Embed Size (px)
Citation preview

SCIENCE PROJECTS UPDATEJESSICA MACDONALD
SENIOR RESEARCH ASSISTANT

OUR OFFICE STAFF
Shannon Scott-Tibbetts, Director of Operations
Jessica MacDonald, Senior Research Assistant
Jade Petritchenko, Research Assistant
Thomas Baker, Ghost Gear Project Coordinator
OVERVIEW OF 2019 PROJECTS
Lobster Recruitment Index Project
ESFPA Research Strategy
At-sea sampling and v-notching
Nearshore Temperature Monitoring Program
WWF Bait Project
Sentinel Monitoring Program
Ghost Gear Project
LFA 36 Season Extension Data Collection
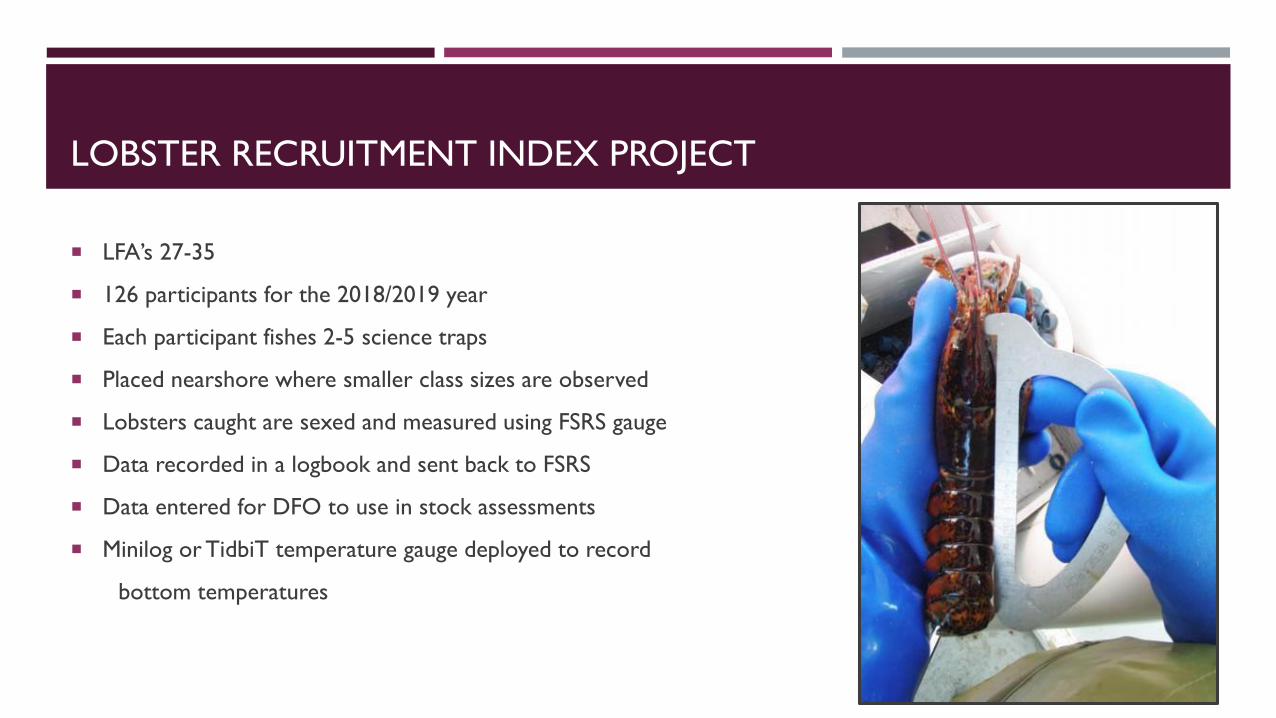
LOBSTER RECRUITMENT INDEX PROJECT
LFA’s 27-35
126 participants for the 2018/2019 year
Each participant fishes 2-5 science traps
Placed nearshore where smaller class sizes are observed
Lobsters caught are sexed and measured using FSRS gauge
Data recorded in a logbook and sent back to FSRS
Data entered for DFO to use in stock assessments
Minilog or TidbiT temperature gauge deployed to record
bottom temperatures
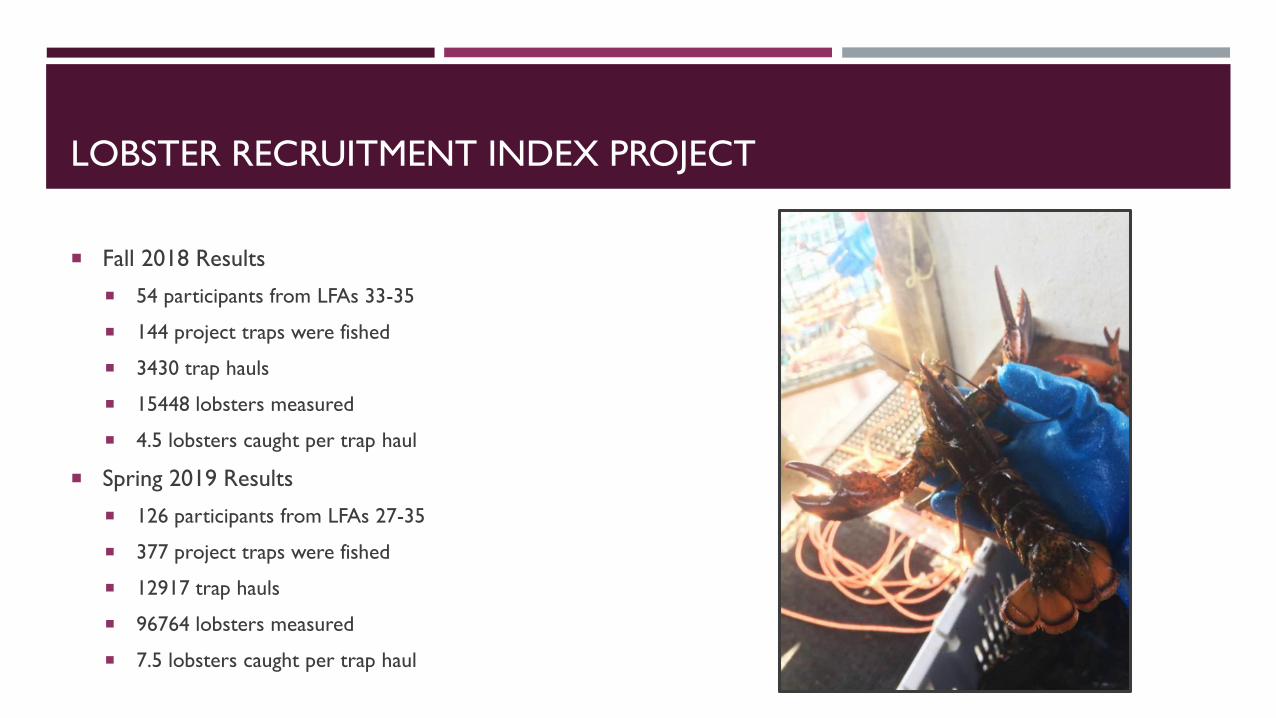
LOBSTER RECRUITMENT INDEX PROJECT
Fall 2018 Results
54 participants from LFAs 33-35
144 project traps were fished
3430 trap hauls
15448 lobsters measured
4.5 lobsters caught per trap haul
Spring 2019 Results
126 participants from LFAs 27-35
377 project traps were fished
12917 trap hauls
96764 lobsters measured
7.5 lobsters caught per trap haul
LOBSTER RECRUITMENT INDEX PROJECT
0
20
40
60
80
100
120
140
160
180
200
<51 51-60 61-70 71-80 81-90 91-100 >100
Nu
mb
er
of
lob
sters
/ 100 t
rap
hau
ls
Carapace Size (mm)
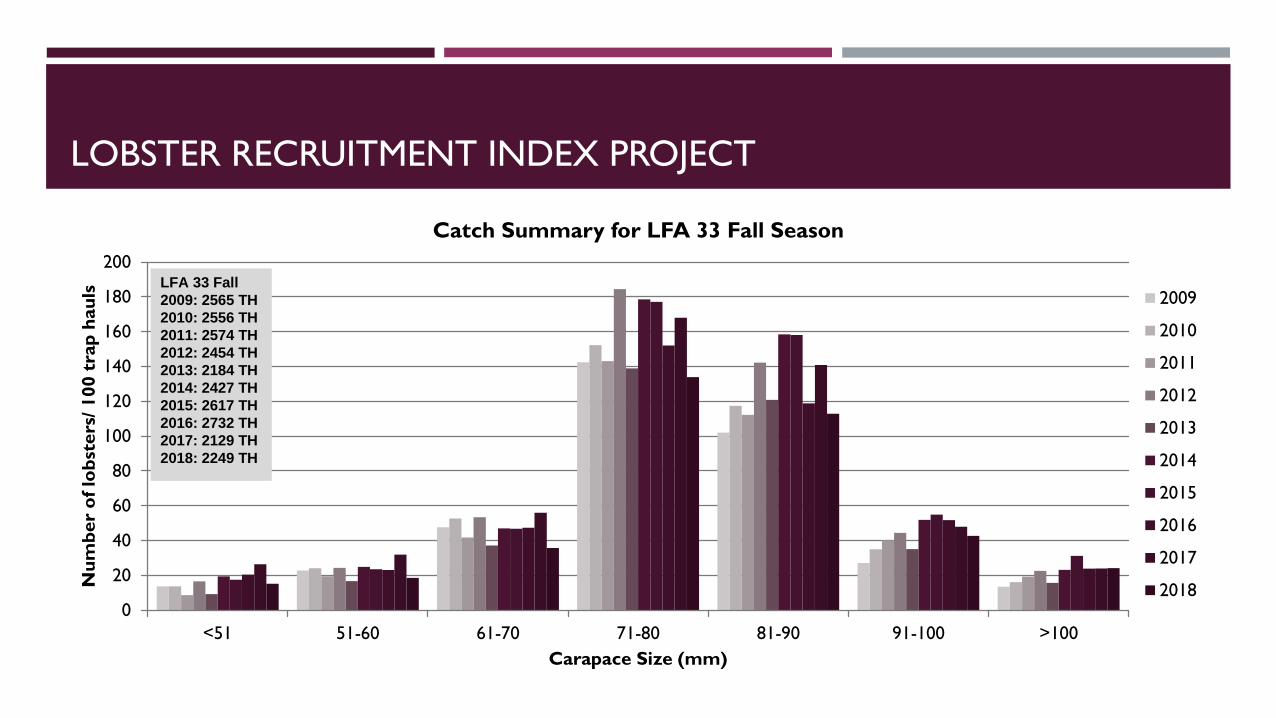
Catch Summary for LFA 33 Fall Season
2009
2010
2011
2012
2013
2014
2015
2016
2017
2018
LFA 33 Fall
2009: 2565 TH
2010: 2556 TH
2011: 2574 TH
2012: 2454 TH
2013: 2184 TH
2014: 2427 TH
2015: 2617 TH
2016: 2732 TH
2017: 2129 TH
2018: 2249 TH
LOBSTER RECRUITMENT INDEX PROJECT
-1.00
0.00
1.00
2.00
3.00
4.00
5.00
6.00
7.00
Tem
pera
ture
°C
Date
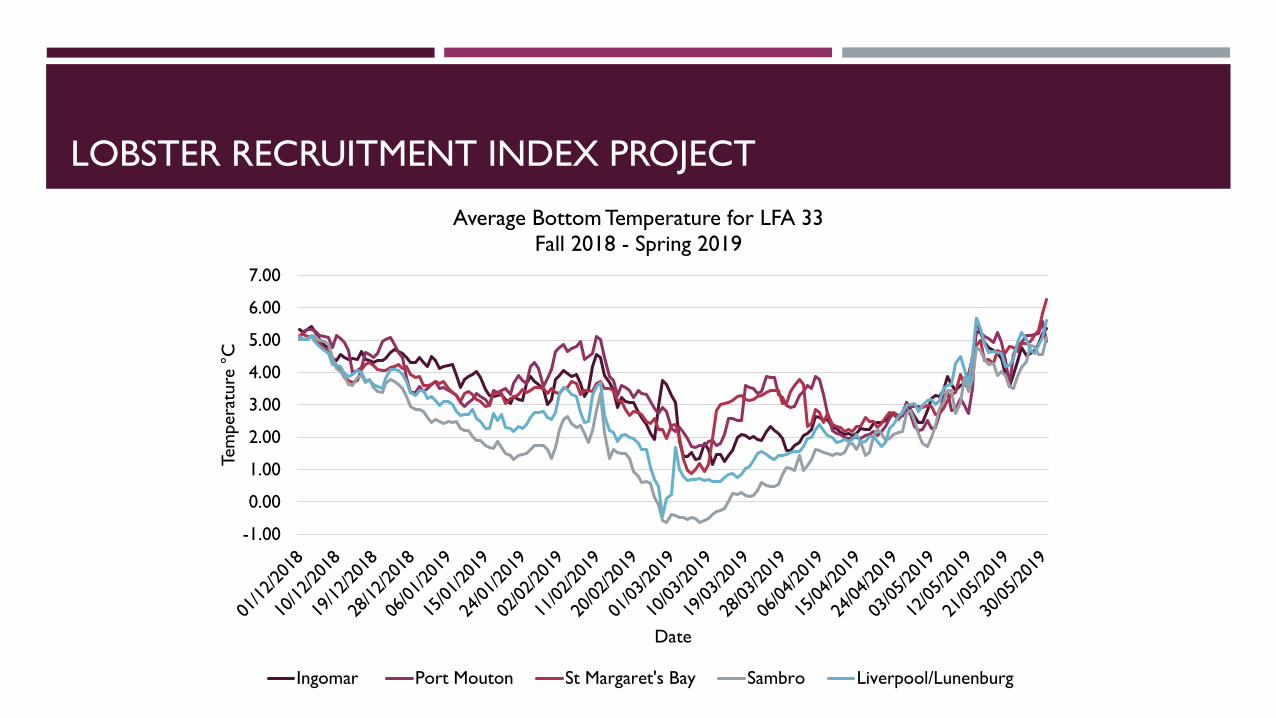
Average Bottom Temperature for LFA 33
Fall 2018 - Spring 2019
Ingomar Port Mouton St Margaret's Bay Sambro Liverpool/Lunenburg

ESFPA RESEARCH STRATEGY-V-NOTCHING
Last year was the 20th season for v-notching
Released 490,663 pounds to date
FSRS technicians work to
Weigh, count, and measure lobsters to ensure they
are >110mm in carapace length
Ensure lobsters are healthy and of superior quality
V-notch and release
0
5,000
10,000
15,000
20,000
25,000
30,000
35,000
40,000
0
0.5
1
1.5
2
2.5
3
3.5
Poss
ible
egg
s pro
duce
d p
er
fem
ale
Ave
rage
weig
ht
per
fem
ale r
ele
ased (
lbs)
Possible number of eggs released by size
Weight LFA 32
Weight LFA 31B
Eggs LFA 32
Eggs LFA 31B
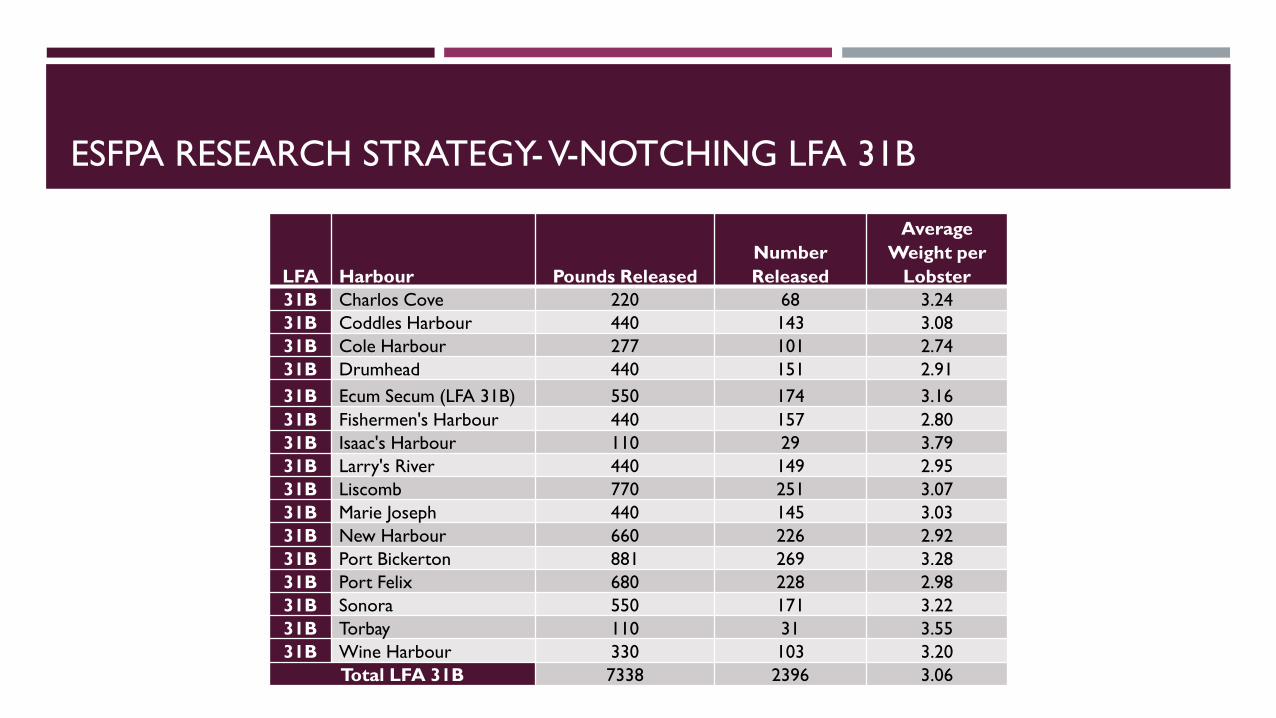
ESFPA RESEARCH STRATEGY-V-NOTCHING LFA 31B
LFA Harbour Pounds Released
Number
Released
Average
Weight per
Lobster
31B Charlos Cove 220 68 3.24
31B Coddles Harbour 440 143 3.08
31B Cole Harbour 277 101 2.74
31B Drumhead 440 151 2.91
31B Ecum Secum (LFA 31B) 550 174 3.16
31B Fishermen's Harbour 440 157 2.80
31B Isaac's Harbour 110 29 3.79
31B Larry's River 440 149 2.95
31B Liscomb 770 251 3.07
31B Marie Joseph 440 145 3.03
31B New Harbour 660 226 2.92
31B Port Bickerton 881 269 3.28
31B Port Felix 680 228 2.98
31B Sonora 550 171 3.22
31B Torbay 110 31 3.55
31B Wine Harbour 330 103 3.20
Total LFA 31B 7338 2396 3.06
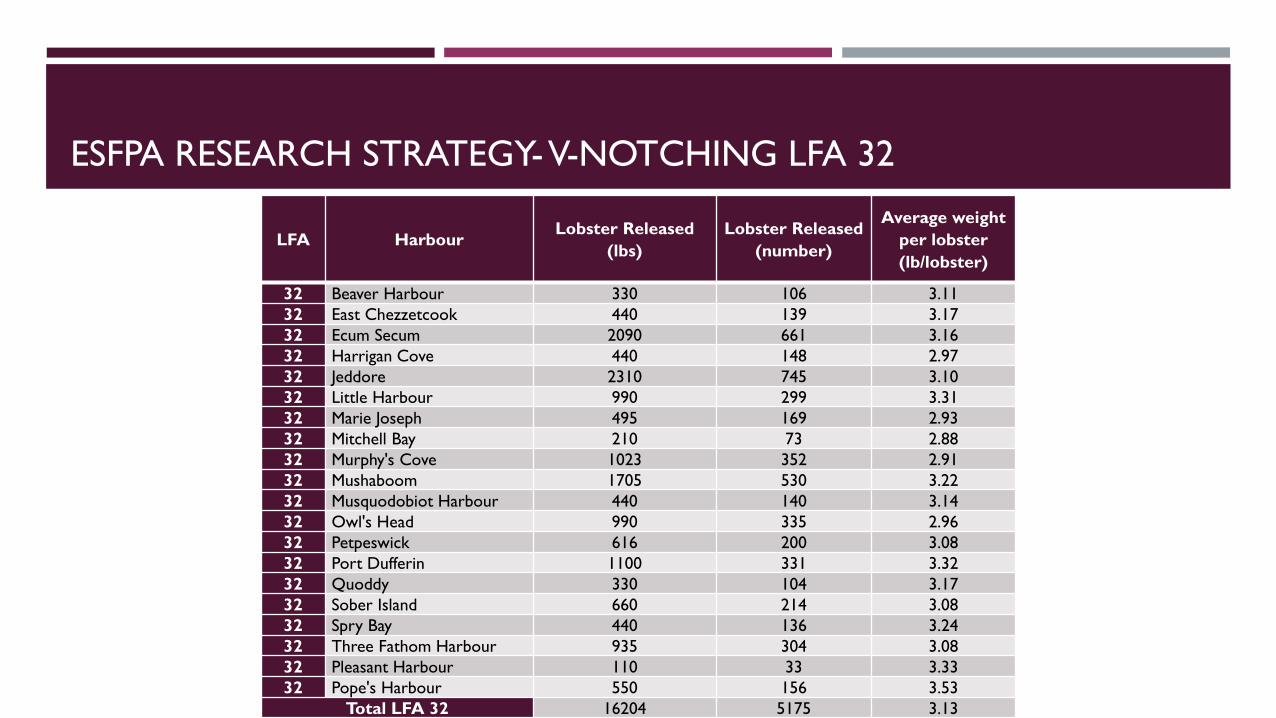
ESFPA RESEARCH STRATEGY-V-NOTCHING LFA 32
LFA HarbourLobster Released
(lbs)
Lobster Released
(number)
Average weight
per lobster
(lb/lobster)
32 Beaver Harbour 330 106 3.11
32 East Chezzetcook 440 139 3.17
32 Ecum Secum 2090 661 3.16
32 Harrigan Cove 440 148 2.97
32 Jeddore 2310 745 3.10
32 Little Harbour 990 299 3.31
32 Marie Joseph 495 169 2.93
32 Mitchell Bay 210 73 2.88
32 Murphy's Cove 1023 352 2.91
32 Mushaboom 1705 530 3.22
32 Musquodobiot Harbour 440 140 3.14
32 Owl's Head 990 335 2.96
32 Petpeswick 616 200 3.08
32 Port Dufferin 1100 331 3.32
32 Quoddy 330 104 3.17
32 Sober Island 660 214 3.08
32 Spry Bay 440 136 3.24
32 Three Fathom Harbour 935 304 3.08
32 Pleasant Harbour 110 33 3.33
32 Pope's Harbour 550 156 3.53
Total LFA 32 16204 5175 3.13

ESFPA RESEARCH STRATEGY- AT-SEA SAMPLING LFA 31B
Location Date Lobsters
Sampled
V-Notched Traps Sampled Empty Traps Bycatch
Liscomb April 26 326 0 204 3 0
May 10 788 0 244 7 60
May 23 789 1 249 4 62
June 5 661 0 246 8 27
Marie Joseph May 4 870 1 251 3 33
May 24 953 6 248 2 32
May 30 583 1 247 23 9
June 12 350 6 137 3 4
Total 5320 15 1826 53 227
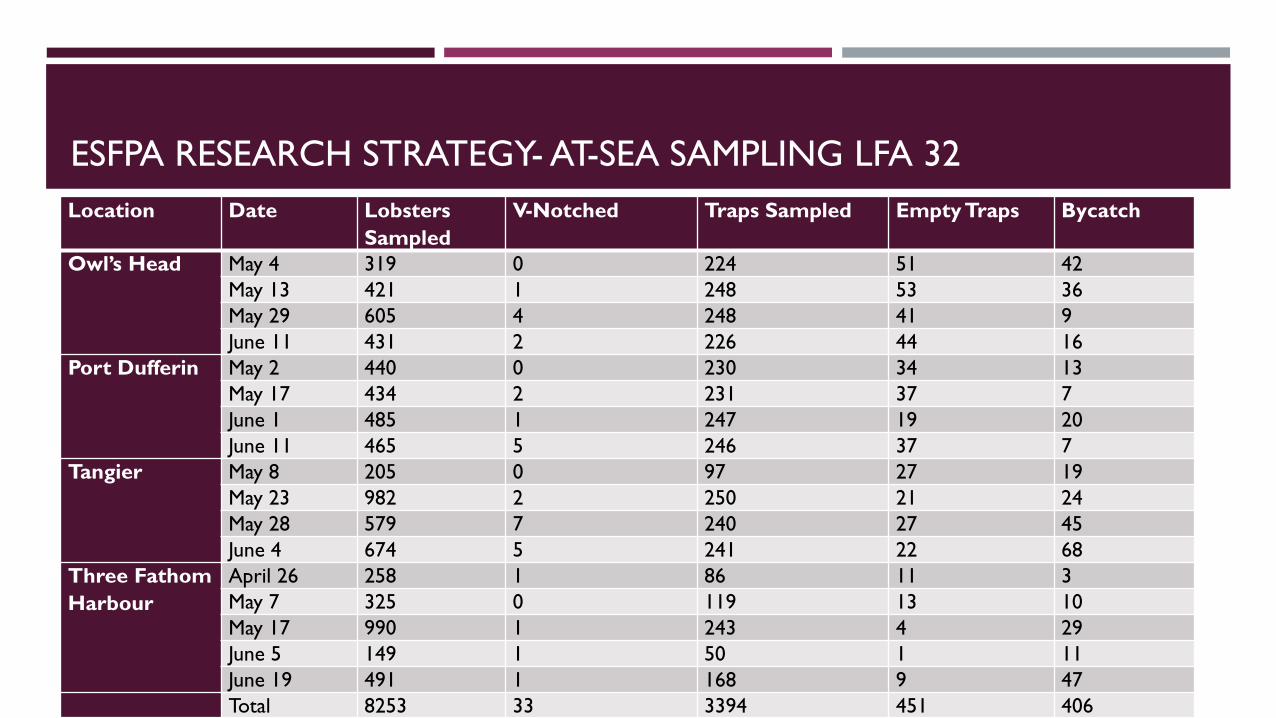
ESFPA RESEARCH STRATEGY- AT-SEA SAMPLING LFA 32
Location Date Lobsters
Sampled
V-Notched Traps Sampled Empty Traps Bycatch
Owl’s Head May 4 319 0 224 51 42
May 13 421 1 248 53 36
May 29 605 4 248 41 9
June 11 431 2 226 44 16
Port Dufferin May 2 440 0 230 34 13
May 17 434 2 231 37 7
June 1 485 1 247 19 20
June 11 465 5 246 37 7
Tangier May 8 205 0 97 27 19
May 23 982 2 250 21 24
May 28 579 7 240 27 45
June 4 674 5 241 22 68
Three Fathom
Harbour
April 26 258 1 86 11 3
May 7 325 0 119 13 10
May 17 990 1 243 4 29
June 5 149 1 50 1 11
June 19 491 1 168 9 47
Total 8253 33 3394 451 406
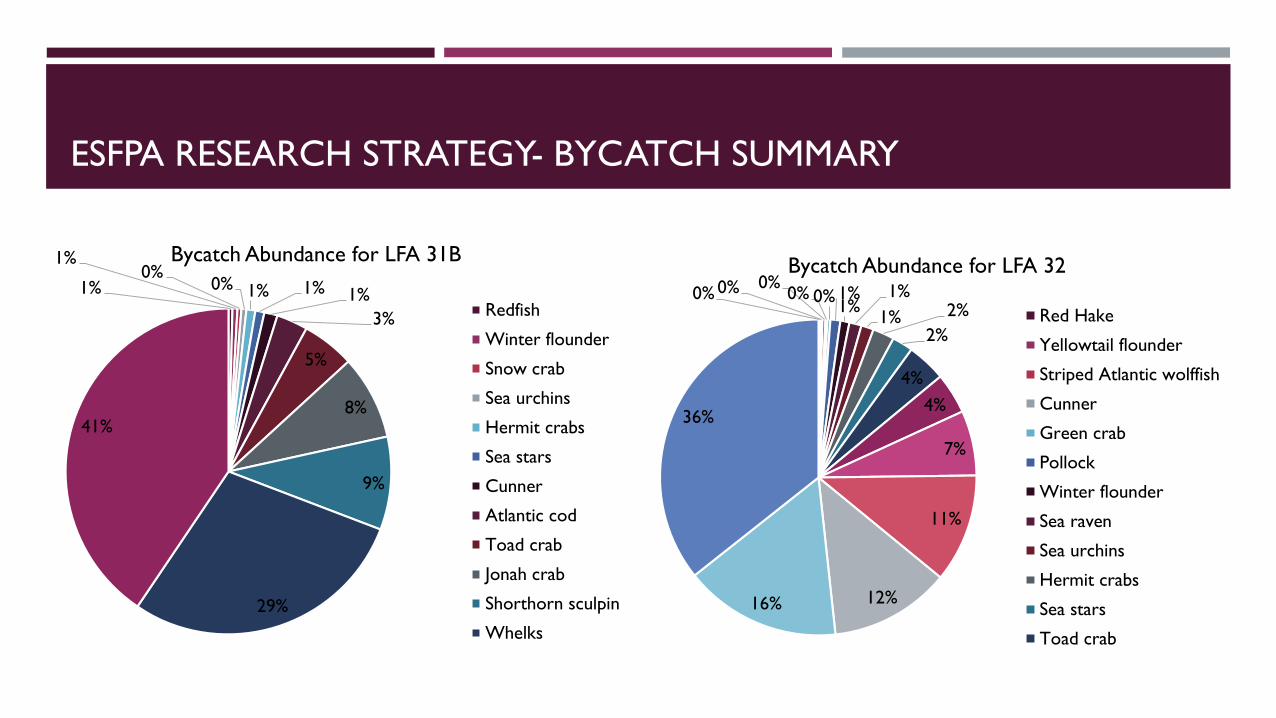
ESFPA RESEARCH STRATEGY- BYCATCH SUMMARY
1%
1%0%
0% 1% 1% 1%
3%
5%
8%
9%
29%
41%
Bycatch Abundance for LFA 31B
Redfish
Winter flounder
Snow crab
Sea urchins
Hermit crabs
Sea stars
Cunner
Atlantic cod
Toad crab
Jonah crab
Shorthorn sculpin
Whelks
0% 0% 0%0% 0% 1%
1%1%
1% 2%
2%
4%
4%
7%
11%
12%16%
36%
Bycatch Abundance for LFA 32
Red Hake
Yellowtail flounder
Striped Atlantic wolffish
Cunner
Green crab
Pollock
Winter flounder
Sea raven
Sea urchins
Hermit crabs
Sea stars
Toad crab
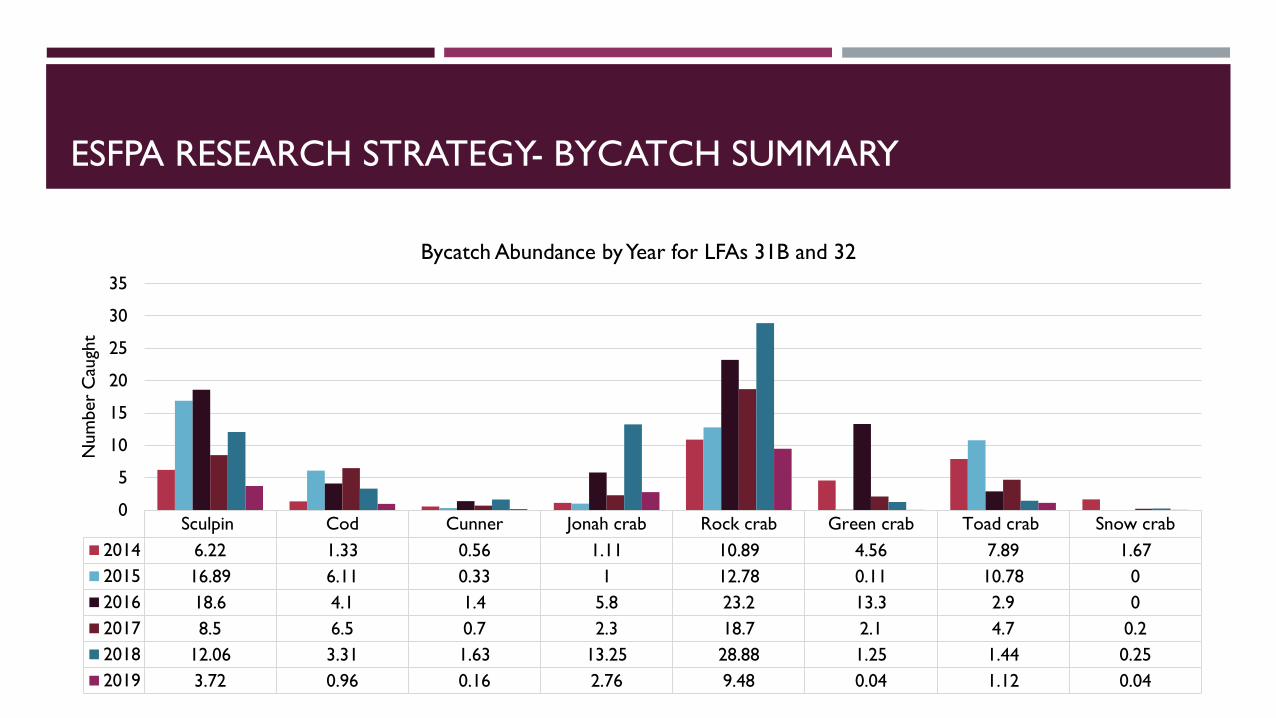
ESFPA RESEARCH STRATEGY- BYCATCH SUMMARY
Sculpin Cod Cunner Jonah crab Rock crab Green crab Toad crab Snow crab
2014 6.22 1.33 0.56 1.11 10.89 4.56 7.89 1.67
2015 16.89 6.11 0.33 1 12.78 0.11 10.78 0
2016 18.6 4.1 1.4 5.8 23.2 13.3 2.9 0
2017 8.5 6.5 0.7 2.3 18.7 2.1 4.7 0.2
2018 12.06 3.31 1.63 13.25 28.88 1.25 1.44 0.25
2019 3.72 0.96 0.16 2.76 9.48 0.04 1.12 0.04
0
5
10
15
20
25
30
35
Num
ber
Cau
ght
Bycatch Abundance by Year for LFAs 31B and 32
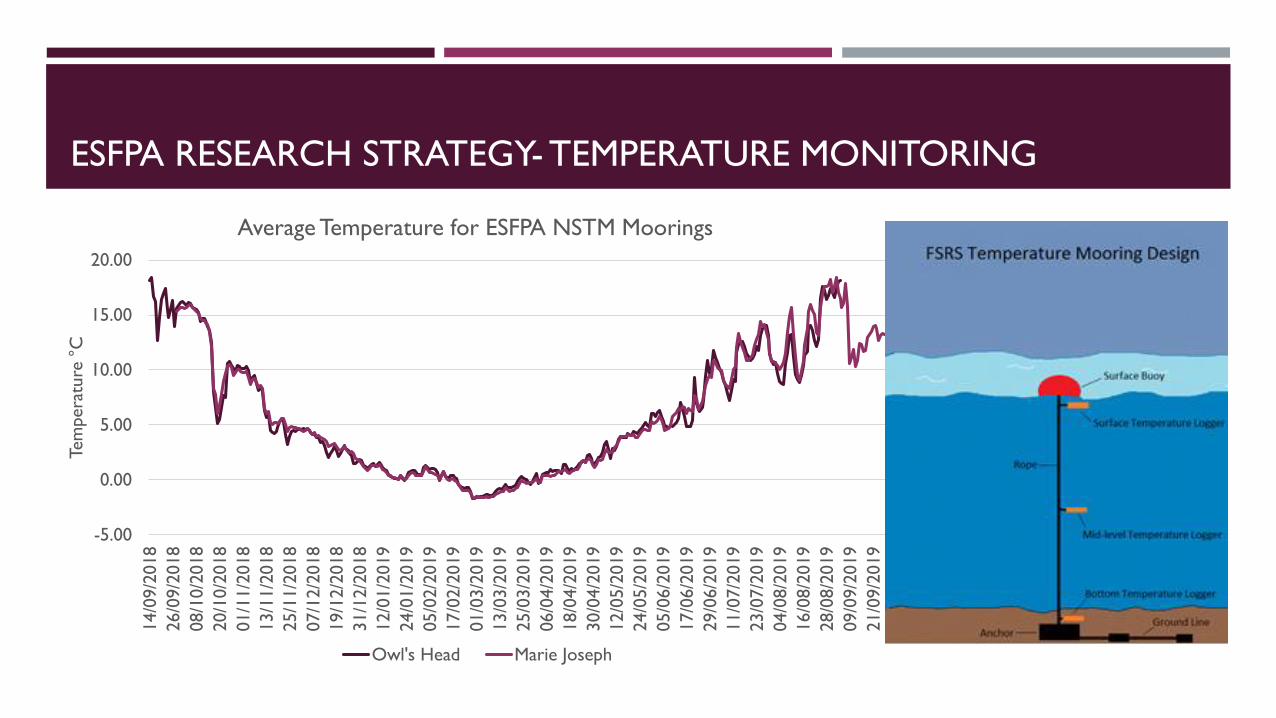
ESFPA RESEARCH STRATEGY- TEMPERATURE MONITORING
-5.00
0.00
5.00
10.00
15.00
20.00
14/0
9/2
018
26/0
9/2
018
08/1
0/2
018
20/1
0/2
018
01/1
1/2
018
13/1
1/2
018
25/1
1/2
018
07/1
2/2
018
19/1
2/2
018
31/1
2/2
018
12/0
1/2
019
24/0
1/2
019
05/0
2/2
019
17/0
2/2
019
01/0
3/2
019
13/0
3/2
019
25/0
3/2
019
06/0
4/2
019
18/0
4/2
019
30/0
4/2
019
12/0
5/2
019
24/0
5/2
019
05/0
6/2
019
17/0
6/2
019
29/0
6/2
019
11/0
7/2
019
23/0
7/2
019
04/0
8/2
019
16/0
8/2
019
28/0
8/2
019
09/0
9/2
019
21/0
9/2
019
Tem
pera
ture
°C
Average Temperature for ESFPA NSTM Moorings
Owl's Head Marie Joseph
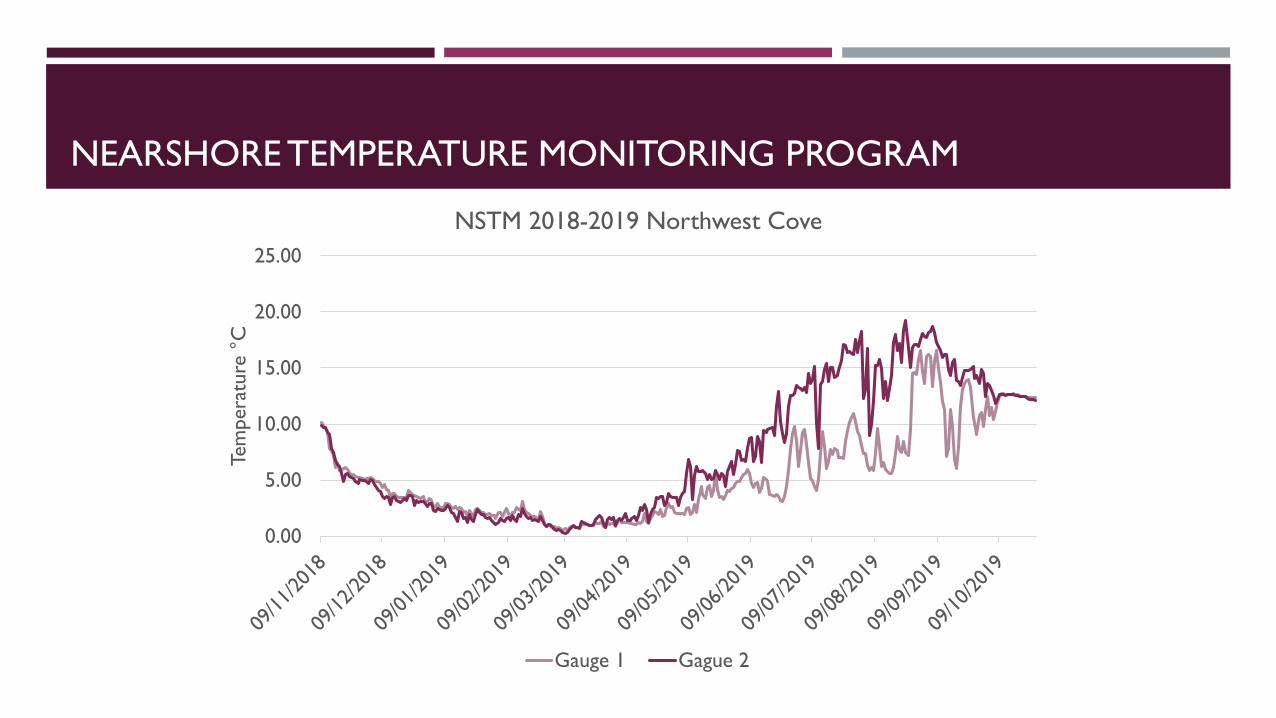
NEARSHORE TEMPERATURE MONITORING PROGRAM
0.00
5.00
10.00
15.00
20.00
25.00Te
mpera
ture
°C
NSTM 2018-2019 Northwest Cove
Gauge 1 Gague 2
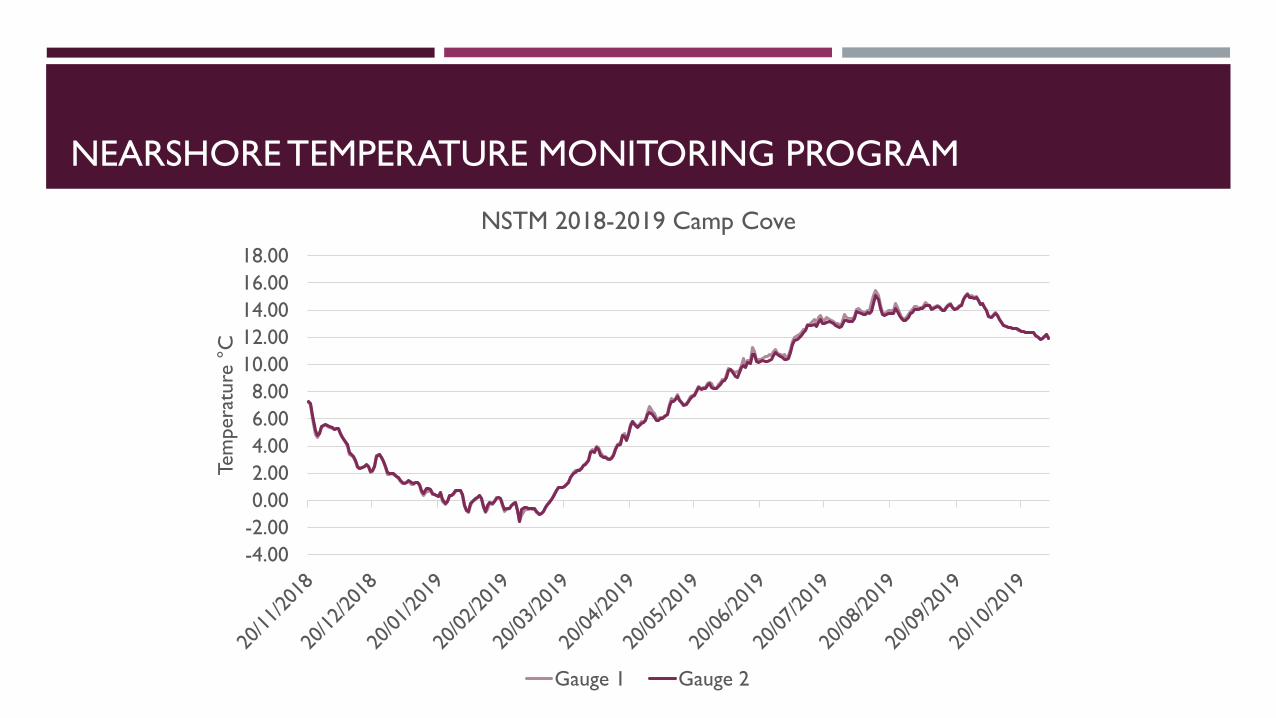
NEARSHORE TEMPERATURE MONITORING PROGRAM
-4.00
-2.00
0.00
2.00
4.00
6.00
8.00
10.00
12.00
14.00
16.00
18.00
Tem
pera
ture
°C
NSTM 2018-2019 Camp Cove
Gauge 1 Gauge 2
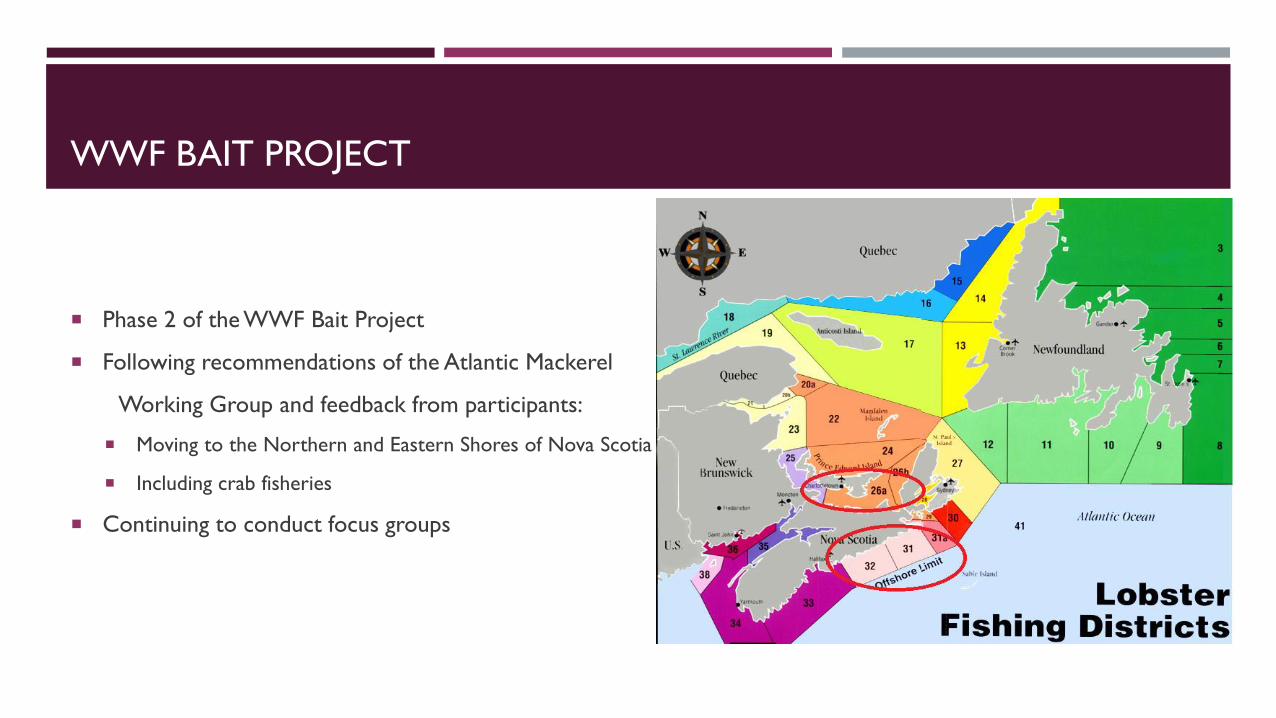
WWF BAIT PROJECT
Phase 2 of the WWF Bait Project
Following recommendations of the Atlantic Mackerel
Working Group and feedback from participants:
Moving to the Northern and Eastern Shores of Nova Scotia
Including crab fisheries
Continuing to conduct focus groups
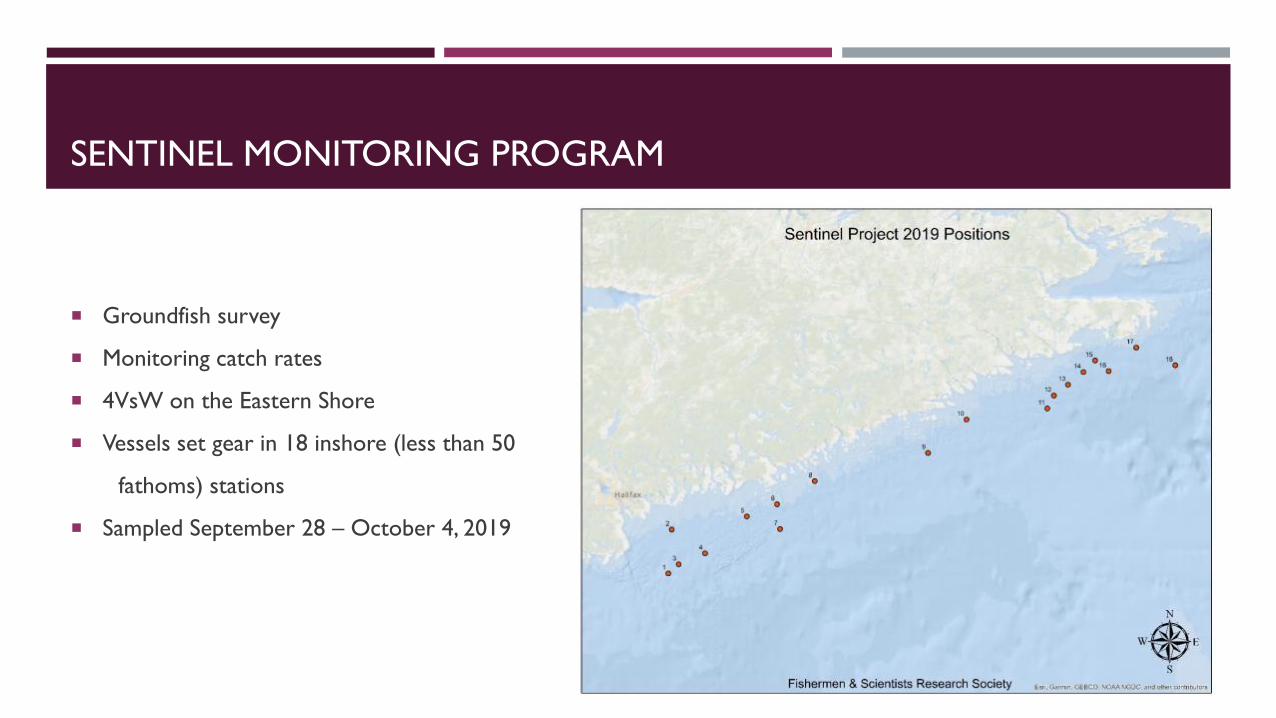
SENTINEL MONITORING PROGRAM
Groundfish survey
Monitoring catch rates
4VsW on the Eastern Shore
Vessels set gear in 18 inshore (less than 50
fathoms) stations
Sampled September 28 – October 4, 2019
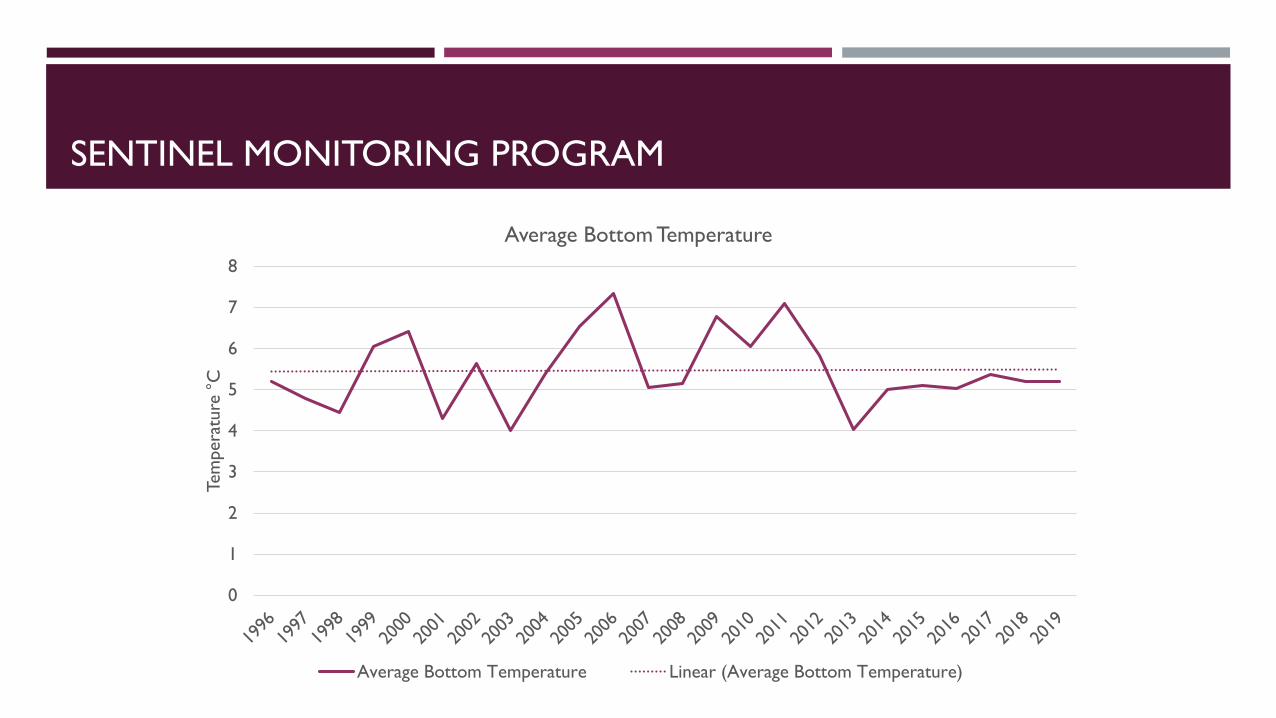
SENTINEL MONITORING PROGRAM
0
1
2
3
4
5
6
7
8
Tem
pera
ture
°C
Average Bottom Temperature
Average Bottom Temperature Linear (Average Bottom Temperature)
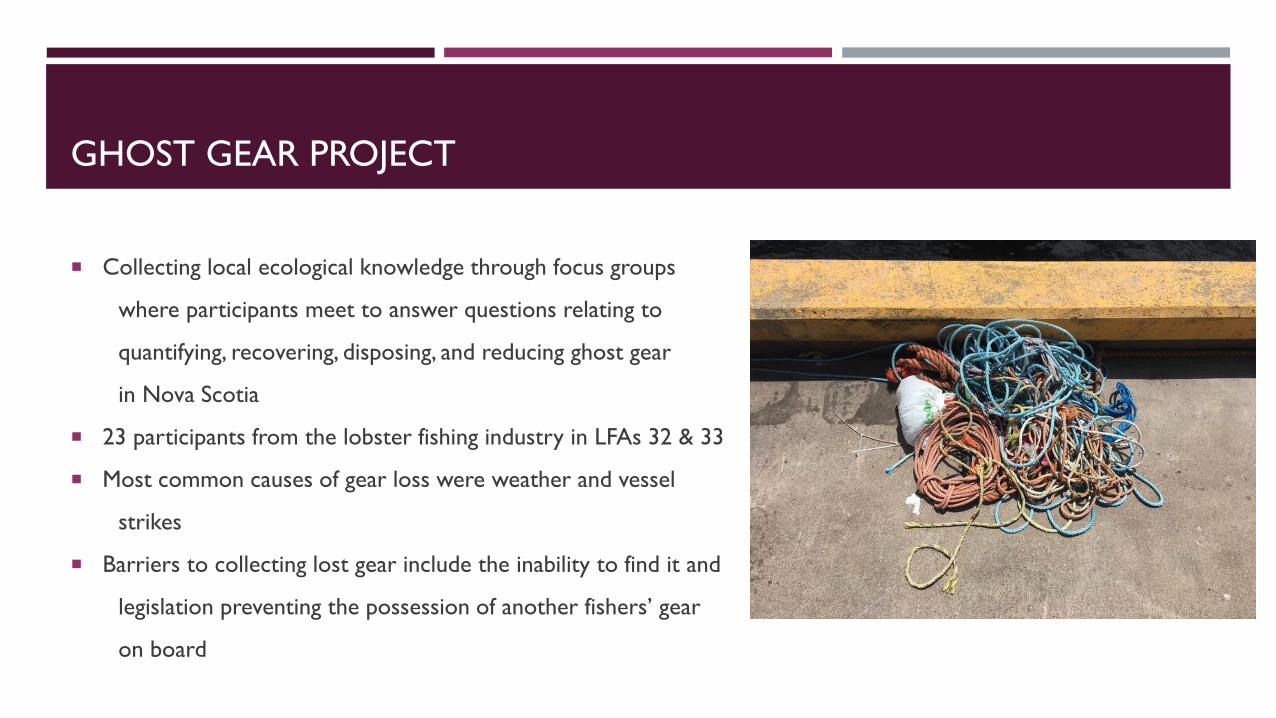
GHOST GEAR PROJECT
Collecting local ecological knowledge through focus groups
where participants meet to answer questions relating to
quantifying, recovering, disposing, and reducing ghost gear
in Nova Scotia
23 participants from the lobster fishing industry in LFAs 32 & 33
Most common causes of gear loss were weather and vessel
strikes
Barriers to collecting lost gear include the inability to find it and
legislation preventing the possession of another fishers’ gear
on board
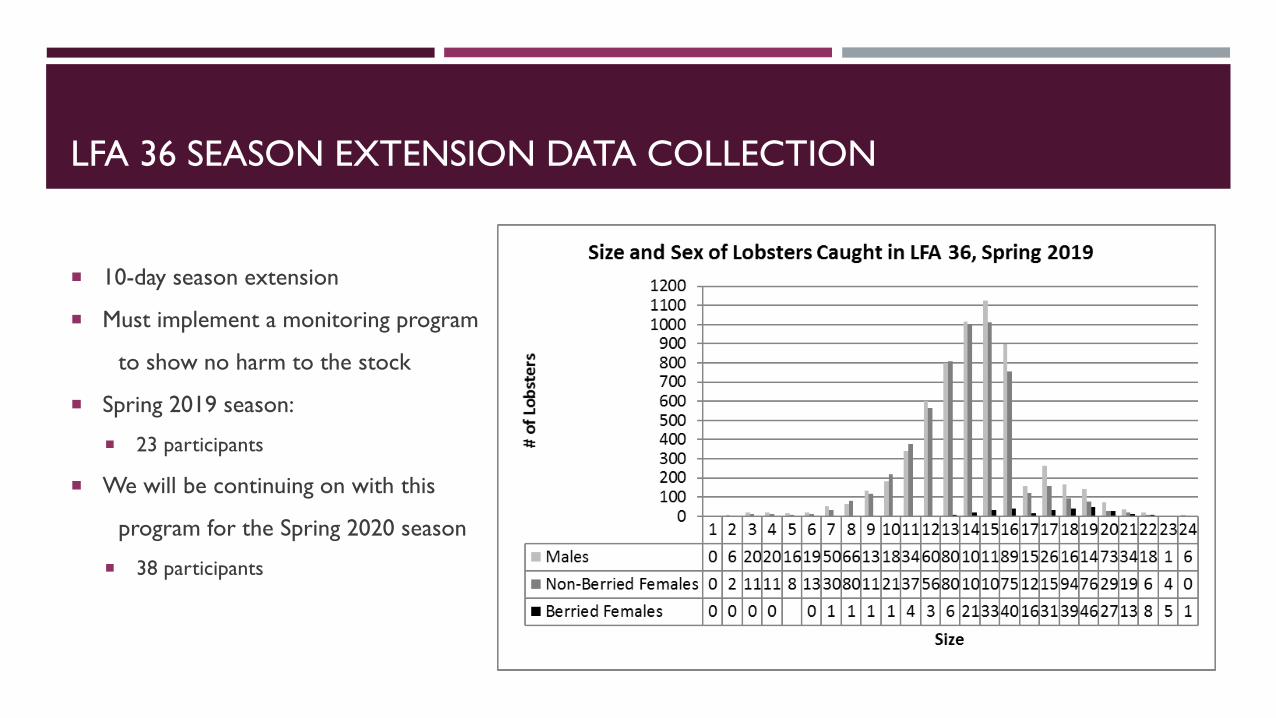
LFA 36 SEASON EXTENSION DATA COLLECTION
10-day season extension
Must implement a monitoring program
to show no harm to the stock
Spring 2019 season:
23 participants
We will be continuing on with this
program for the Spring 2020 season
38 participants

UPCOMING PROJECTS
Lobster Recruitment Index Project
ESFPA Research Strategy
At-sea sampling and v-notching
Sentinel Monitoring Program
Nearshore Temperature Monitoring Program
LFA 36 Season Extension Data Collection