Embed Size (px)
Citation preview

SCHIZOPHRENIA IN KWAZULU NATAL:A study of certified patients,
accessibility to mental health services and risk
By Andrea Enslin
A dissertation submitted as part requirement for the degree ofMasters of Social Science
(Clinical Psychology)
At University ofNatal (pietermaritzburg)2002
ABSTRACT
Schizophrenia is a debilitating mental illness. The prevalence of schizophrenia is of
concern and highlights the chronicity of the illness (Kaplan & Sadock, 1998; Warner
& de Girolamo, 1995).
It is therefore important that greater understanding ofthe variables affecting and
potentially contributing to schizophrenia is sought. This study deals with three
separate areas:
1. Creating a database and describing the socio-demographic profile of 615
certified patients diagnosed with schizophrenia between the years 1995 and
1996, hospitalised at Fort Napier.
2. Exploring whether a meaningful geographical model of socio-demographic
variables of schizophrenia can be built, and whether it can determine areas of
high schizophrenia sensitivity. Such a perspective of schizophrenia (exploring
the combined effect of all the variables connected to schizophrenia) has not
been previously researched rather each variable has been studied
independently. The model utilised in the Geographical Information Systems
(GIS) offers an opportunity to graphically overlay these individual variables
and then examine the potential effect. It was only possible to explore socio
demographic variables within this Masters research project.
3. Determining the geographical accessibility of the public provincial hospitals
offering psychiatric services to the population, (particularly to persons with
schizophrenia). This is relevant to the provision of maintenance programmes
and early intervention as encouraged by recent research (Hodges, Byme, Grant
& Johnstone, 1999; Yung et aI, 1998).
The socio-demographic profile of the certified patients at FNH correlated with most
of the international findings. The presentation of schizophrenia remained constant in
South Afiica in comparison to international countries and cultures (Warner & de
Girolamo, 1995). Overall, the pattern produced by the schizophrenia sensitivity model
was unclear other than high and low schizophrenia sensitivity ranges being evenly
spread throughout KZN. The model has yet to be further refined to increase its
sensitivity to schizophrenia risk. Although statistical significance was not established,
the accessibility model suggested that large parts ofKZN fall within the range of easy
11

accessibility in relation to the 19 provincial hospitals that provide a psychiatric
service. The potential of the schizophrenia sensitivity model and accessibility model,
in spite of the crude and incomplete variables utilised was evident. The GIS was a
powerful tool and utilised in this study to collect (from surveys and other databases),
store (retrieval and query), manipulate (transforming data, analysis and modelling)
and produce data output (data reporting, such as maps and reports) (Foote & Lynch,
1995). The GIS has been a very effective tool in working with epidemiological
information and it would be ofgreat use in service planning. It is strongly
recommended that there be greater collaboration between mental health services and
the GIS Unit, Department ofHealth.
III

ACKNOWLEDGEMENTS
There are numerous people I would like to thank for their assistance in the completion
of this thesis.
• My supervisor, Prof Anthony Pillay for his quiet constructive direction.
• Shannon Rushworth, the GIS manager of the GIS unit, Health Department, for
her high standards of professionalism, patience and perseverance.
• The Health Department for their policy on interdepartmental co-operation.
• Fort Napier Hospital for granting of permission for this study to be conducted
and allowing access to data.
• The 'dream team' who never let the torch go out - Mrs A, Sooz, Mary, Carla
and Uncle John, Joan, Margaret and Marc.
• My parents for their continued support, encouragement and love.
Declaration of Originality
The author hereby declares that this whole thesis, unless specifically indicated to the contrary in the
text. is her own original work.
IV

1.
2.
3.
4.
5.
6.
SHORT CONTENTS
TITLE PAGE
ABSTRACT
ACKNOWLEDGEMENTS
DECLARATION OF ORIGINALITY
SHORT CONTENTS
LONG CONTENTS
LIST OF DIAGRAMS, TABLES AND MAPS
LIST OF APPENDICES
INTRODUCTION
LITERATURE REVIEW
METHODOLOGY
RESULTS
DISCUSSION
CONCLUSION
REFERENCES
APPENDIX
11
IV
IV
V
VI
Xll
XlV
1
3
23
39
74
97
111
V

1.
2.
LONG CONTENTS
TITLE PAGE
ABSTRACT
ACKNOWLEDGEMENTS
DECLARATION OF ORIGINALITY
SHORT CONTENTS
LONG CONTENTS
LIST OF DIAGRAMS, TABLES AND MAPS
LIST OF APPENDICES
INTRODUCTION
LITERATURE REVIEW
11
IV
IV
V
VI
Xll
XlV
1
3
2.1 THEORETICAL FRAMEWORKS UNDERLYING THE STUDY
3
2.1.1 MEDICAL GEOGRAPHY 3
2.1.2
2.1.3
DEMOGRAPHY
EPIDEMIOLOGY
2.1.3.1 Epidemiological Tenns
3
4
4
2.2 SCHIZOPHRENIA
2.2.1 CONCEPT
6
6
VI

2.2.2 sCmzOPHRENIA COSTS 8
2.2.3 DEMOGRAPIDC CHARACTERISTICS 9
2.2.3.1 Age 9
2.2.3.2 Gender 9
2.2.3.3 Marital status 9
2.2.3.4 Location 10
2.2.3.5 Population Density 10
2.2.3.6 Seasonality of birth 11
2.2.3.7 Culture 11
2.2.3.8 Socio-economic status 12
2.2.3.9 Occupation 13
2.2.3.10 Migration 14
2.3 ACCESS TO MENTAL HEALTH CARE
2.4 GEOGRAPIDCAL INFORMATION SYSTEMS
2.4.1 INTRODUCTION
2.4.2 DEFINITION
2.4.3 APPLICATIONS
Schizophrenia Sensitivity Model
Geographical Accessibility Model
14
16
16
16
19
20
21
2.4.4 HEALTH GIS UNIT, KZN, DEPARTMENT OF HEALTH
22
2.4.5 POTENTIAL ERRORS IN USING THE GIS 22
vu

3. METHODOLOGY 23
3.1 INTRODUCTION 23
3.2 AIMS AND HYPOTHESES 24
3.3 METHODOLOGY 25
3.3.1 Sample 25
3.3.2 Instruments 25
3.3.3 Validity and Reliability 26
3.4 THE PROCEDURE 26
3.4.1 Database of certified patients with schizophrenia 27
4.4.1.1
3.4.1.23.4.1.3
Creating a Database of Certified Patients with
Schizophrenia 27
Ethical Considerations 27Describing the Database of Certified Patientswith Schizophrenia 28
3.4.2 GIS model of schizophrenia sensitivity 29
3.4.2.1 Demographic details ofKZN province and
population 29
3.4.2.2 The model of schizophrenia sensitivity 29
3.2.2.3 Working with the model's output 36
3.4.3 Geographical accessibility 37
3.4.3.1 Accessibility model 37
3.4.3.2 Application of the Accessibility model 38
4. RESULTS 39
4.1 DESCRIPTION OF KWAZULU NATAL 39
Vlll
4.2 DESCRIPTION OF PATIENT SAMPLE 40
4.2.1 Gender and cultural composition 40
4.2.2 Age 40
4.2.3 Marital Status 40
4.2.4 Seasonality ofBirth 41
4.2.5 Employment 42
4.2.6 Occupation 42
4.2.7 Religion 44
4.2.8 Previous Admissions 44
4.2.9 Month Admitted 45
4.2.10 Length of Stay 46
4.2.11 Diagnosis 47
4.2.12 Location 48
4.2.13 Summary 53
4.3 DESCRIPTION OF SCHIZOPHRENIA SENSITIVITY MODEL
54
4.3.1 Is there evidence of a geographical pattern? 54
4.3.2 Percentage ofKZN population falling into the varying ranges
of schizophrenia risk
4.3.3 Description of the relationship between the schizophrenia
sensitivity ranges and certified patients
4.3.4 Summary
56
57
62
4.4 DESCRIPTION OF ACCESSffiILITY MODEL 63
4.4.1 Access and the KZN population 63
4.4.2 Access and the certified patient population with
schizophrenia seen at Fort Napier Hospital 66
4.4.3 Relationship between the accessibility rating and
schizophrenia sensitivity ratings 71
4.4.4 Summary 73
IX

5. DISCUSSION 74
5.1 DISCUSSION OF KWAZULU NATAL 74
5.2 DISCUSSION OF PATIENT SAMPLE 74
5.2.1 Gender and cultural composition 74
5.2.2 Age 74
5.2.3 Marital Status 75
5.2.4 Seasonality ofBirth 75
5.2.5 Employment 76
5.2.6 Occupation 76
5.2.7 Religion 77
5.2.8 Previous Admissions 78
5.2.9 Month Admitted 79
5.2.10 Length of Stay 79
5.2.11 Diagnosis 81
5.2.12 Location 83
5.3 DISCUSSION OF SCHIZOPHRENIA SENSITIVITY MODEL
87
5.3.1 Is there evidence ofa geographical pattern? 87
5.3.2 Percentage ofKZN population falling into the varying ranges
of schizophrenia risk 88
5.3.3 Description of the relationship between the schizophrenia
sensitivity ranges and certified patients 88
5.3.4 Summary 89
5.4 DISCUSSION OF ACCESSffiILITY MODEL 90
5.4. 1 Access and the KZN population 90
5.4.2 Access and the certified patient population with
schizophrenia seen at Fort Napier Hospital 91
x

6.
5.4.3
5.4.4
CONCLUSION
REFERENCES
APPENDIX
Relationship between the accessibility rating and
schizophrenia sensitivity ratings
Summary
92
93
94
97
111
Xl

LIST OF DIAGRAMS, TABLES AND MAPS
Diagrams
Diagram 1: Overlaying ofvarious thematic maps of one area
Diagram 2: GIS focusing on one area
Diagram 3: Combining and transforming of data
Diagram 4: An example of an effort map
18
18
21
21
Tables
Table 1: A summary of the definitions used for the socio-demographic variables
included in the study 35
Table 2: A summary of the variables used for the GIS accessibility model 38
Table 3: Age Distribution 40
Table 4: Marital status 41
Table 5: Seasonality ofBirth !Month ofBirth 42
Table 6: Employment 42
Table 7: Occupation 43
Table 8: Religion 44
Table 9: Previous Admissions 45
Table 9.1: Previous Admission by Age 45
Table 10: Month Admitted 46
Table 11: Length of Stay 46
Table 12: Diagnosis 47
Table 12.1: Diagnosis and Average Length of Stay 47
Table13: Breakdown ofPlaces ofResidence ofCertified Patients 49
Table 13. 1: Certified Patients' Place ofReferral and Place ofResidence 51
Table 14: Area Covered By Sensitivity Grading ofPopulation to Schizophrenia 56
Table 15: Population Layout of Schizophrenia Sensitivity Model 56
Table 16: Number of towns in relation to the number ofcertified patients 57
Table 17: Number of Certified Patients within Each Schizophrenia Sensitivity Level
in the DCs ofKZN 58
Table 18.1: Breakdown of Schizophrenia Sensitivity Rating Level 6 59
XlI

Table 18.2: Breakdown of Schizophrenia Sensitivity Rating Level 5 59
Table 18.3: Breakdown of Schizophrenia Sensitivity Rating Level 4 60
Table 18.4: Breakdown of Schizophrenia Sensitivity Rating Level 2/3 61
Table 18.5: Breakdown of Schizophrenia Sensitivity Rating Level One 62
Table 19: Area Covered by Ranges of Accessibility 65
Table 20: Population Layout of Accessibility Model 65
Table 21: Number of Towns in relation to the number of certified patients 66
Table 22.1: Access Level One (1-11) 68
Table 22.2: Access Level 2 (12-32) 69
Table 22.3: Access Level 3 (33-53) 70
Table 22.4: Access Level 4 (54-76) 70
Table 22.5: Access Level 5 (77-98) 70
Table 22.6: Access Level 6 (99-120) 71
Table 22.7: Access Level 7 (121-145) 71
Table 22.8: Access Level 8 (146-173) 71
Table 23: Relationship between the accessibility and schizophrenia sensitivity ratings
of the towns with the most certified patients 72
Maps
Map 1: lliustration of the spread of positive cholera cases (the darkest areas) in the
month ofMarch 2002 19
Map 2: KwaZulu Natal provincial hospitals providing psychiatric services and areas
from which patients originate 50
Map 3: Referral patterns for psychiatric patients 52
Map 4: Schizophrenia sensitivity map 55
Map 5: Accessibility map 64
Xlll

APPENDIX
1. QUESTIONAIRE FOR 'EXPERTS'
2. TABLES OF K\VAZULUNATAL CENSUS DATA
Table 1: Local Councils within each District Council ofKZN
Table 2: Population Distribution in KZN
Table 3: Population Density in KZN
Table 4: Gender Distribution in KZN
Table 5: Distribution ofFemales by Age in KZN
Table 6: Distribution ofMales by Age in KZN
Table 7: Distribution ofPopulation Groups in KZN
Table 8: Employment Distribution within KZN
Table 9: Breakdown ofEducation in KZN
Table 10: Occupational Categories in KZN
Table 11: Percentage Distribution of Income in KZN
Table 12: Disabilities in KZN
Table 13: Marital Status
Table 14: Internal migration within 1991-1996
111
III
113
113
113
114
114
115
115
116
116
117
117
118
118
119
119
XlV

CHAPTER ONE: INTRODUCTION
Schizophrenia is a debilitating mental illness. The aetiology of the disease is little
understood. The incidence is minimaL However, the prevalence is of concern and
highlights the chronicity of the illness (Kaplan & Sadock, 1998; Warner & de
Girolamo, 1995). In spite of greater optimism being experienced over the prognosis of
schizophrenia, over 70 % ofthose suffering from schizophrenia continue to be
detrimentally affected by it (Barbato, 1998). This implies that great costs are both
directly and indirectly incurred, extending far beyond the individual, to the families,
communities, health care systems, and ultimately impacting on a country's economics
(Moscarelli, 1994).
It is therefore important that greater understanding of the variables affecting and
potentially contributing to schizophrenia is sought; primarily a reason to find a cure.
Another reason would be to provide effective management, for example, providing
early intervention (McGlashen & Johannessen, 1996), thereby cutting down costs in
the long-term.
As schizophrenia is a chronic problem it is essential that effective planning of present
and future services be done. The computer based GIS (Geographical Information
System), offers a visual medium in which geography and mental health issues are
combined to create a more comprehensive picture. This project therefore aims to
illustrate the applicability of utilising the GIS in mental health services.
This study deals with three separate areas:
1. Creating a database and describing the socio-demographic profile of certified
patients diagnosed with schizophrenia between the years 1995 and 1996.
2. Exploring whether a meaningful geographical model of socio-demographic
variables of schizophrenia can be built, and whether it can determine areas of
high schizophrenia sensitivity. Such a perspective of schizophrenia (exploring
the combined effect of all the variables connected to schizophrenia) has not
been previously researched rather each variable has been studied
independently. The model utilised in the GIS offers an opportunity to
1

graphically overlay these individual variables and then examine the potential
effect. This information may lead to further understanding and productive
avenues. It was only possible to explore socio-demographic variables within
this Masters research project.
3. Determining the geographical accessibility of the public provincial hospitals
offering psychiatric services to the population, (particularly to persons with
schizophrenia). This is relevant to the provision ofmaintenance programmes
and early intervention as encouraged by recent research (Hodges, Byme, Grant
& Johnstone, 1999; Yung et al, 1998).
In chapter two, schizophrenia is discussed in terms ofconcept, costs and demographic
attributes followed by the population's accessibility to mental health care. The
underlying theoretical frameworks of this study (medical geography, demography and
epidemiology) are briefly introduced. Lastly, the tool used (Geographical Information
System) used for creating the models is introduced and explored in terms of
definition, applications, KZN Health GIS Unit and potential errors affecting
reliability.
The methodology of this study is discussed in chapter three. Initially the aims and
hypotheses are outlined followed by the methodological protocol of the study. The
sample and instruments are defined and issues ofvalidity and reliability described.
The procedure used to collect and explore the data (for the database ofcertified
patients' with schizophrenia and the GIS models of schizophrenia sensitivity and
geographical accessibility), is detailed.
In chapter four the results are reported. Firstly, the essential aspects of the socio
demographic characteristics ofKZN are highlighted. The patient sample and the GIS
models of schizophrenia sensitivity and geographical accessibility are described.
A detailed discussion ofthese areas follows in chapter five.
Chapter six concludes the research study, by highlighting important findings,
discussing implications of the findings and their possible relevance for future
research, and detailing limitations of the study.
2
CHAPTER TWO: LITERATURE REVIEW
In this chapter, the underlying theoretical frameworks of this study (medical
geography, demography and epidemiology) will be briefly introduced. Schizophrenia
will then be discussed in terms of concept, costs and demographic attributes followed
by mental health care accessibility. Lastly, the tool (Geographical Information
System) used for creating the models will be explored in terms of introduction,
definition, applications, KZN Health GIS Unit and potential errors.
2.1 THEORETICAL FRAMEWORKS UNDERLYING
THE STUDY
2.1.1 MEDICAL GEOGRAPHY
Medical geography forms the theoretical framework ofthis study. It is concerned with
the spatial analysis of human problems but is not an end in itself Rather it is a
multifaceted approach in which a wide variety ofgeographical (natural and social
scientific) methods are applied to health related problems (Mc Glashan, 1972; Pyle,
1979). Medical geography makes a valuable contribution in health planning in terms
of location. It aids in planning decisions in which the best location is opted for in
terms of the unique conditions and habitat of each community (Mc Glashan, 1972). It
is also useful to health authorities in mortality and morbidity mapping at a state level,
to develop programmes for delivery of health services and disease prevention and
control (Pyle, 1979). Basic demographical information (Mc Glashan, 1972) and
epidemiological knowledge (Pyle, 1979) are essential in its study.
2.1.2 DEMOGRAPHY
Demography is the scientific study of human populations, their size, composition and
development by studying the causes and consequences of population trends. The term
'population' refers to a number of people residing in some specific geographical area
3

(classroom or nation). Various characteristics of the populations are studied in
demography, such as, stable characteristics (sex, age, racial or ethnic identity), and,
economic characteristics (literacy and education, occupation and income). Nations
rely on regular censuses (counts) as the foundation of their demographic data
gathering systems (Yaukey, 1985).
2.1.3 EPIDEMIOLOGY
Epidemiology is concerned with the distribution and determinants of disease
occurring in human populations (Last, 1988; MacMohan & Pugh, 1970). It is
primarily interested in the following factors that influence disease patterns: time,
place, and person. Increasingly, modern psychiatric epidemiology is taking into
account the reality of countless perspectives for schizophrenia and its treatment (parry
& Swartz, 1997).
This research project focuses on the demographic and socio-economic characteristics
of the population studied.
2.1.3.1 Epidemiological Terms
The distribution of disease/disorder in any given population is measured by incidence
or prevalence (Barbato, 1998). The choice of measure is dependent on the problem
under study (MacMohan & Pugh, 1970).
Incidence describes the occurrence of illness, the number ofcases that came into
being. The rate of incidence describes the number of new cases that occurred within a
given period of time (usually a year) per specified unit of population (Warner, 1994;
MacMohan & Pugh, 1970). It directly estimates the probability, or risk, of developing
a disease during a specified period of time (Lilienfeld & Lilienfeld, 1980).
The incidence rates of adults with schizophrenia, in various countries, are found to
fall between 0.1 and 0.4 per 1000 population per year (Jablensky et aI., 1992). After
using standard diagnostic approaches and corrected age, the range of mean incidence
is 0.07-0.17 per 1000 (mean: 0.11; SD: 0.03).
4

Incidence rates are more precise indicators of the occurrence of an illness and are
more useful in the development of etiological theories (Warner & de Girolamo, 1995;
Stromgren, 1987; MacMohan & Pugh, 1970). Incidence tends to rely on first
admission figures and the diagnosis given. This proves to be problematic in
schizophrenia as the diagnosis requires signs of the disturbance to be present for at
least 6 months (American Psychiatric Association, 1994). On the first admission, the
diagnosis of schizophrenia is unlikely to be given (Stromgren, 1987).
Prevalence deals with the total number of cases (new and old) known to exist during a
specific period of time (Warner, 1994; Lilienfeld & Lilienfeld, 1980). Prevalence data
reflects not only the disease occurrence but in addition its duration (Warner& de
Girolamo, 1995). Three types of prevalence are used: point prevalence, period
prevalence, and, lifetime prevalence. Point prevalence is concerned with the total
number of cases that are in existence at any designated point in time. Period
prevalence deals with the total number ofcases of disease observed at some time,
during any given period of time. Lifetime prevalence refers to the number of people in
the population who have suffered from the illness at any period in their lives. Lifetime
prevalence is unaffected by the rate at which people recover (Warner, 1994). The
range of findings on point or period prevalence of up to one year for schizophrenia,
with age-corrected rates, varies from 0.9 to 17.4 per 1000 (mean: 5.8; SD: 3.6). In
developing countries the range is 0.9-8.0 per 1000 (mean 3.4; SD 3.4). In developed
countries the range is 1.3-17.4 per 1000 (mean 6.3; SD 4.32) (Warner & de Girolamo,
1995). The number of people with schizophrenia around the world can be estimated at
about 29 million, ofwhich 20 million live in developing or least developed countries
(Barbato, 1998). Prevalence is useful in administrative situations, such as, policy and
planning medical care services (Myers et al, 1982; Lilienfeld & Lilienfeld, 1980).
Diseases oflong duration, such as schizophrenia, impose greater burden on the
community than those of short duration.
Cases likely to be missed by both of these measures include prodromal cases (Miller
& Swartz, 1992), and the percentage of population who have never had medical
treatment or hospital admissions (Folnegovic, Folnegovic-Smalc & Kulcar, 1990; Hare
1986). An estimated 0.025 to 0.05 % of the total population of the United States is
treated for schizophrenia annually. In spite of the severity of the illness, only half of
5

all people with schizophrenia are considered to obtain treatment (Kaplan & Sadock,
1998).
2.2
2.2.1
SCHIZOPHRENIA
CONCEPT
Schizophrenia was first presented to medical language in 1911 by Bleuler, a Swiss
psychiatrist (Thara, Sucharitakul, Mendis & Islam, 2001; Barbato, 1998; Sue, Sue &
Sue, 1994). At times it is referred to as a distinct disorder although, many consider it a
group of disorders made up of a constellation of signs and symptoms, with different
aetiologies and outcomes (American Psychiatric Association, 1994; Sue et al., 1994;
Andreasen & Carpenter, 1993). Not one symptom of schizophrenia is considered to be
pathogenic (Sue et al., 1994). In fact, causes are varied and largely unknown (Barbato,
1998). There are many limitations in the making of the diagnosis of schizophrenia
(Maj, 1998). A defining feature of this heterogeneous clinical sYndrome is the
psychotic symptom, which the DSM-IV (American Psychiatric Association, 1994)
described as 'delusions, any prominent hallucinations, disorganised speech, or
disorganised or catatonic behaviour' (American Psychiatric Association, 1994 p 273).
Barbato (1998) summarises schizophrenia as displaying complex disturbances of
perception, affect, thinking and social behaviour. Evidence of this complex disease
indicates schizophrenia to be a serious mental health problem (Barbato, 1998).
One of the distinguishing features of the first definitions of schizophrenia was a heavy
reliance on a deteriorating course and poor outcome. There is greater variation in the
clinical course of schizophrenia than initially considered in classical psychiatry
(American Psychiatric Association, 1994; Barham and Hayward, 1990) as well as
more favourable outcomes subsequently reported (Peters, 1999; Vazquez-Barquero et
aI., 1999; Davidson, 1992; Thara, Henrietta, Joseph, Rajkumar & Eaton, 1994).
Barbato (1998) gives a stem, grounding warning, that 'the more optimistic picture
emerging from recent studies should not, however, lead us to overlook the fact that in
about 60 % of cases, schizophrenia runs a prolonged course (p8)'.
6

The study of the causes and treatment of schizophrenia is not pertinent to this
research. Intensive research into the many possible causes and most effective
treatment continues worldwide. These causes include biological, psychological and
environmental factors. The diathesis-stress model integrates these three factors by
suggesting that the individual has a specific vulnerability (diathesis) which, when
acted on by a stressful influence, allows the symptoms of schizophrenia to develop
(Kaplan and Sadock, 1998).
Hospitalisation is indicated for 'primarily diagnostic purposes, for stabilization of
medications, for patients safety. .. and for grossly disorganized or inappropriate
behaviour (Kaplan & Sadock, 1998, p485)'. The length of stay is determined by the
s~verity ofthe illness and the availability of outpatient treatment facilities. Short stays
of4 to 6 weeks are as effective as long-term hospitalisations especially if active
behavioural approaches are implemented in the hospital settings (Kaplan & Sadock,
1998).
At times, psychiatric patients may need compulsory treatment and detention in
psychiatric hospitals or institutions. The Mental Health Act (Act No 18 of 1973)
encompasses all psychiatric patients requiring detention in psychiatric facilities and
prescribes the admission procedure (Gangat, 2000):
a) voluntary admission (Article 3),
b) admission by consent (Article 4),
c) admission by certification (Article 9),
Admission by certification refers to the depriving of a person of hislher usual
freedom and civil rights. It implies that he/she cannot vote nor sign cheques and is
confined to the institution.
d) emergency admission (Article 12),
e) state patients (Article 28), and
f) informal admission to general hospital.
In MacPherson's (1995) survey of patients with schizophrenia between 1990 and
1995 at the Midlands Hospital Complex (Fort Napier Hospital and Town Hill
Hospital) in Pietermaritzburg, South Africa, schizophrenia was the predominant
7

diagnosis (55.6 %) followed by schizophrenia with substance abuse (12 %) and
schizophreniform (10.8 %).
2.2.2 SCHIZOPHRENIA COSTS
Schizophrenia is a chronic, debilitating and costly mental illness. In the U.S.A., the
cost of treatment of schizophrenia, excluding indirect costs, has been estimated to be
close to 0.5 % ofthe gross national product (Warner and de Girolamo, 1995). In the
u.K., schizophrenia accounts for more expenditure related to health care utilization,
unemployment and family burden than any other single psychiatric illness in the u.K.
(D~vies and Drummond, 1994). In South Africa, schizophrenia is one of the most
costly mental illnesses (Department ofHealth, 1998). Globally schizophrenia is seen
to consume a vast amount of each country's budget and overall resources.
Over and above defining the costs of schizophrenia in terms of direct, indirect and
intangible costs (Suleman, Ohaeri, Lawal, Haruna & Orija, 1997). Torrey (1988)
highlighted an area often not included in the cost estimate of schizophrenia, that of
not fully considering the magnitude of the illness. Schizophrenia often begins between
the ages of 17 and 25 years, and only about one quarter completely recover. Torrey
(1988) saw the cost of schizophrenia as three-fold:
1) the cost to raise and educate these individuals
2) the loss of productivity: many being unable to contribute to society
economically
3) most of these individuals require costly services from society for the rest of
their lives.
Schizophrenia is the most under-researched disease in the western world (Suleman et
al., 1997). In the United States, a calculation was made that if research discoveries
could reduce the cost of schizophrenia by only 10 % by 1998, the savings accrued
over the following decade would total at least $180 billion (Torrey, 1988).
8

2.2.3
2.2.3.1
DEMOGRAPHIC CHARACTERISTICS
Age
The onset of schizophrenia is usually between the ages between 15 and 25 years. It is
extremely rare to have an onset of schizophrenia prior to the age of 10 years and after
the age of 50. Approximately 90 % of the patients in treatment are between the ages
of 15 and 55 years old (Kaplan and Sadock, 1998).
2.2.3.2 Gender
The prevalence ofgender is equal in schizophrenia. However, the presentation in
onset and course varies. Males tend to present with earlier onset of schizophrenia,
with at least halfbeing hospitalised prior to the age of25 years. Males are more likely
to present with negative symptoms and hence be more severely impaired. Their
outcome is considered worse in comparison to females. Females tend to present with
schizophrenia at a later age, only about a third are hospitalised prior to the age of25,
and are more likely to function more adaptively (American Psychiatric Association,
1994). It is well established that females experience a milder course and better
outcome (Barbato, 1998). The gender difference in the age of onset is a robust
phenomenon and is found to be consistent in all cultures (Gureje, 1991). However, in
one study, Fennig, Putnam, Bromet & Galambos (1995) did not find a strong
correlation between gender and negative symptoms or premorbid functioning. This
highlights how little is understood about schizophrenia.
2.2.3.3 Marital status
Warner and de Girolamo (1995) found marital status to be associated with risk of
schizophrenia in several studies. Lower rates of most mental disorders are found
among married people than those unmarried (never married or were presently
separated, divorced or widowed) (WHO International Consortium in Psychiatric
9
Epidemiology (ICPE), 2000; Andrews et al, 2001; Sethi et al, 1974). Women tend to
marry earlier than men and to have a later onset of schizophrenia. Marriage is
considered to be a protective factor for those with schizophrenia. It is uncertain,
however, whether marrying early protects the individual from early onset of
schizophrenia, or whether the early onset of schizophrenia prevents the individual
from marrying. It can be said that if the individual has married, it is considered to be a
positive factor indicating the possibility of a better prognosis. It has been suggested
that marriage exerts a protective effect that delays the onset of illness in women.
Alternatively, the illness in its early stages may act as a barrier to marriage (Warner &
de Girolamo, 1995).
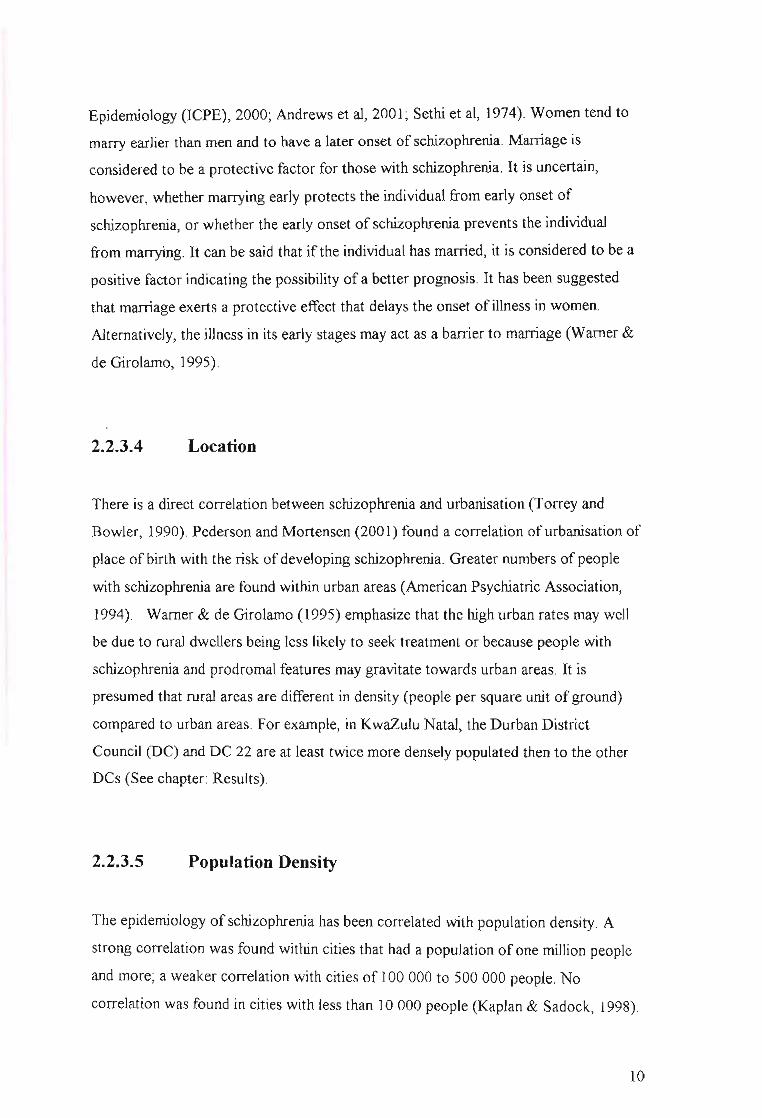
2.2.3.4 Location
There is a direct correlation between schizophrenia and urbanisation (Torrey and
Bowler, 1990). Pederson and Mortensen (2001) found a correlation of urbanisation of
place of birth with the risk of developing schizophrenia. Greater numbers of people
with schizophrenia are found within urban areas (American Psychiatric Association,
1994). Warner & de Girolamo (1995) emphasize that the high urban rates may well
be due to rural dwellers being less likely to seek treatment or because people with
schizophrenia and prodromal features may gravitate towards urban areas. It is
presumed that rural areas are different in density (people per square unit ofground)
compared to urban areas. For example, in KwaZulu Natal, the Durban District
Council (DC) and DC 22 are at least twice more densely populated then to the other
DCs (See chapter: Results).
2.2.3.5 Population Density
The epidemiology of schizophrenia has been correlated with population density. A
strong correlation was found within cities that had a population of one million people
and more; a weaker correlation with cities of 100 000 to 500 000 people. No
correlation was found in cities with less than 10 000 people (Kaplan & Sadock, 1998).
10

This effect of population density is consistent with the observation that the incidence
of schizophrenia in children with one or two parents with schizophrenia is twice as
high in cities than in rural communities. This observation also suggests that social
stressors found in urban settings may affect the development of schizophrenia in
people at risk (Kaplan & Sadock, 1998).
2.2.3.6 Seasonality of birth
People with schizophrenia are most likely to be born in winter and early spring, and
least likely to be born in late spring and summer. In the Southern Hemisphere, they
are more likely to be born between July and September (Kaplan & Sadock, 1998).
Eaton, Day & Kramer (1988) reported the excess of births among treated people with
schizophrenia at this time ofyear, to be approximately 10 % higher than at any other
time of the year. Adams & Kendell (1999) suggested that the significant year-to-year
variation in the birth rate of people subsequently developing schizophrenia provides a
potential clue to the nature of environmental determinants of schizophrenia. Various
hypotheses have been put forward as possible explanations. One proposes that a
season-specific risk factor may be operative, another suggests 'people with a genetic
disposition for schizophrenia have an increased biological advantage to survive
season-specific insults' (Kaplan & Sadock, 1998, p458), whereas another investigates
the interactions with specifically the human leukocyte antigen (HLA) and the
population at risk (Narita et al., 2000). The season of birth is considered to be a
valuable area of research. It is expected that eventually a relevant risk factor in a
significant proportion of cases in schizophrenia will be uncovered (Warner & de
Girolamo, 1995).
2.2.3.7 Culture
Schizophrenia is prevalent in all cultures with the core symptoms of schizophrenia
universally identifiable (Kaplan & Sadock, 1998). Mowry et al. (1994) found that the
prevalence rates of symptoms of schizophrenia appeared to vary across different
11

ethnic groups. Even though no racial prevalence difference is noted in schizophrenia,
it is still a pertinent variable to examine in South Africa due to the legacy of
apartheid. Much discrimination was directed at South African people ofcolour
resulting in them dominating the lower socio-economic ranks. Extreme inequality in
the distribution of income exists among racial groups and households. 'The poorest 40
% of households in South Africa earn less than 6 % of total national income, whilst
the richest 10 % earn more than half of the national income' (White Paper on Social
Welfare, 1997). Although 'poverty is not confined to anyone race group, it is
concentrated among blacks, particularly Africans: 61 % of Africans and 38 % of
coloureds are poor, compared with 5 % ofIndians and 1 % ofwhites' (poverty and
Inequality in South Africa, 1998). This factor may play an important role in the
ep~demiologyof schizophrenia.
Lilienfeld & Lilienfeld (1980) described religion to be an interesting population
characteristic as it usually related to the living habits of that population. This is of
particular relevance to South Africa as it may affect whether medical professionals or
traditional healers (including faith healers) are the first choice for treatment. After all,
it is estimated that there are some 150 000 traditional healers in South Africa
(including faith healers) (Karlsson & Moloantoa, 1984). Many of the problems that
they deal with are mental health related (Freeman, 1991). It is believed that as many
as 80 % of the South African population consults traditional healers (Hopa, Simbayi
& du Toit, 1998).
2.2.3.8 Socio-economic status
An excess of people with schizophrenia is found in the lower social classes (Freeman
and Alpert, 1986). Socio-economic status is a theoretical concept and still awaiting a
clear definition. Many variables encompass the concept such as, occupation, family
income, living conditions, and social prestige. Each variable measures a different
component of this complex subject, and its association can be expected to vary
according to the variable used (MacMohon & Pugh, 1970). Traditional measures of
social class (education, occupations and income) have been inversely related to the
12

prevalence of psychiatric disorders (Andrews et al, 2001; Jablensky et al, 2000; WHO
International Consortium in Psychiatric Epidemiology, 2000; Muntaner, Eaten, Diala,
Kessler & Sorlie, 1998; Torrey and Bowler, 1990). The majority ofepidemiological
studies have concluded that the lower the social class position the greater the risk of
psychiatric disorder (Timms, 1998; Kawachi & Kennedy, 1997). In spite of the strong
association between schizophrenia and a low social-class position, it has not been
established that this is an aetiological relationship (Timms, 1998).
2.2.3.9 Occupation
About 75 % of people with severe schizophrenia are unable to work and are
unemployed (Kaplan & Sadock, 1998). Those in employment had the lower rates of
all mental disorders (Andrews et aI, 2001; Jablensky et al, 2000; Timms, 1998; Sethi,
Gupta, Mahendru & Kumari, 1974). Among men in the workforce, a regular increase
in mental illness was found as the work status decreased (Timms, 1998; Odegaard,
1956). The relative risk of males in unskilled working class occupations being
hospitalised with a psychotic illness was twelve times more than those classified as
being upper middle class (Timms, 1998). Similarities of chronic schizophrenia and
the psychological effects oflong-term unemployment have been highlighted (Warner,
1985). These findings are of particular significance to South Africa as South Africa is
characterised by large-scale unemployment in the formal sector of the economy
resulting in great poverty exists alongside extreme wealth (White Paper on Social
Welfare, 1997). Unemployment among people with disabilities is high and 1.6 % of
the total South African population receives a disability grant (White Paper on Social
Welfare, 1997). It is an historic fact that unfortunately a large proportion ofthe South
African population has been exposed to the psychological effects oflong-term
unemployment, minimal educational opportunities, job discrimination and racial and
political conflicts.
13

2.2.3.10 Migration
Inconsistent findings have emerged to whether migration represents a risk factor in
schizophrenia as some migrant groups continue to show very high rates ofhospital
admission for schizophrenia, while other studies fail to show excess (Warner, 1985).
A possible explanation is that the nature ofmigration has changed and the process of
self-selection that operated before is no longer a prominent factor. However, there is
some evidence in relating the difference in variance rates to whether the migrant
enters the new culture at a high or low social status. Those who encounter poverty and
stress are routinely found to experience greater rates of psychotic1 illness whereas
those who enter a new culture with a high status studies have revealed lower rates of
hQspitalisation for schizophrenia. This variable is pertinent to South Africa because of
the wide spread poverty (White Paper on Social Welfare, 1997) and the expected
migration of Africans from rural areas to informal settlements closer to the centres of
metropolitan areas (Dor, 1994).
2.3 ACCESS TO MENTAL HEALTH CARE
After more than 40 years of apartheid, the new government came to power in 1994
and inherited a legacy ofgreat inequity in the South African health care systems
(Jinabhai & Campbell, 1995). Departments were fragmented and bureaucratic
resulting in discriminatory service delivery and inequities taking on many forms.
(Ntsaluba & Pillay, 1998). Much of South Africa is geographically impassable, hence
making the rendering and access to health care difficult leading to significant
geographical related inequities. The impact of these difficulties is aggravated in areas
characterised by widespread poverty and poorly developed infrastructure. Forty
percent ofall South Africans live in poverty, ofwhich 75 % live in rural areas and are
chiefly ofAfrican descent (South African Yearbook 2000101: Health, 2001).
I Psychosis is the 'inability to distinguish reality from fantasy; impaired reality testing with thecreation ofa new reality' (Kaplan and Sadock, 1998, p281) ,
14

Personnel and resources are found to be concentrated in the urban and metropolitan
areas (van Rensburg & Fourie, 1994).
The Bill ofRights does not guarantee individuals a right to health, but rather the right
of access to health care services (Constitution, 1996). This is reiterated in the National
Patients Rights Charter finalised in 1999 (South African Yearbook 2000/01: Health,
2001).
The Department ofHealth stated their objective was to ensure all South Africans have
access to health resources by adopting the district-based primary health care (PHC)
model. The major emphasis is the move from the curative hospital-based health car~
to integrated community based care (South African Yearbook 2000/01: Health, 2001).
Health care is provided at 3 levels. The Primary Care Level is the point of entry into
the system and embraces all general health services. The Secondary Care Level
comprises more specialized services to which patients are referred by the Primary
Care Services. Psychiatric institutions, offering long-term care, are found at this level.
The Tertiary Care Level includes highly specialized services not normally found at
the secondary level (Chetty, 1990).
South Africa has a well-developed network of public hospitals in urban areas. In
practice, an ineffective system of referral between primary care facilities and hospitals
has been found (Bloom & Mclntyre, 1998).
The essential message - stemming originally from the World Health Organisation's
Alma Ata Conference - is that health care must be provided at the site closest to
where people live and work, and at a point where they are able to exert maximum
control over their lives (van Rensburg, & Fourie, 1994). Utilization of facilities
declines when geographical accessibility declines (Ayeni, Rushton, & McNulty,
1987). A recent survey found that more than 35 % of African residents travelled more
than an hour to reach a provider ofhealth services and 73 % had to wait between 1
and 5 hours to see a health worker once they arrived at a facility (Hirschowitz and
Orkin, 1995, in Bloom & McIntyre, 1998).
The focus of this study is to examine the potential geographical accessibility of the 19
provincial hospitals. The existing public sector health services are found to be least
accessible to the most vulnerable of populations. This is particularly pertinent in
15
mental health as the services are found to be still concentrated in the psychiatric
hospitals and not in the health care clinics (Harvey, 2000). As 75 % of South Africans
do not have medical aid insurance there is a great reliance on the public health
services (policy on Quality in Health Care for South Africa, 2000).
2.4 GEOGRAPHICAL INFORMATION SYSTEMS
2.4.1 INTRODUCTION
'Fhe computer based Geographical Information Systems (GIS) were first available in
the late 1970's (Foote & Lynch, 1995). Since then the GIS have expanded rapidly,
maturing into general-purpose information technology that is capable ofaddressing
diverse problems in a geographical context (Longley, Goodchild, Maguire & Rhind,
1999). GIS are now used extensively in government, business, and research (Lynch,
1994). Applications are found in land resources (Foote & Lynch, 1995), fields of
census mapping and socio-economic modelling, and in geodemographic applications
such as marketing, health, transport and planning (Martin, 1999). Government
agencies are addressing public health issues, for example capturing AIDS data into
GIS databases for monitoring and modeling purposes (Chou, 1997). Two local studies
used the GIS to determine potential access of health care resources (Bhana & Pillay,
1998; Zwarenstien, Krige & Wolff, 1991).
2.4.2 DEFINITION
Foote & Lynch (1995) provide a generic definition for computer based GIS: 'GIS is a
special-purpose digital database in which a common spatial coordinate system is the
primary means of reference'.
16

There are four standard operations required by a comprehensive GIS:
1. Data input: from maps, aerial photos, satellites, surveys, and other sources
2. Data storage: retrieval, and query
3. Data manipulation: data transformation, analysis, and modelling, including
spatial statistics
4. Data output: data reporting, such as maps, reports, and plans (Foote & Lynch,
1995; Longley et aI, 1999).
Data input:
The GIS utilises digital data to represent time and space (Longley et aI, 1999). A
digital representation is a model of the real world (Burrough, 1986). The relationship
between the 'real' world and the representation at each stage depends not only on the
accuracy of the co-ordinates and attributes, but also on the researcher's decision
regarding what to include, how to measure / classify and symbolise those
representations (Martin, 1999).
Data storage
The GIS database is designed to represent, model, store, and access information about
spatial relationships based upon location (Foote & Lynch, 1995). The GTS database is
differentiated from other database applications by the fact that all the information in
the GIS is linked to a spatial reference. This refers specifically to geo-references
(latitude and longitude), which are the primary means in which data / information is
stored and accessed, as opposed to only location information (such as, street
addresses, postal codes) (Foote & Huebner, 1996). The GIS plays an important role in
integrating technology. A comprehensive GIS contains very powerful technologies
within a single database, allowing mapping, modelling, queries and analysing of large
quantities of data (Foote & Lynch, 1995). The GIS extends beyond merely software
or hardware. It is a process. It has the potential to play a crucial role in comprehensive
decision-making. The manner in which the information is captured, stored and
analysed must mirror the way it is to be used in the specific research or decision
making task (Foote & Lynch, 1995). Various kinds ofGIS exist and each has a
different purpose with different types ofdecision-making processes and unique
functions and roles (Foote & Lynch, 1995).
17

Data manipulation
A model is a simplified digital representation ofreality (Longley et al, 1999). The
model is used to simulate a process, obtain further understanding ofa situation,
predict an outcome and/or analyse a problem (Association for Geographic
Information, 1999).
The schematic diagram (Diagram 1) demonstrates the powerful tools provided by the
GIS. It has arranged information about a certain location (a given region or city) as a
set ofmaps. Each map displays information about one characteristic of the region. In
this example, the information is useful in planning urban transportation. Each ofthese
separate thematic maps is referred to as a coverage or layer. Each tier is carefully
la~ered over each other ensuring that the location is precisely corresponding to the
locations on all the other maps. The bottom layer of the diagram is the most
important. It represents the grid of the locational reference system (such as longitude
and latitude) to which all the maps have been precisely registered. Once overlaid, the
information displayed on the different layers may be compared and analysed in
combination (Foote & Lynch, 1995).
Census Tracts
Roads
Bus ROUMS
Shopptngcenters
Industrial Sites
GIS: An IntegraIing Technology
Diagram 1: Overlaying ofvarious
thematic maps of one area (Diagram
from Foote & Lynch, 1995).
The GIS also provides for exploring spatial patterns and processes in one location or
the entire region. Diagram 2 illustrates 'how single locations or areas can be separated
from surrounding locations ... by simply cutting all the layers of the desired location
from the larger map (Foote & Lynch, 1995, p3)'.
Diagram 2: GIS focusing on one area
(Foote & Lynch, 1995).
18

Data output:
An important purpose of the GIS is to function as a decision support system. Maps are
important tools in this process. Maps are ideally suited for spatial data as they assist
understanding and revealing spatial relations and patterns (see map 1), and are
integral parts of the spatial handling process. Complex multidimensional aspects of
spatial data are effectively captured, quickly grasped and digested when displayed via
the graphic methods characteristic of the GIS (Beard and Buttenfield, 1999).
Iliwba J ,..1
Map 1: Illustration of the spread of positive cholera cases (the
darkest areas) in the month ofMarch 2002 (Geographical
Information Systems Unit, 2002).
Maps also play an important role in the visual decision support as they provide a
direct and interactive interface to GIS data. It is important for the user to adhere to
proper map strategy to perform this important GIS aspect of interpreting and
analysing them (Kraak, 1999).
2.4.3 APPLICATIONS
This study utilises the GIS process to address two questions:
1) would a geographical pattern emerge if socio-demographical variables associated
with schizophrenia, were overlaid in KZN?
2) are the public hospitals offering psychiatric services in KZN, geographically
accessible to specified populations?
These two specific aspects are discussed further below.
19

Schizophrenia sensitivity model
The GIS can be used to problem solve in a particular application area (e.g. mental
health) by drawing inferences from a knowledge base attained by human expertise.
These knowledge based systems, or more commonly, expert systems have formed the
basis of automated map generalisations (Association for Geographic Information,
1999). The mental health knowledge base would be tapped into by approaching a
number of 'experts' (professionals who have worked in the field of schizophrenia for
a few years) to contribute in the process of selecting and ranking variables that
increase the risk of schizophrenia (See section 3.4.2.2: Consulting the "experts").
Weighting is a scaling factor that indicates the importance of a variable in a particular
op.eration. Weighting determines the influence that a particular layer will have on the
final result (Association for Geographic Information, 1999). In this study each
variable, and then, separately, each sub-definition within each variable was ranked
according to importance in the modeling process. GIS practitioners tap into the
knowledge base of'experts' in the specific field of interest, to assist in identifying
what information is important and to what degree (pers comm. Shannon Rushworth,
2001).
Not all analyses use all map layers simultaneously, for example, schizophrenia
sensitivity model. Some researchers use the information selectively to take the
relationships between specific layers into consideration. Diagram 3 illustrates one
example, in which two or more layers are combined and transferred into a new layer
for use in subsequent layers. These then are overlaid, forming a unique combination
of overlapping socio-demographic data associated to schizophrenia. This ability of the
GIS to separate information into layers and then combine some with other layers of
information highlights its great potential as a research and decision-making tool.
Sometimes, the process ofcombining and transforming information from different
layers is called map 'algebra' as it involves adding and subtracting information (Foote
& Lynch, 1995).
20

Diagram 3: Combining and
transfonning ofdata (Foote &
Lynch, 1995).
Selecting and TransformingGIS Data by Layer
Geographical accessibility model
Accessibility is the aggregate measurement to determine how reachable specific
l~cations are from a given location (see diagram 4). It is commonly measured in
distance or by cost (Association for Geographic Information, 1999). The measure of
accessibility is generated easily and can play a useful role in policy and service
analysis, for example, in determining the gaps in service provision and location of
new facilities (Martin, 1999). In this research, the geographical accessibility of public
hospitals offering psychiatric services is explored. The gravity model is the
foundation ofassessing geographical accessibility. The gravity model (spatial
interaction model) aims at analysing movement of people or goods or services
between origins and destination in terms ofaccessibility. This is usually based on
distance and demand (Association for Geographic Information, 1999).
....By using a GIS's modelling techniques,
variables can be combined to create a
map, which illustrates the effort it
takes to move from a point to a health
facility.
Diagram 4: An example ofan effort map (Geographicallnformation Systems Unit, 2002).
Effort or cost can be described in terms of time, distance decay, impedance or other
user-defined factors (Association for Geographic Information, 1999). Distance decay
is a mathematical representation in spatial interaction on the accessibility and number
of interactions between locations. It reflects a reduction in demand as distance
increases (from the source of some supply) due, normally, to increasing travel costs
(Association for Geographic Information, 1999). The following variables were used to
21

define accessibility in this geographical accessibility model: distance from place of
residence/ referral to hospital, road access, physical obstacles in between such as
major river/nature reserve, financial cost, and, walking distance to the service.
2.4.4 HEALTH GIS UNIT, KZN, DEPARTMENT OF
HEALTH
There is a GIS Unit within the Department ofHealth, KZN (see website
http://www.kznhealth.gov.za/gisinfo.htm).Itsaimsaretogather.maintain. assess and
report on spatial data and information, with the intention offacilitating understanding
in these areas relating to the health of the population ofKwaZulu-Natal. It aims to
make the information gathered and stored, available to individuals and organisations
(internal and external) and be utilized in making recommendations and decisions on
the maintenance, management and use ofhealth resources in the Province. Shannon
Rushworth (BSc Honours specializing in Geographic information Systems, University
ofNatal- Pietermaritzburg) is the GIS manager. Mrs Rushworth has been the
intermediary between the present research project and the GIS.
2.4.5 POTENTIAL ERRORS IN USING THE GIS
There are three main groups offactors governing the errors associated with
geographical information processing:
I Obvious sources of error
II Errors resulting from natural variations or from original measurements
III Errors arising through processing (Burrough, 1986).
22

3.1
CHAPTER THREE: METHODOLOGY
INTRODUCTION
The theoretical framework of medical geography underpins this study providing the
opportunity for a spatial analysis ofhuman problems. Epidemiological knowledge
(pyle, 1979) and basic demographic information (Mc Glashan, 1972) are essential to
its study. Increasingly in South Africa, epidemiology has been utilized to provide
global pictures of the possible causes and geographic locations of the concentration of
illnesses in an attempt to develop a research basis that could inform policies to
transform health care (Katzenellenbogen, Joubert & Yach, 1997). This research study,
a pilot project, created a database of certified patients diagnosed with schizophrenia
during a 2 year time period, at Fort Napier Hospital in Pietermaritzburg, Kwazulu
Natal. Tt attempts to explore the distribution of the socio-demographic variables of
schizophrenia in KZN assessing the geographical accessibility to the public hospitals
with psychiatric facilities within KZN.
Physical diseases such as cholera and tuberculosis tend to have clear cause-effect
relationships. Mapping these diseases is simpler in comparison to a complex mental
illness such as schizophrenia. There are countless aspects of schizophrenia that are
unclear, and numerous associated variables whose relationships with the actual
disorder, and each other, are still not fully understood. To complicate matters further,
there are a profuse number of theories trying to explain these relationships, which
often contradict one another. One example is the variable ofmarriage. Some argue
that it is a protective factor. Hence married women tend to develop schizophrenia at a
later stage. In contrast, others propose that it is simply because men experience earlier
onset of schizophrenia they are less likely to get married. Regardless ofwhether the
variables are precipitating factors or consequences of the disease, these variables are
consistently experienced as core components in the make up of schizophrenia. Despite
many ambiguous areas being evident, it is still relevant to investigate whether a
geographical pattern might emerge if pertinent variables associated with
schizophrenia were found clustered together within a particular location.
23

The 1995 Census database (Central Statistical Services, 1995) fonns a powerful
current resource, yet much needed and basic infonnation in the health sphere area is
not available. The richness of data found in the files of certified patients at Fort
Napier Psychiatric Hospital highlights the possibility and wealth ofinfonnation that
can be drawn on in the psychiatric hospitals, were they only computerized and
combined with a regional! national database. This would be ofgreat benefit for mental
health, and with regard to policies, more effective, infonned decision-making.
3.2 AIMS AND HYPOTHESES
1. To gain a greater understanding of the variables affecting and possibly contributing
to schizophrenia, by firstly, describing the demographic trends and deviations from
international findings, and secondly, using the Geographical Infonnation Systems
(GIS) model, to overlay these individual socio-demographic variables in order to
examine a potential combined effect.
2. To explore the geography of schizophrenia in tenns ofaccessibility of the mental
health services to individuals diagnosed with schizophrenia.
The following questions are proposed:
1. What is the socio-demographic profile of certified patients in KZN diagnosed with
schizophrenia between the years 1995 and 1996?
2. Can a meaningful geographical model of socio-demographic variables of
schizophrenia, be constructed?
1. If the many factors associated with schizophrenia (such as age, gender and
marital status), that can be mapped, are co-ordinated, will a distinct pattern
become obvious? Are certain populations I variables such as gender more
evident in the occurrence of schizophrenia?
24

2. What percentage of the population in KZN is located within the areas of
greater schizophrenia sensitivity?
3. Would the above model withstand statistical testing? What number of certified
patients diagnosed with schizophrenia would fall into the greater areas of
schizophrenia sensitivity?
3. How geographically accessible are the public psychiatric hospitals to the
population? Firstly, the entire population, secondly, the population falling within the
distinct patterns identified in the schizophrenia sensitivity model, and thirdly, the
certified patient population with a diagnosis of schizophrenia from Fort Napier
Hospital, in KwaZulu Natal (KZN)?
3.3
3.3.1
METHODOLOGY
Sample
Two samples were studied. The first entailed all those certified patients diagnosed
with schizophrenia, hospitalized at Fort Napier Hospital (FNH) during the years 1995
and 1996.
The second involved orJy the population of the province ofKZN, as defined by the
National Census Data (Central Statistical Services, 1995).
3.3.2 Instruments
Microsoft Access (2000) was utilized to capture and create the database for the
records of the certified patients.
IDRISI Geographic Information System (GIS) software was used in order to:
• Visually display the KZN district and public psychiatric hospitals
• Create and display a geographical model of socio-demographical variables
associated with schizophrenia
• Display the accessibility of public psychiatric hospitals to the population in
KZN (Chou, 1997; Martin, 1999).
25

3.3.3 Validity and Reliability
To ensure adequate validity in this study it is important to recognize the limitations
and specific aims adopted in this study. Rosnow & Rosenthal (1996, p136) describe
construct validity as being 'concerned with the psychological qualities constituting
what has been characterized as the theoretical scaffolding between X and Y'. It is
important to note that this project is not dealing with causation of different variables
related to schizophrenia and accessibility, but rather it is an attempt to describe them.
Schizophrenia is consistently associated with many variables, yet not one has been
proven to be pathogenic. Very specific variables have been selected for this study.
Rather than trying to comprehensively cover the entire spectrum ofvariables affecting
schizophrenia, the variables chosen were "map-able" and accessible to electronic data
capture.
It is important to note that the aim was neither to explore possible explanations /
causes of schizophrenia, nor investigate the relationships with the variables used, but
essentially a pilot study to explore whether a distinct geographical pattern in the
province would emerge from the selected variables. It was also hoped that the study
would encourage additional questions, leading to further valuable research in this
area. It is evident that further research would be required in which a full range of
variables be included.
3.4 THE PROCEDURE
The research procedure dealt with three major areas: 1) creating a database of
certified patients with schizophrenia at Fort Napier Hospital; 2) establishing and
working with the geographical pattern of socio-demographic variables; and 3)
assessing geographical accessibility to the public hospitals in KZN.
26
3.4.1
3.4.1.1
DATABASE OF CERTIFIED PATIENTS WITH
SCHIZOPHRENIA
Creating a Database of Certified Patients with
Schizophrenia
The collection of the data involved accessing the files at the Fort Napier Hospital
(FNH) registry. The demographic data of the relevant patients were captured directly
into the researcher's database and coded for data analysis. The demographic data
included: age, diagnosis, ethnic group, gender, marital status, religion, season of
admission, first admission/readmission to the hospital, length of stay (date, admission
and discharge dates), and place of residence / certification.
Permission to conduct the study was obtained from the Chief Medical Superintendent
of the Midlands Hospital Complex.
The following criteria were used to select the patients' files:
1. admission to FNH was between January 1995 and December 1996
2. the primary diagnosis was schizophrenia, schizophreniform,
schizoaffective, schizophrenia with substance abuse, schizophrenia with
alcohol abuse, schizophrenia with personality disorder, schizophreniform
with substance abuse, or, schizoaffective with substance abuse
3. the patient's place of residence or place of certification referral had to be
known
4. place of residence or certification was within the province ofKZN.
3.4.1.2 Ethical Considerations
Anonymity
By recording only the patient's file numbers and not their names, the anonymity of
the patients' records was ensured.
Confidentiality
Confidentiality of the contents of the files was secured by the researcher consciously
27

focusing only on the relevant data in the files pertinent to the research. The researcher
was also bound by the rules of confidentiality as laid out by the codes of the Health
Professions Council of South Africa for Intern Psychologists and Psychology
researchers. Only people involved in the research methodology had access to the raw
data.
Responsible Research
The file numbers were included in the event that additional information was required
at a later stage. This was a necessary step to ensure responsible research, as one of the
research objectives was to initiate a mental health database. If further variables were
identified to be researched in the future, then this original database could be utilized
by the files being re-accessed in order to include the additional variables rather than
having to repeat the entire data capture process.
3.4.1.3 Describing the Database of Certified Patients with
Schizophrenia
The sample of certified patients was described according to age, gender & race,
education, marital status, seasonality of birth, employed, occupation (type of
employment), religion, previous admission, length of stay, and diagnosis.
Two maps were produced capturing the patients' geographically referenced variables
(town of origin / referral). The first map (Map 2) illustrated the patients' place of
residence. The second (Map 3) illustrated the patients' place of certification/referral
source linked to the patients' place of residence.
The bottom layer (the locational reference system grid, See Diagram 1) (Foote &
Lynch, 1995) ofMap 2 & 3 consisted ofa map ofKZN in which the 11 health
districts and the 63 public provincial hospitals were displayed. The 19 hospitals
offering psychiatric services are higWighted (KwaZulu Natal Department ofHealth,
2000).
28

3.4.2 GIS MODEL OF SCHIZOPHRENIA SENSITIVITY
This section was made up of three main sub-sections: describing the socio
demographic variables ofKZN; collecting the data required for the model; and,
working with the model's output.
3.4.2.1 Demographic details of KZN province and population
For the purpose of describing the demographic details ofKZN province and
population, the Census data (Central Statistical Services, 1995; calculated based on
Statistics SA amended average growth rate for KwaZulu-Natal from 1996 to 2001
(period 4.7592 Years) of 1.5834 % per annum) was cleaned by rounding the figures
off to a whole number or in some instances to the first or second decimal (See
Appendix 2). The relevant categories and subsections were extracted and grouped by
District Councils (DCs). The population ofKZN was described according to various
socio-demographic variables: age, gender, internal migration, education, marital
status, occupation, socio-economic status, disabilities, urban/rural location, and
population density.
3.4.2.2 The model of schizophrenia sensitivity
The following steps were used to create the model investigating the geographical
pattern of socio-demographic variables of schizophrenia:
1. Consulting the "experts"
• Select a number of"experts" (professionals who have worked
in the field of schizophrenia for a few years) to decide on
variables that increase the risk of schizophrenia
• Each "experts" to independently rank these variables (1-10
where 1 is the most important variable / variable ofgreatest risk
for the individual); combine and average each of the variables'
rankings
29

2. Selecting, defining and weighting ofvariables
• Variables utilised in the study
• Establish a map-able definition for each variable
• Weighting within the variables
3. Data Manipulation
• Mapping the variables
• Layer each variable over KZN
• HigWight the areas where several of these variables overlap and
thereby visually displaying the geographical pattern of these
variables concentrated together (Association for Geographic
Information, 1999).
Consulting the "experts"
Certain professionals currently working in KZN with patients diagnosed with
schizophrenia were approached to provide information and to gain consensus on
which variables it would be useful to include in the study, the ranking of these
variables1, and to collaborate on the definitions used. The clinicians approached
requested anonymity.
A questionnaire (see appendix) was drawn up to submit to the various "experts". The
questionnaire listed thirteen variables identified from the literature review as variables
linked to schizophrenia. In section one, the "experts" were requested to identify
further relevant variables. In section two, they were asked to rank the variables
according to their perception of the importance of the variables, based on their work
experience in the field of schizophrenia2. In section three, a list of the variable
definitions was provided. The "experts" were requested to add to these definitions and
provide further comments. The questionnaire was faxed to two clinicians. TIllS
I This was omitted in the making of the model of schizophrenia sensitivity. All the variables used wereequally weighted and considered to be totally independent of the others. Some variables were brokendown into several subdivisions. These subdivisions within that particular variable were then weightedin relation to each other.2 See footnote I
30

approach, however, rendered poor information. It seems that the lack of discussion
and achieving some form ofconsensus, the complexity ofthe issue of schizophrenia,
and possibly an unclear questionnaire rendered unhelpful results.
Subsequently, the researcher met with another clinician and discussed and debated the
purpose of the research project and questionnaire in detail, after which the "expert"
completed the questionnaire independently. These results were more coherent,
thorough, and in line with the study's purpose. It was therefore decided that only the
input of this "expert" would be applied in the selection of the variables utilised in
corroboration to the literature review (See section 2.2.1). This represents a great
limitation as the knowledge base system (Association for Geographic Information,
1.999) being made use offor this study is restricted to one person as opposed to
collaboration ofseveral "experts", hence weakening the reliability ofthe variables
chosen. However, it could be argued that the literature review provides adequate
support in itself for the variables selected for the study and that the 'experts' most
valuable input required was to rank the variables. Eventually this ranking of the
variables was not implemented, as the literature could not provide guidance in this
area. Seemingly variables have been studied independently but not collectively to
examine the potential combined effect of the variables as proposed by this study. The
impact of ranking the variables could be explored in future studies. Hence, the
limitations of the 'experts' may be argued to have minimal impact on the study.
The variables utilised in the study
The variables listed by the "expert" fell into three categories: socio-demographic (age,
gender, marital status, seasonality of birth, occupation, socio-economic status, internal
migration, rural/urban location, population density), past history variables (family
history ofmental disorder, family history of schizophrenia, maternal health, birth
obstetric details, birth maturity, infant/child mal-development, infant/child ill-health),
and personal habits: substance use. This study focused only on the socio-demographic
variables, as these were map-able and accessible (in terms of the database) to study.
The remaining variables not included in this study highlight the need for these areas to
be further studied.
31
Definitions ofthe variables used
A map-able definition was then made ofeach identified variable being used in the
study. The definitions used for the socio-demographic variables included in the study
are detailed below. Table 1 provides a summary of the definitions used.
Age:
The highest ranking within the age variable was for the age group: 15 - 25 years, in
which onset of schizophrenia occurs most commonly, followed by the age group: 25
55: This type ofage grouping is corroborated by Kaplan and Sadock (1998).
Gender:
Males tend to present with schizophrenia earlier (15-25 years). Females tend to
present with schizophrenia at a later age (25-35 years). As the prevalence of
schizophrenia is equal across gender, the rankings within the gender variable were
also kept the same (American Psychiatric Association, 1994).
Marital status:
Warner and de Girolamo (1995) found marital status to be associated with risk of
schizophrenia in several studies. The highest internal ranking will be for those single,
and then for those divorced, widowed/separated.
Location:
A strong correlation of schizophrenia and urbanisation has been found to exist (Torrey
and Bowler, 1990). High rates of schizophrenia are found in urban centres in
comparison to rural areas (Warner & de Girolamo, 1995). Demarcating precise
32

boundaries for areas considered 'urban' or rural is an ongoing problem for
demographers, and the boundaries always seem arbitrary (Yaukey, 1985). Defining
urban is therefore a matter ofdegree. 'Urban' features appear to correlate with
population size and distribution characteristics. Hence an urban centre would be
described as having a relatively large population, settled, and compacted in within an
area surrounded by an area with less dense population. Urban places with big
populations are 'more urban' than those with small populations. The most difficult
and arbitrary task is to decide the cut-off point for the smallest urban place. The
national census bureaus are relied upon to choose these cut-off points. This introduces
a problematic lack of standardisation into international comparisons, which explains
why there tends to be a greater level of confidence in the comparability of statements
a~out cities with larger population sizes, such as 100 000 and above, or 1 million and
above, as these are considered undoubtedly to be cities (Yaukey, 1985).
Population Density:
A strong correlation was found within cities that had a population of one million or
more; a weaker correlation with cities of 100000 to 500000 people. No correlation
was found in cities with less than 10 000 people (Kaplan & Sadock, 1998). As the
density of the population in KZN increased so the weighting of that variable would
Increase.
Seasonality ofbirth:
In the Southern Hemisphere, people with schizophrenia are more likely born between
July and September (Kaplan & Sadock, 1998). However, this variable will not be
included in the map of socio-demographic variables, as the census data (Central
Statistical Services, 1995) does not render the date of births of the SA population. It
will be discussed under the section dealing with the data on certified patients with
schizophrenia at FNH.
33
Socio-economic status:
The current international poverty line stands at an average per capita consumption of
US$ 1.00 per day (in 1985 dollars) (Gwatkin, 2000~ Poverty and Inequality in South
Africa, 1998). That would be an equivalent of about RJOO per month in South Africa.
The first internal variable ranking is allocated to that proportion of population
receiving no income, then those receiving between RI - R200 per month, and thirdly,
those receiving between R201 - R500 per month.
Occupation:
About 75 % of people with severe schizophrenia are unable to work and are
unemployed (Kaplan & Sadock, 1998). Those in employment had the lower rates of
all mental disorders (Andrews et aI, 2001). Among men in the workforce, a regular
increase in mental illness was found as the work status decreased (Timms, 1998;
Odegaard, 1956). The lowest occupation scale given by Census Data (Central
Statistical Services, 1995) is that of 'elementary occupations'.
Internal migration:
Despite inconsistent findings regarding migration and schizophrenia (Warner, 1985),
it is still considered an important factor in this study. It is pertinent to South Africa
because of the long history of migration labour laws forcing African men to migrate
from their homes to places of employment. Only those who have moved to KZN in
the period 1991-1996 will be considered.
Weighting within the variables
In this model, each variable was considered to be totally independent of each other.
All the variables were allocated the value of one with the exception of those variables
with more than one definition (see table 1). Two examples are given to explain the
34
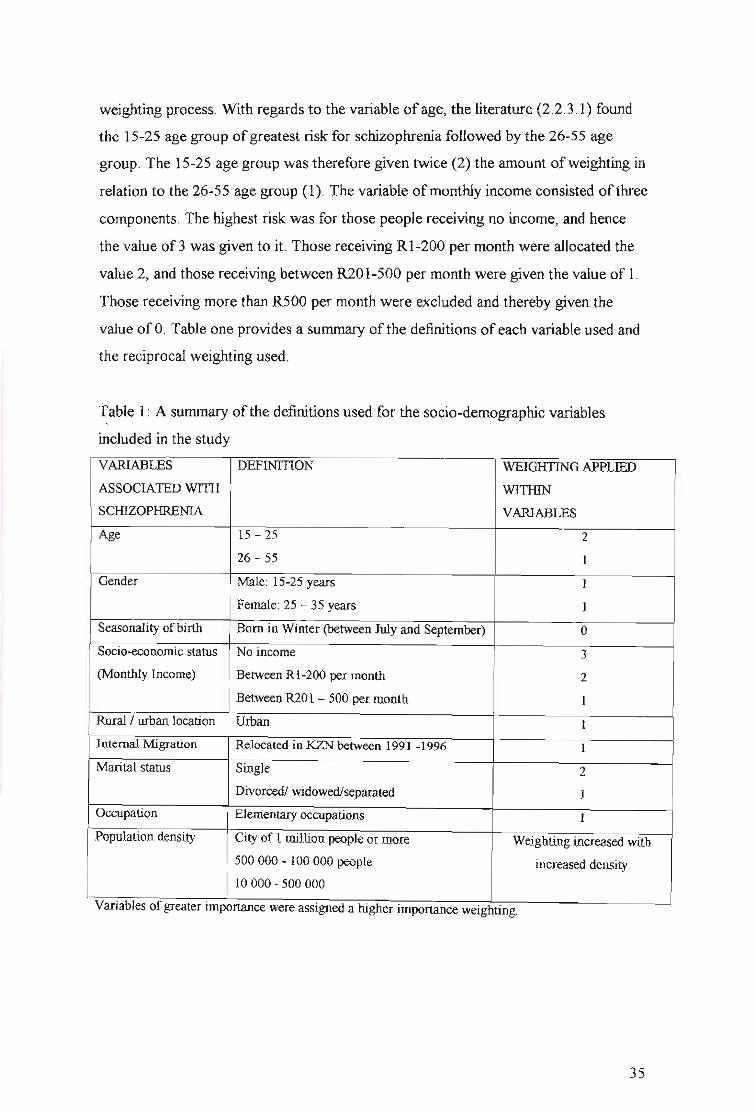
weighting process. With regards to the variable of age, the literature (2.2.3.1) found
the 15-25 age group ofgreatest risk for schizophrenia followed by the 26-55 age
group. The 15-25 age group was therefore given twice (2) the amount ofweighting in
relation to the 26-55 age group (1). The variable ofmonthly income consisted of three
components. The highest risk was for those people receiving no income, and hence
the value of 3 was given to it. Those receiving Rl-200 per month were allocated the
value 2, and those receiving between R201-500 per month were given the value of 1.
Those receiving more than R500 per month were excluded and thereby given the
value ofO. Table one provides a summary of the definitions ofeach variable used and
the reciprocal weighting used.
Table 1: A summary of the definitions used for the socio-demographic variables
included in the study
VARIABLES DEFINITION WEIGHTING APPLIED
ASSOCIATED WITH WITHIN
SCHIZOPHRENIA VARIABLES
Age 15 - 25 2
26-55 1
Gender Male: 15-25 years 1
Female: 25 - 35 years 1
Seasonality ofbirth Born in Winter (between July and September) 0
Socio-econornic status No income 3
(Monthly Income) Between RI-200 per month 2
Between R201 - 500 per month 1
Rural / urban location Urban 1
Internal Migration Relocated in KZN between 1991 -1996 1
Marital status Single 2
Divorced! widowed/separated 1
Occupation Elementary occupations 1
Population density City of 1 million people or more Weighting increased with
500 000 - 100 000 people increased density
10 000 -500 000
Vanables of greater Importance were aSSIgned a higher Importance weIghtIng.
35

Mapping the variables
The IDRISI GIS software was utilized to layer each variable over KZN. The
accessibility model was based on the continuous data of the 1995 Census database
(Central Statistical Services, 1995) resulting in every pixel on the KZN map being
represented.
The nature of the GIS model used in this study did not allow for individual variables
or populations to be examined separately as it was in the combining of the variables
that best reflected the likelihood of suffering schizophrenia. The geographical patterns
of the individual variables would have to been examined prior to the modeling (This
fell out of the scope of the present study). Hence it was not possible to determine
~hich individual variable might have been more evident in the pattern of
schizophrenia.
The model's output (See map 4) visually displayed the geographical pattern of these
variables concentrated together. The darker areas on the map indicated the greater
number of variables overlapping. The greater the amount of overlap demonstrates a
greater proposed schizophrenia sensitivity of the population in that area. The model
output (Map 4) is relative of nature. The 6 levels of schizophrenia sensitivity evident
in the map indicate the natural breaks occurring within data ofthe model.
3.4.2.3 Working with the model's output
Percentage ofPopulation Overlap
The percentage of the population in KZN that fell into each range of schizophrenia
sensitivity was identified (See section 4.3.2).
Degree ofCorrelation
The correlation of overlap between the data of certified patients with schizophrenia
and the patterns identified by the geographical model for schizophrenia sensitivity
was determined (See section 4.3.3).
36

3.4.3 GEOGRAPHICAL ACCESSIBILITY
Ascertaining the geographical accessibility of the public hospitals to the KZN
population involved deciding on the variables to be utilised in the study, mapping the
variables and, working with the model's output.
3.4.3.1 Accessibility model
Defining and weighting the variables l
The following variables were used to define accessibility on the map:
1. distance of hospital from place ofresidence
2. road access
3. physical obstacles in between such as major river/nature reserve
4. financial cost (e.g. to pay for transport)
5. walking distance to the service.
Variables that posed more of a barrier in terms of hindering the accessibility to a
psychiatric health facility have been given a higher friction weighting (See 2.4.3:
Geographical accessibility model). These variables were overlaid to create the
accessibility model (See table 2). The friction costs were determined radially from the
health facilities currently offering psychiatric services. The accessibility model
provided only a relative indication of the difficulty in accessing the services provided
(Rushworth, 2002).
1 The GIS Unit obtained the river data from the Department of Water affairs; the Digital ElevationModel from The Department ofTraditional and Local Government Affairs; Game reserves informationfrom KZN Wildlife Services; Road input from the KZN Department of Transport; Population data wasobtained from 1996 census; and the actual co-ordinates of the Health facilities were collected usinghand held Geostationary Positioning Satelites (GPS).
37

Table 2: A summary of the variables used for the GIS accessibility model
VARIABLE FRICTION WEIGHTING
Slopes (steepness) Friction increases as the steepness of the
slope increases.
Income (people earning less than Friction increases with increased number
R500-00 per month) of people in an area
Distance from psychiatric facility Friction increases with distance away
from facility
Major rivers 5000
Protected conservation areas 5000
District roads 100
Provincial roads 10
National roads 1
Mapping the variables
Each variable was layered over KZN by the IDRISI GIS software in which every
pixel on the KZN map was represented.
The model's output (See map 5) visually displayed the geographical pattern of these
variables concentrated together. The darker areas on the map indicated the greater
number of variables overlapping~ the darker the area, the poorer the degree of
accessibility. The natural break of the data resulted in 255 ranges of access. These
were then were grouped into 9 levels of access (See Table 20). The lower accessibility
ranges represent easier degrees of access (Access levels 1-3 = easy access)~ the
middle access levels 4-6 signifies average access; and the highest levels of access (7
9), symbolize difficult access.
3.4.3.2 Application of the Accessibility model
The model highlighted the areas that are geographically accessible to the population
in KZN. The degree ofaccessibility was examined in relation to, firstly, the entire
KZN population, and secondly, then to the certified patient population of
schizophrenia from FNH.
38

4.1
CHAPTER FOUR: RESULTS
DESCRIPTION OF KWAZULU NATAL (KZN)
KwaZulu Natal (KZN) is the largest of the nine provinces that constitute the Republic
of South Africa. It has a population of approximately 8.5 million people and covers
an area of 92 435 square kilometres. The province consists of 11 district councils
(DC): Durban, DC21, DC22, DC23, DC24, DC25, DC26, DC27, DC28, DC29, and
DC43. Each DC, except for the Durban DC, is made up of several local councils (See
Appendix, table 1). The district councils represent the health districts in the Public
Health system. The 1995 Census Data has been used and adapted to describe the
socio-demographic variables ofKZN. The KZN Health Department's GIS Unit
created the maps that were generated by this study.
One-third of the KZN population resides within the Durban District, and fifty-three
percent of this population is female. In both the female and male age distributions, the
0-14 year age category dominates. The 15-25 and 36-65 year age categories tended to
be the next highest groups. The African population group forms 82% of population. A
large percentage (21 %) of the population have no formal education. Twenty-nine
percent of those who have attended school have attained between grades 1 - 7
educational levels, 32 % have between grades 8-12, and only 3% have tertiary
education. Unemployment is high; with only one-quarter of the potential work force
employed. Thirty percent of the working population practice elementary occupations.
Sixty-three percent of the population receive no income, and 15 % receive between
RI - 1000. Six percent ofthe population have disabilities, with 0.5% being mental
disabilities although this figure may be under-reported. Seventy percent of the
population have never married while 25% are classified as married or living together.
Seventy-seven percent of the population reported never to have moved from each
respective DC.
39
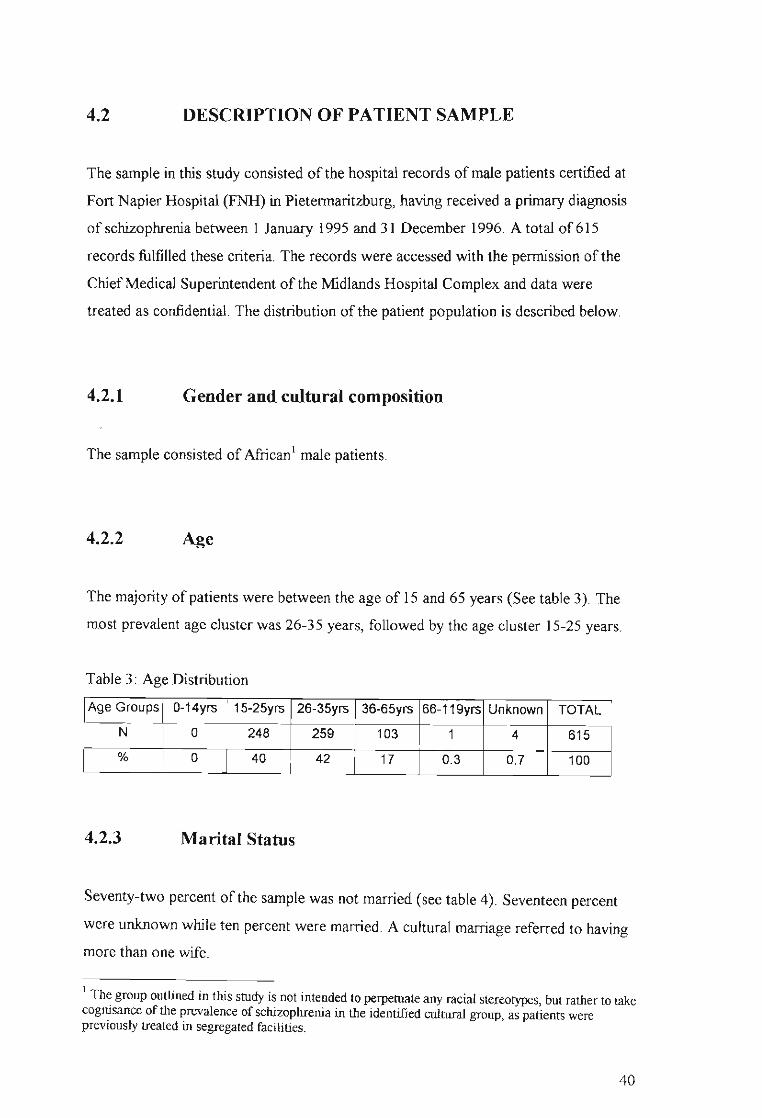
4.2 DESCRIPTION OF PATIENT SAMPLE
The sample in this study consisted ofthe hospital records ofmale patients certified at
Fort Napier Hospital (FNH) in Pietermaritzburg, having received a primary diagnosis
of schizophrenia between 1 January 1995 and 31 December 1996. A total of61 5
records fulfilled these criteria. The records were accessed with the permission of the
ChiefMedical Superintendent of the Midlands Hospital Complex and data were
treated as confidential. The distribution of the patient population is described below.
4.2.1 Gender and cultural composition
The sample consisted of African1 male patients.
4.2.2 ~e
The majority of patients were between the age of 15 and 65 years (See table 3). The
most prevalent age cluster was 26-35 years, followed by the age cluster 15-25 years.
Table 3: Age Distribution
Age Groups 0-14yrs 15-25yrs 26-35yrs 36-65yrs 66-119yrs Unknown TOTAL
N 0 248 259 103 1 4 615
% 0 40 42 17 0.3 0.7 100
4.2.3 Marital Status
Seventy-two percent of the sample was not married (see table 4). Seventeen percent
were unknown while ten percent were married. A cultural marriage referred to having
more than one wife.
I Th~ group outlined in this study is not intended to perpetuate any racial stereotypes, but rather to takecogmsance of the prevalence of schizophrenia in the identified cultural group, as patients werepreviously treated in segregated facilities.
40

Table 4: Marital status
Marital Cultural
Status Unknown Single Separated Married Divorced Widowed Marriage TOTAL
N 105 441 2 64 1 1 1 615
% 17 72 0.3 10.4 0.1 0.1 0.1 100
4.2.4 Seasonality of Birth
Fifteen percent (93 cases) of the records contained dates of birth. Twenty-seven cases
(4%) had the first of January with varying years given as their birth dates, whenever
the actual birth date was unknown. It is common practise to allocate the first of
Januaty to people whose date ofbirth is unknown. The year used would give an
indication of the estimated age of the person. This data was therefore regarded as
unreliable and unsuitable for entry. Only 66 cases (eleven percent) of the data were
used.
There were fewer people (18%) born in autumn compared to the other seasons (See
Table 5). However, on closer examination discrepancies were found within each
season. Both in summer and winter, the first two months (December & January; June
& July, respectively) had almost twice the number ofpeople in relation to the last
month of that season, whereas there was a steady increase in the number ofpeople
born in the advancing spring months. In autumn the first month (March) contained 4
times more people than the next two autumn months. These figures are however too
small for statistical analysis or substantial interpretation.
41

Table 5: Seasonality ofBirth /Month ofBirth
Seasons of the Year in
Southern Hemisphere Month
December
TOTAL
n
7
7
4
5
6
8
%
11
11
5
12
3
3
l$U4···11
11
6
8
9
12
100
4.2.5 Employment
Fifty three percent of the sample was not employed, whereas thirteen percent were
employed (see table 6).
Table 6: Employment
Employment Yes No Unknown TOTAL
N 80 324 211 615% 13 53 34 100
4.2.6 Occupation
The occupational data was divided into the same categories used by the National
Census Data. The categories are: legislators, senior officials and managers;
42

professionals; technicians and associate professionals; clerks; service workers, shop
and market sales workers; skilled agricultural and fishery workers; craft and related
trades workers; plant and machine operators and assemblers; and elementary
occupations.
There were 205 entries filled in the occupation section of the files. Ninety-eight
entries were categorised according to the Census Data categories (see table 7). Of
those 98 entries, 67% worked in elementary occupations, 9 % did craft and related
trade work, 12% were plant and machine operators and assemblers, 5 % were either
service workers, shop and market sales workers or professionals and 1% were clerks.
Table 7: Occupation
Elementary Plant and Craft and Service Clerks Professionals
Occupations machine related ta'ade workers,
operators and workers shop and
assemblers market sales
workers
Subtype N Subtype n Subtype n Subtype n Subtype n Subtype n
Packer 5 Driver 7 Painter 1 Cashier 1 Clerk 1 Teacher 2
General 1 Machine 2 Builder, 4 Store 3 Faith 1
Assistant operator, Brick- Assistants Healer
Payloader layer
Forklifter Instructor
Security 11 Baker I Reception 1 School 1
Guard ist principal
Garage 1 Carpenter 3 Traditional 1Attendant Healer
Casual 44 Foreman 1
Labourer 23 Musician 1
Ice 1 Mines 1Cream Com-Vendor pound
Manager
Barman 1
Cleaner 2
Total 66 Total 9 Total 12 Total 5 Total 1 Total 5(where N 98)
43

4.2.7 Religion
The section of the patients' files requiring information on their religion was seldom
completed. In eighty one percent ofthe cases, religion was classified as unknown (see
table 8). There were one or two representatives of the islamic, Shembe, Traditional,
Rastafarian religions. Four patients reported to have no religious affiliations.
Seventeen percent ofthe total sample was reported to belong to the Christian faith.
The files indicated a number of subdivisions of the faith of Christianity: Alphews
church, Anglican, Apostolic Faith, Catholic, Christian, Church ofChrist, Ethiopian,
Free Congregational church, Full Gospel, Lutheran, Methodist, Nazareth church,
Pr~sbyterian, St Johns' church, St Theresa, Zion Christian. For the purpose of this
study, these subdivisions have been simplified into three categories. The Zionist
Christians represented 17%, Catholics 23%, and a general category ofChristian
(church/denomination unspecified) 34% of the 103 cases.
Table 8: Religion
Religion n %
Islam 1 0.2Rastafarian 1 0.2Xhosa 1 0.2Shembe 2 0.3Traditional Healer 2 0.3UCC 2 0.3No religion 4 0.7Christian 103 16.7Unknown 499 81.1TOTAL 615 100
4.2.8 Previous Admissions
Forty-four percent of the sample of patients had been previously admitted, compared
with just over a third (35%) that had not been previously admitted (see table 9).
In the 26-35 year age category, almost twice the number ofpatients (21%) had been
previously admitted to FNH in comparison with those not previously admitted (12%)
44
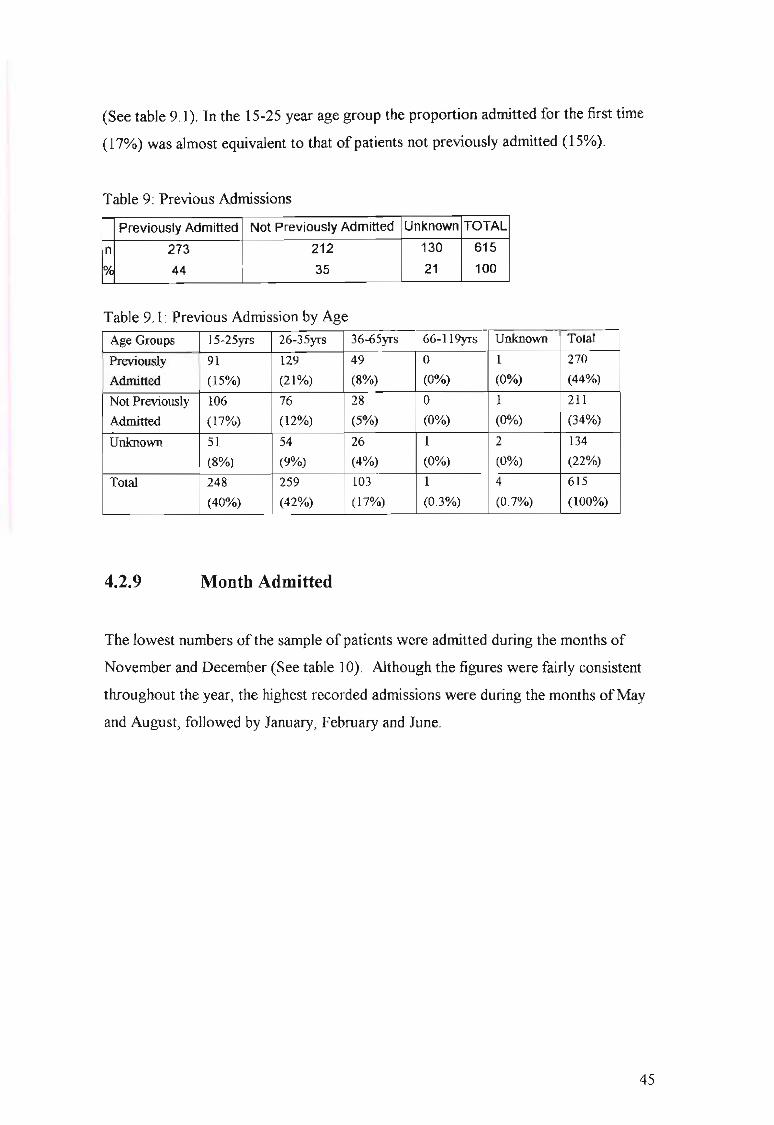
(See table 9.1). In the 15-25 year age group the proportion admitted for the first time
(17%) was almost equivalent to that of patients not previously admitted (15%).
Table 9: Previous Admissions
Previously Admitted Not Previously Admitted Unknown TOTAL
n 273 212 130 615
* 44 35 21 100
Table 9.1: Previous Admission by Age
Age Groups 15-25yrs 26-35yrs 36-65yrs 66-119yrs Unknown Total
Previously 91 129 49 0 1 270
Admitted (15%) (21%) (8%) (0%) (0%) (44%)
Not Previously 106 76 28 0 I 211
Admitted (17%) (12%) (5%) (0%) (0%) (34%)
Unknown 51 54 26 1 2 134
(8%) (9%) (4%) (0%) (0%) (22%)
Total 248 259 103 1 4 615
(40%) (42%) (17%) (0.3%) (0.7%) (100%)
4.2.9 Month Admitted
The lowest numbers of the sample of patients were admitted during the months of
November and December (See table IQ). Although the figures were fairly consistent
throughout the year, the highest recorded admissions were during the months ofMay
and August, followed by January, February and June.
45
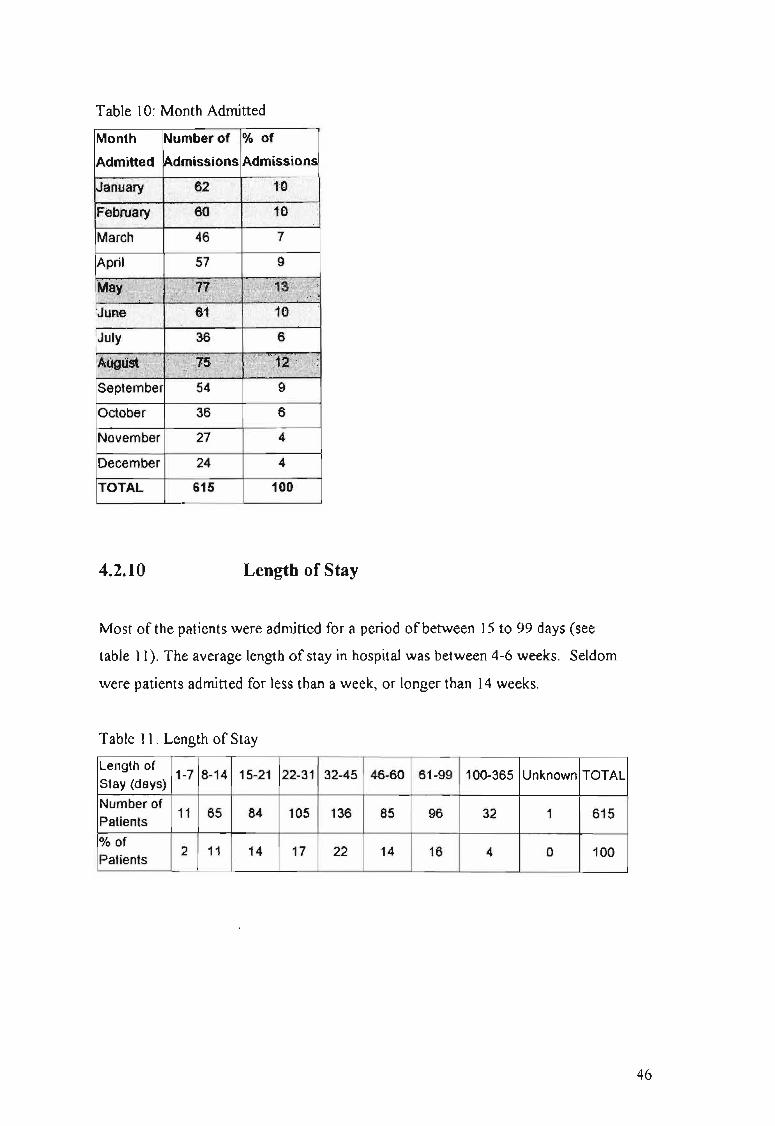
Table 10: Month Admitted
Month Number of % of
September 54 9
October 36 6
November 27 4
December 24 4
TOTAL 615 100
4.2.10 Length of Stay
Most of the patients were admitted for a period ofbetween 15 to 99 days (see
table 11). The average length of stay in hospital was between 4-6 weeks. Seldom
were patients admitted for less than a week, or longer than 14 weeks.
Table 11: Length of Stay
Length of1-7 8-14 15-21 22-31 32-45 46-60 61-99 100-365 Unknown TOTAL
Stay (days)
Number of11 65 84 105 136 85 96 32
Patients1 615
% of2 11 14 17 22 14
Patients16 4 0 100
46

4.2.11 Diagnosis
The diagnosis of schizophrenia constituted 58 % of all the diagnoses (See table 12).
Schizophrenia with substance abuse comprised 18.9% ofthe samples diagnoses, and
schizophrenia with schizophrenifonn disorder 16%. The remaining 3% included other
schizophrenia-related diagnoses. The average length of stay did not vary much
according to the diagnosis given (see table 12.1), except for schizophrenia with
alcohol abuse, and unfortunately the number of patients with this diagnosis (n=2) was
too small for interpretation.
Table 12: Diagnosis
Diagnoses n %
Schizophrenia 358 58.2
Schizophrenia with substance abuse 116 18.9
Schizophreniforrn disorder 100 16.3
Schizophreniforrn with substance abuse 18 2.9
Schizoaffective disorder 15 2.4
Schizoaffective with substance abuse 6 1.0
Schizophrenia with alcohol abuse 2 0.3Schizophrenia with personality disorder 0 0
TOTAL 615 100
Table 12.1: Diagnosis and Average Length of Stay
Average
Diagnoses n Length of Stay
Schizophrenia 358 44.81
Schizophreniforrn 100 40.76
Schizoaffective 15 42.80
Schizophrenia with substance abuse 116 41.46
Schizophrenia with alcohol abuse 2 22.00Schizophreniforrn with substance abuse 18 48.78
Schizoaffective with substance abuse 6 45.16
Total 615 40.82
47

4.2.12 Location
It was only possible to map the location of398 certified patients' residences (See
table 13 and Map 2). Even though there were 615 patients in the database, in 55 of the
records, place of residence information was omitted; ofthe remaining 560 records,
only 398 could be correlated to the standardised list oftown names required by the
GIS for spatial analysis.
Most of the patients (75.5 %) were recorded as residing within the southern part of
KZN (Durban DC, DC 22, DC 43 and DC 21), with just less than 40% of these within
the Durban DC (See map 2). One hundred and six (68 %) of the 155 certified patients
in the Durban DC came from the areas ofUmlazi, KwaMashu, Inanda and Durban.
Very few patients (2.5 %) were resident in the outlying DCs, namely, DC25, DC26
and DC27.
Twenty-five (43 %) ofthe 58 DC 22 certified patients were resident in Richmond and
Imbali. Approximately 50 % ofthe certified patients came from Ixopo in DC 43 and
Urnzinto in DC 21. Durban DC and DC 42 had the highest mean of certified patients
(at least twice the mean ofthe other DCs).
A third map was created linking the patients' place of residence and place of referral
in an attempt to observe whether a particular geographical pattern would emerge (See
table 13.1 and map 3). The key in Map 3 is expanded on in detail in Table 13.1. Only
243 out of the 398 patients details were utilised in the mapping procedure. These
additional records had to be eliminated due to further names of certain places of
referral did not match the standardised list of institutions. There were 41 places of
referral. Thirty-nine percent of the institutions (16) referred a number of patients who
lived outside the DC ofthe institution (See the highlighted institutions in Table 13.1).
A.E. Haviland Provincial Clinic from DC23, for example, referred 3 patients who
lived within its boundaries (Weenen) and one patient who resided in Tugela (DC29).
Forty-three percent of the certified patients (105) were referred from the provincial
hospitals (See the institutions written in italics in Table 13.1).
48
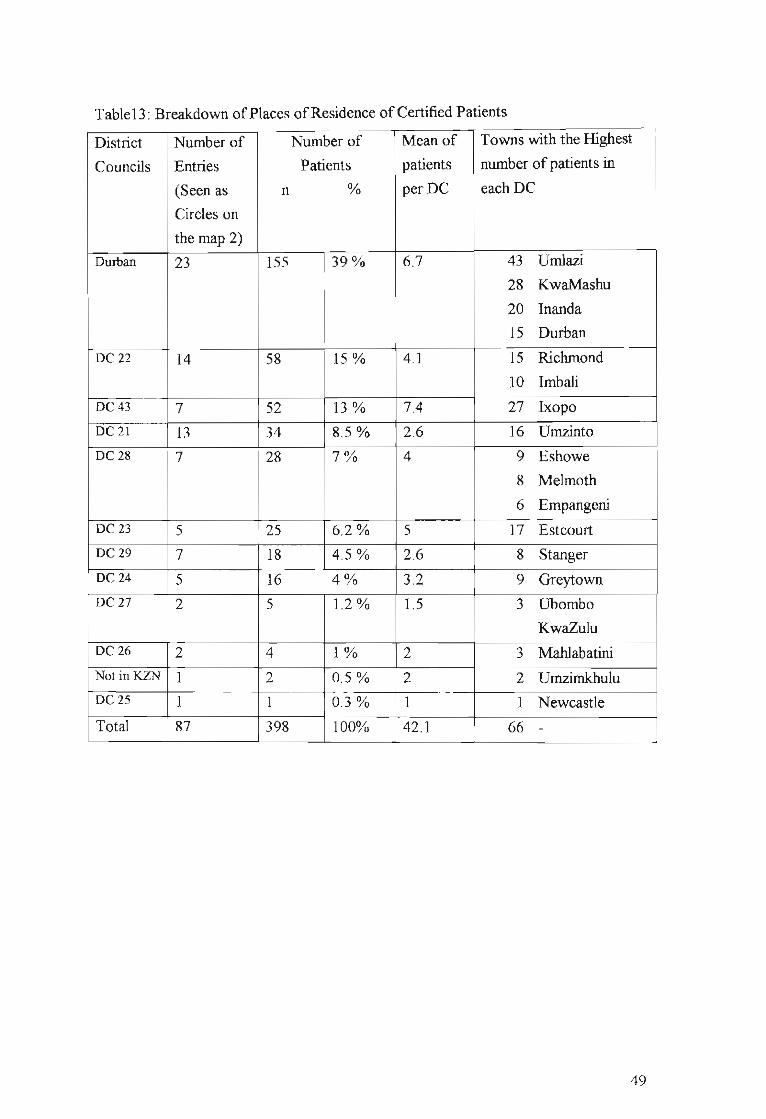
Table13: Breakdown ofPlaces ofResidence of Certified Patients
District Number of Number of Mean of Towns with the Highest
Councils Entries Patients patients number of patients in
(Seen as n % per DC each DC
Circles on
the map 2)
Durban 23 155 39% 6.7 43 UmIazi
28 KwaMashu
20 Inanda
15 Durban
DC 22 14 58 15 % 4.1 15 Richmond
10 Imbali
DC 43 7 52 13% 7.4 27 Ixopo
DC21 13 34 8.5% 2.6 16 Umzinto
DC 28 7 28 7% 4 9 Eshowe
8 Melmoth
6 Empangeni
DC23 5 25 6.2% 5 17 Estcourt
DC29 7 18 4.5% 2.6 8 Stanger
DC 24 5 16 4% 3.2 9 Greytown
DC 27 2 5 1.2 % 1.5 3 Ubombo
KwaZulu
DC 26 2 4 1% 2 3 Mahlabatini
NotinKZN 1 2 0.5% 2 2 UmzimkhuluDC 25 1 1 0.3% 1 1 Newcastle
Total 87 398 100% 42.1 66 -
49

M!P 2: KwaZulu-Natal Provincial Hospitals providingPsychiatric Services and Areas from whichPatients Originate
Dcmarcal~n Bound~s obtained from Data World (Ply) Ud
7~+MSELENI
DC27Umkhanyakude
3
4.3
Major Towns
*
Provincial Hospitals
+ No Psychiatric Services (42)
Psychiatric Services (19)
Number of Patients with Schizophrenia
DurbaneThekwini
- .CHAR'tl:S'JOHHSON·fEMORlAt;·;,
~J - ~KONJENI di!S~, FRANCIS1.l.l.tD '.'="
DC24Umzinyiithi'\ rw
MURCHISON~ . PORT SHEPSTONE
tJjff) ji PORT SHEPSTONE
~ MARGATE
*: PORT EDWARO
®~
EST~ESTCOURT
LAOYSMlTH lADYSMlTH
DC23uThukela ®BERGVl.LE*
DC43~Sisonke
~ ~YLER BEQUEST
\
MATATRe '
/"'.- /--.E2-& USHE~MEMORIAL ~OKSTAD
Compied and Produced by:The GIS Unit,KwaZ"'Nalal Heath DeparlmenlPietcrmarizbll'g
Dale of production: 28 Oclobe< 2002
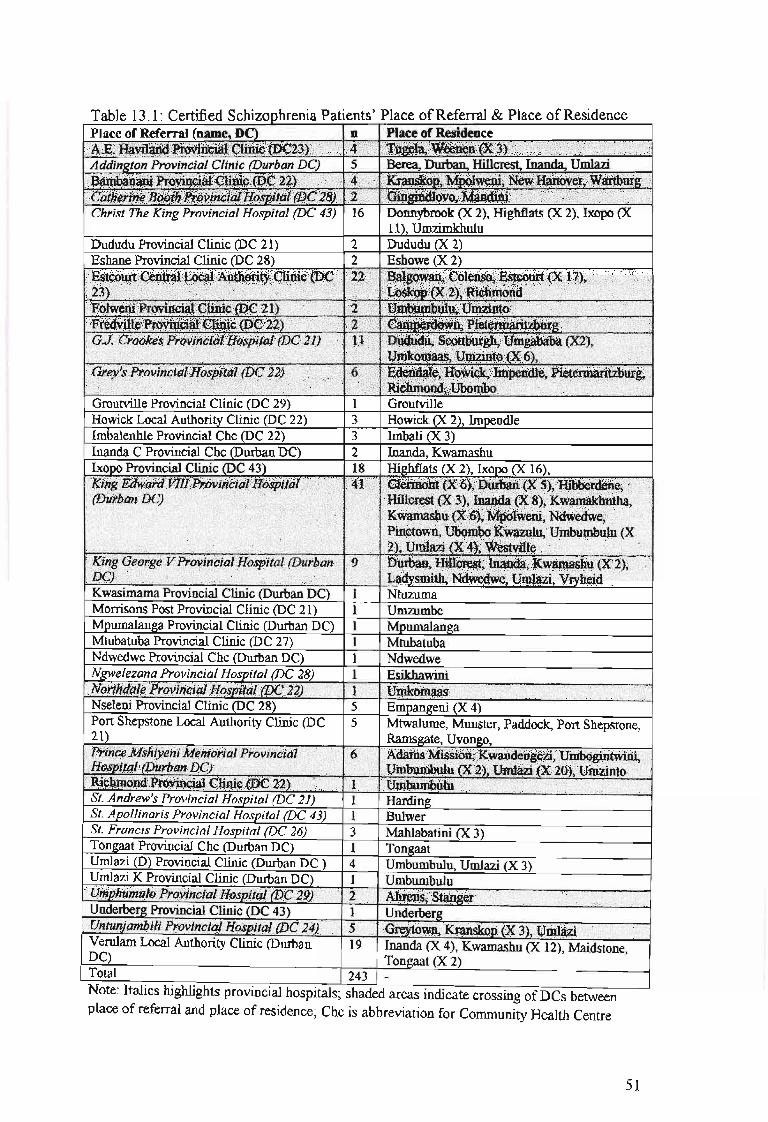
Table 13.1: Certified Schizophrenia Patients' Place ofReferral & Place ofResidencePlace of Referral (name, DC) n Place of ResidenceA;e;l-m~:lYi~;~~$:))" (Xi•. ~.,;i. ;'f.ilii.l~'/\t~~\~~)t/;);nt j;;';':::::;':.:.;;, ••• :;;2::tNDAddinKton Provincial Clinic (Durban DC) 5 Berea, Durban. HilIcrest, Inanda, Umlazi . ....
".~~~I~1:~n:~~f~~i~~~!: fi~r:·;~~~;G=~~=;n:,··Christ The King Provincial Hospital (DC 43) 16 Donnybrook (X 2), Highflats (X 2), Ixopo (X
11), UmzimkbuluDududu Provincial Clinic (DC 21) 2 Dududu (X 2)Eshane Provincial Clinic (DC 28) 2 Eshowe (X 2)
:;W~~~;r~~~~~~·~~~~1~·-IEf0i~,·K)/.;'::·~~·r,. T·(.I••'.~!~~~~!!':~~:rGroutville Provincial Clinic (DC 29) 1 GroutvilleHowick Local Authority Clinic (DC 22) 3 Howick (X 2), ImpendleImbalenhle Provincial Chc (DC 22) 3 Imbali (X 3)Inanda C Provincial Chc (Dmban DC) 2 Inanda, KwamashuIxopo Provincial Clinic (DC 43) 18 Highflats (X 2), Ixopo (X 16),
Kwasimama Provincial Clinic (Durban DC) 1 NtuzumaMorrisons Post Provincial Clinic (DC 21) 1 UmzumbeMpumalanga Provincial Clinic (Durban DC) 1 MpumalangaMtubatuba Provincial Clinic (DC 27) 1 MtubatubaNdwedwe Provincial Chc (Durban DC) 1 NdwedweNKlvelezana Provincial Hosoita/ (DC 28) 1 EsikhawiniN(jiihi!(jt~PrtM#i!4J11~$ili.fiiJ(J')t(4'))/:.·.·.:; .•',,; ;'~'."""'./.'" ·.~;)ri •...... ,.•...'.'..'....'... ·i.·.c'.·.i\··.'•.• :;'7i\:/.\i.'?.'i{./.Nseleni Provincial Clinic (DC 28) 5 EmPaD11;eni (X 4)Port Shepstone Local Authority Clinic (DC 5 Mtwalume, Munster, Paddock, Port Shepstone,21) Rams11;ate, Uvon11;o,
St. Andrew's Provincial Hospital (DC 21) 1 Hanting.'•.•.•..!..•.~.•....••.~.~.nli.·•..~Ct.;.j,.•.•~..•.·.f.•~.•...·.·'·.•l·.~.J1!iS,..'h.·,...·.i.~I·I....·...;.J):.•.~...';~.~:.·•.•.i....•·•.~.•.o...'.•.•.;.n.~.••...'J~.l.~rt..••.:l•...D;.R.;.;...•.•.••.••i-rih~.••:.~.••.t.•. v.;.~.•.;l.'.n.•:.::.•.•.~.••.•c...~..•_.t.a.•.;..'.:i:l..•..,!..·.•.i..'~·.•.-.:...•.;.;..·.'i.•.:••:·.•..•.,:.•:•....:,.•.•.•.•.•._.•.•.:.•.•.•.•.•.:.~,•.. r}~;r:.•;:!~••lk~.'I~i~:A~t)~~tuU-"';'M~'4"'~'~:: ): ·tt#t~~/\ •• ;:;/:;:/,,:i/:.,·•.:.:.yyJ/.,:.·:,/(\/:,·)
St. Apo/linaris Provincial Hospital (DC 43) 1 BulwerSt. Francis Provincial Hospital (DC 26) 3 Mahlabatini (X 3)Tongaat Provincial Chc (Durban DC) 1 Ton11;aatUmlazi (D) Provincial Clinic (Durban DC) 4 Umbumbulu, Umlazi (X 3)
Total 243 _
Umlazi K Provincial Clinic (Durban DC) 1 Umbumbulu····tJljjil#Ji#ifllii)tffiii!ifii#iil1i:(j$jjj{i#(f'jfJ.;~1J)tX{ •.. ~=b·Ahti::<~.·'.·,,:i'@$;~';:;;;;.si:.~~,..•.7.·.·,·'7"'·~r0!""(?"'/"""''''''·''''.'.'.=i/'''''';::'''''/y'''''/i;''"'';''''>=/i''''''!\'0''i,'''''}/'''''•• ''''. ••••=/d.\
Underber11; Provincial Clinic (DC 43) 1 Underber11;fl#ti#iiiiiiil!!#Pf()¥in.i;I&lJiiii»ta.1/(J).(J;'g'4)}J::· " ····.··· ··~~p(X·3)/t1nu3#./:ii.'VerulamLocal Authority Clinic (Durban 19 Inanda (X 4), Kwamashu (X 12), Maidstone,DC) Tongaat (X 2)
Note: Italics highlights provincial hospitals; shaded areas indicate crossing of DCs betweenplace of referral and place of residence; Chc is abbreviation for Community Health Centre
51

Ma~ 3: Referral Patterns for PS'lchiatric Patients
~GUZI
*IHGWAVUMA
+ MOSVOLD
~SELENI
Major Towns
* HLUIlLUWE
Provincial Hospitals
De27Umkhanyakude
Towns to Institution Referral
+No Psychiatric Services (42)
Psychiatric Services (19)
*
LOWER UMFOLOZI WAR MEMORIAL
~A~Ge~ .. /.' ......1llCIWlOS BAY
. ··NGWELEZANA
.~... -...•....:.: ,.-." '.'
,..' ..
CEZA
----AE Haviland Provincial Cinic (DC23) (4)----Addington Provincial Cinic (Durban N'etro) (5)---- Bambanani Provincial Cinic (DC22) (4)---- Catherine Booth Provincial Hospital (DC28) (2)
Christ The King Provincial Hospital (DC43) (16)---- Dududu Provincial Cinic (DC21) (2)---- Eshane Provincial Cinic (DC28) (2)---- Estcourt Central Local Authority Cinic (DC23) (22)---- Fot.veni Provincial Cinic (DC21) (2)---- Fredvile Provincial Cinic (DC22) (2)----GJ. Crookes Provincial Hospital (DC21) (11)---- Grey's Provincial Hospital (DC22) (6)----Groulvile Provincial Cinic (DC29) (1)----Howick Local Authority Cinic (DC22) (3)----Imbaenhe Provincial CHC (DC22) (3)-----Inanda C Provincial CHC (Durban N'etro) (2)
Ixopo Provincial Cinic (D C43) (18)----King Edward VIII Provincial Hospital (Durban N'etro) (41)----King Gearge V Provincial Hosprtal (Durban N'etro) (9)----Kwasimama Provincial Cinic (Durban N'etro) (1)----MorTisons Post Provincial Cinic (DC21) (1)----Mpumalanga Provincial Cinic (Durban N'etro) (1)----Mtubatuba Provincial Cinic (DC27) (1)----Ndwedwe Provincial CHC (DUrban N'etro) (1)
Ngweezana Provincial Hospital (DC28) (1)'co Northdae Provincial Hospital (DC22) (1)
.."".".."...,......." "..,,, Nseeni Provincial Cinic (DC28) (5)Pinetown Local Authority Cinic (Durban N'etro) (5)
---- Port Shepstone Local Authority Cinic (DC21) (6)." ..... Prince Mshiyeni N'emorial Provincial Hospital (Durban N'etro) (26)
----Richmond Provincial Cinic (DC22) (1)---- SI. Andrews Provincial Hospital (DC21) (1)---- SI. Apo~naris Provincial Hospital (DC43) (1)---- SI. Francis Provincial Hospital (DC26) (3)----Toogaat Provincial CHC (Durban N'etro) (1)---- Umlazi (D) Provincial Cinic (DUrban N'etro) (4)---- Umlazi K Provincial Cinic (DUrban N'etro) (1)----Umphumub Provincial Hospital (DC29) (2)----Underberg Provincial Cinic (DC43) (1)----Untunjambii Provincial Hospital (DC24) (5)
Verulam Local Authority Cinic (Durban N'etro) (19)
*MElMOru' £ * NTAMBANANA
+ST. MARY'S (~AMAGWAZA)' .. . ," f
./',DC28
.Uth}tngulu.!ES1ioWE
. ~ESHOWE:''/.ff":
+'TSHELEJUBA
~--------.-,---~
DC26Zululand
THULASIZWE
*PAULPI£ffilS8URG
~RYHEIDVRYHEIO
J~KOMBE
L~CHURCH OF SCOTLAND
.. '" <tTUGELA FERRY
DC24Urnzlnyathi
DC21Ugu
DC22
MURCHISONfo__~ORTSHEPSTOHE
j- .. PORT SHEPSTONE
~ ~RGATE
\L..
~ST" ANDREWS
!lARDING
uMgungundlovu
MIDLANDS HOSP~AL -UMGEN~~ .. ,
MIDLANDS HOSPITAL - TOWN HILl'._=-_.--T,ORTHDALE'.
..... \ 'tF--L~ZBURG"-"MIDLANDS HOSIPTAL - FORT NAPIER I£TERMA ~>"o
'----.J EDE~DALE ''''~,,-"1,.,
"~~
100
DC23
u::\ESTCOURl'~STCOURT
50
EMMAUS +
kilometres
/ $;sook,
~:'""'''~& USHER MEMORIALYKOKSTAO
DC43
....BERGVILLE
Compled and Produced by:The GIS UndoKwaluiu-Natal Health DepartmentPietennaritzburg
Date of production: 10 December 2002
o
Demarcation Boundaries obtained from Dala World (Ply) Lld

4.2.13 Summary
All the files between 1995 and 1996 ofcertified patients with schizophrenia were
accessed from FNH. Due to the racial segregation measures in place at that time, they
were all African, and all were male. The majority of patients were between the ages of
15 and 65 years. The most prevalent age cluster was 26-35 years, followed by those
aged 15-25 years. Seventy two percent of the sample was not married while 10 %
were married. Fewer subjects were born in autumn compared with other seasons. Fifty
three percent of the sample was unemployed whilst thirteen percent were employed.
Ofthe 98 entries that were categorised according to the Census Data Occupational
categories, 67% worked in elementary occupations, 9 % did craft and related trade
work, 12% were plant and machine operators and assemblers, 5 % were either service
workers, shop and market sales workers or professionals and 1% were clerks.
Seventeen percent of the total sample reported to be of the Christian faith. Forty-four
percent ofthe patients had been previously admitted compared withjust over a third
(35%) that had not been previously admitted. The sample ofpatients was admitted at
a fairly regular rate throughout the year, with the lowest number being admitted
during November and December, and the highest number being admitted during May
and August. The majority of the patients stayed in hospital between 15 to 99 days
long, the most common length of stay being between 4-6 weeks. The diagnosis of
schizophrenia constituted 58% ofthe sample ofcertified patients. The majority of
patients (75.5 %) were resident in the southern part ofKZN (Durban DC, DC 22, DC
43 and DC 21), with just less than 40% ofthese in the Durban DC. Three quarters of
the referring institutions referred patients who lived within the same DC as the
institution. Forty percent of the certified patients were referred from provincial
hospitals.
53
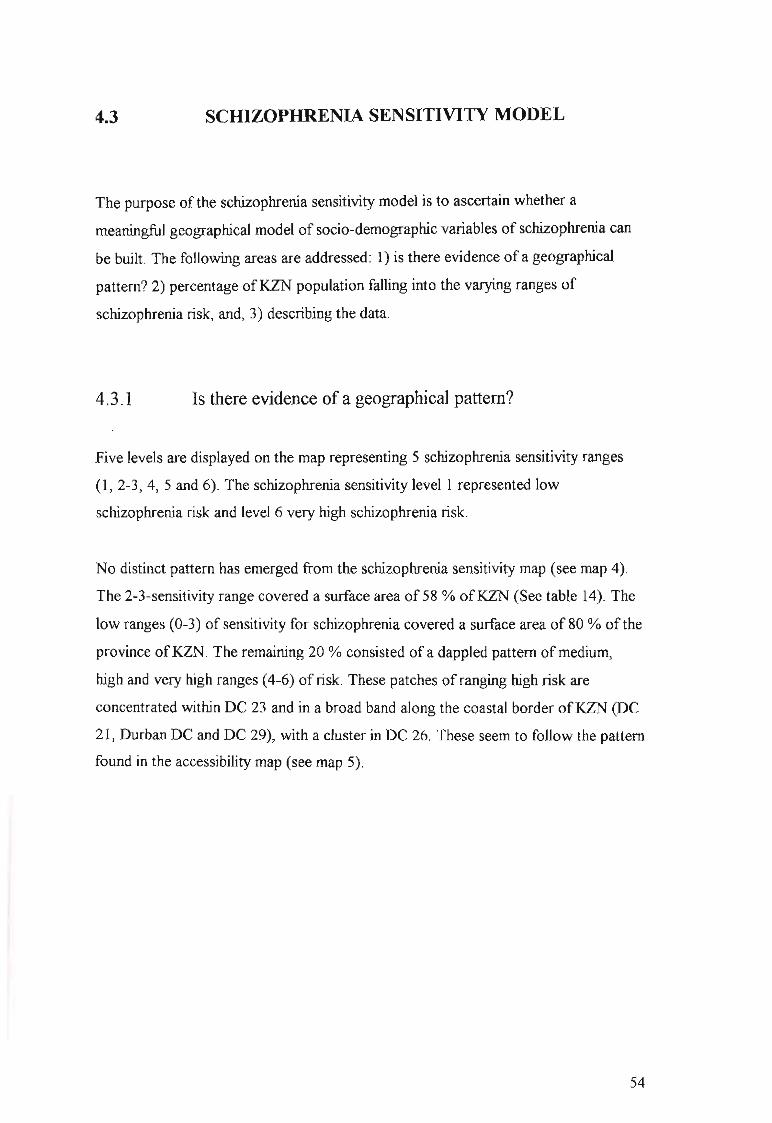
4.3 SCHIZOPHRENIA SENSITIVITY MODEL
The purpose of the schizophrenia sensitivity model is to ascertain whether a
meaningful geographical model of socio-demographic variables of schizophrenia can
be built. The following areas are addressed: 1) is there evidence of a geographical
pattern? 2) percentage ofKZN population falling into the varying ranges of
schizophrenia risk, and, 3) describing the data.
4.3.1 Is there evidence of a geographical pattern?
Five levels are displayed on the map representing 5 schizophrenia sensitivity ranges
(1, 2-3, 4, 5 and 6). The schizophrenia sensitivity level 1 represented low
schizophrenia risk and level 6 very high schizophrenia risk.
No distinct pattern has emerged from the schizophrenia sensitivity map (see map 4).
The 2-3-sensitivity range covered a surface area of 58 % ofKZN (See table 14). The
low ranges (0-3) of sensitivity for schizophrenia covered a surface area of80 % ofthe
province ofKZN. The remaining 20 % consisted ofa dappled pattern ofmedium,
high and very high ranges (4-6) of risk. These patches of ranging high risk are
concentrated within DC 23 and in a broad band along the coastal border ofKZN (DC
21, Durban DC and DC 29), with a cluster in DC 26. These seem to follow the pattern
found in the accessibility map (see map 5).
54
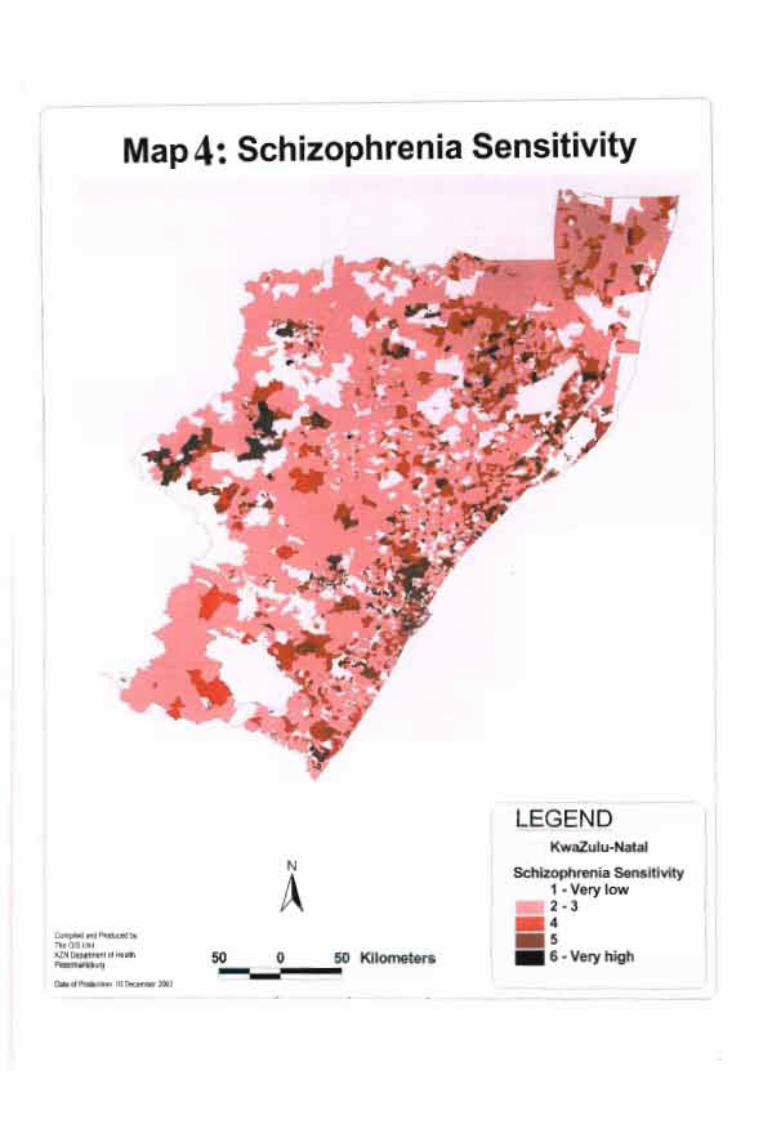
(
Map4:. Schizophrenia Sensitivity
LEGENDKwazulu-Natal
Schizophrenia Sensitivity1 - Very low2-3_4_5 J_ 6 - Very high
N
Ao 50 Kilometers
~~~i50
Compiled and Produced by:The GIS UnitKlN Department of HealthPietermaritzburg
I Date of Production: 10 December 2002

Table 14: Area Covered By Sensitivity Grading ofPopulation to Schizophrenia
Sensitivity Grading of Population to Area Percentage
Schizophrenia (sq km.) (%)
0 6485 7.00
1 13910 15.00
2-3 53 163 57.50
4 13 105 14.17
5 2756 2.98
6 3017 3.26
Total for Province 92436 100%
4.3.2 Percentage ofKZN population falling into the varying ranges of
schizophrenia risk
The greatest concentration of the KZN population was found within the 6-sensitivity
range (34 %), and then the 2-3-sensitivity range (28.5 %) followed closely by the 4
sensitivity range (23 %) (See table 15). Thirty-three percent of the KZN population
fell within the 0-3 sensitivity ranges and 67 % fell within the 4-6 schizophrenia
sensitivity ranges.
Table 15: Population Layout of Schizophrenia Sensitivity Model
Sensitivity Grading of Population to Population PercentageSchizophrenia Occurring in (%)
this area
0 63 163 0.70
1 298569 3.292-3 2617545 28.85
4 2073350 22.855 970988 10.706 3046843 33.59
Total for Province 9070457 100%
56
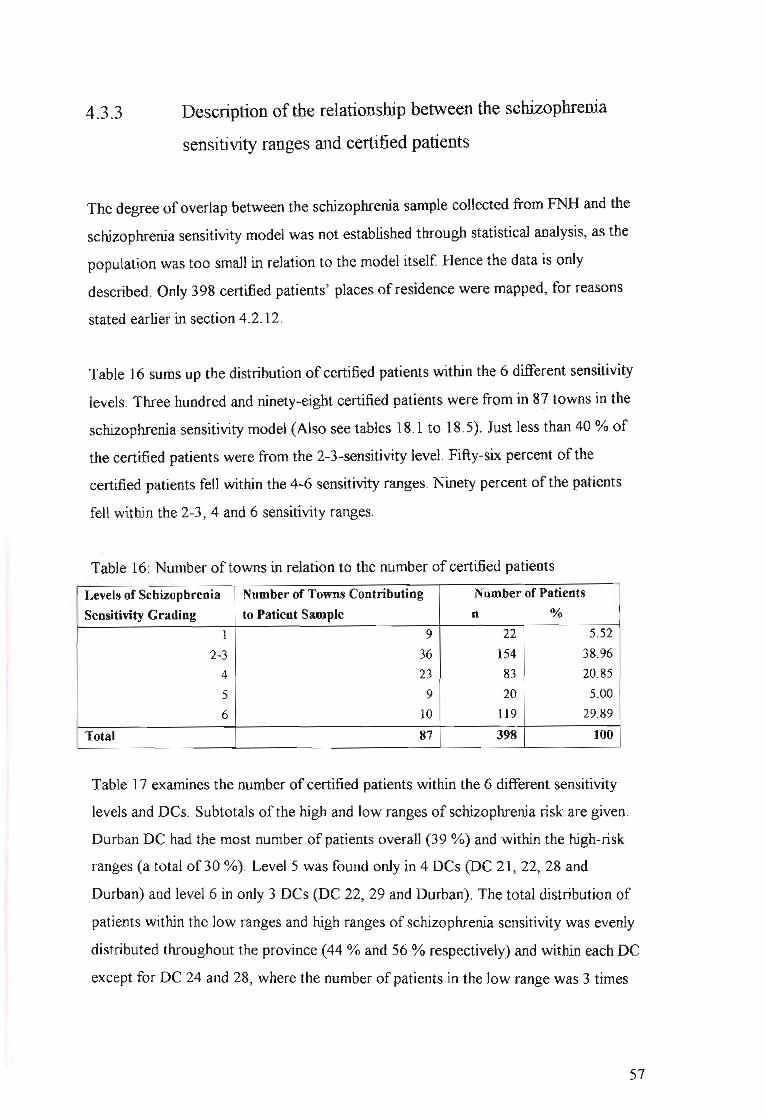
4.3.3 Description of the relationship between the schizophrenia
sensitivity ranges and certified patients
The degree of overlap between the schizophrenia sample collected from FNH and the
schizophrenia sensitivity model was not established through statistical analysis, as the
population was too small in relation to the model itself Hence the data is only
described. Only 398 certified patients' places of residence were mapped, for reasons
stated earlier in section 4.2.12.
Table 16 sums up the distribution of certified patients within the 6 different sensitivity
levels. Three hundred and ninety-eight certified patients were from in 8? towns in the
schizophrenia sensitivity model (Also see tables 18.1 to 18.5). Just less than 40 % of
the certified patients were from the 2-3-sensitivity level. Fifty-six percent of the
certified patients fell within the 4-6 sensitivity ranges. Ninety percent of the patients
fell within the 2-3, 4 and 6 sensitivity ranges.
Table 16: Number of towns in relation to the number of certified patients
Levels of Schizophrenia Number of Towns Contributing Number of Patients
Sensitivity Grading to Patient Sample n %
1 9 22 5.52
2-3 36 154 38.96
4 23 83 20.85
5 9 20 5.00
6 10 119 29.89
Total 87 398 100
Table 17 examines the number of certified patients within the 6 different sensitivity
levels and DCs. Subtotals of the high and low ranges of schizophrenia risk are given.
Durban DC had the most number of patients overall (39 %) and within the high-risk
ranges (a total of30 %). LevelS was found only in 4 DCs (DC 21, 22, 28 and
Durban) and level 6 in only 3 DCs (DC 22, 29 and Durban). The total distribution of
patients within the low ranges and high ranges of schizophrenia sensitivity was evenly
distributed throughout the province (44 % and 56 % respectively) and within each DC
except for DC 24 and 28, where the number of patients in the low range was 3 times
57

and greater than high range; but in the Durban DC there were 3.4 times more patients
from the high range than low.
Table 17: Number ofCertified Patients within Each Schizophrenia Sensitivity Level
in the DCs ofKZN
Schizophrenia Sensitivity Levels
4 5 6 (High Ranges)
19 1 ·.>2~(~%J< 34
15 5 16 2.···.·3'6(flDA) 58:-:>
5 «~,-) 25
9 :ri ..i; .16//
~i1
1 (/ :: 4
i ( '< " 5
1 6 ·:'i·.?iJ rO; 28',' ..?<
10 3 I..'/'
181'< '..
11 ........ 11.(~~Q')' ..... 52
12 8 100 .::;41P(~q~)·i .. 155: ..:: .. .
2I·· ...83 20 119 ··2Zi<·,···. 398
(21%) (5%) (30%) ·i(5~%)/····· (100%)
District
Councils
DC21
DC 22
DC 23
DC 24
DC 25
DC 26
DC 27
DC 28
DC 29
DC 43
Durban
NotinKZN
Total
1
1
3
4
6
5
1
22
(6%)
2-3
13
19
20
6
1
3
5
21
1
35
30
154(39%)
n
(Low Ranges)
.. .J76·.··.•..
.::····(#~r~i(
nTotal
Tables 18.1 to 18.5 illustrate the towns from which the certified patients originate in
each sensitivity level. The Durban DC and DC 22 were the only two DCs that
featured within all the sensitivity ranges.
In the sensitivity range 6 (See table 18.1), the DC Durban contained most of the
patients (84 % of the 119). Umlazi, Kwamashu and Inanda had 76 % ofthe total
number of patients within the SSR level 6.
In the sensitivity range 5 (See table 18.2), there was an even distribution (averaging
between 1-3) ofcertified patients across the towns of each of the DCs except in DC
28, Empangeni provided all 6 patients.
In the sensitivity range 4 (See table 18.3), one town in most DCs had between 1 Y2 to
8 times more patients than the other towns in that DC.
58
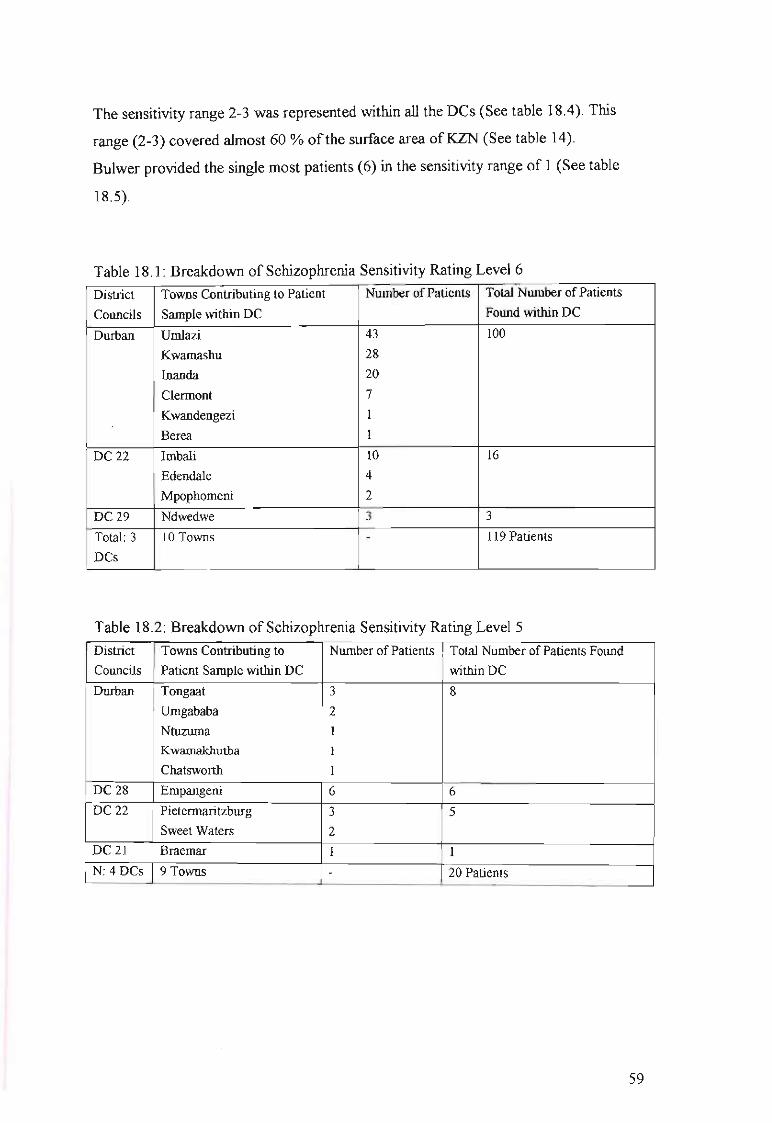
The sensitivity range 2-3 was represented within all the Des (See table 18.4). This
range (2-3) covered almost 60 % ofthe surface area ofKZN (See table 14).
Bulwer provided the single most patients (6) in the sensitivity range of 1 (See table
18.5).
Table 18.1: Breakdown of Schizophrenia Sensitivity Rating Level 6
District Towns Contributing to Patient Nwnber ofPatients Total Nwnber ofPatients
Councils Sample within DC Found within DC
Durban Umlazi 43 100
Kwamashu 28
Inanda 20
Clennont 7
Kwandengezi I
Berea I
DC 22 Imbali 10 16
Edendale 4
Mpophomeni 2
DC29 Ndwedwe 3 3
Total: 3 10 Towns - 119 Patients
DCs
Table 18.2: Breakdown of Schizophrenia Sensitivity Rating LevelS
District Towns Contributing to Nwnber ofPatients Total Nwnber ofPatients FoundCouncils Patient Sample within DC within DC
Durban Tongaat 3 8
Umgababa 2
Ntuzuma I
Kwamakhutha 1
Chatsworth I
DC 28 Empangeni 6 6
DC 22 Pietennaritzburg 3 5
Sweet Waters 2DC21 Braemar I 1
N: 4DCs 9 Towns - 20 Patients
59

Table 18.3 : Breakdown of Schizophrenia Sensitivity Rating Level 4
District Towns Contributing to Number of Patients Total Number of Patients Found
Councils Patient Sample within DC within DC
DC21 Urnzinto 16 19
Port Shepstone 1
Paddock 1
Harding 1
DC 22 Richmond 15 15
Durban Umkomaas 5 12
lllovo 2
Westville 1
Umbogintwini 1
Mpumalanga 1
Maidstone 1
Adams Mission 1
DC43 Kokstad 6 11
Matatiele 3
Underberg 2
DC 29 Stanger 8 10
Nyoni 1
Ballito 1
DC 24 Greytown 9 9
DC 23 Weenen 3 5
Loskop 2
DC 26 Vryheid 1 1
DC 28 Esikhawini I 1
N: 10 23 Towns - 83 Patients
DCs
60

Table 18.4 : Breakdown of Schizophrenia Sensitivity Rating Level 2/3
District Towns Contributing to Patient Number of Patients Total Number ofPatients
Councils Sample within DC Found within DC
DC 43 Ixopo 27 35
Highflats 4
Donnybrook 4
Durban Durban 15 30
Umbumbulu 9
Hillcrest 6
DC28 Eshowe 9 21
Melmoth 8
Gingindlovo 2
Nkwalini 1
Mtunzini I
DC 23 Estcourt 17 20
Ladysmith 2
Colenso I
DC 22 Howick 6 19
Wartburg 4
Impendle 4
Thomville 2
New Hanover 1
Lidgetton I
Camperdown 1
DC2l Scottburgh 4 13
Dududu 3
Mtwalume 2
Uvongo 1
Umzumbe 1
Munster I
Hibberdene 1
DC 24 Kranskop 4 6
Elandskraal I
Ahrens 1
DC 27 Ubombo Kwazulu 3 5
Mtubatuba 2
DC 26 Mahlabatini 3 3
DC25 Newcastle I I
DC 29 Tugela 1 1
N: 11 DCs 36 Towns - 154 Patients
61

Table 18.5: Breakdown of Schizophrenia Sensitivity Rating Level One
District Towns Contributing to Number of Patients Total Number of Patients Found
Councils Patient Sample within DC within DC
DC 43 Bulwer 6 6
Durban Pinetown 4 5
Nchanga 1
DC 29 Groutville 3 4
Mandini I
DC 22 Mpolweni 3 3
Transkei Umzimkhulu 2 2
DC21 Ramsgate I I
DC 24 Muden I I
N: 6DCs+ 9 Towns - 22 Patients
Transkei
4.3.4 Summary
No distinct pattern emerged from the schizophrenia sensitivity map. The 2-3
sensitivity range covered 58 % ofKZN. The greatest concentration of the KZN
population was found within the 6-sensitivity range (34 %), and then the 2-3
sensitivity range (28.5 %) followed closely by the 4-sensitivity range (23 %). The rate
of schizophrenia sensitivity risk identified by the model varied from 6.96 and 335.91
per 1000. Thirty-eight percent ofthe certified patients were found in the 2-3
sensitivity level. Fifty-six percent of the certified patients fell within the 4-6
sensitivity ranges. Durban DC had the most number of patients overall (39 %) and
within the high-risk ranges (a total of30 %). The total distribution of patients within
the low ranges and high ranges of schizophrenia sensitivity was evenly distributed
within the province (44 % and 56 % respectively) and within each DC. The Durban
DC and DC 22 were the only two DCs that featured within all the sensitivity ranges.
62

4.4 DESCRIPTION OF ACCESSIBILITY MODEL
The main aim in the geographical accessibility aspect of this study was an exploration
of the accessibility of the mental health services to persons with schizophrenia. Three
areas determining the geographic accessibility of the public hospitals offering
psychiatric services are described. These include,
1) access and the population ofKZN,
2) access and the certified patient population with schizophrenia seen at Fort
Napier Hospital, Pietermaritzburg,
3) the relationship between the accessibility and schizophrenia sensitivity
ratings of the towns with the most certified patients.
4.4.1 Access and the KZN population
A broad band of poor accessibility spreads diagonally from the southwest of the
Province across to the northeast, through approximately the middle ofKZN (see map
5). This dark band of poor accessibility is alleviated by widening circles found around
each of the identified provincial hospitals providing psychiatric services.
Accessibility2 ranges 1 - 3 (easy access) covered a surface area of65 % ofKZN, and
accessibility ranges 4-6 (average range) covered 30 % ofKZN (See table 19).
Accessibility range 9 covered the surface area ofless than half a percent ofKZN, and
accessibility range 8, just over 1 %.
2 Lower accessibility ranges mean easier access. Access levels 1-3 = easy access; access levels 4-6 =average access; access levels 7-9 = difficult access
63

Map 5: Accessibility to Psychiatric Health Services
LEGEND
Compied and Produced by:TheGIS UnitKZN Department of Hea IhPielermanlzburg
Date of Production: 10 December 2002
N
A50 0 50 Kilometers~j~_~~~i
L.· :KwaZUlu-Natal
Level of Accessibility, - 11 - Easy access12 -32
~. 33 -53.54-76.77-98.99-120.121-145.146-173• 174 - 255 Extremely difficult access

Table 19: Area Covered by Ranges of Accessibility
Accessibility Area Percentage
Ranges in KZN (sq km) (%)
1 (1-11) 23647 25.5
2 (12-32) 20839 22.5
3 (33-53) 15292 16.5
4 (54-76) 13 280 14.4
5 (77-98) 9205 9.9
6 (99-120) 5778 6.2
7 (121-145) 3327 3.6
8 (146-173) 1005 1.2
9 (174-255) 195 0.2
Total 92567 100%
The greatest concentration of the KZN population was found within the area
representing accessibility range 1 (58 %), followed at an ever-decreasing rate of
population density by accessibility ranges 2 (15 %), 3 (8 %), and 4 (6 %) (See table
20). Eighty-one percent of the KZN population fell within the 1-3 (easy access)
accessibility ranges. As the degree of difficulty in accessibility increased so the
population (density or per square kilometre) decreased in number.
Table 20: Population Layout of Accessibility Model
Accessibility Ranges in Population Occurring Percentage
KZN in tbis Area (%)
1 (1-11) 5254759 57.9
2 (12-32) 1400021 15.4
3 (33-53) 692 489 7.6
4 (54-76) 553090 6.1
5 (77-98) 482959 5.3
6 (99-120) 257923 2.8
7 (121-145) 196565 2.2
8 (146-173) 71 740 0.8
9 (174-255) 996 0.01
No Accessibility Assigned 159917 1.8
Total for Province 9070459 100%
65

4.4.2 Access and the certified patient population with
schizophrenia seen at Fort Napier Hospital
The degree of overlap between the schizophrenia sample collected from FNH and the
accessibility model was not established through statistical analysis, as again the
sample was too small in relation to the model itself Hence the data can only be
described. Three hundred and ninety-eight certified patients' places of residence were
mapped (See table 21) due to certain data unavailability or incompatibility with the
GIS.
Table 21 illustrates the distribution of certified patients within the 9 levels of
accessibility. Three hundred and ninety-eight certified patients were from 87 towns
within the accessibility model. The most noteworthy finding is that the majority of
patients are located within accessibility range level 1 (47 %), followed by level 2 (31
%). Levels 6 (8 %),3 (7 %) and 4 (6 %) follow with at least 4 times less the number
of patients than the first two levels. Apart from accessibility level 6, there is a
decrease in the number of patients as the degree of accessibility becomes more
difficult.
Table 21: Number of Towns in relation to the number of certified patients
Accessibility No of Towns Contributing Number of Patients
Level to Patient Sample n %
1 (1-11) 40 lR7 47
2 (12-32) 23 123 31
3 (33-53) 10 27 7
4 (54-76) 5 22 6
5 (77-98) 2 5 1
6 (99-120) 5 30 8
7 (121-145) I 3 0.7
8 (146-173) 1 1 0.3
9 (174-255) 0 0 0
N 87 398 100
66
Tables 22.1- 22.8 illustrate the distribution ofcertified patients within the towns and
DCs of each accessibility range.
In accessibility level one, 55 % ofthe patients were from Durban DC (See table 22.1).
Within the nineteen towns of the Durban DC, 61 % ofthose patients were resident in
Kwa Mashu (28 patients), Inanda (20 patients) and Durban (15 patients).
Cumulatively DC's 43,21, and 22 provide 42 % ofthe remaining patients (30,28,21
of 187 patients respectively). Ixopo provided 90 % ofDC 43's patients (27 patients);
Urnzinto 57 % ofDC 21's (16 patients) and Imbali 57 % (10) of its district's patients
(DC 22).
In ~ccessibility level 2, 37 % ofthe patients were sourced from Durban DC, 22 %
from DC 22, 14 % from DC 28, 11 % from DC 29 (See table 22.2). Umlazi provided
96 % (43) of its DC's patients, Richmond 56 % (15 patients), Eshowe 53 % and
Stanger 62 %.
In accessibility level 3, Umbumbulu provided 33 % (9 patients) of its DC's patients
(See table 22.3).
In accessibility level 4, 68 % ofthe patients were found in Greytown (9 patients) and
Bulwer (6 patients) (See table 22.4).
Estcourt provided 56 % (17) of patients in accessibility level 6, followed by Melmoth
with 27 % (8) of patients (See table 22.5).
67

Table 22.1: Access Level One (1-11)
District Towns Contributing to Patient Sample within DC
Councils (number of patients)
Number of Schizophrenia
Sensitivity Ratings
Durban Kwamashu (28), Inanda (20), Clennont (7), Berea,
Kwandengezi
Tongaat (3), Umgababa (2), Chatsworth,
Kwamakhutha, Ntuzuma
lliovo(12), Umkomaas (5), Umbogintwini
Westville, Maidstone, Adams Mission
Hillcrest (6), Durban (5)
Pinetown (4)
6
6
5
5
4
4
3
I
4
3
3
I
3
Umzinto (16), Port Shepstone,
Hibberdene, Uvongo, Mtwalume (2),
Scottburgh (4), Munster, Urnzumbe
Ramsgate
DC 22 Imbali (10), Edendale (4)
Pietennaritzburg (3), Sweet Waters (2)
Thomville (2)
6
5
3
68

Table 22.2: Access Level 2 (12-32)
District
Councils
Durban
DC 22
DC 29
Towns Contributing to Patient Sample
within DC (number of patients)
Umlazi (43)
Mpumalanga
Inchanga
Richmond (15)
Howick (6)
Mpolweni (3)
Mpophomeni (2)
Camperdown
Eshowe (9)
Empangeni (6)
Gingindlovo (2)
Stanger (8)
Groutville (3)
Nyoni, (1)
Tugela
Schizophrenia
Sensitivity Ratings
6
4
I
3
1
6
3
3
N
DC 43
N
N
DC 24
N
DC 25
Kokstad (6)
Highflats (4)
Dududu (3)
Braemar
Harding,Paddock
Kranskop (4)
.···1 towrf(4cases) .
Newcastle
3
5
4
3
3
69

Table 22.3: Access Level 3 (33-53)
District Towns Contributing to Patient Sample
Councils within DC (number of patients)
Schizophrenia
Sensitivity Ratings
Durban Umbumbulu (1) 3
DC 43 Donnybrook (4)
Underberg (2)
.-
Wartburg (4)
New Hanover
Lidgetton
DC 22
Table 22.4: Access Level 4 (54-76)
District Towns Contributing to Patient Sample
Councils within DC (number of patients)
Schizophrenia
Sensitivity Ratings
DC 24 Greytown (9) 4
DC 43 Bulwer (6)
DC 22 lmpendle (4) 3
DC 27 Mtubatuba (2) 3
DC 28 Nkwalini 3
Table 22.5: Access Level 5 (77-98)
District Towns Contributing to Patient Sample
Councils within DC (number of patients)
Schizophrenia
Sensitivity Ratings
DC 23 Weenen (3) 4
DC 23 Loskop (2) 4
70
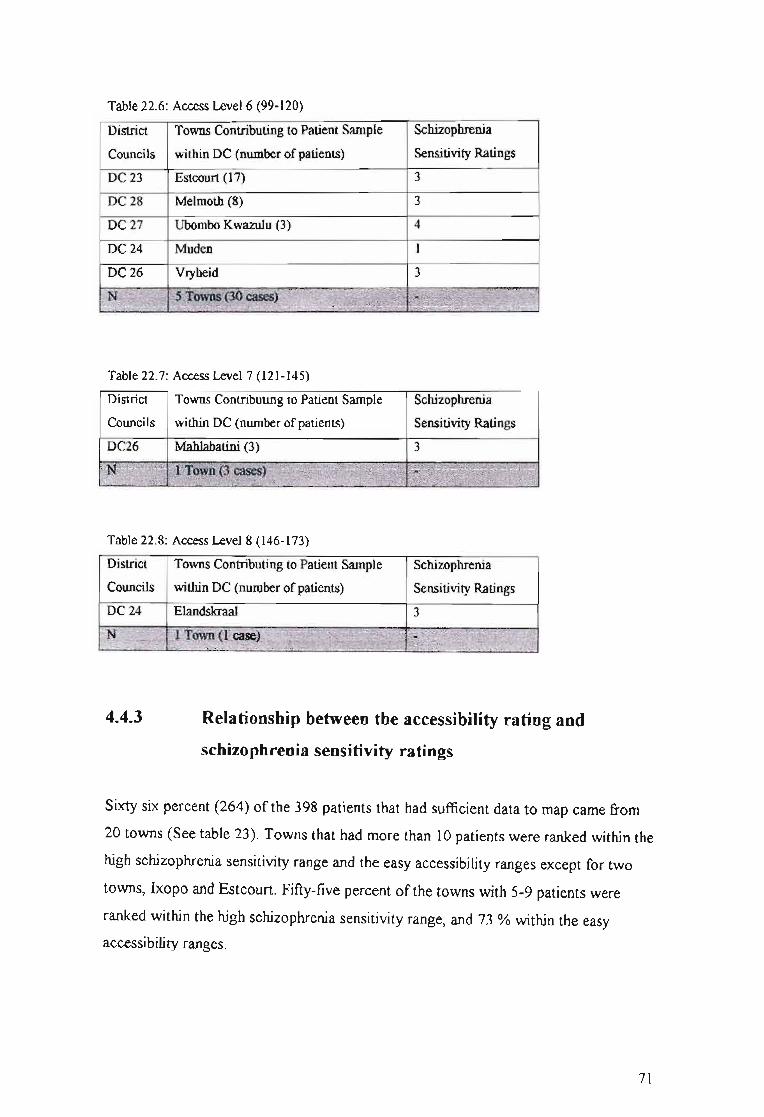
Table 22.6: Access Level 6 (99-120)
District Towns Contributing to Patient Sample
Councils within DC (number of patients)
DC23 Estcourt (17)
DC28 Melmoth (8)
DC27 Ubombo Kwazulu (3)
DC 24 Muden
DC 26 Vryheid
Schizophrenia
Sensitivity Ratings
3
3
4
I
3
Table 22.7: Access Level 7 (121-145)
District Towns Contributing to Patient Sample
Councils within DC (number of patients)
Schizophrenia
Sensitivity Ratings
DC26 Mahlabatini (3) 3
Table 22.8: Access Level 8 (146-173)
District Towns Contributing to Patient Sample
Councils within DC (number of patients)
Schizophrenia
Sensitivity Ratings
DC 24 Elandskraal 3
4.4.3 Relationship between the accessibility rating and
schizophrenia sensitivity ratings
Sixty six percent (264) of the 398 patients that had sufficient data to map came from
20 towns (See table 23). Towns that had more than 10 patients were ranked within the
high schizophrenia sensitivity range and the easy accessibility ranges except for two
towns, Ixopo and Estcourt. Fifty-five percent of the towns with 5-9 patients were
ranked within the high schizophrenia sensitivity range, and 73 % within the easy
accessibility ranges.
71

Table 23: Relationship between the accessibility and schizophrenia sensitivity ratings
of the towns with the most certified patients
Rangc ofPaticnts Towns DC SSL* AL**
(No. of patients)
10 and above UOOazi (43) Dmban 6 2
Kwamashu (28) Dmban 6 1
Ixopo (27) DC 43 3 1
Inanda (20) Durban 6 1
Estcourt (17) DC 23 3 6
Urnzinto (16) DC 21 4 1
Richmond (15) DC 22 4 2
Illovo(12) Durban 4 1
Imbali (10) DC 22 6 1
3 2
4
2
6
1
1
2
2
2
4
1
'., .,
DC 28
DC 24
DC 29
DC 28
Durban
Durban
DC 22
DC43
DC 28
DC 43
Durban
.()To~(l~$);X(§1?gs~j)resent#.c' T$J~V~ls.:>' \3ievels~' •• '/.
'~~i1~t- ··¥ri~~~·.:-.:,.... :: . -.".. "c' ..... ,:
5-9
N' •...... ,
,.N 11 Towas(76y ·'6 IJCs represented '$ levels •.•..."",,) ......•..•.•....,.. . ... ···~p4.t~:
41evcl:s" .'.. . ". .
"'J:~sel1t~
N 20 Towns (264) 8 DCs represented 5 levels
represented
4 levels
represented
*Schizophrenia Sensitivity Level; **Accessibility Level
72

4.4.4 Summary
The accessibility model map illustrated 65 % ofKZN as having 'easy access' to the
provincial hospitals providing mental health services. The greatest concentration
(81%) of the KZN population was found within the easy (1-3) accessibility ranges.
In accessibility level one, 55 % ofthe patients were from Durban DC. In accessibility
level two, 37 % of the patients originated from Durban DC, and 22 % from DC 22. In
accessibility level three, 33 % of its DC's patients resided in Umbumbulu. In
accessibility level 4, 68 % ofthe patients were found in Greytown and Bulwer.
Estcourt provided 56 % of patients in accessibility level 6. Most of the towns from
which 10 or more certified patients originated, ranked within the high schizophrenia
sepsitivity range, and the easy accessibility ranges. Towns with 5-9 patients were
ranked predominantly within the easy accessibility range, but only 55 % ranked
within the high sensitivity range.
73

5.1
CHAPTER FIVE: DISCUSSION
DISCUSSION OF KWAZULU NATAL (KZN)
Many people in KwaZulu Natal (KZN) are exposed to disadvantaged socio-economic
circumstances, for example, living in low social class positions, having little or no
education, not having work / working in elementary occupations, receiving low or no
income. These factors contribute toward a large number of the population in KZN
being vulnerable to the risk of psychiatric disorder (Andrews et aI, 2001; Jablensky
et aI., 2000; WHO International Consortium in Psychiatric Epidemiology, 2000;
Muntaner et aI., 1998; Timms, 1998; Torrey and Bowler, 1990). These factors are
considered likely to promote the conditions for schizophrenia to emerge.
5.2 DISCUSSION OF PATIENT SAMPLE
5.2.1 Gender and cultural composition
Only African male patients were sampled, as previously (under the apartheid
government), FNH was classified as a black psychiatric hospital and males dominated
these particular psychiatric admissions. It is recognised that this data is skewed
according to gender with males being over-represented in the population sample, as
schizophrenia is found equally in males and females (Kaplan and Sadock, 1998).
5.2.2 Age
The majority of the sample of patients were aged between 15 and 65 years. This
confirms Kaplan and Sadock's (1998) findings that 90% of patients with
schizophrenia usually present for treatment between the ages of 15 and 55 years. The
most prevalent age cluster was 26 - 35 years, followed by those aged 15-25 years.
74
These findings also correlate with the literature in that at least halfof the patients with
schizophrenia present with onset prior to the age of25, implying that the other half
present after the age of25 (American Psychiatric Association, 1994). It is important
however not to consider schizophrenia as a young-adult disease due to early onset, as
schizophrenia is currently predominantly perceived as chronic in nature. The
diagnosis has a permanent impact on family life, social interaction, work relations,
self-esteem, and quality oflife in general (Goeree et al, 1999). It should be taken into
consideration that the admission criteria to FNH is more likely to have contributed to
the fact that no patients under the age of 16 years were admitted rather than there
being an absence of such cases. Furthermore, patients who may have been readmitted
were included in the data; therefore assumptions of age of onset cannot be accurately
d~uced with this sample.
5.2.3 Marital Status
The high percentage ofunmarried patients supports the international findings that
marriage is considered to be a protective factor for those with schizophrenia
(Jablensky et aI., 2000; Warner and de Girolamo, 1995).
There were very few reported cultural marriages. This is more likely to be indicative
of the lack ofawareness or acceptance of such marriages, or the psychotic state of
patients on admission, resulting in inaccuracies in biographical data.
5.2.4 Seasonality of Birth
The sub-sample with actual date of births (11%) showed a fairly even distribution
throughout winter, spring and summer. These findings did not fully correspond with
international reports that people with schizophrenia were born predominantly in
winter and early spring (Kaplan & Sadock, 1998; Eaton et aI, 1988). One explanation
for this discrepancy is the small sample with actual birth dates, rendering these
findings too insignificant for substantial interpretation. This problem is particularly
evident in the African population as a result of the disadvantages experienced under
75

the apartheid government (for example: illiteracy, poor access to government
departments to register births especially in the rural areas). For the 1994 elections in
South Africa, there was a drive for all South African citizens to obtain an identity
document to ensure they could vote and hence, ensure that most people have dates of
birth. Hopefully this will also set a trend in which all citizens in the future born will
be registered and be given a birth certificate. Another explanation for the poor number
of dates ofbirth could be that on admission, the patients were too psychotic to provide
reliable or coherent personal information.
5.2.5 Employment
The high number ofunemployed patients in this sample is consistent with
international studies that show the highest rates of psychiatric disorders among those
not employed (Jablensky et al., 2000; Timms, 1998; Warner, 1985). This further
highlights costs as only small numbers of people with schizophrenia manage to work
in the open labour market (Knapp, 1997). In addition, it is significant that the
generally high unemployment rate in South Africa will mean that persons with mental
illness are less likely to obtain employment than others (White Paper on Social
Welfare, 1997). The social burden of schizophrenia is exacerbated by the social
structures in which the mentally ill are excluded from the employment market
(Jablensky et aI., 2000). With such high general rates of unemployment in the open
labour market, work for people with schizophrenia will rarely be an option (Kelly et
al, 1998). Alternate forms ofemployment, such as a greater number of protective and
sheltered workshops should ideally be made available by the government to
counteract the negative effects ofunemployment (Warner, 1985).
5.2.6 Occupation
Patients were engaged in all levels ofoccupation although over halfof the employed
sample, were in the low status occupations. These findings correlate with international
findings that schizophrenia occurs among all social classes (Jablensky et al., 2000;
76
Warner & de Girolamo, 1995) although there is a greater prevalence among those in
lower social status (Jablensky et al., 2000; Torrey & Bowler, 1990; Eaton, 1985;
Odegaard, 1956). Caution must be taken in interpreting these results, as cognisance
needs to be taken of the fact that the sample was drawn from a public hospital.
Certainly some individuals with higher incomes and occupational status would be
receiving private mental health care.
Wiggers & Sanson-Fisher (1997) identified a problematic issue in which patients
experience possible discrimination in treatment provided, based on their occupational
status. General practitioners have been identified as playing a central role in the
service provision and support network of people with schizophrenia (Knapp, 1997;
L~ng, 10hnstone & Murray, 1997b). Wiggers & Sanson-Fisher (1997) carried out a
study in the UK, that found an occupational status differential in the duration of
general practice consultation. This finding suggested that socio-economically
disadvantaged patients may not be receiving the health care they require and that
occupationally disadvantaged patients received less care from practitioners. This is of
great concern in regard to patients with schizophrenia, as many tend to be socio
economically disadvantaged. In addition this mental illness often manifests in the
patient being socially inept, and could potentially expose the patient to further
discrimination in service provision.
5.2.7 Religion
Of the 19% (n=116) of religious responses, 17% (103) were reported to be of the
Christian faith. There were one or two representatives of the Islamic, Shembe,
Traditional, and Rastafarian religions. Four patients reported to have no religious
affiliations. It is difficult to make any observations of possible interesting I pertinent
population characteristics with such a small portion of the sample.
The paucity ofdata within this section could be as a consequence of the sample's use
of certified patients' records, who were probably psychotic on admission and hence
provided unreliable information. It could also indicate the low priority religion is
77
given by those completing the patients' files, as it may not be seen to be directly
related to the patients' well-being. It may also be a reflection ofthe former
ethnocentric, predominantly Christian value system that may have overshadowed
other possible belief systems. This highlights the importance of training and feedback
to hospital personnel on the importance of such demographic data for future research.
5.2.8 Previous Admissions
The high rate of readmission (44%) corresponds to the chronic nature of
schizophrenia (Barbato, 1998). This is further demonstrated when previous admission
is ~alysed by age group. The data reveals that the only instance where the number of
patients admitted for the first time equals the number ofpatients being readmitted is in
the 15-25 year age category. In the following two age categories (26-35 years and 36
65 years), the number of patients being readmitted is almost double to those being
admitted for the first time. This supports the international findings that onset of
schizophrenia in males occurs predominantly between the ages of 15-25 years
(American Psychiatric Association, 1994). It may also be indicative of the lack of
resources in the province. If there were better community structures to support the
patients with chronic illnesses, it would be feasible to argue that there would be less
admissions.
Relapse is relatively common in patients with chronic schizophrenia, often followed
by re-hospitalisation (Knapp, 1997; Mason, Harrison, Glazebrook, Medley &
Croudace, 1996). 'Costs ofrelapse' was explored in a meta-analysis of relapse studies
(Davies & Drummond, 1994). It was found in the US that although the cost offirst
episode in-patient care was estimated at $2.3 billion, the direct costs of re-admission
in the two years following the first episode were about $2 billion (Davies &
Drummond, 1994). Relapse is costly. Davies & Drummond (1994) explain that 63%
ofthat relapse cost was due to the loss of medication response, and 37% to medication
non-compliance. A number of side-effects associated with classical neuroleptic
therapy (notably extrapyramidal symptoms) has been closely linked to non-
compliance and subsequent psychotic relapse as they add further distress to the
78

patient's life, being inconvenient, embarrassing, painful and life-threatening (Kemp &
David, 1996). With the increasing advances made in the understanding of the brain's
neurochemical transmitters and receptor sites, new antipsychotic drugs are being
developed, ensuring more effective and cost-effective antipsychotic treatment
(Jonsson, & WaIinder, 1995; Kane & Freeman, 1994). In an attempt to save on costs,
chiefly cheaper drugs (which often tend to have greater side effects) are being
prescribed in spite of the fact that the proportion of the total direct costs of
schizophrenia incurred by drug therapy is relatively modest. This tends to be a
shortsighted cost saving strategy in the light of the many other costs incurred by non
compliance and resulting multiple re-hospitalisations (Knapp, 1997).
5.2.9 Month Admitted
As the sample of patients was admitted at a fairly regular rate throughout the year
except tor the months ofNovember and December, no evidence of seasonal variation
was noted. The drop in admissions during the last 2 months of the year could possibly
be indicative of the holiday season that may in some way protect patients from
psychotic breakdown. Another explanation is that mental health services and some
community resources may be less available during this period.
5.2.10 Length of Stay
The average length of stay varied between 4-6 weeks. Research elsewhere in the
world has shown this period ofhospitalisation to be generally effective (Kaplan &
Sadock, 1998). The long period ofhospitalisation and high rate of readmission (44%)
supports the international findings regarding the great cost incurred by schizophrenia
(Department ofHealth, 1998, Warner & de Girolamo, 1995, Davies & Drummond,
1994). It has been argued that community care is more cost-effective in comparison
with hospital care (Knapp, 1997) and internationally policy has been directed towards
community-based care (Kelly, McCreadie, MacEwan, & Carey, 1998; Knapp, 1997;
Lang, Forbes, Murray & Johnstone, 1997a). The Department ofHealth, South Africa,
79

has followed suit and endorsed district-based primary health care (KwaZulu Natal
Department ofHealth, 2000). This promises a significant impact on the management
of patients with a chronic illness such as schizophrenia. Knapp (1997) suggests that
cost-effectiveness in relation to chronic mental illness should be carefully interpreted,
arguing that patients with chronic mental disease tend to have unique needs in relation
to those with acute illness.
Kelly et al (1998) described various areas of difficulties experienced by patients who
spent more of their time outside hospital:
a) supervision, was bound to have been less, with a corresponding decrease in
compliance with drugs
. b) patients outside hospital had to face up to the problems of everyday living,
which are known to exacerbate schizophrenia
c) they were exposed to greater social isolation and few employment
opportunities which lead to anxiety and depression,
d) potential increased access to alcohol and street drugs, could lead to
exacerbating symptoms of the disease and make treatment more difficult.
Success ofcommunity-based care can only be ensured if there are sufficient resources
to adequately support the service. Hafher (1987, p121) describes a comprehensive
community mental health service as one that provides well co-ordinated services at
five levels:
1) psychiatric treatment;
2) residential care (psychiatric homes, group homes etc.);
3) occupation and rehabilitation;
4) social contacts and
5) leisure activities'.
Psychiatric treatment refers to more than just administering antipsychotic medication.
Drug therapy is rarely sufficient in maximal clinical treatment. This highlights the
importance for clinicians to take the psychosocial factors affecting schizophrenia into
account (Kaplan & Sadock, 1998) and multifactorial treatment to be adopted.
Adjunctive psychotherapy effectively augments pharmacotherapy, showing a
80
remarkable increase in patients' functioning (Huxley, Rendall, & Sederer, 2000). It is
especially hoped that psychological therapies would decrease non-compliance by
improving the patient's attitude to medication. Family interventions could also
increase the promise of cost-effectiveness in treatment (Knapp, 1997).
In addition to the obvious cost of the hospital admission, there are many indirect and
intangible costs as well (Suleman et aI, 1997; Torrey, 1998). In particular the
Disability Adjusted Life Years (DALY) index is very severe for schizophrenia since
very few lead economically productive lives. This highlights the need for multifaceted
financing, managing and treatment of schizophrenia in which the overlapping
economic, resource and personal burdens as a result of this illness are shared and
h~listically addressed. Schizophrenia is a costly illness and reducing its financial
burden is not a simple matter.
5.2.11 Diagnosis
Schizophrenia constituted almost 60% ofthe diagnoses whereas just fewer than 20%
comprised either schizophrenia with substance abuse or schizophreniform disorder.
These findings correlate with findings of a previous study carried out at the Midland
Psychiatric Hospitals (MacPherson, 1995). Schizophrenia is one of the most
prominent mental disorders requiring hospitalisation as patients presenting for the first
time often show acute psychotic symptoms (delusions, hallucinations, paranoia)
require prompt hospitalisation; and as relapse is relatively common in patients with
chronic schizophrenia, re-hospitalisation is frequent (Knapp, 1997; Mason et al,
1996). The direct costs incurred by people with repeated episodes of schizophrenia,
requiring hospitalisation or intensive community care, tend to be more than 100 times
greater than the cost of treating a single episode (Davies & Drumond, 1994).
Many professionals consider schizophrenia as a group of disorders made up of a
constellation of signs and symptoms, with different aetiologies and outcomes
(American Psychiatric Association, 1994; Sue et al., 1994; Andreasen & Carpenter,
1993). Andreasen & Carpenter (1993) address the limitations of the concept of
81

schizophrenia and argue that the definition of schizophrenia can only be considered as
provisional. There are many limitations in making the diagnosis ofschizophrenia
(Maj, 1998), and methods to improve this clinical dilemma are being investigated
(Klosterkotter, Albers, Steinmeyer, Hensen, & SaB, 1995). One of the major goals of
WHO mental health programmes over the past three decades has been to develop
reliable and cross-culturally applicable diagnostic criteria and instruments for
assessing mental health disorders (Janca, Ustiin & Sartorius, 1994). This would be of
great value to the management of schizophrenia as there is an absence of a biological
marker. Health professionals are currently reliant on a mental status examination,
which usually involves a clinical interview and observation of the patient's behaviour
(Sue et al, 1994). This exposes the diagnosis to subjectivity (subjective bias). This is
an important factor to consider in that many people with schizophrenia may have been
omitted from treatment schedules.
The value of the diagnostic system is dependent on consistent and appropriate use.
Clinicians have been found not to follow the classification guidelines thereby
decreasing its validity and worth (Harding and Zahniser, 1994), and this is highlighted
by the tendency to over diagnose schizophrenia in some ethnic groups (American
Psychological Association, 1994). As this study only included African males, it is not
possible to test this observation.
As there is no single sine qua non behavioural symptom for schizophrenia (Millon,
1994), considerable variability needs to be built into each category. An important
problem in classifYing schizophrenia is that of changing criteria. Broader definitions
of schizophrenia were used in DSM-I and DSM-II, but since then, the DSM-ill-R and
DSM-IV criteria have become the most restrictive among the classification systems.
The mode ofonset ofschizophrenia may be acute or insidious (American Psychiatric
Association, 1994; Barbato, 1994). It is difficult to diagnose a person as having
schizophrenia on first admission because of the chronological criterion of the DSM
IV in which the disorder must have lasted for at least 6 months previously, and been
evident for 1 month at the time ofdiagnosis (Maj, 1998; Sue et al, 1994). This
criterion may obscure the figures of first admission and readmissions of this study,
perhaps giving lower figures of first admission than might be appropriate. The
changes in the criteria for schizophrenia may increase the reliability and validity of
the diagnosis, but makes comparing different studies over a period of time in the same
82

country, as well as international cross-cultural comparisons increasingly difficult (Sue
et al, 1994).
5.2.12 Location
It could be anticipated that a high concentration of patients reside in Durban DC, as
one-third of the population resides in that DC and hence it has the highest population
density in KZN (See appendix). DC22 followed by DC21 are the second and third
most densely populated DCs in KZN. A high number of patients are found in the
more densely populated DCs. This is in line with international findings that the
gfeater the population density, the greater the likelihood of schizophrenia in that area
(Kaplan & Sadock, 1998). The many patients living in areas where there are hospitals
could be an indication that the area is developed enough to justify a hospital. It also
could give indication that the easier the accessibility to the health facility, the more
readily it is used.
Urbanisation is a pressing issue in the country. Fifty-nine percent of the population is
now urbanised and approximately 7 million urban-dwellers are informal settlers
(squatters) (Dawes & Donald, 1994). Migration to the cities continues, following the
removal of political restrictions on the mobility ofAfrican people thus creating
increased pressure on the urban housing situation (Dawes & Donald, 1994). It is also
likely to be an issue ofconcern for persons with schizophrenia. There is a direct
regional correlation of insanity and schizophrenia with urbanisation (Torrey &
Bowler, 1990). Several theories (e.g. social drift, social cause, social residue) attempt
to explain this phenomenon.
The social drift theory can be used to explain the presence of schizophrenia by
describing both movement down the socio-economic scale; and geographical
movement to more deprived urban areas. Social drift refers to the migration of those
affected by psychiatric morbidity to areas ofa particular kind, where social demands
on them may be less (Freeman, 1994). The inner-city areas are said to attract these
affected individuals where cheap, single-person accommodation and opportunities for
casual but lowly paid work, without a cumbersome well-knit social structure tend to
83
be found. The implication of being resident in a poor environmental area is not an
aetiological factor in itself, but rather one associated with the development of the
disorder (Freeman, 1994).
In the social residue theory, the mentally healthy are said to migrate away from
socially and environmentally undesirable areas, leaving the relatively incompetent
behind (Freeman & Alpert, 1986a).
The social causation hypothesis explains how environmental factors are seen as either
causative of schizophrenia or as having to be present for a predisposed individual to
become ill. Many of the other theories have mostly focused on the individual rather
than on environmental factors when attempting to explain the uneven distribution of
schizophrenia, both in environments and among the social class (Baton, 1990).
Freeman (1994) concludes that the phenomenon is best explained by combining the
aspects of the various social processes, particularly the social drift and social cause
theories. This would mean that schizophrenia and tendencies for patients to originate
in areas ofurban deprivation could be explained by assuming a link between the
disease and an early environment of socio-economic deprivation. He also elaborated
on a seemingly distinct urban factor, other than socio-economic drift, involved in
producing the geographical disparity in insanity and schizophrenia. Some suggested
explanations include: Social factors, such as rural-community pressure resulting in
increasing difficulty to commit a patient involuntarily; stress and crowding factor;
genetic factors (i.e. genetic disposition with stress factors which could lead to
schizophrenia); biological factors (e.g. nutritional factors that lead to the exposure to
lead); and, environmental contaminants (such as air-polluting gases and infectious
diseases).
These issues are ofgreat concern with the increasing move towards de
institutionalisation, particularly if there is inadequate provision for community
residences for patients with schizophrenia. Such patients, on leaving the mental
hospitals, tend to drift to the poorest parts of cities (Goldman, 1983).
A high number ofcertified patients (43 %) were referred from provincial hospitals.
This seems to support Harvey's findings (2000) that mental health services are still
concentrated in the psychiatric services and not in the health care clinics. However,
the fact that the sample population of certified patients were hospitalised in 1995-
84
1996, needs to be acknowledged. In 2002, the referral procedures may have changed
radically to be in line with the primary health care policy adopted by the Department
ofHealth. Replication of the study may yield different results, as 1995 may have been
too soon after the new South Africa and the New S.A. Constitution (The Constitution
of the Republic ofS.A., 1996) and health policies (e.g. Policy on Quality in Health
Care for South Africa (September 2000); Mental Health Care Act (2000); White
Paper on Transforming Public Service Delivery (October 1997); Policy on Quality in
Health Care (April 1997); White Paper on the Transformation of the Health System of
South Africa (April 1997) were ushered in, and thus not enough time had elapsed to
implement these changes.
Cooper and Sartorius (1977) proposed that schizophrenia has emerged as a major
disorder in the 20th century due to the large populations that accumulated on a hitherto
unprecedented scale, mainly through migration. Fifty-nine percent of the population is
now urbanised and approximately 7 million urban-dwellers are informal settlers
(squatters) (Dawes & Donald, 1994). The migration to the cities continues following
the removal ofrestrictions on the mobility of African people creating increased
pressure on the urban housing situation (Dawes & Donald, 1994). Freeman (1994)
proposed that cases of severe mental illness had previously been widely dispersed in
rural societies, but because of the migration to the cities, had subsequently become
aggregated in such numbers in the urban areas, and came to represent a major public
health factor in the population. This may explain the high number ofcertified patients
(68 %) coming from for example, Umlazi, KwaMashu, Inanda and Durban, in the
Durban DC.
Only 8 % ofthe patients were referred from institutions outside the DC in which they
lived. This is a minimal amount. If it had been a greater number, migration could have
possibly explained the movement in the province or the lack / lack ofaccessibility of
referring institutions resulting in the patients needing to travel out of their DC for
help. However, this does not appear to be the case. Fifty-eight percent of the patients,
who were referred out of their DC of abode, had come from towns from which other
patients had been referred from institutions within the same DC. Perhaps the patients
were simply on holiday or given incorrect information on admission due to their
psychotic state on presentation.
85
Only 65 % ofthe original certified patients database was utilised in the maps due to
poor data collection. The information within the files was often poor due to either
illegible writing, unfamiliar abbreviations used, unknown (not on GIS standardised
list of town names) towns listed. If the socio-demographic data were to be captured on
hospital admission, it would be more reliable and consistent if, (a) the staff member's
professional experience could be utilised, and, (b) possible clarification from the
patient or collateral from those persons in accompaniment could ensure more accurate
information being recorded in the database.
86

5.3 DISCUSSION OF SCHIZOPHRENIA SENSITIVITY
MODEL
The focus of recent research is to identify the variables of risk in relation to
schizophrenia and to enable early intervention (Cornblatt, Obuchowski, Schnur,
O'Brien, 1998; Yung et al, 1998) to prevent or minimize later ill-health (Yung et ai,
1998), as the earlier the intervention, the more successful the outcome (Yung et al,
1998; McGlashan & Johannessen, 1996). Kaplan & Sadock (1998) described a risk
factor as disorder-associated factor that could possibly uphold a causal connection. As
little is understood about the causes of schizophrenia, the model is attempting to
establish the relative risk of schizophrenia, i.e. the risk factors which are likely to
occur in a specific environment such as KZN. The schizophrenia sensitivity model
aims to identify some people in KZN who may be vulnerable to the psychotic
disorder.
5.3.1 Is there evidence ofa geographical pattern?
No distinct pattern was evident in the map ofthe model as one could expect for a
physical disease such as cholera or lung cancer in which the cause and effect are well
established and clearly mapped. The schizophrenia sensitivity model was in essence
an experimental exercise. This type of project has not, to the researcher's knowledge,
been attempted before in mental health let alone with schizophrenia. Much research
has been focused on isolated variables associated with schizophrenia. As yet, no one
had taken the many variables and overlaid them to examine the combined effect,
which could potentially hold the alchemists key to unravelling the illusive disease of
schizophrenia. There were many obvious limitations to the study. Firstly, the variables
used to create the model were from the 1995 Census Data (Central Statistical
Services, 1995). They were crude in terms of sensitivity to schizophrenia highlighting
the need for the finding to be interpreted with caution. Secondly, the population
sample was too small and no statistical analysis could be performed due to GIS
incompatibility. If this study were to be repeated this needs to be addressed, ensuring
87

that the geographical references be linked to the standardised lists used by the GIS.
Only one 'expert' was accessed to contribute to the creating ofthe model. Usually, a
group ofexperts' knowledge is tapped into and a consensus out of that pool of
knowledge to inform the process of model making. However, the variables utilised
were substantiated by the literature in the field.
This project attempted to utilize the GIS to explore the geographical patterns of
schizophrenia. Previously GIS has been ably applied to infectious diseases such as
cholera and tuberculosis (Geographical Information Systems Unit, 2002). However,
there are limitations in applying GIS to mental illness. In contrast to infectious
disease, mental illness have less clearly defined signs and symptoms, and are not
re.stricted to the realm ofbiology; etiological factors are not necessarily understood;
nor does diagnosis automatically implicate specific etiology or treatment (Kaplan &
Sadock, 1998; Carson & Butcher, 1992). Many of the contributing variables
(biological, social, psychological) associated with the disorder have not been included
in this study. This could well explain the lack ofdistinct pattern evident in the KZN
schizophrenia model.
5.3.2 Percentage ofKZN population falling into the varying
ranges of schizophrenia risk
It would seem that the high schizophrenia sensitivity levels are linked to areas of
greater population density as the high schizophrenia sensitivity risk ranges took up
almost four times less surface area (20 %) than the low risk ranges (72 %), and yet
contain twice the amount of population (67 %). The model suggests that the greater
the population density the greater the schizophrenia sensitivity risk.
5.3.3 Description of the relationship between the schizophrenia
sensitivity ranges and certified patients
Throughout KZN and within most of the Des, the high and low schizophrenia
88
sensitivity ranges occur almost equally (56 %,44 % respectively). The implication of
this finding is that there is a 50 % risk of schizophrenia throughout the province. This
figure is extremely high especially when considering that the lifetime risk of
schizophrenia falls within the range of0.50 - 1.72 % and that little variation have
been noted across diverse populations and cultures (Jablensky et al., 1992).
Durban DC exhibited 3 times more high schizophrenia sensitivity ranges than low
ranges. Durban DC has at least 3 times more population than the other DCS. DC 24
had the smallest population quota and also had 3 times more low schizophrenia
sensitivity ranges. DC 28 also had 3 times more low schizophrenia sensitivity ranges
and contained 3 times less population as DC Durban. This again seems to point to the
role that population distribution may be playing in the patterns of the model. It needs
to be queried whether this is due to schizophrenia or possibly extraneous non
aetiological influence instead.
It would seem that it would be beneficial to include additional variables in the model
to increase its sensitivity to schizophrenia vulnerability. Some ofthe high-risk studies
focused on genetic relatedness to define risk (Hodges et al, 1999; Yung & McGorry,
1996). Cornblatt et al (1998) found that neurocognitive deficits and clinical symptoms
were independent classes of risk indicators. Hodges et al (1999) found significant
differences in high-risk groups in the social parameters (childhood isolation,
interpersonal sensitivity, social isolation and restricted affect). These studies highlight
the diversity of risk variables affecting vulnerability to schizophrenia. This present
study took only at socio-demographic variables (e.g. age, marital status) into
consideration and omitted social (social isolation), past history variables (history of
mental disorder, birth obstetric details), and biological factors (genetic factors,
neurocognitive factors), psychological (family interactions) and other environmental
factors (air pollution). By taking more of these factors into account, the model will
only be enriched and fine-tuned to the schizophrenia risk.
5.3.4 Summary
The schizophrenia sensitivity model is crude in its identification of individuals
vulnerable to schizophrenia. However, potential for further development in the model
for both schizophrenia and mental illness in the future, has been highlighted,
especially for planning and managing ofthe mental illnesses and policymaking.
89

5.4 ACCESSffiILITY MODEL
South Africa has a legacy ofgreat inequity in the health care system (Jinabhai &
Campbell, 1995). Discriminatory service delivery (Ntsaluba & Pillay, 1998) has been
exacerbated by the geographical inequities. The Bill ofRights (Constitution of the
Republic of South Africa, 1996) states that access to health care services are a right.
The degree of accessibility to the 19 provincial hospitals providing psychiatric
services has been explored in the accessibility model.
5.4.1 Access and the KZN population
The majority (95 %) ofKZN surface area and population fall within the easy to
average range of accessibility. As the degree of accessibility becomes more difficult,
so the population decrease. The model suggests that accessibility to the provincial
hospitals offering psychiatric services is not a problem in KZN. However, caution
needs to be heeded in these findings, as it does not correlate with the real world. This
model is only describing the physical distance between the service and the person
requiring the service. There are many qualitative issues that may form a barrier to the
person requiring the service. Schizophrenia itself may be a barrier. Paranoia and
suspicion, characteristics of schizophrenia can become rife as the psychotic symptoms
set in, and this may result in preventing the patient treatment to seek treatment. The
GIS map is a digital representation of the world (Burrough, 1986). The relationship
between the 'real' world and the representation at each stage depends not only on the
accuracy of the co-ordinates and attributes, but also on the researcher's decision
regarding what to include, how to measure / classify and symbolise those
representations (Martin, 1999). The variables utilised within this model may not be
sensitive enough to the accessibility needs of this region or pertinent variables
omitted, and hence, representing the degree of accessibility inaccurately. If
consideration is taken ofthe high levels of poverty especially concentrated within the
rural areas, it seems likely that the too little emphasis was made on the cost of
travelling. The patient requiring the service, regardless of how nearby in proximity the
90

person is to the provincial hospital, will not be able to get there if he or she has no
money to pay for transport. It is important to recognise that this model identifies the
physical or locational accessibility. There are many other issues related to access to
health care over and above physical accessibility, such as, revealed accessibility and
quality of service provided (phillips, 1990). Locational accessibility is simply a
measure of proximity. It assumes that because a facility exists, it may be used. This is
also referred to as 'potential' accessibility. Another pertinent issue deals with the
argument of quantity of facilities is not the same as quality of service rendered
(Phillips, 1990). A study done in western Guatemala, (Armis, 1981) illustrated the
powerful effect on utilisation of the services determined by the quality of service
provided. In spite of there being reasonably good access to health services, even
taking the bad roads and slow travel times into account, Armis (1981) argued that only
those who lived within short distances of the facility made use of it because ofthe
people's expectation to receive dissatisfactory service. Armis (1981) went on to
describe poor service in terms ofunderstaffed personnel, poorly trained staff, badly
equipped and a reputation of not being effective in healing the people.
5.4.2 Access and the certified patient population with
schizophrenia seen at Fort Napier Hospital
The number of patients was too small to perform any statistical analysis. As with the
KZN population, more patients were found in the easy levels of access, and less
patients as the access became more difficult with the exception of accessibility level
6, namely, Estcourt (DC 23) and Melmouth (DC 28). However, the overall picture
implies that the degree of accessibility for the certified patients was good. Again
caution needs to be taken with interpreting these results for various reasons. This
relationship between the levels of accessibility and certified patients could not be
statistically analysed due to the small numbers of patients. This study would need to
be repeated to gain confidence in the outcome. Also, it must be acknowledged that the
model is measuring physical access and not taken into account the many issues related
to actual utilisation of the hospitals.
91

5.4.3 Relationship between the accessibility rating and
schizophrenia sensitivity ratings
A vast majority of patients (66 %) come from a selected few towns (20 %) within
each DC. Most of the towns (7 out of the 9) that had 10 or more patients allocated to
them, fell into high schizophrenia sensitivity ranges and within the easy accessibility
ranges.
However, those towns (11) that had 5 - 9 patients allocated to them displayed a less
distinct pattern. Seventy-three percent of the towns fell into the easy accessibility
range while only 55 % towns (6) fell into the high schizophrenia sensitivity ranges.
The latter pattern reflects the findings found in Results 5.3.4 in which throughout
KZN and most of the DCs, the high and low sensitivity risk ranges were evenly
distributed. The former pattern reflects the DC ofexception, Durban DC, in which
there were 3 times more high sensitivity risk ranges than low. Four (44 %) out of the 9
towns were from the Durban DC. It would be valuable to investigate what common
factor between these towns could feasibly explain the high number of patients
corresponding to the increase in schizophrenia sensitivity levels. Those DCs falling
with the distinct pattern (Durban, 22 and 21) have the three highest population
densities in KZN. This is in line with international findings that the greater the
population density, the greater the likelihood of schizophrenia in that area (Kaplan &
Sadock, 1998). Another common factor these towns have is that they are
predominantly informal townships, occupied mainly with the African population
group. The high number of people migrating the urban areas, and settling at a rapid
rate within these informal townships (Freeman, 1994; Cooper and Sartorius, 1977)
may explain the increase in schizophrenia in these areas. Caution must be
implemented in interpreting these findings as yet it is unclear whether the model is
showing merit in certain circumstances or whether there is an uncontrolled for,
external variable (such as population density) to explain this pattern. A larger patient
sample is required to give statistical validity to the findings.
92
5.4.4 Summary
According to the accessibility model the majority ofKZN population is said to be
within easy to average range ofaccessibility to the provincial hospitals oftering
psychiatric services. This is problematic and the model will need to be refined to
ensure that it is more sensitive to the plight ofmany of the people in KZN. The model
is describing the proximal distance to the provincial hospital from their place of
residence and does not deal with other issues of accessibility such as, the actual
utilisation of the services, cost of transport, quality of the services provided, which
has been argued to have great impact on issues ofaccessibility.
93
CHAPTER 6: CONCLUSION
Schizophrenia is a debilitating, chronic mental illness (Kaplan & Sadock, 1998;
Warner & de Girolamo, 1995) that is both emotionally and financially incapacitating
to the individual, and their family, as well as economically costly in terms of a
country's resources (MoscarelJi, 1994). Medical geography combining
epidemiological knowledge (pyle, 1979) and basic demographic information
(Mc Glashan, 1972) provides an opportunity for the spatial analysis of human
problems and can be graphically displayed and interpreted utilizing Geographic
Information Software (GIS).
The aims of this pilot study were to gain a greater understanding of the variables
affecting and possibly contributing to schizophrenia, by firstly, describing the
demographic trends and deviations from international findings, and secondly, using
the Geographical Information Systems (GIS) model, to overlay these individual socio
demographic variables in order to examine a potential combined effect; and to explore
the geography of schizophrenia in terms ofaccessibility of the mental health services
to individuals diagnosed with schizophrenia.
It was found that the socio-demographic profile of the certified patients at FNH, and
presentation of schizophrenia resembled that of most international findings.
Overall, the pattern produced by the schizophrenia sensitivity model was unclear
other than high and low schizophrenia sensitivity ranges being evenly spread
throughout KZN. Only in the Durban DC did the high schizophrenia sensitivity
ranges occur three times more than the low. These findings should be interpreted very
cautiously. The model could be refined further to amplify its sensitivity to
schizophrenia risk using variables such as biological (genetics and neuropathology),
psychological (family interactions) and environmental factors (socio-political issues).
Each of these variables would enhance the model greatly.
Although statistical significance could not be established, the accessibility model
suggested that large parts ofKZN fall within the range of easy accessibility in relation
to the 19 provincial hospitals that provide a psychiatric service. Broader aspects of
94

accessibility need to be incorporated into the study ofaccessibility, such as utilisation
and quality ofthe mental health services.
The schizophrenia sensitivity model and accessibility model, in spite of the
rudimentary and incomplete variables utilised, confirmed its potential as a powerful
tool to collect (from surveys and other databases), store (retrieval and query),
manipulate (transforming data, analysis and modelling) and produce data output (data
reporting, such as maps and reports) (Foote & Lynch, 1995).
The limitations of this study included using crude variables in the models which led to
losing a degree of sensitivity and comprehensiveness of the purpose of the model.
~nly one 'expert' was utilised in the development of the models, although the current
literature provided corroboration. Difficulties experienced in the data capture process,
such as not all the of the patient sample being used in the mapping process; and, the
patient sample being too small to allow for statistical analysis, resulted in all the
findings having to be treated with caution.
It would be beneficial to repeat this study in order to achieve a time series
longitudinal data base, to establish whether changes in departmental policies have
made an impact on the quality of the patients' treatment, and to create a database in
which the sociodemographic variables of the patients could be used to map future
planning and management of the mental health services.
Thus it is recommended that,
• a provincial computerised database be established in which more efficient and
standardised hospital and clinic records be kept. This could provide valuable
information for further research in the field of mental health.
• further studies be conducted to refine the models and that the major findings
be verified at local site studies.
• future surveys of patients should include private hospitals and clinics to ensure
a more holistic picture of the socio-demographic profile of the patient sample
inKZN.
• A larger patient sample needs to be studied to statistical analysis can be
applied.
95

It is strongly recommended that there be greater collaboration between mental health
services and the GIS Unit, Department ofHealth and that the GIS be utilised to assist
in planning and decision-making in mental health services. The researcher should be
predominantly involved in liasing with the GIS department in order to get basic
training on the GIS to ensure a solid foundation ofunderstanding and conceptual
background to use the GIS as effectively and efficiently as possible.
It is evident that people with schizophrenia experience many obstacles in their every
day living. This research project has highlighted the negative and unsupportive
context in KZN. To make a difference in these patients' lives, the quality ofthe lives
of the majority of the population in KZN needs to be improved. This would include
ensuring a basic education, increased employment opportunities, and raising the
standard ofliving of the majority of South Africans to above the international poverty
line. By creating an environment that is supportive ofbasic living standards for the
majority of the people, the repercussions can only be positive on those with chronic
mental illness. Resources need to be allocated for patients' unique needs, to ensure
appropriate accommodation and accessible alternate employment opportunities for
those unable to work in the open labour market. This can only promote mental health
in South Africa.
96

REFERENCES
Adams, W. & Kendell, R.E. (1999). Annual variation in birth rate of people who
subsequently develop schizophrenia. British Journal ofPsychiatry, 175, 522
527
American Psychiatric Association (1994). Diagnostic and Statistical Manual of
Mental Disorders (4th ed.). Washington, DC: American Psychiatric
Association
Andreasen, N.C. & Carpenter, Jr., W.T. (1993). Diagnosis and classification of
schizophrenia. Schizophrenia Bulletin, 19, 199-211
Andrews, G., Henderson, S. & Hall, W. (2001). Prevalence, comorbidity, disability
and service utilization. British Journal ofPsychiatry, 178, 145-153
Armis, S. (1981). Physical access and utilization ofhealth services in rural Gautemala.
Social Science andMedicine, 15D, 515-523
Association for Geographic Information (1 999).GIS Dictionary: Spatial Analysis and
modelling related terms. URL: http://www.geo.ed.ac.uk/
Ayeni, B. Rushton, G., & McNulty, M.L. (1987). Improving the geographical
accessibility ofhealth care in rural areas: a Nigerian case study. Social Science
andMedicine, 25, 10, 1083 - 1094
Barbato, A. (1998). Schizophrenia andpublic health. Division ofMental Health and
Prevention of Substance Abuse; Nations for Mental Health. World Health
Organisation: Geneva. [On-line]. Available: http://www.who/msa/nam/97.6
97

Barham, P. & Hayward, R (1990). Schizophrenia as a life process. In Bentall, RP.
(ed) Reconstructing schizophrenia. Routledge: New York
Beard, M.K. & Buttenfield, B.P. (1999). Detecting and evaluating errors by
geographical methods. In Longley, P.A., Goodchild, M.F., Maguire, D.l and
Rhind, D.W. (eds). Geographical Information Systems: Principles and
technical issues (Volume 1). John Wiley & Sons, Inc: New York
Bhana, A. & Pillay, YG. (1998). The use of the Geographical Information System
(GIS) to determine potential access and allocation of public mental health
resources in KwaZulu-Natal. South African Journal ofPsychology, 28 (4),
222-233
Bloom, G. & McIntyre, D. (1998). Towards equity in health in an unequal society.
Social Science &Medicine, 47 (IQ), 1529-1538
Burrough, P.A. (1986). Principles ofgeographical information systemsfor land
resources assessment. Clarendon Press: Oxford
Carson, RC. & Butcher, IN. (1992). Abnormalpsychology and modern life.
Harper Collins Publishers
Central Statistical Services (1995). Population census. Pretoria: Central Statistical
Services
Chetty, K. (1990). The provision of hospitals and clinics in South Africa: some steps
to redress the problems. Critical Health, 21-23
Chou, Y (1997). Exploring spatial analysis in geographic information systems. Santa
Fe: Onward Press
98

Constitution of the Republic of South Africa, Act 108 of 1996
Cooper, lE. & Sartorius, N. (1977). Cultural and temporal variations in
schizophrenia. British Journal ofPsychiatry, 130, 50-55
Comblatt, B., Obuchowski, M., Schnur, D. & O'Brien, 1 D. (1998). Hillside study of
risk and early detection in schizophrenia. British Journal ofPsychiatry, 172
(supp 33), 26-32
Davidson, L. (1992). Developing an empirical-phenomenological approach to
schizophrenia research. Journal ofPhenomenological Psychology, 23 (1),
3-15
Davies, L.M. & Drummond, M.F. (1994). Economics and schizophrenia: The real
cost. British Journal ofPsychiatry, 165 (suppI25), 18-21
Dawes, A. & Donald, D. (1994). Understanding the psychological consequences of
adversity. In Dawes, A. & Donald, D. (Eds). Childhood & adversity:
Psychological perspectivesfrom South African research. David Philip: Cape
Town
Department ofHealth (1998). Provincial Health Policy Bill. URL: http://www.gov.za/
Dor, G. (1994). New settlements, growing communities: the increasing need for
health care. Critical Health, 46, 6-13
Eaton, W.W., Day, R. & Kramer, M. (1988). The use ofepidemiology for risk factor
research in schizophrenia: An overview and methodological critique. In
Handbook ofschizophrenia. Vol. 3: Nosology, epidemiology and genetics.
Tsuang M.T., & Simpson le., (eds.). EIsevier: Amsterdam
99

Eaton, W.W. (1985). Epidemiology of schizophrenia. Epidemiological reviews, 7,
105-126
Fennig, S., Putnam, K, Bromet, E.J. & Galambos, N. (1995). Gender, premorbid
characteristics and negative symptoms in schizophrenia. Acta Psychiatr Scand,
92, 173-177
Folnegovic, Z., Folnegovic-Smalc, V. & Kulcar, Z. (1990). The incidence of
schizophrenia in Croatia. British Journal ofPsychiatry, 156, 363-365
Foote, K E. & Huebner, D. J. (1996). Database Concepts. The Geographer's Craft
Project, Department of Geography, The University of Colorado at
Boulder.Url: http://www.colorado.edu/geography/gcraft
Foote, K E. & Lynch, M. (1995). Geographic Information Systems as an Integrating
Technology: Context, Concepts, and Definitions. The Geographer's Craft
Project, Department of Geography, The University of Colorado at Boulder.
Url: http://www.colorado.edu/geography/gcraft
Freeman, H. (1994). Schizophrenia and City residence. British Journal ofPsychiatry,
164 (suppl 23), 39-50
Freeman, M. (1991). Mental health for all - moving beyond rhetoric. South African
Journal ofPsychology, 23(3), 141-147
Freeman, H. & Alpert, M. (1986). Prevalence of schizophrenia in an urban
population. British Journal ofPsychiatry, 149, 603-611
Gangat, A.E.(2000). Psychosis and schizophrenia. Valentine Bedford - Durban,
South Africa.
100
Geographical Infonnation Systems Unit, Health Department (2002). URL:
http://www.kznhealth.gov.za/gisinfo/htm
Goeree, R., O'Brien, B.1., Goering, P., Blackhouse, G., Agro, K., Rhodes, A. &
Watson,1. (1999). The economic burden of schizophrenia in Canada.
Canadian Journal ofPsychiatry, 44 (5),464-473
Goldman, H.H. (Bd.) (1983). International perspectives in deinstitutionalisation.
International Journal ofMental Healfh, 11,3-165
Gureje, O. (1991). Gender and schizophrenia: age at onset and sociodemographic
attributes. Acta Psychiatr Scand, 83, 402-405
Gwatkin, D.R. (2000). Health inequalities and the health of the poor: what do we
know? What can we do? Bulletin ofthe World Health Organisation, 70 (1),
3-18
Hafuer, H. (1987). Do we still need beds for psychiatric patients? An analysis of
changing patterns ofmental health care. Acta Psychiatr Scand, 75, 113-126
Harding, C.M. & Zahniser, 1.H. (1994). Empirical correction of seven myths about
schizophrenia with implications for treatment. Acta Psychiatr Scand, 90 (suppl
384), 140-146
Hare, E. (1986). Aspects of epidemiology of schizophrenia British Journal of
Psychiany, 149, 554-561
Harvey, M. (2000). Mental health is the stepchild ofhealthcare.
Http://www.iclinic.co.za/octOO/editorial/menta12.htm
101
Hodges, A, Byrne, M., Grant, E. & Johnstone, E. (1999). People at risk of
schizophrenia. Sample characteristics of the first 100 cases in the Edinburgh
high-risk study. British Journal ofPsychiatry, 174, 546-553
Hopa, M., Simbayi, L.e. & du Toit, e.D. (1998). Perceptions on integration of
traditional and western healing in the new South Africa. South African Journal
ofPsychology, 28 (1), 8-14
Huxley, N.A, Rendall, M. & Sederer, L. (2000). Psychosocial treatments in
schizophrenia: a review ofthe past 20 years. Journal ofNervous andMental
Disease, 188, 187-201
Jablensky, A, McGrath, 1., Herrman, H., Castle, D., Gureje, 0., Evans, M., Carr, v.,
Morgan, V., Korten, A & Harvey, e. (2000). Psychotic disorders in urban
areas: an overview ofthe study on low prevalence disorders. Australian and
New Zealand Journal ofPsychiatry, 34,221-236
Jablensky, A, Sartorius, N., Ernberg, G., Anker, M., Korten ,A, Cooper, lE., Day, R.,
& Bertelsen A (1992). Schizophrenia: Manifestations, incidence and course in
different cultures: A World Health Organization ten-country study.
Psychological Medicine Monograph Supplement 20, Cambridge, Cambridge
University Press
Janca, A, UstOn, T.B. & Sartorius, N. (1994). New versions ofWorld Health
Organization instruments for the assessment of mental disorders. Acta
Psychiatr Scand, 90, 73-83
Jinabhai, e. & Campbell, L. (1995). The need tor equitable resource distribution: The
case ofKwaZululNatal. Critical Health, 47, 42-46
102

Jonsson, D. & W81inder, 1. (1995). Cost-effectiveness ofclozapine treatment therapy
refactory schizophrenia. Acta Psychiatr Scand, 92, 199-201
Kane, 1.M. & Freeman, H.L. (1994). Towards more effective antipsychotic treatment.
British Journal ~fPsychiatry, 165 (suppI25), 22-31
Kaplan, H.I. & Sadock, B.1. (1998). Synopsis ofPsychiatry. Behavioural Science /
Clinical psychiatry. Balitmore: Williams and Wilkins
Katzenellenbogen, J.M., Joubert, G. & Yach, D. (Eds) (1997). Epidemiology: A
manualfor South Africa. Cape Town: Oxford University Press Southern
Africa
Kawachi" I. & Kennedy, RP. (1997). The relationship of income inequality to
mortality: does the choice of indication matter? Social Science andMedicine,
45 (7), 1121-1127
Kelly, c., McCreadie, R, G., MacEwan, T., & Carey, S. (1998). Nithsdale
schizophrenia surveys 17: Fifteen year review. British Journal ~fPsychiatry,
172,513-517
Kemp, RW. & David, A. (1996). Psychological predictors of insight and compliance
in psychotic patients: randomised control trial. Brilijh Journal ofPjychialry,
169, 444-450
Klosterkotter, 1., Albers, M., Steinmeyer, E.M., Hensen, A. & SaB, H. (1995).
Positive or negative symptoms - which are more appropriate as diagnostic
criteria for schizophrenia? Acta Psychiatr Scand, 92, 321-326
Knapp, M. (1997). Costs of schizophrenia. British Journal ofPsychiatry, 171, 509
518
103
Kraak, M.J. (1999). Visualising spatial distributions. In Longley, P.A, Goodchild,
M.F., Maguire, D.I & Rhind, D.W. (eds). Geographical Information Systems:
Principles an.d technical issues (Volume 1). John Wiley & Sons, Inc: New
York
KwaZulu Natal Department ofHealth (2000). URL: http://healthweb.kzntl.gov.zal
Lang, F.H., Forbes, IF., Murray, G.D. & Johnstone, E.C. (1997a). Service provision
for people with schizophrenia.. 1. Clinical and economic perspective. British
JournalofP~chiahy, 171,159-164
Lang, F.H., Johnstone, E.C. & Murray, G.D. (1997b). Service provision for people
with schizophrenia. IT Role of the general practitioner. British Journal of
P~chiahy, 171, 165-167
Last, IM. (1988). Dictionary ofEpidemiology. Oxford University Press: New York
Lilienfeld, AM. & Lilienfeld, D.E. (1980). Foundations ofEpidemiology. New York:
Oxford University Press
Longley, P.A, Goodchild, M.F., Maguire, D.J. & Rhind, D.W. (Eds) (1999).
Geographical Information Systems: Principles and technical issues (Volume
1). John Wiley & Sons, Inc: New York
Lynch, M. (1994). Ethical Issues in Electronic Information Systems. The
Geographer's Craft Project, Department ofGeography, The University of
Colorado at Boulder. URL: http://www.colorado.edu/geography/gcraft
MacMahon, B. & Pugh, T.F. (1970). Epidemiology: Principles andMethods. Little,
Brown and Company: Boston
104

MacPherson, A. (1995). Schizophrenia in KwaZulu Natal. A GIS survey ofpatients
treated at the Midlands Complex from 1990 -1995. Unpublished master's
dissertation, University ofNatal (pietermaritzburg).
Maj, M. (1998). Critique of the DSM-IV operational diagnostic criteria for
schizophrenia. British Journal ofPsychiatry, 172, 458-460
Martin, D.J.(1999). Spatial Representation: The social scientist's perspective. In
Longley, P.A., Goodchild, M.F., Maguire, D.I & Rhind, D.W. (eds).
Geographical Information Systems: Principles and technical issues (Volume
1). John Wiley & Sons, Inc: New York
Mason, P., Harrison, G., Glazebrook, c., Medley, I. & Croudace, T. (1996). The
course of schizophrenia over 13 years. British Journal ofPsychiatry, 169,
580-586
McGlashan, T.H. (1998). Early detection and intervention of schizophrenia: rationale
and research. British Journal ofPsychiatry, 172, 3-6
McGlashan, N.D. (1972). Medical Geography: an Introduction. In McGlashan, N.D.
(Ed). Medical Geography: Techniques and Field Studies. Methuen & Co Ltd:
London
McGlashan, T.H. & Johannessen, 10. (1996). Early detection and intervention with
schizophrenia: rationale. Schizophrenia Bulletin, 22, 201-222
Mental Health Act (1973). Act 18 of 1973
Mental Health Care Act (2000). Government Gazette No. 20848, February 2000
105

Miller, T. & Swartz, L. (1992). Psychology and epidemiology: and uncomfortable
alliance? South African Journal ofPsychology, 28 (1), 8-14
Millon, T. (1999). Personality - Guided Therapy. John Wiley & Sons, Inc.: New
York
Moscarelli, A. (1994). Health and economic evaluation in schizophrenia: implications
for health policies. Acta Psychiatr Scand, 89 (suppI382), 84-88
Mowry, RI., Lennon, D.P. & De Felice, C.N. (1994). Diagnosis of schizophrenia in a
matched sample of Australian aborigines, Acta Psychiatr Scand, 90,337-341
Muntaner, C., Eaten, W.W., Diala, e., Kessler, RC. & Sortie, P.D. (1998). Social
class, assets, organizational control and the prevalence of common groups of
psychiatric disorders. Social Science andMedicine, 47 (12), 2043-2055
Myers, I.K., Weissman, M.M., Tischler, G.L., Holzer, C.E., Leaf, P.I., Orvaschel, H.,
Anthony, I.e., Boyd, I.H., Burke, J.D., Kramer, M. & Stoltzman, R (1982).
Six-month prevalence of psychiatric disorders in three communities: 1980 to
1982. Archives ofGeneral Psychiatry, 41, 959-967
Narita, K., Sasaki, T., Akaho, R, Okazaki, I., Kusumi, I., Kato, T., Hashimoto, 0.,
Fikuda, R, Koyama, T., Matsuo, K., Okabe, Y, Nanko, S., Hohjoh, H. &
Tokunga, K., (2000). Human leukocyte antigen and season ofbirth in
Japanese patients with schizophrenia. American Journal ofPsychiatry, 157,
7,1173-1175
Ntsaluba, A. & Pillay, Y (1998). Reconstructing and developing the health system
the first 1000 days. South African Medical Journal, 88, 33-36
106

Odegaard, O. (1956). The incidence of psychosis in various occupations.
International.Journal ofSocial Psychiatry, 2, 85-104
Parry, C. & Swartz, L. (1997). Psychiatric epidemiology. In Katzenel1enbogen, lM.,
Joubert, G., & Karim, S.S.A. (Eds). Epidemiology: A manualfor South Africa.
Cape Town: Oxford University Press Southern Africa
Pederson, C.B. & Mortensen, P.B. (2001). Family history, place and season ofbirth as
risk factors for schizophrenia in Denmark: a replication and reanalysis. British
Journal ofPsychiatry, 179, 46-52
Peters, D.G. (1999). Attitude, coping and outcome in schizophrenia. Unpublished
master's dissertation, University ofNatal (pietermaritzburg).
Pyle, G.F. (1979). Applied medical Geography. Y.H. Winstons & Sons: Washington,
D.C.
Policy on Quality in Health Care for South Africa; National Department ofHealth,
Pretoria, Quality Assurance, 29 September 2000
Policy on Quality in Health Care, April 1997, Government Gazette No 17910
Poverty and Inequality in South Africa (1998): Report preparedfor the Office ofthe
Executive Deputy President and the Inter-Ministerial Committee for Poverty
and Inequality: Summary Report: 13 May, 1998
Rosnow, RL. & Rosenthal, R (1996). Beginning behavioural research: A conceptual
primer. Prentice Hall: New Jersey
Rushworth, (2002). Geographical Information Systems Unit, Health Department. Url:
http://www.kznhealth.gov.za/gisinfo/htm
107

Sethi, B.B., Gupta, S.c., Mahendru, RK., & Kumari, P. (1974). Mental health and
urban life: A study of 850 families. British Journal ofPsychiatry, 124, 243
246
South African Yearbook 2000/01 (2001). URL:
http://www.gov.za/yearbook/health.htm
Stromgren, E. (1987). Changes in the incidence of schizophrenia? British Journal of
Psychiatry, 150, 1-7
Sue, D., Sue, D. & Sue, S. (1994). Understanding abnormal behavior. Houghton
Miffiin Company: Toronto
Suleman, T.G., Ohaeri, lD., Lawal, RA, Haruna, AY. & Orija, O.B. (1997).
Financial cost of treating out-patients with schizophrenia in Nigeria. British
Journal ofPsychiatry, 171, 364-368
Thara, R, Henrietta, M., Joseph, A, Rajkumar, S. & Eaton, W.W. (1994). Ten-year
course of schizophrenia - the Madras longitudinal study. Acta Psychiatr
Scand, 90, 329-336
Thara, R, Sucharitakul, D., Mendis, N., & Islam, H. (2001). Schizophrenia: Youth's
greatest disabler. World Health Organization.
http://whqlibdoc.who.int/searo/200 lISEA_Ment_117. pdf
Timms. D. (1998).Gender, social mobility and psychiatric diagnoses. Social Science
andMedicine, 46 (9), 1235-1247
Torrey, E.F. & Bowler, A (1990). Geographical distribution of insanity in America:
evidence for an urban factor. Schizophrenia Bulletin, 16 (4), 591-604
108

Torrey. E.F. (1988). Surviving schizophrenia: A/ami/y manual. Perennial Library:
Harper & Row, Publishers: New York
Van Rensburg, nc.J. & Fourie, A. (1994). Inequalities in South African health care.
Part I. The problem -manifestations and origins. South ~fricanMedical
Journal, 84, 95-99
Vcizquez-Barquero, J.L., Cuesta, MJ., Castanedo, s.n, Lastra, I., Hemin, A. & Dunn,
G. (1999). Cantabria First-episode schizophrenia study: three-year follow-up.
British Journal 0/Psychiatry, 174, 141-149
Warner, R. & de Girolamo, G. (1995). Epidemiology o/mental disorders and
psychosocialproblems: Schizophrenia. World Health Organisation: Geneva
Warner, R. (1994). Recoveryfrom schizophrenia: Psychiatry andpolitical economy.
(Second edition). Routledge and KeganPaul: London
Warner R. (1985). Recoveryfrom schizophrenia: psychiatry andpolitical economy.
Routledge and Kegan Paul: London
Weiden & Olfson, (1995). Cost of relapse in schizophrenia. Schizophrenia Bulletin,
21,419-429
White Paper on Social Welfare (1997). URL: http://www.gov.za/whitepaper/1997
White Paper on the Transformation of the Health System of South Africa, April 1997,
Government Gazette No.1791 0
White Paper on Transforming Public Service Delivery, October 1997, Government
Gazette No. 18340
109

Wiggers, T.H. & Sanson-Fisher, R. (1997). Duration ofgeneral practice consultations:
Association with patients occupational and educational status. Social Science
Medicine, 44 (7), 925-934
World Health Organisation International Consortium in Psychiatric Epidemiology
(2000). Cross-national comparisons of the prevalences and correlates of
mental disorders. Bulletin ofthe World Health Organisation, 78 (4), 413-426
Yaukey, D. (1985). Demography: The study ofhuman population. St. Martin's Press:
New York
Yung, A.R., Phillips, L.J., McGorry, P.D., McFarlane, c.A., Francey, S., Harrigan, S.,
Patton, G.c. & Jackson, H.J. (1998). British Journal ofPsychiatry, 172 (suppl
33), 14-20
Zwarenstien, M., Krige, D., & Wolff, B. (1991). The use ofa geographical
information system for hospital catchment area research in Natal/KwaZulu.
South African Medical Journal, 80, 497-500
110

APPENDIX 1: QUESTIONAIRE GIVEN TO THE 'EXPERTS'
NAME (OPTIONAL): _
MODELLING A COST MAP OF SENSITIVE POPULATIONS FORSCHIZOPHRENIA IN KZN
A.1. Identifying ten of the most important variables of risk in developingschizophrenia.The variables below have been listed randomly. These variables are to be seen astotally independent of each other. Please feel free to discuss and debate this sectionwith others.- age- gender-' education- marital status- seasonality of birth- occupation- socio-economic status- internal migration (e.g. have they moved in last year)- rural/urban location- population density: cities of 1million/ 100 000/ 10 aaa/less
A.2. Ranking the variables:Each person needs to rank these variables independently Le. without discussion.Where 1 is the most important variable in terms of developing schizophrenia; 10 isthe least.VARIABLE RANKINGAgeGenderEducationMarital statusSeasonality of birthOccupationSocio-economicstatusInternal MigrationRural/ urbanlocationPopulation density
111

A.3. Defining the variables:These definitions will then be put into map format.Please feel free to add further definitions and to make comments. Remember that many
b" erterms used are subiective and need to be defined to make them more 0 )Ie Ive.VARIABLE of RISK DEFINITIONAge 15 - 25 ++
26- 55 +Gender Male: 15-25 years
Female: 25 - 35 yearsEducation No education +++
Elementary education (Grade I to 7) ++Marital status Single and divorcedSeasonality of birth Born between July and SeptemberOccupation Unemployed / unskilledSocio-economic LowstatusInternal Migration Relocated to another area rural - urban +++
Relocated to another area rural- rural/ urban-urban ++Rural/ urban UrbanlocationPopulation density City of 1 million people +++
500 000 - 100 000 people ++10000+
MODELLING A COST FRICTION SERVICE MAP IN KZN
B.1. Accessibility: Cost Friction Service Map:In order to create the above map which aims to investigate the potential access for allof KZN people to clinics and hospital, per district; the term 'access' needs to defined.These definitions will then be put into map format.The variables that have been included are directed at the general public, could youcould think of any more that may be more specifically related to psychiatricpopulation (especially people with schizophrenia.
• distance to hospital• number of hospital and clinics• road access• physical obstacles in between s.a. major river/nature reserve• financial cost (travelling costs; hospital costs)• define effort (points allocated to above); decide cut off point where effort too
much•••
Thank you kindly for your time, assistance and co-operation.
Andrea Enslin18-11-01
112
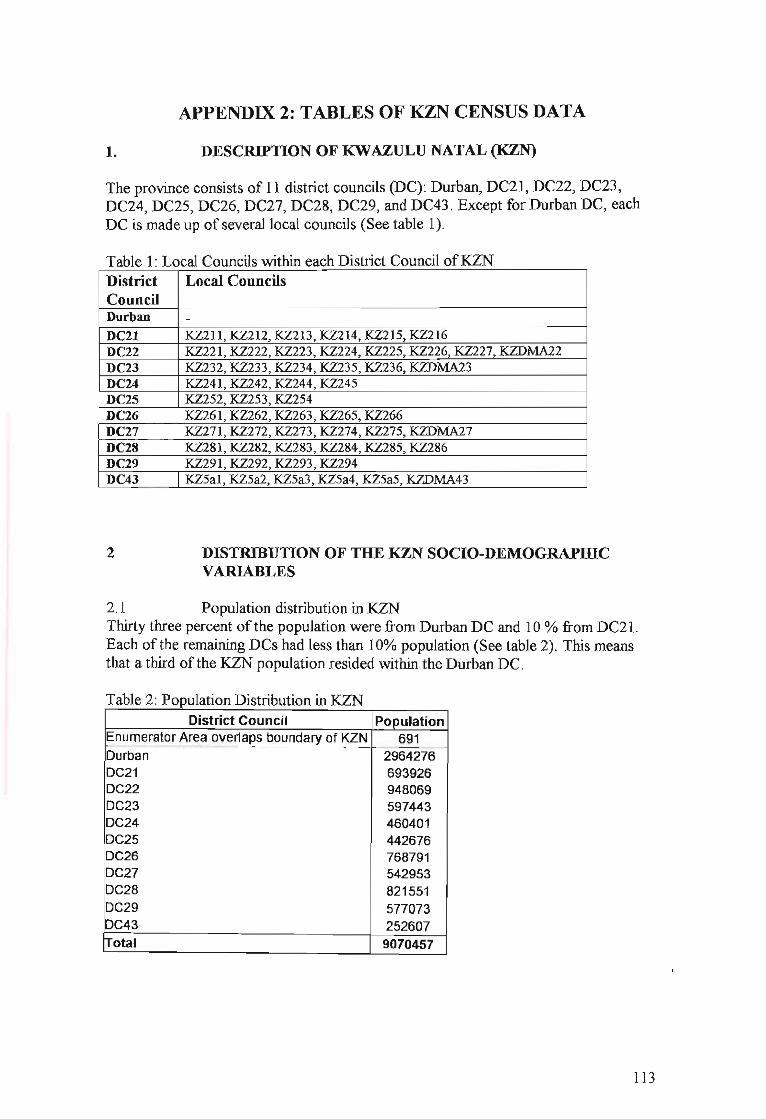
APPENDIX 2: TABLES OF KZN CENSUS DATA
1. DESCRIPTION OF KWAZULU NATAL (KZN)
The province consists of 11 district councils (DC): Durban, DC21, DC22, DC23,DC24, DC25, DC26, DC27, DC28, DC29, and DC43. Except for Durban DC, eachDC is made up of several local councils (See table 1).
Table l' Local Councils within each District Council ofKZNDistrict Local CouncilsCouncilDurban -DC2l ~211,~212,~213,~214,~215,~216
DC22 ~221,~222,~223,~224,~225,~226,~227,~~2
DC23 ~232,~233,~234,~235,~236,~~3
DC24 ~241,~242,~244,~245
DC25 ~252,~253,~254
DC26 ~261,~262,~263,~265,~266
DC27 ~271,~272,~273,~274,~275,~~7
DC28 ~281,~282,~283,~284,~285,~286
DC29 ~291,~292,~293,~294
DC43 ~5al,~5a2,~5a3,~5a4,~5a5,~~43
2 DISTRIBUTION OF THE KZN SOCIO-DEMOGRAPIDCVARIABLES
2.1 Population distribution in KZNThirty three percent of the population were from Durban DC and 10 % from DC21.Each of the remaining DCs had less than 10% population (See table 2). This meansthat a third ofthe KZN population resided within the Durban DC.
T bl 2 PI' D" "b' "KZNa e opu atlon Istn utlOn In
District Council PopulationEnumerator Area overlaps boundary of KZN 691--_...__...._---_..__._----_._.._--_.._._._--_.._-....----_...__.---- --------_._----Durban 2964276DC21 693926DC22 948069DC23 597443DC24 460401DC25 442676DC26 768791DC27 542953DC28 821551DC29 577073DC43 252607Total 9070457
113

2.2 Population density in KZNExamining the distribution of population in terms of density gives a different picture.The distribution of population is still unequal in KZN (see table 1). However, threegroupings are evident. The most dense district was found in the Durban DC, followedclosely by DC22, and then DC21. DC 29 and 28 were intermediate in terms ofdensity, with just over 500 people per square kilometre. The rest displayed a densityof less than 400 people per square kilometre, with DC43 less than 150 people persquare kilometre.
Table 3' Population Density in KZNDistrict Council Density (People per sq km) Population
Durban 1292 2964277-_.._._._---_.. , ..._~-_._._--_.----- ----..- ... -_.....__._-_.. ----_._--
DC21 909 693926I····
_. "-'--_.
DC22 1156 948069DC23 372 597443._..•......_- - . _- ._-_. -_..._--_._.-_ .. --
DC24 234 460401DC25 245 442676OC26 260 768791
.......... , ..........._........
DC27 283 542953I····
DC28 646 821551...._.__....
DC2g 737 577073DC43 140 252607
2.3 Distribution of Gender in KZNFifty-three percent of the KZN population is female (See table 4). Overall, there are 6% more females in KZN than males. This distribution is seen throughout KZN.
Table 4: Gender Distribution in KZNDistrict Council Male Female TotalEnumerator Area overlaps boundary of KZN 310 381 690Durban 1444653 1519624 2964277IDC21 314520 379407 693926DC22 447792 500277 948069DC23 273411 324032 597443DC24 203360 257041 460401DC25 210959 231717 442676DC26 351175 417616 768791DC27 247668 295285 542953DC28 376832 444719 821551DC29 271237 305837 577073DC43 115304 137303 252607~otal 425721S 4813240 9070457
2.4 Distribution of Gender and Age in KZNIn both the female and male age distributions, the 0-14 year age category dominatedoverall and within each DC (See table 5 and 6 respectively). The 15-25 and 36-65year categories tended to be the next highest categories with the 26-35 age categoryfalling slightly lower. In the female distributions, the 15-25 and 36-65 age categories
114
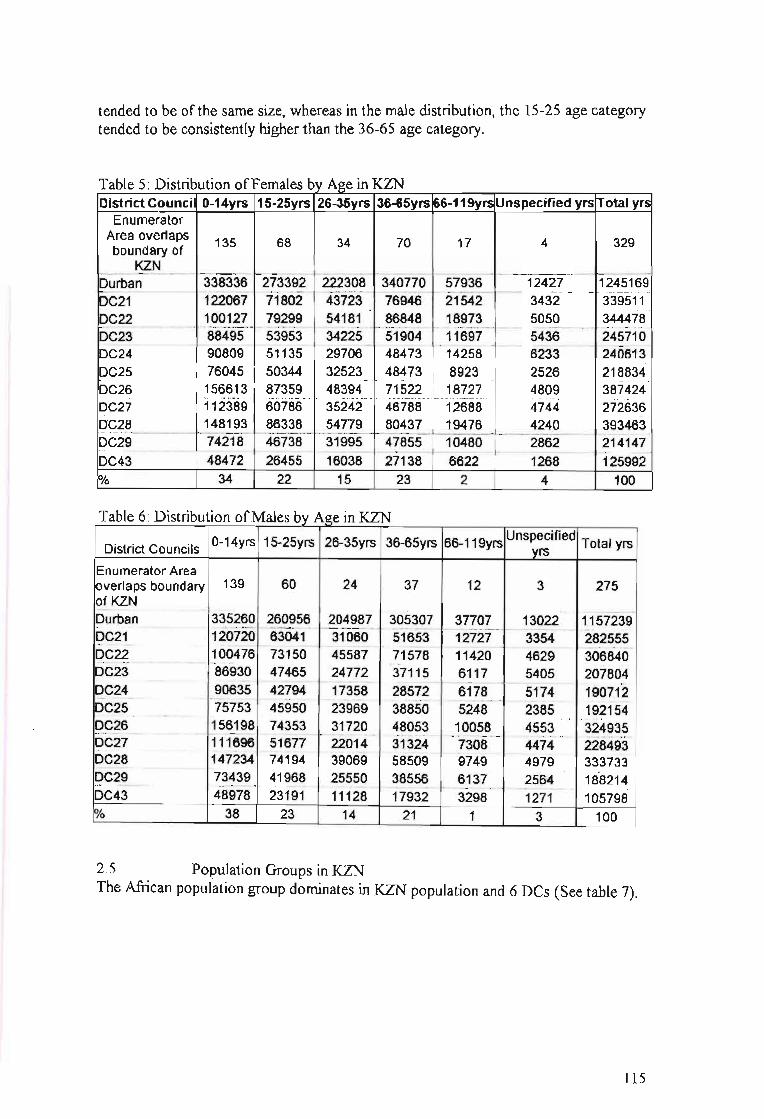
tended to be of the same size, whereas in the male distribution, the 15-25 age categorytended to be consistently higher than the 36-65 age category.
Table 5: Distribution ofFemales by Age in KZNDistrict Council 0-14yrs 15-25yrs 26-35yrs 36-65yrs 66-119yrs Unspecified yrs Total yrs
EnumeratorArea overlaps 135 68 34 70 17 4 329boundary of
KZN...._---_ ..._-----_ ...._-_..- --_..._.-._--_... _ ...._---_..._._- -_....__..•._--_....._._---_ ... _ ..._---_ ..__._---_..__...._---_..._.__._--_...__.._--_.._._._--Durban 338336 273392 222308 340770 57936 12427 1245169f--._- -......... . - ..- ...•.- - .........•....- ..-_. - .....•..-. ......•.••......•.- .......•.....•- ..•.•.....-.-..-_.•.....•-- - - ..---.-. ..-•.- -.- - .•.- ..- .....•.- ..---.- - .•.-
DC21 122067 71802 43723 76946 21542 3432 339511
l:>.~?-?-_ .._._...._.__ .1.gQ~_?.?.. _Z~?~~_. __.?~)~.~ ... _~_~~~.~_. 1~~:!..~__ ?Q?-Q ..__~~!!!.~DC23 88495 53953 34225 51904 11697 5436 245710
. -~- _- ...•............._... . __ -... . _....... . _ _.~._ .._._ _ -..' .-.-..-. __ -.__ - -- ..•.........._ - .
DC24 90809 51135 29706 48473 14258 6233 240613DC25 76045 50344 32523 48473 8923 2526 218834
.•_._. .•. .... ._. ... .,.,__ " ... .__._... .•. ...._. ._. ...__ ._ .•__ ·•._··v····__······,·.··.··.···
DC26 156613 87359 48394 71522 18727 4809 387424DC27 112389 60786 35242 46788 12688 4744 272636DC28 148193 86338 54779 80437 19476 4240 ····393463-
I:c.._c.c.:····_·· ·····_·_·_+_·_·_····_· I·__·_---.-.----.-~-- - ..----- ---------.-. ---..-.------ -.-.----.--- --- -.... . - .DC29 74218 46738 31995 47855 10480 2862 214147
..........._ _ ~.~ .
DC43 48472 26455 16038 27138 6622 1268 125992Yo 34 22 15 23 2 4 100
Table 6: Distribution ofMales by Age in KZN
District Councils 0-14yrs 15-25yrs 26-35yrs 36-65yrs 66-119yrs uns~~ified Total yrs
.-..~:~'!jr!f ·!~1i~:·· f:~~·:{~lt-"ir~~21;i. I············
86930 47465 24772 37115 6117 5405 207804- .. ---. ---_.. _.__._--_ 1- _---_ _. ...-.- ----- -.------ ---. ---- --.-.---... .
90635 42794 17358 28572 6178 5174 190712-' _ - _...... . .......•....... .•...............•...•.- .....•........................ _ .
75753 45950 23969 38850 5248 2385 192154.... 156198 74353 31720 48053 10058 4553 324935
. -.- _--_.~._-- _ _._-_ __.- _._---_ -~._ _.~_.- ._'._~~ -------_. ,._._-_ _---_._._- . --- _.- '-. - _.... . .. _- ~~_ __ _.
111696 51677 22014 31324 7308 4474 228493- _. _.-. ---"--. -- .. _. -_._ _. ..-_ _.
147234 74194 39069 58509 9749 4979 33373373439 41968 25550 38556 6137 2564 188214
.......•.....•.....•..•..................._ - _. _................ .............•.........._.......•_ _ _ - _•...._... . •....... . .
48978 23191 11128 17932 3298 1271 105798
Enumerator AreaIoverlaps boundary 139~!~NDurbanDC21DC22DC23DC24..- - .._...-._.
DC25DC26.................._--..
DC27DC28pC29DC43
60 24 37 12 3 275
38 23 14 21 1 3 100
2.5 Population Groups in KZNThe African population group dominates in KZN population and 6 Des (See table 7).
115

Table 7: Distribution ofPopulation Groups in KZNDistrict Councils African Coloured Indian White Unspecified TotalEnumerator AreaIoverlaps boundary 649 3 7 26 5 690~1_~N ~. . ----- - -------- ----- -- -------- _.- " - ----- ~ --_ ..I:?LJr~~n __ 1~_!~~~~ __ J~~_~~_~~~?~~ ~~~~~?_ 25422 2964277DC21 619265 5590 28624 36879 .~~~~______ _~~~~~~_
£?9??______________ _?~~~_~~ ~~Q~~ ~?~~? ~.?19~___ 7115 ..... _~~_~969DC23 553526 3119 18252 17893 4654 597443
... . _--.- ..•-..•.-.....•.. _--_.....•._--_.- ..... .- ..---_.-....
DC24 435432 2277 8299 10769 .... 3.~_?~______ __~_~_Q~Q!_DC?§ __~~_~~~~ ~~~~ 1_~~~~ ~~~~_~______2?~~__ ._~~?~!6DC26 745618 1237 551 17583 3802 768791............._.•........-•.........•..-.... . .".-.•._---_.............•.- --..... ..._-_ __........•.._ _...•._ _ -_ _-_.._.__ _ .
DC27 534465 726 392 4863 2~~.!___ __~~?~~3
DC28 759392 3518 10721 38675 9244 821551.... ._....._._.._~-_._-- -_ ..._._....---._-_.. -------_.~---_.- --_ ..._------_....__.-. ---_...__._._--_.._------_ .....-.... ... .. -_.- ..__.•..__..--_ ..- ...
DC29 510986 2110 42872 10509 10596 577073.......................--. ..···c···::··::::·::::··:::··:····I·· - - - - - -- .
DC43 235251 7750 690 6897 2018 252607trotal 14828982 254209 1704400 1203009 149624 18140224~ 82 1 9 7 1 100
2.6 EmploymentJust less than 30 % KZN work force is employed. In the Des outside ofDurban, thepercentage ofemployment varies from 7 to 23 %. Throughout KZN, a range of 9 to14 % of people are unemployed, 27 - 38 % are not working, and between 30 - 46 %were within the unspecified category.
Table 8: Employment Distribution within KZNDistrict Councils Employed Unemployed Not Working Unspecified Total
Enumerator Areaoverlaps boundary 0KZN
43 34 275 339 691
887377 2964274........._----_._ .
281561 693935...._ __ . _ _- _.....•
323749 9480412442~f4 ..... -- ···597434
198809 460437...- __.-._.. -. .._ __._._ _-- ..__ .
168861 442678347807 ·768782 ..
......_. __ .__.__ _--
250174 ···542954-344975 . --821-545215967 .. ..... ·57'7086
110179252594·····
852940 409906 814051--_.._----- _... -- .._._-------_._-- ....._-_._._-_ ..._....._- _ .._---
92116 67414 252844216110 133391 -27479175348 70749 207092
..... ·--389S:3--------4948-6-------- ············-17319-4 .
83074 ·····Ki1s4- -133590. -"-'--" .
69711 86410 264853.··4cfHs--- ----4s92<f---20574410'69'1"0--' ··~······-86969 -. 28269'1 .-.--97277 63452 20039034990------25375---- -----82050
Durban........... _._._ _... _..... . _ .
DC21DC22
.._..._-' ...- ---_.~-_ .._--------,-
DC23DC24DC25
......_--_._-- -,.._----- - ---_...
DC26DC27DC28DC29DC43
Total%
1707547 1097219 289129219 12 32
3373702 906976137 100
2.7 Education in KZNThe range ofthose without education in KZN varied from 12-35 % (mean=24),between 25-38 % for those with grade 1-7 to 17-44 % (mean=27), for those with
116

grade 8-12, and 1-5 % (mean=2) for those with post-matric qualifications (See table
9).
Table 9· Breakdown ofEducation in KZNDistrict No Gr 1-7 Gr 8-12 Post- Other Unspecif Less Total
Councils Schooling matric Qualifica ied than 5tions years old
Enumerator 196 269 99 7 2 16 101 690
IAreaIoverlapsboundaryk?!Jgt:~(" ,,_,," -- ----~ ------ ,,- --- ------- --- ----- -~--- ---- --- ----- --------- -
279410 2960783Durban 354473 733486 1309038 127515 27396 129465........................ ............
16426Cf "'246961 . 162556 10037 3075 21486 85100 693476DC21DC22 166415 264071 345166 30349 7652 40623 9303T 947306-"'~'" ..._._----. ----_.-.- -----_.,.-. .... ---_ ...----- ._, .._-----........ .., .... .- .- ---_..._---_.-. - .- ._-_.,._-_.. .. -._~ .
74605 596720DC23 134941 189367 163583 6882 1437 25904
f5348S" 1372"79" "86359.....
4001" 1136 1"5763- 61957'--'" 45998'3·'DC24
53252 '''''442318...
DC25. 73690 137323 152338 9470 2587 13658, .. --_ ...----_........._.. -'_'-._-- .....,.... ......... ---_._._¥-..._----- ._--_._----_._- -----_..•....._............ .__...
768079DC26 205141 253802 171455 7008 2570 22298 105805... ..--_._.__... -..__...... -_......-..._¥._._._...
"'91321.... ... . .._....•._..-_...__._..•._....~--_ ....__ .
DC27 192542 164590 2769 1116 12574 77682 542594---...
DC28 216607 250146 196781 13175 3013 34557 106612 820890......... -- . .. - ----_._ .._, ._.----_. ---_. -- ,- _.- ,.~ ...,-.- .... --_....~--_._._-- --~._ ..--.- .- ..-•...
57639"4--DC29 142818 188032 145255 5845 1702 23317 69425
... -.-....•...-
2827.. " -
-252282DC43 56880 96272 54236 821 8383 32863
!rotal 1861449 2661599 2878187 219886 52506 348028 1039842 9061516
Yo 21 29 32 1 2 4 11 100
2.8 Occupational Categories in KZNElementary occupations (30 %) is the dominant occupational category within KZN(See table 10).T bI 10 0 f I C t . KZNa e ccupalona a egones m
.: -g IIIIII Ill.!!.!! Q. III CIl 'C
~~iii 0-'" iii~ c_.!! cC'llC'll CIl.c~~ 'C i III 'CCIlC'll
.socu;U c·~TL§ 'C~CIll!! C'lIO
u·- 0 ~ u cn ...... c ...... li.5 l!!.- u :!~-;;~ ~iiii
"'c ~·2~ gi... .- • as 0 as- CIlCIl .- III III ~l!!E~ .i-t: _.c 0 -1ii:::l .- CIl·- c <3 c III III :liiGIi='"
cu
_0
•- 0 g'1Il ~ as.casCll CIlCll'C1Il Cl) .;: 'C 0 ... ,; ~ C'lIC'lIas ~G ...
Co g'Co CI)~CCll ClC~ 0_ o:Elii..I 0 E ~C'lIm
CIl -u... C'" C'lI C'lI e- Wono C'lIQ. ... 0
Dbn 33559 82179 73838 63102 72121 8753 106981 77786 172444 690763DC21 2565 7621 4797 3626 7236 6001 10348 6113 29277
..............._, ._.
77584DC22
--_ .. -~_.-----~--- _.~- ,--~ •.. -- --- ---- ._---- --_ .. --_..- --5700 19661 13622 11622 17364 11332 22432 17430 59484 178647
DC23·~:~1~ ..·[i~~.~_
3293 2788 5350 2779 9114..
8392 18501 58865DC24 1629 1432 3101 3269 3385 2441 11890 32497
_..._--_...-....--.. .. --_._------ -_._._----_._-
DC25 2066 7714 3987 3753 6585 2469 14341 9271 18963 69149DC26 1255 -7833 4082 2621 6048 5513 '76'44 4950 19094 59039DC27 750 4573 1519 1381
....
3860 3522 4542 2591 10534 33272DC28 2760 11464
.__._,-_._---- .~ .._----, ._._- "
6599 5417 7871 4452 11824 9303 25070 84759,............_....
DC29 1846 5553 3570 2793 6052 5086 '11"541 10200 34040 80681DC43 781····· 2342 1520 986 2502 4346 2761· 2316
_.- --~
12588 30142Total 54051 160175 118459 99523 138093 57526 204916 150795 411898 1395436
% 4 11 8 7 10 4 15 11 30 100Note. Enumerator Area overlaps boundary ofKZN category has been OIDltted
117

2.9 IncomeinKZNThe category ofno income (63 %) is at least six times greater than all the othercategories.
. KZNfInT bl 11 Pa e ercentage Istn ution 0 come m
<= ~al
<= <=
hI
lO::... - <= <=I I I I I I .... ;i ·0... '0 g <= on .... ....
~~.... .... .... .... .... <=
~ ~'C <= I I g ';§ M .... .... <=~
<= <= <= <= <= g <= <= <= <=... I <= <= <= on <= on <= on <= <= <= \Cl~ '" ...
'" 0 ....~ ~
....~ ~ ~ ~ ; .... = 0
is on on on <= ....u Z ~ ~ .... r'l ..,. \Cl CXl .... ~ r'l ;;J !-<
[Overlap* 75.1 2.6 6.4 1.0 0.8 1.3 0.7 0.4 0.4 0.2 0.2 0.1 0.1 0.0 10.7 100._-------,._- -_.~. -_.~._- --_. -----~.- -- -- --- -._--_... -~_._-- ---------- ."--"."---' ._-..... - .. ~ ........-....-...._....-Durban 53.8 2.0 6.8 5.9 6.1 5.4 3.1 2.0 1.8 1.0 0.7 0.4 0.2 0.1 10.8 100
10.9.. _-_.......... ........,...... ...... _.- .... ....... , •....
-6+16:~._ ......
DC21 68.9 2.7 3.4 2.0 1.9 1.0 0.6 0.5 0.3 0.2 0.0 7.6 100-_.__ .-
DC22 55.1 3.0 9.4 4.7 3.7 3.3 1.9 1.2 1.1 0.6 0.4 0.0 15.3 100
~-~~~:=--.._-_ ....- -_...- -_..._- .... -_ ...- --_._-- _._... __ ........... --.. -_... ---_... __ ...... ..._-_ ... ,--- .- ..... ".
65.5 2.1 7.6 3.3 2.2 1.8 0.8 0.5 0.6 0.2 0.1 0.0 0.0 0.0 15.2 100... _...._.... ..._._......... .~, ...... ............... ............... ..... .................... 0·- ••••·••••• ·•• ·••••. ...._.. ~.~._-.- .. ................_.... ......... ....._...
._.~._...-_.-._- , .•..........- .._._......•...- ..._,_._._......
DC24 74.0 2.7 8.6 1.9 1.2 1.0 0.6 0.3 0.4 0.1 0.1 0.0 0.0 0.0 9.0 100-_._._ ...._..- ..._.- ._ ......•..•..........
»~~?- 66.2 2.7 8.5 4.4 2.9 2.4 1.4 0.9 0.8 0.4 0.2 0.1 0.0 0.0 9.0 100--_._.. -_ .._- ._- - -_._. -- ._--_._.~ -' ._-- ----_._-- - ------_.- _........_.... .....- -I· .•....- ..._.....-.' ..._.
DC26 77.1 2.5 7.2 2.1 1.4 1.2 0.6 0.4 0.3 0.1 0.1 0.0 0.0 0.0 6.8 100..........._. _ . ............... ..... ...... ..... .............._......... ..........._....... 1-· -_........-... ...... . .•.•....•.__..... ,-- ......-.......
~~7 81.1 2.5 6.6 2.0 1.4 1.0 0.4 0.2 0.2 0.1 0.0 0.0 0.0 0.0 4.5 100........ ..._ .. .........._., ..........._. _......
IJ>C28 67.6 1.9 8.2 2.7 1.9 1.7 1.0 0.7 0.7 0.3 0.2 0.1 0.1 0.0 12.7 100~-9:~
.._..._...._._-~ -- - -,._ ...._..__. ...._...- ...............
!DC29 64.? ~.~ 4.7 2.4 1.7 0.8 0.5 0.5 0.2 0.1 0.1 0.0 0.0 10.7 100. . .. I ............. ......__...._.. ........ ......_--. .... ....._.
iDC43 65.1 4.7 10.2 2.6 1.5 1.2 0.6 0.4 0.3 0.2 0.1 0.0 0.0 0.0 13.1 100rrotal 63.4 2.4 8.1 4.1 3.4 3.0 1.7 1.1 1.0 0.5 0.3 0.2 0.1 0.0 10.7 100
*Enumerator Area overlaps boundary of KZN category
2.10 Distribution ofDisabilities in KZNEach form of disabilities is fairly evenly distributed among the Des.
Table 12: Disabilities in KZN<#:>"0
.... ..!:: -; .... 40/
CJ·... .....~
-; CS ~5 -;'C CJ CJ..= ....-=
40/ .... CJ~ § <#:> Q,= 401 0ell
~.... Q 401 .... ~ <#:> E-c=u == E-c<#:> ........ Q
"0=
otal 19826 81866 13990 45743 4823*Enumerator Area overlaps boundary of KZN category
2.11 Marital StatusThe majority of the people within KZN have never been married (See table 13).
118

Table 13: Marital Status
" ::::: c:Q)
:~ Cl) ca 0_.!! 'i: i::: +=u·- ... o~ -tic: Q) 3= ~ calIS 0 Q)O 3= -,- u 0 ;:~c: :E ...- 'i: ;: -" 0" Cl) 0Cl) ~ Q).- ....-
~~.- 0 ...'i: Qi lIS" c: I-
°0Q) :El!> ;~ <i.Q) I-Z :E z
Enumeratorreaverlaps 16 691undary of
KZN---.- -- _. ----- ---
Durban 187425 92373 51671....
DC21 48948 21947 434DC22 63419 29014 1142
."...._- ----- ._--- .. _._. - ......_._-DC23 43957 1673 303.. '_ ..... .........._...-......._-*. .. _.._.........•... .....
DC24 34124 15248 160DC25 32293 10483 318
4_-'-· --- --.-._-- ._- _. -_._~- -- --- ..
DC26 58642 17263 217DC27 41724 14369 226DC28 607821 19098 356....._........__ ...-..... . _._----_.- ._,-- -- .._....
DC29 41503 15145 316..._..._-. - .-.- _...... --
DC43 17780 7268 1421atal 630650 258956 8785% 7 3
2.12 Year MovedTwenty percent of the entire KZN population moved within 1991-1996. Most of thatmobility occurred within the Durban DC (See table 14).
Table 14: Internal nng ation within 1991-1996District
Durban 21 22 23 24 25 26 27 28 29 43 I!>N>Councils
\0 ...... }~\n N 0\ t- o t- \0 '0 t- 0\ \0 v
('f') ...... t- oo '0 ...... N N t- ('f') 0\........~ ...........'0 \0 0\ '0 00 '0 0 v ...... 0 \0
0 0\ ...... \0 v v N 00 t- 0\ ('f') ,.''0'', .'0\ 00 N t- ('f') 00 \0 N 00 \0 ('f') ~
% 54 5 13 5 2 5 4 2 5 4 2 lOO"
119