Embed Size (px)
Citation preview
Scales Corporation Limited Interim Report 30 June 2016

The businesses growingScales Corporation
Food Ingredients
Storage & Logistics
Horticulture
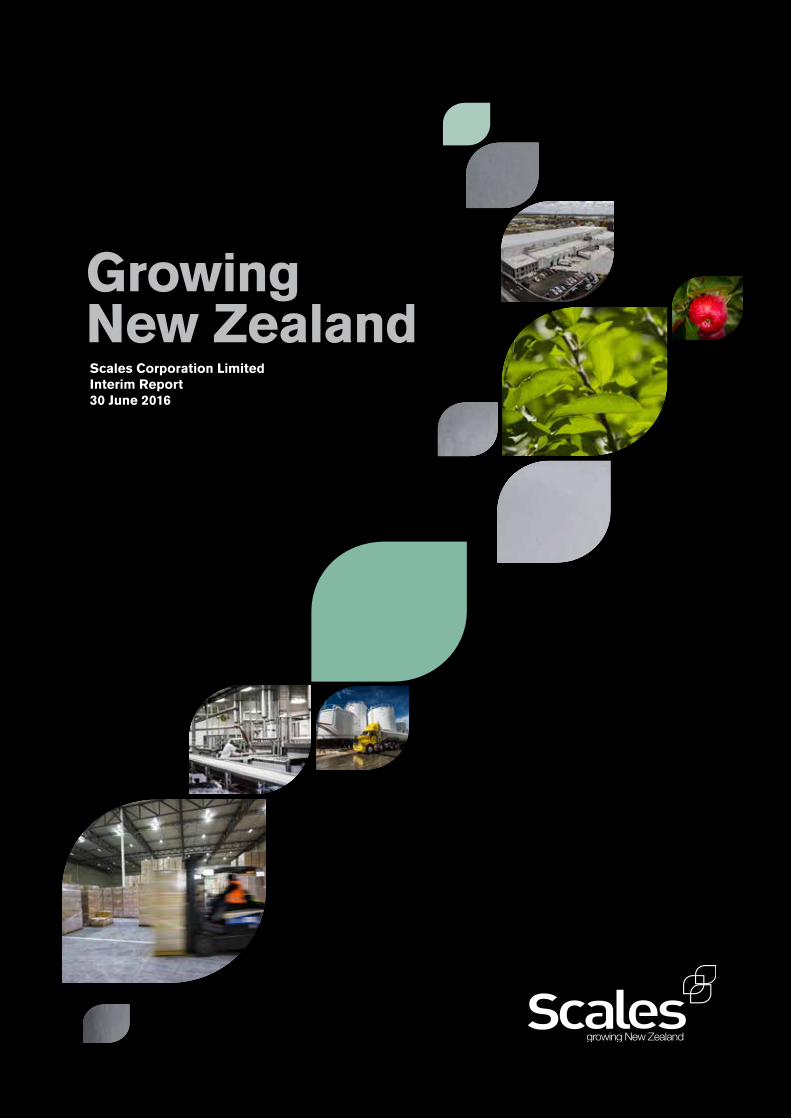
National coverage,global presence
5Interim Report - June 20164 Scales Corporation Limited - www.scalescorporation.co.nz
Contents Directors’ Report 6
Auditor’s Review Report 9
Financial Statements 10
Directory 23
Directors’ Report
Highlights
Highlights of the interim result include increases in EBITDA, EBIT and Net profit after tax, with all three measures up 3 per cent on the 2015 first half results. Total revenue, at $210 million, is a 30 per cent increase on the prior comparative period. This increase is a reflection of trading increases in all divisions, and of the impact of the full consolidation of Fern Ridge Produce Limited in the current period.
Our results have also been affected by recent changes in accounting standards governing the accounting treatment of apple trees. The impact of these changes on the prior and current financial years is outlined in the notes to the accounts.
Other highlights in the interim results are:
• Mr Apple export volumes, from our own orchards, up 12 per cent on the record 2015 volumes, to 3.55 million TCEs, including a 14 per cent increase in volumes of premium apples to 1.66 million TCEs
• Petfood ingredients sales volumes up 24 per cent on the previous corresponding half year.
• Strong performance from new initiatives within the Storage & Logistics division.
• An increase in our stake in Fern Ridge Produce Limited to 72.88 per cent (from 50 per cent).
In addition, we have welcomed China Resources Ng Fung Limited as a long term supportive shareholder. The board looks forward to China Resources’ support in the significant Chinese market, and also to the contribution of Weiyong Wang, China Resources’ representative, who was appointed to the Scales’ board in June 2016.
On the balance sheet our strong financial position continues to improve. Net tangible assets per share as at 30 June 2016 were $1.28 compared to $1.07 as at 30 June 2015, and the ratio of net debt to equity has reduced to 27 per cent from 31 per cent as at 30 June 2015. Average net debt (being the average of the 30 June 2016 and 31 December 2015 net debt balances) at $34.2 million is up slightly on average net debt as at 31 December 2015, but still represents a $10.3 million improvement over average net debt recorded as at 30 June 2015. The increase over the past six months reflects the additional export volumes and seasonal timing of sales and debtor collections.
Divisions
Horticulture
Total export volumes for the division, including those from Fern Ridge, were a record 5.36 million TCEs. Of this total, Mr Apple produced another record crop which, at 3.55 million TCEs, represents the achievement of a volume target that we had set for 2020. This is another great result from the Mr Apple team who have once again exceeded our expectations. Premium varieties saw an overall increase of 14 per cent on 2015 volumes, with NZ Queen volumes in particular up 60 per cent. These increases are a direct result of the historical investment in orchard plantings and also in reflective cloth. We continue to invest in our brands to consolidate our position as one of the leading Southern Hemisphere premium fresh apple exporters.
The increased investment in Fern Ridge further enhances collaboration in the New Zealand apple industry, improving sales networks and supply relationships.
Storage & Logistics
New divisional initiatives, being the Auckland coldstore, Liqueo expansion and air freight operation Balance Cargo, are performing well and made good contributions to the interim
result. Particularly pleasing is the performance of the Auckland coldstore which, from a standing start, has been integrated seamlessly into the cold storage network and is operating at expected operational and financial levels.
Our core cold storage businesses operated at a lower level of performance than the record prior comparative period. This was a result of a change in service requirements, particularly from the meat industry. However by the end of the year it is expected that the overall EBITDA from this division will be consistent with 2015.
Food Ingredients
Divisional EBITDA increased by $1.2 million, or 33 per cent, on the prior year as a result of a 24 per cent increase in sales volumes in Meateor Foods. Diversification of both raw material procurement, and our protein range, is continuing to deliver positive outcomes for Meateor. Favourable apple growing conditions, which have seen strong apple export volumes, have reduced supply to Profruit, our juice business. We expect the Food Ingredients division to produce an EBITDA that is in line with 2015.
Outlook
The outlook for Scales’ remains positive. We have demonstrated resilience in key divisions with increasing crop sizes and diversity of customers and markets at Mr Apple, predictable results from our Storage & Logistics division, and increased sales volumes at Meateor.
Signals from our Horticulture division remain positive. Investments in premium orchard varieties and crop yields are delivering in the form of larger than expected crop sizes. The wider range of varieties and markets we supply also provides a pathway to improved price resilience.
We’ve been investing in our Storage & Logistics division and are seeing the investment paying off with strong performances from new initiatives helping to offset industry headwinds in the more traditional aspects to the business. Our Food Ingredients division continues to deliver strong improvements in volumes establishing us as a critical supplier of food ingredients.
The company’s balance sheet continues to be strong enabling us to take advantage of organic and inorganic growth opportunities. At the moment, we’re finding the best returns from investing in our own businesses. We expect to invest $16.7 million in capital expenditure during 2016, of which approximately $10 million are considered growth projects. This follows on from expenditure of $15.8 million in 2015 of which $11.3 million was for growth projects. These growth initiatives underpin expectations for improvements in earnings beyond the current financial year.
Lastly, the board would like to acknowledge the contribution of our people to Scales’ success. It continues to be the effort, skill and dedication right across the entire team that drives the growth and financial success being achieved.
Jon Mayson Chairman
Andy Borland Managing Director
7Interim Report - June 20166 Scales Corporation Limited - www.scalescorporation.co.nz
DIRECTORS’ REPORT
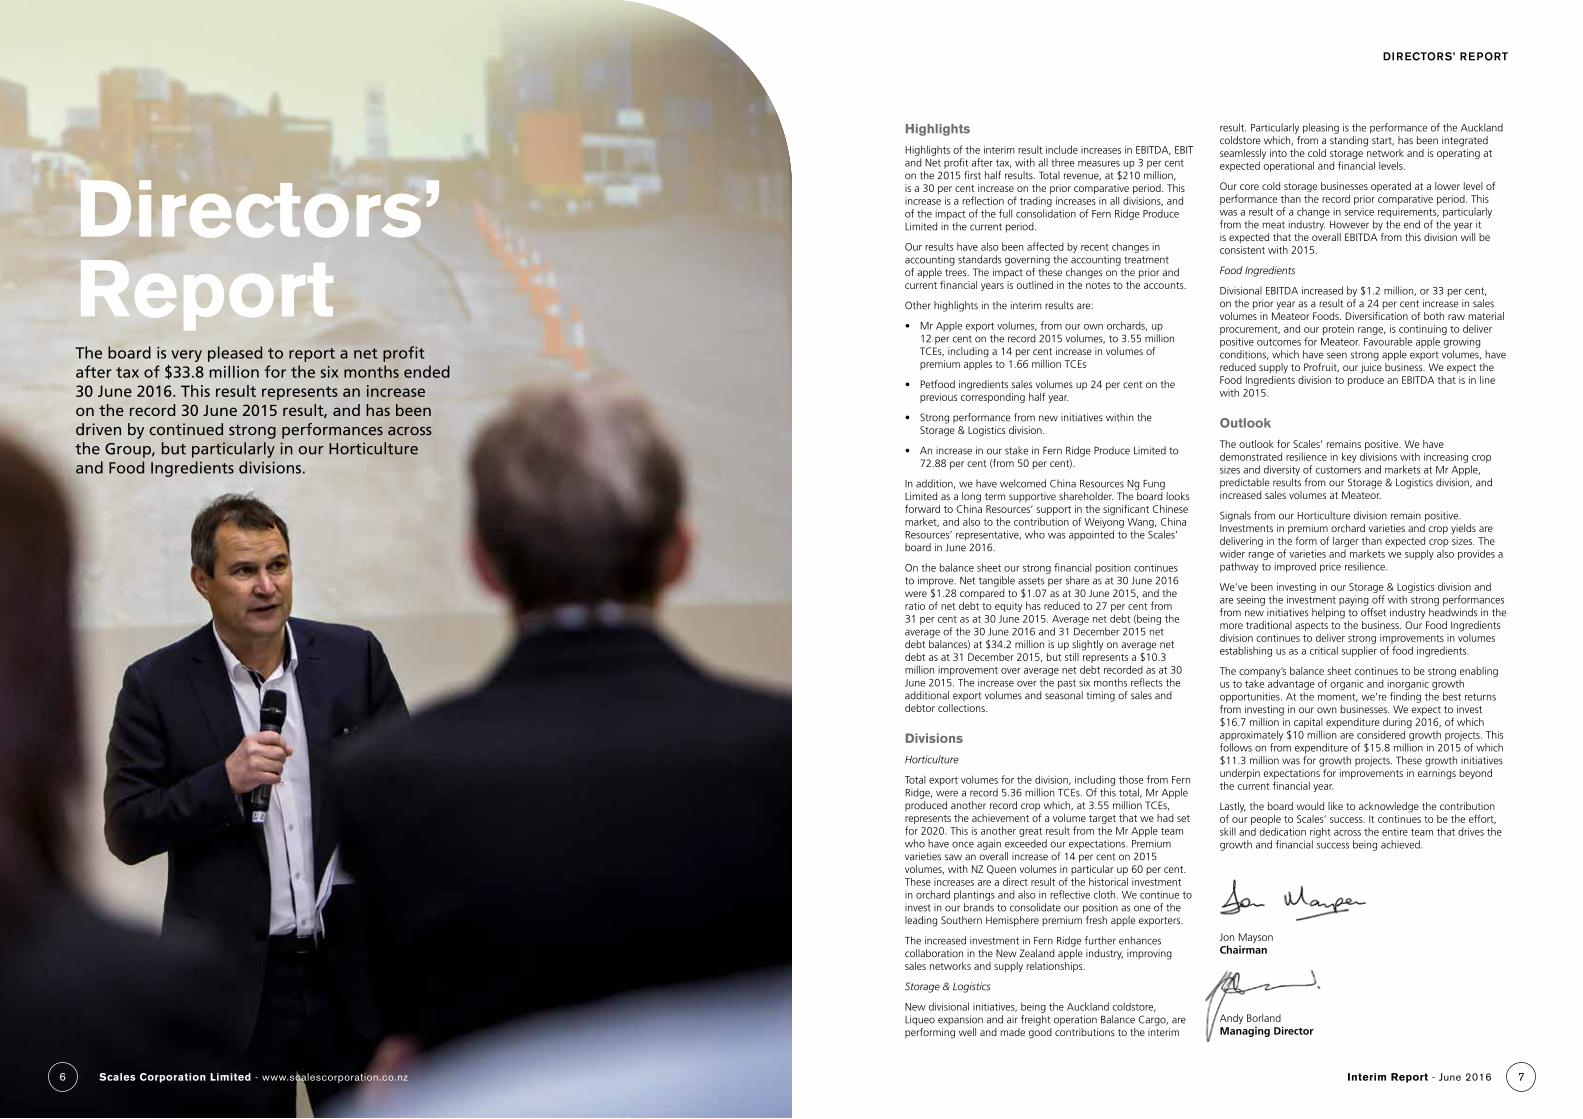
The board is very pleased to report a net profit after tax of $33.8 million for the six months ended 30 June 2016. This result represents an increase on the record 30 June 2015 result, and has been driven by continued strong performances across the Group, but particularly in our Horticulture and Food Ingredients divisions.
Financial Statements
TO THE SHAREHOLDERS OF SCALES CORPORATION LIMITED
We have reviewed the condensed consolidated interim financial statements of Scales Corporation Limited and its subsidiaries (“the Group”) which comprise the condensed consolidated statement of financial position as at 30 June 2016, and the condensed consolidated statement of comprehensive income, condensed consolidated statement of changes in equity and condensed consolidated statement of cash flows for the period ended on that date, and a summary of significant accounting policies and other explanatory information on pages 10 to 22.
This report is made solely to the Group’s shareholders, as a body. Our review has been undertaken so that we might state to the Group’s shareholders those matters we are required to state to them in a review report and for no other purpose. To the fullest extent permitted by law, we do not accept or assume responsibility to anyone other than the Group’s shareholders as a body, for our engagement, for this report, or for the opinions we have formed.
Board of Directors’ Responsibilities
The Board of Directors are responsible for the preparation and fair presentation of the condensed consolidated interim financial statements, in accordance with NZ IAS 34 Interim Financial Reporting and IAS 34 Interim Financial Reporting and for such internal control as the Board of Directors determine is necessary to enable the preparation and fair presentation of the condensed consolidated interim financial statements that are free from material misstatement, whether due to fraud or error.
Our Responsibilities
Our responsibility is to express a conclusion on the condensed consolidated interim financial statements based on our review. We conducted our review in accordance with NZ SRE 2410 Review of Financial Statements Performed by the Independent Auditor of the Entity (NZ SRE 2410). NZ SRE 2410 requires us to conclude whether anything has come to our attention that causes us to believe that the condensed consolidated interim financial statements, taken as a whole, are not prepared, in all material respects, in accordance with NZ IAS 34 Interim Financial Reporting and IAS 34 Interim Financial Reporting. As the auditor of Scales Corporation Limited, NZ SRE 2410 requires that we comply with the ethical requirements relevant to the audit of the annual financial statements.
A review of the condensed consolidated interim financial statements in accordance with NZ SRE 2410 is a limited assurance engagement. The auditor performs procedures, primarily consisting of making enquiries, primarily of persons responsible for financial and accounting matters, and applying analytical and other review procedures.
The procedures performed in a review are substantially less than those performed in an audit conducted in accordance with International Standards on Auditing (New Zealand). Accordingly we do not express an audit opinion on those financial statements.
Other than in our capacity as auditor and the provision of taxation services, we have no relationship with or interests in Scales Corporation Limited or its subsidiaries. These services have not impaired our independence as auditor of the Group.
Conclusion
Based on our review, nothing has come to our attention that causes us to believe that the condensed consolidated interim financial statements of the Group do not present fairly, in all material respects, the financial position of the Group as at 30 June 2016 and its financial performance and cash flows for the period ended on that date in accordance with NZ IAS 34 Interim Financial Reporting and IAS 34 Interim Financial Reporting.
24 August 2016
Chartered Accountants
Christchurch, New Zealand
9Interim Report - June 20168 Scales Corporation Limited - www.scalescorporation.co.nz
INDEPENDENT REVIEW REPORT
CONDENSED CONSOLIDATED STATEMENT OF COMPREHENSIVE INCOME
for the six months ended 30 June 2016
NOTE UNAUDITED AUDITED
Six months ended 30 June 2016
Six months ended 30 June 2015
Year ended 31 December 2015
$’000 $’000 (Restated)
$’000 (Restated)
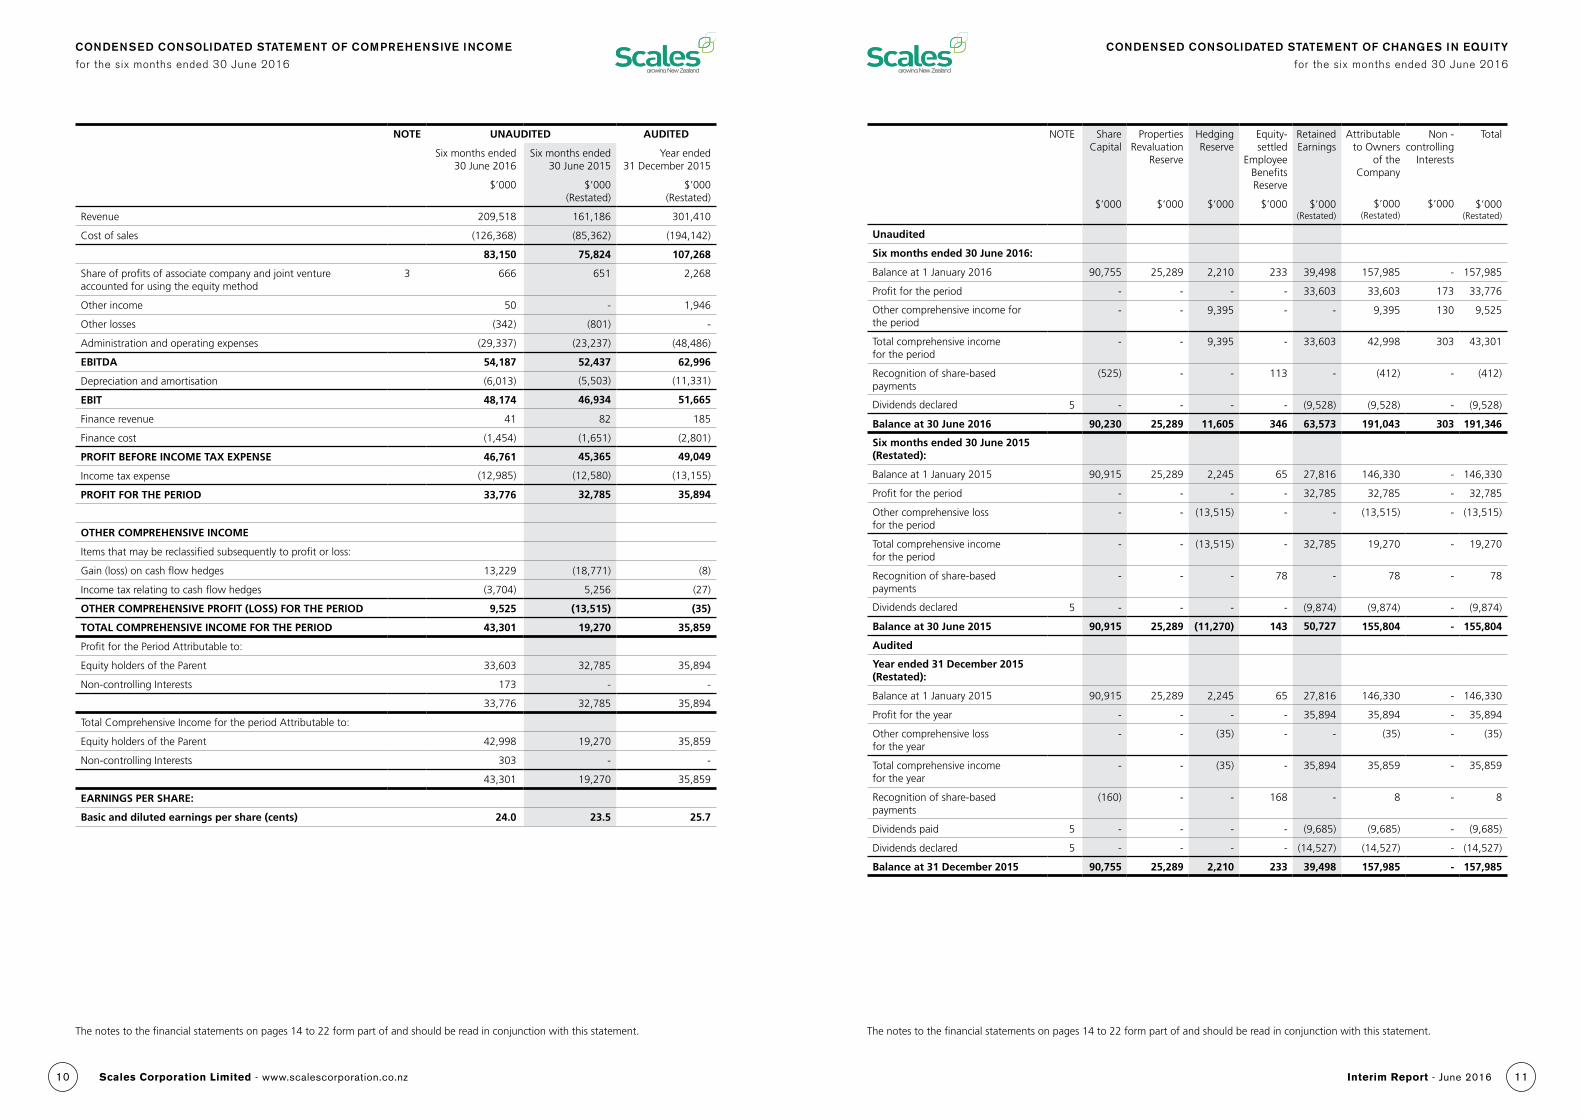
Revenue 209,518 161,186 301,410
Cost of sales (126,368) (85,362) (194,142)
83,150 75,824 107,268
Share of profits of associate company and joint venture accounted for using the equity method
3 666 651 2,268
Other income 50 - 1,946
Other losses (342) (801) -
Administration and operating expenses (29,337) (23,237) (48,486)
EBITDA 54,187 52,437 62,996
Depreciation and amortisation (6,013) (5,503) (11,331)
EBIT 48,174 46,934 51,665
Finance revenue 41 82 185
Finance cost (1,454) (1,651) (2,801)
PROFIT BEFORE INCOME TAX EXPENSE 46,761 45,365 49,049
Income tax expense (12,985) (12,580) (13,155)
PROFIT FOR THE PERIOD 33,776 32,785 35,894
OTHER COMPREHENSIVE INCOME
Items that may be reclassified subsequently to profit or loss:
Gain (loss) on cash flow hedges 13,229 (18,771) (8)
Income tax relating to cash flow hedges (3,704) 5,256 (27)
OTHER COMPREHENSIVE PROFIT (LOSS) FOR THE PERIOD 9,525 (13,515) (35)
TOTAL COMPREHENSIVE INCOME FOR THE PERIOD 43,301 19,270 35,859
Profit for the Period Attributable to:
Equity holders of the Parent 33,603 32,785 35,894
Non-controlling Interests 173 - -
33,776 32,785 35,894
Total Comprehensive Income for the period Attributable to:
Equity holders of the Parent 42,998 19,270 35,859
Non-controlling Interests 303 - -
43,301 19,270 35,859
EARNINGS PER SHARE:
Basic and diluted earnings per share (cents) 24.0 23.5 25.7
The notes to the financial statements on pages 14 to 22 form part of and should be read in conjunction with this statement.
CONDENSED CONSOLIDATED STATEMENT OF CHANGES IN EQUITY
for the six months ended 30 June 2016
NOTE Share Capital
Properties Revaluation
Reserve
Hedging Reserve
Equity-settled
Employee Benefits Reserve
Retained Earnings
Attributable to Owners
of the Company
Non - controlling
Interests
Total
$’000 $’000 $’000 $’000 $’000 (Restated)
$’000 (Restated)
$’000 $’000 (Restated)
Unaudited
Six months ended 30 June 2016:
Balance at 1 January 2016 90,755 25,289 2,210 233 39,498 157,985 - 157,985
Profit for the period - - - - 33,603 33,603 173 33,776
Other comprehensive income for the period
- - 9,395 - - 9,395 130 9,525
Total comprehensive income for the period
- - 9,395 - 33,603 42,998 303 43,301
Recognition of share-based payments
(525) - - 113 - (412) - (412)
Dividends declared 5 - - - - (9,528) (9,528) - (9,528)
Balance at 30 June 2016 90,230 25,289 11,605 346 63,573 191,043 303 191,346
Six months ended 30 June 2015 (Restated):
Balance at 1 January 2015 90,915 25,289 2,245 65 27,816 146,330 - 146,330
Profit for the period - - - - 32,785 32,785 - 32,785
Other comprehensive loss for the period
- - (13,515) - - (13,515) - (13,515)
Total comprehensive income for the period
- - (13,515) - 32,785 19,270 - 19,270
Recognition of share-based payments
- - - 78 - 78 - 78
Dividends declared 5 - - - - (9,874) (9,874) - (9,874)
Balance at 30 June 2015 90,915 25,289 (11,270) 143 50,727 155,804 - 155,804
Audited
Year ended 31 December 2015 (Restated):
Balance at 1 January 2015 90,915 25,289 2,245 65 27,816 146,330 - 146,330
Profit for the year - - - - 35,894 35,894 - 35,894
Other comprehensive loss for the year
- - (35) - - (35) - (35)
Total comprehensive income for the year
- - (35) - 35,894 35,859 - 35,859
Recognition of share-based payments
(160) - - 168 - 8 - 8
Dividends paid 5 - - - - (9,685) (9,685) - (9,685)
Dividends declared 5 - - - - (14,527) (14,527) - (14,527)
Balance at 31 December 2015 90,755 25,289 2,210 233 39,498 157,985 - 157,985
The notes to the financial statements on pages 14 to 22 form part of and should be read in conjunction with this statement.
1110 Interim Report - June 2016Scales Corporation Limited - www.scalescorporation.co.nz
CONDENSED CONSOLIDATED STATEMENT OF FINANCIAL POSITION
as at 30 June 2016
NOTE UNAUDITED AUDITED
30 June 2016 30 June 2015 31 December 2015
$’000 $’000 (Restated)
$’000 (Restated)
EQUITY
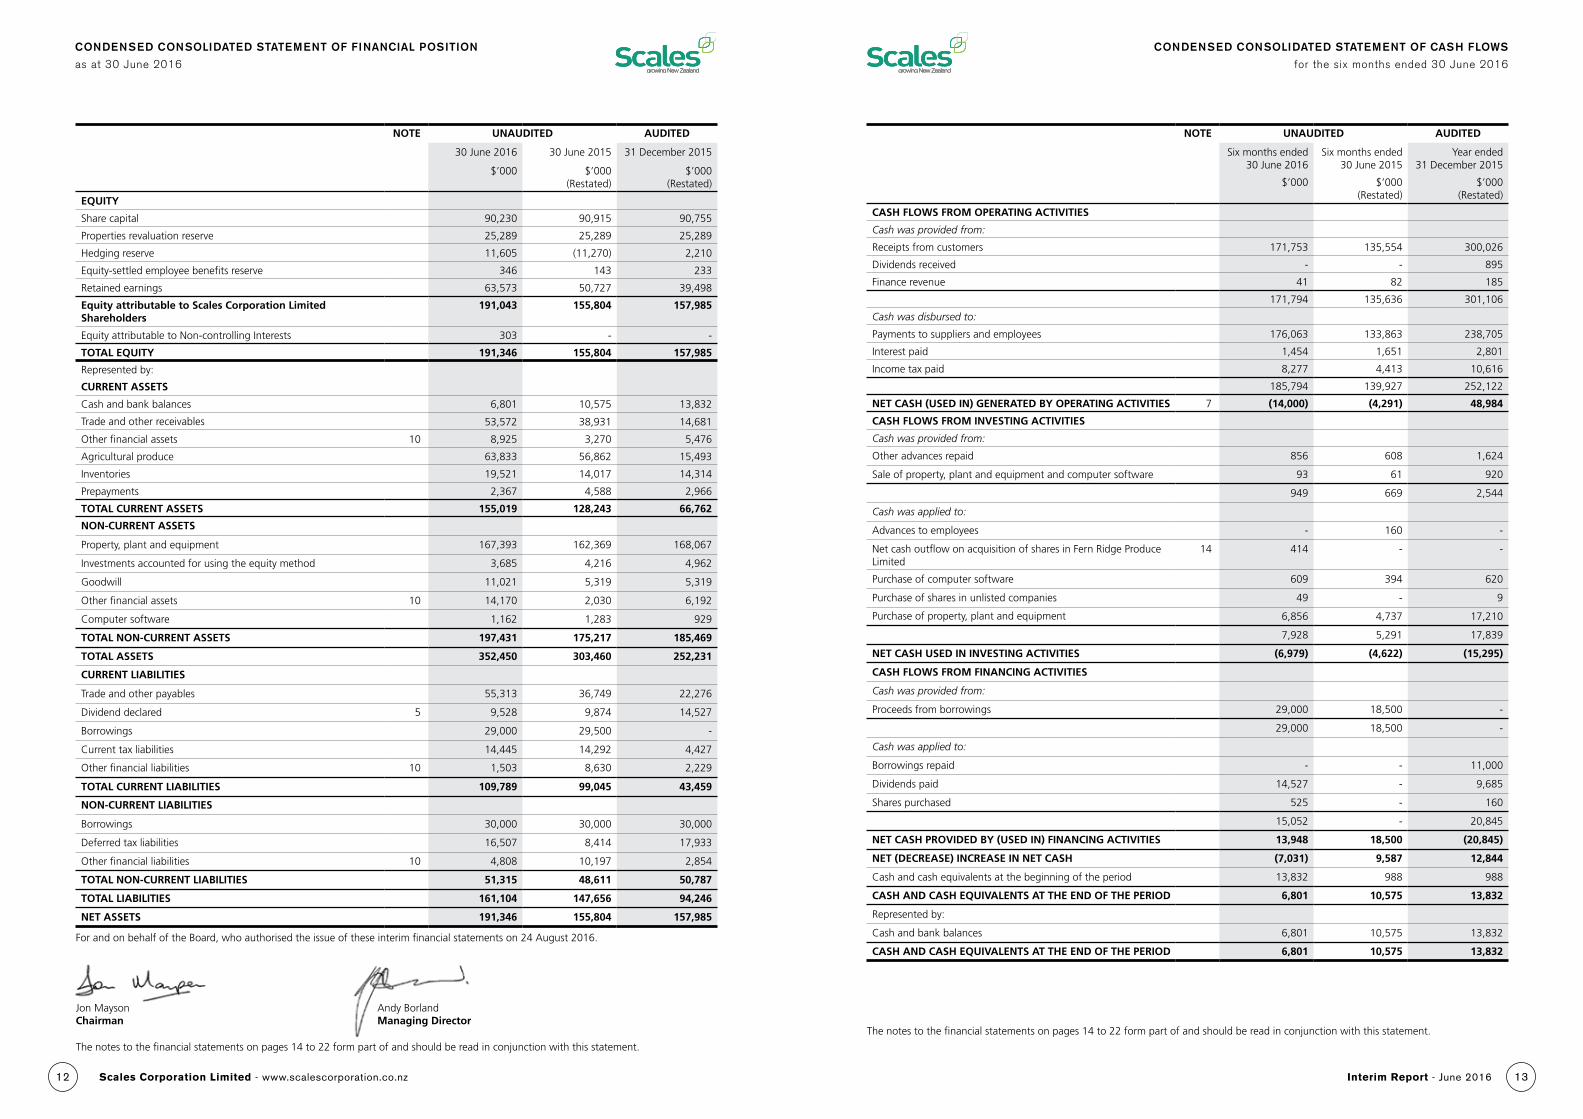
Share capital 90,230 90,915 90,755
Properties revaluation reserve 25,289 25,289 25,289
Hedging reserve 11,605 (11,270) 2,210
Equity-settled employee benefits reserve 346 143 233
Retained earnings 63,573 50,727 39,498
Equity attributable to Scales Corporation Limited Shareholders
191,043 155,804 157,985
Equity attributable to Non-controlling Interests 303 - -
TOTAL EQUITY 191,346 155,804 157,985
Represented by:
CURRENT ASSETS
Cash and bank balances 6,801 10,575 13,832
Trade and other receivables 53,572 38,931 14,681
Other financial assets 10 8,925 3,270 5,476
Agricultural produce 63,833 56,862 15,493
Inventories 19,521 14,017 14,314
Prepayments 2,367 4,588 2,966
TOTAL CURRENT ASSETS 155,019 128,243 66,762
NON-CURRENT ASSETS
Property, plant and equipment 167,393 162,369 168,067
Investments accounted for using the equity method 3,685 4,216 4,962
Goodwill 11,021 5,319 5,319
Other financial assets 10 14,170 2,030 6,192
Computer software 1,162 1,283 929
TOTAL NON-CURRENT ASSETS 197,431 175,217 185,469
TOTAL ASSETS 352,450 303,460 252,231
CURRENT LIABILITIES
Trade and other payables 55,313 36,749 22,276
Dividend declared 5 9,528 9,874 14,527
Borrowings 29,000 29,500 -
Current tax liabilities 14,445 14,292 4,427
Other financial liabilities 10 1,503 8,630 2,229
TOTAL CURRENT LIABILITIES 109,789 99,045 43,459
NON-CURRENT LIABILITIES
Borrowings 30,000 30,000 30,000
Deferred tax liabilities 16,507 8,414 17,933
Other financial liabilities 10 4,808 10,197 2,854
TOTAL NON-CURRENT LIABILITIES 51,315 48,611 50,787
TOTAL LIABILITIES 161,104 147,656 94,246
NET ASSETS 191,346 155,804 157,985
For and on behalf of the Board, who authorised the issue of these interim financial statements on 24 August 2016.
Jon Mayson Andy Borland Chairman Managing Director
The notes to the financial statements on pages 14 to 22 form part of and should be read in conjunction with this statement.
NOTE UNAUDITED AUDITED
Six months ended 30 June 2016
Six months ended 30 June 2015
Year ended 31 December 2015
$’000 $’000 (Restated)
$’000 (Restated)
CASH FLOWS FROM OPERATING ACTIVITIES
Cash was provided from:
Receipts from customers 171,753 135,554 300,026
Dividends received - - 895
Finance revenue 41 82 185
171,794 135,636 301,106
Cash was disbursed to:
Payments to suppliers and employees 176,063 133,863 238,705
Interest paid 1,454 1,651 2,801
Income tax paid 8,277 4,413 10,616
185,794 139,927 252,122
NET CASH (USED IN) GENERATED BY OPERATING ACTIVITIES 7 (14,000) (4,291) 48,984
CASH FLOWS FROM INVESTING ACTIVITIES
Cash was provided from:
Other advances repaid 856 608 1,624
Sale of property, plant and equipment and computer software 93 61 920
949 669 2,544
Cash was applied to:
Advances to employees - 160 -
Net cash outflow on acquisition of shares in Fern Ridge Produce Limited
14 414 - -
Purchase of computer software 609 394 620
Purchase of shares in unlisted companies 49 - 9
Purchase of property, plant and equipment 6,856 4,737 17,210
7,928 5,291 17,839
NET CASH USED IN INVESTING ACTIVITIES (6,979) (4,622) (15,295)
CASH FLOWS FROM FINANCING ACTIVITIES
Cash was provided from:
Proceeds from borrowings 29,000 18,500 -
29,000 18,500 -
Cash was applied to:
Borrowings repaid - - 11,000
Dividends paid 14,527 - 9,685
Shares purchased 525 - 160
15,052 - 20,845
NET CASH PROVIDED BY (USED IN) FINANCING ACTIVITIES 13,948 18,500 (20,845)
NET (DECREASE) INCREASE IN NET CASH (7,031) 9,587 12,844
Cash and cash equivalents at the beginning of the period 13,832 988 988
CASH AND CASH EQUIVALENTS AT THE END OF THE PERIOD 6,801 10,575 13,832
Represented by:
Cash and bank balances 6,801 10,575 13,832
CASH AND CASH EQUIVALENTS AT THE END OF THE PERIOD 6,801 10,575 13,832
The notes to the financial statements on pages 14 to 22 form part of and should be read in conjunction with this statement.
1312 Interim Report - June 2016Scales Corporation Limited - www.scalescorporation.co.nz
CONDENSED CONSOLIDATED STATEMENT OF CASH FLOWS
for the six months ended 30 June 2016
NOTES TO THE CONDENSED CONSOLIDATED INTERIM FINANCIAL STATEMENTS
for the six months ended 30 June 2016
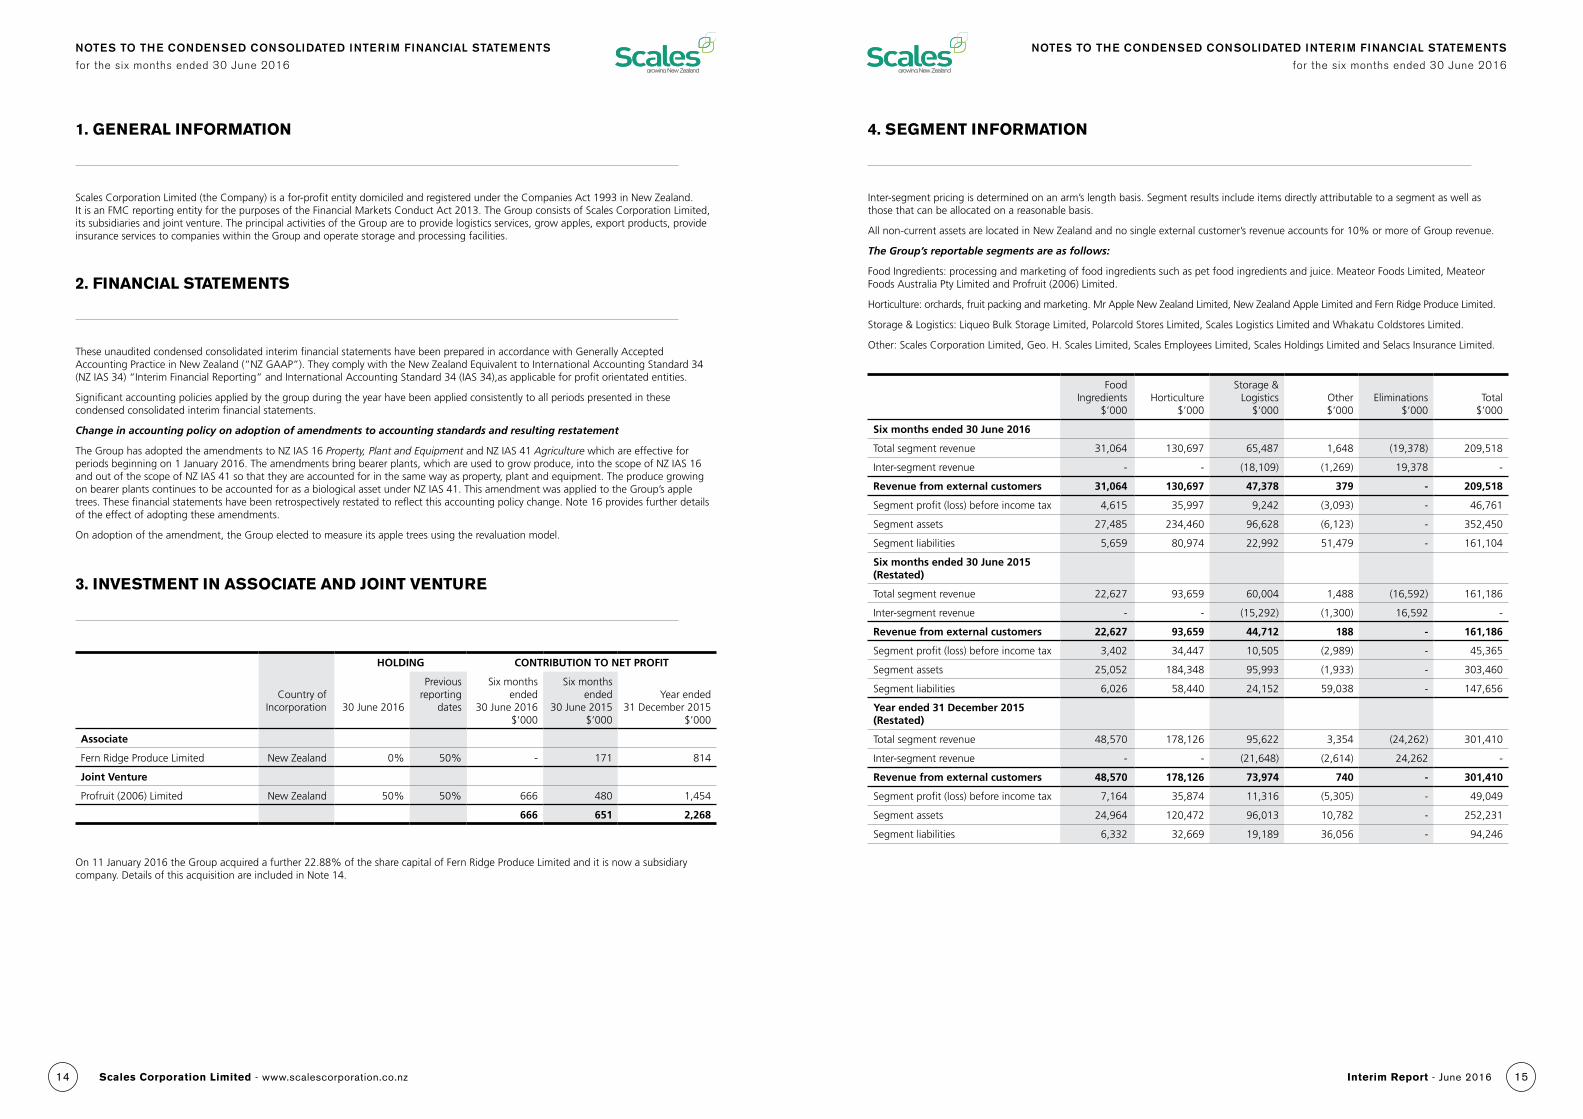
1. GENERAL INFORMATION
Scales Corporation Limited (the Company) is a for-profit entity domiciled and registered under the Companies Act 1993 in New Zealand. It is an FMC reporting entity for the purposes of the Financial Markets Conduct Act 2013. The Group consists of Scales Corporation Limited, its subsidiaries and joint venture. The principal activities of the Group are to provide logistics services, grow apples, export products, provide insurance services to companies within the Group and operate storage and processing facilities.
2. FINANCIAL STATEMENTS
These unaudited condensed consolidated interim financial statements have been prepared in accordance with Generally Accepted Accounting Practice in New Zealand (“NZ GAAP”). They comply with the New Zealand Equivalent to International Accounting Standard 34 (NZ IAS 34) “Interim Financial Reporting” and International Accounting Standard 34 (IAS 34),as applicable for profit orientated entities.
Significant accounting policies applied by the group during the year have been applied consistently to all periods presented in these condensed consolidated interim financial statements.
Change in accounting policy on adoption of amendments to accounting standards and resulting restatement
The Group has adopted the amendments to NZ IAS 16 Property, Plant and Equipment and NZ IAS 41 Agriculture which are effective for periods beginning on 1 January 2016. The amendments bring bearer plants, which are used to grow produce, into the scope of NZ IAS 16 and out of the scope of NZ IAS 41 so that they are accounted for in the same way as property, plant and equipment. The produce growing on bearer plants continues to be accounted for as a biological asset under NZ IAS 41. This amendment was applied to the Group’s apple trees. These financial statements have been retrospectively restated to reflect this accounting policy change. Note 16 provides further details of the effect of adopting these amendments.
On adoption of the amendment, the Group elected to measure its apple trees using the revaluation model.
On 11 January 2016 the Group acquired a further 22.88% of the share capital of Fern Ridge Produce Limited and it is now a subsidiary company. Details of this acquisition are included in Note 14.
3. INVESTMENT IN ASSOCIATE AND JOINT VENTURE
HOLDING CONTRIBUTION TO NET PROFIT
Country of Incorporation 30 June 2016
Previous reporting
dates
Six months ended
30 June 2016 $’000
Six months ended
30 June 2015 $’000
Year ended 31 December 2015
$’000
Associate
Fern Ridge Produce Limited New Zealand 0% 50% - 171 814
Joint Venture
Profruit (2006) Limited New Zealand 50% 50% 666 480 1,454
666 651 2,268
NOTES TO THE CONDENSED CONSOLIDATED INTERIM FINANCIAL STATEMENTS
for the six months ended 30 June 2016
4. SEGMENT INFORMATION
Inter-segment pricing is determined on an arm’s length basis. Segment results include items directly attributable to a segment as well as those that can be allocated on a reasonable basis.
All non-current assets are located in New Zealand and no single external customer’s revenue accounts for 10% or more of Group revenue.
The Group’s reportable segments are as follows:
Food Ingredients: processing and marketing of food ingredients such as pet food ingredients and juice. Meateor Foods Limited, Meateor Foods Australia Pty Limited and Profruit (2006) Limited.
Horticulture: orchards, fruit packing and marketing. Mr Apple New Zealand Limited, New Zealand Apple Limited and Fern Ridge Produce Limited.
Storage & Logistics: Liqueo Bulk Storage Limited, Polarcold Stores Limited, Scales Logistics Limited and Whakatu Coldstores Limited.
Other: Scales Corporation Limited, Geo. H. Scales Limited, Scales Employees Limited, Scales Holdings Limited and Selacs Insurance Limited.
Food Ingredients
$’000Horticulture
$’000
Storage & Logistics
$’000Other $’000
Eliminations $’000
Total $’000
Six months ended 30 June 2016
Total segment revenue 31,064 130,697 65,487 1,648 (19,378) 209,518
Inter-segment revenue - - (18,109) (1,269) 19,378 -
Revenue from external customers 31,064 130,697 47,378 379 - 209,518
Segment profit (loss) before income tax 4,615 35,997 9,242 (3,093) - 46,761
Segment assets 27,485 234,460 96,628 (6,123) - 352,450
Segment liabilities 5,659 80,974 22,992 51,479 - 161,104
Six months ended 30 June 2015 (Restated)
Total segment revenue 22,627 93,659 60,004 1,488 (16,592) 161,186
Inter-segment revenue - - (15,292) (1,300) 16,592 -
Revenue from external customers 22,627 93,659 44,712 188 - 161,186
Segment profit (loss) before income tax 3,402 34,447 10,505 (2,989) - 45,365
Segment assets 25,052 184,348 95,993 (1,933) - 303,460
Segment liabilities 6,026 58,440 24,152 59,038 - 147,656
Year ended 31 December 2015 (Restated)
Total segment revenue 48,570 178,126 95,622 3,354 (24,262) 301,410
Inter-segment revenue - - (21,648) (2,614) 24,262 -
Revenue from external customers 48,570 178,126 73,974 740 - 301,410
Segment profit (loss) before income tax 7,164 35,874 11,316 (5,305) - 49,049
Segment assets 24,964 120,472 96,013 10,782 - 252,231
Segment liabilities 6,332 32,669 19,189 36,056 - 94,246
1514 Interim Report - June 2016Scales Corporation Limited - www.scalescorporation.co.nz
NOTES TO THE CONDENSED CONSOLIDATED INTERIM FINANCIAL STATEMENTS
for the six months ended 30 June 2016
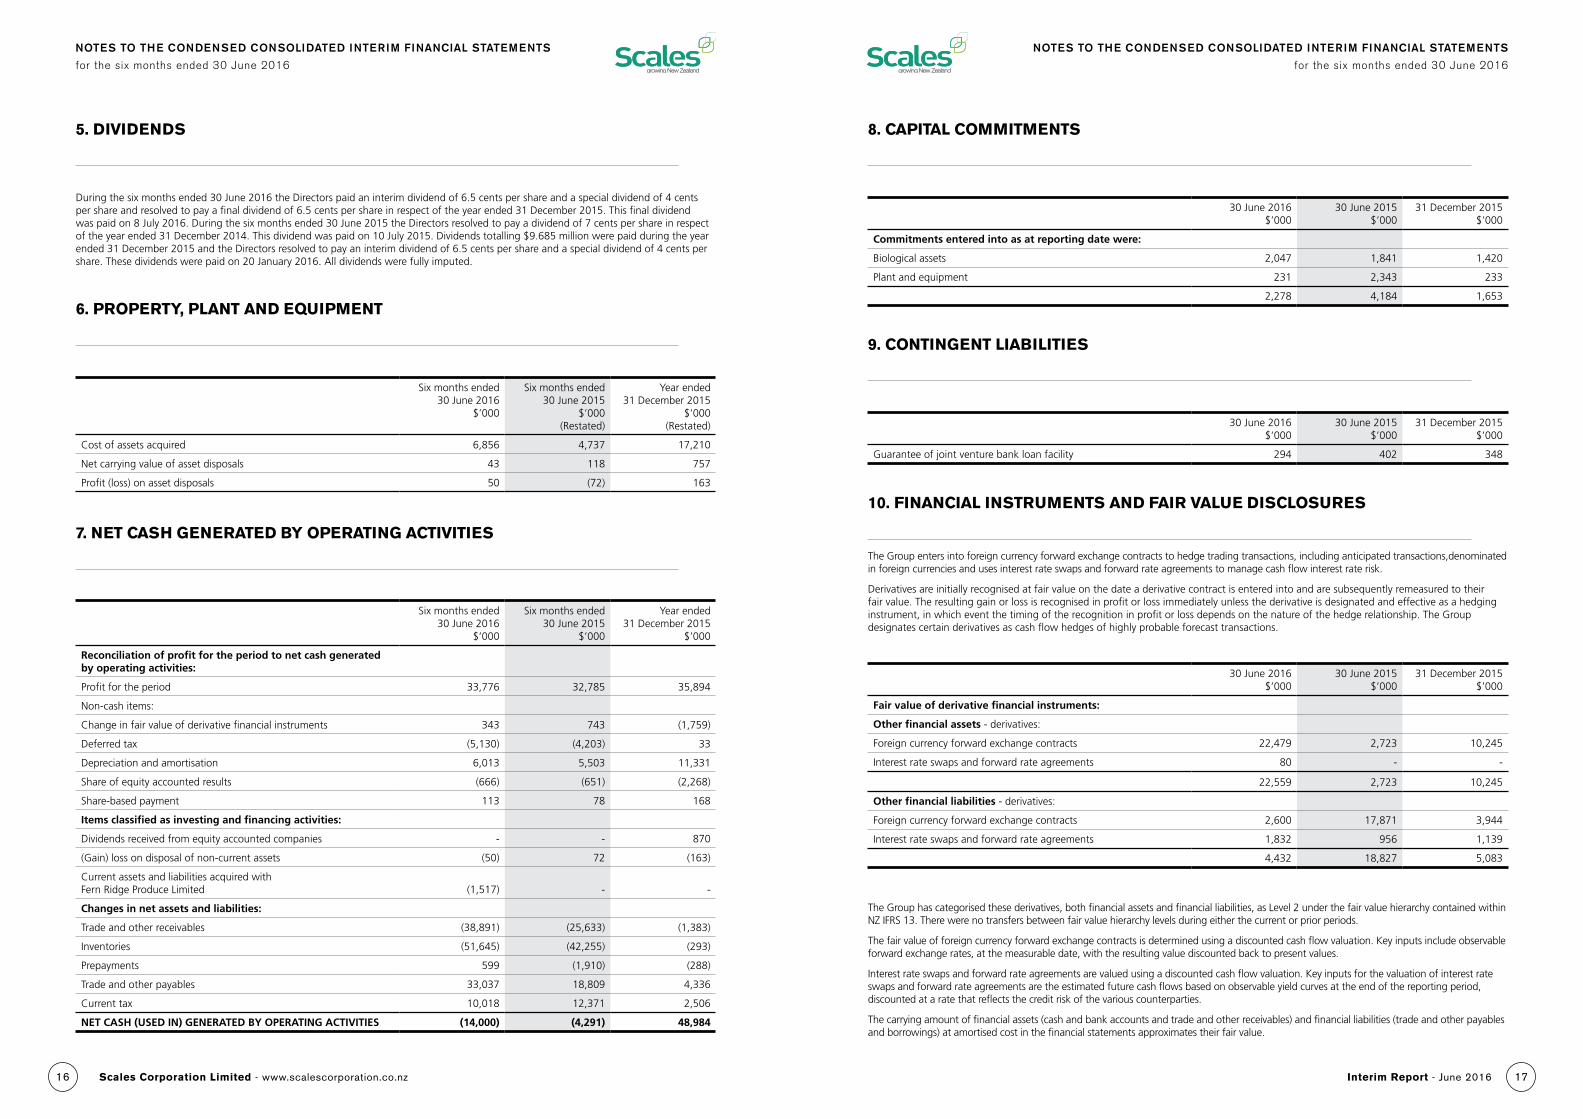
5. DIVIDENDS
During the six months ended 30 June 2016 the Directors paid an interim dividend of 6.5 cents per share and a special dividend of 4 cents per share and resolved to pay a final dividend of 6.5 cents per share in respect of the year ended 31 December 2015. This final dividend was paid on 8 July 2016. During the six months ended 30 June 2015 the Directors resolved to pay a dividend of 7 cents per share in respect of the year ended 31 December 2014. This dividend was paid on 10 July 2015. Dividends totalling $9.685 million were paid during the year ended 31 December 2015 and the Directors resolved to pay an interim dividend of 6.5 cents per share and a special dividend of 4 cents per share. These dividends were paid on 20 January 2016. All dividends were fully imputed.
6. PROPERTY, PLANT AND EQUIPMENT
Six months ended 30 June 2016
$’000
Six months ended 30 June 2015
$’000 (Restated)
Year ended 31 December 2015
$’000 (Restated)
Cost of assets acquired 6,856 4,737 17,210
Net carrying value of asset disposals 43 118 757
Profit (loss) on asset disposals 50 (72) 163
7. NET CASH GENERATED BY OPERATING ACTIVITIES
Six months ended 30 June 2016
$’000
Six months ended 30 June 2015
$’000
Year ended 31 December 2015
$’000
Reconciliation of profit for the period to net cash generated by operating activities:
Profit for the period 33,776 32,785 35,894
Non-cash items:
Change in fair value of derivative financial instruments 343 743 (1,759)
Deferred tax (5,130) (4,203) 33
Depreciation and amortisation 6,013 5,503 11,331
Share of equity accounted results (666) (651) (2,268)
Share-based payment 113 78 168
Items classified as investing and financing activities:
Dividends received from equity accounted companies - - 870
(Gain) loss on disposal of non-current assets (50) 72 (163)
Current assets and liabilities acquired with Fern Ridge Produce Limited (1,517) - -
Changes in net assets and liabilities:
Trade and other receivables (38,891) (25,633) (1,383)
Inventories (51,645) (42,255) (293)
Prepayments 599 (1,910) (288)
Trade and other payables 33,037 18,809 4,336
Current tax 10,018 12,371 2,506
NET CASH (USED IN) GENERATED BY OPERATING ACTIVITIES (14,000) (4,291) 48,984
NOTES TO THE CONDENSED CONSOLIDATED INTERIM FINANCIAL STATEMENTS
for the six months ended 30 June 2016
8. CAPITAL COMMITMENTS
9. CONTINGENT LIABILITIES
30 June 2016 $’000
30 June 2015 $’000
31 December 2015 $’000
Commitments entered into as at reporting date were:
Biological assets 2,047 1,841 1,420
Plant and equipment 231 2,343 233
2,278 4,184 1,653
30 June 2016 $’000
30 June 2015 $’000
31 December 2015 $’000
Guarantee of joint venture bank loan facility 294 402 348
10. FINANCIAL INSTRUMENTS AND FAIR VALUE DISCLOSURES
The Group enters into foreign currency forward exchange contracts to hedge trading transactions, including anticipated transactions,denominated in foreign currencies and uses interest rate swaps and forward rate agreements to manage cash flow interest rate risk.
Derivatives are initially recognised at fair value on the date a derivative contract is entered into and are subsequently remeasured to their fair value. The resulting gain or loss is recognised in profit or loss immediately unless the derivative is designated and effective as a hedging instrument, in which event the timing of the recognition in profit or loss depends on the nature of the hedge relationship. The Group designates certain derivatives as cash flow hedges of highly probable forecast transactions.
The Group has categorised these derivatives, both financial assets and financial liabilities, as Level 2 under the fair value hierarchy contained within NZ IFRS 13. There were no transfers between fair value hierarchy levels during either the current or prior periods.
The fair value of foreign currency forward exchange contracts is determined using a discounted cash flow valuation. Key inputs include observable forward exchange rates, at the measurable date, with the resulting value discounted back to present values.
Interest rate swaps and forward rate agreements are valued using a discounted cash flow valuation. Key inputs for the valuation of interest rate swaps and forward rate agreements are the estimated future cash flows based on observable yield curves at the end of the reporting period, discounted at a rate that reflects the credit risk of the various counterparties.
The carrying amount of financial assets (cash and bank accounts and trade and other receivables) and financial liabilities (trade and other payables and borrowings) at amortised cost in the financial statements approximates their fair value.
30 June 2016 $’000
30 June 2015 $’000
31 December 2015 $’000
Fair value of derivative financial instruments:
Other financial assets - derivatives:
Foreign currency forward exchange contracts 22,479 2,723 10,245
Interest rate swaps and forward rate agreements 80 - -
22,559 2,723 10,245
Other financial liabilities - derivatives:
Foreign currency forward exchange contracts 2,600 17,871 3,944
Interest rate swaps and forward rate agreements 1,832 956 1,139
4,432 18,827 5,083
1716 Interim Report - June 2016Scales Corporation Limited - www.scalescorporation.co.nz
NOTES TO THE CONDENSED CONSOLIDATED INTERIM FINANCIAL STATEMENTS
for the six months ended 30 June 2016
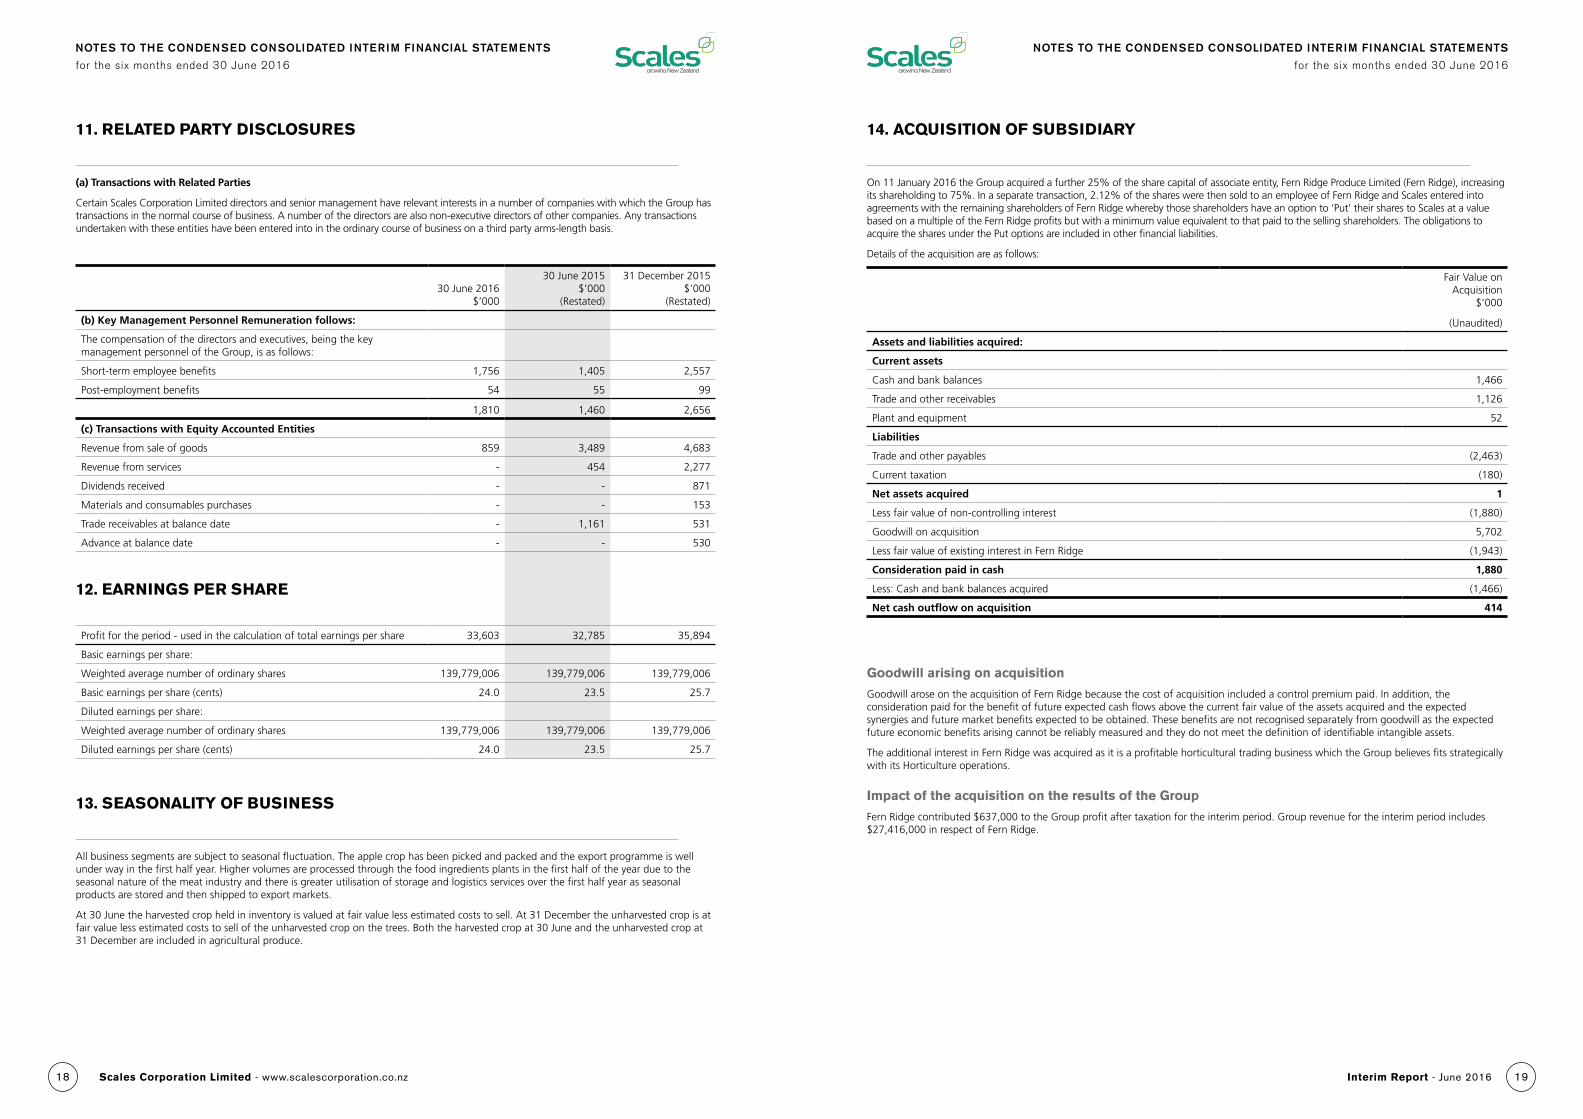
11. RELATED PARTY DISCLOSURES
(a) Transactions with Related Parties
Certain Scales Corporation Limited directors and senior management have relevant interests in a number of companies with which the Group has transactions in the normal course of business. A number of the directors are also non-executive directors of other companies. Any transactions undertaken with these entities have been entered into in the ordinary course of business on a third party arms-length basis.
30 June 2016 $’000
30 June 2015 $’000
(Restated)
31 December 2015 $’000
(Restated)
(b) Key Management Personnel Remuneration follows:
The compensation of the directors and executives, being the key management personnel of the Group, is as follows:
Short-term employee benefits 1,756 1,405 2,557
Post-employment benefits 54 55 99
1,810 1,460 2,656
(c) Transactions with Equity Accounted Entities
Revenue from sale of goods 859 3,489 4,683
Revenue from services - 454 2,277
Dividends received - - 871
Materials and consumables purchases - - 153
Trade receivables at balance date - 1,161 531
Advance at balance date - - 530
12. EARNINGS PER SHARE
Profit for the period - used in the calculation of total earnings per share 33,603 32,785 35,894
Basic earnings per share:
Weighted average number of ordinary shares 139,779,006 139,779,006 139,779,006
Basic earnings per share (cents) 24.0 23.5 25.7
Diluted earnings per share:
Weighted average number of ordinary shares 139,779,006 139,779,006 139,779,006
Diluted earnings per share (cents) 24.0 23.5 25.7
13. SEASONALITY OF BUSINESS
All business segments are subject to seasonal fluctuation. The apple crop has been picked and packed and the export programme is well under way in the first half year. Higher volumes are processed through the food ingredients plants in the first half of the year due to the seasonal nature of the meat industry and there is greater utilisation of storage and logistics services over the first half year as seasonal products are stored and then shipped to export markets.
At 30 June the harvested crop held in inventory is valued at fair value less estimated costs to sell. At 31 December the unharvested crop is at fair value less estimated costs to sell of the unharvested crop on the trees. Both the harvested crop at 30 June and the unharvested crop at 31 December are included in agricultural produce.
NOTES TO THE CONDENSED CONSOLIDATED INTERIM FINANCIAL STATEMENTS
for the six months ended 30 June 2016
14. ACQUISITION OF SUBSIDIARY
On 11 January 2016 the Group acquired a further 25% of the share capital of associate entity, Fern Ridge Produce Limited (Fern Ridge), increasing its shareholding to 75%. In a separate transaction, 2.12% of the shares were then sold to an employee of Fern Ridge and Scales entered into agreements with the remaining shareholders of Fern Ridge whereby those shareholders have an option to ‘Put’ their shares to Scales at a value based on a multiple of the Fern Ridge profits but with a minimum value equivalent to that paid to the selling shareholders. The obligations to acquire the shares under the Put options are included in other financial liabilities.
Details of the acquisition are as follows:
Fair Value on Acquisition
$’000
(Unaudited)
Assets and liabilities acquired:
Current assets
Cash and bank balances 1,466
Trade and other receivables 1,126
Plant and equipment 52
Liabilities
Trade and other payables (2,463)
Current taxation (180)
Net assets acquired 1
Less fair value of non-controlling interest (1,880)
Goodwill on acquisition 5,702
Less fair value of existing interest in Fern Ridge (1,943)
Consideration paid in cash 1,880
Less: Cash and bank balances acquired (1,466)
Net cash outflow on acquisition 414
Goodwill arising on acquisition
Goodwill arose on the acquisition of Fern Ridge because the cost of acquisition included a control premium paid. In addition, the consideration paid for the benefit of future expected cash flows above the current fair value of the assets acquired and the expected synergies and future market benefits expected to be obtained. These benefits are not recognised separately from goodwill as the expected future economic benefits arising cannot be reliably measured and they do not meet the definition of identifiable intangible assets.
The additional interest in Fern Ridge was acquired as it is a profitable horticultural trading business which the Group believes fits strategically with its Horticulture operations.
Impact of the acquisition on the results of the Group
Fern Ridge contributed $637,000 to the Group profit after taxation for the interim period. Group revenue for the interim period includes $27,416,000 in respect of Fern Ridge.
1918 Interim Report - June 2016Scales Corporation Limited - www.scalescorporation.co.nz
NOTES TO THE CONDENSED CONSOLIDATED INTERIM FINANCIAL STATEMENTS
for the six months ended 30 June 2016
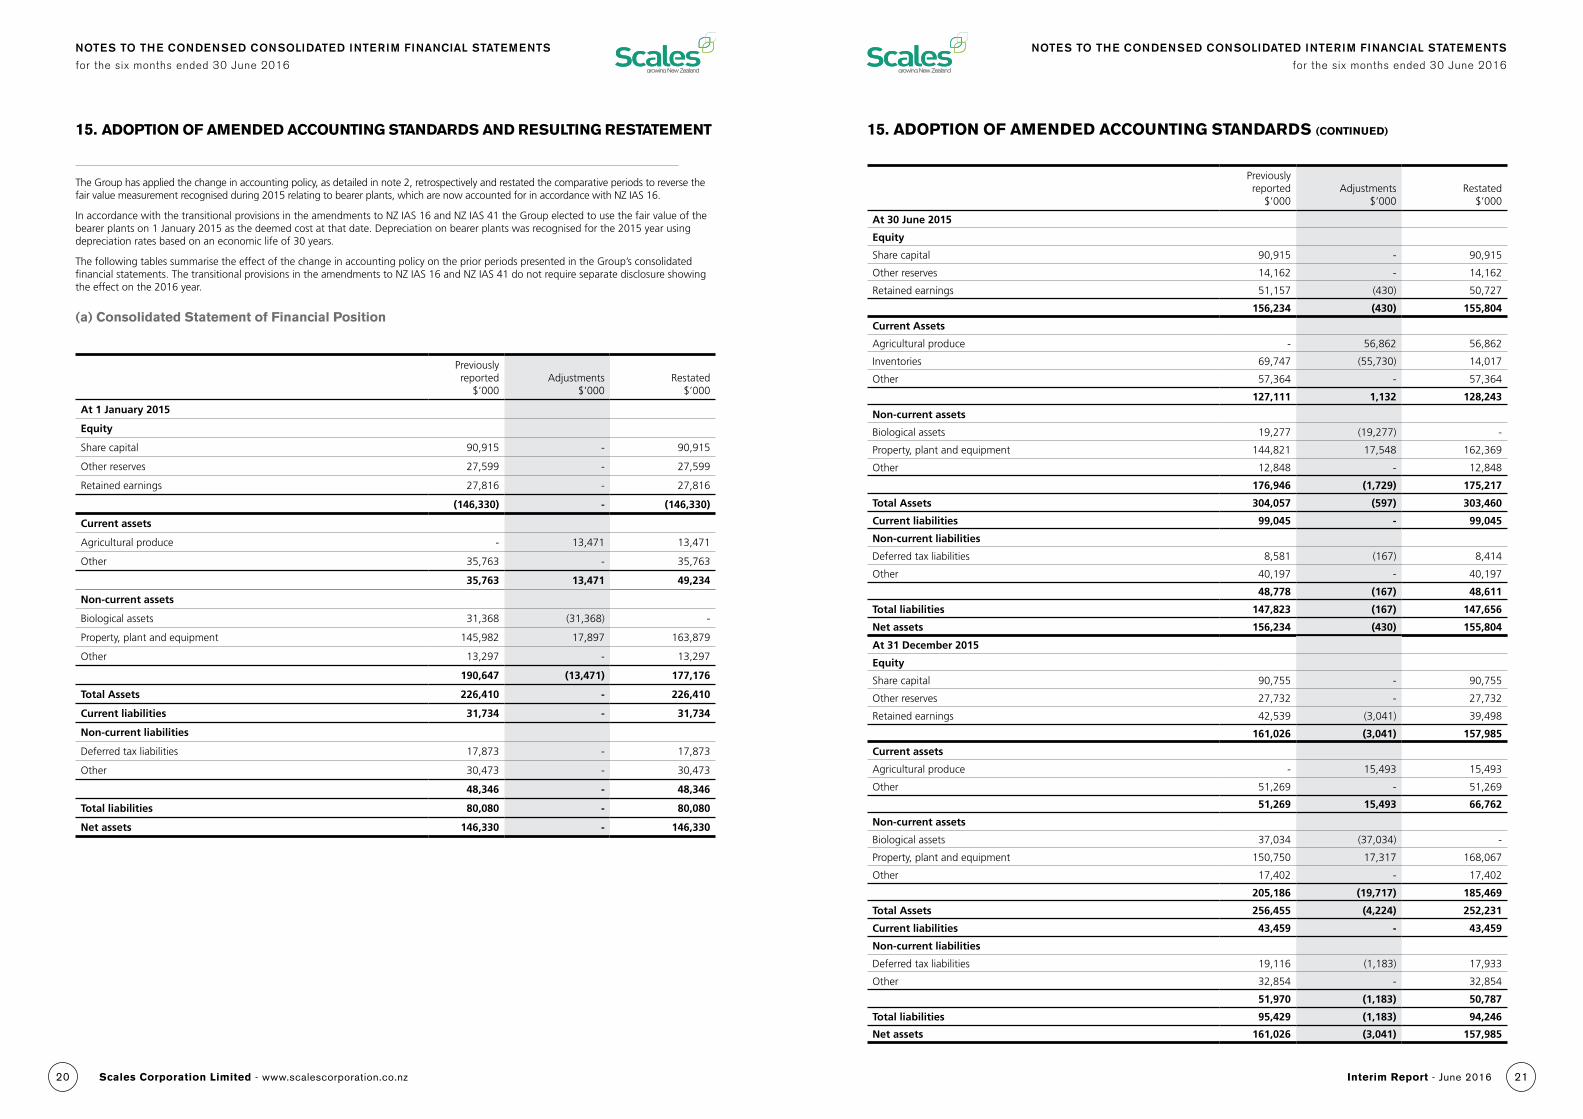
15. ADOPTION OF AMENDED ACCOUNTING STANDARDS AND RESULTING RESTATEMENT
The Group has applied the change in accounting policy, as detailed in note 2, retrospectively and restated the comparative periods to reverse the fair value measurement recognised during 2015 relating to bearer plants, which are now accounted for in accordance with NZ IAS 16.
In accordance with the transitional provisions in the amendments to NZ IAS 16 and NZ IAS 41 the Group elected to use the fair value of the bearer plants on 1 January 2015 as the deemed cost at that date. Depreciation on bearer plants was recognised for the 2015 year using depreciation rates based on an economic life of 30 years.
The following tables summarise the effect of the change in accounting policy on the prior periods presented in the Group’s consolidated financial statements. The transitional provisions in the amendments to NZ IAS 16 and NZ IAS 41 do not require separate disclosure showing the effect on the 2016 year.
(a) Consolidated Statement of Financial Position
Previously reported
$’000Adjustments
$’000Restated
$’000
At 1 January 2015
Equity
Share capital 90,915 - 90,915
Other reserves 27,599 - 27,599
Retained earnings 27,816 - 27,816
(146,330) - (146,330)
Current assets
Agricultural produce - 13,471 13,471
Other 35,763 - 35,763
35,763 13,471 49,234
Non-current assets
Biological assets 31,368 (31,368) -
Property, plant and equipment 145,982 17,897 163,879
Other 13,297 - 13,297
190,647 (13,471) 177,176
Total Assets 226,410 - 226,410
Current liabilities 31,734 - 31,734
Non-current liabilities
Deferred tax liabilities 17,873 - 17,873
Other 30,473 - 30,473
48,346 - 48,346
Total liabilities 80,080 - 80,080
Net assets 146,330 - 146,330
NOTES TO THE CONDENSED CONSOLIDATED INTERIM FINANCIAL STATEMENTS
for the six months ended 30 June 2016
15. ADOPTION OF AMENDED ACCOUNTING STANDARDS (CONTINUED)
Previously reported
$’000Adjustments
$’000Restated
$’000
At 30 June 2015
Equity
Share capital 90,915 - 90,915
Other reserves 14,162 - 14,162
Retained earnings 51,157 (430) 50,727
156,234 (430) 155,804
Current Assets
Agricultural produce - 56,862 56,862
Inventories 69,747 (55,730) 14,017
Other 57,364 - 57,364
127,111 1,132 128,243
Non-current assets
Biological assets 19,277 (19,277) -
Property, plant and equipment 144,821 17,548 162,369
Other 12,848 - 12,848
176,946 (1,729) 175,217
Total Assets 304,057 (597) 303,460
Current liabilities 99,045 - 99,045
Non-current liabilities
Deferred tax liabilities 8,581 (167) 8,414
Other 40,197 - 40,197
48,778 (167) 48,611
Total liabilities 147,823 (167) 147,656
Net assets 156,234 (430) 155,804
At 31 December 2015
Equity
Share capital 90,755 - 90,755
Other reserves 27,732 - 27,732
Retained earnings 42,539 (3,041) 39,498
161,026 (3,041) 157,985
Current assets
Agricultural produce - 15,493 15,493
Other 51,269 - 51,269
51,269 15,493 66,762
Non-current assets
Biological assets 37,034 (37,034) -
Property, plant and equipment 150,750 17,317 168,067
Other 17,402 - 17,402
205,186 (19,717) 185,469
Total Assets 256,455 (4,224) 252,231
Current liabilities 43,459 - 43,459
Non-current liabilities
Deferred tax liabilities 19,116 (1,183) 17,933
Other 32,854 - 32,854
51,970 (1,183) 50,787
Total liabilities 95,429 (1,183) 94,246
Net assets 161,026 (3,041) 157,985
2120 Interim Report - June 2016Scales Corporation Limited - www.scalescorporation.co.nz
NOTES TO THE CONDENSED CONSOLIDATED INTERIM FINANCIAL STATEMENTS
for the six months ended 30 June 2016
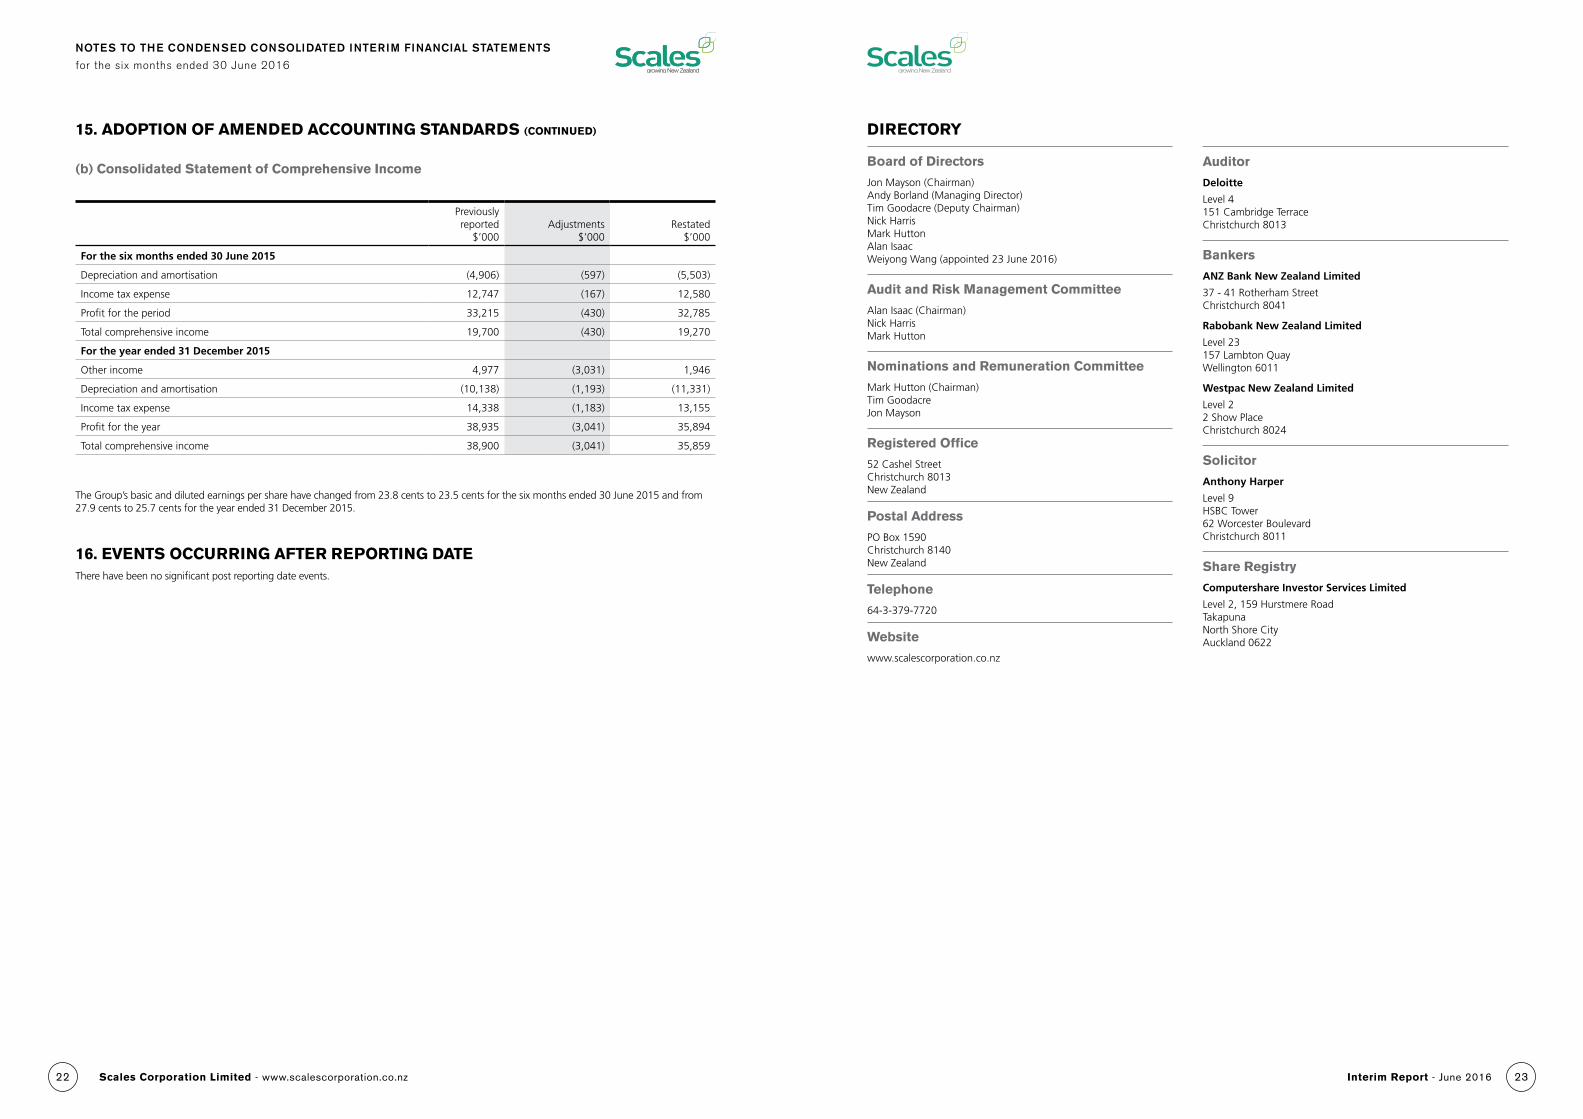
15. ADOPTION OF AMENDED ACCOUNTING STANDARDS (CONTINUED)
Previously reported
$’000Adjustments
$’000Restated
$’000
For the six months ended 30 June 2015
Depreciation and amortisation (4,906) (597) (5,503)
Income tax expense 12,747 (167) 12,580
Profit for the period 33,215 (430) 32,785
Total comprehensive income 19,700 (430) 19,270
For the year ended 31 December 2015
Other income 4,977 (3,031) 1,946
Depreciation and amortisation (10,138) (1,193) (11,331)
Income tax expense 14,338 (1,183) 13,155
Profit for the year 38,935 (3,041) 35,894
Total comprehensive income 38,900 (3,041) 35,859
(b) Consolidated Statement of Comprehensive Income
The Group’s basic and diluted earnings per share have changed from 23.8 cents to 23.5 cents for the six months ended 30 June 2015 and from 27.9 cents to 25.7 cents for the year ended 31 December 2015.
16. EVENTS OCCURRING AFTER REPORTING DATEThere have been no significant post reporting date events.
DIRECTORY
Board of Directors
Jon Mayson (Chairman) Andy Borland (Managing Director) Tim Goodacre (Deputy Chairman) Nick Harris Mark Hutton Alan Isaac Weiyong Wang (appointed 23 June 2016)
Audit and Risk Management Committee
Alan Isaac (Chairman) Nick Harris Mark Hutton
Nominations and Remuneration Committee
Mark Hutton (Chairman) Tim Goodacre Jon Mayson
Registered Office
52 Cashel Street Christchurch 8013 New Zealand
Postal Address
PO Box 1590 Christchurch 8140 New Zealand
Telephone
64-3-379-7720
Website
www.scalescorporation.co.nz
Auditor
Deloitte
Level 4 151 Cambridge Terrace Christchurch 8013
Bankers
ANZ Bank New Zealand Limited
37 - 41 Rotherham Street Christchurch 8041
Rabobank New Zealand Limited
Level 23 157 Lambton Quay Wellington 6011
Westpac New Zealand Limited
Level 2 2 Show Place Christchurch 8024
Solicitor
Anthony Harper
Level 9 HSBC Tower 62 Worcester Boulevard Christchurch 8011
Share Registry
Computershare Investor Services Limited
Level 2, 159 Hurstmere Road Takapuna North Shore City Auckland 0622
2322 Interim Report - June 2016Scales Corporation Limited - www.scalescorporation.co.nz