Embed Size (px)
Citation preview
Protecting the irreplaceable | f-secure.com
F-Secure Corporation - Interim report Q4 2010 (Unaudited)
February 2, 2011
Kimmo Alkio, President & CEO
Q4 highlights – strong finish for 2010!
• Major achievements in winning new Operators; portfolio of Security and Storage services very competitive globally
• Good revenue performance in the quarter; storage already contributing
• North America business taking major steps forward; AT&T agreement (storage services) and Frontier (security and storage)
• Reorganization of operations completed in November, new organization in place as of Jan.1
• Exciting future outlook; revenue growth accelerating in 2011
2
2010 summary
• Traditional Security as a Service -business healthy with accelerating growth in 2H
• Major investments put in place for storage services; scalability to meet global demand
• Product of the Year for Internet Security 2011
• Service offering attractive with combined security and storage portfolio; new deals, bundles, cross selling
• Operator partner network stronger than ever
3
Financial performance
4
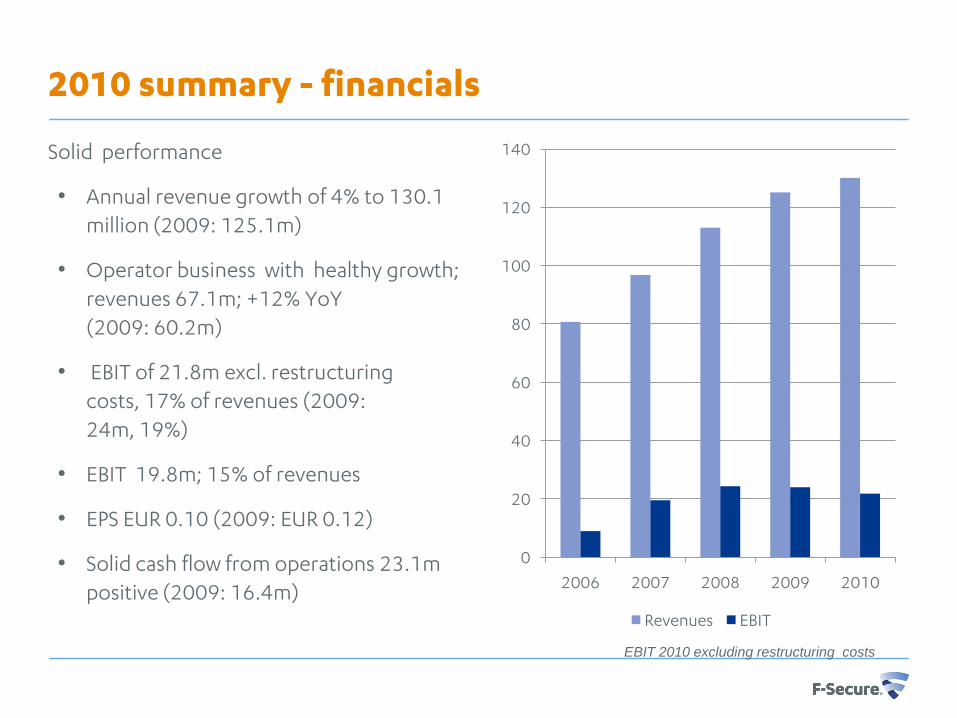
2010 summary - financials
Solid performance
• Annual revenue growth of 4% to 130.1 million (2009: 125.1m)
• Operator business with healthy growth; revenues 67.1m; +12% YoY(2009: 60.2m)
• EBIT of 21.8m excl. restructuring costs, 17% of revenues (2009: 24m, 19%)
• EBIT 19.8m; 15% of revenues
• EPS EUR 0.10 (2009: EUR 0.12)
• Solid cash flow from operations 23.1m positive (2009: 16.4m)
0
20
40
60
80
100
120
140
2006 2007 2008 2009 2010
Revenues EBIT
EBIT 2010 excluding restructuring costs
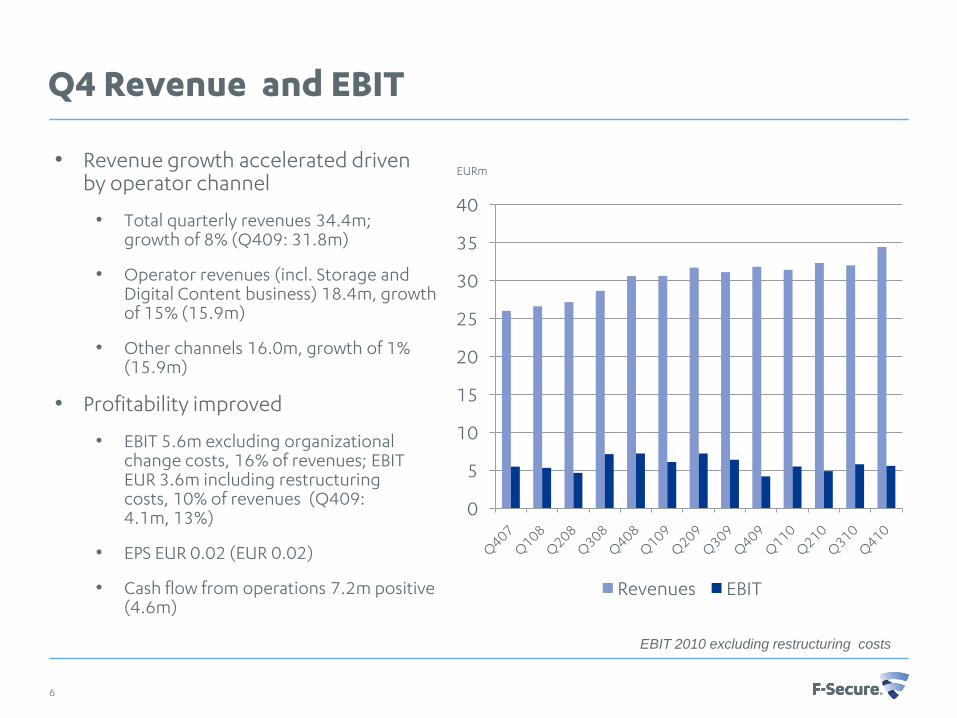
Q4 Revenue and EBIT
• Revenue growth accelerated driven by operator channel
• Total quarterly revenues 34.4m; growth of 8% (Q409: 31.8m)
• Operator revenues (incl. Storage and Digital Content business) 18.4m, growth of 15% (15.9m)
• Other channels 16.0m, growth of 1% (15.9m)
• Profitability improved
• EBIT 5.6m excluding organizational change costs, 16% of revenues; EBIT EUR 3.6m including restructuring costs, 10% of revenues (Q409: 4.1m, 13%)
• EPS EUR 0.02 (EUR 0.02)
• Cash flow from operations 7.2m positive (4.6m)
6
0
5
10
15
20
25
30
35
40
Revenues EBIT
EURm
EBIT 2010 excluding restructuring costs
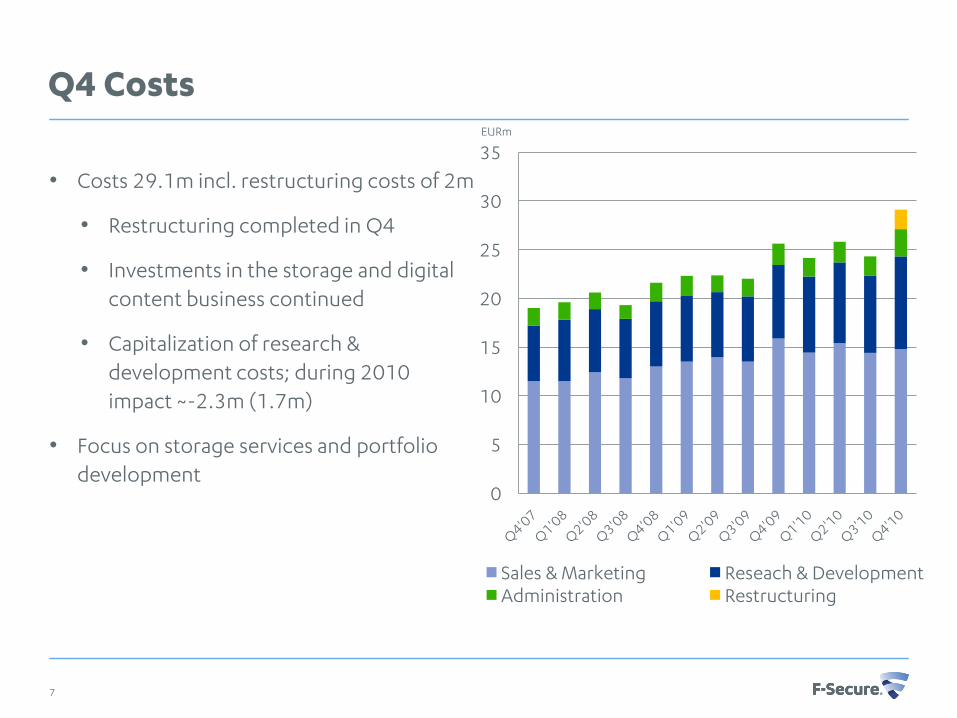
Q4 Costs
• Costs 29.1m incl. restructuring costs of 2m
• Restructuring completed in Q4
• Investments in the storage and digital content business continued
• Capitalization of research & development costs; during 2010 impact ~-2.3m (1.7m)
• Focus on storage services and portfolio development
0
5
10
15
20
25
30
35
Sales & Marketing Reseach & DevelopmentAdministration Restructuring
7
EURm
Q4 Operating profit
0
1
2
3
4
5
6
7
8
8
EURm
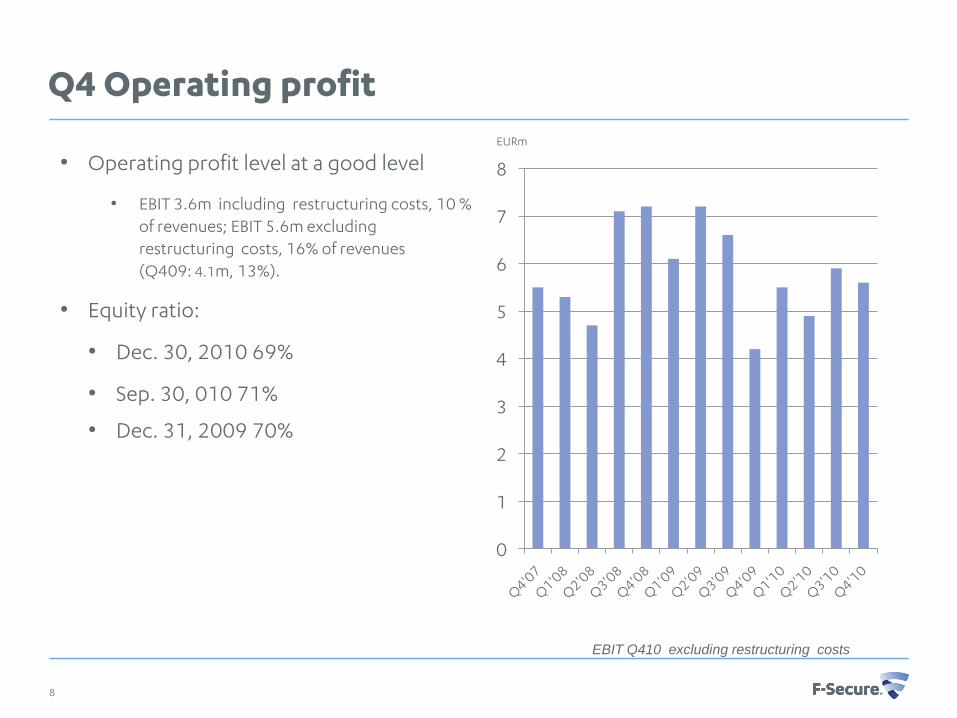
• Operating profit level at a good level
• EBIT 3.6m including restructuring costs, 10 % of revenues; EBIT 5.6m excluding restructuring costs, 16% of revenues (Q409: 4.1m, 13%).
• Equity ratio:
• Dec. 30, 2010 69%
• Sep. 30, 010 71%
• Dec. 31, 2009 70%
EBIT Q410 excluding restructuring costs
Development of EBIT margin
0 %
5 %
10 %
15 %
20 %
25 %
30 %
EBIT% Ave (4 qrts)
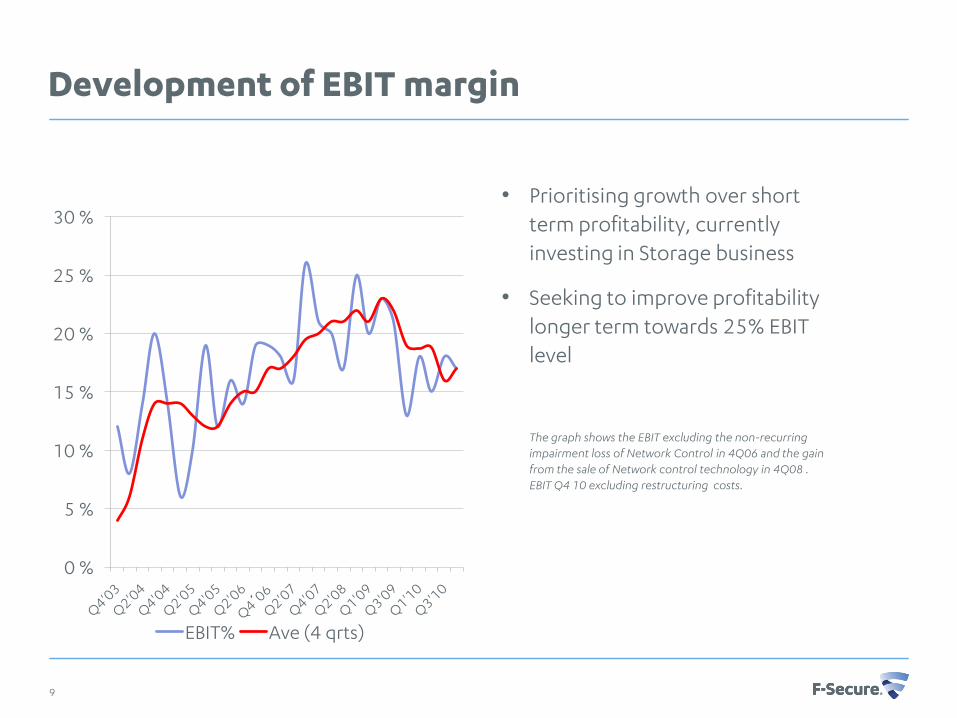
• Prioritising growth over shortterm profitability, currentlyinvesting in Storage business
• Seeking to improve profitability longer term towards 25% EBIT level
The graph shows the EBIT excluding the non-recurringimpairment loss of Network Control in 4Q06 and the gainfrom the sale of Network control technology in 4Q08 . EBIT Q4 10 excluding restructuring costs.
9
Q4 Cash position
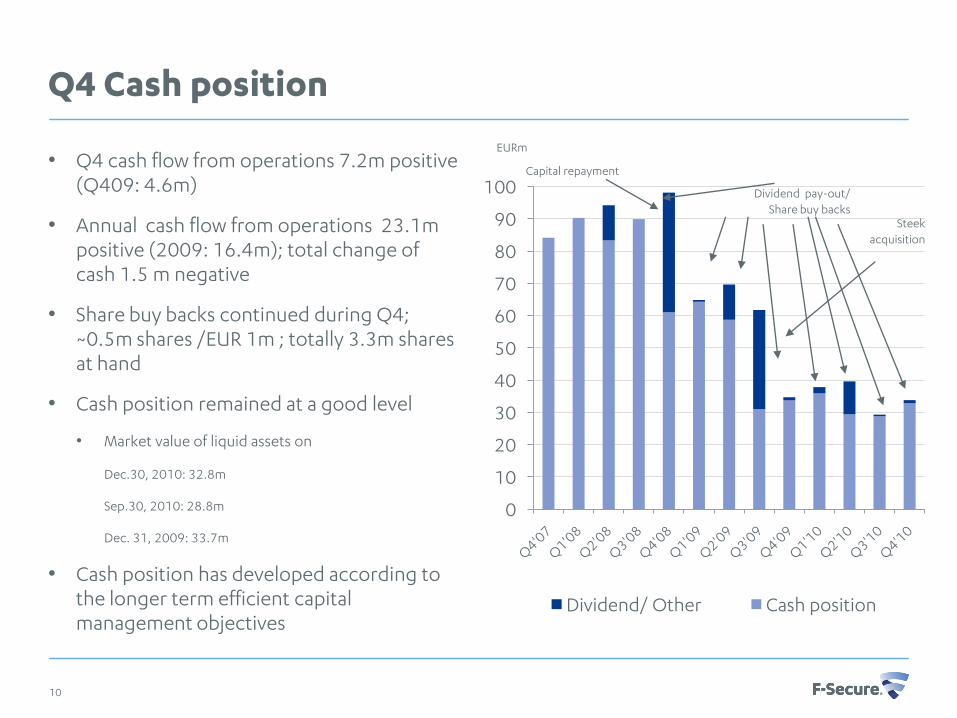
• Q4 cash flow from operations 7.2m positive (Q409: 4.6m)
• Annual cash flow from operations 23.1mpositive (2009: 16.4m); total change of cash 1.5 m negative
• Share buy backs continued during Q4; ~0.5m shares /EUR 1m ; totally 3.3m sharesat hand
• Cash position remained at a good level
• Market value of liquid assets on
Dec.30, 2010: 32.8m
Sep.30, 2010: 28.8m
Dec. 31, 2009: 33.7m
• Cash position has developed according to the longer term efficient capital management objectives
0
10
20
30
40
50
60
70
80
90
100
Dividend/ Other Cash position
Capital repayment
Dividend pay-out/Share buy backs
10
Steekacquisition
EURm
Q4 Deferred Revenues
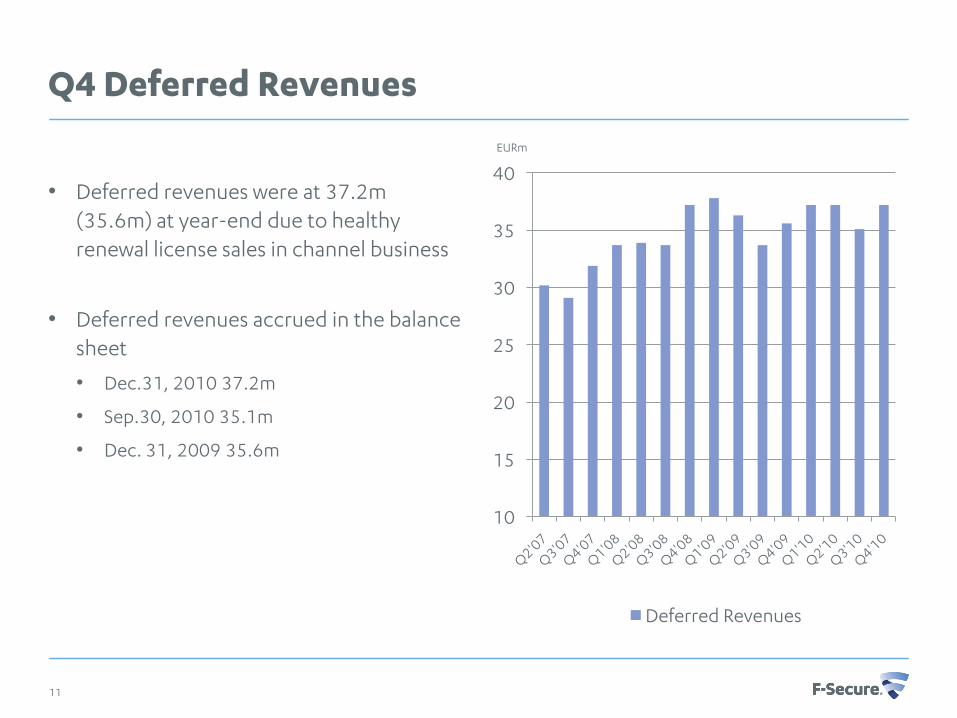
• Deferred revenues were at 37.2m (35.6m) at year-end due to healthyrenewal license sales in channel business
• Deferred revenues accrued in the balancesheet
• Dec.31, 2010 37.2m
• Sep.30, 2010 35.1m
• Dec. 31, 2009 35.6m
10
15
20
25
30
35
40
Deferred Revenues
11
EURm
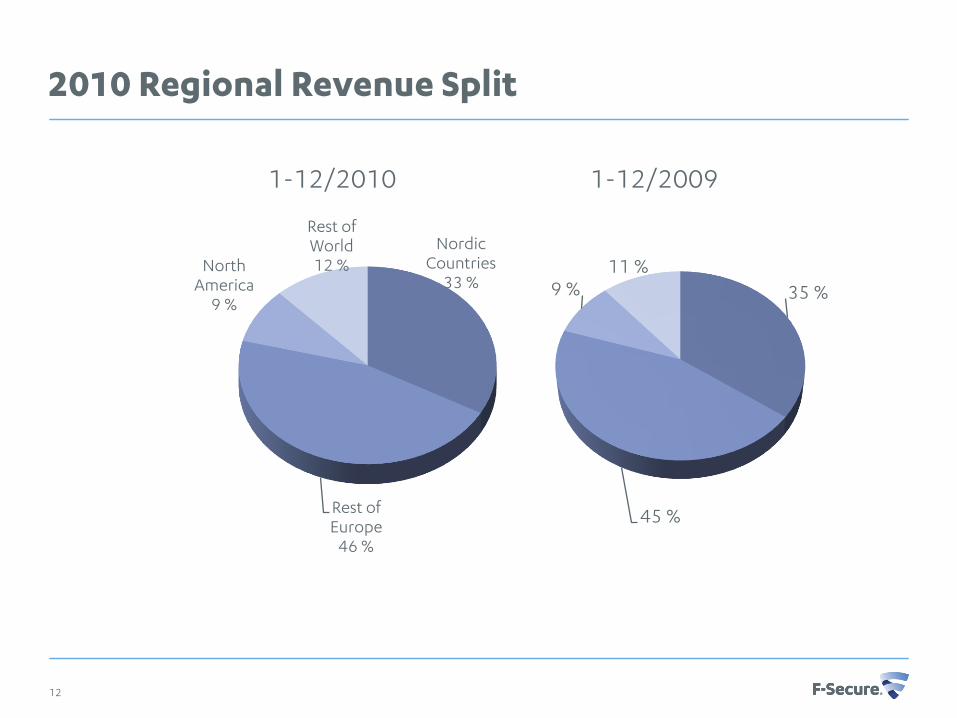
2010 Regional Revenue Split
35 %
45 %
9 %11 %
1-12/20091-12/2010
Nordic Countries
33 %
Rest of Europe
46 %
North America
9 %
Rest of World12 %
12
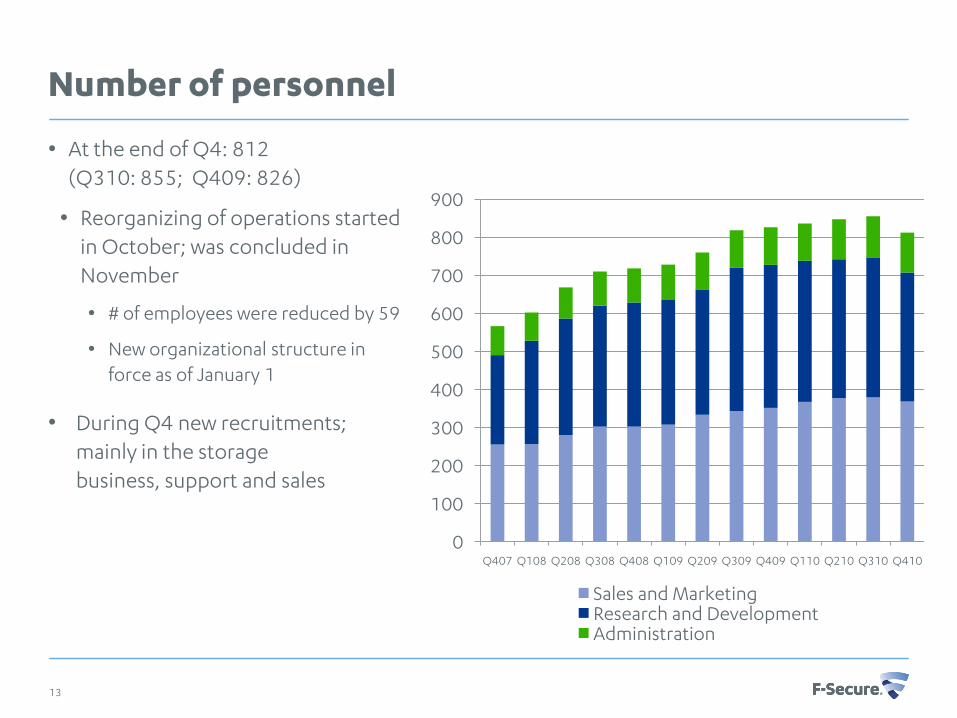
Number of personnel
• At the end of Q4: 812(Q310: 855; Q409: 826)
• Reorganizing of operations started in October; was concluded in November
• # of employees were reduced by 59
• New organizational structure in force as of January 1
• During Q4 new recruitments; mainly in the storage business, support and sales
0
100
200
300
400
500
600
700
800
900
Q407 Q108 Q208 Q308 Q408 Q109 Q209 Q309 Q409 Q110 Q210 Q310 Q410
Sales and MarketingResearch and DevelopmentAdministration
13
Operator business:Strong global partner network
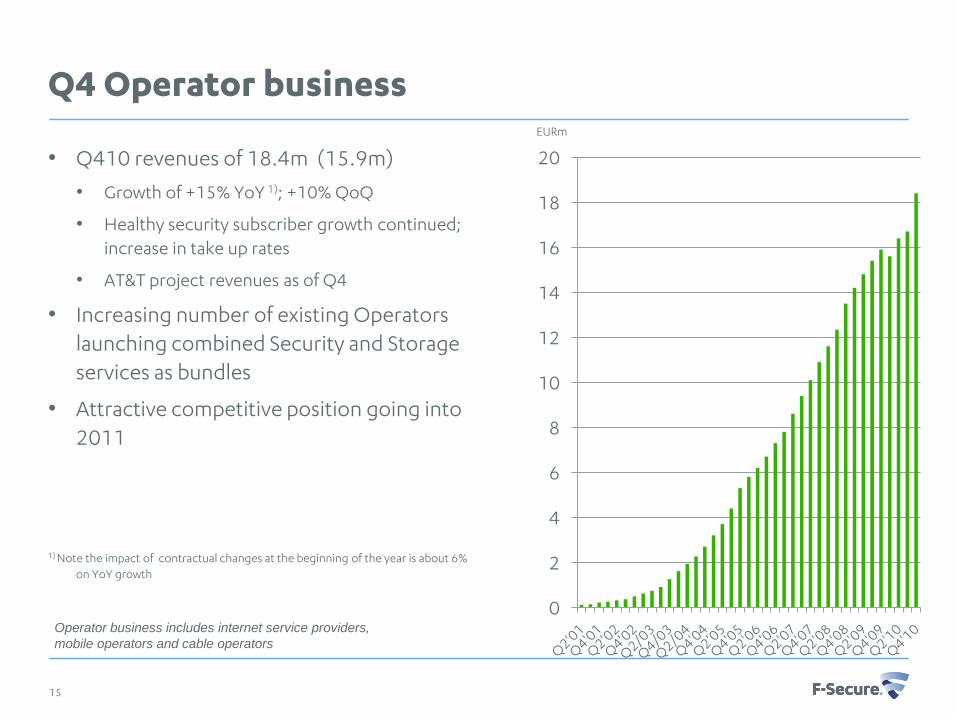
Q4 Operator business
• Q410 revenues of 18.4m (15.9m)
• Growth of +15% YoY 1); +10% QoQ
• Healthy security subscriber growth continued; increase in take up rates
• AT&T project revenues as of Q4
• Increasing number of existing Operators launching combined Security and Storage services as bundles
• Attractive competitive position going into 2011
1) Note the impact of contractual changes at the beginning of the year is about 6% on YoY growth
0
2
4
6
8
10
12
14
16
18
20
15
Operator business includes internet service providers,
mobile operators and cable operators
EURm
Recent major wins
• Strengthening market position in North America with AT&T for storage services and with Frontier for security and storage services
• Other major wins with Fastweb (Italy), Starhub (Singapore) and Celcom(Malaysia)
• More than 200 partners in over 40 countries with an addressable market of over 100 million broadband consumer customers
16
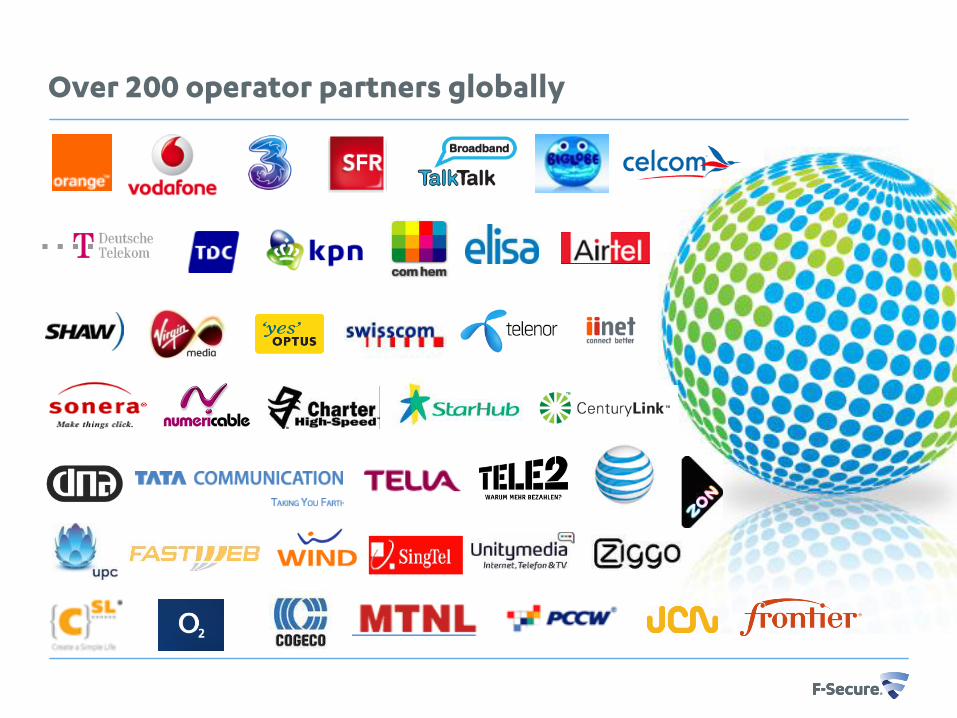
Over 200 operator partners globally
Products and Services
Products and services
18
19
Awards highlight
• F-Secure Internet Security 2011, won “Product of the Year” award issued by AV-Comparatives1)
• F-Secure Internet Security and F-Secure Anti-Virus was awarded seven out of seven of the highest possible Advanced+ scores in its various tests carried out during this year for protection and performance.
1) AV Comparatives is one of the major independent testing organizations in the industry.
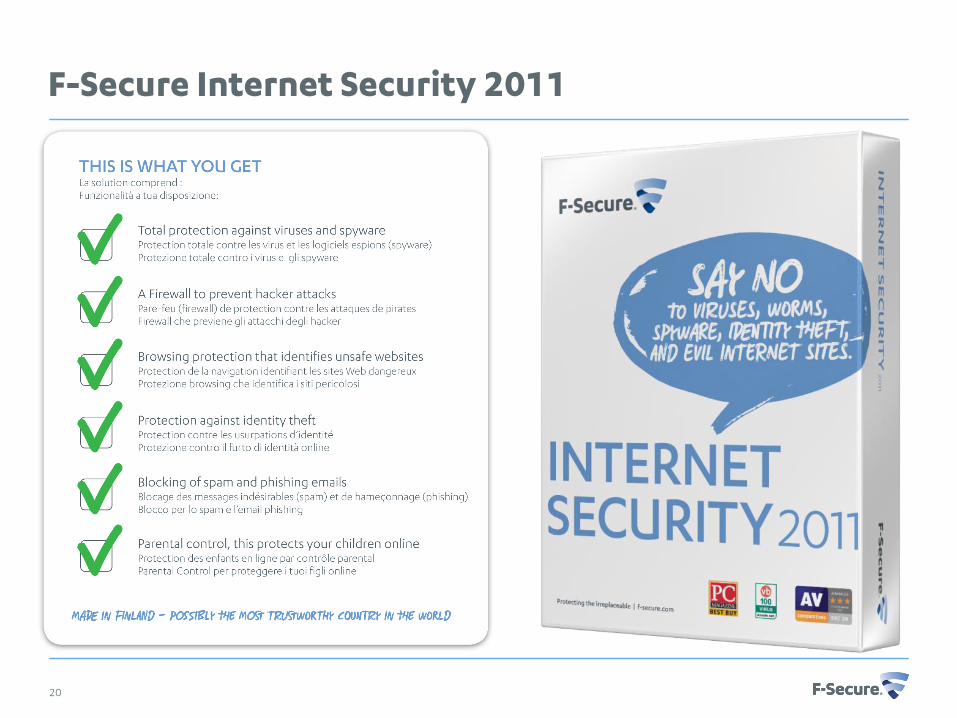
F-Secure Internet Security 2011
20
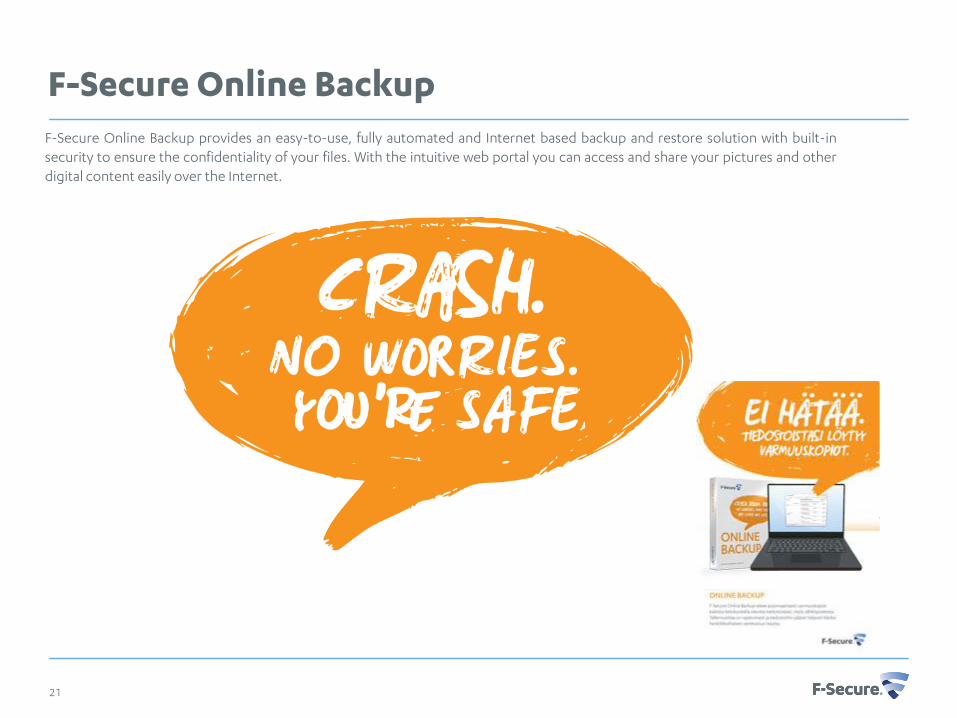
F-Secure Online Backup
21
F-Secure Online Backup provides an easy-to-use, fully automated and Internet based backup and restore solution with built-insecurity to ensure the confidentiality of your files. With the intuitive web portal you can access and share your pictures and otherdigital content easily over the Internet.
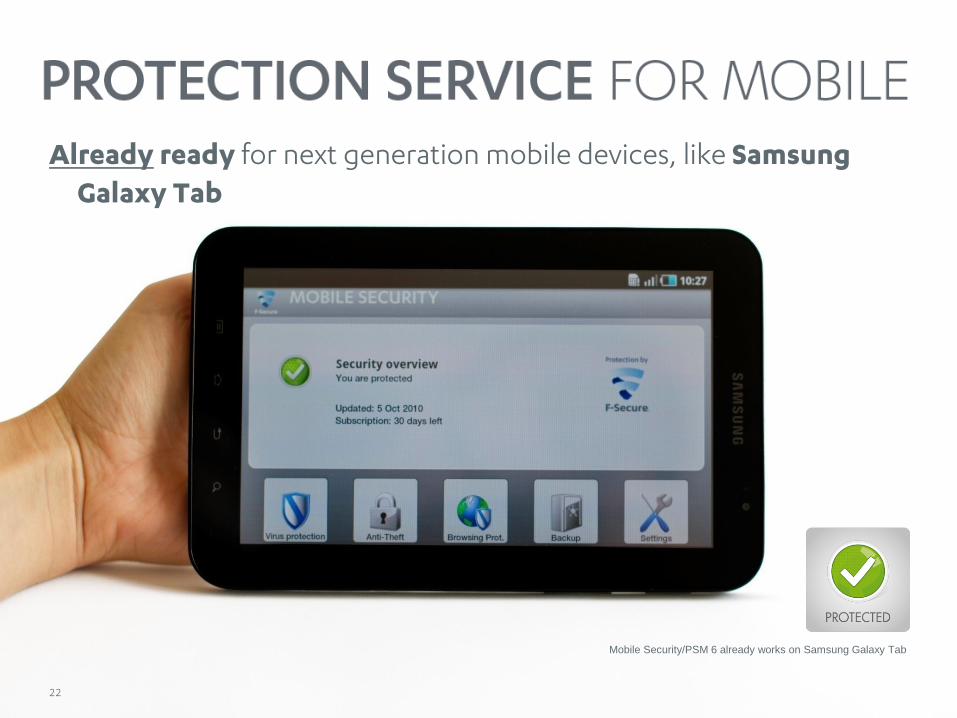
Already ready for next generation mobile devices, like Samsung Galaxy Tab
22
Mobile Security/PSM 6 already works on Samsung Galaxy Tab

Outlook
© F-Secure Corporation23
Market overview
• The growth of Internet users grew by 200m close to 2b in one year
• Global Internet penetration is still globally below 30%; in Asia it is slightly over 20%, in Europe close 60%, and in North America close to 80%(Source: Internet World Stats, U.S. Census Bureau, Jun. 2010)
• The Security software market as a total is attractive globally.
• The global security software revenue worldwide estimate for 2010 is $16.5bn, reflecting a 10% annual growth rate for 2010. Consumer security software growth is expected to show CAGR of 6.5% 2007-2014 (Source: Gartner Jul. 2010).
• The demand for Value Added Services, like Internet security, storage services, is driven by the expansion of the Internet users and IP connected devices.
24
Operators drive Internet expansion. Long-term market opportunities are attractive for F-Secure.
25
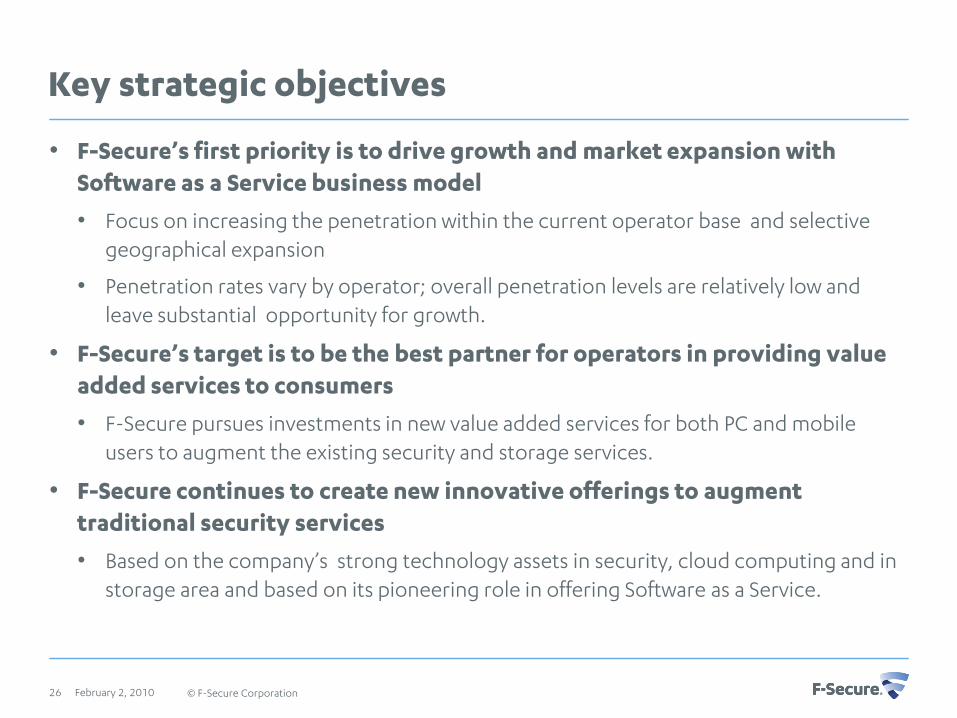
Key strategic objectives
• F-Secure’s first priority is to drive growth and market expansion with Software as a Service business model
• Focus on increasing the penetration within the current operator base and selective geographical expansion
• Penetration rates vary by operator; overall penetration levels are relatively low and leave substantial opportunity for growth.
• F-Secure’s target is to be the best partner for operators in providing value added services to consumers
• F-Secure pursues investments in new value added services for both PC and mobile users to augment the existing security and storage services.
• F-Secure continues to create new innovative offerings to augment traditional security services
• Based on the company’s strong technology assets in security, cloud computing and in storage area and based on its pioneering role in offering Software as a Service.
© F-Secure CorporationFebruary 2, 201026
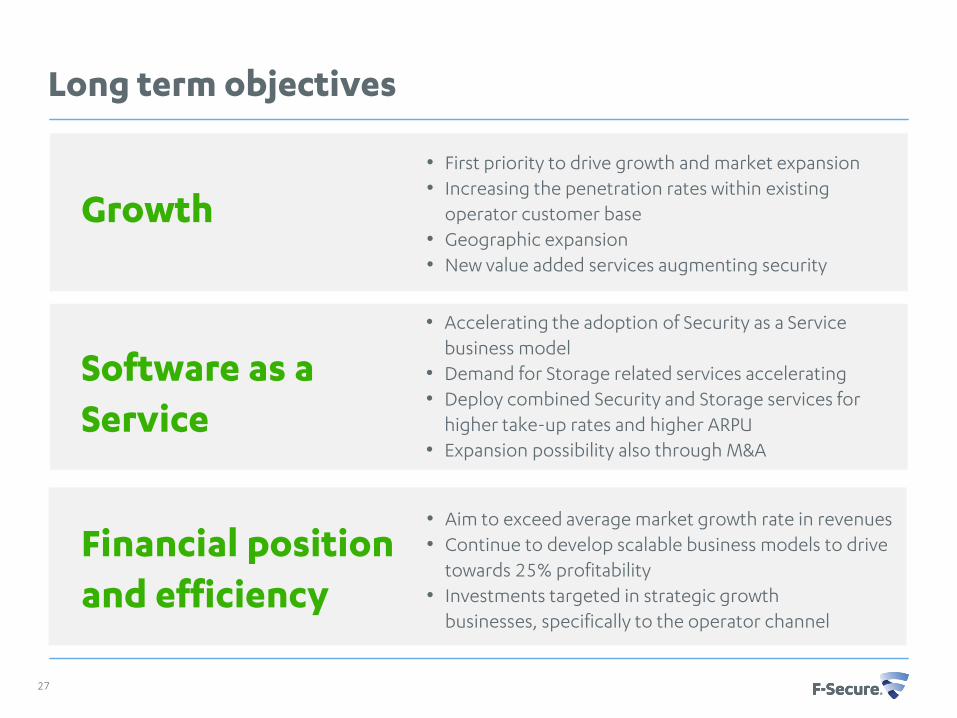
Long term objectives
Growth• First priority to drive growth and market expansion• Increasing the penetration rates within existing
operator customer base• Geographic expansion• New value added services augmenting security
• Accelerating the adoption of Security as a Service business model
• Demand for Storage related services accelerating• Deploy combined Security and Storage services for
higher take-up rates and higher ARPU• Expansion possibility also through M&A
• Aim to exceed average market growth rate in revenues • Continue to develop scalable business models to drive
towards 25% profitability • Investments targeted in strategic growth
businesses, specifically to the operator channel
Software as a Service
Financial position and efficiency
27
Outlook for 2011
• The market opportunity for 2011 looks attractive.
• The growth is driven by Software as a Service business; security sales, storage related project deliveries and storage service sales.
• The management estimates annual revenue growth to accelerate to around 10%.
• Annual profitability is expected to improve from 2010 level at a comparable pace to revenue growth (compared to 2010 EBIT excl. re-structuring).
• Revenue growth is expected to accelerate and profitability to improve after the first quarter.
28
1The estimates are based on the sales pipeline at the time of publishing, existing subscriptions, support contracts and exchange rates previous experience

Thank you!
Forward-looking statements:
Certain statements in this presentation are forward-looking, and the actual outcome could be materially different. Such forward-lookings tatements are based on F-Secure’s present plans, estimates, assumptions, projections and expectations and are subject to risks and uncertainties. In addition to the factors explicitly discussed, other could have a material effect on the actual outcome. Such factors include, but are not limited to, general economic and political conditions, fluctuations in exchange rates, interest rates, outcome of external research studies, technological issues, interruptions of business, products, actions of courts, regulators, government agencies, competitors, customers, suppliers, employees and all other parties.
29