Embed Size (px)
Citation preview
-
10/27/2016
Interim Report 1 Jan–30 Sep 2016
1 (22)
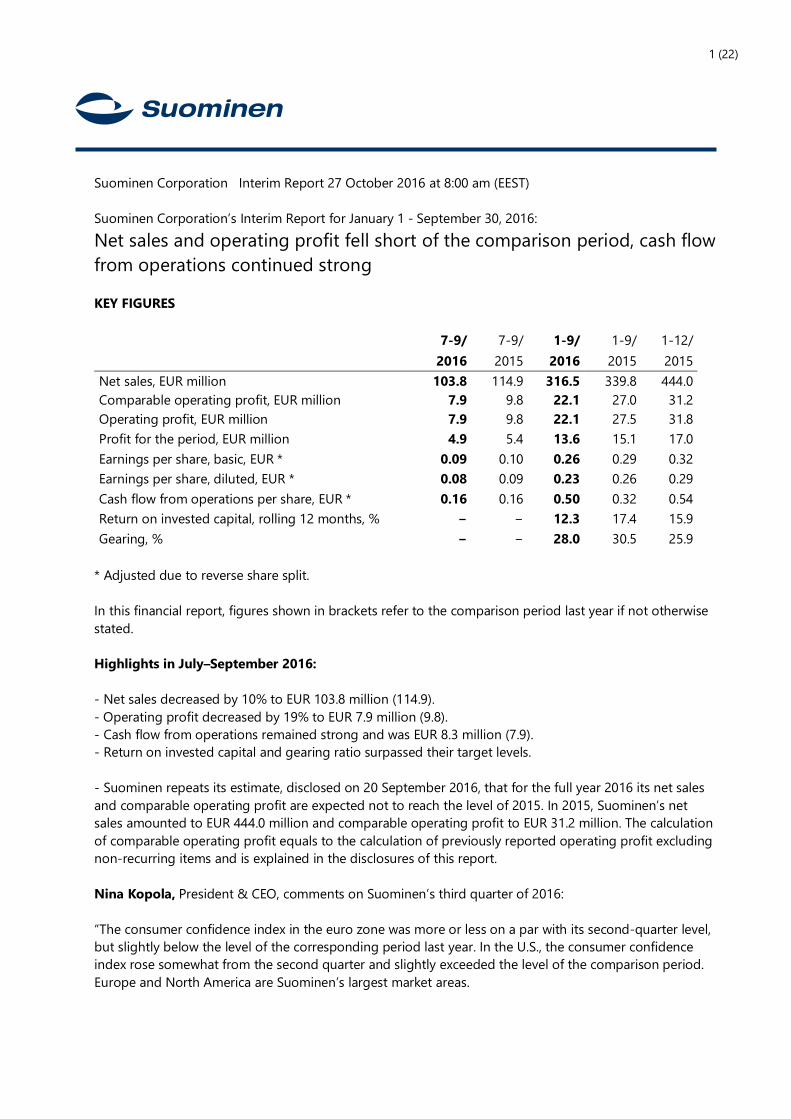
Suominen Corporation Interim Report 27 October 2016 at 8:00 am (EEST) Suominen Corporation’s Interim Report for January 1 - September 30, 2016:
Net sales and operating profit fell short of the comparison period, cash flow from operations continued strong KEY FIGURES 7-9/ 7-9/ 1-9/ 1-9/ 1-12/ 2016 2015 2016 2015 2015 Net sales, EUR million 103.8 114.9 316.5 339.8 444.0 Comparable operating profit, EUR million 7.9 9.8 22.1 27.0 31.2 Operating profit, EUR million 7.9 9.8 22.1 27.5 31.8 Profit for the period, EUR million 4.9 5.4 13.6 15.1 17.0 Earnings per share, basic, EUR * 0.09 0.10 0.26 0.29 0.32 Earnings per share, diluted, EUR * 0.08 0.09 0.23 0.26 0.29 Cash flow from operations per share, EUR * 0.16 0.16 0.50 0.32 0.54 Return on invested capital, rolling 12 months, % − − 12.3 17.4 15.9 Gearing, % − − 28.0 30.5 25.9
* Adjusted due to reverse share split. In this financial report, figures shown in brackets refer to the comparison period last year if not otherwise stated. Highlights in July–September 2016: - Net sales decreased by 10% to EUR 103.8 million (114.9). - Operating profit decreased by 19% to EUR 7.9 million (9.8). - Cash flow from operations remained strong and was EUR 8.3 million (7.9). - Return on invested capital and gearing ratio surpassed their target levels. - Suominen repeats its estimate, disclosed on 20 September 2016, that for the full year 2016 its net sales and comparable operating profit are expected not to reach the level of 2015. In 2015, Suominen’s net sales amounted to EUR 444.0 million and comparable operating profit to EUR 31.2 million. The calculation of comparable operating profit equals to the calculation of previously reported operating profit excluding non-recurring items and is explained in the disclosures of this report. Nina Kopola, President & CEO, comments on Suominen’s third quarter of 2016: “The consumer confidence index in the euro zone was more or less on a par with its second-quarter level, but slightly below the level of the corresponding period last year. In the U.S., the consumer confidence index rose somewhat from the second quarter and slightly exceeded the level of the comparison period. Europe and North America are Suominen’s largest market areas.
2 (22)
In the third quarter, deliveries fell short of our expectations, and Suominen’s net sales declined from the comparison period to EUR 103.8 million. The decline in net sales was reflected in the operating profit, which fell to EUR 7.9 million. Thanks to the favorable development of the product portfolio, the gross profit margin remained more or less on the solid level of the comparison period, and the operating profit margin was 7.6%. Owing to, among other things, good capital management, Suominen’s cash flow from operations continued to be very strong, at EUR 8.3 million. As we communicated on 20 September, 2016, Suominen’s net sales and comparable operating profit will not reach the level of 2015 level in 2016. We have implemented our strategy with determination, but the projects included in the growth investment program and our R&D efforts are creating growth at a slower pace than we had anticipated. The largest of the investment projects, i.e. the construction of a new production line in Bethune, is progressing and the equipment installation work is advancing at high speed. We reiterate our estimate according to which the new production line will begin deliveries to customers in the first quarter of 2017. Suominen has three financial targets: organic net sales growth, return on invested capital and gearing ratio. We follow up on the latter two targets on a quarterly basis, and net sales growth on an annual level. At the end of September, the return on invested capital exceeded the target level (more than 12%) and was 12.3%. Our gearing was also once again lower than our target range (40–80%), at 28.0%.” NET SALES July–September 2016 In July–September 2016, Suominen’s net sales declined by 10% from the comparison period last year to EUR 103.8 million (114.9). Decrease in sales volumes was the primary reason for the decline in net sales. Fluctuations in USD/EUR exchange rate did not have any material effect on the net sales in the third quarter. Suominen has two business areas, Convenience and Care. Convenience business area supplies nonwovens as roll goods for a wide range of wiping products. Care business area manufactures nonwovens for hygiene products and medical applications. Net sales of the Convenience business area in July–September were EUR 96.7 million (107.5) and net sales of the Care business area EUR 7.1 million (7.5). January–September 2016 In January–September 2016, Suominen’s net sales decreased by 7% from the comparison period last year to EUR 316.5 million (339.8). Net sales were affected by both lower sales prices and volumes compared to last year, approximately in equal proportions. In January-September, sales volumes did not reach the level of the comparison period as the first quarter of 2016 was soft, and the third quarter of 2016 fell short of the company’s expectations. The changes in US dollar exchange rate had no effect on the net sales during January–September 2016. Net sales of the Convenience business area were EUR 293.0 million (315.2) and net sales of the Care business area EUR 23.5 million (24.7). The main application areas for nonwoven materials supplied by Suominen in January–September were baby wipes (accounting for 37% of the sales), personal care wipes (26%), household wipes (18%), wipes for workplace use (10%), and hygiene and medical products (7%). All nonwovens for wiping products
3 (22)
belong to the Convenience business area and nonwovens for hygiene and medical products to the Care business area. The share of nonwovens for baby wipes in the net sales decreased from the comparison period by three percentage points. Of the products with higher added value, nonwovens for personal care and household wipes increased their respective shares in the portfolio. The changes in the product portfolio were in line with Suominen’s strategy. OPERATING PROFIT AND RESULT July–September 2016 The operating profit decreased by 19% and amounted to EUR 7.9 million (9.8). Declined net sales impacted operating profit. USD/EUR exchange rate fluctuation had no impact on operating profit. In the review period, Suominen recognized a bad debt provision of approximately EUR 0.3 million relating to customers having operations in Venezuela. Profit before income taxes was EUR 7.0 million (8.5), and profit for the quarter was EUR 4.9 million (5.4). January–September 2016 The comparable operating profit fell by 18% to EUR 22.1 million (27.0). Operating profit decreased by 20% and amounted to EUR 22.1 million (27.5). The operating profit of the comparison period last year was improved by the reversal of the impairment loss due to re-opening of a production line in Nakkila plant in Finland, which has been eliminated from the comparable operating profit of the corresponding period in 2015. Lower net sales and decrease in gross profit had an impact on operating profit. USD/EUR exchange rate fluctuation had no impact on operating profit. In January–September, profit before income taxes was EUR 20.0 million (23.6), and profit for the reporting period was EUR 13.6 million (15.1). Decrease in financial expenses and income taxes improved the profit for the period. FINANCING The Group’s net interest-bearing liabilities amounted to EUR 37.9 million (36.7) at the end of the review period. The gearing ratio was 28.0% (30.5%) and the equity ratio 45.1% (44.3%). In January–September, net financial expenses were EUR -2.0 million (-3.9), or 0.6% (1.2%) of net sales. Fluctuations in exchange rates decreased the financial items by EUR 0.2 million, while in the comparison period they increased the financial expenses by EUR 0.9 million. Interest expenses in the review period were EUR 0.5 million lower than in the comparison period. In addition, financial expenses in the previous year increased also by EUR -0.5 million as an impairment loss of shares in a real estate company was recognized. Cash flow from operations in July–September was EUR 8.3 million (7.9) and in January–September EUR 25.0 million (16.3), representing a cash flow per share of EUR 0.50 (0.32). The improvement in the cash flow from operations was mainly due to the fact that less working capital was tied up during the reporting period than during the corresponding period in the previous year. In addition, the decrease in paid financial items and income taxes also improved cash flow. The financial items in the cash flow from
4 (22)
operations, in total EUR -3.9 million (-6.7), were principally impacted by the interests of the debenture bond paid during the reporting period, while in the corresponding period in the previous year the paid financial items were burdened also by payments related to currency forward contracts hedging equity. In the first nine months, EUR 3.9 million was tied up in working capital (12.0). CAPITAL EXPENDITURE AND DEPRECIATION The gross capital expenditure in January–September totaled EUR 26.5 million (13.8) and was mainly related to the investment in a new production line at the Bethune, SC, USA plant. In addition, Suominen is in the process of renewing its ICT systems. Other investments were mainly for maintenance. Depreciation and amortization for the review period amounted to EUR 13.8 million (depreciation, amortization and impairment losses 13.6). In addition, due to the re-opening of a production line in Nakkila plant, previously made impairment losses were reversed in 2015. The reversal amounted to EUR 0.5 million. INFORMATION ON SHARES AND SHARE CAPITAL Share capital After the reverse share split, the number of Suominen’s registered shares was 51,216,232 shares on 30 September 2016, equaling to a share capital of EUR 11,860,056.00. Reverse share split The Annual General Meeting of Suominen Corporation held on 16 March 2016 decided to reduce the number of shares in the company without reducing share capital in a reverse share split procedure pursuant to the Chapter 15, Section 9 of the Limited Liability Companies Act (624/2005) so that each five (5) shares shall be merged as one (1) share. Before the reverse share split, Suominen Corporation had in total 252,425,616 shares. After the reverse share split, the total number of shares in Suominen Corporation is 51,216,232. The new number of shares was registered with the Trade Register on 22 March 2016 and trading with the merged shares commenced on the same day. The reverse split did not have an impact on the treasury shares held by Suominen (913,886 shares at the date of the reverse split). In accordance with the Limited Liability Companies Act, treasury shares do not entitle to shareholder rights, such as right to receive dividend or other distribution of funds, or right to attend General Meeting. The purpose of merging the shares is to increase the interest for the company’s shares, facilitate the trade in the shares and to increase flexibility in defining the amount of dividend. Share trading and price The number of Suominen Corporation shares traded on Nasdaq Helsinki from 1 January to 30 September 2016 was 11,223,414 shares, accounting for 22.3% of the average number of shares (excluding treasury shares). The highest price was EUR 6.20, the lowest EUR 3.61 and the volume-weighted average price EUR 4.34. The closing price at the end of review period was EUR 3.87. The market capitalization (excluding treasury shares) was EUR 194.8 million on 30 September 2016. Treasury shares On 30 September 2016, Suominen Corporation held 893,087 treasury shares. In accordance with the
5 (22)
resolution by the Annual General Meeting, in total 20,799 shares were transferred in June to the members of the Board of Directors as their remuneration payable in shares during the reporting period. Hybrid bond In February 2014, Suominen Corporation issued a convertible hybrid bond of EUR 17.5 million. The holders of the bond notes are entitled to convert the notes and the potential accrued capitalized interest related to the notes into Suominen shares. The conversion period started on 11 February 2014 and will end on 10 February 2018. The number of shares in Suominen may increase in total by maximum of 7,600,320 shares on the basis of the conversion of the remaining bond notes and the potential capitalized interest, if the conversion is carried out by issuing new shares in Suominen. Share-based incentive plans for the management and key employees The Group management and key employees participate the company’s share-based incentive plan. The share-based incentive plan is divided into Performance Share Plan and Matching Share Plan. The plans are described in detail in the Financial Statements 2015 and in the Remuneration Statement 2015 of Suominen Corporation, available on the company’s website, www.suominen.fi > Investors > Corporate Governance. The terms and conditions of the share-based incentive plans have been technically adjusted after the reverse share split carried out in the review period. ANNUAL GENERAL MEETING The Annual General Meeting (AGM) of Suominen Corporation was held on 16 March 2016. The AGM decided that a dividend or EUR 0.02 per share will be paid for the financial year 2015. The AGM adopted the financial statements and the consolidated financial statements for the financial year 2015 and discharged the members of the Board of Directors and the President & CEO from liability. The AGM confirmed the number of members of the Board of Directors to be six (6). The AGM re-elected Mr. Andreas Ahlström, Mr. Risto Anttonen, Mr. Jorma Eloranta, Mr. Hannu Kasurinen, Ms. Laura Raitio and Ms. Jaana Tuominen as members of the Board of Directors for the next term of office, expiring at the end of the first Annual General Meeting following their election. The remuneration of the members of the Board of Directors was resolved to remain unchanged. The resolutions were in accordance with the proposals submitted by the Nomination Board of shareholders of Suominen. Ernst & Young Oy, accountant firm, was elected as auditor of Suominen Corporation, with Ms. Kristina Sandin, Authorized Public Accountant, as the principal auditor. The AGM decided that the auditor's fee would be paid according to the invoice accepted by the company. The decisions were in accordance with the proposal of the Board of Directors and the recommendation by the Audit Committee. The AGM resolved to amend the company’s Articles of Association so that the limitation regarding Board members age was be removed from article 4 of the Articles of Association and that in the future the Chair of the Board of Directors is elected by the General Meeting instead of the Board of Directors. In addition a corresponding technical addition were made to the article 13 of the Articles of Association. The decision to amend the Articles of Association was in accordance with the proposal of the Board of Directors.
6 (22)
The AGM decided to amend the Section 1 of the resolution by the General Meeting on 26 March 2013 regarding the establishment of the permanent Shareholders’ Nomination Board. The change was related to the earlier decision taken by the AGM to amend the Articles of Association and was made in accordance with the proposal by the Board of Directors. The AGM decided that the number of all shares in the company shall be reduced without reducing share capital in a reverse share split procedure pursuant to the Chapter 15, Section 9 of the Limited Liability Companies Act (624/2005) (“Companies Act”) so that each five (5) shares shall be merged as one (1) share. The decision was in accordance with the proposal by the Board of Directors. The AGM decided to authorize the Board of Directors to decide on the repurchase of the company's own shares, on the share issue and granting of options and other special rights entitling to shares referred to in Chapter 10, Section 1 of the Companies Act. The valid authorizations of the Board of Directors are explained on page 6 of this interim report. Constitutive meeting and permanent committees of the Board of Directors In its constitutive meeting held after the Annual General Meeting on 16 March 2016, the Board of Directors elected from among its members a Chair and Deputy Chair as well as members for the Audit Committee and Personnel and Remuneration Committee. The Board of Directors re-elected Jorma Eloranta as Chair and Risto Anttonen as Deputy Chair of the Board of Directors, in accordance with the recommendation by the Nomination Board of Suominen’s shareholders. Hannu Kasurinen was re-elected as Chair of the Audit Committee. Andreas Ahlström was re-elected and Jaana Tuominen elected as members of the Audit Committee. Jorma Eloranta was re-elected as Chair of the Personnel and Remuneration Committee. Risto Anttonen was re-elected and Laura Raitio elected as members. Authorizations of the Board of Directors The Annual General Meeting (AGM) held on 16 March 2016 authorized the Board of Directors to repurchase a maximum of 400,000 of the company’s own shares. The shares shall be repurchased to be used in company’s share-based incentive programs, in order to disburse the remuneration of the members of the Board of Directors, for use as consideration in acquisitions related to the company’s business, or to be held by the company, to be conveyed by other means or to be cancelled. The company’s own shares shall be repurchased otherwise than in proportion to the holdings of the shareholders by using the non-restricted equity through trading on regulated market organized by Nasdaq Helsinki Ltd at the market price prevailing at the time of acquisition. The repurchase authorization is valid until 30 June 2017. The AGM held on 16 March 2016 authorized the Board of Directors to decide on issuing new shares and/or conveying the company’s own shares held by the company and/or granting special rights entitling to shares referred to in Chapter 10, Section 1 of the Finnish Limited Liability Companies Act. New shares may be issued and/or company’s own shares held by the company or its group company may be conveyed at the maximum amount of 5,000,000 shares in aggregate. The maximum number of new shares that may be subscribed and own shares held by the company that may be conveyed by virtue of the options and other special rights granted by the company is 5,000,000 shares in total which number is
7 (22)
included in the maximum number stated earlier. The authorization is valid until 30 June 2019. NOTIFICATIONS UNDER CHAPTER 9, SECTION 5 OF THE SECURITIES MARKET ACT On 10 June 2016, Suominen Corporation received a notification in accordance with Chapter 9, Section 5 of the Securities Market Act. According to the notification, the total shareholding of Mr. Erkki Etola and companies under his controlling power in Suominen Corporation has exceeded the 10% flagging threshold. According to the notification, Mr. Erkki Etola and companies under his controlling power (Oy Etra Invest Ab and Tiiviste-Group Oy) hold 4,139,164 shares and votes directly (8.08% of all shares and votes) and 1,477,080 shares and votes through financial instruments (2.88% of all shares and votes). BUSINESS RISKS AND UNCERTAINTIES The estimate on the development of Suominen’s net sales is partially based on forecasts and delivery plans received from the company’s customers. Changes in these forecasts and plans, resulting from changes in the market conditions or in customers’ inventory levels, may affect Suominen’s net sales. Due to the continued uncertainty in the general economic situation and the cautious consumer purchasing habits, the forecasts include uncertainty. Suominen’s customer base is fairly concentrated, which adds to the customer-specific risk. Long-term contracts are preferred in the case of the largest customers. In practice, the customer relationships are long-term and last for several years. The relevance of the United States in Suominen’s business operations increases the significance of the exchange rate risk related to USD in the Group’s total exchange risk position. Suominen hedges this foreign exchange position in accordance with its hedging policy. The risks that are characteristic to South American region, including significant changes in business environment or exchange rates, could have an impact on Suominen’s operations in Brazil. Suominen purchases significant amounts of pulp- and oil-based raw materials annually. Raw materials are the largest cost item for operations. Rapid changes in the global market prices of raw materials have an impact on the company’s profitability. The price fluctuations affect Suominen’s financial result quickly, as the company’s stocks equal to two to four weeks’ consumption and passing the price changes on to the prices Suominen charges its contract customers takes between two to five months. Extended interruptions in the supply of Suominen’s main raw materials could disrupt production and have a negative impact on the Group’s overall business operations. As Suominen sources its raw materials from a number of major international suppliers, significant interruptions are unlikely. Suominen has numerous regional, national and international competitors in its different product groups. There is currently oversupply in several product groups, particularly in Europe. If Suominen is not able to compete through an attractive product offering, it may lose some of its market share, and the competition may lead to increased pricing pressure on the company’s products. Suominen continuously invests in its manufacturing facilities. The deployment of the investments may delay from what was planned, the costs of the investments may increase from what has been expected or the investments may create less business benefits than anticipated. The deployment phase of investments may cause temporary interruptions in operations.
8 (22)
The Group’s damage risks are insured in order to guarantee the continuity of operations. Suominen has valid damage and business interruption insurance according to which it is estimated that the damages can be covered and the financial losses caused by an interruption compensated. Suominen performs goodwill impairment testing annually. In impairment testing the recoverable amounts are determined as the value in use, which comprises of the discounted projected future cash flows. Actual cash flows can differ from the discounted projected future cash flows. Uncertainties related to the projected future cash flows include, among others, the long economic useful life of the assets as well as the changes in the forecasted sales prices of Suominen’s products, production costs as well as discount rates used in testing. Due to the uncertainty inherent in the future, it is possible that Suominen’s recoverable amounts will be insufficient to cover the carrying amounts of assets, particularly goodwill. If this happens, it will be necessary to recognize an impairment loss, which, when implemented, will weaken the result and equity. The Group’s financial risks consist of foreign exchange, interest rate, credit, counterparty, liquidity and commodity risks. Due to the international scope of the business, the Group has risks arising from fluctuations in foreign exchange rates. The effect of changes in interest rate levels on Group result represent an interest rate risk. Credit and counterparty risks arise mainly from risks associated with the payment period granted to customers and, in the case of loan receivables, from the ability of the counterparty to repay the loans. Liquidity risk is the risk that the Group’s negotiated credit facilities are insufficient to cover the financial needs of the business or that obtaining new funding for these needs will cause a significant increase in financing costs. General risks related to business operations are described in the Report of the Board of Directors 2015. BUSINESS ENVIRONMENT Suominen’s nonwovens are, for the most part, used in daily consumer goods, such as wet wipes as well as in hygiene and medical products. In these target markets of Suominen, the general economic situation determines the development of consumer demand, even though the demand for consumer goods is not very cyclical in nature. North America and Europe are the largest market areas for Suominen. At these market areas, the growth in the demand for nonwovens has typically exceeded the growth of gross domestic product by a couple of percentage points. Moreover, Suominen has operated in the growing South American markets since 2014. The consumer confidence index in the euro zone was more or less on a par with its second-quarter level, but slightly below the level of the corresponding period last year. In the U.S., the consumer confidence index rose somewhat from the second quarter and slightly exceeded the level of the comparison period. Suominen assesses the trend in the demand for its products on the basis of both the general market situation and, above all, on the basis of the framework agreements drawn up with its customers. Due to the new manufacturing capacity that has entered to the markets during the last 12 months, assessing the competitive situation during the review period was more challenging than earlier. At large, the growth in the demand in Suominen’s target markets is expected to continue in 2016, on average, at the pace of 2015.
9 (22)
OUTLOOK FOR 2016 Suominen repeats its estimate, disclosed on 20 September 2016, that for the full year 2016 the company expects its net sales and comparable operating profit not to reach the level of 2015. In 2015, Suominen’s net sales amounted to EUR 444.0 million and comparable operating profit to EUR 31.2 million. The calculation of comparable operating profit equals to the calculation of previously reported operating profit excluding non-recurring items and is explained in the disclosures of this report. ANALYST AND PRESS CONFERENCE Nina Kopola, President & CEO, and Tapio Engström, CFO, will present Suominen’s financial result for Q3 2016 in Finnish at an analyst and press conference in Helsinki today on 27 October at 11:00 am (EEST). The conference will take place at Suominen’s Helsinki office, address Itämerentori 2. The presentation material will be available after the analyst and press conference at www.suominen.fi. A teleconference and a webcast on the Q3 2016 financial result will be held today on 27 October at 4:00 pm (EEST). The conference can be attended by phone at +44 20 3059 8125 (password: Suominen) and it is held in English. The conference can be accessed also at www.suominen.fi/webcast. A replay of the conference can be accessed shortly after the conference has ended at www.suominen.fi or by phone at +44 121 260 4861, using access code 4547869#. SUOMINEN GROUP 1 JANUARY–30 SEPTEMBER 2016 This interim report has been prepared in accordance with the principles defined in IAS 34 Interim Financial Reporting. The principles for preparing the interim report are the same as those used for preparing the consolidated financial statements for 2015. Changes to published accounting standards and interpretations, together with the new accounting standards that came into force on 1 January 2016, are presented in the consolidated financial statements for 2015. The figures in these interim financial statements are mainly presented in EUR thousands. As a result of rounding differences, the figures presented in the tables do not necessarily add up to total. This interim report has not been audited.
10 (22)
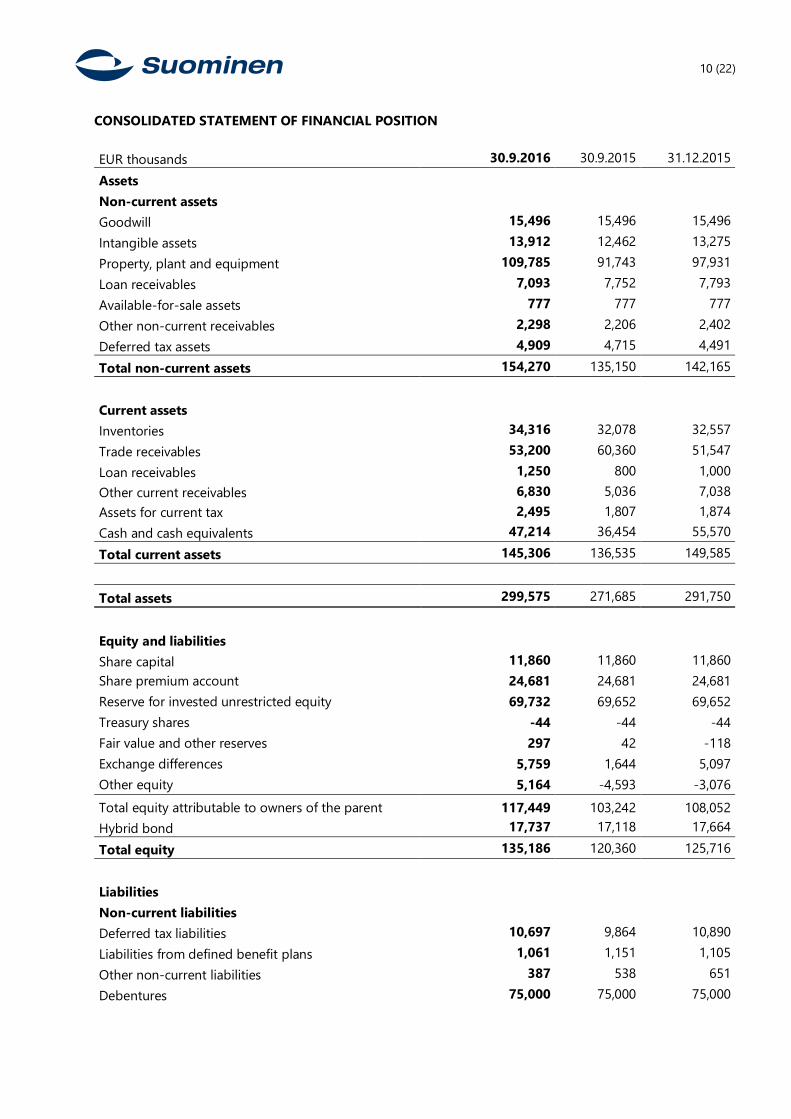
CONSOLIDATED STATEMENT OF FINANCIAL POSITION EUR thousands 30.9.2016 30.9.2015 31.12.2015 Assets
Non-current assets
Goodwill 15,496 15,496 15,496 Intangible assets 13,912 12,462 13,275 Property, plant and equipment 109,785 91,743 97,931 Loan receivables 7,093 7,752 7,793 Available-for-sale assets 777 777 777 Other non-current receivables 2,298 2,206 2,402 Deferred tax assets 4,909 4,715 4,491 Total non-current assets 154,270 135,150 142,165
Current assets
Inventories 34,316 32,078 32,557 Trade receivables 53,200 60,360 51,547 Loan receivables 1,250 800 1,000 Other current receivables 6,830 5,036 7,038 Assets for current tax 2,495 1,807 1,874 Cash and cash equivalents 47,214 36,454 55,570 Total current assets 145,306 136,535 149,585
Total assets 299,575 271,685 291,750
Equity and liabilities
Share capital 11,860 11,860 11,860 Share premium account 24,681 24,681 24,681 Reserve for invested unrestricted equity 69,732 69,652 69,652 Treasury shares -44 -44 -44 Fair value and other reserves 297 42 -118 Exchange differences 5,759 1,644 5,097 Other equity 5,164 -4,593 -3,076 Total equity attributable to owners of the parent 117,449 103,242 108,052 Hybrid bond 17,737 17,118 17,664 Total equity 135,186 120,360 125,716
Liabilities Non-current liabilities Deferred tax liabilities 10,697 9,864 10,890 Liabilities from defined benefit plans 1,061 1,151 1,105 Other non-current liabilities 387 538 651 Debentures 75,000 75,000 75,000
11 (22)
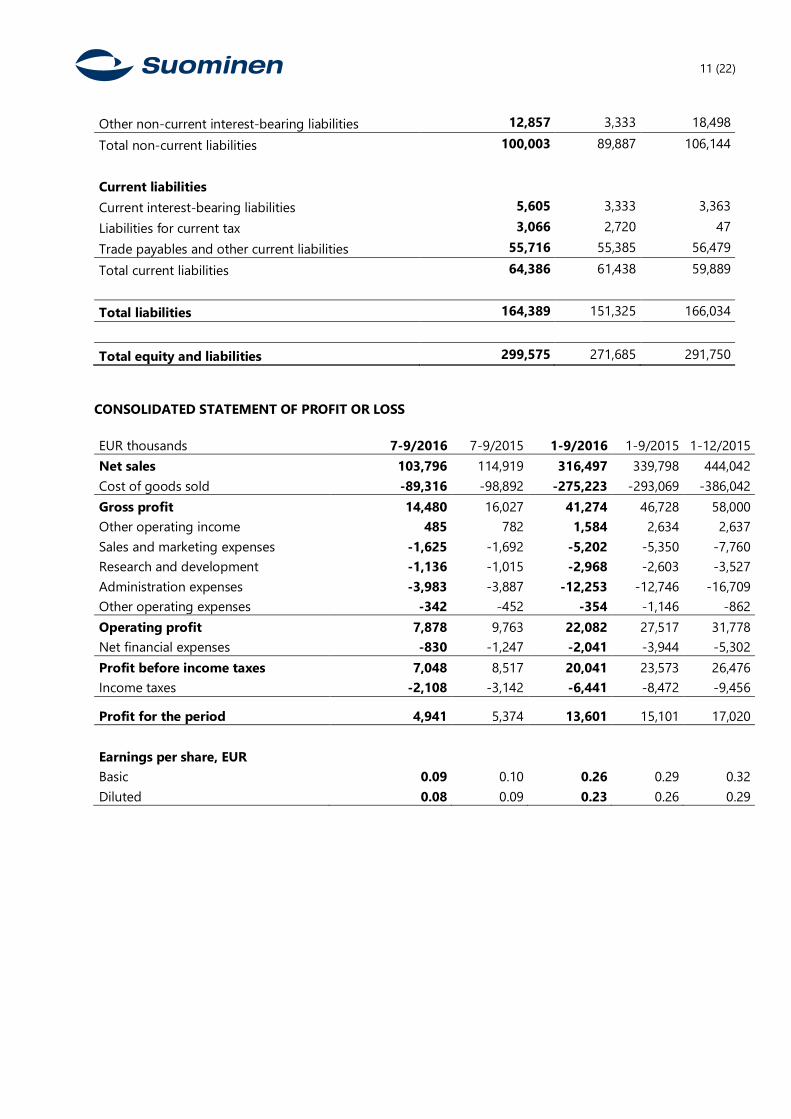
Other non-current interest-bearing liabilities 12,857 3,333 18,498 Total non-current liabilities 100,003 89,887 106,144
Current liabilities Current interest-bearing liabilities 5,605 3,333 3,363 Liabilities for current tax 3,066 2,720 47 Trade payables and other current liabilities 55,716 55,385 56,479 Total current liabilities 64,386 61,438 59,889
Total liabilities 164,389 151,325 166,034
Total equity and liabilities 299,575 271,685 291,750 CONSOLIDATED STATEMENT OF PROFIT OR LOSS EUR thousands 7-9/2016 7-9/2015 1-9/2016 1-9/2015 1-12/2015 Net sales 103,796 114,919 316,497 339,798 444,042 Cost of goods sold -89,316 -98,892 -275,223 -293,069 -386,042 Gross profit 14,480 16,027 41,274 46,728 58,000 Other operating income 485 782 1,584 2,634 2,637 Sales and marketing expenses -1,625 -1,692 -5,202 -5,350 -7,760 Research and development -1,136 -1,015 -2,968 -2,603 -3,527 Administration expenses -3,983 -3,887 -12,253 -12,746 -16,709 Other operating expenses -342 -452 -354 -1,146 -862 Operating profit 7,878 9,763 22,082 27,517 31,778 Net financial expenses -830 -1,247 -2,041 -3,944 -5,302 Profit before income taxes 7,048 8,517 20,041 23,573 26,476 Income taxes -2,108 -3,142 -6,441 -8,472 -9,456
Profit for the period 4,941 5,374 13,601 15,101 17,020
Earnings per share, EUR Basic 0.09 0.10 0.26 0.29 0.32 Diluted 0.08 0.09 0.23 0.26 0.29
12 (22)
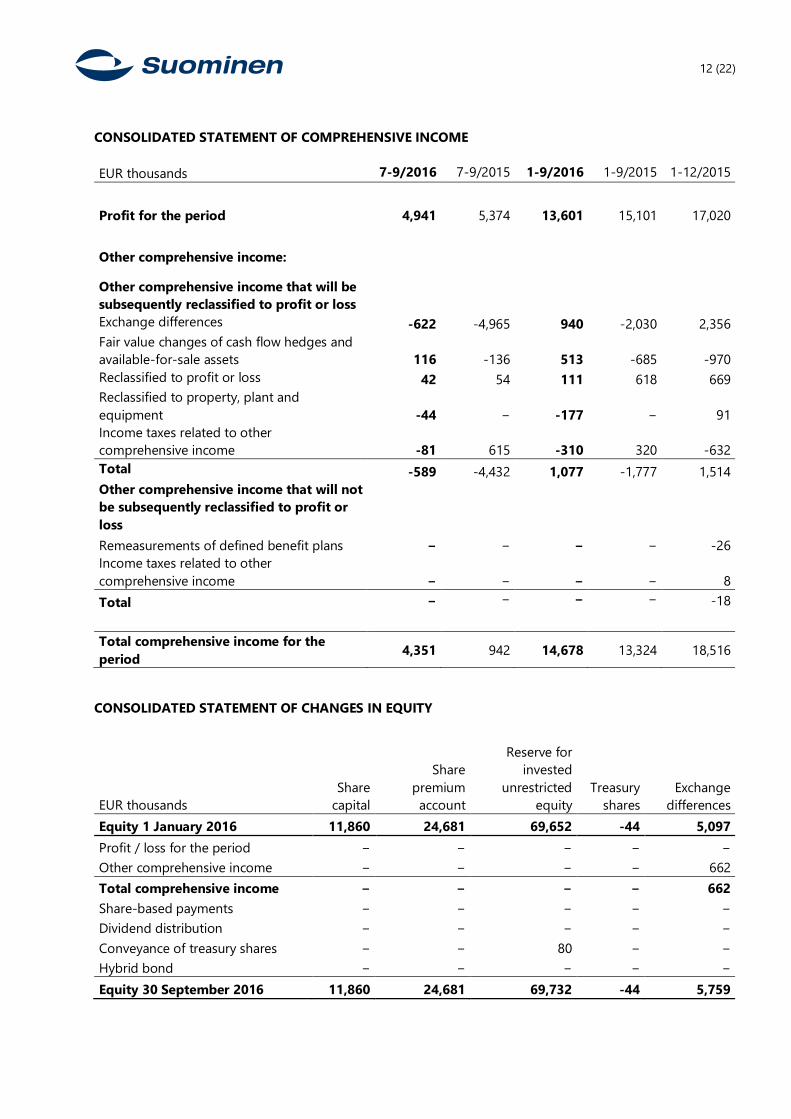
CONSOLIDATED STATEMENT OF COMPREHENSIVE INCOME EUR thousands 7-9/2016 7-9/2015 1-9/2016 1-9/2015 1-12/2015
Profit for the period 4,941 5,374 13,601 15,101 17,020
Other comprehensive income:
Other comprehensive income that will be subsequently reclassified to profit or loss Exchange differences -622 -4,965 940 -2,030 2,356 Fair value changes of cash flow hedges and available-for-sale assets 116 -136 513 -685 -970 Reclassified to profit or loss 42 54 111 618 669 Reclassified to property, plant and equipment -44 − -177 − 91 Income taxes related to other comprehensive income -81 615 -310 320 -632 Total -589 -4,432 1,077 -1,777 1,514 Other comprehensive income that will not be subsequently reclassified to profit or loss Remeasurements of defined benefit plans − − − − -26 Income taxes related to other comprehensive income − − − − 8 Total − − − − -18
Total comprehensive income for the period 4,351 942 14,678 13,324 18,516
CONSOLIDATED STATEMENT OF CHANGES IN EQUITY
EUR thousands Share
capital
Share premium account
Reserve for invested
unrestricted equity
Treasury shares
Exchange differences
Equity 1 January 2016 11,860 24,681 69,652 -44 5,097 Profit / loss for the period − − − − − Other comprehensive income − − − − 662 Total comprehensive income − − − − 662 Share-based payments − − − − − Dividend distribution − − − − − Conveyance of treasury shares − − 80 − − Hybrid bond − − − − − Equity 30 September 2016 11,860 24,681 69,732 -44 5,759
13 (22)
EUR thousands
Fair value and other
reserves Other equity Total
Hybrid bond Total equity
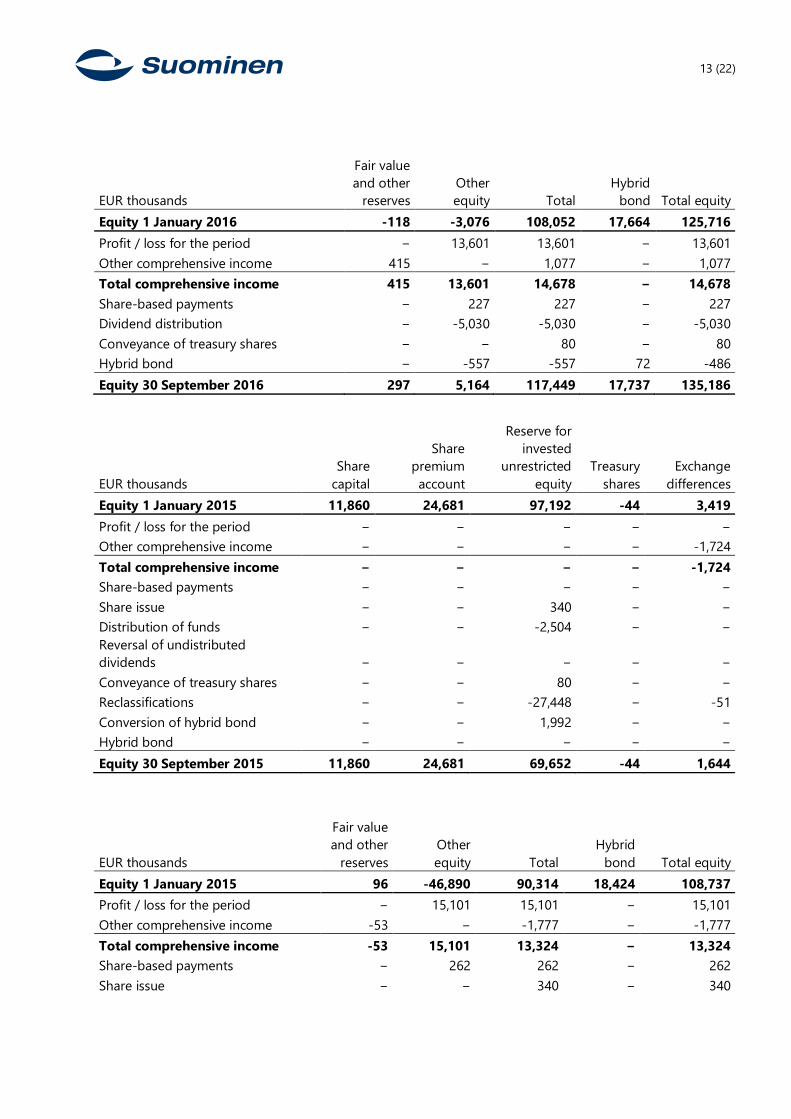
Equity 1 January 2016 -118 -3,076 108,052 17,664 125,716 Profit / loss for the period − 13,601 13,601 − 13,601 Other comprehensive income 415 − 1,077 − 1,077 Total comprehensive income 415 13,601 14,678 − 14,678 Share-based payments − 227 227 − 227 Dividend distribution − -5,030 -5,030 − -5,030 Conveyance of treasury shares − − 80 − 80 Hybrid bond − -557 -557 72 -486 Equity 30 September 2016 297 5,164 117,449 17,737 135,186
EUR thousands Share
capital
Share premium account
Reserve for invested
unrestricted equity
Treasury shares
Exchange differences
Equity 1 January 2015 11,860 24,681 97,192 -44 3,419 Profit / loss for the period − − − − − Other comprehensive income − − − − -1,724 Total comprehensive income − − − − -1,724 Share-based payments − − − − − Share issue − − 340 − − Distribution of funds − − -2,504 − − Reversal of undistributed dividends − − − − − Conveyance of treasury shares − − 80 − − Reclassifications − − -27,448 − -51 Conversion of hybrid bond − − 1,992 − − Hybrid bond − − − − − Equity 30 September 2015 11,860 24,681 69,652 -44 1,644
EUR thousands
Fair value and other
reserves Other equity Total
Hybrid bond Total equity
Equity 1 January 2015 96 -46,890 90,314 18,424 108,737 Profit / loss for the period − 15,101 15,101 − 15,101 Other comprehensive income -53 − -1,777 − -1,777 Total comprehensive income -53 15,101 13,324 − 13,324 Share-based payments − 262 262 − 262 Share issue − − 340 − 340
14 (22)
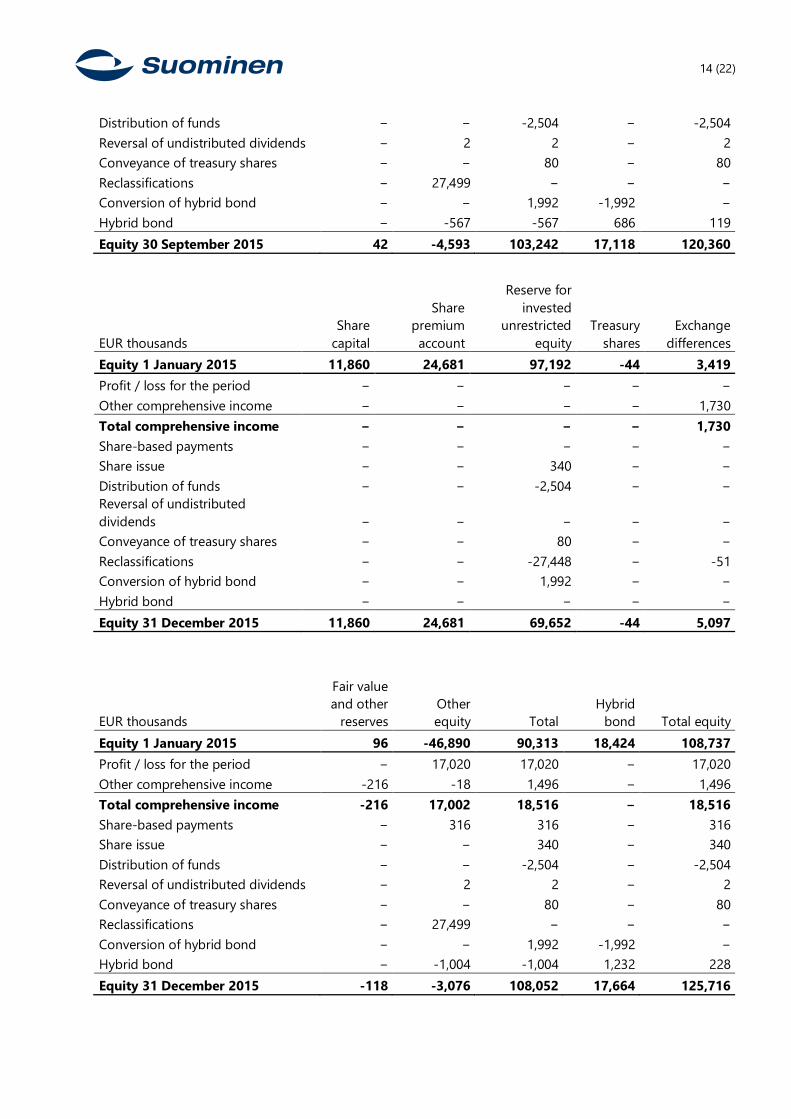
Distribution of funds − − -2,504 − -2,504 Reversal of undistributed dividends − 2 2 − 2 Conveyance of treasury shares − − 80 − 80 Reclassifications − 27,499 − − − Conversion of hybrid bond − − 1,992 -1,992 − Hybrid bond − -567 -567 686 119 Equity 30 September 2015 42 -4,593 103,242 17,118 120,360
EUR thousands Share
capital
Share premium account
Reserve for invested
unrestricted equity
Treasury shares
Exchange differences
Equity 1 January 2015 11,860 24,681 97,192 -44 3,419 Profit / loss for the period − − − − − Other comprehensive income − − − − 1,730 Total comprehensive income − − − − 1,730 Share-based payments − − − − − Share issue − − 340 − − Distribution of funds − − -2,504 − − Reversal of undistributed dividends − − − − − Conveyance of treasury shares − − 80 − − Reclassifications − − -27,448 − -51 Conversion of hybrid bond − − 1,992 − − Hybrid bond − − − − − Equity 31 December 2015 11,860 24,681 69,652 -44 5,097
EUR thousands
Fair value and other
reserves Other equity Total
Hybrid bond Total equity
Equity 1 January 2015 96 -46,890 90,313 18,424 108,737 Profit / loss for the period − 17,020 17,020 − 17,020 Other comprehensive income -216 -18 1,496 − 1,496 Total comprehensive income -216 17,002 18,516 − 18,516 Share-based payments − 316 316 − 316 Share issue − − 340 − 340 Distribution of funds − − -2,504 − -2,504 Reversal of undistributed dividends − 2 2 − 2 Conveyance of treasury shares − − 80 − 80 Reclassifications − 27,499 − − − Conversion of hybrid bond − − 1,992 -1,992 − Hybrid bond − -1,004 -1,004 1,232 228 Equity 31 December 2015 -118 -3,076 108,052 17,664 125,716
15 (22)
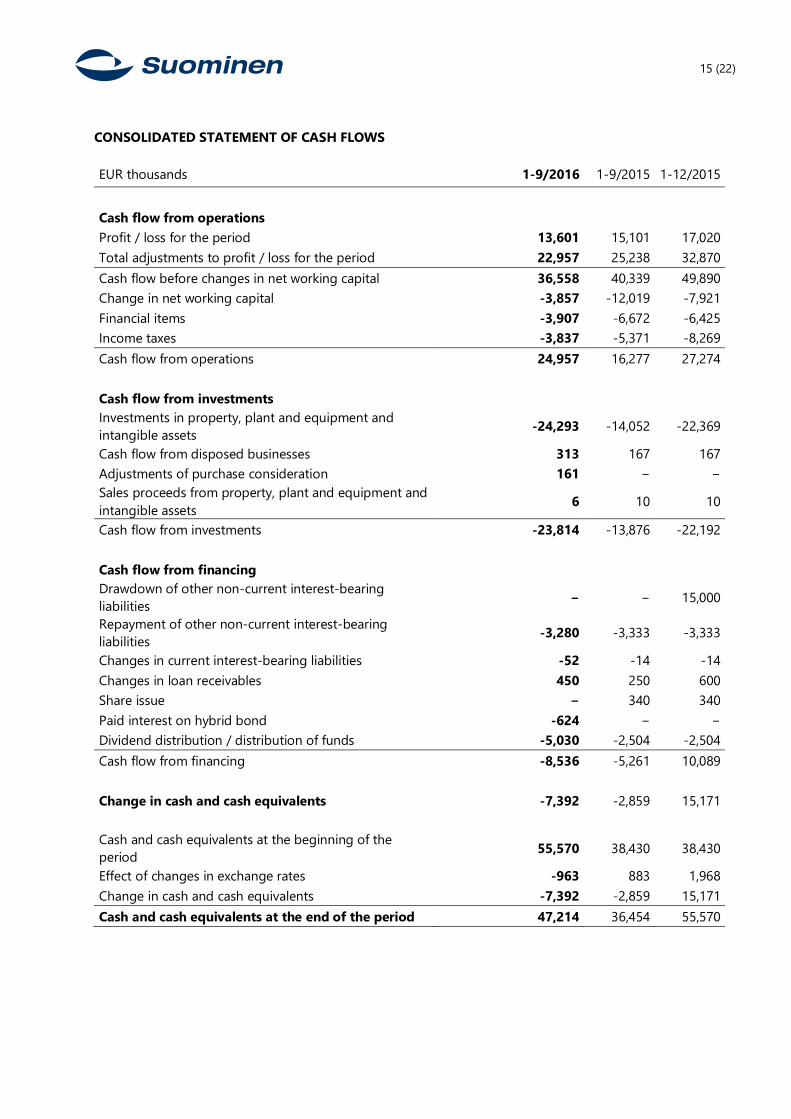
CONSOLIDATED STATEMENT OF CASH FLOWS EUR thousands 1-9/2016 1-9/2015 1-12/2015
Cash flow from operations
Profit / loss for the period 13,601 15,101 17,020 Total adjustments to profit / loss for the period 22,957 25,238 32,870 Cash flow before changes in net working capital 36,558 40,339 49,890 Change in net working capital -3,857 -12,019 -7,921 Financial items -3,907 -6,672 -6,425 Income taxes -3,837 -5,371 -8,269 Cash flow from operations 24,957 16,277 27,274
Cash flow from investments
Investments in property, plant and equipment and intangible assets -24,293 -14,052 -22,369
Cash flow from disposed businesses 313 167 167 Adjustments of purchase consideration 161 − − Sales proceeds from property, plant and equipment and intangible assets 6 10 10
Cash flow from investments -23,814 -13,876 -22,192
Cash flow from financing
Drawdown of other non-current interest-bearing liabilities − − 15,000
Repayment of other non-current interest-bearing liabilities -3,280 -3,333 -3,333
Changes in current interest-bearing liabilities -52 -14 -14 Changes in loan receivables 450 250 600 Share issue − 340 340 Paid interest on hybrid bond -624 − − Dividend distribution / distribution of funds -5,030 -2,504 -2,504 Cash flow from financing -8,536 -5,261 10,089
Change in cash and cash equivalents -7,392 -2,859 15,171
Cash and cash equivalents at the beginning of the period 55,570 38,430 38,430
Effect of changes in exchange rates -963 883 1,968 Change in cash and cash equivalents -7,392 -2,859 15,171 Cash and cash equivalents at the end of the period 47,214 36,454 55,570
16 (22)
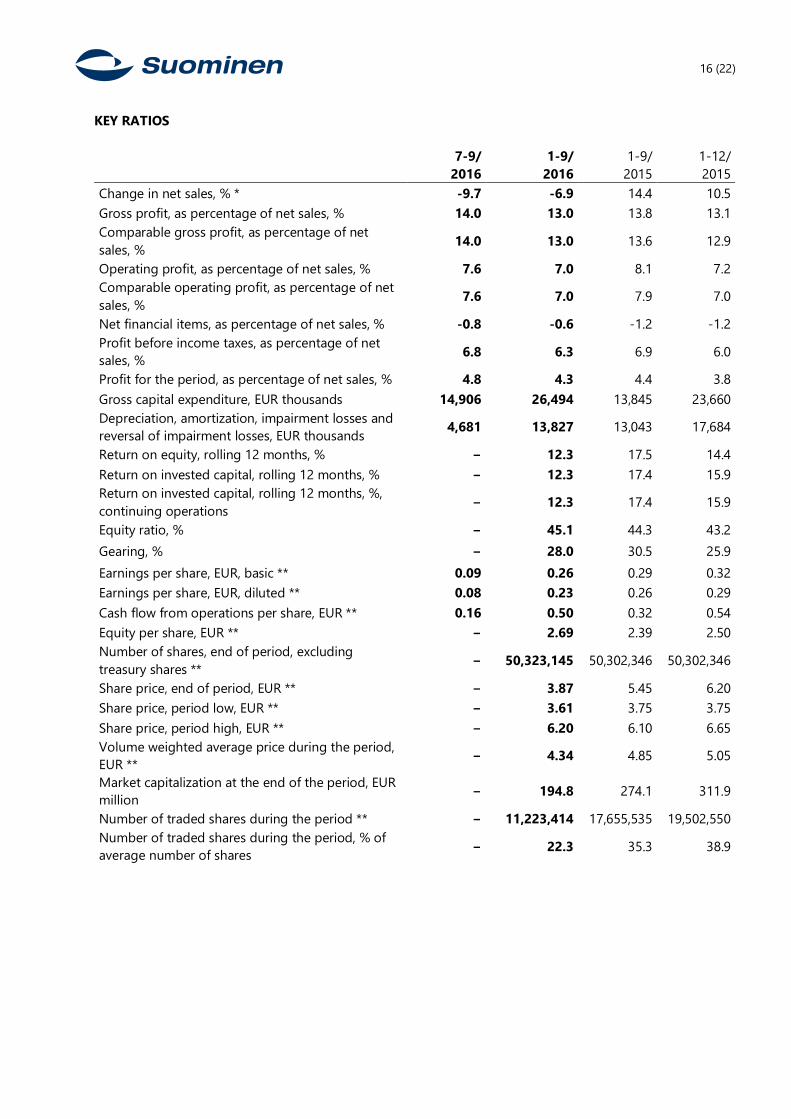
KEY RATIOS
7-9/ 2016
1-9/ 2016
1-9/ 2015
1-12/ 2015
Change in net sales, % * -9.7 -6.9 14.4 10.5 Gross profit, as percentage of net sales, % 14.0 13.0 13.8 13.1 Comparable gross profit, as percentage of net sales, % 14.0 13.0 13.6 12.9
Operating profit, as percentage of net sales, % 7.6 7.0 8.1 7.2 Comparable operating profit, as percentage of net sales, % 7.6 7.0 7.9 7.0
Net financial items, as percentage of net sales, % -0.8 -0.6 -1.2 -1.2 Profit before income taxes, as percentage of net sales, % 6.8 6.3 6.9 6.0
Profit for the period, as percentage of net sales, % 4.8 4.3 4.4 3.8 Gross capital expenditure, EUR thousands 14,906 26,494 13,845 23,660 Depreciation, amortization, impairment losses and reversal of impairment losses, EUR thousands 4,681 13,827 13,043 17,684
Return on equity, rolling 12 months, % − 12.3 17.5 14.4 Return on invested capital, rolling 12 months, % − 12.3 17.4 15.9 Return on invested capital, rolling 12 months, %, continuing operations − 12.3 17.4 15.9
Equity ratio, % − 45.1 44.3 43.2 Gearing, % − 28.0 30.5 25.9 Earnings per share, EUR, basic ** 0.09 0.26 0.29 0.32 Earnings per share, EUR, diluted ** 0.08 0.23 0.26 0.29 Cash flow from operations per share, EUR ** 0.16 0.50 0.32 0.54 Equity per share, EUR ** − 2.69 2.39 2.50 Number of shares, end of period, excluding treasury shares ** − 50,323,145 50,302,346 50,302,346
Share price, end of period, EUR ** − 3.87 5.45 6.20 Share price, period low, EUR ** − 3.61 3.75 3.75 Share price, period high, EUR ** − 6.20 6.10 6.65 Volume weighted average price during the period, EUR ** − 4.34 4.85 5.05
Market capitalization at the end of the period, EUR million − 194.8 274.1 311.9
Number of traded shares during the period ** − 11,223,414 17,655,535 19,502,550 Number of traded shares during the period, % of average number of shares − 22.3 35.3 38.9
17 (22)
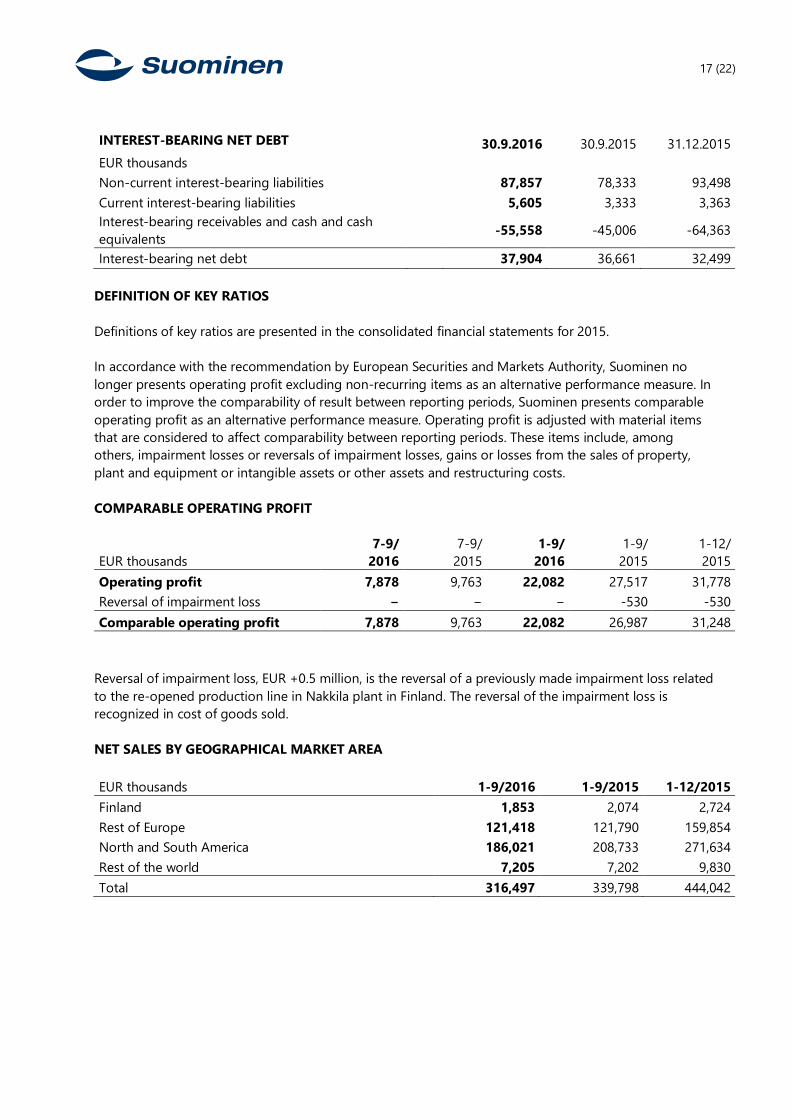
INTEREST-BEARING NET DEBT 30.9.2016 30.9.2015 31.12.2015 EUR thousands
Non-current interest-bearing liabilities 87,857 78,333 93,498 Current interest-bearing liabilities 5,605 3,333 3,363 Interest-bearing receivables and cash and cash equivalents -55,558 -45,006 -64,363
Interest-bearing net debt 37,904 36,661 32,499 DEFINITION OF KEY RATIOS Definitions of key ratios are presented in the consolidated financial statements for 2015. In accordance with the recommendation by European Securities and Markets Authority, Suominen no longer presents operating profit excluding non-recurring items as an alternative performance measure. In order to improve the comparability of result between reporting periods, Suominen presents comparable operating profit as an alternative performance measure. Operating profit is adjusted with material items that are considered to affect comparability between reporting periods. These items include, among others, impairment losses or reversals of impairment losses, gains or losses from the sales of property, plant and equipment or intangible assets or other assets and restructuring costs. COMPARABLE OPERATING PROFIT
EUR thousands 7-9/
2016 7-9/
2015 1-9/
2016 1-9/
2015 1-12/ 2015
Operating profit 7,878 9,763 22,082 27,517 31,778 Reversal of impairment loss − − − -530 -530 Comparable operating profit 7,878 9,763 22,082 26,987 31,248
Reversal of impairment loss, EUR +0.5 million, is the reversal of a previously made impairment loss related to the re-opened production line in Nakkila plant in Finland. The reversal of the impairment loss is recognized in cost of goods sold. NET SALES BY GEOGRAPHICAL MARKET AREA EUR thousands 1-9/2016 1-9/2015 1-12/2015 Finland 1,853 2,074 2,724 Rest of Europe 121,418 121,790 159,854 North and South America 186,021 208,733 271,634 Rest of the world 7,205 7,202 9,830 Total 316,497 339,798 444,042
18 (22)
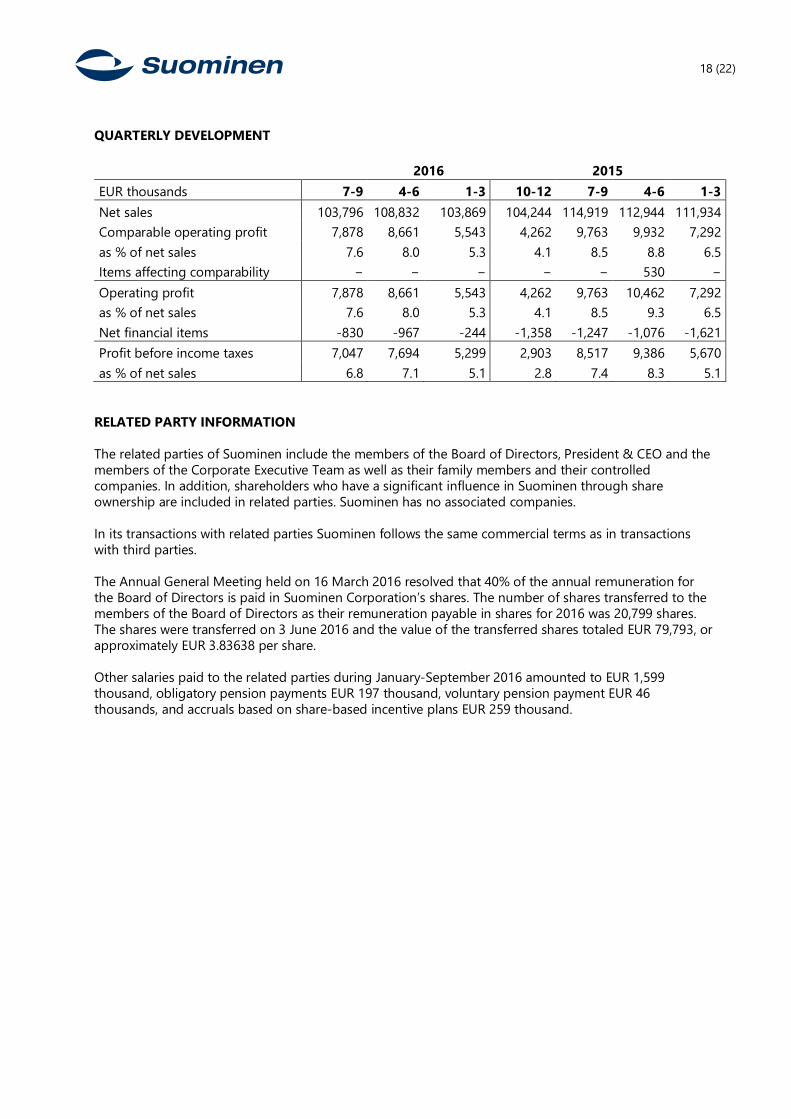
QUARTERLY DEVELOPMENT 2016 2015 EUR thousands 7-9 4-6 1-3 10-12 7-9 4-6 1-3 Net sales 103,796 108,832 103,869 104,244 114,919 112,944 111,934 Comparable operating profit 7,878 8,661 5,543 4,262 9,763 9,932 7,292 as % of net sales 7.6 8.0 5.3 4.1 8.5 8.8 6.5 Items affecting comparability − − − − − 530 − Operating profit 7,878 8,661 5,543 4,262 9,763 10,462 7,292 as % of net sales 7.6 8.0 5.3 4.1 8.5 9.3 6.5 Net financial items -830 -967 -244 -1,358 -1,247 -1,076 -1,621 Profit before income taxes 7,047 7,694 5,299 2,903 8,517 9,386 5,670 as % of net sales 6.8 7.1 5.1 2.8 7.4 8.3 5.1
RELATED PARTY INFORMATION The related parties of Suominen include the members of the Board of Directors, President & CEO and the members of the Corporate Executive Team as well as their family members and their controlled companies. In addition, shareholders who have a significant influence in Suominen through share ownership are included in related parties. Suominen has no associated companies. In its transactions with related parties Suominen follows the same commercial terms as in transactions with third parties. The Annual General Meeting held on 16 March 2016 resolved that 40% of the annual remuneration for the Board of Directors is paid in Suominen Corporation’s shares. The number of shares transferred to the members of the Board of Directors as their remuneration payable in shares for 2016 was 20,799 shares. The shares were transferred on 3 June 2016 and the value of the transferred shares totaled EUR 79,793, or approximately EUR 3.83638 per share. Other salaries paid to the related parties during January-September 2016 amounted to EUR 1,599 thousand, obligatory pension payments EUR 197 thousand, voluntary pension payment EUR 46 thousands, and accruals based on share-based incentive plans EUR 259 thousand.
19 (22)
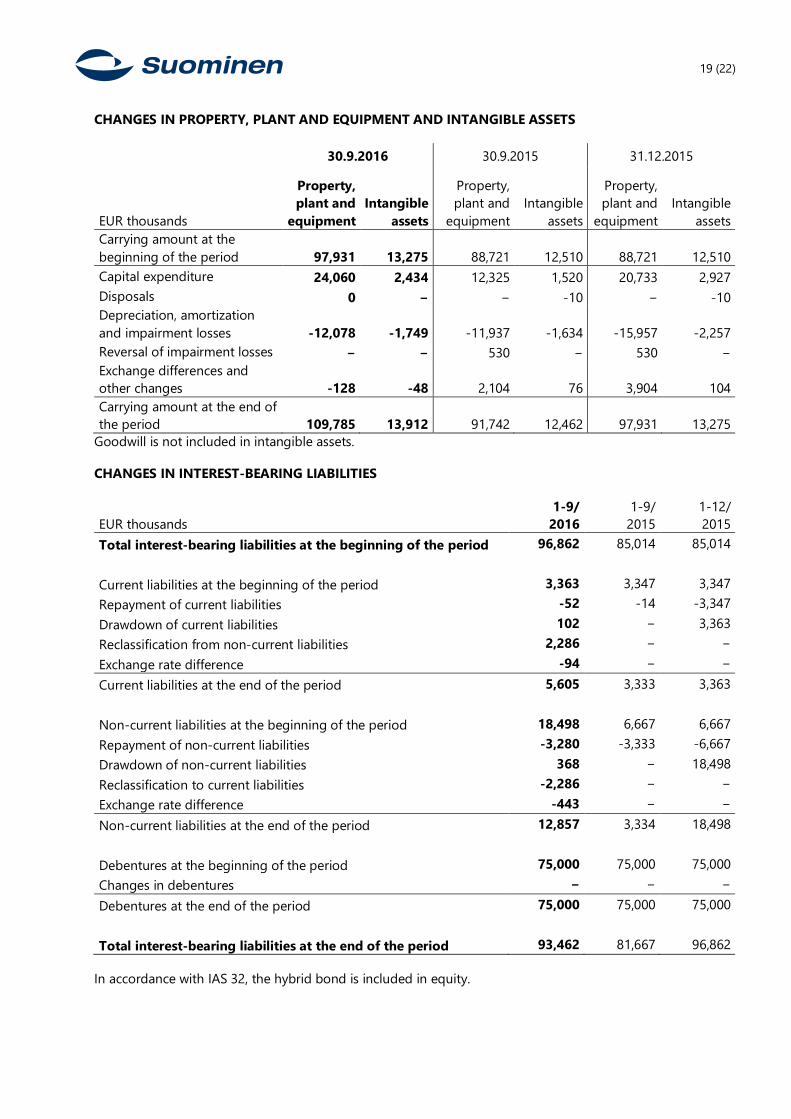
CHANGES IN PROPERTY, PLANT AND EQUIPMENT AND INTANGIBLE ASSETS 30.9.2016 30.9.2015 31.12.2015
EUR thousands
Property, plant and
equipment Intangible
assets
Property, plant and
equipment Intangible
assets
Property, plant and
equipment Intangible
assets Carrying amount at the beginning of the period 97,931 13,275 88,721 12,510 88,721 12,510 Capital expenditure 24,060 2,434 12,325 1,520 20,733 2,927 Disposals 0 − − -10 − -10 Depreciation, amortization and impairment losses -12,078 -1,749 -11,937 -1,634 -15,957 -2,257 Reversal of impairment losses − − 530 − 530 − Exchange differences and other changes -128 -48 2,104 76 3,904 104 Carrying amount at the end of the period 109,785 13,912 91,742 12,462 97,931 13,275
Goodwill is not included in intangible assets. CHANGES IN INTEREST-BEARING LIABILITIES
EUR thousands 1-9/
2016 1-9/
2015 1-12/ 2015
Total interest-bearing liabilities at the beginning of the period 96,862 85,014 85,014
Current liabilities at the beginning of the period 3,363 3,347 3,347 Repayment of current liabilities -52 -14 -3,347 Drawdown of current liabilities 102 − 3,363 Reclassification from non-current liabilities 2,286 − − Exchange rate difference -94 − − Current liabilities at the end of the period 5,605 3,333 3,363
Non-current liabilities at the beginning of the period 18,498 6,667 6,667 Repayment of non-current liabilities -3,280 -3,333 -6,667 Drawdown of non-current liabilities 368 − 18,498 Reclassification to current liabilities -2,286 − − Exchange rate difference -443 − − Non-current liabilities at the end of the period 12,857 3,334 18,498
Debentures at the beginning of the period 75,000 75,000 75,000 Changes in debentures − − − Debentures at the end of the period 75,000 75,000 75,000
Total interest-bearing liabilities at the end of the period 93,462 81,667 96,862 In accordance with IAS 32, the hybrid bond is included in equity.
20 (22)
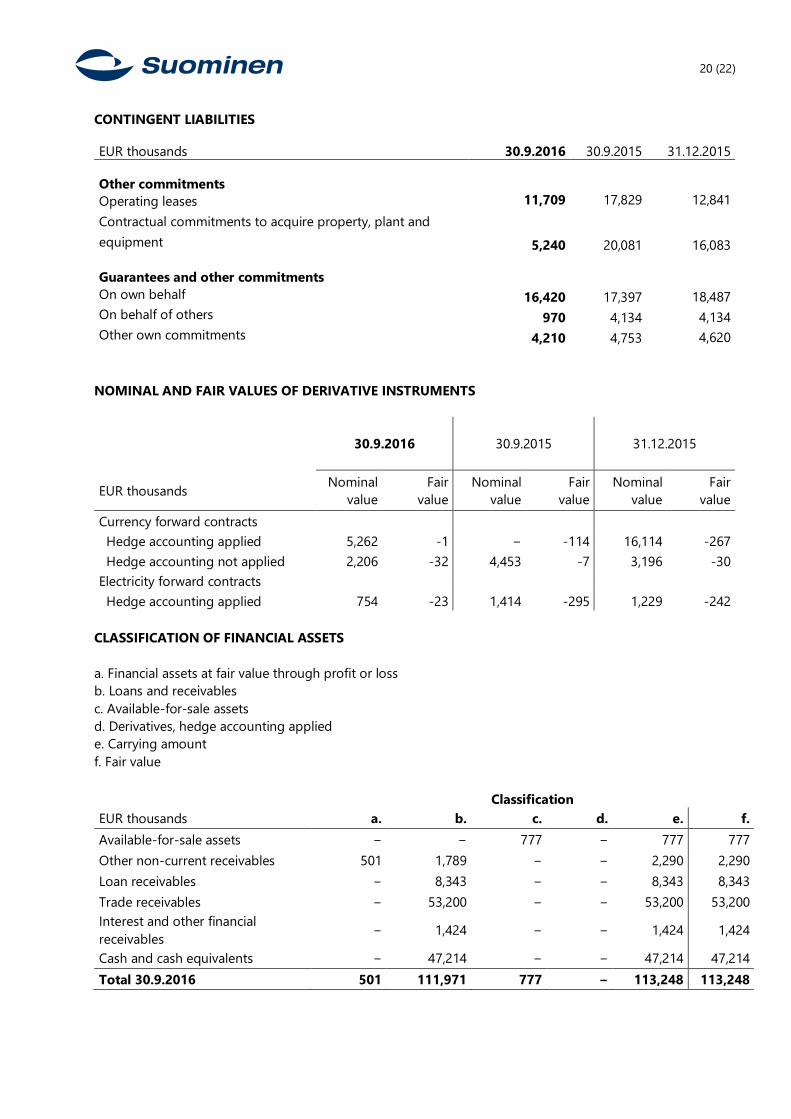
CONTINGENT LIABILITIES EUR thousands 30.9.2016 30.9.2015 31.12.2015
Other commitments Operating leases 11,709 17,829 12,841 Contractual commitments to acquire property, plant and equipment 5,240 20,081 16,083 Guarantees and other commitments On own behalf 16,420 17,397 18,487 On behalf of others 970 4,134 4,134 Other own commitments 4,210 4,753 4,620
NOMINAL AND FAIR VALUES OF DERIVATIVE INSTRUMENTS
30.9.2016 30.9.2015 31.12.2015
EUR thousands Nominal value
Fair value
Nominal value
Fair value
Nominal value
Fair value
Currency forward contracts Hedge accounting applied 5,262 -1 − -114 16,114 -267 Hedge accounting not applied 2,206 -32 4,453 -7 3,196 -30 Electricity forward contracts Hedge accounting applied 754 -23 1,414 -295 1,229 -242
CLASSIFICATION OF FINANCIAL ASSETS a. Financial assets at fair value through profit or loss b. Loans and receivables c. Available-for-sale assets d. Derivatives, hedge accounting applied e. Carrying amount f. Fair value
Classification EUR thousands a. b. c. d. e. f. Available-for-sale assets − − 777 − 777 777 Other non-current receivables 501 1,789 − − 2,290 2,290 Loan receivables − 8,343 − − 8,343 8,343 Trade receivables − 53,200 − − 53,200 53,200 Interest and other financial receivables − 1,424 − − 1,424 1,424
Cash and cash equivalents − 47,214 − − 47,214 47,214 Total 30.9.2016 501 111,971 777 − 113,248 113,248
21 (22)
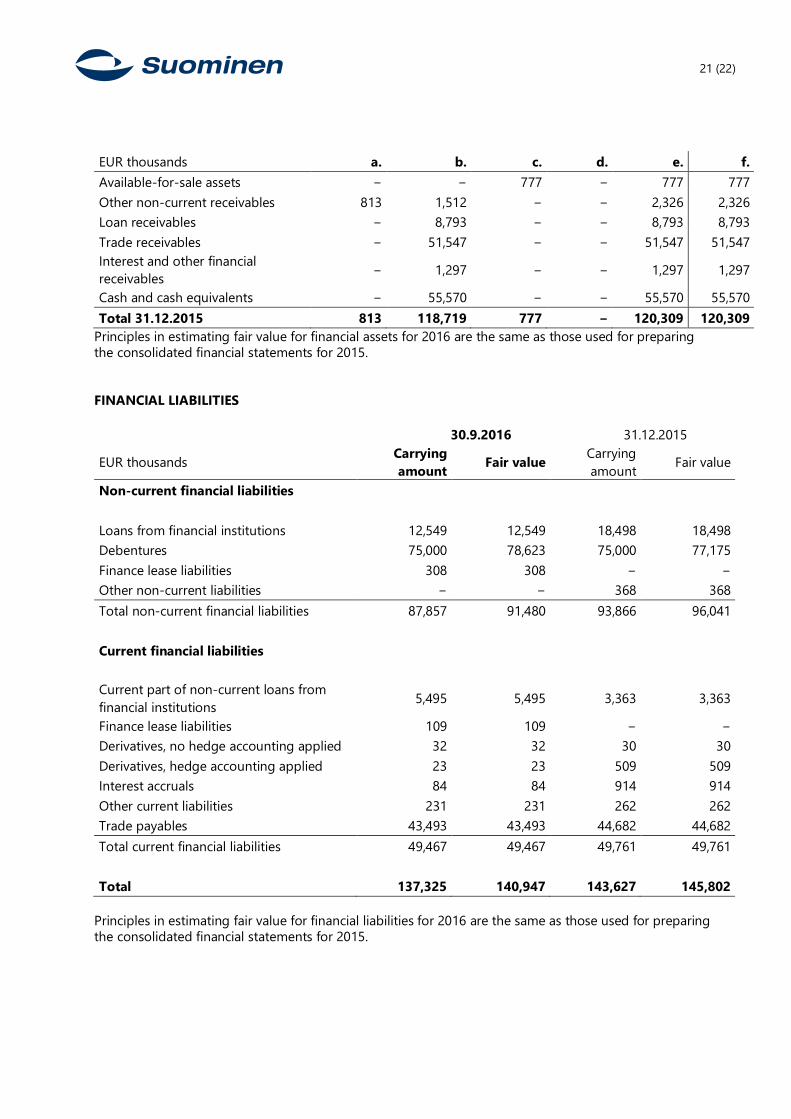
EUR thousands a. b. c. d. e. f. Available-for-sale assets − − 777 − 777 777 Other non-current receivables 813 1,512 − − 2,326 2,326 Loan receivables − 8,793 − − 8,793 8,793 Trade receivables − 51,547 − − 51,547 51,547 Interest and other financial receivables − 1,297 − − 1,297 1,297
Cash and cash equivalents − 55,570 − − 55,570 55,570 Total 31.12.2015 813 118,719 777 − 120,309 120,309
Principles in estimating fair value for financial assets for 2016 are the same as those used for preparing the consolidated financial statements for 2015. FINANCIAL LIABILITIES 30.9.2016 31.12.2015
EUR thousands Carrying amount Fair value Carrying
amount Fair value
Non-current financial liabilities
Loans from financial institutions 12,549 12,549 18,498 18,498 Debentures 75,000 78,623 75,000 77,175 Finance lease liabilities 308 308 − − Other non-current liabilities − − 368 368 Total non-current financial liabilities 87,857 91,480 93,866 96,041
Current financial liabilities
Current part of non-current loans from financial institutions 5,495 5,495 3,363 3,363
Finance lease liabilities 109 109 − − Derivatives, no hedge accounting applied 32 32 30 30 Derivatives, hedge accounting applied 23 23 509 509 Interest accruals 84 84 914 914 Other current liabilities 231 231 262 262 Trade payables 43,493 43,493 44,682 44,682 Total current financial liabilities 49,467 49,467 49,761 49,761
Total 137,325 140,947 143,627 145,802 Principles in estimating fair value for financial liabilities for 2016 are the same as those used for preparing the consolidated financial statements for 2015.
22 (22)
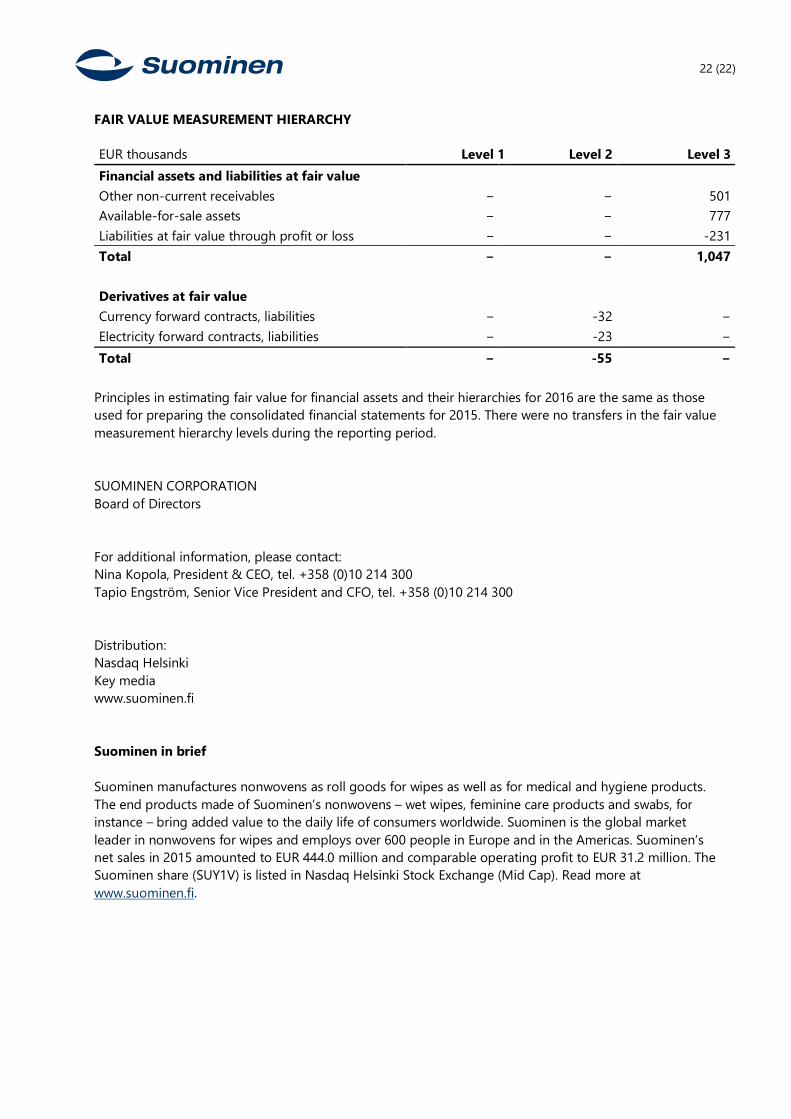
FAIR VALUE MEASUREMENT HIERARCHY EUR thousands Level 1 Level 2 Level 3 Financial assets and liabilities at fair value
Other non-current receivables − − 501 Available-for-sale assets − − 777 Liabilities at fair value through profit or loss − − -231 Total − − 1,047
Derivatives at fair value
Currency forward contracts, liabilities − -32 − Electricity forward contracts, liabilities − -23 − Total − -55 −
Principles in estimating fair value for financial assets and their hierarchies for 2016 are the same as those used for preparing the consolidated financial statements for 2015. There were no transfers in the fair value measurement hierarchy levels during the reporting period. SUOMINEN CORPORATION Board of Directors For additional information, please contact: Nina Kopola, President & CEO, tel. +358 (0)10 214 300 Tapio Engström, Senior Vice President and CFO, tel. +358 (0)10 214 300 Distribution: Nasdaq Helsinki Key media www.suominen.fi Suominen in brief Suominen manufactures nonwovens as roll goods for wipes as well as for medical and hygiene products. The end products made of Suominen’s nonwovens – wet wipes, feminine care products and swabs, for instance – bring added value to the daily life of consumers worldwide. Suominen is the global market leader in nonwovens for wipes and employs over 600 people in Europe and in the Americas. Suominen’s net sales in 2015 amounted to EUR 444.0 million and comparable operating profit to EUR 31.2 million. The Suominen share (SUY1V) is listed in Nasdaq Helsinki Stock Exchange (Mid Cap). Read more at www.suominen.fi.