Embed Size (px)
Citation preview
Interim Report
(a joint stock company incorporated in the People’s Republic of China with limited liability)
Stock Code : 2009
www.bbmg.com.cn/listco*For identification purposes only
20
18 Interim
Rep
ort北京金隅集團股份有限公司 B
BM
G C
OR
PO
RAT
ION

2 CORPORATE INFORMATION
6 CHAIRMAN’S STATEMENT
10 MANAGEMENT DISCUSSION AND ANALYSIS
48 OTHER INFORMATION
57 REPORT ON REVIEW OF INTERIM FINANCIAL STATEMENTS
58 UNAUDITED INTERIM CONSOLIDATED BALANCE SHEET
61 UNAUDITED INTERIM CONSOLIDATED INCOME STATEMENT
64 UNAUDITED INTERIM CONSOLIDATED STATEMENT OF CHANGES IN EQUITY
66 UNAUDITED INTERIM CONSOLIDATED STATEMENT OF CASH FLOWS
68 UNAUDITED INTERIM BALANCE SHEET
71 UNAUDITED INTERIM INCOME STATEMENT
72 UNAUDITED INTERIM STATEMENT OF CHANGES IN EQUITY
74 UNAUDITED INTERIM STATEMENT OF CASH FLOWS
76 NOTES TO UNAUDITED INTERIM FINANCIAL STATEMENTS
339 SUPPLEMENTARY INFORMATION TO UNAUDITED INTERIM FINANCIAL STATEMENTS
CONTENTS
CORPORATE INFORMATION
2
Chinese name of the Company 北京金隅集團股份有限公司
English name of the Company BBMG Corporation*
Headquarters of the Company Tower D, Global Trade Center
No. 36, North Third Ring East Road
Dongcheng District, Beijing 100013, the PRC
Registered address and principal
place of business in the PRC
Tower D, Global Trade Center
No. 36, North Third Ring East Road
Dongcheng District, Beijing 100013, the PRC
Principal place of business
in Hong Kong
Room 405, Kai Wong Commercial Building
222 Queen’s Road Central, Hong Kong
Website of the Company www.bbmg.com.cn/listco
Legal representative Jiang Deyi
The Board
Executive Directors Jiang Deyi (Chairman)
Zeng Jin (General Manager)
Wu Dong
Zheng Baojin
Non-executive Directors Guo Yanming
Yu Zhongfu
Independent non-executive Directors
Wang Guangjin
Tian Lihui
Tang Jun
Ngai Wai Fung

3BBMG CORPORATION
INTERIM REPORT 2018
CORPORATE INFORMATION
The Supervisory Board
Supervisors
Xu Feng (Chairlady)
Wang Zhicheng
Yu Kaijun
Hu Juan
Zhang Guoliang
Zhuang Zhenguo
Zhang Qicheng
Committees
Audit Committee Tian Lihui (Chairman)
Wang Guangjin
Tang Jun
Ngai Wai Fung
Guo Yanming
Yu Zhongfu
Remuneration and Nomination
Committee
Wang Guangjin (Chairman)
Wu Dong
Tian Lihui
Tang Jun
Ngai Wai Fung
Strategic Committee
Jiang Deyi (Chairman)
Zeng Jin
Zheng Baojin
Wang Guangjin
Tian Lihui
Tang Jun
Ngai Wai Fung

4
CORPORATE INFORMATION
Authorised Representatives Jiang Deyi
Lau Fai Lawrence
Board Secretary Zheng Baojin
Company Secretary Lau Fai Lawrence
Listing Information
A Shares
A Share registrar China Securities Depository and Clearing
Corporation Limited, Shanghai Branch
36th Floor, China Insurance Building
166 Lujiazui Road East, Pudong New District,
Shanghai, the PRC
Place of listing Shanghai Stock Exchange
Stock name BBMG
Board lot 100 shares
Stock code 601992.SH
H Shares
H Share registrar Computershare Hong Kong Investor Services Limited
Shops 1712 – 1716, 17th Floor, Hopewell Centre
183 Queen’s Road East, Wanchai, Hong Kong
Place of listing The Stock Exchange of Hong Kong Limited
Stock name BBMG
Board lot 1,000 shares
Stock code 02009.HK

5BBMG CORPORATION
INTERIM REPORT 2018
CORPORATE INFORMATION
Principal bankers Agricultural Bank of China Limited
Industrial and Commercial Bank of China Limited
Bank of Communications Co., Ltd.
Bank of Beijing Co., Ltd.
China Construction Bank Corporation
Bank of China Limited
Beijing Rural Commercial Bank Co., Ltd.
Independent auditor Ernst & Young Hua Ming LLP
Certified Public Accountants
Legal advisers Withers
As to Hong Kong law
Guantao Law Firm
As to PRC law

6
Jiang DeyiChairman
CHAIRMAN’S STATEMENT
7BBMG CORPORATION
INTERIM REPORT 2018
CHAIRMAN’S STATEMENT
* for identification purposes only
Dear shareholders,
On behalf of the board of directors (the “Board”) of BBMG Corporation* (the
“Company” or “BBMG”), I am pleased to present to you the interim results of
the Company for the six months ended 30 June 2018 (the “Reporting Period”),
and report on the operating results of the Company during the said period.
Review
During the first half of the year, the Company adhered to the main theme of seeking a steady progress
by focusing on the improvement of quality and effectiveness during development. Through the taken
up of control of Tianjin Building Materials (Holding) Co., Ltd. (天津市建築材料集團(控股)有限公
司), the Company has achieved the synergistic development of Beijing, Tianjin and Hebei Province in
the building materials industry as a pioneer and completed all the material approval procedures of
asset restructuring with Tangshan Jidong Cement Co., Ltd. The Company made historic achievement
regarding strategic business layout, transformation and upgrading, innovation and development,
opening-up and integration; and its production and operation maintained a positive momentum of
steady and faster development.
During the Reporting Period, the Company recorded total operating revenue of RMB35,365.4 million,
representing a year-on-year increase of 20.0%; net profit attributable to the shareholders of the parent
company amounted to RMB2,410.2 million, representing a year-on-year increase of 30.5%; basic
earnings per share attributable to the shareholders of the parent company amounted to RMB0.23.
8
CHAIRMAN’S STATEMENT
Prospects
On the external front, the Chinese economy maintained a stable development in general. The
internal driver for a high quality development in the PRC further strengthened while the synergistic
development of Beijing, Tianjin and Hebei Province and the supply-side structural reform were
well underway. Meanwhile, with the impact of the escalating Sino-US trade friction, a number of
uncertainties exist in the economy. In addition, with the over-capacity in the overall cement industry,
market demand continued to decline, leading to more prominent contradiction between supply and
demand. Adhering to the basic tone of the policy of “houses are for living, not for speculation”, the
government maintained its control over the real estate industry. Internally, the organic development
between different business segments and different enterprises within the Company was unbalanced
and inadequate. Confronted by the abovementioned challenges amidst opportunities, the Company
will grasp the opportunities, turn those challenges into chances with active response, capitalize them
with scientific approach so as to maintain a positive growth momentum. The Company will strive to
achieve a new round of leap-forward development with high quality.
Pursuing the development strategy of “highlighting principal businesses and strengthening specialized
businesses”, the Company will take initiative in participating in significant national policies, such as
synergetic development of Beijing, Tianjin and Hebei Province and the supply-side structural reform
and facilitate the “Four Centers” development of Beijing. In respect of the cement and ready-mixed
concrete segment and modern building materials and commerce and logistics segment, the Company
will ensure the guaranteed supply of building materials for key projects such as sub-town center
in Beijing, Xiong’an New Area, new capital airport, and venues for Winter Olympics, with a view
to promoting a wide use of BBMG’s modern, environmentally friendly, green and energy-saving
building materials in key projects with high level of market attention, extensive influence and brand
popularity. At the same time, the Company will fully leverage the geographical advantages of Tianjin
to consolidate and enhance the building materials and commerce and logistics business. For the
property development segment and property investment and management segment, the Company
will timely examine the new policies to capture new market trends so as to enhance its operating
capability and nurture competitive advantages. By seizing the opportunity of accelerating the transfer
of non-capital functions, the Company will further develop and utilize the self-owned land resources
located in Beijing, Tianjin and Hebei Province and develop new industries and new segment formats
that meet the respective local positioning of functions for the purpose of the formation and constant
optimization of an industrial layout highly aligned with the national strategy of “synergistic development
of Beijing, Tianjin and Hebei Province”.
9BBMG CORPORATION
INTERIM REPORT 2018
CHAIRMAN’S STATEMENT
On behalf of the Board, I would like to express my sincere gratitude to the shareholders and business
partners of the Company for their support and assistance. I expect continued trust and support from
the shareholders and business partners in our course of achieving a new round of leap-forward
development for BBMG with relentless efforts.
Jiang Deyi
Chairman of the Board
Beijing, the PRC
29 August 2018
10
MANAGEMENT DISCUSSION AND
ANALYSIS

BBMG CORPORATION
INTERIM REPORT 201811
12
MANAGEMENT DISCUSSION AND ANALYSIS
DETAILS OF THE COMPANY’S PRINCIPAL BUSINESS, BUSINESS MODEL AND INDUSTRY SITUATION DURING THE REPORTING PERIOD
(I) Principal business and business model of the Company
The Company’s principal businesses include cement and ready-mixed concrete – modern
building materials manufacturing and commerce and logistics – property development – property
investment and management.
1. Cement and ready-mixed concrete business: The Company is the third largest cement
enterprise in the country. The cement business continued to adopt Beijing, Tianjin
and Hebei as its core strategic regions, and continued to expand the coverage of
its network, mainly with presence in 13 provinces (municipalities and autonomous
regions), including Beijing, Tianjin and Hebei Province, Shaanxi, Shanxi, Inner Mongolia,
Northeastern region, Chongqing, Shandong, Henan and Hunan. The production capacity
of clinker amounted to approximately 110.0 million tonnes; the production capacity of
cement amounted to approximately 170.0 million tonnes; the production capacity of
ready-mixed concrete and ready-mixed mortar amounted to approximately 72.0 million
cubic meters and approximately 2.25 million tonnes, respectively; while the production
capacity of aggregates and grinding aids and admixtures amounted to approximately
38.5 million tonnes and approximately 0.34 million tonnes, respectively. On this basis,
the Company effectively demonstrated the internal synergetic mechanism with cement
production and ready-mixed concrete development providing support to each other. The
industry layout of ready-mixed concrete in key regions and markets will be consolidated
on the basis of concrete group as the platform, aiming to take a leading position in
the north of the country among its industrial peers and become one of the largest
professional enterprises engaging in the production of concrete products in the PRC.
Meanwhile, the Company will insist on promoting market expansion and strategic
resources consolidation simultaneously, and has had a total of about 1,700.0 million
tonnes of limestone reserve in Beijing, Tianjin and Hebei.

BBMG CORPORATION
INTERIM REPORT 201813
MANAGEMENT DISCUSSION AND ANALYSIS
2. Modern building materials and commerce and logistics business: The Company is one
of the largest building materials manufacturers in China, the largest building materials
manufacturer and one of the leaders in the building materials industry in Pan Bohai
Economic Rim in Beijing. It provides major products and services, namely furniture
and woods, wall body and insulation materials, decorative and fitting materials, and
building materials and commerce and logistics, among which, the production and sales
of BBMG’s aerated products ranked second in the industry, BBMG’s production capacity
of fire retardant paint and comprehensive strength ranked top 3 in the country. Tiantan
Furniture is the leading enterprise in the furniture industry in China. The production
capacity of the single production line of mineral wool boards of STAR-USG Building
Materials ranked number one in the world, which is also the largest production line in
Asia and ranked number one in China in terms of sales to mid- to high-end channels.
With strenuous efforts made in implementation of structural adjustment and industrial
upgrade, the Company invested in the construction of BBMG Modern Industrial Park
in Dachang, Hebei, and completed the planned upgrade of Doudian Circular Economic
Park in Fangshan, Beijing, thereby basically forming the centralized production model
in the industrial parks and gradually achieved industrial synergy. The Company took
the initiative to be the major supplier for the construction materials required by the
construction of the subtown center project in Beijing. Production and supply of BBMG’s
aerated products, BBMG coating, BBMG star stone wool, Jinhaiyan Glass Wool, mineral
wool boards of STAR-USG Building Materials, Alavus doors and windows, Tiantan
Furniture and sanitary agency products have been timely and duly completed up to
quality standard. New building materials including BBMG aerated panel and mineral wool
boards of STAR-USG Building Materials facilitated the development of the Xiong’an New
Area. The product supply for the public service center of Xiong’an, the first construction
project of Xiong’an New Area, has been completed. New building materials products
including BBMG star stone wool, Jinhaiyan Glass Wool, mineral wool boards of STAR-
USG Building Materials and BBMG fire retardant paint have facilitated the construction
of the renovation project in respect of Qingdao Olympic Sailing Centre, the main venue
of the SCO Summit in Qingdao. This has enhanced the image of the Company’s modern
building materials products in the market and made improvement to the aspects such
as product quality, organisational security as well as management standard. As long
as risks are under control, the Company will continuously enhance the development
of commerce and logistics industry and proactively explore the developed marketing
modes of e-commerce.

14
MANAGEMENT DISCUSSION AND ANALYSIS
3. Property development business sector: The Company is one of the top property
developers in Beijing in terms of comprehensive strength with an area under construction
of 8 million sq.m. during the year. The Company has made its presence in 15 cities
including Beijing, Shanghai, Tianjin, Chongqing, Hangzhou, Nanjing, Chengdu, Hefei and
Haikou and developed more than 130 property projects with a total gross floor area of
approximately 30 million sq.m, developing a nationwide business presence “from Beijing
to three major economic rims, namely Beijing, Tianjin and Hebei, Yangtze River Delta
and Chengdu-Chongqing region”, with a comprehensive development strength covering
property projects of multiple categories. As a large state-owned enterprise under Beijing
municipality, the Company has been in the leading position in construction of affordable
housing in Beijing for years with a total gross floor area of more than 7 million sq.m.
of planned and completed affordable housing, providing over 70,000 housing units.
Based on continuous consolidation of core business strengths, the Company is making
efforts on nurturing new segment formats and seeking coordinated development with
Beijing, Tianjin and Hebei based on the functions of non-capital cities and is actively
committed to the development and use of urban mineral resources. The Company has
successfully established its presence in various sectors such as featured towns, industrial
properties and technology and innovation related properties, bringing new development
opportunities for the Company.
4. Property investment and management business: The Company is one of the largest
investors and managers of investment properties in Beijing, holding approximately 1.2
million sq.m. of high-end office buildings (including a total area of approximately 0.72
million sq.m. of investment properties held in the core area of Beijing) and managing
approximately 12.0 million sq.m. of properties (including residential communities and
commercial units at low floors) in Beijing. The Company has been leading the industry
in Beijing and even the PRC for years in areas including specialized techniques, brand
awareness, occupancy rate and revenue. Meanwhile, the resort and leisure business,
with Fengshan Hot Spring Resort and Badaling Hot Spring Resort as key projects, has
built up its scale and gained sound reputation in the society.
BBMG CORPORATION
INTERIM REPORT 201815
MANAGEMENT DISCUSSION AND ANALYSIS
(II) Description of major industries
1. Cement Industry
For the first half of 2018, the production of cement nationwide amounted to 0.997
billion tonnes, representing a year-on-year decrease of 0.6%. Under the control and
monitoring of a series of government policies such as risk prevention and deleveraging,
infrastructure investment saw a substantial decrease. However, with the turnaround
of real estate investment and the extension projects of infrastructure investment from
last year, the year-on-year overall demand for cement for the first half of the year only
decreased mildly. During the Reporting Period, the efforts focused on the national
supply-side structural reform and the supervision and inspection for environmental
protection continued to consolidate. In response to this, substantially most of the
provinces launched and implemented various restrictive measures on production such
as “staggering peak production” and “environmentally restrictive production”, which
led to a noticeable change in cement supply. As such, the market demand and supply
continued to improve with a substantial decrease in inventory level as compared to last
year, resulting in a stabilized price and profitability at a high level.
According to the statistics of the National Bureau of Statistics, in the first half of 2018,
the overall profitability in cement industry grew steadily and rapidly as the overall demand
in the industry became stable. From January to May 2018, total profit of RMB51.491
billion was recorded for the entire cement industry of China, representing a year-on-
year increase of 163.86%, which was historically the best performance. The promising
profitability was chiefly benefited from the stabilized demand and price at a high level.
2. Property Development Industry
In the first half of 2018, the property regulation and control measures, without
relaxation, continued to suppress irrational demands under varying policies with cities.
Meanwhile, the “effective supply” was actively implemented and related protection
policies were launched by various local authorities to substantially increase the supply
of housing rental and common property rights. Insisting to pursue the unwavering goal
without any relaxation, various local authorities continued to stringently implement all
regulation and control measures so as to facilitate a sound development of the real
estate market.
16
MANAGEMENT DISCUSSION AND ANALYSIS
According to the data of the National Bureau of Statistics, in the first half of 2018,
the investment in real estate development in China stood at RMB5,553.1 billion,
representing a nominal increase of 9.7% over last year, among which, investment in
residential properties was RMB3,899.0 billion, up by 13.6%, representing a drop of
0.6 percentage points in growth rate. Investment in residential properties accounted
for 70.2% of aggregate investment in real estate development. The construction sites
of real estate developers stood at 7,096.49 million sq.m., representing an increase of
2.5% over last year, among which, 4,879.33 million sq.m. were area of construction
sites for residential properties, representing an increase of 3.2%. The area of newly
started construction of real estates was 958.17 million sq.m., increasing by 11.8%.
Among this, 706.11 million sq.m. were area of newly started construction of residential
properties, which increased by 15.0%. The area of completed properties stood at 371.31
million sq.m., decreasing by 10.6%. Of this, area of completed residential properties
was 259.62 million sq.m., down by 12.8%. In the first half of 2018, land area acquired
by real estate developers was 110.85 million sq.m., increasing by 7.2% over last year.
Area of sold commodity housing in China was 771.43 million sq.m., increasing by
3.3% over last year. Of this, area of sold residential properties, office and properties
for commercial operation increased by 3.2%, decreased by 6.1% and increased by
2.4% respectively. Sales of commodity housing amounted to RMB6,694.5 billion, up
by 13.2%. Of this, sales of residential properties, office and properties for commercial
operation increased by 14.8%, decreased by 3.2% and increased by 5.7% respectively.
As at the end of June, area of commodity housing for sales was 550.83 million sq.m.,
a decrease by 9.27 million sq.m. as compared with the end of May.
BBMG CORPORATION
INTERIM REPORT 201817
MANAGEMENT DISCUSSION AND ANALYSIS
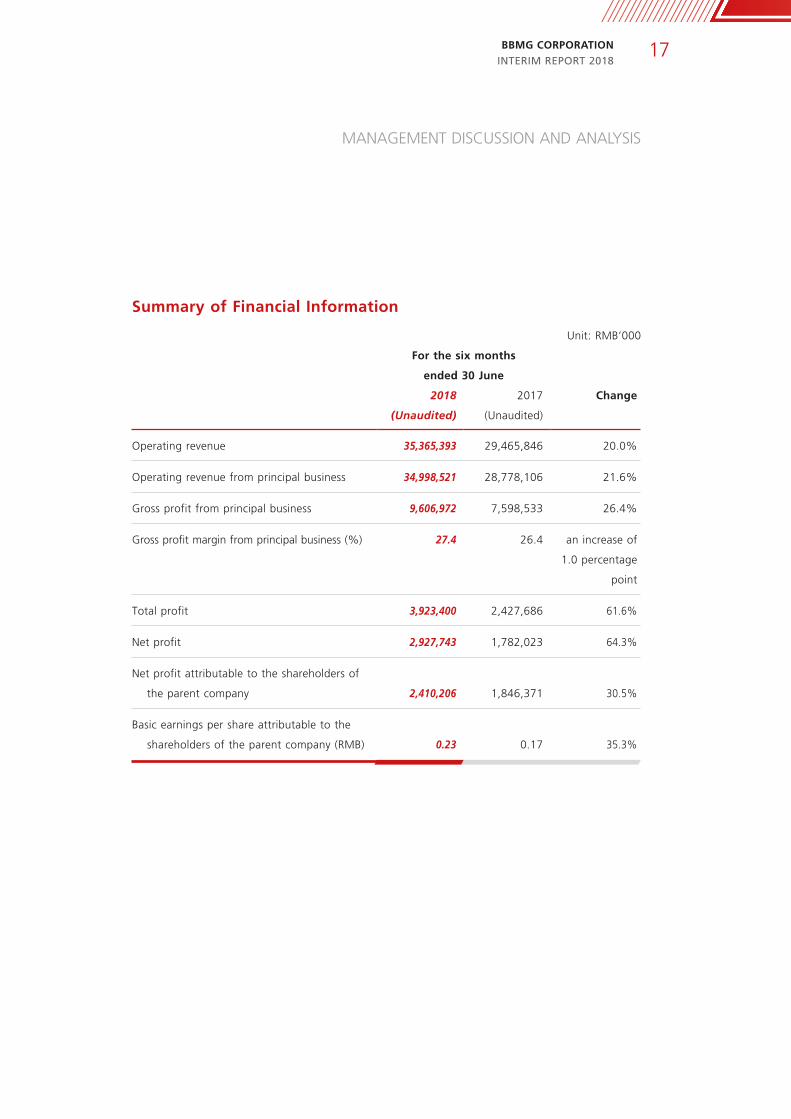
Summary of Financial Information
Unit: RMB’000
For the six months
ended 30 June
2018 2017 Change
(Unaudited) (Unaudited)
Operating revenue 35,365,393 29,465,846 20.0%
Operating revenue from principal business 34,998,521 28,778,106 21.6%
Gross profit from principal business 9,606,972 7,598,533 26.4%
Gross profit margin from principal business (%) 27.4 26.4 an increase of
1.0 percentage
point
Total profit 3,923,400 2,427,686 61.6%
Net profit 2,927,743 1,782,023 64.3%
Net profit attributable to the shareholders of
the parent company 2,410,206 1,846,371 30.5%
Basic earnings per share attributable to the
shareholders of the parent company (RMB) 0.23 0.17 35.3%
18
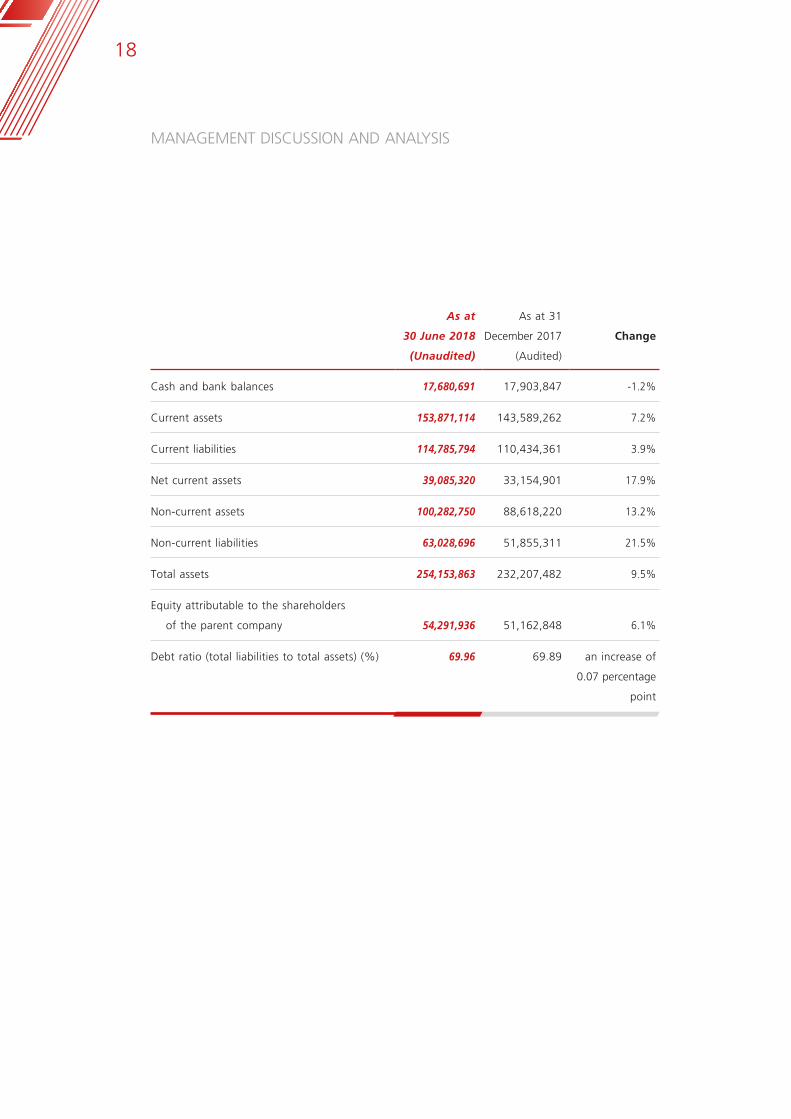
MANAGEMENT DISCUSSION AND ANALYSIS
As at
30 June 2018
As at 31
December 2017 Change
(Unaudited) (Audited)
Cash and bank balances 17,680,691 17,903,847 -1.2%
Current assets 153,871,114 143,589,262 7.2%
Current liabilities 114,785,794 110,434,361 3.9%
Net current assets 39,085,320 33,154,901 17.9%
Non-current assets 100,282,750 88,618,220 13.2%
Non-current liabilities 63,028,696 51,855,311 21.5%
Total assets 254,153,863 232,207,482 9.5%
Equity attributable to the shareholders
of the parent company 54,291,936 51,162,848 6.1%
Debt ratio (total liabilities to total assets) (%) 69.96 69.89 an increase of
0.07 percentage
point

BBMG CORPORATION
INTERIM REPORT 201819
MANAGEMENT DISCUSSION AND ANALYSIS
Summary of Business Information
For the six months
ended 30 June
2018 2017 Change
Cement and Ready-mixed Concrete
Segment
Sales volume of cement (in million tonnes) 43.63 45.83 -4.8%
Sales volume of ready-mixed concrete
(in million cubic metres) 6.28 6.56 -4.3%
Modern Building Materials and Commerce
and Logistics Segment
Stone wool boards (in thousand tonnes) 30.4 20.4 49.0%
Property Development Segment
Booked GFA (in thousand sq.m.) 430.8 406.6 6.0%
Contracted sales GFA (in thousand sq.m.) 518.2 784.7 -34.0%
Property Investment and Management
Segment
Gross GFA of investment properties
(in thousand sq.m.) 1,085.1 715.5 51.7%
DISCUSSION AND ANALYSIS ON OPERATIONS
During the first half of 2018, under the guidance of a new development concept, the Company adhered
to the key note of seeking a steady progress by focusing on the improvement of quality and efficiency
of development. Meanwhile, seizing the opportunity of deepening synergetic development of Beijing,
Tianjin and Hebei Province, the Group realized its control over Tianjin Building Materials Group and
completed the approval procedures of asset restructuring with Jidong Cement. Quality and efficiency
of each business segment have been improved notably. Green transformation continued to make
progress. Science and technology innovation has also seen remarkable achievements. Key priorities has
been forged ahead in a stable way attributable to regulated and orderly basic management. During
the Reporting Period, economy of the Company ran healthily, with both size and efficiency hitting
records and key economic indicators showing sound and rapid growth. Operation of the Company
has been progressing well and maintaining a stable and fast development.
20
MANAGEMENT DISCUSSION AND ANALYSIS
During the first half of 2018, the Company recorded operating revenue of RMB35,365.4 million, of
which operating revenue from its principal business amounted to RMB34,998.5 million, representing
a year-on-year increase of 21.6%; total profit amounted to RMB3,923.4 million, representing a year-
on-year increase of 61.6%; net profit amounted to RMB2,927.7 million, representing a year-on-year
increase of 64.3%; and net profit attributable to the shareholders of the parent company amounted
to RMB2,410.2 million, representing a year-on-year increase of 30.5%.
(1) Cement and Ready-mixed Concrete Segment
Based on its strategic position of “build a world-class cement industry group which is modern,
professional and large in scale”, the Group optimized its management by intensifying process
control to improve its operating efficiency and focus on operating results, and ultimately, to
improve quality and efficiency throughout the Group. Leveraging on the results of restructuring
with Jidong, the Company has taken various measures and the benefit of reform and effect
of restructuring have begun to emerge increasingly.
During the first half of 2018, sales volume of cement and clinker was 43.63 million tonnes,
representing a year-on-year decrease of 4.8%; operating revenue from principal business
was RMB15,692.3 million, representing a year-on-year increase of 12.7%; gross profit from
principal business amounted to RMB4,911.2 million, representing a year-on-year increase
of 30.5%. Most enterprises of the segment posted notable increase in results performance,
among which cement sales volume amounted to 37.21 million tonnes and clinker sales volume
amounted to 6.4 million tonnes; the aggregated gross profit margin for cement and clinker
was 36.6%, representing a year-on-year increase of 7.2 percentage points. Sales volume of
concrete was 6.3 million cubic meters, representing a year-on-year decrease of 4.5%, while
the gross profit margin for mixed concrete was 10.0%, representing a year-on-year increase
of 2.5 percentage points.

BBMG CORPORATION
INTERIM REPORT 201821
MANAGEMENT DISCUSSION AND ANALYSIS
(2) Modern Building Materials and Commerce and Logistics Segment
With an objective to achieve profit of more than ten million yuan for single manufacturing
enterprise in the segment, and focused on implementing enterprise diagnosis, benchmark
management and activities to “lower costs and expenses and increase production and sales
volume”, the Company has put efforts to make the industry more solid, management stronger,
and products better, continuing to enhance its corporate profitability and competitiveness in the
market. The enterprises in the segment coordinated with each other and actively participated
in the construction of key projects in China, such as sub-town center in Beijing, public service
center in Xiongan New Area, renovation of the SCO Summit venue in Qingdao, new capital
airport, and venues for Winter Olympics, providing green, energy-saving, and environmentally
friendly building materials products and services so as to enhance product influence and brand
awareness.
During the first half of 2018, modern building materials and commerce and logistics segment
recorded operating revenue from principal business of RMB9,068.4 million, of which RMB1,389.0
million was derived from manufacturing sector and RMB7,679.0 million was derived from
commerce and logistics sector. The segment recorded gross profit from principal business of
RMB576.9 million, representing a year-on-year increase of 7.0%.
22
MANAGEMENT DISCUSSION AND ANALYSIS
(3) Property Development Segment
The Company will continue to further reform to consolidate and enlarge the development of
its professional control platform. With the pilot programme for professional managers basically
completed and the initial establishment of platforms, such as human resource management,
project development, capital management, strategic procurement and cost control, the
Company’s competitiveness has increased as a whole.
The property development segment recorded operating revenue from principal business of
approximately RMB9,948.4 million during the first half of 2018, representing a year-on-year
increase of 36.3%. The gross profit from its principal business was approximately RMB3,184.1
million, a year-on-year increase of 35.1%. The booked GFA was 430,844 sq.m. for the year, a
year-on-year increase of 6.0%, among which booked GFA of commodity housing amounted
to 429,544 sq.m., a year-on-year increase of 6.9%, while booked GFA of affordable housing
amounted to 1,300 sq.m., a year-on-year decrease of 72.8%. The aggregated contracted
sales area of the Company was 518,172 sq.m., a year-on-year decrease of 34.0%, among
which contracted sales area of commodity housing amounted to 516,872 sq.m., a year-on-
year decrease of 18.6%, and contracted sales area of affordable housing amounted to 1,300
sq.m., a year-on-year decrease of 99.1%. During the Reporting Period, the Company recorded
contracted sales of approximately RMB9,190 million, representing a year-on-year decrease of
31.2%, and cash collection of approximately RMB9,250 million, representing a year-on-year
decrease of 23.3%. As at the end of the Reporting Period, the Company had a land reserve
totaling approximately 8,573,100 sq.m..
During the Reporting Period, despite the exposure to pressure of market regulation, the
Company has made its efforts in promoting project sales and carefully arranging project
delivery for use in various cities. The projects including Shanghai Dachengjun (上海大成郡),
Hefei Nanqili (合肥南七里), Qingdao Hefu (青島和府) recorded robust sales and the phase I of
Beijing Treasure Mansion House (北京金玉府) delivered for use in advance; projects including
phase II of Nanjing Zijingfu (南京紫京府), Hangzhou Xuefu (杭州學府) delivered on schedule.
At the same time, the construction of the project of Xisanqi Science and Technology Park has
also achieved initial progress.
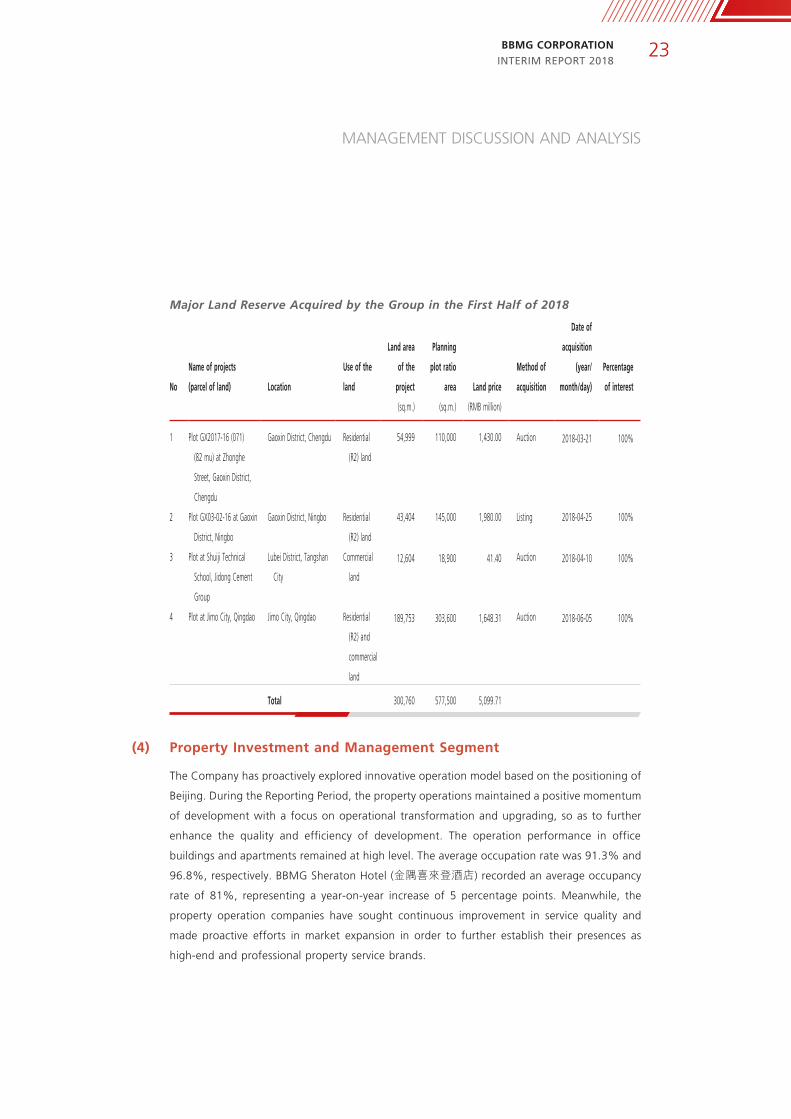
During the first half of 2018, the Company successfully acquired 4 parcels of land, adding
577,500 sq.m. to its land reserve.
BBMG CORPORATION
INTERIM REPORT 201823
MANAGEMENT DISCUSSION AND ANALYSIS
Major Land Reserve Acquired by the Group in the First Half of 2018
No
Name of projects
(parcel of land) Location
Use of the
land
Land area
of the
project
Planning
plot ratio
area Land price
Method of
acquisition
Date of
acquisition
(year/
month/day)
Percentage
of interest
(sq.m.) (sq.m.) (RMB million)
1 Plot GX2017-16 (071)
(82 mu) at Zhonghe
Street, Gaoxin District,
Chengdu
Gaoxin District, Chengdu Residential
(R2) land
54,999 110,000 1,430.00 Auction 2018-03-21 100%
2 Plot GX03-02-16 at Gaoxin
District, Ningbo
Gaoxin District, Ningbo Residential
(R2) land
43,404 145,000 1,980.00 Listing 2018-04-25 100%
3 Plot at Shuiji Technical
School, Jidong Cement
Group
Lubei District, Tangshan
City
Commercial
land
12,604 18,900 41.40 Auction 2018-04-10 100%
4 Plot at Jimo City, Qingdao Jimo City, Qingdao Residential
(R2) and
commercial
land
189,753 303,600 1,648.31 Auction 2018-06-05 100%
Total 300,760 577,500 5,099.71
(4) Property Investment and Management Segment
The Company has proactively explored innovative operation model based on the positioning of
Beijing. During the Reporting Period, the property operations maintained a positive momentum
of development with a focus on operational transformation and upgrading, so as to further
enhance the quality and efficiency of development. The operation performance in office
buildings and apartments remained at high level. The average occupation rate was 91.3% and
96.8%, respectively. BBMG Sheraton Hotel (金隅喜來登酒店) recorded an average occupancy
rate of 81%, representing a year-on-year increase of 5 percentage points. Meanwhile, the
property operation companies have sought continuous improvement in service quality and
made proactive efforts in market expansion in order to further establish their presences as
high-end and professional property service brands.

24
MANAGEMENT DISCUSSION AND ANALYSIS
The property investment and management segment recorded operating revenue from principal
business of approximately RMB1,887.8 million during the first half of 2018, a year-on-year
increase of 13.3%. Gross profit from principal business amounted to approximately 1,103.6
million, representing a year-on-year increase of 2.6%. As at the end of the Reporting Period,
the Company held investment properties totaling approximately 1,085,100 sq.m. in the core
districts of Beijing and Tianjin. The consolidated average occupancy rate was 93% and the
consolidated average rental unit price was RMB5.9/sq.m./day, of which the consolidated rental
unit price for Beijing district was RMB8.3/sq.m./day.
Investment properties held by the Group as at 30 June 2018
Average Average
Property Rental Occupancy Unit
Location Usage Gross Area Fair Value Unit Price Rate Fair Value
(thousand (RMB million) (RMB/day) (RMB/sq.m.)
sq.m.)
Phase 1 of Global Trade Centre North Third Ring Road,
Beijing
Commercial 108.2 3,200.3 11.3 84% 29,581
Phase 2 of Global Trade Centre North Third Ring Road,
Beijing
Commercial 141.5 3,356.4 8.4 92% 23,724
Phase 3 of Global Trade Centre
(Ground Floor Commercial)
North Third Ring Road,
Beijing
Retail 57.5 1,161.7 8.2 90% 20,205
Tengda Plaza West Second Ring Road,
Beijing
Commercial 67.7 1,754.2 9.6 93% 25,920
Jin Yu Mansion West Second Ring Road,
Beijing
Commercial 41.2 1,156.5 10.5 84% 28,047
Jianda Building and Beijing
Building Materials Trading
Tower
East Second Ring Road,
Beijing
Commercial 43.4 1,250.0 5.7 91% 28,824
Dacheng Building West Second Ring Road,
Beijing
Commercial 41.4 1,144.4 11.0 95% 27,619
Pan Bohai Jin’an Plaza Hexi District, Tianjin Retail 301.5 2,445.1 2.4 99% 8,110
Sub-total 802.4 15,468.6 19,279
Other properties Beijing and Tianjin
Municipality
Commercial
and retail
282.7 3,328.3 11,772
Total 1,085.1 18,796.9 5.9 93% 17,323

BBMG CORPORATION
INTERIM REPORT 201825
MANAGEMENT DISCUSSION AND ANALYSIS
ANALYSIS OF INCOME STATEMENT AND CASH FLOWS ITEMS
1. Gains from changes in fair value of investment properties
The Company conducted a subsequent measurement of the investment properties at fair value
at the end of the Reporting Period. Changes in fair value are recognised in “gains from changes
in fair value” in the income statement. The fair value is valued by an independent valuer using
future earnings approach and market-based approach on an open market and existing use basis.
No depreciation or amortisation of investment properties is made by the Company. The book
value of investment properties is adjusted based on their fair value at the balance sheet date.
The difference between the fair value and the original book value is recognised in the profit
or loss for the current period.
During the Reporting Period, the gains from changes in fair value of investment properties of
the Company were RMB270.2 million, accounting for 6.9% of the profit before tax. The gains
from changes in fair value of investment properties increased by approximately 5.0% during
the Reporting Period from the same period in the previous year.
2. Selling expenses, administrative expenses and finance costs
During the Reporting Period, the year-or-year changes in major expenses of the Group were
as follows:
(1) Selling expenses were approximately RMB1,163.7 million in the first half of 2018, an
increase of approximately RMB1.5 million year-on-year.
(2) Administrative expenses were approximately RMB3,093.6 million in the first half of
2018, an increase of approximately RMB422.5 million year-on-year, mainly attributable
to the increase in employee remunerations and loss from shutdown.
(3) Finance costs were approximately RMB1,363.9 million in the first half of 2018, an
increase of approximately RMB31.2 million year-on-year, mainly attributable to the
increase in interest expenses driven by the increase in loans.

26
MANAGEMENT DISCUSSION AND ANALYSIS
3. Cash flows
In the first half of 2018, a net decrease of RMB1,237.7 million in cash and cash equivalents was
recognised in the consolidated financial statements of the Group, of which net cash outflow
generated from operating activities was RMB3,638.6 million; net cash outflow generated
from investment activities was RMB6,738.3 million; net cash inflow generated from financing
activities was RMB9,156.7 million; and the effect of changes in exchange rate on cash and
cash equivalents decreased by RMB17.5 million.
CORE COMPETITIVENESS ANALYSIS
The Company is a leading building material enterprise in Beijing, Tianjin and Hebei Province which is
devoted to environmental protection, energy-saving and emission reduction and recycling development
initiatives. It actively follows the orientation of the policies in relation to synergetic development of
Beijing, Tianjin and Hebei Province and the structural reform of the supply front. In 2016, the Company
conducted the restructuring and merger with Jidong Development Group successfully, and thus its
production capacity of cement has surged to rank number five in the world and become the third
largest cement enterprise in the country. This has further increased its market control and influence.
In May 2018, the Company successfully participated in the mixed-ownership reform of Tianjin Building
Materials Group and commenced to own its controlling interests, enabling the Company to optimize
the layout of business segments in Beijing, Tianjin and Hebei region and further consolidate its leading
position in the building material sector of Beijing, Tianjin and Hebei. Being one of China’s largest
manufacturers of building materials and the modelling enterprise among the green building materials
industry in Pan Bohai Economic Rim, the Company is one of the leading property developers in terms
of comprehensive strength and among the largest affordable housing developers in Beijing region, It
owns relatively low-cost land reserve for development and abundant industrial land reserve in first-
tier cities. Also, the Company is one of the largest holders and managers of investment properties in
Beijing. Ranking among top 500 enterprises, top 200 most cost-effective enterprises and top 100 most
profitable enterprises in China, various principal business segments of the Company have experienced
strong growth and synergetic development by extending their business presence to 23 provinces, cities
and regions in and outside of the PRC.
The core competitiveness of the Company is detailed as follows:
BBMG CORPORATION
INTERIM REPORT 201827
MANAGEMENT DISCUSSION AND ANALYSIS
1. Competitive Edge in the Industrial Chain:
The Company has developed its leading edge of vertically integrated core industrial chain.
Through the substantial transformation and restructure processes towards an enterprise and
group of securities-based share companies, the Company has developed from a traditionally
single building materials products manufacturing enterprise into a large municipal state-
owned holding industrial group and A share and H share dual listing company with a core
industrial chain of “modern and eco-friendly building materials manufacturing – trade and
services – property development and operation – property management”. By leveraging the
advantages accumulated in the development of modern green building materials manufacturing
industry and equipment manufacturing industry, the Company has expanded toward property
development sector. While focusing on business expansion and industrial upgrade, the Company
has developed towards the modern service sectors, including trade and services and high-end
property management. Taking advantage of the characteristics of the real estate development
industry of large amount of funds and great demand for products, the Company, through
market behaviors, drove the application of modern and green cement-based building materials
and other products as well as the development of relevant businesses such as design, fitting-out
and property management. By fully capitalizing on its competitive edges of the modern and
green building materials manufacturing, real estate operation and property services sector in
terms of brand, management and techniques, the Company has succeeded in the promotion
of enhanced quality and values of real estate development projects and cutting inventories.
In addition, the real estate development industry has optimized the business layout, explored
and pioneered market of the target regions backed by various resources and advantages
accumulated in the implementation of the “go global” strategy of the modern and green
building material manufacturing industry. Various principal business segments support and
promote the development of each other. Competitive edges in scale centralizing on the industrial
chain, coordination among and integration of different segments have been cumulating.

28
MANAGEMENT DISCUSSION AND ANALYSIS
2. Competitive Edge in Technological Innovation:
In the first half of 2018, with an investment of RMB0.64 billion in technology, the Company
recorded revenue from sales of new products of RMB1.5 billion and obtained 58 patents with
14 patents up to national, industrial or local standards successfully. In relation to areas such as
waste disposal technology, green building materials and green manufacturing, the Company has
identified 28 major scientific research projects, including “Extra-low Emission of Nitrogen Oxide
from the Cement Kiln (水泥窯氮氧化物超低排放)” project aiming to control the emission to
below 100mg per cubic meter, “Research of High power 3,550KW or Above Permanent Magnet
Direct-drive System (3550KW及以上大功率永磁直驅系統研發) aiming to achieve the R&D of
key technologies and “Development of a Set of Mobile Construction Waste Decomposition
Systems (移動式建築垃圾破碎成套系統開發)”aiming to achieve the manufacturing of prototype.
Beijing Jiandu Design and Research Institute under the Company was granted the title of “Small
and medium sized technological enterprises” by the Ministry of Science and Technology. The
fly ash disposal technology developed by BBMG Liushui Environmental Protection Technology
Co., Ltd. was included in the national advanced technology catalogue of pollution prevention
and control under the Ministry of Ecology and Environment. 6 projects in relation to the
“Development of Graded Combustion and Denitrifying Technology for Cement Kiln Based on
SNCR Technology (基於SNCR工藝的水泥窯分級燃燒脫硝技術開發)”of Jidong Development
Group was listed in the 2018 catalogue of first batch of 100 innovative projects of Tangshan City.
3. Competitive Edge in Sustainable Development of Green Operations:
By fully unleashing its industrial advantages, the Company actively facilitated the “Four Centers”
development of Beijing to play the role of “city air purifier partnering with the government”. As
such, The Company accelerated its pace towards transformation and upgrading to embark on a
sustainable path for green development. In the first half of 2018, BBMG Liushui Environmental
Protection Technology Co., Ltd., Chengde BBMG Cement Co., Ltd., Laishui Jidong Cement Co.,
Ltd. and Yongji Company in Jilin region of BBMG Jidong Cement under the Group obtained
the business permit on hazardous wastes disposal. The 2nd phase of fly ashes disposal project
of BBMG Liushui Environmental Protection Technology Co., Ltd and the household garbage
disposal project of Zanhuang BBMG Cement Co., Ltd. under the Group have achieved target
production steadily. The sludge disposal project of Jidong Cement Luan County Co., Ltd. and
the hazard waste disposal project of Xingtai BBMG Yongning Cement Co., Ltd., under the
Group have completed construction. As of the date hereof, a total of 19 cement enterprises
under the Company has completed the construction of their collaborative disposal lines. In the
first half of the year, solid wastes disposal amounted to 0.377 million tonnes, representing 2.4
times of the corresponding period last year. The hazardous wastes disposal by the enterprises
in Beijing amounted to 0.077 million tonnes, up 27% over the corresponding period last year,
marking a substantial increase in the capacity of hazardous wastes disposal.
BBMG CORPORATION
INTERIM REPORT 201829
MANAGEMENT DISCUSSION AND ANALYSIS
In the first half of 2018, the investment of the Company in environmental protection and
control amounted to RMB0.28 billion.The Company launched unorganized special rectification,
environment protection and safety enhancement project and completed 622 items of rectification.
By revising and promulgating the “Administrative Measures on Environmental Protection”
and the system of standardized assessment parameters on environment, the Company
has demonstrated the civilized concept on ecology with a noticeably enhanced awareness
of corporate environmental responsibility. Under the increasingly stringent environmental
regulation and monitoring, the Company promoted the standardization of environmental
protection, insisted on low-carbon and green sustainable development, which has maximized
the Company’s economic and resource usage efficiencies and actively contributed to urban
development, environmental safety and social harmony.
4. Competitive Edge in Industry-Finance Integration:
Against the backdrop of strengthening financial regulation and deleveraging, market capital
continued to be tightened while the financing costs in the real economy continued to surge.
In a view to support and facilitate the development of its various principal businesses, the
Company has stepped up its efforts in promoting the collaboration with various financial
institutions, innovated the financial management and expanded financing channels. BBMG
Finance Co., Ltd. and BBMG Finance Lease Co., Ltd. under the Group offered a new platform
for the Company to enhance its overall capital operational efficiency, diversify financing channels
and prevent capital risks, thereby facilitating the organic integration between industry capital
and financial capital, which has laid a solid financial foundation for the sound and sustainable
development of the Company.
In the first half of 2018, the external financing of the Company recorded a net increase of
RMB12,700 million, among which, the main financing initiatives included: the Company
successfully registered a bond facility of RMB5 billion on the Shanghai Stock Exchange and
obtained approval and reply from the CSRC. The Company has successfully issued corporate
bonds of RMB3 billion. With the registered debt financing instrument facility of RMB40 billion
in the inter-bank bond market, the issuance of debt financing instrument amounting to RMB9.5
billion was completed, including perpetual medium-term notes of RMB2 billion, medium-
term notes of RMB2 billion and super short term financing bonds of RMB5.5 billion. Facility
of RMB2.4 billion for the special asset support plan of Tengda Plaza and Jianda Building has
completed its registration procedure, and the issuance of the financing of RMB2 billion for the
special asset support plan of Tengda Plaza was completed. The registration procedure of the
debt financing plan facility of RMB2.5 billion on the Beijing Financial Assets Exchange Limited
was completed and the debt has been issued in full.

30
MANAGEMENT DISCUSSION AND ANALYSIS
5. Competitive Edge in Corporate Culture and Branding:
Endeavoring to promote the excellent BBMG culture oriented with the core components such
as the pragmatic working culture of “work with aspiration, competence, efficiency, success and
prudence”, the human spirits of “eight specials”, the development philosophy of “integration,
communion, mutual benefit and prosperity” and the BBMG’s concept of “three emphasis and
one endeavor” to meet all challenges, the Company will seize every opportunity, make steady
progress, respond with the business trends, seek business growth pragmatically and aim for
excellency. The Company will continue to strive for the ambition of positioning itself as a
world-class business group and one of the world’s top 500 enterprises. Under the philosophy
and system of BBMG’s culture, the career goal and humanity spirit shared by all our staff are
highly synchronized, which has become a strong spiritual driver to encourage our staff at all
levels to accomplish goals and make dedication in their own positions. “BBMG” brand has
been consecutively honored as a well-known trademark in Beijing and ranked 67th on the
list of the 2018 (15th) China’s 500 Most Valuable Brands. The superior brand awareness and
prestige has created a sound cultural atmosphere and intelligence support for BBMG to achieve
a new round of leap-forward development in full swing.
POSSIBLE RISKS FACED BY THE COMPANY
1. Risks in Policies
The development of cement and property sectors is directly subject to macroeconomic
development and the state’s macro-control policies. With the impact of the escalating Sino-
US trade friction, more uncertainties exist in the macro economy, which will also affect the
relevant businesses of the Company to a certain extent. Transformation and upgrade as well as
sustainable development in accordance with supply-side structural reform requirements remain
the main theme for cement companies, given the continuous excessive production capacity
across the cement industry and the heightened control of governments over overcapacity and
environmental pollution. Before the long-term mechanisms conducive to healthy development
of the real estate industry become mature, regulatory policies for the real estate industry,
especially at regional levels, will be further differentiated and diversified.

BBMG CORPORATION
INTERIM REPORT 201831
MANAGEMENT DISCUSSION AND ANALYSIS
Solution: The Company will enhance the interpretation, analysis and judgment of the national
macroeconomic policies in response to national policies, and closely monitor US trade policies
toward the PRC to adjust the relevant import and export businesses, strengthen the exchange
rate management and strictly control the foreign exchange risk. Leveraging fully on the
advantages in scale, region and brand, the Company will sharpen its core competence and
minimize the risks brought by macroeconomic policies through actively adapting to the
“new normal”, making use of market trends, further raising the awareness in opportunity
identification, synergy among industries and development and incrementally enhancing the
abilities in institutional innovation, system innovation, technology innovation and management
innovation.
2. Risks in Capital Operation
Under the background of strong financial supervision and de-leveraging, market funds continue
to tighten with increasingly higher finance costs of the real economy, making it harder for
corporate financing and intensifying corporate liquidity risk. Since it is in the stage of rapid
development, the Company will face certain level of financial pressures to maintain daily
operations and meet the needs of future development.
Solution: The Company will enhance its management on finance and capital and improve the
efficiency of the use of capital. It will also promote cooperation with financial institutions,
innovate our financing models and expand our financing channels with a view to ensuring
the safety and stability of the capital chain of the Company. Leveraging the advantages of its
finance company and the finance leasing company, capital operation of the Company will be
secured as a whole.
3. Risks in Market Competition
The Company conducted a strategic restructuring with Jidong Development Group successfully,
which has further improved the order of the regional market of the principal business of cement.
However, with continuous excessive capacity in the cement industry, market demand continues
to decline, leading to more prominent contradiction between supply and demand, while fierce
price competition exists among enterprises, which constrains and impedes the profitability of
the cement segment of the Company.
32
MANAGEMENT DISCUSSION AND ANALYSIS
Solution: Adhering to the principal business of cement, the Company will improve the regional
market integration to expand its regional market share. Meanwhile, the Company will intensify
internal management and continue to boost its market competitiveness by accelerating
transformation and upgrading, enhancing technology research and development and innovation,
tweaking equipment and technologies, saving energy and reducing consumption and lowering
production costs.
LIQUIDITY AND FINANCIAL RESOURCES
As at 30 June 2018, the Group’s total assets amounted to RMB254.153.9 million, an increase of
approximately 9.5% from the beginning of the Reporting Period, which comprised total liabilities of
RMB177,814.5 million, minority interests of RMB22,047.4 million and total equity attributable to the
shareholders of the parent company of RMB54,291.9 million. As at 30 June 2018, total shareholders’
equity amounted to RMB76,339.4 million, an increase of approximately 9.2% from the beginning of
the Reporting Period. As at 30 June 2018, the Group’s net current assets were RMB39,085.3 million,
an increase of approximately RMB5,930.4 million from the beginning of the Reporting Period. Debt
ratio (total liabilities to total assets) was 69.96%, an increase of 0.07 percentage point from the
beginning of the Reporting Period.
As at 30 June 2018, the Group’s cash and bank balances amounted to RMB17,680.7 million, a decrease
of RMB223.2 million from the beginning of the Reporting Period. During the Reporting Period, the
Group generally financed its operations with internally generated resources, corporate bonds, short-
term financing bonds, medium-term notes and banking facilities provided by its principal bankers in the
PRC. As at 30 June 2018, the Group’s interest-bearing bank borrowings amounted to RMB73,394.3
million (as at 31 December 2017: RMB62,448.3 million) which bore fixed interest rates and were all
denominated in Renminbi. Among these borrowings, approximately RMB44,259.0 million interest-
bearing bank borrowings were due for repayment within one year, an increase of approximately
RMB7,481.8 million from the beginning of the Reporting Period. Approximately RMB29,135.3 million
interest-bearing bank borrowings were due for repayment after one year, an increase of approximately
RMB3,464.2 million from the beginning of the Reporting Period. The Group’s interest-bearing bank
borrowings were all denominated in RMB.
BBMG CORPORATION
INTERIM REPORT 201833
MANAGEMENT DISCUSSION AND ANALYSIS
During the Reporting Period, the Company entered into cooperation agreements with various banks
to obtain credit facilities. As at the end of the Reporting Period, the Company was granted total
bank credit facilities of RMB151,975 million and drew down borrowings of RMB73,270 million in
Mainland China. Unutilized credit facilities was RMB78,705 million. As at the date of this report, no
bonds interests of the Company for the current period had not been paid as scheduled, not been fully
paid and was payable but yet to be paid. During the Reporting Period, the interests of other bonds
and debt financing instrument of the Company had been fully settled as scheduled in accordance
with the contract or relevant agreement and no event of default have occurred. The Company has
sufficient capital for its operation. As at 30 June 2018, the Group had no future plans for material
investments or capital assets.
The Company will formulate annual and monthly capital utilization plans according to the repayment
arrangement for principal and interests of borrowings and bonds to be due in the future so as to
allocate capital in a reasonable manner and ensure on-time repayment of interests and principal when
they fall due.
The sources of capital for settling debts are mainly the cash flows generated from daily operating
activities.
During the Reporting Period, in order to effectively safeguard the interests of bondholders and ensure
the principal and interests of the bonds for the current period are settled as agreed, the Company
has established a series of work mechanisms, including measures on opening designated account for
proceeds and designated account for settlement of debts, setting up work teams which will be in
charge of settlement, engaging bonds trustees and enhancing information disclosure. Those measures
together will form a comprehensive system that can ensure the principal and interests of the bonds
for the current period are settled as agreed.
As of the date of this report, no bonds interests of the Company for the current period had not been
paid as scheduled, not been fully paid and was payable but yet to be paid.
ENVIRONMENTAL PROTECTION
During the Reporting Period, the Company conducted production and operation in strict compliance
with the requirements under the national laws and regulations in respect of environmental protection.
There was no breach of laws and regulations, liability for accidents and administrative penalty in
relation to environmental protection that involved the company and its subsidiaries which were the
key pollutant discharging units as announced by the environmental protection departments.

34
MANAGEMENT DISCUSSION AND ANALYSIS
USE OF PROCEEDS FROM THE 2013 PROPOSED PLACING AND THE 2015 PROPOSED PLACING
On 5 September 2013, the Board approved the proposed non-public issue and placing of not more
than 500,903,224 A Shares (the “2013 Proposed Placing”) at the subscription price of RMB5.58
per share by the Company to two target subscribers, including BBMG Group Company Limited and
Beijing Jingguofa Equity Investment Fund (Limited Partnership) (the “Fund”). Each of BBMG Group
Company Limited and the Fund agreed to subscribe for 448,028,673 A Shares and 52,874,551 A
Shares to be issued by the Company at a total consideration of approximately RMB2,500 million and
RMB295 million respectively.
Gross proceeds raised from the 2013 Proposed Placing were approximately RMB2,795 million. Based
on the estimation of all applicable costs and expenses in association with the 2013 Proposed Placing,
the net proceeds from the 2013 Proposed Placing (after deducting all applicable costs and expenses in
association with the proposed placing) were approximately RMB2,774.7 million, which were remitted
to the designated account for proceeds opened as approved by the Board on 24 March 2014.
On 26 March 2015, the Board resolved and proposed to place A shares of the Company to raise gross
proceeds of up to RMB5,000 million to not more than 10 target subscribers (including BBMG Group
Company Limited) (the “2015 Proposed Placing”) to finance the residential and commercial property
development projects of the Group in Beijing, Nanjing and Tianjin and to supplement the working
capital of the Group, details of which have been set out in the announcements of the Company dated
26 March 2015, 1 April 2015, 4 May 2015, 27 May 2015, 11 June 2015, 26 June 2015, 28 July 2015,
12 August 2015, 20 August 2015, 18 September 2015 and 28 October 2015 and the circular of the
Company dated 30 April 2015. At the annual general meeting for 2014 held on 27 May 2015 and
the first extraordinary general meeting for 2015 held on 12 August 2015, the relevant resolutions in
relation to the 2015 Proposed Placing were duly passed.
Reference is also made to the announcement of the Company dated 7 December 2015. On 3
December 2015, the Company completed the 2015 Proposed Placing. Upon completion of the 2015
Proposed Placing, the total number of the Shares of the Company increased from 4,784,640,284
Shares to 5,338,885,567 Shares. The gross proceeds raised from the 2015 Proposed Placing were
RMB4,699,999,999.84. After deducting the costs of the 2015 Proposed Placing and taking the interest
income into consideration, the net proceeds from the 2015 Proposed Placing were RMB4,637,875,039.84,
which were remitted to the designated account for proceeds opened as approved by the Board on
30 November 2015.

BBMG CORPORATION
INTERIM REPORT 201835
MANAGEMENT DISCUSSION AND ANALYSIS
As at 30 June 2018, the Company had utilized the proceeds from the 2013 Proposed Placing and the 2015
Proposed Placing of RMB7,381,841,587.42 (including the use of idle proceeds of RMB10,288,917,300.00
as temporary replenishment of working capital, the use of proceeds of RMB600,000,000.00 as
permanent replenishment of working capital, repayment of RMB10,146,603,600.00 to the designated
account for proceeds with working capital, change in use of the proceeds of RMB2,256,288,600.00,
the actual use of RMB4,378,659,812.43 of the proceeds for projects, intermediary fee paid of
RMB4,504,100.00 and bank charges paid of RMB75,374.99), and obtained interest earned from
deposits of RMB8,498,381.88. The balance of the proceeds was RMB47,396,784.22, including the
intermediary fee unpaid of RMB3,624,960.00.
To regulate the management of proceeds of the Company and secure the interest of small and medium
investors, the Company established the System for Use and Management of Proceeds (hereinafter
referred to as the “Management Measures of Proceeds”) in August 2010, which was considered and
passed by the tenth meeting of the second session of the Board of the Company. In October 2013,
according to the relevant requirements of CSRC and the Shanghai Stock Exchange and as considered
and passed by the sixth meeting of the third session of the Board of the Company, the Company
amended the Management Measures of Proceeds. The amendments provided detailed requirements
regarding the deposit, utilization, change of use, management and supervision of proceeds. It is also
provided that all expenses on the proceeds-financed projects should be of the same use as disclosed
and within the budget of the Company, as well as complete the procedures of approval regarding
utilization of proceeds according to the financial accounting system of the Company.
According to the Management Measures of Proceeds, the Company and Beijing Aerated Concrete
Co., Ltd., BBMG (Dachang) Modern Industrial Park Management Co., Ltd., Beijing BBMG Tiantan
Furniture Co., Ltd., BBMG GEM Real Estate Development Co., Ltd., Jinyu Ligang (Tianjin) Property
Development Co., Ltd. and BBMG Nanjing Real Estate Development Co., Ltd., all being wholly-owned
subsidiaries of the Company, have established designated saving accounts for the proceeds raised from
the 2013 Proposed Placing and the 2015 Proposed Placing respectively. The nine designated accounts
for proceeds include: Bank of Communications Co., Ltd., Beijing Municipal Branch, Industrial and
Commercial Bank of China Limited, Beijing Hepingli Sub-branch, Industrial and Commercial Bank of
China Limited, Shijingshan Sub-branch, China Construction Bank Corporation, Dachang Sub-branch,
Industrial and Commercial Bank of China Limited, Beijing Anzhen Sub-branch, China Construction
Bank Corporation, Beijing Urban Construction Development Professional Sub-branch (2 accounts),
Agricultural Bank of China Limited, Tianjin Yong’an Road Sub-branch and Agricultural Bank of China
Limited, Nanjing Xinglong Street Sub-branch. Upon the receipt of the proceeds from the 2013
Proposed Placing and the 2015 Proposed Placing, the Company entered into a Tri-Party Supervisory
Agreement for the Designated Saving Accounts of Proceeds Raised (《募集資金專戶存儲三方監管協

36
MANAGEMENT DISCUSSION AND ANALYSIS
議》) with the bank and the sponsor for the joint supervision over the use of proceeds. The principal
terms of the agreement are in line with the Tri-Party Supervisory Agreement for the Designated Saving
Accounts of Proceeds Raised (Template) (《募集資金專戶存儲三方監管協議(範本)》) of the Shanghai
Stock Exchange with no significant discrepancy. As of 30 June 2018, the parties to the agreement
had exercised their rights and performed their obligations in accordance with the requirements of the
Tri-Party Supervisory Agreement for Designated Saving Accounts of Proceeds Raised.
As of 30 June 2018, the Company’s deposits of the designated accounts for proceeds were
as follows:
Unit: RMB
No. Name of bank Bank account Account holder Amount
1 Bank of Communications Co., Ltd.,
Beijing Municipal Branch
110060149018170182242 The Company 28,977,894.80
2 Industrial and Commercial Bank of
China Limited, Beijing Hepingli
Sub-branch
0200203319020196563 The Company 13,878.96
3 Industrial and Commercial Bank of
China Limited, Shijingshan Sub-
branch
0200013419200040504 Beijing Aerated Concrete Co., Ltd. 1,411,764.95
4 China Construction Bank Corporation,
Dachang Sub-branch
13001707748050506500 BBMG (Dachang) Modern Industrial Park
Management Co., Ltd.
10,709,101.99
5 Industrial and Commercial Bank of
China, Beijing Anzhen Sub-branch
0200064819024649727 Beijing BBMG Tiantan Furniture Co., Ltd. 57,415.89
6 China Construction Bank, Beijing
Urban Construction Development
Professional Sub-branch
11050138360000000048 BBMG GEM Real Estate Development
Co., Ltd.
390,657.5
7 China Construction Bank, Beijing
Urban Construction Development
Professional Sub-branch
11050138360000000047 BBMG GEM Real Estate Development
Co., Ltd.
2,371,122.65
8 Agricultural Bank of China Limited,
Tianjin Yong’an Road Sub-branch
02280101040015072 Jinyu Ligang (Tianjin) Property Development
Co., Ltd.
1,342,557.25
9 Agricultural Bank of China Limited,
Nanjing Xinglong Street Sub-branch
10109201040009981 BBMG Nanjing Real Estate Development
Co., Ltd.
2,122,390.23
Total 47,396,784.22
Note: The savings balance in the aforesaid designated accounts for proceeds are current savings, which includes savings interest income of RMB8,498,381.88.

BBMG CORPORATION
INTERIM REPORT 201837
MANAGEMENT DISCUSSION AND ANALYSISTh
e C
ompa
ny s
tric
tly
follo
wed
the
Man
agem
ent
Mea
sure
s of
Pro
ceed
s w
hen
usin
g th
e pr
ocee
ds f
rom
the
201
3 Pr
opos
ed P
laci
ng a
nd t
he 2
015
Prop
osed
Pla
cing
. D
etai
ls o
f th
e ac
tual
use
of
proc
eeds
in
proc
eeds
-fin
ance
d pr
ojec
ts w
ere
as f
ollo
ws:
Bre
akd
ow
n o
f U
se o
f Pr
oce
eds
of
the
Co
mp
any
as o
f 30
Ju
ne
2018
Uni
t: R
MB0
’000
Total
proce
eds
749,50
4.00
Total
proce
eds u
sed fo
r inves
tmen
t duri
ng th
e peri
od25,
417.78
Chan
ge in
use o
f total
proce
eds
225,62
8.86
Total
accum
ulated
proce
eds u
sed fo
r inves
tmen
t723
,494.8
5Pro
portio
n of c
hang
e in u
se of
total
procee
ds30.
10%
Comm
itted i
nvest
ment
projec
tCh
ange
dpro
ject
Total
commi
tted
invest
ment
from
procee
ds
Total
invest
ment
after
adjus
tmen
t
Comm
itted
invest
ment
amou
ntas
of the
end o
f the
perio
d (1)
Invest
ment
amou
ntdu
ring t
hepe
riod
Accum
ulated
invest
ment
amou
nt as
ofthe
end
of the
perio
d (2)
Differ
ence
betw
eenacc
umula
tedinv
estme
ntam
ount
and
commi
tted
invest
ment
amou
nt as
of the
end o
fthe
perio
d(3)
=(2)-(1
)
Invest
ment
progre
ss as
of the
end
of the
perio
d (%)
(4)=(2
)/(1)
Date
of pro
ject
ready
for it
sint
ende
d use
Cumu
lative
achiev
edres
ults a
s at
the en
d of
the pe
riod
(Note
8)
Achie
ve the
inten
ded
result
sor
not
Signif
icant
chang
esin
projec
tfea
sibilit
y
Reaso
n for
failur
e to
reach
thesch
edule
dpro
gress
Engine
ering p
roject
of BB
MG In
ternat
ional L
ogistic
s Park
(北京
金隅國際
物流園工
程項目)
(Note
1)–
97,953
.0097,
953.00
97,953
.008,0
79.06
85,324
.30(12
,628.7
0)87.
11%Exp
ected
tobe
comple
tedin
Decem
ber 2018
1,682.
17–
No–
Produc
tion l
ine pr
oject w
ith an
annua
l prod
uction
cap
acity o
f 0.8
million
piece
s of fu
rnitur
e (年產
80萬標件
傢俱生產
線項目)
(Note
2)
–181
,551.0
090,
000.00
90,000
.00127
.5490,
000.00
–100
.00%
Comp
leted
32,988
.47–
No–
Replen
ishme
ntof
workin
gcap
ital
–89,
520.59
89,520
.59–
89,520
.59–
100.00
%–
––
No–
Chaoy
ang Di
strict C
haoyan
g Nort
h Road
(form
er Sta
r Bui
lding M
aterial
s Prod
uct Fa
ctory)
B01, B
02 and
B03
secon
dary re
sident
ial, se
condar
y and
prima
ry sch
ool an
d nurs
ery pr
oject (
朝陽區朝
陽北路(
原星牌建
材製品廠
)B01、
B02、B
03地塊二
類居住、
中小學
合校、托
幼用地項
目) (No
te 3)
–90,
000.00
46,014
.4246,
014.42
499.00
46,014
.42–
100.00
%Co
mplete
d331
,090.2
1–
No–
Replen
ishme
nt of
workin
g cap
ital
–37,
773.08
37,773
.08–
37,773
.08–
100.00
%–
––
No–
Chaoy
ang Di
strict,
Dongb
a Dand
ian se
condar
y res
identi
al and
prima
ry scho
ol pro
ject
(朝陽區東
壩單店二
類居住、
小學用地
項目) (N
ote 4)
–170
,000.0
075,
666.90
75,666
.90701
.0075,
666.90
–100
.00%
Comp
leted
640,07
3.83
–No
–Rep
lenish
ment
of wo
rking
capital
–94,
333.10
94,333
.10–
94,333
.10–
100.00
%–
––
No–
BBMG Z
hongbe
i Town
resid
ential
projec
t (金隅
中北鎮住
宅項目)
(Note
5)–
50,000
.0045,
997.91
45,997
.914,8
00.57
45,997
.91–
100.00
%Co
mplete
d210
,738.0
1–
No–
Replen
ishme
nt of
workin
g cap
ital
–4,0
02.09
4,002.
09–
4,002.
09–
100.00
%–
––
No–
Nanjin
g City
Jianye
Distric
t Xing
long S
treet
North
A2
projec
t (南京市
建鄴區興
隆大街北
側A2項
目) (No
te 6)
–100
,000.0
0100
,000.0
0100
,000.0
011,
210.61
94,862
.46(5,
137.54
)94.
86%Exp
ected
to be
comp
leted i
n Ap
ril 201
9
554,68
2.81
–No
–
Sub-to
tal689
,504.0
0681
,261.0
9681
,261.0
925,
417.78
663,49
4.85
(17,76
6.24)
97.39%
1,771,
255.50
Replen
ishme
nt of
workin
g capi
tal (No
te 7)
60,000
.0060,
000.00
60,000
.00–
60,000
.00–
100.00
%–
Total
749,50
4.00
741,26
1.09
741,26
1.09
25,417
.78723
,494.8
5(17
,766.2
4)97.
60%1,7
71,255
.50

38
MANAGEMENT DISCUSSION AND ANALYSIS
Note 1: Phase 1 of the engineering project of BBMG International Logistics Park has been completed, phase 2 has been basically completed and phase 3 is still under construction. It was scheduled to be completed in December 2016. Since Beijing has launched a policy in relation to orderly shift of non-capital core functions and adjusted its overall planning upon approval of the proceeds-financed project, after consideration and approval at the eighteenth meeting of the fourth session of the Board, the eleventh meeting of the fourth session of the Supervisory Board and the 2016 annual general meeting of the Company and making announcement thereof, the following adjustment will be made for the proceeds-financed project: BBMG International Logistics Park will enhance its position by proactively transforming into an advanced and international park. The completion time of the project will be extended from the end of December 2016 to the end of December 2018. As of 30 June 2018, the expenses incurred but not yet settled and the expenses expected to be incurred but not yet settled amounted to RMB126.2870 million in total.
Note 2: Production line project with an annual production capacity of 0.8 million pieces of furniture has been completed, and the remaining balance in relation to certain construction, procurement and installation that is required to settle will be paid by the Company separately. The difference between committed investment before and after fund raising of the project was due to the deduction of issuance expense of RMB20.3041 million, as well as the change in use of proceeds of RMB895.2059 million. In 2015, the committed investment proceeds for the production line project with an annual production capacity of 0.8 million pieces of furniture changed to RMB900 million. Such change was resolved and announced at the 2014 annual general meeting of BBMG Corporation.
Note 3: Chaoyang District Chaoyang North Road (former Star Building Materials Product Factory) B01, B02 and B03 secondary residential, secondary and primary school and nursery project has been completed. The difference between committed investment before and after fund raising was due to the deduction of issuance expense of RMB62.1250 million. During the implementation of project construction, the Company strictly followed the relevant requirements in relation to the use of proceeds and the proceeds raised were used prudently. Since the project was established at an earlier time, a significant amount of investment has been made by using self-financing funds at the preliminary stage. However, the proceeds can only be used to replace the investment made after the date of the resolution on non-public issuance of Shares by the 17th meeting of the third session of the Board of the Company. Accordingly, this proceeds-financed project has an outstanding balance of proceed. After consideration and approval at the 30th meeting of the fourth session of the Board, the 18th meeting of the fourth session of the Supervisory Board and the 2017 annual general meeting of the Company, the Company closed the project and applied the remaining balance of the proceeds of RMB377.7308 million to permanently replenish the working capital.
Note 4: Chaoyang District, Dongba Dandian secondary residential and primary school project has been completed. During the implementation of project construction, the Company strictly followed the relevant requirements in relation to the use of proceeds and the proceeds raised were used prudently. Since the project was established at an earlier time, a significant amount of investment has been made by using self-financing funds at the preliminary stage. However, the proceeds can only be used to replace the investment made after the date of the resolution on non-public issuance of Shares by the 17th meeting of the third session of the Board of the Company. In addition, during the course of project construction, due to reasons such as further optimization of proposal design, decrease in market price of building materials such as reinforced concrete to a level lower than the estimated value, and application of unused self-financing funds towards early repayment of interest-bearing liabilities upon the receipt of proceeds, the cost of construction has decreased. Taking into account of the above factors, this proceeds-financed project has an outstanding balance of proceed. After consideration and approval at the 30th meeting of the fourth session of the Board, the 18th meeting of the fourth session of the Supervisory Board and the 2017 annual general meeting of the Company, the Company closed the project and applied the remaining balance of the proceeds of RMB943.3310 million to permanently replenish the working capital.
BBMG CORPORATION
INTERIM REPORT 201839
MANAGEMENT DISCUSSION AND ANALYSIS
Note 5: BBMG Zhongbei Town residential project has been completed, but is still required to settle the remaining balance in relation to certain construction, procurement and installation. During the implementation of project construction, the Company strictly followed the relevant requirements in relation to the use of proceeds and the proceeds raised were used prudently. Since the project was established at an earlier time, a significant amount of investment has been made by using self-financing funds at the preliminary stage. However, the proceeds can only be used to replace the investment made after the date of the resolution on non-public issuance of Shares by the 17th meeting of the third session of the Board of the Company. Accordingly, this proceeds-financed project has an outstanding balance of proceed. After consideration and approval at the 30th meeting of the fourth session of the Board, the 18th meeting of the fourth session of the Supervisory Board and the 2017 annual general meeting of the Company, the Company closed the project and applied the remaining balance of the proceeds of RMB40.0209 million to permanently replenish the working capital.
Note 6: Nanjing City Jianye District Xinglong Street North A2 project is expected to be completed in April 2019. As of 30 June 2018, the expenses incurred but not yet settled and the expenses expected to be incurred but not yet settled amounted to RMB51.3754 million in total.
Note 7: Replenishment of working capital is for the pre-use plan of the allocation of proceeds from non-public issuance in accordance with the disclosures of “I. Plan of Use of Proceeds from Private Issuance” under section 4 “Analysis on the Feasibility of the Use of Proceeds by the Board” in “Proposal of Private Issuance of A Shares of BBMG Corporation” published on 27 March 2015.
Note 8: Results achieved was calculated based on revenue.
The Company did not have any prepayment for investment projects and replacement of proceeds
during the Reporting Period.
USE OF IDLE PROCEEDS FOR TEMPORARY REPLENISHMENT OF WORKING CAPITAL DURING THE REPORTING PERIOD
In order to lower the finance expenses and enhance the capital utilization rate of the Company,
pursuant to requirements under Article 11 of the Administrative Measures for Proceeds of Companies
Listed on the Shanghai Stock Exchange (《上海證券交易所上市公司募集資金管理規定》) issued by the
Shanghai Stock Exchange and the “resolution for considering the temporary supplement of working
capital by certain idle proceeds” considered and passed at the ninth meeting of the third session
of the Board, the Company agreed to use RMB2,200 million from the idle proceeds as temporary
replenishment of working capital. As at 9 April 2015, the Company had returned in full the proceeds
of RMB2,200 million, which were used for the temporary replenishment of working capital, to the
designated account for proceeds.
40
MANAGEMENT DISCUSSION AND ANALYSIS
According to the “resolution for considering the temporary supplement of working capital by certain
idle proceeds” considered and passed at the eighteenth meeting of the third session of the Board of
the Company, the Company agreed to use RMB2,200 million from the idle proceeds as temporary
replenishment of working capital. The above idle proceeds used for temporary replenishment of working
capital has a term of not more than 12 months from the date on which the Board of the Company
considered and approved the use. The independent directors, supervisory board and sponsors of the
Company have expressed their consent opinions towards this proposal, and the Company has made
an announcement within 2 days upon conclusion of the Board meeting. As of 18 March 2016, the
monies had been returned in full to the designated account for proceeds.
According to the “resolution for considering the temporary supplement of working capital by certain
idle proceeds” considered and passed at the second meeting of the fourth session of the Board of the
Company, the Company agreed to use up to RMB2,650 million from the idle proceeds as temporary
replenishment of working capital. The above idle proceeds used for temporary replenishment of
working capital has a term of not more than 12 months from the date on which the Board of the
Company considered and approved the use, upon expiry of which the monies shall be returned to the
designated account for proceeds. The independent directors, supervisory board and sponsors of the
Company have expressed their consent opinions towards this proposal, and the Company has made
an announcement within 2 days upon conclusion of the Board meeting. As of 25 October 2016, the
monies had been returned in full to the designated account for proceeds.
According to the “resolution for considering the temporary supplement of working capital by certain
idle proceeds” considered and passed at the fourth meeting of the fourth session of the Board of
the Company, the Company agreed to use RMB900 million from the idle proceeds as temporary
replenishment of working capital, for a term not more than 12 months from the date on which the
Board of the Company considered and approved the use. The independent directors, supervisory
board and sponsors of the Company have expressed their consent opinions towards this proposal,
and the Company has made an announcement within 2 days upon conclusion of the Board meeting.
As of 22 March 2017, the monies had been returned in full to the designated account for proceeds.
According to the “resolution for considering the temporary supplement of working capital by certain
idle proceeds” considered and passed at the fifteenth meeting of the fourth session of the Board of
the Company, the Company agreed to use up to RMB1,800 million from the temporarily idle proceeds
as temporary replenishment of working capital, for a term not more than 12 months from the date
on which the Board of the Company considered and approved the use. The independent directors,
supervisory board and sponsors of the Company have expressed their consent opinions towards this
proposal, and the Company has made an announcement within 2 days upon conclusion of the Board
meeting. As of 24 October 2017, the monies had been returned in full to the designated account
for proceeds.
BBMG CORPORATION
INTERIM REPORT 201841
MANAGEMENT DISCUSSION AND ANALYSIS
According to the “resolution for considering the temporary supplement of working capital by certain
idle proceeds by the Company” considered and passed at the sixteenth meeting of the fourth session
of the Board of the Company, the Company agreed to use RMB400 million from the idle proceeds
as temporary replenishment of working capital, for a term not more than 12 months from the date
on which the Board of the Company considered and approved the use. The independent directors,
supervisory board and sponsors of the Company have expressed their consent opinions towards this
proposal, and the Company has made an announcement within 2 days upon conclusion of the Board
meeting. As of 26 March 2018, the monies had been returned in full to the designated account for
proceeds.
According to the “resolution for considering the temporary supplement of working capital by certain
idle proceeds” considered and passed at the twenty-fourth meeting of the fourth session of the Board
of the Company, the Company agreed to use RMB1,500 million from the idle proceeds as temporary
replenishment of working capital, for a term not more than 12 months from the date on which the
Board of the Company considered and approved the use. The independent directors, supervisory board
and sponsors of the Company have expressed their consent opinions towards this proposal, and the
Company has made an announcement within 2 days upon conclusion of the Board meeting.
In the announcements, the Company undertook that the use of certain idle proceeds for replenishment
of working capital would not change or essentially change the use of proceeds while temporary
replenishment of working capital was only limited to the use in the production and operation related
to principal business and would not be used in placing and subscription of new shares or in the
transactions such as securities and its derivative form and convertible bonds, through direct or indirect
arrangements. It also undertook that in order to ensure the progress of the proceeds-financed projects,
the Company would return the proceeds to the designated account for proceeds with the self-financing
funds or bank loans by the time when the projects need the proceeds.
CHANGE OF THE PROCEEDS-FINANCED PROJECTS
During the Reporting Period, certain proceeds-financed projects of the Company were closed. The
Company applied the remaining balance of the proceeds to permanently replenish the working capital,
and the use of such proceeds has changed, the details of which are as follows:

42
MANAGEMENT DISCUSSION AND ANALYSIS
The “resolution for closing of certain proceeds-financed projects and application of the remaining
balance of the proceeds to permanently replenish the working capital” was considered and passed
at the thirtieth meeting of the fourth session of the Board and the eighteenth meeting of the fourth
session of the Supervisory Board convened on 29 March 2018, and the 2017 annual general meeting
convened on 24 May 2018 by the Company. Given the construction of certain proceeds-financed
projects from the 2015 Proposed Placing of the Company, namely “Chaoyang District Chaoyang
North Road (former Star Building Materials Product Factory) B01, B02 and B03 secondary residential,
secondary and primary school and nursery project”, “Chaoyang District, Dongba Dandian secondary
residential and primary school project” and “BBMG Zhongbei Town residential project”, has been
completed, in order to maximize the effectiveness of the proceeds, improve the efficiency of the use
of funds, enhance the financial position of the Company, reduce its financial expenses and short-term
debt service pressure and improve its profitability, the Company utilized the balance of the proceeds
from the completed fund-raising investment projects of RMB1,361.0827 million in aggregate to
permanently replenish its working capital. The independent directors, supervisory board and sponsors
of the Company have expressed their consent opinions towards this proposal, and the Company has
made an announcement within 2 days upon conclusion of the Board meeting.
Save as stated above, the Company had no other change of the proceeds-financed projects during
the half year of 2018.
The Company has promptly, truly, accurately and fully disclosed the relevant information without any
non-compliance in management of proceeds.
DISCLOSEABLE TRANSACTIONS DURING THE REPORTING PERIOD
(1) Reference is made to the announcements of the Company dated 31 May 2016, 29 June 2016, 6
July 2016 and 4 August 2016 (the “Original Proposal Announcements”), the announcements
of the Company dated 28 December 2017 and 7 February 2018 (the “Adjusted Proposal
Announcements”) and the circular of the Company dated 29 July 2016 (the “2016 Circular”)
relating to, among other things, the Equity Restructuring and Asset Restructuring of Jidong
Development Group and Jidong Cement. Unless otherwise defined, capitalized terms used in
this report shall have the same meanings as defined in the Original Proposal Announcements,
Adjusted Proposal Announcements and 2016 Circular.

BBMG CORPORATION
INTERIM REPORT 201843
MANAGEMENT DISCUSSION AND ANALYSIS
On 11 October 2016, the Company completed the Equity Restructuring. As disclosed in the
2016 Circular, the Asset Restructuring was subject to the approval by the CSRC. Due to change
of internal and external circumstances, the approval of the CSRC of the Asset Restructuring
is not expected to be obtained. Therefore, on 28 December 2017, the Company and Jidong
Cement entered into (i) the Termination Agreement to terminate the Asset Restructuring,
pursuant to which the parties agreed to terminate the Share Issuance and Asset Purchase
Agreement, the Profit Compensation Agreement and the Original Entrustment Agreement.; and
(ii) the Framework Agreement in relation to the establishment of the joint venture company
(the “JV Company”). In contemplation of the transactions under the Framework Agreement,
on 28 December 2017, the Company and the Vendors also entered into the Equity Transfer
Agreements, pursuant to which the Company shall purchase, and the Vendors shall sell, an
aggregate of 49.0% equity interests in BBMG Mangrove (a subsidiary of the Company), upon
completion of which the Company shall hold 100% of the equity interests in BBMG Mangrove.
On 7 February 2018, further to the Framework Agreement, the Company and Jidong Cement
entered into (i) the Joint Venture Agreement in relation to the establishment of the JV Company;
(ii) the Performance Compensation Agreement in relation to the performance compensation
undertaking provided by the Company to Jidong Cement in respect of the Target Mining Rights
and the Target Patents and Software Copyrights; and (iii) the Trademark Licence Agreement.
The Transaction Agreements will be beneficial to the Company in terms of enhancement of
access to capital markets to finance the future growth and expansion of business operations. In
addition, there will be more defined business focus between the Company and Jidong Cement
and an increase in management focus and efficiency in resource allocation. The entering into
of the Transaction Agreements can enhance the Company’s return on investment as the future
returns from the Company’s indirect investment in Jidong Cement as a result of the above
factors. The Equity Transfer Agreements will allow the Company to acquire the remaining
49% equity interests in BBMG Mangrove, and facilitate the injection of 100% equity interest
in BBMG Mangrove to the JV Company.
For details of the above mentioned agreements and discloseable transactions entered into
during the Reporting Period, please refer to the Adjusted Proposal Announcements.

44
MANAGEMENT DISCUSSION AND ANALYSIS
Since the adjusted proposal (the “Adjusted Proposal”) mentioned in the Adjusted Proposal
Announcements, if materialized, will result in the disposal of the equity interests in the 10
Injected Companies held by the Company and the Entrusted Companies (all of which are
subsidiaries of the Company) to Jidong Cement, which is a company listed on the Shenzhen
Stock Exchange and a non-wholly owned subsidiary of the Company, the Adjusted Proposal
constitutes a spin-off under Practice Note 15 of the Listing Rules. On 28 March 2018, The
Stock Exchange of Hong Kong Limited (“Hong Kong Stock Exchange”) has confirmed that
the Company may proceed with the Adjusted Proposal. At the 2018 first extraordinary general
meeting held on 29 March 2018 (“2018 First Extraordinary General Meeting”), the two
ordinary resolutions on the establishment of the JV Company and the matters in relation to the
Performance Compensation Agreement were duly passed by the Shareholders. For details of
the Adjusted Proposal as confirmed by the Hong Kong Stock Exchange and the poll results of
the 2018 First Extraordinary General Meeting, please refer to the Company’s announcements
dated 28 March 2018 and 29 March 2018.
On 27 April 2018, Jidong Cement has received a notice from China Securities Regulatory
Commission that subsequent to the review taken at the 21st working meeting of the Merger
and Reorganization Committee held on 27 April 2018, the material assets restructuring through
contribution by Jidong Cement for the formation of the JV Company has been approved
unconditionally.
On 10 May 2018, the Company received the “Decision on No Prohibition in Relation to the
Anti-monopoly Inspection of the Concentration of Undertakings” (經營者集中反壟斷審查不予
禁止審查決定書) (Fan Long Duan Shen Cha Han [2018] No.2) (反壟斷審查函[2018]第2號) dated
4 May 2018 issued by the Anti-monopoly Bureau under the State Administration for Market
Regulation, which, upon inspections, determined to lift the prohibition on the case of formation
of the JV Company by the Company and Jidong Cement and to approve its implementation
from the same date. The Adjusted Proposal passed the anti-monopoly inspection accordingly.
On 31 May 2018, Jidong Cement received the “Reply as the Approval on the Substantial
Asset Restructure of Tangshan Jidong Cement Co., Ltd” (關於核准唐山冀東水泥股份有限公
司重大資產重組的批覆) (Zheng Jian Xu Ke [2018] No.887) (證監許可[2018]887號) from the
China Securities Regulatory Commission, which granted approval for the Adjusted Proposal. All
the decision making processes in respect of the Adjusted Proposal have been performed and
completed. The necessary relevant approvals or authorizations have all been obtained. There
is no outstanding decision making processes or pending approvals or authorizations.

BBMG CORPORATION
INTERIM REPORT 201845
MANAGEMENT DISCUSSION AND ANALYSIS
On 1 June 2018, the JV Company obtained the business license issued by the Tangshan
Administrative Examination and Approval Bureau (Fengrun District). The Company holds 47.09%
equity interests of the JV Company and Jidong Cement holds 52.91% equity interests of the
JV Company.
On 21 June 2018, Tangshan Jidong Cement Co., Ltd. (Tangshan Branch) and Tangshan Jidong
Cement Co., Ltd. (Marketing Branch) have completed the change of industrial and commercial
registration. Jidong Cement has completed the contributions to the JV Company in form of
the assets of branch companies.
On 26 July 2018, the equity interests in 10 companies including BBMG Cement Trading Co.,
Ltd. held by the Company and the equity interests in 20 companies including Jidong Cement
Luan County Co., Ltd. held by Jidong Cement were fully transferred to the JV Company.
(2) After completion of a tender process conducted through Tianjin Property Rights Exchange, on 4
May 2018, the Company and Tianjin Jincheng State-owned Capital Investment and Management
Company Limited* (“Tianjin Jincheng”), entered into the Equity Transaction Agreement.
Pursuant to the Equity Transaction Agreement, the Company has agreed to acquire, and Tianjin
Jincheng has agreed to sell, 55% equity interests in Tianjin Building Materials (Holding) Co.,
Ltd. (“Tianjin Building Materials”) (a wholly-owned subsidiary of Tianjin Jincheng) at a total
consideration of RMB4,018 million. Upon completion of the transactions contemplated under
the Equity Transaction Agreement on 22 May 2018, Tianjin Building Materials became a non-
wholly owned subsidiary of the Company and its financial statements was consolidated into
the financial statements of the Group. For details of the Equity Transaction Agreement and
the reasons for and benefits of entering into the Equity Transaction Agreement, please refer
to the announcement of the Company dated 4 May 2018.
COMMITMENTS
Unit: RMB
As at
30 June 2018
As at
31 December 2017
(Unaudited) (Audited)
Contracted but not provided for
Capital commitments 141,899,499.23 240,456,042.76
Property development contracts 9,498,338,882.80 6,402,057,932.69
9,640,238,382.03 6,642,513,975.45

46
MANAGEMENT DISCUSSION AND ANALYSIS
CONTINGENCIES
Unit: RMB
As at
30 June 2018
As at
31 December 2017
(Unaudited) (Audited)
Provision of guarantee on mortgage
to third parties Note 1 11,703,068,498.38 12,052,621,076.05
Provision of guarantee on loans and
others to third parties Note 2 3,053,500,000.00 4,824,000,000.00
14,756,568,498.38 16,876,621,076.05
Note 1: Certain customers of the Group have purchased the commodity housing developed by the Group by way of bank mortgage (secured loans). According to the bank requirement in respect of the secured loans of the individual purchase of housing, the Group has provided guarantees to secure the periodical and joint obligation of such secured loans granted by banks for home buyers. These guarantees will be released upon obtaining building ownership certificates and completion of formalities of mortgage by the home buyers. The management is of the opinion that in the event of default in payments, the net realizable value of the relevant properties is sufficient to cover the outstanding mortgage principals together with the accrued interests and penalties, and therefore no provision for the guarantees has been made in the financial statements.
Note 2: As at 30 June 2018, Jidong Development Group, a subsidiary of the Group, provided guarantee on the borrowings of RMB1,040,000,000.00 for Tangshan Nanhu Eco-City Development and Construction Investment Co., Ltd. (唐山市南湖生態城開發建設投資有限責任公司). The guarantee will expire on 21 May 2029. Tianjin Building Materials (Holding) Co., Ltd. (天津市建築材料集團(控股)有限公司), a subsidiary of the Group, provided guarantees on the borrowings of RMB50,000,000.00 for Tianjin Longhong Composite Materials Co., Ltd. (天津市龍泓複合材料有限公司), the borrowings of RMB515,000,000.00 for Tianjin Yishang Group Co., Ltd. (天津一商集團有限公司) and the borrowings of RMB1,426,500,000.00 for Datong Coal Mine Group Co., Ltd. (大同煤礦集團有限責任公司). These guarantees will expire on 24 September 2018, 4 March 2019 and 13 December 2019, respectively.
PLEDGE OF ASSETS
As at 30 June 2018, certain of the Group’s inventories, fixed assets, investment properties, land use
rights and equity interest totaling RMB33,620.7 million (as at December 2017: RMB26,058.7 million)
were pledged or mortgaged to secure the short-term and long-term loans of the Group, which
accounted for approximately 13.2% of the total assets of the Group (as at 31 December 2017: 11.2%).
EMPLOYEES
As at 30 June 2018, the Group had 56,708 employees in total (as at 31 December 2017: 52,321).
During the Reporting Period, the aggregate remuneration of the Group’s employees (including Directors’
remuneration) amounted to approximately RMB2,776.9 million (for the six months ended 30 June
2017: RMB2,649.9 million), representing an increase of approximately 4.8%. The Group provides its
employees in the PRC with retirement insurance, medical insurance, unemployment insurance, maternity
insurance and industrial injury insurance as well as a housing provident fund pursuant to PRC laws
and regulations. The Group pays salaries to its employees based on a combination of factors such as
their positions, lengths of service and work performance, and reviews these salaries and benefits on
a regular basis.

BBMG CORPORATION
INTERIM REPORT 201847
MANAGEMENT DISCUSSION AND ANALYSIS
RISK MANAGEMENT
The Group has established and maintained sufficient risk management procedures to identify and control
various types of risk within the organisation and the external environment with active management
participation and effective internal control procedures, which is in the best interest of the Group and
its shareholders.
FOREIGN EXCHANGE RISK MANAGEMENT
The Group mainly operates its business in the PRC. During the Reporting Period, sales proceeds and
procurement expenses of the Group were mainly denominated in RMB. Most of the Group’s financial
instruments such as accounts and bills receivables, cash and bank balances are denominated in the
same currency or a currency that is pegged to the functional currency of the operations to which the
transactions are related. Accordingly, it is believed that the Group has minimal foreign exchange risks.
The Group has not used any forward contract or currency borrowing to hedge its interest rate risks.
Fluctuations of the exchange rates of foreign currencies did not constitute any material challenges to
the Group or have any significant effects on its operations or working capital during the Reporting
Period. However, the management will continue to monitor foreign exchange risks and adopt prudent
measures as appropriate.
TREASURY POLICIES
The Group adopts conservative treasury policies and controls tightly its cash and risk management.
The Group’s cash and bank balances are held mainly in RMB. Surplus cash is generally placed in short
term deposits denominated in RMB.
MATERIAL ACQUISITION AND DISPOSAL OF SUBSIDIARIES
Save as disclosed above under the section headed “Discloseable Transactions During the Reporting
Period” for the establishment of the JV Company, the acquisition of all the minority interests of BBMG
Mangrove and the acquisition of Tianjin Building Materials under the Equity Transfer Agreements, the
Group had not conducted any substantial acquisition or disposal of subsidiaries, associates or joint
ventures that were required to be disclosed during the Reporting Period.
SIGNIFICANT EVENTS AFTER BALANCE SHEET DATE
As at the date of this report, the Group did not have any significant event after balance sheet date
required to be disclosed.

OTHER INFORMATION
48
SUBSTANTIAL SHAREHOLDERS’ AND OTHER PERSONS’ INTERESTS IN SHARES
As at 30 June 2018, the total issued share capital of the Company was 10,677,771,134 shares, of
which 8,339,006,264 were A Shares and 2,338,764,870 were H Shares. To the best knowledge of
the directors of the Company (the “Directors”), the records of interest (being 5% or more of the
Company’s issued share capital) as registered in the register of interests kept by the Company under
section 336 of the Securities and Futures Ordinance (the “SFO”) were as follows:
Long positions:
Type of
shareholding Name of shareholder
Capacity and nature
of interest
Number of
shares held
Percentage
of such
shareholding
in the same
type of issued
share capital
Percentage of
total issued
share capital
(%) (%)
A Shares 北京國有資本經營管理中心 (Beijing
State-owned Capital Operation
and Management Center,
“Beijing SCOM Center”) (Note 1)
Direct beneficial owner 4,797,357,572 57.53 44.93
北京京國發股權投資基金(有限合夥) (Beijing Jingguofa Equity
Investment Fund (Limited
Partnership)) (Note 2)
Interest of corporation
controlled by
the substantial
shareholder
43,115,900 0.52 0.40
State-owned Assets Supervision and
Administration Commission of
People’s Government of Beijing
Municipality (Note 1)
Held by controlled
corporation
4,840,473,472 58.05 45.33
H Shares BlackRock, Inc. Interest of corporation
controlled by
the substantial
shareholder
197,254,179 8.43 1.85
H Shares Prime Capital Management
Company Limited
Investment manager 162,907,755 7.15 1.57
H Shares FMR LLC Interest of corporation
controlled by
the substantial
shareholder
138,348,624 5.92 1.30

BBMG CORPORATION
INTERIM REPORT 201849
OTHER INFORMATION
Note 1: The Beijing SCOM Center is a collectively-owned enterprise established under the laws of the PRC with registered capital fully paid up by the State-owned Assets Supervision and Administration Commission of People’s Government of Beijing Municipality.
Note 2: The Beijing SCOM Center is interested in 43,115,900 A Shares of the Company through its 83.4262% direct equity interest in Beijing Jingguorui State-owned Assets Reform and Development Fund (Limited Partnership)* (北京京國瑞國企改革發展基金(有限合夥)) and 93.32% indirect equity interest in Beijing Jingguofa Equity Investment Fund (Limited Partnership)* (北京京國發股權投資基金(有限合夥)), which is directly held by Jingguorui State-owned Assets Reform and Development Fund (Limited Partnership)* (北京京國瑞國企改革發展基金(有限合夥)) .
Short positions:
Type of
shareholding Name of shareholder
Capacity and nature
of interest
Number of
shares held
Percentage
of such
shareholding
in the same
type of issued
share capital
Percentage of
total issued
share capital
(%) (%)
H Shares BlackRock, Inc. Interest of corporation
controlled by the
substantial shareholder
682,000 0.03 0.01
Save as disclosed above, as at 30 June 2018, so far as was known to the Directors, there were no other
parties who had interests or short positions in the shares or underlying shares of the Company which
would fall to be disclosed to the Company and the Hong Kong Stock Exchange under the provisions
of Divisions 2 and 3 of Part XV of the SFO, or which were recorded in the register of interests required
to be kept by the Company pursuant to Section 336 of the SFO.

50
OTHER INFORMATION
INTERESTS AND SHORT POSITIONS OF DIRECTORS, SUPERVISORS AND CHIEF EXECUTIVE IN SHARES AND UNDERLYING SHARES
As at 30 June 2018, the interests or short positions of the Company’s Directors, supervisors or chief
executive in the shares and underlying shares of the Company or any of its associated corporations
(within the meaning of Part XV of the SFO) which were required to be notified to the Company and the
Hong Kong Stock Exchange pursuant to Divisions 7 and 8 of Part XV of the SFO (including interests or
short positions which they were taken or deemed to have under such provisions of the SFO); or were
required, pursuant to section 352 of the SFO, to be entered in the register of interests maintained by
the Company, or were required, pursuant to the Model Code for Securities Transactions by Directors
of Listed Issuers (the “Model Code”) set out in Appendix 10 to the Listing Rules, to be notified to
the Company and the Hong Kong Stock Exchange, were as follows:
Name Position
Capacity and
nature of interest
Number of
shares held
Type of
shareholding
Percentage
of such
shareholding in
the same type
of issued share
capital
Percentage
of total
issued share
capital
(%) (%)
Jiang Deyi Director Beneficial owner 63,000 Shares A Shares 0.00% 0.00%
Wu Dong Director Beneficial owner 60,000 Shares A Shares 0.00% 0.00%
All the shareholding interests listed in the above table are “long” positions.
MODEL CODE FOR SECURITIES TRANSACTIONS BY DIRECTORS AND SUPERVISORS
The Company has adopted the model code for securities transactions by the Directors, supervisors
and relevant employees on terms no less exacting than the required standards set out in the Model
Code. Relevant employees who are likely to be in possession of inside information in relation to the
purchase and sale of the securities of the Company are also required to comply with the Model Code.
As at 30 June 2018, the Directors were not aware of any issues of the Directors, supervisors and
relevant employees not in compliance with the Model Code during the six months ended 30 June
2018. Specific enquiry has been made to all Directors and supervisors, who have confirmed that they
had complied with the Model Code during the Reporting Period.

BBMG CORPORATION
INTERIM REPORT 201851
OTHER INFORMATION
PURCHASE, SALES OR REDEMPTION OF THE COMPANY’S LISTED SECURITIES
The Group did not sell, repurchase or redeem any of the securities of the Company during the six
months ended 30 June 2018.
CORPORATE GOVERNANCE CODE
Good corporate governance is conducive to enhancing overall performance and accountability and is
essential in modern corporate governance. The Board continuously observes the principles of good
corporate governance in the interests of Shareholders and devotes considerable effort identifying and
formalizing the best practice. During the Reporting Period, the Company had reviewed its corporate
governance documents and the Board is of the view that the Company had fully complied with the
code provisions of the Corporate Governance Code set out in Appendix 14 to the Listing Rules.
CHANGE OF THE CHINESE NAME AND CHINESE STOCK SHORT NAME OF THE COMPANY
As the gratuitous transfer (the “Gratuitous Transfer”) of state-owned A shares of the Company from
BBMG Group Company Limited (being the original controlling shareholder and is presently renamed as
BBMG Assets Management Co., Ltd.) to Beijing SCOM Center was completed on 29 December 2016,
Beijing SCOM Center has become the controlling shareholder of the Company through the Gratuitous
Transfer. Hence, in accordance with the requirements to deepen the comprehensive reformation of
state-owned enterprises and to promote the realization of the overall development strategic objective
and extend the social brand awareness of “BBMG Group”, in order to streamline the management
structural mechanism for the Company and BBMG Group Company Limited and enhance the operational
efficiency and economic momentum of the Company, in accordance to the requirements of the relevant
laws, administrative regulations and listing rules of the listing markets of the Company, the Company
changed its Chinese name from “北京金隅股份有限公司” to “北京金隅集團股份有限公司” according
to the proposal of Beijing SCOM Center, the controlling shareholder of the Company, and based on
the Company’s strategic positioning for future development with an emphasis on its core competitive
advantages. The Board considers that the proposed change of the Chinese name of the Company is in
the interests of the Company and the shareholders of the Company (the “Shareholders”) as a whole.
Meanwhile, in order to align with the change of the Chinese name of the Company, the Company has
proposed to change the Company’s Chinese stock short name from “金隅股份” to “金隅集團” upon
completion of the change of the Company’s Chinese name. The ordinary resolution in relation to the
proposed change of the Company’s Chinese name and Chinese stock short name was passed at the
2017 second extraordinary general meeting (the “2017 Second Extraordinary General Meeting”)
held on 15 December 2017. The Company has received the new business license of the Company

52
OTHER INFORMATION
issued by the Beijing Administration for Industry and Commerce on 19 December 2017. The change
of the Company’s Chinese name has become effective from 19 December 2017. On 9 January 2018,
the Company received from the Companies Registry of Hong Kong the Certificate of Registration of
Alteration of Name of Registered Non-Hong Kong Company reflecting the change of Chinese name
of the Company. The change of the Company’s Chinese stock short name took effect on 19 January
2018. For details of the change of the Company’s Chinese name and Chinese stock short name,
please refer to the announcements of the Company dated 27 October 2017, 15 December 2017,
22 December 2017 and 15 January 2018 and the circular of the Company dated 30 October 2017.
AMENDMENTS TO THE ARTICLES OF ASSOCIATION
As the Gratuitous Transfer was completed on 29 December 2016, Beijing SCOM Center has become
the controlling shareholder of the Company through the Gratuitous Transfer. In order to further
maintain the accuracy and timeliness of the articles of association of the Company (the “Articles of
Association”), the Board made relevant amendments to the Articles of Association (“First Proposed
Amendments”) in accordance with the relevant laws, administrative regulations and listing rules at
the locality where the Company is listed and with reference to the actual circumstances. The First
Proposed Amendments have been approved as a special resolution by the Shareholders at the 2017
Second Extraordinary General Meeting and took effect on 15 January 2018. Please refer to the
announcements of the Company dated 27 October 2017 and 15 December 2017 and the circular of
the Company dated 30 October 2017 for details of the First Proposed Amendments.
In order to further improve the corporate governance structure of the Company and further strengthen
the protection of the interests of small and medium investors, the Board made relevant amendments
to the Articles of Association (“Second Proposed Amendments”) in accordance with the relevant
requirements of Beijing Administration for Industry and Commerce and the suggestions according to
the requirement of the Recommendation Letter of China Securities Investor Services Center regarding
Small and Medium Shareholders (《中證中小投資服務中小股東建議函》) and coping with the actual
conditions of the Company. The Second Proposed Amendments have been approved as a special
resolution by the Shareholders at the 2017 Annual General Meeting held on 24 May 2018 and took
effect on the same date. Please refer to the announcements of the Company dated 29 March 2018
and 24 May 2018 for details of the Second Proposed Amendments.

BBMG CORPORATION
INTERIM REPORT 201853
OTHER INFORMATION
BOARD COMPOSITION
The balance of power and authorities is ensured by the operation of the Board and the senior
management, which comprise experienced and high caliber individuals. As of the date of this report,
the Board comprises four executive Directors, two non-executive Directors and four independent non-
executive Directors. It has a strong independence element in its composition.
There is no change in the composition of the Board during the Reporting Period.
INVESTOR RELATIONS MANAGEMENT
The Group strongly believes that investor relations are an integral part of maintaining good corporate
governance of a listed company. During the Reporting Period, the Group has been actively maintaining
contact with investors and keeping them abreast of the industry updates, corporate information and
business development in a timely manner, so as to establish a platform for fair, open and transparent
information disclosure. The Board Secretary, Zheng Baojin, is responsible for the investor relations of
the Group with the full support from the Board and the senior management. During the six months
ended 30 June 2018, the Group actively participated in various investor relations activities and provided
real-time information to investors through its company website.
1. Investor Forums and Conferences
During the six months ended 30 June 2018, the Group attended a number of investor forums,
roadshows and presentations held by renowned investment and securities firms in the PRC
and Hong Kong, and actively organized one-on-one and group meetings with fund managers
and analysts in various regions. During the Reporting Period, the Group has met with various
analysts, fund managers and financial commentators and maintained close communications
with institutional investors, providing them with up-to-date information about the Group.
2. Ongoing Communications with Shareholders, Investors and Analysts
The Group has adopted an active and progressive approach to provide the shareholders and
investors of the Group with the opportunity to communicate with the senior management of
the Group through one-on-one and group meetings and luncheons to share with them the
financial performance, business updates and future prospects of the Group.

54
OTHER INFORMATION
3. Results and Profit Alert Announcements
The Group had prepared detailed result reports upon release of interim and annual results
accompanied by a profit alert announcement where required under Rule 13.09(2) of the Listing
Rules and the Inside Information Provisions under Part XIVA of the SFO. Investors’ presentations
and press conferences were also held to provide updates in relation to the market environment,
financial performance, operating strategies and future prospects to the public in an accurate
and effective manner, so as to maintain the Group’s transparent investor relations strategy
and strengthen the communications with the public.
4. Maintaining Interactive Communications with Media
The Group endeavors to maintain a close relationship with the overseas and local media,
and disseminate the Group’s updates to the public through various channels, ranging from
organizing press conferences for interim and annual results announcements, issuing regular
press releases, and arranging news media interviews with the management of the Group, thus
increasing the Group’s publicity and further strengthening its corporate image and position.
5. Timely Dissemination of Latest Corporate Updates
Company website is considered to be one of the quickest means to communicate with investors.
Information was disseminated through the Company’s website (www.bbmg.com.cn/listco) as the
platform to communicate with the public. The Group regularly updates the website contents,
disseminates the latest corporate updates and developments and discloses financial information
of the Group so as to enable the public to obtain such information in a timely manner. In
addition, the Group also swiftly responds to different enquiries made by the shareholders,
investors, analysts and media by means of email, facsimile and telephone, and publishes
announcements, press releases and other latest updates on the development of the Group,
so as to strengthen the effectiveness of information dissemination.
INVESTOR INFORMATION
1. Share Particulars
H SharesListing date 29 July 2009Stock Exchange Hong Kong Stock ExchangeBoard lot 1,000 sharesNumber of issued H Shares 2,338,764,870 shares (as at 30 June 2018
and 29 August 2018)Stock code 02009.HK
A SharesListing date 1 March 2011Stock Exchange Shanghai Stock ExchangeBoard lot 100 sharesNumber of issued A Shares 8,339,006,264 shares (as at 30 June 2018
and 29 August 2018)Stock code 601992.SH

BBMG CORPORATION
INTERIM REPORT 201855
OTHER INFORMATION
2. Financial Calendar
2017 annual results announcement published on 29 March 2018
2018 first quarterly results announcement published on 25 April 2018
2018 interim results announcement published on 29 August 2018
2017 annual general meeting held on 24 May 2018
Closure of register of H shares members to
determine the eligibility of shareholders to
attend the 2017 annual general meeting
25 April 2018 – 24 May 2018
2018 first extraordinary general meeting held on 29 March 2018
Closure of register of H shares members to
determine the eligibility of shareholders to
attend the 2018 first extraordinary general
meeting
24 February 2018 – 29 March 2018
Financial year end 31 December
3. Dividends
2017 final dividends RMB0.048 per share (inclusive of applicable
tax) (or equivalent to HK$0.0590807 per
H share)
Closure of register of H shares members to
determine the entitlement of shareholders
to the 2017 final dividends
2 June 2018 – 7 June 2018
Payment of 2017 final dividends of H shares 24 July 2018
For any queries, please contact:
BBMG Corporation
Room 2220, 22nd Floor, Tower D,
Global Trade Center
No. 36 North Third Ring East Road
Dongcheng District
Beijing 100013
The People’s Republic of China
Investor Relations Department
Phone: (8610) 6641 7706
Fax: (8610) 6641 0889
Email: [email protected]
Company website: www.bbmg.com.cn/listco

56
OTHER INFORMATION
AUDIT COMMITTEE
The Company has established the Audit Committee pursuant to the provisions of the Listing Rules,
aimed at reviewing and supervising the Group’s financial reporting procedures. The Audit Committee
is composed of two non-executive Directors and four independent non-executive Directors. At the
meeting convened on 28 August 2018, the Audit Committee had reviewed the unaudited interim
consolidated financial statements of the Group for the six months ended 30 June 2018. The Audit
Committee has considered the Group’s internal audit report for the first half of 2018, reviewed the
accounting principles and practices adopted by the Group, considered the Group’s financial statements
for the first half of 2018 and recommended their adoption by the Board.
As at the date of this report, members of the Audit Committee are Mr. Guo Yanming (non-executive
Director), Mr. Yu Zhongfu (non-executive director), Mr. Wang Guangjin (independent non-executive
Director), Mr. Tian Lihui (independent non-executive Director), Mr. Tang Jun (independent non-executive
Director) and Mr. Ngai Wai Fung (independent non-executive Director). Mr. Tian Lihui is the chairman
of the Audit Committee.
AUDITORS
The Board has engaged Ernst & Young Hua Ming LLP, Certified Public Accountant, to review the
interim financial statements of the Company.

Report on Review of Interim Financial Statements
57BBMG CORPORATION
INTERIM REPORT 2018
Ernst & Young Hua Ming (2018) Zhuan Zi No. 60667053_A80
To all shareholders of BBMG Corporation:
We have audited the accompanying financial statements of BBMG Corporation, which comprise the consolidated and
company balance sheets as at 30 June 2018, and the consolidated and company income statements, the statements
of changes in equity and the statements of cash flows for the six-month period ended 30 June 2018 and the notes to
the financial statements (hereinafter collectively, the “Interim Financial Statements”). The management of BBMG
Corporation is responsible for the preparation of the Interim Financial Statements, while we are responsible for the
presentation of an auditors’ report on the Interim Financial Statements based on our review.
We conducted our audit in accordance with China’s Auditing Standards for the Certified Public Accountants No. 2101
Review of Financial Statements. The standard requires our planning of and performing the audit to obtain reasonable
assurance about whether the Interim Financial Statements as a whole are free from material misstatement. The review
is principally based on the enquiries with the related staff of the Company and on the analysis procedures on the
financial data only, therefore the extent of assurance provided by which fall below that obtained from audit. As a
result of the non-performance of audit, we do not provide audit opinion.
Based on our review, we have not been aware of any convincing events that the said Interim Financial Statements
had failed to be prepared in accordance with the Accounting Standards for Business Enterprises No. 32 – Interim
Financial Report or failed to present fairly, in all material aspects, the financial position, the operating results and
cash flows of BBMG Corporation.
Ernst & Young Hua Ming LLP
Chinese Certified Public Accountant: Meng Dong
Chinese Certified Public Accountant: Liu Taiping
Beijing, the PRC
29 August 2018

58
Unaudited Interim Consolidated Balance SheetAs at 30 June 2018
RMB
Assets Note V 30 June 2018 31 December 2017
Assets
Current assets 1 17,680,691,208.86 17,903,847,144.72
Cash and bank balances
Financial assets at fair value through profit or loss 2 – 46,226,108.99
Financial assets held for trading 3 1,350,141,114.85 –
Bills receivable & accounts receivable 4 16,424,808,133.57 15,867,845,894.72
Prepayments 5 2,038,530,443.06 1,792,354,290.47
Other receivables 6 9,210,548,208.77 5,890,424,799.29
Inventories 7 103,328,686,770.34 98,649,716,753.63
Contractual assets 8 5,168,714.52 –
Assets held for sale 9 109,922,395.60 –
Other current assets 10 3,722,616,884.59 3,438,847,412.19
Total current assets 153,871,113,874.16 143,589,262,404.01
Non-current assets
Available-for-sale financial assets 11 – 2,897,887,864.39
Long-term receivables 12 772,241,633.80 485,377,872.64
Long-term equity investments 13 2,501,781,932.88 2,174,939,257.51
Other investments in equity instruments 14 455,311,615.11 –
Other non-current financial assets 15 1,730,252,400.00 –
Investment properties 16 19,217,528,375.46 15,440,453,467.02
Fixed assets 17 45,521,200,463.65 45,895,321,483.24
Construction in progress 18 3,716,196,233.70 2,981,062,425.11
Intangible assets 19 17,512,556,083.47 10,857,085,997.78
Goodwill 20 2,740,287,649.80 2,740,287,649.80
Long-term deferred expenditures 21 1,173,992,323.14 1,134,362,027.11
Deferred income tax assets 22 3,157,049,532.50 2,952,009,690.68
Other non-current assets 23 1,784,351,325.83 1,059,431,952.41
Total non-current assets 100,282,749,569.34 88,618,219,687.69
Total assets 254,153,863,443.50 232,207,482,091.70
The accompanying notes form an integral part of these financial statements

59BBMG CORPORATION
INTERIM REPORT 2018
Unaudited Interim Consolidated Balance Sheet (continued)As at 30 June 2018
RMB
Liabilities and shareholders’ equity Note V 30 June 2018 31 December 2017
Current liabilities
Short-term loans 25 38,136,520,000.00 34,375,200,000.00
Bills payable & accounts payable 26 17,556,199,802.79 17,205,078,515.28
Receipts in advance 191,670,784.18 27,340,492,780.84
Contractual liabilities 27 22,491,291,593.07 –
Wages payable 28 248,324,132.00 365,587,130.76
Tax payable 29 2,622,900,071.05 1,769,260,167.61
Other payables 30 8,917,468,574.76 9,075,247,809.85
Held-for-sale liabilities 9 40,283,885.12 –
Non-current liabilities due within one year 31 13,049,262,905.72 11,491,439,775.59
Short-term financing bonds 34 5,500,000,000.00 2,769,698,081.12
Other current liabilities 32 6,031,872,448.10 6,042,357,010.03
Total current liabilities 114,785,794,196.79 110,434,361,271.08
Non-current liabilities
Long-term loans 33 29,135,269,349.97 25,671,030,000.00
Bonds payable 34 19,971,170,605.73 18,154,840,828.51
Long-term payables 35 615,533,763.80 920,769,354.18
Long-term wages payable 36 682,147,912.50 654,032,290.50
Accrued liabilities 37 535,517,819.93 464,935,400.17
Deferred income 38 862,084,079.92 855,519,940.14
Deferred income tax liabilities 22 5,946,878,811.68 4,473,726,257.58
Other non-current liabilities 39 5,280,094,029.40 660,456,831.52
Total non-current liabilities 63,028,696,372.93 51,855,310,902.60
Total liabilities 177,814,490,569.72 162,289,672,173.68
The accompanying notes form an integral part of these financial statements

60
Unaudited Interim Consolidated Balance Sheet (continued)As at 30 June 2018
RMB
Liabilities and shareholders’ equity Note V 30 June 2018 31 December 2017
Shareholders’ equity
Share capital 40 10,677,771,134.00 10,677,771,134.00
Other equity instruments 41 11,968,000,000.00 9,972,000,000.00
Including: perpetual bonds 11,968,000,000.00 9,972,000,000.00
Capital reserve 42 5,374,405,026.50 5,820,202,037.98
Other comprehensive income 43 209,822,225.32 254,210,159.32
Specific reserve 44 22,887,332.39 12,989,928.59
Surplus reserve 45 1,368,019,010.35 1,368,019,010.35
General risk reserve 46 299,478,851.25 299,478,851.25
Retained earnings 47 24,371,551,943.76 22,758,176,658.95
Equity attributable to the shareholders of the parent company 54,291,935,523.57 51,162,847,780.44
Minority interests 22,047,437,350.21 18,754,962,137.58
Total shareholders’ equity 76,339,372,873.78 69,917,809,918.02
Total liabilities and shareholders’ equity 254,153,863,443.50 232,207,482,091.70
The financial statements have been signed by:
Legal representative: Chief accountant: Head of the accounting department:
Jiang Deyi Chen Guogao Hu Juan
The accompanying notes form an integral part of these financial statements

61BBMG CORPORATION
INTERIM REPORT 2018
Unaudited Interim Consolidated Income StatementFor the six months ended 30 June 2018
RMB
Note V
For the six
months ended
30 June 2018
For the six
months ended
30 June 2017
Operating revenue 48 35,365,393,255.98 29,465,846,282.85
Less: Operating costs 48 25,534,771,580.22 21,479,871,148.31
Tax and surcharges 49 1,053,708,401.15 973,940,364.57
Selling expenses 50 1,163,665,343.18 1,162,126,683.93
Administrative expenses 51 3,093,590,089.13 2,671,044,112.24
Research and development expenses 52 63,250,262.45 22,652,599.26
Finance costs 53 1,363,946,668.03 1,332,763,468.39
Including: Interest income 119,554,528.16 102,242,372.45
Interest expense 1,293,674,299.22 1,302,028,970.59
Asset impairment losses 54 14,133,583.21 146,941,218.69
Reversal of the provision for credit impairment 55 (43,476,415.85) –
Add: Other gains 56 297,746,941.54 255,474,156.38
Investment gains 57 232,457,732.29 271,046,580.10
Including: Share of investment gains of
associates and joint ventures 139,008,136.74 52,810,274.02
Gains from changes in fair value 58 273,123,778.84 126,425,614.70
Gains/(losses) on disposal of assets 59 18,831,201.79 (11,132,655.85)
Operating profit 3,943,963,398.92 2,318,320,382.79
Add: Non-operating revenue 60 88,381,624.69 123,912,550.58
Less: Non-operating expenses 61 108,945,005.24 14,547,290.44
Total profit 3,923,400,018.37 2,427,685,642.93
Less: Income tax expenses 63 995,656,787.76 645,662,574.87
Net profit 2,927,743,230.61 1,782,023,068.06
Including: Net profit from continuing operations 2,927,743,230.61 1,782,023,068.06
Net profit from discontinued operations – –
Classified by attribution of ownership
Net profit attributable to the shareholders of the parent company 2,410,206,116.06 1,846,371,188.87
Minority interests 517,537,114.55 (64,348,120.81)
The accompanying notes form an integral part of these financial statements

62
Unaudited Interim Consolidated Income Statement (continued)For the six months ended 30 June 2018
RMB
Note V
For the six
months ended
30 June 2018
For the six
months ended
30 June 2017
Net other comprehensive income after tax
Net other comprehensive income after tax attributable to
shareholders of the parent company 43
Other comprehensive income that cannot be reclassified to
profit or loss
Re-measurement of changes in defined benefit plan (18,855,736.00) 29,061,622.00
Changes in fair value of other equity instruments investments (21,675,850.45) –
Other comprehensive income to be reclassified into profit or loss
Other comprehensive income that may be reclassified to
profit or loss under equity method (685,072.50) (1,102,557.87)
Exchange differences on translation of financial statements
prepared in foreign currency (3,171,275.05) (661,099.26)
Changes in fair value of available-for-sale financial assets – (5,235,630.29)
The surplus of the fair value on the date of transfer over the
carrying value of the investment properties transferred from the
disposal of self-occupied properties or inventories and measured
with the fair value model – (10,194,361.74)
Net other comprehensive income after deducting
impact of income tax (44,387,934.00) 11,867,972.84
Net other comprehensive income after tax
attributable to minority shareholders 43 (105,857,435.12) (28,641,350.50)
Total comprehensive income 2,777,497,861.49 1,765,249,690.40
The accompanying notes form an integral part of these financial statements

63BBMG CORPORATION
INTERIM REPORT 2018
Unaudited Interim Consolidated Income Statement (continued)For the six months ended 30 June 2018
RMB
Note V
For the six
months ended
30 June 2018
For the six
months ended
30 June 2017
Including:
Total comprehensive income attributable to
shareholders of the parent company 2,365,818,182.06 1,858,239,161.71
Total comprehensive income attributable to
minority shareholders 411,679,679.43 (92,989,471.31)
Basic earnings per share (RMB/share) 64 0.23 0.17
Diluted earnings per share (RMB/share) 64 0.23 0.17
The accompanying notes form an integral part of these financial statements

64
Unaudited Interim Consolidated Statement of Changes in EquityFor the six months ended 30 June 2018
RMB
Equit
y attr
ibutab
le to
shareh
olders
of th
e pare
nt com
pany
Share
capit
al
Othe
r equ
ityins
trume
ntsInc
luding
:Per
petua
l bon
dsCa
pital
reserv
e
Othe
rcom
prehe
nsive
incom
eSp
ecific
reserv
eSu
rplus
reserv
eGe
neral
risk r
eserve
Retai
ned e
arning
sSu
btotal
Mino
rity in
terest
sTo
tal eq
uity
I. Bal
ance a
t the e
nd of
the pr
evious
perio
d10,
677,77
1,134.
009,9
72,000
,000.0
05,8
20,202
,037.9
8254
,210,1
59.32
12,989
,928.5
91,3
68,019
,010.3
5299
,478,8
51.25
22,758
,176,6
58.95
51,162
,847,7
80.44
18,754
,962,1
37.58
69,917
,809,9
18.02
Plus: C
hanges
in ac
counti
ng pol
icies
––
––
––
–(21
,093,9
27.93)
(21,09
3,927.
93)41,
192,60
0.82
20,098
,672.8
9
II. Bal
ance a
t the b
eginni
ng of
the pe
riod
10,677
,771,1
34.00
9,972,
000,00
0.00
5,820,
202,03
7.98
254,21
0,159.
3212,
989,92
8.59
1,368,
019,01
0.35
299,47
8,851.
2522,
737,08
2,731.
0251,
141,75
3,852.
5118,
796,15
4,738.
4069,
937,90
8,590.
91
III. Mo
vement
s duri
ng the
perio
d(1)
Tota
l comp
rehens
ive in
come
––
–(44
,387,9
34.00)
––
–2,4
10,206
,116.0
62,3
65,818
,182.0
6411
,679,6
79.43
2,777,
497,86
1.49
(2) C
apital
contrib
ution
and re
ductio
n from
s
hareho
lders
1. Acq
uisitio
n of m
inority
inter
ests in
subsi
diaries
––
(417,3
32,120
.92)
––
––
–(41
7,332,
120.92
)(1,
893,12
7,094.
85)(2,
310,45
9,215.
77)2.
Busine
ss com
binatio
ns not
invol
ving e
ntities
u
nder co
mmon
contro
l (Note
VI. 1
)–
––
––
––
––
3,780,
249,72
4.45
3,780,
249,72
4.45
3. Ne
w capi
tal con
tributi
on fro
m min
ority
shar
eholde
rs–
––
––
––
––
1,077,
474,89
3.75
1,077,
474,89
3.75
4. Red
uction
of m
inority
inter
ests u
pon
dere
gistra
tion o
f subsi
diaries
––
––
––
––
–(11
,711,1
87.21)
(11,71
1,187.
21)5.
Princip
al amo
unt of
issued
perpe
tual b
onds
(No
te V.
41)–
1,996,
000,00
0.00
––
––
––
1,996,
000,00
0.00
–1,9
96,000
,000.0
0
(3) P
rofit d
istribu
tion
1. Div
idend
to sha
rehold
ers–
––
––
––
(512,5
33,014
.43)
(512,5
33,014
.43)
(7,584
,516.5
9)(52
0,117,
531.02
)2.
Intere
st on p
erpetu
al bond
s–
––
––
––
(263,2
03,888
.89)
(263,2
03,888
.89)
(86,28
4,931.
50)(34
9,488,
820.39
)
(4) S
pecific
reser
ve1.
Appro
priate
d duri
ng the
perio
d–
––
–27,
330,45
3.45
––
–27,
330,45
3.45
35,345
,762.6
262,
676,21
6.07
2. Pai
d duri
ng the
perio
d–
––
–(17
,433,0
49.65)
––
–(17
,433,0
49.65)
(30,93
7,681.
24)(48
,370,7
30.89)
(5) O
thers
––
(28,46
4,890.
56)–
––
––
(28,46
4,890.
56)(23
,822,0
37.05)
(52,28
6,927.
61)
IV. B
alance
at th
e end
of the
perio
d10,
677,77
1,134.
0011,
968,00
0,000.
00 5,3
74,405
,026.5
0209
,822,2
25.32
22,887
,332.3
91,3
68,019
,010.3
5299
,478,8
51.25
24,371
,551,9
43.76
54,291
,935,5
23.57
22,047
,437,3
50.21
76,339
,372,8
73.78
The
acco
mpa
nyin
g no
tes
form
an
inte
gral
par
t of
the
se f
inan
cial
sta
tem
ents

65BBMG CORPORATION
INTERIM REPORT 2018
Unaudited Interim Consolidated Statement of Changes in Equity (continued)For the six months ended 30 June 2017
RMB
Equity
attrib
utable
to sh
arehol
ders o
f the p
arent
compan
y
Share
capital
Other
equity
instru
ments
Includ
ing:
Perpet
ual bo
ndsCa
pital r
eserve
Other
compre
hensive
incom
eSpe
cific re
serve
Surplu
s reser
veGe
neral r
isk re
serve
Retain
ed ear
nings
Subtot
alMin
ority i
nteres
tsTot
al equi
ty
I. Bal
ance a
t the b
eginni
ng of
the pe
riod
10,677
,771,1
34.00
4,982,
000,00
0.00
5,865,
195,78
3.46
231,83
9,701.
658,6
55,529
.411,2
76,866
,688.5
1178
,039,1
95.99
20,980
,120,6
19.08
44,200
,488,6
52.10
18,709
,022,1
34.50
62,909
,510,7
86.60
II. Mo
vement
s duri
ng the
perio
d(1)
Tota
l comp
rehens
ive in
come
––
–11,
867,97
2.84
––
–1,8
46,371
,188.8
71,8
58,239
,161.7
1(92
,989,4
71.31)
1,765,
249,69
0.40
(2) C
apital
contrib
ution
and re
ductio
n from
s
hareho
lders
1. Ord
inary s
hares
contrib
ution
from
minori
ty s
hareho
lders
––
––
––
––
–98,
675,00
0.00
98,675
,000.0
0
(3) P
rofit d
istribu
tion
1. Div
idend
to sha
rehold
ers–
––
––
––
(491,1
77,472
.16)
(491,1
77,472
.16)
(6,488
,800.0
0)(49
7,666,
272.16
)2.
Appro
priatio
n of g
eneral
risk re
serve
––
––
––
91,642
,989.4
5(91
,642,9
89.45)
––
–3.
Others
-inter
est on
perpe
tual b
onds
––
––
––
–(18
6,959,
166.67
)(18
6,959,
166.67
)(86
,284,9
31.50)
(273,2
44,098
.17)
(4) S
pecific
reser
ve1.
Appro
priate
d duri
ng the
perio
d–
––
–27,
774,85
1.07
––
–27,
774,85
1.07
46,350
,755.8
674,
125,60
6.93
2. Pai
d duri
ng the
perio
d–
––
–(25
,198,8
97.25)
––
–(25
,198,8
97.25)
(40,65
2,246.
83)(65
,851,1
44.08)
(5) O
thers
––
(2,390
,395.7
2)–
––
––
(2,390
,395.7
2)1,5
99,007
.53(79
1,388.
19)
III. Bal
ance a
t the e
nd of
the pe
riod
10,677
,771,1
34.00
4,982,
000,00
0.00
5,862,
805,38
7.74
243,70
7,674.
4911,
231,48
3.23
1,276,
866,68
8.51
269,68
2,185.
4422,
056,71
2,179.
6745,
380,77
6,733.
0818,
629,23
1,448.
2564,
010,00
8,181.
33
The
acco
mpa
nyin
g no
tes
form
an
inte
gral
par
t of
the
se f
inan
cial
sta
tem
ents

66
Unaudited Interim Consolidated Statement of Cash FlowsFor the six months ended 30 June 2018
RMB
Note V
For the six
months ended
30 June 2018
For the six
months ended
30 June 2017
I. Cash flows from operating activities
Cash received from sale of goods or rendering of services 36,874,565,568.62 28,785,905,124.32
Refunds of taxes 147,785,613.56 105,897,637.27
Net decrease in deposits placed with the Central Bank 40,627,688.18 852,312,723.52
Cash received from other operating activities 65 1,053,771,605.23 1,251,840,148.49
Subtotal of cash inflows from operating activities 38,116,750,475.59 30,995,955,633.60
Cash paid for goods and services 26,869,069,166.58 34,448,415,925.36
Cash paid to and on behalf of employees 2,992,856,544.14 2,872,321,782.69
Cash paid for all types of taxes 3,853,861,315.77 3,524,205,151.47
Cash paid for other operating activities 65 8,039,561,659.11 1,493,647,445.08
Subtotal of cash outflows from operating activities 41,755,348,685.60 42,338,590,304.60
Net cash flows used in operating activities 66(1) (3,638,598,210.01) (11,342,634,671.00)
II. Cash flows from investing activities
Cash received from redemption of investments – 102,549,482.30
Cash received from return on investments 279,348,817.24 135,774,918.39
Net cash received from disposal of fixed assets, intangible
assets and other long-term assets 43,553,624.35 126,086,788.00
Net cash received from disposal of subsidiaries and other
operating units 66(2) – 634,885,099.31
Cash received from other investing activities 65 6,872,768,400.00 1,162,488,000.00
Subtotal of cash inflows from investing activities 7,195,670,841.59 2,161,784,288.00
Cash paid for acquisition of fixed assets, intangible assets
and other long-term assets 1,218,217,602.45 1,297,925,168.78
Cash paid for investments 1,293,968,421.40 105,516,033.55
Net cash paid for acquisition of subsidiaries and other
operating units 66(2) 3,636,170,422.00 210,840,422.98
Cash paid for other investing activities 65 7,785,629,400.00 2,861,135,077.01
Subtotal of cash outflows from investing activities 13,933,985,845.85 4,475,416,702.32
Net cash flows used in investing activities (6,738,315,004.26) (2,313,632,414.32)
The accompanying notes form an integral part of these financial statements

67BBMG CORPORATION
INTERIM REPORT 2018
Unaudited Interim Consolidated Statement of Cash Flows (continued)For the six months ended 30 June 2018
RMB
Note V
For the sixmonths ended
30 June 2018
For the six
months ended
30 June 2017
III. Cash flows from financing activities
Cash received from capital contributions 900,853,542.47 98,675,000.00
Including: Cash received by subsidiaries from
minority interests 900,853,542.47 98,675,000.00
Cash received from borrowings 30,668,462,205.00 27,756,851,756.00
Cash received from issuance of bonds 12,496,000,000.00 10,800,000,000.00
Cash received from other financing activities 65 – 357,259,000.00
Subtotal of cash inflows from financing activities 44,065,315,747.47 39,012,785,756.00
Cash paid for repayment of borrowings 24,022,530,202.00 17,123,784,762.83
Cash paid for distribution of dividends or
profits or for interest expenses 2,419,976,810.75 2,199,872,165.12
Including: Dividends and profits paid by
subsidiaries to minority interests 17,610,860.00 6,844,279.81
Cash paid for redemption of bonds 8,069,048,081.12 6,585,305,000.00
Cash paid for other financing activities 65 397,052,351.96 2,731,947,406.30
Subtotal of cash outflows from financing activities 34,908,607,445.83 28,640,909,334.25
Net cash flows from financing activities 9,156,708,301.64 10,371,876,421.75
IV. Effect of changes in exchange rate on cash
and cash equivalents (17,511,515.79) 18,255,095.79
V. Net decrease in cash and cash equivalents (1,237,716,428.42) (3,266,135,567.78)
Add: Ca sh and cash equivalents at the
beginning of the period 12,914,086,803.47 18,110,782,535.76
VI. Cash and cash equivalents at the end of
the period 66(3) 11,676,370,375.05 14,844,646,967.98
The accompanying notes form an integral part of these financial statements

68
Unaudited Interim Balance SheetAs at 30 June 2018
RMB
Assets Note XV 30 June 2018 31 December 2017
Current assets
Cash and bank balances 3,919,480,213.24 6,259,648,184.09
Accounts receivable – 124,246.15
Other receivables 1 65,058,476,019.41 56,424,801,069.16
Other current assets 7,335,795.33 7,511,032.83
Total current assets 68,985,292,027.98 62,692,084,532.23
Non-current assets
Other investments in equity instruments 200,000.00 200,000.00
Long-term equity investments 2 41,921,167,167.06 34,720,818,298.28
Investment properties 3 10,349,396,166.46 10,164,795,183.02
Fixed assets 1,197,353,160.57 1,230,783,437.66
Intangible assets 407,761,655.97 414,752,345.13
Deferred income tax assets 187,416,965.05 168,663,517.96
Total non-current assets 54,063,295,115.11 46,700,012,782.05
Total assets 123,048,587,143.09 109,392,097,314.28
The accompanying notes form an integral part of these financial statements

69BBMG CORPORATION
INTERIM REPORT 2018
Unaudited Interim Balance Sheet (continued)As at 30 June 2018
RMB
Liabilities and shareholders’ equity 30 June 2018 31 December 2017
Current liabilities
Short-term loans 22,731,550,000.00 20,841,550,000.00
Accounts payable 25,462,384.48 25,462,384.48
Receipts in advance – 118,748,027.30
Contractual liabilities 132,260,667.78 –
Wages payable 85,430.15 14,420,033.15
Tax payable 67,417,231.79 54,341,168.83
Other payables 7,758,989,519.51 5,627,378,930.45
Short-term financing bonds payable 5,500,000,000.00 2,000,000,000.00
Non-current liabilities due within one year 6,090,456,572.56 7,500,000,000.00
Total current liabilities 42,306,221,806.27 36,181,900,544.21
Non-current liabilities
Long-term loans 16,762,970,000.00 13,724,470,000.00
Bonds payable 17,771,458,901.81 15,956,825,637.00
Long-term wages payable 372,638,251.46 363,073,483.46
Deferred income tax liabilities 2,127,694,804.83 2,081,544,558.97
Other non-current liabilities – 717,233.77
Total non-current liabilities 37,034,761,958.10 32,126,630,913.20
Total liabilities 79,340,983,764.37 68,308,531,457.41
The accompanying notes form an integral part of these financial statements

70
Unaudited Interim Balance Sheet (continued)As at 30 June 2018
RMB
Liabilities and shareholders’ equity 30 June 2018 31 December 2017
Shareholders’ equity
Share capital 10,677,771,134.00 10,677,771,134.00
Other equity instruments 11,968,000,000.00 9,972,000,000.00
Including: perpetual bonds 11,968,000,000.00 9,972,000,000.00
Capital reserve 6,674,854,902.82 6,674,854,902.82
Other comprehensive income 64,422,428.79 82,198,530.79
Surplus reserve 1,368,019,010.35 1,368,019,010.35
Retained earnings 12,954,535,902.76 12,308,722,278.91
Total shareholders’ equity 43,707,603,378.72 41,083,565,856.87
Total liabilities and shareholders’ equity 123,048,587,143.09 109,392,097,314.28
The financial statements have been signed by:
Legal representative: Chief accountant: Head of the accounting department:
Jiang Deyi Chen Guogao Hu Juan
The accompanying notes form an integral part of these financial statements

71BBMG CORPORATION
INTERIM REPORT 2018
Unaudited Interim Income StatementFor the six months ended 30 June 2018
RMB
Note XV
For the six
months ended
30 June 2018
For the six
months ended
30 June 2017
Operating revenue 4 511,791,424.76 468,492,202.30Less: Operating costs 4 36,491,918.32 43,359,840.95
Tax and surcharges 68,772,765.10 59,653,930.18Selling expenses 23,163,791.40 24,557,920.90Administrative expenses 63,743,523.95 54,931,703.34Finance costs 419,951,339.88 477,856,928.21Including: Interest expense 1,561,969,963.55 1,168,640,985.65
Interest income 1,187,444,611.51 743,502,630.44Reversal of the provision for credit impairment (5,611,315.87) –
Add: Other gains 717,233.77 –Gains from changes in fair value 184,600,983.44 135,588,436.76Investment gains 5 1,348,775,859.95 180,178,400.59Including: Share of investment gains/(losses)
of associates and joint ventures 24,124,522.78 (18,671,179.76)
Operating profit 1,439,373,479.14 123,898,716.07Add: Non-operating revenue 18,309,344.52 4,397,055.17Less: Non-operating expenses 1,701.07 163,529.71
Total profit 1,457,681,122.59 128,132,241.53Less: Income tax expenses 29,580,247.93 (13,452,054.15)
Net profit 1,428,100,874.66 141,584,295.68
Including: Net profit from continuing operations 1,428,100,874.66 141,584,295.68Net profit from discontinued operations – –
Net other comprehensive income after tax
Other comprehensive income not allowed to be reclassified into profit or loss in subsequent accounting periodsChanges arising from re-measurement of net liabilities of defined
benefit plans (17,776,102.00) 28,590,242.00
Total comprehensive income 1,410,324,772.66 170,174,537.68
The accompanying notes form an integral part of these financial statements

72
Unaudited Interim Statement of Changes in EquityFor the six months ended 30 June 2018
RMB
Share capital
Other equity
instruments
Including:
Perpetual bonds Capital reserve
Other
comprehensive
income Surplus reserve Retained earnings Total equity
I. Balance as at the end of the
previous period 10,677,771,134.00 9,972,000,000.00 6,674,854,902.82 82,198,530.79 1,368,019,010.35 12,308,722,278.91 41,083,565,856.87
Plus: Changes in accounting policies – – – – – (6,550,347.49) (6,550,347.49)
II. Balance as at the beginning of the period 10,677,771,134.00 9,972,000,000.00 6,674,854,902.82 82,198,530.79 1,368,019,010.35 12,302,171,931.42 41,077,015,509.38
III. Movements during the period
(1) Total comprehensive income – 1,996,000,000.00 – (17,776,102.00) – 1,428,100,874.66 3,406,324,772.66
(2) Profit distribution
1. Dividend to Shareholders – – – – – (512,533,014.43) (512,533,014.43)
2. Interest on perpetual bonds – – – – – (263,203,888.89) (263,203,888.89)
IV. Balance at the end of the period 10,677,771,134.00 11,968,000,000.00 6,674,854,902.82 64,422,428.79 1,368,019,010.35 12,954,535,902.76 43,707,603,378.72
The accompanying notes form an integral part of these financial statements

73BBMG CORPORATION
INTERIM REPORT 2018
Unaudited Interim Statement of Changes in Equity (continued)For the six months ended 30 June 2017
RMB
The accompanying notes form an integral part of these financial statements
Share capital
Other equity
instruments
Including:
Perpetual bonds Capital reserve
Other
comprehensive
income Surplus reserve Retained earnings Total equity
I. Balance as at the beginning of the
period 10,677,771,134.00 4,982,000,000.00 6,674,854,902.82 49,398,221.79 1,276,866,688.51 12,334,368,299.00 35,995,259,246.12
II. Movements during the period
(1) Total comprehensive income – – – 28,590,242.00 – 141,584,295.68 170,174,537.68
(2) Profit distribution
1. Dividend to shareholders – – – – – (491,177,472.16) (491,177,472.16)
2. Interest on perpetual bonds – – – – – (186,959,166.66) (186,959,166.66)
III. Balance at the end of the period 10,677,771,134.00 4,982,000,000.00 6,674,854,902.82 77,988,463.79 1,276,866,688.51 11,797,815,955.86 35,487,297,144.98

74
Unaudited Interim Statement of Cash FlowsFor the six months ended 30 June 2018
RMB
Note XV
For the six
months ended
30 June 2018
For the six
months ended
30 June 2017
I. Cash flows from operating activities
Cash received from sale of goods or rendering of services 576,576,103.08 534,548,179.19
Cash received from other operating activities 6 26,137,769,938.07 23,046,775,269.09
Subtotal of cash inflows from operating activities 26,714,346,041.15 23,581,323,448.28
Cash paid for goods and services 51,944,068.59 40,612,490.71
Cash paid to and on behalf of employees 30,344,062.95 33,026,490.68
Cash paid for all types of taxes 66,242,928.46 76,811,610.70
Cash paid for other operating activities 6 31,768,587,567.13 33,357,893,207.72
Subtotal of cash outflows from operating activities 31,917,118,627.13 33,508,343,799.81
Net cash flows used in operating activities 7(1) (5,202,772,585.98) (9,927,020,351.53)
II. Cash flows from investing activities
Net cash received from disposal of fixed assets, intangible
assets and other long-term assets – 9,635.00
Subtotal of cash inflows from investing activities – 9,635.00
Cash paid for acquisition of fixed assets, intangible assets
and other long-term assets 1,935,700.00 720,753.00
Net cash paid for acquisition of subsidiaries and other
operating units 6,357,858,292.61 211,406,183.00
Subtotal of cash outflows from investing activities 6,359,793,992.61 212,126,936.00
Net cash flows used in investing activities (6,359,793,992.61) (212,117,301.00)
The accompanying notes form an integral part of these financial statements

75BBMG CORPORATION
INTERIM REPORT 2018
Unaudited Interim Statement of Cash Flows (continued)For the six months ended 30 June 2018
RMB
The accompanying notes form an integral part of these financial statements
Note XV
For the six
months ended
30 June 2018
For the six
months ended
30 June 2017
III. Cash flows from financing activities
Cash received from borrowings 15,541,000,000.00 12,851,000,000.00
Cash received from issuance of bonds 12,500,000,000.00 10,000,000,000.00
Subtotal of cash inflows from financing activities 28,041,000,000.00 22,851,000,000.00
Cash paid for repayment of borrowings 10,712,500,000.00 5,362,000,000.00
Cash paid for distribution of dividends or profits or for
interest expenses 1,571,273,147.04 1,340,674,860.90
Cash paid for redemption of bonds 6,500,000,000.00 6,000,000,000.00
Cash paid in relation to other financing activities 35,000,000.00 15,600,000.00
Subtotal of cash outflows from financing activities 18,818,773,147.04 12,718,274,860.90
Net cash flows from financing activities 9,222,226,852.96 10,132,725,139.10
IV. Net decrease in cash and cash equivalents (2,340,339,725.63) (6,412,513.43)
Add: Ca sh and cash equivalents at the
beginning of the period 6,209,927,405.16 6,904,569,211.47
V. Cash and cash equivalents at the end of the period 7(2) 3,869,587,679.53 6,898,156,698.04

76
Notes to Unaudited Interim Financial StatementsFor the six months ended 30 June 2018
RMB
I. BASIC INFORMATION OF THE GROUP
BBMG Corporation (hereinafter referred to as the “Company” or “BBMG Group”) is a joint stock company
with limited liability incorporated in Beijing, the People’s Republic of China and was established on 22
December 2005. The Renminbi-denominated ordinary shares (A shares) and H shares of the Company are
listed on the Shanghai Stock Exchange (“Shanghai Stock Exchange”) and The Stock Exchange of Hong
Kong Limited (“Stock Exchange of Hong Kong”), respectively. The Company’s headquarters is located at
No. 36, North Third Ring East Road, Dongcheng District, Beijing.
The principal business activities of the Company and its subsidiaries (collectively, the “Group”) includes:
manufacture and sale of cement and building materials, construction and decoration, trade and logistics,
tourism services, real estate development, property investment and management.
The Company’s parent and ultimate holding company is BBMG Assets Management Co., Ltd. (北京金隅資產經營管理有限責任公司) (formerly named as “BBMG Group Company Limited”, hereinafter referred
to as “BBMG Assets Company”), a company established in the People’s Republic of China, originally.
On 11 November 2016, State-owned Assets Supervision and Administration Commission of the People’s
Government of Beijing Municipality agreed the gratuitous transfer of 4,797,357,572 A shares of the
Company held by BBMG Assets Company to Beijing SCOM Center (hereinafter referred to as “BSCOMC”).
On 29 December 2016, the transfer registration formalities for the gratuitous transfer of the A shares of
the Company were completed, afterwhich, BSCOMC directly held 4,797,357,572 state-owned shares of
the Company, representing 44.93% of the total share capital of the Company, and became the controlling
shareholder of the Company.
These financial statements were approved by a resolution of the board of directors of the Company on 29
August 2018. In accordance with the Articles of Association of the Company, these financial statements will
be proposed to the general meeting for review.
The consolidation scope of consolidated financial statements was determined on the basis of control. See
note VI for changes of the current period.
II. BASIS OF PREPARATION OF THE FINANCIAL STATEMENTS
The interim financial statements are prepared in accordance with the requirements of Accounting Standards
for Business Enterprises No. 32 – Interim Financial Reporting issued by the Ministry of Finance, and hence
do not include all the information and disclosures of the audited financial statements for 2017. Accordingly,
the interim financial statements should be read in conjunction with the Group’s audited financial statements
for 2017 which were prepared in accordance with Accounting Standards for Business Enterprises.
The financial statements are presented on a going concern basis.
Except for certain financial instruments and investment properties, the financial statements have been
prepared under the historical cost convention. The disposal group held for sale is measured at the lower
of the carrying value and the fair value less cost of sale, net. If the assets are impaired, corresponding
provisions for impairment shall be provided according to relevant provisions.

77BBMG CORPORATION
INTERIM REPORT 2018
Notes to Unaudited Interim Financial StatementsFor the six months ended 30 June 2018
RMB
III. MAJOR ACCOUNTING POLICIES AND ACCOUNTING ESTIMATES FOR BUSINESS ENTERPRISES
The specific accounting policies and accounting estimation has been prepared by the Group based on actual
production and operation characteristics, as mainly embodied in the provision for bad debt of accounts
receivable, inventory valuation method, the useful lives and residual values of fixed assets, classification
between investment properties and inventories, classification between investment properties and fixed
assets, the recognition and allocation of development costs on properties under construction, etc.
1. Statement of compliance with Accounting Standards for Business Enterprises
The interim financial statements are in compliance with the requirements of the Accounting
Standards for Business Enterprises No. 32 – Interim Financial Reporting and present truly and fully
the financial position of the Company and the Group as at 30 June 2018 and their operating results
and cash flows for the six months ended 30 June 2018. Except for the implementation of newly
issued or revised accounting standards, the accounting policies adopted in the preparation of the
interim financial statements are the same as those adopted in the financial statements of last year
which were prepared in accordance with the Accounting Standards for Business Enterprises.
2. Accounting period
The accounting year for the Group is from 1 January to 31 December of each calendar year. The
accounting period for this report is from 1 January to 30 June 2018.
3. Functional currency
The Company’s reporting and presentation currency is Renminbi (“RMB”). Unless otherwise stated,
the unit of the currency is RMB yuan.
The subsidiaries, joint ventures and associates of the Group may determine their own functional
currencies based on the specific economic environments in their place of business. In the preparation
of financial statements, their functional currencies shall be translated into RMB.
4. Business combinations
A business combination is a transaction or event that brings together two or more separate entities
into one reporting entity. Business combinations are classified into business combinations under
common control and business combinations not under common control.
Business combinations under common control
A business combination under common control is a business combination in which all of the
combining entities are ultimately controlled by the same party or parties both before and after the
combination, and that control is not transitory. For a business combination under common control,
the party that, on the combination date, obtains control of another entity participating in the
combination is the acquiring party, while that other entity participating in the combination is a party
being acquired. The combination date is the date on which the acquiring party effectively obtains
control of the party being acquired.

78
Notes to Unaudited Interim Financial StatementsFor the six months ended 30 June 2018
RMB
III. MAJOR ACCOUNTING POLICIES AND ACCOUNTING ESTIMATES FOR BUSINESS ENTERPRISES (continued)
4. Business combinations (continued)
Business combinations under common control (continued)
Assets and liabilities (including the goodwill arising from acquisition of the party being acquired by
the ultimate controlling party) that are obtained by the acquirer in a business combination under
common control shall be subject to relevant accounting treatment on the basis of their carrying
amounts in the financial statements of the ultimate controlling party at the combination date.
The difference between the carrying amount of the net assets obtained and the carrying amount
of the consideration paid for the combination (or the aggregate face value of shares issued as
consideration) shall be adjusted against share premium under capital reserve and the balance of
capital reserve transferred in under the old accounting system. If the capital reserve is not sufficient
to absorb the difference, any excess shall be adjusted against retained earnings.
Business combinations not under common control
A business combination not under common control is a business combination in which the
combining entities are not ultimately controlled by the same party or parties both before and after
the combination. For a business combination not under common control, the party that, on the
acquisition date, obtains control of another entity participating in the combination is the acquirer,
while that other entity participating in the combination is the acquiree. Acquisition date is the date
on which the acquirer effectively obtains control of the acquiree.
The acquiree’s identifiable assets, liabilities and contingent liabilities acquired in a business
combination not under common control are measured at their fair values on the acquisition date.
Where the aggregate of the fair value of the consideration paid (or the fair value of the equity
securities issued) and any fair value of the acquirer’s previously held equity interest exceeds the
acquirer’s interest in the fair value of the acquiree’s identifiable net assets acquired, the difference
shall be recognised as goodwill. Goodwill is subsequently measured at cost less any accumulated
impairment losses. Where the aggregate of the fair value of the consideration paid (or the fair value
of the equity securities issued) and any fair value of the acquirer’s previously held equity interest is
less than the acquirer’s interest in the fair value of the acquiree’s identifiable net assets acquired,
reassessment of the measurement of these items is conducted first, if the sum of the fair value of
this consideration and other items mentioned above is still lower than the acquirer’s interest in the
fair value of the acquiree’s identifiable net assets acquired, the difference is recognised in profit or
loss for the current period.

79BBMG CORPORATION
INTERIM REPORT 2018
Notes to Unaudited Interim Financial StatementsFor the six months ended 30 June 2018
RMB
III. MAJOR ACCOUNTING POLICIES AND ACCOUNTING ESTIMATES FOR BUSINESS ENTERPRISES (continued)
4. Business combinations (continued)
Business combinations not under common control (continued)
For a business combination not under common control achieved in stages, the long-term equity
investments in the acquiree before the acquisition date will be remeasured at fair value on the
acquisition date. The difference between the fair value and the carrying amount is recognised as
profit or loss for the current period; long-term equity investments in the acquiree held-prior to the
date of acquisition involving other comprehensive income under the equity method will be subject
to accounting treatment on the same basis as direct disposal of underlying assets or liabilities by the
investee, and other changes in shareholders’ equity will be reclassified as profit or loss for the period
in which the acquisition date falls, except for net profit or loss, other comprehensive income and
profit distribution. As for other equity instrument investment in the acquiree held prior to the date
of the acquisition, changes in fair values before the date of acquisition will be accumulated in other
comprehensive income and transferred to the retained profit or loss subsequently.
5. Consolidated financial statements
The consolidation scope of consolidated financial statements is determined on the basis of control,
including the financial statements of the Company and all of its subsidiaries for the accounting
period during the six months ended 30 June 2018. A subsidiary is an entity (including an enterprise,
a separable part of an investee, a structural entity controlled by the Company, etc.) that is controlled
by the Company.
In preparing consolidated financial statements, subsidiaries adopt the same accounting period and
accounting policies as those of the Company. All assets, liabilities, interests, income, fees and cash
flows resulting from intra-group transactions are eliminated on consolidation in full.
Where the amount of losses for the current period attributed to the minority shareholders of a
subsidiary exceeds the minority shareholders’ portion of the opening balance of shareholders’ equity
of the subsidiary, the excess amount is allocated against minority interests.
For subsidiaries acquired through a business combination not under common control, the operating
results and cash flows of the acquiree are included in the consolidated financial statements from the
date on which the Group obtains control and will continue to be consolidated until the date that
such control ceases. In preparing consolidated financial statements, adjustments shall be made to
the subsidiaries’ financial statements based on the fair values of the identifiable assets, liabilities and
contingent liabilities at the acquisition date.
For subsidiaries acquired through a business combination under common control, the operating
results and cash flows of the acquiree are included in the consolidated financial statements from the
beginning of the combination period. In preparing consolidated financial statements, adjustments
shall be made to related items of prior year’s financial statements, as if the reporting entities after
the combination had existed from the date when the combining entities first came under control of
the ultimate controlling party.

80
Notes to Unaudited Interim Financial StatementsFor the six months ended 30 June 2018
RMB
III. MAJOR ACCOUNTING POLICIES AND ACCOUNTING ESTIMATES FOR BUSINESS ENTERPRISES (continued)
5. Consolidated financial statements (continued)
The Group reassesses whether or not it controls an investee if facts or circumstances indicate that
there are changes to one or more elements of control.
A change in minority interests, without a loss of control, is accounted for as an equity transaction.
6. Classification of joint arrangements and joint operation
Joint arrangements are divided into joint operation and joint venture. Joint operation refers to a
joint arrangement whereby the parties that have joint control of the arrangement have rights to the
assets and obligations of the liabilities relating to the arrangement. Joint venture refers to a joint
arrangement whereby the parties that have joint control of the arrangement only have rights to the
net assets of the arrangement.
7. Cash and cash equivalents
Cash comprises the Group’s cash on hand and deposits that can be readily withdrawn on demand
for payment purposes. Cash equivalents are short-term, highly liquid investments held by the Group
that are readily convertible to known amounts of cash and which are subject to an insignificant risk
of changes in value.
8. Foreign currency transactions and translation of financial statements prepared in foreign currencies
The Group translates the amounts of foreign currency transactions occurred into its functional
currency.
Foreign currency transactions are recorded, on initial recognition, in their functional currencies by
translating the foreign currency amounts at the spot exchange rates at the transaction dates. At the
balance sheet date, foreign currency monetary items are translated using the spot exchange rates at
the balance sheet date. All the resulting exchange differences are taken to profit or loss, except for
those relating to foreign currency borrowings specifically for acquisition and construction of assets
qualified for capitalisation, which are capitalised in accordance with the principle of capitalisation
of borrowing costs. Non-monetary foreign currency items measured at historical cost shall still
be translated at the spot exchange rates prevailing on the transaction dates, while the amounts
denominated in the functional currencies do not change. Non-monetary foreign currency items
measured at fair value are translated at the spot exchange rates prevailing on the date on which the
fair values are determined. The resulting exchange differences are recognised in profit or loss or as
other comprehensive income for the current period, depending on the nature of the non-monetary
item.

81BBMG CORPORATION
INTERIM REPORT 2018
Notes to Unaudited Interim Financial StatementsFor the six months ended 30 June 2018
RMB
III. MAJOR ACCOUNTING POLICIES AND ACCOUNTING ESTIMATES FOR BUSINESS ENTERPRISES (continued)
8. Foreign currency transactions and translation of financial statements prepared in foreign currencies (continued)
For foreign operations, the Group translates their functional currency amounts into Renminbi in
preparing the financial statements as follows: asset and liability items in the balance sheet are
translated using the spot exchange rates at the balance sheet date, and equity items other than
“retained earnings” are translated using the spot exchange rates on the transaction dates; revenue
and expense items in the income statement are translated using the weighted average exchange
rate for the period during which the transactions occur. The resulting exchange differences are
recognised as other comprehensive income. On disposal of a foreign operation, the component of
other comprehensive income relating to that particular foreign operation is transferred to profit
or loss in the period during which the disposal occurs. If the disposal only involves a portion of a
particular foreign operation, the calculations will be made on a pro-rata basis.
Foreign currency cash flows and the cash flows of foreign subsidiaries are translated using the
average exchange rate for the period during which the cash flows occur. The effect of exchange
rate changes on cash is separately presented as an adjustment item in the statement of cash flows.
9. Financial instruments
A financial instrument is any contract that gives rise to a financial asset of one entity and a financial
liability or equity instrument of another entity.
Recognition and derecognition of financial instruments
The Group recognises a financial asset or a financial liability when it becomes a party to the
contractual provisions of a financial instrument.
The Group derecognises and writes off a financial asset (or part of a financial asset, or part of a
group of similar financial assets) from its account and balance sheet when the following conditions
are met:
(1) the rights to receive cash flows from the asset have expired;
(2) the Group has transferred its rights to receive cash flows from the asset, or has assumed
an obligation to pay the received cash flows in full without material delay to a third party
under a “pass-through” arrangement; and either (a) the Group has transferred substantially
all the risks and rewards of the asset, or (b) the Group has neither transferred nor retained
substantially all the risks and rewards of the asset, but has transferred control of the asset.

82
Notes to Unaudited Interim Financial StatementsFor the six months ended 30 June 2018
RMB
III. MAJOR ACCOUNTING POLICIES AND ACCOUNTING ESTIMATES FOR BUSINESS ENTERPRISES (continued)
9. Financial instruments (continued)
Recognition and derecognition of financial instruments (continued)
If the underlying obligation of a financial liability has been discharged or cancelled or has expired,
the financial liability is derecognised. If an existing financial liability is replaced by the same
creditor with a new financial liability that has substantially different terms, or if the terms of an
existing financial liability are substantially revised, such replacement or revision is accounted for as
the derecognition of the original liability and the recognition of a new liability, and the resulting
difference is recognised in profit or loss for the current period.
Regular way purchases or sales of financial assets are recognised and derecognised on the trade
date. Regular way purchases or sales of financial assets mean that the financial assets are received
or delivered under the terms of a contract within a period established by regulations or conventions
in the marketplace. Trade date is the date that the Group commits to purchase or sell the asset.
Classification and measurement of financial assets
According to the Group’s corporate business model for managing financial assets and the
contractual cash flow characteristics of the financial assets, the Group’s financial assets are, on initial
recognition, classified into the following categories: financial assets at fair value through profit or
loss, financial assets at amortised cost, financial assets at fair value through other comprehensive
income and derivatives designated as hedging instruments in an effective hedge. A financial asset is
recognised initially at fair value.
In the case of financial assets at fair value through profit or loss, relevant transaction costs are
directly charged to profit and loss for the current period; transaction costs relating to financial assets
of other categories are included in the amounts initially recognised.
The subsequent measurement of financial assets depends on their classification as follows:
Debt instrument investment at amortised cost
Financial assets are classified as financial assets at amortised cost if the financial assets meet the
following conditions: the objective of the Group’s business model for managing such financial assets
is to collect contractual cash flows; the contractual terms of the financial assets stipulate that cash
flows generated on a specific date are solely payment of the principal and the interest based on the
outstanding principal amount. Such financial assets are subsequently measured at amortised cost by
using the effective interest rate method. The gains or losses arising from amortisation or impairment
are recognised in profit or loss for the current period.

83BBMG CORPORATION
INTERIM REPORT 2018
Notes to Unaudited Interim Financial StatementsFor the six months ended 30 June 2018
RMB
III. MAJOR ACCOUNTING POLICIES AND ACCOUNTING ESTIMATES FOR BUSINESS ENTERPRISES (continued)
9. Financial instruments (continued)
Classification and measurement of financial assets (continued)
Debt instrument investment at fair value through other comprehensive income
Financial assets are classified as financial assets at fair value through other comprehensive income
if the financial assets meet the following conditions: the objective of the Group’s business model
for managing such financial assets is both to collect contractual cash flows and to dispose of the
financial assets; the contractual terms of the financial assets stipulate that cash flows generated
on a specific date are solely payment of the principal and the interest based on the outstanding
principal amount. Such financial assets are subsequently measured at fair value. The discount/
premium is amortised using the effective interest rate method and recognised as interest income or
expense. Changes in the fair value of such financial asset are recognised as other comprehensive
income, except that impairment losses and exchange gains or losses from monetary financial assets
denominated in foreign currencies are recognised as profit or loss for the current period, until such
financial asset is derecognized, at which time its accumulated gain or loss is transferred to profit or
loss for the current period. Interest income relating to such financial asset is recognised in profit or
loss for the current period.
Equity instrument investment at fair value through other comprehensive income
The Group irrevocably elects to designate certain equity instrument investments not held for trading
as financial assets at fair value through other comprehensive income, such that only relevant
dividend income is recognised as profit or loss for the current period and changes in fair value are
recognised as other comprehensive income, until such financial asset is derecognized, at which time
its accumulated gain or loss is transferred to retained earnings.
Financial assets at fair value through profit or loss
Apart from the financial assets at amortised cost and financial assets at fair value through other
comprehensive income mentioned above, other financial assets are classified as financial assets at
fair value through profit or loss. Such financial assets are subsequently measured at fair value. All
changes in fair value are recognised in profit or loss for the current period.
Classification and measurement of financial liabilities
The Group’s financial liabilities are, on initial recognition, classified into financial liabilities at
fair value through profit or loss, other financial liabilities or derivatives designated as hedging
instruments in an effective hedge. For financial liabilities at fair value through profit or loss, relevant
transaction costs are directly charged to profit or loss for the current period, and transaction costs
relating to other financial liabilities are included in the initial amounts recognised.

84
Notes to Unaudited Interim Financial StatementsFor the six months ended 30 June 2018
RMB
III. MAJOR ACCOUNTING POLICIES AND ACCOUNTING ESTIMATES FOR BUSINESS ENTERPRISES (continued)
9. Financial instruments (continued)
Classification and measurement of financial liabilities (continued)
The subsequent measurement of financial liabilities depends on its classification as follows:
Financial liabilities at fair value through profit or loss
Financial liabilities at fair value through profit or loss include financial liabilities held for trading
(including derivative which are financial liabilities) and those designated upon initial recognition at
fair value through profit or loss.
It is a financial asset held for trading or a financial liability held for trading if it meets one of the
following conditions: to acquire the relevant financial asset or assume the relevant financial liability
is primarily for the purpose of selling or buying-back in the near term; it is a part of a portfolio
of identifiable financial instruments that are collectively managed, and there is objective evidence
indicating that the entity recently adopts the model of short-term profit-taking; it is a derivative,
except for a derivative that is designated as an effective hedging instrument, or one that is aligned
with a derivative under financial guarantee contract. Financial liabilities held for trading (including
derivative of financial liabilities) are subsequently measured at fair value and, save for those are
related to hedging accounting, all movements of fair value are included in profit or loss for the
current period.
Other financial liabilities
Such kinds of financial liabilities are subsequently measured at amortised cost by using the effective
interest rate method.
Offsetting of financial instruments
Financial assets and financial liabilities are offset and the net amount is presented in the balance
sheet to the extent that there is a currently enforceable legal right to offset the recognised amounts
and that there is an intention to settle on a net basis, or to realise the assets and settle the liabilities
simultaneously.
Impairment of financial assets
On the basis of expected credit losses, the Group makes impairment provisions and recognises loss
provisions for the financial assets carried at amortised cost, investments on debt instrument at fair
value through other comprehensive income, lease receivables, contractual assets, financial guarantee
contracts and others.

85BBMG CORPORATION
INTERIM REPORT 2018
Notes to Unaudited Interim Financial StatementsFor the six months ended 30 June 2018
RMB
III. MAJOR ACCOUNTING POLICIES AND ACCOUNTING ESTIMATES FOR BUSINESS ENTERPRISES (continued)
9. Financial instruments (continued)
Impairment of financial assets (continued)
Credit loss represents the difference between all contractual cash flows due to the Group under
contracts discounted at the original effective interest rate and all the cash flows that the Group
expects to receive,(i.e. the present value of all cash shortfalls. Among them, the financial assets
acquired or originated by the Group that have impaired with credit shall be discounted at an
effective interest rate adjusted in accordance with credit status of the financial assets.
For receivables that do not contain significant financing components and contractual assets, the
Group uses a simplified measurement method to measure loss provision based on the amount of
expected credit losses throughout the lifetime.
For lease receivables, receivables with significant financing components and contractual assets, the
Group uses a simplified measurement method to measure loss provisions based on the amount of
expected credit losses throughout the lifetime.
In addition to the abovementioned financial assets and financial guarantee contracts for which the
simplified measurement method are used, the Group assesses whether its credit risk has increased
significantly since the initial recognition on each balance sheet date. If the credit risk has increased
significantly since the initial recognition, the Group measures the loss provision based on the
amount of expected credit loss over its lifetime. In the event that the credit risk has not increased
significantly since the initial recognition, the Group measures the loss provision based on the amount
of expected credit loss over the next 12 months.
Except for certain financial assets on which expected credit losses are assessed on an individual
basis, the Group also assesses the expected credit losses of financial assets at amortised cost based
on the aging profile.
During assessment on expected credit losses, the Group considers all reasonable and evidenced
information, including forward-looking information.
When the Group no longer reasonably expects to be able to recover, in full or in part, the
contractual cash flows of financial assets, the Group directly writes down the carrying amount of the
financial assets.

86
Notes to Unaudited Interim Financial StatementsFor the six months ended 30 June 2018
RMB
III. MAJOR ACCOUNTING POLICIES AND ACCOUNTING ESTIMATES FOR BUSINESS ENTERPRISES (continued)
9. Financial instruments (continued)
Transfers of financial assets
If the Group transfers substantially all the risks and rewards of ownership of the financial asset, the
Group derecognises the financial asset; if the Group retains substantially all the risks and rewards of
ownership of the financial asset, the Group does not derecognise the financial asset.
If the Group neither transfers nor retains substantially all the risks and rewards of ownership of the
financial asset, it accounts for the transactions as follows: (i) if the Group has not retained control,
it derecognises the financial asset and recognises any resulting assets or liabilities; (ii) if the Group
has retained control, it continues to recognise the financial asset to the extent of its continuing
involvement in the transferred financial asset and recognises an associated liability.
Continuing involvement that takes the form of a financial guarantee over the transferred financial
asset is measured at the lower of the carrying amount of the financial asset and the amount
of financial guarantee. The amount of financial guarantee refers to the maximum amount of
consideration that the Group could be required to repay.

87BBMG CORPORATION
INTERIM REPORT 2018
Notes to Unaudited Interim Financial StatementsFor the six months ended 30 June 2018
RMB
III. MAJOR ACCOUNTING POLICIES AND ACCOUNTING ESTIMATES FOR BUSINESS ENTERPRISES (continued)
10. Inventories
Inventories include raw materials, work in progress, finished goods, goods in stock, turnover
materials, costs to fulfill a contract properties under development and completed properties held for
sale.
Inventories are initially carried at cost. Except for properties under development and completed
properties held for sale, cost of inventories comprises all costs of purchase, costs of conversion
and other costs. The actual cost of inventories transferred out is determined by using the weighted
average method. Turnover materials include low value consumables and packing materials. Low
value consumables and packing materials are amortised by using the immediate write-off method.
Costs of properties under development and completed properties held for sale consist of land
acquisition cost, construction cost, interests capitalised and other direct and indirect development
expenses. Cost of properties under development is transferred to cost of completed properties held
for sale upon completion of development.
Within the construction cost, public ancillary facilities represent government-approved public ancillary
projects, i.e. roads. The relevant costs are recognised under the properties under development,
and are accounted for and allotted by cost object and cost item. Land use rights for development
purpose are classified as part of properties under development.
The Group adopts a perpetual inventory system.
At the balance sheet date, inventories are stated at the lower of cost and net realisable value. If
the cost of inventories is higher than the net realisable value, a provision for decline in value of
inventories is recognised in profit or loss for the current period. If factors that previously resulted in
the provision for decline in value of inventories no longer exist and result in the net realisable value
being higher than their carrying amount, the amount of the write-down is reversed to the extent of
the amount of the previous provision for the inventories and is recognised in profit or loss for the
current period.
Net realisable value is the estimated selling price in the ordinary course of business less the estimated
costs to completion and the estimated expenses and the related taxes necessary to make the sale.
The provision for decline in value is made on an individual basis, provided that for inventories with
large quantity and lower unit cost, the provision for decline in value is made on a category basis. For
inventories related to a series of products manufactured and sold in the same area, and of which
the final use or purpose is identical or similar, and if it is difficult to measure them by separating
them from other items, the provision for decline in value of inventories are made on a combination
basis.

88
Notes to Unaudited Interim Financial StatementsFor the six months ended 30 June 2018
RMB
III. MAJOR ACCOUNTING POLICIES AND ACCOUNTING ESTIMATES FOR BUSINESS ENTERPRISES (continued)
11. Non-current assets or disposal groups held for sale
A non-current asset or disposal group is classified as held for sale when its carrying amount will
be recovered principally through a sale transaction rather than through continuous use. Non-
current assets or disposal groups are classified as held for sale only when the following conditions
are satisfied: according to the practice of disposing this type of assets or disposal groups in similar
transactions, the non-current asset or disposal group is available for immediate sale in its present
condition; the sale will likely occur as the enterprise has made a resolution in respect of a disposal
plan and obtained a firm purchase commitment, and the sale is expected to be completed within
one year (and approval has been obtained by the enterprise where approval of the sale is required
from relevant competent authorities or regulatory bodies in accordance with relevant regulations). If
sale of any investment in a subsidiary will result in the loss of control over the respective subsidiary,
whether or not any part of the equity investments is retained after the sale, the investment in
subsidiary is classified as held for sale in the respective financial statements, and all assets and
liabilities of the subsidiary shall be classified as held for sale in the consolidated financial statements.
For a non-current asset or disposal group classified as held for sale (other than financial assets,
deferred income tax assets, investment properties measured at fair value and assets formed by
employee benefits), its carrying amount is written down to its fair value less costs to sell if its
carrying amount is higher than its fair value less costs to sell. The reduced amount is recognised as
asset impairment loss and charged to current profit or loss, with provision made for the impairment
of the held-for-sale assets. No depreciation or amortisation is provided for a non-current asset in the
non-current assets or disposal groups held for sale.

89BBMG CORPORATION
INTERIM REPORT 2018
Notes to Unaudited Interim Financial StatementsFor the six months ended 30 June 2018
RMB
III. MAJOR ACCOUNTING POLICIES AND ACCOUNTING ESTIMATES FOR BUSINESS ENTERPRISES (continued)
12. Long-term equity investments
Long-term equity investments include equity investments in subsidiaries, joint ventures and
associates.
A long-term equity investment is initially measured at its initial investment cost on acquisition.
For a business combination involving entities under common control, the initial investment cost
of the long-term equity investment is the carrying amount of the absorbing party’s share of the
owner’s equity of the party being absorbed on the consolidated financial statements of the ultimate
controller. The difference between the initial investment cost and the carrying amount of the
consideration paid for the combination shall be adjusted against capital reserve (where the capital
reserve is not sufficient to absorb the difference, any excess shall be adjusted against retained
earnings). Other comprehensive income prior to the date of the merger is accounted for on the
same basis as that used to account for direct disposal of such assets or liabilities by the investee, and
shareholders’ equity recognised as a result of changes in other shareholders’ equity of the investee
other than net profit or loss, other comprehensive income and profit distribution is transferred to
profit or loss for the current period upon such disposal, of which the investment which remains
long-term equity investment upon the disposal is transferred in proportion, and the investment which
is converted into financial instruments upon the disposal is transferred in full. The initial investment
cost of the long-term equity investment is the cost of acquisition for a business combination not
under common control (for a business combination not under common control achieved in stages,
the initial investment cost is measured at the carrying amount of the equity investments in the
acquiree before the acquisition date plus the additional investment cost incurred on the acquisition
date). The cost of combination includes the assets transferred and the liabilities incurred or assumed
by the acquirer, and the fair value of equity securities issued. Other comprehensive income held
prior to the date of the acquisition and recognised using the equity method is accounted for
on the same basis as that used to account for direct disposal of such assets or liabilities by the
investee, and shareholders’ equity recognised as a result of changes in other shareholders’ equity
of the investee other than net profit or loss, other comprehensive income and profit distribution
is transferred to profit or loss for the current period upon such disposal, of which the investment
which remains long-term equity investment upon the disposal is transferred in proportion, and the
investment which is converted into financial instruments upon the disposal is transferred in full. Any
change in accumulated fair value of the equity investment held prior to the date of the acquisition
included in other comprehensive income as other equity instrument investments are transferred
to retained earnings for the current period in full when the cost method is adopted. For a long-
term equity investment acquired other than through a business combination, the initial investment
cost is determined as follows: (i) if acquired by paying cash, the initial investment cost is the actual
purchase price paid and those costs, taxes and other necessary expenditures directly attributable to
the acquisition of the long-term equity investment; (ii) if acquired by the issue of equity securities,
the initial investment cost is the fair value of the securities issued; (iii) if acquired by exchange
of non-monetary assets, the initial investment cost is determined in accordance with Accounting
Standards for Business Enterprises No. 7 – Exchange of Non-Monetary Assets.

90
Notes to Unaudited Interim Financial StatementsFor the six months ended 30 June 2018
RMB
III. MAJOR ACCOUNTING POLICIES AND ACCOUNTING ESTIMATES FOR BUSINESS ENTERPRISES (continued)
12. Long-term equity investments (continued)
For a long-term equity investment where the Company can exercise control over the investee, the
long-term equity investment is accounted for using the cost method in the Company’s separate
financial statements. Control refers to having the power over the investee, the entitlement to
variable returns through the participation in the relevant activities of the investee, and the ability to
affect the amount of returns by using its power over the investee.
Under the cost method, the long-term equity investment is measured at its initial investment cost.
If investment is increased or withdrawn, the cost of long-term equity investment shall be adjusted.
Cash dividends or profit distributions declared by the investee are recognised as investment income
for the current period.
The equity method is adopted when the Group holds joint control, or exercises significant influence
on the investee. Joint control is the relevant agreed sharing of control over an arrangement, and
relevant activities of such arrangement shall be decided upon the unanimous consent of the parties
sharing control. Significant influence is the power to participate in decision making of the financial
and operating policies of the investee, but without the power to control or jointly control with other
parties the formulation of those policies.
Under the equity method, where the initial investment cost of a long-term equity investment
exceeds the investing enterprise’s interest in the fair values of the investee’s identifiable net assets at
the acquisition date, long-term equity investment is measured at the initial investment cost. Where
the initial investment cost is less than the investing enterprise’s interest in the fair values of the
investee’s identifiable net assets at the acquisition date, the difference is charged to profit or loss for
the current period, and the cost of the long-term equity investment is adjusted accordingly.

91BBMG CORPORATION
INTERIM REPORT 2018
Notes to Unaudited Interim Financial StatementsFor the six months ended 30 June 2018
RMB
III. MAJOR ACCOUNTING POLICIES AND ACCOUNTING ESTIMATES FOR BUSINESS ENTERPRISES (continued)
12. Long-term equity investments (continued)
Under the equity method, the Group recognises, upon acquisition of the long-term equity
investment, its share of the net profits or losses and other comprehensive income made by the
investee as investment income or losses and other comprehensive income respectively, and adjusts
the carrying amount of the investment accordingly. The Group recognises its share of the investee’s
net profits or losses after making appropriate adjustments to the investee’s net profits or losses,
except for those from dispensing or selling businesses constituted by assets, based on the fair value
of the investee’s identifiable assets at the acquisition date, using the Group’s accounting policies and
periods, and eliminating the portion of the profits or losses arising from internal transactions with
its associates and joint ventures, attributable to the investing party according to its entitled ratio
(but impairment losses for assets arising from internal transactions shall be recognised in full). The
carrying amount of the investment is reduced based on the Group’s share of any profit distributions
or cash dividends declared by the investee. The Group’s share of net losses of the investee is
recognised to the extent the carrying amount of the investment together with any long-term
interests that in substance form part of its net investment in the investee is reduced to zero, except
that the Group has incurred obligations to assume additional losses. The Group adjusts the carrying
amount of the long-term equity investment for any changes in shareholders’ equity of the investee
(other than net profit or loss, other comprehensive income and profit distributions) and includes the
corresponding adjustments in the shareholders’ equity.
On disposal of a long-term investment, the difference between the carrying amount of the
investment and the sales proceeds actually received is recognised in profit or loss for the current
period. For long-term equity investments accounted for using the equity method, where the equity
method is no longer adopted, the relevant other comprehensive income previously accounted
for using the equity method is accounted for on the same basis as that used to account for
direct disposal of such assets or liabilities by the investee, and shareholders’ equity recognised
as a result of changes in other shareholders’ equity of the investee other than net profit or loss,
other comprehensive income and profit distribution is transferred to profit or loss in full for the
current period; where the equity method is still adopted, the relevant other comprehensive income
previously accounted for using the equity method is accounted for on the same basis as that used to
account for direct disposal of such assets or liabilities by the investee and transferred to profit or loss
in proportion for the current period, and shareholders’ equity recognised as a result of changes in
other shareholders’ equity of the investee other than net profit or loss, other comprehensive income
and profit distribution is transferred to profit or loss in corresponding proportion for the current
period.

92
Notes to Unaudited Interim Financial StatementsFor the six months ended 30 June 2018
RMB
III. MAJOR ACCOUNTING POLICIES AND ACCOUNTING ESTIMATES FOR BUSINESS ENTERPRISES (continued)
13. Investment properties
Investment properties are held to earn rentals or for capital appreciation or both. Investment
properties include land use right that is leased out, land use right held for transfer upon capital
appreciation, and building that is leased out. The Group’s investment properties are held for long
term purposes and are leased to earn rentals.
An investment property is measured initially at cost. Subsequent costs incurred for an investment
property are included in its cost only when the economic benefits associated with the asset will
probably flow in and the cost can be measured reliably. Otherwise, subsequent costs are recognised
in profit or loss for the period during which they are incurred.
The Group uses the fair value model for subsequent measurement of its investment properties. Fair
value changes are included in “Gains from changes in fair value” in the income statement. Reasons
for the adoption of the fair value model as the accounting policy for subsequent measurement by
the Group are as follows:
(1) The investment properties are located in places where the property markets are active.
The Group’s current investment properties, most of which are commercial properties at
developed commercial districts, are primarily located at core districts of Beijing and Tianjin
where the property markets are relatively active. The Group is able to obtain market price
and other related information of properties of the same category or similar nature. It is
practicable for the Group to adopt the fair value model for subsequent measurement of the
investment properties.
(2) The Group is able to obtain market price and other related information of properties of the
same category or similar nature from the property markets, by which the Group makes a
reasonable estimation of the fair value of its investment properties.
The Group has engaged a valuer with relevant qualifications to make valuation on the fair
value of the investment properties of the Group using the income method and with reference
to the prices in the open market. The result of such valuation is used as the fair value of the
investment properties of the Group.

93BBMG CORPORATION
INTERIM REPORT 2018
Notes to Unaudited Interim Financial StatementsFor the six months ended 30 June 2018
RMB
III. MAJOR ACCOUNTING POLICIES AND ACCOUNTING ESTIMATES FOR BUSINESS ENTERPRISES (continued)
13. Investment properties (continued)
Key assumptions and major uncertain factors adopted by the Group for the estimation of the fair
value of the investment properties of the Group mainly include: assuming the investment properties
are traded in the open market and will continue to be used for their existing purposes; there will
be no significant changes in the macro-economic policies of the PRC and the social and economic
environment, tax policies, credit interest rates and foreign exchange rates in the places where the
investment properties are located; and there is no other force majeure and unforeseeable factor that
may have a material impact on the Group’s operation.
14. Fixed assets
A fixed asset is recognised only when the economic benefits associated with the asset will probably
flow to the Group and the cost of the asset can be measured reliably. Subsequent expenditures
incurred for a fixed asset that meet the recognition criteria shall be included in its cost, and the
carrying amount of the component of the fixed asset that is replaced shall be derecognised.
Otherwise, such expenditures shall be recognised in profit or loss for the period during which they
are incurred.
Fixed assets are initially measured at cost and the effect of any expected costs of abandoning the
assets is considered. The cost of a purchased fixed asset comprises the purchase price, relevant taxes
and any directly attributable costs for bringing the asset to working condition for its intended use.
Except for those fixed assets formed by using production safety fees accrued, depreciation of fixed
assets is calculated using the straight-line method. The useful lives, estimated net residual values and
annual depreciation rates of fixed assets are as follows:
Useful life
Estimated net
residual value
Annual
depreciation rate
(%)
Buildings 20-35 years 5% 2.71-4.75%
Machinery and equipment 15 years 5% 6.33%
Transportation equipment 8-10 years 5% 9.50-11.88%
Other equipment 5 years 5% 19.00%

94
Notes to Unaudited Interim Financial StatementsFor the six months ended 30 June 2018
RMB
III. MAJOR ACCOUNTING POLICIES AND ACCOUNTING ESTIMATES FOR BUSINESS ENTERPRISES (continued)
14. Fixed assets (continued)
Different depreciation rates are applied where the components of fixed assets have different useful
lives or provide the entity with economic benefits in different patterns.
A fixed asset under finance lease is depreciated according to the same policy as that of a self-owned
fixed asset. If it is reasonably certain that ownership of the leased asset can be obtained upon expiry
of the lease term, the leased asset is depreciated over its useful life. Otherwise, the leased asset is
depreciated over the shorter of the lease term and its useful life.
The Group reviews the useful life and estimated net residual value of a fixed asset and the
depreciation method applied at least once at the end of each financial year, and makes adjustments
if necessary.
15. Construction in progress
The cost of construction in progress is determined according to the actual costs incurred for the
construction, including all necessary construction costs incurred during the construction period,
borrowing costs that shall be capitalised before the construction gets ready for its intended use and
other relevant expenses.
Construction in progress is transferred to fixed assets when the asset is ready for its intended use.

95BBMG CORPORATION
INTERIM REPORT 2018
Notes to Unaudited Interim Financial StatementsFor the six months ended 30 June 2018
RMB
III. MAJOR ACCOUNTING POLICIES AND ACCOUNTING ESTIMATES FOR BUSINESS ENTERPRISES (continued)
16. Assets related to contractual costs
The Group’s assets related to contractual costs include costs incurred to secure a contract and costs
incurred in performing a contract, which are presented in inventory, other current assets and other
non-current assets, respectively, based on their liquidity.
The Group recognises as the additional costs incurred to secure a contract as an asset if it expects to
recover the costs.
If the costs incurred in performing a contract are not within the scope of inventories, fixed assets,
intangible assets or other relevant standards, the Group recognises the costs incurred in performing
a contract as an asset if those costs meet all of the following criteria:
(1) the costs relate directly to an existing contract or to an anticipated contract, including direct
labour, direct materials, production overheads (or similar costs), costs that are explicitly
chargeable to the customer and other costs that are incurred only by the reason of the
contract;
(2) costs generate resources of the corporate that will be used in satisfying performance
obligations in the future;
(3) the costs are expected to be recovered.
Assets related to contract costs are amortised on a basis that is consistent with the recognition of
the revenue to which the assets relate and recognised in profit or loss for the current period.
The Group makes impairment provisions and recognises an impairment loss on asset to the extent
that the carrying amount of an asset related to contract costs exceeds:
(1) remaining amount of consideration that the corporate expects to receive in exchange for the
goods to which the asset relates; less
(2) the estimated costs to be incurred for the exchange of the related goods.
The Group shall make a reversal of the provision for asset impairment previously made and recognise
it in profit or loss for the current period when the impairment conditions have changed resulting in
the difference between (1) and (2) aforementioned higher than the carrying amount of the asset.
However, the carrying amount of the asset upon reversal shall not exceed the carrying amount that
would have been determined on the date of reversal if no impairment provisions had been made
previously.

96
Notes to Unaudited Interim Financial StatementsFor the six months ended 30 June 2018
RMB
III. MAJOR ACCOUNTING POLICIES AND ACCOUNTING ESTIMATES FOR BUSINESS ENTERPRISES (continued)
17. Borrowing costs
Borrowing costs are interest and other costs incurred by the Group in connection with the
borrowing. Borrowing costs include interest, amortisation of discounts or premiums related to
borrowings, ancillary costs incurred in connection with the arrangement of borrowings, and
exchange differences arising from foreign currency borrowings.
The borrowing costs that are directly attributable to the acquisition, construction or production of
a qualifying asset are capitalised. The amounts of other borrowing costs incurred are recognised
in profit or loss for the period in which they are incurred. Qualifying assets are assets (fixed assets,
investment properties, inventories, etc.) that necessarily take a substantial period of time for
acquisition, construction or production to get ready for their intended use or sale.
The capitalisation of borrowing costs commences only when all of the following conditions are
satisfied:
(1) expenditures for the asset are being incurred;
(2) borrowing costs are being incurred;
(3) activities relating to the acquisition, construction or production of the asset that are
necessary to prepare the asset for its intended use or sale have commenced.
Capitalisation of borrowing costs ceases when the qualifying asset being acquired, constructed or
produced becomes ready for its intended use or sale. Any borrowing costs subsequently incurred are
recognised in profit or loss for the period during which they are incurred.
During the capitalisation period, the amount of interest to be capitalised for each accounting period
shall be determined as follows:
(1) where funds are borrowed for a specific purpose, the amount of interest to be capitalised
is the actual interest expense incurred on that borrowing for the period less any temporary
bank interest earned from depositing the borrowed funds before being used on the asset or
any investment income on the temporary investment of those funds.
(2) where funds are borrowed for a general purpose, the amount of interest to be capitalised on
such borrowings is determined by multiplying a weighted average interest rate of the funds
borrowed for a general purpose by the weighted average of the excess amounts of accumulated
expenditure on the asset over and above the amounts of specific-purpose borrowings.
Capitalisation of borrowing costs is suspended during periods in which the acquisition, construction
or production of a qualifying asset is interrupted by activities other than those necessary to prepare
the asset for its intended use or sale, when the interruption is for a continuous period of more than
three months. Borrowing costs incurred during these periods are recognised in profit or loss for the
period during which they are incurred until the acquisition, construction or production is resumed.

97BBMG CORPORATION
INTERIM REPORT 2018
Notes to Unaudited Interim Financial StatementsFor the six months ended 30 June 2018
RMB
III. MAJOR ACCOUNTING POLICIES AND ACCOUNTING ESTIMATES FOR BUSINESS ENTERPRISES (continued)
18. Intangible assets
An intangible asset shall be recognised only when it is probable that the economic benefits
associated with the asset will flow to the Group and the cost of the asset can be measured reliably.
Intangible assets are measured initially at cost. However, intangible assets acquired in a business
combination which is not under common control and with a fair value that can be measured reliably
are recognized separately as intangible assets and measured at fair value.
The useful life of an intangible asset is determined according to the period over which it is estimated
to generate economic benefits for the Group. An intangible asset is regarded as having an indefinite
useful life when the period over which the asset is estimated to generate economic benefits for the
Group is uncertain.
The intangible assets of the Group consist of land use rights, mining rights, trademarks and software
use rights.
Land use rights that are purchased by the Group for purposes other than real estate development
are generally accounted for as intangible assets. For buildings such as plants that are developed and
constructed by the Group, the relevant land use rights and buildings are accounted for as intangible
assets and fixed assets, respectively. Payments for the land and buildings purchased are allocated
between the land use rights and the buildings; if they cannot be reasonably allocated, all of the
land use rights and buildings are accounted for as fixed assets. Land use rights of the Group are
amortised on the straight-line basis over the term stipulated on the certificates of land use rights
obtained by the Group.
Costs of mining rights include costs incurred to obtain the mining licence and estimated mine
restoration cost. Amortisation is calculated using the production method based on the relevant
recoverable mining reserves.

98
Notes to Unaudited Interim Financial StatementsFor the six months ended 30 June 2018
RMB
III. MAJOR ACCOUNTING POLICIES AND ACCOUNTING ESTIMATES FOR BUSINESS ENTERPRISES (continued)
18. Intangible assets (continued)
An intangible asset with a finite useful life is amortised using the straight-line method over its
useful life. For an intangible asset with a finite useful life, the Group reviews the useful life and
amortization method at least once at the end of each financial year and makes adjustment if
necessary.
Intangible assets with indefinite use life (mainly trademarks) are tested for impairment each year,
irrespective of whether there is any indication that the asset may be impaired. An intangible asset
with indefinite useful life shall not be amortised, for which the useful life is reassessed in each
accounting period. If there is evidence indicating that the useful life of that intangible asset becomes
finite, it shall be accounted for by applying the accounting policy for intangible assets with a finite
useful life.
The Group classifies expenditure for an internal research and development project into expenditure
in the research phase and expenditure in the development phase. Expenditure in the research phase
is recognised in profit or loss for the period in which it is incurred. Expenditure in the development
phase is capitalised when the Group can demonstrate all of the following: (i) the technical feasibility
of completing the intangible asset so that it will be available for use or sale; (ii) the intention to
complete the intangible asset and use or sell it; (iii) how the intangible asset will generate probable
future economic benefits, for which, among other things, the Group can demonstrate the existence
of a market for the output of the intangible asset or the intangible asset itself or, if it is to be used
internally, the usefulness of the intangible asset; (iv) the availability of adequate technical, financial
and other resources to complete the development and the ability to use or sell the intangible asset;
and (v) the expenditure attributable to the intangible asset during its development can be measured
reliably. Expenditure in the development phase that does not meet the above criteria is recognised in
profit or loss for the period in which it is incurred.

99BBMG CORPORATION
INTERIM REPORT 2018
Notes to Unaudited Interim Financial StatementsFor the six months ended 30 June 2018
RMB
III. MAJOR ACCOUNTING POLICIES AND ACCOUNTING ESTIMATES FOR BUSINESS ENTERPRISES (continued)
19. Impairment of assets
The Group determines the impairment of assets other than inventories, investment properties
measured under the fair value model, deferred income tax assets, financial assets and assets held for
sale using the following methods:
The Group assesses at the balance sheet date whether there is any indication that an asset may be
impaired. If any indication exists that an asset may be impaired, the Group estimates the recoverable
amount of the asset and performs test for impairment. Goodwill arising from a business combination
and intangible assets with indefinite useful life are tested for impairment at least once at the end of
each year, irrespective of whether there is any indication that the asset may be impaired. Intangible
assets that have not been ready for intended use are tested for impairment each year.
The recoverable amount of an asset is the higher of its fair value less costs to sell and the present
value of the future cash flows estimated to be derived from the asset. The Group estimates the
recoverable amount on an individual basis. If it is not possible to estimate the recoverable amount of
the individual asset, the Group determines the recoverable amount of the asset group to which the
asset belongs. Identification of an asset group is based on whether major cash inflows generated by
the asset group are largely independent of the cash inflows from other assets or asset groups.
When the recoverable amount of an asset or an asset group is less than its carrying amount, the
carrying amount is reduced to the recoverable amount. The reduction in carrying amount is treated
as impairment loss and recognised in profit or loss for the current period. A provision for impairment
loss of the asset is recognised accordingly.
For the purpose of goodwill impairment testing, the carrying amount of goodwill acquired in a
business combination is allocated from the acquisition date on a reasonable basis to each of the
related asset groups; if it is not possible to allocate to the related asset groups, it is allocated to
each of the related set of asset groups. Each of the related asset group or set of asset groups
is an asset group or set of asset groups that is able to benefit from the synergy of the business
combination and shall not be larger than a reportable segment determined by the Group.

100
Notes to Unaudited Interim Financial StatementsFor the six months ended 30 June 2018
RMB
III. MAJOR ACCOUNTING POLICIES AND ACCOUNTING ESTIMATES FOR BUSINESS ENTERPRISES (continued)
19. Impairment of assets (continued)
In testing an asset group or a set of asset groups to which goodwill has been allocated for
impairment test, if there is any indication of impairment, the Group first tests the asset group or set
of asset groups excluding the amount of goodwill allocated for impairment, i.e., it determines and
compare the recoverable amount with the related carrying amount and recognise any impairment
loss. After that, the Group tests the asset group or set of asset groups including goodwill for
impairment, the carrying amount (including the portion of the carrying amount of goodwill
allocated) of the related asset group or set of asset groups is compared to its recoverable amount. If
the recoverable amount of the asset group or set of asset groups is lower than its carrying amount,
the amount of the impairment loss is first reduced by the carrying amount of the goodwill allocated
to the asset group or set of asset groups, and then by the carrying amount of other assets (other
than the goodwill) within the asset group or set of asset groups, pro rata based on the carrying
amount of each asset.
Once the above impairment loss is recognised, it cannot be reversed in subsequent accounting
periods.
20. Long-term deferred expenditures
Long-term deferred expenditures represent expenditures incurred but should be recognised as
expenses over more than one year in the current year and subsequent periods, including costs of
leasehold improvements, renovation expenses, stripping cost of mines and lease prepayments. A
long-term deferred expenditure is amortised using the straight-line method according to the period
over which it is estimated to generate economic benefits for the Group.
21. Employee benefits
Employee benefits are all forms of considerations or compensations given by the Group in exchange
for services rendered by employees or for the termination of employment. Employee benefits include
short-term benefits, post-employment benefits, termination benefits and other long-term employee
benefits. The benefits provided by the Group to the spouses, children and dependents of employees
as well as families and other beneficiaries of deceased employees are also classified as employee
benefits.
Short-term benefits
In the accounting period in which services are rendered by employees, the actual amount of short-
term benefits incurred is recognised as liabilities and charged to profit or loss for the current period
or cost of underlying assets.

101BBMG CORPORATION
INTERIM REPORT 2018
Notes to Unaudited Interim Financial StatementsFor the six months ended 30 June 2018
RMB
III. MAJOR ACCOUNTING POLICIES AND ACCOUNTING ESTIMATES FOR BUSINESS ENTERPRISES (continued)
21. Employee benefits (continued)
Post-employment benefits (the defined contribution plan)
The employees of the Group participate in the pension insurance and unemployment insurance
scheme administered by the local government and also enterprise annuity, and the corresponding
expenses are included in the costs of underlying assets when incurred or recognised in profit or loss
for the current period.
Post-employment benefits (the defined benefit plan)
The Group operates various defined benefit pension plans, which includes providing certain eligible
retirees of the Company and its subsidiaries with supplementary allowance benefits. No capital has
been injected into the plan. The benefits cost under the defined benefit plan is calculated using the
projected accumulative benefit unit method.
The items to be remeasured as a result of the defined benefit pension plan, which include actuarial
gains or losses, movements arising from assets cap (net of amounts included in net interest of
liabilities in the defined benefit plan) and return on plan assets (net of amounts included in net
interest of liabilities in the defined benefit plan), are all immediately recognised in the balance sheet,
and are included in shareholders’ equity through other comprehensive income during the period in
which they are incurred. They will not be reversed to profit or loss in subsequent periods.
The past service costs are recognised as expenses for the current period when the defined benefit
plan is modified or when the Group recognises relevant restructuring costs or termination benefits,
whichever occurs earlier.
Net interest is calculated by multiplying net liabilities or net assets of the defined benefit plan by
the discount rate. The Group recognises changes in net liabilities of the defined benefit plan under
finance expenses in the income statement. Service cost includes current service cost, past service
cost and gains or losses on settlement; net interest includes interest income on plan assets, interest
expenses on plan obligations and interest arising from assets cap.
Termination benefits
Where the Group provides termination benefits to employees, the employee benefits liabilities arising
from termination benefits are recognised and accounted for in profit or loss for the current period
at the earlier of the following dates: when the Group cannot unilaterally withdraw the offer of these
termination benefits as a result of termination of employment plan or downsizing proposal, and
when the Group recognises restructuring costs involving the payment of termination benefits.

102
Notes to Unaudited Interim Financial StatementsFor the six months ended 30 June 2018
RMB
III. MAJOR ACCOUNTING POLICIES AND ACCOUNTING ESTIMATES FOR BUSINESS ENTERPRISES (continued)
22. Provisions
Except for contingent consideration and contingent liability assumed in a business combination not
under common control, the Group recognises an obligation related to a contingency as a provision
when all of the following conditions are satisfied:
(1) the obligation is a present obligation of the Group;
(2) it is probable that an outflow of economic benefits from the Group will be required to settle
the obligation;
(3) the amount of the obligation can be measured reliably.
A provision is initially measured at the best estimate of the expenditure required to settle the related
present obligation, with comprehensive consideration of factors such as the risks, uncertainty and
time value of money relating to a contingency. The carrying amount of a provision is reviewed at
each balance sheet date. If there is clear evidence that the carrying amount does not reflect the
current best estimate, the carrying amount is adjusted to the best estimate.
23. Preference shares, perpetual bonds and other financial instruments
The financial instruments issued by the Group, such as perpetual bonds and preference shares, are
classified as equity instruments when all of the following conditions are satisfied:
(1) The financial instruments have no contractual obligation to pay in cash or other financial
assets to other parties nor to exchange financial assets or financial liabilities under potential
adverse condition with other parties;
(2) If the financial instrument will or may be settled in the entity’s own equity instruments, it
is a non-derivative instrument that includes no contractual obligations to deliver a variable
number of its own equity instruments; or a derivative that will be settled only by the Group
exchanging a fixed amount of cash or other financial asset for a fixed number of its own
equity instruments.
Other than financial instruments classified as equity instruments according to the above conditions,
other financial instruments issued by the Group shall be classified as financial liabilities.
The financial instruments issued by the Group which are compound financial instruments are
recognized as a liability based on the fair value of the liability component, and the amount net of
the fair value of the liability component from the actual amount received is recognised as “other
equity instruments”. Transaction costs that relate to the issue of a compound financial instrument
are allocated to the liability and equity components in proportion to the allocation of gross proceeds.

103BBMG CORPORATION
INTERIM REPORT 2018
Notes to Unaudited Interim Financial StatementsFor the six months ended 30 June 2018
RMB
III. MAJOR ACCOUNTING POLICIES AND ACCOUNTING ESTIMATES FOR BUSINESS ENTERPRISES (continued)
23. Preference shares, perpetual bonds and other financial instruments (continued)
For financial instruments classified as financial liabilities (such as perpetual bonds and preference
shares), except borrowing costs qualifying for capitalisation, its related interest, dividends, gains or
losses, and gains or losses arising from redemption or refinancing are credited to profit or loss for
the current period.
For financial instruments classified as equity instruments (such as perpetual bonds and preference
shares), its issue (including refinancing), repurchase, sale or cancellation are treated by the Group
as changes in equity, with related transaction costs deducted from equity. The Group’s distribution
to holders of equity instruments are treated as a distribution of profits. Changes in the fair value of
equity instruments are not recognised by the Group.
24. Revenue
When the Group has fulfilled its performance obligations of the contract, the revenue is recognized
when the customers take control of the relevant goods or services. Taking control of the relevant
goods or services means being able to dominate the use of the goods or the provision of the
services and obtain almost all of the economic benefits from them.
Sales contracts of goods
Sales contracts of goods between the Group and its customers generally include the performance
obligation of transferred goods only. Generally, upon taking account of all the following factors,
namely, receipt of the current payment rights of goods, transfer of major risks and rewards in
relation to the ownership of goods, transfer of the legal ownership of goods, transfer of physical
assets of goods and receipt of delivery of such goods by the customers, the Group recognises this as
revenue when control of goods have been transferred to the buyer.
Revenue from the sales of completed properties is recognised when the risks and rewards of
property ownership have been transferred to the buyer, i.e., when the properties has been
completed and delivered to the buyer pursuant to the sale agreement and the collection of the
consideration determined under the purchase and sales contract can be assured reasonably.
According to the contract, the instalments of sold properties and proceeds from pre-sale collected
prior to the revenue recognition will be presented in the contractual liabilities or other non-current
liabilities under the balance sheet based on liquidity.

104
Notes to Unaudited Interim Financial StatementsFor the six months ended 30 June 2018
RMB
III. MAJOR ACCOUNTING POLICIES AND ACCOUNTING ESTIMATES FOR BUSINESS ENTERPRISES (continued)
24. Revenue (continued)
Contracts for provision of services
Contracts for provision of services between the Group and its customers generally include
performance obligations in relation to decoration and design, property management, etc. As the
customers will receive and consume economic benefits arising from the fulfilment of performance
obligations as stipulated in the contracts by the Group. During the contract period, the Group is
entitled to receive revenue from the performance completed to date. The Group considers such
revenue as performance obligations fulfilled during a specific period and recognises the revenue
based on the progress of performance, unless the progress of performance cannot be reasonably
determined. The Group determined the progress of performance in relation to the provision of
services using input method. Where progress of performance cannot be reasonably determined, the
Group determined its revenue based on the incurred amount of costs to the extent that they are
expected to be compensated, until the progress of performance is able to be determined reasonably.
Sales return provisions
In terms of sales with sales return provisions, the Group recognises revenue in accordance with
the amount of consideration expected to receive due to the transfer of goods to the customers
and recognises liabilities according to the expected amount to be refunded due to the return of
sales. Meanwhile, the Group recognises an asset based on the balance of the carrying value upon
transferring the goods expected to be returned, deducting the cost anticipated to be incurred in
recovering such goods (including the value impairment on the return of the goods) and the net cost
of such asset carried forward according to the carrying value of the transferred goods when the
transfer occurs. The Group reassesses the returns of future sales and re-measures the above assets
and liabilities on each balance sheet date.
Significant financing component
For the existence of significant financing components in the contract, the Group determines the
transaction price based on the amount payable by cash when assuming that the client takes the
control of the goods, and discounts the nominal amount of the contract consideration to the
discounted price of the goods sold. The difference between the determined transaction price and
the consideration amount of the contractual commitment is amortized using the effective interest
method during the contract period.

105BBMG CORPORATION
INTERIM REPORT 2018
Notes to Unaudited Interim Financial StatementsFor the six months ended 30 June 2018
RMB
III. MAJOR ACCOUNTING POLICIES AND ACCOUNTING ESTIMATES FOR BUSINESS ENTERPRISES (continued)
24. Revenue (continued)
Warranty obligations
The Group provides quality assurance for the goods sold pursuant to contractual agreement and
laws and regulations. The Group performs accounting treatments in accordance with Note III. 22
with a view to providing guarantee to the customers that the goods sold meet the established
quality standards. In addition to providing guarantee to the customers that the goods sold meet the
established quality standards, providing the customers with a separate quality assurance for services
is regarded as a separate performance obligation by the Group. Based on the relative proportion
of the individual selling prices of providing quality assurance for goods and services, part of the
transaction price is allocated to quality assurance of services and revenue is recognized when the
customers take control of the services. In assessing whether quality assurance is provided as a
separate service other than providing guarantee to the customers that the goods sold meet the
established quality standards; the Group considers factors such as whether the quality assurance is
a statutory requirement, the term of quality assurance and nature of the Group’s commitment to
perform its obligations.
Variable consideration
There exist arrangements under certain business contracts between the Group and its customers
where the amount of settlement is calculated in the manner as agreed in the contract upon
completion of the projects, which results in a variable consideration. The Group determines the
best estimate amount of the variable consideration based on the expected value or the most likely
amount, but the transaction price including the variable consideration does not exceed the amount
that the accumulated and recognized revenue is likely not to be significantly reversed when the
relevant uncertainty is eliminated.
Main responsible person/agent
Upon receiving goods held for trading or taking control over other assets from third parties, the
Group is entitled to solely determine the price of goods held for trading when transferring such
goods to the customers. As such, the Group would be able to control such goods before it transfers
the goods held for trading to its customers. Therefore, the Group is the main responsible person
and recognizes the revenue according to the total consideration received or receivable. Otherwise,
the Group is an agent and recognizes the revenue according to the amount of the commission or
handling fee expected to receive. The amount shall be netted according to the total amount received
or receivable, after deducting the price payable to other related parties, or determined according to
the established commission amount or proportion thereof.

106
Notes to Unaudited Interim Financial StatementsFor the six months ended 30 June 2018
RMB
III. MAJOR ACCOUNTING POLICIES AND ACCOUNTING ESTIMATES FOR BUSINESS ENTERPRISES (continued)
24. Revenue (continued)
Interest income
It is determined according to the length of period for which the Group’s currency fund is used by
others and the effective interest rate.
Lease income
Lease income from operating leases is recognised on a straight-line basis over the lease term.
Contingent rental income is charged to profit or loss in the period in which it actually arises.
25. Government grants
Government grants are recognised when all attaching conditions can be complied with and the
grant can be received. If a government grant is in the form of a transfer of a monetary asset, it is
measured at the amount received or receivable. If a government grant is in the form of a transfer
of a non-monetary asset, it is measured at fair value; if fair value cannot be reliably determined, it is
measured at a nominal amount.
Government grants shall be recognised as government grants related to assets where long-
term assets are built or otherwise developed in accordance with the requirements of government
documents. If there are no specific requirements of government documents, judgment shall be
exercised based on the basic conditions required for the grants. Government grants shall be
recognised as government grants related to assets where the building or otherwise development
of long-term assets is considered as the basic condition; otherwise, they shall be recognised as
government grants related to income.
A government grant related to income is accounted for as follows: (a) if the grant is a compensation
for related expenses or losses to be incurred in subsequent periods, the grant is recognised as
deferred income, and recognised in profit or loss over the periods in which the related costs are
recognised; and (b) if the grant is a compensation for related expenses or losses already incurred, it
is recognized immediately in profit or loss for the current period. A government grant related to an
asset shall be recognised as deferred income, and recognised in profit or loss in instalments over the
useful life of the related asset in a reasonable and systematic way. If the related assets are disposed
of, transferred, scrapped and damaged before the end of the useful life, the relevant remaining
deferred income unallocated shall be transferred to the profit or loss for the period when the
assets are disposed of. However, a government grant measured at a nominal amount is recognised
immediately in profit or loss for the current period. A government grant related to both an asset and
income is accounted for separately upon distinction, otherwise is classified as a government grant
related to income as a whole.
Government grants related to daily corporate activities are included in other gains or used to offset
relevant cost and expenses based on the nature of the economic business. Government grants not
related to daily corporate activities are included in non-operating income.

107BBMG CORPORATION
INTERIM REPORT 2018
Notes to Unaudited Interim Financial StatementsFor the six months ended 30 June 2018
RMB
III. MAJOR ACCOUNTING POLICIES AND ACCOUNTING ESTIMATES FOR BUSINESS ENTERPRISES (continued)
26. Income tax
Income tax comprises current and deferred income tax. Income tax is recognised as an income
tax expense or income in profit or loss for the current period, or otherwise recognised directly in
shareholders’ equity if it arises from goodwill on a business combination or relates to a transaction
or event which is recognised directly in shareholders’ equity.
The Group measures a current tax liability or asset arising from the current and prior periods based
on the amount of income tax estimated to be paid by the Group or returned by taxation authority
calculated in accordance with the requirements of related tax laws.
Deferred income tax is recognised under the balance sheet liability method based on the temporary
differences at the balance sheet date between the tax bases of assets and liabilities and their
carrying amounts, and temporary differences between the tax bases and carrying amounts in respect
of items not recognized as assets and liabilities, but the tax bases being determinable under tax law.
Deferred income tax liabilities are recognised for all taxable temporary differences, except:
(1) where the taxable temporary differences arise from the initial recognition of goodwill, or the
initial recognition of an asset or liability in a transaction that is not a business combination
and, at the time of the transaction, affects neither accounting profit nor taxable profit or
deductible loss.
(2) in respect of taxable temporary differences associated with investments in subsidiaries, joint
ventures and associates, where the timing of the reversal of the temporary differences can
be controlled and it is probable that the temporary differences will not be reversed in the
foreseeable future.
A deferred income tax asset is recognised for deductible temporary differences, and unused
deductible losses and tax credits that can be carried forward, to the extent that it is probable that
taxable profit will be available against which the deductible temporary differences, deductible losses
and tax credits can be utilised, except:
(1) where the deductible temporary difference arises from a transaction that is not a business
combination and, at the time of the transaction, affects neither accounting profit nor taxable
profit or deductible loss.
(2) in respect of the deductible temporary differences associated with investments in subsidiaries,
joint ventures and associates, a deferred income tax asset is only recognised to the extent
that it is probable that the temporary differences will be reversed in the foreseeable future
and taxable profit will be available against which the deductible temporary differences can
be utilised in the future.

108
Notes to Unaudited Interim Financial StatementsFor the six months ended 30 June 2018
RMB
III. MAJOR ACCOUNTING POLICIES AND ACCOUNTING ESTIMATES FOR BUSINESS ENTERPRISES (continued)
26. Income tax (continued)
At the balance sheet date, deferred income tax assets and liabilities are measured at the tax rates
that are estimated to apply to the period when the asset is recovered or the liability is settled
according to the requirements of tax laws. The measurement of deferred income tax assets and
deferred income tax liabilities reflects the tax consequences that would follow from the manner in
which the Group expects, at the balance sheet date, to recover the assets or settle the liabilities.
The carrying amount of deferred income tax assets is reviewed at the balance sheet date and
reduced to the extent that it is no longer probable that sufficient taxable profit will be available in
future periods to allow the deferred income tax assets to be utilised. Unrecognised deferred income
tax assets are reassessed at the balance sheet date and are recognised to the extent that it has
become probable that sufficient taxable profit will be available to allow all or part of the deferred
income tax asset to be recovered.
When the following conditions are satisfied, deferred income tax assets and deferred income tax
labilities are shown as net amounts after set-off: there is a legally enforceable right to settle current
tax assets and current tax liabilities on a net basis; deferred income tax assets and deferred income
tax liabilities relate to income taxes levied by the same taxation authority on either the same taxable
entity or different taxable entities, but the involved taxable entities intended to settle the current tax
assets and current tax liabilities on a net basis or to simultaneously acquire assets and repay debts
during each future period in which significant amounts of deferred income tax assets and deferred
income tax liabilities are expected to be reversed.
27. Maintenance and quality guarantee funds
Maintenance fund is collected on behalf of housing administration authorities from property buyers
in a certain proportion to the selling price in accordance with relevant regulations. The fund will be
remitted to housing administration authorities upon registration of property ownership. Maintenance
fund is accounted for under other payables.
Quality guarantee fund is reserved by a certain percentage of the project payment. The fund will
be repaid to the constructor after completion inspection of the properties has been completed, and
with no quality issue within the agreed warranty period. The fund is accounted for under accounts
payable.

109BBMG CORPORATION
INTERIM REPORT 2018
Notes to Unaudited Interim Financial StatementsFor the six months ended 30 June 2018
RMB
III. MAJOR ACCOUNTING POLICIES AND ACCOUNTING ESTIMATES FOR BUSINESS ENTERPRISES (continued)
28. Leases
Leases that transfer substantially all the risks and rewards of ownership of assets are accounted for
as finance leases. An operating lease is a lease other than a finance lease.
In the case of being the lessee of an operating lease
Lease payments under an operating lease are recognised by a lessee on a straight-line basis over the
lease terms, and either included in the cost of the related asset or charged to profit or loss for the
current period. Contingent rental payments are charged to profit or loss in the period in which they
actually arise.
In the case of being the lessor of an operating lease
Rental income under an operating lease is recognised on a straight-line basis over the lease term
through profit or loss for the current period. Contingent rental income is credited to profit or loss in
the period in which it actually arises.
In the case of being the lessee of a finance lease
An asset held under a finance lease is recognised at the lower of its fair value as at the effective
date of lease and the present value of the minimum lease payments, and the minimum lease
payment is recorded as the carrying amount of long-term payables. The difference between the
recorded amount of the leased asset and the recorded amount of the payable is accounted for
as unrecognised finance cost, which is amortised using the effective interest rate method during
periods over the lease term. Contingent rental payments are charged to profit or loss in the period
in which they actually arise.
In the case of being the lessor of a finance lease
An asset leased under a finance lease is recognised at the sum of the minimum lease payment
receivables and initial direct cost as at the effective date of lease as the finance lease receivables
and unguaranteed residual value is recorded at the same time. The difference between the sum of
minimum lease payment receivables, initial direct cost and the unguaranteed residual value and the
sum of its present value are accounted for as unrealised finance income which are recognised using
the effective interest rate method during periods over the lease term. Contingent rental income is
credited to profit or loss in the current period in which it actually arises.
29. Distribution of profit
Cash dividend of the Company is recognised as a liability upon being approved at the shareholders’
general meeting.

110
Notes to Unaudited Interim Financial StatementsFor the six months ended 30 June 2018
RMB
III. MAJOR ACCOUNTING POLICIES AND ACCOUNTING ESTIMATES FOR BUSINESS ENTERPRISES (continued)
30. Production safety cost
Production safety cost appropriated pursuant to regulations is recognised in the cost of the relevant
products or in profit or loss for the current period, and also in the specific reserve. The use of
production safety cost is accounted for separately according to whether a fixed asset is formed; The
cost incurred through expenditure will be reduced from the specific reserve; The cost incurred for a
fixed asset shall be pooled and recognised as a fixed asset when it reaches the working condition
for its intended use, meanwhile, an equivalent amount shall be deducted from the specific reserve
and recognised as accumulated depreciation.
31. Fair value measurement
The Group measures its investment properties and other equity instruments at fair value at each
balance sheet date. Fair value is the price that would be received to sell an asset or paid to transfer
a liability in an orderly transaction between market participants at the measurement date. The
Group’s relevant assets and liabilities are measured at fair value based on the presumption that the
orderly transaction to sell the asset or transfer the liability takes place in the principal market for
the relevant asset or liability, or in the absence of a principal market, in the most advantageous
market for the relevant asset or liability. The principal market (or the most advantageous market)
must be accessible by the Group at the measurement date. The fair value of an asset or a liability
is measured using the assumptions that market participants would use when pricing the asset or
liability, assuming that market participants act in their best economic interest.
A fair value measurement of a non-financial asset takes into account a market participant’s ability
to generate economic benefits by using the asset in its best use or by selling it to another market
participant that would use the asset in its best use.
The Group uses valuation techniques that are appropriate in the circumstances and for which
sufficient information and other supporting information are available to measure fair value,
maximising the use of relevant observable inputs and minimising the use of unobservable inputs.
All assets and liabilities for which fair value is measured or disclosed in the financial statements are
categorised within the fair value hierarchy based on the lowest level input that is significant to the
fair value measurement as a whole: Level 1 inputs – quoted prices (unadjusted) in active markets for
identical assets or liabilities at the measurement date; Level 2 inputs – the observable inputs, either
directly or indirectly, of the relevant assets or liabilities other than Level 1 inputs; Level 3 inputs –
unobservable inputs of the relevant assets or liabilities.
At each balance sheet date, for assets and liabilities that are recognised in the financial statements
that are measured at fair value on a recurring basis, the Group determines whether transfers have
occurred between levels in the fair value hierarchy by reassessment.

111BBMG CORPORATION
INTERIM REPORT 2018
Notes to Unaudited Interim Financial StatementsFor the six months ended 30 June 2018
RMB
III. MAJOR ACCOUNTING POLICIES AND ACCOUNTING ESTIMATES FOR BUSINESS ENTERPRISES (continued)
32. Significant accounting judgments and estimates
The preparation of the financial statements requires management to make judgments, estimates
and assumptions that affect the reported amounts of revenue, expenses, assets and liabilities, and
their accompanying disclosures, and the disclosure of contingent liabilities at the balance sheet date.
However, uncertainty about these assumptions and estimates could result in outcomes that could
require a material adjustment to the carrying amounts of the assets or liabilities affected in the
future.
Judgments
In the process of applying the Group’s accounting policies, management has made the following
judgments, apart from those involving estimations, which have the most significant effect on the
amounts recognised in the financial statements:
Operating lease commitments – Group as lessor
The Group has entered into lease contracts on its investment property portfolio. The Group has
determined, based on evaluation of the terms and conditions of the arrangements, that it retains all
the significant risks and rewards of ownership of these properties which are leased out on operating
leases.
Classification between investment properties and inventories
The properties constructed by the Group may be held for sale, earning rental income and/or capital
appreciation. The properties are designated as inventories or investment properties according to
the intention of holding at the early development stage. During the course of construction, the
properties which are intended for sale after their completion are accounted for as inventories –
properties under development included in current assets, whereas, the properties which are intended
to be held to earn rental income and/or for capital appreciation are accounted for as investment
properties under construction included in non-current assets. Upon completion, the properties held
for sale are transferred to inventories – completed properties held for sale, while the properties held
to earn rentals and/or for capital appreciation are transferred to completed investment properties.
Classification between investment properties and fixed assets
The Group determines whether a property held qualifies as an investment property, and has
developed relevant criteria for making the judgment. Properties held to earn rental income or for
capital appreciation or both (including buildings under construction or development which are
supposed to be used for rental earning) are classified as investment properties. Therefore, the Group
considers whether a property generates cash flows largely independently of other assets held by the
Group. Some properties comprise a portion that is held to earn rentals or for capital appreciation
while the remaining portion is held for use in the production or supply of goods or services or
for administrative purposes. The Group accounts for the portion that is held to earn rentals or for
capital appreciation separately if such portion can be sold or leased out separately. Otherwise, the
property is classified as an investment property only if an insignificant portion is held for use in the
production or supply of goods or services or for administrative purposes. The Group’s judgment is
made on an individual basis when determining whether ancillary services are so significant that a
property does not qualify as an investment property.

112
Notes to Unaudited Interim Financial StatementsFor the six months ended 30 June 2018
RMB
III. MAJOR ACCOUNTING POLICIES AND ACCOUNTING ESTIMATES FOR BUSINESS ENTERPRISES (continued)
32. Significant accounting judgments and estimates (continued)
Judgments (continued)
Classification of perpetual bonds
As described in Note V. 41, the Group issued perpetual bonds of RMB1 billion, RMB4 billion, RMB5
billion and RMB 2 billion in 2015, 2016, 2017 and 2018 respectively, and Jidong Development
Group Co., Ltd. (hereinafter referred to as “Jidong Group”, being a subsidiary of the Group) issued
perpetual bonds of RMB3 billion on 3 December 2015. According to the Prospectus on 2015 First
Tranche of Medium-term Notes of BBMG Corporation, the Prospectus on 2016 First Tranche of
Medium-term Notes of BBMG Corporation, the Prospectus on 2016 Second Tranche of Medium-term
Notes of BBMG Corporation, the Prospectus on 2017 First Tranche of Medium-term Notes of BBMG
Corporation, the Prospectus on 2017 Second Tranche of Medium term Notes of BBMG Corporation,
the Prospectus on 2018 Second Tranche of Medium-term Notes of BBMG Corporation and the
Prospectus on 2015 First Tranche of Medium-term Notes of Jidong Development Group Co., Ltd.,
the Group has no contractual obligation to repay the principal or pay interest on the bonds, namely
the Group has no contractual obligation to pay in cash or other financial assets to the holders of
the perpetual bonds nor to exchange financial assets or financial liabilities under potential adverse
condition with the holders of the perpetual bonds. The perpetual bonds are classified by the Group
as equity instruments, and the subsequent declared distribution will be treated as distribution to the
holders of the equity.
Uncertainty of estimation
The key assumptions concerning the future and other key sources of estimation uncertainty at the
balance sheet date that have a significant risk of causing a material adjustment to the carrying
amounts of assets and liabilities within the future accounting periods are discussed below.
Deferred income tax assets
Deferred income tax assets are recognised for all unused deductible losses to the extent that it is
probable that taxable profit will be available against which the deductible losses can be utilised.
Significant management judgment is required to determine the amount of deferred income tax
assets that should be recognised, based upon the likely timing and level of future taxable profits
together with future tax planning strategies.

113BBMG CORPORATION
INTERIM REPORT 2018
Notes to Unaudited Interim Financial StatementsFor the six months ended 30 June 2018
RMB
III. MAJOR ACCOUNTING POLICIES AND ACCOUNTING ESTIMATES FOR BUSINESS ENTERPRISES (continued)
32. Significant accounting judgments and estimates (continued)
Uncertainty of estimation (continued)
Impairment of financial instruments
The Group uses expected credit losses model to conduct assessment on the impairment of financial
instruments. The application of expected credit losses model requires significant judgement and
estimation and takes into account all reasonable and reliable information, including forward-
looking information. When making such judgement and estimation, the Group predicts the expected
changes in credit risk of the obligor based on its historical data of repayment together with factors
such as economic policy, macroeconomic indicators and industry risk.
Impairment of non-current assets other than financial assets (other than goodwill)
The Group assesses whether there are any indication of impairment for all non-current assets other
than financial assets at the balance sheet date. Intangible assets with indefinite useful lives are
tested for impairment annually and at other times when such indication exists. Other non-current
assets other than financial assets are tested for impairment when there is indication that the carrying
amounts may not be recoverable. Where the carrying amount of an asset or asset group is higher
than its recoverable amount (i.e. the higher of its fair value less costs to sell and the present value
of the future cash flows expected to be derived from it), it is indicated that such asset or asset
group is impaired. The fair value less costs to sell is determined with reference to the price in sales
agreement or observable market price in arm’s length transaction, adjusted for incremental costs
that would be directly attributable to the disposal of the asset or asset group. Estimating the present
value of the expected future cash flows requires the management to make an estimation of the
expected future cash flows from an asset or asset group and also choose a suitable discount rate in
order to calculate the present value of those future cash flows.
Impairment of goodwill
The Group determines whether goodwill is impaired at least on an annual basis. This requires an
estimation of the present value of the expected future cash flows from an asset group or set of
asset groups to which the goodwill is allocated. Estimating the present value of the expected future
cash flows requires the Group to make an estimation of the expected future cash flows from an
asset group or set of asset groups and also choose a suitable discount rate in order to calculate the
present value of those future cash flows.
Land appreciation tax
The Group is subject to land appreciation tax. The provision for land appreciation tax is based on
the management’s best estimates according to their understanding of the requirements set forth in
the relevant tax laws and regulations. The actual land appreciation tax liabilities are subject to the
determination by the tax authorities upon the settlement of land appreciation tax. The Group has
not finalised the assessment for its land appreciation tax calculations and payments with the tax
authorities for certain property development projects. The final outcome could be different from the
amounts that were initially recorded, and any differences will have impact on the land appreciation
tax expense and the related provision in the period in which the differences are realised.

114
Notes to Unaudited Interim Financial StatementsFor the six months ended 30 June 2018
RMB
III. MAJOR ACCOUNTING POLICIES AND ACCOUNTING ESTIMATES FOR BUSINESS ENTERPRISES (continued)
32. Significant accounting judgments and estimates (continued)
Uncertainty of estimation (continued)
Fair value of investment properties
The fair value of investment properties are revalued at the balance sheet date by an independent
professional valuer. Such valuations are based on certain assumptions, which are subject to
uncertainty and might differ from the actual results. In making the relevant estimation, information
from current market rentals for similar properties is considered and assumptions that are mainly
based on market conditions existing at the balance sheet date are adopted.
Recognition and allocation of development costs on properties under construction
Development costs of properties are recorded as inventory during the construction stage and will
be transferred to the income statement upon the recognition of the sale of the properties. Before
the final settlement of the development cost and other costs relating to the development of the
properties, the management of the Group is required to make estimation on these costs according
to the budgeted cost and the progress of development. When developing properties, the Group
typically divides the development projects into phases. Costs directly related to the development
of a phase are recorded as the costs of such phase. Costs that are common to different phases
are allocated to individual phases based on saleable area. Where the final settlement of costs and
the related cost allocation are different from the initial estimates, any increase or decrease in the
development costs and other costs would affect the profit or loss in future years.
Impairment of financial instruments
The Group adopts expected credit losses model to conduct assessment on the impairment of
financial instruments. The application of expected credit losses model requires significant judgement
and estimation and takes into account all reasonable and reliable information, including forward-
looking information. The information used for the estimation is subject to uncertainties, which might
lead to differences with the actual results.
Provision for decline in value of inventory
The Group’s inventory is measured at the lower of the costs and net realisable value. Net realizable
value of inventory is the estimated selling price of inventory less the estimated costs upon
completion of production, the estimated selling expenses and the related taxes and surcharges
necessary to make the sale. Management’s calculation of the net realisable value of inventory
involves the estimation on the estimated selling price, the estimated costs upon completion, the
estimated selling expenses and the related taxes and surcharges necessary to make the sale. Any
changes in such estimates will affect the carrying amount of the inventory and the profit for the
subsequent years.

115BBMG CORPORATION
INTERIM REPORT 2018
Notes to Unaudited Interim Financial StatementsFor the six months ended 30 June 2018
RMB
III. MAJOR ACCOUNTING POLICIES AND ACCOUNTING ESTIMATES FOR BUSINESS ENTERPRISES (continued)
32. Significant accounting judgments and estimates (continued)
Uncertainty of estimation (continued)
Measurement of defined benefit obligations
Supplementary subsidies and benefits paid to certain retired and early retired employees are
recognized as a liability. The amounts of those benefit expenses and liabilities are determined
using actuarial valuations conducted by an independent professional actuary who conducts annual
assessment of the actuarial position of the Group’s retirement plans. The actuarial valuation involves
making assumptions on discount rates, pension benefit inflation rates, and other factors. Due to
their long term nature, such estimates are subject to uncertainties.
Useful lives and residual values of fixed assets
Fixed assets are depreciated over their estimated useful lives by taking into account of their residual
values. The Group regularly reviews the estimated useful lives and residual values of relevant assets
to determine the total amount of depreciation which will be included in each reporting period.
Useful lives and residual values of assets are determined on the basis of the previous experience
from assets of the same category and the expected change of technology. If the past estimates
change significantly, the depreciation costs shall be adjusted during future periods.
33. Change in accounting policies and accounting estimates
Change in Accounting Policy
In 2017, the Ministry of Finance announced the revised “Accounting Standard for Business
Enterprises No.14 – Revenue” (the “New Revenue Standard”), “Accounting Standard for
Business Enterprises No.22 – Recognition and measurement for financial instruments, “Accounting
Standard for Business Enterprises No.23 – Transfer of financial assets”, “Accounting Standard for
Business Enterprises No.24 – Hedging” and “Accounting Standard for Business Enterprises No.37 –
Presentation of financial instruments” (the “New Financial Instruments Standard”). The Group
began to implement the accounting treatment according to the newly revised standards above from
1 January 2018. According to the transitional requirements, the information for the comparable
period will not be adjusted and profit or other comprehensive income will be retrospectively adjusted
based on the difference between the implementation of the new standards on the first day and the
current standards.

116
Notes to Unaudited Interim Financial StatementsFor the six months ended 30 June 2018
RMB
III. MAJOR ACCOUNTING POLICIES AND ACCOUNTING ESTIMATES FOR BUSINESS ENTERPRISES (continued)
33. Change in accounting policies and accounting estimates (continued)
Change in Accounting Policy (continued)
The New Revenue Standard
The New Revenue Standard establishes a new model for recognizing the revenue generated from
contracts with customers. The amount of revenue recognized should reflect the mode in which
the entity transfers goods or services to customers. The amount of revenue should reflect the
amount that the entity is expected to receive due to the transfer of such goods and services to the
customer. At the same time, the New Revenue Standard also regulates the judgments and estimates
for matters such as cost of contract, performance obligation, variable consideration, as well as
principal-versus-agent. The Group only adjusted the cumulative impact of contracts that have not
been completed on 1 January 2018. For changes to contracts that occurred before 1 January 2018,
the Group adopted a simplified treatment method that it identifies the performance obligations
that have been and have not been fulfilled, determines the transaction price, and allocated the
transaction price between fulfilled and outstanding performance obligations for all contracts based
on the final arrangement of contract changes.
Based on the review made for the performed sales contract as at 31 December 2017, the Group is
of the opinion that the practicable expedience approach has no significant impact on the financial
statements of the company. It is because the revenue recognised upon the transfer of risks and
rewards is synchronized with the performance of the obligations in sales contract and a sale contract
of the Group generally involves only one performance obligation.
The impact of implementing the New Revenue Standard by the Group is as follows:
For contracts with the time interval between payments from customers and ownership transfer of
promised goods or services more than a year, the transaction prices of the contracts are adjusted
due to the impact on inclusion of significant financing component.
Where the incremental costs incurred from obtaining contracts are expected to be recoverable, they
will be capitalised as the costs of contracts, and amortised upon recognition of the income from
relevant contracts. However, for contracts with the amortisation term of assets not more than a
year, the incremental costs could be included in the profit or loss for the current period when they
are incurred. Incremental costs mean the costs (such as sales commission) that will not be incurred if
an enterprise fails to obtain a contract.

117BBMG CORPORATION
INTERIM REPORT 2018
Notes to Unaudited Interim Financial StatementsFor the six months ended 30 June 2018
RMB
III. MAJOR ACCOUNTING POLICIES AND ACCOUNTING ESTIMATES FOR BUSINESS ENTERPRISES (continued)
33. Change in accounting policies and accounting estimates (continued)
Change in Accounting Policy (continued)
The New Revenue Standard (continued)
For contracts with variable considerations, the enterprises shall, based on the expected values or
the most likely amounts, determine the best estimate of the variable considerations. However, the
transaction prices that include the variable considerations shall not exceed the amounts that are
most unlikely to have significant reversal for accumulated recognised income when the relevant
uncertainties are eliminated. In assessing whether it is most unlikely to have the significant reversal
for the accumulated recognised income, the enterprises shall consider the possibility and its
proportion of income reversal at the same time.
Below is the effect of the New Revenue Standard on the consolidated balance sheet of the Group
on the date of initial adoption:
Consolidated Balance Sheet
As at 31 December 2017 Carrying amount
Assuming
implementing the
original standard
Impact on
adopting the New
Revenue Standard
Bills receivable and accounts receivable 15,065,293,755.04 15,867,845,894.72 (802,552,139.68)
Long-term receivables 1,186,951,841.33 485,377,872.64 701,573,968.69
Inventories 99,497,005,659.34 98,649,716,753.63 847,288,905.71
Other non-current assets 1,162,211,200.86 1,059,431,952.41 102,779,248.45
Deferred income tax assets 2,999,963,491.58 2,952,009,690.68 47,953,800.90
Receipts in advance 172,958,649.26 27,340,492,780.84 (27,167,534,131.58)
Contract liabilities 19,449,250,034.98 – 19,449,250,034.98
Other non-current liabilities 9,289,742,430.25 660,456,831.52 8,629,285,598.73
Deferred income tax liabilities 4,499,421,069.69 4,473,726,257.58 25,694,812.11
Accrued liabilities 492,059,836.36 464,935,400.17 27,124,436.19
Retained earnings 22,732,463,426.79 22,758,176,658.95 (25,713,232.16)
Minority interests 18,713,898,403.38 18,754,962,137.58 (41,063,734.20)

118
Notes to Unaudited Interim Financial StatementsFor the six months ended 30 June 2018
RMB
III. MAJOR ACCOUNTING POLICIES AND ACCOUNTING ESTIMATES FOR BUSINESS ENTERPRISES (continued)
33. Change in accounting policies and accounting estimates (continued)
Change in Accounting Policy (continued)
The New Revenue Standard (continued)
Material impacts of the new revenue standard on the Group for the period are as follows:
Consolidated Balance Sheet
As at 30 June 2018 Carrying amount
Assuming
implementing the
original standard
Impact on
adopting the New
Revenue Standard
Bills receivable and accounts receivable 16,424,808,133.57 17,000,135,942.33 (575,327,808.76)
Long-term receivables 772,241,633.80 269,222,956.50 503,018,677.30
Inventories 103,328,686,770.34 102,383,661,236.05 945,025,534.29
Other non-current assets 1,784,351,325.83 1,697,667,397.81 86,683,928.02
Deferred income tax assets 3,157,049,532.50 3,115,953,193.91 41,096,338.59
Receipts in advance 191,670,784.18 26,270,850,350.95 (26,079,179,566.77)
Contract liabilities 22,491,291,593.07 – 22,491,291,593.07
Other non-current liabilities 5,280,094,029.40 678,456,831.52 4,601,637,197.88
Deferred income tax liabilities 5,946,878,811.68 5,925,207,829.67 21,670,982.01
Accrued liabilities 535,517,819.93 512,165,286.94 23,352,532.99
Retained earnings 24,371,551,943.76 24,417,189,858.37 (45,637,914.61)
Minority interests 22,047,437,350.21 22,060,075,505.33 (12,638,155.12)

119BBMG CORPORATION
INTERIM REPORT 2018
Notes to Unaudited Interim Financial StatementsFor the six months ended 30 June 2018
RMB
III. MAJOR ACCOUNTING POLICIES AND ACCOUNTING ESTIMATES FOR BUSINESS ENTERPRISES (continued)
33. Change in accounting policies and accounting estimates (continued)
Change in Accounting Policy (continued)
The New Revenue Standard (continued)
Income Statement
For the six months ended
30 June 2018 Carrying amount
Assuming
implementing the
original standard
Impact on
adopting the New
Revenue Standard
Operating revenue 35,365,393,255.98 34,965,862,636.25 399,530,619.73
Operating costs 25,534,771,580.22 25,154,233,296.09 380,538,284.13
Selling expenses 1,163,665,343.18 1,175,497,678.52 (11,832,335.34)
Finance costs 1,363,946,668.03 1,344,456,525.93 19,490,142.10
Income tax expenses 995,656,787.76 992,823,155.55 2,833,632.21
The New Financial Instruments Standard
The New Financial Instruments Standard changes the classification and measurement of financial
assets and defines three categories for measurement: financial assets are measured at amortized
cost; measured at fair value through other comprehensive income; measured at fair value through
profit or loss of the current period. The above classification shall be made by the entity based on
its consideration of its business model and the characteristics of contractual cash flows relating
to the financial assets. Equity investments shall be measured at fair value through profit or loss
of the current period. However, at initial recognition, the Company can elect to measure equity
investments at fair value through other comprehensive income and the election is irrevocable. (Under
this election, only dividends are recognized in profit or loss, and gains or losses on disposal are not
transferred to profit and loss).
The New Financial Instruments Standard requires “expected credit loss” model for recognition and
measurement of impairments in financial assets instead of “objective evidence of impairment”
model. Expected credit loss model is applied in financial assets measured at amortized cost or fair
value through other comprehensive income, loan commitments and financial guarantee contracts.
On the day of initial implementation, the comparison of financial assets that are classified and
measured in accordance with the recognition and measurement standards for financial instruments
before and after amendments is as follows:

120
Notes to Unaudited Interim Financial StatementsFor the six months ended 30 June 2018
RMB
III. MAJOR ACCOUNTING POLICIES AND ACCOUNTING ESTIMATES FOR BUSINESS ENTERPRISES (continued)
33. Change in accounting policies and accounting estimates (continued)
Change in Accounting Policy (continued)
The New Financial Instruments Standard (continued)
The Group
Recognition and measurement standards for
financial instruments before amendment
Recognition and measurement standards for
financial instruments after amendment
Measurement category Carrying amount Measurement category Carrying amount
Bills receivables and accounts receivables At amortised cost (loans
and receivables)
15,065,293,755.04 At amortised cost 15,254,140,090.78
Long-term receivables At amortised cost (loans
and receivables)
1,186,951,841.33 At amortised cost 1,164,859,634.57
Other receivables At amortised cost (loans
and receivables)
5,890,424,799.29 At amortised cost 5,838,085,078.24
Equity investment Measured at fair value
through other
comprehensive income
(assets available for sale)
2,309,736,754.00 Measured at fair value
through profit or loss (as
per the requirements of
the standard)
1,730,252,400.00
Measured at fair value
through other
comprehensive income
(designated)
579,484,354.00
Wealth management products Measured at fair value
through other
comprehensive income
(assets available for sale)
588,151,110.39 Measured at fair value
through profit or loss (as
per the requirements of
the standard)
588,151,110.39

121BBMG CORPORATION
INTERIM REPORT 2018
Notes to Unaudited Interim Financial StatementsFor the six months ended 30 June 2018
RMB
III. MAJOR ACCOUNTING POLICIES AND ACCOUNTING ESTIMATES FOR BUSINESS ENTERPRISES (continued)
33. Change in accounting policies and accounting estimates (continued)
Change in Accounting Policy (continued)
The New Financial Instruments Standard (continued)
On the day of initial implementation, the reconciliation between the original carrying value of
financial assets and the adjusted new carrying value of financial assets classified and measured
in accordance with the recognition and measurement standards for financial instruments after
amendment is as follows:
Carrying amount
according to the
original financial
instruments
standard as at
31 December 2017 Reclassification Remeasurement
Carrying amount
according to the
New Financial
Instruments
Standard as at
1 January 2018
Financial assets measured at amortised costs
Bills receivable and accounts receivable
Balance presented according to original financial instruments standard 15,065,293,755.04
Remeasurement: provision for expected credit loss 166,754,128.98
Reclassification: provision for the long-term portion of expected credit
loss 22,092,206.76
Balance presented according to New Financial Instruments Standard 15,254,140,090.78
Long-term receivables
Balance presented according to original financial instruments standard 1,186,951,841.33
Reclassification (22,092,206.76)
Balance presented according to New Financial
Instruments Standard 1,164,859,634.57
Other receivables
Balance presented according to original financial instruments standard 5,890,424,799.29
Remeasurement: provision for expected credit loss (52,339,721.05)
Balance presented according to New Financial
Instruments Standard 5,838,085,078.24
Total financial assets measured at amortised costs 22,142,670,395.66 22,257,084,803.59

122
Notes to Unaudited Interim Financial StatementsFor the six months ended 30 June 2018
RMB
Carrying amount
according to the
original financial
instruments
standard as at
31 December 2017 Reclassification Remeasurement
Carrying amount
according to the
New Financial
Instruments
Standard as at
1 January 2018
Available-for-sale financial assets
Balance presented according to original financial instruments standard 2,897,887,864.39
Less: Tr ansfer to financial assets measured at fair value through
other comprehensive income-equity instruments
(New Financial Instruments Standard) (579,484,354.00)
Less: Tr ansfer to financial assets measured at fair value through profit
or loss (New Financial Instruments Standard) (2,318,403,510.39)
Balance presented according to New Financial Instruments Standard –
Financial assets measured at fair value through other
comprehensive income
Investment in other equity instruments
Amount presented according to original financial instruments standard –
Reclassification 579,484,354.00
Amount presented according to New Financial Instruments Standard 579,484,354.00
Financial assets measured at fair value through profit or loss
Amount presented according to original financial instruments standard 46,226,108.99
Reclassification 2,318,403,510.39
Amount presented according to New Financial Instruments Standard 2,364,629,619.38
III. MAJOR ACCOUNTING POLICIES AND ACCOUNTING ESTIMATES FOR BUSINESS ENTERPRISES (continued)
33. Change in accounting policies and accounting estimates (continued)
Change in Accounting Policy (continued)
The New Financial Instruments Standard (continued)

123BBMG CORPORATION
INTERIM REPORT 2018
Notes to Unaudited Interim Financial StatementsFor the six months ended 30 June 2018
RMB
On the day of initial implementation, the reconciliation between the impairment provision of original
financial assets as at 31 December 2017 and the adjusted new impairment provision of financial
assets classified and measured in accordance with the standards for financial instruments after
amendment is as follows:
Measurement category
Provision for loss made according to
the original financial instruments
standard Reclassification Remeasurement
Provision for loss made according to the New Financial
Instruments Standard
Loans and receivables (original financial instruments standard)/Financial assets measured at amortised costs (New Financial Instruments Standard)
Bill receivable and accounts receivable, Long-term receivables 2,420,720,346.67 – (166,754,128.98) 2,253,966,217.69
Other receivables 1,284,733,038.50 – 52,339,721.05 1,337,072,759.55
Total 3,705,453,385.17 – (114,414,407.93) 3,591,038,977.24
Presentation of financial statement
In accordance with the “Notice on the Revision of the Issuance of the Financial Statements of
General Enterprises for the year 2018” (Accounting [2018] No. 15) (《關於修訂印發截至2018年度
一般企業財務報表格式的通知》(財會[2018]15號)), except for the presentation changes of financial
statements resulted from the implementation of the New Financial Instruments Standard and the
New Revenue Standard mentioned above, the Group consolidated the “bills receivable” and “accounts
receivables” to the newly added “bills receivable and accounts receivables” item, consolidated
the “dividends receivable” and “interest receivable” to “other receivables”, consolidated the
“liquidation of fixed assets” to the “fixed assets” item, consolidated the “construction material” to
the “construction in progress” item, consolidated the “bills payable” and “accounts payables” to
the newly added “bills payable and accounts payables” item, consolidated the “specific payable”
to the “long-term payables” item, and the “research and development expenses” item is split from
the “administrative expenses” item in the income statement, the “interest expense” and “interest
income” are split from the “financial expenses” item; the “change in the defined benefit plan
carried forward to retained earnings” item was added to the statement of changes in equity and the
Group restated the comparative period statement accordingly. This change in accounting policy has
no impact on the merger and the Company’s net profit and shareholders’ equity.
III. MAJOR ACCOUNTING POLICIES AND ACCOUNTING ESTIMATES FOR BUSINESS ENTERPRISES (continued)
33. Change in accounting policies and accounting estimates (continued)
Change in Accounting Policy (continued)
The New Financial Instruments Standard (continued)

124
Notes to Unaudited Interim Financial StatementsFor the six months ended 30 June 2018
RMB
IV. TAXATION
(1) Major categories of taxes and respective tax rates
Value-added tax (“VAT”): Before 1 May 2018, the VAT payable is determined by
the output VAT calculated based on the taxable revenue
from general taxpayers at the tax rate of 17% and the
output VAT calculated based on the taxable revenue
from the modern services industry at the tax rate of 6%
less the deductible input VAT for the current period; for
small-scale taxpayers, VAT is levied based on the sales
revenue at the tax rate of 3%; for the concrete industry,
VAT is levied based on the sales revenue at a simplified
tax rate of 6%. For financial leasing companies, VAT
is levied based on the rental income at a simplified tax
rate of 6%. For the sale of immovables of property
developers, the VAT payable is determined by the
output VAT calculated based on the taxable revenue
from general taxpayers at the tax rate of 11% less the
deductible input VAT for the current period, and those
general taxpayers who are eligible under the Transition
Policy may choose to be levied at the simplified rate
of 5%. The rate of VAT for tourism and entertainment
service, and food and beverage and accommodation
service is 6%, and that for immovable leasing service is
11%. Subsequent to 1 May 2018, the VAT payable is
determined by the output VAT calculated based on the
taxable revenue from general taxpayers at the tax rate
of 16% less the deductible input VAT for the current
period.
City maintenance and construction tax: It is levied at 7%, 5% and 1% of net VAT and business
tax paid.
Education surcharge: It is levied at 3% of net VAT and business tax paid.

125BBMG CORPORATION
INTERIM REPORT 2018
Notes to Unaudited Interim Financial StatementsFor the six months ended 30 June 2018
RMB
IV. TAXATION (continued)
(1) Major categories of taxes and respective tax rates (continued)
Property tax: It is levied based on the values of properties owned
or used by the Group at the percentages prescribed
by the tax laws. The tax of self-occupied properties is
levied according to the values of the properties at an
annual tax rate of 1.2%, which is calculated and paid
based on the original value of the property less 10%
– 30% of that value; the tax of lease out properties is
levied according to the rent at an annual tax rate of
12%, which is calculated and paid based on the rental
income.
Vehicle and vessel tax: It is levied by number for passenger vehicles and by
tonnage for trucks on vehicles owned or managed by
the Group.
Urban land use tax: It is levied based on the land areas occupied by the
Group for production and operations, at the annual tax
amount per sq.m. for the respective land use tax levels
prescribed by local governments.
Individual income tax: Individual income tax is withheld and paid under the tax
laws based on salaries and other personal incomes paid
to employees of the Group.
Land appreciation tax: It is levied at four-level excess progressive tax rates
ranging from 30% to 60% on the appreciation of
land value for any land use right and buildings on the
ground or other structures annexed thereto from which
VAT arises as a result of the transfer of ownership by
the Group at a consideration.
Resource tax: Under the relevant tax laws of the PRC, it is levied to
the minerals exploited by the Group on a quantity basis
or price basis.
Corporate income tax: Except for the corporate income tax of BBMG Hong
Kong Limited and Jidong Development (HK) International
Ltd levied at the rate of 16.5% based on the taxable
profits and the income tax concessions entitled to by
some of the enterprises comprising the Group as below,
the Group’s corporate income tax is levied at the tax
rate of 25% based on the taxable profit.

126
Notes to Unaudited Interim Financial StatementsFor the six months ended 30 June 2018
RMB
IV. TAXATION (continued)
(2) Tax preferences
1. Value-added tax (VAT)
Certain subsidiaries of the Group are entitled to the following VAT preferences:
(1) In accordance with the Notice concerning the Issuance of “Directory of Value-added
Tax Concessions on Comprehensive Utilisation of Goods and Services” (《關於印
發<資源綜合利用產品和勞務增值稅優惠目錄>的通知》) (Cai Shui [2015] No. 78)
promulgated by Ministry of Finance and State Administration of Taxation of the PRC
with effect from 1 July 2015, some of the Company’s subsidiaries engaged in cement
production enjoy 70% VAT refund upon collection preferential policy in respect of
their eligible cement products.
(2) In accordance with the requirements of the Notice on Issuing the Catalogue of Value-
Added Tax Preferences for Products and Labor Services Involving the Comprehensive
Utilization of Resources (《關於印發〈資源綜合利用產品和勞務增值稅優惠目錄〉的通知》)
(Cai Shui [2015] No. 78) with effect from 1 July 2015, a minor portion of products
of BBMG Mortar Co., Ltd., being a subsidiary of the Group, meet the requirement of
Comprehensive Utilization of Resources, making these products be able to enjoy 70%
VAT refund.
(3) In accordance with the requirements of the Notice concerning the Value-added Tax
Policy for Novel Wall Materials (《關於新型牆體材料增值稅政策的通知》) (Cai Shui
[2015] No. 73), Beijing Jinyu Aerated Concrete Co., Ltd. and Tangshan Jinyu Aerated
Concrete Co., Ltd., both being the Group’ s subsidiaries, enjoy 50% VAT refund upon
collection preferential policy in respect of their eligible novel wall materials.
(4) In accordance with the requirements of the Notice on Preferential Policies on Value-
Added Tax, Real Estate Tax and Urban Land Use Tax for Heat Supply Enterprises (Cai
Shui [2016] No. 94), Beijing Jinhaiyan Property Management Co., Ltd. and BBMG
Dacheng Property Management Co., Ltd., both being the Group’ s subsidiaries, enjoy
the VAT exemption for heating fee income obtained from supplying heat for resident
individuals by heat supply enterprises upon the end of the heat supply period from 1
January 2016 to 2018.
(5) In accordance with the financial and tax documents, the products of Beijing Bio-
Island Science and Technology Co., Ltd., a subsidiary of the Group, compile with the
qualification of products involving comprehensive utilisation of resources produced by
using waste lead-acid batteries, and enjoys 50% (for industrial oil produced by waste
mineral oil, such as lube base oil, gasoline and diesel) VAT refund upon collection
preferential policy.

127BBMG CORPORATION
INTERIM REPORT 2018
Notes to Unaudited Interim Financial StatementsFor the six months ended 30 June 2018
RMB
IV. TAXATION (continued)
(2) Tax preferences (continued)
1. Value-added tax (VAT) (continued)
(6) In accordance with the Notice of the State Administration of Taxation of the PRC
concerning Temporary Exemption of Value-added Tax and Business Tax of Some
Small and Micro-Enterprises (《國家稅務總局關於暫免徵收部分小微企業增值稅和營
業稅的通知》) (Cai Shui [2013] No. 52), BBMG Human Resources Management Co.,
Ltd., a subsidiary of the Group, enjoys the VAT exemption for an enterprise or non-
enterprise organisation with monthly sales amount of no more than RMB20,000
within smallscale VAT tax payers.
(7) Under the project cooperation agreement entered into with the Management
Committee of Tianjin Dongjiang Free Trade Zone (天津東疆保稅港區管理委員會),
BBMG Finance Lease Co., Ltd., a subsidiary of the Group, enjoys a tax preference
policy implemented by the tax authority in the Dongjiang Free Trade Zone, pursuant
to which actual tax burden exceeding 3% will be entitled to VAT refund upon
collection in accordance with the Notice concerning the Incorporation of the Railway
Transportation Industry and the Postal Industry into the Pilot Program of Levying
Value-added Tax in lieu of Business Tax (《關於將鐵路運輸和郵政業納入營業稅改增值
稅試點的通知》) (Cai Shui [2013] No. 106). In addition, in accordance with the Notice
of Tianjin Finance Bureau, Tianjin Municipal Office, SAT and Tianjin Local Taxation
Bureau on Relevant Issues concerning Transitional Financial Subsidy for Pilot Program
of Levying Value-added Tax in lieu of Business Tax (《天津市財政局天津市國家稅務
局天津市地方稅務局關於營業稅改增值稅試點過渡性財政扶持資金申請撥付問題的
通知》) (Jin Cai Shui Zheng [2013] No. 1), if the tax burden of VAT after the reform
from business tax to value-added tax (“ B2V Reform” ) is greater than that of business
tax before B2V Reform, the financial subsidy for the increased tax burden will be
executed according to the relevant requirements of the above documents. Pursuant
to the agreement, the Dongjiang Free Trade Zone would undertake 70% of turnover
tax from 2015 to 2020 supported by the preferential policies.

128
Notes to Unaudited Interim Financial StatementsFor the six months ended 30 June 2018
RMB
IV. TAXATION (continued)
(2) Tax preferences (continued)
1. Value-added tax (VAT) (continued)
(8) According to the requirements of Appendix 3 Requirements of the Transition Policy
for the Pilot Program of Levying Value-added Tax in lieu of Business Tax (《營業稅改徵
增值稅試點過渡政策的規定》) of the Notice concerning the Overall Implementation of
the Pilot Program of Levying Value-added Tax in lieu of Business Tax (《關於全面推開
營業稅改徵增值稅試點的通知》) (Cai Shui [2016] No. 36), in respect of borrowing and
lending business, the interests charged on BBMG Finance Co., Ltd., a subsidiary of
the Group, at the borrowing interest rates not higher than those paying to financial
institutions or the coupon rate of bonds paid are exempted from VAT.
(9) In accordance with the requirements of the Notice of the Ministry of Finance and
the State Administration of Taxation on Value-added Tax Policies for Software
Products(《財政部國家稅務總局關於軟件產品增值稅政策的通知》) (Cai Shui [2011] No.
100), Tangshan Dunshi Information and Technology Co., Ltd. enjoys the preferential
VAT policy of refund in respect of the portion exceeding the 3% actual VAT bearing
ratio upon VAT payment at a tax rate of 17%.
2. Resource tax
In accordance with the Notice on Issues on Specific Policies on the Reform of Resource Tax
(Cai Shui [2016] No. 54), Bo’ai BBMG Cement Co., Ltd. has adopted relevant requirements
concerning the VAT exemption of co-existing minerals that for mining and selling of co-
existing minerals by taxpayers, the sales amounts of main minerals and co-existing minerals
products shall be handled separately in accounting and the resource tax for co-existing
minerals shall be temporarily exempted in order to promote the comprehensive utilization of
co-existing minerals.

129BBMG CORPORATION
INTERIM REPORT 2018
Notes to Unaudited Interim Financial StatementsFor the six months ended 30 June 2018
RMB
IV. TAXATION (continued)
(2) Tax preferences (continued)
3. Corporate income tax
Certain subsidiaries of the Group enjoy the following corporate income tax preferences:
(1) Certain subsidiaries of the Group are certified as high-tech enterprises by relevant
governmental authorities and enjoy a preferential corporate income tax rate of
15% for high-tech enterprises pursuant to the implementation rules of the Law on
Enterprise Income Tax of the People’s Republic of China and the Notice of the State
Administration of Taxation of the PRC regarding Income Tax Preferences for High-
tech Enterprises (《國家稅務總局關於高新技術企業所得稅優惠有關問題的通知》).
Such subsidiaries include Tongda Refractory Technology Co., Ltd., Gongyi Tongda
Zhongyuan Refractory Technology Co., Ltd., Gongyi Tongda Zhongyuan Refractory
Testing Center Co., Ltd., Beijing Building Material Testing Academy Co., Ltd., Beijing
Building Materials Academy Co., Ltd., Beijing Jiandu Design and Research Institute
Co., Ltd., Beijing Alavus Building Energy Saving Components Co., Ltd., Beijing BBMG
Liushui Environmental Protection Technology Co., Ltd., Beijing BBMG Cement Energy
Saving Technology Co., Ltd., Beijing BBMG Mangrove Environmental Protection
Technology Co., Ltd., Hebei BBMG Mangrove Environmental Protection Technology
Co., Ltd., BBMG Mortar Co., Ltd., Beijing Bio-Island Science and Technology Co.,
Ltd., Beijing Dynea Chemical Industry Co., Ltd., Beijing Sanchong Mirror (Dachang)
Co., Ltd., Beijing Tintan Ma Jencia Seats Co., Ltd. (北京天壇瑪金莎座椅有限公司),
Beijing Jinyu Energy-Saving Materials & Technology (Dachang) Co., Ltd., Dachang
BBMG Coating, Tianjin Keheng New Building Material Co., Ltd., and Tangshan Dunshi
Electric Gas Co., Ltd.
(2) In accordance with the Indices on Income Tax Preferential Policies for Enterprises
engaging in Environmental Protection as well as Energy and Water Saving Projects
(《環境保護 、節能節水項目企業所得稅優惠政策目錄》), Qinyang BBMG Cement Co.,
Ltd. enjoys the preferential corporate income tax policy of “three-year exemption and
three-year 50% reduction” from 1 January 2014 to 31 December 2019.
(3) BBMG Human Resources Management Co., Ltd. enjoys tax preferences concerning
small and thin profit enterprises stipulated by the State Administration of Taxation of
the PRC, and are subject to corporate income tax at a rate of 15%.

130
Notes to Unaudited Interim Financial StatementsFor the six months ended 30 June 2018
RMB
IV. TAXATION (continued)
(2) Tax preferences (continued)
3. Corporate income tax (continued)
(4) In accordance with the Indices on Income Tax Preferential Policies for Enterprises
engaging in Environmental Protection as well as Energy and Water Saving Projects (《環
境保護 、節能節水項目企業所得稅優惠政策目錄》), Guangling BBMG Cement enjoys
the preferential corporate income tax policy of “three-year exemption and three-year
50% reduction” from 1 January 2016 to 31 December 2021.
(5) Pursuant to the Notice on the Issues concerning the Taxation Policies for Deepening
the Implementation of the Western Development Strategy (《關於深入實施西部大開
發戰略有關稅收政策問題的通知》) (Cai Shui [2011] No. 58) and the Announcement
No. 12, 2012 of the State Administration of Taxation on the Corporate Income Tax in
relation to Deepening the Implementation of the Western Development Strategy (《關
於深入實施西部大開發戰略有關企業所得稅問題的公告》), Inner Mongolia Yili Jidong
Cement Co., Ltd., Baotou Jidong Cement Co., Ltd., Jidong Cement Bishan Co.,
Ltd., Shaanxi Jidong Logistics Services Co., Ltd., Jidong Cement Fengxiang Co., Ltd.,
Chongqing Jushi New Building Material Co., Ltd., Sin Heng Chan (Chongqing) Co.,
Ltd., Jidong Cement Chongqing Concrete Co., Ltd., Mizhi Jidong Cement Co., Ltd.
were subject to corporate income tax at rate of 15% after obtaining the approval
from the competent tax authorities; according the Paragraph 2, Article 28, the Law
on Enterprise Income Tax of the People’s Republic of China, Tangshan Jidong Cement
Additive Co., Ltd. and Tangshan Dunshi Dry powder Building Material Co., Ltd.
enjoyed a reduced 15% corporate income tax rate under the key support policies for
High-Tech Enterprises by the country.
V. NOTES TO KEY ITEMS OF CONSOLIDATED FINANCIAL STATEMENTS
1. Cash and bank balances
30 June 2018 31 December 2017
Cash in stock 3,292,287.37 908,870.81
Bank deposits 14,770,055,002.72 16,157,596,409.79
Other monetary fund 1,719,833,652.18 516,903,909.35
Statutory deposit reserve placement with central
bank by finance company 1,187,510,266.59 1,228,437,954.77
17,680,691,208.86 17,903,847,144.72

131BBMG CORPORATION
INTERIM REPORT 2018
Notes to Unaudited Interim Financial StatementsFor the six months ended 30 June 2018
RMB
V. NOTES TO KEY ITEMS OF CONSOLIDATED FINANCIAL STATEMENTS
(continued)
1. Cash and bank balances (continued)
Including the following monetary fund with restrictions:
30 June 2018 31 December 2017
Monetary fund for collateral:
Statutory deposit reserve placement with central
bank by finance company 1,187,510,266.59 1,228,437,954.77
Deposits for letter of credit 275,728,496.49 59,308,277.04
Quality/performance guarantees 61,408,568.85 117,009,520.57
Deposits for acceptance bills 1,250,310,777.57 177,489,541.28
Other monetary fund with restrictions:
Restricted part of property pre-sale funds 3,096,676,915.04 3,245,141,712.81
Others 132,685,809.27 162,373,334.78
6,004,320,833.81 4,989,760,341.25
As at 30 June 2018, the Group’s monetary fund deposited overseas amounted to RMB85,544,277.32
(31 December 2017: RMB32,669,894.86).
Interest income is generated from current savings as determined by the interest rate for the savings
in banks. Short-term time deposits with durations from 7 days to 3 months are made in accordance
with the Group’s need for cash, with interest income generated according to the respective time
deposit interest rates.
2. Financial assets at fair value through profit or loss
31 December 2017
Financial assets held for trading
Equity instrument investment 46,226,108.99
As at 31 December 2017, such equity instrument investment mainly referred to the market value
of the tradable shares of China Resources and Environment (stock code: 600217) held by Tangshan
Jidong Cement Co., Ltd. (hereinafter referred to as “Jidong Cement”), as at such date.

132
Notes to Unaudited Interim Financial StatementsFor the six months ended 30 June 2018
RMB
V. NOTES TO KEY ITEMS OF CONSOLIDATED FINANCIAL STATEMENTS
(continued)
3. Financial assets held for trading
30 June 2018
Gains/(loss)
recognised during
the period
Financial assets at fair value through profit or loss
Wealth management products 1,306,841,102.67 5,853,992.28
Equity instrument investment 43,300,012.18 (2,926,096.81)
1,350,141,114.85 2,927,895.47
As at 30 June 2018, wealth management products referred to monetary fund held by BBMG Finance
Co., Ltd.; while equity instrument investment referred to the fair value of shares of China Resources
and Environment held by Jidong Cement and shares of Bank of Communications held by Jidong
Development Group Co., Ltd..
4. Bills receivable and accounts receivable
30 June 2018 31 December 2017
Bills receivable (1) 7,837,252,103.41 8,181,663,835.79
Accounts receivable (2) 11,027,714,532.05 10,106,902,405.60
18,864,966,635.46 18,288,566,241.39
Less: Provision for bad debts 2,440,158,501.89 2,420,720,346.67
16,424,808,133.57 15,867,845,894.72

133BBMG CORPORATION
INTERIM REPORT 2018
Notes to Unaudited Interim Financial StatementsFor the six months ended 30 June 2018
RMB
V. NOTES TO KEY ITEMS OF CONSOLIDATED FINANCIAL STATEMENTS
(continued)
4. Bills receivable and accounts receivable (continued)
(1) Bills receivable
30 June 2018 31 December 2017
Bank acceptance bills 6,781,791,199.53 6,902,433,880.50
Commercial acceptance bills 1,055,460,903.88 1,279,229,955.29
7,837,252,103.41 8,181,663,835.79
Bills receivable endorsed or discounted but not yet due at the balance sheet date are as
follows:
30 June 2018 31 December 2017
Derecognised
Not
derecognised Derecognised
Not
derecognised
Bank acceptance bills 7,937,522,266.63 2,429,933,349.82 3,547,596,983.95 3,411,269,211.02
Commercial acceptance bills – 395,937,052.37 – 345,743,510.81
7,937,522,266.63 2,825,870,402.19 3,547,596,983.95 3,757,012,721.83
As at 30 June 2018, bank acceptance bills pledged to secure bank borrowings amounted to
RMB5,800,000.00 (31 December 2017: RMB5,300,000.00), details of which are set out in
note V. 67.
As at the balance sheet date, there was no transfer of bills receivable into accounts
receivable due to default on the part of the drawer.

134
Notes to Unaudited Interim Financial StatementsFor the six months ended 30 June 2018
RMB
V. NOTES TO KEY ITEMS OF CONSOLIDATED FINANCIAL STATEMENTS
(continued)
4. Bills receivable and accounts receivable (continued)
(2) Accounts receivable
The credit periods of accounts receivable from external third parties are generally 1 to 6
months and amounts due from related parties have no fixed terms of repayment. Accounts
receivable are non-interest bearing.
An aging analysis of the accounts receivable is as follows:
30 June 2018 31 December 2017
Within 1 year (inclusive of 1 year) 6,353,416,189.84 5,594,236,704.72
1 to 2 years (inclusive of 2 years) 1,885,689,147.78 1,893,391,337.30
2 to 3 years (inclusive of 3 years) 967,454,682.55 998,531,700.06
3 to 4 years (inclusive of 4 years) 713,172,610.23 667,986,707.04
4 to 5 years (inclusive of 5 years) 357,081,790.51 387,965,394.02
Over 5 years 750,900,111.14 564,790,562.46
11,027,714,532.05 10,106,902,405.60
Less: Pr ovision for bad debts of accounts
receivable 2,440,158,501.89 2,420,720,346.67
8,587,556,030.16 7,686,182,058.93
The movements in provision for bad debts of bills receivable and accounts receivable are as
follows:
30 June 2018 31 December 2017
Balance at the end of the previous year 2,420,720,346.67 2,250,876,050.03
Effect of change in accounting policy (188,846,335.74) –
Opening balance for the period/year 2,231,874,010.93 2,250,876,050.03
Provision for the period/year 134,679,988.89 550,190,679.03
Transferred in upon acquisition of subsidiaries 219,885,802.98 42,894.45
Transferred out for the period (103,649.00) –
Reversal for the period/year (140,353,265.16) (355,573,980.57)
Write-off for the period/year (5,824,386.75) (24,815,296.27)
Closing balance for the period/year 2,440,158,501.89 2,420,720,346.67

135BBMG CORPORATION
INTERIM REPORT 2018
Notes to Unaudited Interim Financial StatementsFor the six months ended 30 June 2018
RMB
V. NOTES TO KEY ITEMS OF CONSOLIDATED FINANCIAL STATEMENTS
(continued)
4. Bills receivable and accounts receivable (continued)
(2) Accounts receivable (continued)
30 June 2018
Gross carrying amount Provision for bad debts
Amount Proportion
(%)
Amount Proportion
(%)
Subject to separate provision for bad
debts 1,229,568,481.13 11.15 215,729,588.30 17.55
Provision for bad debts by credit risk
characteristics group 9,798,146,050.92 88.85 2,224,428,913.59 22.70
11,027,714,532.05 100.00 2,440,158,501.89
The provision for bad debt of accounts receivable determined by the Group based on the
aging analysis is as follows:
30 June 2018
Gross carrying
amount estimated
to be in default
Expected credit
loss rate
Lifetime expected
credit loss
Within 1 year (inclusive of 1 year) 5,917,932,217.08 2.91 172,473,203.36
1 to 2 years (inclusive of 2 years) 1,585,374,894.81 18.53 293,694,619.74
2 to 3 years (inclusive of 3 years) 741,324,953.80 49.17 364,478,991.65
3 to 4 years (inclusive of 4 years) 556,650,360.72 71.30 396,918,474.33
4 to 5 years (inclusive of 5 years) 317,763,411.74 100.00 317,763,411.74
Over 5 years 679,100,212.77 100.00 679,100,212.77
9,798,146,050.92 2,224,428,913.59

136
Notes to Unaudited Interim Financial StatementsFor the six months ended 30 June 2018
RMB
V. NOTES TO KEY ITEMS OF CONSOLIDATED FINANCIAL STATEMENTS
(continued)
4. Bills receivable and accounts receivable (continued)
(2) Accounts receivable (continued)
31 December 2017
Gross carrying amount Provision for bad debts
Amount Proportion
(%)
Amount Proportion
(%)
Individually significant and subject to
separate provision for bad debts 165,916,230.92 1.64 95,292,154.85 57.43
Provision for bad debts by credit risk
characteristics group
Within 1 year (inclusive of 1 year) 5,554,791,184.63 54.96 – –
1 to 2 years (inclusive of 2 years) 1,622,133,911.48 16.05 486,609,621.86 30.00
2 to 3 years (inclusive of 3 years) 799,332,777.79 7.91 479,599,666.68 60.00
3 to 4 years (inclusive of 4 years) 496,762,500.50 4.92 422,248,125.69 85.00
4 to 5 years (inclusive of 5 years) 297,619,135.91 2.94 297,619,135.91 100.00
Over 5 years 507,630,233.09 5.02 507,630,233.09 100.00
9,278,269,743.40 91.80 2,193,706,783.23
Provision for bad debts by special credit
characteristics group 324,402,353.52 3.21 – –
Individually not significant but subject to
separate provision for bad debts 338,314,077.76 3.35 131,721,408.59 38.93
10,106,902,405.60 100.00 2,420,720,346.67

137BBMG CORPORATION
INTERIM REPORT 2018
Notes to Unaudited Interim Financial StatementsFor the six months ended 30 June 2018
RMB
V. NOTES TO KEY ITEMS OF CONSOLIDATED FINANCIAL STATEMENTS
(continued)
4. Bills receivable and accounts receivable (continued)
(2) Accounts receivable (continued)
As at 31 December 2017, accounts receivable which were individually significant and subject
to separate provision for bad debts were as follows:
Gross carrying
amount
Provision for
bad debts
Percentage of
Provision
(%)
Reasons
Unit 1 78,993,168.64 61,474,662.37 77.82 Partly uncollectible
Unit 2 51,900,000.00 15,570,000.00 30.00 Partly uncollectible
Unit 3 17,538,494.30 762,924.50 4.35 Partly uncollectible
Unit 4 17,484,567.98 17,484,567.98 100.00 Uncollectible
165,916,230.92 95,292,154.85
As at 31 December 2017, reversal of provision for bad debts of individually significant
accounts receivable or recovery of individually significant accounts receivable are as follows:
Reasons for
reversal
Basis of
determining the
original provisions
for bad debts
Accumulated
amount of
provision
for bad debts
before recovery
Reversal
amount
Unit 5 Payment for goods
received
Aging analysis 6,171,287.23 6,171,287.23
Unit 6 Payment for goods
received
Individual
identification
2,576,860.17 2,576,860.17
Unit 7 Payment for goods
received
Individual
identification
1,509,870.50 1,509,870.50
Unit 8 Payment for goods
received
Individual
identification
25,925.82 25,925.82
10,283,943.72 10,283,943.72

138
Notes to Unaudited Interim Financial StatementsFor the six months ended 30 June 2018
RMB
V. NOTES TO KEY ITEMS OF CONSOLIDATED FINANCIAL STATEMENTS
(continued)
4. Bills receivable and accounts receivable (continued)
(2) Accounts receivable (continued)
As at 30 June 2018, the top 5 of accounts receivable were as follows:
Balance
Proportion in total
accounts receivable
(%)
Balance of provision
for bad debts as at
the end of the period Net amount
Unit 9 138,183,606.28 1.25 43,005,099.65 95,178,506.63
Unit 10 99,390,666.20 0.90 – 99,390,666.20
Unit 11 93,476,055.80 0.85 – 93,476,055.80
Unit 12 82,520,145.87 0.75 – 82,520,145.87
Unit 1 80,213,849.30 0.73 63,889,923.80 16,323,925.50
493,784,323.45 4.48 106,895,023.45 386,889,300.00
As at 31 December 2017, the top 5 of accounts receivable were as follows:
Balance
Proportion in total
accounts receivable
Balance of provision
for bad debts as at
the end of the year Net amount
(%)
Unit 9 148,478,348.34 1.47 68,000,805.28 80,477,543.06
Unit 1 80,756,418.64 0.80 63,094,799.87 17,661,618.77
Unit 13 67,815,547.49 0.67 – 67,815,547.49
Unit 14 55,938,329.62 0.55 110,694.02 55,827,635.60
Unit 15 53,936,074.01 0.53 44,459,489.91 9,476,584.10
406,924,718.10 4.02 175,665,789.08 231,258,929.02
F o r the s i x months ended 30 June 2018, p rov i s ion fo r bad debts amounted to
RMB134,679,988.89 (2017: RMB550,190,679.03), and provision for bad debts recovered or
reversed amounted to RMB140,353,265.16 (2017: RMB355,573,980.57). The actual amount
of accounts receivable written-off was RMB5,824,386.75 (2017: RMB24,815,296.27).
For the transfer of bills receivable, please refer to Note VIII. 2.

139BBMG CORPORATION
INTERIM REPORT 2018
Notes to Unaudited Interim Financial StatementsFor the six months ended 30 June 2018
RMB
V. NOTES TO KEY ITEMS OF CONSOLIDATED FINANCIAL STATEMENTS
(continued)
5. Prepayments
An aging analysis of prepayments is as follows:
30 June 2018 31 December 2017
Gross carrying
amount
Proportion
(%)
Gross carrying
amount
Proportion
(%)
Within 1 year (inclusive) 1,886,783,407.07 91.97 1,618,250,818.14 88.17
1 to 2 years (inclusive) 54,656,555.91 2.66 113,738,152.85 6.20
2 to 3 years (inclusive) 48,643,507.57 2.37 28,337,468.54 1.54
Over 3 years 61,531,452.73 3.00 75,134,002.97 4.09
2,051,614,923.28 100.00 1,835,460,442.50 100.00
Less: Provision for bad debts
of prepayments 13,084,480.22 43,106,152.03
2,038,530,443.06 1,792,354,290.47
As at 30 June 2018, the significant prepayments aging over 1 year were as follows:
Aging Amount
Percentage
of total
prepayments
Reasons for being
not yet settled in time
Unit 16 1-2 years 9,718,872.87 0.47% Transaction not yet completed
Unit 17 1-2 years 9,996,589.86 0.48% Transaction not yet completed
19,715,462.73
As at 31 December 2017, the significant prepayments aging over 1 year were as follows:
Aging Amount
Percentage
of total
prepayments
Reasons for being
not yet settled in time
Unit 18 1-2 years and 2-3 years 33,079,173.18 1.80% Transaction not yet completed

140
Notes to Unaudited Interim Financial StatementsFor the six months ended 30 June 2018
RMB
V. NOTES TO KEY ITEMS OF CONSOLIDATED FINANCIAL STATEMENTS
(continued)
5. Prepayments (continued)
As at 30 June 2018, the top 5 prepayments were as follows:
Amount
Percentage of
total prepayments
Unit 19 136,310,637.65 6.64%
Unit 20 127,909,668.63 6.23%
Unit 21 56,416,422.30 2.75%
Unit 22 50,000,000.00 2.44%
Unit 23 48,747,764.94 2.38%
419,384,493.52 20.44%
As at 31 December 2017, the top 5 prepayments were as follows:
Amount
Percentage of
total prepayments
Unit 24 262,039,244.70 14.28%
Unit 25 98,603,195.88 5.37%
Unit 26 83,482,264.44 4.55%
Unit 27 33,079,173.18 1.80%
Unit 28 29,569,354.27 1.61%
506,773,232.47 27.61%

141BBMG CORPORATION
INTERIM REPORT 2018
Notes to Unaudited Interim Financial StatementsFor the six months ended 30 June 2018
RMB
V. NOTES TO KEY ITEMS OF CONSOLIDATED FINANCIAL STATEMENTS
(continued)
6. Other receivables
30 June 2018 31 December 2017
Interests receivable 3,562,827.64 1,284,128.69
Dividends receivable 11,071,936.52 10,071,936.52
Deposits 4,642,851,104.19 1,086,461,353.04
Current account with other entities 2,703,460,277.10 1,729,224,573.12
Disbursements previously made 1,368,810,287.31 1,054,864,213.70
Investment receivable 337,297,369.13 1,231,866,805.24
Government grants receivable 150,041,032.17 56,592,224.11
Reserve fund 148,288,119.41 155,567,050.51
Other current account 1,285,595,360.42 1,849,225,552.86
10,650,978,313.89 7,175,157,837.79
Less: Provision for bad debts of other receivables 1,440,430,105.12 1,284,733,038.50
9,210,548,208.77 5,890,424,799.29
An aging analysis of other receivables is as follows:
30 June 2018 31 December 2017
Within 1 year (inclusive) 6,538,546,621.10 3,534,634,238.35
1 to 2 years (inclusive) 1,068,656,663.69 1,240,188,321.88
2 to 3 years (inclusive) 1,194,001,290.41 489,456,704.83
3 to 4 years (inclusive) 346,578,099.06 419,793,430.29
4 to 5 years (inclusive) 380,313,613.50 253,461,395.33
Over 5 years 1,122,882,026.13 1,237,623,747.11
10,650,978,313.89 7,175,157,837.79
Less: Provision for bad debts of other receivables 1,440,430,105.12 1,284,733,038.50
9,210,548,208.77 5,890,424,799.29

142
Notes to Unaudited Interim Financial StatementsFor the six months ended 30 June 2018
RMB
V. NOTES TO KEY ITEMS OF CONSOLIDATED FINANCIAL STATEMENTS
(continued)
6. Other receivables (continued)
The movements in provision for bad debts of other receivables based on lifetime expected credit
losses are as follows:
For the
six months ended
30 June 2018
Balance at the end of the previous year 1,284,733,038.50
Effect of change in accounting policy 52,339,721.05
Opening balance for the period 1,337,072,759.55
Provision for the period 50,378,182.43
Transferred in upon acquisition of subsidiaries 141,409,129.87
Reversal for the period (82,010,304.01)
Write-off for the period (6,419,662.72)
Closing balance for the period 1,440,430,105.12

143BBMG CORPORATION
INTERIM REPORT 2018
Notes to Unaudited Interim Financial StatementsFor the six months ended 30 June 2018
RMB
V. NOTES TO KEY ITEMS OF CONSOLIDATED FINANCIAL STATEMENTS
(continued)
6. Other receivables (continued)
31 December 2017
Gross carrying amount Provision for bad debts
Amount Proportion
(%)
Amount Percentage of provision
(%)
Individually significant and subject to separate
provision for bad debts 1,049,521,502.08 14.63 555,906,061.27 52.97
Provision for bad debts by credit risk
characteristics group
Within 1 year (inclusive) 2,056,603,431.19 28.66 – –
1 to 2 years (inclusive) 176,255,657.72 2.46 52,876,577.32 30.00
2 to 3 years (inclusive) 66,295,002.51 0.92 39,777,001.51 60.00
3 to 4 years (inclusive) 41,323,846.77 0.58 35,123,721.12 85.00
4 to 5 years (inclusive) 49,528,192.06 0.69 49,528,192.06 100.00
Over 5 years 464,503,537.95 6.47 464,503,537.95 100.00
2,854,509,668.20 39.78 641,809,029.96
Provision for bad debts by special credit
characteristics group 3,140,411,904.03 43.77 – –
Individually not significant but subject to
separate provision for bad debts 130,714,763.48 1.82 87,017,947.27 66.57
7,175,157,837.79 100.00 1,284,733,038.50

144
Notes to Unaudited Interim Financial StatementsFor the six months ended 30 June 2018
RMB
V. NOTES TO KEY ITEMS OF CONSOLIDATED FINANCIAL STATEMENTS
(continued)
6. Other receivables (continued)
30 June 2018
Gross carrying amount Provision for bad debts
Amount Proportion
(%)
Amount Percentage of
provision (%)
Individual assessment of
expected credit losses and
provision for bad debts 7,973,476,332.38 74.86 769,085,787.10 9.65
Assessment of expected credit
losses and provision for
bad dets by credit risk
characteristics group 2,677,501,981.51 25.14 671,344,318.02 25.07
10,650,978,313.89 100.00 1,440,430,105.12
As at 31 December 2017, other receivables which were individually significant and subject to
separate provision for bad debts were as follows:
Gross carrying
amount
Provision for
bad debts
Percentage of
provision
(%)
Reasons
Unit 29 193,800,000.00 116,280,000.00 60.00 Partly uncollectible
Unit 30 126,964,897.64 36,569,230.67 28.80 Partly uncollectible
Unit 31 124,595,646.26 6,229,782.31 5.00 Partly uncollectible
Unit 1 116,589,327.25 91,915,165.90 78.84 Partly uncollectible
Other units 487,571,630.93 304,911,882.39 62.54 Partly uncollectible
1,049,521,502.08 555,906,061.27

145BBMG CORPORATION
INTERIM REPORT 2018
Notes to Unaudited Interim Financial StatementsFor the six months ended 30 June 2018
RMB
V. NOTES TO KEY ITEMS OF CONSOLIDATED FINANCIAL STATEMENTS
(continued)
6. Other receivables (continued)
The provision for bad debt of other receivables determined by the Group based on the aging
analysis is as follows:
30 June 2018
Gross carrying
amount
estimated to be
in default
Expected
credit
loss rate
Lifetime
expected
credit loss
Within 1 year (inclusive) 1,763,280,787.39 1% 16,077,947.85
1 to 2 years (inclusive) 243,833,428.48 12% 29,260,011.41
2 to 3 years (inclusive) 68,283,179.52 44% 30,044,598.99
3 to 4 years (inclusive) 21,182,159.83 71% 15,039,333.48
4 to 5 years (inclusive) 45,575,763.99 100% 45,575,763.99
Over 5 years 535,346,662.30 100% 535,346,662.30
2,677,501,981.51 671,344,318.02
For the six months ended 30 June 2018, provision for bad debts amounted to RMB50,378,182.43
(2017: RMB348,610,117.91), and provision for bad debts recovered or reversed amounted to
RMB82,010,304.01 (2017: RMB359,123,810.99). The actual amount of accounts receivable written-
off was RMB6,419,662.72 (2017: RMB20,334,270.23).

146
Notes to Unaudited Interim Financial StatementsFor the six months ended 30 June 2018
RMB
V. NOTES TO KEY ITEMS OF CONSOLIDATED FINANCIAL STATEMENTS
(continued)
6. Other receivables (continued)
As at 30 June 2018,the top 5 of other receivables were as follows:
Closing
balance
Proportion in
total other
receivables Nature Aging
Closing balance
of provision
for bad debts
(%)
Unit 32 396,170,227.56 3.72 Disbursements
previously made
Within 1 year –
Unit 31 237,722,355.94 2.23 Consideration
receivable for equity
transfer and others
Within 1 year,
over 5 years
116,280,000.00
Unit 33 145,045,448.61 1.36 Disbursements
previously made
Within 1 year,
4-5 years
16,800,000.00
Unit 30 126,964,897.64 1.19 General current
borrowings
2-3 years,
4-5 years
36,569,230.67
Unit 1 116,589,327.25 1.09 Current account with
other companies
1-2 years,
3-4 years
91,915,165.90
1,022,492,257.00 9.59 261,564,396.57
As at 31 December 2017, the top 5 of other receivables were as follows:
Closing balance
Proportion in
total other
receivables Nature Aging
Closing balance
of provision
for bad debts
(%)
Unit 34 546,661,460.00 7.62 Consideration receivable
for equity transfer
Within 1 year –
Unit 31 193,800,000.00 2.70 Consideration receivable
for equity transfer
Over 5 years 116,280,000.00
Unit 35 156,701,654.49 2.18 Disbursements previously
made
Within 1 year,
1-2 years
156,701,654.49
Unit 36 134,248,050.00 1.87 Consideration receivable
for equity transfer
Within 1 year,
over 5 years
–
Unit 30 126,964,897.64 1.77 General current
borrowings
1-2 years,
3-4 years
36,569,230.67
1,158,376,062.13 16.14 309,550,885.16

147BBMG CORPORATION
INTERIM REPORT 2018
Notes to Unaudited Interim Financial StatementsFor the six months ended 30 June 2018
RMB
V. NOTES TO KEY ITEMS OF CONSOLIDATED FINANCIAL STATEMENTS
(continued)
6. Other receivables (continued)
As at 30 June 2018, government grants receivable were as follows:
Description of
government grants Amount Aging
Expected time
of receipt
Unit 37 Refunds of VAT 37,608,721.79 Within 1 year 2019
Unit 38 Refunds of VAT 24,396,541.66 Within 1 year 2019
Unit 39 Refunds of VAT 12,885,479.15 Within 1 year 2019
Unit 40 Refunds of VAT 11,459,244.00 Within 1 year 2019
Unit 41 Refunds of VAT 10,929,207.80 Within 1 year 2019
Unit 42 Refunds of VAT 10,720,394.00 Within 1 year 2019
Unit 43 Refunds of VAT 8,133,437.10 Within 1 year 2019
Unit 44 Refunds of VAT 5,952,216.76 Within 1 year 2019
Unit 45 Refunds of VAT 4,962,861.80 Within 1 year 2019
Unit 28 Refunds of VAT 4,304,297.86 Within 1 year 2019
Unit 46 Refunds of VAT 4,103,108.94 Within 1 year 2019
Unit 47 Refunds of VAT 2,932,681.92 Within 1 year 2019
Unit 48 Refunds of VAT 2,654,814.63 Within 1 year 2019
Unit 49 Refunds of VAT 2,237,511.85 Within 1 year 2019
Unit 25 Refunds of VAT 2,027,469.41 Within 1 year 2019
Unit 50 Refunds of VAT 1,583,494.50 Within 1 year 2019
Unit 51 Refunds of VAT 1,295,549.36 Within 1 year 2019
Unit 52 Refunds of VAT 1,222,011.96 Within 1 year 2019
Unit 53 Refunds of VAT 265,999.19 Within 1 year 2019
Unit 54 Refunds of VAT 205,249.61 Within 1 year 2019
Unit 55 Refunds of VAT 129,738.88 Within 1 year 2019
Unit 56 Refunds of VAT 30,000.00 Within 1 year 2019
Unit 57 Refunds of VAT 1,000.00 Within 1 year 2019
150,041,032.17

148
Notes to Unaudited Interim Financial StatementsFor the six months ended 30 June 2018
RMB
V. NOTES TO KEY ITEMS OF CONSOLIDATED FINANCIAL STATEMENTS
(continued)
6. Other receivables (continued)
As at 31 December 2017, government grants receivable were as follows:
Description of
government grants Amount Aging
Expected time
of receipt
Unit 41 Refunds of VAT 38,213,505.08 Within 1 year 2018
Unit 42 Refunds of VAT 9,126,462.14 Within 1 year 2018
Unit 44 Refunds of VAT 2,808,813.48 Within 1 year 2018
Unit 58 Refunds of VAT 2,236,400.86 Within 1 year 2018
Unit 59 Refunds of VAT 1,697,238.58 Within 1 year 2018
Unit 50 Refunds of VAT 1,366,570.53 Within 1 year 2018
Unit 53 Refunds of VAT 265,999.19 Within 1 year 2018
Unit 45 Refunds of VAT 217,328.17 Within 1 year 2018
Unit 54 Refunds of VAT 205,912.34 Within 1 year 2018
Unit 55 Refunds of VAT 192,299.51 Within 1 year 2018
Other units Refunds of VAT 261,694.23 Within 1 year 2018
56,592,224.11
As set out in Note IV. (2) Tax, certain companies of the Group enjoy the policy of immediate refund
of VAT levied. As at the balance sheet date, the value-added tax receivable refund policies have
been verified by various tax bureaus.

149BBMG CORPORATION
INTERIM REPORT 2018
Notes to Unaudited Interim Financial StatementsFor the six months ended 30 June 2018
RMB
V. NOTES TO KEY ITEMS OF CONSOLIDATED FINANCIAL STATEMENTS
(continued)
7. Inventories
30 June 2018
Gross carrying
amount
Less: Provision for
decline in value
of inventories Carrying value
Raw materials 2,114,488,350.52 101,658,677.68 2,012,829,672.84
Items in production 837,487,453.41 19,641,464.80 817,845,988.61
Finished goods 2,129,102,648.83 46,868,318.43 2,082,234,330.40
Turnover materials 87,133,575.44 81,472.31 87,052,103.13
Goods in stock 382,895,129.13 395,486.62 382,499,642.51
Development costs 87,105,016,896.86 12,163,046.86 87,092,853,850.00
Products under
development 11,014,488,805.92 161,117,623.07 10,853,371,182.85
103,670,612,860.11 341,926,089.77 103,328,686,770.34
30 December 2017
Gross carrying
amount
Less: Provision for
decline in value
of inventories Carrying value
Raw materials 1,894,373,153.74 100,513,654.18 1,793,859,499.56
Items in production 840,631,376.18 46,209,849.70 794,421,526.48
Finished goods 1,939,035,330.53 53,935,822.09 1,885,099,508.44
Turnover materials 73,467,759.77 81,472.31 73,386,287.46
Goods in stock 390,545,544.02 395,486.62 390,150,057.40
Development costs 81,490,890,193.24 15,632,660.41 81,475,257,532.83
Products under
development 12,419,619,674.52 182,077,333.06 12,237,542,341.46_______________ ________________ _______________
99,048,563,032.00 398,846,278.37 98,649,716,753.63

150
Notes to Unaudited Interim Financial StatementsFor the six months ended 30 June 2018
RMB
V. NOTES TO KEY ITEMS OF CONSOLIDATED FINANCIAL STATEMENTS
(continued)
7. Inventories (continued)
For the six months ended 30 June 2018, the movements in provision for decline in value of
inventories are as follows:
Decrease in the period
Opening balance
Provision for
the period Reversal Write-off Closing balance
Raw materials 100,513,654.18 3,114,844.63 (42,273.78) (1,927,547.35) 101,658,677.68
Items in production 46,209,849.70 1,093,587.73 (1,093,587.73) (26,568,384.90) 19,641,464.80
Finished goods 53,935,822.09 1,002,578.20 (984,245.81) (7,085,836.05) 46,868,318.43
Turnover materials 81,472.31 – – – 81,472.31
Goods in stock 395,486.62 – – – 395,486.62
Development costs 15,632,660.41 – – (3,469,613.55) 12,163,046.86
Products under development 182,077,333.06 – – (20,959,709.99) 161,117,623.07
398,846,278.37 5,211,010.56 (2,120,107.32) (60,011,091.84) 341,926,089.77

151BBMG CORPORATION
INTERIM REPORT 2018
Notes to Unaudited Interim Financial StatementsFor the six months ended 30 June 2018
RMB
V. NOTES TO KEY ITEMS OF CONSOLIDATED FINANCIAL STATEMENTS
(continued)
7. Inventories (continued)
The movements in provision for decline in value of inventories in 2017 are as follows:
Decrease in the year
Opening balance
Provision for the
year
Disposal of
subsidiaries Reversal Write-off Closing balance
Raw materials 73,982,451.78 956,633.12 37,458,568.34 (140,871.70) (11,743,127.36) 100,513,654.18
Items in production 72,674,203.82 – 11,672,783.00 (2,296,671.00) (35,840,466.12) 46,209,849.70
Finished goods 80,504,007.51 – 63,362,726.62 (6,871,538.39) (83,059,373.65) 53,935,822.09
Turnover materials 337,616.84 – – (256,144.53) – 81,472.31
Goods in stock 1,122,050.29 – – (726,563.67) – 395,486.62
Development costs 40,401,250.12 – – – (24,768,589.71) 15,632,660.41
Products under
development 293,601,747.06 – 45,401,806.07 (43,533,161.04) (113,393,059.03) 182,077,333.06
562,623,327.42 956,633.12 157,895,884.03 (53,824,950.33) (268,804,615.87) 398,846,278.37
As at 30 June 2018, the balance of development costs included the capitalised borrowing costs of
RMB4,250,957,377.13 (31 December 2017: RMB3,339,772,026.89). The capitalised borrowing costs
amounted to RMB1,116,161,798.05 in aggregate during the period (2017: RMB1,318,364,035.21),
and the rate of interest capitalisation was 4.86% (31 December 2017: 4.62%).
Details of pledge of inventories are set out in Note V.67.

152
Notes to Unaudited Interim Financial StatementsFor the six months ended 30 June 2018
RMB
V. NOTES TO KEY ITEMS OF CONSOLIDATED FINANCIAL STATEMENTS
(continued)
7. Inventories (continued)
(1) The following sets out the breakdown of costs of property development:
Project name
Time of
commencement
Estimated completion
time of the next phase Aggregate investment 30 June 2018 31 December 2017
Hangzhou – Jingfangsanbao Project May 2017 December 2019 10,389,880,000.00 8,130,138,746.32 7,794,797,761.79
Beijing – Fengtai Project October 2015 October 2018 6,622,570,000.00 6,484,564,474.88 5,823,383,723.90
Tianjin – Airport Economic Zone March 2018 December 2019 9,119,780,000.00 6,359,794,904.49 6,154,726,837.94
Hefei – Plot S1606 at Baohe District May 2017 April 2020 7,832,884,312.81 5,161,082,826.23 4,929,122,998.74
Nanjing – Plot G07 at Diary Farm December 2016 November 2018 6,845,850,000.00 4,779,250,191.00 4,628,655,149.01
Hefei – Nanqi Garden March 2016 December 2018 7,010,664,201.05 4,591,924,371.53 4,306,226,481.23
Ningbo – Plot 07#/15# at Gaoxin
District March 2018 March 2020 5,390,000,000.00 4,269,438,524.72 3,167,386,989.40
Chongqing – Xinduhu Project June 2018 November 2019 20,117,351,300.00 4,214,783,700.32 4,104,114,958.20
Beijing – Penglai Project May 2015 2019 6,816,300,000.00 4,125,751,775.41 4,003,618,006.44
Nanjing - Plot G20 at Jiulonghu July 2018 April 2020 5,051,370,000.00 3,425,549,234.88 3,327,162,601.40
Qingdao – Qingdao Project November 2015 September 2018 3,400,000,000.00 2,753,329,258.46 2,445,038,410.14
Beijing – Houshayu Project October 2016 December 2018 2,946,000,000.00 2,688,530,777.76 2,436,377,810.43
Beijing – Yancun Project September 2018 N/A 3,732,050,000.00 2,657,597,135.58 2,540,000,000.00
Beijing – Yizhuang Project August 2018 N/A 3,243,940,000.00 2,581,470,697.45 2,460,000,000.00
Chengdu – Gaoxin Zhonghe Project September 2018 April 2022 5,332,520,000.00 2,348,864,667.03 1,749,364,483.47
Beijing – Airport Project March 2018 May 2020 2,830,000,000.00 2,191,458,347.62 2,029,763,499.51
Beijing – Plot at Western Xijiao Gravel
Plant November 2015 November 2018 2,648,303,200.00 2,176,531,415.96 1,662,886,919.26
Qingdao – Jinyu Jimo December 2018 April 2021 4,151,470,000.00 1,723,829,891.84 –
Shanghai – Jiading Juyuan December 2015 December 2018 5,500,000,000.00 1,533,021,001.34 2,837,522,654.41
Anhui – Forklift Factory Project May 2018 April 2020 2,189,770,007.66 1,279,654,210.67 1,232,566,564.78
Chongqing – Nanshanjun December 2011 October 2019 4,374,991,427.00 1,273,729,252.18 1,210,348,479.32
Tangshan – Qixin 1889# April 2014 September 2019 810,889,940.35 1,122,882,143.21 1,047,454,794.67
Chengdu – Xindu Dafeng Project July 2018 September 2020 1,654,890,000.00 1,106,657,077.74 1,069,710,676.81
Haikou – Yangguangjun April 2016 September 2022 2,532,000,000.00 1,029,986,092.30 963,014,390.91
Chengdu – Wuhou Longxijun Project July 2018 September 2020 1,808,840,000.00 839,522,528.67 766,475,980.57
Inner Mongolia – Jinyu Global Finance
Centre July 2013 December 2018 1,200,000,000.00 754,072,761.97 700,733,359.79
Chongqing – Times Metro October 2012 September 2018 4,036,912,780.00 673,422,019.67 978,005,735.37
Beijing – Public Rental Apartments of
Technology Park June 2015 August 2019 1,377,090,000.00 672,826,229.42 490,869,688.93
Tianjin – Qiaowanyuan Project December 2016 June 2019 869,000,000.00 634,402,243.06 –
Nanhu – Jin’anshiming March 2018 December 2018 2,360,000,000.00 632,294,425.86 567,875,759.55
Tangshan – Jinyu Lefu March 2010 December 2019 2,787,561,938.91 625,035,512.59 597,804,216.27
Tianjin – Yingshun Building March 2018 June 2021 1,300,380,000.00 612,224,798.73 –

153BBMG CORPORATION
INTERIM REPORT 2018
Notes to Unaudited Interim Financial StatementsFor the six months ended 30 June 2018
RMB
Project name
Time of
commencement
Estimated completion
time of the next phase Aggregate investment 30 June 2018 31 December 2017
Chengdu – Shangxifu July 2018 September 2020 960,270,000.00 502,894,584.29 485,727,813.37
Beijing – Nankou Project May 2016 August 2018 682,973,619.00 480,692,101.67 348,763,167.23
Tianjin – Haoyu Company Commercial
Project May 2017 December 2018 578,000,000.00 468,019,943.28 –
Ningbo – Plot at Yaojiang Chuanzha March 2017 April 2019 840,000,000.00 391,110,968.46 324,695,337.29
Haikou – Xixili April 2016 September 2022 420,980,000.00 271,957,688.05 195,460,998.38
Beijing – Phase II of Dandian April 2014 December 2018 4,406,665,057.79 263,086,202.18 250,288,146.91
Beijing – Chaoyang New City August 2013 December 2018 4,184,808,038.41 182,685,861.91 184,219,448.30
Tianjin – Jinyu Yuecheng September 2010 N/A 5,157,217,800.00 173,996,116.92 174,890,456.22
Beijing – Kanghuiyuan February 2009 February 2020 1,923,699,963.82 139,498,381.86 135,492,986.07
Beijing – Changyang Polytechnic
University Land No.1 May 2013 December 2018 2,500,000,000.00 118,395,721.36 114,277,273.80
Hangzhou – Plot 2F April 2016 September 2022 N/A 86,742,630.75 86,113,840.39
Chengde – Chengde Project June 2018 March 2021 542,000,000.00 85,897,427.47 61,529,109.20
Tangshan – Laishui Dormitory March 2009 December 2018 49,479,634.00 46,408,551.65 45,745,047.51
Nanjing – Plot A2 at Xinglong Street
North March 2014 June 2018 4,540,170,000.00 35,888,053.68 1,921,318,371.09
Hangzhou – Guanlan Times May 2013 Completed 644,267,397.16 – 459,930,827.80
Beijing – Jinyu fu March 2012 Completed 928,663,517.09 – 269,348,903.43
Others 391,958,377.58 392,446,873.60
Total 87,092,853,850.00 81,475,257,532.83
V. NOTES TO KEY ITEMS OF CONSOLIDATED FINANCIAL STATEMENTS
(continued)
7. Inventories (continued)
(1) The following sets out the breakdown of costs of property development: (continued)

154
Notes to Unaudited Interim Financial StatementsFor the six months ended 30 June 2018
RMB
V. NOTES TO KEY ITEMS OF CONSOLIDATED FINANCIAL STATEMENTS
(continued)
7. Inventories (continued)
(2) The following sets out the breakdown of costs of property development:
Project name
Completion date of
the latest phase Opening balance Increase in the year Decrease in the year Closing balance
Shanghai – Jiading Juyuan June 2018 317,743,217.19 1,658,827,746.45 (1,067,247,597.11) 909,323,366.53
Beijing – Jiapin MALL September 2015 811,471,711.72 – – 811,471,711.72
Beijing – Chaoyang New City May 2016 766,739,866.05 – – 766,739,866.05
Chongqing – Nanshanjun July 2017 727,854,932.86 – (72,277,201.70) 655,577,731.16
Tangshan – Jin’anhongbao December 2017 851,944,317.34 – (208,666,525.39) 643,277,791.95
Tangshan – Jinyu Lefu March 2018 675,421,377.17 – (76,887,723.60) 598,533,653.57
Hangzhou – Guanlan Times May 2018 367,083,031.74 629,286,983.19 (470,667,429.87) 525,702,585.06
Beijing – Shangchengjun December 2017 818,715,650.89 – (293,842,345.19) 524,873,305.70
Nanjing – Zijinfu May 2018 126,424,683.98 2,238,646,105.79 (1,865,143,651.86) 499,927,137.91
Hangzhou – Jinyu Xuefu November 2017 1,657,819,347.35 49,430,879.42 (1,279,296,990.92) 427,953,235.85
Chengdu – Longxijun July 2017 461,336,099.24 – (46,955,559.82) 414,380,539.42
Chongqing – Times Metro March 2018 292,396,368.51 409,910,626.36 (318,867,515.90) 383,439,478.97
Haikou – Xixili October 2017 683,241,146.66 – (305,449,166.07) 377,791,980.59
Tianjin – Jinyu Yuecheng October 2017 325,341,646.38 – (67,101,669.76) 258,239,976.62
Beijing – Treasure Mansion House June 2018 – 402,371,618.96 (162,872,393.95) 239,499,225.01
Tangshan – Phase I of Qixin 1889# January 2016 238,829,891.16 – (3,513,610.42) 235,316,280.74
Inner Mongolia – Jinyu Elegancy City October 2015 229,805,023.03 – – 229,805,023.03
Changyang – Polytechnic University Land No.1 June 2017 257,157,055.74 – (42,897,427.52) 214,259,628.22
Hangzhou – Banshan Tianyuan March 2016 469,121,788.16 – (285,753,676.58) 183,368,111.58
Tianjin – Jinyu Mantang June 2016 291,174,828.28 – (115,107,261.57) 176,067,566.71
Ma’ Anshan – Jiashanshu June 2016 198,824,059.57 – (35,869,790.36) 162,954,269.21
Chengdu – Dachengjun December 2014 156,019,318.39 – – 156,019,318.39
Inner Mongolia – Global Center June 2017 167,533,330.37 – (29,248,367.96) 138,284,962.41
Beijing – Jinyu Feili November 2016 255,423,127.32 – (141,760,282.84) 113,662,844.48
Beijing – Kanghuiyuan September 2011 98,191,082.69 – – 98,191,082.69
Beijing – Guogongzhuang December 2014 78,890,046.87 – – 78,890,046.87
Beijing – Tuqiao Project December 2016 75,415,921.37 – – 75,415,921.37
Beijing – Dacheng Shida November 2010 73,881,317.53 – – 73,881,317.53
Beijing – BBMG International April 2005 72,644,672.32 – – 72,644,672.32

155BBMG CORPORATION
INTERIM REPORT 2018
Notes to Unaudited Interim Financial StatementsFor the six months ended 30 June 2018
RMB
Project name
Completion date of
the latest phase Opening balance Increase in the year Decrease in the year Closing balance
Beijing – Binheyuan June 2014 70,671,572.44 – – 70,671,572.44
Beijing – Tuqiao Phase III August 2016 68,428,364.76 – – 68,428,364.76
Tianjin – Rongxiyuan Project May 2015 – 61,153,132.45 – 61,153,132.45
Beijing – Jiaheyuan March 2018 7,138,522.71 302,633,426.96 (250,668,234.86) 59,103,714.81
Beijing – Jinyu Town House October 2014 57,884,417.91 – – 57,884,417.91
Beijing – Chang’an New City December 2007 52,892,137.32 – – 52,892,137.32
Beijing – Huijingyuan September 2017 51,458,740.72 – – 51,458,740.72
Inner Mongolia – Jinyu Times City June 2014 64,653,083.01 – (14,505,481.63) 50,147,601.38
Beijing – Dacheng International March 2018 30,603,408.75 31,487,807.48 (21,244,706.80) 40,846,509.43
Beijing – Jinyu Lanwan October 2016 34,494,759.95 – – 34,494,759.95
Hainan – Dacheng Business Apartments February 2005 33,819,032.85 – – 33,819,032.85
Beijing – I Cube February 2015 27,308,757.45 – – 27,308,757.45
Tangshan- Lixinjiayuan September 2016 37,703,579.58 – (12,685,649.06) 25,017,930.52
Tianjin – Liulanhuayuan Project Phase I June 2010 – 22,774,062.85 – 22,774,062.85
Beijing – Huixingyuan (Xingpai) September 2016 22,470,146.73 – – 22,470,146.73
Others 131,570,957.40 – (2,163,287.78) 129,407,669.62
Total 12,237,542,341.46 5,806,522,389.91 (7,190,693,548.52) 10,853,371,182.85
8. Contract assets
30 June 2018
Gross carrying
amount
Provision for
impairment Carrying value
Project construction 5,168,714.52 – 5,168,714.52
V. NOTES TO KEY ITEMS OF CONSOLIDATED FINANCIAL STATEMENTS
(continued)
7. Inventories (continued)
(2) The following sets out the breakdown of costs of property development: (continued)

156
Notes to Unaudited Interim Financial StatementsFor the six months ended 30 June 2018
RMB
V. NOTES TO KEY ITEMS OF CONSOLIDATED FINANCIAL STATEMENTS
(continued)
8. Contract assets (continued)
Details of closing balance of contract assets, including assets completed but not yet settled under
construction contracts, are summarized as follows:
Aggregate
costs
incurred
Aggregate gross
profits
Expected
losses
Amounts
settled
30 June 2018 13,292,338.93 608,198.32 – 8,731,822.73
9. Assets/liabilities held for sale
In December 2017, the management of the Group decided to dispose of BBMG Material Industrial
(Shanghai) Co., Ltd. and submitted the Tender Notice to CBEX. In February 2018, the Company
entered into a legally binding transfer agreement and classified BBMG Material Industrial (Shanghai)
Co., Ltd. as held-for-sale accordingly. As at 30 June 2018, the carrying values of assets and liabilities
of BBMG Material Industrial (Shanghai) Co., Ltd. are as follows:
30 June 2018
Cash and bank balances 15,866,058.01
Bills receivable and accounts receivable 39,943,529.71
Prepayments 21,126,200.00
Other receivables 5,400.00
Inventories 25,646,772.31
Other current assets 513,743.54
Fixed assets 677,454.77
Deferred income tax assets 6,143,237.26
Assets held for sale 109,922,395.60
Prepayments 37,277,074.00
Wages payable 1,028,408.11
Tax payable 703.39
Other payables 1,977,699.62
Liabilities held for sale 40,283,885.12

157BBMG CORPORATION
INTERIM REPORT 2018
Notes to Unaudited Interim Financial StatementsFor the six months ended 30 June 2018
RMB
V. NOTES TO KEY ITEMS OF CONSOLIDATED FINANCIAL STATEMENTS
(continued)
10. Other current assets
30 June 2018 31 December 2017
Prepaid enterprise income tax 836,345,712.11 807,512,779.97
Prepaid land appreciation tax 728,912,004.16 807,877,261.43
Prepaid business tax and other tax 827,053,480.53 832,994,250.34
VAT recoverable 896,171,503.29 781,652,061.69
VAT certifiable 16,641,589.68 38,471,297.50
Prepaid expenses 26,292,562.35 18,928,639.83
Debt investment 200,000,000.00 –
Others 191,200,032.47 151,411,121.43
3,722,616,884.59 3,438,847,412.19
11. Available-for-sale financial assets
31 December
2017
Available-for-sale debt instruments (1) 588,151,110.39
Available-for-sale equity instruments
Measured at fair value (2) 2,303,039,303.04
Measured at cost (3) 6,697,450.96
2,897,887,864.39
(1) As at 31 December 2017, available-for-sale debt instruments represent interbank certificates of deposit of RMB488,139,000.00 held by BBMG Finance Co., Ltd. (金隅財務有限公司) from Industrial Bank and monetary fund of RMB100,012,110.39 from Cinda Smart Steward C (信達慧管家C).
(2) As at 31 December 2017, collective trust of Noble Sky Wenjian Phase I from Yunan International Trust Co., Ltd. (雲南國際信託有限公司), amounting to RMB1,506,972,400.00 in aggregate, was held by Jidong Development Group International Trading Co., Ltd. (冀東發展集團國際貿易有限公司), Jidong Sand Gravel Aggregate Co., Ltd. (冀東砂石骨料有限公司), Tangshan Dunshi Real Estate Development Co., Ltd. (唐山盾石房地產開發有限公司), Hebei Building Material Industry Design & Research Institution (河北省建築材料工業設計研究院) and Jidong Development Logistics Co., Ltd. (冀東發展物流有限責任公司), all being subsidiaries of the Group. BBMG Finance Lease Co., Ltd. (金隅融資租賃有限公司) purchased trust scheme (i.e. Huazheng Value No. 330) of RMB104,000,000.00 from Huarong Securities Co., Limited (華融證券股份有限公司) in July 2016 and trust scheme (i.e. FTSE New Hope No. 1) of RMB287,280,000.00 from Beijing Xinhua FTSE Asset Management Company Limited (北京新華富時資產管理有限公司) in August 2016. The finance lease company became a deeply subordinated beneficiary of the both trust schemes aforementioned. Huazheng Value No. 330 matured in July 2017 and extended for 3 years, and FTSE New Hope No. 1 matured in August 2017. The finance lease company has drawn the principal amount of RMB168,000,000.00, and the remaining of RMB119,280,000.00 has extended for 3 years.

158
Notes to Unaudited Interim Financial StatementsFor the six months ended 30 June 2018
RMB
V. NOTES TO KEY ITEMS OF CONSOLIDATED FINANCIAL STATEMENTS
(continued)
11. Available-for-sale financial assets (continued)
Tangshan Jidong Cement Co., Ltd. (唐山冀東水泥股份有限公司), a subsidiary of the Group,
held 108,482,368 shares of Yatai (Group) (stock code:600881). As at 31 December 2017,
the share price and market value were RMB5.28 and RMB572,786,903.04 respectively.
(3) As at 31 December 2017, the domestic non-listed equity investments held by the Group
were measured at cost due to the absence of quoted prices of these equity investments in an
active market. The specific details are as follows:
2017
Gross carrying amount Provision for impairment
Opening balance
Increase
in the year Closing balance Opening balance
Increase
in the year Closing balance
Percentage of
shareholding
Cash dividend for
the year
(%)
Tianjia (Tianjin) Building Materials
Company Limited (天嘉天津建材有限
公司) 1,000,000.00 – 1,000,000.00 1,000,000.00 – 1,000,000.00 10.00 –
Chengguan Rural Credit Cooperatives,
Fangshan District, Beijing (北京市房
山區城關農村信用合作社) 101,000.00 – 101,000.00 – – – 0.01 11,110.00
Zhongyou Jinyu (Beijing) Oil Sales Co.,
Ltd. (中油金隅(北京)石油銷售有限公
司) 3,000,000.00 – 3,000,000.00 – – – 10.00 266,086.09
*Beijing Beizhuan Gas Station
(北京市北磚加油站) 648,297.22 – 648,297.22 291,047.22 – 291,047.22 62.50 –
*Beijing Xinjianxinyuan Farmer’s Market
Co., Ltd. (北京市鑫建欣苑農貿市場有
限公司) 380,000.00 – 380,000.00 – – – 95.00 –
Beijing Tianyun Trading (北京天雲實業) 75,000.00 – 75,000.00 – – – 15.00 –
Beijing Yadu Science and Technology
Co., Ltd. (北京亞都科技股份有限公
司) 200,000.00 – 200,000.00 – – – 0.20 –

159BBMG CORPORATION
INTERIM REPORT 2018
Notes to Unaudited Interim Financial StatementsFor the six months ended 30 June 2018
RMB
Gross carrying amount Provision for impairment
Opening balance
Increase
in the year Closing balance Opening balance
Increase
in the year Closing balance
Percentage of
shareholding
Cash dividend for
the year
(%)
*Hainan Dihao Furniture Co., Ltd.
(海南帝豪家俱公司) 2,645,418.54 – 2,645,418.54 2,645,418.54 – 2,645,418.54 55.00 –
Beijing Tsinghua Unisplendor Founder
High-Tech Ceramics Co., Ltd.
(北京清華紫光方大高技術陶瓷有限公
司) 3,267,700.00 – 3,267,700.00 3,267,700.00 – 3,267,700.00 27.14 –
Beijing Capital Engineering Co., Ltd.
(北京首都工程有限公司) 100,000.00 – 100,000.00 100,000.00 – 100,000.00 0.34 –
Hebei ZCJY (河北眾誠建業) 500,000.00 – 500,000.00 – – – 16.00 –
Tangshan Productivity Promotion Center
Co., Ltd. (唐山市生產力促進中心有限
公司) 194,200.96 – 194,200.96 – – – 16.67 –
Sinoma Hanjiang Cement Co., Ltd.
(中材漢江水泥股份有限公司) 600,000.00 – 600,000.00 – – – 0.22 –
Xi’an High-Tech Industry Company
(西安高科實業公司) 1,220,000.00 – 1,220,000.00 – – – 1.12 –
Shaanxi Yao County Cement Factory
Properties Co., Ltd. (陝西耀縣水泥廠
置業有限公司) 70,000.00 – 70,000.00 – – – 0.29 –
14,001,616.72 – 14,001,616.72 7,304,165.76 – 7,304,165.76 277,196.09
* The Group holds more than 50% of the equity interests in these companies but is unable to participate in their operation and decision-making, which are therefore accounted for as available-for-sale financial assets.
V. NOTES TO KEY ITEMS OF CONSOLIDATED FINANCIAL STATEMENTS
(continued)
11. Available-for-sale financial assets (continued)
(3) (continued)
2017 (continued)

160
Notes to Unaudited Interim Financial StatementsFor the six months ended 30 June 2018
RMB
V. NOTES TO KEY ITEMS OF CONSOLIDATED FINANCIAL STATEMENTS
(continued)
12. Long-term receivables
30 June 2018
Gross carrying
amount
Less: provision
for impairment
of long-term
receivables
Carrying
amount
Sales of goods by instalments 518,939,866.06 15,921,188.76 503,018,677.30
Loans to Related parties 269,222,956.50 – 269,222,956.50
788,162,822.56 15,921,188.76 772,241,633.80
31 December 2017
Gross carrying
amount
Less: provision
for impairment
of long-term
receivables
Carrying
amount
Receipt of finance lease 229,024,145.84 – 229,024,145.84
Loans to Related parties 256,353,726.80 – 256,353,726.80
485,377,872.64 – 485,377,872.64
The time interval between payments from customers and committed ownership transfer of goods in
certain contracts regarding the Group’s concrete business was more than a year, the receivables of
which was presented as long-term receivables after considering the significant financing component.
The Group referred to bank loan interest rate during the same period and added a premium for
certain risk as a discount rate while measuring the significant financing component. The discount
rate was 5% for the six months ended 30 June 2018.

161BBMG CORPORATION
INTERIM REPORT 2018
Notes to Unaudited Interim Financial StatementsFor the six months ended 30 June 2018
RMB
V. NOTES TO KEY ITEMS OF CONSOLIDATED FINANCIAL STATEMENTS
(continued)
12. Long-term receivables (continued)
The movements in provision for bad debts of long-term receivables measured based on the lifetime
expected credit loss are as follows:
Opening balance
Provision for
the period
Reversal for
the period Closing balance
(restated)
Lifetime expected
credit loss 22,092,206.76 – (6,171,018.00) 15,921,188.76
Current accounts with the related parties mainly referred to the borrowings and interest receivable
provided to Cross Point Trading 274 (Pty) Ltd (RF), a joint venture of African Rhino Co., Ltd. (非洲犀
牛有限公司) which is a subsidiary of the Group. Pursuant to the agreement between both parties,
such borrowings will be recovered before March 2044.

162
Notes to Unaudited Interim Financial StatementsFor the six months ended 30 June 2018
RMB
V.
NO
TES
TO K
EY I
TEM
S O
F C
ON
SOLI
DA
TED
FIN
AN
CIA
L ST
ATE
MEN
TS (
cont
inue
d)
13.
Lon
g-t
erm
eq
uit
y in
vest
men
ts
For
the
six
mo
nth
s en
ded
30
Jun
e 20
18
Movem
ents
durin
g the
perio
d
Open
ing ba
lance
Obtai
ned
from
busin
ess
combin
ation
s not
unde
r com
mon
contro
l
Increa
se/(De
crease
)
in inv
estme
nt
Invest
ment
gain
or los
s
unde
r equ
ity m
ethod
Othe
r mov
emen
ts of
equit
y inte
rests
Cash
divide
nds
decla
red
Provis
ion fo
r
impa
irmen
t
Carry
ing am
ount
at
the en
d of th
e peri
od
Provis
ion fo
r
impa
irmen
t at th
e
end o
f the p
eriod
Closin
g net
value
Joint
ventur
es
STAR-U
SG Bu
ilding
Mater
ials Co
., Ltd.
(星牌優
時吉建築
材料有限
公司)
15,938
,256.8
1–
–10,
364,39
2.37
––
–26,
302,64
9.18
–26,
302,64
9.18
BBMG L
andao
Comm
ercial
Opera
tion M
anagem
ent Co
.,
Ltd. (北
京金隅藍
島商業運
營管理有
限公司)
3,727,
572.61
––
28,531
.93–
(56,09
6.24)
–3,7
00,008
.30–
3,700,
008.30
BBMG T
US Te
chnolo
gy Inc
ubator
Co., L
td. (北
京金隅啟
迪科技孵
化器有限
公司)
4,237,
456.15
––
375,79
0.98
––
–4,6
13,247
.13–
4,613,
247.13
Jidong
Heide
lberg
(Fufen
g) Ce
ment
Co., L
td.
(冀東海德
堡(扶風
)水泥有
限公司)
482,07
4,363.
98–
–47,
926,36
3.89
(745,1
15.87)
(84,19
2,500.
00)–
445,06
3,112.
00–
445,06
3,112.
00
Jidong
Heide
lberg
(Jingya
ng) Ce
ment
Co., L
td.
(冀東海德
堡(涇陽
)水泥有
限公司)
563,34
7,381.
44–
–60,
401,73
2.80
(16,78
0.10)
(87,50
0,000.
00)–
536,23
2,334.
14–
536,23
2,334.
14
Tangsh
an Ca
ofeidia
n Duns
hi Ne
w Build
ing M
aterial
Co.,
Ltd. (唐
山曹妃甸
盾石新型
建材有限
公司)
139,91
4,786.
42–
–6,2
61,358
.88–
––
146,17
6,145.
30–
146,17
6,145.
30
Ansha
n Jido
ng Ce
ment
Co., L
td.
(鞍山冀東
水泥有限
責任公司
)235
,487,5
46.30
––
5,255,
597.24
–(15
,000,0
00.00)
–225
,743,1
43.54
–225
,743,1
43.54
Jidong
Pacifi
c (Beiji
ng) En
vironm
ental P
rotect
ion
Engine
ering T
echnol
ogy Co
., Ltd.
(冀東太
平洋(北
京)
環保工程
技術有限
公司)
11,781
,943.4
5–
–(1,
463,49
4.88)
––
–10,
318,44
8.57
–10,
318,44
8.57
Cross
Point
Tradin
g 274
(Pty) L
td (RF
)77,
489,48
9.83
––
1,449,
269.76
(2,075
,977.2
8)–
–76,
862,78
2.31
–76,
862,78
2.31
Subtot
al of jo
int ve
ntures
1,533,
998,79
6.99
––
130,59
9,542.
97(2,
837,87
3.25)
(186,7
48,596
.24)
–1,4
75,011
,870.4
7–
1,475,
011,87
0.47

163BBMG CORPORATION
INTERIM REPORT 2018
Notes to Unaudited Interim Financial StatementsFor the six months ended 30 June 2018
RMB
V.
NO
TES
TO K
EY I
TEM
S O
F C
ON
SOLI
DA
TED
FIN
AN
CIA
L ST
ATE
MEN
TS
(con
tinu
ed)
13.
Lon
g-t
erm
eq
uit
y in
vest
men
ts (
cont
inue
d)
For
the
six
mo
nth
s en
ded
30
Jun
e 20
18 (
cont
inue
d)Mo
vemen
ts du
ring t
he pe
riod
Open
ing ba
lance
Obtai
ned
from
busin
ess
combin
ation
s not
unde
r com
mon
contro
l
Increa
se/(De
crease
)
in inv
estme
nt
Invest
ment
gain
or los
s
unde
r equ
ity m
ethod
Othe
r mov
emen
ts of
equit
y inte
rests
Cash
divide
nds
decla
red
Provis
ion fo
r
impa
irmen
t
Carry
ing am
ount
at
the en
d of th
e peri
od
Provis
ion fo
r
impa
irmen
t at th
e
end o
f the p
eriod
Closin
g net
value
Associ
ates
Zehnde
r (Chin
a) Ind
oor Cl
imate
Co., L
td. (森
德(中國
)暖
通設備有
限公司)
95,352
,921.8
3–
–5,0
03,425
.64–
––
100,35
6,347.
47–
100,35
6,347.
47
OCV R
einfor
cement
s (Beiji
ng) Co
., Ltd.
(歐文斯
科寧複合
材料(北
京)有限
公司)
59,574
,366.7
4–
–2,4
95,567
.35–
––
62,069
,934.0
9–
62,069
,934.0
9
Beijing
Gaoqi
ang Co
ncrete
Co., L
td. (北
京市高強
混凝土
有限責任
公司)
23,774
,703.4
8–
–6,1
01,630
.14–
––
29,876
,333.6
2–
29,876
,333.6
2
Beijing
Sinoba
ide Te
chnolo
gy Co
., Ltd.
(北京金
時佰德技
術有限公
司)11,
897,32
0.50
––
978,08
1.91
–(69
0,000.
00)–
12,185
,402.4
1–
12,185
,402.4
1
Hebei
Ruisu
o Solid
Wast
e Engi
neerin
g Tech
nology
Resear
ch Ins
titute
Co., L
td. (河
北睿索固
廢工程技
術研
究院有限
公司)
16,239
,040.8
4–
–(17
,229.6
2)–
––
16,221
,811.2
2–
16,221
,811.2
2
Tangsh
an Co
nch Pr
ofiles
Co., L
td.
(唐山海螺
型材有限
責任公司
)139
,532,8
05.60
––
159,50
7.28
––
–139
,692,3
12.88
–139
,692,3
12.88
Beijing
Youth
Camp
Jinyu
Fengsh
an Edu
cation
Techno
logy C
o., Ltd
.
(北京青年
營金隅鳳
山教育科
技有限公
司)1,5
85,375
.30–
–(27
,119.6
5)–
––
1,558,
255.65
–1,5
58,255
.65

164
Notes to Unaudited Interim Financial StatementsFor the six months ended 30 June 2018
RMB
Movem
ents
durin
g the
perio
d
Open
ing ba
lance
Obtai
ned
from
busin
ess
combin
ation
s not
unde
r com
mon
contro
l
Increa
se/(De
crease
)
in inv
estme
nt
Invest
ment
gain
or los
s
unde
r equ
ity m
ethod
Othe
r mov
emen
ts of
equit
y inte
rests
Cash
divide
nds
decla
red
Provis
ion fo
r
impa
irmen
t
Carry
ing am
ount
at
the en
d of th
e peri
od
Provis
ion fo
r
impa
irmen
t at th
e
end o
f the p
eriod
Closin
g net
value
Associ
ates (c
ontinu
ed)
Baogan
g Jido
ng Ce
ment
Co., L
td.
(包鋼冀東
水泥有限
公司)
102,10
7,514.
31–
–(3,
313,13
5.29)
––
–98,
794,37
9.02
–98,
794,37
9.02
Jidong
Ceme
nt Fuf
eng Tr
anspor
tation
Co., L
td. (冀
東水
泥扶風運
輸有限責
任公司)
6,479,
080.36
––
35,319
.201,0
23.79
––
6,515,
423.35
–6,5
15,423
.35
Jilin Ch
angjitu
Inves
tment
Co., L
td.
(吉林市長
吉圖投資
有限公司
)143
,393,9
71.16
––
(943,7
07.80)
––
–142
,450,2
63.36
–142
,450,2
63.36
SINJI T
RADIN
G PTE
LTD
(新冀貿易
私人有限
公司)
4,676,
430.77
––
(21,32
5.97)
––
–4,6
55,104
.80–
4,655,
104.80
Zhongf
ang Hu
arui (T
angsha
n) Rea
l Estat
e Co.,
Ltd.
(中房華瑞
(唐山)
置業有限
公司)
4,991,
835.01
––
1,292.
10–
(227.6
2)–
4,992,
899.49
–4,9
92,899
.49
Chang
chun L
ight R
ail Jid
ong Co
ncrete
Co., L
td.
(長春輕軌
冀東混凝
土有限公
司)31,
335,09
4.62
––
892,59
8.60
––
–32,
227,69
3.22
–32,
227,69
3.22
Jilin Ce
ment
(Group
) Co.,
Ltd. (吉
林水泥(
集團)有
限公司
)–
–14,
285,00
0.00
––
–14,
285,00
0.00
–14,
285,00
0.00
Tianjin
Gangb
ei Conc
rete C
o., Ltd
. (天津岡
北混凝土
有限公司
)–
6,769,
873.20
–(75
,927.1
8)–
––
6,693,
946.02
–6,6
93,946
.02
Tianjin
Wank
eyou E
nergy
Saving
Techn
ology
Co.,
Ltd. (天
津萬可優
節能科技
有限公司
)–
2,525,
553.70
–(13
6,300.
16)–
––
2,389,
253.54
–2,3
89,253
.54
Tianjin
Xingy
e Long
xiang
Const
ructio
n Co.,
Ltd. (天
津市興業
龍祥建設
工程有限
公司)
–30,
133,51
4.23
–(85
,366.9
7)–
––
30,048
,147.2
6–
30,048
,147.2
6
V.
NO
TES
TO K
EY I
TEM
S O
F C
ON
SOLI
DA
TED
FIN
AN
CIA
L ST
ATE
MEN
TS
(con
tinu
ed)
13.
Lon
g-t
erm
eq
uit
y in
vest
men
ts (
cont
inue
d)
For
the
six
mo
nth
s en
ded
30
Jun
e 20
18 (
cont
inue
d)

165BBMG CORPORATION
INTERIM REPORT 2018
Notes to Unaudited Interim Financial StatementsFor the six months ended 30 June 2018
RMB
V.
NO
TES
TO K
EY I
TEM
S O
F C
ON
SOLI
DA
TED
FIN
AN
CIA
L ST
ATE
MEN
TS
(con
tinu
ed)
13.
Lon
g-t
erm
eq
uit
y in
vest
men
ts (
cont
inue
d)
For
the
six
mo
nth
s en
ded
30
Jun
e 20
18 (
cont
inue
d)Mo
vemen
ts du
ring t
he pe
riod
Open
ing ba
lance
Obtai
ned
from
busin
ess
combin
ation
s not
unde
r com
mon
contro
l
Increa
se/(De
crease
)
in inv
estme
nt
Invest
ment
gain
or los
s
unde
r equ
ity m
ethod
Othe
r mov
emen
ts of
equit
y inte
rests
Cash
divide
nds
decla
red
Provis
ion fo
r
impa
irmen
t
Carry
ing am
ount
at
the en
d of th
e peri
od
Provis
ion fo
r
impa
irmen
t at th
e
end o
f the p
eriod
Closin
g net
value
Associ
ates (c
ontinu
ed)
Tianjin
Yaopi
Glass
Co., L
td. (天
津耀皮玻
璃有限公
司)–
157,51
0,944.
13–
931,54
8.35
––
–158
,442,4
92.48
–158
,442,4
92.48
Tianjin
Cetian
Techn
ology
Devel
opment
Co., L
td. (天
津策天科
技發展有
限公司)*
*–
––
––
––
––
–
Tianjin
Xinlin
g Envi
ronme
ntal Pr
otectio
n Co.,
Ltd. (天
津市新菱
環保工程
有限公司
)–
3,229,
810.16
––
–3,2
29,810
.16–
3,229,
810.16
Tianjin
Binha
i Jiant
ai Inve
stment
Co., L
td. (天
津濱海
建泰投資
有限公司
)–
163,65
5,516.
51(3,
570,26
4.14)
––
–160
,085,2
52.37
–160
,085,2
52.37
Tianjin
Huanb
ohai R
ock M
aterial
s Trad
ing Ce
ntre
Co., L
td. (天
津市環渤
海石材交
易中心有
限公司)*
*–
––
––
––
––
–
Tianjin
Sheng
xiang
Plastic
Busin
ess M
anagem
ent Co
., Ltd
. (天津盛
象塑料管
業有限公
司)**
––
––
––
––
––
Tianjin
Huanb
ohai H
omew
are Sh
opping
Plaza
Co.,
Ltd. (天
津環渤海
家居購物
廣場有限
公司)**
––
––
––
––
––
Daton
g Coal
Mine
Tianjia
n Stee
l Co.,
Ltd. (大
同煤礦
天建鋼鐵
有限公司
)**–
––
––
––
––
–
Tianjin
Tiantu
Fuqua
n Cons
tructio
n Mate
rials
Techno
logy D
evelop
ment
Co., L
td. (天
津天塗福
泉建材
科技發展
有限公司
)**–
––
––
––
––
–
Tianjin
Shubu
Luoke
Ceme
nt Blo
ck Co
., Ltd.
(天津舒
布洛克水
泥砌塊有
限公司)*
*–
––
––
––
––
–
Tangsh
an Ha
ngdao
Marin
e Heav
y Indus
try Co
., Ltd.
(唐山航島
海洋重工
有限公司
)**–
––
––
––
––
–

166
Notes to Unaudited Interim Financial StatementsFor the six months ended 30 June 2018
RMB
V.
NO
TES
TO K
EY I
TEM
S O
F C
ON
SOLI
DA
TED
FIN
AN
CIA
L ST
ATE
MEN
TS
(con
tinu
ed)
13.
Lon
g-t
erm
eq
uit
y in
vest
men
ts (
cont
inue
d)
For
the
six
mo
nth
s en
ded
30
Jun
e 20
18 (
cont
inue
d)
Movem
ents
durin
g the
perio
d
Open
ing ba
lance
Obtai
ned
from
busin
ess
combin
ation
s not
unde
r com
mon
contro
l
Increa
se/(De
crease
)
in inv
estme
nt
Invest
ment
gain
or los
s
unde
r equ
ity m
ethod
Othe
r mov
emen
ts of
equit
y inte
rests
Cash
divide
nds
decla
red
Provis
ion fo
r
impa
irmen
t
Carry
ing am
ount
at
the en
d of th
e peri
od
Provis
ion fo
r
impa
irmen
t at th
e
end o
f the p
eriod
Closin
g net
value
Associ
ates (c
ontinu
ed)
Beijing
XinY
uan Co
ncrete
Co., L
td.
(北京新源
混凝土有
限公司)*
*–
––
––
––
––
–
Xianya
ng Jid
ong Hi
gh Ne
w Conc
rete C
o., Ltd
.
(咸陽冀東
高新混凝
土有限公
司)**
––
––
––
––
––
Fuxin
Jidong
Xiang
he Co
ncrete
Co., L
td.
(阜新冀東
祥合混凝
土有限公
司)**
––
––
––
––
––
Liquan
Qinlin
g Cem
ent Co
., Ltd
(禮泉秦嶺
水泥有限
公司)**
––
––
––
––
––
Shaanx
i Yan’
an Qin
ling Ce
ment
Grindi
ng Co
., Ltd.
(陝西延安
秦嶺水泥
粉磨有限
公司)**
––
––
––
––
––
Shaanx
i Qinli
ng Ce
ment
Group
Specia
l Cem
ent Co
., Ltd.
(陝西秦嶺
水泥集團
特種水泥
有限公司
)**–
––
––
––
––
–
Tangsh
an Fen
grun F
irst Tr
anspor
tation
Comp
any
(唐山市豐
潤區第一
運輸公司
)**–
––
––
––
––
–
Tangsh
an Ha
igang
Datan
g Tong
zhou C
onstru
ction
Mater
ials Co
mpany
Limited
(唐山海港
大唐同舟
建材有限
公司)**
––
––
––
––
––
Subtot
al of a
ssocia
tes640
,940,4
60.52
363,82
5,211.
9314,
285,00
0.00
8,408,
593.79
1,023.
79(69
0,227.
62)–
1,026,
770,06
2.41
–1,0
26,770
,062.4
1
Toal
2,174,
939,25
7.51
363,82
5,211.
9314,
285,00
0.00
139,00
8,136.
76(2,
836,84
9.46)
(187,4
38,823
.86)
–2,5
01,781
,932.8
8–
2,501,
781,93
2.88

167BBMG CORPORATION
INTERIM REPORT 2018
Notes to Unaudited Interim Financial StatementsFor the six months ended 30 June 2018
RMB
V.
NO
TES
TO K
EY I
TEM
S O
F C
ON
SOLI
DA
TED
FIN
AN
CIA
L ST
ATE
MEN
TS (
cont
inue
d)
13.
Lon
g-t
erm
eq
uit
y in
vest
men
ts (
cont
inue
d)
2017
Movem
ents d
uring
the ye
ar
Openi
ng bal
ance
Obtain
ed fro
m bus
iness
combin
ations
not un
der co
mmon
contro
l
Increa
se/(De
crease
)
in inv
estme
nt
Invest
ment
gain o
r loss
under
equity
metho
d
Other
movem
ents o
f
equity
intere
sts
Cash
divide
nds
declare
d
Provisi
on for
impairm
ent
Carry
ing am
ount a
t the
end of
the y
ear
Provisi
on for
impairm
ent at
the e
nd
of the
year
Closin
g net
value
Joint
ventur
es
STAR-U
SG Bu
ilding
Mater
ials Co
., Ltd.
(星牌優時
吉建築材
料有限公
司)–
––
15,938
,256.8
1–
––
15,938
,256.8
1–
15,938
,256.8
1
BBMG L
andao
Comm
ercial
Opera
tion M
anagem
ent Co
.,
Ltd. (北
京金隅藍
島商業運
營管理有
限公司)
3,725,
369.48
––
62,329
.30–
(60,12
6.17)
–3,7
27,572
.61–
3,727,
572.61
BBMG T
US Te
chnolo
gy Inc
ubator
Co., L
td. (北
京金隅啟
迪科技孵
化器有限
公司)
3,683,
994.60
––
553,46
1.55
––
–4,2
37,456
.15–
4,237,
456.15
Jidong
Heide
lberg
(Fufen
g) Ce
ment
Co., L
td. (冀
東海德
堡(扶風
)水泥有
限公司)
490,90
7,685.
52–
–64,
055,41
9.54
(723,7
41.08)
(72,16
5,000.
00)–
482,07
4,363.
98–
482,07
4,363.
98
Jidong
Heide
lberg
(Jingya
ng) Ce
ment
Co., L
td. (冀
東海德堡
(涇陽)
水泥有限
公司)
531,86
5,534.
19–
–81,
486,90
9.63
(5,062
.38)
(50,00
0,000.
00)–
563,34
7,381.
44–
563,34
7,381.
44
Tangsh
an Ca
ofeidia
n Duns
hi Ne
w Build
ing M
aterial
Co.,
Ltd. (唐
山曹妃甸
盾石新型
建材有限
公司)
100,94
4,300.
10–
–38,
970,48
6.32
––
–139
,914,7
86.42
–139
,914,7
86.42
Ansha
n Jido
ng Ce
ment
Co., L
td.
(鞍山冀東
水泥有限
責任公司
)234
,064,0
65.95
––
6,423,
480.35
–(5,
000,00
0.00)
–235
,487,5
46.30
–235
,487,5
46.30
Jidong
Pacifi
c (Beiji
ng) En
vironm
ental P
rotect
ion
Engine
ering T
echnol
ogy Co
., Ltd.
(冀東太
平洋(北
京)環保
工程技術
有限公司
)11,
129,65
7.22
––
652,28
6.23
––
–11,
781,94
3.45
–11,
781,94
3.45
Cross
Point
Tradin
g 274
(Pty) L
td (RF
)72,
671,08
0.66
––
(4,722
,375.7
8)9,5
40,784
.95–
–77,
489,48
9.83
–77,
489,48
9.83
Subtot
al of jo
int ve
ntures
1,448,
991,68
7.72
––
203,42
0,253.
958,8
11,981
.49(12
7,225,
126.17
)–
1,533,
998,79
6.99
–1,5
33,998
,796.9
9

168
Notes to Unaudited Interim Financial StatementsFor the six months ended 30 June 2018
RMB
Movem
ents d
uring
the ye
ar
Openi
ng bal
ance
Obtain
ed fro
m bus
iness
combin
ations
not un
der co
mmon
contro
l
Increa
se/(De
crease
)
in inv
estme
nt
Invest
ment
gain o
r loss
under
equity
metho
d
Other
movem
ents o
f
equity
intere
sts
Cash
divide
nds
declare
d
Provisi
on for
impairm
ent
Carry
ing am
ount a
t the
end of
the y
ear
Provisi
on for
impairm
ent at
the e
nd
of the
year
Closin
g net
value
Associ
ates
Krono
(Beijin
g) Wo
ods Co
., Ltd.
(柯諾(北
京)木業
有限公司
)72,
371,17
5.20
–(68
,401,9
82.43)
(3,969
,192.7
7)–
––
––
–
Zehnde
r (Chin
a) Ind
oor Cl
imate
Co., L
td. (森
德(中國
)暖通設
備有限公
司)142
,904,8
03.94
––
(15,21
1,882.
11)–
(32,34
0,000.
00)–
95,352
,921.8
3–
95,352
,921.8
3
OCV R
einfor
cement
s (Beiji
ng) Co
., Ltd.
(歐文斯
科寧複合
材料(北
京)有限
公司)
63,680
,856.4
2–
–(4,
106,48
9.68)
––
–59,
574,36
6.74
–59,
574,36
6.74
Beijing
Gaoqi
ang Co
ncrete
Co., L
td. (北
京市高強
混凝土
有限責任
公司)
25,067
,432.0
0–
–(1,
038,72
8.52)
–(25
4,000.
00)–
23,774
,703.4
8–
23,774
,703.4
8
Beijing
Sinoba
ide Te
chnolo
gy Co
., Ltd.
(北京金時
佰德技術
有限公司
)10,
592,81
9.89
––
1,304,
500.61
––
–11,
897,32
0.50
–11,
897,32
0.50
Hebei
Ruisu
o Solid
Wast
e Engi
neerin
g Tech
nology
Resear
ch Ins
titute
Co., L
td.
(河北睿索
固廢工程
技術研究
院有限公
司)16,
128,84
6.71
––
110,19
4.13
––
–16,
239,04
0.84
–16,
239,04
0.84
Tangsh
an Co
nch Pr
ofiles
Co., L
td.
(唐山海螺
型材有限
責任公司
)143
,126,1
71.52
––
406,63
4.08
–(4,
000,00
0.00)
–139
,532,8
05.60
–139
,532,8
05.60
Beijing
Youth
Camp
Jinyu
Fengsh
an Edu
cation
Techno
logy C
o., Ltd
. (北京青
年營金隅
鳳山教育
科技有限
公司)
1,502,
187.19
––
83,188
.11–
––
1,585,
375.30
–1,5
85,375
.30
Baogan
g Jido
ng Ce
ment
Co., L
td.
(包鋼冀東
水泥有限
公司)
97,818
,593.9
9–
–4,2
88,920
.32–
––
102,10
7,514.
31–
102,10
7,514.
31
Jidong
Ceme
nt Fuf
eng Tr
anspor
tation
Co., L
td. (冀
東水泥扶
風運輸有
限責任公
司)6,4
71,985
.71–
–7,0
94.65
––
–6,4
79,080
.36–
6,479,
080.36
Jilin Ch
angjitu
Invest
ment
Co., L
td.
(吉林市長
吉圖投資
有限公司
)148
,817,6
51.91
––
(5,423
,680.7
5)–
––
143,39
3,971.
16–
143,39
3,971.
16
V.
NO
TES
TO K
EY I
TEM
S O
F C
ON
SOLI
DA
TED
FIN
AN
CIA
L ST
ATE
MEN
TS
(con
tinu
ed)
13.
Lon
g-t
erm
eq
uit
y in
vest
men
ts (
cont
inue
d)
2017
(co
ntin
ued)

169BBMG CORPORATION
INTERIM REPORT 2018
Notes to Unaudited Interim Financial StatementsFor the six months ended 30 June 2018
RMB
Movem
ents d
uring
the ye
ar
Openi
ng bal
ance
Obtain
ed fro
m bus
iness
combin
ations
not un
der co
mmon
contro
l
Increa
se/(De
crease
)
in inv
estme
nt
Invest
ment
gain o
r loss
under
equity
metho
d
Other
movem
ents o
f
equity
intere
sts
Cash
divide
nds
declare
d
Provisi
on for
impairm
ent
Carry
ing am
ount a
t the
end of
the y
ear
Provisi
on for
impairm
ent at
the e
nd
of the
year
Closin
g net
value
Associ
ates (c
ontinu
ed)
SINJI T
RADIN
G PTE
LTD
(新冀貿易
私人有限
公司)
5,081,
441.23
––
(405,0
10.46)
––
–4,6
76,430
.77–
4,676,
430.77
Zhongf
ang Hu
arui (T
angsha
n) Rea
l Estat
e Co.,
Ltd.
(中房華瑞
(唐山)
置業有限
公司)
4,989,
973.07
––
1,861.
94–
––
4,991,
835.01
–4,9
91,835
.01
Chang
chun L
ight R
ail Jid
ong Co
ncrete
Co., L
td.
(長春輕軌
冀東混凝
土有限公
司)46,
105,34
8.27
––
9,264,
466.82
–(24
,034,7
20.47)
–31,
335,09
4.62
–31,
335,09
4.62
Tangsh
an Ha
ngdao
Marin
e Heav
y Indus
try Co
., Ltd.
(唐山航
島海洋重
工有限公
司)**
––
––
––
––
––
Beijing
XinY
uan Co
ncrete
Co., L
td. (北
京新源混
凝土有限
公司)**
––
––
––
––
––
Xianya
ng Jid
ong Hi
gh Ne
w Conc
rete C
o., Ltd
. (咸陽冀
東高新
混凝土有
限公司)*
*–
––
––
––
––
–
Fuxin
Jidong
Xiang
he Co
ncrete
Co., L
td. (阜
新冀東祥
合混凝
土有限公
司)**
––
––
––
––
––
Liquan
Qinlin
g Cem
ent Co
., Ltd.
(禮泉秦
嶺水泥有
限公司 )
**–
––
––
––
––
–
Shaanx
i Yan’
an Qin
ling Ce
ment
Grindi
ng Co
., Ltd.
(陝西延
安秦嶺水
泥粉磨有
限公司 )*
*–
––
––
––
––
–
Shaanx
i Qinli
ng Ce
ment
Group
Specia
l Cem
ent Co
., Ltd.
(陝西秦嶺
水泥集團
特種水泥
有限公司
)**–
––
––
––
––
–
V.
NO
TES
TO K
EY I
TEM
S O
F C
ON
SOLI
DA
TED
FIN
AN
CIA
L ST
ATE
MEN
TS
(con
tinu
ed)
13.
Lon
g-t
erm
eq
uit
y in
vest
men
ts (
cont
inue
d)
2017
(co
ntin
ued)

170
Notes to Unaudited Interim Financial StatementsFor the six months ended 30 June 2018
RMB
V.
NO
TES
TO K
EY I
TEM
S O
F C
ON
SOLI
DA
TED
FIN
AN
CIA
L ST
ATE
MEN
TS
(con
tinu
ed)
13.
Lon
g-t
erm
eq
uit
y in
vest
men
ts (
cont
inue
d)
2017
(co
ntin
ued)
Movem
ents d
uring
the ye
ar
Openi
ng bal
ance
Obtain
ed fro
m bus
iness
combin
ations
not un
der co
mmon
contro
l
Increa
se/(De
crease
)
in inv
estme
nt
Invest
ment
gain o
r loss
under
equity
metho
d
Other
movem
ents o
f
equity
intere
sts
Cash
divide
nds
declare
d
Provisi
on for
impairm
ent
Carry
ing am
ount a
t the
end of
the y
ear
Provisi
on for
impairm
ent at
the e
nd
of the
year
Closin
g net
value
Associ
ates (c
ontinu
ed)
Tangsh
an Fen
grun F
irst Tr
anspor
tation
Comp
any (唐
山市豐潤
區第一運
輸公司)*
*–
––
––
––
––
–
Tangsh
an Ha
igang
Datan
g Tong
zhou C
onstru
ction
Mater
ials Co
mpany
Limited
(唐山海港
大唐同舟
建材有限
公司)**
––
––
––
––
––
Subtot
al of a
ssocia
tes784
,659,2
87.05
–(68
,401,9
82.43)
(14,68
8,123.
63)–
(60,62
8,720.
47)–
640,94
0,460.
52–
640,94
0,460.
52
Total
2,233,
650,97
4.77
–(68
,401,9
82.43)
188,73
2,130.
328,8
11,981
.49(18
7,853,
846.64
)–
2,174,
939,25
7.51
–2,1
74,939
,257.5
1
* Se
e de
tails
in
Not
e V
I. 1.
**
Such
com
pani
es a
re j
oint
ven
ture
s an
d as
soci
ates
of
Jido
ng D
evel
opm
ent
Gro
up C
o.,
Ltd.
and
Tia
njin
Bui
ldin
g M
ater
ials
(H
oldi
ng)
Co.
, Lt
d. (
天津
市建
築材
料集
團(控
股)有
限公
司).
Fai
r va
lues
of
such
com
pani
es a
t th
e ti
me
and
date
of
acqu
isit
ion
by t
he G
roup
wer
e ni
l.
The
Gro
up’s
lon
g-te
rm e
quit
y in
vest
men
ts i
n jo
int
vent
ures
and
ass
ocia
tes
are
unlis
ted
inve
stm
ents
, w
hich
are
acc
ount
ed f
or u
sing
equ
ity
met
hod.

171BBMG CORPORATION
INTERIM REPORT 2018
Notes to Unaudited Interim Financial StatementsFor the six months ended 30 June 2018
RMB
V. NOTES TO KEY ITEMS OF CONSOLIDATED FINANCIAL STATEMENTS
(continued)
14. Investment in other equity instruments
30 June 2018
Changes in fair
value accumulated Dividend income for the period
in other
comprehensive
income
Cost Fair value
Equity instruments
derecognized
for the period
Equity
instruments held
Investments in listed companies 512,797,331.24 (93,837,290.60) 418,960,040.64 – –
Chengguan Rural Credit Cooperatives, Fangshan District, Beijing
(北京市房山區城關農村信用合作社) 101,000.00 – 101,000.00 – –
Zhongyou Jinyu (Beijing) Oil Sales Co., Ltd. (中油金隅(北京)石油銷售有限公司) 3,000,000.00 1,024,826.61 4,024,826.61 – 531,473.78
Beijing Beizhuan Gas Station (北京市北磚加油站) 357,250.00 – 357,250.00 – –
Beijing Xinjianxinyuan Farmer’s Market Co., Ltd. (北京市鑫建欣苑農貿市場有限公司) 380,000.00 (380,000.00) – – –
Hebei ZCJY Project Management Co., Ltd. (河北眾誠建業工程項目管理有限公司) 500,000.00 (500,000.00) – – –
Sinoma Hanjiang Cement Co., Ltd. (中材漢江水泥股份有限公司) 600,000.00 486,186.22 1,086,186.22 – –
Xi’an High-Tech Industry Company (西安高科實業公司) 1,220,000.00 (1,220,000.00) – – –
Shaanxi Yao County Cement Factory Properties Co., Ltd. (陝西耀縣水泥廠置業有限公司) 70,000.00 (70,000.00) – – –
Tangshan Productivity Promotion Center Co., Ltd. (唐山市生產力促進中心有限公司) 500,000.00 (305,799.04) 194,200.96 – –
Beijing Tianyun Trading Co., Ltd. (北京天雲實業有限公司) 75,000.00 – 75,000.00 – –
Beijing Yadu Science and Technology Co., Ltd. (北京亞都科技股份有限公司) 200,000.00 – 200,000.00 – –
Hainan Dihao Furniture Co., Ltd.(海南帝豪家具公司) 2,645,418.54 (2,645,418.54) – – –
Taili Information Industry Co., Ltd. (太力信息產業股份有限公司) 14,454,136.85 – 14,454,136.85 – –
Koemmerling (Tianjin) Kunststoff Co., Ltd.(柯梅令(天津)高分子型材有限公司) 7,632,973.83 – 7,632,973.83 – –
Tianjin Huanbohai Technology Development Co., Ltd. (天津市環渤海科技發展有限公司) 7,000,000.00 – 7,000,000.00 – –
Guojian Alliance Media Investment (Beijing) Co., Ltd. (國建聯盟傳媒投資(北京)有限公司) 1,000,000.00 – 1,000,000.00 – –
Tianjin Wangle Technology Development Co., Ltd. (天津市網樂技術開發有限公司) 100,000.00 – 100,000.00 – –
Tianjin Hualian Commercial Building Co., Ltd. (天津華聯商廈股份有限公司) 126,000.00 – 126,000.00 – –
Guan County Rufeng Plastic Products Co., Ltd. (固安縣如峰塑膠製品有限公司) 5,846,991.84 (5,846,991.84) – – –
Tianjin Longhui Carbon And Graphite Products Co., Ltd. (天津龍匯碳石墨製品有限公司) 480,000.00 (480,000.00) – – –
559,086,102.30 (103,774,487.19) 455,311,615.11 – 531,473.78

172
Notes to Unaudited Interim Financial StatementsFor the six months ended 30 June 2018
RMB
V. NOTES TO KEY ITEMS OF CONSOLIDATED FINANCIAL STATEMENTS
(continued)
15. Other non-current financial assets
30 June 2018
Financial assets at fair value through profit or loss
Designated asset management of Huazheng Value No. 330 (Note V. 11) 104,000,000.00
FTSE New Hope No. 1 (Note V. 11) 119,280,000.00
Collective trust of Noble Sky Wenjian Phase I (Note V. 11) 1,506,972,400.00
1,730,252,400.00
16. Investment properties
Fair value model is applied to investment properties of the Group for subsequent measurement:
For the six months ended 30 June 2018:
Buildings Land use rights Total
Opening balance 15,440,453,467.02 – 15,440,453,467.02
Business combination not under
common control 3,079,529,250.00 – 3,079,529,250.00
Acquisition for the year 28,329,648.64 432,009,126.42 460,338,775.06
Transfer of investment properties
into self-occupied properties (32,988,999.99) – (32,988,999.99)
Changes in fair value 270,195,883.37 – 270,195,883.37
Closing balance 18,785,519,249.04 432,009,126.42 19,217,528,375.46

173BBMG CORPORATION
INTERIM REPORT 2018
Notes to Unaudited Interim Financial StatementsFor the six months ended 30 June 2018
RMB
V. NOTES TO KEY ITEMS OF CONSOLIDATED FINANCIAL STATEMENTS
(continued)
16. Investment properties (continued)
2017
Buildings
Opening balance 14,976,628,345.79
Disposal and retirement (62,526,015.74)
Transfer of self-occupied properties into investment properties 12,467,043.03
Changes in fair value 513,884,093.94
Closing balance 15,440,453,467.02
All the above investment properties are located in the PRC and mainly held under operating
commercial leases.
The Group’s investment properties were valued by Savills Valuation and Beijing Guorong Xinghua
Asset Appraisal Company Limited (北京國融興華資產評估有限責任公司 ), independent valuers
with professional qualifications, using future earnings method and market-based approach on
an open market and existing use basis, the appraised value of which as at 30 June 2018 was
RMB19,217,528,375.46 (31 December 2017: RMB15,440,453,467.02).
As at the balance sheet date, The carrying amount for investment properties pending completion
of the procedures for the title certificates amounted to RMB1,218,364,680.00. These investment
properties were acquired through business combination under common control in 2011 and business
combination not under common control for the period, respectively, and the Group was in the
process of handling the procedures for changing the relevant titles. The management was of the
view that the Group had the legitimate and valid right to occupy and use or dispose of the above
properties and the above matters would not impose material adverse effect on the overall financial
position of the Group as at 30 June 2018.
Details of pledge of investment properties are set out in Note V. 67.

174
Notes to Unaudited Interim Financial StatementsFor the six months ended 30 June 2018
RMB
V. NOTES TO KEY ITEMS OF CONSOLIDATED FINANCIAL STATEMENTS
(continued)
17. Fixed assets
For the six months ended 30 June 2018
Buildings Machinery and equipment Transportation equipment Other equipments Total
Cost
Opening balance 29,492,547,790.90 27,803,469,106.66 2,034,078,198.14 677,408,152.34 60,007,503,248.04
Addition 2,916,811.45 90,402,833.39 45,381,727.96 21,293,763.47 159,995,136.27
Transfer from construction
in progress 300,982,889.55 218,617,683.65 368,546.99 3,411,501.06 523,380,621.25
Business combination not
under common control 1,038,592,638.40 138,439,892.82 43,815,738.92 10,276,292.86 1,231,124,563.00
Classified as held for trading – – (1,328,500.00) (526,286.45) (1,854,786.45)
Disposal or retirement (473,543,321.77) (170,270,003.80) (174,744,768.30) (15,926,365.10) (834,484,458.97)
Closing balance 30,361,496,808.53 28,080,659,512.72 1,947,570,943.71 695,937,058.18 61,085,664,323.14
Accumulated depreciation
Opening balance 4,825,210,669.20 7,513,672,795.22 869,043,773.49 473,499,551.88 13,681,426,789.79
Provision for the period 591,069,297.97 1,071,282,121.23 127,498,930.29 32,531,535.01 1,822,381,884.50
Classified as held for trading – – (719,711.92) (457,619.75) (1,177,331.67)
Disposal or retirement (140,598,647.18) (65,727,201.54) (144,698,102.12) (14,861,688.00) (365,885,638.84)
Closing balance 5,275,681,319.99 8,519,227,714.91 851,124,889.74 490,711,779.14 15,136,745,703.78
Provision for impairment
Opening balance 152,820,438.85 254,443,957.54 22,167,534.24 1,323,044.38 430,754,975.01
Provision for the period 5,744,131.69 516,364.70 2,648,644.13 64,155.40 8,973,295.92
Disposal or retirement (10,550,971.65) (1,291,998.97) (167,144.60) – (12,010,115.22)
Closing balance 148,013,598.89 253,668,323.27 24,649,033.77 1,387,199.78 427,718,155.71
Carrying amount
At the end of the year 24,937,801,889.65 19,307,763,474.54 1,071,797,020.20 203,838,079.26 45,521,200,463.65
At the beginning of the period 24,514,516,682.85 20,035,352,353.90 1,142,866,890.41 202,585,556.08 45,895,321,483.24

175BBMG CORPORATION
INTERIM REPORT 2018
Notes to Unaudited Interim Financial StatementsFor the six months ended 30 June 2018
RMB
V. NOTES TO KEY ITEMS OF CONSOLIDATED FINANCIAL STATEMENTS
(continued)
17. Fixed assets (continued)
2017
Buildings Machinery and equipment Transportation equipment Other equipments Total
Cost
Opening balance 28,236,098,712.18 25,424,018,671.00 2,067,898,477.06 645,256,766.95 56,373,272,627.19
Addition 22,334,493.76 237,008,962.61 80,766,292.32 55,735,666.02 395,845,414.71
Transfer from construction
in progress 1,378,040,147.01 2,050,702,994.02 1,313,869.56 14,509,643.91 3,444,566,654.50
Business combination not
under common control – 336,163,975.77 212,834.95 1,264,130.44 337,640,941.16
Disposal or retirement (143,925,562.05) (244,425,496.74) (116,113,275.75) (30,407,634.18) (534,871,968.72)
Disposal of subsidiaries – – – (8,950,420.80) (8,950,420.80)
Closing balance 29,492,547,790.90 27,803,469,106.66 2,034,078,198.14 677,408,152.34 60,007,503,248.04
Accumulated depreciation
Opening balance 3,614,797,393.14 5,644,174,493.05 641,847,766.21 430,907,331.58 10,331,726,983.98
Provision for the year 1,277,411,034.19 2,027,067,451.26 317,146,021.41 64,952,239.01 3,686,576,745.87
Disposal or retirement (66,997,758.13) (157,569,149.09) (89,950,014.13) (21,083,104.52) (335,600,025.87)
Disposal of subsidiaries – – – (1,276,914.19) (1,276,914.19)
Closing balance 4,825,210,669.20 7,513,672,795.22 869,043,773.49 473,499,551.88 13,681,426,789.79
2017
Buildings Machinery and equipment Transportation equipment Other equipments Total
Provision for impairment
Opening balance 76,123,698.84 182,592,424.18 7,472,042.08 2,073,884.36 268,262,049.46
Provision for the year 85,207,792.62 81,652,404.17 15,022,238.90 266,628.02 182,149,063.71
Disposal or retirement (8,511,052.61) (9,800,870.81) (326,746.74) (1,017,468.00) (19,656,138.16)
Closing balance 152,820,438.85 254,443,957.54 22,167,534.24 1,323,044.38 430,754,975.01
Carrying amount
At the end of the year 24,514,516,682.85 20,035,352,353.90 1,142,866,890.41 202,585,556.08 45,895,321,483.24
At the beginning of the year 24,545,177,620.20 19,597,251,753.77 1,418,578,668.77 212,275,551.01 45,773,283,593.75

176
Notes to Unaudited Interim Financial StatementsFor the six months ended 30 June 2018
RMB
V. NOTES TO KEY ITEMS OF CONSOLIDATED FINANCIAL STATEMENTS
(continued)
17. Fixed assets (continued)
The carrying amounts of the fixed assets under finance leases and sale and lease back are as follows:
30 June 2018 31 December 2017
Machinery and equipment 4,343,354,480.14 4,039,734,333.63
Buildings 47,345,215.69 49,826,439.11
Transportation equipment 48,206,251.03 62,337,952.11
Carrying amount 4,438,905,946.86 4,151,898,724.85
The carrying amounts of the fixed assets leased out under operating leases are as follows:
30 June 2018 31 December 2017
Machinery and equipment 10,424,370.33 4,939,122.54
Buildings 135,243,856.97 21,889,223.73
Transportation equipment 6,441,766.07 –
Other equipments 18,113.94 –
152,128,107.31 26,828,346.27
As at 30 June 2018, the carrying amounts of buildings pending for completion of the procedures
for title certificates amounted to RMB626,944,719.40. The procedures for title certificates for these
buildings were in progress. The management of the Company is of the view that there would not
be any material adverse impact on the business operation of the Group from the aforementioned
incomplete procedures for the title certificates.
Details of pledge of fixed assets are set out in Note V. 67.

177BBMG CORPORATION
INTERIM REPORT 2018
Notes to Unaudited Interim Financial StatementsFor the six months ended 30 June 2018
RMB
V. NOTES TO KEY ITEMS OF CONSOLIDATED FINANCIAL STATEMENTS
(continued)
18. Construction in progress
30 June 2018 31 December 2017
Gross carrying
amount
Provision for
impairment Carrying amount
Gross carrying
amount
Provision for
impairment Carrying amount
Beijing Liushui Environmental Protection
– Construction waste resources optimization 71,320,265.52 – 71,320,265.52 57,780,767.18 – 57,780,767.18
– Improvement and expansion project of fly ash 36,209,046.67 – 36,209,046.67 34,986,805.15 – 34,986,805.15
– Conveying system for the base of clinker silos no.1
to 5 1,497,729.70 – 1,497,729.70 4,252,364.10 – 4,252,364.10
– Capacity improvement, optimization and renovation
project of the disposal of fly ashes 13,408,264.49 – 13,408,264.49 11,777,217.29 – 11,777,217.29
– Project concerning comprehensive utilization of fly
ash 6,429,138.46 – 6,429,138.46 5,647,066.46 – 5,647,066.46
Beijing Jianhua-Bulangni Concrete
– Relocation of production line of 4.5 cubic meters in
Qingyundian Town 7,300,000.00 – 7,300,000.00 7,300,000.00 – 7,300,000.00
– Project for building basement and material shed of
concrete mixing tower for Bulangni (Qingyundian) 2,100,000.00 – 2,100,000.00 2,100,000.00 – 2,100,000.00
Hebei BBMG Dingxin Cement
– Projects for managing sheds in branches no. 1, 2
and 3 and stone plant in 2017 4,345,401.34 – 4,345,401.34 3,322,733.39 – 3,322,733.39
– Project concerning comprehensive technological
improvement on new powder separation and
energy-saving in branch no. 2 in 2017 475,026.11 – 475,026.11 4,374,560.14 – 4,374,560.14
– Sealing of conveyor belt in branch no. 2 in 2018 2,099,692.00 – 2,099,692.00 – – –
– Renovation project concerning warm-air ventilation
in 2017 1,850,157.39 – 1,850,157.39 – – –
Baoding Taihang Heyi
– Renovation project of air compressors 1,589,655.17 – 1,589,655.17 – – –
Handan BBMG Taihang Cement
– Collaborative project of the disposal of garbage for
cement kiln 585,168.80 – 585,168.80 – – –
– Renovation project concerning raw coal shed for
XM-2017-044#, 5# 9,955,792.08 – 9,955,792.08 9,633,883.02 – 9,633,883.02
– Renovation project concerning sandstone shed 3,626,396.40 – 3,626,396.40 2,456,000.00 – 2,456,000.00
– Renovation of staff canteen for XM2013-08 1,774,327.68 – 1,774,327.68 – – –
– Renovation of the direct drive of coal mill for 2017-
056# 1,449,802.83 – 1,449,802.83 – – –
– Concentrated office renovation of sports center for
2011-17 1,427,382.95 – 1,427,382.95 – – –

178
Notes to Unaudited Interim Financial StatementsFor the six months ended 30 June 2018
RMB
30 June 2018 31 December 2017
Gross carrying
amount
Provision for
impairment Carrying amount
Gross carrying
amount
Provision for
impairment Carrying amount
Cheng’an BBMG Taihang Cement
– Material shed 4,552,735.81 – 4,552,735.81 3,702,396.11 – 3,702,396.11
Handan BBMG Taihang Building Materials
– Land expenses 21,212,641.62 – 21,212,641.62 6,167,550.30 – 6,167,550.30
Handan Shexian BBMG Cement
– Project concerning comprehensive utilisation of
mining mullock 1,822,497.71 – 1,822,497.71 1,822,497.71 – 1,822,497.71
Zanhuang BBMG Cement
– Collaborative disposal of household garbage and
sludge in cement kiln 73,693,946.59 – 73,693,946.59 44,926,265.56 – 44,926,265.56
– Sandstone mine 1,609,395.88 – 1,609,395.88 – – –
Tianjin BBMG Concrete
– Binhai creative investment office building 23,650,000.00 – 23,650,000.00 23,650,000.00 – 23,650,000.00
– Construction project of new station in Wuqing 2,691,447.45 – 2,691,447.45 2,677,497.45 – 2,677,497.45
Lingchuan BBMG Cement
– Comprehensive ancillary material shed project 2,927,434.77 – 2,927,434.77 – – –
Bo’ai BBMG Cement
– Bo’ai Zhaihuoxiang limestone mine 14,097,169.75 – 14,097,169.75 14,097,169.75 – 14,097,169.75
Guangling BBMG Cement
– Technological improvement of clinker shed 14,378,796.46 – 14,378,796.46 14,080,459.89 – 14,080,459.89
– Renovation project of a workshop – – – 2,711,497.77 – 2,711,497.77
– Construction of a new cement warehouse with a
storage of 1,200 tonnes 1,613,709.34 – 1,613,709.34 2,559,925.67 – 2,559,925.67
– Cogeneration projects 384,500.83 – 384,500.83 2,483,383.91 – 2,483,383.91
Chengde BBMG Cement
– Project concerning comprehensive utilisation of
hazardous waste 37,735.85 – 37,735.85 28,015,172.27 – 28,015,172.27
– Intelligent engineering projects 1,655,877.40 – 1,655,877.40 402,564.10 – 402,564.10
Xingtai BBMG Yongning Cement
– Collaborative disposal of wastes in cement kiln 17,287,609.82 – 17,287,609.82 8,626,215.61 – 8,626,215.61
Beijing BBMG Tiantan Furniture
– Intelligent manufacturing workshop 301,518,333.11 – 301,518,333.11 139,236,575.77 – 139,236,575.77
– Renovation of a plant of Longshuncheng 30,725,326.11 – 30,725,326.11 14,188,487.82 – 14,188,487.82
Dachang BBMG Tiantan Furniture
– Construction of Dachang project 22,715,386.45 – 22,715,386.45 20,774,294.83 – 20,774,294.83
Beijing Aerated Concrete
– Logistics park project 1,007,578,218.26 – 1,007,578,218.26 955,230,172.52 – 955,230,172.52
Beijing Building Material Test Centre
– Establishment of information platform 2,997,369.17 – 2,997,369.17 3,487,392.11 – 3,487,392.11
V. NOTES TO KEY ITEMS OF CONSOLIDATED FINANCIAL STATEMENTS
(continued)
18. Construction in progress (continued)

179BBMG CORPORATION
INTERIM REPORT 2018
Notes to Unaudited Interim Financial StatementsFor the six months ended 30 June 2018
RMB
30 June 2018 31 December 2017
Gross carrying
amount
Provision for
impairment Carrying amount
Gross carrying
amount
Provision for
impairment Carrying amount
BBMG (Dachang) Modern Industrial Park
– Furniture project standard plant 25,195,976.26 – 25,195,976.26 25,195,976.26 – 25,195,976.26
– Coating product warehouse and test center 8,070,502.80 – 8,070,502.80 8,070,502.80 – 8,070,502.80
BBMG Weiguan (Cangzhou) Chemical
– Adhesive and poly–hydroxy-acid alkaline agent 29,448,954.98 – 29,448,954.98 46,739,986.14 – 46,739,986.14
– Plants on land lot no. 7#9# of Tiantan project
Jianan Engineering 21,338,120.62 – 21,338,120.62 – – –
Hongye Ecological
– Jianjin Building decoration project – – – 28,026,857.13 – 28,026,857.13
Jidong Development Group
– Caofeidian industrial park 68,576,964.41 – 68,576,964.41 67,352,913.55 – 67,352,913.55
– Sand making project 4,324,624.50 – 4,324,624.50 4,324,624.50 – 4,324,624.50
– Further treatment and transformation of a mine 2,721,801.07 – 2,721,801.07 2,393,961.68 – 2,393,961.68
Tangshan Jidong Concrete
– ERP project 5,046,908.00 – 5,046,908.00 7,884,948.85 – 7,884,948.85
Jidong Sand Gravel Aggregate
– Construction project of a production line of 2.5
million tonnes dolomite 25,881,151.95 – 25,881,151.95 23,466,333.46 – 23,466,333.46
– Aggregates production line with annual production
capacity of 3 million tonnes of Jingyang Building
Materials 26,516,621.96 – 26,516,621.96 14,044,839.69 – 14,044,839.69
Jidong Development Machinery and Equipment
– Relocation and capacity expansion projects 742,275,763.80 – 742,275,763.80 656,537,545.30 – 656,537,545.30
BBMG Jidong Tangshan Concrete Environmental
Technology Group (金隅冀東唐山混凝土環保科技集團)
– Material shed project 3,200,000.00 – 3,200,000.00 1,800,000.00 – 1,800,000.00
– SAP project 2,819,745.85 – 2,819,745.85 2,819,745.85 – 2,819,745.85
– Construction of material shed 1,509,000.00 – 1,509,000.00 1,509,000.00 – 1,509,000.00
– Machine-made sand project of Bishan station 1,443,860.00 – 1,443,860.00 66,465.00 – 66,465.00
Changli Jidong Cement Co., Ltd. (昌黎冀東水泥有限公司)
– Expansion project concerning a raw coal and
auxiliary material shed 5,432,390.86 – 5,432,390.86 – – –
Jidong Cement (Yantai) Co., Ltd. (冀東水泥(煙臺)有限責任公司)
– Construction project of new raw material shed 5,017,506.38 – 5,017,506.38 175,270.19 – 175,270.19
– Renovation and technological improvement project
concerning electric dust collection at the entrance
of a kiln 3,032,478.64 – 3,032,478.64 – – –
V. NOTES TO KEY ITEMS OF CONSOLIDATED FINANCIAL STATEMENTS
(continued)
18. Construction in progress (continued)

180
Notes to Unaudited Interim Financial StatementsFor the six months ended 30 June 2018
RMB
30 June 2018 31 December 2017
Gross carrying
amount
Provision for
impairment Carrying amount
Gross carrying
amount
Provision for
impairment Carrying amount
Yangquan Jidong Cement Co., Ltd. (陽泉冀東水泥有限責任公司)
– Material shed project 4,746,938.29 – 4,746,938.29 – – –
Tang County Jidong Cement Co., Ltd. (Headquarters)
(唐縣冀東水泥有限責任公司(本部))
– Wet slag shed project 3,264,072.73 – 3,264,072.73 – – –
Hebei Mining Engineering
– Construction project of explosive depot in Yutian 3,018,519.37 – 3,018,519.37 3,018,519.37 – 3,018,519.37
Huahai Wind Power
– Caofeidian new wind power project 107,045,976.72 – 107,045,976.72 107,045,976.72 – 107,045,976.72
Yan Dong Construction
– Production line for Jicheng Housing plate-making
workshop – – – 3,989,307.93 – 3,989,307.93
– Plate-making workshop – composite plate
production line – – – 3,550,750.56 – 3,550,750.56
– Hainan villa 2,336,304.83 – 2,336,304.83 2,336,304.83 – 2,336,304.83
– Upgrading production line in plate-making
workshop – – – 2,315,063.08 – 2,315,063.08
– Composite-free plate production line for
comprehensive foaming and heating platform – – – 61,590.89 – 61,590.89
– Plate-making workshop-thin plate workshop
production line 4,650,851.22 – 4,650,851.22 197,076.95 – 197,076.95
Cement museum
– Museum project 12,282,726.72 – 12,282,726.72 804,718.62 – 804,718.62
Yi County Xinhai Mining
– Project concerning crushed stone production of 1.2
million cubic meters per annum – – – 55,942,478.74 – 55,942,478.74
Jidong Cement Heilongjiang
– Cement production line using new drying process
with clinker 83,331,222.04 – 83,331,222.04 53,164,479.34 – 53,164,479.34
Jidong Cement Tongchuan
– Conveyor belt project 28,893,452.21 5,795,465.90 23,097,986.31 28,893,452.21 3,978,739.01 24,914,713.20
V. NOTES TO KEY ITEMS OF CONSOLIDATED FINANCIAL STATEMENTS
(continued)
18. Construction in progress (continued)

181BBMG CORPORATION
INTERIM REPORT 2018
Notes to Unaudited Interim Financial StatementsFor the six months ended 30 June 2018
RMB
30 June 2018 31 December 2017
Gross carrying
amount
Provision for
impairment Carrying amount
Gross carrying
amount
Provision for
impairment Carrying amount
Chengde Jidong Cement
– Technological improvement project of mining 17,505,260.94 – 17,505,260.94 15,983,664.78 – 15,983,664.78
– Aerated shed project of Wet slag 2,015,206.69 – 2,015,206.69 1,459,282.71 – 1,459,282.71
– Technological improvement on enhancing kiln
production – technological improvement project
for diagonal pulling chains 1,438,717.96 – 1,438,717.96 – – –
Baotou Jidong Cement
– Flux limestone crushing and screening project,
phase II 15,760,000.00 – 15,760,000.00 15,614,377.59 – 15,614,377.59
Jidong Haitian Cement Wenxi
– Clinker storage tent 12,764,571.46 – 12,764,571.46 11,711,711.71 – 11,711,711.71
– Closure of long conveyor belt and transfer station 1,459,063.55 – 1,459,063.55 1,581,081.08 – 1,581,081.08
– Sealing project concerning limestone shed and
unloading area 3,633,806.31 – 3,633,806.31 – – –
– Long conveyor belt of the mine 1,972,500.00 – 1,972,500.00 1,972,500.00 – 1,972,500.00
– Slag shed project 1,849,358.00 – 1,849,358.00 – – –
Yantai Jidong Runtai Building Materials
– Production line project 10,257,807.77 – 10,257,807.77 10,437,308.14 – 10,437,308.14
Jidong Cement Chongqing Jiangjin
– Avenue leading to plant 9,483,126.04 – 9,483,126.04 7,476,867.80 – 7,476,867.80
– Synergetic use of cement kiln for the disposal of
solid waste 2,236,694.25 – 2,236,694.25 1,667,723.01 – 1,667,723.01
Laishui Jidong Cement
– Project of hazardous solid waste disposal 433,418.50 – 433,418.50 6,898,595.34 – 6,898,595.34
– Renovation project of conveying de-sulphur gypsum 2,721,808.88 – 2,721,808.88 189,146.33 – 189,146.33
Jidong Cement Yongji
– Project concerning a change of exploration right to
mining right of Qincaigou mine 6,398,927.35 – 6,398,927.35 6,268,841.07 – 6,268,841.07
– Technology improvement project concerning a new
raw coal shed 2,053,661.45 – 2,053,661.45 20,552.07 – 20,552.07
– Technology improvement project concerning low
ammonia and denitrification 1,549,678.01 – 1,549,678.01 – – –
Mizhi Jidong Cement
– Project concerning cement production by
comprehensive utilization using new dry process 7,470,170.69 – 7,470,170.69 5,926,650.40 – 5,926,650.40
– Renovation project concerning the electric dust
collector at the entrance of a kiln 5,646,548.04 – 5,646,548.04 – – –
V. NOTES TO KEY ITEMS OF CONSOLIDATED FINANCIAL STATEMENTS
(continued)
18. Construction in progress (continued)

182
Notes to Unaudited Interim Financial StatementsFor the six months ended 30 June 2018
RMB
30 June 2018 31 December 2017
Gross carrying
amount
Provision for
impairment Carrying amount
Gross carrying
amount
Provision for
impairment Carrying amount
Tangshan Jidong Cement
– Collaborative project of the disposal of solid wastes
for cement kiln of the Plant no.2 – – – 5,693,379.69 – 5,693,379.69
– Closure and comprehensive treatment of sheds in
Plant no.2 4,474,534.01 – 4,474,534.01 – – –
– Environmental renovation project concerning slag
shed and the loading system of auxiliary material,
such as slags and limestones, in Plant no.1 3,998,891.52 – 3,998,891.52 – – –
– Comprehensive treatment project concerning the
conveying corridor in Plant no.2 3,932,207.22 – 3,932,207.22 – – –
– Closure project concerning the conveyor belt in
Plant no.1 3,385,183.08 – 3,385,183.08 – – –
– Comprehensive treatment project concerning dust
emission in Plant no.2 2,164,955.16 – 2,164,955.16 299.14 – 299.14
– Renovation and upgrading project of slags in Plant
no.1 1,677,702.57 – 1,677,702.57 1,133,632.59 – 1,133,632.59
– Renovation project concerning the occupational
health standards attainment of packaging and
bagging system in Plant no.1 1,517,525.84 – 1,517,525.84 597.44 – 597.44
– the cement supply chain of BBMG Jidong 2,327,509.85 – 2,327,509.85 975,044.36 – 975,044.36
– Projects concerning the optimized integration of
management and system, and standardization of
ERP blueprint process of BBMG Jidong 3,143,660.37 – 3,143,660.37 1,847,301.87 – 1,847,301.87
Datong Jidong Cement
– Original flood command center 5,067,326.00 – 5,067,326.00 5,067,326.00 – 5,067,326.00
– Restoration project of the No.1 kiln dome body of
Datong Company 20,594,504.97 – 20,594,504.97 – – –
– Renovation project concerning the grate cooler of
Datong Company 5,916,360.13 – 5,916,360.13 – – –
– Renovation project concerning the limestone
reclaimer 1,841,933.96 – 1,841,933.96 – – –
– Renovation of the preheater of Datong Company
for energy-saving 1,744,824.74 – 1,744,824.74 – – –
V. NOTES TO KEY ITEMS OF CONSOLIDATED FINANCIAL STATEMENTS
(continued)
18. Construction in progress (continued)

183BBMG CORPORATION
INTERIM REPORT 2018
Notes to Unaudited Interim Financial StatementsFor the six months ended 30 June 2018
RMB
30 June 2018 31 December 2017
Gross carrying
amount
Provision for
impairment Carrying amount
Gross carrying
amount
Provision for
impairment Carrying amount
Inner Mongolia Yili Jidong Cement
– Upgrading project of filter press – – – 4,760,256.42 – 4,760,256.42
Jilin Jidong Logistics
– Construction project concerning energy saving and
environmental protection 4,107,624.29 – 4,107,624.29 4,107,624.29 – 4,107,624.29
Tangshan Jidong Qixin Cement
– Construction project of a new slag shed 4,362,713.49 – 4,362,713.49 3,619,000.77 – 3,619,000.77
– Final treatment project of side slopes of a mine 3,504,179.95 – 3,504,179.95 3,377,477.87 – 3,377,477.87
– Renovaion project of ancillary material shed 15,468,322.84 – 15,468,322.84 15,687,753.02 – 15,687,753.02
Jidong Cement Huludao
– Cement production line using new drying process
with clinker 3,308,185.11 – 3,308,185.11 3,190,260.58 – 3,190,260.58
Liaoyang Jidong Cement
– Cogeneration projects of Liaoyang company 3,312,582.06 – 3,312,582.06 3,037,775.33 – 3,037,775.33
Jidong Haitian Cement
– Project concerning bag filter revamping from ESP at
the entrance of a kiln 4,882,117.05 – 4,882,117.05 3,017,094.01 – 3,017,094.01
Jidong Cement Chongqing Hechuan
– Relocation project of 110KV power supply line 2,423,354.13 – 2,423,354.13 2,423,354.13 – 2,423,354.13
– Renovation project concerning the ancillary
conveying system for enhancing kiln production 1,416,909.97 – 1,416,909.97 – – –
Tangshan Jidong Cement Sanyou
– Project concerning design of connection system
of 12MW cogeneration project phase II and its
upgrading of grid connection – – – 2,365,193.14 – 2,365,193.14
– Closure project of conveyor belt 1,771,495.90 – 1,771,495.90 – – –
Linli Jidong Cement
– Technological improvement project of conveying
limestone 3,930,723.13 – 3,930,723.13 2,360,872.86 – 2,360,872.86
– Environmental protection plug project in ancillary
material shed areas 3,390,627.16 – 3,390,627.16 2,033,056.26 – 2,033,056.26
– Upgrading project of desulphurization of exhaust
gas at the end of a kiln 7,440,939.68 – 7,440,939.68 2,665,117.24 – 2,665,117.24
Jidong Cement Luan County
– Technological improvement project of grid
connection for generating sets phase II – – – 2,153,680.09 – 2,153,680.09
V. NOTES TO KEY ITEMS OF CONSOLIDATED FINANCIAL STATEMENTS
(continued)
18. Construction in progress (continued)

184
Notes to Unaudited Interim Financial StatementsFor the six months ended 30 June 2018
RMB
30 June 2018 31 December 2017
Gross carrying
amount
Provision for
impairment Carrying amount
Gross carrying
amount
Provision for
impairment Carrying amount
– Improvement project of energy management center 2,147,008.55 – 2,147,008.55 2,147,008.55 – 2,147,008.55
– Collaborative disposal project in cement kiln 4,413,844.17 – 4,413,844.17 – – –
– Closure project of conveyor belts in the whole plant 2,865,384.07 – 2,865,384.07 – – –
Jidong Cement Fengxiang Co., Ltd. (冀東水泥鳳翔有限責任公司)
– Construction project concerning new clinker shed 2,842,867.81 – 2,842,867.81 – – –
Wubao Jidong Special Cement Co., Ltd. (吳堡冀東特種水泥有限公司)
– Project concerning bag filter revamping from ESP of
the electric dust collector at the entrance of kiln 2,760,172.63 – 2,760,172.63 – – –
Shanxi Shuangliang Dingxin Cement Co., Ltd. (山西雙良鼎新水泥有限公司)
– Construction project of a new raw coal shed in
Shuangliang company 1,902,094.05 – 1,902,094.05 1,550,838.07 – 1,550,838.07
– Project concerning image improvement of plant
area of Shuangliang company 1,620,053.14 – 1,620,053.14 744,452.55 – 744,452.55
Jidong Cement Panshi Co., Ltd. (冀東水泥磐石有限責任
公司)
– Environmental technology improvement project of
raw material and ancillary material shed 1,907,339.64 – 1,907,339.64 – – –
– Yantong Lazi mining 1,666,926.89 – 1,666,926.89 1,666,926.89 – 1,666,926.89
Tianjin Jidong Cement Co., Ltd. (天津冀東水泥有限公司)
– Renovation and technology improvement on direct
drives of cement mills 1,549,893.33 – 1,549,893.33 1,178,624.50 – 1,178,624.50
Tangshan Jidong Equipment & Engineering (唐山冀東裝備工程)
– Reserved plant for heavy machinery hotworking
center 5,909,090.27 – 5,909,090.27 – – –
Quyang BBMG Cement Co., Ltd. (曲陽金隅水泥有限公司)
– Technology improvement project of cogeneration
and cold end energy-saving system 1,555,555.16 – 1,555,555.16 – – –
– Clinker shed conveying system 1,486,224.55 – 1,486,224.55 190,704.08 – 190,704.08
V. NOTES TO KEY ITEMS OF CONSOLIDATED FINANCIAL STATEMENTS
(continued)
18. Construction in progress (continued)

185BBMG CORPORATION
INTERIM REPORT 2018
Notes to Unaudited Interim Financial StatementsFor the six months ended 30 June 2018
RMB
30 June 2018 31 December 2017
Gross carrying
amount
Provision for
impairment Carrying amount
Gross carrying
amount
Provision for
impairment Carrying amount
Lanxian BBMG Cement Co., Ltd. (嵐縣金隅水泥有限公司)
– Project concerning bag filter revamping from ESP at
the entrance of a kiln 3,338,232.14 – 3,338,232.14 – – –
– Raw material shed 3,064,803.35 – 3,064,803.35 – – –
Beijing Chinefarge Cement Co., Ltd. (北京興發水泥有限
公司)
– Chinefarge upgrading project 19,060,113.20 – 19,060,113.20 5,651,361.34 – 5,651,361.34
Badaling Hot Spring
– Upgrading net value of real estates in 2018 20,443,907.01 – 20,443,907.01 – – –
– Upgrading resorts in 2018 5,517,387.77 – 5,517,387.77 1,264,150.93 – 1,264,150.93
BBMG Xing Energy-Saving Technology (Tangshan) Co.,
Ltd. (金隅星節能保溫科技(唐山)有限公司)
– Caofeidian project 21,869,696.59 – 21,869,696.59 – – –
Parent Company of Jidong Group
– Caofeidian technology building 76,612,066.48 – 76,612,066.48 – – –
– Caofeidian project (dunshi machinery) 16,155,896.51 – 16,155,896.51 15,260,504.18 – 15,260,504.18
Construction materials 111,515,940.53 15,190,693.73 96,325,246.80 124,743,026.77 15,171,060.40 109,571,966.37
Others 283,829,113.30 30,624,254.06 253,204,859.24 135,514,876.07 30,624,254.06 104,890,622.01
3,767,806,647.39 51,610,413.69 3,716,196,233.70 3,030,836,478.58 49,774,053.47 2,981,062,425.11
V. NOTES TO KEY ITEMS OF CONSOLIDATED FINANCIAL STATEMENTS
(continued)
18. Construction in progress (continued)

186
Notes to Unaudited Interim Financial StatementsFor the six months ended 30 June 2018
RMB
V.
NO
TES
TO K
EY I
TEM
S O
F C
ON
SOLI
DA
TED
FIN
AN
CIA
L ST
ATE
MEN
TS (
cont
inue
d)
18.
Co
nst
ruct
ion
in
pro
gre
ss (
cont
inue
d)
The
mo
vem
ents
in
sig
nif
ican
t co
nst
ruct
ion
in
pro
gre
ss f
rom
Jan
uar
y to
Ju
ne
2018
are
as
follo
ws:
Proj
ects
Budg
etOp
enin
gba
lance
Incre
ase
in th
e pe
riod
Busin
ess
comb
inat
ion
not
unde
r com
mon
cont
rol
Tran
sferre
d to
fix
ed a
sset
s in
the
perio
d
Othe
rde
creas
es(n
ote)
Clos
ing
balan
ceSo
urce
of
fund
ing
Perce
ntag
e of
proj
ect
inve
stmen
tin
bud
get
(thou
sand
RM
B)(%
)
Beijin
g Liu
shui
Envir
onme
ntal
Tech
nolog
y
– C
onstr
uctio
n wa
ste re
sour
ces o
ptim
izatio
n72
,240
57,78
0,767
.1813
,539,4
98.34
––
–71
,320,2
65.52
Self–
finan
cing
and
borro
wing
98.73
– I
mpro
veme
nt an
d ex
pans
ion p
rojec
t of f
ly as
h70
,910
34,98
6,805
.151,2
22,24
1.52
––
–36
,209,0
46.67
Self–
finan
cing
51.06
Hebe
i BBM
G Di
ngxin
Cem
ent
– P
r ojec
t con
cern
ing co
mpreh
ensiv
e tec
hnolo
gical
impr
ovem
ent o
n ne
w po
wder
sepa
ration
and
energ
y-sav
ing in
bran
ch n
o. 2
in 20
17
90,00
04,3
74,56
0.14
78,59
8,377
.42–
(82,49
7,911
.45)
–47
5,026
.11Se
lf–fin
ancin
g92
.19
Hand
an Sh
exian
BBM
G Ce
ment
– P
r ojec
t con
cern
ing co
mpreh
ensiv
e utili
satio
n
of m
ining
mull
ock
46,00
01,8
22,49
7.71
––
––
1,822
,497.7
1Gr
oup
fund
ing3.9
6
Zhuo
lu Jin
yu C
emen
t
– S
hed
proje
ct of
0.3
millio
n to
nnes
of c
linke
r25
,481
61,32
0.75
476,0
75.25
––
–53
7,396
.00Se
lf–fin
ancin
g2.1
1
Tianji
n BB
MG
Conc
rete
– B
inhai
creati
ve in
vestm
ent o
ffice
buil
ding
33,81
623
,650,0
00.00
––
––
23,65
0,000
.00Se
lf–fin
ancin
g69
.94
Qiny
ang
BBM
G Ce
ment
– C
o llab
orati
ve p
rojec
t of h
azard
ous w
aste
dispo
sal w
ith ce
ment
pro
ducti
on lin
e
31,07
365
1,116
.5147
,169.8
1–
––
698,2
86.32
Self–
finan
cing
2.25
Zuoq
uan
BBM
G Ce
ment
– l
imes
tone
(for
ceme
nt u
se) m
ine p
rojec
t42
,227
–1,1
65,05
7.71
––
–1,1
65,05
7.71
Self–
finan
cing
2.76
Beijin
g Ch
inefar
ge C
emen
t Co.,
Ltd.
– C
hinefa
rge u
pgrad
ing p
rojec
t58
0,000
5,651
,361.3
413
,408,7
51.86
––
–19
,060,1
13.20
Self–
finan
cing
3.29

187BBMG CORPORATION
INTERIM REPORT 2018
Notes to Unaudited Interim Financial StatementsFor the six months ended 30 June 2018
RMB
Proj
ects
Budg
etOp
enin
gba
lance
Incre
ase
in th
e pe
riod
Busin
ess
comb
inat
ion
not
unde
r com
mon
cont
rol
Tran
sferre
d to
fix
ed a
sset
s in
the
perio
d
Othe
rde
creas
es(n
ote)
Clos
ing
balan
ceSo
urce
of
fund
ing
Perce
ntag
e of
proj
ect
inve
stmen
tin
bud
get
(thou
sand
RM
B)(%
)
Bo’ai
BBM
G Ce
ment
– B
o’ai Z
haihu
oxian
g lim
esto
ne m
ine21
,103
14,09
7,169
.75–
––
–14
,097,1
69.75
Self–
finan
cing
and
borro
wing
66.80
– H
azard
ous w
aste
dispo
sal p
rojec
t34
,723
681,5
93.73
––
––
681,5
93.73
Self–
finan
cing
1.96
Chen
gde B
BMG
Ceme
nt
– P
r ojec
t con
cern
ing co
mpreh
ensiv
e utili
satio
n of
haza
rdou
s was
te
39,14
028
,015,1
72.27
6,060
,129.1
7–
(34,03
7,565
.59)
–37
,735.8
5Gr
oup
fund
ing87
.06
– I
ntell
igent
engin
eerin
g pr
ojects
45,19
740
2,564
.101,2
53,31
3.30
––
–1,6
55,87
7.40
Self–
finan
cing
3.66
Xingt
ai BB
MG
Yong
ning
Ceme
nt
– C
ollab
orati
ve d
ispos
al of
was
tes in
ceme
nt ki
ln42
,057
8,626
,215.6
18,6
61,39
4.21
––
–17
,287,6
09.82
Self–
finan
cing
41.11
Beijin
g BB
MG
Tiant
an Fu
rnitu
re
– I
ntell
igent
man
ufac
turin
g wo
rksho
p28
1,400
139,2
36,57
5.77
162,2
81,75
7.34
––
–30
1,518
,333.1
1Gr
oup
fund
ing86
.63
– R
enov
ation
of a
plan
t of L
ongs
hunc
heng
42,00
014
,188,4
87.82
16,53
6,838
.29–
––
30,72
5,326
.11Gr
oup
fund
ing59
.15
Dach
ang
BBM
G Tia
ntan
Furn
iture
– C
onstr
uctio
n of
Dac
hang
pro
ject
558,6
0020
,774,2
94.83
1,941
,091.6
2–
––
22,71
5,386
.45Ap
prop
riatio
n by
the s
tate,
self–
finan
cing
4.07
Beijin
g Ae
rated
Con
crete
– L
ogist
ics p
ark p
rojec
t1,3
67,60
081
8,008
,893.5
618
9,569
,324.7
0–
––
1,007
,578,2
18.26
Self–
finan
cing
73.67
BBM
G (D
acha
ng) M
odern
Indu
strial
Park
– T
iantan
Furn
iture
proje
ct sta
ndard
plan
t37
,201
25,19
5,976
.26–
––
–25
,195,9
76.26
Self–
finan
cing
67.73
– T
i antan
Furn
iture
phas
e I at
Lot 4
#, 10
-2#
unde
r
Tiant
an Fu
rnitu
re pr
oject
97,81
382
1,813
.06–
––
–82
1,813
.06Se
lf–fin
ancin
g0.8
4
– T
iantan
Furn
iture
proje
ct-GS
HP p
rojec
t88
,000
112,5
06.29
––
––
112,5
06.29
Self–
finan
cing
0.13
– S
anch
ong
Mirr
or p
rojec
t27
,524
65,00
0.00
––
––
65,00
0.00
Self–
finan
cing
0.24
V.
NO
TES
TO K
EY I
TEM
S O
F C
ON
SOLI
DA
TED
FIN
AN
CIA
L ST
ATE
MEN
TS (
cont
inue
d)
18.
Co
nst
ruct
ion
in
pro
gre
ss (
cont
inue
d)
The
mo
vem
ents
in
sig
nif
ican
t co
nst
ruct
ion
in
pro
gre
ss f
rom
Jan
uar
y to
Ju
ne
2018
are
as
follo
ws:
(co
ntin
ued)

188
Notes to Unaudited Interim Financial StatementsFor the six months ended 30 June 2018
RMB
Proj
ects
Budg
etOp
enin
gba
lance
Incre
ase
in th
e pe
riod
Busin
ess
comb
inat
ion
not
unde
r com
mon
cont
rol
Tran
sferre
d to
fix
ed a
sset
s in
the
perio
d
Othe
rde
creas
es(n
ote)
Clos
ing
balan
ceSo
urce
of
fund
ing
Perce
ntag
e of
proj
ect
inve
stmen
tin
bud
get
(thou
sand
RM
B)(%
)
– T
i antan
Furn
iture
phas
e I w
ith ca
pacit
y of 0
.8
millio
n pie
ces o
f fur
nitur
e at L
ot 7
# an
d 9#
197,7
0737
,670.6
221
,300,4
50.00
––
–21
,338,1
20.62
Self–
finan
cing
10.79
BBM
G W
eigua
n (C
angz
hou)
– A
dhes
ive an
d po
ly–hy
drox
y-acid
alka
line a
gent
88,39
246
,739,9
86.14
––
(7,64
8,469
.05)
(9,64
2,562
.11)
29,44
8,954
.98Se
lf–fin
ancin
g52
.88
Bada
ling
Hot S
pring
– U
pgrad
ing o
f res
orts
433,0
001,2
64,15
0.93
25,10
8,506
.34–
––
26,37
2,657
.27Se
lf–fin
ancin
g6.0
9
Hong
ye Ec
ologic
al
– J
ianjin
Buil
ding
deco
ration
pro
ject
34,00
028
,026,8
57.13
302,7
91.51
––
(28,32
9,648
.64)
–Se
lf–fin
ancin
g83
.32
Jidon
g De
velop
ment
Gro
up
– C
aofei
dian
indus
trial
park
67,35
267
,352,9
13.55
1,224
,050.8
6–
––
68,57
6,964
.41Se
lf–fin
ancin
g an
d
borro
wing
163.3
0
Laish
ui Jin
glai B
uildin
g M
ateria
ls
– C
o nstr
uctio
n pr
oject
of a
prod
uctio
n lin
e of 2
.5
millio
n to
nnes
dolo
mite
120,0
7323
,466,3
33.46
2,414
,818.4
9–
––
25,88
1,151
.95Se
lf–fin
ancin
g21
.55
Jidon
g Sa
nd G
ravel
Aggr
egate
– A
g greg
ate p
rodu
ction
line w
ith an
nual
prod
uctio
n ca
pacit
y of 3
milli
on to
nnes
of
Jingy
ang
Build
ing M
ateria
ls
330,7
8014
,044,8
39.69
12,47
1,782
.27–
––
26,51
6,621
.96Se
lf–fin
ancin
g an
d
borro
wing
8.02
Jidon
g De
velop
ment
Mac
hinery
and
Equip
ment
– R
eloca
tion
of ca
pacit
y exp
ansio
n pr
oject
1,133
,224
619,0
34,26
9.73
103,1
27,93
1.78
–(14
,379,7
43.59
)(3,
009,9
69.69
)70
4,772
,488.2
3Se
lf–fin
ancin
g63
.73
Huah
ai W
ind Po
wer
– C
aofei
dian
new
wind
pow
er pr
oject
230,0
0010
7,045
,976.7
2–
––
–10
7,045
,976.7
2Se
lf–fin
ancin
g46
.54
Yan
Dong
Con
struc
tion
– Y
uqua
n pla
te-ma
king
works
hop
50,00
010
4,418
.53–
––
–10
4,418
.53Se
lf–fin
ancin
g0.2
1
V.
NO
TES
TO K
EY I
TEM
S O
F C
ON
SOLI
DA
TED
FIN
AN
CIA
L ST
ATE
MEN
TS (
cont
inue
d)
18.
Co
nst
ruct
ion
in
pro
gre
ss (
cont
inue
d)
The
mo
vem
ents
in
sig
nif
ican
t co
nst
ruct
ion
in
pro
gre
ss f
rom
Jan
uar
y to
Ju
ne
2018
are
as
follo
ws:
(co
ntin
ued)

189BBMG CORPORATION
INTERIM REPORT 2018
Notes to Unaudited Interim Financial StatementsFor the six months ended 30 June 2018
RMB
Proj
ects
Budg
etOp
enin
gba
lance
Incre
ase
in th
e pe
riod
Busin
ess
comb
inat
ion
not
unde
r com
mon
cont
rol
Tran
sferre
d to
fix
ed a
sset
s in
the
perio
d
Othe
rde
creas
es(n
ote)
Clos
ing
balan
ceSo
urce
of
fund
ing
Perce
ntag
e of
proj
ect
inve
stmen
tin
bud
get
(thou
sand
RM
B)(%
)
Ceme
nt m
useu
m
– M
useu
m pr
oject
250,0
0080
4,718
.6211
,478,0
08.10
––
–12
,282,7
26.72
Self–
finan
cing
4.91
Yi Co
unty
Xinha
i Mini
ng
– Pr o
ject c
once
rning
crus
hed
stone
pro
ducti
on o
f 1.2
milli
on cu
bic m
eters
per a
nnum
92,17
255
,942,4
78.74
––
(49,02
0,779
.97)
(6,92
1,698
.77)
–Se
lf–fin
ancin
g an
d bo
rrowi
ng60
.69
Jidon
g Ce
ment
Heil
ongji
ang
– C
e men
t pro
ducti
on lin
e usin
g ne
w dr
ying
proc
ess w
ith cl
inker
1,670
,000
53,16
4,479
.3412
8,325
,105.0
3–
(97,50
4,155
.84)
(654,2
06.49
)83
,331,2
22.04
Self–
finan
cing
and
borro
wing
10.87
Jidon
g Ce
ment
Tong
chua
n
– Con
veyo
r belt
pro
ject
55,00
028
,893,4
52.21
––
––
28,89
3,452
.21Se
lf–fin
ancin
g52
.53Ch
engd
e Jido
ng C
emen
t
– Tec
hnolo
gical
impr
ovem
ent p
rojec
t of m
ining
50,17
015
,983,6
64.78
1,521
,596.1
6–
––
17,50
5,260
.94Se
lf–fin
ancin
g34
.89Ya
ntai
Jidon
g Ru
ntai
Build
ing M
ateria
ls
– Pro
ducti
on lin
e pro
ject
238,0
9810
,437,3
08.14
––
(179,5
00.37
)–
10,25
7,807
.77Se
lf–fin
ancin
g an
d bo
rrowi
ng4.3
8
Jidon
g Ce
ment
Yon
gji
– Pr o
ject c
once
rning
a ch
ange
of e
xplor
ation
righ
t to
mini
ng ri
ght o
f Qinc
aigou
mine
122,8
396,2
68,84
1.07
130,0
86.28
––
–6,3
98,92
7.35
Self–
finan
cing
5.21
Mizh
i Jido
ng C
emen
t
– Pr o
ject c
once
rning
ceme
nt p
rodu
ction
by
comp
rehen
sive u
tiliza
tion
using
new
dry
proc
ess
487,8
315,9
26,65
0.40
1,543
,520.2
9–
––
7,470
,170.6
9Se
lf–fin
ancin
g1.5
3
Jilin
Jidon
g Lo
gistic
s
– Co n
struc
tion
proje
ct co
ncern
ing en
ergy s
aving
an
d en
viron
ment
al pr
otec
tion
50,00
04,1
07,62
4.29
––
––
4,107
,624.2
9Bo
rrowi
ng8.2
2
Tang
shan
Jido
ng Q
ixin
Ceme
nt
– Con
struc
tion
proje
ct of
a ne
w sla
g sh
ed20
,694
3,619
,000.7
774
3,712
.72–
––
4,362
,713.4
9Se
lf–fin
ancin
g21
.08
– Ren
ovati
on p
rojec
t of a
ncilla
ry ma
terial
shed
20,45
515
,687,7
53.02
––
–(21
9,430
.18)
15,46
8,322
.84Se
lf–fin
ancin
g76
.69Jid
ong
Ceme
nt H
uluda
o
V.
NO
TES
TO K
EY I
TEM
S O
F C
ON
SOLI
DA
TED
FIN
AN
CIA
L ST
ATE
MEN
TS (
cont
inue
d)
18.
Co
nst
ruct
ion
in
pro
gre
ss (
cont
inue
d)
The
mo
vem
ents
in
sig
nif
ican
t co
nst
ruct
ion
in
pro
gre
ss f
rom
Jan
uar
y to
Ju
ne
2018
are
as
follo
ws:
(co
ntin
ued)

190
Notes to Unaudited Interim Financial StatementsFor the six months ended 30 June 2018
RMB
Proj
ects
Budg
etOp
enin
gba
lance
Incre
ase
in th
e pe
riod
Busin
ess
comb
inat
ion
not
unde
r com
mon
cont
rol
Tran
sferre
d to
fix
ed a
sset
s in
the
perio
d
Othe
rde
creas
es(n
ote)
Clos
ing
balan
ceSo
urce
of
fund
ing
Perce
ntag
e of
proj
ect
inve
stmen
tin
bud
get
(thou
sand
RM
B)(%
)
– C
e men
t pro
ducti
on lin
e usin
g ne
w dr
ying
proc
ess w
ith cl
inker
790,0
003,1
90,26
0.58
117,9
24.53
––
–3,3
08,18
5.11
Grou
p fu
nding
0.42
Liaoy
ang
Jidon
g Ce
ment
– C
ogen
eratio
n pr
ojects
of L
iaoya
ng co
mpan
y33
,070
3,037
,775.3
327
4,806
.73–
––
3,312
,582.0
6Se
lf–fin
ancin
g10
.02
Jidon
g Ha
itian
Ceme
nt W
enxi
– C
onve
yor b
elts o
f a m
ine98
,220
1,972
,500.0
0–
––
–1,9
72,50
0.00
Self–
finan
cing
2.01
Jidon
g Ce
ment
Pans
hi
– Y
anto
ng La
zi mi
ning
99,40
81,6
66,92
6.89
––
––
1,666
,926.8
9Se
lf–fin
ancin
g1.6
8
Shan
xi Sh
uang
liang
Ding
xin C
emen
t
– T
e chn
ologic
al im
prov
emen
t pro
ject o
f
colla
borat
ive d
ispos
al of
ceme
nt ki
ln in
Shua
nglia
ng co
mpan
y
40,00
047
8,274
.23–
––
–47
8,274
.23Se
lf–fin
ancin
g1.2
0
Cons
tructi
on m
ateria
ls12
4,743
,026.7
760
,124,1
67.86
––
(73,35
1,254
.10)
111,5
15,94
0.53
Othe
rs58
8,589
,635.0
748
0,124
,759.0
038
,938,7
93.52
(238,1
12,49
5.39)
(1,55
4,271
.97)
867,9
86,42
0.23
3,030
,836,4
78.58
1,345
,095,0
38.49
38,93
8,793
.52(52
3,380
,621.2
5)(12
3,683
,041.9
5)3,7
67,80
6,647
.39
Not
e:
Oth
er d
ecre
ases
mai
nly
repr
esen
t th
e tr
ansf
er o
f Ji
anjin
Bui
ldin
g de
cora
tion
pro
ject
of
Hon
gye
Ecol
ogic
al C
o.,
Ltd.
, a
subs
idia
ry o
f th
e C
ompa
ny,
to l
ong–
term
def
erre
d ex
pend
itur
es o
f RM
B 28
,329
,648
.64,
in
aggr
egat
e.
V.
NO
TES
TO K
EY I
TEM
S O
F C
ON
SOLI
DA
TED
FIN
AN
CIA
L ST
ATE
MEN
TS (
cont
inue
d)
18.
Co
nst
ruct
ion
in
pro
gre
ss (
cont
inue
d)
The
mo
vem
ents
in
sig
nif
ican
t co
nst
ruct
ion
in
pro
gre
ss f
rom
Jan
uar
y to
Ju
ne
2018
are
as
follo
ws:
(co
ntin
ued)

191BBMG CORPORATION
INTERIM REPORT 2018
Notes to Unaudited Interim Financial StatementsFor the six months ended 30 June 2018
RMB
V. NOTES TO KEY ITEMS OF CONSOLIDATED FINANCIAL STATEMENTS
(continued)
18. Construction in progress (continued)
The analysis of capitalized amount and capitalization rate of borrowing costs included in balances
for construction in progress is set out below:
For the six-month period ended 30 June 2018
Progress of
works
(%)
Accumulated
amount
of interest
capitalized
Of which:
Interest
capitalized for
the period
Capitalization
rate for the
period
(%)
Beijing Liushui Environmental
– Co nstruction waste resources
optimization 87.28 531,666.66 317,066.66 3.49
Zanhuang BBMG Cement
– Co llaborative disposal of household
garbage and sludge in cement kiln
projects 35.76 603,683.33 – –
Handan Shexian BBMG Cement
– Re location and technological
improvement project of cement
grinding station 0.45 434,916.66 434,916.66 4.35
Jidong Development Group
– Caofeidian industrial park 2.79 20,718,267.70 1,755,504.94 5.18
Laishui Jinglai Building Materials
– Co nstruction project of a production line
of 2.5 million tonnes dolomite 21.55 2,346,909.29 – –
Tangshan Dunshi Machinery Manufacturing
– Dunshi machinery manufacturing project 24.04 11,243,496.83 6,896,363.20 7.74
Jidong Cement Heilongjiang Co., Ltd.
– Ce ment production line using new drying
process with clinker 10.83 127,075,779.80 1,494,733.79 4.82
Jidong Cement Yongji
– Pr oject concerning a change of
exploration right to mining right of
Qincaigou mine 5.21 160,090.67 55,805.33 4.37
– Te chnological improvement project of
construction of new raw coal shed 37.92 30.23 – –
Jidong Cement Panshi
– Yantong Lazi mining 1.68 1,666,926.89 – –
164,781,768.06 10,954,390.58

192
Notes to Unaudited Interim Financial StatementsFor the six months ended 30 June 2018
RMB
Progress of
works
Accumulated
amount
of interest
capitalized
Of which: Interest
capitalized for
the year
Capitalization
rate for
the period
(%) (%)
Beijing Liushui Environmental Protection
Technology
– Construction waste resources
optimization 79.98 214,600.00 214,600.00 3.48
Zanhuang BBMG Cement
– Collaborative disposal of household
garbage and sludge in cement kiln
projects 35.76 603,683.33 603,683.33 3.48
Chengde BBMG Cement
– Project concerning comprehensive
utilisation of hazardous waste 71.58 616,880.75 485,554.75 3.76
Jidong Development Group
– Caofeidian industrial park 2.74 18,962,762.76 3,923,296.72 5.18
Laishui Jinglai Building Materials
– Construction project of a production
line of 2.5 million tonnes dolomite 19.54 2,177,481.95 13,910.57 –
Jidong Development Jingyang Building
Materials
– Aggregates production line with annual
production capacity of 3 million
tonnes of Jingyang Building Materials 62.75 25,593,870.64 1,107,583.92 5.46
Tangshan Dunshi Machinery Manufacturing
– Dunshi machinery manufacturing
project 4.92 4,347,133.63 – –
V. NOTES TO KEY ITEMS OF CONSOLIDATED FINANCIAL STATEMENTS
(continued)
18. Construction in progress (continued)
2017

193BBMG CORPORATION
INTERIM REPORT 2018
Notes to Unaudited Interim Financial StatementsFor the six months ended 30 June 2018
RMB
Progress of
works
Accumulated
amount
of interest
capitalized
Of which: Interest
capitalized for
the year
Capitalization
rate for
the period
(%) (%)
Yi County Xinhai Mining Co., Ltd.
– Project concerning crushed stone
production of 1.2 million cubic meters
per annum 60.69 5,430,594.84 1,962,028.92 4.53
Jidong Cement Heilongjiang Co., Ltd.
– Cement production line using new
drying process with clinker 66.40 125,581,046.01 57,080,337.94 4.82
Jidong Cement Yongji
– Project concerning a change of
exploration right to mining right of
Qincaigou mine 5.10 104,285.34 104,285.34 4.37
– Project of intelligent delivery and
transportation plaza in front of plant
and roads nearby 81.87 242.26 242.26 4.37
– Technological improvement project of
construction of new raw coal shed 0.38 30.23 30.23 4.37
– Collaborative disposal of sludge in
cement kiln 98.80 2,406.99 13,365.48 4.39
Jidong Cement Panshi
– Yantong Lazi mining 1.68 1,666,926.89 – –
185,301,945.62 65,508,919.46
Note: The amount of capitalized interests included in construction in progress for the first half of 2018 was RMB11,706,877.68 (2017: RMB86,331,737.21), among which, RMB752,487.10 (2017: RMB20,822,817.75) had been transferred to fixed assets.
V. NOTES TO KEY ITEMS OF CONSOLIDATED FINANCIAL STATEMENTS
(continued)
18. Construction in progress (continued)
2017 (continued)

194
Notes to Unaudited Interim Financial StatementsFor the six months ended 30 June 2018
RMB
V. NOTES TO KEY ITEMS OF CONSOLIDATED FINANCIAL STATEMENTS
(continued)
18. Construction in progress (continued)
Provision for impairment of construction in progress for the six months ended 30 June
2018:
Opening balance
Increase
in the period
Decrease
in the period Closing balance Reason for impairment
Hebei BBMG Dingxin Co., Ltd.
– Project for the first branch 1,299,924.00 – – 1,299,924.00 Project suspension
Jidong Group
– Nanhu Yingbinguan 25,696,028.66 – – 25,696,028.66 Recoverable amount is
lower than the carrying
amount
Jingyang Jinhui Building Materials
Co., Ltd.
– Technological improvement of
production line
2,147,850.07 – – 2,147,850.07 Recoverable amount is
lower than the carrying
amount
Laishui Jidong Development Building
Materials Co., Ltd.
– Project of a production line with
annual production capacity of 10
million tonnes dolomite
1,480,451.33 – – 1,480,451.33 Recoverable amount is
lower than the carrying
amount
Jidong Cement Tongchuan Co., Ltd.
– Conveyor belt project 3,978,739.01 1,816,726.89 – 5,795,465.90 Recoverable amount is
lower than the carrying
amount
Construction Materials 15,171,060.40 19,633.33 – 15,190,693.73 Recoverable amount is
lower than the carrying
amount
49,774,053.47 1,836,360.22 – 51,610,413.69

195BBMG CORPORATION
INTERIM REPORT 2018
Notes to Unaudited Interim Financial StatementsFor the six months ended 30 June 2018
RMB
V. NOTES TO KEY ITEMS OF CONSOLIDATED FINANCIAL STATEMENTS
(continued)
18. Construction in progress (continued)
Provision for impairment of construction in progress for 2017:
Opening balance
Increase
in the year
Decrease
in the year Closing balance Reason for impairment
Hebei BBMG Dingxin Co., Ltd.
– Project for the first branch 1,299,924.00 – – 1,299,924.00 Project suspension
Jidong Group
– Nanhu Yingbinguan – 25,696,028.66 – 25,696,028.66 Recoverable amount is lower
than the carrying amount
Jingyang Jinhui Building Materials
Co., Ltd.
– Technological improvement of
production line
2,147,850.07 – – 2,147,850.07 Recoverable amount is lower
than the carrying amount
Laishui Jidong Development Building
Materials Co., Ltd.
– Project of a production line with
annual production capacity of 10
million tonnes dolomite
1,480,451.33 – – 1,480,451.33 Recoverable amount is lower
than the carrying amount
Jidong Cement Tongchuan Co., Ltd.
– Conveyor belt project 1,556,436.49 2,422,302.52 – 3,978,739.01 Recoverable amount is lower
than the carrying amount
Construction Materials 14,512,244.21 1,430,205.69 771,389.50 15,171,060.40 Recoverable amount is lower
than the carrying amount
20,996,906.10 29,548,536.87 771,389.50 49,774,053.47

196
Notes to Unaudited Interim Financial StatementsFor the six months ended 30 June 2018
RMB
V. NOTES TO KEY ITEMS OF CONSOLIDATED FINANCIAL STATEMENTS
(continued)
19. Intangible assets
For the six months ended 30 June 2018
Land use rights
Computer software
licenses Mining rights Trademark rights Others Total
Cost
Opening balance 9,126,604,942.70 167,093,919.84 2,806,043,512.90 83,414,700.00 197,289,497.90 12,380,446,573.34
Addition 153,165,135.52 6,371,237.22 3,259,802.30 – – 162,796,175.04
Business combination not
under common control 6,670,458,320.35 1,062,425.00 33,029,955.88 – – 6,704,550,701.23
Disposal or retirement (35,946,212.59) (1,022,759.15) – – (3,917.05) (36,972,888.79)
Closing balance 15,914,282,185.98 173,504,822.91 2,842,333,271.08 83,414,700.00 197,285,580.85 19,210,820,560.82
Accumulated amortisation
Opening balance 970,003,171.86 63,873,740.72 355,658,391.06 – 46,865,377.82 1,436,400,681.46
Provision for the period 130,060,508.67 15,850,684.36 49,363,605.41 – 5,106,195.53 200,380,993.97
Disposal or retirement (27,849,919.81) (677,765.86) – – – (28,527,685.67)
Closing balance 1,072,213,760.72 79,046,659.22 405,021,996.47 – 51,971,573.35 1,608,253,989.76
Provision for impairment
Opening balance 6,235,685.06 – 67,943,968.48 5,000,000.00 7,780,240.56 86,959,894.10
Provision for the period 3,050,593.49 – – – – 3,050,593.49
Closing balance 9,286,278.55 – 67,943,968.48 5,000,000.00 7,780,240.56 90,010,487.59
Carrying amount
At the end of the period 14,832,782,146.71 94,458,163.69 2,369,367,306.13 78,414,700.00 137,533,766.94 17,512,556,083.47
At the beginning of the
period 8,150,366,085.78 103,220,179.12 2,382,441,153.36 78,414,700.00 142,643,879.52 10,857,085,997.78

197BBMG CORPORATION
INTERIM REPORT 2018
Notes to Unaudited Interim Financial StatementsFor the six months ended 30 June 2018
RMB
V. NOTES TO KEY ITEMS OF CONSOLIDATED FINANCIAL STATEMENTS
(continued)
19. Intangible assets (continued)
2017
Land use rights
Computer software
licenses Mining rights Trademark rights Others Total
Cost
Opening balance 8,866,453,997.40 142,685,476.24 3,109,948,816.31 95,084,700.00 214,585,274.20 12,428,758,264.15
Addition 315,689,402.26 26,243,746.95 109,577,423.54 – 1,704,156.00 453,214,728.75
Business combination not
under common control – 91,190.88 – – – 91,190.88
Disposal or retirement (55,538,456.96) (1,926,494.23) (413,482,726.95) (11,670,000.00) (18,999,932.30) (501,617,610.44)
Closing balance 9,126,604,942.70 167,093,919.84 2,806,043,512.90 83,414,700.00 197,289,497.90 12,380,446,573.34
Accumulated amortisation
Opening balance 732,431,123.22 36,730,494.14 199,584,853.48 – 42,018,390.34 1,010,764,861.18
Provision for the year 245,154,513.58 28,910,294.55 179,079,273.95 – 11,223,385.11 464,367,467.19
Disposal or retirement (7,582,464.94) (1,767,047.97) (23,005,736.37) – (6,376,397.63) (38,731,646.91)
Closing balance 970,003,171.86 63,873,740.72 355,658,391.06 – 46,865,377.82 1,436,400,681.46
Provision for impairment
Opening balance 6,235,685.06 – 48,811,850.42 5,000,000.00 7,780,240.56 67,827,776.04
Provision for the year – – 19,132,118.06 – – 19,132,118.06
Closing balance 6,235,685.06 – 67,943,968.48 5,000,000.00 7,780,240.56 86,959,894.10
Carrying amount
At the end of the year 8,150,366,085.78 103,220,179.12 2,382,441,153.36 78,414,700.00 142,643,879.52 10,857,085,997.78
At the beginning of the
year 8,127,787,189.12 105,954,982.10 2,861,552,112.41 90,084,700.00 164,786,643.30 11,350,165,626.93

198
Notes to Unaudited Interim Financial StatementsFor the six months ended 30 June 2018
RMB
V. NOTES TO KEY ITEMS OF CONSOLIDATED FINANCIAL STATEMENTS
(continued)
19. Intangible assets (continued)
All land use rights owned by the Group are within the PRC and are analysed as follows according to
the remaining useful lives:
30 June 2018 31 December 2017
Less than 50 years 14,832,782,146.71 8,150,366,085.78
Details of pledge of intangible assets are set out in Note V.67.
As at 30 June 2018, the useful life of trademark rights with a carrying amount of RMB78,414,700.00
was indefinite (31 December 2017: RMB78,414,700.00). The Group can apply for extension at
the end of the expiration of protection periods of trademark rights with lower handling fees, and
according to comprehensive judgment of product life cycle, market conditions and other factors,
these trademark rights will bring economic benefits to the Group during future periods. After
evaluated by the management of the Group, no provision for impairment is necessary.
As at 30 June 2018, the carrying value of intangible assets of the Group pending completion of
the procedures for title certificates was amounted to RMB42,113,487.96. The management of
the Company is of the view that there would not be any material adverse impact on the business
operation of the Group from the aforementioned incomplete procedures for the title certificates.

199BBMG CORPORATION
INTERIM REPORT 2018
Notes to Unaudited Interim Financial StatementsFor the six months ended 30 June 2018
RMB
V. NOTES TO KEY ITEMS OF CONSOLIDATED FINANCIAL STATEMENTS
(continued)
20. Goodwill
30 June 2018 31 December 2017
Hebei BBMG Dingxin Cement Co., Ltd. 189,815,999.91 189,815,999.91
Gongyi Tongda Zhongyuan Refractory Technology Co.,
Ltd. 3,967,009.95 3,967,009.95
Handan BBMG Taihang Cement Co., Ltd. 26,884,752.28 26,884,752.28
Beijing Taihang Prospect Environmental Protection
Technology Co., Ltd. (北京太行前景環保科技有限
公司) 9,482,871.64 9,482,871.64
Baoding Taihang Heyi Cement Co., Ltd. 11,428,946.82 11,428,946.82
Beijing Qianglian Cement Co., Ltd. (北京強聯水泥有限公司) 2,742,710.29 2,742,710.29
Tianjin Zhenxing Cement Co., Ltd. 10,931,009.96 10,931,009.96
Handan Shexian BBMG Cement Co., Ltd. 56,276,121.38 56,276,121.38
Jidong Cement Business 2,013,854,242.93 2,013,854,242.93
Jidong Equipment Business 477,549,380.23 477,549,380.23
2,802,933,045.39 2,802,933,045.39
Less: Provision for impairment of goodwill 62,645,395.59 62,645,395.59
2,740,287,649.80 2,740,287,649.80
Movements in provision for impairment of goodwill are as follows:
For the six months ended 30 June 2018
Opening balanceProvision for
the periodDecrease in the period Closing balance
Gongyi Tongda Zhongyuan
Refractory Technology
Co., Ltd. 3,967,009.95 – – 3,967,009.95Tianjin Zhenxing Cement
Co., Ltd. 10,931,009.96 – – 10,931,009.96Beijing Taihang Prospect
Environmental Protection
Technology Co., Ltd. (北京太行前景環保科技有限公司) 9,482,871.64 – – 9,482,871.64
Handan Shexian BBMG Cement
Co., Ltd. 35,521,793.75 – – 35,521,793.75Beijing Qianglian Cement
Co., Ltd. 2,742,710.29 – – 2,742,710.29
62,645,395.59 – – 62,645,395.59

200
Notes to Unaudited Interim Financial StatementsFor the six months ended 30 June 2018
RMB
V. NOTES TO KEY ITEMS OF CONSOLIDATED FINANCIAL STATEMENTS
(continued)
20. Goodwill (continued)
Movements in provision for impairment of goodwill are as follows: (continued)
2017
Opening balance
Provision for
the year
Decrease in
the year Closing balance
Gongyi Tongda Zhongyuan
Refractory Technology Co.,
Ltd. 3,967,009.95 – – 3,967,009.95
Tianjin Zhenxing Cement Co.,
Ltd. 10,931,009.96 – – 10,931,009.96
Beijing Taihang Prospect
Environmental Protection
Technology Co., Ltd. (北京太行前景環保科技有限公司) – 9,482,871.64 – 9,482,871.64
Handan Shexian BBMG Cement
Co., Ltd. 35,521,793.75 – – 35,521,793.75
Beijing Qianglian Cement Co.,
Ltd. 2,742,710.29 – – 2,742,710.29
53,162,523.95 9,482,871.64 – 62,645,395.59
Measurement basis and major assumptions for determining the recoverable amount of the above
assets groups are as follows:
The recoverable amount was determined based on the higher of the net amount of fair value of the
assets group less costs to sell and the present value of the estimated future cash flow of the asset.
The net amount of fair value of the assets group less costs to sell was adjusted based on the market
value of the interests held by the Group in the RMB denominated ordinary shares issued by way
of public issuance in the People’s Republic of China as at 30 June 2018, and determined after
deducting the transaction expenses and other necessary costs incurred on disposal of equity.
The estimated future cash flows are based on the five-year financial budget approved by the
management at a discount rate of 12% – 13% (2017: 10% – 11%). The estimated cash flows of
these assets groups beyond five years are determined at a fixed growth rate of 1%-3% (2017: 1% –
3%) per annum. Other key assumptions adopted during the evaluation include estimated production
capacity, future selling price, growth rate, expected gross profit margin and relevant expenditures of
the asset product portfolio, and the above assumptions are based on the previous performance of
these assets groups, industry standard and the management’s expectations on market development.

201BBMG CORPORATION
INTERIM REPORT 2018
Notes to Unaudited Interim Financial StatementsFor the six months ended 30 June 2018
RMB
V. NOTES TO KEY ITEMS OF CONSOLIDATED FINANCIAL STATEMENTS (continued)
21. Long-term deferred expenditures
For the six months ended 30 June 2018
Opening Increase
Increase in business combination
not under Amortisation Other Closing balance for the period common control for the period decreases balance
Decoration 117,765,888.69 23,680,930.21 18,265,390.25 (20,003,841.20) – 139,708,367.95Leasehold improvement for fixed
assets rented 20,425,942.92 2,503,324.00 524,044.30 (3,583,430.30) – 19,869,880.92
Land lease prepayments 338,573,072.61 8,725,359.00 – (10,883,605.42) (1,828,452.43) 334,586,373.76
Cost of stripping mines 494,325,767.23 29,024,506.60 – (11,182,612.17) (714,900.64) 511,452,761.02
Others 163,271,355.66 36,692,909.75 25,083.99 (31,417,552.64) (196,857.27) 168,374,939.49
1,134,362,027.11 100,627,029.56 18,814,518.54 (77,071,041.73) (2,740,210.34) 1,173,992,323.14
2017
Opening Increase
Increase in business
combination
not under Amortisation Other Closing
balance for the year common control for the year decreases balance
Decoration 112,437,313.26 46,839,545.96 – (33,395,860.73) (8,115,109.80) 117,765,888.69
Leasehold improvement for fixed
assets rented 22,292,358.49 7,977,768.61 – (9,844,184.18) – 20,425,942.92
Land lease prepayments 344,206,231.57 15,017,440.41 – (20,150,599.33) (500,000.04) 338,573,072.61
Cost of stripping mines 423,596,008.33 91,850,487.22 – (20,376,937.86) (743,790.46) 494,325,767.23
Others 110,271,037.21 108,356,116.60 22,101.66 (50,533,886.42) (4,844,013.39) 163,271,355.66
1,012,802,948.86 270,041,358.80 22,101.66 (134,301,468.52) (14,202,913.69) 1,134,362,027.11

202
Notes to Unaudited Interim Financial StatementsFor the six months ended 30 June 2018
RMB
V. NOTES TO KEY ITEMS OF CONSOLIDATED FINANCIAL STATEMENTS (continued)
22. Deferred income tax assets/liabilities
Deferred income tax assets and deferred income tax liabilities not eliminated:
30 June 2018 31 December 2017
Deductible Deductible
temporary Deferred income temporary Deferred income
differences tax assets differences tax assets
Deferred income tax assets
Provision for LAT 2,646,811,784.24 661,702,946.06 2,462,289,487.36 615,572,371.84
Deductible losses 3,090,721,299.76 772,680,324.94 2,743,348,954.68 685,837,238.67
Provision for impairment of assets 2,856,628,647.96 714,157,161.99 2,752,435,448.72 688,108,862.18
Difference in accounting and tax of
revenue recognition 59,676,356.24 14,919,089.06 74,968,816.36 18,742,204.09
Accrual of property development cost 2,650,282,979.32 662,570,744.83 2,699,765,097.60 674,941,274.40
Floating loss from other equity investment 45,942,594.56 11,485,648.64 – –
Unrealised profits and losses of internal
transactions 860,464,228.44 215,116,057.11 771,760,173.12 192,940,043.28
Others 417,670,239.48 104,417,559.87 303,470,784.88 75,867,696.22
12,628,198,130.00 3,157,049,532.50 11,808,038,762.72 2,952,009,690.68
The management of the Group considers it is probable that sufficient taxable profit will be available
in the future to offset the deductible temporary differences according to the profit forecast and hence
deferred income tax assets are recognized for the above items.
30 June 2018 31 December 2017
Taxable Taxable
temporary Deferred income temporary Deferred income
differences tax liabilities differences tax liabilities
Deferred income tax liabilities
Revaluation gains of investment properties 11,399,914,507.60 2,849,978,626.90 8,775,739,306.96 2,193,934,826.74
Deductiable difference of accumulated
depreciation 1,336,575,894.88 334,143,973.72 1,336,575,894.88 334,143,973.72
Fair value adjustment arising from business
combination 9,671,421,996.76 2,417,855,499.19 6,329,150,784.88 1,582,287,696.22
Floating profit from other equity investment – – 118,905,453.76 29,726,363.44
Deferred relocation compensation income 501,500,387.29 125,375,096.82 501,500,387.29 125,375,096.82
Others 878,102,460.20 219,525,615.05 833,033,202.55 208,258,300.64
23,787,515,246.73 5,946,878,811.68 17,894,905,030.32 4,473,726,257.58

203BBMG CORPORATION
INTERIM REPORT 2018
Notes to Unaudited Interim Financial StatementsFor the six months ended 30 June 2018
RMB
V. NOTES TO KEY ITEMS OF CONSOLIDATED FINANCIAL STATEMENTS (continued)
22. Deferred income tax assets/liabilities (continued)
Deductible losses and deductible temporary differences of unrecognised deferred income tax assets
are as follows:
30 June 2018 31 December 2017
Deductible losses 7,732,605,243.38 7,137,027,656.13
Deductible temporary differences 5,980,757,644.62 3,340,755,629.93
13,713,362,888.00 10,477,783,286.06
The deductible losses that are not recognised as deferred income tax assets will expire in the following
years:
30 June 2018 31 December 2017
2018 68,233,620.26 440,777,797.372019 174,749,956.28 107,555,461.592020 813,729,124.61 921,492,836.202021 3,632,982,329.64 3,625,822,913.212022 2,054,068,376.49 2,041,378,647.762023 988,841,836.10 –
7,732,605,243.38 7,137,027,656.13
23. Other non-current assets
30 June 2018 31 December 2017
Repurchase (1) 460,843,080.58 460,843,080.58Prepayment for projects, equipment and plants 1,036,263,108.98 397,704,657.68
Prepayment for lands 116,261,199.38 136,326,054.15
Prepayment for exploration rights 84,300,008.87 64,558,160.00
Cost of obtaining a contract
Sales commission (2) 86,683,928.02 –
1,784,351,325.83 1,059,431,952.41________________ ________________
(1) Chongqing BBMG Dacheng Shanshui Properties Co., Ltd., a sub-subsidiary of the Company, entered into an en bloc sales agreement for a commercial property in Chongqing. As the agreement provided for a possible repurchase after five years, management classified and presented the relevant commercial property with a carrying amount of RMB460,843,080.58 as other non-current assets. The relevant receipts in advance of RMB660,456,831.52 were classified and presented as other non-current liabilities.

204
Notes to Unaudited Interim Financial StatementsFor the six months ended 30 June 2018
RMB
V. NOTES TO KEY ITEMS OF CONSOLIDATED FINANCIAL STATEMENTS (continued)
23. Other non-current assets (continued)
(2) Cost of obtaining a contract refers to the sales commission occurred by the entering into a
sales contract of commodity housing and is amortized with the recognition of revenue from
relevant contract, details of which are the following:
For the six months ended 30 June 2018:
Opening
balance
Increase
in the period
Amortization
in the period
Closing
balance
(Restated)
Cost of obtaining a contract
Sales commission 102,779,248.45 11,832,335.34 (27,927,655.77) 86,683,928.02
24. Provisions for impairment of assets
For the six months ended 30 June 2018
Decrease in the year
Restated opening
balance
Provision in the
period
Acquisition of
subsidiaries
Transfered to
Assets held
for sale Reversal
Write-back/
Write-off Closing balance
Provision for bad debts: 3,634,145,129.27 185,058,171.32 361,294,932.85 (24,572,949.00) (230,562,054.66) (15,768,953.79) 3,909,594,275.99
Of which: Accounts receivable
(Note V.4) 2,231,874,010.93 134,679,988.89 219,885,802.98 (103,649.00) (140,353,265.16) (5,824,386.75) 2,440,158,501.89
Other receivables
(Note V.6) 1,337,072,759.55 50,378,182.43 141,409,129.87 – (82,010,304.01) (6,419,662.72) 1,440,430,105.12
Prepayments (Note V.5) 43,106,152.03 – – (24,469,300.00) (2,027,467.49) (3,524,904.32) 13,084,480.22
Long-term receivables (Note V.12) 22,092,206.76 – – – (6,171,018.00) – 15,921,188.76
Provision for decline in value of
inventories (Note V.7) 398,846,278.37 5,211,010.56 – – (2,120,107.32) (60,011,091.84) 341,926,089.77
Provision for impairment of fixed
assets (Note V.17) 430,754,975.01 8,973,295.92 – – – (12,010,115.22) 427,718,155.71
Provision for impairment of
construction materials (Note V.18) 49,774,053.47 1,836,360.22 – – – – 51,610,413.69
Provision for impairment of
intangible assets (Note V.19) 86,959,894.10 3,050,593.49 – – – – 90,010,487.59
Provision for impairment of goodwill
(Note V.20) 62,645,395.59 – – – – – 62,645,395.59
Others 2,754,674.63 – – – (790,102.17) – 1,964,572.46
4,665,880,400.44 204,129,431.51 361,294,932.85 (24,572,949.00) (233,472,264.15) (87,790,160.85) 4,885,469,390.80

205BBMG CORPORATION
INTERIM REPORT 2018
Notes to Unaudited Interim Financial StatementsFor the six months ended 30 June 2018
RMB
V. NOTES TO KEY ITEMS OF CONSOLIDATED FINANCIAL STATEMENTS (continued)
24. Provisions for impairment of assets (continued)
2017
Decrease in the period
Restated
opening Provision Acquisition of Disposal of Write-back/ Closing
balance for the period subsidiaries subsidiaries Reversal Write-off balance
Provision for bad debts: 3,606,558,585.22 905,930,357.85 102,894.45 (60,000.00) (718,031,387.88) (45,940,912.44) 3,748,559,537.20
Of which: Accounts receivable 2,250,876,050.03 550,190,679.03 42,894.45 – (355,573,980.57) (24,815,296.27) 2,420,720,346.67
Other receivables 1,315,581,001.81 348,610,117.91 60,000.00 (60,000.00) (359,123,810.99) (20,334,270.23) 1,284,733,038.50
Prepayments 40,101,533.38 7,129,560.91 – – (3,333,596.32) (791,345.94) 43,106,152.03
Provision for decline in value of inventories 562,623,327.42 157,895,884.03 956,633.12 – (53,824,950.33) (268,804,615.87) 398,846,278.37
Provision for impairment of available-for-sale
financial assets 7,304,165.76 – – – – – 7,304,165.76
Provision for impairment of fixed assets 268,262,049.46 182,149,063.71 – – – (19,656,138.16) 430,754,975.01
Provision for impairment of construction in
progress 20,996,906.10 29,548,536.87 – – – (771,389.50) 49,774,053.47
Provision for impairment of intangible assets 67,827,776.04 19,132,118.06 – – – – 86,959,894.10
Provision for impairment of goodwill 53,162,523.95 9,482,871.64 – – – – 62,645,395.59
Others 12,829.03 2,741,845.60 – – – – 2,754,674.63
4,586,748,162.98 1,306,880,677.76 1,059,527.57 (60,000.00) (771,856,338.21) (335,173,055.97) 4,787,598,974.13

206
Notes to Unaudited Interim Financial StatementsFor the six months ended 30 June 2018
RMB
V. NOTES TO KEY ITEMS OF CONSOLIDATED FINANCIAL STATEMENTS (continued)
25. Short–term loans
30 June 2018 31 December 2017
Guaranteed loans (Note 1) 2,392,500,000.00 1,840,000,000.00
Credit loans 34,414,970,000.00 32,029,900,000.00
Mortgaged loans (Note 2) 513,000,000.00 –
Pledged loans (Note 3) 816,050,000.00 505,300,000.00
38,136,520,000.00 34,375,200,000.00
Note 1: As at 30 June 2018, guaranteed loans were guaranteed by Tianjin Yishang Group Co., Ltd. (天津一商集團有限公司) in the amount of RMB540,000,000.00; and the remaining part was guaranteed by entities within the Group.
Note 2: As at 30 June 2018, breakdown of collateral in respect of the mortgaged loans of the Group and values thereof are set out in Note V.67.
Note 3: As at 30 June 2018, pledged loans of the Group included loans of RMB777,000,000.00 secured by equity interests with a carrying amount of RMB269,299,741.71, loans of RMB33,250,000.00 secured by deposit certificates and loans of RMB5,800,000.00 by discounting the bills receivable of the Group’s subsidiaries, details of which are set out in Note V.67.
As at 30 June 2018, the interest rates of the above loans were 2.80%-7.50% per annum (31 December
2017: 3.30%-8.40%). As at 30 June 2018, the Group had no outstanding loans that were due.
26. Bills payable and accounts payable
30 June 2018 31 December 2017
Bills payable 1,897,770,792.69 1,457,987,393.20
Including: Bank acceptance bills 1,712,698,812.75 1,448,906,903.71
Commercial acceptance bills 185,071,979.94 9,080,489.49
Account payables 15,658,429,010.10 15,747,091,122.08
17,556,199,802.79 17,205,078,515.28________________ ________________
As at the balance sheet date, the Group had no outstanding bills payable that were due and the bills
payable of the Group would be due in six months.

207BBMG CORPORATION
INTERIM REPORT 2018
Notes to Unaudited Interim Financial StatementsFor the six months ended 30 June 2018
RMB
V. NOTES TO KEY ITEMS OF CONSOLIDATED FINANCIAL STATEMENTS (continued)
26. Bills payable and accounts payable (continued)
Accounts payable are non-interest bearing and shall generally be paid within 90 days.
The aging analysis of bills payable and accounts payable were the following:
30 June 2018 31 December 2017
Within 1 year (inclusive) 14,551,318,323.51 14,872,129,418.17
1 to 2 years (inclusive) 1,844,204,318.93 1,199,775,599.39
2 to 3 years (inclusive) 371,391,738.43 551,774,237.03
Over 3 years 789,285,421.92 581,399,260.69
17,556,199,802.79 17,205,078,515.28________________ ________________
As at 30 June 2018, significant accounts payable of the Group aging over 1 year are as follows:
Name of
Customer
Relationship with
the Group Amount
Percentage of total
accounts
payable (%)
Reasons for
non–payment
Customer 60 Third party 40,300,000.00 0.26 construction yet
to be finished
Customer 61 Third party 34,713,828.85 0.22 In process
Customer 62 Third party 25,831,182.78 0.16 Payment of
materials
Customer 63 Third party 18,718,263.31 0.12 In process
Customer 64 Third party 16,951,326.02 0.11 In process
Customer 65 Third party 16,428,882.19 0.10 In process
Customer 66 Third party 15,540,117.07 0.10 In process
Customer 67 Third party 14,996,718.56 0.10 construction yet
to be finished
Customer 68 Third party 12,553,163.74 0.08 construction yet
to be finished
Customer 69 Third party 11,720,000.00 0.07 construction yet
to be finished

208
Notes to Unaudited Interim Financial StatementsFor the six months ended 30 June 2018
RMB
V. NOTES TO KEY ITEMS OF CONSOLIDATED FINANCIAL STATEMENTS (continued)
27. Contract liabilities
Opening balance
Increase in
the period
Carry-forward
revenue
Business combination
not under joint control Closing balance
(Restated)
Advances on pre-sale of properties 25,645,999,724.85 8,974,947,024.35 (10,113,222,869.16) 24,507,723,880.04
Advances on sale of goods 1,887,290,435.52 5,919,071,810.94 (6,003,429,644.89) 221,727,823.98 2,024,660,425.55
Advances on construction costs 215,280,517.23 247,695,131.41 (304,427,271.97) 80,204,853.63 238,753,230.30
Advances on property fees 329,964,956.12 245,483,887.98 (253,657,589.04) 321,791,255.06
28,078,535,633.72 15,387,197,854.68 (16,674,737,375.06) 301,932,677.61 27,092,928,790.95
Including: Non-current portion 8,629,285,598.74 4,601,637,197.88
Current portion 19,449,250,034.98 22,491,291,593.07
Details of advances on pre-sale of properties as at the balance sheet date are as follows:
Project
Expected
settlement
date of the
next batch
Proportion of
pre–sales 30 June 2018 31 December 2017
Beijing – Treasure Mansion House December 2018 81% 4,723,025,300.87 4,222,064,132.05
Hefei – Nanqi Garden December 2018 37% 3,758,333,447.66 2,295,969,583.00
Beijing – Wangchuan Beiyuan July 2018 56% 3,613,877,787.62 3,030,140,764.94
Qingdao – Beizutuan September 2018 68% 3,367,662,876.69 2,733,284,906.09
Beijing – Shunyi Jinchengyu
Garden (順義金成裕雅苑) January 2019 80% 1,742,739,654.96 1,070,430,125.00
Beijing – Jinyu Feili December 2018 100% 943,300,977.16 564,491,929.03
Nanjing – Jinyu Zijingfu June 2018 96% 871,324,307.18 3,543,777,965.70
Shanghai – Juyuan July 2018 63% 803,628,165.39 1,129,515,771.91
Haikou – Xixili December 2018 80% 645,663,513.78 623,698,987.70
Hangzhou – Guanlan Times December 2018 97% 615,011,376.82 693,820,353.46
Hangzhou – Jinyu Xuefu July 2018 93% 522,624,082.90 1,739,304,781.36
Beijing – Nankou housing with a
price cap December 2018 100% 434,205,485.68 391,628,128.81
Hangzhou – Banshan project September 2018 99% 269,597,057.69 300,187,537.56

209BBMG CORPORATION
INTERIM REPORT 2018
Notes to Unaudited Interim Financial StatementsFor the six months ended 30 June 2018
RMB
Project
Expected
settlement
date of the
next batch
Proportion of
pre–sales 30 June 2018 31 December 2017
Chongqing – Times Metro July 2018 55% 244,667,611.81 476,886,198.59
Inner Mongolia – Jinyu Global
Finance Centre September 2018 97% 229,286,652.16 97,339,051.11
Tangshan – Jinyu Lefu July 2018 85% 204,861,976.77 130,114,909.12
Beijing – Shangchengjun August 2018 69% 194,708,089.95 201,298,419.15
Beijing – Nankou Affordable
Housing December 2018 95% 182,865,169.20 169,434,021.00
Beijing -Changyang University of
Science and Technology September 2018 86% 155,372,713.59 163,606,689.88
Tianjin – Jinyu Yuecheng July 2018 99% 149,876,055.94 127,688,795.47
Chongqing – Nanshanjun July 2018 82% 130,304,516.83 93,134,275.43
Beijing – Chaoyang New City June 2019 100% 121,309,964.06 115,947,085.64
Tianjin – Jinyu Mantang July 2018 100% 63,684,201.48 105,044,999.19
Beijing – Jiaheyuan December 2018 95% 40,473,214.56 171,432,398.51
Hefei – Baohe Project April 2020 0.35% 31,221,695.00 –
Beijing – Chang’an New City December 2018 100% 28,513,839.74 32,614,620.00
Beijing – Tuqiao Phase III December 2018 95% 19,837,415.95 17,438,169.07
Inner Mongolia – Jinyu Times City September 2018 99% 16,741,991.01 21,107,694.51
Chengdu – Longxijun September 2018 93% 16,711,875.30 62,802,676.23
Beijing – Jinyu Town–House December 2018 100% 14,633,752.81 13,609,436.24
Inner Mongolia – Jinyu Elegancy
City September 2018 91% 14,562,141.56 5,840,910.89
Beijing – Meiheyuan December 2018 100% 13,567,052.94 10,045,138.83
Chengdu – Shuangliu project September 2018 100% 12,988,965.98 8,334,260.00
Beijing – Ruiheyuan December 2018 100% 12,186,223.62 10,413,331.89
Beijing – Jinyu Lanwan December 2018 98% 11,071,816.71 10,917,821.99
Beijing – Tuqiao Huashijiang December 2018 99% 9,911,179.37 14,811,929.84
Beijing – Kanghuiyuan December 2018 97% 8,912,710.07 5,532,743.55
Beijing – Dachengjun December 2018 99% 8,778,657.92 8,828,610.30
Beijing – Tuqiao Ziyouzhu December 2018 98% 5,273,473.60 5,311,155.62
V. NOTES TO KEY ITEMS OF CONSOLIDATED FINANCIAL STATEMENTS (continued)
27. Contract liabilities (continued)
Details of advances on pre-sale of properties as at the balance sheet date are as follows: (continued)

210
Notes to Unaudited Interim Financial StatementsFor the six months ended 30 June 2018
RMB
Project
Expected
settlement
date of the
next batch
Proportion of
pre–sales 30 June 2018 31 December 2017
Qingdao – Site in Jinggangshan
Rd. December 2018 99% 4,906,221.53 2,697,954.86
Beijing – Tuqiao Tongheyuan December 2018 100% 4,353,458.87 7,201,634.04
Beijing – Liyuan Jincheng Center December 2018 99% 4,064,641.89 4,036,546.66
Beijing – Jinyu Huijingyuan December 2018 100% 3,292,137.99 7,329,231.60
Beijing – Binheyuan December 2018 100% 2,709,593.88 3,328,752.28
Beijing – Jinyu Huixingyuan December 2018 100% 2,169,286.07 3,492,074.98
Beijing – Guogongzhuang project December 2018 94% 1,772,857.15 3,926,875.25
Beijing – I Cube December 2018 99% 708,775.13 3,189,128.01
Ma’anshan – Eastern Foot of
Jiashan Hill July 2018 91% 190,000.00 7,329,003.84
Beijing – Jinyu Vanke City December 2018 100% 10,000.00 10,000.00
Jidong Tangshan – Jin’anhongbao,
Lixin and Qixin July 2018 65% 134,283,209.70 197,281,742.68
Others 95,946,705.50 77,324,969.85
24,507,723,880.04 24,734,998,222.71
V. NOTES TO KEY ITEMS OF CONSOLIDATED FINANCIAL STATEMENTS (continued)
27. Contract liabilities (continued)
Details of advances on pre-sale of properties as at the balance sheet date are as follows: (continued)

211BBMG CORPORATION
INTERIM REPORT 2018
Notes to Unaudited Interim Financial StatementsFor the six months ended 30 June 2018
RMB
V. NOTES TO KEY ITEMS OF CONSOLIDATED FINANCIAL STATEMENTS (continued)
28. Wages payable
For the six months ended 30 June 2018
Opening balance
Increase in
the period
Decrease in
the period Closing balance
Short–term remunerations 297,848,583.63 2,470,744,011.10 (2,545,658,638.97) 222,933,955.76
Post–employment benefits
(defined contribution plan) 35,723,955.91 298,265,801.78 (316,440,581.45) 17,549,176.24
Termination benefits 32,014,591.22 7,841,000.00 (32,014,591.22) 7,841,000.00
365,587,130.76 2,776,850,812.88 (2,894,113,811.64) 248,324,132.00_______________ __________________ _________________ _______________
2017
Opening balance Increase in the year Decrease in the year Closing balance
Short–term remunerations 349,055,936.48 4,877,968,336.66 (4,929,175,689.51) 297,848,583.63
Post–employment benefits
(defined contribution plan) 48,200,679.31 592,019,626.82 (604,496,350.22) 35,723,955.91
Termination benefits 2,835,797.39 32,410,593.43 (3,231,799.60) 32,014,591.22
400,092,413.18 5,502,398,556.91 (5,536,903,839.33) 365,587,130.76_______________ __________________ _________________ _______________

212
Notes to Unaudited Interim Financial StatementsFor the six months ended 30 June 2018
RMB
V. NOTES TO KEY ITEMS OF CONSOLIDATED FINANCIAL STATEMENTS (continued)
28. Wages payable (continued)
Details of short–term remunerations are as follows:
For the six months ended 30 June 2018
Opening balance
Increase in
the period
Decrease in
the period Closing balance
Salaries, bonuses, allowances
and subsidies 208,846,996.99 1,922,634,328.67 (2,014,247,649.31) 117,233,676.35
Staff welfare – 140,495,494.09 (140,495,494.09) –
Social insurance 9,235,934.89 182,317,355.05 (184,296,406.61) 7,256,883.33
Of which: Medical insurance 7,649,678.21 154,755,592.03 (156,049,660.93) 6,355,609.31
Work injury insurance 1,175,668.47 17,754,193.24 (18,509,146.52) 420,715.19
Maternity insurance 410,588.21 9,807,569.78 (9,737,599.16) 480,558.83
Housing funds 7,694,117.71 162,247,702.90 (161,090,713.39) 8,851,107.22
Union fund and employee
education fund 52,350,745.92 46,260,805.95 (43,925,995.35) 54,685,556.52
Others 19,720,788.12 16,788,324.44 (1,602,380.22) 34,906,732.34
297,848,583.63 2,470,744,011.10 (2,545,658,638.97) 222,933,955.76_______________ __________________ _________________ _______________
2017
Opening balance
Increase in
the year
Decrease in
the year Closing balance
Salaries, bonuses, allowances
and subsidies 167,202,401.24 3,788,401,055.23 (3,746,756,459.48) 208,846,996.99
Staff welfare 4,801.00 300,544,606.01 (300,549,407.01) –
Social insurance 61,831,894.04 364,184,876.74 (416,780,835.89) 9,235,934.89
Of which: Medical insurance 59,346,531.02 308,105,177.52 (359,802,030.33) 7,649,678.21
Work injury insurance 1,901,642.71 38,526,443.16 (39,252,417.40) 1,175,668.47
Maternity insurance 583,720.31 17,553,256.06 (17,726,388.16) 410,588.21
Housing funds 19,416,158.00 308,581,387.61 (320,303,427.90) 7,694,117.71
Union fund and employee
education fund 47,415,963.38 82,378,144.13 (77,443,361.59) 52,350,745.92
Others 53,184,718.82 33,878,266.94 (67,342,197.64) 19,720,788.12
349,055,936.48 4,877,968,336.66 (4,929,175,689.51) 297,848,583.63_______________ __________________ _________________ _______________
As at the balance sheet date, there was no wages payable in arrears.

213BBMG CORPORATION
INTERIM REPORT 2018
Notes to Unaudited Interim Financial StatementsFor the six months ended 30 June 2018
RMB
V. NOTES TO KEY ITEMS OF CONSOLIDATED FINANCIAL STATEMENTS (continued)
28. Wages payable (continued)
Details of post–employment benefits (defined contribution plan) as at the balance sheet date are as
follows:
For the six months ended 30 June 2018
Opening
balance
Increase in
the period
Decrease in
the period
Closing
balance
Basic pension 34,016,342.42 267,792,679.81 (285,902,406.36) 15,906,615.87
Unemployment insurance 1,164,549.03 10,364,099.51 (10,473,918.66) 1,054,729.88
Corporate annuity 543,064.46 20,109,022.46 (20,064,256.43) 587,830.49
35,723,955.91 298,265,801.78 (316,440,581.45) 17,549,176.24_______________ __________________ _________________ _______________
2017
Opening
balance
Increase in
the year
Decrease in
the year
Closing
balance
Basic pension 42,595,443.29 532,439,843.90 (541,018,944.77) 34,016,342.42
Unemployment insurance 3,085,064.29 20,825,478.59 (22,745,993.85) 1,164,549.03
Corporate annuity 2,520,171.73 38,754,304.33 (40,731,411.60) 543,064.46
48,200,679.31 592,019,626.82 (604,496,350.22) 35,723,955.91
The Group participated in the pension insurance and unemployment insurance managed by local
government, to which the Group and employees made contributions based on 18%-20% and 8%
of the total wages in the previous year respectively. In addition, the Group also participated in the
corporate annuity scheme operated and managed by a competent external management organization,
to pay a certain percentage of annuity for eligible employees of enterprises.

214
Notes to Unaudited Interim Financial StatementsFor the six months ended 30 June 2018
RMB
V. NOTES TO KEY ITEMS OF CONSOLIDATED FINANCIAL STATEMENTS (continued)
29. Tax payable
30 June 2018 31 December 2017
Corporate income tax 1,084,245,243.86 982,515,360.34
VAT 562,960,573.58 397,466,917.54
Land appreciation tax 95,670,224.19 181,605,784.99
Real estate tax 81,183,173.22 40,607,067.92
Urban and rural land use tax 60,616,020.50 25,169,007.14
Resource tax 11,879,047.30 7,260,281.07
Individual income tax 10,102,877.68 24,725,077.76
City maintenance and construction tax 35,995,711.32 25,632,955.58
Education surcharges 31,329,015.21 20,498,275.73
Business tax 15,235,856.40 461,068.69
Deed tax and others 633,682,327.79 63,318,370.85
2,622,900,071.05 1,769,260,167.61

215BBMG CORPORATION
INTERIM REPORT 2018
Notes to Unaudited Interim Financial StatementsFor the six months ended 30 June 2018
RMB
V. NOTES TO KEY ITEMS OF CONSOLIDATED FINANCIAL STATEMENTS (continued)
30. Other payables
30 June 2018 31 December 2017
Interests payable 824,967,388.84 858,108,769.82
Interests on borrowings 707,942,681.09 136,525,059.42
Of which: Interests on long–term borrowings 21,560,833.45 56,329,360.17
Interests on short–term borrowings 686,381,847.64 80,195,699.25
Interests of corporate bonds 117,024,707.75 721,583,710.40
Dividends payable 1,037,090,703.52 190,801,504.66
Dividends payable to minority shareholders 19,450,317.14 35,182,953.10
Sinoma 38,847,720.00 16,770,600.00
Other shareholders 495,216,456.32 4,760,561.89
Interests on perpetual bonds 483,576,210.06 134,087,389.67
Other payables 7,055,410,482.40 8,026,337,535.37
Amounts collected on behalf and temporary receipts 3,185,785,086.20 2,911,688,273.45
Deposits 1,857,601,660.85 1,549,719,228.45
Payables for land use right 153,204,868.98 2,056,379,654.91
Construction costs payable 189,927,986.85 179,517,391.27
Payables for relocation compensation 192,908,005.94 260,196,816.96
Freight and miscellaneous charges payable 164,002,141.09 178,953,768.60
Payables for acquisition of equity investments 43,978,417.50 49,782,791.64
Payables to related parties (Note X.7) 3,421,843.92 1,380,753.06
Utilities 66,107,442.08 65,110,139.65
Public maintenance fund payable 52,968,889.18 47,872,372.87
Current portion of net liabilities of defined benefit
plan (Note V.36) 69,848,478.69 70,648,301.69
Others 1,075,655,661.12 655,088,042.82
8,917,468,574.76 9,075,247,809.85

216
Notes to Unaudited Interim Financial StatementsFor the six months ended 30 June 2018
RMB
V. NOTES TO KEY ITEMS OF CONSOLIDATED FINANCIAL STATEMENTS (continued)
30. Other payables (continued)
As at 30 June 2018, significant other payables of the Group aging more than one year are as follows:
Relationship
with the Group Amount
Percentage
of total other
payables
Reasons for
non–payment
(%)
Customer 70 Third party 184,159,559.25 2.07 Not yet settled
Customer 71 Third party 103,401,947.89 1.16 Not yet settled
Customer 72 Third party 55,782,501.50 0.63 Not yet settled
Customer 73 Third party 52,783,085.77 0.59 Not yet settled
Customer 74 Third party 52,000,000.00 0.58 Not yet settled
31. Non–current liabilities due within one year
30 June 2018 31 December 2017
Long–term loans due within one year (Note V.33) 6,122,471,290.77 2,402,037,997.00
Bonds payable due within one year (Note V.34) 6,267,948,424.60 8,374,629,908.13
Long–term payables due within one year (Note V.35) 658,843,190.35 714,771,870.46
13,049,262,905.72 11,491,439,775.59________________ ________________
Details of long–term loans due within one year are as follows:
30 June 2018 31 December 2017
Guaranteed loans 1,065,550,000.00 502,600,000.00
Credit loans 3,125,241,290.77 1,741,897,997.00
Mortgaged loans 1,691,980,000.00 157,540,000.00
Pledged loans 239,700,000.00 –
6,122,471,290.77 2,402,037,997.00________________ ________________

217BBMG CORPORATION
INTERIM REPORT 2018
Notes to Unaudited Interim Financial StatementsFor the six months ended 30 June 2018
RMB
V. NOTES TO KEY ITEMS OF CONSOLIDATED FINANCIAL STATEMENTS (continued)
32. Other current liabilities
30 June 2018 31 December 2017
Accrued expenses
Of which: Accrued development cost 3,132,295,599.05 3,272,200,988.66
Provision for LAT 2,647,805,312.95 2,562,713,668.13
Accrued costs for treatment of solid wastes 189,661,666.68 127,089,285.59
Other accrued expenses 62,109,869.42 80,353,067.65________________
6,031,872,448.10 6,042,357,010.03________________ ________________

218
Notes to Unaudited Interim Financial StatementsFor the six months ended 30 June 2018
RMB
V. NOTES TO KEY ITEMS OF CONSOLIDATED FINANCIAL STATEMENTS (continued)
33. Long–term borrowings
30 June 2018 31 December 2017
Mortgaged loans (Note 1) 7,862,330,000.00 6,704,237,997.00
Guaranteed loans (Note 2) 7,576,700,000.00 6,507,360,000.00
Credit loans 16,519,510,640.74 11,921,470,000.00
Pledged loans (Note 1) 3,299,200,000.00 2,940,000,000.00
Closing balance 35,257,740,640.74 28,073,067,997.00
Less: Long–term loans due within one year (Note V.31) 6,122,471,290.77 2,402,037,997.00
Non–current portion 29,135,269,349.97 25,671,030,000.00________________ _________________
An analysis on maturity of long–term loans as at the balance sheet date is as follows:
30 June 2018 31 December 2017
Within 1 year (inclusive) 6,122,471,290.77 2,402,037,997.00
1 to 2 years (inclusive) 7,233,870,000.00 5,347,800,000.00
2 to 3 years (inclusive) 9,702,800,000.00 12,323,760,000.00
3 to 4 years (inclusive) 3,418,750,000.00 680,000,000.00
4 to 5 years (inclusive) 223,750,000.00 800,000,000.00
Over 5 years 8,556,099,349.97 6,519,470,000.00
35,257,740,640.74 28,073,067,997.00
For the six months ended 30 June 2018, the above loans bore interest rates of 1.2%-10.50% (2017:
1.2%-10.34%) per annum.
Note 1: As at 30 June 2018, details and value of collaterals corresponding to mortgaged and pledged loans of the Group are set out in note V. 67.
Note 2: As at the balance sheet date, the guaranteed loans of the Group were guaranteed by the Group and its subsidiaries.

219BBMG CORPORATION
INTERIM REPORT 2018
Notes to Unaudited Interim Financial StatementsFor the six months ended 30 June 2018
RMB
V. NOTES TO KEY ITEMS OF CONSOLIDATED FINANCIAL STATEMENTS (continued)
34. Short-term Financing Bonds and Bonds Payable
30 June 2018 31 December 2017
Corporate bonds 18,239,119,030.33 15,230,995,736.64
Medium–term notes 7,000,000,000.00 5,000,000,000.00
Private bonds 500,000,000.00 5,798,475,000.00
Debt financing plan 500,000,000.00 500,000,000.00
Balance at the end of the period/year 26,239,119,030.33 26,529,470,736.64
Including: Bonds payable within one year (Note V.31) 6,267,948,424.60 8,374,629,908.13
Non-current portion 19,971,170,605.73 18,154,840,828.51
30 June 2018 31 December 2017
Analysis of maturity of bonds payable:
within 1 year (inclusive) 6,267,948,424.60 8,374,629,908.13
1 to 2 years (inclusive) 6,732,856,872.66 9,420,108,004.27
2 to 5 years (inclusive) 13,238,313,733.07 8,734,732,824.24
26,239,119,030.33 26,529,470,736.64
Current portion
Short-term financing bonds 5,500,000,000.00 2,769,698,081.12
As at the balance sheet date, the short-term financing bonds above would be due within one year.

220
Notes to Unaudited Interim Financial StatementsFor the six months ended 30 June 2018
RMB
V.
NO
TES
TO K
EY I
TEM
S O
F C
ON
SOLI
DA
TED
FIN
AN
CIA
L ST
ATE
MEN
TS (c
ontin
ued)
34.
Sho
rt-t
erm
Fin
anci
ng
Bo
nd
s an
d B
on
ds
Paya
ble
(con
tinue
d)
For
the
six
mo
nth
s en
d 3
0 Ju
ne
2018
Par va
lueIssu
ance d
ateTer
mIssu
ance a
mount
Openi
ng bal
ance
Issuanc
e amo
unt
during
the p
eriod
Busine
ss
combin
ation n
ot
under
joint co
ntrol
Intere
st char
ged
during
the p
eriod
Amort
isatio
n of
discou
nt/pre
mium
Repaym
ent du
ring
the pe
riod
Reclas
sified
to due
withi
n
one ye
arClo
sing b
alance
Non–cu
rrent po
rtion:
1) RMB
1.5 bil
lion me
dium–
term no
tesRM
B1.5 b
illion
14 Oct
ober 20
135 y
ears
1,500,
000,00
0.00
1,500,
000,00
0.00
––
43,500
,000.0
0–
–(1,5
00,000
,000.0
0)–
2) RMB
2 billio
n medi
um–te
rm not
esRM
B2 billi
on15
Octobe
r 2014
5 year
s2,0
00,000
,000.0
02,0
00,000
,000.0
0–
–53,
500,00
0.00
––
–2,0
00,000
,000.0
0
2) RMB
1.5 bil
lion me
dium–
term no
tesRM
B1.5 b
illion
17 Nov
ember
2014
5 year
s1,5
00,000
,000.0
01,5
00,000
,000.0
0–
–39,
750,00
0.00
––
–1,5
00,000
,000.0
0
3) RMB
2 billio
n priva
te bond
sRM
B2 billi
on5 F
ebruar
y 2015
3 year
s2,0
00,000
,000.0
02,0
00,000
,000.0
0–
–11,
000,00
0.00
–(2,0
00,000
,000.0
0)–
–
3) RMB
2.5 bil
lion pri
vate b
onds
RMB2.
5 billio
n19
March
2015
3 year
s2,5
00,000
,000.0
02,5
00,000
,000.0
0–
–30,
333,33
3.33
–(2,5
00,000
,000.0
0)–
–
3) RMB
0.5 bil
lion pri
vate b
onds
RMB0.
5 billio
n20
July 20
153 y
ears
500,00
0,000.
00500
,000,0
00.00
––
12,875
,000.0
0–
–(50
0,000,
000.00
)–
4) RMB
3.2 bil
lion co
rporate
bonds
RMB3.
2 billio
n14
March
2016
3 year
s3,2
00,000
,000.0
03,1
88,753
,555.1
9–
–51,
655,82
6.84
1,703,
017.38
–(3,1
90,456
,572.5
7)–
4) RMB
1.8 bil
lion co
rporate
bonds
RMB1.
8 billio
n14
March
2016
5 year
s1,8
00,000
,000.0
01,7
92,420
,728.6
1–
–32,
171,36
7.73
657,33
8.76
––
1,793,
078,06
7.37
5) RMB
0.8 bil
lion co
rporate
bonds
RMB0.
8 billio
n13
Septem
ber 20
127 y
ears
800,00
0,000.
0038,
911,20
0.00
––
1,218,
402.74
26,400
.00–
–38,
937,60
0.00
6) RMB
0.3 bil
lion pri
vate b
onds
RMB0.
3 billio
n4 M
ay 201
53 y
ears
300,00
0,000.
00298
,475,0
00.00
––
7,076,
712.33
300,00
0.00
(298,7
75,000
.00)
––
6) RMB
0.5 bil
lion pri
vate b
onds
RMB0.
5 billio
n3 Ju
ne 201
53 y
ears
500,00
0,000.
00500
,000,0
00.00
––
14,101
,369.7
5575
,000.0
0(50
0,575,
000.00
)–
–
7) RMB
1.6 bil
lion co
rporate
bonds
RMB1.
6 billio
n30
August
2011
7 year
s1,6
00,000
,000.0
01,0
76,154
,908.1
3–
–33,
847,23
7.50
1,336,
943.90
–(1,0
77,491
,852.0
3)–
7) RMB
0.9 bil
lion co
rporate
bonds
RMB0.
9 billio
n20
March
2012
8 year
s900
,000,0
00.00
415,40
0,880.
64–
–11,
681,59
0.50
698,44
7.48
––
416,09
9,328.
12
8) RMB
0.45 b
illion c
orpora
te bond
sRM
B0.45
billion
15 Oct
ober 20
127 y
ears
450,00
0,000.
00449
,128,8
18.21
––
13,275
,000.0
0235
,220.3
9–
–449
,364,0
38.60
8) RMB
0.8 bil
lion co
rporate
bonds
RMB0.
8 billio
n15
Octobe
r 2012
10 yea
rs800
,000,0
00.00
797,10
4,074.
72–
–24,
000,00
0.00
266,22
6.61
––
797,37
0,301.
33
9) RMB
3.5 bil
lion co
rporate
bonds
RMB3.
5 billio
n19
May 2
0175 y
ears
3,500,
000,00
0.00
3,487,
864,53
2.24
––
92,242
,798.0
91,2
27,999
.11–
–3,4
89,092
,531.3
5
9) RMB
0.5 bil
lion co
rporate
bonds
RMB0.
5 billio
n19
May 2
0177 y
ears
500,00
0,000.
00498
,195,6
88.05
––
13,569
,591.4
6118
,125.4
4–
–498
,313,8
13.49
10) RM
B1.25
billion
corpo
rate bo
ndsRM
B1.25
billion
13 July
2017
2 year
s1,2
50,000
,000.0
01,2
45,844
,212.9
3–
–33,
270,58
5.28
770,58
5.28
––
1,246,
614,79
8.21

221BBMG CORPORATION
INTERIM REPORT 2018
Notes to Unaudited Interim Financial StatementsFor the six months ended 30 June 2018
RMB
Par va
lueIssu
ance d
ateTer
mIssu
ance a
mount
Openi
ng bal
ance
Issuanc
e amo
unt
during
the p
eriod
Busine
ss
combin
ation n
ot
under
joint co
ntrol
Intere
st char
ged
during
the p
eriod
Amort
isatio
n of
discou
nt/pre
mium
Repaym
ent du
ring
the pe
riod
Reclas
sified
to due
withi
n
one ye
arClo
sing b
alance
Non–cu
rrent po
rtion: (
continu
ed)
11) RM
B1.75
billion
corpo
rate bo
ndsRM
B1.75
billion
13 July
2017
3 year
s1,7
50,000
,000.0
01,7
43,746
,919.9
8–
–46,
987,77
1.40
612,77
1.42
––
1,744,
359,69
1.40
12) RM
B0.5 b
illion s
hort-te
rm bon
dsRM
B0.5 b
illion
17 Nov
ember
2017
2 year
s500
,000,0
00.00
500,00
0,000.
00–
–13,
750,00
0.00
––
–500
,000,0
00.00
13) RM
B0.5 b
illion c
orpora
te bond
sRM
B0.5 b
illion
30 Jun
e 2017
3 year
s500
,000,0
00.00
497,47
0,217.
94–
–14,
950,00
0.00
470,21
7.92
––
497,94
0,435.
86
14) RM
B2 billi
on me
dium–
term no
tesRM
B2 billi
on22
Januar
y 2018
5 year
s2,0
00,000
,000.0
0–
2,000,
000,00
0.00
–51,
675,00
0.00
––
–2,0
00,000
,000.0
0
15) RM
B0.5 b
illion s
hort-te
rm bon
dsRM
B0.5 b
illion
27 Feb
ruary 2
0183+2
years
500,00
0,000.
00–
500,00
0,000.
00–
9,908,
333.33
––
–500
,000,0
00.00
16) RM
B2.5 b
illion s
hort-te
rm bon
dsRM
B2.5 b
illion
25 Jun
e 2018
3 year
s2,5
00,000
,000.0
0–
2,500,
000,00
0.00
–2,1
87,500
.00–
––
2,500,
000,00
0.00
33,350
,000,0
00.00
26,529
,470,7
36.64
5,000,
000,00
0.00
–658
,527,4
20.28
8,998,
293.69
(5,299,
350,00
0.00)
(6,267,
948,42
4.60)
19,971
,170,6
05.73
Curren
t portio
n:
17) RM
B1 billi
on sho
rt-term
financ
ing bo
ndsRM
B1 billi
on21
June 2
017270
days
1,000,
000,00
0.00
799,69
8,081.
12–
––
–(79
9,698,
081.12
)–
–
18) RM
B2 billi
on ultr
ashort
financin
g bond
sRM
B2 billi
on28
Septem
ber 20
17270
days
2,000,
000,00
0.00
1,970,
000,00
0.00
––
47,638
,888.8
9–
(1,970,
000,00
0.00)
––
19) RM
B2 billi
on ultr
ashort
financin
g bond
sRM
B2 billi
on29
Januar
y 2018
180 da
ys2,0
00,000
,000.0
0–
2,000,
000,00
0.00
–44,
755,55
5.56
––
–2,0
00,000
,000.0
0
20) RM
B2 billi
on ultr
ashort
financin
g bond
sRM
B2 billi
on5 M
arch 2
018180
days
2,000,
000,00
0.00
–2,0
00,000
,000.0
0–
33,345
,000.0
0–
––
2,000,
000,00
0.00
21) RM
B1.5 b
illion u
ltrasho
rt fina
ncing b
onds
RMB1.
5 billio
n23
April 2
018270
days
1,500,
000,00
0.00
–1,5
00,000
,000.0
0–
13,005
,000.0
0–
––
1,500,
000,00
0.00
8,500,
000,00
0.00
2,769,
698,08
1.12
5,500,
000,00
0.00
–138
,744,4
44.45
–(2,7
69,698
,081.1
2)–
5,500,
000,00
0.00
41,850
,000,0
00.00
29,299
,168,8
17.76
10,500
,000,0
00.00
–797
,271,8
64.73
8,998,
293.69
(8,069,
048,08
1.12)
(6,267,
948,42
4.60)
25,471
,170,6
05.73
V.
NO
TES
TO K
EY I
TEM
S O
F C
ON
SOLI
DA
TED
FIN
AN
CIA
L ST
ATE
MEN
TS (c
ontin
ued)
34.
Sho
rt-t
erm
Fin
anci
ng
Bo
nd
s an
d B
on
ds
Paya
ble
(con
tinue
d)
For
the
six
mo
nth
s en
d 3
0 Ju
ne
2018
(con
tinue
d)

222
Notes to Unaudited Interim Financial StatementsFor the six months ended 30 June 2018
RMB
V.
NO
TES
TO K
EY I
TEM
S O
F C
ON
SOLI
DA
TED
FIN
AN
CIA
L ST
ATE
MEN
TS (c
ontin
ued)
34.
Sho
rt-t
erm
Fin
anci
ng
Bo
nd
s an
d B
on
ds
Paya
ble
(con
tinue
d)
2017
Par va
lueIssu
ance d
ateTer
mIssu
ance a
mount
Openi
ng bal
ance
Issuanc
e amo
unt
during
the ye
ar
Busine
ss
combin
ation n
ot
under j
oint co
ntrol
Interest
charg
ed
during
the ye
ar
Amorti
sation
of
discoun
t/prem
ium
Repaym
ent
during
the ye
ar
Reclass
ified to
due
within
one y
earClo
sing ba
lance
Non–cu
rrent po
rtion:
RMB2
billion
mediu
m–term
notes
RMB2
billion
20 Sep
tember
2012
5 year
s2,0
00,000
,000.0
02,0
00,000
,000.0
0–
–80,
600,00
0.00
–(2,0
00,000
,000.0
0)–
–
1) RMB
1.5 bil
lion me
dium–
term no
tesRM
B1.5 b
illion
14 Oct
ober 20
135 y
ears
1,500,
000,00
0.00
1,500,
000,00
0.00
––
87,000
,000.0
0–
–(1,5
00,000
,000.0
0)–
2) RMB
2 billio
n medi
um–te
rm not
esRM
B2 billi
on15
Octobe
r 2014
5 year
s2,0
00,000
,000.0
02,0
00,000
,000.0
0–
–107
,000,0
00.00
––
–2,0
00,000
,000.0
0
2) RMB
1.5 bil
lion me
dium–
term no
tesRM
B1.5 b
illion
17 Nov
ember
2014
5 year
s1,5
00,000
,000.0
01,5
00,000
,000.0
0–
–79,
500,00
0.00
––
–1,5
00,000
,000.0
0
3) RMB
2 billio
n priva
te bond
sRM
B2 billi
on5 F
ebruar
y 2015
3 year
s2,0
00,000
,000.0
02,0
00,000
,000.0
0–
–110
,000,0
00.00
––
(2,000,
000,00
0.00)
–
3) RMB
2.5 bil
lion pri
vate b
onds
RMB2.
5 billio
n19
March
2015
3 year
s2,5
00,000
,000.0
02,5
00,000
,000.0
0–
–136
,500,0
00.00
––
(2,500,
000,00
0.00)
–
3) RMB
0.5 bil
lion pri
vate b
onds
RMB0.
5 billio
n20
July 20
153 y
ears
500,00
0,000.
00500
,000,0
00.00
––
25,750
,000.0
0–
–(50
0,000,
000.00
)–
4) RMB
3.2 bil
lion co
rporate
bonds
RMB3.
2 billio
n14
March
2016
5 year
s3,2
00,000
,000.0
03,1
85,369
,201.7
7–
–103
,224,3
53.43
3,384,
353.42
––
3,188,
753,55
5.19
4) RMB
1.8 bil
lion co
rporate
bonds
RMB1.
8 billio
n14
March
2016
7 year
s1,8
00,000
,000.0
01,7
91,115
,290.5
3–
–64,
305,43
8.09
1,305,
438.08
––
1,792,
420,72
8.61
9) RMB
3.5 bil
lion co
rporate
bonds
RMB3.
5 billio
n19
May 2
0175 y
ears
3,500,
000,00
0.00
–3,5
00,000
,000.0
0–
113,74
7,865.
59(12
,135,4
67.76)
––
3,487,
864,53
2.24
9) RMB
0.5 bil
lion co
rporate
bonds
RMB0.
5 billio
n19
May 2
0177 y
ears
500,00
0,000.
00–
500,00
0,000.
00–
16,734
,021.4
0(1,8
04,311
.95)
––
498,19
5,688.
05
10) RM
B1.25
billion
corpor
ate bo
ndsRM
B1.25
billion
13 July
2017
2 year
s1,2
50,000
,000.0
0–
1,250,
000,00
0.00
–31,
052,54
6.27
(4,155,
787.07
)–
–1,2
45,844
,212.9
3
11) RM
B1.75
billion
corpo
rate bo
ndsRM
B1.75
billion
13 July
2017
3 year
s1,7
50,000
,000.0
0–
1,750,
000,00
0.00
–43,
855,25
3.31
(6,253,
080.02
)–
–1,7
43,746
,919.9
8
12) De
bt fina
ncing p
lanRM
B0.5 b
illion
17 Nov
ember
2017
2 year
s500
,000,0
00.00
–500
,000,0
00.00
–3,3
15,068
.49–
––
500,00
0,000.
00
5) RMB
0.8 bil
lion co
rporate
bonds
RMB0.
8 billio
n13
Septem
ber 20
127 y
ears
800,00
0,000.
00797
,106,0
00.00
––
35,820
,073.9
52,8
05,200
.00(76
1,000,
000.00
)–
38,911
,200.0
0
RMB
1.5 bil
lion co
rporate
bonds
RMB1.
5 billio
n24
July 20
153 y
ears
1,500,
000,00
0.00
1,495,
500,00
0.00
––
62,067
,945.2
14,5
00,000
.00(1,5
00,000
,000.0
0)–
–
2007
corpo
rate bo
ndsRM
B0.6 b
illion
1 Augu
st 2007
10 yea
rs600
,000,0
00.00
598,09
7,435.
08–
–19,
215,00
0.00
1,902,
564.92
(600,0
00,000
.00)
––
Jido
ng RM
B0.1 b
illion p
rivate b
onds
RMB0.
1 billio
n20
May 2
0143 y
ears
100,00
0,000.
0099,
882,37
1.87
––
2,670,
967.74
117,62
8.13
(100,0
00,000
.00)
––
Jido
ng RM
B0.9 b
illion p
rivate b
onds
RMB0.
9 billio
n19
Septem
ber 20
143 y
ears
900,00
0,000.
00898
,129,1
25.34
––
39,000
,000.0
01,8
70,874
.66(90
0,000,
000.00
)–
–
7) RMB
1.6 bil
lion co
rporate
bonds
RMB1.
6 billio
n30
August
2011
7 year
s1,6
00,000
,000.0
01,0
73,589
,155.2
4–
–67,
694,47
5.00
2,565,
752.89
–(1,0
76,154
,908.1
3)–
7) RMB
0.9 bil
lion co
rporate
bonds
RMB0.
9 billio
n20
March
2012
8 year
s900
,000,0
00.00
895,36
6,562.
66–
–30,
077,38
5.75
1,339,
317.98
(481,3
05,000
.00)
–415
,400,8
80.64
8) RMB
0.8 bil
lion co
rporate
bonds
RMB0.
8 billio
n15
Octobe
r 2012
5 year
s800
,000,0
00.00
799,07
3,408.
72–
–35,
783,33
3.33
926,59
1.28
(800,0
00,000
.00)
––

223BBMG CORPORATION
INTERIM REPORT 2018
Notes to Unaudited Interim Financial StatementsFor the six months ended 30 June 2018
RMB
Par va
lueIssu
ance d
ateTer
mIssu
ance a
mount
Openi
ng bal
ance
Issuanc
e amo
unt
during
the ye
ar
Busine
ss
combin
ation n
ot
under j
oint co
ntrol
Interest
charg
ed
during
the ye
ar
Amorti
sation
of
discoun
t/prem
ium
Repaym
ent
during
the ye
ar
Reclass
ified to
due
within
one y
earClo
sing ba
lance
Non–cu
rrent po
rtion: (
continu
ed)
8) RMB
0.45 b
illion c
orpora
te bond
sRM
B0.45
billion
15 Oct
ober 20
127 y
ears
450,00
0,000.
00448
,679,5
16.54
––
26,550
,000.0
0449
,301.6
7–
–449
,128,8
18.21
8) RMB
0.8 bil
lion co
rporate
bonds
RMB0.
8 billio
n15
Octobe
r 2012
10 yea
rs800
,000,0
00.00
796,59
5,816.
71–
–48,
000,00
0.00
508,25
8.01
––
797,10
4,074.
72
6) RMB
0.3 bil
lion pri
vate b
onds
RMB0.
3 billio
n4 M
ay 201
53 y
ears
300,00
0,000.
00296
,075,0
00.00
––
21,632
,876.7
12,4
00,000
.00–
(298,4
75,000
.00)
–
6) RMB
0.5 bil
lion pri
vate b
onds
RMB0.
5 billio
n3 Ju
ne 201
53 y
ears
500,00
0,000.
00500
,000,0
00.00
––
34,000
,000.0
0–
–(50
0,000,
000.00
)–
13) RM
B0.5 b
illion c
orpora
te bond
sRM
B0.5 b
illion
30 Jun
e 2017
3 year
s500
,000,0
00.00
–497
,000,0
00.00
–14,
950,00
0.00
470,21
7.94
––
497,47
0,217.
94
34,250
,000,0
00.00
25,674
,578,8
84.46
7,997,
000,00
0.00
–1,4
40,046
,604.2
7196
,852.1
8(7,1
42,305
,000.0
0)(8,3
74,629
,908.1
3)18,
154,84
0,828.
51
Curren
t portio
n:
RMB3
billion
ultrash
ort fina
ncing b
onds
RMB3
billion
20 Ma
y 2016
266 da
ys3,0
00,000
,000.0
03,0
00,000
,000.0
0–
–11,
633,33
3.33
–(3,0
00,000
,000.0
0)–
–
RMB3
billion
ultrash
ort fina
ncing b
onds
RMB3
billion
13 Jan
uary 2
01788
days
3,000,
000,00
0.00
–3,0
00,000
,000.0
0–
29,250
,000.0
0–
(3,000,
000,00
0.00)
––
RMB3
billion
ultrash
ort fina
ncing b
onds
RMB3
billion
14 Ma
rch 20
17245
days
3,000,
000,00
0.00
–3,0
00,000
,000.0
0–
40,838
,333.3
3–
(3,000,
000,00
0.00)
––
17) RM
B1 billi
on sho
rt-term
financ
ing bo
ndsRM
B1 bill
ion21
June 2
017270
days
1,000,
000,00
0.00
–798
,620,0
00.00
–26,
893,44
2.62
1,078,
081.12
––
799,69
8,081.
12
18) RM
B2 billi
on ultr
ashort
financin
g bond
sRM
B2 billi
on28
Septem
ber 20
17270
days
2,000,
000,00
0.00
–2,0
00,000
,000.0
0–
24,969
,863.0
1–
(30,00
0,000.
00)–
1,970,
000,00
0.00
12,000
,000,0
00.00
3,000,
000,00
0.00
8,798,
620,00
0.00
–133
,584,9
72.29
1,078,
081.12
(9,030,
000,00
0.00)
–2,7
69,698
,081.1
2
46,250
,000,0
00.00
28,674
,578,8
84.46
16,795
,620,0
00.00
–1,5
73,631
,576.5
61,2
74,933
.30(16
,172,3
05,000
.00)
(8,374,
629,90
8.13)
20,924
,538,9
09.63
V.
NO
TES
TO K
EY I
TEM
S O
F C
ON
SOLI
DA
TED
FIN
AN
CIA
L ST
ATE
MEN
TS (c
ontin
ued)
34.
Sho
rt-t
erm
Fin
anci
ng
Bo
nd
s an
d B
on
ds
Paya
ble
(con
tinue
d)
2017
(con
tinue
d)

224
Notes to Unaudited Interim Financial StatementsFor the six months ended 30 June 2018
RMB
V. NOTES TO KEY ITEMS OF CONSOLIDATED FINANCIAL STATEMENTS (continued)
34. Short-term Financing Bonds and Bonds Payable (continued)
1) Pursuant to the document Zhong Shi Xie Zhu [2013] No. MTN279 issued by the National
Association of Financial Market Institutional Investors (hereinafter referred to as the “NAFMII”),
the Company issued its first tranche of medium-term notes for 2013 on 14 October 2013,
totaling RMB1,500,000,000 with a term of 5 years and a coupon rate of 5.8%.
2) Pursuant to the document Zhong Shi Xie Zhu [2014] No. MTN316 issued by the National
Association of Financial Market Institutional Investors, the Company issued its first tranche of
medium-term notes for 2014 on 15 October 2014, totaling RMB2,000,000,000 with a term of
5 years and a coupon rate of 5.35%; and the Company issued its second tranche of medium-
term notes for 2014 on 17 November 2014, totaling RMB1,500,000,000 with a term of 5 years
and a coupon rate of 5.3%.
3) Pursuant to the document Zhong Shi Xie Zhu [2014] No. PPN570 issued by the National
Association of Financial Market Institutional Investors, the Company issued its first tranche
of private placement notes for 2015 on 5 February 2015, totaling RMB2,000,000,000 with
a term of 3 years and a coupon rate of 5.50%; the Company issued its second tranche of
private placement notes for 2015 on 19 March 2015, totaling RMB2,500,000,000 with a term
of 3 years and a coupon rate of 5.46%; and the Company issued its third tranche of private
placement notes for 2015 on 20 July 2015, totaling RMB500,000,000 with a term of 3 years
and a coupon rate of 5.15%.
4) Upon consideration and approval by the 27th meeting of the 3rd session of the Board held
on 12 October 2015 and the 2015 second extraordinary general meeting of the Company
held on 27 November 2015, the Company intended to issue corporate bonds of no more than
RMB5,000,000,000. Pursuant to the document [2016] No. 35 issued by the China Securities
Regulatory Commission, the Company issued its first tranche of corporate bonds (type one) for
2016 on 14 March 2016, totaling RMB3,200,000,000 with a term of 3 years and a coupon rate
of 3.12%; and the Company issued its first tranche of corporate bonds (type two) for 2016
on 14 March 2016, totaling RMB1,800,000,000 with a term of 5 years and a coupon rate of
3.5%.
5) Pursuant to the document (Fa Gai Cai Jin [2012] No. 2810) issued by National Development
and Reform Commission, Jidong Group issued the first tranche of corporate bonds for 2012
on 13 September 2012, totaling RMB800,000,000 with a term of 7 years and a coupon rate
of 6.3%.
6) Pursuant to the approval document (Zhong Shi Xie Zhu [2015] No. PPN73) issued by the
NAFMII, Tangshan Jidong Concrete Co., Ltd. could conduct non-public placement financing of
no more than RMB1,500,000,000. The amount of the first tranche of non-public placement
debt financing instruments for 2014-2016 is RMB300,000,000 with a term of 3 years and a
coupon rate of 7.00%. The maturity date is 4 May 2018. The amount of the second tranche
of non-public placement debt financing instruments for 2014-2016 is RMB500,000,000 with
a term of 3 years and a coupon rate of 6.80%. The maturity date is 3 June 2018.

225BBMG CORPORATION
INTERIM REPORT 2018
Notes to Unaudited Interim Financial StatementsFor the six months ended 30 June 2018
RMB
V. NOTES TO KEY ITEMS OF CONSOLIDATED FINANCIAL STATEMENTS (continued)
34. Short-term Financing Bonds and Bonds Payable (continued)
7) Pursuant to the document (Zheng Jian Xu Ke [2011] No. 1179) issued by China Securities Regulatory
Commission, Jidong Cement issued corporate bonds of no more than RMB2,500,000,000 to the
public, including “2011 Jidong 01” and “2011 Jidong 02”. On 30 August 2011, it issued 2011
Jidong 01, totaling RMB1,600,000,000 with a coupon rate of 6.28% and an effective interest
rate of 6.46%. The term of the bonds is 7 years (with the issuer’s option to raise the coupon
rate after the end of the fifth year and the investors’ entitlement to sell back the bonds). The
sale back amount as announced on 30 August 2016 is RMB522,000,000, with the remaining
amount of RMB1,078,000,000 due on 30 August 2018. On 20 March 2012, it issued 2011
Jidong 02 in an amount of RMB900,000,000 with a coupon rate of 5.58% and an effective
interest rate of 5.76%. The term of the bonds is 8 years (with the issuer’s option to raise the
coupon rate after the end of the fifth year and the investors’ entitlement to sell back the bonds).
The total sale back amount as announced on 17 March 2017 is RMB481,305,000.00 (exclusive
of interests) with the remaining amount of RMB416,099,328.12 (exclusive of interests) due on
20 March 2020.
8) Pursuant to the document (Zheng Jian Xu Ke [2012] No. 1000) issued by China Securities Regulatory
Commission, Jidong Cement issued corporate bonds of no more than RMB1,250,000,000 to the
public. On 15 October 2012, it issued 2012 Jidong 02 Bonds in an amount of RMB450,000,000
with a term of 7 years, a coupon rate of 5.90% and an effective interest rate of 6.02%. The
maturity date is 15 October 2019. On 15 October 2012, it issued 2012 Jidong 03 Bonds in an
amount of RMB800,000,000 with a term of 10 years, a coupon rate of 6.00% and an effective
interest rate of 6.09%. The maturity date is 15 October 2022.
9) Upon consideration and approval by the 4th meeting of the 4th session of the Board held on
23 March 2016 and the 2015 annual general meeting of the Company held on 18 May 2016,
the Company intended to issue corporate bonds of no more than RMB4,000,000,000. Pursuant
to the document [2017] No. 46 issued by the China Securities Regulatory Commission, the
Company issued its first tranche of corporate bonds (type one) for 2017 on 19 May 2017,
totaling RMB3,500,000,000 with a term of 5 years and a coupon rate of 5.2%; and the
Company issued its first tranche of corporate bonds (type two) for 2017 on 19 May 2017,
totaling RMB500,000,000 with a term of 7 years and a coupon rate of 5.38%.
10) Pursuant to the relevant requirements for bonds listing on the Shanghai Stock Exchange, the
Company issued the first tranche of corporate bonds (type one) of BBMG Corporation for 2017
on the Shanghai Stock Exchange to qualified investors by way of non-public issuance from
13 July 2017, totaling RMB1,250,000,000 with a term of 2 years. The bonds bear an annual
coupon rate of 5.20% and adopt simple interest for accrual of annual interest; no compound
interest will be accrued.

226
Notes to Unaudited Interim Financial StatementsFor the six months ended 30 June 2018
RMB
V. NOTES TO KEY ITEMS OF CONSOLIDATED FINANCIAL STATEMENTS (continued)
34. Short-term Financing Bonds and Bonds Payable (continued)
11) Pursuant to the relevant requirements for bonds listing on the Shanghai Stock Exchange, the
Company issued the first tranche of corporate bonds (type two) of BBMG Corporation for 2017
on the Shanghai Stock Exchange to qualified investors by way of non-public issuance from
13 July 2017, totaling RMB1,750,000,000 with a term of 3 years. The bonds bear an annual
interest rate of 5.30% and adopt simple interest for accrual of annual interest; no compound
interest will be accrued.
12) Upon consideration and approval by the 18th meeting by the 4th session of the Board held on
26 April 2017 and the 2016 annual general meeting of the Company held on 17 May 2017,
and pursuant to the document Debt Financing Plan [2017] No. 0192 issued by Beijing Financial
Assets Exchange Limited, the Company successfully issued the first tranche of debt financing
plan for 2017 on 17 November 2017 for a term of 2 years. The interest commencement date
was 17 November 2017. The actual listing amount totalled RMB500,000,000 with a coupon
rate of 5.50%. The interests are calculated at fixed rate and allocated based on actual number
of days.
13) Upon consideration and approval by the 13th meeting of the 7th session of the Board held on
13 December 2015 and the 2015 second extraordinary general meeting of the Company held
on 30 December 2015, and pursuant to the No-Objection Letter Regarding the Compliance
with Transfer Conditions of Shenzhen Stock Exchange by the Non-Public Issuance of Corporate
Bonds for 2016 of Tangshan Jidong Cement Co., Ltd. (Shen Zheng Han [2016] No. 471)
(《關於唐山冀東水泥股份有限公司2016年非公開發行公司債券符合深交所轉讓條件的無異議
函》 (深證函[2016]471號)) issued by the Shenzhen Stock Exchange, the Company issued the
first tranche of corporate bonds by way of non-public issuance on 3 July 2017 with a term of
3 years, of which the issuer has an option to adjust the coupon rate and the investors have a
sell back option at the end of the second year. The interest commencement date was 30 June
2017 and the actual amount issued totalled RMB500,000,000. The bonds bear an interest rate
of 5.98%.
14) Upon consideration and approval by the 16th meeting of the 4th session of the Board held
on 29 March 2017 and the 2016 annual general meeting of the Company held on 17 May
2017, and pursuant to the Notice of Acceptance of Registration (Zhong Shi Xie Zhu [2017] No.
MTN512) (《接受註冊通知書》 (中市協注[2017]MTN512號)) issued by the NAFMII, the Company
successfully issued the first tranche of medium term notes for 2018 of BBMG Corporation on
22 January 2018. The amount issued totalled RMB2,000,000,000 with a term of 5 years and
a coupon rate of 5.85%.

227BBMG CORPORATION
INTERIM REPORT 2018
Notes to Unaudited Interim Financial StatementsFor the six months ended 30 June 2018
RMB
V. NOTES TO KEY ITEMS OF CONSOLIDATED FINANCIAL STATEMENTS (continued)
34. Short-term Financing Bonds and Bonds Payable (continued)
15) The Company successfully issued the first tranche of debt financing plan for 2018 named
“18BBMGZR001 (18京金隅ZR001)” on 27 February 2018 for a term of 2+3 years. The interest
commencement date was 27 February 2018 and expiry date will be 27 February 2023. The
actual listing amount totalled RMB500,000,000 with a coupon rate of 5.80%.
16) The Company successfully issued the second tranche of debt financing plan for 2018 named
“18BBMGZR0 (18京金隅ZR0)” on 25 June 2018 for a term of 3 years. The expiry date will be
25 June 2021. The actual listing amount totalled RMB2,500,000,000 and the listing price was
6.30% with a coupon rate of 6.30%.
17) Pursuant to the document Zhong Shi Xie Zhu [2015] No. SCP[174] issued by the NAFMII, it was
agreed that Tangshan Jidong Concrete Co., Ltd. issued its first tranche of ultrashort financing
bonds for 2017 in open market on 21 June 2017, totaling RMB1,000,000,000 with a term of
270 days and a coupon rate of 5.1%. The maturity date is 18 March 2018.
18) Upon consideration and approval by the 16th meeting of the 4th session of the Board held
on 29 March 2017 and the 2016 annual general meeting of the Company held on 17 May
2017, and pursuant to the Notice of Acceptance of Registration (Zhong Shi Xie Zhu [2017] No.
SCP300)(《 接受註冊通知書》 (中市協注[2017]SCP300號)) issued by the NAFMII, the Company
successfully issued the third tranche on 28 September 2017 ultrashort financing bonds for a
term of 270 days. The interest commencement date was 29 September 2017 and the actual
amount issued totalled RMB2,000,000,000 with a coupon rate of 4.90%.
19) Upon consideration and approval by the 16th meeting of the 4th session of the Board held
on 29 March 2017 and the 2016 annual general meeting of the Company held on 17 May
2017, and pursuant to the Notice of Acceptance of Registration (Zhong Shi Xie Zhu [2017] No.
SCP300) (《接受註冊通知書》 (中市協注[2017]SCP300號)) issued by the NAFMII, the Company
successfully issued the first tranche of super short term financing bonds for 2018 on 29 January
2018 for a term of 180 days. The interest commencement date was 29 January 2018 and the
actual amount issued totalled RMB2,000,000,000 with a coupon rate of 5.30%.

228
Notes to Unaudited Interim Financial StatementsFor the six months ended 30 June 2018
RMB
V. NOTES TO KEY ITEMS OF CONSOLIDATED FINANCIAL STATEMENTS (continued)
34. Short-term Financing Bonds and Bonds Payable (continued)
20) Upon consideration and approval by the 16th meeting of the 4th session of the Board held
on 29 March 2017 and the 2016 annual general meeting of the Company held on 17 May
2017, and pursuant to the Notice of Acceptance of Registration (Zhong Shi Xie Zhu [2017] No.
SCP300) (《接受註冊通知書》 (中市協注[2017]SCP300號)) issued by the NAFMII, the Company
successfully issued the second tranche of super short term financing bonds for 2018 on 5 March
2018 for a term of 180 days. The interest commencement date was 5 March 2018 and the
actual amount issued totalled RMB2,000,000,000 with a coupon rate of 5.13%.
21) Upon consideration and approval by the 16th meeting of the 4th session of the Board held
on 29 March 2017 and the 2016 annual general meeting of the Company held on 17 May
2017, and pursuant to the Notice of Acceptance of Registration (Zhong Shi Xie Zhu [2017] No.
SCP300) (《接受註冊通知書》 (中市協注[2017]SCP300號)) issued by the NAFMII, the Company
successfully issued the third tranche of super short term financing bonds for 2018 on 20 April
2018 for a term of 270 days. The interest commencement date was 23 April 2018 and the
actual amount issued totalled RMB1,500,000,000 with a coupon rate of 4.59%.

229BBMG CORPORATION
INTERIM REPORT 2018
Notes to Unaudited Interim Financial StatementsFor the six months ended 30 June 2018
RMB
V. NOTES TO KEY ITEMS OF CONSOLIDATED FINANCIAL STATEMENTS (continued)
35. Long-term payables
30 June 2018 31 December 2017
Finance leases (Note 1) 1,234,809,571.07 1,595,973,841.56
Others (Note 2) 39,567,383.08 39,567,383.08
1,274,376,954.15 1,635,541,224.64
Less: Long-term payables due within one year
(Note V. 31) 658,843,190.35 714,771,870.46
Non-current portion 615,533,763.80 920,769,354.18
30 June 2018 31 December 2017
Analysis of maturity of long-term payables
Within 1 year (inclusive) 658,843,190.35 714,771,870.46
1 to 2 years (inclusive) 550,300,999.29 642,102,218.16
2 to 5 years (inclusive) 65,232,764.51 278,667,136.02
1,274,376,954.15 1,635,541,224.64

230
Notes to Unaudited Interim Financial StatementsFor the six months ended 30 June 2018
RMB
V. NOTES TO KEY ITEMS OF CONSOLIDATED FINANCIAL STATEMENTS (continued)
35. Long-term payables (continued)
Note 1: BBMG Badaling Hot Spring Resort Co., Ltd., a subsidiary of the Group, leased geothermal
well equipment under finance lease in 2013. The value of the fixed asset under finance lease
initially recognised was RMB29,168,129.40, with a term of 8 years and bearing an interest rate
of 6.55% per annum. As at 30 June 2018, the original value of the long-term payables was
RMB14,658,900.00 and the unrecognized finance lease payment was RMB1,190,023.03 (As
at 31 December 2017, the original value of the long-term payables was RMB16,958,700.00
and the unrecognized finance lease payment was RMB1,423,997.95).
BBMG Mortar Co., Ltd., a subsidiary of the Group, leased mortar cans under finance lease in
2017. The value of the fixed assets under finance lease initially recognised was RMB5,138,451.28,
with a term of 2 years and bearing an interest rate of 4.75% per annum. As at 30 June 2018,
the original value of the long-term payables was RMB4,561,096.90 and the unrecognised
finance lease payment was RMB106,773.88 (31 December 2017: the original value of the
long-term payables was RMB6,459,257.01 and the unrecognised finance lease payment was
RMB223,712.06).
The finance lease payment under sale and leaseback of the Group payable to the Bank of
Communications Financial Leasing Co., Ltd., CCB Financial Leasing Corporation Limited and
China National Foreign Trade Financing & Leasing Co., Ltd. As at 30 June 2018, the original
value of long-term payables amounted to RMB1,307,063,365.69 and unrecognised finance
lease payment was RMB90,176,994.61 (As at 31 December 2017, the original value of long-
term payables amounted to RMB1,699,917,757.54 and unrecognised finance lease payment
was RMB125,714,162.98).
Note 2: Others represent the borrowings from Tangshan Dunshi Real Estate Development Co., Ltd.
(唐山盾石房地產開發有限公司) to Tangshan Lubei District Urban Construction Investment Co.,
Ltd. (唐山市路北區建設投資有限公司), which contracted to be due on 29 July 2018.

231BBMG CORPORATION
INTERIM REPORT 2018
Notes to Unaudited Interim Financial StatementsFor the six months ended 30 June 2018
RMB
V. NOTES TO KEY ITEMS OF CONSOLIDATED FINANCIAL STATEMENTS (continued)
36. Long-term wages payable
30 June 2018 31 December 2017
Net liabilities of defined benefit plan 682,147,912.50 654,032,290.50
The Group’s defined benefit plans are various supplementary benefit plans targeting at employees
retiring before the designated dates, and the plans are subject to impacts from interest rate risk and
changes in the life expectancy of pension beneficiaries. The present value of the net liabilities of the
defined benefit plans was determined by Towers Watson Consulting (Shanghai) Company Limited (韜
睿惠悅諮詢(上海)有限公司), a member of the China Association of Actuaries (中國精算學會), on 30
June 2018 using the projected accumulated benefit units method.
The following table sets forth the principal actuarial assumptions used as at the balance sheet date:
30 June 2018 31 December 2017
Discount rate (%) 3.50%-4.50% 4.00%-4.25%
Expected growth rate of future retiree benefit costs (%) 2.50% 2.50%

232
Notes to Unaudited Interim Financial StatementsFor the six months ended 30 June 2018
RMB
V. NOTES TO KEY ITEMS OF CONSOLIDATED FINANCIAL STATEMENTS (continued)
36. Long-term wages payable (continued)
The following table sets forth the quantitative sensitivity analysis of significant assumptions used:
30 June 2018
Increase
Increase/(decrease)
in present value
of defined benefit
obligations Decrease
Increase/(decrease)
in present value
of defined benefit
obligations
% %
Discount rate (%) 0.25 (17,894,392.00) (0.25) 18,822,608.00
Expected growth rate of future
retiree benefit costs (%) 0.25 22,916,854.00 (0.25) (21,073,953.00)
2017
Increase
Increase/(decrease)
in present value
of defined benefit
obligations Decrease
Increase/(decrease)
in present value
of defined benefit
obligations
% %
Discount rate (%) 0.25 (16,151,364.00) (0.25) 17,475,604.00
Expected growth rate of future
retiree benefit costs (%) 0.50 22,131,679.00 (0.50) (20,374,573.00)
The above sensitivity analysis represents the inference on the impacts over the defined benefit obligations
based on reasonable changes in key assumptions as at the balance sheet date. The sensitivity analysis
is based on changes in major assumptions with other assumptions remain unchanged. As changes in
assumptions are always not isolated from each other, the sensitivity analysis may not represent the
actual changes in the defined benefit obligations.

233BBMG CORPORATION
INTERIM REPORT 2018
Notes to Unaudited Interim Financial StatementsFor the six months ended 30 June 2018
RMB
V. NOTES TO KEY ITEMS OF CONSOLIDATED FINANCIAL STATEMENTS (continued)
36. Long-term wages payable (continued)
Relevant costs recognised in the income statement are as follows:
For the
six months ended
30 June 2018 2017
Net interest expenses charged to finance expenses 7,966,566.00 23,979,700.00
Charged to management expenses 121,000.00 37,958,656.33
Movements in present value of net liabilities of defined benefit plan are as follows:
For the
six months ended
30 June 2018 2017
Amount at the beginning of the period/year 724,680,592.19 795,812,425.46
Increase of business combination not under
common control (Note VI. 1) 17,421,000.00* –
Interest expenses for the period/year 7,966,566.00 23,979,700.00
Service costs for the period/year 121,000.00 37,958,656.33
Welfare benefits paid for the period/year (17,620,003.00) (80,126,564.60)
Actuarial gains/(losses) recognised in other
comprehensive income 19,427,236.00 (52,943,625.00)
Of which: Actuarial changes arising from changes in
demographic statistics assumptions – 7,357,000.00
Actuarial changes arising from changes
in financial assumptions – (13,392,000.00)
Actuarial gains/(losses) on difference in
experience 19,427,236.00 (46,908,625.00)
Amount at the end of the period/year 751,996,391.19 724,680,592.19
Of which: Current portion of net liabilities of defined
benefit plan (Note V. 30) 69,848,478.69 70,648,301.69
Non-current portion 682,147,912.50 654,032,290.50

234
Notes to Unaudited Interim Financial StatementsFor the six months ended 30 June 2018
RMB
V. NOTES TO KEY ITEMS OF CONSOLIDATED FINANCIAL STATEMENTS (continued)
36. Long-term wages payable (continued)
Expected future payments to the defined benefit plan:
30 June 2018 31 December 2017
Within 1 year 69,848,478.69 70,648,301.69
2 to 5 years 271,790,364.67 256,299,613.67
6 to 10 years 213,651,844.80 217,260,376.80
Over 10 years 584,637,734.57 596,287,934.57
1,139,928,422.73 1,140,496,226.73
* Business combination not under common control increased long-term wages payable of RMB17,421,000.00 in which long-term and current portions amounted to RMB17,398,000.00 and RMB23,000.00 respectively.
37. Accrued liabilities
For the six months ended 30 June 2018
Opening
balance
Increase in
the period
Decrease in
the period
Closing
balance
Accrued concrete loss 30,214,465.69 414,002.68 (6,103,633.14) 24,524,835.23 Note1
Restoration cost of mines 281,111,097.14 32,306,815.28 (3,985,765.06) 309,432,147.36 Note2
Finance charges from sale
and repurchase 152,922,000.00 27,951,000.00 – 180,873,000.00 Note3
Others 687,837.34 20,000,000.00 – 20,687,837.34
464,935,400.17 80,671,817.96 (10,089,398.20) 535,517,819.93

235BBMG CORPORATION
INTERIM REPORT 2018
Notes to Unaudited Interim Financial StatementsFor the six months ended 30 June 2018
RMB
V. NOTES TO KEY ITEMS OF CONSOLIDATED FINANCIAL STATEMENTS (continued)
37. Accrued liabilities (continued)
2017
Opening
balance
Increase in
the year
Decrease in
the year
Closing
balance
Accrued concrete loss 32,733,222.62 1,899,665.81 (4,418,422.74) 30,214,465.69 Note1
Restoration cost of mines 241,526,126.35 46,490,526.03 (6,905,555.24) 281,111,097.14 Note2
Finance charges from
sale and repurchase 97,020,000.00 55,902,000.00 – 152,922,000.00 Note3
Others – 687,837.34 – 687,837.34
371,279,348.97 104,980,029.18 (11,323,977.98) 464,935,400.17
Note 1: Accrued concrete loss was recognized based on potential difference between concrete’s warehouse–out amount and future settlement amount by the Group’s subsidiaries engaged in the production of concrete.
Note 2: Accrued restoration cost was recognized based on the expenditure on restoration of mines required to be incurred in subsequent years by the Group’s subsidiaries engaged in the production of cement.
Note 3: A subsidiary of the Group engaged in real estate has entered into an en bloc sales agreement for a commercial property in Chongqing on 16 December 2015. As the agreement provided for a possible repurchase after five years, the expected return rate may not be satisfied for the year. Finance charges were expected based on the relevant agreement.
38. Deferred income
For the six months ended 30 June 2018
Opening
balance
Increase in
the period
Decrease in
the period
Closing
balance
Government grants 855,519,940.14 39,627,819.99 33,063,680.21 862,084,079.92
2017
Opening
balance
Increase in
the year
Decrease in
the year
Closing
balance
Government grants 922,615,398.60 42,426,314.79 109,521,773.25 855,519,940.14

236
Notes to Unaudited Interim Financial StatementsFor the six months ended 30 June 2018
RMB
V. NOTES TO KEY ITEMS OF CONSOLIDATED FINANCIAL STATEMENTS (continued)
38. Deferred income (continued)
Of which, the details of government grants are as follows:
30 June 2018 31 December 2017
Government grants related to assets
Environmental protection projects 407,443,430.09 432,674,914.50
Cogeneration projects 27,772,878.91 28,159,631.79
Relocation compensation 299,755,469.00 260,443,532.70
Specific funds 48,824,242.66 49,745,454.76
Others 75,339,771.06 81,714,238.73
Government grants related to income
Research and development funds 2,948,288.20 2,782,167.66
Closing balance 862,084,079.92 855,519,940.14
As at 30 June 2018, the major items related to government grants were as follows:
Opening
balance
Increase in
the period
Recognised in
other income in
the period
Closing
balance
Related to
assets/gains
Asset subsidy for relocation compensation of Tiantan 173,235,980.36 6,985,908.12 2,548,798.06 177,673,090.42 Related to assets
Subsidy for environmental protection equipment for
Bio–Island project
156,915,120.74 – 7,501,092.62 149,414,028.12 Related to assets
Appropriation for mud project of Beijing Cement Plant 27,899,722.24 – 1,488,333.33 26,411,388.91 Related to assets
Relocation compensation for Jianji 49,745,454.76 – 921,212.10 48,824,242.66 Related to assets
Subsidy for Zanhuang – 2,500 tonnes new cement
clinker production line project
7,245,777.74 – 365,333.34 6,880,444.40 Related to assets
Raw material storage tent of Zhenxing 8,736,000.00 – 336,000.00 8,400,000.00 Related to assets
Air pollution control project of Zanhuang 7,017,833.36 – 269,916.66 6,747,916.70 Related to assets
Heat supply renovation project of Liulihe 6,874,999.97 – 250,000.02 6,624,999.95 Related to assets
Tangshan Qixin Cement Industry Museum project 50,688,412.70 – 7,208,538.26 43,479,874.44 Related to assets

237BBMG CORPORATION
INTERIM REPORT 2018
Notes to Unaudited Interim Financial StatementsFor the six months ended 30 June 2018
RMB
V. NOTES TO KEY ITEMS OF CONSOLIDATED FINANCIAL STATEMENTS (continued)
38. Deferred income (continued)
As at 31 December 2017, the major items related to government grants were as follows:
Opening
balance
Increase in
the year
Recognised in
other income
in the year Closing balance
Related to
assets/gains
Asset subsidy for relocation compensation of Tiantan 203,027,594.00 – 29,791,613.64 173,235,980.36 Related to assets
Subsidy for environmental protection equipment
for Bio–Island project
172,477,904.58 – 15,562,783.84 156,915,120.74 Related to assets
Appropriation for mud project of Beijing Cement Plant 30,876,388.89 – 2,976,666.65 27,899,722.24 Related to assets
Relocation compensation for Jianji 51,587,878.96 – 1,842,424.20 49,745,454.76 Related to assets
Subsidy for Zanhuang – 2,500 tonnes new cement
clinker production line project
7,976,444.42 – 730,666.68 7,245,777.74 Related to assets
Raw material storage tent of Zhenxing 9,408,000.00 – 672,000.00 8,736,000.00 Related to assets
Air pollution control project of Zanhuang 7,557,666.68 – 539,833.32 7,017,833.36 Related to assets
Heat supply renovation project of Liulihe 7,375,000.00 – 500,000.03 6,874,999.97 Related to assets
Tangshan Qixin Cement Industry Museum project 50,688,412.70 – – 50,688,412.70 Related to assets
39. Other non–current liabilities
30 June 2018 31 December 2017
Repurchase payment (Note V.23) 660,456,831.52 660,456,831.52
Advance payment for housing (Note V.27) 4,601,637,197.88 –
Advance payment for rent 18,000,000.00 –
5,280,094,029.40 660,456,831.52

238
Notes to Unaudited Interim Financial StatementsFor the six months ended 30 June 2018
RMB
V. NOTES TO KEY ITEMS OF CONSOLIDATED FINANCIAL STATEMENTS (continued)
40. Share capital
For the six months ended 30 June 2018
Increase/(decrease) in the period
Opening balanceIssue of
new shares
Sharesreleased from
lock-up period Subtotal Closing balance
I. Shares subject to lock–up restriction1. State–owned legal person shareholdings 188,679,244.00 – – – 188,679,244.002. Other domestic shareholdings 4,848,000.00 – – – 4,848,000.00
Total shares subject to lock–up restriction 193,527,244.00 – – – 193,527,244.00
II. Shares not subject to lock–up restriction1. RMB ordinary shares 8,145,479,020.00 – – – 8,145,479,020.002. Foreign listed shares 2,338,764,870.00 – – – 2,338,764,870.00
Total shares not subject to lock–up restriction 10,484,243,890.00 – – – 10,484,243,890.00
Total share capital 10,677,771,134.00 – – – 10,677,771,134.00
2017
Increase/(decrease) in the year
Opening balance
Increase ofshare capital by
conversion ofcapital reserve
Sharesreleased from
lock-up period Subtotal Closing balance
I. Shares subject to lock–up restriction1. State–owned legal person shareholdings 1,084,736,590.00 – (896,057,346.00) (896,057,346.00) 188,679,244.002. Other domestic shareholdings 110,837,102.00 – (105,989,102.00) (105,989,102.00) 4,848,000.00
Total shares subject to lock–up restriction 1,195,573,692.00 – (1,002,046,448.00) (1,002,046,448.00) 193,527,244.00
II. Shares not subject to lock–up restriction1. RMB ordinary shares 7,143,432,572.00 – 1,002,046,448.00 1,002,046,448.00 8,145,479,020.002. Foreign listed shares 2,338,764,870.00 – – – 2,338,764,870.00
Total shares not subject to lock–up restriction 9,482,197,442.00 – 1,002,046,448.00 1,002,046,448.00 10,484,243,890.00
Total share capital 10,677,771,134.00 – – – 10,677,771,134.00

239BBMG CORPORATION
INTERIM REPORT 2018
Notes to Unaudited Interim Financial StatementsFor the six months ended 30 June 2018
RMB
V. NOTES TO KEY ITEMS OF CONSOLIDATED FINANCIAL STATEMENTS (continued)
41. Other equity instruments
On 15 October 2015, the Company issued 10,000,000 medium–term notes at par value of RMB100
to specific investors, and the actual proceeds after deducting related issue expenses amounted to
RMB990,000,000.00; on 2 September 2016 and 6 September 2016, the Company issued 20,000,000
and 20,000,000 medium–term notes at par value of RMB100 to specific investors respectively, and
the actual proceeds after deducting related issue expenses amounted to RMB3,992,000,000.00; on 11
October 2017 and 6 November 2017, the Company issued 25,000,000 and 25,000,000 medium–term
notes at par value of RMB100 to specific investors respectively, and the actual proceeds after deducting
related issue expenses amounted to RMB4,990,000,000.00. In 2017, the Company registered with the
National Association of Financial Market Institutional Investors and issued medium–term notes totaling
RMB10 billion. On 7 June 2018, the Company issued 20,000,000 medium–term notes at par value
of RMB100 to specific investors respectively, and the actual proceeds after deducting related issue
expenses amounted to RMB1,996,000,000.00.
According to the Prospectus on 2015 First Tranche of Medium–term Notes of BBMG Corporation, the
Prospectus on 2016 First Tranche of Medium–term Notes of BBMG Corporation, the Prospectus on 2016
Second Tranche of Medium–term Notes of BBMG Corporation, the Prospectus on 2017 First Tranche of
Medium–term Notes of BBMG Corporation, the Prospectus on 2017 Second Tranche of Medium–term
Notes of BBMG Corporation and the Prospectus on 2018 Second Tranche of Medium–term Notes of
BBMG Corporation, the major terms of the medium–term notes are as follows:
Maturity date – The medium-term notes have no fixed maturity date, which are on a long-
term basis until redemption by the Company according to the requirement
of the issuance provisions, and will expire when the Company redeems
the notes according to the requirement of the issuance provisions.
Deferred distribution – Unless a mandatory interest payment event has occurred, on each interest
payment date of the medium-term notes, the Company can elect to
defer payment of interest due and all interest deferred according to
the issuance provisions and its fruits to the next interest payment date
without any limitation on the number of times of such deferral. The
foregoing deferred interest payment does not make the Company fail
to pay the interest in full according to the requirement. Interest shall
accrue on each of the deferred interest at the prevailing coupon rate
over the period of deferral.
Mandatory distribution
payment events
– If any of the following events occurs within 12 months prior to the
interest payment date, the Company shall not defer the payment of
interest due or all interest deferred pursuant to this term and its fruits:
(1) distributing dividends to ordinary shareholders;
(2) reducing the registered capital.
Redemption and
purchase
– The Company is entitled to redeem the medium-term notes at par value
plus payable interest (including all deferred interest) on the fifth and each
of the subsequent interest payment dates of the medium-term notes.

240
Notes to Unaudited Interim Financial StatementsFor the six months ended 30 June 2018
RMB
V. NOTES TO KEY ITEMS OF CONSOLIDATED FINANCIAL STATEMENTS (continued)
41. Other equity instruments (continued)
Interest rate determination – Medium-term notes carried fixed rate;
The coupon rate of the medium–term notes for the first five years
of interest calculation is determined through book–building and
centralised placing, and shall remain unchanged for the first five
years of interest calculation. The coupon rate shall be reset every
three years from the sixth year of interest calculation;
The coupon rate for the first five years of interest calculation
is the initial benchmark interest rate plus initial spread. Among
which, the initial benchmark interest rate is defined as the
arithmetic average yield rate (rounded to the nearest 0.01%)
of treasury bonds with a repayment period of 5 years in the
interbank treasury bond fixed rate bond yield curve published on
China Bond information webpage (www. chinabond.com.cn) (or
other website recognized by China Central Depository & Clearing
Co., Ltd.) 5 working days before the book–building day. Initial
spread is the difference between the coupon rate and the initial
benchmark interest rate;
In the event that the issuer does not exercise its redemption right,
starting from the sixth year of interest calculation, the coupon
rate shall be adjusted to benchmark interest rate for the current
period plus initial spread plus 300 basis points, and shall remain
unchanged from the sixth to the tenth year of interest calculation.
The benchmark interest rate for the current period is defined as
the arithmetic average yield rate (rounded to the nearest 0.01%)
of treasury bonds with a repayment period of 5 years in the
interbank treasury bond fixed rate bond yield curve published on
China Bond information webpage (www. chinabond.com.cn) (or
other website recognized by China Central Depository & Clearing
Co., Ltd.) 5 working days before the reset of the coupon rate.
Thereafter, the coupon interest rate is reset every 3 years to the
benchmark interest rate for the current period plus the initial
spread plus 300 basis points;
Formula of coupon rate: coupon rate for the current period =
benchmark interest rate for the current period + initial spread +
300BPs;
In the event that the benchmark interest rate for the current
period is not available on the date of reset due to factors such as
changes in macroeconomy and policies in the future, the coupon
rate will be determined based on the benchmark interest rate
for the period prior to the reset of the coupon rate plus initial
spread plus 300 basis points.

241BBMG CORPORATION
INTERIM REPORT 2018
Notes to Unaudited Interim Financial StatementsFor the six months ended 30 June 2018
RMB
V. NOTES TO KEY ITEMS OF CONSOLIDATED FINANCIAL STATEMENTS (continued)
41. Other equity instruments (continued)
In view of the above characteristics of the medium-term notes, the Company has no contractual obligation to repay the principal or pay interest on the bonds, namely the Company has no contractual obligation to pay in cash or other financial assets to the holders of the perpetual bonds nor to exchange financial assets or financial liabilities under potential adverse condition with the holders of the perpetual bonds. The perpetual bonds were accounted for by the Company based on the net proceeds after deducting issue expenses and included in other equity instruments, and the relevant coupon payments declared will be treated as distribution to the holders of the equity.
For the six months ended 30 June 2018, the interest accrued amounted to RMB618,043,333.35.
42. Capital reserve
For the six months ended 30 June 2018
Opening balanceIncrease inthe period
Decrease inthe period Closing balance
Share premium 5,820,202,037.98 – (445,797,011.48) 5,374,405,026.50
2017
Opening balanceIncrease in
the yearDecrease in
the year Closing balance
Share premium 5,865,195,783.46 – (44,993,745.48) 5,820,202,037.98
See the Consolidated Statement of Changes in Equity for the reasons of movements in capital reserve.

242
Notes to Unaudited Interim Financial StatementsFor the six months ended 30 June 2018
RMB
V. NOTES TO KEY ITEMS OF CONSOLIDATED FINANCIAL STATEMENTS (continued)
43. Other comprehensive income
Accumulated balance of other comprehensive income in the consolidated balance sheet:
1 January 2018
Increase/
(decrease) 30 June 2018
Re-measurement of changes in defined
benefit plan 70,072,510.00 (18,855,736.00) 51,216,774.00
Transfer of inventories/self–occupied
properties into investment properties 176,722,075.98 – 176,722,075.98
Effect on changes in other owners’
equity of investee under equity method 3,127,570.81 (685,072.50) 2,442,498.31
Foreign currency translation 931,829.28 (3,171,275.05) (2,239,445.77)
Changes in fair value of other equity
investment 3,356,173.25 (21,675,850.45) (18,319,677.20)
254,210,159.32 (44,387,934.00) 209,822,225.32
1 January 2017
Increase/
(decrease)
31 December
2017
Re-measurement of changes in defined
benefit plan 28,174,585.00 41,897,925.00 70,072,510.00
Transfer of inventories/self–occupied
properties into investment properties 186,916,437.72 (10,194,361.74) 176,722,075.98
Effect on changes in other owners’
equity of investee under equity method (20,888.22) 3,148,459.03 3,127,570.81
Foreign currency translation 10,862,702.22 (9,930,872.94) 931,829.28
Available–for–sale financial assets 5,906,864.93 (2,550,691.68) 3,356,173.25
231,839,701.65 22,370,457.67 254,210,159.32

243BBMG CORPORATION
INTERIM REPORT 2018
Notes to Unaudited Interim Financial StatementsFor the six months ended 30 June 2018
RMB
V. NOTES TO KEY ITEMS OF CONSOLIDATED FINANCIAL STATEMENTS (continued)
43. Other comprehensive income (continued)
Amount of other comprehensive income in the consolidated income statement for the period:
For the six months ended 30 June 2018
Amount
before tax
Less: Amount
transferred to
profit or loss for
the period for
those previously
included in other
comprehensive
income
Less:
Income tax
Attributable
to parent
company
Equity
attributable
to minority
interests
Other comprehensive income that will not be
reclassified to profit or loss in subsequent periods
Re-measurement of changes in
defined benefit plan (19,427,236.00) – – (18,855,736.00) (571,500.00)
Changes in fair value of other equity investment (171,731,944.57) – (43,094,192.79) (21,675,850.45) (106,961,901.33)
Other comprehensive income that will be reclassified
to profit or loss in subsequent periods
Effect on changes in other shareholders’ equity of
investee under equity method (2,075,977.28) – – (685,072.50) (1,390,904.78)
Exchange differences on foreign currency translation (104,404.06) – – (3,171,275.05) 3,066,870.99
(193,339,561.91) – (43,094,192.79) (44,387,934.00) (105,857,435.12)

244
Notes to Unaudited Interim Financial StatementsFor the six months ended 30 June 2018
RMB
V. NOTES TO KEY ITEMS OF CONSOLIDATED FINANCIAL STATEMENTS (continued)
43. Other comprehensive income (continued)
For the six months ended 30 June 2017
Amount
before tax
Less: Amount
transferred to
profit or loss for
the period for
those previously
included in other
comprehensive
income
Less:
Income tax
Attributable
to parent
company
Equity
attributable
to minority
interests
Other comprehensive income that will not be
reclassified to profit or loss in subsequent periods
Re-measurement of changes in net liabilities
of defined benefit plan 29,061,622.00 – – 29,061,622.00 –
Other comprehensive income that will be reclassified
to profit or loss in subsequent periods
Other comprehensive income incurred from transfer
of fixed assets/inventories to investment properties – 13,592,482.32 (3,398,120.58) (10,194,361.74) –
Effect on changes in other shareholders’ equity of
investee under equity method (3,573,352.36) – – (1,102,557.87) (2,470,794.49)
Exchange differences on foreign currency translation (336,192.92) – – (661,099.26) 324,906.34
Available-for-sale financial assets (42,308,123.52) – (10,577,030.88) (5,235,630.29) (26,495,462.35)(42,308,123.52) – (10,577,030.88) (5,235,630.29) (26,495,462.35)
(17,156,046.80) 13,592,482.32 (13,975,151.46) 11,867,972.84 (28,641,350.50)

245BBMG CORPORATION
INTERIM REPORT 2018
Notes to Unaudited Interim Financial StatementsFor the six months ended 30 June 2018
RMB
V. NOTES TO KEY ITEMS OF CONSOLIDATED FINANCIAL STATEMENTS (continued)
44. Specific reserve
For the six months ended 30 June 2018
Opening balance
Amount provided
for the period
Amount paid
for the period Closing balance
Production safety cost 12,989,928.59 27,330,453.45 17,433,049.65 22,887,332.39
2017
Opening balance
Amount provided
for the year
Amount paid
during the year Closing balance
Production safety cost 8,655,529.41 63,436,796.09 59,102,396.91 12,989,928.59
Pursuant to the requirements of the “Administrative Measures on Provision and Usage of Production
Safety Cost of Enterprises” (Caiqi [2012] No.16) issued by the Ministry of Finance and the State
Administration of Work Safety, the Group began to accrue production safety fund for the stipulated
non-metal mineral products industries at a fixed amount from 2012, the details of which are set out
in Note III 30. Production safety cost.
45. Surplus reserve
For the six months ended 30 June 2018
Opening balance
Increase in
the period
Decrease in
the period Closing balance
Statutory surplus reserve 1,368,019,010.35 – – 1,368,019,010.35
2017
Opening balance
Increase in
the year
Decrease in
the year Closing balance
Statutory surplus reserve 1,276,866,688.51 91,152,321.84 – 1,368,019,010.35

246
Notes to Unaudited Interim Financial StatementsFor the six months ended 30 June 2018
RMB
V. NOTES TO KEY ITEMS OF CONSOLIDATED FINANCIAL STATEMENTS (continued)
45. Surplus reserve (continued)
According the requirements of the Company Law and the Articles of Association of the Company, the
Company shall appropriate 10% of its net profit to the statutory surplus reserve. In the event that the
accumulated statutory surplus reserve of the Company has exceeded 50% of the registered capital of
the Company, additional appropriation will not be needed.
After the appropriation to statutory surplus reserve, the Company may make appropriation to the
discretionary surplus reserve. Upon approval, discretionary surplus reserve can be used to make up for
losses from previous years or to increase the share capital.
46. General risk reserve
For the six months ended 30 June 2018
Opening balance
Increase in
the period
Decrease in
the period Closing balance
General risk reserve 299,478,851.25 – – 299,478,851.25
2017
Opening balance
Increase in
the year
Decrease in
the year Closing balance
General risk reserve 178,039,195.99 121,439,655.26 – 299,478,851.25
The general risk reserve is made for by the Company’s subsidiary BBMG Finance Co., Ltd. according to
a certain ratio of the balance of risk assets at the end of the period/year pursuant to the Administrative
Measures on Provision of Reserves of Financial Enterprises (金融企業準備金計提管理辦法) issued by
the Ministry of Finance.

247BBMG CORPORATION
INTERIM REPORT 2018
Notes to Unaudited Interim Financial StatementsFor the six months ended 30 June 2018
RMB
V. NOTES TO KEY ITEMS OF CONSOLIDATED FINANCIAL STATEMENTS (continued)
47. Retained earnings
For the six
months ended
30 June 2018 2017
Retained earnings as at the end of the previous year 22,758,176,658.95 20,980,120,619.08
Add: changes in accounting policy (21,093,927.93) –
Net profit attributable to the shareholders of
the parent company 2,410,206,116.06 2,836,664,933.59
Less: Cash dividends declared for ordinary shares
(Note 1) 512,533,014.43 491,177,472.16
Less: Appropriation of surplus reserve (Note V.45) – 91,152,321.84
Less: Interest of perpetual bonds (Note V.41) 263,203,888.89 354,839,444.46
Less: Appropriation of general risk reserve (Note V.46) – 121,439,655.26
Retained earnings at the end of the period/year 24,371,551,943.76 22,758,176,658.95
Note 1: Upon the consideration and approval by the 2017 annual general meeting of the Company convened on 24 May 2018, profit distribution for the year 2017 was calculated based on 10,677,771,134 ordinary shares in issue as of 31 December 2017, with the distribution of a dividend of RMB0.48 per 10 shares (tax inclusive) in an aggregate amount of cash dividends of RMB512,533,014.43.
48. Operating revenue and operating costs
For the six months ended
30 June 2018
For the six months ended
30 June 2017
Revenue Costs Revenue Costs
Principal operations 34,998,521,382.42 25,391,549,752.00 28,778,106,439.91 21,179,573,587.19
Other operations 366,871,873.56 143,221,828.22 687,739,842.94 300,297,561.12
35,365,393,255.98 25,534,771,580.22 29,465,846,282.85 21,479,871,148.31

248
Notes to Unaudited Interim Financial StatementsFor the six months ended 30 June 2018
RMB
V. NOTES TO KEY ITEMS OF CONSOLIDATED FINANCIAL STATEMENTS (continued)
48. Operating revenue and operating costs (continued)
The principal businesses are the following:
For the six months ended
30 June 2018
For the six months ended
30 June 2017
Revenue Costs Revenue Costs
Sale of products 16,691,762,445.41 11,497,460,937.86 14,703,815,505.97 10,781,304,651.52
Bulk commodity trade 5,798,692,112.10 5,756,570,676.88 4,295,423,070.67 4,191,989,825.53
Sale of properties 9,955,463,235.75 6,816,228,978.21 7,346,395,932.14 4,965,631,414.32
Rental income from
investment properties 646,537,184.55 59,384,760.16 646,855,908.42 41,253,781.27
Property management 435,264,429.59 327,777,514.10 397,505,348.07 289,830,873.44
Hotel management 212,893,202.89 110,845,647.24 202,153,741.55 103,199,401.73
Income from decoration 322,286,697.74 282,307,744.27 428,100,134.10 416,644,859.52
Treatment of solid wastes 453,942,695.63 238,700,814.34 280,268,621.47 190,804,433.37
Others 481,679,378.76 302,272,678.94 477,588,177.52 198,914,346.49
34,998,521,382.42 25,391,549,752.00 28,778,106,439.91 21,179,573,587.19
Operating revenue are as follows:
For the six
months ended
30 June 2018
For the six
months ended
30 June 2017
Sale of products 16,691,762,445.41 14,703,815,505.97
Bulk commodity trade 5,798,692,112.10 4,295,423,070.67
Sale of properties 9,955,463,235.75 7,346,395,932.14
Lease income 759,136,003.43 723,566,360.78
Of which: Rental income from
investment properties 646,537,184.55 646,855,908.42
Other lease income 112,598,818.88 76,710,452.36
Property management 435,264,429.59 397,505,348.07
Hotel management 212,893,202.89 202,153,741.55
Income from decoration 322,286,697.74 428,100,134.10
Treatment of solid wastes 453,942,695.63 280,268,621.47
Others 735,952,433.44 1,088,617,568.10
35,365,393,255.98 29,465,846,282.85

249BBMG CORPORATION
INTERIM REPORT 2018
Notes to Unaudited Interim Financial StatementsFor the six months ended 30 June 2018
RMB
V. NOTES TO KEY ITEMS OF CONSOLIDATED FINANCIAL STATEMENTS (continued)
48. Operating revenue and operating costs (continued)
The reporting segments are the following:
For the six months ended
30 June 2018
For the six months ended
30 June 2017
Commodity
(transferred at a
point of time)
Service
(provided
over time)
Commodity
(transferred at a
point of time)
Service
(provided)
over time
Cement segment 14,124,217,015.86 453,942,695.63 13,005,383,233.88 280,268,621.47
Building materials and
commerce and logistics
segment 8,574,141,741.27 322,286,697.74 6,547,693,878.18 428,100,134.10
Property segment 9,974,060,860.17 – 7,334,205,335.26 –
Property investment
and management
segment 1,268,586,612.83 648,157,632.48 1,270,535,990.34 599,659,089.62
Total 33,941,006,230.13 1,424,387,025.85 28,157,818,437.66 1,308,027,845.19
Please refer to Note XIV. 2 Segment Report for details of the principal operating locations and type
of products.
49. Tax and surcharges
For the six
months ended
30 June 2018
For the six
months ended
30 June 2017
Business tax 50,794,937.59 86,382,293.16
City maintenance and construction tax 91,931,674.41 87,964,279.52
Education surcharges 78,682,790.62 63,932,594.98
Land appreciation tax 491,140,914.91 460,059,550.41
Real estate tax 115,689,182.96 106,407,410.39
Others 225,468,900.66 169,194,236.11
1,053,708,401.15 973,940,364.57
Other taxes principally include real estate tax, land use tax, vehicle and vessel tax, stamp duty and
related taxes incurred from corporate operating activities.

250
Notes to Unaudited Interim Financial StatementsFor the six months ended 30 June 2018
RMB
V. NOTES TO KEY ITEMS OF CONSOLIDATED FINANCIAL STATEMENTS (continued)
50. Selling expenses
For the six
months ended
30 June 2018
For the six
months ended
30 June 2017
Employee remunerations 405,786,840.86 379,762,814.66
Office and service expenses 93,484,337.78 98,758,795.94
Lease fee 66,337,198.61 75,455,612.60
Agency intermediary fee 96,049,910.14 100,744,325.69
Advertisement fee 157,054,858.75 133,302,374.75
Transportation expenses 319,736,820.32 332,299,012.04
Others 25,215,376.72 41,803,748.25
1,163,665,343.18 1,162,126,683.93
51. Administrative expenses
For the six
months ended
30 June 2018
For the six
months ended
30 June 2017
Employee remunerations 1,218,358,079.49 1,177,148,649.00
Office and service expenses 526,422,811.56 503,361,772.60
Professional fees 101,991,748.68 96,314,676.03
Lease and utilities 130,202,084.84 94,062,312.59
Sewage and afforestation fees 27,487,527.07 76,479,225.79
Suspension of operation 436,027,925.63 187,640,160.35
Others 653,099,911.86 536,037,315.88
3,093,590,089.13 2,671,044,112.24

251BBMG CORPORATION
INTERIM REPORT 2018
Notes to Unaudited Interim Financial StatementsFor the six months ended 30 June 2018
RMB
V. NOTES TO KEY ITEMS OF CONSOLIDATED FINANCIAL STATEMENTS (continued)
52. Research and Development Expenses
For the six
months end
For the six
months end
30 June 2018 30 June 2017
Material cost 6,324,171.03 1,759,846.66
Employee cost 47,665,212.66 16,260,186.43
Others 9,260,878.76 4,632,566.17
63,250,262.45 22,652,599.26
53. Finance costs
For the six
months ended
30 June 2018
For the six
months ended
30 June 2017
Interest expenses 2,421,542,974.95 2,262,646,885.32
Of which: Interests on bank loans and other
loans to be fully repaid within 5 years 2,416,824,321.32 2,258,566,041.90
Interests on bank loans and other loans
to be fully repaid over 5 years 4,718,653.63 4,080,843.42
Less: Interest income 119,554,528.16 102,242,372.45
Less: Capitalised interest (Note) 1,127,868,675.73 960,617,914.73
Exchange gains and losses 17,511,515.78 (18,255,095.79)
Bank charges 61,148,038.90 47,829,987.78
Others 111,167,342.29 103,401,978.26
1,363,946,668.03 1,332,763,468.39
Note: The amount of capitalized borrowing cost has been included in construction in progress of RMB11,706,877.68 and costs for properties under development of RMB1,116,161,798.05 (for the first half of 2017: the amount of capitalised borrowing cost was included in construction in progress of RMB45,683,124.92 and costs of properties under development of RMB914,934,789.81).

252
Notes to Unaudited Interim Financial StatementsFor the six months ended 30 June 2018
RMB
V. NOTES TO KEY ITEMS OF CONSOLIDATED FINANCIAL STATEMENTS (continued)
53. Finance costs (continued)
The breakdown of interest income was as follows:
For the six
months ended
For the six
months ended
30 June 2018 30 June 2017
Monetary fund 119,554,528.16 102,242,372.45
For the six months ended 30 June 2018, the above interest income has no interest income arising from
impaired financial assets (for the first half of 2017: Nil).
54. Asset impairment losses
For the six
months ended
30 June 2018
For the six
months ended
30 June 2017
Losses on bad debts – 182,395,052.15
Losses/(reversal of provision) on decline
in value of inventory 3,090,903.24 (40,839,361.85)
Losses on impairment of fixed assets 8,973,295.92 3,932,146.88
Losses on impairment of intangible assets 3,050,593.49 –
Losses on impairment of construction in progress 1,836,360.22 1,453,381.51
Losses on impairment of prepayments (2,027,467.49)
Others (790,102.17) –
14,133,583.21 146,941,218.69
55. Credit impairment losses
For the six
months ended
For the six
months ended
30 June 2018 30 June 2017
Losses on bad debts (43,476,415.85) –

253BBMG CORPORATION
INTERIM REPORT 2018
Notes to Unaudited Interim Financial StatementsFor the six months ended 30 June 2018
RMB
V. NOTES TO KEY ITEMS OF CONSOLIDATED FINANCIAL STATEMENTS (continued)
56. Other gains
For the six
months ended
For the six
months ended Relevant to
30 June 2018 30 June 2017 asset/income
Refunds of VAT 241,425,207.62 193,350,474.55 Relevant to income
Income from relocation
compensation
3,425,126.02 5,496,291.65 Relevant to asset/income
Income from other subsidies 51,284,765.20 55,508,697.44 Relevant to asset/income
Grants of sale of heat 1,611,842.70 1,118,692.74 Relevant to income
297,746,941.54 255,474,156.38
57. Investment gains
For the six
months ended
For the six
months ended
30 June 2018 30 June 2017
Long-term equity investment gains measured under cost
method – 266,086.09
Long-term equity investment gains measured under equity
method 139,008,136.76 52,810,274.02
Investment gains from disposal of subsidiaries – 154,210,544.33
Investment gains from the holding of financial assets at fair
value through profit or loss 61,546,654.49 –
Gains from the holding of available–for-sale financial assets – 43,417,264.38
Investment gains from the holding of financial assets at
amortized cost 24,407,626.67 –
Investment gains from the holding of equity investment at
fair value through other comprehensive Income 531,473.76 –
Investment gains from disposal of financial assets held for
trading 1,539,602.17 3,244,610.12
Gains on re-measurement of equity interests in the acquiree
not under joint control but controllable due to additional
investment on the date of acquisition at fair value – 14,563,139.38
Others 5,424,238.44 2,534,661.78
232,457,732.29 271,046,580.10
There were no significant restrictions on the repatriation of investment income of the Group as of 30
June 2018.

254
Notes to Unaudited Interim Financial StatementsFor the six months ended 30 June 2018
RMB
V. NOTES TO KEY ITEMS OF CONSOLIDATED FINANCIAL STATEMENTS (continued)
58. Gains from changes in fair value
For the six
months ended
For the six
months ended
30 June 2018 30 June 2017
Financial assets held for trading 2,927,895.47 –
Financial assets at fair value through profit or loss – (131,020,832.78)
Investment properties measured at fair value (Note V.16) 270,195,883.37 257,446,447.48
273,123,778.84 126,425,614.70
59. Gains/(losses) on disposal of assets
For the six
months ended
For the six
months ended
30 June 2018 30 June 2017
Gains on disposal of assets 21,476,624.01 9,401,693.25
Less: losses on disposal of assets 2,645,422.22 20,534,349.10
18,831,201.79 (11,132,655.85)
60. Non-operating income
For the six
months ended
30 June 2018
For the six
months ended
30 June 2017
Recognised in
non-recurring profit
and loss
for the six
months ended
30 June 2018
Gains from debt restructuring 13,576,256.77 10,650,578.99 13,576,256.77
Net gains from fines 22,928,047.87 10,821,773.69 22,928,047.87
Relocation compensation/
Government grants 1,634,830.25 35,147,805.28 1,634,830.25
Unpayable amounts 11,292,107.94 10,199,797.08 11,292,107.94
Others 38,950,381.86 57,092,595.54 38,950,381.86
88,381,624.69 123,912,550.58 88,381,624.69_____________ _____________ _____________

255BBMG CORPORATION
INTERIM REPORT 2018
Notes to Unaudited Interim Financial StatementsFor the six months ended 30 June 2018
RMB
V. NOTES TO KEY ITEMS OF CONSOLIDATED FINANCIAL STATEMENTS (continued)
61. Non-operating expenses
For the six
months ended
30 June 2018
For the six
months ended
30 June 2017
Recognised in
non-recurring profit
and loss
for the six
months ended
30 June 2018
Losses from disposal of
non-current assets 41,333,767.02 4,554,937.22 41,333,767.02
Of which: Losses from disposal
of fixed assets 41,321,148.53 4,537,356.07 41,321,148.53
Losses from disposal
of intangible assets – 8,156.95 –
Losses from disposal
of other
non-current assets 12,618.49 9,424.20 12,618.49
Abnormal losses – 4,922.64 –
Losses from debt restructuring 1,313,442.84 387,092.98 1,313,442.84
Charity donation expenses 100,000.03 17,708.76 100,000.03
Expense on compensation,
penalties and fines 46,815,569.79 5,682,850.36 46,815,569.79
Others 19,382,225.56 3,899,778.48 19,382,225.56
108,945,005.24 14,547,290.44 108,945,005.24

256
Notes to Unaudited Interim Financial StatementsFor the six months ended 30 June 2018
RMB
V. NOTES TO KEY ITEMS OF CONSOLIDATED FINANCIAL STATEMENTS (continued)
62. Expenses by nature
The supplemental information on the Group’s operating costs, selling expenses, administrative expenses
and research and development expenses by nature is as follows:
For the six
months ended
30 June 2018
For the six
months ended
30 June 2017
Consumption of raw materials 7,334,522,415.42 7,060,780,722.92
Procurement costs of tradable goods 7,032,383,236.60 4,915,892,493.90
Cost of sales of real estate 6,816,228,978.21 4,965,631,414.32
Changes in work in progress, finished goods
and trading goods (147,558,489.41) (663,398,686.08)
Employees’ remuneration 2,776,850,812.88 2,649,898,277.78
Depreciation and amortisation 2,099,833,920.20 2,101,125,398.05
Rentals 256,625,792.17 187,456,771.52
Maintenance expenses 575,036,441.39 671,108,237.47
Transportation fee 486,627,915.48 488,643,404.06
Advertising costs 157,054,858.75 133,302,374.75
Office and service expenses 88,344,112.13 82,440,967.17
Intermediary fee 198,041,658.82 244,181,788.77
Others 2,181,285,622.34 2,498,631,379.11
29,855,277,274.98 25,335,694,543.74

257BBMG CORPORATION
INTERIM REPORT 2018
Notes to Unaudited Interim Financial StatementsFor the six months ended 30 June 2018
RMB
V. NOTES TO KEY ITEMS OF CONSOLIDATED FINANCIAL STATEMENTS (continued)
63. Income tax expense
For the six
months ended
30 June 2018
For the six
months ended
30 June 2017
Current income tax expense 1,082,588,352.32 772,280,210.87
Deferred income tax expense (86,931,564.56) (126,617,636.00)
995,656,787.76 645,662,574.87
A reconciliation of income tax expense and total profit is set out as follows:
For the six
months ended
30 June 2018
For the six
months ended
30 June 2017
Total profit 3,923,400,018.37 2,427,685,642.93
Income tax expense at the statutory
tax rate of 25% (note 1) 980,850,004.59 606,921,410.73
Effect of different tax rates applicable
to some subsidiaries (38,157,503.73) (20,872,944.40)
Share of profits and losses of joint ventures
and associates (39,108,268.33) (21,489,437.80)
Expenses not deductible 8,167,589.32 6,703,140.20
Deductible temporary differences and deductible
losses utilized from previous years (96,020,961.35) (146,854,619.17)
Adjustments on the current income tax of
previous periods (41,163,567.33) (19,100,307.79)
Deductible temporary difference and deductible
losses not recognized 221,089,494.59 240,355,333.10
995,656,787.76 645,662,574.87
Note 1: Income tax of the Group shall be calculated based on the estimated taxable income from Mainland China and the applicable tax rate. Taxes of taxable income arising from other regions shall be calculated based on the applicable tax rate pursuant to the existing laws, interpretations, announcements and practices in the jurisdiction where the Group operates.

258
Notes to Unaudited Interim Financial StatementsFor the six months ended 30 June 2018
RMB
V. NOTES TO KEY ITEMS OF CONSOLIDATED FINANCIAL STATEMENTS (continued)
64. Earnings per share
The calculation of the basic earnings per share is based on the net profit for the period attributable
to ordinary shareholders of the Company divided by the weighted average number of outstanding
ordinary shares in issue. The number of newly-issued ordinary shares is calculated and determined from
the date of consideration receivable in accordance with the specified terms of issuance agreement.
The calculation of basic earnings per share is as follows:
For the six
months ended
30 June 2018
For the six
months ended
30 June 2017
Earnings
Net profit for the year attributable to ordinary
shareholders of the Company 2,410,206,116.06 1,846,371,188.87
Shares
Weighted average number of ordinary shares in
issue of the Company 10,677,771,134.00 10,677,771,134.00
Earnings per share 0.23 0.17
The Company did not have potentially dilutive ordinary shares.

259BBMG CORPORATION
INTERIM REPORT 2018
Notes to Unaudited Interim Financial StatementsFor the six months ended 30 June 2018
RMB
V. NOTES TO KEY ITEMS OF CONSOLIDATED FINANCIAL STATEMENTS (continued)
65. Notes to items of statement of cash flows
For the sixmonths ended
30 June 2018
For the six
months ended
30 June 2017
Cash received from other operating activities
Deposits and relevant amounts received 198,133,218.49 142,685,878.60
Compensation received 24,892,883.96 53,574,997.09
Current accounts and other current account 830,745,502.78 1,055,579,272.80
1,053,771,605.23 1,251,840,148.49
Cash paid relating to other operating activities
Bidding deposits of land items and relevant amounts 2,979,218,170.86 –
Relocation compensation paid 67,288,811.02 47,877,281.24
Selling and administrative expenses etc. paid 2,034,067,804.61 1,445,770,163.84
Other current accounts 2,958,986,872.62 –
8,039,561,659.11 1,493,647,445.08
Cash received from other investing activities
Disposal of financial products such as short-term
funds or bonds 2,300,000,000.00 1,161,998,000.00
Repayment of borrowings from the minority
shareholder, Beijing Vanke Enterprise Co., Ltd. – 490,000.00
Disposal of large-amount certificate of deposits 2,572,568,400.00 –
Disposal of reverse repurchase assets 2,000,200,000.00 –
6,872,768,400.00 1,162,488,000.00
Cash paid relating to other investing activities
Purchase of financial products such as
short-term funds or bonds 3,501,000,000.00 1,161,998,000.00
Purchase of large-amount certificate of deposits 2,084,429,400.00 1,699,137,077.01
Purchase of reverse repurchase assets 2,200,200,000.00 –
7,785,629,400.00 2,861,135,077.01
Cash received from other financing activities
Borrowings from the minority shareholder,
Nuode Investment Co., Ltd. of China Railway
Construction Engineering Group – 357,259,000.00
Cash paid relating to other financing activities
Repayment of financing of sale and
lease back business 397,052,351.96 2,731,947,406.30

260
Notes to Unaudited Interim Financial StatementsFor the six months ended 30 June 2018
RMB
V. NOTES TO KEY ITEMS OF CONSOLIDATED FINANCIAL STATEMENTS (continued)
66. Supplemental information to statement of cash flows
(1) Supplemental information to statement of cash flows
Reconciliation of net profit to cash flows from operating activities:
For the sixmonths ended
30 June 2018
For the sixmonths ended30 June 2017
Net profit 2,927,743,230.61 1,782,023,068.06Add: Credit impairment losses (43,476,415.85) –
Assets impairment losses 14,133,583.21 146,941,218.69Depreciation of fixed assets 1,822,381,884.50 1,818,000,065.00Amortisation of intangible assets 200,380,993.97 222,427,738.70Amortisation of long-term deferred expenses 77,071,041.73 60,697,594.35Net losses from disposal of fixed assets, intangible assets and other long-term assets 22,502,565.23 15,398,707.60Gains from changes in fair value (273,123,778.84) (126,425,614.70)Finance expenses 1,311,185,815.00 1,269,930,613.35Investment gains (232,457,732.29) (271,046,580.10)(Increase)/decrease in deferred income tax assets (70,154,196.78) 37,306,864.58Increase in deferred income tax liabilities (3,715,981.93) (163,924,500.59)Increase in inventories (1,738,150,777.27) (20,480,555,549.16)(Increase)/decrease in operating receivables (2,170,725,177.68) 3,015,707,463.97(Decrease)/increase in operating payables (5,482,193,263.62) 1,330,884,239.25
Net cash flows used in operating activities (3,638,598,210.01) (11,342,634,671.00)
Material financing activities not involving cash:Debt-to-equity swap of a minority shareholder (Note) 147,000,000.00 –
Operation receivables from third parties set-off against long-term payables to third parties – 260,432,616.92
Endorsement and transfer of bills: Endorsement and transfer of bank acceptance bills received from sale of goods or rendering of services 3,548,995,501.48 5,298,976,379.66
Note: Nuode Investment Co., Ltd. of China Railway Construction Engineering Group (中鐵建工集團諾德投資有限公司), a minority shareholder of BBMG China Railway Noble (Hangzhou) Property Development Co., Ltd. (金隅中鐵諾德(杭州)房地產開發有限公司), which, in turn, is a subsidiary of the Group, made additional investment to it in a way of debt-to-equity swap, with a capital increase of RMB147,000,000.00.

261BBMG CORPORATION
INTERIM REPORT 2018
Notes to Unaudited Interim Financial StatementsFor the six months ended 30 June 2018
RMB
V. NOTES TO KEY ITEMS OF CONSOLIDATED FINANCIAL STATEMENTS (continued)
66. Supplemental information to statement of cash flows (continued)
(1) Supplemental information to statement of cash flows (continued)
For the six
months ended
30 June 2018
For the six
months ended
30 June 2017
Net movements in cash and cash equivalents:
Balances of cash at end of the period 11,676,370,375.05 14,844,646,967.98
Less: Balances of cash at beginning of the period 12,914,086,803.47 18,110,782,535.76
Net decrease in cash and cash equivalents (1,237,716,428.42) (3,266,135,567.78)
(2) Information on acquisition or disposal of subsidiaries and other operating units
Information on disposal of subsidiaries and other operating units
For the six
months ended
30 June 2018
For the six
months ended
30 June 2017
Consideration of disposal of subsidiaries and
other operating units for the period (Note) – 30,350,000.00
Cash and cash equivalents received from the
prior year disposal of subsidiaries and other
operating units for the period – 636,620,000.00
Less: Cash and cash equivalents held by
subsidiaries and other operating units
disposed of – 1,734,900.69
Net cash received from disposal of subsidiaries
and other operating units – 634,885,099.31

262
Notes to Unaudited Interim Financial StatementsFor the six months ended 30 June 2018
RMB
V. NOTES TO KEY ITEMS OF CONSOLIDATED FINANCIAL STATEMENTS (continued)
66. Supplemental information to statement of cash flows (continued)
(2) Information on acquisition or disposal of subsidiaries and other operating units (continued)
Information on acquisition of subsidiaries and other operating units
For the six
months ended
30 June 2018
For the six
months ended
30 June 2017
Payments for the acquisition of subsidiaries
and other operating units (Note VI.1) 4,018,176,372.21 1,608,710.67
Restricted monetary fund from the
acquisition of subsidiaries and other
operating units (Note VI.1) – 209,797,472.00
Less: Cash and cash equivalents held by
subsidiaries and other operating
units acquired 382,005,950.21 565,759.69
Net cash paid for acquisition of
subsidiaries and other operating units 3,636,170,422.00 210,840,422.98
Note: The Group received the amount of RMB30,350,000.00 as the consideration of disposal of subsidiaries and other operating units for the period in December 2016.
(3) Cash and cash equivalents
30 June 2018 31 December 2017
Cash 11,676,370,375.05 12,914,086,803.47
Including: Cash on hand 3,292,287.37 908,870.81
Bank deposits readily withdrawn
on demand 11,673,078,087.68 12,912,454,696.98
Other monetary fund readily withdrawn
on demand – 723,235.68
Balance of cash and cash equivalents at end of
the period/year 11,676,370,375.05 12,914,086,803.47

263BBMG CORPORATION
INTERIM REPORT 2018
Notes to Unaudited Interim Financial StatementsFor the six months ended 30 June 2018
RMB
V. NOTES TO KEY ITEMS OF CONSOLIDATED FINANCIAL STATEMENTS (continued)
67. Assets with restricted titles or right to use
Note 30 June 2018 31 December 2017
Pledged assets
Cash and bank balances
Statutory deposit reserve placement
with central bank by Finance Company (1) 1,187,510,266.59 1,228,437,954.77
Guarantee deposits for L/C (1) 275,728,496.49 59,308,277.04
Quality/performance deposits (1) 61,408,568.85 117,009,520.57
Guarantee deposits for acceptance bills (1) 1,250,310,777.57 177,489,541.28
Inventories (2) 16,092,346,008.34 8,571,416,008.34
Bills receivable and accounts receivable (3) 5,800,000.00 5,300,000.00
Fixed assets (2) 3,742,685,900.11 4,274,246,121.07
Investment properties (2) 7,599,987,014.63 7,599,987,014.63
Equity interests (2) 5,894,407,341.71 5,494,299,741.71
Land use rights (2) 291,285,099.50 118,768,976.72
Cash and bank balances whose titles are
restricted for other reasons
Cash and bank balances
Restricted cash arising from pre-sales
of properties (4) 3,096,676,915.04 3,245,141,712.81
Other restricted cash 132,685,809.27 162,373,334.78
39,630,832,198.10 31,053,778,203.72
Note 1: As at 30 June 2018, the total amount of the Group’s pledged cash and bank balances was RMB2,774,958,109.50 (31 December 2017: RMB1,582,245,293.66), of which the amount paid by BBMG Finance Co., Ltd. (金隅財務有限公司) to the People’s Bank of China as statutory deposit reserve in accordance with relevant regulations which cannot be used for daily operations was RMB1,187,510,266.59 (31 December 2017: RMB1,228,437,954.77).
Note 2: As at 30 June 2018, the Group obtained short-term borrowings of RMB1,323,250,000.00 (31 December 2017: RMB505,300,000.00) and long-term borrowings of RMB11,161,530,000.00 (31 December 2017: RMB9,644,237,997.00) secured by inventories with a carrying amount of RMB16,092,346,008.34 (31 December 2017: RMB8,571,416,008.34), fixed assets with a carrying amount of RMB3,742,685,900.11 (31 December 2017: RMB4,274,246,121.07), investment properties with a carrying amount of RMB7,599,987,014.63 (31 December 2017: RMB7,599,987,014.63) and land use rights with a carrying amount of RMB291,285,099.50 (31 December 2017: RMB118,768,976.72) and pledged by equity interests with a carrying amount of RMB5,894,407,341.71 (31 December 2017: RMB5,494,299,741.71).
Note 3: As at 30 June 2018, the Group obtained short-term borrowings of RMB5,800,000.00 (31 December 2017: RMB5,300,000.00) by discounting bills receivable not qualified for derecognition.
Note 4: In accordance with relevant provisions, funds from pre-sales of commodity housing of property developers have to be deposited in special bank accounts of funds from pre-sales of real estates for supervision to ensure that the pre-sales funds are used for construction projects first, and written application have to be made to the supervisory bank before using the funds. Where pre-sale projects under supervision have been completed and accepted and other required conditions have been satisfied, application for lifting supervision of the funds may be made.

264
Notes to Unaudited Interim Financial StatementsFor the six months ended 30 June 2018
RMB
V. NOTES TO KEY ITEMS OF CONSOLIDATED FINANCIAL STATEMENTS (continued)
68. Foreign currency monetary items
30 June 2018 31 December 2017
Original currency Exchange rate As RMB Original currency Exchange rate As RMB
Bank deposits
USD 9,751,420.48 6.5775 64,139,968.21 12,114,512.24 6.5342 79,158,645.88
HKD 131,240.57 0.8959 117,578.43 1,917852.76 0.8359 1,603,133.12
EUR – 7.3034 – 1.39 7.8023 10.85
JPY 24,259,937.00 0.0600 1,455,596.22 24,259,925.00 0.0579 1,404,649.66
MNT 364,508,492.59 0.0027 984,172.93 1,246,231,165.99 0.0027 3,364,824.15
ZAR – 0.4803 – 32,523,224.05 0.5277 17,162,505.33
Accounts receivable
USD 70,827,757.34 6.5775 465,869,573.90 80,533,480.10 6.5342 526,221,865.67
EUR 78,645.84 7.3034 574,382.03 802,285.44 7.8023 6,259,671.69
HKD 210,398.43 0.8959 188,495.95 – – –
MNT 3,481,219,640.74 0.0027 9,399,293.03 – – –
Accounts payable
USD (121,479,489.08) 6.5775 (799,031,339.42) (70,461,342.96) 6.5342 (460,408,507.17)
MNT (8,076,740,629.63) 0.0027 (21,807,199.70) – – –
Other receivables
USD 1,740,227.40 6.5775 11,446,345.72 2,959,772.60 6.5342 19,339,746.12
MNT 161,362,740.74 0.0027 435,679.40 – – –
HKD 309,974.00 0.8959 277,705.71 285,974.00 0.8359 239,045.67
Other payables
USD – – – (2,270,097.00) 6.5342 (14,833,267.82)
ZAR – – – – – –
HKD – – – (2,647,219.28) 0.8359 (2,212,810.60)
Long-term receivables
ZAR 560,530,827.61 0.4803 269,222,956.50 485,794,441.54 0.5277 256,353,726.80
Long-term payables
USD (2,358,853.51) 6.5775 (15,515,358.95) (2,388,600.00) 6.5342 (15,607,590.12)
(12,242,150.04) 418,045,649.23

265BBMG CORPORATION
INTERIM REPORT 2018
Notes to Unaudited Interim Financial StatementsFor the six months ended 30 June 2018
RMB
VI. CHANGE IN SCOPE OF CONSOLIDATION
1. Business combination not under common control
On 29 January 2018, Tianjin Jincheng State-owned Capital Investment and Management Company Limited (天津津誠國有資本投資運營有限公司) (“Jincheng Capital”) transferred 55% equity interests in Tianjin Building Materials (Holding) Co., Ltd. (“Tianjin Building Materials”) through Tianjin Property Rights Exchange by way of public tender. On 4 May 2018, the Company entered into the Equity Transfer Contact and the Joint Venture And Cooperation Agreement with Jincheng Capital to obtain 55% equity interests in Tianjin Building Materials at a consideration of RMB4,018 million. On 10 May 2018, the Company paid in full the consideration for equity transfer to Tianjin Property Rights Exchange. On 22 May 2018, Tianjin Building Materials made amendments to its articles of association. On 22 May 2018, the date fell on which the articles of association was amended, the Company began to own beneficial control over Tianjin Building Materials by virtue of holding 55% equity interests in Tianjin Building Materials, and became its controlling shareholder.
The fair values and carrying values of identifiable assets and liabilities of Tianjin Building Materials on acquisition date are set out as follows:
Fair value as at Carrying value as at22 May 2018 22 May 2018
Cash and bank balances 1,306,893,706.52 1,306,893,706.52Bills receivable and accounts receivable 615,040,977.41 615,040,977.41Prepayments 340,949,726.06 340,949,726.06Other receivables 1,087,522,946.48 1,087,522,946.48Inventories 1,845,899,887.37 1,845,899,887.37Other current assets 85,126,592.53 58,669,752.35Long-term equity investments 530,323,924.74 530,323,924.74Investment in other equity instruments 94,470,233.85 83,159,875.68Investment properties 3,079,529,250.00 3,079,529,250.00Fixed assets 1,231,124,563.00 855,606,774.27Construction in progress 38,938,793.52 38,938,793.52Intangible assets 6,704,550,701.23 3,756,720,585.84Long-term deferred expenditures 18,814,518.54 18,814,518.54Deferred income tax assets 110,365,470.37 110,365,470.37Other non-current assets 778,476,769.32 625,853,016.06Short-term loans (1,916,570,000.00) (1,916,570,000.00)Bills payable and accounts payable (1,309,610,408.82) (1,309,610,408.82)Contract liabilities (301,932,677.61) (301,932,677.61)Wages payable (35,392,231.57) (35,392,231.57)Tax payable (1,078,962,175.13) (1,078,962,175.13)Other payables (1,493,787,805.15) (1,493,787,805.19)Non-current liabilities due within one year (1,958,361,290.77) (1,958,361,290.77)Other current liabilities (7,042,403.07) (7,042,403.07)Long-term loans (425,129,349.97) (425,129,349.97)Accrued liabilities (20,000,000.00) (20,000,000.00)Deferred income (5,120,515.04) (5,120,515.04)Deferred income tax liabilities (1,482,295,108.15) (602,589,155.75)Long-term wages (17,398,000.00) (17,398,000.00)Other non-current liabilities (18,000,000.00) (18,000,000.00)
7,798,426,095.66 5,164,393,192.29
Minority interests (3,780,249,724.45) (2,572,947,988.65)
Consideration for acquisition 4,018,176,371.21

266
Notes to Unaudited Interim Financial StatementsFor the six months ended 30 June 2018
RMB
VI. CHANGE IN SCOPE OF CONSOLIDATION (continued)
1. Business combination not under common control (continued)
The operation results and cash flows of Tianjin Building Materials from the acquisition date to the end
of the period are set out as follows:
From 22 May to
30 June 2018
Operating revenue 486,030,828.40
Net (loss) (34,698,592.23)
Net cash flows 1,404,612,527.14
2. Deregistration of subsidiaries
Five subsidiaries, namely Gongyi Tongda Zhongyuan Refractory Testing Center Co., Ltd. (鞏義通達中
原耐火材料檢測中心有限公司), Beijing BBMG Dongrun Construction Materials Co., Ltd. (北京金隅東
潤建材有限公司), Beijing Hengxing Land Real Estate Co., Ltd. (北京恆興置地房地產有限公司), Jidong
Development Group Dunshi Industrial Co., Ltd.(冀東發展集團盾石實業公司) and Tang Ren Investment
Development Limited (唐人投資發展有限公司) were deregistered by the Company during the period.
3. Establishment of new subsidiaries
Certain new subsidiaries were established by the Company during the period, details of which are set
out in Note VII. 1.

267BBMG CORPORATION
INTERIM REPORT 2018
Notes to Unaudited Interim Financial StatementsFor the six months ended 30 June 2018
RMB
VII. INTERESTS IN OTHER ENTITIES
1. Interests in the subsidiaries
Information of the Company’s subsidiaries is as follows:
Place of
registration/
principal
business Business nature
Registered
capital
RMB0’000
Percentage of
shareholding (%)
Direct Indirect
Subsidiaries acquired through establishment,
investment or other ways
Beijing Liushui Environmental Protection
Technology Co., Ltd.
(北京琉水環保科技有限公司)
Beijing Manufacture of cement, mining and
sale of sandstone etc.
66,060.00 100.00 –
Beijing Jianhua-Bulangni Concrete Co., Ltd.
(北京建華布朗尼混凝土有限公司)
Beijing Manufacture and sale of commercial
concrete
1,269.80 – 100.00
Beijing BBMG Concrete Co., Ltd.
(北京金隅混凝土有限公司)
Beijing Processing of commodity concrete
etc.
46,541.04 100.00 –
Beijing BBMG Mangrove Environmental Protection
Technology Co., Ltd.
(北京金隅紅樹林環保技術有限責任公司)
Beijing Disposal of hazardous waste etc. 169,815.09 51.00 –
Hebei BBMG Mangrove Environmental Protection
Technology Co., Ltd.
(河北金隅紅樹林環保技術有限責任公司)
Sanhe Treatment and disposal of hazardous
waste
1,000.00 – 100.00
Beijing Jinyu Pinggu Cement Co., Ltd.
(北京金隅平谷水泥有限公司)
Beijing Manufacture and sale of cement etc. 15,000.00 100.00 –
Cangzhou Lingang Jinyu Cement Co., Ltd.
(滄州臨港金隅水泥有限公司)
Cangzhou Manufacture and sale of cement and
cement product
15,000.00 – 100.00
Cheng’an BBMG Taihang Concrete Co., Ltd.
(成安金隅太行混凝土有限公司)
Cheng’an
County
Manufacture and sale of commodity
concrete
1,000.00 – 100.00
Daming BBMG Taihang Concrete Co., Ltd.
(大名縣金隅太行混凝土有限公司)
Daming County Sales of concretes and mortar 1,000.00 – 90.00
Zanhuang BBMG Cement Co., Ltd.
(贊皇金隅水泥有限公司)
Zanhuang
County
Manufacture and sale of cement
and clinker
70,000.00 100.00 –
BBMG Cement Trading Co., Ltd.
(北京金隅水泥經貿有限公司)
Beijing Wholesale of cement and cement
product etc.
50,000.00 100.00 –
Sanhe Jinling Mining Co., Ltd.
(三河市金嶺礦業有限公司)
Sanhe Processing and sale of rock materials
for construction
500.00 – 100.00
Beijing BBMG Cement Energy Technology Co., Ltd.
(北京金隅水泥節能科技有限公司)
Beijing Development and transfer of cement
and concrete technology
3,500.00 100.00 –

268
Notes to Unaudited Interim Financial StatementsFor the six months ended 30 June 2018
RMB
Place of
registration/
principal
business Business nature
Registered
capital
RMB0’000
Percentage of
shareholding (%)
Direct Indirect
Subsidiaries acquired through establishment,
investment or other ways (continued)
Siping BBMG Cement Co., Ltd.
(四平金隅水泥有限公司)
Siping Manufacture and sale of cement and
cement product etc.
30,000.00 52.00 –
Lanxian BBMG Cement Co., Ltd.
(嵐縣金隅水泥有限公司)
Lan County Manufacture and sale of cement and
cement product
20,030.00 80.00 –
Qinyang BBMG Cement Co., Ltd.
(沁陽市金隅水泥有限公司)
Qinyang Manufacture and sale of cement and
clinker etc.
16,645.00 86.60 –
Lingchuan BBMG Cement Co., Ltd.
(陵川金隅水泥有限公司)
Lingchuan
County
Manufacture and sale of cement
and clinker
35,000.00 100.00 –
Beijing BBMG Mining Co., Ltd.
(北京金隅礦業有限公司)
Beijing Sale of metal ore and mining
products etc.
500.00 100.00 –
Zuoquan BBMG Cement Co., Ltd.
(左權金隅水泥有限公司)
Zuoquan County Technical consultation service in
relation to cement clinker
53,000.00 100.00 –
Xuanhua BBMG Cement Co., Ltd.
(宣化金隅水泥有限公司)
Xuanhua County Manufacture and sale of cement
clinker
500.00 65.00 –
Bo’ai BBMG Cement Co., Ltd.
(博愛金隅水泥有限公司)
Bo’ai County Manufacture and sale of cement
and clinker
30,000.00 95.00 –
Guangling Jinyu Cement Co., Ltd.
(廣靈金隅水泥有限公司)
Guangling
County
Manufacture and sale of cement
clinker
31,700.00 100.00 –
BBMG Mortar Co., Ltd.
(北京金隅砂漿有限公司)
Beijing Manufacture and sale of dry and
mixed mortar
11,875.00 80.00 20.00
Tianjin Jinyu Treasure Bright Mortar Co., Ltd.
(天津金隅寶輝砂漿有限公司)
Tianjin Manufacture and sale of mortar 4,900.00 – 70.00
Handan BBMG Commerical Concrete Technology
Co., Ltd. (邯鄲金隅商砼科技有限公司)
Handan Manufacture and sale of prepared
components and processing of
concrete
6,600.00 100.00 –
Handan Hanshan BBMG Concrete Co., Ltd.
(邯鄲市邯山金隅混凝土有限公司)
Handan Manufacture and sale of commercial
concrete and crushed stone
3,000.00 92.00 –
Wei County BBMG Concrete Co., Ltd.
(魏縣金隅混凝土有限公司)
Handan Manufacture and sale of concrete 1,000.00 92.00 –
VII. INTERESTS IN OTHER ENTITIES (continued)
1. Interests in the subsidiaries (continued)
Information of the Company’s subsidiaries is as follows (continued):

269BBMG CORPORATION
INTERIM REPORT 2018
Notes to Unaudited Interim Financial StatementsFor the six months ended 30 June 2018
RMB
Place of
registration/
principal
business Business nature
Registered
capital
RMB0’000
Percentage of
shareholding (%)
Direct Indirect
Subsidiaries acquired through establishment,
investment or other ways (continued)
Handan BBMG Concrete Co., Ltd.
(邯鄲縣金隅混凝土有限公司)
Handan Manufacture and sale of concrete 3,000.00 92.00 –
Handan BBMG Taihang Building Materials Co., Ltd.
(邯鄲金隅太行建材有限公司)
Handan Manufacture and sale of slag
powder
8,109.00 – 100.00
Beijing BBMG Tiantan Furniture Co., Ltd.
(北京金隅天壇傢俱股份有限公司)
Beijing Manufacture, processing, and sale of
furniture etc.
20,916.49 97.68 0.15
Beijing Tiantan-Jingwei Furniture Co., Ltd.
(北京天壇京偉傢俱有限公司)
Beijing Manufacture of wooden furniture 600.00 – 60.00
Foshan BBMG Tiantan Furniture Co., Ltd.
(佛山金隅天壇傢俱有限公司)
Foshan Processing and sale of furniture and
wooden products etc.
500.00 – 100.00
Beijing Tiantan Decoration and Engineering Co., Ltd.
(北京天壇裝飾工程有限責任公司)
Beijing Building decoration and design
consultation etc.
600.00 – 100.00
Beijing Quinette Great Wall Seats Co., Ltd.
(北京奇耐特長城座椅有限公司)
Beijing Manufacture of furniture and
decoration materials and seats for
opera houses and auditoriums etc.
1,597.04 – 59.78
Beijing Woodworking Factory Co., Ltd.
(北京市木材廠有限責任公司)
Beijing Manufacture and sale of wood-
based panels, etc.
5,455.63 100.00 –
Beijing Tongda Refractory Engineering Technology Co., Ltd.
(北京通達耐火工程技術有限公司)
Beijing Development and manufacture of
various new refractory materials
etc.
1,000.00 – 100.00
Gongyi Tongda Zhongyuan Refractory Technology Co., Ltd.
(鞏義通達中原耐火技術有限公司)
Gongyi Manufacture and distribution of
refractory materials etc.
1,050.00 – 100.00
Beijing Jinyu Energy-Saving Technology Co., Ltd.
(北京金隅節能保溫科技有限公司)
Beijing Manufacture and sale of building
materials
37,496.77 100.00 –
Guantao BBMG Yuzhen Concrete Co., Ltd.
(館陶縣金隅宇震混凝土有限公司)
Handan Sale of prepared components 1,000.00 – 100.00
Jize BBMG Taihang Concrete Co., Ltd.
(雞澤縣金隅太行混凝土有限公司)
Jize County Processing and sale of commercial
concrete
1,200.00 – 100.00
Shanghai BBMG Dacheng Property Development
Co., Ltd.
(上海金隅大成房地產開發有限公司)
Shanghai Property development and operation,
etc.
100,000.00 – 100.00
VII. INTERESTS IN OTHER ENTITIES (continued)
1. Interests in the subsidiaries (continued)
Information of the Company’s subsidiaries is as follows (continued):

270
Notes to Unaudited Interim Financial StatementsFor the six months ended 30 June 2018
RMB
Place of
registration/
principal
business Business nature
Registered
capital
RMB0’000
Percentage of
shareholding (%)
Direct Indirect
Subsidiaries acquired through establishment,
investment or other ways (continued)
Ningbo BBMG Dacheng Property Development Co., Ltd. (
寧波金隅大成房地產開發有限公司)
Ningbo Property development and operation,
etc.
5,000.00 – 100.00
Beijing Jianzong Building, Installation and Engineering
Co., Ltd.
(北京建總建築安裝工程有限公司)
Beijing Construction contracting 2,001.12 – 100.00
Beijing Aerated Concrete Co., Ltd.
(北京市加氣混凝土有限責任公司)
Beijing Manufacture and sale of aerated
concrete panels
27,480.00 55.68 –
Beijing Jinyu Aerated Concrete Co., Ltd.
(北京金隅加氣混凝土有限責任公司)
Beijing Manufacture and sale of aerated
concrete products etc.
10,000.00 100.00 –
Beijing BBMG Coating Co., Ltd.
(北京金隅塗料有限責任公司)
Beijing Manufacture of coating; professional
contracting
8,900.00 100.00 –
Dachang BBMG Coating Co., Ltd.
(大廠金隅塗料有限責任公司)
Dachang County Manufacture and sale of coating 3,000.00 – 100.00
Xinjiang BBMG Coating Co., Ltd.
(新疆金隅塗料有限公司)
Urumqi Manufacture of coating; sale of
building materials etc
100.00 – 55.00
Beijing Building Materials Academy Co., Ltd.
(北京建築材料科學研究總院有限公司)
Beijing Development, manufacture and sale
of building materials etc.
19,170.00 100.00 –
Beijing Building Materials Testing Academy Co., Ltd.
(北京建築材料檢驗研究院有限公司)
Beijing Testing for building material quality
etc.
8,136.61 – 100.00
Beijing Keshi Hardware Co., Ltd.
(北京市科實五金有限責任公司)
Beijing Manufacture of new products like
construction hardware
6,595.92 100.00 –
Beijing BBMG Dongrun Construction Materials Co., Ltd.
(北京金隅東潤建材有限公司)
Beijing Wholesale of building materials etc. 2,000.00 – 51.00
Beijing BBMT-Xinke Building Materials Co., Ltd.
(北京建貿新科建材有限公司)
Beijing Purchase and sale of building
materials etc.
17,000.00 – 100.00
BBMG Home Furnishing Co., Ltd.
(北京金隅家居有限公司)
Beijing Purchase and sale of building
materials and metal materials etc.
600.00 – 100.00
Beijing BBMG Decoration and Engineering Co., Ltd.
(北京金隅裝飾工程有限公司)
Beijing Design and construction of building
decoration projects etc.
5,882.35 – 51.00
Beijing Jiandu Design and Research Institute Co., Ltd.
(北京建都設計研究院有限責任公司)
Beijing Design of modern building materials
etc.
954.12 100.00 –
VII. INTERESTS IN OTHER ENTITIES (continued)
1. Interests in the subsidiaries (continued)
Information of the Company’s subsidiaries is as follows (continued):

271BBMG CORPORATION
INTERIM REPORT 2018
Notes to Unaudited Interim Financial StatementsFor the six months ended 30 June 2018
RMB
Place of
registration/
principal
business Business nature
Registered
capital
RMB0’000
Percentage of
shareholding (%)
Direct Indirect
Subsidiaries acquired through establishment,
investment or other ways (continued)
Beijing Jiantuo Engineering Management Co., Ltd.
(北京建拓工程管理有限公司)
Beijing Agent for construction tendering 300.00 – 100.00
Beijing Sanchong Mirror Co., Ltd.
(北京三重鏡業有限公司)
Beijing Manufacture and sale of glass-made
spectacle lenses
5,766.00 – 100.00
BBMG (Dachang) Modern Industrial Park Management
Co., Ltd.
(大廠金隅現代工業園管理有限公司)
Dachang County Manufacture of various modern
building materials etc.
50,000.00 100.00 –
Yangquan Tongda BBMG Refractory Materials Co., Ltd.
(陽泉金隅通達高溫材料有限公司)
Yangquan Manufacture and sale of refractory
ceramic etc.
6,000.00 – 100.00
Beijing BBMG Business and Trading Co., Ltd.
(北京金隅商貿有限公司)
Beijing Wholesale of building materials and
metal materials etc.
66,000.00 100.00 –
Dachang BBMG Jinhaiyan Glass Wool Co., Ltd.
(大廠金隅金海燕玻璃棉有限公司)
Dachang County Manufacture and sale of glass wool
products
8,000.00 – 100.00
BBMG Material Industrial (Shanghai) Co., Ltd.
(金隅物產上海有限公司)
Shanghai Import and export of coke, iron ore
and metal materials
8,000.00 51.00 –
Tangshan Jinyu Aerated Concrete Co., Ltd.
(唐山金隅加氣混凝土有限責任公司)
Tangshan Manufacture and sale of aerated
concrete panels etc
6,860.00 – 100.00
BBMG GEM Real Estate Development Co., Ltd.
(北京金隅嘉業房地產開發有限公司)
Beijing Property development and operation
etc.
340,000.00 100.00 –
BBMG (Qingdao) Property Development Co., Ltd.
(金隅(青島)房地產開發有限公司)
Qingdao Property development and brokerage 5,000.00 – 100.00
Inner Mongolia BBMG Property Investment Co., Ltd.
(內蒙古金隅置地投資有限公司)
Hohhot Property development and operation
etc.
20,000.00 – 100.00
BBMG (Hangzhou) Property Development Co., Ltd.
(金隅(杭州)房地產開發有限公司)
Hangzhou Property development and operation
etc.
75,000.00 – 100.00
Hangzhou BBMG Mountain Villa Property Development
Co., Ltd.
(杭州金隅山墅房地產開發有限公司)
Hangzhou Property development and others 25,000.00 – 100.00
VII. INTERESTS IN OTHER ENTITIES (continued)
1. Interests in the subsidiaries (continued)
Information of the Company’s subsidiaries is as follows (continued):

272
Notes to Unaudited Interim Financial StatementsFor the six months ended 30 June 2018
RMB
Place of
registration/
principal
business Business nature
Registered
capital
RMB0’000
Percentage of
shareholding (%)
Direct Indirect
Subsidiaries acquired through establishment,
investment or other ways (continued)
BBMG (Tianjin) Property Development Co., Ltd.
(金隅(天津)房地產開發有限公司)
Tianjin Property development and sales etc. 80,000.00 – 100.00
Tangshan BBMG Julong Property Development Co., Ltd.
(唐山金隅巨龍房地產開發有限公司)
Tangshan Property development and operation
etc.
5,000.00 – 80.00
Beijing BBMG Property Development Co., Ltd.
(北京金隅置地房地產開發有限公司)
Beijing Property development and sales etc. 5,000.00 – 100.00
Beijing Xisanqi High Tech New Building Material City
Management and Development Co., Ltd.
(北京西三旗高新建材城經營開發有限公司)
Beijing Property rental and development etc. 6,129.76 100.00 –
Chengdu BBMG Dacheng Property Development
Co., Ltd.
(成都金隅大成房地產開發有限公司)
Chengdu Property development etc. 5,000.00 – 80.00
Chongqing BBMG Dacheng Property Development Co.,
Ltd.
(重慶金隅大成房地產開發有限公司)
Chongqing Property development and
consultation etc.
20,000.00 – 100.00
Beijing BBMG Chengyuan Property Development
Co., Ltd.
(北京金隅程遠房地產開發有限公司)
Beijing Property development and sale of
commodity housing etc.
45,944.06 100.00 –
Beijing Jinyexincheng Property Management Co., Ltd.
(北京市金業新城物業管理有限責任公司)
Beijing Property management 50.00 – 100.00
Inner Mongolia BBMG Dacheng Property Management
Co., Ltd.
(內蒙古金隅大成物業管理有限公司)
Hohhot Property management 200.00 – 100.00
BBMG Property Management Co., Ltd.
(北京金隅物業管理有限責任公司)
Beijing Property management 2,000.00 100.00 –
Beijing Jinhuyuan Property Management Co., Ltd.
(北京錦湖園物業管理有限公司)
Beijing Property management 50.00 – 100.00
BBMG Fengshan Hot Spring Resort Co., Ltd.
(北京金隅鳳山溫泉度假村有限公司)
Beijing Provision of accommodation and
dining services etc.
36,818.91 100.00 –
Beijing Jianyuan Hotel Co., Ltd.
(北京市建苑賓館有限公司)
Beijing Provision of accommodation and
dining services
1,000.53 – 100.00
Beijing Jianji Assets Management Co., Ltd.
(北京建機資產經營有限公司)
Beijing Self-owned property rental, property
management etc.
78,732.79 100.00 –
VII. INTERESTS IN OTHER ENTITIES (continued)
1. Interests in the subsidiaries (continued)
Information of the Company’s subsidiaries is as follows (continued):

273BBMG CORPORATION
INTERIM REPORT 2018
Notes to Unaudited Interim Financial StatementsFor the six months ended 30 June 2018
RMB
Place of
registration/
principal
business Business nature
Registered
capital
RMB0’000
Percentage of
shareholding (%)
Direct Indirect
Subsidiaries acquired through establishment,
investment or other ways (continued)
Beijing Jinhaiyan Assets Management Co., Ltd.
(北京金海燕資產經營有限責任公司)
Beijing Self-owned property rental,
investment management etc.
8,292.36 100.00 –
Beijing Jinhaiyan Property Management Co., Ltd.
(北京金海燕物業管理有限公司)
Beijing Property management 1,370.00 100.00 –
BBMG Property Operation Management Co., Ltd.
(北京金隅地產經營管理有限公司)
Beijing Commercial housing rental,
property management and hotel
management
9,900.00 100.00 –
Beijing BBMG Real Estate Agency Co., Ltd.
(北京金隅房地產經紀有限公司)
Beijing Property agency business and
property consultation
500.00 – 100.00
Beijing Kaicheng Cinda Property Management Co., Ltd.
(北京凱誠信達物業管理有限公司)
Beijing Property management 300.00 – 100.00
Beijing Wancheng Hengtai Commercial Property
Management Co., Ltd.
(北京萬成恆泰商業物業管理有限公司)
Beijing Property management 200.00 – 100.00
Jinyu Ligang (Tianjin) Property Development Co., Ltd.
(金隅麗港(天津)房地產開發有限公司)
Tianjin Property development and operation
etc.
39,000.00 – 100.00
Beijing Jinyu Chaoxin Tiandi Property Investment
Co., Ltd.
(北京金隅朝新天地置業有限公司)
Beijing Property development and property
management etc.
1,000.00 – 100.00
Jinyu Mengcheng (Ma’anshan) Property
Development Co., Ltd.
(金隅夢城(馬鞍山)房地產開發有限公司)
Ma’anshan Property development and sale of
commodity housing etc.
5,000.00 – 100.00
BBMG Finance Co., Ltd.
(北京金隅財務有限公司)
Beijing Operation of finance business and
financing advisory business etc.
300,000.00 100.00 –
VII. INTERESTS IN OTHER ENTITIES (continued)
1. Interests in the subsidiaries (continued)
Information of the Company’s subsidiaries is as follows (continued):

274
Notes to Unaudited Interim Financial StatementsFor the six months ended 30 June 2018
RMB
Place of
registration/
principal
business Business nature
Registered
capital
RMB0’000
Percentage of
shareholding (%)
Direct Indirect
Subsidiaries acquired through establishment,
investment or other ways (continued)
Hangzhou BBMG Guanchao Real Estate
Development Co., Ltd.
(杭州金隅觀潮房地產開發有限公司)
Hangzhou Property development and operation
etc.
58,600.00 – 100.00
Beijing BBMG Changyang Jiaye Real Estate Development
Co., Ltd.
(北京金隅長陽嘉業地產開發有限公司)
Beijing Property development and sale of
commodity housing etc.
237,254.90 – 100.00
BBMG Nanjing Real Estate Development Co., Ltd.
(金隅南京房地產開發有限公司)
Nanjing Property development and operation
etc.
122,000.00 – 100.00
Dachang BBMG Alavus Energy Saving Components Co.,
Ltd.
(大廠金隅愛樂屋建築節能製品有限公司)
Dachang County Provision of timber for construction
purpose and processing of timber
products
3,000.00 – 100.00
Beijing Tongda New Green High-temperature Materials
Engineering Research Centre Co., Ltd.
(北京通達綠色高溫新材料工程研究中心有限公司)
Beijing Research, experimentation and
development of engineering and
technology
1,000.00 – 98.00
Beijing Dacheng Changrun Properties Limited
(北京大成昌潤置業有限公司)
Beijing Property development and operation 1,000.00 – 82.00
Chongqing BBMG Dacheng Shanshui Real Estate
Co., Ltd.
(重慶金隅大成山水置業有限公司)
Chongqing Property development and sales of
housing etc.
49,250.00 – 100.00
Jilin BBMG Tiantan Furniture Co., Ltd.
(吉林市金隅天壇傢俱有限責任公司)
Huadian Manufacture and sale of furniture,
fixture, panels and wooden
products etc.
3,000.00 – 55.00
Beijing BBMG Cement Environmental Protection
Technology Co., Ltd.
(北京金隅水泥環保工程技術有限公司)
Beijing Construction project management,
construction general contracting
and eco-friendly technology
development etc.
1,000.00 – 100.00
Beijing BBMG Pension Industry Investment Management
Co., Ltd.
(北京金隅養老產業投資管理有限公司)
Beijing Property development and property
management etc.
1,000.00 – 100.00
VII. INTERESTS IN OTHER ENTITIES (continued)
1. Interests in the subsidiaries (continued)
Information of the Company’s subsidiaries is as follows (continued):

275BBMG CORPORATION
INTERIM REPORT 2018
Notes to Unaudited Interim Financial StatementsFor the six months ended 30 June 2018
RMB
Place of
registration/
principal
business Business nature
Registered
capital
RMB0’000
Percentage of
shareholding (%)
Direct Indirect
Subsidiaries acquired through establishment,
investment or other ways (continued)
Handan BBMG Taihang International Economic & Technical
Cooperation Co., Ltd.
(邯鄲金隅太行對外經濟技術合作有限公司)
Handan Consulting services of international
economic and trading information
and technology
600.00 – 100.00
Liaocheng BBMG Hongjun Concrete Co., Ltd.
(聊城金隅泓均砼業有限公司)
Liaocheng Manufacture and sale of commercial
concrete
1,000.00 – 80.00
Liaocheng BBMG Yonghui Concrete Co., Ltd.
(聊城金隅永輝砼業有限公司)
Liaocheng Manufacture and sale of commercial
concrete
2,000.00 – 80.00
Dachang BBMG Tiantan Furniture Co., Ltd.
(大廠金隅天壇傢俱有限責任公司)
Langfang Manufacturing, processing, sale of
furniture, etc.
68,000.00 – 100.00
BBMG Huitong (Dachang) Trading Co., Ltd.
(金隅匯通(大廠)經貿有限公司)
Langfang Wholesale of coal and building
materials, etc.
20,000.00 – 100.00
BBMG Business and Trading Co., Ltd.
(金隅商貿有限公司)
Tanzania Import and export of bulk materials 217.35 – 100.00
Beijing BBMG Property Investment Co., Ltd.
(北京金隅房地置業有限公司)
Beijing Real estate development, sale
of self-developed commercial
housing
5,000.00 – 70.00
Beijing BBMG Aixin Tonghe Elderly Services Co., Ltd.
(北京金隅愛馨通和養老服務有限公司)
Beijing Provision of centralized
accommodation and daily care
services for the elderly
50.00 – 100.00
Beijing BBMG Aixin Taihe Elderly Services Co., Ltd.
(北京金隅愛馨泰和養老服務有限公司)
Beijing Elderly services and catering
management, housework services
50.00 – 100.00
Qingdao BBMG Yangguang Property Development Co.,
Ltd.
(青島金隅陽光房地產開發有限公司)
Qingdao Real estate development and
fiduciary agent for sale of real
estate
60,000.00 – 100.00
Beijing BBMG Fengshan Training Centre Co., Ltd.
(北京金隅鳳山培訓中心有限公司)
Beijing Accommodation and conference
services, etc.
200.00 – 100.00
Xi’an BBMG Tianli Business and Trading Co., Ltd.
(西安金隅天麗商貿有限公司)
Xi’an Sale of building materials and
sanitary ware
5,000.00 – 65.00
BBMG Properties (Anhui) Co., Ltd.
(金隅置業安徽有限公司)
Hefei Property development and property
management, etc.
50,000.00 – 100.00
VII. INTERESTS IN OTHER ENTITIES (continued)
1. Interests in the subsidiaries (continued)
Information of the Company’s subsidiaries is as follows (continued):

276
Notes to Unaudited Interim Financial StatementsFor the six months ended 30 June 2018
RMB
Place of
registration/
principal
business Business nature
Registered
capital
RMB0’000
Percentage of
shareholding (%)
Direct Indirect
Subsidiaries acquired through establishment,
investment or other ways (continued)
BBMG Real Estate Development (Hefei) Co., Ltd.
(金隅房地產開發合肥有限公司)
Hefei Property development and operation 150,000.00 – 100.00
Beijing BBMG Innovation and Technology Incubator Co.,
Ltd.
(北京金隅創新科技孵化器有限公司)
Beijing Incubating property management
and technology business
100,000.00 51.37 48.63
Chongqing BBMG Dacheng New Metropolis Co., Ltd.
(重慶金隅大成新都會有限公司)
Chongqing Property development; Sale of
commodity housing etc.
150,000.00 – 100.00
BBMG Finance Lease Co., Ltd.
(金隅融資租賃有限公司)
Tianjin Finance lease business 65,594.00 60.00 40.00
Beijing BBMG Culture Technology Development
Co., Ltd.
(北京金隅文化科技發展有限公司)
Beijing Technology development, transfer,
consulting, services, and
engagement in cultural economy,
etc.
5,000.00 – 68.00
Beijing Jinyu Energy-Saving Materials & Technology
(Dachang) Co., Ltd.
(北京金隅節能保溫科技(大廠)有限公司)
Langfang Manufacture and sale of building
materials
1,700.00 – 100.00
Beijing Sanchong Mirror (Dachang) Co., Ltd.
(北京三重鏡業(大廠)有限公司)
Langfang Manufacture and sale of glass-made
spectacle lenses
5,800.00 – 100.00
BBMG Weiguan (Cangzhou) Chemical Co., Ltd.
(金隅微觀(滄州)化工有限公司)
Beijing Manufacture of wood-based panels,
resin for impregnated paper, etc.
6,000.00 – 100.00
Beijing BBMG Chengye Property Development Co., Ltd.
(北京金隅成業房地產開發有限公司)
Beijing Property development 5,000.00 – 100.00
BBMG Jiahua Nanjing Real Estate Co., Ltd.
(金隅嘉華南京置業有限公司)
Nanjing Property development 50,000.00 – 100.00
Fujian BBMG Coating Co., Ltd.
(福建金隅塗料有限公司)
Fuzhou Manufacture and sale of coating 1,000 – 55.00
Beijing BBMG Dongcheng Real Estate Co., Ltd.
(北京金隅東成置業有限公司)
Beijing Property development 100,000 – 90.50
BBMG Jindian (Tianjin) Property Development Co., Ltd.
(金隅津典(天津)房地產開發有限公司)
Tianjin Property development 10,000 – 100.00
VII. INTERESTS IN OTHER ENTITIES (continued)
1. Interests in the subsidiaries (continued)
Information of the Company’s subsidiaries is as follows (continued):

277BBMG CORPORATION
INTERIM REPORT 2018
Notes to Unaudited Interim Financial StatementsFor the six months ended 30 June 2018
RMB
Place of
registration/
principal
business Business nature
Registered
capital
RMB0’000
Percentage of
shareholding (%)
Direct Indirect
Subsidiaries acquired through establishment,
investment or other ways (continued)
Beijing BBMG Beijia Engineering Technology Co., Ltd.
(北京金隅北加工程技術有限公司)
Beijing Engineering technology services 2,000 – 100.00
BBMG China Railway Nuode (Hangzhou) Property
Development Co., Ltd.
(金隅中鐵諾德(杭州)房地產開發有限公司)
Hangzhou Property development 20,000 – 51.00
BBMG Jinghua Property Development Hefei Co., Ltd.
(金隅京華房地產開發合肥有限公司)
Hefei Property development 50,000 – 100.00
Dacheng Meixi International Property Development (Beijing)
Co., Ltd.
(大成美西國際置業發展(北京)有限公司)
Beijing Property development 10,000 – 100.00
Beijing BBMG Konggang Development Co., Ltd.
(北京金隅空港開發有限公司)
Beijing Property development 10,000 – 95.00
Beijing BBMG Business Management Co., Ltd.
(北京金隅商業管理有限公司)
Beijing Corporate management 1,000 – 100.00
BBMG Jingyuan (Ningbo) Real Estate Development
Co., Ltd.
(金隅京遠(寧波)房地產開發有限公司)
Ningbo Property development 20,000 – 100.00
Chengdu BBMG Yuehuang Real Estate Co., Ltd.
(成都金隅岳煌置業有限公司)
Chengdu Property development 5,000 – 100.00
Beijing BBMG Aixin Binhe Elderly Services Co., Ltd.
(北京金隅愛馨濱和養老服務有限公司)
Beijing Elderly services 50 – 70.00
Chengdu BBMG Jingfeng Real Estate Development
Co., Ltd.
(成都金隅京峰房地產開發有限公司)
Chengdu Property development 5,000 – 100.00
Chengdu BBMG Wancheng Real Estate Development
Co., Ltd.
(成都金隅萬成房地產開發有限公司)
Chengdu Property development 5,000 – 100.00
Chengde BBMG Real Estate Development Co., Ltd.
(承德金隅房地產開發有限公司)
Chengde Property development 5,000 – 100.00
VII. INTERESTS IN OTHER ENTITIES (continued)
1. Interests in the subsidiaries (continued)
Information of the Company’s subsidiaries is as follows (continued):

278
Notes to Unaudited Interim Financial StatementsFor the six months ended 30 June 2018
RMB
Place of
registration/
principal
business Business nature
Registered
capital
RMB0’000
Percentage of
shareholding (%)
Direct Indirect
Subsidiaries acquired through establishment,
investment or other ways (continued)
BBMG Jiaxing Nanjing Real Estate Development Co., Ltd. (
金隅嘉星南京房地產開發有限公司)
Nanjing Property development 10,000 – 70.00
Beijing BBMG Xingda Real Estate Development Co., Ltd.
(北京金隅興大房地產開發有限公司)(1)
Beijing Property development 5,000 100.00 –
Beijing Longyuan Real Estate Development Co., Ltd.
(北京隆源房地產開發有限公司)(1)
Beijing Property development 5,000 100.00 –
BBMG Wenchao (Hangzhou) Real Estate Development
Co., Ltd.
(金隅聞潮(杭州)房地產開發有限公司)(1)
Hangzhou Property development 5,000 100.00 –
BBMG Keshi (Caofeidian) Precision Manufacture Co., Ltd.
(金隅科實(曹妃甸)精密製造有限公司)(1)
Tangshan Processing of mechanical part and
components
8,000 100.00 –
BBMG Tiantan (Tangshan) Wood Technology Co., Ltd.
(金隅天壇(唐山)木業科技有限公司)(1)
Tangshan Processing of wood 10,000 100.00 –
BBMG Star Insulation and Energy Conservation Technology
(Tangshan) Co., Ltd.
(金隅星節能保溫科技(唐山)有限公司)(1)
Tangshan Technology development of
insulation materials
5,000 100.00 –
VII. INTERESTS IN OTHER ENTITIES (continued)
1. Interests in the subsidiaries (continued)
Information of the Company’s subsidiaries is as follows (continued):

279BBMG CORPORATION
INTERIM REPORT 2018
Notes to Unaudited Interim Financial StatementsFor the six months ended 30 June 2018
RMB
Place of
registration/
principal
business Business nature
Registered
capital
RMB0’000
Percentage of
shareholding (%)
Direct Indirect
Subsidiaries acquired through business
combination under common control
Beijing Yanshui Assets Management Co., Ltd.
(北京燕水資產管理有限公司)
Beijing Manufacture of cement 6,266.85 100.00 –
Zhangjiakou Jinyu Cement Co., Ltd.
(張家口金隅水泥有限公司)
Zhangjiakou Manufacture and sale of cement and
cement products
37,300.00 100.00 –
Zhuolu Jinyu Cement Co., Ltd.
(涿鹿金隅水泥有限公司)
Zhuolu County Manufacture and sale of cement and
cement products
38,000.00 100.00 –
Quyang Jinyu Cement Co., Ltd.
(曲陽金隅水泥有限公司)
Quyang County Manufacture and sale of cement
and clinker
28,000.00 90.00 –
Beijing Bio-Island Science and Technology Co., Ltd.
(北京生態島科技有限責任公司)
Beijing Development of technologies for
waste disposal and comprehensive
utilisation and environmental
protection
5,000.00 – 100.00
Tianjin BBMG Zhenxing Environment Protection
Technology Co., Ltd.
(天津金隅振興環保科技有限公司)
Tianjin Manufacture of cement 57,943.97 62.09 24.09
Tongda Refractory Technology Co., Ltd.
(通達耐火技術股份有限公司)
Beijing Research and development and
manufacture of new refractory
materials, etc.
28,517.14 92.82 –
Shanghai BBMG Sanming Building Materials Co., Ltd.
(上海金隅三明建材有限公司)
Shanghai Manufacture and sale of modern
building materials
3,200.00 – 100.00
BBMG Human Resources Management Co., Ltd.
(北京金隅人力資源管理有限公司)
Beijing Dispatch of labour 50 – 100.00
Beijing Hengxing Land Real Estate Co., Ltd.
(北京恆興置地房地產有限公司)
Beijing Property development, etc 4,635.00 – 100.00
Haikou Dacheng Property Investment Co., Ltd.
(海口大成置業有限公司)
Haikou Property development, etc 1,600.00 – 100.00
BBMG Hong Kong Limited
(金隅香港有限公司)
Hong Kong Self-owned property rental (HKD)100.00 100.00 –
Beijing Building Decoration and Design
Engineering Co., Ltd.
(北京市建築裝飾設計工程有限公司)
Beijing Design of projects’ decoration and
furniture decoration, etc.
8,500.00 100.00 –
VII. INTERESTS IN OTHER ENTITIES (continued)
1. Interests in the subsidiaries (continued)
Information of the Company’s subsidiaries is as follows (continued):

280
Notes to Unaudited Interim Financial StatementsFor the six months ended 30 June 2018
RMB
Place of
registration/
principal
business Business nature
Registered
capital
RMB0’000
Percentage of
shareholding (%)
Direct Indirect
Subsidiaries acquired through business
combination under common control (continued)
Beijing Building Decoration and Design Institute Co., Ltd.
(北京市建築裝飾設計院有限公司)
Beijing Decorative design technical service 2,000.00 – 100.00
Beijing Longshuncheng Chinese Style Furniture Co., Ltd.
(北京市龍順成中式傢俱有限公司)
Beijing Manufacture of furniture, etc. 1,292.40 – 100.00
Beijing BBMG Doudian Technology Corporate Management
Co., Ltd.
(北京金隅竇店科技企業管理有限公司)
Beijing Manufacture of insulation and
energy-saving building materials,
etc.
15,037.66 100.00 –
BBMG Badaling Hot Spring Resort Co., Ltd.
(北京金隅八達嶺溫泉度假村有限責任公司)
Beijing Provision of travelling service and
guest rooms rental, etc.
45,420.00 – 100.00
Beijing Oakland Building Waterproofing Materials Co., Ltd. (
北京奧克蘭建築防水材料有限公司)
Beijing Processing and sale of waterproof
materials
500 – 100.00
Beijing Xisanqi Heating Co., Ltd.
(北京西三旗熱力有限責任公司)
Beijing Manufacture of low to medium
pressure steam and distilled
water, etc.
7,560.00 – 100.00
BBMG Hongye Ecological Science and Technology Co., Ltd. (
北京金隅宏業生態科技有限責任公司)
Beijing Property rental and management,
etc.
200 100.00 –
BBMG Dacheng Property Management Co., Ltd.
(北京金隅大成物業管理有限公司)
Beijing Property management 500 100.00 –
BBMG Dacheng Property Development Co., Ltd.
(北京金隅大成開發有限公司)
Beijing Property development, etc. 290,000.00 100.00 –
VII. INTERESTS IN OTHER ENTITIES (continued)
1. Interests in the subsidiaries (continued)
Information of the Company’s subsidiaries is as follows (continued):

281BBMG CORPORATION
INTERIM REPORT 2018
Notes to Unaudited Interim Financial StatementsFor the six months ended 30 June 2018
RMB
Place of
registration/
principal
business Business nature
Registered
capital
RMB0’000
Percentage of
shareholding (%)
Direct Indirect
Subsidiaries acquired through business combination
not under common control
Baoding Taihang Heyi Cement Co., Ltd.
(保定太行和益水泥有限公司)
Yi County Manufacture and sale of cement and
cement products, etc.
16,000.00 75.00 –
Hebei BBMG Dingxin Cement Co., Ltd.
(河北金隅鼎鑫水泥有限公司)
Luquan Manufacture and sale of cement and
clinker, etc.
131,700.00 100.00 –
Hebei Taihang Huaxin Building Materials Co., Ltd.
(河北太行華信建材有限責任公司)
Handan Mining of limestone and cement
products operation
22,800.00 100.00 –
Beijing BBMG Qianjing Environmental Technology Co., Ltd.
(北京金隅前景環保科技有限公司)
Beijing Manufacture and sale of cement and
cement products, etc.
10,000.00 67.00 –
Hetian Yuhe Sand Stone Company Limited
(和田市玉河砂石有限公司)
Hetian Manufacture and sale of concrete 2,040.80 – 51.00
Yixian Tenghui Mineral Building Materials Company Limited
(易縣騰輝礦產建材有限公司)
Yi County Sale of lime and rock materials, etc. 2,100.00 – 100.00
Beijing Qianglian Cement Co., Ltd.
(北京強聯水泥有限公司)
Beijing Manufacture of cement 2,000.00 – 60.00
Handan BBMG Taihang Cement Co., Ltd.
(邯鄲金隅太行水泥有限責任公司)
Handan Manufacture of cement 66,434.29 92.63 –
Cheng’an BBMG Taihang Cement Co., Ltd.
(成安金隅太行水泥有限公司)
Cheng’an
County
Manufacture of cement 6,000.00 – 75.00
Guantao BBMG Taihang Concrete Co., Ltd.
(館陶縣金隅太行混凝土有限公司)
Guantao County Manufacture and sale of commercial
concrete
4,000.00 – 100.00
Handan Shexian BBMG Cement Co., Ltd.
(邯鄲涉縣金隅水泥有限公司)
She County Manufacture and sale of cement 10,000.00 91.00 –
Tianjin BBMG Concrete Co., Ltd.
(天津金隅混凝土有限公司)
Tianjin Concrete project construction and
manufacturing, etc.
39,590.51 91.01 8.99
Shijiazhuang BBMG Xucheng Concrete Co., Ltd.
(石家莊金隅旭成混凝土有限公司)
Shijiazhuang Manufacture and sale of concrete 20,000.00 97.80 –
Beijing BBMG Beishui Enviromental Technology Co., Ltd. (
北京金隅北水環保科技有限公司)
Beijing Manufacture of cement and mining
of limestone, etc.
96,346.28 – 100.00
VII. INTERESTS IN OTHER ENTITIES (continued)
1. Interests in the subsidiaries (continued)
Information of the Company’s subsidiaries is as follows (continued):

282
Notes to Unaudited Interim Financial StatementsFor the six months ended 30 June 2018
RMB
Place of
registration/
principal
business Business nature
Registered
capital
RMB0’000
Percentage of
shareholding (%)
Direct Indirect
Subsidiaries acquired through business combination
not under common control (continued)
Beijing Chinefarge Cement Co., Ltd.
(北京興發水泥有限公司)
Beijing Manufacture of cement and clinker,
etc.
31,500.00 95.70 –
BBMG Shunfa Cement Co., Ltd.
(北京金隅順發水泥有限公司)
Beijing Manufacture of cement and clinker,
etc.
15,000.00 70.00 –
Beijing Alavus Building Energy Saving Components
Co., Ltd.
(北京愛樂屋建築節能製品有限公司)
Beijing Manufacture, sale and repair
of energy efficient doors and
windows
(EUR)400.00 82.00 –
Beijing Oriental Royal Banquet Restaurant Co., Ltd.
(北京東方御宴大酒樓有限公司)(2)
Beijing Food and beverage industry 500.00 – 100.00
Tangshan Jidong Guye Mining Investment Co., Ltd.
(唐山冀東古冶礦業投資有限責任公司)(2)
Tangshan Other machinery and equipment
repair industry
10,650.00 – 70.00
Hebei Jidong Development Group Mining Engineering
Co., Ltd.
(冀東發展集團河北礦山工程有限公司)(2)
Shijiazhuang Other construction and installation
industry
2,000.00 – 85.00
Chengde BBMG Cement Co., Ltd.
(承德金隅水泥有限責任公司)
Chengde Manufacture of cement and clinker,
etc.
40,000.00 85.00 –
Beijing Dynea Chemical Industry Co., Ltd.
(北京太爾化工有限公司)
Beijing Manufacture of wood-based panels,
resin for impregnated paper, etc.
7,808.61 100.00 –
BBMG Vanke Property Development Co., Ltd.
(北京金隅萬科房地產開發有限公司)
Beijing Property development and sale of
housing, etc.
19,000.00 – 51.00
Xingtai BBMG Yongning Cement Co., Ltd.
(邢台金隅詠寧水泥有限公司)
Xingtai Manufacture and sale of cement
clinker
33,000.00 60.00 –
Jidong Group (2) Tangshan Operating capital through holding,
equity participation, merger and
lease, wholesale and retail of
building materials, etc.
247,950.40 55.00 –
Jidong Rizhang Energy-Conserving Fan Manufacture
Co., Ltd.
(冀東日彰節能風機製造有限公司)(2)
Tangshan State-owned enterprise (machinery
manufacturing industry)
8,400.00 – 100.00
Krono (Beijing) Woods Co., Ltd.
(柯諾(北京)木業有限公司)
Beijing Manufacture, sale and technology
services of decoration panels
44,987.38 100.00 –
VII. INTERESTS IN OTHER ENTITIES (continued)
1. Interests in the subsidiaries (continued)
Information of the Company’s subsidiaries is as follows (continued):

283BBMG CORPORATION
INTERIM REPORT 2018
Notes to Unaudited Interim Financial StatementsFor the six months ended 30 June 2018
RMB
Place of
registration/
principal
business Business nature
Registered
capital
RMB0’000
Percentage of
shareholding (%)
Direct Indirect
Subsidiaries acquired through business combination
not under common control (continued)
Hebei Building Material Industry Design & Research
Institution
(河北省建築材料工業設計研究院)(2)
Shijiazhuang Building materials industry
engineering design
11,550.60 – 100.00
Jidong Development Logistics Co., Ltd.
(冀東發展物流有限責任公司)(2)
Tangshan Transportation and storage of
general goods, etc.
10,000.00 – 100.00
Huahai Wind Power Development Co., Ltd.
(華海風能發展有限公司)(2)
Tangshan Wind power equipment
manufacturing
15,000.00 – 58.95
China-Africa Jidong Building Materials Investment Co., Ltd. (
中非冀東建材投資有限責任公司)(2)
Tangshan Investment in building materials
industry
34,830.00 – 60.00
Shijiazhuang Dunshi Real Estate Development Co., Ltd.
(石家莊盾石房地產開發有限公司)(2)
Shijiazhuang Property development and operation,
etc.
10,000.00 – 65.00
Jidong Development (HK) International Ltd.
(冀東發展(香港)國際有限公司)(2)
Hong Kong Commodities trading 6,294.36 – 100.00
Hebei Dunshi Trading Co., Ltd.
(河北盾石商貿有限公司)(2)
Tangshan Wholesale and retail of cement,
clinker and concrete, etc.
15,000.00 – 100.00
Tangshan Qixin Jiyi Property Services Co., Ltd.
(唐山啟新記憶物業服務有限公司)(2)
Tangshan Property service, commodity
retail,etc.
100.00 – 100.00
Tangshan Jidong Development Machinery and Equipment
Manufacturing Co., Ltd.
(唐山冀東發展機械設備製造有限公司)(2)
Tangshan Manufacture and sales of machinery
equipment and accessories
55,000.00 – 100.00
Tangshan Jixin Cement Transition Co., Ltd.
(唐山冀新水泥中轉有限公司)(2)
Tangshan Loading, offloading and handling (USD)600 – 60.00
Tangshan Qixin Cement Industry Museum
(唐山啟新水泥工業博物館)(2)
Tangshan Cultural relic collection and
exhibition to promote national
culture, etc.
6,724.00 – 100.00
Tangshan Jidong Cement Nanhu Property Development
Co., Ltd.
(唐山冀東水泥南湖房地產開發有限公司)(2)
Tangshan Real estate 75,000.00 – 100.00
Tangshan Jidong Property Services Co., Ltd.
(唐山冀東物業服務有限公司)(2)
Tangshan Property service 300.00 – 100.00
Jidong Development International Trading Co., Ltd.
(冀東發展集團國際貿易有限公司)(2)
Beijing Trading agent 10,000.00 – 100.00
VII. INTERESTS IN OTHER ENTITIES (continued)
1. Interests in the subsidiaries (continued)
Information of the Company’s subsidiaries is as follows (continued):

284
Notes to Unaudited Interim Financial StatementsFor the six months ended 30 June 2018
RMB
Place of
registration/
principal
business Business nature
Registered
capital
RMB0’000
Percentage of
shareholding (%)
Direct Indirect
Subsidiaries acquired through business combination
not under common control (continued)
Tangshan Dunshi Real Estate Development Co., Ltd.
(唐山盾石房地產開發有限公司)(2)
Tangshan Real estate 30,000.00 – 100.00
Tangshan High Voltage Porcelain Insulator Works Co., Ltd. (
唐山高壓電瓷有限公司)(2)
Tangshan Manufacture and sales of high
voltage insulator
5,000.00 – 100.00
Tangshan Jidong Development Yan Dong Construction
Co., Ltd.
(唐山冀東發展燕東建設有限公司)(2)
Tangshan Construction industry 10,000.00 – 59.00
Tangshan Qixin Cement Co., Ltd.
(唐山啟新水泥有限公司)(2)
Tangshan Manufacture of limestone, cement
and cement clinker, etc.
23,544.00 – 100.00
Tangshan Qixin Building Materials Co., Ltd.
(唐山啟新建材有限責任公司)(2)
Tangshan Manufacture of cement and cement
products
16,747.00 – 100.00
Jidong Development Group Tangshan Xinxing
Knitting Factory
(冀東發展集團唐山新星針織總廠)(2)
Tangshan Knitting processing 4,171.00 – 100.00
Tangshan Jidong Concrete Co., Ltd.
(唐山冀東混凝土有限公司)(2)
Tangshan Manufacture and sales of concrete
and concrete products
199,000.00 – 100.00
Jidong Sand Gravel Aggregate Co., Ltd.
(冀東砂石骨料有限公司)(2)
Tangshan Aggregate 25,000.00 – 100.00
Tangshan Jidong Equipment & Engineering Co., Ltd.
(唐山冀東裝備工程股份有限公司)(2)
Tangshan Manufacturing 22,700.00 – 30.00
Jidong Cement (3) Tangshan Manufacture and sales of cement
and clinker, etc.
134,752 – 30.00
Krono (Beijing) Woods Co., Ltd.
(柯諾(北京)木業有限公司)
Beijing Production and sale of artificial
panels
44,987.38 100.00 –
BBMG Jidong Caifeidian Supply Chain Management
Co., Ltd.
(金隅冀東曹妃甸供應鏈管理有限公司)(1)
Tangshan Supply chain management services 20,000.00 – 100.00
Tianjin Building Materials (Holding) Co., Ltd.
(天津市建築材料集團(控股)有限公司)(4)
Tianjin Manufacture and sales of building
materials and decoration materials
Lease of self-owned properties,
market exploration services as
well as exports and imports
businesses, etc.
308,222.35 55 –
VII. INTERESTS IN OTHER ENTITIES (continued)
1. Interests in the subsidiaries (continued)
Information of the Company’s subsidiaries is as follows (continued):

285BBMG CORPORATION
INTERIM REPORT 2018
Notes to Unaudited Interim Financial StatementsFor the six months ended 30 June 2018
RMB
VII. INTERESTS IN OTHER ENTITIES (continued)
1. Interests in the subsidiaries (continued)
(1) Newly-established subsidiaries during the period.
(2) In 2016, the Company acquired 55% equity interests of Jidong Group through capital increase and acquisition of equity interests, becoming the controlling shareholder of Jidong Group. The proportion of indirect shareholding in Jidong Group’s subsidiaries represents the proportion of voting rights in these subsidiaries held by the Group through Jidong Group.
(3) The Company holds 30% equity interests of Jidong Cement and Tangshan Jidong Equipment & Engineering Co., Ltd. (“Jidong Equipment”) respectively through Jidong Group. After comprehensive consideration of the Group’s voting rights in Jidong Cement and Jidong Equipment as compared with other shareholders’ entitlement, historic exercise of voting rights at general meetings of Jidong Cement and Jidong Equipment, the Group’s board seats in Jidong Cement and Jidong Equipment as well as the actual arrangement of production and operation activities of Jidong Cement and Jidong Equipment, the management of the Group believes that the Group has effective control over Jidong Cement and Jidong Equipment.
(4) During the period, the Company obtained 55% equity interests in Tijian Buiding Materials through business combination not under common control, and became a controlling shareholder of Tijian Buiding Materials.
Subsidiaries with significant minority interests are as follows:
Percentage
of minority
shareholding
Profit or loss
attributable to
minority shareholders
Dividend paid to
minority shareholders Others
Accumulated equity
attributable to minority
interests at the end
of the period/year
For the six months ended 30 June 2018
BBMG Vanke Property Development Co., Ltd. 49.00% 32,319,492.12 – – 403,614,407.97
Jidong Group 45.00% 325,651,093.23 (7,552,860.00) (112,557,730.74) 16,055,661,368.69
Tianjin Building Materials* 45.00% (21,686,364.77) – 898,441,215.64 4,657,004,575.31
2017
BBMG Vanke Property Development Co., Ltd. 49.00% 17,556,989.47 – – 371,294,915.85
Beijing BBMG Mangrove Environmental Protection
Technology Co., Ltd. 49.00% 31,320,520.56 – 1,436,839.23 1,286,804,025.23
Jidong Group 45.00% 51,059,995.85 9,106,956.15 (2,104,677.36) 15,850,120,866.20
* Upon the acquisition of Tijian Buiding Materials through business combination not under common control, the Company and Jincheng Capital contributed additional capital of RMB1,100,000,000.00 and RMB900,000,000.00 to Tijian Buiding Materials in proportion to their percentage of shareholding of 55% and 45%, respectively.

286
Notes to Unaudited Interim Financial StatementsFor the six months ended 30 June 2018
RMB
VII. INTERESTS IN OTHER ENTITIES (continued)
1. Interests in the subsidiaries (continued)
The following table sets forth the major financial information of the above-mentioned subsidiaries.
Relevant figures represent amounts before intragroup offsetting:
30 June 2018
BBMG Vanke Property
Development Co., Ltd. Jidong Group
Tianjin Building
Materials
Current assets 888,154,183.53 23,363,595,273.65 6,456,806,126.24
Non-current assets 2,568,982.67 41,841,900,323.82 12,581,038,890.57
Total assets 890,723,166.20 65,205,495,597.47 19,037,845,016.81
Current liabilities 67,020,292.80 37,967,438,834.09 7,322,083,971.34
Non-current liabilities – 8,973,157,034.75 1,098,358,110.75
Total liabilities 67,020,292.80 46,940,595,868.84 8,420,442,082.09
For the six months ended 30 June 2018
Operating revenue 5,859,331.05 13,034,153,416.73 486,030,828.40
Net profit/(loss) 65,958,147.19 461,961,035.51 (39,422,056.98)
Total comprehensive income 65,958,147.19 332,763,352.67 (42,886,022.23)
Net cash flows from/(used in) operating activities (5,389,161.35) 481,248,367.34 (4,135,760.00)

287BBMG CORPORATION
INTERIM REPORT 2018
Notes to Unaudited Interim Financial StatementsFor the six months ended 30 June 2018
RMB
VII. INTERESTS IN OTHER ENTITIES (continued)
1. Interests in the subsidiaries (continued)
31 December 2017
Beijing Vanke Property
Development Co., Ltd.
Beijing BBMG Mangrove
Environmental Protection
Technology Co., Ltd. Jidong Group
Current assets 880,698,129.09 1,897,360,292.23 21,073,005,497.99
Non-current assets 3,094,442.72 1,445,999,819.05 42,717,758,669.76
Total assets 883,792,571.81 3,343,360,111.28 63,790,764,167.75
Current liabilities 126,047,845.59 499,984,152.80 37,892,321,644.39
Non-current liabilities – 217,245,228.13 7,755,694,131.89
Total liabilities 126,047,845.59 717,229,380.93 45,648,015,776.28
2017 2017
October to
December 2017
Operating revenue 21,851,596.14 1,091,467,127.63 22,663,384,834.71
Net profit/(loss) 35,830,590.76 63,919,431.33 (311,031,708.52)
Total comprehensive income 35,830,590.76 63,919,431.33 (299,531,097.22)
Net cash flows from/(used in)
operating activities 15,720,116.93 279,788,507.95 3,046,511,000.43
2. Transactions resulting in changes in equity attributable to shareholders in subsidiaries with no effect on right of control
In December 2017, the Company entered into an equity transfer agreement with the minority sharehoders
of Beijing BBMG Mangrove Environmental Protection Technology Co., Ltd.(北京金隅紅樹林環保技術有
限責任公司) to acquire an aggregate of 49% equity interests in Mangrove Environmental Protection
held by those minority shareholders, at a consideration of RMB1,753,806,765.40. Completion of such
equity transfer took place in June 2018, upon which, the percentage of shareholding of the Company
increased from 51% to 100%. Based on the percentage of shareholding of the minority shareholders
of 49% as at the acquisition date, an amount of of RMB1,348,269,654.77 in respect of net asset
was recognised, resulting a decrease of RMB405,537,110.63 in capital reserve at consolidation level.

288
Notes to Unaudited Interim Financial StatementsFor the six months ended 30 June 2018
RMB
VII. INTERESTS IN OTHER ENTITIES (continued)
2. Transactions resulting in changes in equity attributable to shareholders in subsidiaries with no effect on right of control (continued)
In May 2018, the Company acquired tradable shares of Tangshan Jidong Cement Co., Ltd. at a
consideration of RMB304,241,209.40. Accordingly, the Company’s percentage of direct sharehoding
increased by 2%. Based on the fair value determined in respect of acquisition of Tangshan Jidong Cement
Co., Ltd. through business combination not under common control of the Company on a reoccurring
basis, the amount of 2% net asset of Tangshan Jidong Cement Co., Ltd. was RMB292,613,097.28,
resulting a decrease of RMB11,628,112.12 in capital reserve at consolidation level.
3. Interests in joint ventures and associates
Place of
registration/principal
business Business nature
Registered
capital
RMB’000
Percentage of
shareholding (%) Accounting
treatment
Direct Indirect
Joint ventures
STAR-USG Building Materials Co., Ltd.
(星牌優時吉建築材料有限公司)
Dachang County Production of mineral wool acoustic
board, etc.
(USD)54,520 50.00 – Equity method
BBMG Landao Commercial Operation
Management Co., Ltd.
(北京金隅藍島商業運營管理有限公司)
Beijing Commodities retail 6,000 – 50.00 Equity method
BBMG TUS Technology Incubator Co., Ltd.
(北京金隅啟迪科技孵化器有限公司)
Beijing Incubating technology business,
enterprise management, etc.
8,000 – 50.00 Equity method
Jidong Heidelberg (Fufeng) Cement Co., Ltd.
(冀東海德堡(扶風)水泥有限公司)
Baoji Manufacture and sales of cement
and clinker, etc.
489,975 – 48.11 Equity method
Jidong Heidelberg (Jingyang) Cement Co., Ltd.
(冀東海德堡(涇陽)水泥有限公司)
Xianyang Manufacture and sales of cement
and clinker, etc.
458,960 – 50.00 Equity method
Tangshan Caofeidian Dunshi New Building
Material Co., Ltd.
(唐山曹妃甸盾石新型建材有限公司)
Tangshan Manufacture and sales of slag fine
powder and by-product
200,000 – 50.00 Equity method
Anshan Jidong Cement Co., Ltd.
(鞍山冀東水泥有限責任公司)
Anshan Manufacture and sales of cement
and clinker, etc.
300,000 – 50.00 Equity method
Jidong Pacific (Beijing) Environmental Protection
Engineering Technology Co., Ltd.
(冀東太平洋(北京)環保工程技術有限公司)
Beijing Design, research and development
of cement energy-saving and
environmental equipment, etc.
30,000 – 50.00 Equity method
Cross Point Trading 274 (Pty) Ltd (RF) South Africa Investment in building materials
industry
(ZAR)300,000 – 56.00 Equity method

289BBMG CORPORATION
INTERIM REPORT 2018
Notes to Unaudited Interim Financial StatementsFor the six months ended 30 June 2018
RMB
Place of
registration/principal
business Business nature
Registered
capital
RMB’000
Percentage of
shareholding (%) Accounting
treatment
Direct Indirect
Associates
Beijing Gaoqiang Concrete Co., Ltd.
(北京市高强混凝土有限責任公司)
Beijing Production of concrete, pumping,
etc.
55,000 25.00 – Equity method
Zehnder (China) Indoor Climate Co., Ltd.
(森德(中國)暖通設備有限公司)
Beijing Production of radiators, etc. (USD)27,500 26.70 – Equity method
OCV Reinforcements (Beijing) Co., Ltd.
(歐文斯科寧複合材料(北京)有限公司)
Beijing Complete non-standard control of
concrete and pumping
55,000 20.00 – Equity method
Beijing Sinobaide Technology Co., Ltd.
(北京金時佰德技術有限公司)
Beijing Design and production of equipment 10,000 – 23.00 Equity method
Hebei Ruisuo Solid Waste Engineering
Technology Research Institute Co., Ltd.
(河北睿索固廢工程技術研究院有限公司)
Chengde Technology research and testing for
comprehensive utilization of solid
waste, etc.
46,000 – 34.78 Equity method
Tangshan Conch Profiles Co., Ltd.
(唐山海螺型材有限責任公司)
Tangshan Manufacture and sales of
architectural profiles
160,000 40.00 – Equity method
Beijing Youth Camp Jinyu Fengshan Education
Technology Co., Ltd.
(北京青年營金隅鳳山教育科技有限公司)
Beijing Education technology promotion
services, etc.
10,000 – 30.00 Equity method
SINJI TRADING PTE LTD
(新冀貿易私人有限公司)
Singapore Wholesale and sales of metal and
metallic mineral, etc.
(SGD)800,000 – 40.00 Equity method
Zhongfang Huarui (Tangshan) Real Estate Co., Ltd.
(中房華瑞(唐山)置業有限公司)
Tangshan Property development and operation,
etc.
10,000 – 40.00 Equity method
Tangshan Harbor Datangtongzhou Building
Materials Co., Ltd.
(唐山海港大唐同舟建材有限公司)
Tangshan Manufacture and sales of concrete
blocks, etc.
15,000 – 20.00 Equity method
Changchun Light Rail Jidong Concrete Co., Ltd.
(長春輕軌冀東混凝土有限公司)
Changchun Manufacture and sales of commercial
concrete, etc.
10,000 – 49.00 Equity method
Baogang Jidong Cement Co., Ltd.
(包鋼冀東水泥有限公司)
Baotou Manufacture and sale of micro-
powder from metallurgical slag
250,000 – 49.00 Equity method
Jidong Cement Fufeng Transportation Co., Ltd.
(冀東水泥扶風運輸有限責任公司)
Baoji Automobile transportation, etc. 16,000 – 23.75 Equity method
Jilin Changjitu Investment Co., Ltd.
(吉林市長吉圖投資有限公司)
Jilin Service industry, etc. 500,000 – 30.00 Equity method
Tangshan Hangdao Marine Heavy Industry
Co., Ltd.
(唐山航島海洋重工有限公司)
Tangshan Research and developemnt of
offshore platform technology
150,000 – 30.00 Equity method
VII. INTERESTS IN OTHER ENTITIES (continued)
3. Interests in joint ventures and associates (continued)

290
Notes to Unaudited Interim Financial StatementsFor the six months ended 30 June 2018
RMB
Place of
registration/principal
business Business nature
Registered
capital
RMB’000
Percentage of
shareholding (%) Accounting
treatment
Direct Indirect
Associates (continued)
Beijing XinYuan Concrete Co., Ltd.
(北京新源混凝土有限公司)
Beijing Manufacture and sales of concrete,
etc.
20,000 – 65.00 Equity method
Xianyang Jidong High New Concrete Co., Ltd.
(咸陽冀東高新混凝土有限公司)
Xianyang Manufacture and sales of concrete,
etc.
25,000 – 60.00 Equity method
Tangshan Fengrun District the First
Transportation Co., Ltd.
(唐山市豐潤區第一運輸公司)
Tangshan Transportation services etc. 4,503 – 17.38 Equity method
Jilin Cement (Group) Co., Ltd.
(吉林水泥(集團)有限公司)
Jilin Manufacture and sales of clinker,
cement, etc.
50,000 – 28.60 Equity method
Tianjin Gangbei Concrete Co., Ltd.
(天津岡北混凝土有限公司)
Tianjin Manufacture of cement, ready-
mixed concrete and concrete
products, etc.
20,000 – 30.00 Equity method
Tianjin Wankeyou Energy Saving Technology.
Co., Ltd.
(天津萬可優節能科技有限公司)
Tianjin Sales of insulation materials and
ancillary products of building
exterior walls, etc.
9,600 – 35.00 Equity method
Tianjin Xingye Longxiang Construction Co., Ltd.
(天津市興業龍祥建設工程有限公司)
Tianjin Undertaking the construction of
various types of projects, etc.
100,000 – 30.00 Equity method
Tianjin SYP Glass Co., Ltd.
(天津耀皮玻璃有限公司)
Tianjin Manufacture and sale of various
types of plate glass, etc.
736,166 – 23.00 Equity method
Tianjin Xinling Environmental Protection
Engineering Co., Ltd.
(天津市新菱環保工程有限公司)
Tianjin Design, manufacture and sales
of sound isolation and noise
reduction products, etc.
25,000 – 44.00 Equity method
Tianjin Binhai Jiantai Investment Co., Ltd.
(天津濱海建泰投資有限公司)
Tianjin Investments in high-tech industry, etc. 15,625 – 48.00 Equity method
VII. INTERESTS IN OTHER ENTITIES (continued)
3. Interests in joint ventures and associates (continued)

291BBMG CORPORATION
INTERIM REPORT 2018
Notes to Unaudited Interim Financial StatementsFor the six months ended 30 June 2018
RMB
VII. INTERESTS IN OTHER ENTITIES (continued)
3. Interests in joint ventures and associates (continued)
The following table sets forth the consolidated financial information on joint ventures and associates
which are not individually significant to the Group:
For the six months
ended 30 June
2018 2017
Joint ventures
Total carrying amount of investments 1,475,011,870.47 1,533,998,796.99
Total amount calculated based on shareholding
Net profit 130,599,542.97 203,420,253.95
Total comprehensive income 128,523,565.69 212,232,235.44
Associates
Total carrying amount of investments 1,026,770,062.41 640,940,460.52
Total amount calculated based on shareholding
Net profit/(loss) 8,408,593.79 (14,688,123.63)
Total comprehensive income 8,408,593.79 (14,688,123.63)

292
Notes to Unaudited Interim Financial StatementsFor the six months ended 30 June 2018
RMB
VIII. RISKS RELATED TO FINANCIAL INSTRUMENTS
1. Financial instruments by category
The carrying amounts of each of the categories of financial instruments as at the balance sheet date
are as follows:
30 June 2018
Financial assets
Financial assets at
fair value through
profit or loss
Financial assets carried
at amortised cost
Financial assets at fair
value through other
comprehensive income Total
Cash and bank balances – 17,680,691,208.86 – 17,680,691,208.86
Financial assets held for trading 1,350,141,114.85 – – 1,350,141,114.85
Bills receivable and accounts receivable – 16,424,808,133.57 – 16,424,808,133.57
Other receivables – 8,799,349,692.41 – 8,799,349,692.41
Debt investments – 200,000,000.00 – 200,000,000.00
Long-term receivables – 772,241,633.80 – 772,241,633.80
Investment in other equity instruments – – 455,311,615.11 455,311,615.11
Other non-current financial assets 1,730,252,400.00 – – 1,730,252,400.00
3,080,393,514.85 43,877,090,668.64 455,311,615.11 47,412,795,798.60
Financial liabilities
Financial
liabilities carried at
amortised cost
Short-term loans 38,136,520,000.00
Bills payable and accounts payable 17,556,199,802.79
Other payables 8,572,106,367.18
Non-current liabilities due within one year 13,049,262,905.72
Long-term loans 29,135,269,349.97
Bonds payable 19,971,170,605.73
Short-term financing bonds 5,500,000,000.00
Long-term payables 615,533,763.80
Other non-current liabilities 660,456,831.52
133,196,519,626.71

293BBMG CORPORATION
INTERIM REPORT 2018
Notes to Unaudited Interim Financial StatementsFor the six months ended 30 June 2018
RMB
VIII. RISKS RELATED TO FINANCIAL INSTRUMENTS (continued)
1. Financial instruments by category (continued)
2017
Financial assets
Financial assets held for
trading at fair value
through profit or loss Loans and receivables
Available-for-sale
financial assets Total
Cash and bank balances – 17,903,847,144.72 – 17,903,847,144.72
Financial assets held for trading at
fair value through profit or loss 46,226,108.99 – – 46,226,108.99
Bills receivable and accounts receivable – 15,867,845,894.72 – 15,867,845,894.72
Other receivables – 5,572,834,876.99 – 5,572,834,876.99
Available-for-sale financial assets – – 2,897,887,864.39 2,897,887,864.39
Long-term receivables – 485,377,872.64 – 485,377,872.64
46,226,108.99 39,829,905,789.07 2,897,887,864.39 42,774,019,762.45
Financial liabilities
Financial
liabilities carried at
amortised cost
Short-term loans 34,375,200,000.00
Bills payable and accounts payable 17,205,078,515.28
Other payables 8,693,194,770.94
Non-current liabilities due within one year 11,491,439,775.59
Long-term loans 25,671,030,000.00
Bonds payable 18,154,840,828.51
Short-term financing bonds 2,769,698,081.12
Long-term payables 920,769,354.18
Other non-current liabilities 660,456,831.52
119,941,708,157.14

294
Notes to Unaudited Interim Financial StatementsFor the six months ended 30 June 2018
RMB
VIII. RISKS RELATED TO FINANCIAL INSTRUMENTS (continued)
2. Transfers of financial assets
Financial assets transferred but not yet fully derecognised
As at 30 June 2018, the Group endorsed bank acceptance bills and commercial acceptance bills with a
carrying amount of RMB2,421,700,694.30 and RMB394,337,052.37 respectively (31 December 2017:
RMB3,407,019,211.02 and RMB344,693,510.81) to its suppliers for settlement of accounts payable
but not yet derecognized, and discounted bank acceptance bills and commercial acceptance bills
with a carrying amount of RMB8,232,655.52 and RMB1,600,000.00 respectively (31 December 2017:
bank acceptance bills of RMB4,250,000.00 and commercial acceptance bills of RMB1,150,000.00)
to the banks. As the Group is of the opinion that the Group has retained substantially all their risks
and rewards, including the default risk associated, the Group continues to recognise them and the
settled accounts payable or short-term loans associated therewith in full. After the endorsement or
discount, the Group no longer reserves the rights to use these financial assets, including the rights to
sell, transfer or pledge to any other third parties. As at 30 June 2018, the carrying amount of accounts
payable settled or short-terms loans secured by the Group through these financial assets amounted to
RMB2,820,070,402.19 and RMB5,800,000.00 respectively (31 December 2017: RMB3,751,712,721.83
and RMB5,300,000.00).
Transferred financial assets fully derecognised but with continuing involvement
As at 30 June 2018, the carrying amount of bank acceptance bills endorsed to its suppliers for
settlement of accounts payable or discounted to the banks and derecognized by the Group was
RMB7,937,522,266.63 (31 December 2017: RMB3,547,596,983.95). As at 30 June 2018, the maturities
ranged from 1 to 12 months. Pursuant to relevant provisions of the “Law of Negotiable Instruments”,
the holders of commercial instruments shall have the right of recourse against the Group (“Continuing
Involvement”) if the relevant acceptance bank defaults. As the Group is of the opinion that the Group
has transferred substantially all their risks and rewards, the Group has derecognised them and the
settled accounts payable associated therewith (carrying amounts). The maximum exposure to loss from
the Continuing Involvement and repurchase and the undiscounted cash flows equal to their carrying
amounts. The Group is of the opinion that the fair value of the Continuing Involvement is insignificant.
For the six months ended 30 June 2018, no gains or losses were recognised on their dates of transfer
by the Group. No income or expenses were recognised for the current year or on an accumulative
basis as a result of the Group’s Continuing Involvement in derecognised financial assets. Endorsements
were incurred basically evenly during the year.

295BBMG CORPORATION
INTERIM REPORT 2018
Notes to Unaudited Interim Financial StatementsFor the six months ended 30 June 2018
RMB
VIII. RISKS RELATED TO FINANCIAL INSTRUMENTS (continued)
3. Financial instruments risks
The Group is exposed to various types of risks from financial instruments during its ordinary course
of business, mainly including cedit risk, liquidity risk and market risk with foreign exchange risk and
interest rate risk inclusive. Financial instruments of the Group is mainly comprised of cash and bank
balances, equity investment, debt investment, loans, bills receivable and accounts receivable and bills
payable and accounts payable, etc. Risks related to these financial instruments and the Group’s risk
management policies adopted to reduce such risks are described as follows.
Directors are responsible for planning and establishing the risk management structure of the Group,
designating the risk management policies and the related guidance for the Group, and monitoring
the implementation of risk management measures. The Group has risk management policies in place
to identify and analyse the risk exposure of the Group. These risk management policies have defined
particular risks, covering the aspects of the management of market risk, credit risk and liquidity risk.
The Group will decide whether it is necessary to update the risk management policies and system by
regularly evaluating changes in market environment and the operating activities of the Group. Risk
management of the Group is carried out by the risk management committee in accordance with the
policies approved by the board. Risk management committee identifies, evaluates and mitigates the
relevant risks by closely working with other business departments. Internal audit department of the
Group will conduct audit regularly on risk management control and procedures, and submit the audit
results to the audit committee of the Group.
The Group spreads the risks from financial instruments by diversified investment and business portfolio,
and develops risk management policies accordingly to mitigate the risk of overconcentration on any
single industry, particular region or particular counterparties.
Credit risk
The Group trades only with recognised and creditworthy third parties. It is the Group’s policy that all
customers who wish to trade on credit terms are subject to credit verification procedures. In addition,
balances of accounts receivable are monitored on an ongoing basis to ensure that the Group’s exposure
to bad debt is not significant. For transactions that are not settled in the functional currency of the
relevant operating unit, the Group does not offer credit terms without the specific approval of the
Department of Credit Control in the Group.
Since the counterparties of cash and bank balances, financial assets held for trading and other non-
current financial assets are placed in the well-established banks and other financial institutions with
high credit ratings, these financial instruments are exposed to lower credit risk.
The credit risk of the Group’s other financial assets, which comprise bills receivable and accounts
receivable, other receivables, long-term receivables and other non-current financial assets, etc. arises
from default of the counterparty, with a maximum exposure equal to the carrying amounts of these
instruments. The Group is also exposed to credit risk through the granting of financial guarantees,
further details of which are disclosed in Note XI. Contingencies.

296
Notes to Unaudited Interim Financial StatementsFor the six months ended 30 June 2018
RMB
VIII. RISKS RELATED TO FINANCIAL INSTRUMENTS (continued)
3. Financial instruments risks (continued)
Credit risk (continued)
Amount due from customers
Since the Group trades only with recognised and creditworthy third parties, there is no requirement
for collateral. Concentrations of credit risk are managed by customer/counterparty, by geographical
region and by industry sector. There are no significant concentrations of credit risk within the Group
as the customer bases of the Group’s accounts receivable are widely dispersed in different sectors and
industries. The Group does not hold any collateral or other credit enhancements over the balances of
accounts receivable.
30 June 2018
Criteria for judging significant increase in credit risk
The Group assesses whether or not the credit risk of the relevant financial instruments has increased
significantly since the initial recognition at each balance sheet date. While determining whether the
credit risk has significantly increased since initial recognition or not, the Group takes into account
the reasonable and substantiated information that is accessible without exerting unnecessary cost or
effort, including qualitative and quantitative analysis based on the historical data of the Group, external
credit risk rating, and forward-looking information. Based on the single financial instrument or the
combination of financial instruments with similar characteristics of credit risk, the Group compares the
risk of default of financial instruments on the balance sheet date with that on the initial recognition
date in order to figure out the changes of default risk in the expected lifetime of financial instruments.
The Group considers a financial instrument to have experienced a significant increase in credit risk when
one or more of the following quantitative, qualitative or backstop criteria have been met:
• Quantitative criteria mainly comprises of the circumstance that at the reporting date, the increase
in remaining lifetime probability of default is considered significant comparing with the one at
initial recognition
• Qualitative criteria mainly comprises of the circumstances that significant adverse change in
debtor’s operation or financial status and being listed on the watch-list, etc.

297BBMG CORPORATION
INTERIM REPORT 2018
Notes to Unaudited Interim Financial StatementsFor the six months ended 30 June 2018
RMB
VIII. RISKS RELATED TO FINANCIAL INSTRUMENTS (continued)
3. Financial instruments risks (continued)
Credit risk (continued)
Definition of credit-impaired asset
The standard adopted by the Group to determine whether a credit impairment occurs is consistent
with the internal credit risk management objectives of the relevant financial instrument, taking into
account quantitative and qualitative criteria. When the Group assesses whether the credit impairment
of debtor occurred, the following factors are mainly considered:
• Significant financial difficulty of the issuer or the debtor;
• Debtors are in breach of contract, such as defaulting on interest or becoming overdue on
interest or principal payments overdue;
• The creditor of the debtor, for economic or contractual reasons relating to the debtor’s financial
difficulty, having granted to the debtor a concession that the creditor would not otherwise
consider;
• It is becoming probable that the debtor will enter bankruptcy or other financial restructuring;
• The disappearance of an active market for that financial asset because of financial difficulties
of the issuer or the debtor;
• The purchase or origination of a financial asset at a deep discount that reflects the incurred
credit losses;
The credit impairment on a financial asset may be caused by the combined effect of multiple events
and may not be necessarily due to a single event.
Parameters of expected credit loss (“ECL”) measurement
The key measuring parameters of ECL include probability of default (PD), loss given default (LGD) and
exposure at default (EAD). The Group takes into account the quantitative analysis of historical statistics
(such as ratings of counterparties, manners of guarantees and types of collaterals, repayments, etc.)
and forward-looking information in order to establish the model of PD, LGD and EAD.

298
Notes to Unaudited Interim Financial StatementsFor the six months ended 30 June 2018
RMB
VIII. RISKS RELATED TO FINANCIAL INSTRUMENTS (continued)
3. Financial instruments risks (continued)
Credit risk (continued)
Parameters of ECL measurement (continued)
Relative definitions are listed as follows:
• PD refers to the possibility that the debtor will not be able to fulfil its obligations of repayment
throughout the entire remaining lifetime. The Group’s PD is adjusted based on historical loss
rate, taking into account the forward-looking information to reflect the debtor’s PD under the
current macroeconomic environment;
• LGD refers to the Group’s expectation of the extent of the loss resulting from the default
exposure. Depending on the type of counterparty, the method and priority of the recourse,
and the type of collaterals, the LGD varies. The LGD is the percentage of loss of risk exposure
at the time of default, calculated throughout the entire remaining lifetime;
• EAD is the amount that the Group should be reimbursed at the time of the default throughout
the entire remaining lifetime.
Forward-looking information
The assessment of a significant increase in credit risk and the calculation of ECL both involve forward-
looking information. Through the analysis of historical data, the Group identifies the key economic
indicators that affect the credit risk and ECL of various business types.
As at 30 June 2018, the accounts receivable that were neither past due nor impaired related to a large
number of diversified customers for whom there was no recent history of default.
As at 30 June 2018, the accounts receivable that were past due but not impaired related to a large
number of independent customers that have a good track record with the Group. Based on the past
experience, the Group believes that no impairment allowance is necessary in respect of these balances
as there has not been a significant change in credit quality and the balances are still considered fully
recoverable.

299BBMG CORPORATION
INTERIM REPORT 2018
Notes to Unaudited Interim Financial StatementsFor the six months ended 30 June 2018
RMB
VIII. RISKS RELATED TO FINANCIAL INSTRUMENTS (continued)
3. Financial instruments risks (continued)
Liquidity risk
The Group manages its risk to deficiency of funds using a recurring liquidity planning tool. This tool
considers both the maturity of its financial instruments and the projected cash flows from the Group’s
operations.
The Group’s objective is to maintain a balance between continuity and flexibility of funding through
the use of bank borrowings, financial leasing, bonds payable and short-term financing bonds payable.
In addition, the Group also raised capital by way of non-public issue, so as to fund its own operations
and development.
The liquidity of the Group is primarily dependent on adequate cash inflows from operations to meet its
debt obligations as they fall due and external financing to meet its committed future capital expenditure.
With respect to future capital commitment and other funding requirements, the Company’s credit
facilities granted by domestic banks amounted to RMB94.326 billion as at 30 June 2018, of which
approximately RMB47.493 billion remained unused.
The table below summarises the maturity profile of financial liabilities based on the undiscounted
contractual cash flows:
As at 30 June 2018
Within 1 year 1-2 years 2-5 years Over 5 years Total
Bills payable and accounts payable 17,556,199,802.79 – – – 17,556,199,802.79
Other payables 8,572,106,367.18 – – – 8,572,106,367.18
Long-term payables 658,843,190.35 550,300,999.29 65,232,764.51 – 1,274,376,954.15
Short-term loans 39,085,188,870.14 – – – 39,085,188,870.14
Long-term loans 7,119,260,580.55 8,088,436,815.12 14,321,652,773.47 10,875,900,325.37 40,405,250,494.51
Short-term financing bonds 5,566,013,888.89 – – – 5,566,013,888.89
Bonds payable 10,560,760,000.00 12,359,960,000.00 11,664,070,000.00 4,020,900,000.00 38,605,690,000.00
Other non-current liabilities 716,358,831.52 27,951,000.00 – – 744,309,831.52
89,834,731,531.42 21,026,648,814.41 26,050,955,537.98 14,896,800,325.37 151,809,136,209.18

300
Notes to Unaudited Interim Financial StatementsFor the six months ended 30 June 2018
RMB
VIII. RISKS RELATED TO FINANCIAL INSTRUMENTS (continued)
3. Financial Instruments Risks (continued)
Liquidity risk (continued)
As at 31 December 2017
Within 1 year 1-2 years 2-5 years Over 5 years Total
Bills payable and accounts payable 17,205,078,515.28 – – – 17,205,078,515.28
Other payables 8,693,194,770.94 – – – 8,693,194,770.94
Long-term payables 710,941,503.78 642,102,218.16 283,096,579.82 – 1,636,140,301.76
Bank borrowings 38,680,625,634.95 6,360,351,562.47 14,709,665,638.79 7,889,711,129.92 67,640,353,966.13
Bonds payable 10,200,740,000.00 11,099,940,000.00 7,600,550,000.00 1,374,900,000.00 30,276,130,000.00
Other non-current liabilities 716,358,831.52 55,902,000.00 – – 772,260,831.52
76,206,939,256.47 18,158,295,780.63 22,593,312,218.61 9,264,611,129.92 126,223,158,385.63
Market risk
Interest rate risk
The Group’s exposure to the changes in market interest rates is mainly related to the floating-rate
long-term liabilities of the Group. The Group manages its interest cost using a mix of fixed- and
floating-rate debts.
The table below demonstrates the sensitivity analysis of interest rate risk that reflects the impact on
net profit or loss (through the impact on floating-rate borrowings) and net profit or loss of other
comprehensive income after tax when a reasonably possible change in interest rates occurs, with all
other variables held constant.

301BBMG CORPORATION
INTERIM REPORT 2018
Notes to Unaudited Interim Financial StatementsFor the six months ended 30 June 2018
RMB
VIII. RISKS RELATED TO FINANCIAL INSTRUMENTS (continued)
3. Financial Instruments Risks (continued)
Market risk (continued)
Interest rate risk (continued)
For the six months ended 30 June 2018
Increase/
(decrease) in
basis point
Increase/
(decrease) in net
profit or loss
Increase/
(decrease)
in net other
comprehensive
income after tax
Increase/
(decrease)
in total
shareholder’s
equity
RMB 1% increase
in interest rate
(21,270,328.86) – (21,270,328.86)
2017
Increase/
(decrease) in
basis point
Increase/
(decrease) in net
profit or loss
Increase/
(decrease)
in net other
comprehensive
income after tax
Increase/
(decrease)
in total
shareholder’s
equity
RMB
1% increase
in interest rate (23,561,224.47) – (23,561,224.47)
Foreign exchange risk
Foreign exchange risk is the risk that the fair value or future cash flows of a financial instrument will
fluctuate due to changes in foreign exchange rates. The Group’s exposure to foreign currency risk mainly
arises from certain financial assets and liabilities held by the Group that are principally denominated
in USD, HKD, EUR, JPY, ZAR and MNT.
The table below demonstrates the sensitivity analysis of foreign exchange risk to a possible change in
exchange rates of RMB against USD, HKD, EUR, JPY, ZAR, MNT and ZMK, with all other variables held
constant, with respect to the effects on net profit or loss and net other comprehensive income after tax.

302
Notes to Unaudited Interim Financial StatementsFor the six months ended 30 June 2018
RMB
VIII. RISKS RELATED TO FINANCIAL INSTRUMENTS (continued)
3. Financial Instruments Risks (continued)
Market risk (continued)
Foreign exchange risk (continued)
For the six months ended 30 June 2018
Increase/
(decrease) In
exchange rate
Increase/
(decrease) in net
profit or loss
Increase/
(decrease)
in net other
comprehensive
income after tax
Increase/
(decrease)
in total
shareholder’s
equity
USD appreciation against RMB 1% 18,452,853.90 – 18,452,853.90
HKD appreciation against RMB 1% 7,339.03 3,334,436.60 3,341,775.63
EUR appreciation against RMB 1% 4,307.87 – 4,307.87
JPY appreciation against RMB 1% 10,916.97 – 10,916.97
ZAR appreciation against RMB 1% 246,867.89 – 246,867.89
MNT appreciation against RMB 1% 2,548,043.20 – 2,548,043.20
2017
Increase/
(decrease) In
exchange rate
Increase/
(decrease) in net
profit or loss
Increase/
(decrease)
in net other
comprehensive
income after tax
Increase/
(decrease)
in total
shareholder’s
equity
USD appreciation against RMB 1% 950,756.10 – 950,756.10
HKD appreciation against RMB 1% 21,278.34 3,378,186.94 3,399,465.28
EUR appreciation against RMB 1% 41,271.45 – 41,271.45
JPY appreciation against RMB 1% 10,534.87 – 10,534.87
MNT appreciation against RMB 1% 25,236.18 – 25,236.18
ZAR appreciation against RMB 1% 2,051,371.74 – 2,051,371.74
Price risk of equity instrument investment
Price risk of equity instrument investment is the risk that the fair values of equity securities decrease
as a result of changes in the levels of equity indices and the value of individual securities. The Group
is exposed to price risk of equity instrument investment arising from individual equity instrument
investment classified as held-for-trading equity instrument investment (Note V. 3) and other equity
instrument investment (Note V. 14) as at 30 June 2018. The Group’s listed equity instrument investments
are listed on the stock exchange in Shanghai and Shenzhen and are measured at quoted market prices
at the balance sheet date.

303BBMG CORPORATION
INTERIM REPORT 2018
Notes to Unaudited Interim Financial StatementsFor the six months ended 30 June 2018
RMB
VIII. RISKS RELATED TO FINANCIAL INSTRUMENTS (continued)
4. Capital management
The main objective of the Group’s capital management is to ensure the Group’s ability to operate
on a going concern basis and maintain healthy capital ratios so as to support business growth and
maximise shareholder value.
The Group manages its capital structure and makes adjustments in response to changes in economic
conditions and risk characteristics of the underlying assets. In order to maintain or adjust the capital
structure, the Group may adjust the distribution of profits to shareholders, return capital to shareholders
or issue new shares. During the six months ended 30 June 2018 and 2017, there was no change in
the Group’s capital management objectives, policies or procedures.
The Group controls its capital using debt ratio, which is calculated by dividing total liabilities by total
assets. As at 30 June 2018 and 31 December 2017, the debt ratio was as follows:
30 June 2018 31 December 2017
Total liabilities 177,814,490,569.72 162,289,672,173.68
Total assets 254,153,863,443.50 232,207,482,091.70
Debt ratio 69.96% 69.89%

304
Notes to Unaudited Interim Financial StatementsFor the six months ended 30 June 2018
RMB
IX. DISCLOSURE OF FAIR VALUE
1. Assets measured at fair value
30 June 2018
Fair value as at 30 June 2018
Quoted price in
active market
(Level 1)
Significant
observable inputs
(Level 2)
Significant
unobservable
inputs
(Level 3) Total
Continuously measured at fair value:
Financial assets held for trading 1,350,141,114.85 – – 1,350,141,114.85
Investment in other equity
instruments 418,960,040.64 – 36,351,574.47 455,311,615.11
Other non-current financial assets 1,506,972,400.00 – 223,280,000.00 1,730,252,400.00
Investment properties – 990,228,140.00 18,227,300,235.46 19,217,528,375.46
Total 3,276,073,555.49 990,228,140.00 18,486,931,809.93 22,753,233,505.42
Fair value as at 31 December 2017
Quoted price in
active market
(Level 1)
Significant
observable inputs
(Level 2)
Significant
unobservable inputs
(Level 3) Total
Continuously measured at fair value:
Financial assets at fair value
through profit or loss 46,226,108.99 – – 46,226,108.99
Available-for-sale financial assets 1,506,972,400.00 572,786,903.04 811,431,110.39 2,891,190,413.43
Investment properties – 492,000,000.00 14,948,453,467.02 15,440,453,467.02
1,553,198,508.99 1,064,786,903.04 15,759,884,577.41 18,377,869,989.44

305BBMG CORPORATION
INTERIM REPORT 2018
Notes to Unaudited Interim Financial StatementsFor the six months ended 30 June 2018
RMB
IX. DISCLOSURE OF FAIR VALUE (continued)
1. Assets measured at fair value (continued)
The following sets forth the valuation method and key inputs used for the valuation of fair value of
the investment properties for the six months ended 30 June 2018:
Valuation method Significant unobservable inputs Range of variation
Income approach Unit rental (RMB/sq.m./day) 1.22-17.46
Term yield 5.50%-8.00%
Reversionary yield 6.00%-8.50%
Market comparable approach Similar properties N/A
For Level 3 fair value measurement under income approach, term and reversion approach in particular,
the rental income derived from the existing tenancies with due allowance for the reversionary potential
of the property is capitalised at the capitalisation rate. The estimated net leased income is capitalized
over the remaining term of lease of the investment property at an appropriate market yield expected
by investors for the type of properties to calculate the fair value of investment properties.
For Level 2 fair value measurement under market comparable approach, as for certain investment
properties, the fair value of the investment property is estimated upon the principle of substitution
under which the value of such investment property approximates the value of a comparable substitute
property for a potential buyer. In theory, the best comparable transaction would be an exact duplicate
of the subject property. In practice, the value of the evaluated property at the benchmark date of
evaluation is calculated by comparing it with the recent selling prices of similar properties and adjusting
in accordance with transaction condition, transaction date, the conditions of the property, etc.
2. Assets and liabilities disclosed at fair value
Set out below are the carrying amount and fair value of each category of financial instruments of
the Group other than short-term financial instruments with minor differences between the carrying
amount and fair value:
Carrying amount Fair value
30 June 2018 31 December 2017 30 June 2018 31 December 2017
Financial assets
Long-term receivables 772,241,633.80 485,377,872.64 772,241,633.80 485,377,872.64
Financial liabilities
Long-term loans 29,135,269,349.97 25,671,030,000.00 29,135,269,349.97 25,671,030,000.00
Bonds payable 19,971,170,605.73 18,154,840,828.51 19,971,170,605.73 18,154,840,828.51
Long-term payables 615,533,763.80 920,769,354.18 615,533,763.80 920,769,354.18
Other non-current liabilities 660,456,831.52 660,456,831.52 660,456,831.52 660,456,831.52
50,382,430,551.02 45,407,097,014.21 50,382,430,551.02 45,407,097,014.21

306
Notes to Unaudited Interim Financial StatementsFor the six months ended 30 June 2018
RMB
IX. DISCLOSURE OF FAIR VALUE (continued)
2. Assets and liabilities disclosed at fair value (continued)
Management has assessed that the fair values of the short-term financial assets and financial liabilities,
such as cash and bank balances, bill receivable and accounts receivable, other receivables, short-term
borrowings, short-term financing bonds, bills payable and accounts payable, other payables and non-
current liabilities due within one year, approximate their carrying amounts due to the short residual
term of these instruments.
The Group’s finance team is led by the manager of the finance and capital department, and is responsible
for formulating policies and procedures for the fair value measurement of financial instruments. The
finance team reports directly to the chief financial officer and the Audit Committee. As at each balance
sheet date, the finance team analyses changes in the value of financial instruments and determines
the main inputs applicable to the valuation, and the valuation must be reviewed and approved by
the chief financial officer. For the purpose of preparing interim and annual financial statements, the
finance team meets the Audit Committee twice a year to discuss the valuation process and results.
The fair value of financial assets and financial liabilities is determined based on the amount for which
an asset could be exchanged, or a liability settled, between knowledgeable, willing parties in an arm’s
length transaction, instead of the amount under forced sale or under liquidation. The following methods
and assumptions are used to estimate the fair value.
The fair values of long-term borrowings, bonds payable and long-term payables are calculated by
discounting the future cash flows using market yields currently available for other financial instruments
with similar contractual terms, credit risk and residual term as the discount rate. As at 30 June 2018,
the Group’s exposure to non-performance risk associated with the long-term borrowings, bonds payable
and long-term payables is assessed as insignificant.
3. Valuation of fair value
The following table sets forth the changes in Level 3 fair value of the investment properties of the
Group for the six months ended 30 June 2018:
Commercial properties
Value as at 1 January 2018 14,948,453,467.02
Business combination not under common control 2,581,301,110.00
Purchase during the year 460,338,775.06
Transfer of investment properties into self-occupied properties (32,988,999.99)
Changes in fair value 270,195,883.37
Value as at 30 June 2018 18,227,300,235.46
For the six months ended 30 June 2018, there was no change between different fair value levels of
investment properties of the Group.

307BBMG CORPORATION
INTERIM REPORT 2018
Notes to Unaudited Interim Financial StatementsFor the six months ended 30 June 2018
RMB
X. RELATED PARTY RELATIONSHIPS AND TRANSACTIONS
1. Parent company
Over the Company
Place of registration Business nature Registered capital
Proportion of
shareholding
Proportion
of votes
RMB’000 (%) (%)
BSCOMC Beijing Investment and investment management, assets
management, as well as the organization of the restructure
or merger of assets of enterprises
35,000,000 44.93 44.93
As at 30 June 2018, BSCOMC is the parent company of the Company, and the State-Owned Assets
Supervision and Administration Commission of the People’s Government of Beijing Municipality is the
ultimate controlling party of the Company.
2. Subsidiaries
For details on the subsidiaries, please refer to Note VII. 1. Interests in the subsidiaries.
3. Jointly-controlled entities and associates
For details on the jointly-controlled entities and associates, please refer to Note VII. 3.
4. Other related parties
Names of other related parties Relationship with related parties
BBMG Assets Company Having common key management
personnel with the Company
Party School of the Communist Party of China Beijing
Building Materials Group Corporation Committee
Other related parties
Beijing Xisha Assets Management Co., Ltd. Other related parties
Beijing Dacheng Real Estate Development Co., Ltd. Other related parties
Handan Hanni Building Materials Co., Ltd. Other related parties
Beijing Longfengshan Sands and Stone Factory Other related parties
Beijing Jinyu Scien-tech School Other related parties
Beijing Guanghua Woodworking Factory Other related parties
BBMG Properties Limited Other related parties
Beijing Jianmao Property Management Co., Ltd. Other related parties
Beijing Doors and Windows Co., Ltd. Other related parties

308
Notes to Unaudited Interim Financial StatementsFor the six months ended 30 June 2018
RMB
X. RELATED PARTY RELATIONSHIPS AND TRANSACTIONS (continued)
5. Major transactions between the Group and related parties
(1) Transactions concerning goods and services with related parties
Type of goods
For the six
months ended
For the six
months ended
or services 30 June 2018 30 June 2017
Purchase of goods and receipt of services from
related parties
Transactions with joint ventures and associates
Anshan Jidong Cement Co., Ltd. Purchase of goods 34,085,120.13 12,111,764.23
Jidong Heidelberg (Fufeng) Cement Co., Ltd. Purchase of goods 6,392,178.29 7,213.67
Baogang Jidong Cement Co., Ltd. Purchase of goods 5,052,600.60 1,212,710.40
Jidong Heidelberg (Shaanxi) Logistics Co., Ltd. Purchase of goods 785,210.39 –
Jidong Cement Fufeng Transportation Co., Ltd. Receipt of services 685,563.92 382,926.65
Jidong Heidelberg (Jingyang) Cement Co., Ltd. Purchase of goods 660,697.77 1,049,273.79
Zehnder (China) Indoor Climate Co., Ltd. Purchase of goods 254,686.77 –
Beijing Youth Camp Jinyu Fengshan Education
Technology Co., Ltd.
Purchase of goods 59,101.00 –
Tangshan Caofeidian Dunshi New Building
Materials Co., Ltd.
Purchase of goods – 2,675,048.49
Jidong Pacific (Beijing) Environmental Protection
Engineering Technology Co., Ltd.
Purchase of goods – 3,205,879.10
Beijing Sinobaide Technology Co., Ltd. Purchase of goods – 427,350.43
47,975,158.87 21,072,166.76
Transactions with other related parties
Beijing Jinyu Scien-tech School Receipt of training services 172,763.11 17,603.77
Beijing Dacheng Real Estate Development Co., Ltd. Receipt of services – 46,763.00
Beijing Longfengshan Sands and Stone Factory Receipt of services – 7,884.00
48,147,921.98 72,250.77
Sale of goods and rendering of services to
related parties
BBMG Assets Company Rendering of property services – 540,600.00

309BBMG CORPORATION
INTERIM REPORT 2018
Notes to Unaudited Interim Financial StatementsFor the six months ended 30 June 2018
RMB
Type of goods
For the six
months ended
For the six
months ended
or services 30 June 2018 30 June 2017
Transactions with joint ventures and associates
Jidong Heidelberg (Jingyang) Cement Co., Ltd. Sale of goods 54,653,379.36 9,391,337.47
Jidong Heidelberg (Fufeng) Cement Co., Ltd. Sale of goods and
rendering of services
37,037,500.95 9,426,689.06
Changchun Light Rail Jidong Concrete Co., Ltd. Sale of goods 23,060,237.20 18,316,249.33
Tangshan Caofeidian Dunshi New Building
Materials Co., Ltd.
Sale of goods 13,414,072.20 41,880.34
Anshan Jidong Cement Co., Ltd. Sale of goods 27,120,592.91 2,464,469.14
Mamba Cement Company (Pty) Ltd (RF) Sale of goods 7,489,716.51 –
Jidong Cement Fufeng Transportation Co., Ltd. Rendering of services 7,766,774.57 2,959,966.06
Baogang Jidong Cement Co., Ltd. Sale of goods 879,904.10 12,561,399.65
STAR-USG Building Materials Co., Ltd. Rendering of services 677,316.37 –
Jidong Heidelberg (Shaanxi) Logistics Co., Ltd. Rendering of services 237,738.32 –
Jidong Pacific (Beijing) Environmental Protection
Engineering Technology Co., Ltd.
Sale of goods 2,627.36 –
OCV Reinforcements (Beijing) Co., Ltd. Sale of goods – 7,917,360.33
Beijing Gaoqiang Concrete Co., Ltd. Sale of goods – 475,045.64
172,339,859.85 63,554,397.02
Type of goods
For the six
months ended
For the six
months ended
or services 30 June 2018 30 June 2017
Transactions with other related parties
Beijing Dacheng Real Estate Development Co., Ltd. Rendering of property services 352,048.38 355,371.33
Handan Hanni Building Materials Co., Ltd. Sale of goods 237,382.58 265,900.23
589,430.96 621,271.56
Purchase/sale of goods and receipt/rendering of services from/to related parties by the Group
are negotiated and determined based on market price, and carried out according to the agreed
terms entered into between the Group and related parties.
X. RELATED PARTY RELATIONSHIPS AND TRANSACTIONS (continued)
5. Major transactions between the Group and related parties (continued)
(1) Transactions concerning goods and services with related parties (continued)

310
Notes to Unaudited Interim Financial StatementsFor the six months ended 30 June 2018
RMB
X. RELATED PARTY RELATIONSHIPS AND TRANSACTIONS (continued)
5. Major transactions between the Group and related parties (continued)
(2) Leases with related parties
As lessor
Name of the lessee
Category of
leased assets
For the six
months ended
30 June 2018
For the six
months ended
30 June 2017
Beijing Dacheng Real Estate Development Co., Ltd. Building 2,519,579.60 757,996.88
STAR-USG Building Materials Co., Ltd. Building – 3,949,930.20
OCV Reinforcements (Beijing) Co., Ltd. Plant – 142,857.12
Beijing Sinobaide Technology Co., Ltd. Building – 457,684.82
Beijing Doors and Windows Co., Ltd. Building – 181,587.50
2,519,579.60 5,490,056.52
As lessee
Name of the lessor
Category of
leased assets
For the six
months ended
30 June 2018
For the six
months ended
30 June 2017
Beijing Doors and Windows Co., Ltd. Building 373,415.00 –
Beijing Dacheng Real Estate Development Co., Ltd. Building 164,000.00 –
Beijing Xisha Assets Management Co., Ltd. Building – 861,359.00
3,056,994.60 6,351,415.52
The rentals from the assets leased out to or leased from related parties by the Group are
negotiated and determined by making reference to market price, and carried out according to
the agreed terms entered into between the Group and related parties.

311BBMG CORPORATION
INTERIM REPORT 2018
Notes to Unaudited Interim Financial StatementsFor the six months ended 30 June 2018
RMB
X. RELATED PARTY RELATIONSHIPS AND TRANSACTIONS (continued)
5. Major transactions between the Group and related parties (continued)
(3) Guarantees received from/provided to related parties
Guarantees received from related parties
For the six months ended 30 June 2018
Guarantor Guaranteed partyAmount
guaranteed Starting date Maturity date
Completion of performance of guarantee or not
BBMG Assets Company BBMG GEM 600,000,000.00 20 April 2017 19 April 2022 NoBBMG Assets Company BBMG GEM 200,000,000.00 27 May 2017 26 May 2022 No
800,000,000.00
The above related parties provided guarantees in respect of borrowings for the Group at nil
consideration.
Guarantees provided to related parties
Guarantor Guaranteed party Amount guaranteed Starting date Maturity date
Completion of performance of guarantee or not
Jidong Cement Anshan Jidong Cement 20,000,000.00 18 July 2017 17 July 2018 NoJidong Cement Anshan Jidong Cement 18,000,000.00 16 November 2017 16 November 2018 NoJidong Cement Anshan Jidong Cement 14,000,000.00 30 November 2017 30 November 2018 No
52,000,000.00
As at 30 June 2018, Jidong Cement, a subsidiary of the Group, provided joint obligation
guarantees in respect of borrowings, bank guarantees and bank acceptance bills for Anshan
Jidong Cement Co., Ltd. at nil consideration, with total amount guarantees of RMB52,000,000.00.

312
Notes to Unaudited Interim Financial StatementsFor the six months ended 30 June 2018
RMB
X. RELATED PARTY RELATIONSHIPS AND TRANSACTIONS (continued)
5. Major transactions between the Group and related parties (continued)
(4) Lending to/borrowing from related parties
Borrowings
As at 30 June 2018
Amount of
lending/
borrowing
Commencement
date Maturity date
BBMG Assets Company 50,000,000.00 30 November 2017 25 November 2018
BBMG Assets Company 81,000,000.00 13 February 2018 25 January 2019
BSCOMC 20,550,000.00 25 August 2017 25 August 2018
BSCOMC 60,000,000.00 29 May 2018 29 May 2019
As at 31 December 2017
Amount of
lending/
borrowing
Commencement
date Maturity date
BBMG Assets Company 50,000,000.00 30 November 2017 25 November 2018
BBMG Assets Company 81,000,000.00 25 January 2017 24 January 2018
BSCOMC 20,550,000.00 25 August 2017 25 August 2018
BSCOMC 60,000,000.00 27 May 2017 27 May 2018
Note: Through financial institutions, the Group obtained entrusted loans of RMB81,000,000.00 from BBMG Assets Company and entrusted loans of RMB60,000,000.00 from BSCOMC in 2018, which were used for liquidity purposes. As at 30 June 2018, the balance of such loans amounted to RMB211,550,000.00 (31 December 2017: RMB211,550,000.00). The interest rate of each the above loans was in line with the benchmark rate for loans of the same period and same ranking issued by People’s Bank of China on the drawdown date corresponding to the period of the loan. During the six months ended 30 June 2018, the total interest expenses recognised for the loans were RMB2,995,173.17 (During the six months ended 30 June 2017: RMB2,595,258.33).

313BBMG CORPORATION
INTERIM REPORT 2018
Notes to Unaudited Interim Financial StatementsFor the six months ended 30 June 2018
RMB
X. RELATED PARTY RELATIONSHIPS AND TRANSACTIONS (continued)
5. Major transactions between the Group and related parties (continued)
(4) Lending to/borrowing from related parties (continued)
Lending:
During the six months ended 30 June 2018, the Group had accumulated lending to STAR-USG
Building Materials Co., Ltd. of RMB104,188,940.00 (30 June 2017: RMB104,188,940.00).
During the six months ended 30 June 2018, the Group had no additional lending to Baogang
Jidong Cement Co., Ltd. (For the six months ended 30 June 2017: RMB60,000,000.00 at
interest rate of 4.75% per annum). As at 30 June 2018, the outstanding lending amounted to
RMB60,000,000.00 (30 June 2017: RMB60,000,000.00).
During the six months ended 30 June 2018, the Group adjusted the interest rate for lending to
Cross Point Trading 274 (Pty) Ltd (RF) from 10.5% to 10% per annum (For the six months ended
30 June 2017: RMB16,640,696.45 at interest rate of 10.50% per annum). As at 30 June 2018,
the outstanding lending amounted to RMB188,416,172.20 (30 June 2017: RMB182,686,519.61).
Interest income from lending:
For the six
months ended
For the six
months ended
30 June 2018 30 June 2017
Cross Point Trading 274 (Pty) Ltd (RF) 16,276,526.26 16,974,634.96
STAR-USG Building Materials Co., Ltd. 2,278,698.95 2,417,183.42
Baogang Jidong Cement Co., Ltd. 1,432,916.80 1,491,425.38
19,988,142.01 20,883,243.76
Interest expenses from borrowing:
For the six
months ended
For the six
months ended
30 June 2018 30 June 2017
BBMG Assets Company 2,444,216.67 2,456,058.33
BSCOMC 550,956.50 139,200.00
2,995,173.17 2,595,258.33

314
Notes to Unaudited Interim Financial StatementsFor the six months ended 30 June 2018
RMB
X. RELATED PARTY RELATIONSHIPS AND TRANSACTIONS (continued)
5. Major transactions between the Group and related parties (continued)
(5) Remuneration for key management personnel
For the six
months ended
30 June 2018
For the six
months ended
30 June 2017
Remuneration for key management personnel 3,205,837.91 3,117,252.10
6. Balances of receivables from related parties
30 June 2018 31 December 2017
Bills receivable and account receivables
Due from associates
Baogang Jidong Cement Co., Ltd. 47,895,814.46 38,294,359.59
Zhongfang Huarui (Tangshan) Real Estate Co., Ltd. 14,657,627.47 16,649,655.47
Beijing Gaoqiang Concrete Co., Ltd. 6,422,413.91 –
Changchun Light Rail Jidong Concrete Co., Ltd. 5,262,447.12 23,519,974.72
Tangshan Hangdao Marine Heavy Industry Co., Ltd. 4,230,282.84 4,230,282.84
Jidong Cement Fufeng Transportation Co., Ltd. 2,476,826.10 1,283,422.39
Mamba Cement Company (Pty) Ltd (RF) 1,922,971.11 –
Xianyang Jidong High-New Concrete Co., Ltd. 647,830.88 647,830.88
OCV Reinforcements (Beijing) Co., Ltd. 267,305.25 267,305.25
Zehnder (China) Indoor Climate Co., Ltd. 199,995.00 14,174.35
Beijing XinYuan Concrete Co., Ltd. – 1,135,261.95
83,983,514.14 86,042,267.44
Due from joint ventures
Jidong Heidelberg (Jingyang) Cement Co., Ltd. 15,727,801.82 13,235,647.86
Jidong Heidelberg (Fufeng) Cement Co., Ltd. 9,785,391.89 17,707,659.30
Anshan Jidong Cement Co., Ltd. 9,280,425.96 10,824,268.86
STAR-USG Building Materials Co., Ltd. 1,749,396.23 800,000.00
Tangshan Caofeidian Dunshi New Building Materials Co., Ltd. 729,795.00 40,000.00
Jidong Heidelberg (Shaanxi) Logistic Co., Ltd. 5,319.47 –
Jidong Pacific (Beijing) Environmental Protection Engineering
Technology Co., Ltd. – 9,837.50
37,278,130.37 42,617,413.52

315BBMG CORPORATION
INTERIM REPORT 2018
Notes to Unaudited Interim Financial StatementsFor the six months ended 30 June 2018
RMB
30 June 2018 31 December 2017
Bills receivable and account receivables (continued)
Due from other related parties
Beijing Dacheng Real Estate Development Co., Ltd. 5,594,878.14 2,795,241.54
BBMG Properties Limited 720,400.00 –
Beijing Longfengshan Sands and Stone Factory 149,098.29 –
127,726,020.94 131,454,922.50
Prepayment
Prepayment to associates
Zehnder (China) Indoor Climate Co., Ltd. 1,046,241.61 2,573,018.09
Prepayment to joint ventures
Tangshan Caofeidian Dunshi New Building Materials Co., Ltd. – 356,581.00
Anshan Jidong Cement Co., Ltd. 2,764,524.33 124,011.88
Jidong Heidelberg (Fufeng) Cement Co., Ltd. – 260.00
Jidong Heidelberg (Jingyang) Cement Co., Ltd. – 22,379.40
2,764,524.33 503,232.28
Prepayment to other related parties
Beijing Hazardous Waste Materials Treatment Centre 800,000.00 –
Beijing Dacheng Real Estate Development Co., Ltd. 3,385.72 –
Beijing Xisha Assets Management Co., Ltd. – 408,564.19
4,614,151.66 3,484,814.56
X. RELATED PARTY RELATIONSHIPS AND TRANSACTIONS (continued)
6. Balances of receivables from related parties (continued)

316
Notes to Unaudited Interim Financial StatementsFor the six months ended 30 June 2018
RMB
X. RELATED PARTY RELATIONSHIPS AND TRANSACTIONS (continued)
6. Balances of receivables from related parties (continued)
30 June 2018 31 December 2017
Other receivables
BBMG Assets Company 48,208,390.65 31,120,364.02
Due from associates
Zhongfang Huarui (Tangshan) Real Estate Co., Ltd. 396,170,227.56 411,368,593.38
Baogang Jidong Cement Co., Ltd. 60,079,166.70 60,087,083.30
Jidong Cement Fufeng Transportation Co., Ltd. 2,632,000.00 –
Zehnder (China) Indoor Climate Co., Ltd. 9,500.00 9,500.00
Changchun Light Rail Jidong Concrete Co., Ltd. – 199,296.93
Xianyang Jidong High-New Concrete Co., Ltd. – 8,454,767.42
Beijing XinYuan Concrete Co., Ltd. – 100,073,596.04
Tangshan Fengrun First Transportation Company – 1,000,000.00
Fuxin Jidong Xianghe Concrete Co., Ltd. – 84,136,725.56
458,890,894.26 665,329,562.63
Due from joint ventures
STAR-USG Building Materials Co., Ltd. 82,291,395.91 104,280,703.00
Jidong Heidelberg (Shaanxi) Logistic Co., Ltd. 4,090,000.00 –
Jidong Heidelberg (Fufeng) Cement Co., Ltd. 82,288.83 82,288.83
86,463,684.74 104,362,991.83
Due from other related parties
Beijing Dacheng Real Estate Development Co., Ltd. 155,450.41 –
BBMG Jianmao Property Management Center 62,936.72 –
Handan Hanni Building Materials Co., Ltd. 22,464.01 –
240,851.14 –
593,803,820.79 800,812,918.48
Interest receivable
Due from joint ventures
STAR-USG Building Materials Co., Ltd. 4,854,302.26 1,284,128.69

317BBMG CORPORATION
INTERIM REPORT 2018
Notes to Unaudited Interim Financial StatementsFor the six months ended 30 June 2018
RMB
X. RELATED PARTY RELATIONSHIPS AND TRANSACTIONS (continued)
6. Balances of receivables from related parties (continued)
30 June 2018 31 December 2017
Dividends receivable
Due from associates
Changchun Light Rail Jidong Concrete Co., Ltd. 7,000,236.52 7,000,236.52
Beijing Gaoqiang Concrete Co., Ltd. 3,071,700.00 3,071,700.00
Tianjin Xingye longxiang Construction Engineering Co., Ltd. 1,000,000.00 –
11,071,936.52 10,071,936.52
Long-term receivables
Due from joint ventures
Cross Point Trading 274 (Pty) Ltd (RF) 269,222,956.50 256,353,726.80
7. Balances of payables to related parties
30 June 2018 31 December 2017
Bills payable and accounts payable
Due to associates
Baogang Jidong Cement Co., Ltd. 5,012,777.92 3,082,949.15
Zehnder (China) Indoor Climate Co., Ltd. 2,979,582.97 96,207.23
Beijing Sinobaide Technology Co., Ltd. 432,067.88 –
Hebei Ruisuo Solid Waste Engineering Technology Research
Institute Co., Ltd. 417,462.00 1,159,486.68
Jidong Cement Fufeng Transportation Co., Ltd. 137,567.48 40,908.16
OCV Reinforcements (Beijing) Co., Ltd. 3,800.00 –
8,983,258.25 4,379,551.22

318
Notes to Unaudited Interim Financial StatementsFor the six months ended 30 June 2018
RMB
30 June 2018 31 December 2017
Bills payable and accounts payable (continued)
Due to joint ventures
Jidong Heidelberg (Fufeng) Cement Co., Ltd. 7,357,940.80 –
Jidong Pacific (Beijing) Environmental Protection Engineering
Technology Co., Ltd. 3,263,300.00 4,110,467.79
Tangshan Caofeidian Dunshi New Building Materials Co., Ltd. 1,320,747.63 –
Anshan Jidong Cement Co., Ltd. – 1,000,000.00
Jidong Heidelberg (Jingyang) Cement Co., Ltd. 772,470.40 709,781.15
Jidong Heidelberg (Shaanxi) Logistic Co., Ltd 855,050.73 –
STAR-USG Building Materials Co., Ltd. 748,656.41 748,656.41
14,318,165.97 6,568,905.35
Due to other related parties
Beijing Dacheng Real Estate Development Co., Ltd. 276,291.00 60,000.00
Beijing Jinyu Scien-tech School – 18,200.00
Party School of the Communist Party of China Beijing Building
Materials Group Corporation Committee – 12,500.00
276,291.00 90,700.00
23,577,715.22 11,039,156.57
Receipts in advance
Advances from other related parties
Beijing Longfengshan Sands and Stone Factory – 149,098.29
Advances from associates
Beijing Gaoqiang Concrete Co., Ltd. 8,112,934.71 –
Beijing Gaoqiang Concrete Co., Ltd. – 4,710.00
OCV Reinforcements (Beijing) Co., Ltd. 2,520.00 2,520.00
8,115,454.71 7,230.00
X. RELATED PARTY RELATIONSHIPS AND TRANSACTIONS (continued)
7. Balances of payables to related parties (continued)

319BBMG CORPORATION
INTERIM REPORT 2018
Notes to Unaudited Interim Financial StatementsFor the six months ended 30 June 2018
RMB
30 June 2018 31 December 2017
Receipts in advance (continued)
Advances from joint ventures
Tangshan Caofeidian Dunshi New Building Materials Co., Ltd. 465,552.50 88,500.00
Anshan Jidong Cement Co., Ltd. 147,750.40 30,000.00
Jidong Heidelberg (Fufeng) Cement Co., Ltd. 471,000.00 –
Jidong Heidelberg (Jingyang) Cement Co., Ltd. – 112,972.26
Jidong Heidelberg (Shaanxi) Logistic Co., Ltd. 9,551.18 –
1,093,854.08 231,472.26
9,209,308.79 387,800.55
Other payables
BBMG Assets Company 219,343.40 –
Due to associates
Baogang Jidong Cement Co., Ltd. 630,000.00 630,000.00
OCV Reinforcements (Beijing) Co., Ltd. 159,200.00 159,200.00
Beijing Sinobaide Technology Co., Ltd. 12,738.42 –
Tanshan Conch Profiles Co., Ltd. 2,682.00 4,704.76
Zhongfang Huarui (Tangshan) Real Estate Co., Ltd. – 527,000.00
Beijing XinYuan Concrete Co., Ltd. – 2,200.25
Xianyang Jidong High-New Concrete Co., Ltd. – 282.12
804,620.42 1,323,387.13
Due to joint ventures
STAR-USG Building Materials Co., Ltd. 19,436.46 19,436.46
Jidong Heidelberg (Jingyang) Cement Co., Ltd. 209,685.64 37,890.47
Anshan Jidong Cement Co., Ltd. – 39.00
229,122.10 57,365.93
X. RELATED PARTY RELATIONSHIPS AND TRANSACTIONS (continued)
7. Balances of payables to related parties (continued)

320
Notes to Unaudited Interim Financial StatementsFor the six months ended 30 June 2018
RMB
30 June 2018 31 December 2017
Due to other related parties
Beijing Xisha Assets Management Co., Ltd. 2,162,248.00 –
Beijing Jinyu Scien-tech School 6,510.00 –
3,421,843.92 1,380,753.06
Short-term borrowing
BBMG Assets Company 131,000,000.00 131,000,000.00
BSCOMC 80,550,000.00 80,550,000.00
211,550,000.00 211,550,000.00
Except for the short-term loans and the balances due from STAR-USG Building Materials Co., Ltd. in
other receivables and due from Cross Point Trading 274 (Pty) Ltd (RF) in long-term receivables, other
amounts due from and due to related parties are interest-free, unsecured and have no fixed terms of
repayment.
X. RELATED PARTY RELATIONSHIPS AND TRANSACTIONS (continued)
7. Balances of payables to related parties (continued)

321BBMG CORPORATION
INTERIM REPORT 2018
Notes to Unaudited Interim Financial StatementsFor the six months ended 30 June 2018
RMB
XI. CONTINGENCIES
Note 30 June 2018 31 December 2017
Provision of guarantee on housing
mortgage to third parties Note 1 11,703,068,498.38 12,052,621,076.05
Provision of guarantee on loans and
others to third parties Note 2 3,053,500,000.00 4,824,000,000.00
14,756,568,498.38 16,876,621,076.05
Note 1: Certain customers of the Group have purchased the commodity housing developed by the Group by way of bank mortgage (secured loans). According to the bank requirement in respect of the secured loans of the individual purchase of housing, the Group has provided guarantees to secure the periodical and joint obligation of such secured loans granted by banks for home buyers. These guarantees will be released upon obtaining building ownership certificates and completion of formalities of housing mortgage by the home buyers. The management is of the opinion that in the event of default in payments, the net realizable value of the relevant properties is still sufficient to cover the outstanding mortgage principals together with the accrued interests and penalties, and therefore no provision for the guarantees has been made in the financial statements.
Note 2: As at 30 June 2018, Jidong Development Group Co., Ltd., a subsidiary of the Group, provided guarantee on the borrowings of RMB1,040,000,000.00 for Tangshan Nanhu Eco-City Development and Construction Investment Co., Ltd. (唐山市南湖生態城開發建設投資有限責任公司). The guarantee will expire on 21 May 2029. Tianjin Building Materials (Holding) Co., Ltd. (天津市建築材料集團(控股)有限公司), a subsidiary of the Group, provided guarantees on the borrowings of RMB50,000,000.00 for Tianjin Longhong Composite Materials Co., Ltd. (天津市龍泓複合材料有限公司), the borrowings of RMB515,000,000.00 for Tianjin Yishang Group Co., Ltd. (天津一商集團有限公司) and the borrowings of RMB1,426,500,000.00 for Datong Coal Mine Group Co., Ltd. (大同煤礦集團有限責任公司). These guarantees will expire on 24 September 2018, 4 March 2019 and 13 December 2019, respectively. In addition, Tianjin Xinfengtai Construction Materials Trading Co., Ltd. (天津市鑫豐泰建材貿易有限公司), a subsidiary of the Group, provided guarantee on the borrowings of RMB22,000,000.00 for North Advanced Science and Technology (Tianjin) Industrial Co., Ltd. (北方高科(天津)實業有限公司). The guarantee expired on 16 January 2018.
Please refer to Note X. 5 for details of the guarantees provided to related parties by the Group.
XII. COMMITMENTS
30 June 2018 31 December 2017
Contracted but not provided for
Capital commitments 141,899,499.23 240,456,042.76
Property development contracts 9,498,338,882.80 6,402,057,932.69
9,640,238,382.03 6,642,513,975.45
XIII. EVENTS AFTER BALANCE SHEET DATE
As at the date of approval of the financial statements, the Group did not have events after the balance sheet
date required to be disclosed.

322
Notes to Unaudited Interim Financial StatementsFor the six months ended 30 June 2018
RMB
XIV. OTHER SIGNIFICANT MATTERS
1. Lease
As lessor
Significant operating leases: according to the lease contracts entered into with lessees, the minimum
lease receipts under non-cancellable leases are as follows:
30 June 2018 31 December 2017
Within 1 year (inclusive of 1 year) 1,030,200,370.09 918,809,697.80
1 to 2 years (inclusive of 2 years) 714,747,157.93 592,538,424.84
2 to 3 years (inclusive of 3 years) 386,803,630.08 338,785,501.91
Over 3 years 421,088,808.86 349,308,798.60
2,552,839,966.96 2,199,442,423.15
Please refer to Note V. 16 and 17 for details of investment properties and fixed assets leased under
operating leases.
As lessee
Significant operating leases: according to the lease contracts entered into with lessors, the minimum
lease payments under non-cancellable leases are as follows:
30 June 2018 31 December 2017
Within 1 year (inclusive of 1 year) 101,646,183.89 88,068,180.04
1 to 2 years (inclusive of 2 years) 156,023,682.81 57,032,898.02
2 to 3 years (inclusive of 3 years) 152,987,158.37 52,859,340.92
Over 3 years 783,150,326.98 320,933,092.44
1,193,807,352.05 518,893,511.42

323BBMG CORPORATION
INTERIM REPORT 2018
Notes to Unaudited Interim Financial StatementsFor the six months ended 30 June 2018
RMB
XIV. OTHER SIGNIFICANT MATTERS (continued)
2. Segment reporting
Operating segments
For management purposes, the Group is organised into business units based on their products and
services and has four reportable segments as follows:
(1) the cement segment engages in the manufacture and sale of cement and concrete;
(2) the building materials and commerce and logistics segment engages in the manufacture and
sale of building materials and furniture and commerce and logistics;
(3) the property development segment engages in the development and sale of real estate;
(4) the property investment and management segment invests in properties for their rental income
potential and/or for capital appreciation, and provides management and security services to
residential and commercial properties.
The management monitors the operating results of its business units separately for the purpose of
making decisions about resource allocation and performance assessment. Segment results are evaluated
based on the segment profits reported. It represents the indicator after adjustments have been made to
total profit, and other than the exclusion of overheads attributable to the headquarters, the indicator
is consistent with the Group’s total profit.
Segment assets and segment liabilities exclude unallocated assets and liabilities of the headquarters as
these assets and liabilities are under the unified management of the Group.
Pricing for transfer between operating segments is agreed upon by both parties of transactions with
reference to the fair price quoted from transactions with third parties.

324
Notes to Unaudited Interim Financial StatementsFor the six months ended 30 June 2018
RMB
XIV. OTHER SIGNIFICANT MATTERS (continued)
2. Segment reporting (continued)
For the six months ended 30 June 2018
Cement
Segment
Building Materials
and Commerce
and Logistics
Segment
Property
Segment
Property
Investment and
Management
Segment
Unallocated
Assets/Liabilities/
Expenses of the
Headquarters
Elimination on
Consolidation Total
Revenue from external transactions 14,578,159,711.49 8,896,428,439.01 9,974,060,860.17 1,916,744,245.31 – – 35,365,393,255.98
Revenue from inter-segment
transactions 1,300,566,673.17 185,810,428.94 3,402,021.89 132,703,635.32 – (1,622,482,759.32) –
15,878,726,384.66 9,082,238,867.95 9,977,462,882.06 2,049,447,880.63 – (1,622,482,759.32) 35,365,393,255.98
Gains/(losses) on investment in
joint ventures and associates 121,078,335.58 19,534,118.87 1,292.10 (1,605,609.81) – – 139,008,136.74
Losses from impairment of assets (55,219,996.86) (5,801,610.83) 864,114.05 (24,465,204.92) – 98,756,281.77 14,133,583.21
Credit impairment losses 48,160,858.31 12,756,662.75 5,018,016.80 (10,655,671.94) – (98,756,281.77) (43,476,415.85)
Depreciation expenses and
amortization expenses 1,853,886,670.19 99,403,303.76 15,195,701.13 118,228,511.12 13,119,734.00 – 2,099,833,920.20
Total profits/(losses) 1,446,778,327.58 35,105,458.82 1,981,748,903.27 104,632,014.61 (483,694,863.83) 838,830,177.92 3,923,400,018.37
Income tax expense 369,278,953.02 21,326,812.91 469,668,241.66 46,598,951.65 (120,923,715.96) 209,707,544.48 995,656,787.76
Total assets 85,333,130,737.39 16,545,709,517.00 120,110,967,639.35 75,706,215,046.93 2,395,295,478.55 (45,937,454,975.72) 254,153,863,443.50
Total liabilities 54,749,841,576.78 13,363,415,017.28 104,233,790,491.75 30,697,322,327.93 24,595,681,181.26 (49,825,560,025.28) 177,814,490,569.72
Other disclosure
Long-term equity investment in joint
ventures and associates 1,694,376,222.13 415,900,952.58 4,992,899.49 386,511,858.68 – – 2,501,781,932.88
Increase in other non-current
assets (excluding long-term
equity investments) 2,596,158,690.12 987,733,794.73 30,192,519.62 6,108,918,157.65 – – 9,723,003,162.12

325BBMG CORPORATION
INTERIM REPORT 2018
Notes to Unaudited Interim Financial StatementsFor the six months ended 30 June 2018
RMB
XIV. OTHER SIGNIFICANT MATTERS (continued)
2. Segment reporting (continued)
For the six months ended 30 June 2017
Cement
Segment
Building Materials
and Commerce
and Logistics
Segment
Property
Segment
Property Investment
and Management
Segment
Unallocated Assets/
Liabilities/ Expenses
of the Headquarters
Elimination on
Consolidation Total
Revenue from external transactions 13,285,651,855.35 6,975,794,012.28 7,334,205,335.26 1,870,195,079.96 – – 29,465,846,282.85
Revenue from inter-segment
transactions 849,224,989.22 134,587,915.09 – 244,187,534.18 – (1,228,000,438.49) –
14,134,876,844.57 7,110,381,927.37 7,334,205,335.26 2,114,382,614.14 – (1,228,000,438.49) 29,465,846,282.85
Gains/(losses) on investment in joint
ventures and associates 69,549,449.99 (15,144,905.75) 1,652.47 (1,595,922.69) – – 52,810,274.02
Losses from impairment of assets 178,674,698.23 (686,436.20) (38,635,237.49) 7,588,194.15 – – 146,941,218.69
Depreciation expenses and
amortization expenses 1,817,917,633.25 68,164,523.30 57,991,306.48 146,959,302.87 10,249,414.70 – 2,101,282,180.60
Total profits/(losses) 244,840,747.37 31,871,416.97 1,419,920,497.17 1,176,589,113.71 (532,788,631.55) 87,252,499.26 2,427,685,642.93
Income tax expense 162,230,716.82 16,788,250.43 337,564,064.69 240,463,576.01 (133,197,157.89) 21,813,124.81 645,662,574.87
Total assets 82,636,431,050.73 10,888,804,447.07 102,329,517,211.59 47,226,735,731.36 2,431,402,819.14 (21,542,009,981.81) 223,970,881,278.08
Total liabilities 53,934,668,373.08 6,634,231,556.96 88,097,959,009.34 19,760,943,308.29 17,517,777,278.99 (25,984,706,429.91) 159,960,873,096.75
Other disclosure
Long-term equity investment in joint
ventures and associates 1,629,316,560.67 194,694,554.58 4,991,625.54 219,690,903.02 – – 2,048,693,643.81
Increase in other non-current
assets (excluding long-term
equity investments) 1,228,121,783.38 207,158,684.99 120,806,983.81 405,494,917.59 – – 1,961,582,369.77

326
Notes to Unaudited Interim Financial StatementsFor the six months ended 30 June 2018
RMB
XIV. OTHER SIGNIFICANT MATTERS (continued)
2. Segment reporting (continued)
Other information
Information on products and labour services
Operating revenue by product/service is set out in Note V. 48.
Geographic information
Operating revenue
For the six
months ended
30 June 2018
For the six
months ended
30 June 2017
PRC 34,808,047,239.08 28,440,547,737.24
Singapore 311,073,668.58 74,751,041.07
South Africa 24,342,180.85 17,655,810.39
Japan 62,339.72 121,524,543.94
Other countries or regions 221,867,827.75 811,367,150.21
35,365,393,255.98 29,465,846,282.85
Revenues from external transactions are attributable to the geographic locations where the customers
are located.
Major non-current assets of the Group are located in the PRC.
Information about major customers
In 2017 and for the six months ended 30 June 2018, none of the sales income arising from any single
customer of the Group exceeds 10% of the Group’s revenues.

327BBMG CORPORATION
INTERIM REPORT 2018
Notes to Unaudited Interim Financial StatementsFor the six months ended 30 June 2018
RMB
XIV. OTHER SIGNIFICANT MATTERS (continued)
3. Supplemental information to the balance sheet
30 June 2018 31 December 2017
Consolidated
Net current assets
Current assets 153,871,113,874.16 143,589,262,404.01
Less: current liabilities 114,785,794,196.79 110,434,361,271.08
Net current assets 39,085,319,677.37 33,154,901,132.93
Total assets less current liabilities
Total assets 254,153,863,443.50 232,207,482,091.70
Less: current liabilities 114,785,794,196.79 110,434,361,271.08
Total assets less current liabilities 139,368,069,246.71 121,773,120,820.62
Company
Net current assets
Current assets 68,985,292,027.98 62,692,084,532.23
Less: current liabilities 42,306,221,806.27 36,181,900,544.21
Net current assets 26,679,070,221.71 26,510,183,988.02
Total assets less current liabilities
Total assets 123,048,587,143.09 109,392,097,314.28
Less: current liabilities 42,306,221,806.27 36,181,900,544.21
Total assets less current liabilities 80,742,365,336.82 73,210,196,770.07

328
Notes to Unaudited Interim Financial StatementsFor the six months ended 30 June 2018
RMB
XV. NOTES TO KEY ITEMS OF THE COMPANY’S FINANCIAL STATEMENTS
1. Other receivables
An aging analysis of other receivables is as follows:
30 June 2018 31 December 2017
Interests receivable 1,858,605,431.95 1,106,889,669.23
Dividends receivable 2,905,198,217.16 1,582,172,059.85
Amounts due from subsidiaries 60,140,648,569.64 52,753,176,863.68
Due from a joint venture-STAR-USG 104,188,940.00 104,188,940.00
Other current account 70,944,476.74 896,484,917.85
65,079,585,635.49 56,442,912,450.61
Less: Provision for bad debts of other receivables 21,109,616.08 18,111,381.45
65,058,476,019.41 56,424,801,069.16
An aging analysis of other receivables is as follows:
30 June 2018 31 December 2017
Within 1 year (inclusive of 1 year) 61,512,969,150.46 54,209,810,528.70
1 to 2 years (inclusive of 2 years) 3,439,652,311.99 2,117,484,024.49
2 to 3 years (inclusive of 3 years) 11,676,295.36 50,998,001.96
3 to 4 years (inclusive of 4 years) 50,998,001.96 256,734.52
4 to 5 years (inclusive of 5 years) 256,734.52 26,945,892.47
Over 5 years 64,033,141.20 37,417,268.47
65,079,585,635.49 56,442,912,450.61
Less: Provision for bad debts of other receivables 21,109,616.08 18,111,381.45
65,058,476,019.41 56,424,801,069.16

329BBMG CORPORATION
INTERIM REPORT 2018
Notes to Unaudited Interim Financial StatementsFor the six months ended 30 June 2018
RMB
XV. NOTES TO KEY ITEMS OF THE COMPANY’S FINANCIAL STATEMENTS (continued)
1. Other receivables (continued)
The movements in provision for bad debts of other receivables based on lifetime expected credit losses
are as follows:
30 June 2018
Closing balance for the prior year 18,111,381.45
Change in accounting policy 8,733,796.64
Opening balance 26,845,178.09
Reversal for the period/year (5,735,562.01)
Closing balance 21,109,616.08
30 June 2018
Gross carrying amount Provision for bad debts
Amount Proportion
(%)
Amount
Percentage of
provision
(%)
Individual assessment of
expected credit losses and
provision for bad debts 65,079,085,635.49 100.00 21,104,616.08 0.03
Assessment of expected credit
losses and provision for
bad dets by credit risk
characteristics group 500,000.00 – 5,000.00 1.00
65,079,585,635.49 100.00 21,109,616.08

330
Notes to Unaudited Interim Financial StatementsFor the six months ended 30 June 2018
RMB
XV. NOTES TO KEY ITEMS OF THE COMPANY’S FINANCIAL STATEMENTS (continued)
1. Other receivables (continued)
31 December 2017
Gross carrying amount Provision for bad debts
Amount Proportion(%)
AmountPercentage of
provision(%)
Individually significant and subject to separate provision for bad debts 30,379,950.00 0.05 9,113,985.00 30.00
Provision for bad debts by credit risk characteristics group
Within 1 year (inclusive of 1 year) 873,379,665.07 1.55 – –
Provision for bad debts by special credit characteristics group 52,838,155,475.40 93.61 – –
Individually not significant but subject to separate provision for bad debts 2,700,997,360.14 4.79 8,997,396.45 0.33
56,442,912,450.61 100.00 18,111,381.45
As at 31 December 2017, other receivables which were individually significant and subject to separate provision for bad debts were as follows:
Gross carrying Provision for Percentage ofReasonamount bad debts provision
(%)
Unit A 30,379,950.00 9,113,985.00 30.00 Partly uncollectible
Other receivables which were subject to provision for bad debts by the Group based on aging analysis were as follows:
30 June 2018
Gross carrying amount estimated
to incur defaultExpected credit
loss rateLifetime expected
credit losses
Within 1 year (inclusive of 1 year) 500,000.00 1% 5,000.00

331BBMG CORPORATION
INTERIM REPORT 2018
Notes to Unaudited Interim Financial StatementsFor the six months ended 30 June 2018
RMB
XV
. N
OTE
S TO
KEY
ITE
MS
OF
THE
CO
MPA
NY
’S F
INA
NC
IAL
STA
TEM
ENTS
(con
tinu
ed)
2.
Lon
g-t
erm
eq
uit
y in
vest
men
ts
For
the
six
mo
nth
s en
ded
30
Jun
e 20
18
Inve
stm
ent c
ost
Open
ing
bala
nce
Incr
ease
/
decr
ease
for t
he p
erio
dCl
osin
g ba
lanc
e
Perc
enta
ge
of sh
are-
hold
ing
Perc
enta
ge
of v
otin
g
right
Cash
div
iden
ds
for t
he p
erio
d
(%)
(%)
Cost
met
hod:
Beijin
g Liu
shui
Envir
onm
enta
l Pro
tecti
on T
echn
ology
Co.
, Ltd
.69
0,00
5,05
2.96
690,
005,
052.
96–
690,
005,
052.
9610
0.00
100.
0090
,725
,062
.35
Beijin
g BB
MG
Conc
rete
Co.
, Ltd
.50
9,23
5,91
0.27
509,
235,
910.
27–
509,
235,
910.
2710
0.00
100.
00–
Beijin
g BB
MG
Man
grov
e En
viron
men
tal P
rote
ction
Tech
nolog
y Co.
, Ltd
.1,
093,
444,
400.
001,
093,
444,
400.
001,
753,
806,
765.
402,
847,
251,
165.
4010
0.00
100.
00–
Hebe
i BBM
G Di
ngxin
Cem
ent C
o., L
td.
1,47
1,40
0,00
0.00
1,47
1,40
0,00
0.00
–1,
471,
400,
000.
0010
0.00
100.
00–
Hebe
i Taih
ang
Huax
in Bu
ilding
Mat
erial
s Co.
, Ltd
.19
1,95
2,08
8.44
191,
952,
088.
44–
191,
952,
088.
4410
0.00
100.
00–
Beijin
g BB
MG
Qian
jing
Envir
onm
enta
l Pro
tecti
on
Tech
nolog
y Co.
, Ltd
.67
,600
,000
.00
67,6
00,0
00.0
0–
67,6
00,0
00.0
067
.00
67.0
0–
Baod
ing T
aihan
g He
yi Ce
men
t Co.
, Ltd
.12
0,00
0,00
0.00
120,
000,
000.
00–
120,
000,
000.
0075
.00
75.0
0–
Hand
an B
BMG
Taiha
ng C
emen
t Co.
, Ltd
.71
9,98
6,62
6.30
719,
986,
626.
30–
719,
986,
626.
3094
.00
94.0
0–
Zanh
uang
BBM
G Ce
men
t Co.
, Ltd
.70
0,00
0,00
0.00
700,
000,
000.
00–
700,
000,
000.
0010
0.00
100.
0014
6,35
3,63
2.45
Beijin
g BB
MG
Cem
ent T
radin
g Co
., Ltd
.50
0,00
0,00
0.00
500,
000,
000.
00–
500,
000,
000.
0010
0.00
100.
00–
Beijin
g BB
MG
Cem
ent E
nerg
y Sav
ing T
echn
ology
Co.
, Ltd
.35
,000
,000
.00
35,0
00,0
00.0
0–
35,0
00,0
00.0
010
0.00
100.
00–
Zhan
gjiak
ou Ji
nyu
Cem
ent C
o., L
td.
391,
071,
805.
8139
1,07
1,80
5.81
–39
1,07
1,80
5.81
100.
0010
0.00
12,7
70,5
41.9
6
Tianji
n Zh
enxin
g Ce
men
t Co.
, Ltd
.42
2,95
0,23
6.38
422,
950,
236.
38–
422,
950,
236.
3862
.00
62.0
0–
Quya
ng Ji
nyu
Cem
ent C
o., L
td.
245,
747,
261.
6524
5,74
7,26
1.65
–24
5,74
7,26
1.65
90.0
090
.00
–
Tianji
n BB
MG
Conc
rete
Co.
, Ltd
.44
7,45
4,70
7.80
447,
454,
707.
80–
447,
454,
707.
8091
.00
100.
00–
Siping
BBM
G Ce
men
t Co.
, Ltd
.15
6,00
0,00
0.00
156,
000,
000.
00–
156,
000,
000.
0052
.00
52.0
0–
Shijia
zhua
ng B
BMG
Xuch
eng
Conc
rete
Co.
, Ltd
.20
2,04
7,00
0.00
202,
047,
000.
00–
202,
047,
000.
0097
.00
97.0
0–
Lanx
ian B
BMG
Cem
ent C
o., L
td.
160,
240,
000.
0016
0,24
0,00
0.00
–16
0,24
0,00
0.00
80.0
080
.00
–
Qiny
ang
BBM
G Ce
men
t Co.
, Ltd
.14
4,14
5,10
0.00
144,
145,
100.
00–
144,
145,
100.
0086
.00
86.0
0–
Zhuo
lu Jin
yu C
emen
t Co.
, Ltd
.36
6,67
7,49
8.05
366,
677,
498.
05–
366,
677,
498.
0510
0.00
100.
0010
4,49
2,79
9.40
Hand
an S
hexia
n BB
MG
Cem
ent C
o., L
td.
181,
678,
700.
0018
1,67
8,70
0.00
–18
1,67
8,70
0.00
91.0
091
.00
–
Beijin
g BB
MG
Mini
ng C
o., L
td.
5,00
0,00
0.00
5,00
0,00
0.00
–5,
000,
000.
0010
0.00
100.
00–

332
Notes to Unaudited Interim Financial StatementsFor the six months ended 30 June 2018
RMB
Inve
stm
ent c
ost
Open
ing
bala
nce
Incr
ease
/
decr
ease
for t
he p
erio
dCl
osin
g ba
lanc
e
Perc
enta
ge
of sh
are-
hold
ing
Perc
enta
ge
of v
otin
g
right
Cash
div
iden
ds
for t
he p
erio
d
(%)
(%)
Cost
met
hod:
(con
tinue
d)
Lingc
huan
BBM
G Ce
men
t Co.
, Ltd
.35
0,00
0,00
0.00
350,
000,
000.
00–
350,
000,
000.
0010
0.00
100.
00–
Beijin
g Jin
yu P
inggu
Cem
ent C
o., L
td.
150,
000,
000.
0015
0,00
0,00
0.00
–15
0,00
0,00
0.00
100.
0010
0.00
–
Beijin
g Ch
inefa
rge
Cem
ent C
o., L
td.
464,
740,
918.
2946
4,74
0,91
8.29
–46
4,74
0,91
8.29
95.0
095
.00
–
BBM
G Sh
unfa
Lafa
rge
Cem
ent C
o., L
td.
110,
681,
119.
4211
0,68
1,11
9.42
–11
0,68
1,11
9.42
70.0
070
.00
–
Zuoq
uan
BBM
G Ce
men
t Co.
, Ltd
.53
0,00
0,00
0.00
530,
000,
000.
00–
530,
000,
000.
0010
0.00
100.
00–
Xuan
hua
BBM
G Ce
men
t Co.
, Ltd
.3,
250,
000.
003,
250,
000.
00–
3,25
0,00
0.00
65.0
065
.00
–
Chen
gde
BBM
G Ce
men
t Co.
, Ltd
.34
0,00
0,00
0.00
340,
000,
000.
00–
340,
000,
000.
0085
.00
85.0
0–
Bo’ai
BBM
G Ce
men
t Co.
, Ltd
.28
5,00
0,00
0.00
285,
000,
000.
00–
285,
000,
000.
0095
.00
95.0
0–
BBM
G M
orta
r Co.
, Ltd
.95
,000
,000
.00
95,0
00,0
00.0
0–
95,0
00,0
00.0
010
0.00
100.
007,
494,
726.
53
Guan
gling
Jiny
u Ce
men
t Co.
, Ltd
.31
7,00
0,00
0.00
317,
000,
000.
00–
317,
000,
000.
0010
0.00
100.
00–
Hand
an Fe
ngfe
ng B
BMG
Conc
rete
Co.
, Ltd
.66
,000
,000
.00
66,0
00,0
00.0
0–
66,0
00,0
00.0
010
0.00
100.
00–
Hand
an H
ansh
an B
BMG
Conc
rete
Co.
, Ltd
.27
,600
,000
.00
27,6
00,0
00.0
0–
27,6
00,0
00.0
092
.00
92.0
0–
Hand
an B
BMG
Conc
rete
Co.
, Ltd
.27
,600
,000
.00
27,6
00,0
00.0
0–
27,6
00,0
00.0
092
.00
92.0
0–
Wei
Coun
ty BB
MG
Conc
rete
Co.
, Ltd
.9,
200,
000.
009,
200,
000.
00–
9,20
0,00
0.00
92.0
092
.00
–
tai B
BMG
Yong
ning
Cem
ent C
o., L
td.
245,
668,
600.
0024
5,66
8,60
0.00
–24
5,66
8,60
0.00
60.0
060
.00
–
Beijin
g BB
MG
Tiant
an Fu
rnitu
re C
o., L
td.
649,
305,
960.
3664
9,30
5,96
0.36
–64
9,30
5,96
0.36
97.2
697
.00
1,44
2,73
9.71
Beijin
g W
oodw
orkin
g Fa
ctory
Co.,
Ltd.
54,5
56,2
61.1
654
,556
,261
.16
–54
,556
,261
.16
100.
0010
0.00
–
Tong
da R
efra
ctory
Tech
nolog
y Co.
, Ltd
.49
8,03
0,44
4.48
498,
030,
444.
48–
498,
030,
444.
4892
.00
92.0
0–
Beijin
g Jin
yu E
nerg
y-Sav
ing T
echn
ology
Co.
, Ltd
.40
2,45
0,57
6.31
402,
450,
576.
31–
402,
450,
576.
3110
0.00
100.
0011
,781
,044
.27
Beijin
g Ae
rate
d Co
ncre
te C
o., L
td.
166,
166,
021.
3816
6,16
6,02
1.38
–16
6,16
6,02
1.38
56.0
010
0.00
23,7
94,9
38.2
1
Beijin
g Jin
yu A
erat
ed C
oncre
te C
o., L
td.
107,
946,
419.
6810
7,94
6,41
9.68
–10
7,94
6,41
9.68
100.
0010
0.00
–
Beijin
g BB
MG
Coat
ing C
o., L
td.
95,4
21,2
00.6
195
,421
,200
.61
–95
,421
,200
.61
100.
0010
0.00
3,92
2,38
8.08
Beijin
g Bu
ilding
Mat
erial
s Aca
dem
y Co.
, Ltd
.19
4,16
7,78
4.68
194,
167,
784.
68–
194,
167,
784.
6810
0.00
100.
0065
6,35
1.64
Beijin
g Ke
shi H
ardw
are
Co.,
Ltd.
64,0
98,8
26.5
564
,098
,826
.55
–64
,098
,826
.55
100.
0010
0.00
2,06
2,05
5.66
Beijin
g Jia
ndu
Desig
n an
d Re
sear
ch In
stitu
te C
o., L
td.
59,8
64,0
57.8
959
,864
,057
.89
–59
,864
,057
.89
100.
0010
0.00
3,02
6,62
9.01
BBM
G (D
acha
ng) M
oder
n Ind
ustri
al Pa
rk M
anag
emen
t Co.
, Ltd
.50
0,00
0,00
0.00
500,
000,
000.
00–
500,
000,
000.
0010
0.00
100.
00–
XV
. N
OTE
S TO
KEY
ITE
MS
OF
THE
CO
MPA
NY
’S F
INA
NC
IAL
STA
TEM
ENTS
(con
tinu
ed)
2.
Lon
g-t
erm
eq
uit
y in
vest
men
ts (c
onti
nued
)
For
the
six
mo
nth
s en
ded
30
Jun
e 20
18 (c
onti
nued
)

333BBMG CORPORATION
INTERIM REPORT 2018
Notes to Unaudited Interim Financial StatementsFor the six months ended 30 June 2018
RMB
Inve
stm
ent c
ost
Open
ing
bala
nce
Incr
ease
/
decr
ease
for t
he p
erio
dCl
osin
g ba
lanc
e
Perc
enta
ge
of sh
are-
hold
ing
Perc
enta
ge
of v
otin
g
right
Cash
div
iden
ds
for t
he p
erio
d
(%)
(%)
Cost
met
hod:
(con
tinue
d)Be
ijing
BBM
G Bu
sines
s and
Tra
ding
Co.,
Ltd.
660,
000,
000.
0066
0,00
0,00
0.00
–66
0,00
0,00
0.00
100.
0010
0.00
19,0
57,2
52.5
9BB
MG
Mat
erial
Indu
strial
(Sha
ngha
i) Co
., Ltd
.40
,800
,000
.00
40,8
00,0
00.0
0–
40,8
00,0
00.0
0–
––
Beijin
g Dy
nea
Chem
ical In
dustr
y Co.
, Ltd
.95
,358
,791
.69
95,3
58,7
91.6
9–
95,3
58,7
91.6
910
0.00
100.
0070
3,55
7.14
BBM
G GE
M R
eal E
state
Dev
elopm
ent C
o., L
td.
3,06
5,13
8,41
1.45
3,06
5,13
8,41
1.45
–3,
065,
138,
411.
4510
0.00
100.
00–
Beijin
g Xi
sanq
i High
Tec
h Ne
w Bu
ilding
Mat
erial
City
M
anag
emen
t and
Dev
elopm
ent C
o., L
td.
123,
580,
431.
3512
3,58
0,43
1.35
–12
3,58
0,43
1.35
100.
0010
0.00
–BB
MG
Prop
erty
Man
agem
ent C
o., L
td.
99,2
64,5
30.9
299
,264
,530
.92
–99
,264
,530
.92
100.
0010
0.00
–BB
MG
Feng
shan
Hot
Spr
ing R
esor
t Co.
, Ltd
.37
0,68
0,36
1.57
370,
680,
361.
57–
370,
680,
361.
5710
0.00
100.
00–
Beijin
g Jia
nji A
ssets
Man
agem
ent C
o., L
td.
776,
172,
150.
3077
6,17
2,15
0.30
–77
6,17
2,15
0.30
100.
0010
0.00
461,
965,
427.
50Be
ijing
Jinha
iyan
Asse
ts M
anag
emen
t Co.
, Ltd
.78
,479
,818
.89
78,4
79,8
18.8
9–
78,4
79,8
18.8
910
0.00
100.
00–
Beijin
g Jin
haiya
n Pr
oper
ty M
anag
emen
t Co.
, Ltd
.14
,333
,292
.75
14,3
33,2
92.7
5–
14,3
33,2
92.7
510
0.00
100.
00–
BBM
G Pr
oper
ty Op
erat
ion M
anag
emen
t Co.
, Ltd
.99
,000
,000
.00
99,0
00,0
00.0
0–
99,0
00,0
00.0
010
0.00
100.
009,
862,
396.
16Be
ijing
BBM
G Ch
engy
uan
Prop
erty
Deve
lopm
ent C
o., L
td.
473,
509,
857.
5347
3,50
9,85
7.53
–47
3,50
9,85
7.53
100.
0010
0.00
–Be
ijing
BBM
G Pr
oper
ty De
velop
men
t Gro
up C
o., L
td.
(北京
金隅
地產
開發
集團
有限
公司
)2,
994,
735,
641.
872,
994,
735,
641.
87–
2,99
4,73
5,64
1.87
100.
0010
0.00
7,08
4,04
1.42
Beijin
g Bu
ilding
Dec
orat
ion a
nd D
esign
Eng
ineer
ing C
o., L
td.
82,4
29,8
82.3
482
,429
,882
.34
–82
,429
,882
.34
100.
0010
0.00
5,24
8,54
3.42
Beijin
g BB
MG
Doud
ian T
echn
ology
Cor
pora
te
Man
agem
ent C
o., L
td.
152,
788,
777.
0915
2,78
8,77
7.09
–15
2,78
8,77
7.09
100.
0010
0.00
–Be
ijing
Yans
hui A
sset M
anag
emen
t Co.
, Ltd
.32
,707
,342
.45
32,7
07,3
42.4
5–
32,7
07,3
42.4
510
0.00
100.
0025
,884
,482
.68
BBM
G Da
chen
g Pr
oper
ty M
anag
emen
t Co.
, Ltd
.16
,198
,711
.92
16,1
98,7
11.9
2–
16,1
98,7
11.9
210
0.00
100.
00–
BBM
G Ho
ngye
Eco
logica
l Scie
nce
and
Tech
nolog
y Co.
, Ltd
.81
5,33
1,41
3.51
815,
331,
413.
51–
815,
331,
413.
5110
0.00
100.
0017
0,00
0,00
0.00
BBM
G Ho
ng K
ong
Limite
d28
8,05
7,38
7.91
288,
057,
387.
91–
288,
057,
387.
9110
0.00
100.
004,
229,
078.
47Be
ijing
BBM
G Inn
ovat
ion a
nd T
echn
ology
Incu
bato
r Co.
, Ltd
.51
3,67
6,10
0.00
513,
676,
100.
00–
513,
676,
100.
0010
0.00
100.
00–
BBM
G Fin
ance
Co.
, Ltd
.3,
000,
000,
000.
003,
000,
000,
000.
00–
3,00
0,00
0,00
0.00
100.
0010
0.00
203,
966,
324.
81BB
MG
Finan
ce Le
ase
Co.,
Ltd.
393,
876,
000.
0039
3,87
6,00
0.00
–39
3,87
6,00
0.00
60.0
060
.00
8,12
7,32
3.71
Kron
o (B
eijing
) Woo
ds C
o., L
td.
287,
445,
693.
3428
7,44
5,69
3.34
–28
7,44
5,69
3.34
100.
0010
0.00
–Jid
ong
Deve
lopm
ent G
roup
Co.
, Ltd
.5,
225,
000,
000.
005,
225,
000,
000.
00–
5,22
5,00
0,00
0.00
55.0
055
.00
–Ta
ngsh
an Ji
dong
Cem
ent C
o., L
td.
304,
241,
209.
40–
304,
241,
209.
4030
4,24
1,20
9.40
32.0
032
.00
–Tia
njin
Build
ing M
ater
ials (
Holdi
ng) C
o., L
td.
(天津
市建
築材
料集
團(控
股)有
限公
司)
5,11
8,17
6,37
1.21
–5,
118,
176,
371.
215,
118,
176,
371.
2155
.00
55.0
0–
Tota
l und
er co
st m
etho
d39
,756
,366
,755
.96
34,3
33,9
49,1
75.3
57,
176,
224,
346.
0141
,510
,173
,521
.36
1,32
4,65
1,33
7.17
XV
. N
OTE
S TO
KEY
ITE
MS
OF
THE
CO
MPA
NY
’S F
INA
NC
IAL
STA
TEM
ENTS
(con
tinu
ed)
2.
Lon
g-t
erm
eq
uit
y in
vest
men
ts (c
onti
nued
)
For
the
six
mo
nth
s en
ded
30
Jun
e 20
18 (c
onti
nued
)

334
Notes to Unaudited Interim Financial StatementsFor the six months ended 30 June 2018
RMB
XV. NOTES TO KEY ITEMS OF THE COMPANY’S FINANCIAL STATEMENTS (continued)
2. Long-term equity investments (continued)
For the six months ended 30 June 2018 (continued)
Equity method:
Change for the period
Opening balance
Increase in
Investment
Investment
income or loss
under equity
method
Other changes
in equity
Cash dividend
declared
Provisions for
impairment
Carrying
amount at the
end of period
Provision for
impairment at
the end of period
Joint ventures
STAR–USG Building
Materials Co., Ltd. 15,938,256.81 – 10,364,392.36 – – – 26,302,649.17 –
Associates
Zehnder (China) Indoor Climate
Co., Ltd. 95,352,921.83 – 5,003,425.64 – – – 100,356,347.47 –
OCV Reinforcements (Beijing) Co., Ltd. 59,574,366.74 – 2,495,567.35 – – – 62,069,934.09 –
Beijing Gaoqiang Concrete Co., Ltd. 23,774,703.48 – 6,101,630.14 – – – 29,876,333.62 –
Tanshan Conch Profiles Co., Ltd. 192,228,874.07 – 159,507.28 – – – 192,388,381.35 –
Subtotal for associates 370,930,866.12 – 13,760,130.41 – – – 384,690,996.53 –
Total under equity method 386,869,122.93 – 24,124,522.77 – – – 410,993,645.70 –

335BBMG CORPORATION
INTERIM REPORT 2018
Notes to Unaudited Interim Financial StatementsFor the six months ended 30 June 2018
RMB
XV. NOTES TO KEY ITEMS OF THE COMPANY’S FINANCIAL STATEMENTS (continued)
3. Investment property
Measured subsequently through fair value model:
For the six months ended 30 June 2018
Buildings
Opening balance 10,164,795,183.02
Changes in fair value 184,600,983.44
Closing balance 10,349,396,166.46
2017
Buildings
Opening balance 9,895,924,295.76
Changes in fair value 268,870,887.26
Closing balance 10,164,795,183.02
All the above investment properties are located in the PRC, leased out in form of operating leases and
held under mid-term leases.
As at 30 June 2018, there was no investment property for which the procedures for obtaining title
certificates were incomplete.

336
Notes to Unaudited Interim Financial StatementsFor the six months ended 30 June 2018
RMB
XV. NOTES TO KEY ITEMS OF THE COMPANY’S FINANCIAL STATEMENTS (continued)
4. Operating revenue and costs
Operating revenue is as follows:
For the
six months ended
30 June 2018
For the
six months ended
30 June 2017
Revenue from principal business 509,734,752.86 466,435,530.40
Revenue from other business 2,056,671.90 2,056,671.90
511,791,424.76 468,492,202.30
Operating cost is as follows:
For the
six months ended
30 June 2018
For the
six months ended
30 June 2017
Cost of principal business 36,491,918.32 43,359,840.95
Information by products is as follows:
For the six months
ended 30 June 2018
For the six months
ended 30 June 2017
Revenue Costs Revenue Costs
Rental income 509,734,752.86 36,491,918.32 466,435,530.40 43,359,840.95
Others 2,056,671.90 – 2,056,671.90 –
511,791,424.76 36,491,918.32 468,492,202.30 43,359,840.95

337BBMG CORPORATION
INTERIM REPORT 2018
Notes to Unaudited Interim Financial StatementsFor the six months ended 30 June 2018
RMB
XV. NOTES TO KEY ITEMS OF THE COMPANY’S FINANCIAL STATEMENTS (continued)
5. Investment gains
For the
six months ended
30 June 2018
For the
six months ended
30 June 2017
Gains from long-term equity investments
under cost method 1,324,651,337.17 198,849,580.35
Losses from long-term equity investments
under equity method 24,124,522.78 (18,671,179.76)
1,348,775,859.95 180,178,400.59
6. Notes to items of statement of cash flows
For the
six months ended
30 June 2018
For the
six months ended
30 June 2017
Cash received relating to other operating activities
Cash received from superior units 18,085,528,188.24 9,010,000,000.00
Cash received from internal borrowings
among subsidiaries 8,001,376,000.00 13,989,789,799.55
Interests income 50,865,749.83 46,985,469.54
26,137,769,938.07 23,046,775,269.09
Cash paid relating to other operating activities
Cash paid to subordinate units 18,094,756,175.88 23,100,392,159.40
Current accounts of subsidiaries 13,483,547,408.28 10,037,443,104.89
Expenses of the headquarters 190,283,982.97 220,057,943.43
31,768,587,567.13 33,357,893,207.72

338
Notes to Unaudited Interim Financial StatementsFor the six months ended 30 June 2018
RMB
XV. NOTES TO KEY ITEMS OF THE COMPANY’S FINANCIAL STATEMENTS (continued)
7. Supplemental information to statement of cash flows
(1) Reconciliation of net profit to cash flows from operating activities:
For the
six months ended
30 June 2018
For the
six months ended
30 June 2017
Net profit 1,428,100,874.66 141,584,295.68
Add: Depreciation of fixed assets 35,363,976.02 35,324,870.62
Amortisation of intangible assets 6,990,689.16 6,766,596.04
Losses from disposal of fixed assets,
intangible assets and other long-term
assets – 111,582.12
Gains from changes in fair value – (135,588,436.76)
Finance expenses 419,951,339.88 1,184,240,985.65
Investment gains (1,348,775,859.95) (180,178,400.59)
(Increase)/decrease in deferred income tax
assets (18,753,447.09) 84,250,836.66
Increase/(decrease) in deferred income tax
liabilities 46,150,245.86 (97,702,890.81)
Increase in operating receivables (8,624,886,907.45) (11,639,924,185.36)
Increase in operating payables 2,853,086,502.93 674,094,395.22
Net cash flows used in operating activities (5,202,772,585.98) (9,927,020,351.53)
(2) Cash and cash equivalents
30 June 2018 31 December 2017
Cash 3,869,587,679.53 6,209,927,405.16
Including: Bank deposits on demand 3,869,587,679.53 6,209,927,405.16
Closing balance of cash and cash equivalents 3,869,587,679.53 6,209,927,405.16

339BBMG CORPORATION
INTERIM REPORT 2018
Supplementary Information to Unaudited Interim Financial StatementsFor the six months ended 30 June 2018
RMB
1. BREAKDOWN OF NON-RECURRING PROFIT AND LOSS
For the
six months ended
30 June 2018
Profit and loss from disposal of non-current assets (22,502,565.23)
Government grants recognised through profit or loss for the current period (excluding
those closely related to the Company’s ordinary business operations, in line with
national policies and entitled continuously in accordance with certain standard
based on a fixed amount or quantity) 54,709,891.22
Profit and loss from debt restructuring 12,262,813.93
Profit and loss from fair value change of investment properties measured subsequently
through fair value model and profit and loss from fair value change of financial
assets held for trading 273,123,778.84
Profit or loss from change in fair value of held-for-trading financial assets and held-
for-trading financial liabilities, and investment gains from disposal of held-for-
trading financial assets, held-for-trading financial liabilities and available-for-sale
financial assets, other than effective hedging business relating to the ordinary
business operations of the Company 6,963,840.61
Reversal of provisions for impairment of receivables that are individually tested for
impairment 5,633,297.57
Other non-operating income and expenses other than the above items 8,507,572.54
Total non-recurring profit and loss 338,698,629.48
Less: impact of income tax 65,304,742.26
Less: impact of minority interests 32,967,543.66
240,426,343.56
Items included in the government grants recognised through profit or loss for the period, but were not regarded
as non-recurring profit or loss due to their close relation to the ordinary business operations of the Group,
in line with national policies and were entitled continuously in accordance with certain standard based on a
fixed amount or quantity were as follows:
For the
six months ended
30 June 2018
Refunds of VAT 241,425,207.62
Grants for heat supply 1,611,842.70

340
Supplementary Information to Unaudited Interim Financial Statements (continued)For the six months ended 30 June 2018
RMB
1. BREAKDOWN OF NON-RECURRING PROFIT AND LOSS (continued)
The Group recognised non-recurring profit and loss items in accordance with the requirement under Explanatory
Announcement No. 1 on Information Disclosure for Companies Making Public Offering of Securities – Non-
recurring Profit and Loss (CSRC Announcement [2008] No. 43).
2. RETURN ON NET ASSETS AND EARNINGS PER SHARE
For the six months ended 30 June 2018
Weighted
average return
on net assets
Earnings per share
Basic Diluted
(%)
Net profit attributable to ordinary
shareholders of the Company 4.59 0.23 0.23
Net profit attributable to ordinary
shareholders of the Company after
deducting non-recurring profit and loss 4.07 0.20 0.20
For the six months ended 30 June 2017
Weighted
average return
on net assets
Earnings per share
Basic Diluted
(%)
Net profit attributable to ordinary
shareholders of the Company 4.10 0.17 0.17
Net profit attributable to ordinary
shareholders of the Company after
deducting non-recurring profit and loss 3.59 0.15 0.15
The Company did not have potentially dilutive ordinary shares.

Interim Report
(a joint stock company incorporated in the People’s Republic of China with limited liability)
Stock Code : 2009
www.bbmg.com.cn/listco*For identification purposes only
20
18 Interim
Rep
ort北京金隅集團股份有限公司 B
BM
G C
OR
PO
RAT
ION


![BBMG Corporation [2009.HK]...Recap of the restructuring: step 2. BBMG will inject its cement, concrete, new materials and environ-mental protection business into Jidong Cement in exchange](https://img.pdfslide.us/doc/110x75/5f0e89c37e708231d43fb9c4/bbmg-corporation-2009hk-recap-of-the-restructuring-step-2-bbmg-will-inject.jpg)