Embed Size (px)
Citation preview
SCALE-UP OF USING NOVEL DEWATERING AIDS
By
Mert Kerem Eraydin
Dissertation submitted to the Faculty of the
Virginia Polytechnic Institute and State University
In partial fulfillment of the requirement for the degree of
Doctor of Philosophy
In
Mining and Minerals Engineering
R.-H. Yoon, Chairman
G.H. Luttrell
G.T. Adel
I. Yildirim
May 4, 2009
Blacksburg, Virginia
Keywords: Dewatering, Moisture, Flotation, Dewatering Aid, Vacuum, Disc, Horizontal Belt
Filter, Flocculation, Hydrophobicity, Coal, Clay, Copper
SCALE-UP OF USING NOVEL DEWATERING AIDS
By
Mert Kerem Eraydin
ABSTRACT
Coal preparation plants use large quantities of water for cleaning processes. Upon
cleaning, the spent water must be removed such that the final product moisture level meets
market constraints. However, removal of free water from the surface of fine particles is difficult
and costly, and often the results are less than desirable. Fine particles inherently have very large
surface areas, and hence retain large amounts of water. Increased amounts of fines also cause
denser particle packing, which creates relatively small capillaries in filter cakes and, thus, cause
slower dewatering kinetics. As a result, dewatering costs for fine particles are much higher than
for dewatering coarse particles.
Considering the technical and economic issues associated with dewatering coal and
mineral fines, an extensive matrix of laboratory- and pilot-scale dewatering tests have been
conducted to evaluate the use of novel dewatering aids. The reagents are designed to lower the
surface tension of water, increase the hydrophobicity of the particles to be dewatered, and
increase the capillary radius by hydrophobic coagulation. All of these are designed to lower the
moisture of the filter cakes produced in mechanical dewatering processes. Laboratory-scale
dewatering tests confirmed that using the novel dewatering aids can lower the final cake
moisture of coal by 20-50%, while increasing the dewatering kinetics. Several on-site, pilot-
scale tests were conducted to demonstrate that the process of using the novel dewatering aids can
be scaled.
Based on the laboratory- and pilot-scale tests conducted, a scale-up model for the process
of using the novel dewatering aids has been developed. It can predict the final cake moistures as
a function of vacuum pressure, filtration time and specific cake weight. The model can be useful
for the scale-up of vacuum disc filters (VDF) and horizontal belt filters (HBF). Simulation
results indicate that dewatering aids can be very effective, especially when used in conjunction
with HBF due to its ability to control cake thickness and drying cycle time independently.
In light of the promising laboratory- and pilot-scale test results, an industrial
demonstration of the novel dewatering aids has been conducted at the Smith Branch
impoundment site, which contains 2.9 million tons of recoverable coal. When the reagent was
used for dewatering flotation products using a VDF, the moisture content was reduced from 26 to
20% at 0.5 lb/ton of reagent addition and to 17.5% at 1 lb/ton. The use of the dewatering aid
also improved the kinetics of dewatering, increased the throughput, and reduced the power
consumption of vacuum pumps by 30%.
The novel dewatering aids were also tested successfully for dewatering of kaolin clays.
In this case, the mineral was treated with a cationic surfactant before adding the dewatering aids.
This two-step hydrophobization process was able to reduce the cake moisture and also increase
the throughput.
iv
ACKNOWLEDGMENTS
The author would like to express his sincere appreciation to his advisor, Dr. Roe-Hoan
Yoon, for the guidance, inspiration, suggestions and criticisms. Special thanks are also given to
his committee members, Dr. Luttrell, Dr. Adel, and Dr. Ismail for their continued interests,
useful suggestions, constructive comments and discussion to understand the overall process.
The financial support from the National Energy Technology Laboratory and Department
of Mining and Minerals Engineering is deeply appreciated.
I owe special gratitude to Mr. David Brightbill, Steve Blubaugh and Steven Abbatello for
their helpful suggestions and continuous support. I am also grateful to Dr. Jinming Zhang, Mr.
Serhat Keles, for their friendship and support.
I would like to express my most sincere appreciation to my parents Ziynet and Ali
Eraydin for their inspiration, encouragements, moral support and continued suggestions. I would
also like to thank my sister Feyza for her continued support.
Finally, I would like to express my thanks to Emily A. Sarver for all her encouragements,
patience and dedication.
v
TABLE OF CONTENTS
TITLE PAGE………………………………………...………………………………………
ABSTRACT………………………………………………………………………………….
ACKNOWLEDGMENTS……………………..…………………………………………….
TABLE OF CONTENTS……………..……………………………………………………..
LIST OF FIGURES………………………………………………………………………….
LIST OF TABLES…………………………………………………………………………...
CHAPTER 1 INTRODUCTION………………………………………………..…………
1.1. INTRODUCTION…………………………………………………………....
1.2. LITERATURE REVIEW…………………………………………………….
1.2.1. Coal Processing………………………………………………………
1.2.2. Coal Dewatering……………………………………………………...
1.2.3. Solid-Liquid Separation Methods……………………………………
1.2.4. Dewatering Parameters………………………………………………
1.2.5. Dewatering Theory…………………………………………………...
1.2.6. Research Objectives………………………………………………….
REFERENCES….……………………………………………………………...…….
i
ii
iv
v
ix
xii
1
1
5
5
9
10
17
30
36
37
vi
CHAPTER 2 LABORATORY AND PILOT SCALE EVALUATION OF
DEWATERING AIDS……………………………………..……………….
2.1. INTRODUCTION……………………………………………………………
2.2. GENERAL EXPERIMENTAL DETAILS…………………………………..
2.2.1. Samples………………………………………………………………
2.2.2. Methods and Procedures……………………………………………..
2.3. FIELD TESTING…………………………………………………………….
2.3.1. Test Program Overview……………………………………………...
2.3.2. Mingo Logan Site……………………………………………………
2.3.3. Coal Clean Site……………………………………………………….
2.3.4. Concord Site………………………………………………………….
2.3.5. Buchanan Site………………………………………………………...
2.3.6. Elkview Site………………………………………………………….
2.3.7. Smith Branch Site…………………………………………………….
2.3.8. Moatize Site…………………………………………………………..
2.4. SUMMARY AND CONCLUSIONS………………………………………..
REFERENCES….……………………………………………………………………
CHAPTER 3 SIMULATION AND SCALE-UP………………………………..………...
3.1. INTRODUCTION………….………………………………………………..
3.2. EXPERIMENTAL……...……………………………………………………
3.3. DATA COLLECTION AND RESULTS…………………………………….
3.4. EMPIRICAL MODEL…………………...…………………………………..
43
43
44
44
46
53
53
54
81
89
96
105
114
125
130
134
135
135
136
137
143
vii
3.5. SUMMARY AND CONCLUSIONS………………………………………...
REFERENCES….……………………………………………………………………
CHAPTER 4 INDUSTRIAL DEMONSTRATION OF DEWATERING AIDS…...…..
4.1. INTRODUCTION……………………………………………………………
4.1.1. General Background………………………………………………….
4.1.2. Smith Branch Impoundment…………………………………………
4.1.3. Preliminary Analysis…………………………………………………
4.2. PROOF-OF-CONCEPT DEMONSTRATION……………………………..
4.2.1. POC Engineering and Circuit Design………………………………..
4.2.2. POC Fabrication and Installation…………………………………….
4.2.3. POC Circuit Testing………………………………………………….
4.2.4. Scale-Up Assessment………………………………………………...
4.3. SUMMARY AND CONCLUSIONS……………………………………….
REFERENCES………………………………………………………………………
CHAPTER 5 DEWATERING OTHER MINERALS…………………………………...
5.1. INTRODUCTION……….…………………………………………………..
5.2. KAOLIN CLAY……………………………………………………………..
5.2.1. Background Information……………………………………………..
5.2.2. Two Step Hydrophobization Method………………………….……..
5.2.3. Foam Aided Dewatering Method…………………………………….
5.3. FLY ASH…………………………………………………………………….
152
153
154
154
154
156
157
160
160
161
166
173
176
179
180
180
180
180
182
192
199
viii
5.3.1. Background Information……………………………………………..
5.3.2. Two Step Hydrophobization Technique……………………………..
5.3.3. Results and Discussion……………………………………………….
5.3.4. Foam aided dewatering method……………………………………...
5.4. COPPER………………….………………………………………………….
5.4.1. Background Information……………………………………………..
5.4.2. Experimental…………………………………………………………
5.4.3. Results and Discussion……………………………………………….
5.5. SUMMARY AND CONCLUSIONS………………………………………...
REFERENCES…………………….…………………………………………………
CHAPTER 6 CONCLUSIONS…………………………………………………………….
FUTURE WORK………………….…………………………………………………
199
200
202
209
211
211
211
212
214
217
219
223
ix
LIST OF FIGURES
Figure 1.1 Primary energy production by major source (Energy Information
Administration)…………………………….……………….………………..
Figure 1.2 Coal consumption by sector (Energy Information Administration).....…….
Figure 1.3 Coal production and consumption in the United States (Energy Information
Administration)………………………………………………………………
Figure 1.4 Levels of beneficiation……………………………………………………….
Figure 1.5 Classification of mechanical coal dewatering methods………..…………….
Figure 1.6 Commonly used dewatering equipment in coal industry for various size
ranges and corresponding approximate moistures…………………………...
Figure 1.7 Coal structure………………………………….……….…………………….
Figure 1.8 Simplified classifications of coals by rank…………….……………………..
Figure 1.9 Schematic of particle-water relationship in cake structure…………….…….
Figure 1.10 Relationship between applied pressure and moisture reduction……..……...
Figure 1.11 Cake formations during dewatering stages………………………………..…
Figure 1.12 Schematic of the moisture zones……………………………..……….……..
Figure 1.13 Potential energy curves……………………………………………..….…….
Figure 1.14 Double layer model…………………………………………………....……..
Figure 1.15 Surface active agents…………………………………………….…………...
Figure 1.16 Contact angle and hydrophobicity……………………………….………..…
Figure 1.17 Schematic illustration of the layer formations………………………….……
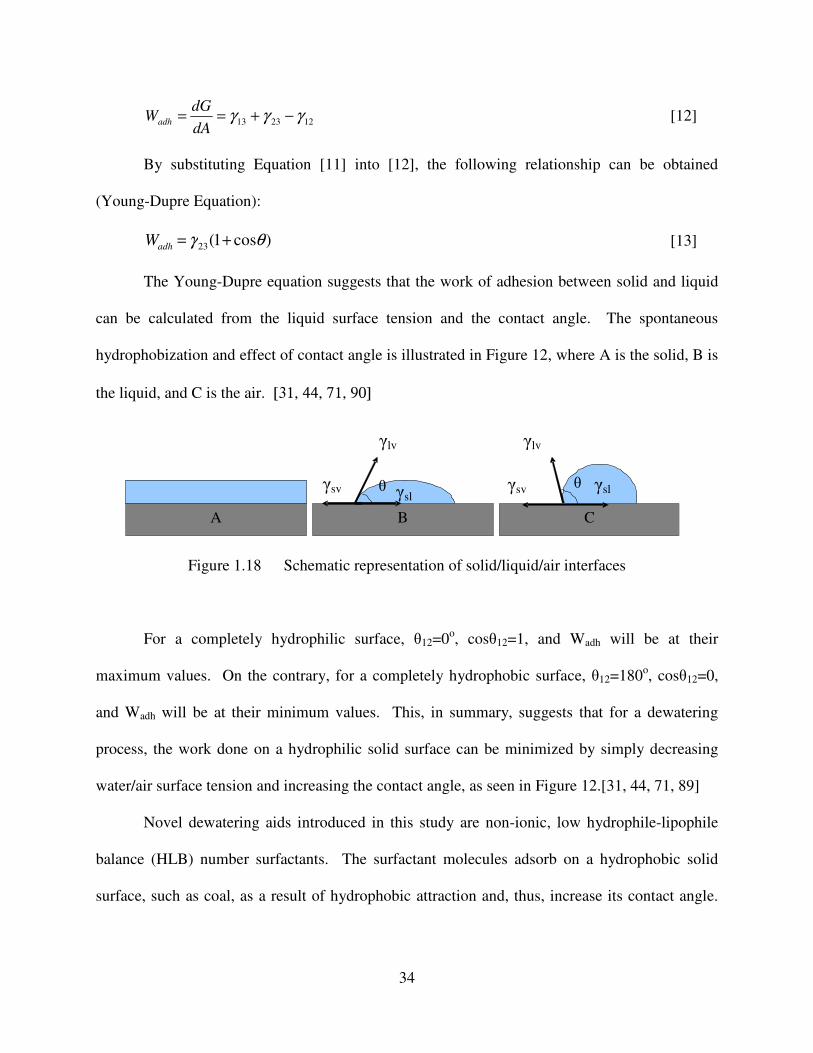
Figure 1.18 Schematic representation of solid/liquid/air interfaces………………..……..
Figure 2.1 Experimental setup for laboratory vacuum filtration tests…………………...
2
3
4
6
10
11
18
18
19
20
21
22
23
24
27
28
29
34
47
x
Figure 2.2 Schematic diagram of the Peterson disc filter……………………..……..…..
Figure 2.3 Figure illustrating the principle of the dual vacuum system………...……….
Figure 2.4 Photograph of the horizontal belt filter…………………………...………….
Figure 2.5 Photographs of (a) the column unit, (b) the conditioner……..……………..
Figure 2.6 Normalized product rate (lb/hr/ft2) versus cake moisture………..………….
Figure 2.7 Cake moisture versus normalized drying cycle time……………………..…
Figure 2.8 Cake moisture versus cake formation time……………………………….….
Figure 2.9 Cake moisture versus normalized filter cake production rate…………….…
Figure 2.10 Cake moisture versus normalized filtration time…………………………....
Figure 2.11 Cake moisture versus total cake formation time…………………….………
Figure 2.12 Configuration of the mobile unit test modules evaluated at the Panther
Preparation Plant site………………….……………………………………
Figure 2.13 Effect of conditioning on moisture (Middlefork coal)……..………………..
Figure 2.14 Results of the low-pressure pressure filter tests conducted on the Elkview
coal sample (filter feed)…………………………………………….………...
Figure 2.15 Weight and ash distributions of slurry from the Smith Branch
impoundment………………………………………………….……………...
Figure 3.1 WS vs. CFTxPF for mixture sample……………………………...………….
Figure 3.2 WS vs. CFTxPF for flotation sample………………………….……………..
Figure 3.3 Moisture (%) vs. (1/W)(DCTxPD/µ) for mixture sample…………...……….
Figure 3.4 Moisture (%) vs. (1/W)(DCTxPD/µ) for flotation product sample…...……..
Figure 4.1. Pinnacle waste coal impoundment cross-section from vibracore analysis…..
Figure 4.2. Generic POC flowsheet for treating pond reclaim material………………….
49
50
51
52
63
65
66
73
75
76
82
110
112
115
145
145
147
148
156
158
xi
Figure 4.3 Engineering flowsheet for the POC-scale pond reclaim facility……..………
Figure 4.4 Simplified process flow diagram for the pond reclaim facility………………
Figure 4.5 Nearly completed plant incorporating the POC circuitry……………...……..
Figure 4.6 Classifying cyclones used to provide a 100 mesh cutsize……………………
Figure 4.7 Screen-bowl centrifuge used to dewater 100x235 mesh product……..……..
Figure 4.8 Deslime cyclones used to perform a nominal 325 mesh cutsize……………..
Figure 4.9 Three-stage conditions used for conditioning the dewatering aid……………
Figure 4.10 Bank of disc filters used to dewater the fine coal froth product……………..
Figure 4.11 Static thickener used to thicken solids and clarify process water……………
Figure 4.12 Paste thickener used to further thicken wastes for disposal………………….
Figure 4.13 Weight and ash distributions for samples collected from the shakedown
tests conducted on the coarse coal treatment circuits………….……………..
Figure 4.14 Weight and ash distributions for samples collected from the shakedown
tests conducted on the fine coal treatment circuits……………..…………….
Figure 4.15 Moisture content versus dewatering aid dosage (RV)………..…….………..
Figure 4.16 Moisture reduction versus dewatering aid dosage (RV)………..……………
Figure 4.17 Effect of dewatering aid addition on vacuum filter pump power demand…...
Figure 5.1 Tergitol NP-7…………………………………………………………………
Figure 5.2 PPG-400……………………………………………………………………...
160
163
164
164
164
164
165
165
166
166
168
169
174
174
175
195
210
xii
LIST OF TABLES
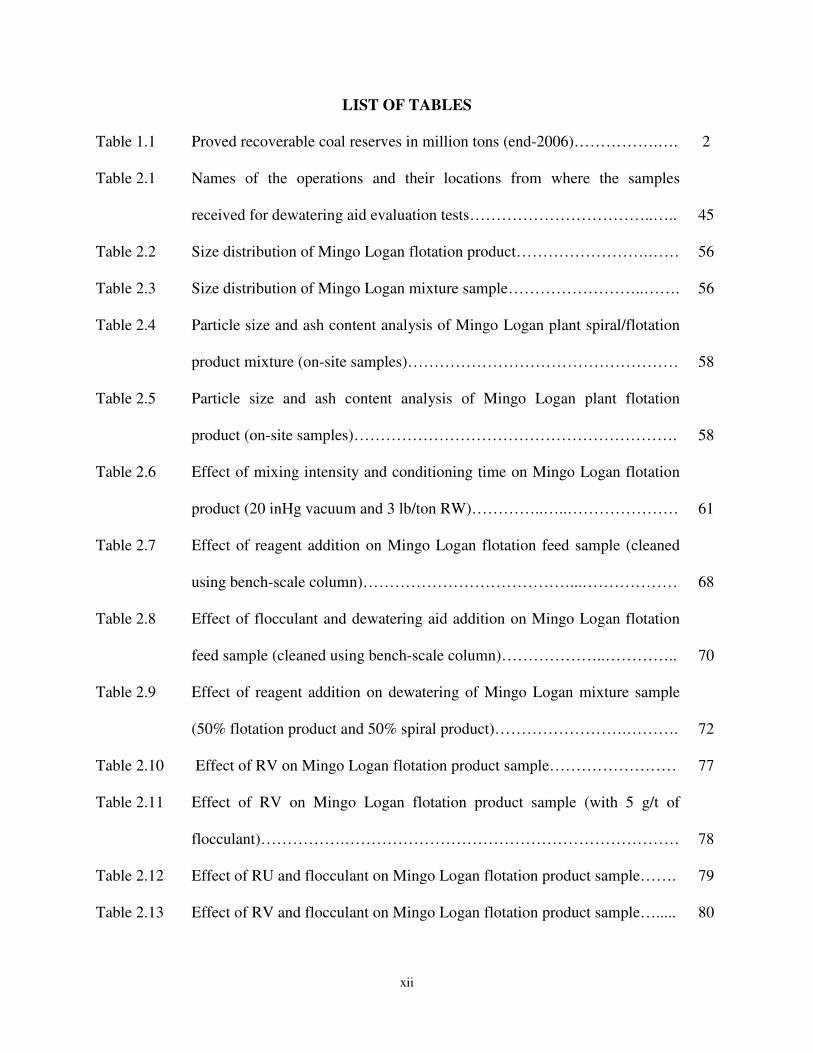
Table 1.1 Proved recoverable coal reserves in million tons (end-2006)…………….….
Table 2.1 Names of the operations and their locations from where the samples
received for dewatering aid evaluation tests……………………………..…..
Table 2.2 Size distribution of Mingo Logan flotation product…………………….……
Table 2.3 Size distribution of Mingo Logan mixture sample……………………..…….
Table 2.4 Particle size and ash content analysis of Mingo Logan plant spiral/flotation
product mixture (on-site samples)……………………………………………
Table 2.5 Particle size and ash content analysis of Mingo Logan plant flotation
product (on-site samples)…………………………………………………….
Table 2.6 Effect of mixing intensity and conditioning time on Mingo Logan flotation
product (20 inHg vacuum and 3 lb/ton RW)…………..…..…………………
Table 2.7 Effect of reagent addition on Mingo Logan flotation feed sample (cleaned
using bench-scale column)…………………………………...………………
Table 2.8 Effect of flocculant and dewatering aid addition on Mingo Logan flotation
feed sample (cleaned using bench-scale column)………………..…………..
Table 2.9 Effect of reagent addition on dewatering of Mingo Logan mixture sample
(50% flotation product and 50% spiral product)…………………….……….
Table 2.10 Effect of RV on Mingo Logan flotation product sample……………………
Table 2.11 Effect of RV on Mingo Logan flotation product sample (with 5 g/t of
flocculant)…………….………………………………………………………
Table 2.12 Effect of RU and flocculant on Mingo Logan flotation product sample…….
Table 2.13 Effect of RV and flocculant on Mingo Logan flotation product sample….....
2
45
56
56
58
58
61
68
70
72
77
78
79
80
xiii
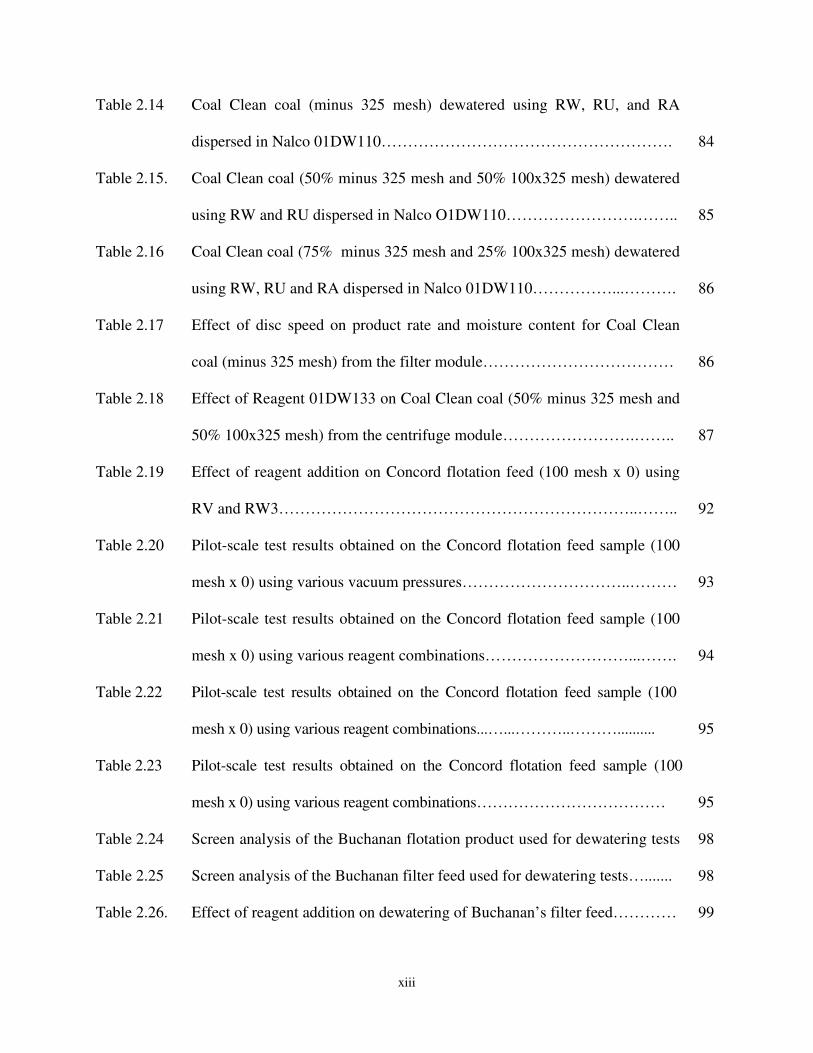
Table 2.14 Coal Clean coal (minus 325 mesh) dewatered using RW, RU, and RA
dispersed in Nalco 01DW110……………………………………………….
Table 2.15. Coal Clean coal (50% minus 325 mesh and 50% 100x325 mesh) dewatered
using RW and RU dispersed in Nalco O1DW110…………………….……..
Table 2.16 Coal Clean coal (75% minus 325 mesh and 25% 100x325 mesh) dewatered
using RW, RU and RA dispersed in Nalco 01DW110……………...……….
Table 2.17 Effect of disc speed on product rate and moisture content for Coal Clean
coal (minus 325 mesh) from the filter module………………………………
Table 2.18 Effect of Reagent 01DW133 on Coal Clean coal (50% minus 325 mesh and
50% 100x325 mesh) from the centrifuge module…………………….……..
Table 2.19 Effect of reagent addition on Concord flotation feed (100 mesh x 0) using
RV and RW3…………………………………………………………..……..
Table 2.20 Pilot-scale test results obtained on the Concord flotation feed sample (100
mesh x 0) using various vacuum pressures…………………………..………
Table 2.21 Pilot-scale test results obtained on the Concord flotation feed sample (100
mesh x 0) using various reagent combinations………………………...…….
Table 2.22 Pilot-scale test results obtained on the Concord flotation feed sample (100
mesh x 0) using various reagent combinations...…...………..………..........
Table 2.23 Pilot-scale test results obtained on the Concord flotation feed sample (100
mesh x 0) using various reagent combinations………………………………
Table 2.24 Screen analysis of the Buchanan flotation product used for dewatering tests
Table 2.25 Screen analysis of the Buchanan filter feed used for dewatering tests….......
Table 2.26. Effect of reagent addition on dewatering of Buchanan’s filter feed…………
84
85
86
86
87
92
93
94
95
95
98
98
99
xiv
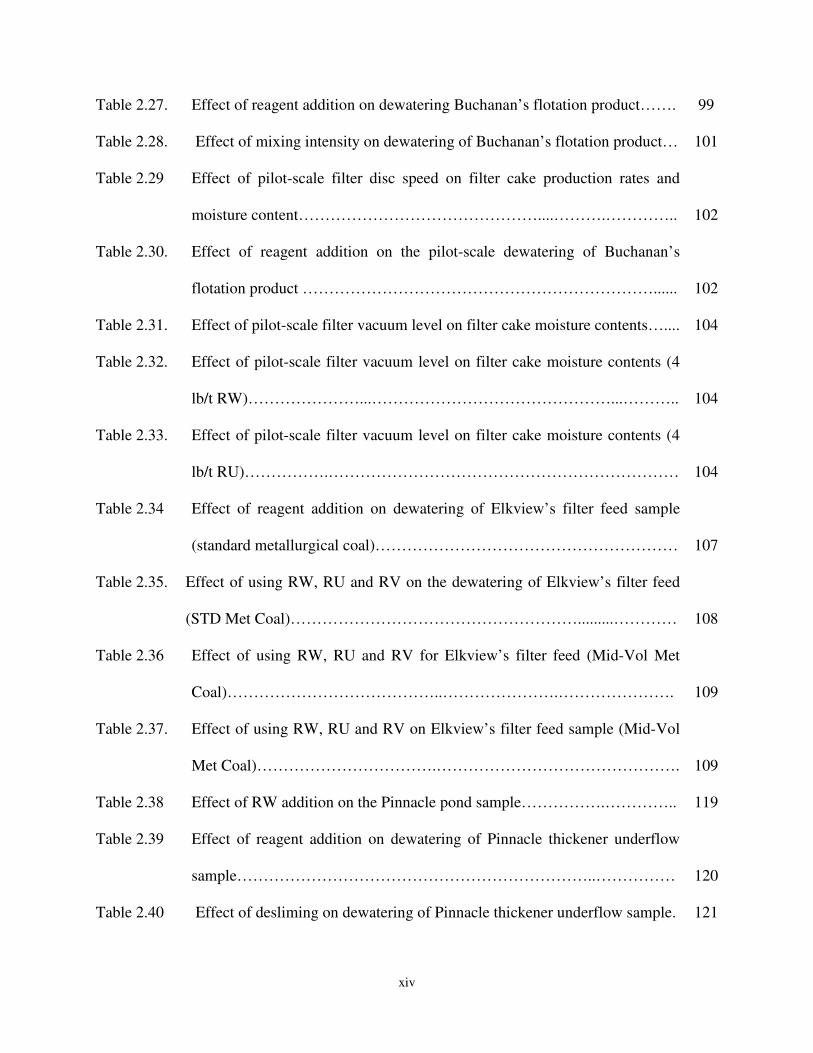
Table 2.27. Effect of reagent addition on dewatering Buchanan’s flotation product…….
Table 2.28. Effect of mixing intensity on dewatering of Buchanan’s flotation product…
Table 2.29 Effect of pilot-scale filter disc speed on filter cake production rates and
moisture content………………………………………....……….…………..
Table 2.30. Effect of reagent addition on the pilot-scale dewatering of Buchanan’s
flotation product …………………………………………………………......
Table 2.31. Effect of pilot-scale filter vacuum level on filter cake moisture contents…....
Table 2.32. Effect of pilot-scale filter vacuum level on filter cake moisture contents (4
lb/t RW)…………………...………………………………………...………..
Table 2.33. Effect of pilot-scale filter vacuum level on filter cake moisture contents (4
lb/t RU)…………….…………………………………………………………
Table 2.34 Effect of reagent addition on dewatering of Elkview’s filter feed sample
(standard metallurgical coal)…………………………………………………
Table 2.35. Effect of using RW, RU and RV on the dewatering of Elkview’s filter feed
(STD Met Coal)……………………………………………….........…………
Table 2.36 Effect of using RW, RU and RV for Elkview’s filter feed (Mid-Vol Met
Coal)…………………………………..………………….………………….
Table 2.37. Effect of using RW, RU and RV on Elkview’s filter feed sample (Mid-Vol
Met Coal)…………………………….……………………………………….
Table 2.38 Effect of RW addition on the Pinnacle pond sample…………….…………..
Table 2.39 Effect of reagent addition on dewatering of Pinnacle thickener underflow
sample…………………………………………………………..……………
Table 2.40 Effect of desliming on dewatering of Pinnacle thickener underflow sample.
99
101
102
102
104
104
104
107
108
109
109
119
120
121
xv
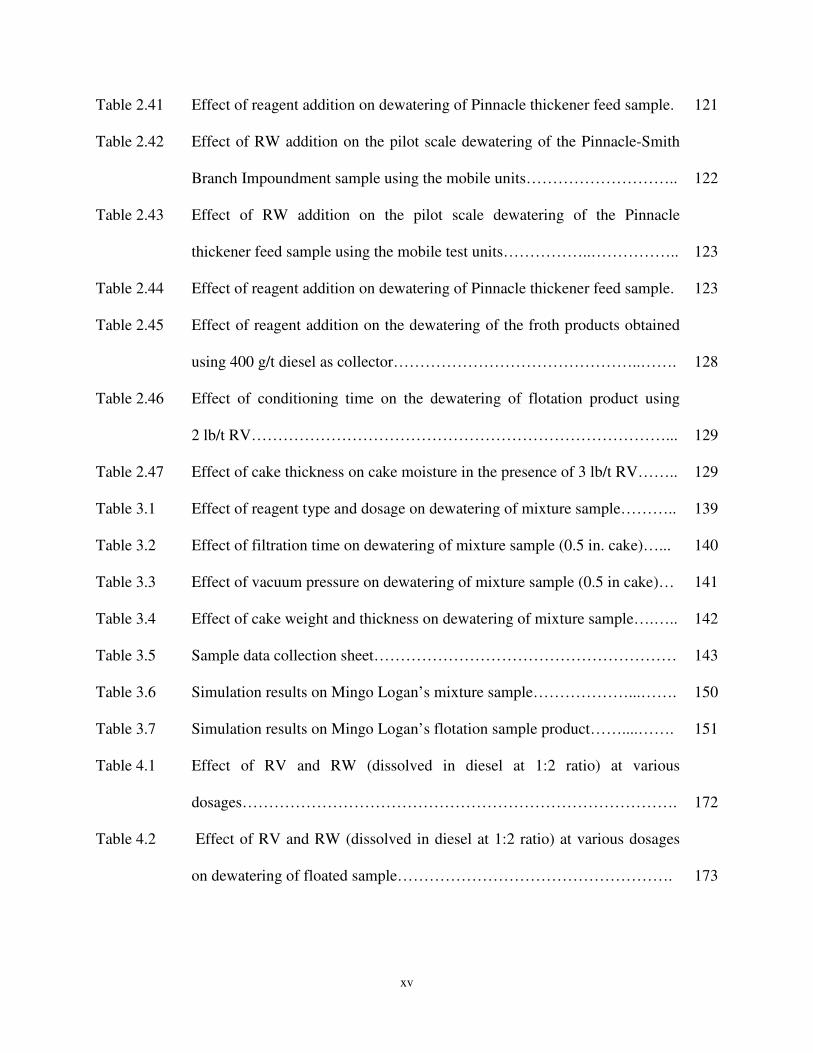
Table 2.41 Effect of reagent addition on dewatering of Pinnacle thickener feed sample.
Table 2.42 Effect of RW addition on the pilot scale dewatering of the Pinnacle-Smith
Branch Impoundment sample using the mobile units………………………..
Table 2.43 Effect of RW addition on the pilot scale dewatering of the Pinnacle
thickener feed sample using the mobile test units……………..……………..
Table 2.44 Effect of reagent addition on dewatering of Pinnacle thickener feed sample.
Table 2.45 Effect of reagent addition on the dewatering of the froth products obtained
using 400 g/t diesel as collector………………………………………..…….
Table 2.46 Effect of conditioning time on the dewatering of flotation product using
2 lb/t RV……………………………………………………………………...
Table 2.47 Effect of cake thickness on cake moisture in the presence of 3 lb/t RV……..
Table 3.1 Effect of reagent type and dosage on dewatering of mixture sample………..
Table 3.2 Effect of filtration time on dewatering of mixture sample (0.5 in. cake)…...
Table 3.3 Effect of vacuum pressure on dewatering of mixture sample (0.5 in cake)…
Table 3.4 Effect of cake weight and thickness on dewatering of mixture sample….…..
Table 3.5 Sample data collection sheet…………………………………………………
Table 3.6 Simulation results on Mingo Logan’s mixture sample………………...…….
Table 3.7 Simulation results on Mingo Logan’s flotation sample product……....…….
Table 4.1 Effect of RV and RW (dissolved in diesel at 1:2 ratio) at various
dosages……………………………………………………………………….
Table 4.2 Effect of RV and RW (dissolved in diesel at 1:2 ratio) at various dosages
on dewatering of floated sample…………………………………………….
121
122
123
123
128
129
129
139
140
141
142
143
150
151
172
173
xvi
Table 4.3. Effect of RV (dissolved in diesel at 1:2 ratio) at various dosages on
dewatering of deslimed samples…………………………..…………………
Table 5.1 Effect of amine (DAC) addition as the first step on dewatering of Georgia
clay……………………………………………………………..…………….
Table 5.2 Effect of RW addition as the second step (10 lb/t DAC & various dosages
of RW) on dewatering of Georgia clay………………………….………..…
Table 5.3 Effect of using 10 lbs/t amine and RW on the dewatering of PSD Filter Vat
kaolin clay sample after dilution to 15% solids at pH 7.0..…..................…
Table 5.4 Effect of using 10 lbs/t amine and RW on the dewatering of PSD Filter Vat
kaolin clay sample after dilution to 15% solids at pH 7.0……....................
Table 5.5 Effect of using amine only on the dewatering of PSD Filter pre-leached
kaolin clay sample (pH 9.5& 30% solids)………..…………………….……
Table 5.6 Effect of using amine only on the dewatering of the coarse pre-leach kaolin
clay sample from (pH 7 & 30% solids)………………...………………..…..
Table 5.7 Effect of using amine (10lb/t) and RW on the dewatering of PSD Filter pre-
leached kaolin clay sample at 30% solids at pH 9.5 and pH 7.0…………...
Table 5.8 Effect of foam on dewatering of Georgia clay at pH 7.0 when Tergitol NP-7
and NP-9 is used as foam generating agents……………………....…………
Table 5.9 Effect of Tergitol with thick cake (5-6mm) on dewatering of Georgia clay...
Table 5.10 Effect of foam on dewatering of Georgia clay at pH 3 when Tergitol NP-7
is used as foam generating agent……………………………………..………
Table 5.11 Effect of alum addition on dewatering of Georgia clay when Tergitol was
used as foaming agent…………………………………………….………….
173
184
185
187
188
189
189
190
194
194
197
197
xvii
Table 5.12 Effect of reagent addition at (1:2) ratio on dewatering of Kentucky coal
sample at 17-19 inches Hg vacuum…………………………………..………
Table 5.13 Effect of amine addition at (1:2) ratio on dewatering of Kentucky coal
sample at 17-19 inches Hg vacuum…………………………………..………
Table 5.14 Effect of amine (10 lb/t) and RW addition at (1:2) ratio on dewatering of
Kentucky coal sample at 17-19 inHg vacuum………………….……..……..
Table 5.15 Effect of amine addition as the first step on dewatering of fly ash sample at
20 in Hg Vacuum pressure……………………………….…....……………..
Table 5.16 Effect RW, RU and RV addition at (1:2) ratio on dewatering of amine pre-
treated (3 lb/t of amine) Kentucky fly ash sample at 20 in Hg vacuum.........
Table 5.17 Effect of amine addition as the first step on dewatering of fly ash sample at
30psi pressure…………………………………………………………………
Table 5.18 Effect of amine (3 lb/t) and RW addition at (1:2) ratio on dewatering of
Kentucky coal sample at 30psi pressure……………………………..………
Table 5.19 Effect of amine (1lb/t) and RV addition as the first step on dewatering of fly
ash sample at 20 in Hg vacuum pressure………………….……….………...
Table 5.20 Effect of using amine (1lb/t) and RV on the dewatering of the fly ash
sample at 30% solids………..……………………………………………….
Table 5.21 Effect of PPG addition on dewatering of Kentucky fly ash sample at 17-19
in Hg vacuum…………………………….…………………………………..
Table 5.22 Effect of Tergitol addition on dewatering of Kentucky coal sample at 17-19
in Hg vacuum………...…………………………...………………………….
202
203
204
205
205
206
206
207
208
209
210

xviii
Table 5.23 Effect of using RW on the dewatering of the copper sample at 20 in Hg
vacuum pressure………………………………………………………….…..
Table 5.24 Effect of using RW on the dewatering of the copper sample at 500 Kpa
pressure……………………………………………………………………….
212
213
1
CHAPTER 1 INTRODUCTION
1.1. INTRODUCTION
Fossil fuels, especially coal, oil and gas, are of great importance since they can be burned
to produce energy. The Energy Information Administration estimates that in 2005, fossil fuels
made up approximately 86% of United States’ energy production and 76% of world
consumption. The remaining sources are non-fossil sources such as hydroelectric, nuclear and
other (geothermal, solar, wind, wood and waste) at 6.3%, 6.0% and 0.9 % used for energy
production, respectively.[1, 2]
Fossil fuels are the most important energy sources; however, they are non-renewable.
According to Oil & Gas Journal estimates, years of production left in the ground for fossil
reserves are 45 years for oil, 72 years for gas and 252 years for coal. Of these fossil fuels coal
has the most widely distributed reserves and it is mined in over 100 countries and on all
continents except Antarctica. The total recoverable world reserve for coal was estimated by
International Energy Annual-2005 to be around 908 million tons. British Petroleum’s statistical
review of world energy data from 2007 shows that the United States has enormous coal
resources and recoverable reserves. Coal is classified into six types or ranks (peat, lignite, sub-
bituminous, bituminous, anthracite and graphite) which depend on the amount and the types of
carbon it contains and on the amount of heat energy it can produce. In the United States, the
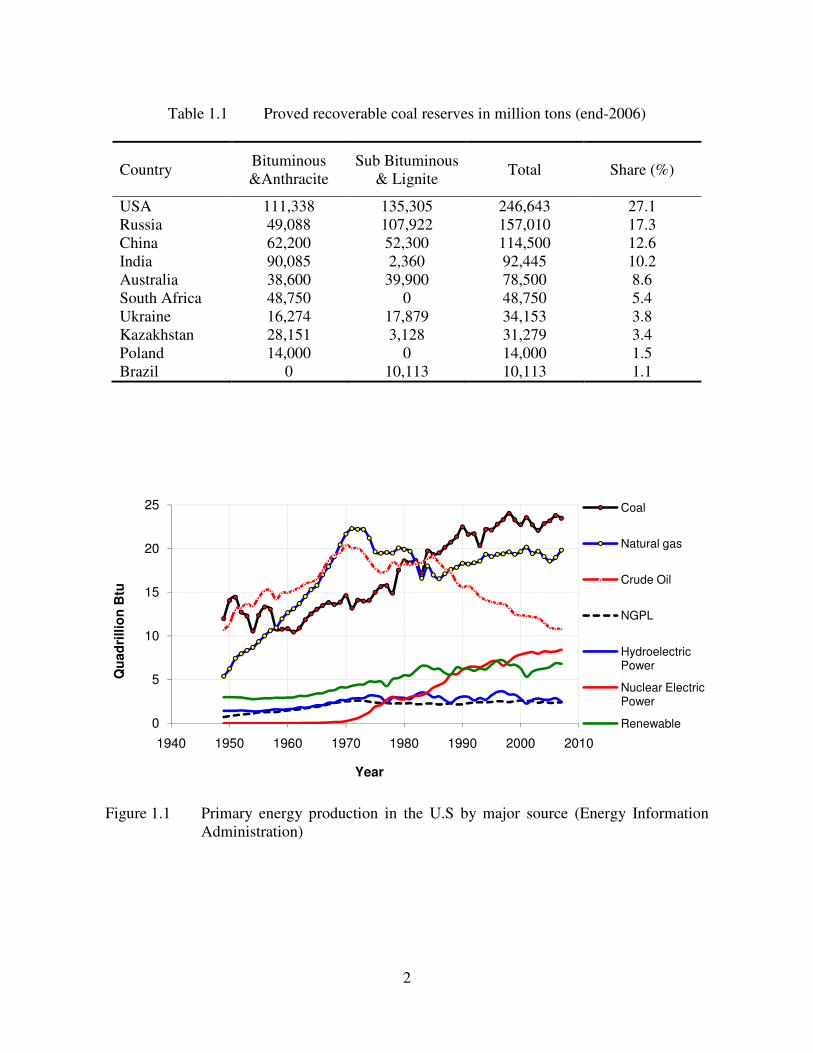
most widely used coal types are lignite, sub-bituminous, bituminous and anthracite. Table 1.1
shows the proved recoverable coal reserves in millions of tons for the United States and the top
10 countries as of the end of 2006.[1-4]
2
Table 1.1 Proved recoverable coal reserves in million tons (end-2006)
Country Bituminous
&Anthracite
Sub Bituminous
& Lignite Total Share (%)
USA 111,338 135,305 246,643 27.1
Russia 49,088 107,922 157,010 17.3
China 62,200 52,300 114,500 12.6
India 90,085 2,360 92,445 10.2
Australia 38,600 39,900 78,500 8.6
South Africa 48,750 0 48,750 5.4
Ukraine 16,274 17,879 34,153 3.8
Kazakhstan 28,151 3,128 31,279 3.4
Poland 14,000 0 14,000 1.5
Brazil 0 10,113 10,113 1.1
Figure 1.1 Primary energy production in the U.S by major source (Energy Information
Administration)
0
5
10
15
20
25
1940 1950 1960 1970 1980 1990 2000 2010
Qu
ad
rillio
n B
tu
Year
Coal
Natural gas
Crude Oil
NGPL
Hydroelectric Power
Nuclear Electric Power
Renewable
3
In United States, coal represents approximately 95 percent of the nation’s fossil energy
reserves. Coal is mainly found in three large regions: the Appalachian Coal Region, the Interior
Coal Region, and the Western Coal Region (includes the Powder River Basin). It is currently
produced in 26 states, with most of it mined in Wyoming, followed by West Virginia, Kentucky,
Pennsylvania, and Texas. The Energy Information Administration reports that 1,162.8 million
short tons of coal were produced in 2006. Currently, approximately 50% of the electricity is
produced by using coal and there are approximately 600 power plants. Coal is also one of the
nation’s lowest-cost electric power sources (DOE). Thus, today the electric power sector drives
the coal demand for electricity production and is almost responsible for 90% of the coal
consumption (EIA). Figure 1.1 shows the comparison of electricity produced from the major
energy sources in United States.[1-3]
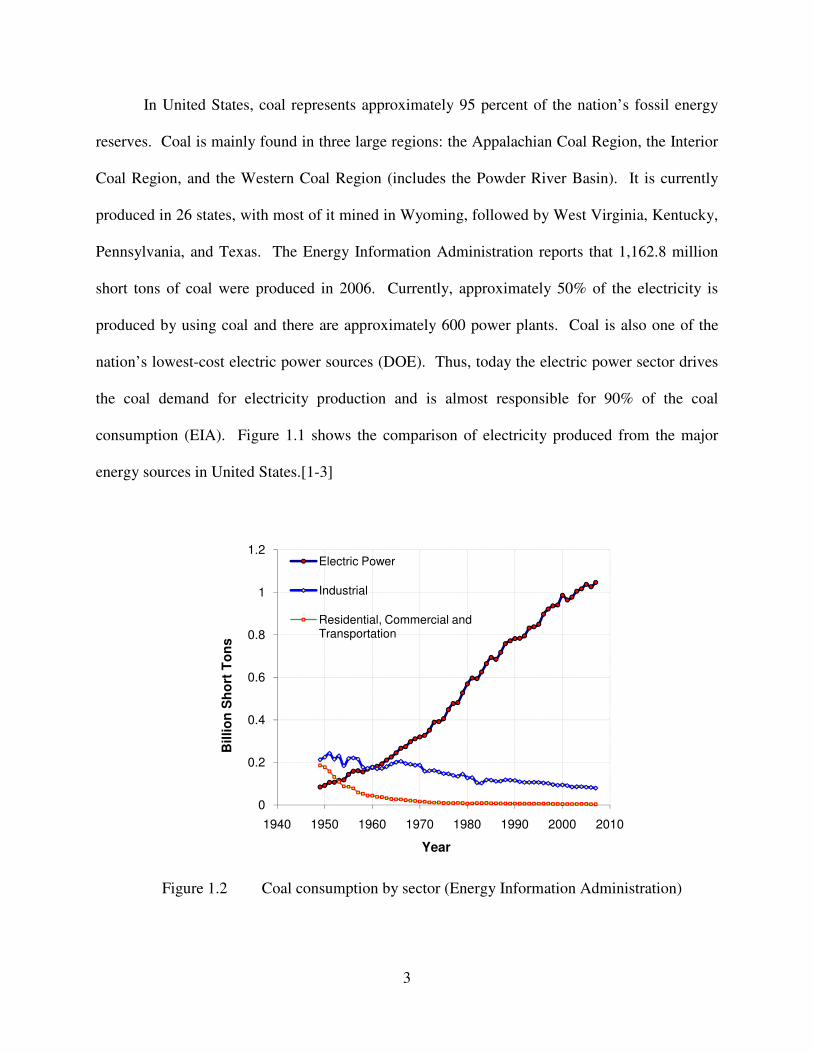
Figure 1.2 Coal consumption by sector (Energy Information Administration)
0
0.2
0.4
0.6
0.8
1
1.2
1940 1950 1960 1970 1980 1990 2000 2010
Billio
n S
ho
rt T
on
s
Year
Electric Power
Industrial
Residential, Commercial and Transportation
4
As seen from Figure 1.1, a large part of the energy production in the United States comes
from fossil fuels such as coal, natural gas and crude oil. Until the 1980s, coal was surpassed by
crude oil and then by natural gas. By the mid 1980s, coal started to become the leading energy
source, and the use of coal increased sharply. In the 1950s, the industrial sector used coal as its
major energy source. By the 1960s, the electric power sector started to use more coal. Figure
1.2 shows the coal consumption from 1949 to 2007 by major sectors.[1, 2]
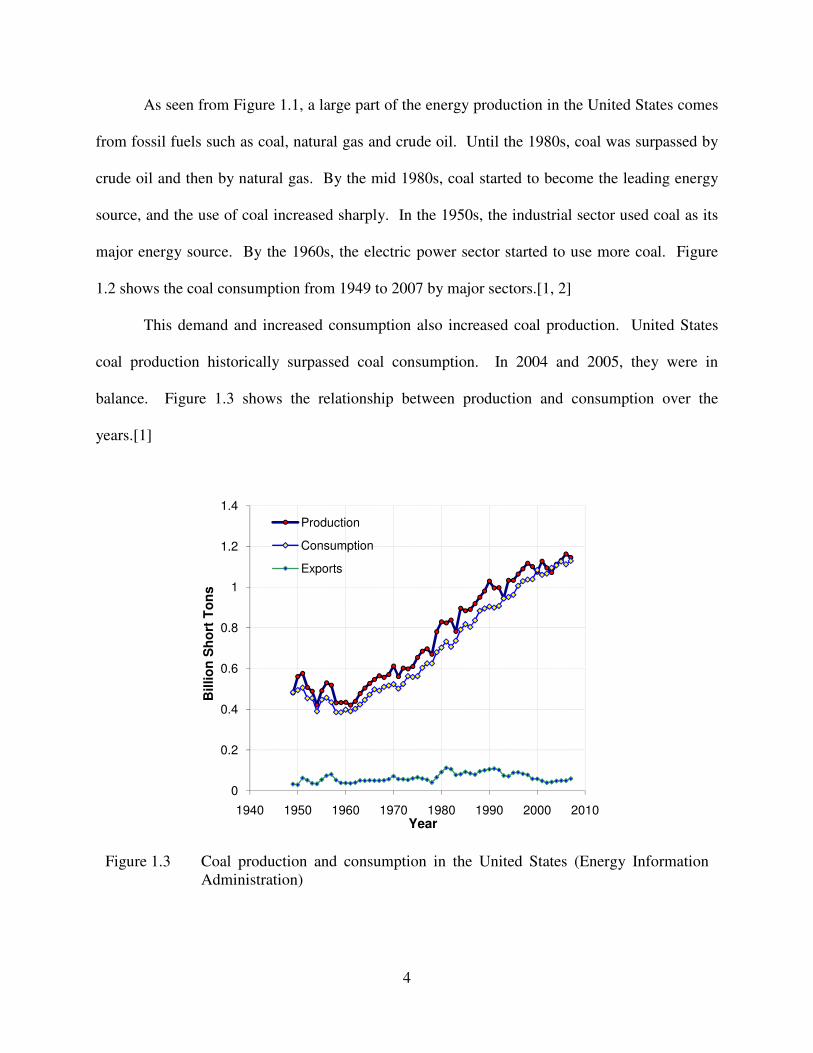
This demand and increased consumption also increased coal production. United States
coal production historically surpassed coal consumption. In 2004 and 2005, they were in
balance. Figure 1.3 shows the relationship between production and consumption over the
years.[1]
Figure 1.3 Coal production and consumption in the United States (Energy Information
Administration)
0
0.2
0.4
0.6
0.8
1
1.2
1.4
1940 1950 1960 1970 1980 1990 2000 2010
Billio
n S
ho
rt T
on
s
Year
Production
Consumption
Exports
5
The increase in demand resulted in tremendous expansions on coal mining and capacity.
After the 1970s this demand created more mines, especially above-ground. The National Mining
Association reports that, of the two main mining methods, surface and underground,
approximately two-thirds of today’s coal production is surface mining. The increase in the need
of coal also improved mining technologies to produce additional coal. This additional coal is
prepared to today’s standard specifications dictated by the users. Thus, coal processing
technologies is advanced to produce a cleaner and higher heating content end product.[5]
1.2. LITERATURE REVIEW
1.2.1. Coal Processing
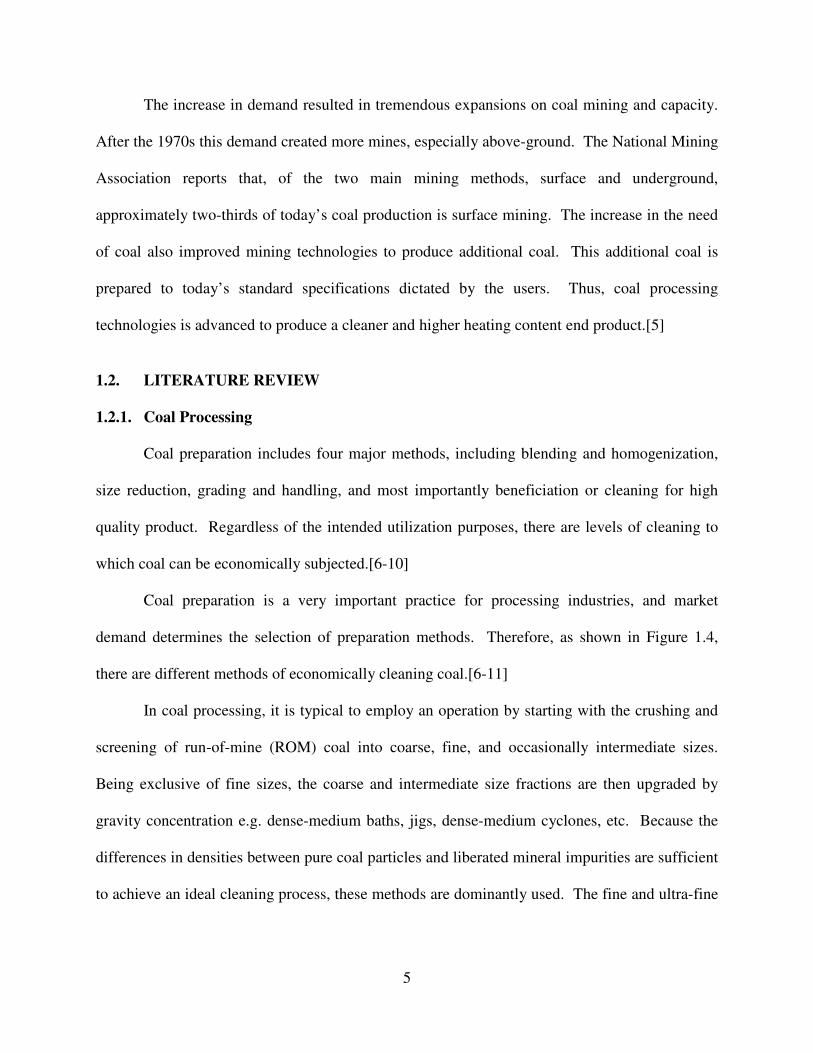
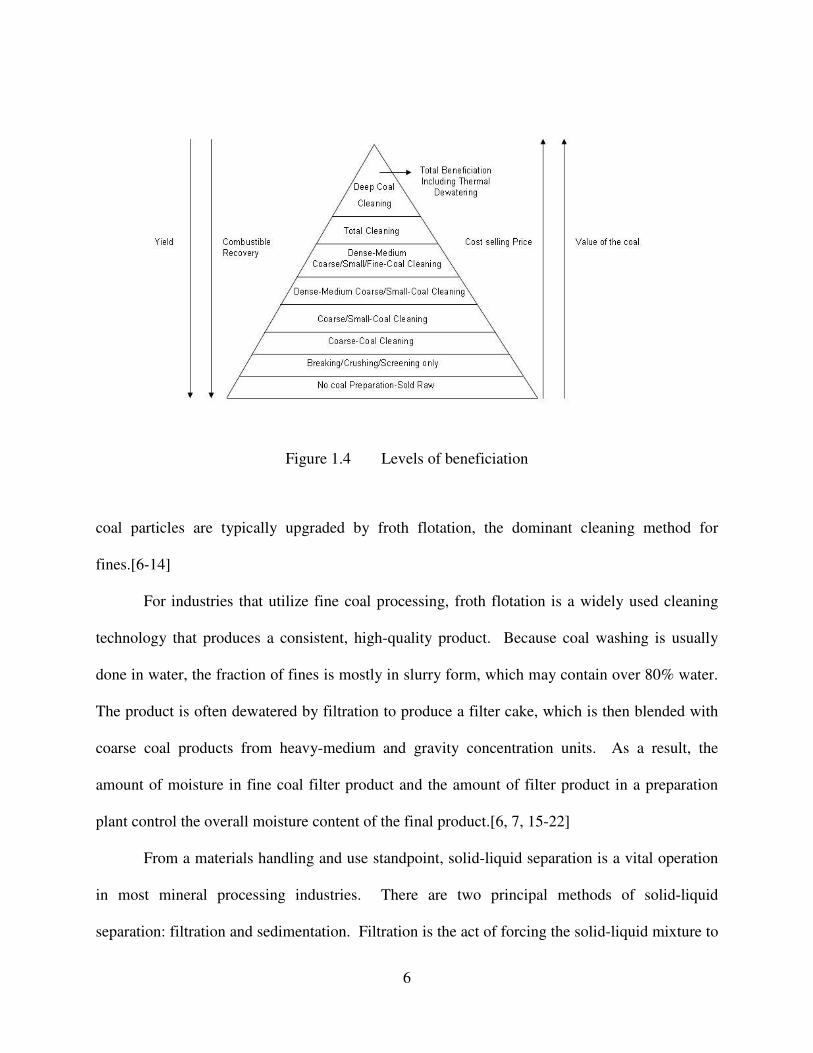
Coal preparation includes four major methods, including blending and homogenization,
size reduction, grading and handling, and most importantly beneficiation or cleaning for high
quality product. Regardless of the intended utilization purposes, there are levels of cleaning to
which coal can be economically subjected.[6-10]
Coal preparation is a very important practice for processing industries, and market
demand determines the selection of preparation methods. Therefore, as shown in Figure 1.4,
there are different methods of economically cleaning coal.[6-11]
In coal processing, it is typical to employ an operation by starting with the crushing and
screening of run-of-mine (ROM) coal into coarse, fine, and occasionally intermediate sizes.
Being exclusive of fine sizes, the coarse and intermediate size fractions are then upgraded by
gravity concentration e.g. dense-medium baths, jigs, dense-medium cyclones, etc. Because the
differences in densities between pure coal particles and liberated mineral impurities are sufficient
to achieve an ideal cleaning process, these methods are dominantly used. The fine and ultra-fine
6
coal particles are typically upgraded by froth flotation, the dominant cleaning method for
fines.[6-14]
For industries that utilize fine coal processing, froth flotation is a widely used cleaning
technology that produces a consistent, high-quality product. Because coal washing is usually
done in water, the fraction of fines is mostly in slurry form, which may contain over 80% water.
The product is often dewatered by filtration to produce a filter cake, which is then blended with
coarse coal products from heavy-medium and gravity concentration units. As a result, the
amount of moisture in fine coal filter product and the amount of filter product in a preparation
plant control the overall moisture content of the final product.[6, 7, 15-22]
From a materials handling and use standpoint, solid-liquid separation is a vital operation
in most mineral processing industries. There are two principal methods of solid-liquid
separation: filtration and sedimentation. Filtration is the act of forcing the solid-liquid mixture to
Figure 1.4 Levels of beneficiation
7
pass through a medium. Solids are retained on the surface of the medium, creating a cake
formation, which the liquid media flows through. Sedimentation is a separation method that
benefits from the differences in phase densities of solids and liquids by allowing solids to sink in
the fluid under controlled conditions.[20, 22-29]
In the conventional dewatering processes, thickeners, dewatering screens, vacuum filters
(drum, disc, and belt), centrifuges, pressure (hyperbaric) filters are utilized to remove the surface
water. Vacuum filtration is one of the dewatering processes widely used in the coal industry, its
advantage being a continuous operation that can be utilized under relatively simple mechanical
conditions. The removal of free water from the surface of fine particles is difficult and
unsatisfactory by mechanical methods. The problems associated with the dewatering of fine
particles are complicated. The finer particles have a larger total surface area than the coarse
particles, causing very high water retention and smaller capillaries in the filter cake. Eventually,
this results in high capillary pressures and slower dewatering rates.[19, 20, 23-26]
In general, the costs of cleaning fine particles are approximately 3 times higher than those
for coarse particle. This leaves coal producers only a few options as to what to do with the fines
in economical terms. The fine products also contain higher levels of impurities, ash and sulfur,
that lead to environmental concerns. Therefore, fine particles smaller than 500µm, and ultra-fine
particles smaller than 100µm, are abandoned with the discard streams if they constitute only a
small fraction (5% to 10%) of the product stream. This has been the case for many U.S. coal
producers. As a result, 30 to 40 million tons of fines have been discarded to waste ponds
annually, representing a loss of recognized, exploitable natural resources.[8, 17, 18, 21, 31, 36]
The key reason for not completely exploiting this energy resource is the cost of the
cleaning process as well as dewatering the high levels of moisture associated with the fine
8
fraction of coal. The dewatering of fines results in a significant expense reporting to overall
cleaning expenses because dewatering costs increase severely when the particle size is smaller
than 500µm. The cost also includes thermal drying, which is the only practical method of drying
fine coal to further decrease the moisture content. An acceptable level of moisture reduction is
usually below 10% (by weight). Even though preferred moisture levels can be achieved by
thermal drying, it is a capital-intensive and costly technology compared to mechanical
dewatering methods.[31, 33, 40, 44-46]
There have not been any significant technical innovations in fine particle dewatering in
decades because most of the fine fraction was sent to waste ponds. This lack of technological
knowledge generated approximately two billion tons of fine coal in waste ponds to date, and 500
to 800 million tons of the fines are still in active ponds. On the other hand, in recent times, the
industrial demand for coal has increased, and recovery of this size fraction has become more
important. Recent advances in the recovery of fine and ultra-fine particles by flotation have also
lead to more fine size coal production, creating an incompatibility between efficient, cleaner coal
production and insufficient, fine-particle dewatering techniques.[9, 23, 31, 46, 47]
The need for understanding and enhancing fine-coal dewatering will be a considerable
contribution to the performance of studies to meet the industry’s needs. Studies on fine-coal
dewatering will increase the availability of efficient dewatering processes that can provide lower
filter cake moisture, resulting in reduced thermal drying costs, reduced transportation cost,
improved product quality, increased calorific value, and minimized freezing during winter
storage.[31, 36, 48]
This study was carried out to achieve a better understanding to solve the problems
associated with fine particle dewatering. For this reason, two new dewatering technologies,
9
which have been developed at Virginia Polytechnic Institute and State University, were tested.
The first technology utilizes novel dewatering aids that have revealed promising options to
receive significantly lower moisture. The other technology is the utilization of foam-supported
dewatering, which is superior when compared to the current, commonly-used technologies.
1.2.2. Coal Dewatering
Because flotation is accomplished in an aqueous solution to produce clean coal, the
product contains approximately 80% water. Although, coal fine products may represent only
20% of the weight of a preparation plant feed, this fraction is accountable for almost two-thirds
of the final product moisture. From a utility viewpoint, a one-ton decrease in moisture can offset
four tons of steam coal. This steam coal can be added to clean coal product, strongly indicating
that the success of coal utilization is critically dependent on solid/liquid separation
technology.[23, 49, 50]
As the first step in dewatering, large settling tanks can be used to remove the free water,
where the slurry is thickened from 35% to 75% solid content. The second step involves
subjecting the pulp to filtration methods including vacuum, drum, disc, and belt filters,
centrifuges, and pressure (hyperbaric) filters to remove the remaining surface water. Despite all
of this, the fine coal, filtered by using these mechanical methods, may still include undesirable
amounts of water in their compositions. Thermal drying, the only fully-developed method to
lower the moisture to single digits, can further decrease cake moisture contents to attain desired
levels; however, the associated high energy intensives, operation costs, and special installation
permissions limit the employment of thermal driers.[20, 26, 51-53]
10
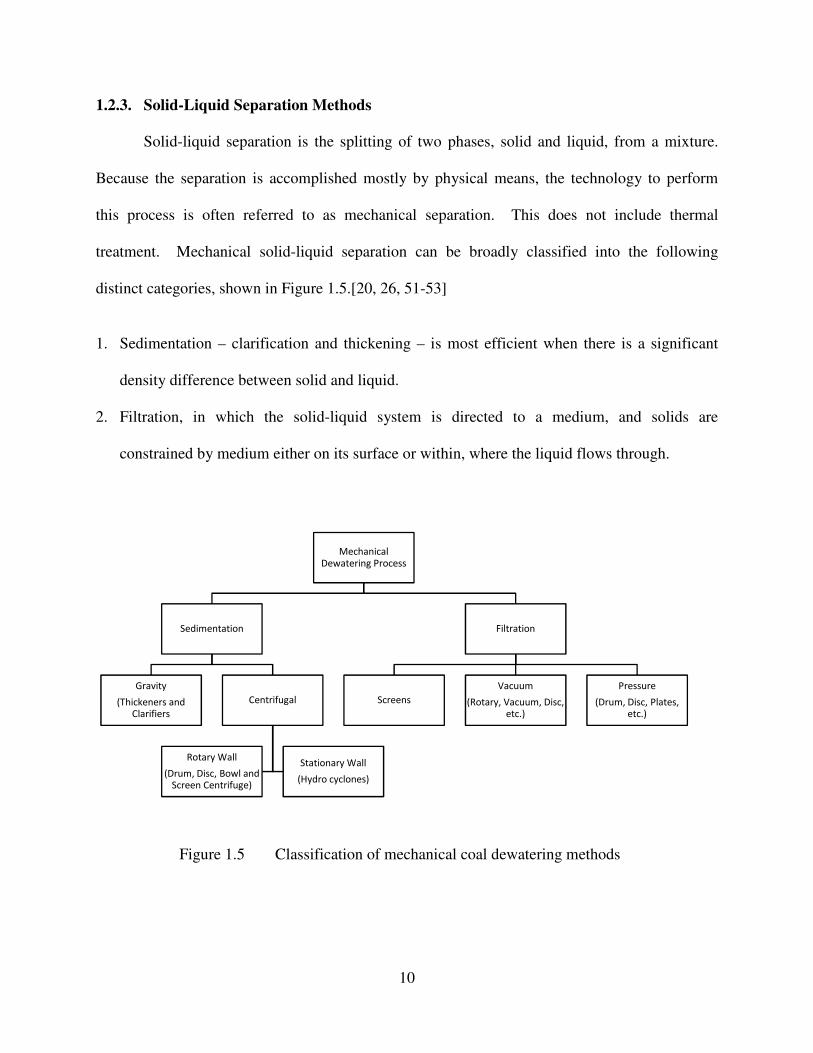
1.2.3. Solid-Liquid Separation Methods
Solid-liquid separation is the splitting of two phases, solid and liquid, from a mixture.
Because the separation is accomplished mostly by physical means, the technology to perform
this process is often referred to as mechanical separation. This does not include thermal
treatment. Mechanical solid-liquid separation can be broadly classified into the following
distinct categories, shown in Figure 1.5.[20, 26, 51-53]
1. Sedimentation – clarification and thickening – is most efficient when there is a significant
density difference between solid and liquid.
2. Filtration, in which the solid-liquid system is directed to a medium, and solids are
constrained by medium either on its surface or within, where the liquid flows through.
Figure 1.5 Classification of mechanical coal dewatering methods
Mechanical
Dewatering Process
Sedimentation
Gravity
(Thickeners and
Clarifiers
Centrifugal
Rotary Wall
(Drum, Disc, Bowl and
Screen Centrifuge)
Stationary Wall
(Hydro cyclones)
Filtration
Screens
Vacuum
(Rotary, Vacuum, Disc,
etc.)
Pressure
(Drum, Disc, Plates,
etc.)
11
Thermal drying is the last operation conducted on dewatered solids when these two mechanical
solid-liquid separation methods are not sufficient.[22, 24, 54]
At processing plants, dewatering is practiced normally in a combination of the above
methods. First, the bulk of the water is removed by sedimentation methods, followed by
filtration methods. If needed, thermal driers are used to produce the desired final moisture
content. Several common factors influence all solid-liquid separation steps and equipment
selection, such as solid concentration, particle shape, specific gravity, surface characteristics,
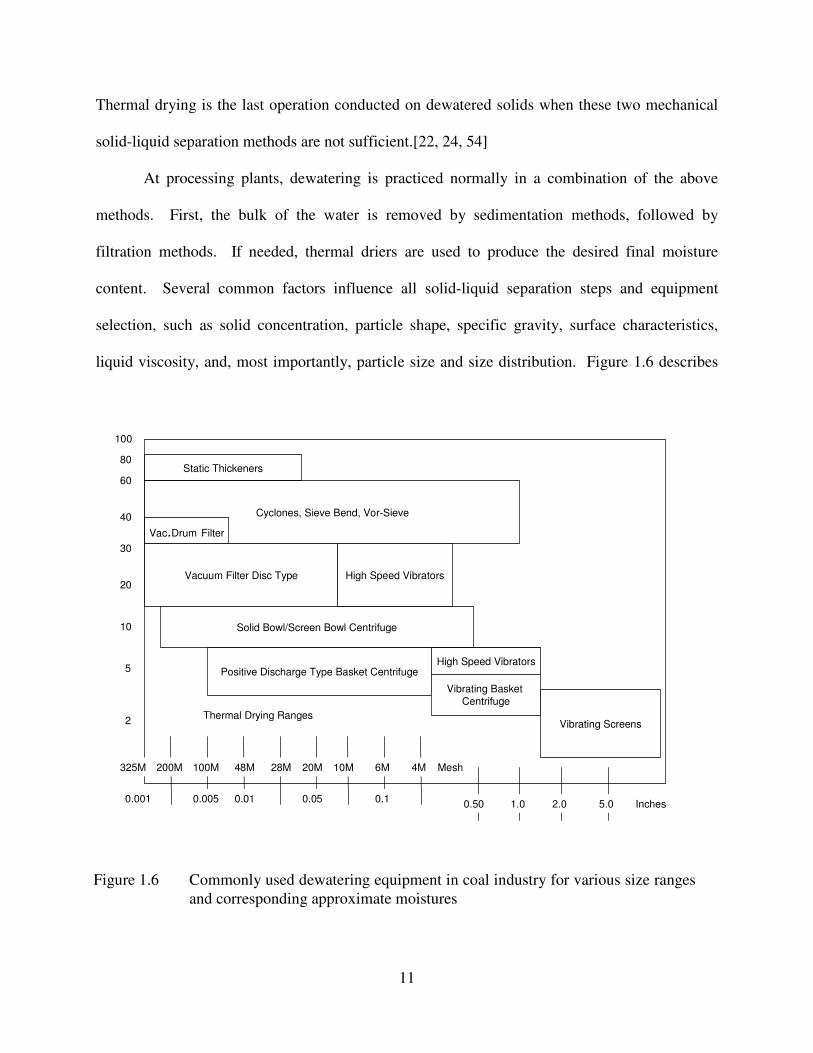
liquid viscosity, and, most importantly, particle size and size distribution. Figure 1.6 describes
Figure 1.6 Commonly used dewatering equipment in coal industry for various size ranges
and corresponding approximate moistures
325M 200M 100M 48M 28M 20M 10M 6M 4M Mesh
0.001 0.005 0.01 0.05 0.10.50 1.0 2.0 5.0 Inches
2
5
10
20
30
40
60
80
100
Static Thickeners
Cyclones, Sieve Bend, Vor-Sieve
Vac.Drum Filter
Vacuum Filter Disc Type
Solid Bowl/Screen Bowl Centrifuge
Positive Discharge Type Basket Centrifuge
Vibrating Basket Centrifuge
High Speed Vibrators
High Speed Vibrators
Vibrating ScreensThermal Drying Ranges
12
the tools that are generally employed for different size fractions of coal to be dewatered.[8, 9, 20,
26, 51-53]
In general, sizes larger than 1.5 inches do not exhibit any particular/serious dewatering
problems since very basic types of shaker screens can produce products with low moistures. For
intermediate to 0.02inch particle size dewatering, high-speed vibrators may be used. Usually, for
dewatering of 3/8 to ¼inch size particles, centrifuges of various types and designs are used,
where the centrifugal force can be employed to promote/aid dewatering. For sizes smaller than
0.02 inch, solid bowl and screen bowl centrifuges can be used, even though higher moisture
values may result than what is desired. Vacuum filtration becomes increasingly important with
finer sizes (-30 mesh) for further dewatering.[8-10, 15, 41, 55, 56]
a) Sedimentation Techniques
Sedimentation is a collective term describing the gravity separation of the fine solids,
usually under quiescent conditions, resulting in the formation of a sedimentary layer of solids
and a relatively clear supernatant liquid. It is mainly used at the very early stages of the
dewatering process to increase the solid content of the slurry in large capacity thickeners.
Depending on the particle size and the solid percent, sedimentation processes involve the settling
of solids in slurry by either employing gravitational or centrifugal force. Because the settling
velocity of the very fine particles is extremely slow by gravity alone, the centrifugal force will
have greater affect on settling time and velocity. Alternatively, the particles may be
agglomerated into larger lumps to facilitate the dewatering. The settled solids are then collected,
removed, and introduced to filtration to further reduce the moisture content of the cake before
thermal drying.[20, 26, 41, 44, 52]
13
b) Centrifugation Techniques
Centrifugal Separation can be considered an extension of gravity separation because the
equipment creates high gravity forces to increase the settling rate of particles for the purpose of
solid-liquid separation. Compared to thickeners, centrifugal separation does not require a density
difference between the solid and the liquid. Even though high maintenance costs exist,
centrifugal dewatering is commonly the most effective mechanical method as a result of these
high forces’ ability to dewater the particles in a short time and a continuous manner.
Centrifugation is primarily utilized for mineral and coal processing industries because it can
collectively dewater a wide range of sizes (normally with a 37.5mm upper limit, where fine is
0.5mm x 0).[8, 9, 29, 41, 61]
Centrifugal separation can be executed by using cyclones or centrifuges. Cyclones are
very simple and cheap, but they suffer from limitations such as low efficiency when dealing with
fine particles and their inability to use flocculants due to high shear forces. Therefore, cyclones
are considered more like classifiers than thickening tools.
Centrifuges are generally classified into two groups.
a) perforate-basket type
- without transporting device
- with positive discharge system
- vibrating basket
b) bowl type
- co-current solid bowl
- countercurrent solid bowl
- screen bowl
14
In coarse coal dewatering, perforated basket centrifuges are most commonly used, and
bowl type centrifuges are most generally used for fine particles. Bowl type centrifuges are
commonly used to dewater coal at sizes from approximately 10mm to 1.0 mm. Two types of
bowl centrifuges may be used, solid bowl centrifuges and screen bowl centrifuges.[8, 9, 29]
c) Filtration Techniques
Filtration is a widely utilized dewatering application in mineral processing industries and
generally occurs after thickening. In filtration, there are four types of driving forces employed to
obtain flow through the filtering medium: gravity, vacuum, pressure, and centrifugal forces.
There are basically two types of filtration used in practice, surface filters, in which the solids are
deposited in the form of cake on the upstream side of the relatively thin filter medium, and depth
filters, in which particle deposition takes place inside the medium. In coal-preparation
applications, most filters are surface filters, employing vacuum and pressure forms of driving
force.[26, 29, 51, 52, 62, 63]
Vacuum filtration can be categorized into two groups: batch and continuous. In coal
dewatering, where continuous filters are widely employed, batch vacuum filters are not practical.
There are several types of vacuum filters that are used for fine particle dewatering. Three types
of vacuum filters are rotary drum, rotary disc, and horizontal belt (HBF), or disc, filter.[26, 44,
52]
Rotary vacuum drum filters are the most widely used continuous filters for fine coal and
mineral particles. They utilize a drum partially submerged into a tank of agitated slurry. Once
the vacuum is applied, cake is deposited on the drum surface and discarded by various types of
mechanisms, such as fixed knife and air blowing. Effluent is drained by different methods,
depending on the manufacturer’s design. Adjustable operating parameters, such as drum rotation
15
speed (rpm), applied vacuum pressure, and submergence, dictate the performance of the drum
filter. Changes in these conditions affect the cake formation, drying, throughput, and the degree
of dewatering achieved.[26, 44, 52, 64]
The key advantages of drum filters are i) effective washing and dewatering properties, ii)
low labor and operating costs, iii) wide operation variations, and iv) easy maintenance and clean
operation. The main disadvantages are i) high capital cost, ii) large space requirements, iii)
incompatible for fast-settling slurries, and low efficiency with ultra-fine particles that blind the
filter cloth.[26, 44, 52, 64]
Rotary vacuum disc filters have almost the same fundamental design as the drum filters.
Disc filters consist of a number of flat filter elements, mounted on a central shaft and connected
to a normal rotary vacuum filter valve. As the unit rotates, the discs are submerged in slurry
contained in a slurry tank and agitated. Gradually, cake is formed and dewatered as the unit
rotates out of submergence. The filter cake is usually removed by a combination of scraper
blades and a blowback mechanism. The disc filters have a low capital cost per unit area, and
they supply large filter areas in smaller floor areas; however, blowback systems may cause
higher moisture, and cake washing cannot be done efficiently.[26, 44, 52, 64]
Horizontal belt filters are continuous filters and consist of an endless reinforced
perforated rubber belt with drainage channels, where the vacuum is applied. The filter
medium/cloth sits on the rubber belt and moves along with it. The suspended slurry is fed from
one end of the filter to produce cake, and filtrate is collected in a tank to be pumped out as
effluent. The horizontal belt filters occupy large floor areas, and the installation costs per filter
area are high; however, being fully automatic, flexible, and having relatively high speeds of
operation offset these weak points.[22, 24, 29]
16
The pressure filters normally perform in a batch-wise manner under positive (air or
hydraulic) pressures to remove water and retain solids in the form of a cake. Pressure filters are
utilized very often in process industries that deal with fine, slow-settling particles exhibiting low
filterability and suspensions that contain higher solid contents. Pressure filters have advantages
over vacuum filters due to higher pressures and vertical incompressibility of solids. In these
units, high pressure creates an increased dewatering rate and lower filter cake moisture. On the
other hand, the discharge of the cake in a continuous manner from the inside of the unit is
difficult and therefore pressure filters are usually employed as batch units. The high capital costs
and inefficient returns associated with batch units create an additional economic disadvantage.
Batch, chamber filter presses and continuous, belt filter presses are two distinct types of pressure
filters most frequently utilized in coal dewatering.[25, 26, 52, 65]
d) Thermal Drying
Thermal drying of minerals and coal is the last and the most expensive unit operation
performed on the dewatered materials before transportation. For that reason, the surface area of
particles increases proportionally with the fineness of size and the final cake moisture. The
coal’s ultimate dewatering cost is strongly related to the amount of the fines. Thermal dryers are
utilized to generate low moisture, maintain high coal-pulverized capacity in power plant
applications, reduce heat loss, prevent freezing, and ease handling, storage and
transportation.[66-68]
There are different types of dryers available, but only a small number of them are used in
coal preparation. Coal thermal dryers can be categorized into two main groups, direct or indirect
heat exchange. The most common dryer in use today for coal preparation industries is the direct-
heated, fluid-bed type dryer. This type of dryer is generally used for fine particle drying, where
17
hot gas passes through the fine particles inside the dryer and removes water from the unit. In the
indirect heat exchange method, the fine particles in the chamber of the dryer are externally
heated by hot gas to obtain dry product. It is mostly employed when environmental concerns
arise. [66-68]
1.2.4. Dewatering Parameters
The performance of most of the dewatering tools that are used today depends strongly on
several parameters of particle-aqueous systems. Parameters which affect the dewatering process
include equipment properties, mineral type, particle size and distribution, physical and chemical
properties of the mineral surface, cake structure and thickness, impurity content, surface
oxidation, solid/liquid ratio, and the presence of chemical additives.[10, 14, 25]
a) Effects of Physical Properties
To improve dewatering to a large extent, understanding the characteristics and properties
of coal and their effects on dewatering behavior is of utmost importance. Coal is the most
abundant resource of fossil fuel available. It is 20 times more abundant than crude oil and over
1.5 times more than other fossil fuels and crude oil combined. Coal is an inherently
heterogeneous material, possessing organic matter, mineral matter, and has an extensive pore
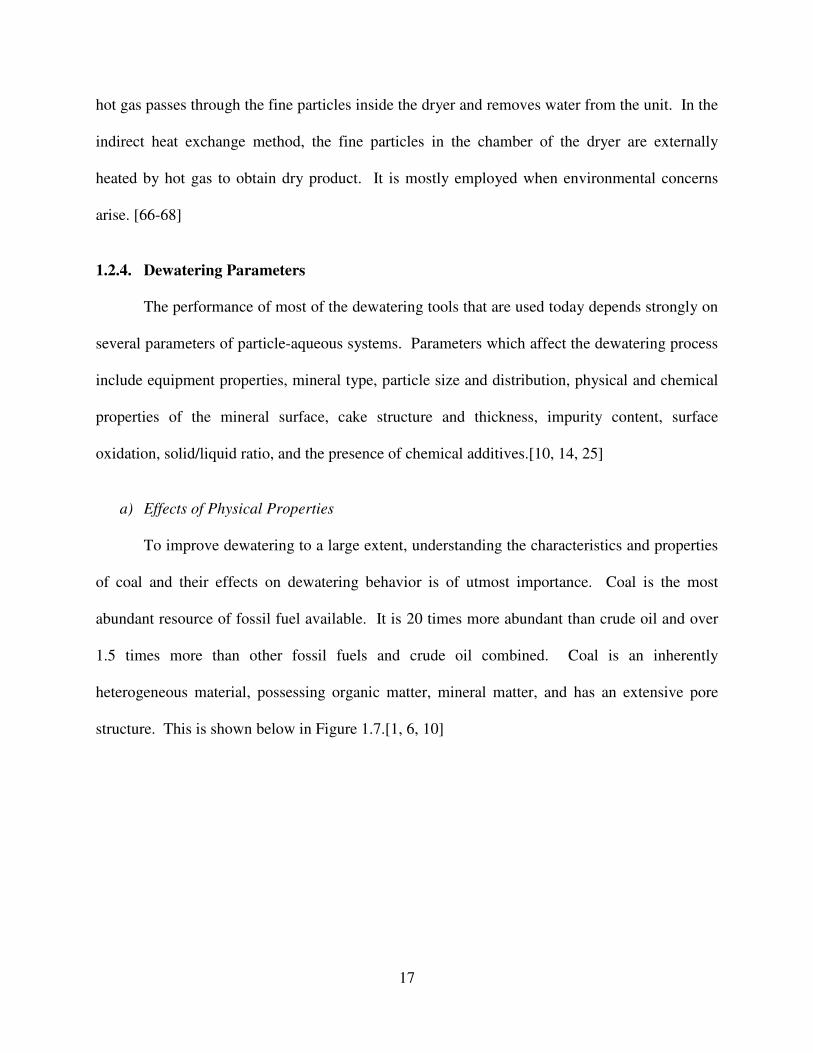
structure. This is shown below in Figure 1.7.[1, 6, 10]
18
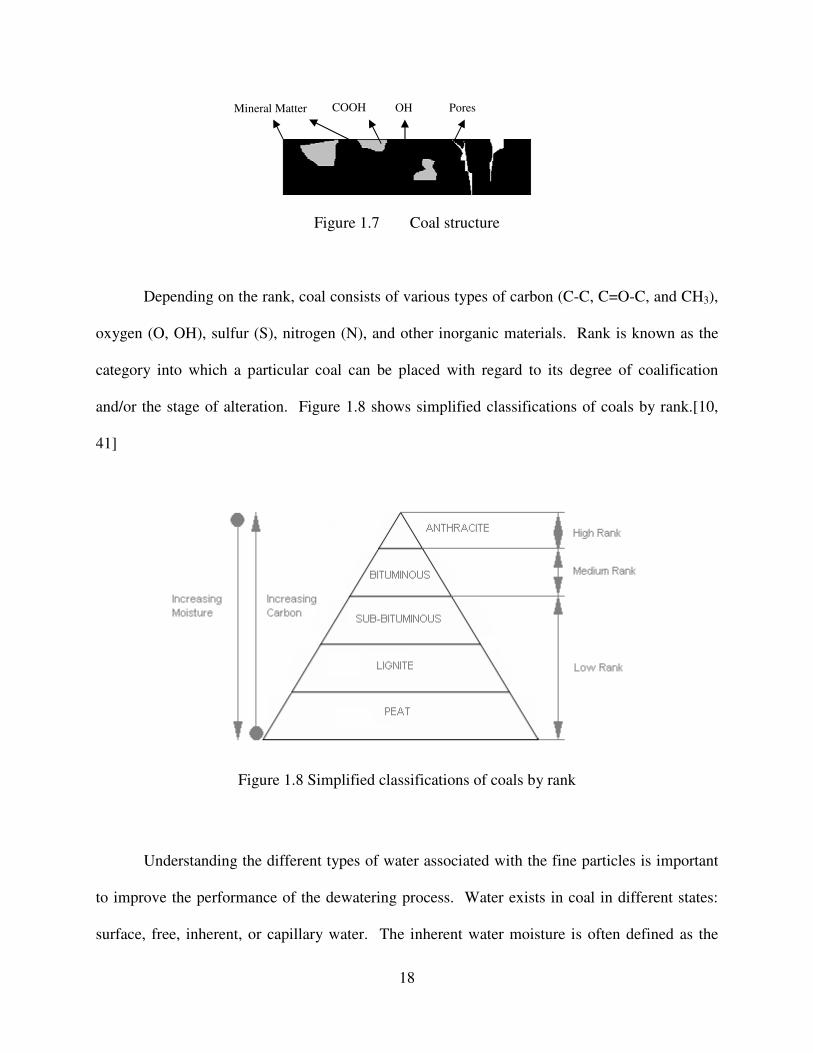
Depending on the rank, coal consists of various types of carbon (C-C, C=O-C, and CH3),
oxygen (O, OH), sulfur (S), nitrogen (N), and other inorganic materials. Rank is known as the
category into which a particular coal can be placed with regard to its degree of coalification
and/or the stage of alteration. Figure 1.8 shows simplified classifications of coals by rank.[10,
41]
Understanding the different types of water associated with the fine particles is important
to improve the performance of the dewatering process. Water exists in coal in different states:
surface, free, inherent, or capillary water. The inherent water moisture is often defined as the
Figure 1.8 Simplified classifications of coals by rank
Pores OH COOH Mineral Matter
Figure 1.7 Coal structure
19
water that is not readily removable by mechanical methods, chemically bound to the particle, and
which is a part of the particle. It is also generally known as intra-particle moisture. This is
extensively seen in the structure of low rank coals, such as lignite, and it can only be removed by
thermal drying methods (over 100oC). The capillary water is trapped in small channels of the
filter cake, which, again, requires more complex and intensive methods for removal. Free water,
which is not associated with solids and behaves thermodynamically as pure water occupying the
bulk of the slurries, can be removed by any means of mechanical dewatering. Screens,
thickeners, cyclones, and centrifuges are widely-used tools to remove this type of water.[23, 24,
26, 38, 41, 56]
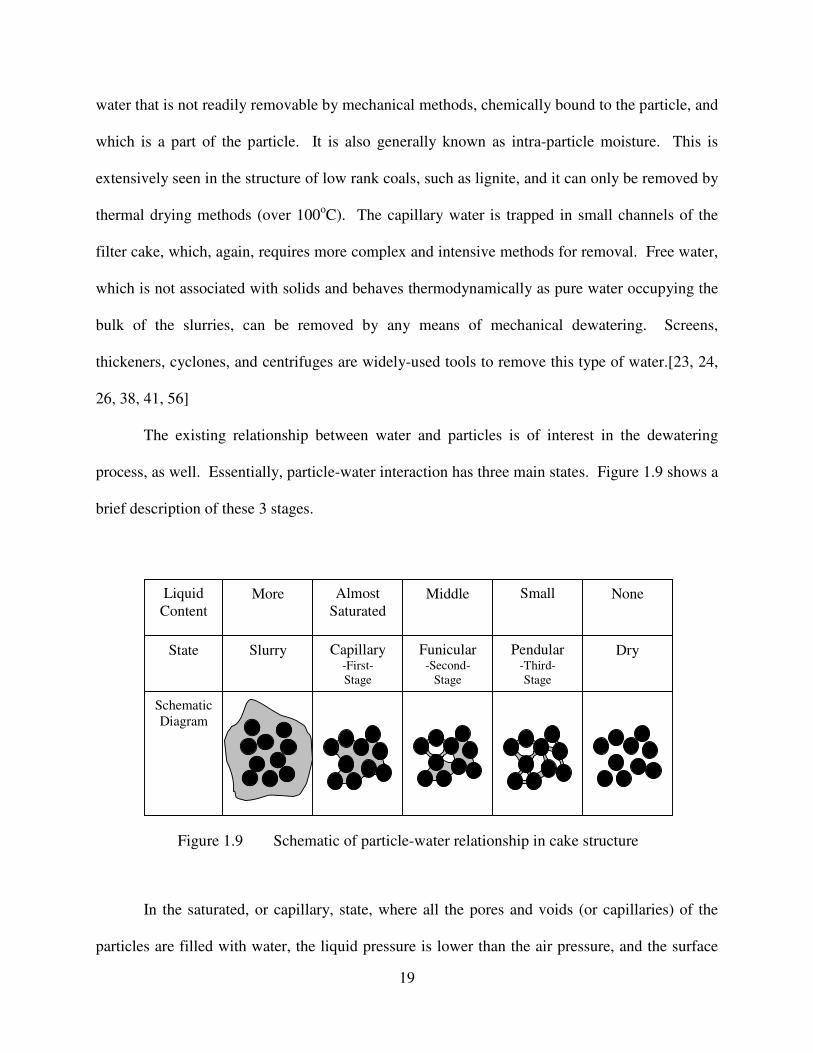
The existing relationship between water and particles is of interest in the dewatering
process, as well. Essentially, particle-water interaction has three main states. Figure 1.9 shows a
brief description of these 3 stages.
In the saturated, or capillary, state, where all the pores and voids (or capillaries) of the
particles are filled with water, the liquid pressure is lower than the air pressure, and the surface
Figure 1.9 Schematic of particle-water relationship in cake structure
Liquid
Content
State
Schematic
Diagram
More Almost
Saturated
Middle Small
None
Slurry Capillary -First-
Stage
Funicular -Second-
Stage
Pendular -Third-
Stage
Dry
20
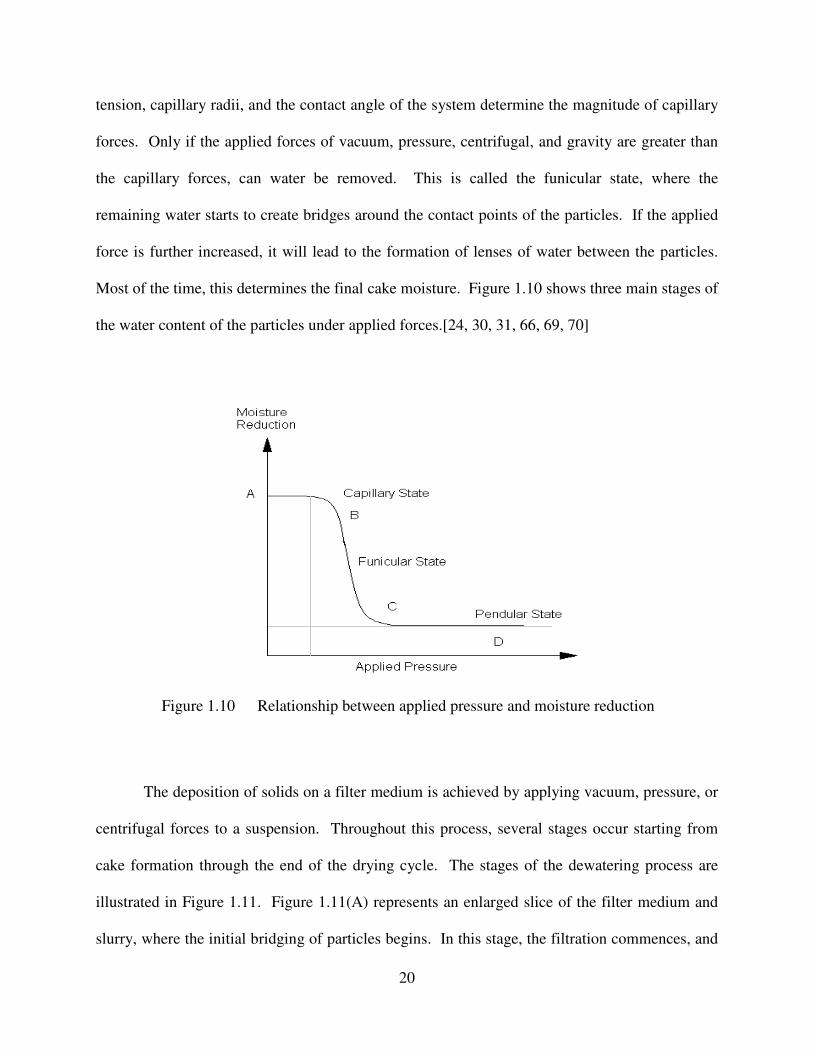
tension, capillary radii, and the contact angle of the system determine the magnitude of capillary
forces. Only if the applied forces of vacuum, pressure, centrifugal, and gravity are greater than
the capillary forces, can water be removed. This is called the funicular state, where the
remaining water starts to create bridges around the contact points of the particles. If the applied
force is further increased, it will lead to the formation of lenses of water between the particles.
Most of the time, this determines the final cake moisture. Figure 1.10 shows three main stages of
the water content of the particles under applied forces.[24, 30, 31, 66, 69, 70]
The deposition of solids on a filter medium is achieved by applying vacuum, pressure, or
centrifugal forces to a suspension. Throughout this process, several stages occur starting from
cake formation through the end of the drying cycle. The stages of the dewatering process are
illustrated in Figure 1.11. Figure 1.11(A) represents an enlarged slice of the filter medium and
slurry, where the initial bridging of particles begins. In this stage, the filtration commences, and
Figure 1.10 Relationship between applied pressure and moisture reduction
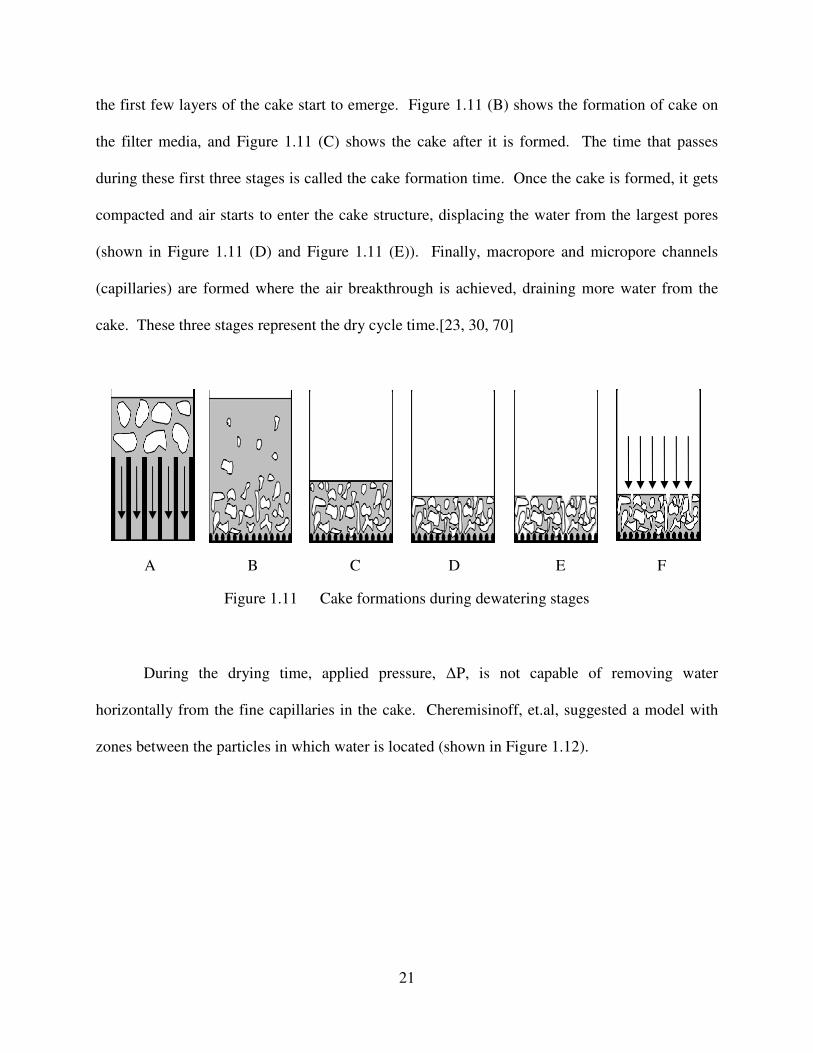
21
the first few layers of the cake start to emerge. Figure 1.11 (B) shows the formation of cake on
the filter media, and Figure 1.11 (C) shows the cake after it is formed. The time that passes
during these first three stages is called the cake formation time. Once the cake is formed, it gets
compacted and air starts to enter the cake structure, displacing the water from the largest pores
(shown in Figure 1.11 (D) and Figure 1.11 (E)). Finally, macropore and micropore channels
(capillaries) are formed where the air breakthrough is achieved, draining more water from the
cake. These three stages represent the dry cycle time.[23, 30, 70]
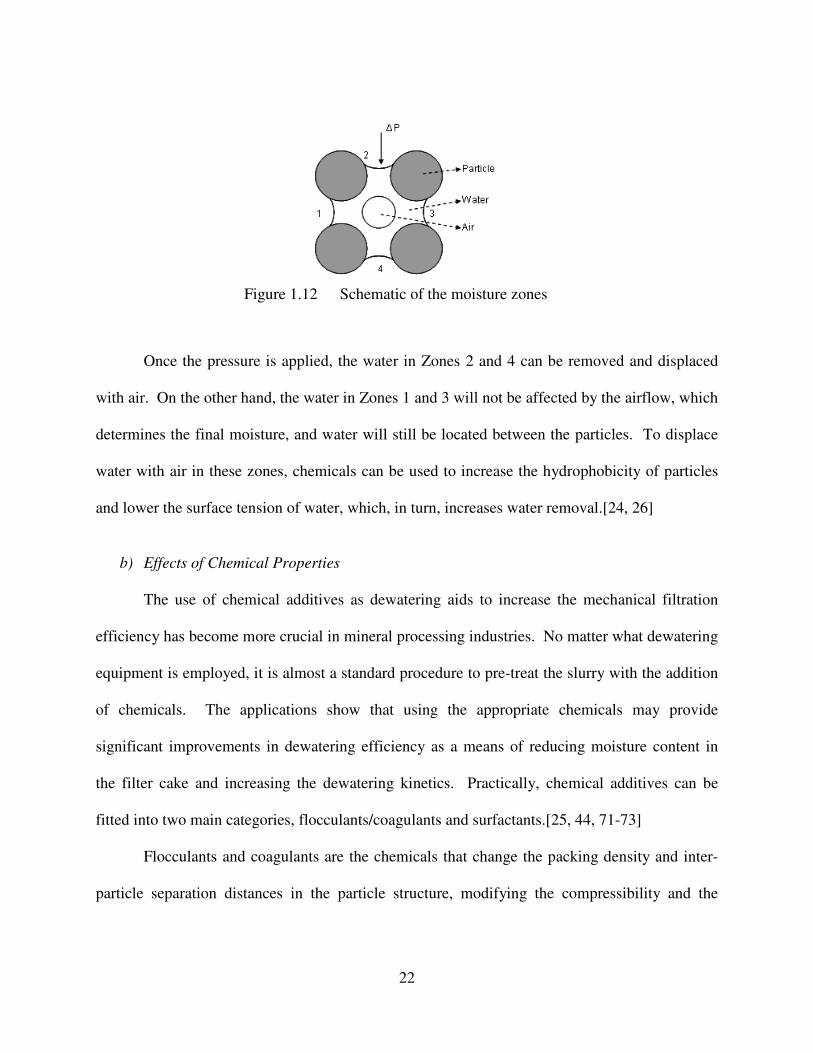
During the drying time, applied pressure, ∆P, is not capable of removing water
horizontally from the fine capillaries in the cake. Cheremisinoff, et.al, suggested a model with
zones between the particles in which water is located (shown in Figure 1.12).
A B C D E F
Figure 1.11 Cake formations during dewatering stages
22
Once the pressure is applied, the water in Zones 2 and 4 can be removed and displaced
with air. On the other hand, the water in Zones 1 and 3 will not be affected by the airflow, which
determines the final moisture, and water will still be located between the particles. To displace
water with air in these zones, chemicals can be used to increase the hydrophobicity of particles
and lower the surface tension of water, which, in turn, increases water removal.[24, 26]
b) Effects of Chemical Properties
The use of chemical additives as dewatering aids to increase the mechanical filtration
efficiency has become more crucial in mineral processing industries. No matter what dewatering
equipment is employed, it is almost a standard procedure to pre-treat the slurry with the addition
of chemicals. The applications show that using the appropriate chemicals may provide
significant improvements in dewatering efficiency as a means of reducing moisture content in
the filter cake and increasing the dewatering kinetics. Practically, chemical additives can be
fitted into two main categories, flocculants/coagulants and surfactants.[25, 44, 71-73]
Flocculants and coagulants are the chemicals that change the packing density and inter-
particle separation distances in the particle structure, modifying the compressibility and the
Figure 1.12 Schematic of the moisture zones
23
drainage features of the formed cake. Surfactants, on the other hand, are long-chain polymers
that are absorbed between two surfaces in order to change the surface properties. [25, 44, 71-73]
Coagulants or inorganic salts (electrolytes), such as aluminum, copper, chromic, and
ferric and calcium sulfates (or chlorides) affect the composition and the extent of the electrical
double layer surrounding the particles. They also change the zeta potential of the particles, as
well as the inter-particle electrostatic repulsion, which in turn lead to coagulation.[20, 21, 74, 75]
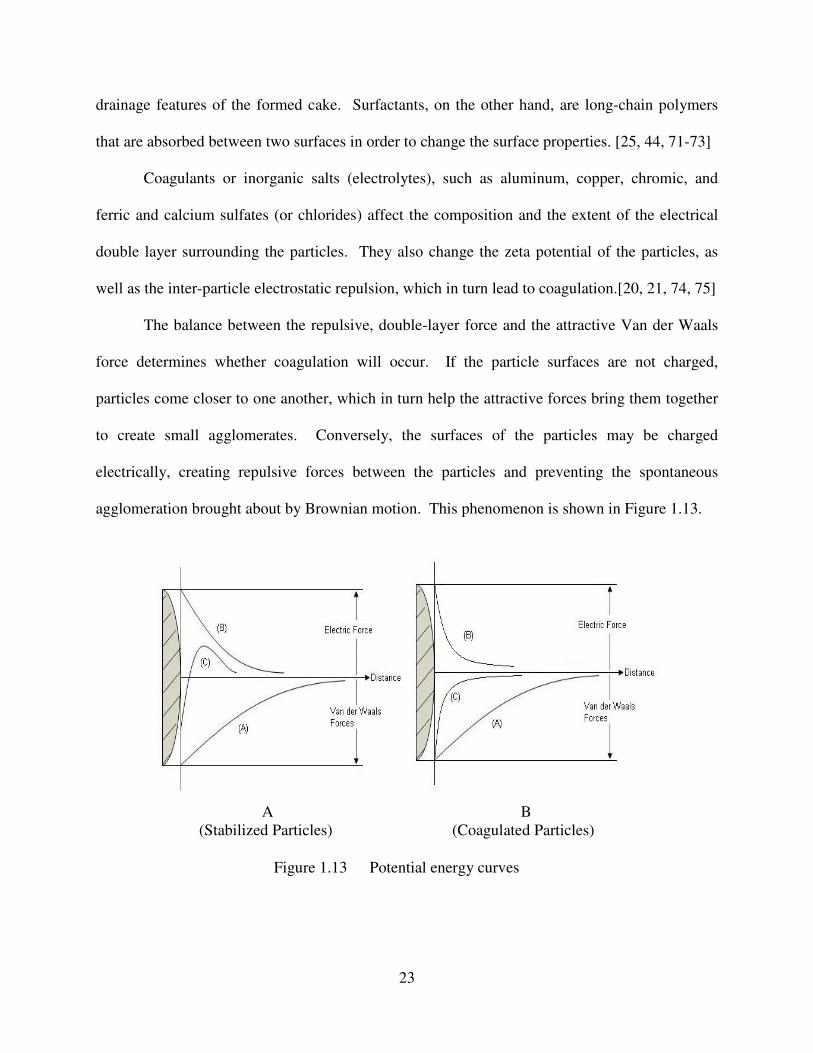
The balance between the repulsive, double-layer force and the attractive Van der Waals
force determines whether coagulation will occur. If the particle surfaces are not charged,
particles come closer to one another, which in turn help the attractive forces bring them together
to create small agglomerates. Conversely, the surfaces of the particles may be charged
electrically, creating repulsive forces between the particles and preventing the spontaneous
agglomeration brought about by Brownian motion. This phenomenon is shown in Figure 1.13.
A B
(Stabilized Particles) (Coagulated Particles)
Figure 1.13 Potential energy curves
24
The curve (A) in Figure 1.13 A represents Van der Waals energy. It is an attractive force
having an increasingly negative value, which is effective in small distances between particles.
Curve (B) represents the repulsive electrical force and curve (C) is the outcome of these two
forces, showing the maximum energy barrier for the colloidal system to become steady. At this
point, because the resultant force is repulsive, coagulation does not occur. To allow the
agglomeration to take place, chemical additives can be used to change the surface charge in favor
of Van der Waals forces. Figure 1.13 B shows the changes on the particle surface when
coagulant is introduced to the system. It reduces the electrical force and brings the curve (B) to
lower values. This causes the resultant curve (C) to fall below zero and allows the particles to
coagulate – if they come close enough – and the Van der Waals forces can be effective.[20, 31,
58, 71, 73, 74, 80]
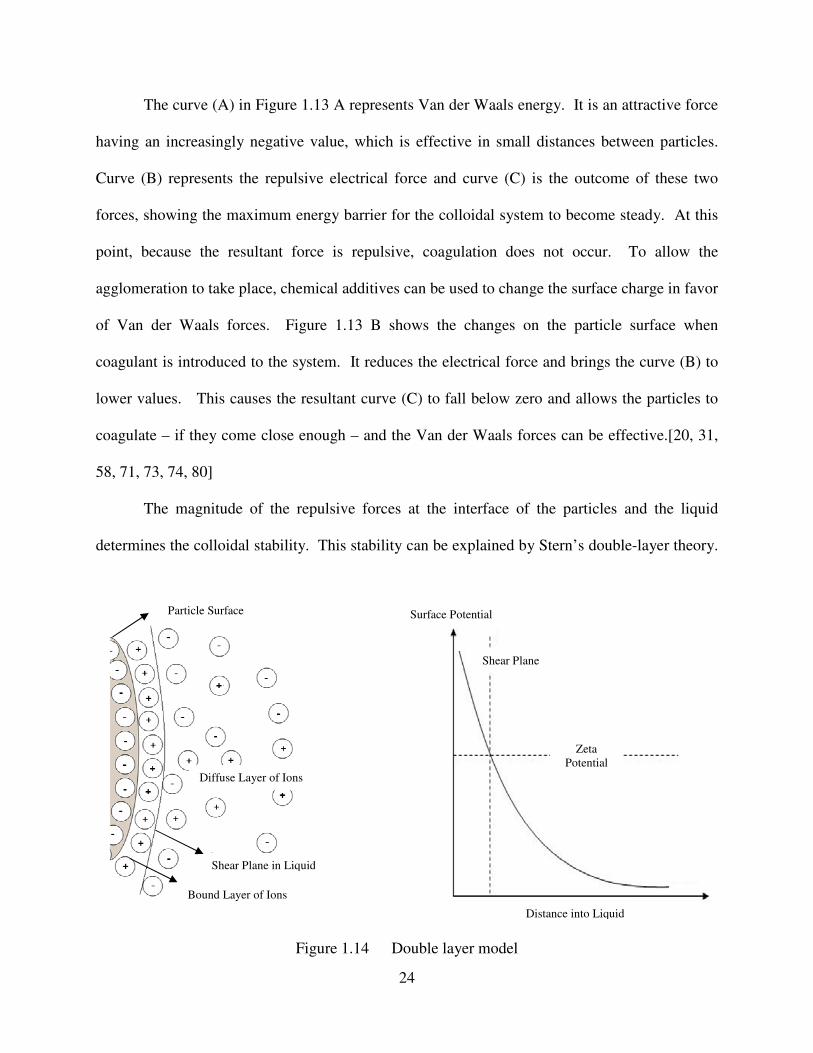
The magnitude of the repulsive forces at the interface of the particles and the liquid
determines the colloidal stability. This stability can be explained by Stern’s double-layer theory.
Particle Surface
Diffuse Layer of Ions
Shear Plane in Liquid
Bound Layer of Ions
Zeta
Potential
Shear Plane
Distance into Liquid
Surface Potential
Figure 1.14 Double layer model
25
The suspended particles, having a certain type of charge in an electrolyte solution, attract the
ions of opposing charges from the liquid, repel the ions that have similar charges, and develop an
electrical double layer of ions as shown in Figure 1.14. The ions that are located in the inner
stratum of the double layer are more strongly bound, and the ions that are located in the outer
stratum are weaker and more diffuse. The electrical potential between these two stratums is
called the zeta potential.[21, 50, 58, 71, 72, 80]
The ions of a coagulant compress the double layer by bringing the charges within the
plane of shear between the bound and the diffuse layers. This compression becomes more
effective when multivalent ions are in solution because they have greater charge concentration.
As a result, the zeta potential is decreased. The minimum ionic concentration required to
produce coagulation and its overall effect is described by the Shulze-Hardy rule. According to
the Shulze-Hardy rule, to start coagulation the minimum ionic concentration must be
proportional to the sixth power of reciprocal counter ion charge. The Al3+
, Fe3+
, and Ca2+
ions
are the commonly used ions as coagulants. The pH level of the slurry is important for the
hydrolysis of these salts. pH values of a slurry that are above or below the effective pH value
range for a given specific salt, or coagulant, may not allow hydrolysis, and chemical dosage
requirements may be higher than the ideal dosage.[21, 50, 58, 71, 72, 80]
Flocculants are long-chain polymers, or electrolytes, that cause the particles to aggregate
by forming bridges between particles. Typically, flocculants are categorized into two groups:
natural and synthetic. [71, 81]
Natural polymers, such as starches, gums, alginates, and polysaccharides, are mostly
short-chain, neutral, organic compounds. The effectiveness of these polymers is dependent on
the pH of the slurry as well. At alkaline and neutral conditions, polysaccharides are more
26
effective while, gums, alginates, and starches are more effective at acidic conditions. Because
natural polymers that are used as flocculants have short, rigid chain structure and low bonding
strength, their shear strength is very low. Thus, for flocculation applications, excessive amounts
of these polymers may be needed. In recent times, synthetic polymers, or polyelectrolytes, have
displaced these natural materials, as these polymers can be designed to give desired behaviors,
such as providing more durable flocs and more economical dosages when applied to a particular
problem.[25, 58, 77, 78, 80, 83]
The synthetic polymers are based on polyacrylamide or one of its derivatives that may
have very large polymer chains. These chains consist of anionic, cationic, or neutral groups,
causing the polymer to uncoil and bond to the surface of the coal or clay minerals. This may
result in a desired or undesired selectivity. Polymers with long chains have more contact with
particles and produce large and open floccules. However, they have low shear strength and
contain high residual moistures. In contrast, shorter and lesser-charged polymers generate more
compact granular floccules and improve the filtration characteristics. The high shear forces due
to dewatering methods might reduce the effectiveness of flocculation on fine particle dewatering.
When the flocculants/polymers in solution are introduced to the slurry, they work in two stages:
ion, or charge, neutralization and bridging. Although, the exact absorption mechanism is still not
fully understood, initial adsorption occurs by strong bonding between the polymer and the solid
particles. It involves a molecular bridge, or a series of bridges, between polymer and the solid
particles. The polymer chain from the solution adsorbs onto the solid particles and, when the
extended part of the chain or particles come close enough, creates bridges and continues to
adsorb onto the other particles. These basic floccules grow by bridging with other solid particles
until a most favorable floc size is formed. This is a quick and, unlike coagulation, irreversible
27
reaction, which again, needs low heat rates to avoid breaking the molecular bridges in order to
initiate a fast settling of solid. The use of flocculants can increase the filtration rate, as well as
the cake thickness, by several multiples. The combined use of anionic and cationic flocculants
exhibits further improvements. It is also reported that anionic flocculant is more effective in
promoting fine coal dewatering than cationic flocculant in vacuum filtration. On the other hand,
cationic flocculant was more effective in high shear centrifugal filtration. The positive increase
in kinetics is, however, accompanied by an increase in moisture content resulting from water
being trapped in the agglomerate structure. In addition, it was observed that the use of
flocculants increased final cake moisture due to increased kinetics, thicker filter cake, and water
trapped in the agglomerate structure.[25, 30, 50, 54, 58, 72, 73, 77, 78, 80, 82, 83]
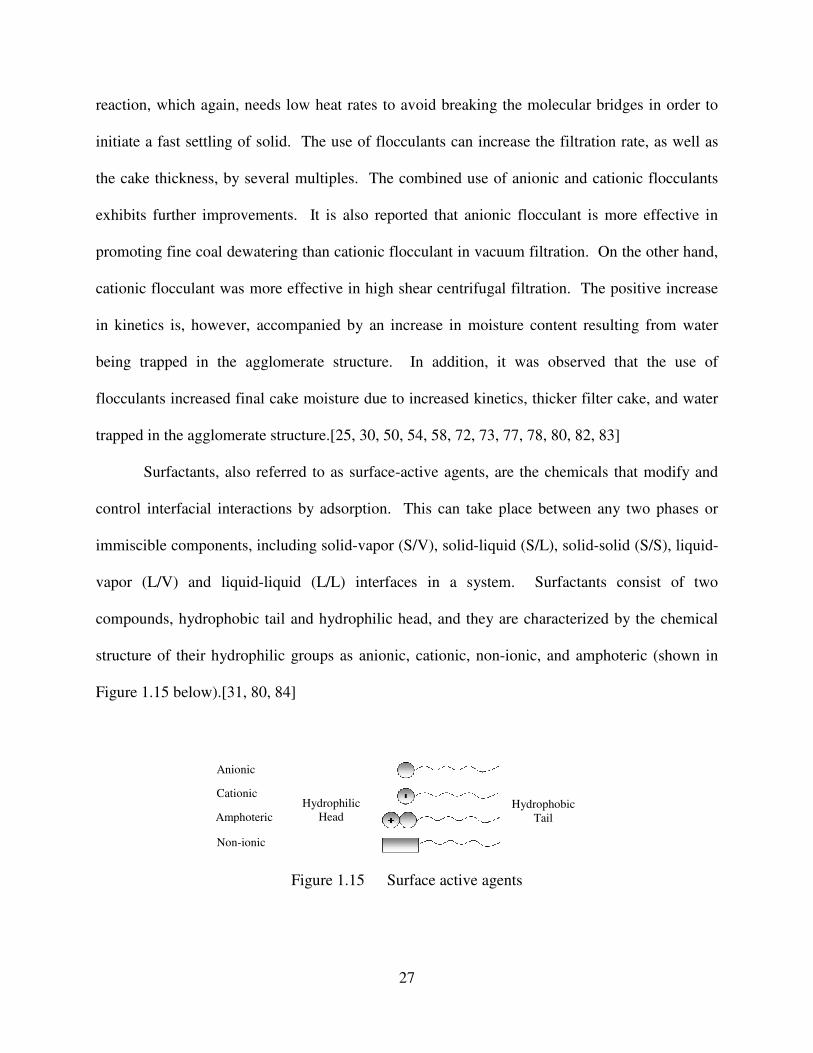
Surfactants, also referred to as surface-active agents, are the chemicals that modify and
control interfacial interactions by adsorption. This can take place between any two phases or
immiscible components, including solid-vapor (S/V), solid-liquid (S/L), solid-solid (S/S), liquid-
vapor (L/V) and liquid-liquid (L/L) interfaces in a system. Surfactants consist of two
compounds, hydrophobic tail and hydrophilic head, and they are characterized by the chemical
structure of their hydrophilic groups as anionic, cationic, non-ionic, and amphoteric (shown in
Figure 1.15 below).[31, 80, 84]
Cationic
Anionic
Amphoteric
Non-ionic
Hydrophilic
Head
Hydrophobic
Tail
Figure 1.15 Surface active agents
28
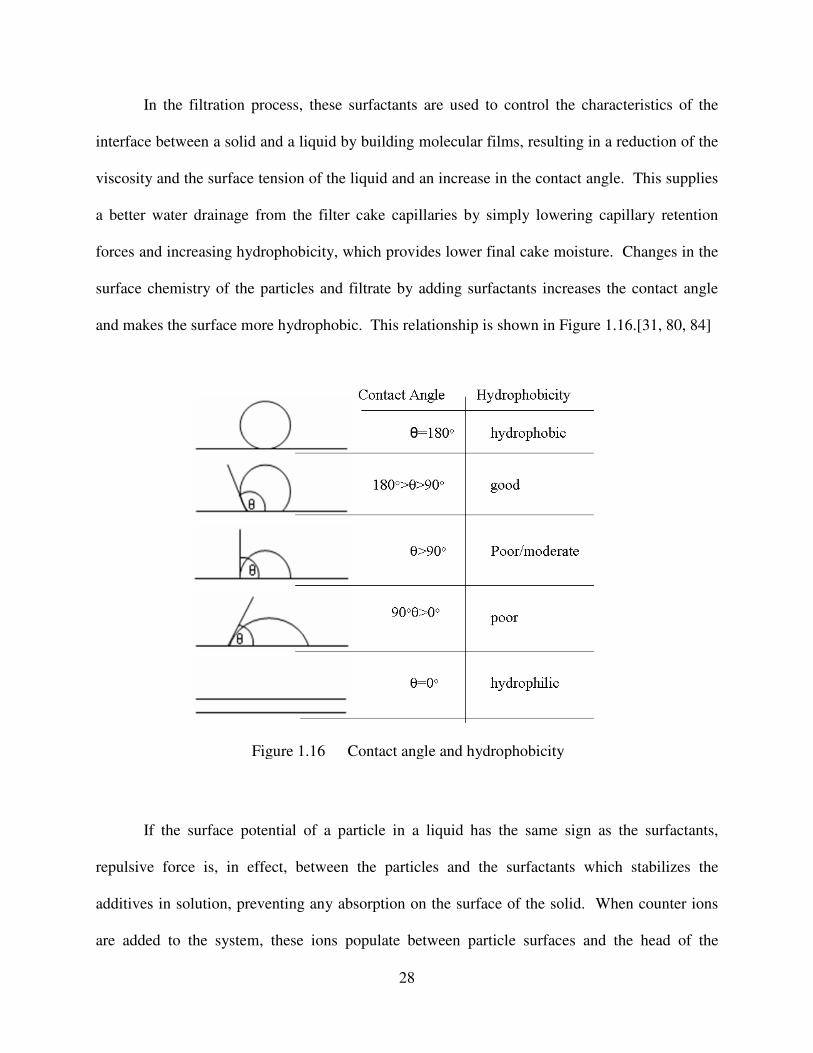
In the filtration process, these surfactants are used to control the characteristics of the
interface between a solid and a liquid by building molecular films, resulting in a reduction of the
viscosity and the surface tension of the liquid and an increase in the contact angle. This supplies
a better water drainage from the filter cake capillaries by simply lowering capillary retention
forces and increasing hydrophobicity, which provides lower final cake moisture. Changes in the
surface chemistry of the particles and filtrate by adding surfactants increases the contact angle
and makes the surface more hydrophobic. This relationship is shown in Figure 1.16.[31, 80, 84]
If the surface potential of a particle in a liquid has the same sign as the surfactants,
repulsive force is, in effect, between the particles and the surfactants which stabilizes the
additives in solution, preventing any absorption on the surface of the solid. When counter ions
are added to the system, these ions populate between particle surfaces and the head of the
Figure 1.16 Contact angle and hydrophobicity
29
surfactant, allowing adsorption. The adsorption occurs in two ways: ion exchange and ion
pairing. Ion exchange happens when the surfactant molecules are placed on the charged side of
particles which have not been occupied by the counter ions. In ion pairing, the surfactant
molecules displace the charge of the same counter ions and stay on the surface. Based on the
orientation of the surfactant molecules, the surface chemistry of the particles changes, and
becomes hydrophobic or hydrophilic. Depending on the surfactant concentration, the formation
of the additives forms either a neutralized monolayer or reversed, secondary bilayer (shown in
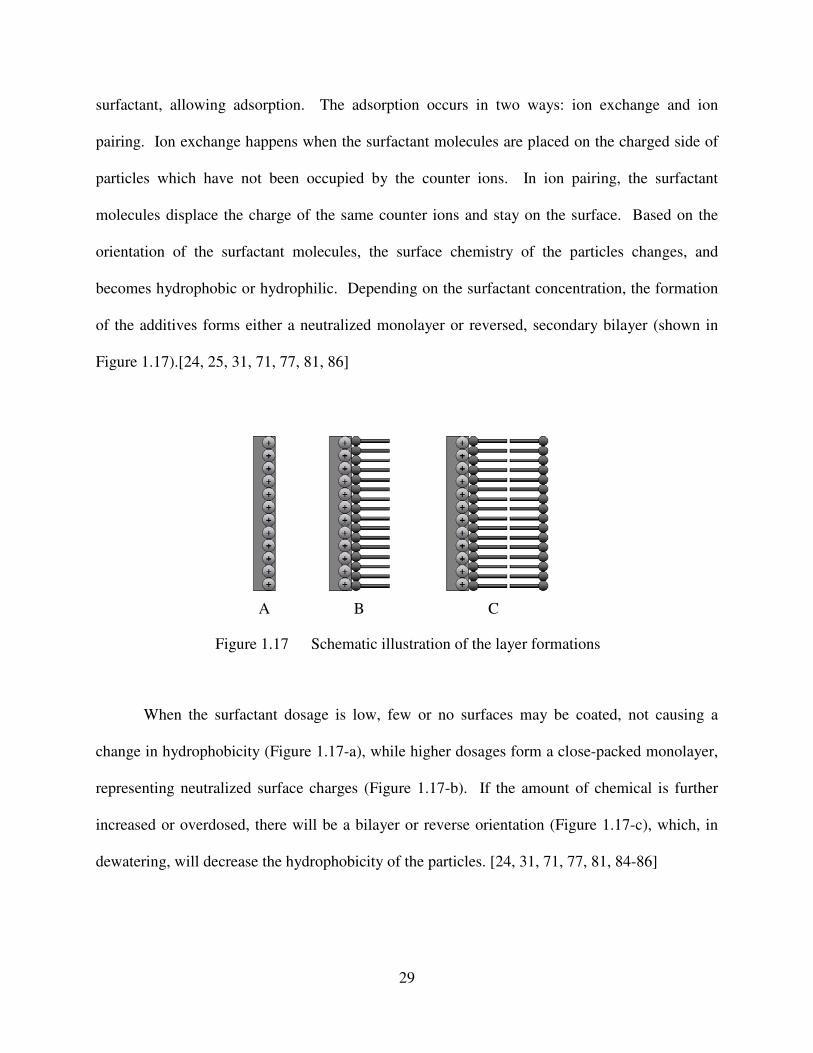
Figure 1.17).[24, 25, 31, 71, 77, 81, 86]
When the surfactant dosage is low, few or no surfaces may be coated, not causing a
change in hydrophobicity (Figure 1.17-a), while higher dosages form a close-packed monolayer,
representing neutralized surface charges (Figure 1.17-b). If the amount of chemical is further
increased or overdosed, there will be a bilayer or reverse orientation (Figure 1.17-c), which, in
dewatering, will decrease the hydrophobicity of the particles. [24, 31, 71, 77, 81, 84-86]
A B C
Figure 1.17 Schematic illustration of the layer formations
30
Polyelectrolytic polymers are highly charged, short-chain polymers that are used when
the solid content is very low. These types of polymers are used when the flocculants cannot be
effectively employed.[24, 31, 38]
1.2.5. Dewatering Theory
a) Dewatering Kinetics
Filtration kinetics is an important characteristic of fine particle dewatering that
determines the volumetric flow rate of liquid to be removed through a porous media created by
the particles and the filter throughput. Darcy first described the filtration kinetics in 1856 as the
rate equation for the dewatering process. Darcy’s basic filtration equation relating the flow rate
is [20, 26, 44, 88] :
L
PAK
dt
dV ∆=
η [1]
where V is the volume of fluid, t is the filtration time, ∆P is the pressure drop across the cake,
and L is the thickness. A is the cross-sectional area of the cake, η is the absolute viscosity of
liquid, and K is the rate constant referred to as the permeability of the cake. The equation reveals
a basic relationship; the rate of dewatering is proportional to the pressure gradient and the cross-
sectional area and is inversely proportional to the viscosity. Equation [1] is also written in the
form:
R
PA
dt
dV ∆=
η [2]
where R is the medium resistance (the medium thickness is divided by the permeability of the
cake). If the suspension does not include any solid particles, all the parameters in Equations [1]
and [2] will be independent of filtration time, t. This will result in a constant filtration rate for a
31
constant pressure drop. It also represents a linear increase of the cumulative filtrate volume;
however, if the suspension contains particles, resistance of the cake will increase gradually with
time and lead to a drop in the flow rate.[20, 22, 26, 39, 44, 88]
In batch filtration, resistance has two components, medium resistance, R, which can be
assumed constant, and cake resistance, Rc, which increases with time as a result of increase in
cake thickness (shown in Equation [3]).
)(
cRR
PA
dt
dV
+
∆=
η [3]
If the resistance of the cake is assumed to be directly proportional to the amount of cake
deposited (w), then
wRc α= [4]
where α is the specific cake resistance.
The mass of cake deposited is a function of time (t) and can be related to the accumulated
filtrate volume, V by
cVwA = [5]
where c is the concentration of solids in the system (mass per unit volume of the filtrate). By
integrating and rearranging Equations [3], [4] and [5], the general filtration equation can be
reached. The general filtration equation, Equation [6], is shown:
PA
RV
PA
c
dV
dt
∆+
∆=
ηαη22
[6]
The fundamental filtration parameters, such as α and R, can be determined to evaluate the
effects of different conditions on filtration kinetics. The filtration kinetics can be altered using
chemical additives, which change filter cake properties, such as permeability (K), cake porosity
(ε), and the specific surface area of particles (S). [20, 22, 26, 39, 44, 88]
32
According to Kozeny, the factors that affect permeability are the size of the particles
making up the porous medium and the porosity. The Kozeny equation is related to the specific
cake resistance α by
α
ε
ε1
)1(2
3
2=
−
=
kS
K [7]
Normally, the Kozeny constant has the value of 5 in fixed or slowly moving-beds and
3.36 in settling or rapidly-moving beds, but for many industrial applications, k is often greater
than 5. Equation [7] suggests that the cake permeability decreases with decreasing cake porosity
and specific surface area of particles, both of which decrease with decreasing the particle size.
Substituting Equation [7] into Darcy’s law gives the Kozeny-Carman equation:
L
P
kS
A
dt
dV ∆
−=
2)1(
3
εη
ε [8]
The filtration process is also related to the flow of liquid through a bundle of capillary
tubes, which is defined by the Poiseulle’s equation (1846):
L
Pr
dt
dV ∆=
η
π
8
4
[9]
where r is the radius of the capillary tubes.[26, 39, 44, 88]
33
b) Dewatering Thermodynamics
To remove the liquid located in these capillaries, it is important that the applied pressure
be larger than the capillary pressure, (p), which is defined by Laplace:
rp
θγ cos2 23= [10]
where, γ23 is the surface tension of liquid, and θ is the water contact angle. The Laplace equation
suggests that decreasing surface tension leads to a lower capillary force and improved cake
dewatering. Increasing the solid/liquid contact angle, θ, lowers the cosθs, and as a result, it
decreases the capillary force. This controls the water removal from the cake.[25, 31, 39]
By using an appropriate surface-active reagent, it is possible to hydrophobize the surface,
decrease γ23, and increase contact angle by absorption in such a way that its hydrophobic part is
oriented away from the surface. The Young’s Equation describes the relationship between the
solid/liquid contact angle and the work of adhesion, a measure of how strongly water is bound by
the solid surface: [44, 71, 89]
122313 cos γθγγ += [11]
where θ is the solid/liquid contact angle, γ13 is the surface free energy of the solid/air interface,
γ23 is the surface free energy of water/air interface, and γ12 is the surface free energy of the
solid/water interface. The free energy change per unit area, ∆G/dA, is determined by the
following equation in a solid/liquid/air system. This is also known as the Dupre equation.[31,
44, 71, 89]
34
122313 γγγ −+==dA
dGWadh [12]
By substituting Equation [11] into [12], the following relationship can be obtained
(Young-Dupre Equation):
)cos1(23 θγ +=adhW [13]
The Young-Dupre equation suggests that the work of adhesion between solid and liquid
can be calculated from the liquid surface tension and the contact angle. The spontaneous
hydrophobization and effect of contact angle is illustrated in Figure 12, where A is the solid, B is
the liquid, and C is the air. [31, 44, 71, 90]
For a completely hydrophilic surface, θ12=0o, cosθ12=1, and Wadh will be at their
maximum values. On the contrary, for a completely hydrophobic surface, θ12=180o, cosθ12=0,
and Wadh will be at their minimum values. This, in summary, suggests that for a dewatering
process, the work done on a hydrophilic solid surface can be minimized by simply decreasing
water/air surface tension and increasing the contact angle, as seen in Figure 12.[31, 44, 71, 89]
Novel dewatering aids introduced in this study are non-ionic, low hydrophile-lipophile
balance (HLB) number surfactants. The surfactant molecules adsorb on a hydrophobic solid
surface, such as coal, as a result of hydrophobic attraction and, thus, increase its contact angle.
C B A
Figure 1.18 Schematic representation of solid/liquid/air interfaces
γsv γsl γsl γsv θ θ
γlv γlv

35
They also are capable of lowering surface tension, and enlarging capillary radius, all of which
should contribute to decreasing capillary pressure and improving dewatering.
36
1.2.6. Research Objectives
The objectives of the work herein are to:
• Determine the technical and economic effectiveness of using novel dewatering
aids to reduce the moisture content of fine-particle coal samples from various
sites;
• Compare the results of laboratory- and pilot-scale experiments utilizing the aids to
investigate if scale-up is possible;
• Use laboratory test results to formulate an empirical model for vacuum filtration
systems, and then simulate filtration under a variety of operating parameters;
• Demonstrate the capabilities of the novel dewatering aids at full-scale to evaluate
the feasibility of implementation; and
• Evaluate the effectiveness of two new dewatering methods – two-step
hydrophobization in the presence of the novel aids, and foam-aided dewatering –
to reduce the moisture of other fine-particle industrial minerals.
37
REFERENCES
1. Administration, E.I. Official Energy Statistics from the U.S Government. 2009
Available from: http://www.eia.doe.gov/.
2. Energy, U.S.D.O., Clean Coal and Natural Gas Power Systems. 2009
Available from: http://www.energy.gov/energysources/coal.htm.
3. Journal, Oil & Gas. 2009
Available from: http://www.ogj.com/index.cfm.
4. British Petroleum. Statistical Review of World Energy. 2007
Available from: http://www.bp.com
5. Association, National Mining. 2009
Available from: http://www.nma.org/.
6. Wills, B.A., Coal Preparation Technology: D.G. Osborne Graham & Trotman Ltd, 1988.
p. 374-375.
7. Rice, N.M., Mineral Processing Technology: by B.A. Wills, 1984
Second Edition Volume 29, p. 134-135.
8. 96/03533 Coal preparation. Fuel and Energy Abstracts, 1996
37(4), p. 252.
9. P. Somasundaran, Advances in Mineral Processing. 1986
Littleton: The Society of Mining Engineers of AIME. 756.
10. D.R. Mitchell, Coal preparation, 1950
New York: Institute of Mining and Metallurgical Engineers
11. Gy, P., Mineral Processing 1979:
Proceedings of the Thirteenth International Mineral Processing Congress, Warsaw
Edited by Prof. J. Laskowski. 9(3): p. 299-300.
12. Pradip, Selected Topics In Mineral Processing, 1995
New Delhi:
13. 95/00081. The Future of Coal Preparation. Fuel and Energy Abstracts, 1995.
36(1): p. 6.
14. Y.A. Liu, The Physical Cleaning of Coal: Present and Developing Methods. 1982
Volume 17 p.551. 1982, New York
38
15. Xu, Z., Mineral Processing Technology (5th edition) 1994.
7(2-3): p. 427-428.
16. Wakeman, R.J., Vacuum Dewatering and Residual Saturation of Incompressible Filter
Cakes. International Journal of Mineral Processing, 1976. 3(3): p. 193-206.
17. A survey of coal cleaning technologies (Coal Preparation). Fuel and Energy Abstracts,
2002. 43(1): p. 9.
18. B.K. Parekah, J.D. Miller, Advances in Flotation Technology, 1999
Society for Mining, Metallurgy, and Exploration. p.463.
19. 99/02473 Dewatering/Reconstitution of Fine Clean Coal Slurry
Fuel and Energy Abstracts, 1999. 40(4): p. 260.
20. Solid-Liquid Separation. Filtration & Separation, 1994. 31(1): p. 51.
21. Coal Surface Control for Advanced Physical Fine Coal Cleaning Technologies. 1990,
Chemical and Petroleum Engineering Department, University of Pittsburgh
22. J. Gregory. Solid-Liquid Separation, New York: Ellis Horwood Limited 1984
23. D.J. Condie, M.H., and C.J. Veal, Modelling the Vacuum Filtration of Fine Coal.
Filtration & Separation, 1996.
24. Cheremisinoff, N.P., David S. Azbel, Liquid Filtration. 1983: Ann Arbor Science. 520.
25. Akers, R.J., Solid-Liquid Separation : ed. by L. Svarovsky, Butterworths, London, 1977
The Chemical Engineering Journal, 1978. 15(1): p. 77-79.
26. R. Wakeman, S. Tarleton. Solid-Liquid Separation: Principles of Industrial Filtration
2005. Oxford: Elsevier Advanced Technology. p.339.
27. R.A. Bott, T. Langeloh Solid-Liquid Separation Lexicon, 2002
28. Classification and Dewatering of Fine Coal Concentrates. Fuel and Energy Abstracts,
2002. 43(1): p. 10.
29. H.S. Muralidhara Advances in Solid-Liquid Separation, Columbus: Battelle Press 1986
30. Condie, D.J. and C.J. Veal, Modelling the Vacuum Filtration of Fine Coal: Part 2.
Filtration & Separation, 1997. 34(9): p. 957-963.
31. Asmatulu, R., Advanced Chemical-Mechanical Dewatering of Fine Particles, in Material
Science and Engineering. March 12, 2001, Virginia Polytechnic Institute and State
University: Blacksburg.
39
32. Ranj an, S. and Hogg, R.The Role of Cake Structure in the Dewatering of Fine Coal by
Filtration: Coal Prep., 1996, 17, (1-2), 71-87. Fuel and Energy Abstracts, 1998. 39(3):
p. 172.
33. Ivatt, S. and Shah, Dewatering of Fine Coal 138 pp. Fuel and Energy Abstracts, 1998.
39(3): p. 170.
34. Pechoc, J. Acta Mont., Ser. B, Kinetics of Filter Cakes Dewatering: 1996
Fuel and Energy Abstracts, 1998. 39(4): p. 250.
35. Improving the Vacuum Filtration of Fine Coal Using Simultaneous Dewatering and Size
Enlargement. Fuel and Energy Abstracts, 1998. 39(5): p. 334.
36. Yoon Roe-Hoan; Luttrell Gerald H Blacksburg, Method for Dewatering Particles: VA,
United States assigned to Virginia Tech Intellectual Property Inc. Journal of Cleaner
Production, 1997. 5(3): p. 232.
37. J. Yang. X. H. Wang and. K. Parekh Improved Approaches for Dewatering of Fine Coal.
Fuel and Energy Abstracts, 1996. 37(5): p. 334.
38. C. Orr, Matteson, Michael. Filtration: Principles and Practices. Chemical Processing and
Engineering Vol. 1. 1987
39. C. Orr. Filtration: principles and practices (in two parts). Chemical Processing and
Engineering, Vol. 2. 1977
40. Roe-Hoan Yoon, R.A., Ismail Yildirim, William Jansen, Jinming Zhang, Brad Atkinson,
and Jeff Havens, Development of Dewatering Aids for Minerals and Coal Fines,
Final Report to U.S.D.O.E 2004, Virginia Tech. Blacksburg, VA.
41. G., O.D., Coal Preparation Technology. London: Graham & Trotman. 1988,
42. Lockhart, N. C.; Kern, R. Research and Development Needs in Filtration and
Dewatering. 1997. 38(3): p. 194.
43. Palowitch, Eugene R. Coal Preparation in Appalachia. 1996. 37(4): p. 252.
44. Smith, M.R., Solid-Liquid Separation Process and Technology, 1985
42(11): p. 2802-2803.
45. Wakeman, R.J., Selection of Equipment for Solid-Liquid Separation Processes. 1995
Filtration & Separation, 32(4): p. 328.
46. El-Shall, H. and P. Zhang, Process for Dewatering and Utilization of Mining Wastes.
Minerals Engineering, 2004. 17(2): p. 269-277.
40
47. Evaluation of the influence of coal properties on dewatering results. Fuel and Energy
Abstracts, 1997. 38(3): p. 134.
48. Cake dewatering reduces transport costs. Filtration & Separation, 2001. 38(5): p. 10.
49. Fonseca, A.G., Challenges of Coal Preparation. Fuel and Energy Abstracts, 1996. 37(3):
p. 171.
50. D. J. Condie and C. J. Veal, Modeling the Vacuum Filtration of Fine Coal: part 2. Fuel
and Energy Abstracts, 1998. 39(1): p. 7.
51. Holdich, R.G., Solid-Liquid Separation Equipment Selection and Modelling. 2003. 16(2):
p. 75-83.
52. R. Wakeman, S. Tarleton, Solid-Liquid Separation: Equipment Selection and Process
Design, 2007,
53. Rahul Konnur, S.R, Parameter Estimation and Simulation of Dependence of Constant
Pressure Batch Dewatering on Initial Solids Concentration. International Journal of
Mineral Processing, 2006.
54. Apling, A., Mineral Processing Technology: B. A. Wills, Pergamon Press, Oxford
Corrosion Science, 1994. 36(4): p. 743-744.
55. Dickenson, T.C., Filters and Filtration Handbook. 1997: Elsevier
56. Society, T.S.A.C.P., Coal Preparation for Plant Operators. 1980:
57. R. Wakeman, S. Tarleton, Solid-Liquid Separation: Scale-up of Industrial Equipment.
2005
58. Hogg, R., Flocculation and Dewatering. International Journal of Mineral Processing,
2000. 58(1-4): p. 223-236.
59. Dewatering Equipment Database. Filtration & Separation, 2001. 38(8): p. 12.
60. Demir, I., Characterization of the Surface Properties of Illinois Basin Coals, in DOE
Technical Report, K.K. Ho, Editor. 1992.
61. Advanced Centrifuges for Solid-Liquid Separation and Liquid-Liquid Extraction.
Filtration & Separation, 1993. 30(2): p. 104-106.
62. Machado, A.F., Mineral Technology and Mineral Processing & Hydrometallurgy
Meetings. Filtration & Separation, 1993. 30(2): p. 123.
63. Lee, C.P.C.a.D.J., Experimental Analysis of Centrifugal Dewatering Process of
Polyelectrolyte Flocculated Waste Activated Sludge. 2001. 35(10).
41
64. Osborne, D.G., Rotary-Vacuum Filtration of Coal Flotation Concentrates. International
Journal of Mineral Processing, 1976. 3(2): p. 175-191.
65. A. Patwardhan, Y.P.C., Dewatering Ultrafine Clean Coal in a T.H. Filter Press. Coal
Preparation, 2006. 26.
66. B.K. Parekh, a.Z.C., Dewatering and Handleability. 2000, University of Kentucky:
Lexington, KY.
67. Mahidin, et al., The Advantages of Vacuum-Treatment in the Thermal Upgrading of
Low-rank Coals on the Improvement of Dewatering and Devolatilization. Fuel
Processing Technology, 2003. 84(1-3): p. 147-160.
68. A.H. Mwale, P.M., D.M. Fraser, The Influence of Particle Size on Energy Consumptions
and Water Recovery in Comminution and Dewatering Systems. Minerals Engineering,
2005. 18.
69. Bergins, C., Kinetics and Mechanism During Mechanical-Thermal Dewatering of
Lignite. 2003. 82(4): p. 355-364.
70. Parekh, D.P.P.a.B.K., Determination of Free and Bound Water in Fine Coal Filter Cake.
Coal Preparation, 2004(24): p. 217-232.
71. Yu, X. and P. Somasundaran, Colloid Chemistry in Mineral Processing : Edited by J.S.
Laskowski and J. Ralston, Development in Mineral Processing, 1994. 83(2): p. 183-184.
72. Tao, D., J.G. Groppo, and B.K. Parekh, Enhanced Ultrafine Coal Dewatering Using
Flocculation Filtration Processes. Minerals Engineering, 2000. 13(2): p. 163-171.
73. Moss, N.a.D., Brian, Flocculation: Theory & Application.
74. D.R. Skuse. Specialty Chemicals in Mineral Processing, 2002, Cambridge:
75. 99/00817 To enhance the dewatering of vacuum filter by adding surfactant reagent. Fuel
and Energy Abstracts, 1999. 40(1): p. 81.
76. L. Besra, D.K.S., S.K. Roy, P. Ay, Flocculation and Dewatering of Kaolin Suspensions in
the Presence of Polyacrylamide and Surfactants. International Journal of Mineral
Processing, 2002. 66.
77. Hogg, R., Colloid Chemistry in Mineral Processing : J.S. Laskowski and J. Ralston
(Editors), Vol. 12. Elsevier, Amsterdam, 1994. 41(1-2): p. 161-163.
78. S.R. Rao, Surface Chemistry of Froth Flotation.Vol. 1. 2004, New York:
42
79. Bimal P. Singh, The Role of Surfactant Adsorption in the Improved Dewatering of Fine
Coal., 2000. 41(4): p. 195.
80. R. Laskowski, Colloid Chemistry in Mineral Processing, 1992, New York:
81. Singh, B.P., The Influence of Surface Phenomena on the Dewatering of Fine Clean Coal.
Filtration & Separation, 1997. 34(2): p. 159-163.
82. B. P. Singh, L. Besra, P. S. R. Reddy and D. K. Sengupta, Use of surfactants to aid the
dewatering of fine clean coal. 1999. 40(1): p. 11.
83. Hans Saveyn, G.P., Rik Timmerman, Paul Van der Meeren, Effect of Polyelectrolyte
Conditioning on the Enhanced Dewatering of Activated Sludge by Application of an
Electric Field During the Expression Phase. Water Research, 2005. 39.
84. B.P. Singh, L.B., P.S.R. Reddy and D.K. Sengupta, Use of Surfactants to Aid the
Dewatering of Fine Clean Coal. 1998. 77(12).
85. Wheelock, J.D.a.T.D., Air-promoted Oil Agglomeration of Moderately Hydrophobic
Coals. DOE/PC/93209--T10, 1996.
86. Pearse, M.J., Historical Use and Future Development of Chemicals for Solid-Liquid
Separation in the Mineral Processing Industry. Minerals Engineering, 2003. 16.
87. Mwaba, C.C., Surfactant-enhanced Dewatering of Graphite and Hematite Suspensions.
Minerals Engineering, 1991. 4(1).
88. Svarovsky, Solid-Liquid Separation. 1991, London: Butterworth.
89 Yoon, R.H., Advanced Mineral Processing-Fundamentals of Flotation Chemistry, in
MinE 5045 Notes. 2002.
43
CHAPTER 2 LABORATORY AND PILOT SCALE EVALUATION OF
DEWATERING AIDS
2.1. INTRODUCTION
The fine size coal production has increased as a result of several factors. These factors
can be broadly explained as follows[1, 2];
i) The mechanized ROM coal production methods have increased the fine coal
production
ii) The coal produced, for both coking and power industries, has to meet with certain
quality constraints, such as calorific value, ash, sulfur and moisture content. To
meet these requirements and produce a higher quality product, the raw material
should be crushed to a lower top size for improved liberation.
iii) The possibility of economical recovery of fine size fraction of coal that reports to
plants’ discard streams
iv) Recovery of the fine/ultrafine coal from the waste ponds which represents an
economically viable resource
Froth flotation is the widely used and the most effective separation method for fine coal
cleaning. It is a wet process and the separation results in two products in the form of slurry, i.e.
the concentrate (coal) and the tailing (ash-forming minerals). Of the products, the tailings are
discarded to the waste ponds and the coal is further processed before it reaches to the final
consumer.[2-4]
In processing plants, clean coal is dewatered by means of filters, such as vacuum disc,
horizontal belt and drum filters, and centrifuges. However, the larger surface area of fine/ultra
fine particles per mass results in more water adsorption. Additionally, the fine particles create
44
smaller size capillaries in the filter cake from which water cannot be removed easily during the
application of vacuum or air pressure. As a result, these dewatering methods cannot produce the
desired moisture levels if there is not a thermal drier. Therefore, fine coal dewatering is the most
difficult and costly operation in preparation plants.[5, 6]
Previous studies on fine coal dewatering addressed the problem and a number of
dewatering aids were developed to lower the final cake moisture to the extent that is not
achievable by mechanical means. In this study, laboratory and pilot scale tests were conducted
on a variety of fine coal samples to do engineering evaluation of these dewatering aids; and
possible industrial applications have been investigated.
2.2. GENERAL EXPERIMENTAL DETAILS
2.2.1. Samples
Laboratory- and pilot-scale dewatering tests were conducted on various samples
comprised of different mixtures of coarse and fine coal. Following are the samples that were
used in these tests:
i) Flotation feed (cyclone overflow or underflow)
ii) Flotation product
iii) Filter feed (blend of flotation and spiral products)
These samples were received from different preparation plants located in North America
region. Table 2.1 shows the selected coal samples for the dewatering tests.
45
These samples were tested
i) as received, if the sample was directly collected from filter feed stream,
ii) after upgraded with flotation, if it was cyclone overflow or cyclone underflow,
iii) after blended at different ratios.
For laboratory dewatering tests, the samples were collected or received as coal slurry in 5
gallon buckets. To minimize the adverse effects of superficial oxidation of the coal samples, the
dewatering tests were conducted within 24-48 hours of receipt. The samples were first subjected
to solid content determination (% solid) and particle size distribution determination. When
flotation step was carried out, Denver D-12 flotation equipment was used, where kerosene and
MIBC were added as collector and frother, respectively. After dewatering aid addition, each
sample was conditioned with a stand-alone mixer to ensure a proper dispersion and adsorption of
the dewatering aids.
Table 2.1 Names of the operations and their locations from where the samples received for
dewatering aid evaluation tests
Operation Location
Mingo Logan West Virginia
Coal Clean West Virginia
Concord Alabama
Buchanan Virginia
Moatize Mozambique
Elkview BC, Canada
Pinnacle Reclamation Virginia
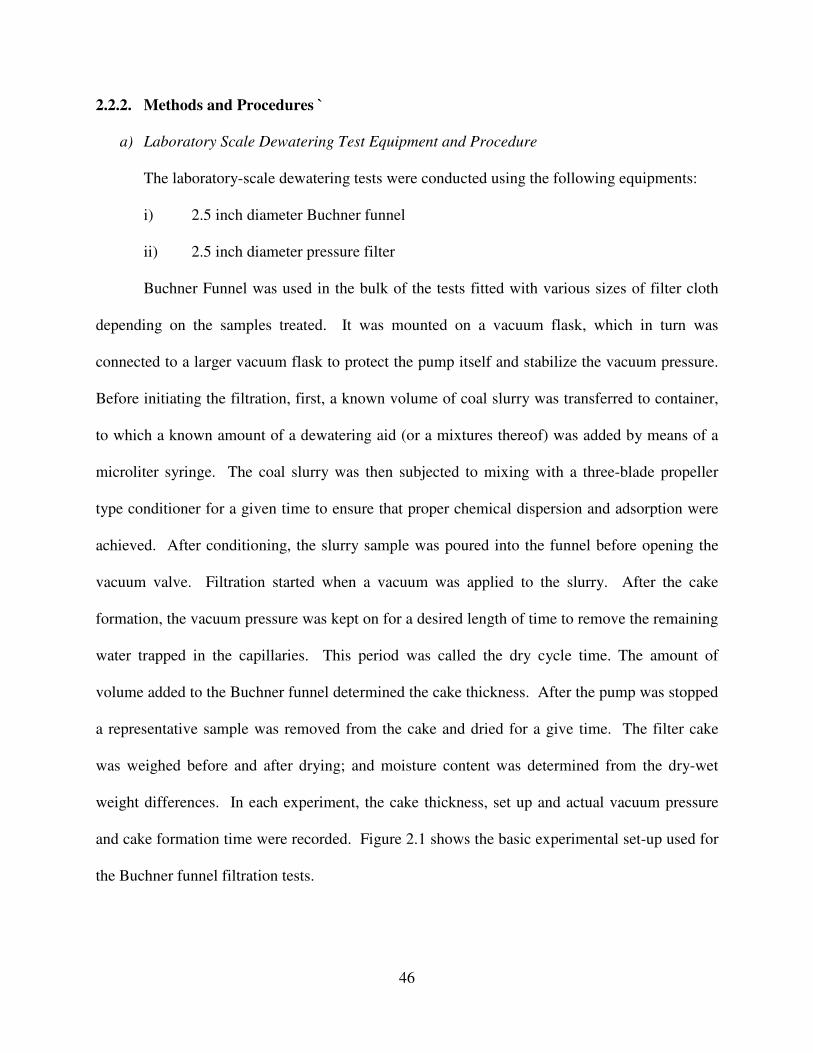
46
2.2.2. Methods and Procedures `
a) Laboratory Scale Dewatering Test Equipment and Procedure
The laboratory-scale dewatering tests were conducted using the following equipments:
i) 2.5 inch diameter Buchner funnel
ii) 2.5 inch diameter pressure filter
Buchner Funnel was used in the bulk of the tests fitted with various sizes of filter cloth
depending on the samples treated. It was mounted on a vacuum flask, which in turn was
connected to a larger vacuum flask to protect the pump itself and stabilize the vacuum pressure.
Before initiating the filtration, first, a known volume of coal slurry was transferred to container,
to which a known amount of a dewatering aid (or a mixtures thereof) was added by means of a
microliter syringe. The coal slurry was then subjected to mixing with a three-blade propeller
type conditioner for a given time to ensure that proper chemical dispersion and adsorption were
achieved. After conditioning, the slurry sample was poured into the funnel before opening the
vacuum valve. Filtration started when a vacuum was applied to the slurry. After the cake
formation, the vacuum pressure was kept on for a desired length of time to remove the remaining
water trapped in the capillaries. This period was called the dry cycle time. The amount of
volume added to the Buchner funnel determined the cake thickness. After the pump was stopped
a representative sample was removed from the cake and dried for a give time. The filter cake
was weighed before and after drying; and moisture content was determined from the dry-wet
weight differences. In each experiment, the cake thickness, set up and actual vacuum pressure
and cake formation time were recorded. Figure 2.1 shows the basic experimental set-up used for
the Buchner funnel filtration tests.
47
A limited number of tests were also conducted using a stainless steel pressure filter with
dimensions of 2.5 inches in diameter and 8 inches in height. Both the top and the bottom of the
filter were covered with stainless steel lids. The filter cloth was placed on the bottom lid where
filter cake was formed which was also the discharge spot. Compressed air was introduced from
the upper side of the chamber and could be adjusted to a desired level.
b) Pilot Scale Dewatering Test Equipment and Procedure
The pilot-scale filtration equipment used in tests consisted of two types of filter units and
additional equipment. The pilot scale dewatering equipments and the ancillary units were:
� 24-inch diameter Peterson Vacuum Disc Filter
� 12" wide x 7’ long Wes-tech Horizontal Belt Filter
� Pilot-scale Flotation Column Module
� Conditioner Module
Vacuum Disc Filter was manufactured by Peterson Filter Company, Salt Lake City, Utah
Figure 2.1 Experimental setup for laboratory vacuum filtration tests
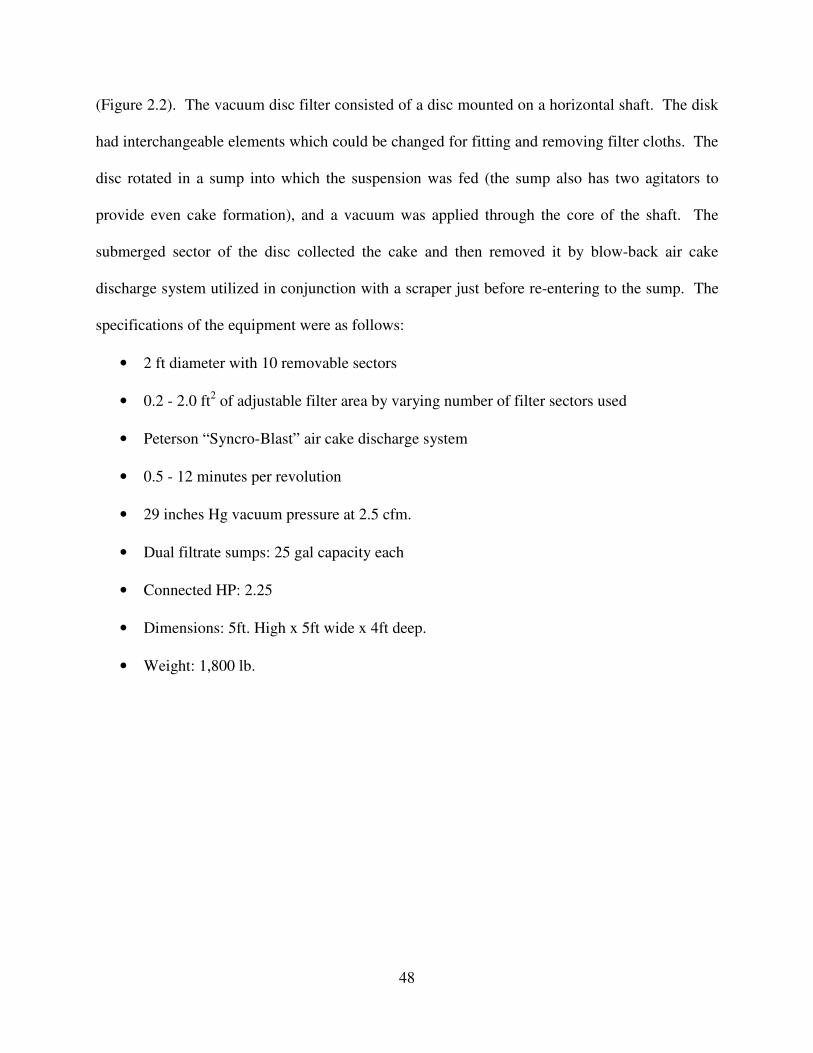
48
(Figure 2.2). The vacuum disc filter consisted of a disc mounted on a horizontal shaft. The disk
had interchangeable elements which could be changed for fitting and removing filter cloths. The
disc rotated in a sump into which the suspension was fed (the sump also has two agitators to
provide even cake formation), and a vacuum was applied through the core of the shaft. The
submerged sector of the disc collected the cake and then removed it by blow-back air cake
discharge system utilized in conjunction with a scraper just before re-entering to the sump. The
specifications of the equipment were as follows:
• 2 ft diameter with 10 removable sectors
• 0.2 - 2.0 ft2 of adjustable filter area by varying number of filter sectors used
• Peterson “Syncro-Blast” air cake discharge system
• 0.5 - 12 minutes per revolution
• 29 inches Hg vacuum pressure at 2.5 cfm.
• Dual filtrate sumps: 25 gal capacity each
• Connected HP: 2.25
• Dimensions: 5ft. High x 5ft wide x 4ft deep.
• Weight: 1,800 lb.
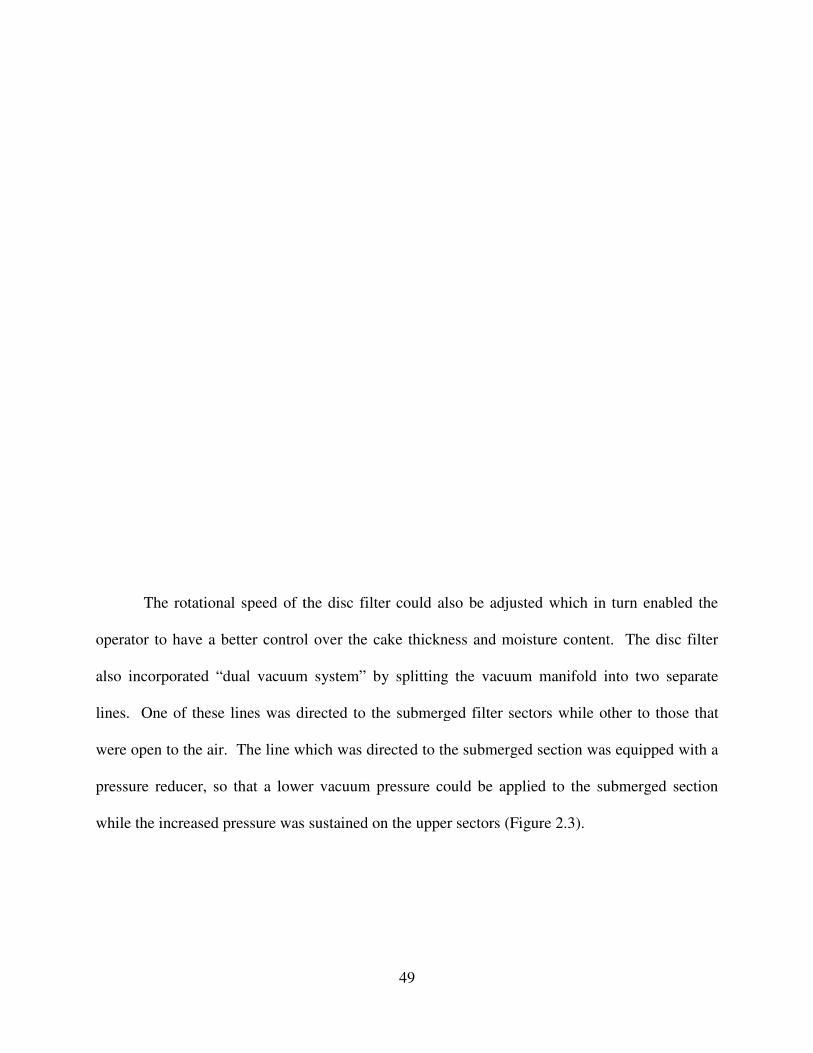
The rotational speed of the disc filter
operator to have a better control over the cake thickness and
also incorporated “dual vacuum system” by splitting the vacuum manifold into two separate
lines. One of these lines was directed to the submerged filter sectors while other to those that
were open to the air. The line which wa
pressure reducer, so that a lower vacuum pressure could
while the increased pressure was sustained on the upper sectors (
Figure 2.2
49
nal speed of the disc filter could also be adjusted which in turn enabled
operator to have a better control over the cake thickness and moisture content.
“dual vacuum system” by splitting the vacuum manifold into two separate
s directed to the submerged filter sectors while other to those that
which was directed to the submerged section was equipped with a
that a lower vacuum pressure could be applied to the submerged section
s sustained on the upper sectors (Figure 2.3).
Schematic diagram of the Peterson disc filter
e adjusted which in turn enabled the
moisture content. The disc filter
“dual vacuum system” by splitting the vacuum manifold into two separate
s directed to the submerged filter sectors while other to those that
s equipped with a
be applied to the submerged section
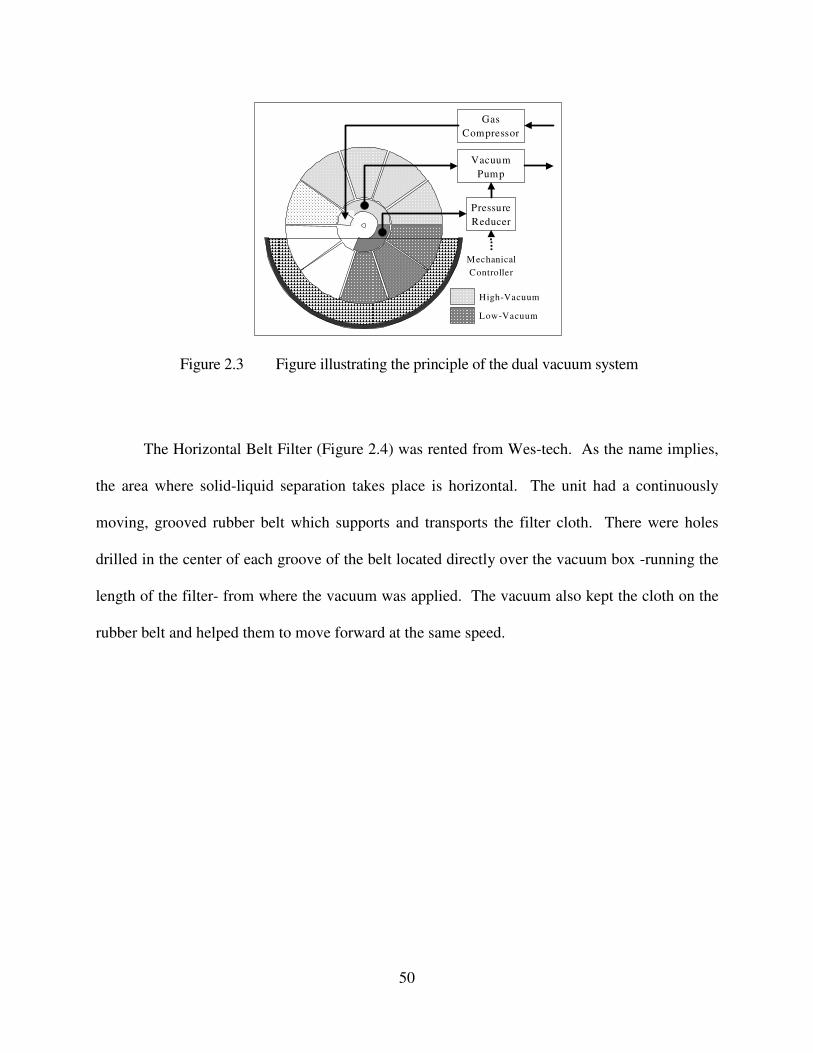
50
The Horizontal Belt Filter (Figure 2.4) was rented from Wes-tech. As the name implies,
the area where solid-liquid separation takes place is horizontal. The unit had a continuously
moving, grooved rubber belt which supports and transports the filter cloth. There were holes
drilled in the center of each groove of the belt located directly over the vacuum box -running the
length of the filter- from where the vacuum was applied. The vacuum also kept the cloth on the
rubber belt and helped them to move forward at the same speed.
Figure 2.3 Figure illustrating the principle of the dual vacuum system
Pressure
Reducer
Vacuum
Pump
Gas
Compressor
High-Vacuum
Low-Vacuum
Mechanical
Controller
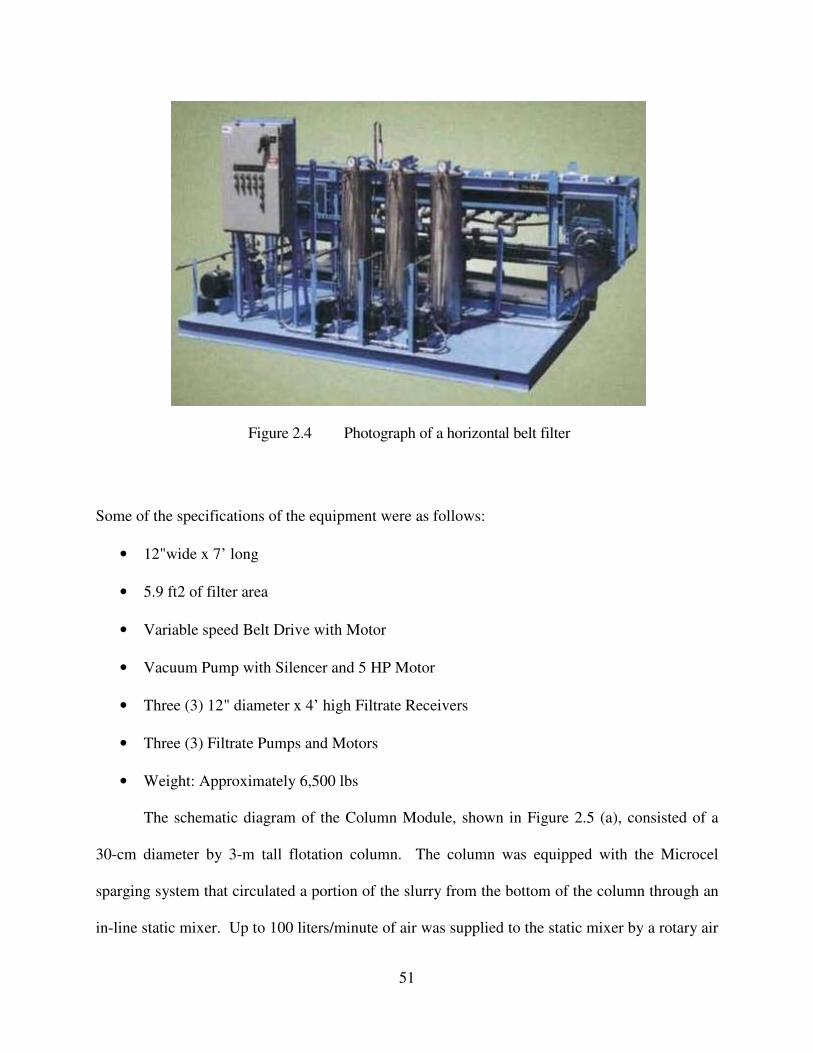
51
Some of the specifications of the equipment were as follows:
• 12"wide x 7’ long
• 5.9 ft2 of filter area
• Variable speed Belt Drive with Motor
• Vacuum Pump with Silencer and 5 HP Motor
• Three (3) 12" diameter x 4’ high Filtrate Receivers
• Three (3) Filtrate Pumps and Motors
• Weight: Approximately 6,500 lbs
The schematic diagram of the Column Module, shown in Figure 2.5 (a), consisted of a
30-cm diameter by 3-m tall flotation column. The column was equipped with the Microcel
sparging system that circulated a portion of the slurry from the bottom of the column through an
in-line static mixer. Up to 100 liters/minute of air was supplied to the static mixer by a rotary air
Figure 2.4 Photograph of a horizontal belt filter
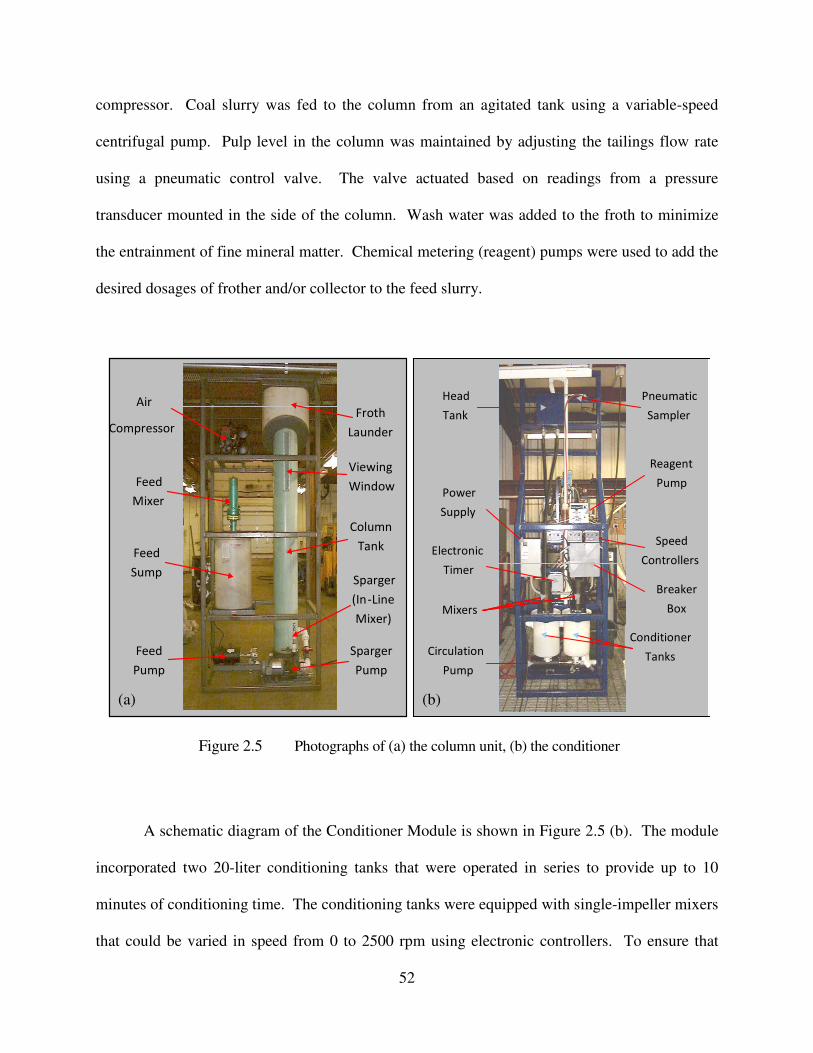
52
compressor. Coal slurry was fed to the column from an agitated tank using a variable-speed
centrifugal pump. Pulp level in the column was maintained by adjusting the tailings flow rate
using a pneumatic control valve. The valve actuated based on readings from a pressure
transducer mounted in the side of the column. Wash water was added to the froth to minimize
the entrainment of fine mineral matter. Chemical metering (reagent) pumps were used to add the
desired dosages of frother and/or collector to the feed slurry.
A schematic diagram of the Conditioner Module is shown in Figure 2.5 (b). The module
incorporated two 20-liter conditioning tanks that were operated in series to provide up to 10
minutes of conditioning time. The conditioning tanks were equipped with single-impeller mixers
that could be varied in speed from 0 to 2500 rpm using electronic controllers. To ensure that
Figure 2.5 Photographs of (a) the column unit, (b) the conditioner
Sparger
(In - Line
Mixer)
Sparger
Pump
Feed
Mixer
Viewing
Window
Column
Tank
Air
Compressor
Froth
Launder
Feed
Sump
Feed
Pump
Conditioner
Tanks
Mixers
Circulation
Pump
Power
Supply
Reagent
Pump
Speed
Controllers
Breaker
Box
Head
Tank
Pneumatic
Sampler
Electronic
Timer
(a) (b)
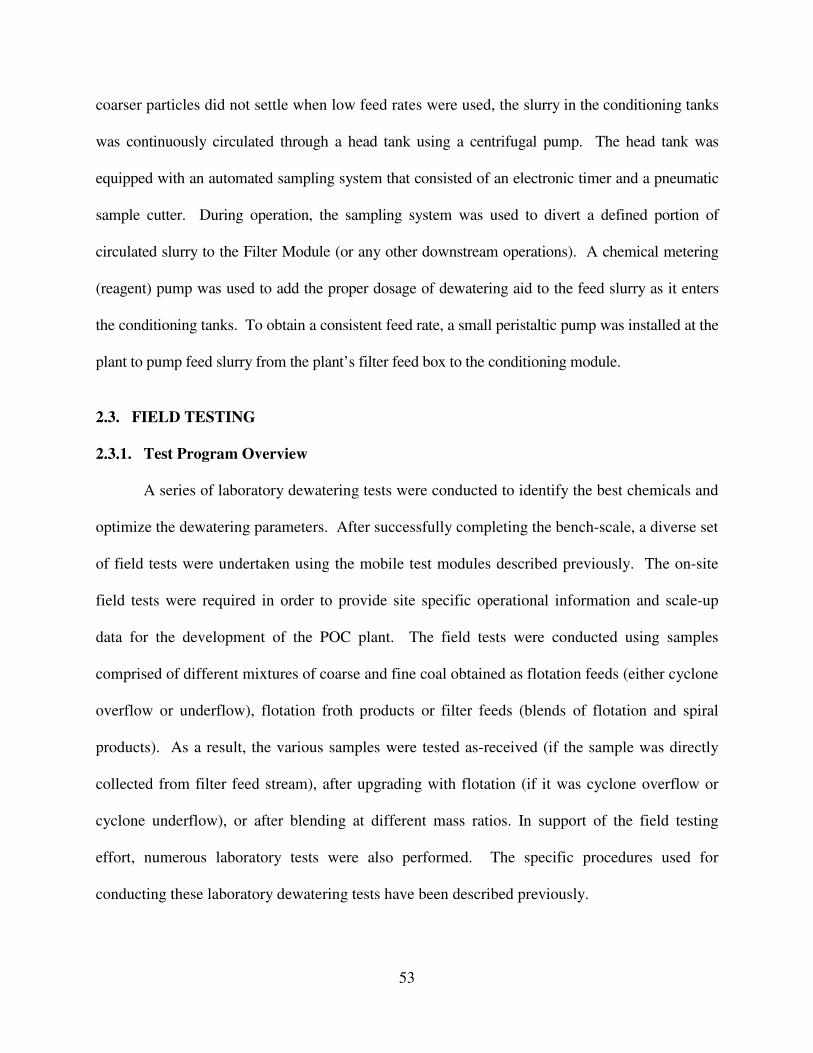
53
coarser particles did not settle when low feed rates were used, the slurry in the conditioning tanks
was continuously circulated through a head tank using a centrifugal pump. The head tank was
equipped with an automated sampling system that consisted of an electronic timer and a pneumatic
sample cutter. During operation, the sampling system was used to divert a defined portion of
circulated slurry to the Filter Module (or any other downstream operations). A chemical metering
(reagent) pump was used to add the proper dosage of dewatering aid to the feed slurry as it enters
the conditioning tanks. To obtain a consistent feed rate, a small peristaltic pump was installed at the
plant to pump feed slurry from the plant’s filter feed box to the conditioning module.
2.3. FIELD TESTING
2.3.1. Test Program Overview
A series of laboratory dewatering tests were conducted to identify the best chemicals and
optimize the dewatering parameters. After successfully completing the bench-scale, a diverse set
of field tests were undertaken using the mobile test modules described previously. The on-site
field tests were required in order to provide site specific operational information and scale-up
data for the development of the POC plant. The field tests were conducted using samples
comprised of different mixtures of coarse and fine coal obtained as flotation feeds (either cyclone
overflow or underflow), flotation froth products or filter feeds (blends of flotation and spiral
products). As a result, the various samples were tested as-received (if the sample was directly
collected from filter feed stream), after upgrading with flotation (if it was cyclone overflow or
cyclone underflow), or after blending at different mass ratios. In support of the field testing
effort, numerous laboratory tests were also performed. The specific procedures used for
conducting these laboratory dewatering tests have been described previously.
54
2.3.2. Mingo Logan Site
a) Site Description
The Mingo Logan Coal Preparation Plant is located in the counties of Mingo and Logan,
WV. This is in Central Appalachia Region. As Arch’s principal source of metallurgical coal,
the plant produces approximately 3.9 million tons (2006) at a quality of 13,000 Btu/lbs. and, 1.1
lbs. SO2/MM Btu. The preparation plant consists of two independent 800-ton circuits, each
provided with separate surge bins to ensure uniform splitting of the plant feed. Each of the
circuits consists of heavy media vessels for the 160 x 7.7 mm (6 x 0.3 inch) material, heavy
media cyclones for the 0.3 x 16 mesh material, spirals for the 16 x 65 mesh material, and froth
flotation for the 65 mesh x 0 material. Dewatering is accomplished through centrifuging for the
various size fractions. However, the dewatering efficiency was not satisfactory due to (i) the fine
particle size of flotation product, (ii) the screen bowl centrifuges were not capable of capturing
the fines, and (iii) the accumulation of excessively stable foam over the screen bowl centrifuges.
Also, the issues resulted in high final cake moistures and loss of considerable amount of valuable
material that might be recovered by other means. If recovered and dewatered more efficiently,
such losses could be turned into profits.
An extensive laboratory and pilot-scale dewatering test program was conducted to study
the feasibility of new approaches on more efficient dewatering methods and the recovery of the
fine particle size material which reports to the plant’s discard stream as a result of centrifuge’s
lack of fine particle capturing capability. To meet the objectives, exploratory laboratory
dewatering tests were conducted to evaluate the performance of various types and dosages of
newly developed fine particle dewatering aid technology. Data from the laboratory studies were
used to provide technical justification for the pilot-scale test program undertaken at a coal
55
preparation plant using a horizontal belt vacuum filter. Investigations incorporated the study for
the possible utilization of these technologies in industrial applications for fine coal beneficiation.
b) Reagents
The investigation, both laboratory and pilot-scale, was performed with varying amounts
of three types of dewatering aids, namely RW, RU, and RV. Since these dewatering aids are
insoluble in water, they were dissolved in a solvent. In both laboratory and pilot-scale
experiments diesel was used as the solvent. The ratio of reagents-to-solvent was optimized in
previous studies by varying the individual dosages (0.5 to 3lb/ton), while maintaining the total
blend dosage constant. For this test program, the optimum combination for a given dewatering
aid and solvent is one to two (1:2) dewatering aid-diesel ratio. The flocculants, Nalco-9822 and
Nalco-9806, were prepared at a 0.09 % solution and used both alone and in conjunction with
dewatering aids. After examining various dewatering aid and flocculant combinations and their
orders of additions, the best combination was found to be to add dewatering aids first, then to
add flocculants. As it is going to be discussed in the following sections, the agitation and mixing
intensity play an important role in determining the chemical performance. The dewatering aids
require certain amount of mixing intensity; however, it may be excessive shear for a given
flocculant. Excessive shear may lead to chain breakage, which reduces the effectiveness of a
flocculant for bridging. Therefore, flocculant was added after mixing the dewatering aids; and
the new combination was conditioned at a very low intensity for 15-20 seconds.
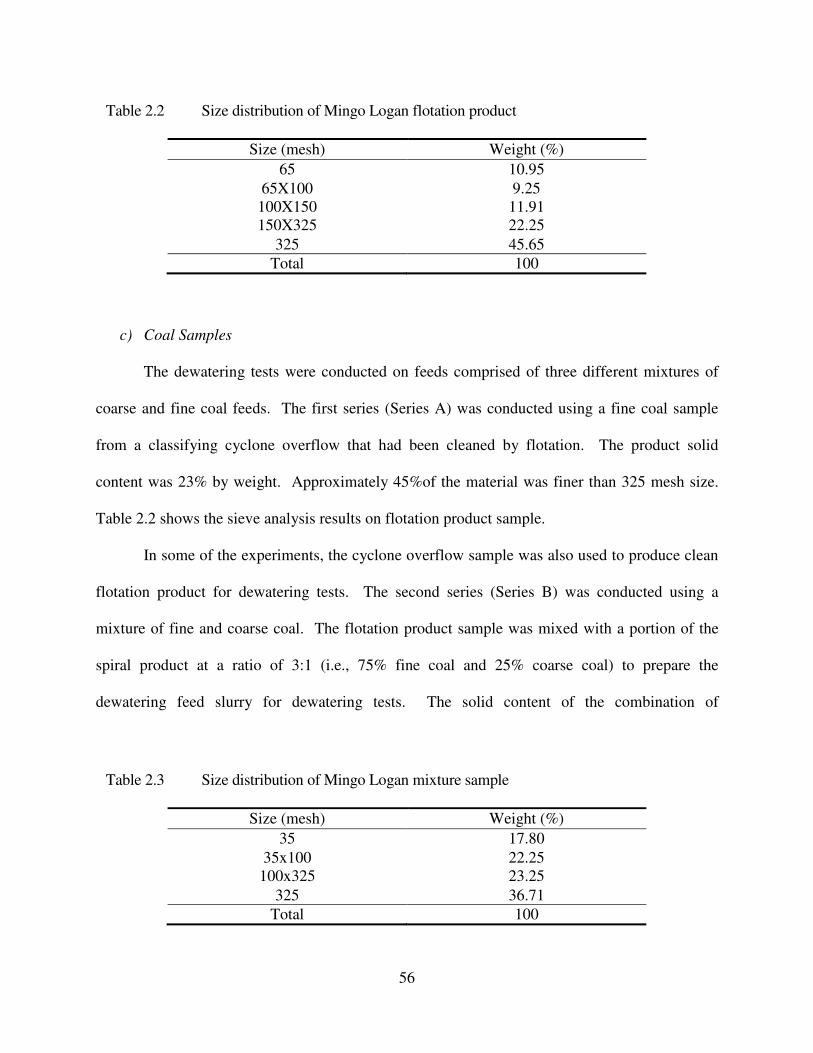
56
c) Coal Samples
The dewatering tests were conducted on feeds comprised of three different mixtures of
coarse and fine coal feeds. The first series (Series A) was conducted using a fine coal sample
from a classifying cyclone overflow that had been cleaned by flotation. The product solid
content was 23% by weight. Approximately 45%of the material was finer than 325 mesh size.
Table 2.2 shows the sieve analysis results on flotation product sample.
In some of the experiments, the cyclone overflow sample was also used to produce clean
flotation product for dewatering tests. The second series (Series B) was conducted using a
mixture of fine and coarse coal. The flotation product sample was mixed with a portion of the
spiral product at a ratio of 3:1 (i.e., 75% fine coal and 25% coarse coal) to prepare the
dewatering feed slurry for dewatering tests. The solid content of the combination of
Table 2.2 Size distribution of Mingo Logan flotation product
Size (mesh) Weight (%)
65 10.95
65X100 9.25
100X150 11.91
150X325 22.25
325 45.65
Total 100
Table 2.3 Size distribution of Mingo Logan mixture sample
Size (mesh) Weight (%)
35 17.80
35x100 22.25
100x325 23.25
325 36.71
Total 100
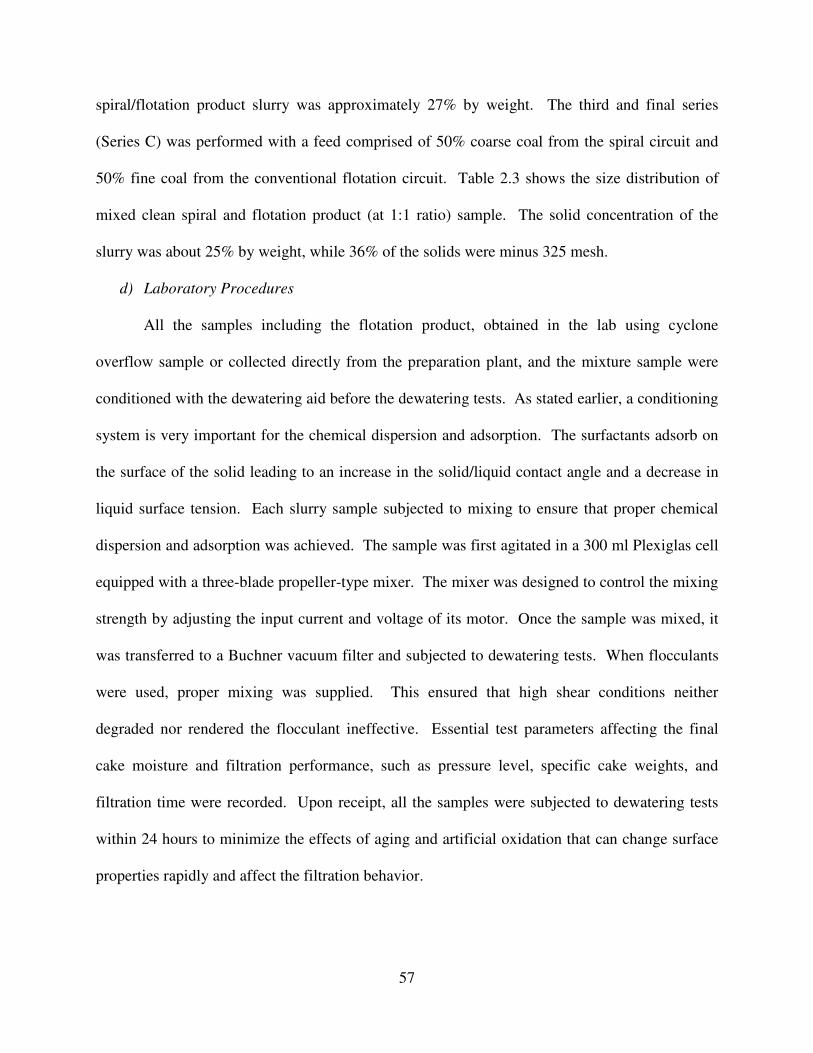
57
spiral/flotation product slurry was approximately 27% by weight. The third and final series
(Series C) was performed with a feed comprised of 50% coarse coal from the spiral circuit and
50% fine coal from the conventional flotation circuit. Table 2.3 shows the size distribution of
mixed clean spiral and flotation product (at 1:1 ratio) sample. The solid concentration of the
slurry was about 25% by weight, while 36% of the solids were minus 325 mesh.
d) Laboratory Procedures
All the samples including the flotation product, obtained in the lab using cyclone
overflow sample or collected directly from the preparation plant, and the mixture sample were
conditioned with the dewatering aid before the dewatering tests. As stated earlier, a conditioning
system is very important for the chemical dispersion and adsorption. The surfactants adsorb on
the surface of the solid leading to an increase in the solid/liquid contact angle and a decrease in
liquid surface tension. Each slurry sample subjected to mixing to ensure that proper chemical
dispersion and adsorption was achieved. The sample was first agitated in a 300 ml Plexiglas cell
equipped with a three-blade propeller-type mixer. The mixer was designed to control the mixing
strength by adjusting the input current and voltage of its motor. Once the sample was mixed, it
was transferred to a Buchner vacuum filter and subjected to dewatering tests. When flocculants
were used, proper mixing was supplied. This ensured that high shear conditions neither
degraded nor rendered the flocculant ineffective. Essential test parameters affecting the final
cake moisture and filtration performance, such as pressure level, specific cake weights, and
filtration time were recorded. Upon receipt, all the samples were subjected to dewatering tests
within 24 hours to minimize the effects of aging and artificial oxidation that can change surface
properties rapidly and affect the filtration behavior.
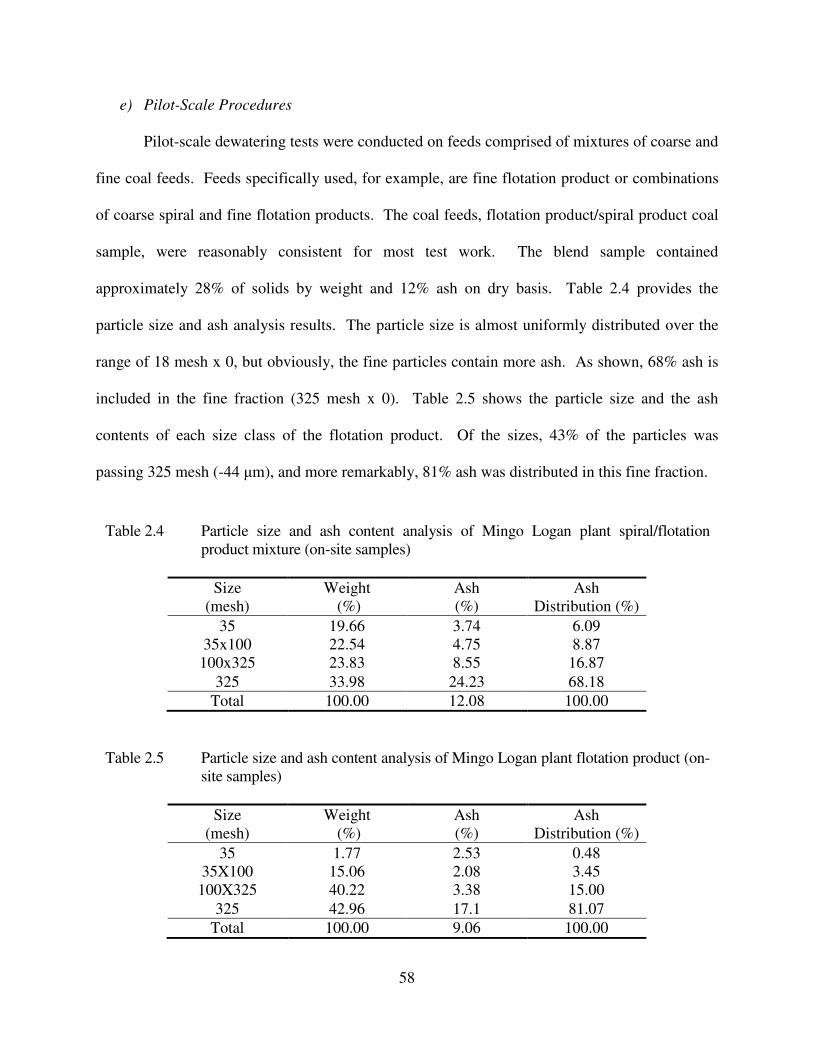
58
e) Pilot-Scale Procedures
Pilot-scale dewatering tests were conducted on feeds comprised of mixtures of coarse and
fine coal feeds. Feeds specifically used, for example, are fine flotation product or combinations
of coarse spiral and fine flotation products. The coal feeds, flotation product/spiral product coal
sample, were reasonably consistent for most test work. The blend sample contained
approximately 28% of solids by weight and 12% ash on dry basis. Table 2.4 provides the
particle size and ash analysis results. The particle size is almost uniformly distributed over the
range of 18 mesh x 0, but obviously, the fine particles contain more ash. As shown, 68% ash is
included in the fine fraction (325 mesh x 0). Table 2.5 shows the particle size and the ash
contents of each size class of the flotation product. Of the sizes, 43% of the particles was
passing 325 mesh (-44 µm), and more remarkably, 81% ash was distributed in this fine fraction.
Table 2.4 Particle size and ash content analysis of Mingo Logan plant spiral/flotation
product mixture (on-site samples)
Size
(mesh)
Weight
(%)
Ash
(%)
Ash
Distribution (%)
35 19.66 3.74 6.09
35x100 22.54 4.75 8.87
100x325 23.83 8.55 16.87
325 33.98 24.23 68.18
Total 100.00 12.08 100.00
Table 2.5 Particle size and ash content analysis of Mingo Logan plant flotation product (on-
site samples)
Size
(mesh)
Weight
(%)
Ash
(%)
Ash
Distribution (%)
35 1.77 2.53 0.48
35X100 15.06 2.08 3.45
100X325 40.22 3.38 15.00
325 42.96 17.1 81.07
Total 100.00 9.06 100.00
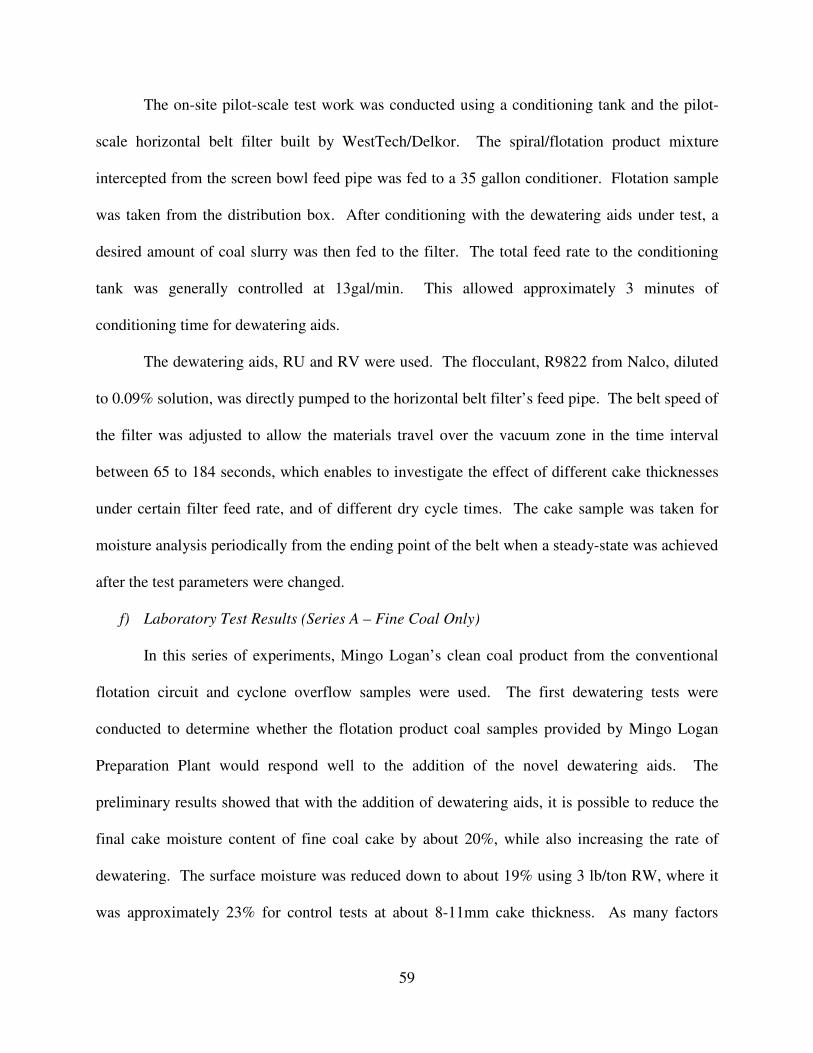
59
The on-site pilot-scale test work was conducted using a conditioning tank and the pilot-
scale horizontal belt filter built by WestTech/Delkor. The spiral/flotation product mixture
intercepted from the screen bowl feed pipe was fed to a 35 gallon conditioner. Flotation sample
was taken from the distribution box. After conditioning with the dewatering aids under test, a
desired amount of coal slurry was then fed to the filter. The total feed rate to the conditioning
tank was generally controlled at 13gal/min. This allowed approximately 3 minutes of
conditioning time for dewatering aids.
The dewatering aids, RU and RV were used. The flocculant, R9822 from Nalco, diluted
to 0.09% solution, was directly pumped to the horizontal belt filter’s feed pipe. The belt speed of
the filter was adjusted to allow the materials travel over the vacuum zone in the time interval
between 65 to 184 seconds, which enables to investigate the effect of different cake thicknesses
under certain filter feed rate, and of different dry cycle times. The cake sample was taken for
moisture analysis periodically from the ending point of the belt when a steady-state was achieved
after the test parameters were changed.
f) Laboratory Test Results (Series A – Fine Coal Only)
In this series of experiments, Mingo Logan’s clean coal product from the conventional
flotation circuit and cyclone overflow samples were used. The first dewatering tests were
conducted to determine whether the flotation product coal samples provided by Mingo Logan
Preparation Plant would respond well to the addition of the novel dewatering aids. The
preliminary results showed that with the addition of dewatering aids, it is possible to reduce the
final cake moisture content of fine coal cake by about 20%, while also increasing the rate of
dewatering. The surface moisture was reduced down to about 19% using 3 lb/ton RW, where it
was approximately 23% for control tests at about 8-11mm cake thickness. As many factors
60
influence the filtration performance, particle size distribution and corresponding ash contents
were the dictating parameters. Considering the amount of material under 325 mesh size in the
flotation product sample, a portion of ultra-fine particles was removed from the sample via
desliming. The tests results on the deslimed sample showed that moisture was further decreased
to 16.7 % at the same RW dosage. This is another significant moisture reduction from a baseline
of 21%. This moisture reduction in both baseline and with reagent tests is achieved by desliming
of the ultrafine fraction that results in more freely draining filter cake capillaries. This also
prevented the fines from forming an impermeable layer which might be positioned on the top of
the cake.
The screen analysis results also showed that 81% of the ash was in the minus 325 mesh
size fraction. This material, which consists of clays and slimes, is hydrophilic in nature and this
affects the dewatering performance negatively. The use of flocculants may be another way to
compensate the negative effects of the ultrafine particles. The principle of using of flocculants is
to bring the fine particles together in the coal slurry and create looser packing in the filter cake.
This loose packing results in larger capillaries between the aggregates and a more porous,
permeable cake. This allows a rapid drainage of water from these voids, which, in turn,
increases the filtration rate. To investigate the effects of flocculants on dewatering kinetics, a
series of tests was conducted. To optimize the dosage, various amounts of flocculant were
tested, from 5 g/ton to 75g/ton. It was determined that 25 g/ton was the most appropriate
flocculant amount when being used alone or in conjunction with other chemicals. The test
results showed that in most cases, the addition of flocculant did not improve the final cake
moisture, due to the water trapped inside the flocculants. Instead, the dewatering kinetics
increased significantly i.e., 30% to 75%.
61
Another way of lowering the moisture may be to clear out the excessive amount of ash-
forming minerals in the fines. To investigate this idea, prior to laboratory dewatering tests, the
plant’s clean coal product was subjected to another step of flotation using 1 lb/ton (454g/t) RV
(in Diesel (1:2)) as collector and 100g/t MIBC as frother. The particle size analysis results
showed that the 37.6% of the re-floated sample was minus 325 mesh. Dewatering test results
showed after its addition, RW, at about 3 lb/ton, can reduce the moisture to 15.5%, where the
baseline was approximately 20%. In addition, the dewatering kinetics of the coal sample was
also increased by 50% as a result of the increased hydrophobicity.
As stated earlier, the surfactant adsorption is very important so that it can lead to an
increase in solid/liquid contact angle and a decrease in liquid surface tension. For this reason, it
is very important to have an effective conditioning system. To investigate and optimize the
effectiveness of the dewatering aids and their performances, two series of filtration tests were
conducted at various mixing intensities and times. Table 2.6 gives the laboratory test results
obtained on the flotation product sample using RW at 3 lb/ton at about 20-24 mm cake
thicknesses. As shown, the moisture reduction was substantially improved when mixing
intensity was increased. The use of RW at 3 lb/ton reduced the filter cake moisture from
baseline value of 30.02% to 25.98% and 25.45% when using low and medium-energy agitation
at one minute, respectively. The cake moisture was further reduced to 20.26% moisture when
Table 2.6 Effect of mixing intensity and conditioning time on Mingo Logan flotation
product (20 inHg vacuum and 3 lb/ton RW)
Speed
Level
Moisture @ specified conditioning time
1 min 2 min
0 30.02 30.02
Low 25.98 25.29
Medium 25.45 23.91
High 20.26 18.66
62
using high-energy agitation at the same reagent dosage of 3 lb/ton. The moisture reduction
showed a similar trend, but improved final cake moistures were obtained when the agitation time
was increased to two minutes. The final cake moisture was reduced to 23.91% and 18.66%
using medium and high-energy conditioning, respectively, at the same dewatering aid dosage. It
was found out that two minutes of conditioning at high intensity mixing was optimum. Beyond
two minutes of conditioning, there was no change in the residual moisture of the cake. These
results clearly demonstrate that the importance of proper conditioning when using the novel
dewatering aids.
In the light of the results obtained in the initial laboratory filter tests, using dewatering
aids were believed to be a promising method because it could not only remove water but also
increased the filtration kinetics. To evaluate the filtration performance in detail as a function of
cake formation time, dry cycle time, and specific cake weight in the absence and presence of
different types of dewatering aids, a series of vacuum filtration tests was carried out. It is very
informative to know the effects of these physical parameters for scale up of using chemicals,
optimization of total filtration time, production rate, and, consequently, the final cake moisture.
These parameters would also provide general suggestions to meet the desirable filtration
efficiencies.
The dewatering tests were carried out using a fixed amount of dewatering aids (3lb/ton)
and flocculants (25 g/ton) after the optimum dosage was determined. The tests were conducted
at a fixed setup vacuum pressure and pre-measured amount of slurry was added to the Buchner
funnel for dewatering tests. The dry cycle times were changed randomly, varying from 14 to 120
seconds. The cake weights were changed by increasing the slurry volume from 50 ml to 300 ml.
The cake formation time, dry cycle time, cake weights, amount of filtrate, and solid contents for
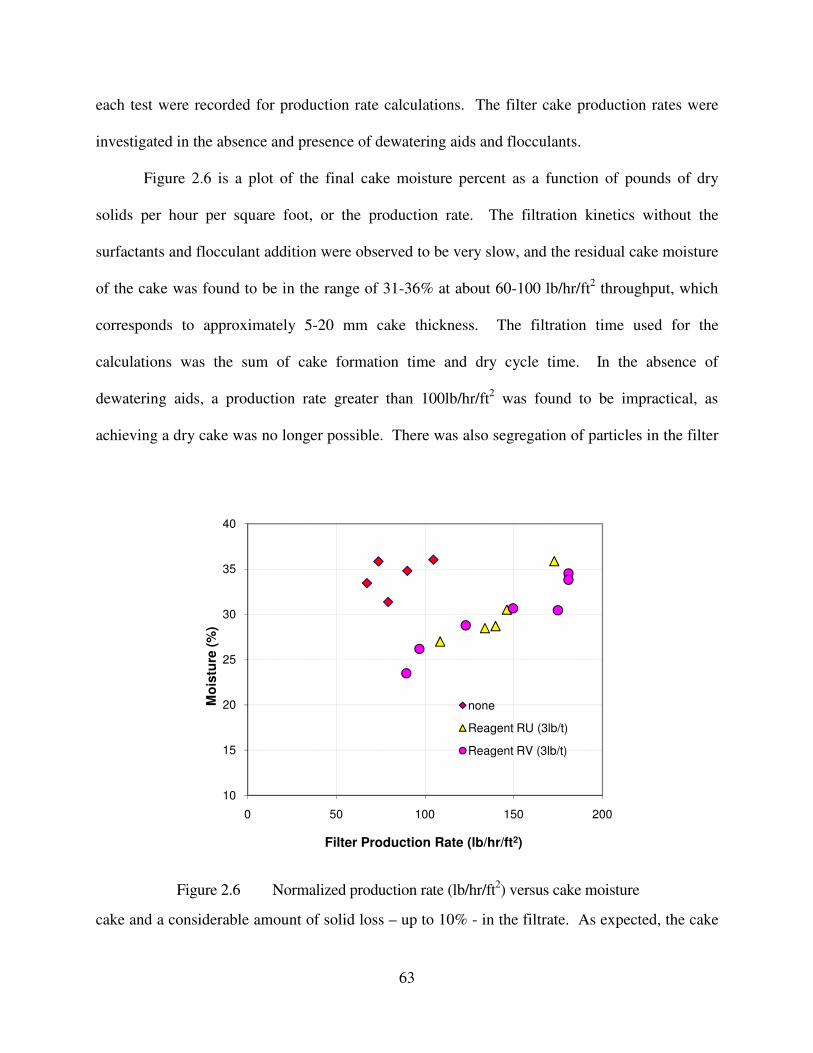
63
each test were recorded for production rate calculations. The filter cake production rates were
investigated in the absence and presence of dewatering aids and flocculants.
Figure 2.6 is a plot of the final cake moisture percent as a function of pounds of dry
solids per hour per square foot, or the production rate. The filtration kinetics without the
surfactants and flocculant addition were observed to be very slow, and the residual cake moisture
of the cake was found to be in the range of 31-36% at about 60-100 lb/hr/ft2 throughput, which
corresponds to approximately 5-20 mm cake thickness. The filtration time used for the
calculations was the sum of cake formation time and dry cycle time. In the absence of
dewatering aids, a production rate greater than 100lb/hr/ft2 was found to be impractical, as
achieving a dry cake was no longer possible. There was also segregation of particles in the filter
cake and a considerable amount of solid loss – up to 10% - in the filtrate. As expected, the cake
Figure 2.6 Normalized production rate (lb/hr/ft2) versus cake moisture
10
15
20
25
30
35
40
0 50 100 150 200
Mo
istu
re (
%)
Filter Production Rate (lb/hr/ft2)
none
Reagent RU (3lb/t)
Reagent RV (3lb/t)
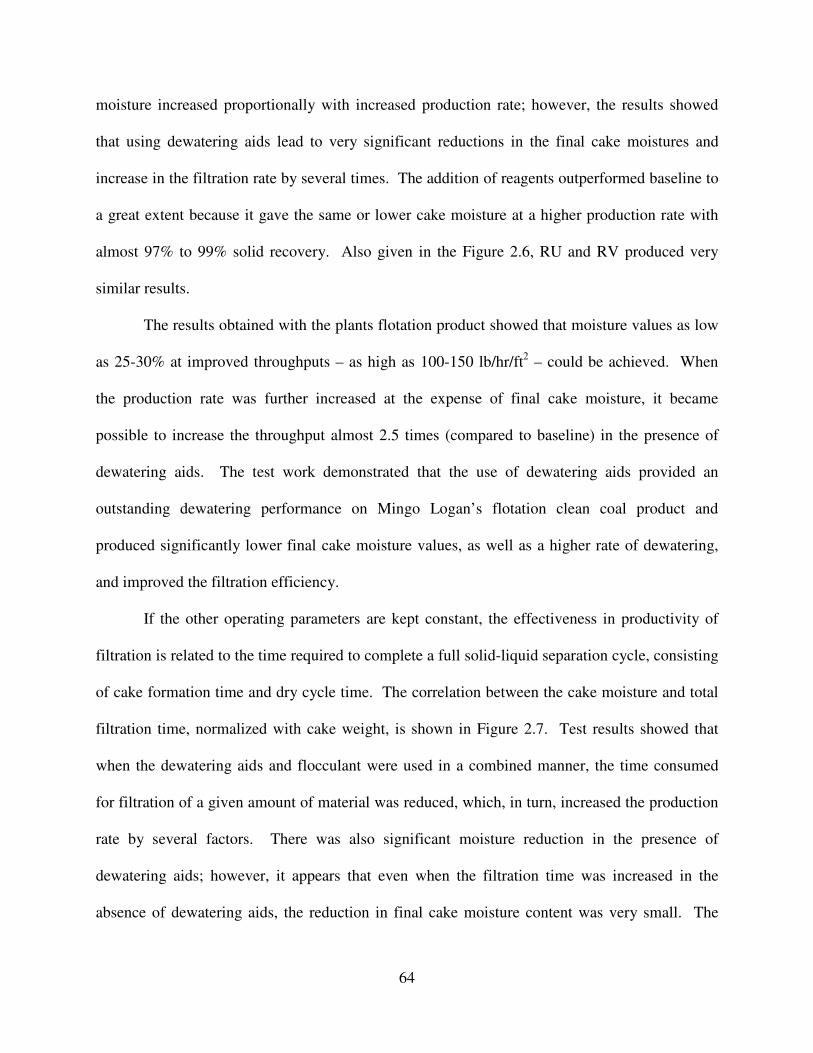
64
moisture increased proportionally with increased production rate; however, the results showed
that using dewatering aids lead to very significant reductions in the final cake moistures and
increase in the filtration rate by several times. The addition of reagents outperformed baseline to
a great extent because it gave the same or lower cake moisture at a higher production rate with
almost 97% to 99% solid recovery. Also given in the Figure 2.6, RU and RV produced very
similar results.
The results obtained with the plants flotation product showed that moisture values as low
as 25-30% at improved throughputs – as high as 100-150 lb/hr/ft2 – could be achieved. When
the production rate was further increased at the expense of final cake moisture, it became
possible to increase the throughput almost 2.5 times (compared to baseline) in the presence of
dewatering aids. The test work demonstrated that the use of dewatering aids provided an
outstanding dewatering performance on Mingo Logan’s flotation clean coal product and
produced significantly lower final cake moisture values, as well as a higher rate of dewatering,
and improved the filtration efficiency.
If the other operating parameters are kept constant, the effectiveness in productivity of
filtration is related to the time required to complete a full solid-liquid separation cycle, consisting
of cake formation time and dry cycle time. The correlation between the cake moisture and total
filtration time, normalized with cake weight, is shown in Figure 2.7. Test results showed that
when the dewatering aids and flocculant were used in a combined manner, the time consumed
for filtration of a given amount of material was reduced, which, in turn, increased the production
rate by several factors. There was also significant moisture reduction in the presence of
dewatering aids; however, it appears that even when the filtration time was increased in the
absence of dewatering aids, the reduction in final cake moisture content was very small. The
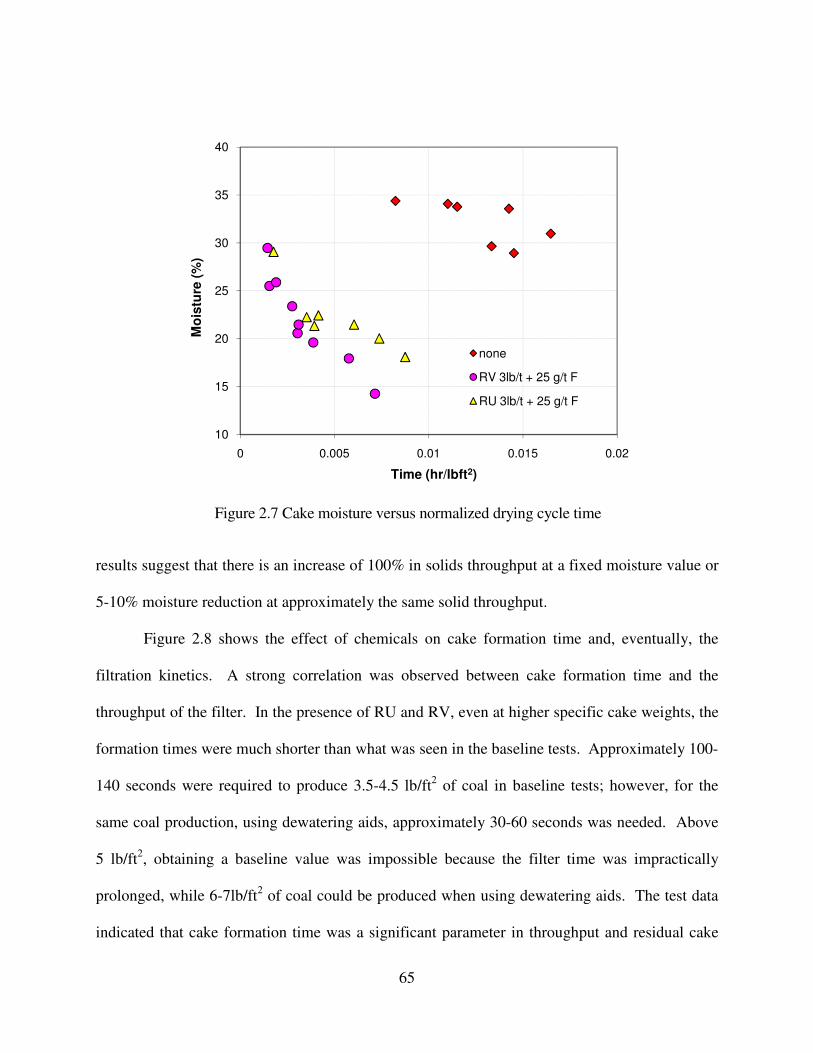
65
results suggest that there is an increase of 100% in solids throughput at a fixed moisture value or
5-10% moisture reduction at approximately the same solid throughput.
Figure 2.8 shows the effect of chemicals on cake formation time and, eventually, the
filtration kinetics. A strong correlation was observed between cake formation time and the
throughput of the filter. In the presence of RU and RV, even at higher specific cake weights, the
formation times were much shorter than what was seen in the baseline tests. Approximately 100-
140 seconds were required to produce 3.5-4.5 lb/ft2 of coal in baseline tests; however, for the
same coal production, using dewatering aids, approximately 30-60 seconds was needed. Above
5 lb/ft2, obtaining a baseline value was impossible because the filter time was impractically
prolonged, while 6-7lb/ft2 of coal could be produced when using dewatering aids. The test data
indicated that cake formation time was a significant parameter in throughput and residual cake
Figure 2.7 Cake moisture versus normalized drying cycle time
10
15
20
25
30
35
40
0 0.005 0.01 0.015 0.02
Mo
istu
re (
%)
Time (hr/lbft2)
none
RV 3lb/t + 25 g/t F
RU 3lb/t + 25 g/t F
66
moisture; however, formation time can be altered by using dewatering aids. In addition, in daily
practice, decreased cake formation time allows a longer dry cycle time to complete the full
filtration operation, increasing the throughput of the filter at lower final cake moisture.
After completing the tests using the fine clean coal sample from Mingo Logan, a second
set of tests were performed using a fine cyclone overflow sample that had been subjected to froth
flotation to minimize the adverse effects of high ash content. The tests were conducted by
floating the cyclone overflow sample using diesel (0.66 lb/t) as collector and MIBC (0.33 lb/ton)
as frother. Both conventional laboratory-scale flotation and bench-scale column flotation
equipment were used to produce ash-free clean coal. Both products were tested in the absence
and presence of dewatering aids.
Figure 2.8 Cake moisture versus cake formation time
1
3
5
7
9
11
13
15
17
19
0 50 100 150 200 250
CaK
e W
eig
ht
lb/f
t2
Cake Formation Time (sec)
none
RV 3lb/t + 25 g/t F
RU 3lb/t + 25 g/t F
67
The first series of clean coal samples were produced using lab scale Denver cell. The
solid concentration of the product was about 15% by weight, while maintaining approximately
44% of minus 325 mesh particle size. The test results on this sample showed that the control
cake moisture was 25.31%, and with RW addition at about 3 lb/ton, the final cake moisture was
reduced approximately to 19.5% at 7-10 mm cake thickness. Another set of flotation tests was
run on the plant’s flotation product to discard ash-forming minerals, and the product of the
flotation tests was subjected to the same type of dewatering tests. The results indicated that the
floated cyclone overflow and re-floated samples, using the laboratory-scale Denver flotation
machine, gave considerably better results compared to the plant’s as-is flotation product sample.
This may be the result of discarding ash-forming minerals and removing ultra-fine particles more
efficiently from the coal slurry compared to plant operation.
Using a laboratory scale column flotation unit produced another series of clean coal
samples. In this set of tests, the flotation feed/cyclone overflow sample was floated using 0.66
lb/ton diesel as collector and 0.22 lb/ton MIBC as frother. The solid concentration of the column
flotation product was about 10% by weight, and approximately 39% of particles were minus 325
mesh size. The dewatering tests were conducted using a 2.5inch-diameter Buchner funnel at 20
inch Hg set-up vacuum pressure with 2 minutes drying cycle time and about 11 mm cake
thickness. RU and RV were used as dewatering aids with several of dosages ranging from 0.5-3
lb/ton. Vacuum filtration results on both column and Denver unit clean coal products showed
that RV alone was capable of both reducing the moisture and cake formation time significantly;
therefore, flocculant addition was unnecessary. The cake formation time for control tests was 94
seconds, whereas it was approximately 10 seconds in the presence of the dewatering aid, RV.
The presence of dewatering aids also made it possible to reduce the final cake moisture content
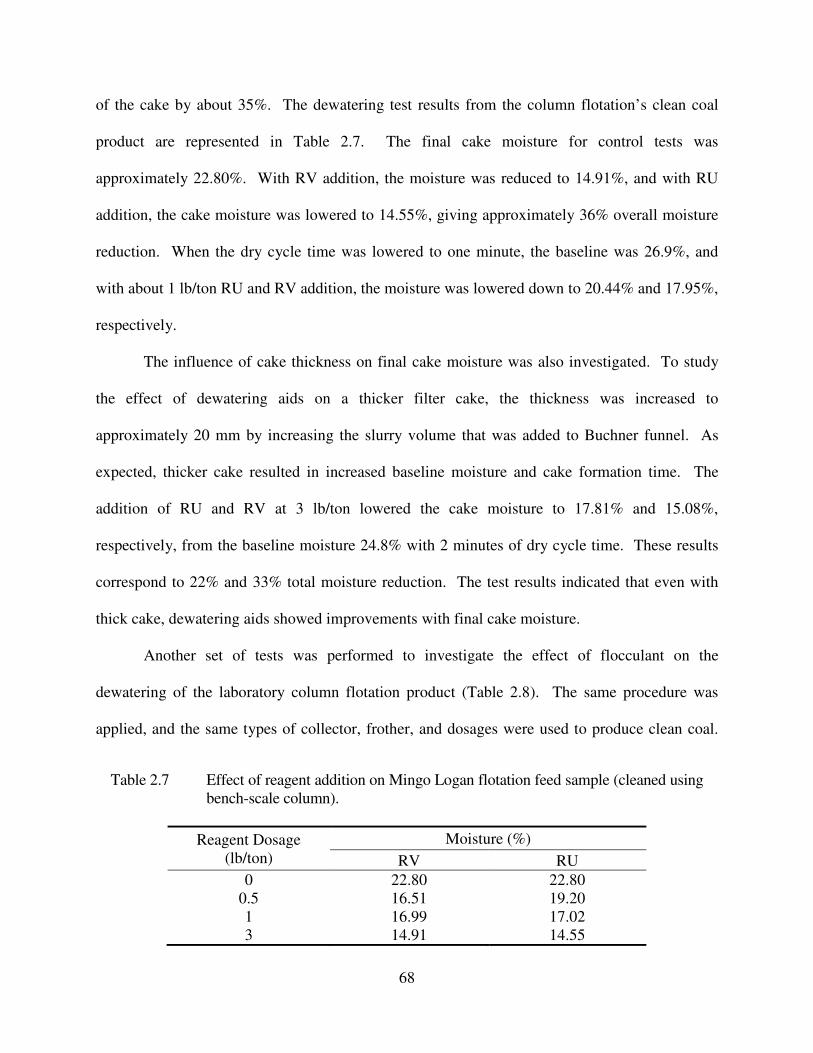
68
of the cake by about 35%. The dewatering test results from the column flotation’s clean coal
product are represented in Table 2.7. The final cake moisture for control tests was
approximately 22.80%. With RV addition, the moisture was reduced to 14.91%, and with RU
addition, the cake moisture was lowered to 14.55%, giving approximately 36% overall moisture
reduction. When the dry cycle time was lowered to one minute, the baseline was 26.9%, and
with about 1 lb/ton RU and RV addition, the moisture was lowered down to 20.44% and 17.95%,
respectively.
The influence of cake thickness on final cake moisture was also investigated. To study
the effect of dewatering aids on a thicker filter cake, the thickness was increased to
approximately 20 mm by increasing the slurry volume that was added to Buchner funnel. As
expected, thicker cake resulted in increased baseline moisture and cake formation time. The
addition of RU and RV at 3 lb/ton lowered the cake moisture to 17.81% and 15.08%,
respectively, from the baseline moisture 24.8% with 2 minutes of dry cycle time. These results
correspond to 22% and 33% total moisture reduction. The test results indicated that even with
thick cake, dewatering aids showed improvements with final cake moisture.
Another set of tests was performed to investigate the effect of flocculant on the
dewatering of the laboratory column flotation product (Table 2.8). The same procedure was
applied, and the same types of collector, frother, and dosages were used to produce clean coal.
Table 2.7 Effect of reagent addition on Mingo Logan flotation feed sample (cleaned using
bench-scale column).
Reagent Dosage
(lb/ton)
Moisture (%)
RV RU
0 22.80 22.80
0.5 16.51 19.20
1 16.99 17.02
3 14.91 14.55
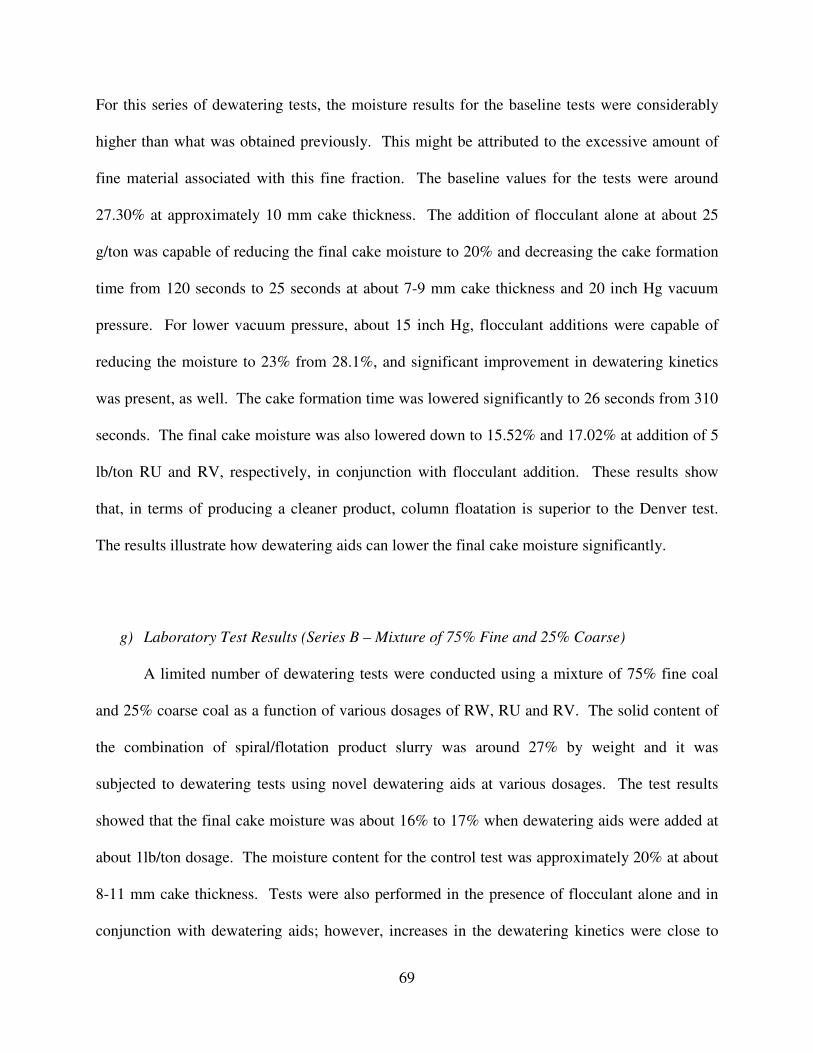
69
For this series of dewatering tests, the moisture results for the baseline tests were considerably
higher than what was obtained previously. This might be attributed to the excessive amount of
fine material associated with this fine fraction. The baseline values for the tests were around
27.30% at approximately 10 mm cake thickness. The addition of flocculant alone at about 25
g/ton was capable of reducing the final cake moisture to 20% and decreasing the cake formation
time from 120 seconds to 25 seconds at about 7-9 mm cake thickness and 20 inch Hg vacuum
pressure. For lower vacuum pressure, about 15 inch Hg, flocculant additions were capable of
reducing the moisture to 23% from 28.1%, and significant improvement in dewatering kinetics
was present, as well. The cake formation time was lowered significantly to 26 seconds from 310
seconds. The final cake moisture was also lowered down to 15.52% and 17.02% at addition of 5
lb/ton RU and RV, respectively, in conjunction with flocculant addition. These results show
that, in terms of producing a cleaner product, column floatation is superior to the Denver test.
The results illustrate how dewatering aids can lower the final cake moisture significantly.
g) Laboratory Test Results (Series B – Mixture of 75% Fine and 25% Coarse)
A limited number of dewatering tests were conducted using a mixture of 75% fine coal
and 25% coarse coal as a function of various dosages of RW, RU and RV. The solid content of
the combination of spiral/flotation product slurry was around 27% by weight and it was
subjected to dewatering tests using novel dewatering aids at various dosages. The test results
showed that the final cake moisture was about 16% to 17% when dewatering aids were added at
about 1lb/ton dosage. The moisture content for the control test was approximately 20% at about
8-11 mm cake thickness. Tests were also performed in the presence of flocculant alone and in
conjunction with dewatering aids; however, increases in the dewatering kinetics were close to
70
those obtained with reagents. Even though the preliminary dewatering test results were
promising, due to the Plant’s request dewatering tests were focused more on flotation or
flotation/spiral mixture samples. Thus, no further tests were done.
h) Laboratory Test Results (Series C – 50% Mixture of Fine and Coarse Coal)
The fine and ultra-fine size fraction of a stream to be dewatered is very influential on
dewatering, which affects the filtration performance. In the dewatering of such particles, lower
moisture percentages are always desirable; however, mechanically, there is a limit to the level of
moisture achievable, regardless of operating parameters, such as the length of the filtration time
or the applied pressure. In filtration, most of the water is held between and on the surfaces of the
particles. Finer particles will create a larger overall surface area and smaller inter-particle
openings, which, in turn, keep more water than coarser size distributions do. As the capillary
filtration model suggests, a filter cake consists of numerous capillaries with a range of diameters.
When the capillary radii are increased, the filtration rate should also increase.[5-8] It can be
achieved either by de-sliming or coarse particle addition into the stream or, in this case, into the
slurry. As mentioned earlier, when the coal slurry was partially or fully deslimed the drainage of
the filter cake was much more efficient, thus lowering the final cake moisture and increasing the
Table 2.8 Effect of flocculant and dewatering aid addition on Mingo Logan floation feed
sample (cleaned using bench-scale column)
Reagent
(lb/ton) Flocculant
(lb/ton)
Moisture (%)
RV RU
0 0 27.30 27.30
0 25 19.99 19.99
0.5 25 18.78 18.55
1 25 19.66 17.41
3 25 19.99 16.55
5 25 17.02 15.52
71
kinetics. Blending coarse particles with fine particles will also increase the capillary radii and
improve the filtration performance. In some coal preparation plants, this is already applied to
increase the dewatering efficiency as an alternative to other means. In fact, currently, Mingo
Logan Coal Preparation Plant has been blending spiral clean coal (18 X 100 mesh) with the finer
flotation clean product (smaller than 100 mesh) at about 1:1 ratio before filtration in dewatering
centrifuges.
The preliminary dewatering test results using RW, RU and RV on one-to-one
spiral/flotation blend product showed that significant cake moisture reduction can be obtained
using novel dewatering aids by about 20.5-28%, while also increasing the rate of dewatering so
much that the formation time could be reduced by as much as 50%. A set of three preliminary
tests was conducted to investigate the effectiveness of the dewatering aids (Table 2.9). The
dosages used were 1, 3 and 5 lb/ton. The baseline tests produced an average of 19% final cake
moisture at about 8mm cake thickness. Even at low dosage, 1lb/ton, when RW, RU and RV was
used, the cake moisture was decreased to 15.6%, 14.4%, and 14.8%, respectively, and the
filtration kinetics were increased by 30-50 %. Of the reagents and dosages being tested, RU was
the most effective for the cake moisture reduction. In this case, the addition of 5 lb/ton RU
reduced the cake moisture from 19.00% to 13.7% which corresponds to 20-30 % overall
moisture reduction.
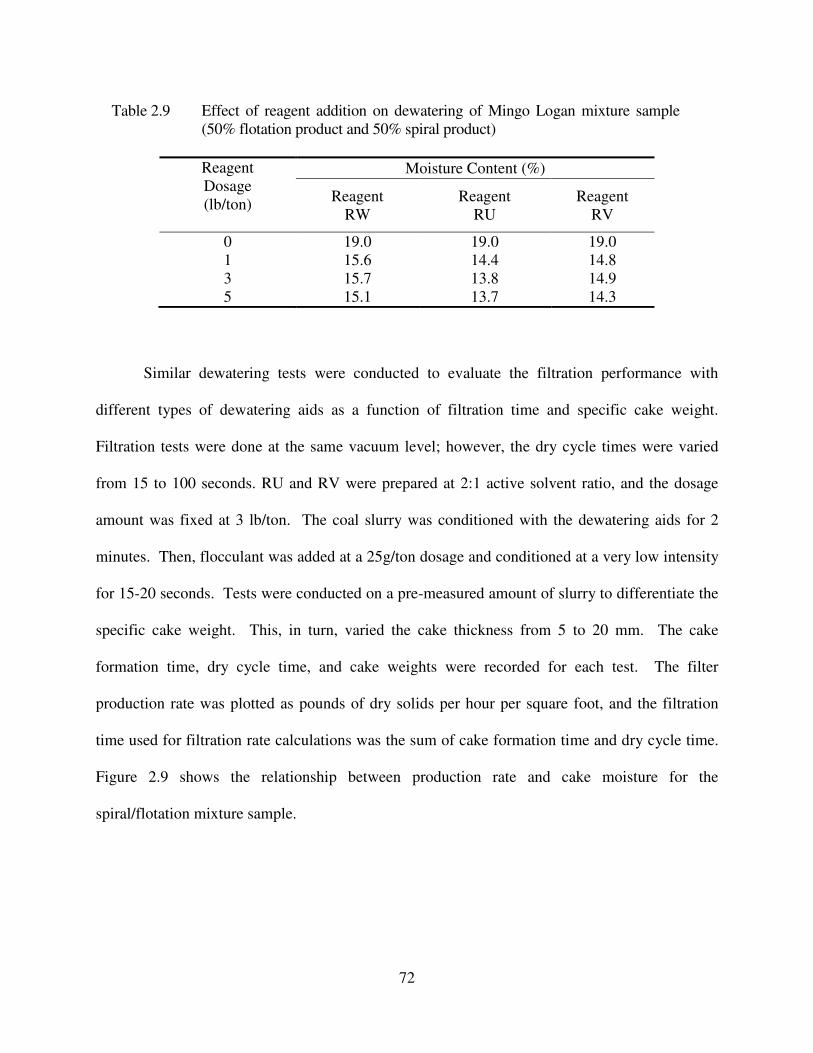
72
Similar dewatering tests were conducted to evaluate the filtration performance with
different types of dewatering aids as a function of filtration time and specific cake weight.
Filtration tests were done at the same vacuum level; however, the dry cycle times were varied
from 15 to 100 seconds. RU and RV were prepared at 2:1 active solvent ratio, and the dosage
amount was fixed at 3 lb/ton. The coal slurry was conditioned with the dewatering aids for 2
minutes. Then, flocculant was added at a 25g/ton dosage and conditioned at a very low intensity
for 15-20 seconds. Tests were conducted on a pre-measured amount of slurry to differentiate the
specific cake weight. This, in turn, varied the cake thickness from 5 to 20 mm. The cake
formation time, dry cycle time, and cake weights were recorded for each test. The filter
production rate was plotted as pounds of dry solids per hour per square foot, and the filtration
time used for filtration rate calculations was the sum of cake formation time and dry cycle time.
Figure 2.9 shows the relationship between production rate and cake moisture for the
spiral/flotation mixture sample.
Table 2.9 Effect of reagent addition on dewatering of Mingo Logan mixture sample
(50% flotation product and 50% spiral product)
Reagent
Dosage
(lb/ton)
Moisture Content (%)
Reagent
RW
Reagent
RU
Reagent
RV
0 19.0 19.0 19.0
1 15.6 14.4 14.8
3 15.7 13.8 14.9
5 15.1 13.7 14.3
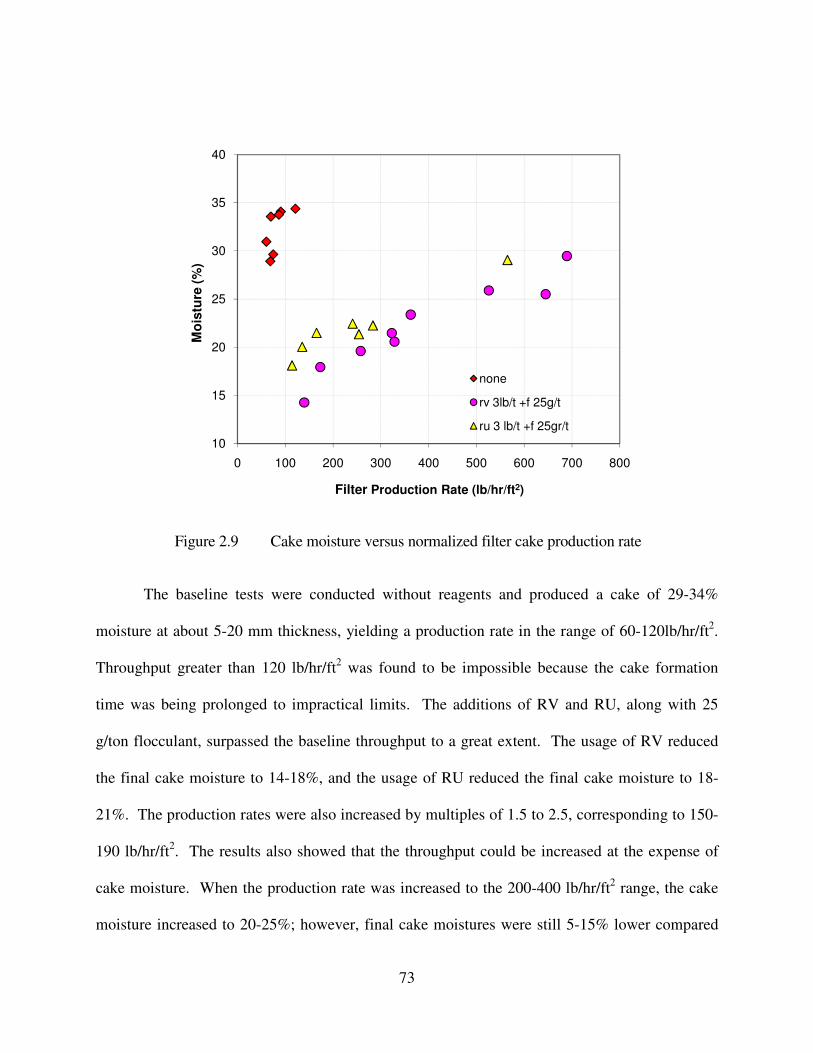
73
The baseline tests were conducted without reagents and produced a cake of 29-34%
moisture at about 5-20 mm thickness, yielding a production rate in the range of 60-120lb/hr/ft2.
Throughput greater than 120 lb/hr/ft2 was found to be impossible because the cake formation
time was being prolonged to impractical limits. The additions of RV and RU, along with 25
g/ton flocculant, surpassed the baseline throughput to a great extent. The usage of RV reduced
the final cake moisture to 14-18%, and the usage of RU reduced the final cake moisture to 18-
21%. The production rates were also increased by multiples of 1.5 to 2.5, corresponding to 150-
190 lb/hr/ft2. The results also showed that the throughput could be increased at the expense of
cake moisture. When the production rate was increased to the 200-400 lb/hr/ft2 range, the cake
moisture increased to 20-25%; however, final cake moistures were still 5-15% lower compared
Figure 2.9 Cake moisture versus normalized filter cake production rate
10
15
20
25
30
35
40
0 100 200 300 400 500 600 700 800
Mo
istu
re (
%)
Filter Production Rate (lb/hr/ft2)
none
rv 3lb/t +f 25g/t
ru 3 lb/t +f 25gr/t
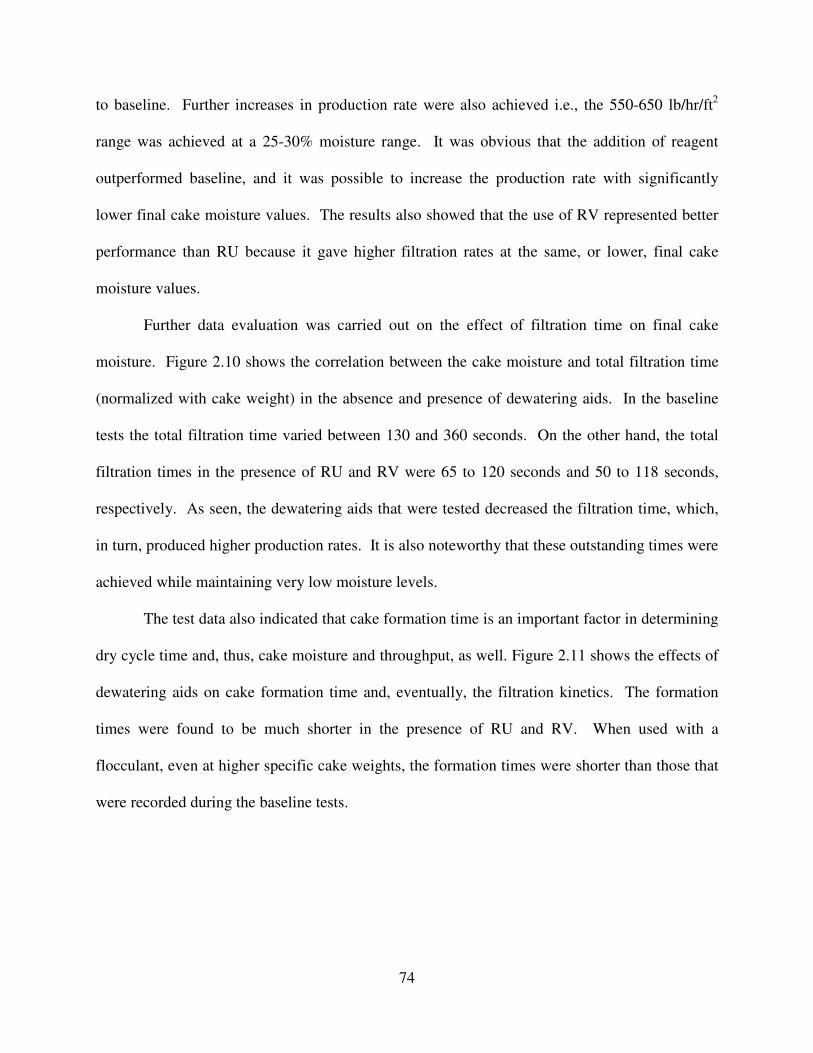
74
to baseline. Further increases in production rate were also achieved i.e., the 550-650 lb/hr/ft2
range was achieved at a 25-30% moisture range. It was obvious that the addition of reagent
outperformed baseline, and it was possible to increase the production rate with significantly
lower final cake moisture values. The results also showed that the use of RV represented better
performance than RU because it gave higher filtration rates at the same, or lower, final cake
moisture values.
Further data evaluation was carried out on the effect of filtration time on final cake
moisture. Figure 2.10 shows the correlation between the cake moisture and total filtration time
(normalized with cake weight) in the absence and presence of dewatering aids. In the baseline
tests the total filtration time varied between 130 and 360 seconds. On the other hand, the total
filtration times in the presence of RU and RV were 65 to 120 seconds and 50 to 118 seconds,
respectively. As seen, the dewatering aids that were tested decreased the filtration time, which,
in turn, produced higher production rates. It is also noteworthy that these outstanding times were
achieved while maintaining very low moisture levels.
The test data also indicated that cake formation time is an important factor in determining
dry cycle time and, thus, cake moisture and throughput, as well. Figure 2.11 shows the effects of
dewatering aids on cake formation time and, eventually, the filtration kinetics. The formation
times were found to be much shorter in the presence of RU and RV. When used with a
flocculant, even at higher specific cake weights, the formation times were shorter than those that
were recorded during the baseline tests.
75
As seen in Figure 2.11, only 10-15 seconds were required to produce 4.5 lb/ft2 of coal
when dewatering aids were used; however, in baseline tests, approximately 100-120 seconds
were needed for the same coal production. When the cake weight was increased to 7 lb/ft2, the
cake formation time was 20 seconds using dewatering aids, where it was 340 seconds for
baseline test. Cake weights above 5 lb/ft2 were found to be impractical for dewatering in the
absence of dewatering aids. Conversely, it was still possible to produce a cake weight of 11
lb/ft2 while maintaining a short cake formation time. The results showed that the use of
dewatering aids decreased the cake formation time by several multiples. The usage of
dewatering aids also substantially improved the throughput. This is a strong indication that in
the presence of dewatering aids, more material can be treated.
Figure 2.10 Cake moisture versus normalized filtration time
10
15
20
25
30
35
40
0 0.005 0.01 0.015 0.02
Mo
istu
re (
%)
Time (hr/lbft2)
none
RV 3lb/t + 25 g/t F
RU 3lb/t + 25 g/t F
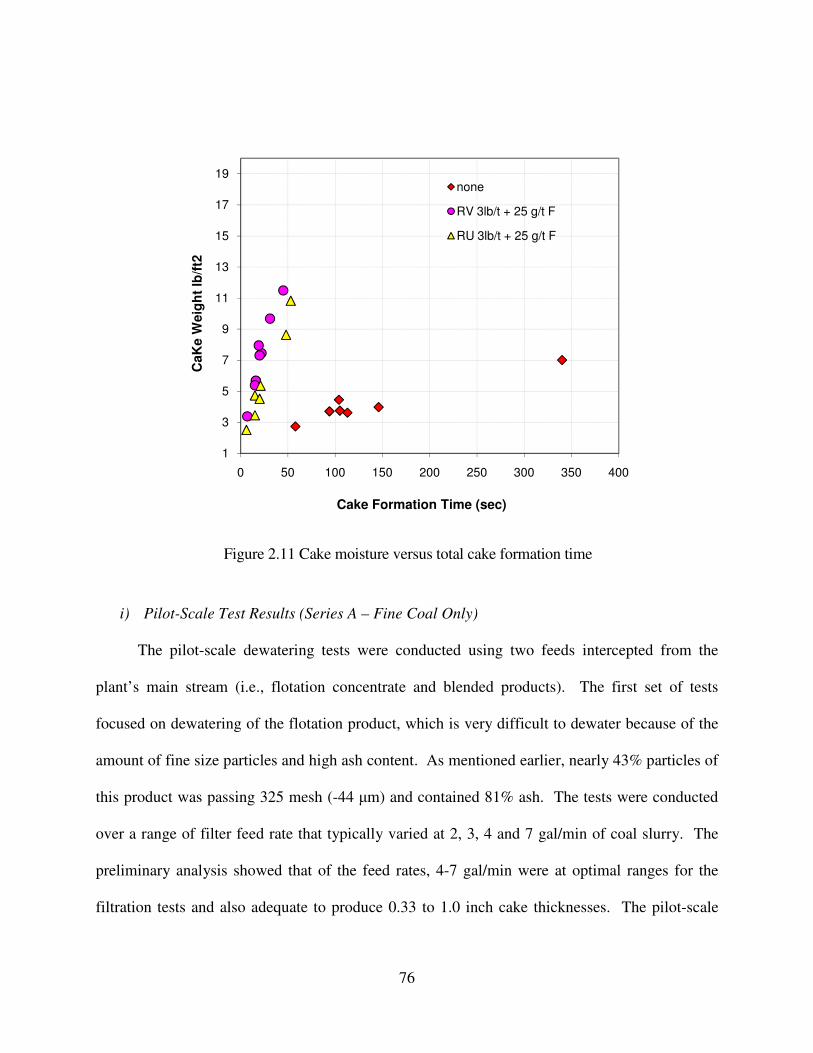
76
i) Pilot-Scale Test Results (Series A – Fine Coal Only)
The pilot-scale dewatering tests were conducted using two feeds intercepted from the
plant’s main stream (i.e., flotation concentrate and blended products). The first set of tests
focused on dewatering of the flotation product, which is very difficult to dewater because of the
amount of fine size particles and high ash content. As mentioned earlier, nearly 43% particles of
this product was passing 325 mesh (-44 µm) and contained 81% ash. The tests were conducted
over a range of filter feed rate that typically varied at 2, 3, 4 and 7 gal/min of coal slurry. The
preliminary analysis showed that of the feed rates, 4-7 gal/min were at optimal ranges for the
filtration tests and also adequate to produce 0.33 to 1.0 inch cake thicknesses. The pilot-scale
Figure 2.11 Cake moisture versus total cake formation time
1
3
5
7
9
11
13
15
17
19
0 50 100 150 200 250 300 350 400
CaK
e W
eig
ht
lb/f
t2
Cake Formation Time (sec)
none
RV 3lb/t + 25 g/t F
RU 3lb/t + 25 g/t F
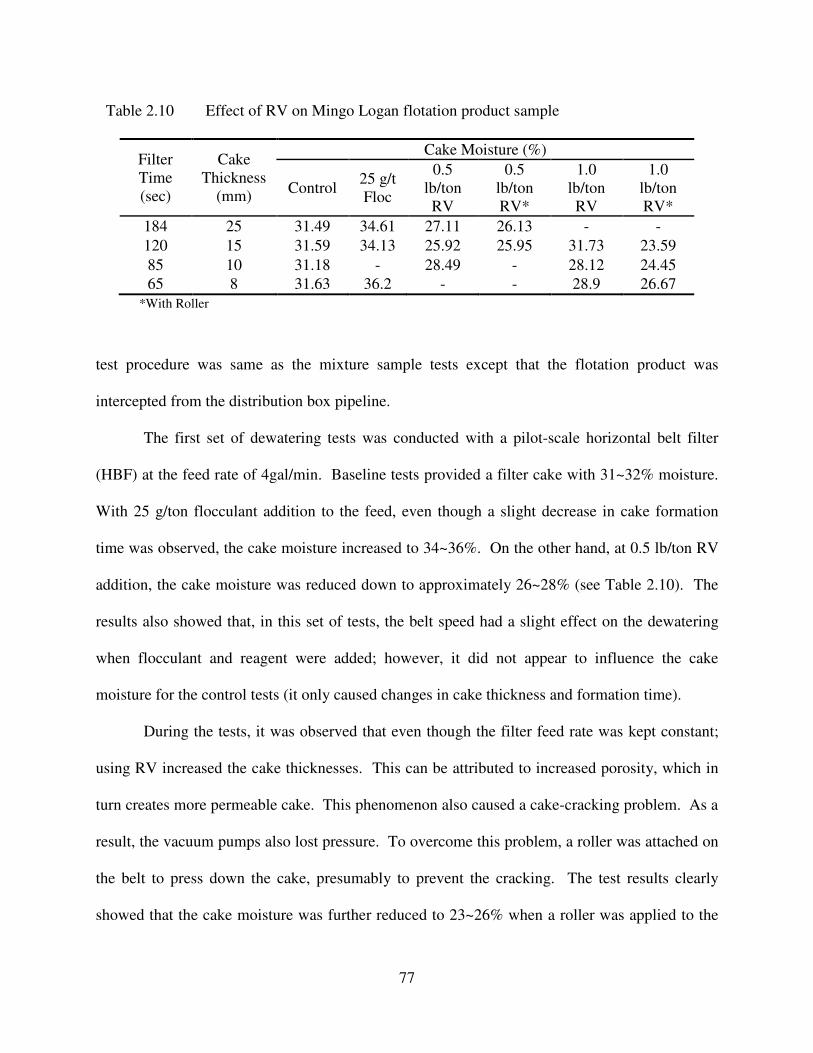
77
test procedure was same as the mixture sample tests except that the flotation product was
intercepted from the distribution box pipeline.
The first set of dewatering tests was conducted with a pilot-scale horizontal belt filter
(HBF) at the feed rate of 4gal/min. Baseline tests provided a filter cake with 31~32% moisture.
With 25 g/ton flocculant addition to the feed, even though a slight decrease in cake formation
time was observed, the cake moisture increased to 34~36%. On the other hand, at 0.5 lb/ton RV
addition, the cake moisture was reduced down to approximately 26~28% (see Table 2.10). The
results also showed that, in this set of tests, the belt speed had a slight effect on the dewatering
when flocculant and reagent were added; however, it did not appear to influence the cake
moisture for the control tests (it only caused changes in cake thickness and formation time).
During the tests, it was observed that even though the filter feed rate was kept constant;
using RV increased the cake thicknesses. This can be attributed to increased porosity, which in
turn creates more permeable cake. This phenomenon also caused a cake-cracking problem. As a
result, the vacuum pumps also lost pressure. To overcome this problem, a roller was attached on
the belt to press down the cake, presumably to prevent the cracking. The test results clearly
showed that the cake moisture was further reduced to 23~26% when a roller was applied to the
Table 2.10 Effect of RV on Mingo Logan flotation product sample
Filter
Time
(sec)
Cake
Thickness
(mm)
Cake Moisture (%)
Control 25 g/t
Floc
0.5
lb/ton
RV
0.5
lb/ton
RV*
1.0
lb/ton
RV
1.0
lb/ton
RV*
184 25 31.49 34.61 27.11 26.13 - -
120 15 31.59 34.13 25.92 25.95 31.73 23.59
85 10 31.18 - 28.49 - 28.12 24.45
65 8 31.63 36.2 - - 28.9 26.67
*With Roller
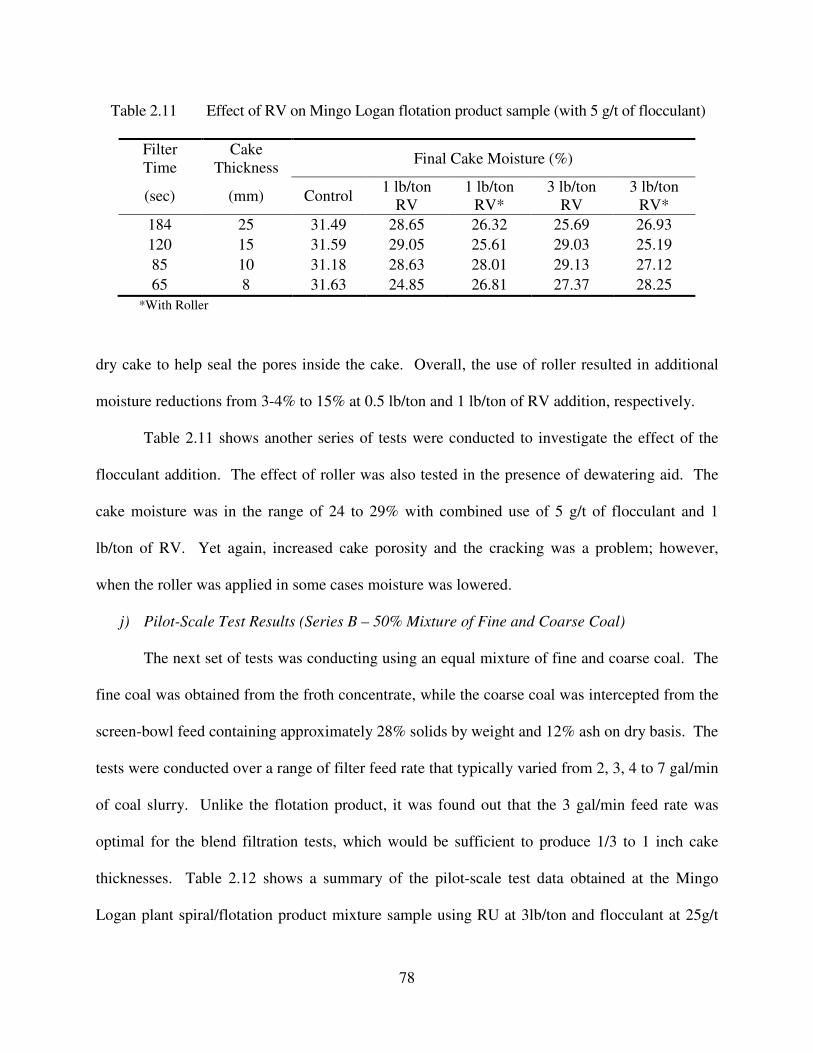
78
dry cake to help seal the pores inside the cake. Overall, the use of roller resulted in additional
moisture reductions from 3-4% to 15% at 0.5 lb/ton and 1 lb/ton of RV addition, respectively.
Table 2.11 shows another series of tests were conducted to investigate the effect of the
flocculant addition. The effect of roller was also tested in the presence of dewatering aid. The
cake moisture was in the range of 24 to 29% with combined use of 5 g/t of flocculant and 1
lb/ton of RV. Yet again, increased cake porosity and the cracking was a problem; however,
when the roller was applied in some cases moisture was lowered.
j) Pilot-Scale Test Results (Series B – 50% Mixture of Fine and Coarse Coal)
The next set of tests was conducting using an equal mixture of fine and coarse coal. The
fine coal was obtained from the froth concentrate, while the coarse coal was intercepted from the
screen-bowl feed containing approximately 28% solids by weight and 12% ash on dry basis. The
tests were conducted over a range of filter feed rate that typically varied from 2, 3, 4 to 7 gal/min
of coal slurry. Unlike the flotation product, it was found out that the 3 gal/min feed rate was
optimal for the blend filtration tests, which would be sufficient to produce 1/3 to 1 inch cake
thicknesses. Table 2.12 shows a summary of the pilot-scale test data obtained at the Mingo
Logan plant spiral/flotation product mixture sample using RU at 3lb/ton and flocculant at 25g/t
Table 2.11 Effect of RV on Mingo Logan flotation product sample (with 5 g/t of flocculant)
Filter
Time
Cake
Thickness Final Cake Moisture (%)
(sec) (mm) Control 1 lb/ton
RV
1 lb/ton
RV*
3 lb/ton
RV
3 lb/ton
RV*
184 25 31.49 28.65 26.32 25.69 26.93
120 15 31.59 29.05 25.61 29.03 25.19
85 10 31.18 28.63 28.01 29.13 27.12
65 8 31.63 24.85 26.81 27.37 28.25
*With Roller
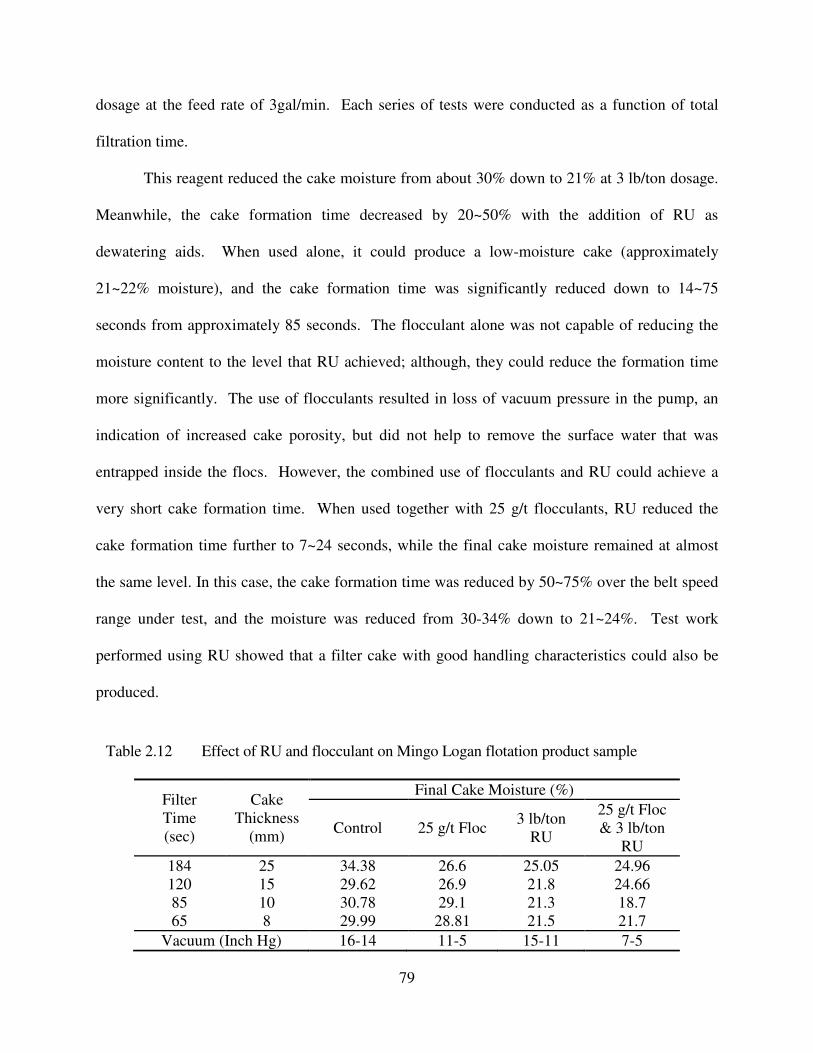
79
dosage at the feed rate of 3gal/min. Each series of tests were conducted as a function of total
filtration time.
This reagent reduced the cake moisture from about 30% down to 21% at 3 lb/ton dosage.
Meanwhile, the cake formation time decreased by 20~50% with the addition of RU as
dewatering aids. When used alone, it could produce a low-moisture cake (approximately
21~22% moisture), and the cake formation time was significantly reduced down to 14~75
seconds from approximately 85 seconds. The flocculant alone was not capable of reducing the
moisture content to the level that RU achieved; although, they could reduce the formation time
more significantly. The use of flocculants resulted in loss of vacuum pressure in the pump, an
indication of increased cake porosity, but did not help to remove the surface water that was
entrapped inside the flocs. However, the combined use of flocculants and RU could achieve a
very short cake formation time. When used together with 25 g/t flocculants, RU reduced the
cake formation time further to 7~24 seconds, while the final cake moisture remained at almost
the same level. In this case, the cake formation time was reduced by 50~75% over the belt speed
range under test, and the moisture was reduced from 30-34% down to 21~24%. Test work
performed using RU showed that a filter cake with good handling characteristics could also be
produced.
Table 2.12 Effect of RU and flocculant on Mingo Logan flotation product sample
Filter
Time
(sec)
Cake
Thickness
(mm)
Final Cake Moisture (%)
Control 25 g/t Floc 3 lb/ton
RU
25 g/t Floc
& 3 lb/ton
RU
184 25 34.38 26.6 25.05 24.96
120 15 29.62 26.9 21.8 24.66
85 10 30.78 29.1 21.3 18.7
65 8 29.99 28.81 21.5 21.7
Vacuum (Inch Hg) 16-14 11-5 15-11 7-5
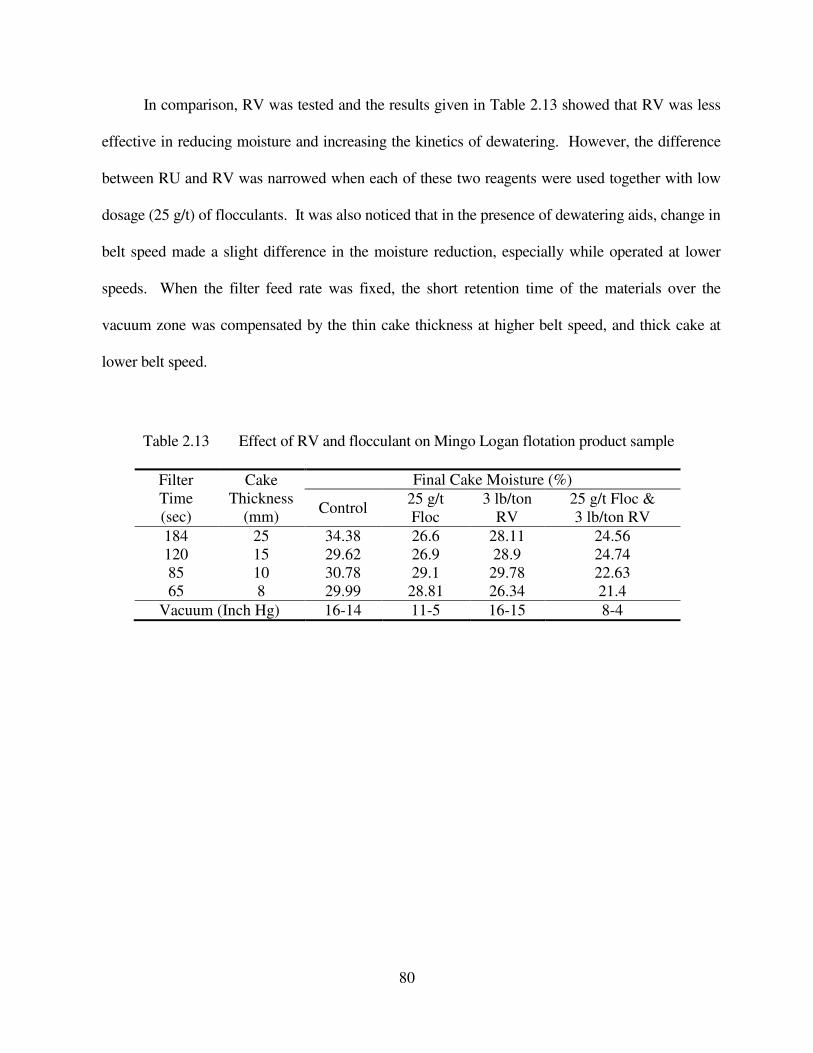
80
In comparison, RV was tested and the results given in Table 2.13 showed that RV was less
effective in reducing moisture and increasing the kinetics of dewatering. However, the difference
between RU and RV was narrowed when each of these two reagents were used together with low
dosage (25 g/t) of flocculants. It was also noticed that in the presence of dewatering aids, change in
belt speed made a slight difference in the moisture reduction, especially while operated at lower
speeds. When the filter feed rate was fixed, the short retention time of the materials over the
vacuum zone was compensated by the thin cake thickness at higher belt speed, and thick cake at
lower belt speed.
Table 2.13 Effect of RV and flocculant on Mingo Logan flotation product sample
Filter
Time
(sec)
Cake
Thickness
(mm)
Final Cake Moisture (%)
Control 25 g/t
Floc
3 lb/ton
RV
25 g/t Floc &
3 lb/ton RV
184 25 34.38 26.6 28.11 24.56
120 15 29.62 26.9 28.9 24.74
85 10 30.78 29.1 29.78 22.63
65 8 29.99 28.81 26.34 21.4
Vacuum (Inch Hg) 16-14 11-5 16-15 8-4
81
2.3.3. Coal Clean Site
a) Site Descripton
The Coal Clean Panther Preparation Plant is located in Dry Branch, approximately 15
miles south of Charleston, West Virginia. The Panther Preparation Plant currently processes 63
mm x 0 raw coal for ultimate use in the metallurgical and steam markets. The minus 325 mesh
size fraction material reports to the discard stream without any type of processing method.
However, if this size fraction is recovered and dewatered, loss of valuable source could be turned
into profit. For this reason the plant management looked for alternatives for the recovery of the
minus 325 mesh coal that is presently discarded to refuse. To evaluate the feasibility of the
recovery and dewatering of this size fraction, extensive pilot scale flotation and dewatering tests
were conducted. A number of tests with pilot scale centrifuge unit were conducted for
comparison reasons.
b) Reagents
In this investigation, majority of the pilot scale dewatering tests were performed with
varying amounts of three types of dewatering aids, namely RW, RU and RA. Diesel was used as
solvent at one to two (1:2) ratio (dewatering aid: solvent). Each of the reagents were tested over
a range of dosages typically ranging from 0 to 20 pounds per ton for the ratios of the ultra-fine
and fine products in the feed to the Filter Module and the Centrifuge Module.
c) Coal Samples
For this particular test site, pilot-scale dewatering tests were conducted on feeds comprised
of different mixtures of coarse and fine coal feeds. These included (i) 100 mesh x 0 feed stream
from the overflow of the primary classifying cyclones, (ii) 325 mesh x 0 feed raw stream, and
(iii) blends of 100 mesh x 325 and minus 325 mesh product from the flotation column. The
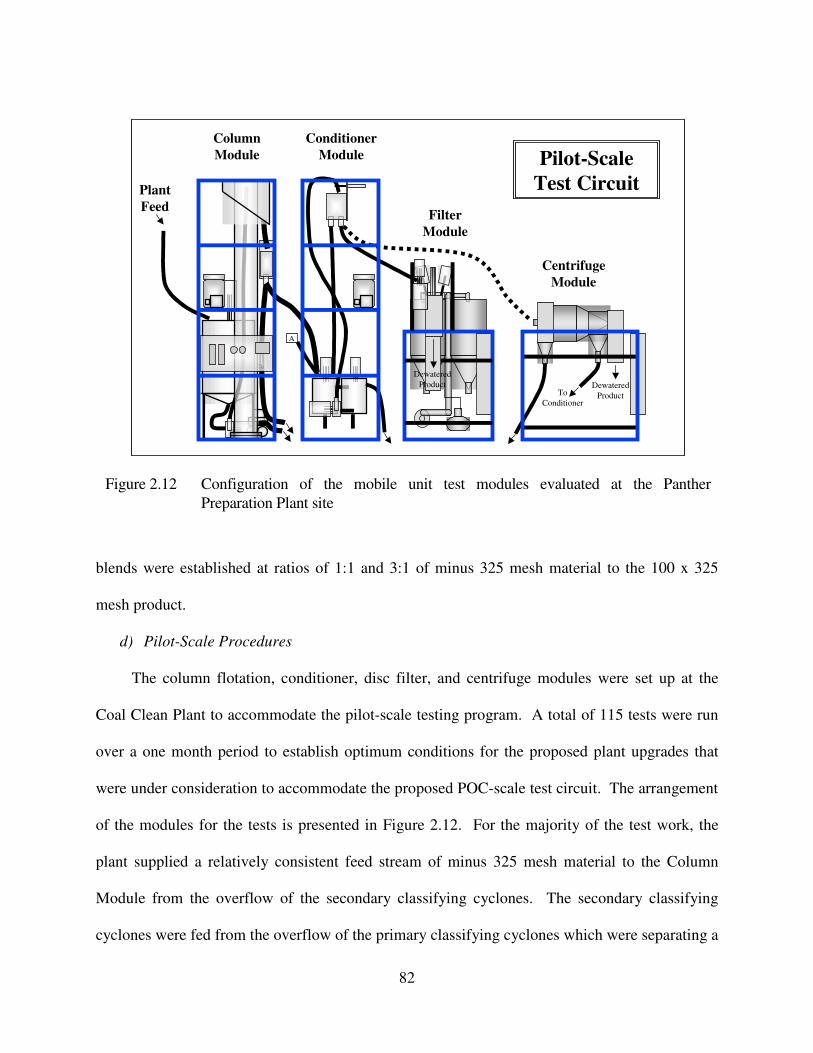
82
blends were established at ratios of 1:1 and 3:1 of minus 325 mesh material to the 100 x 325
mesh product.
d) Pilot-Scale Procedures
The column flotation, conditioner, disc filter, and centrifuge modules were set up at the
Coal Clean Plant to accommodate the pilot-scale testing program. A total of 115 tests were run
over a one month period to establish optimum conditions for the proposed plant upgrades that
were under consideration to accommodate the proposed POC-scale test circuit. The arrangement
of the modules for the tests is presented in Figure 2.12. For the majority of the test work, the
plant supplied a relatively consistent feed stream of minus 325 mesh material to the Column
Module from the overflow of the secondary classifying cyclones. The secondary classifying
cyclones were fed from the overflow of the primary classifying cyclones which were separating a
Figure 2.12 Configuration of the mobile unit test modules evaluated at the Panther
Preparation Plant site
A
Column
Module
Conditioner
Module
Filter
Module
Plant
Feed
To
Conditioner
Dewatered
Product
Dewatered
Product
Centrifuge
Module
Pilot-Scale
Test Circuit
83
16 mesh x 0 slurry stream at a nominal size of 100 mesh. The underflow from the secondary
classifying cyclones reported to a bank of conventional flotation cells and the overflow was
discarded to the refuse thickener. A series of tests was also conducted on the 100 mesh x 0 feed
stream from the overflow of the primary classifying cyclones. The minus 325 mesh raw feed
was cleaned in the Column Module, with the clean coal routed to the Conditioner Module. The
conditioned slurry was then dewatered in either the Filter Module or the Centrifuge Module.
The Panther Preparation Plant offered a unique opportunity to conduct a series of tests with
various blends of 100 mesh x 325 mesh conventional flotation product added to the minus 325
mesh product from the Column Module. The projected blends were established at ratios of 1:1
and 3:1 of minus 325 mesh material to the 100 x 325 mesh product. Maintaining the blend at the
various ratios proved somewhat difficult due to the changing flows for the products, but most of
the tests were conducted within 5% of the projected blend. Although the Filter Module and the
Centrifuge Module were not operated at the same time, the tests included almost the same sweep
of reagent tests for both modules.
e) Pilot-Scale Test Results
Table 2.14 presents the results for dewatering tests with various reagents while
dewatering the minus 325 mesh product in the Filter Module. The sample was first floated using
a mixture of Nalco 01DU113 (0.25 unit) + 01DU145 (1.0 unit) as collector and Nalco-948 as
frother (9 units) in a flotation column. The solids content in the filter feed ranged from 4-5% by
weight. For dewatering tests, RW, RU and RA were used as dewatering aids at various dosages.
The vacuum pressure was approximately 20.5 to 23.0 inches Hg; and the cake thickness was
around 6-7 mm. The results indicate that the baseline moisture content of the filter cake (with no
reagent) was very consistent and it was approximately 29.0%. This value was reduced to 27.5%,
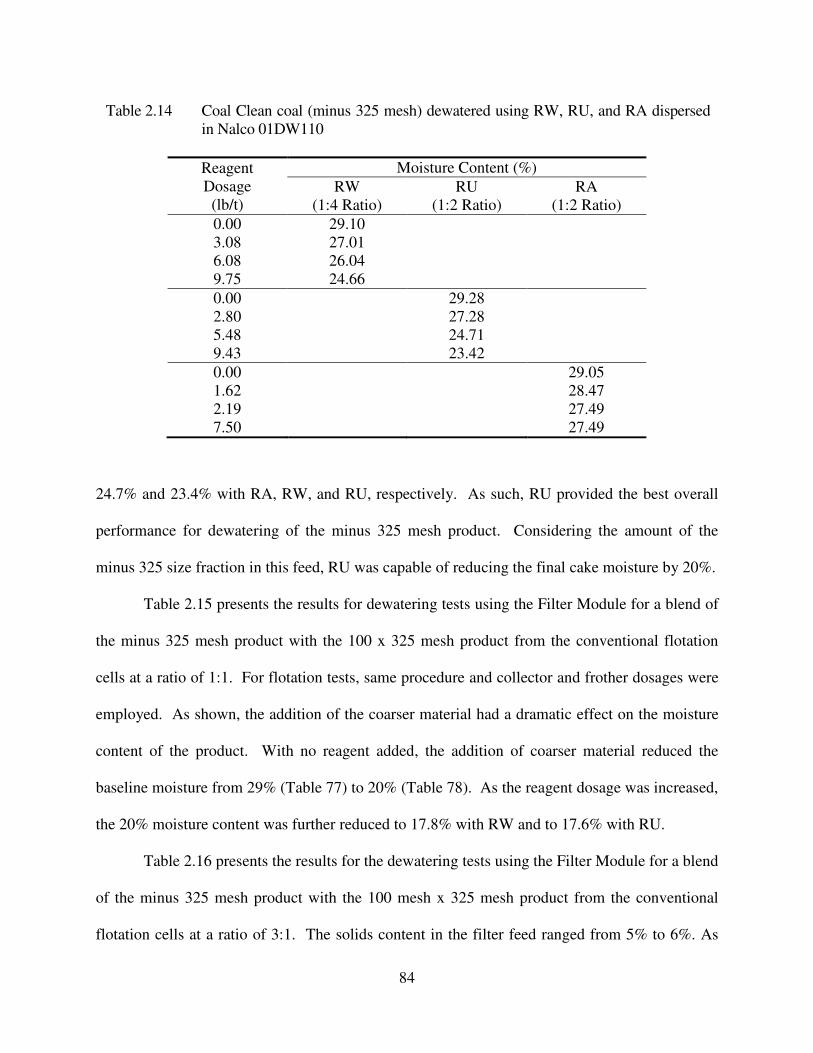
84
24.7% and 23.4% with RA, RW, and RU, respectively. As such, RU provided the best overall
performance for dewatering of the minus 325 mesh product. Considering the amount of the
minus 325 size fraction in this feed, RU was capable of reducing the final cake moisture by 20%.
Table 2.15 presents the results for dewatering tests using the Filter Module for a blend of
the minus 325 mesh product with the 100 x 325 mesh product from the conventional flotation
cells at a ratio of 1:1. For flotation tests, same procedure and collector and frother dosages were
employed. As shown, the addition of the coarser material had a dramatic effect on the moisture
content of the product. With no reagent added, the addition of coarser material reduced the
baseline moisture from 29% (Table 77) to 20% (Table 78). As the reagent dosage was increased,
the 20% moisture content was further reduced to 17.8% with RW and to 17.6% with RU.
Table 2.16 presents the results for the dewatering tests using the Filter Module for a blend
of the minus 325 mesh product with the 100 mesh x 325 mesh product from the conventional
flotation cells at a ratio of 3:1. The solids content in the filter feed ranged from 5% to 6%. As
Table 2.15. Coal Clean coal (50% minus 325 mesh and 50% 100x325 mesh) dewatered using
RW and RU dispersed in Nalco O1DW110
.
Reagent
Dosage
(lb/t)
Moisture Content (%)
RW
(1:2 Ratio)
RU
(1:2 Ratio)
0.00 19.98
1.98 19.82
4.47 17.76
0.00 19.98
2.80 18.26
5.40 17.93
7.95 17.65
Table 2.14 Coal Clean coal (minus 325 mesh) dewatered using RW, RU, and RA dispersed
in Nalco 01DW110
Reagent
Dosage
(lb/t)
Moisture Content (%)
RW
(1:4 Ratio)
RU
(1:2 Ratio)
RA
(1:2 Ratio)
0.00 29.10
3.08 27.01
6.08 26.04
9.75 24.66
0.00 29.28
2.80 27.28
5.48 24.71
9.43 23.42
0.00 29.05
1.62 28.47
2.19 27.49
7.50 27.49
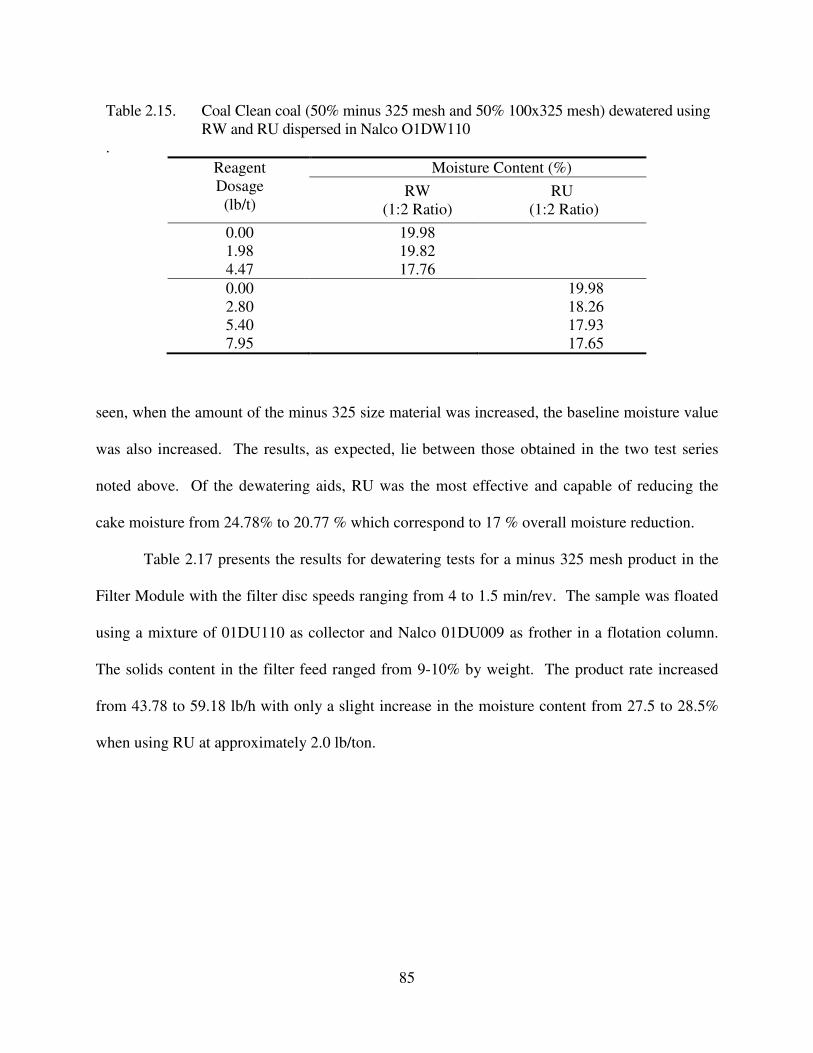
85
seen, when the amount of the minus 325 size material was increased, the baseline moisture value
was also increased. The results, as expected, lie between those obtained in the two test series
noted above. Of the dewatering aids, RU was the most effective and capable of reducing the
cake moisture from 24.78% to 20.77 % which correspond to 17 % overall moisture reduction.
Table 2.17 presents the results for dewatering tests for a minus 325 mesh product in the
Filter Module with the filter disc speeds ranging from 4 to 1.5 min/rev. The sample was floated
using a mixture of 01DU110 as collector and Nalco 01DU009 as frother in a flotation column.
The solids content in the filter feed ranged from 9-10% by weight. The product rate increased
from 43.78 to 59.18 lb/h with only a slight increase in the moisture content from 27.5 to 28.5%
when using RU at approximately 2.0 lb/ton.
Table 2.15. Coal Clean coal (50% minus 325 mesh and 50% 100x325 mesh) dewatered using
RW and RU dispersed in Nalco O1DW110
.
Reagent
Dosage
(lb/t)
Moisture Content (%)
RW
(1:2 Ratio)
RU
(1:2 Ratio)
0.00 19.98
1.98 19.82
4.47 17.76
0.00 19.98
2.80 18.26
5.40 17.93
7.95 17.65
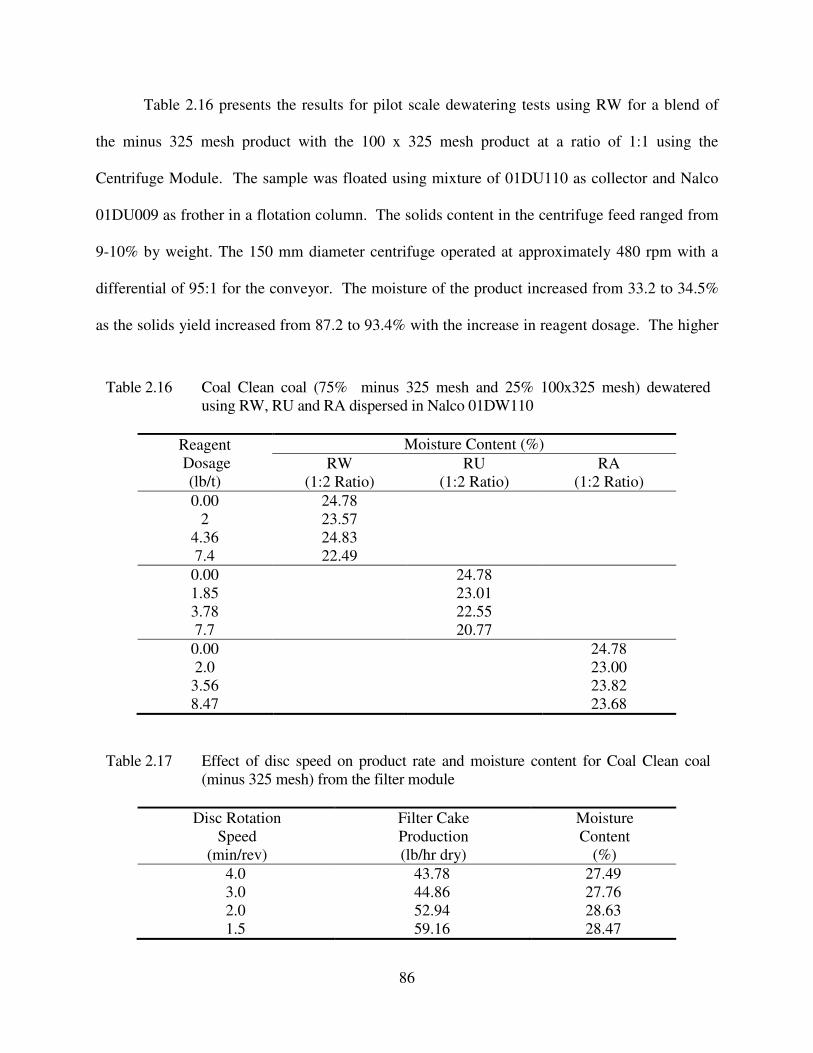
86
Table 2.16 presents the results for pilot scale dewatering tests using RW for a blend of
the minus 325 mesh product with the 100 x 325 mesh product at a ratio of 1:1 using the
Centrifuge Module. The sample was floated using mixture of 01DU110 as collector and Nalco
01DU009 as frother in a flotation column. The solids content in the centrifuge feed ranged from
9-10% by weight. The 150 mm diameter centrifuge operated at approximately 480 rpm with a
differential of 95:1 for the conveyor. The moisture of the product increased from 33.2 to 34.5%
as the solids yield increased from 87.2 to 93.4% with the increase in reagent dosage. The higher
Table 2.16 Coal Clean coal (75% minus 325 mesh and 25% 100x325 mesh) dewatered
using RW, RU and RA dispersed in Nalco 01DW110
Reagent
Dosage
(lb/t)
Moisture Content (%)
RW
(1:2 Ratio)
RU
(1:2 Ratio)
RA
(1:2 Ratio)
0.00 24.78
2 23.57
4.36 24.83
7.4 22.49
0.00 24.78
1.85 23.01
3.78 22.55
7.7 20.77
0.00 24.78
2.0 23.00
3.56 23.82
8.47 23.68
Table 2.17 Effect of disc speed on product rate and moisture content for Coal Clean coal
(minus 325 mesh) from the filter module
Disc Rotation
Speed
(min/rev)
Filter Cake
Production
(lb/hr dry)
Moisture
Content
(%)
4.0 43.78 27.49
3.0 44.86 27.76
2.0 52.94 28.63
1.5 59.16 28.47
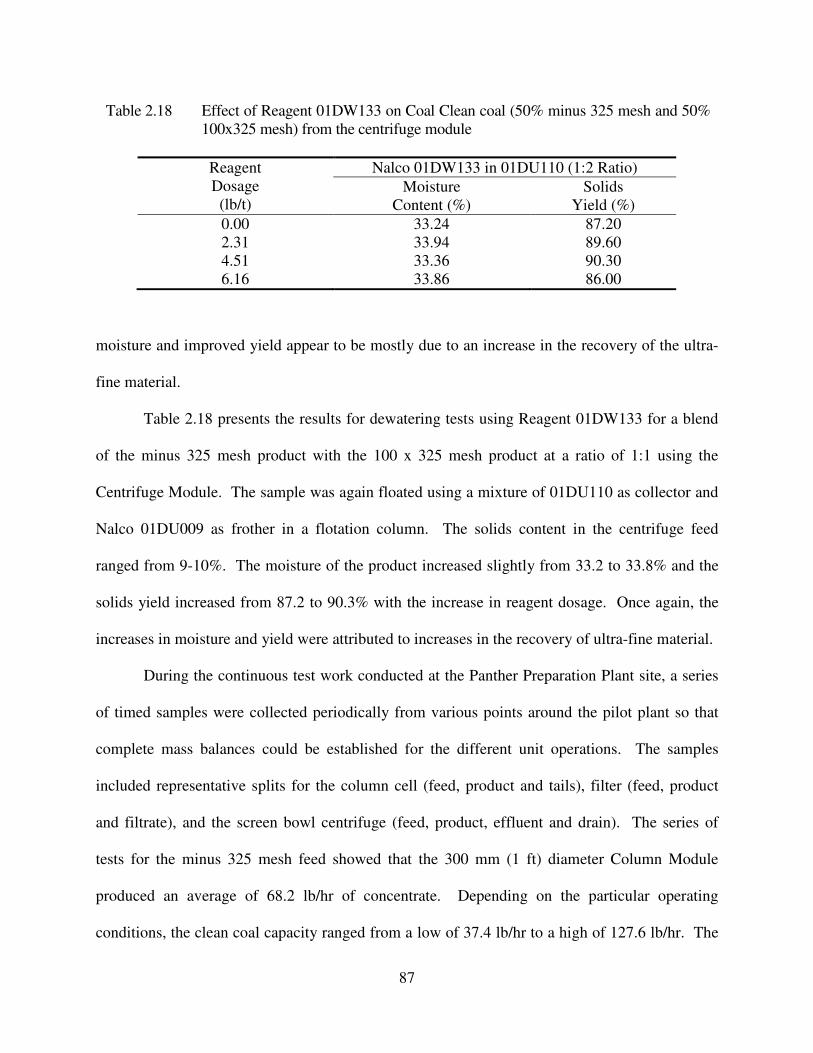
87
moisture and improved yield appear to be mostly due to an increase in the recovery of the ultra-
fine material.
Table 2.18 presents the results for dewatering tests using Reagent 01DW133 for a blend
of the minus 325 mesh product with the 100 x 325 mesh product at a ratio of 1:1 using the
Centrifuge Module. The sample was again floated using a mixture of 01DU110 as collector and
Nalco 01DU009 as frother in a flotation column. The solids content in the centrifuge feed
ranged from 9-10%. The moisture of the product increased slightly from 33.2 to 33.8% and the
solids yield increased from 87.2 to 90.3% with the increase in reagent dosage. Once again, the
increases in moisture and yield were attributed to increases in the recovery of ultra-fine material.
During the continuous test work conducted at the Panther Preparation Plant site, a series
of timed samples were collected periodically from various points around the pilot plant so that
complete mass balances could be established for the different unit operations. The samples
included representative splits for the column cell (feed, product and tails), filter (feed, product
and filtrate), and the screen bowl centrifuge (feed, product, effluent and drain). The series of
tests for the minus 325 mesh feed showed that the 300 mm (1 ft) diameter Column Module
produced an average of 68.2 lb/hr of concentrate. Depending on the particular operating
conditions, the clean coal capacity ranged from a low of 37.4 lb/hr to a high of 127.6 lb/hr. The
Table 2.18 Effect of Reagent 01DW133 on Coal Clean coal (50% minus 325 mesh and 50%
100x325 mesh) from the centrifuge module
Reagent
Dosage
(lb/t)
Nalco 01DW133 in 01DU110 (1:2 Ratio)
Moisture
Content (%)
Solids
Yield (%)
0.00 33.24 87.20
2.31 33.94 89.60
4.51 33.36 90.30
6.16 33.86 86.00
88
grade of the concentrate averaged 10.4% ash and ranged from 3% to18% ash, while the
combustible recovery averaged 83.0% and ranged from 35.7% to 92.9%. The feed ash averaged
40.8% ash and ranged from 32.6% to 53.6% ash. The 0.2 m2 (2 ft
2) Filter Module produced
from 33 to 59.4 lb/hr of cake and the 150 mm diameter Centrifuge Module produced from 10.12
to 52.36 lb/hr of product from feed streams containing between 2.1-16.7% solids by weight.
89
2.3.4. Concord Site
a) Site Description
The Concord Coal plant is located near Birmingham, Alabama. This facility processed
50 mm x 0 coal for the metallurgical and steam markets, with a design plant feed rate of 1,000
tph and typical clean coal yields of 55%-60%. The intermediate/fine coal circuit consists of
primary classifying cyclones (PCC), spirals, secondary classifying cyclones (SCC), froth
flotation, and screen bowl centrifuges. The overflow from the PCCs is fed to the SCCs; the SCC
underflow is the feed stream to flotation (4 banks of five 180-ft3 cells), while the SCC overflow
is piped to a refuse thickener. The coal being processed is very soft and fine in size consist and
the feed to the flotation cells can be as much as twice that of the design flowsheet rate (design 54
t/hr vs. actual 80-100 t/hr). The feed to the flotation cells is approximately 80% minus 325 mesh
(0.045 mm). The flotation and spiral clean-coal products are combined and then dewatered via
four 44” x 132” screen bowl centrifuges with a total design feed rate of 2,200 gal/min and 242
t/hr.
The primary objectives of the test program were to determine whether (i) a thick and low-
moisture filter cake and (ii) a filter cake with good material handling characteristics could be
produced from the minus 100 mesh flotation feed stream (primary cyclone overflow) that is
currently processed in conventional flotation cells and centrifuges at this plant. To meet these
objectives, extensive laboratory and pilot scale flotation and dewatering test program was
conducted at Virginia Tech Mineral Processing Facility in Virginia, and at the Concord coal
preparation plant in Alabama. The laboratory tests included the performance evaluation of
various types and dosages of dewatering aids to collect dewatering data that could be used in
90
direct support of pilot-scale test work. The data obtained from the laboratory tests were used to
provide a technical guidance for the pilot scale test program.
b) Reagents
The laboratory and pilot scale tests included both the flotation and dewatering tests. For
laboratory flotation tests, diesel and MIBC were used as collector and frother, respectively. The
floated sample was then subjected to dewatering tests using RW3 and RV. For pilot-scale
flotation tests RW, RU, RV and diesel as collectors and Nalco DU009 as frother were used. The
same reagents were used as the dewatering aids in filter tests. Each of the reagents was tested
over a range of dosages that typically varied from 0 to10 lb/ton of dry coal. As mentioned
elsewhere, these dewatering aids are insoluble in water. For all the tests, flotation and
dewatering, diesel was used as solvent at one to two (1:2) dewatering aid-to-diesel ratio.
c) Coal Samples
The coal slurry samples for the flotation and dewatering tests were collected from the
minus 100 mesh flotation feed stream (primary cyclone overflow) that was processed. The same
coal slurry feed was used for the pilot-scale flotation and dewatering tests.
d) Laboratory Procedures
The flotation feed sample (minus 100 mesh) from the Concord plant was first floated in a
laboratory mechanical flotation cell using 0.66 lb/t of diesel and 0.33 lb/t of MIBC to remove
ash-forming minerals. The floated product was then subjected to dewatering tests at about
13.5% solids by weight. In these tests, RV and RW3 (both diluted to 33.3% in solvent) were
used as dewatering aids. Immediately prior to each filter test, a known volume of slurry was
conditioned for 5 minutes with the reagent in a mechanical shaker and then poured into a
91
Buchner funnel before applying vacuum of 20 inches Hg. A constant drying cycle time of 2
minutes was used in all tests. The thickness of the filter cake varied from 7 to 9 mm.
e) Pilot-Scale Procedures
The on-site test work was conducted using the Column, Conditioner, and Filter Modules.
In each test, the cyclone overflow from the plant was first upgraded using the Column Module (a
305 mm or 12-inch diameter Microcel column) using diesel and RW, RU and RV as collectors
and Nalco DU009 as frother. The plant feed was reasonably consistent for most of the test work
and contained 3.5-5.5% solids by weight and 23.3-26.5% ash. The column produced a clean coal
product with 7-11% ash and 84-87% combustible recovery, depending on the reagent type and
dosage used. The froth product was then dewatered using the Filter Module (i.e., 0.186 m2 (2 ft
2)
filter area, 10 sector Peterson disc filter). The same reagents listed above, namely RW, RU and
RV, were also used as the dewatering aids in the filter tests. Each of the dewatering aids were
tested over a range of dosages that typically varied from 0 to 10 lb/ton of dry coal. Timed
samples were collected periodically from various points around the test modules to establish
typical material balances and reagent addition rates for this particular coal.
f) Laboratory Test Results
Several series of laboratory dewatering tests were conducted to collect data that could be
used as guidance for the pilot scale dewatering tests. Table 2.19 shows the laboratory test results
obtained on the Concord Plant flotation feed sample using RV and RW3 as the dewatering aids.
A 62.5 mm diameter Buchner funnel was used. The solid content of the flotation feed sample
was 6%. It was increased up to 13.5% after flotation. 0.66 lb/t diesel and 0.33 lb/t MIBC was
used during flotation. Vacuum setup point was 20 inches Hg. Cake thickness: 7-9 mm.
Conditioning time: 5 minutes; drying cycle time: 2 minutes. The volume of the slurry was 100
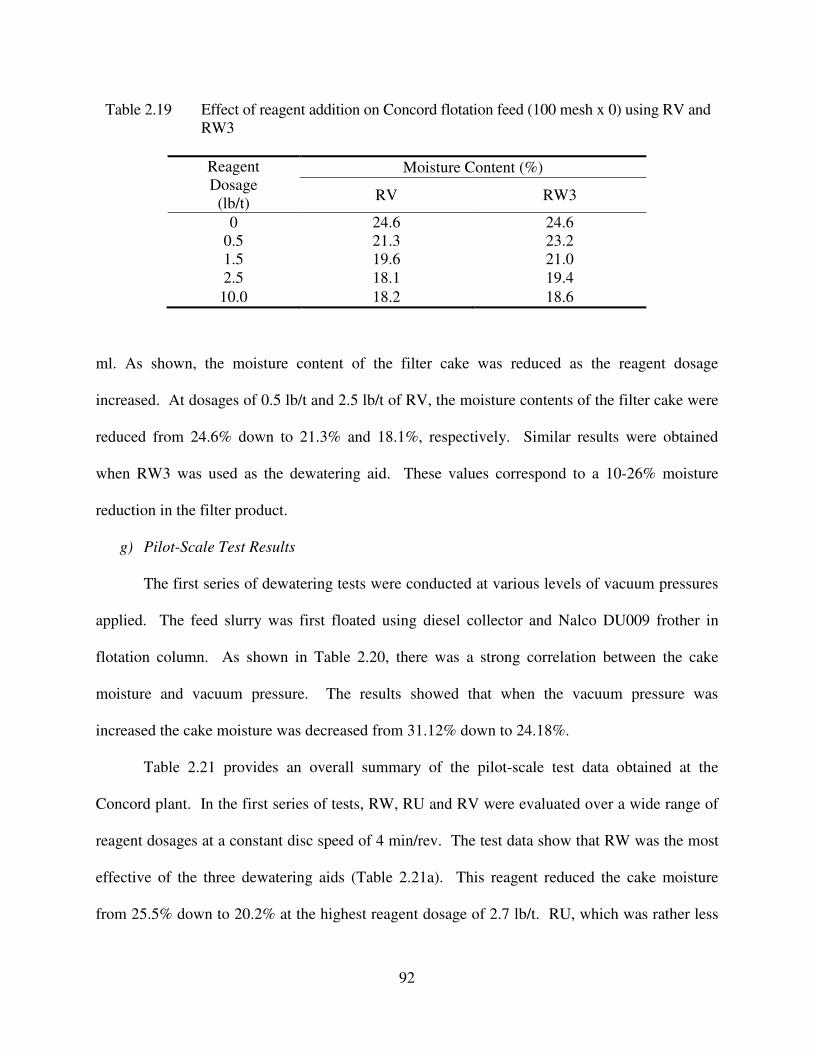
92
ml. As shown, the moisture content of the filter cake was reduced as the reagent dosage
increased. At dosages of 0.5 lb/t and 2.5 lb/t of RV, the moisture contents of the filter cake were
reduced from 24.6% down to 21.3% and 18.1%, respectively. Similar results were obtained
when RW3 was used as the dewatering aid. These values correspond to a 10-26% moisture
reduction in the filter product.
g) Pilot-Scale Test Results
The first series of dewatering tests were conducted at various levels of vacuum pressures
applied. The feed slurry was first floated using diesel collector and Nalco DU009 frother in
flotation column. As shown in Table 2.20, there was a strong correlation between the cake
moisture and vacuum pressure. The results showed that when the vacuum pressure was
increased the cake moisture was decreased from 31.12% down to 24.18%.
Table 2.21 provides an overall summary of the pilot-scale test data obtained at the
Concord plant. In the first series of tests, RW, RU and RV were evaluated over a wide range of
reagent dosages at a constant disc speed of 4 min/rev. The test data show that RW was the most
effective of the three dewatering aids (Table 2.21a). This reagent reduced the cake moisture
from 25.5% down to 20.2% at the highest reagent dosage of 2.7 lb/t. RU, which was rather less
Table 2.19 Effect of reagent addition on Concord flotation feed (100 mesh x 0) using RV and
RW3
Reagent
Dosage
(lb/t)
Moisture Content (%)
RV RW3
0 24.6 24.6
0.5 21.3 23.2
1.5 19.6 21.0
2.5 18.1 19.4
10.0 18.2 18.6
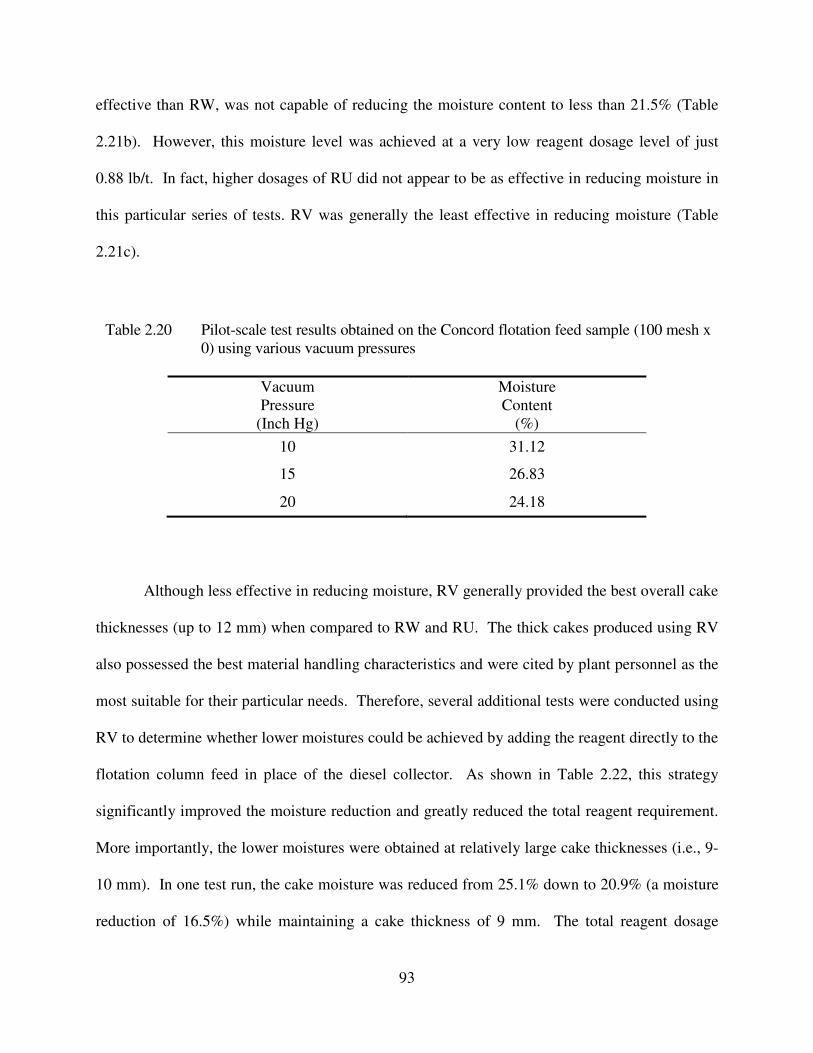
93
effective than RW, was not capable of reducing the moisture content to less than 21.5% (Table
2.21b). However, this moisture level was achieved at a very low reagent dosage level of just
0.88 lb/t. In fact, higher dosages of RU did not appear to be as effective in reducing moisture in
this particular series of tests. RV was generally the least effective in reducing moisture (Table
2.21c).
Although less effective in reducing moisture, RV generally provided the best overall cake
thicknesses (up to 12 mm) when compared to RW and RU. The thick cakes produced using RV
also possessed the best material handling characteristics and were cited by plant personnel as the
most suitable for their particular needs. Therefore, several additional tests were conducted using
RV to determine whether lower moistures could be achieved by adding the reagent directly to the
flotation column feed in place of the diesel collector. As shown in Table 2.22, this strategy
significantly improved the moisture reduction and greatly reduced the total reagent requirement.
More importantly, the lower moistures were obtained at relatively large cake thicknesses (i.e., 9-
10 mm). In one test run, the cake moisture was reduced from 25.1% down to 20.9% (a moisture
reduction of 16.5%) while maintaining a cake thickness of 9 mm. The total reagent dosage
Table 2.20 Pilot-scale test results obtained on the Concord flotation feed sample (100 mesh x
0) using various vacuum pressures
Vacuum
Pressure
(Inch Hg)
Moisture
Content
(%)
10 31.12
15 26.83
20 24.18
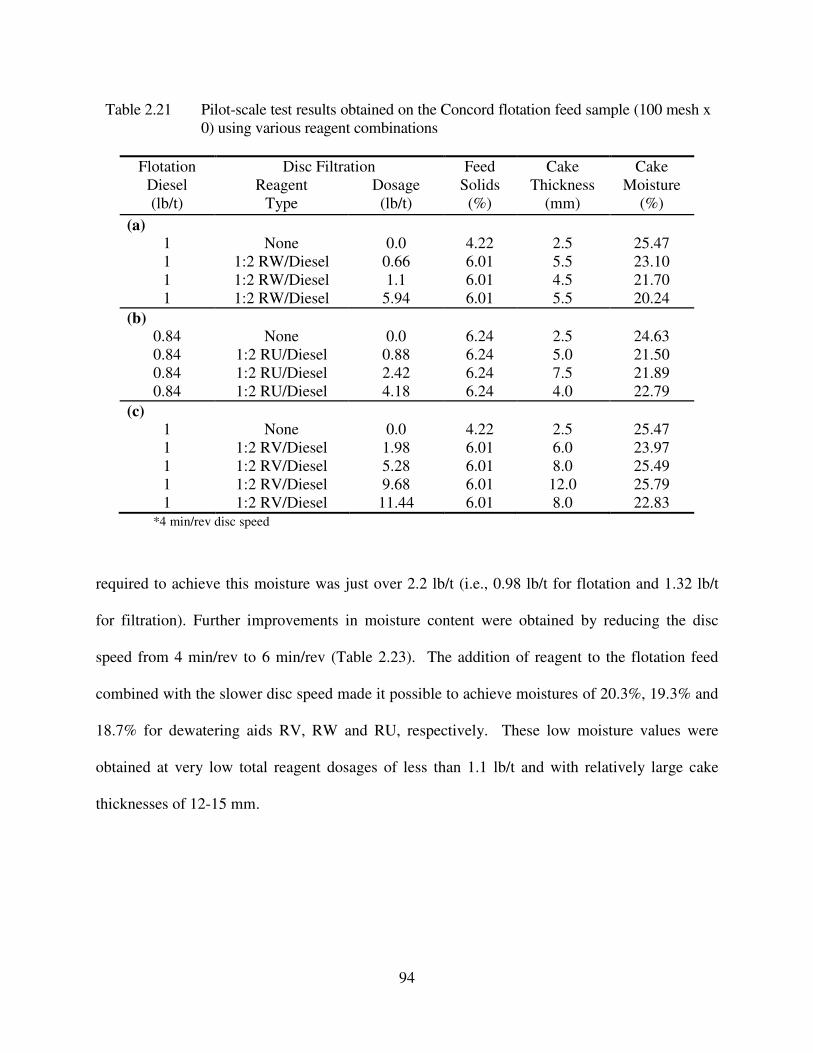
94
required to achieve this moisture was just over 2.2 lb/t (i.e., 0.98 lb/t for flotation and 1.32 lb/t
for filtration). Further improvements in moisture content were obtained by reducing the disc
speed from 4 min/rev to 6 min/rev (Table 2.23). The addition of reagent to the flotation feed
combined with the slower disc speed made it possible to achieve moistures of 20.3%, 19.3% and
18.7% for dewatering aids RV, RW and RU, respectively. These low moisture values were
obtained at very low total reagent dosages of less than 1.1 lb/t and with relatively large cake
thicknesses of 12-15 mm.
Table 2.21 Pilot-scale test results obtained on the Concord flotation feed sample (100 mesh x
0) using various reagent combinations
Flotation
Diesel
(lb/t)
Disc Filtration Feed
Solids
(%)
Cake
Thickness
(mm)
Cake
Moisture
(%)
Reagent
Type
Dosage
(lb/t)
(a)
1 None 0.0 4.22 2.5 25.47
1 1:2 RW/Diesel 0.66 6.01 5.5 23.10
1 1:2 RW/Diesel 1.1 6.01 4.5 21.70
1 1:2 RW/Diesel 5.94 6.01 5.5 20.24
(b)
0.84 None 0.0 6.24 2.5 24.63
0.84 1:2 RU/Diesel 0.88 6.24 5.0 21.50
0.84 1:2 RU/Diesel 2.42 6.24 7.5 21.89
0.84 1:2 RU/Diesel 4.18 6.24 4.0 22.79
(c)
1 None 0.0 4.22 2.5 25.47
1 1:2 RV/Diesel 1.98 6.01 6.0 23.97
1 1:2 RV/Diesel 5.28 6.01 8.0 25.49
1 1:2 RV/Diesel 9.68 6.01 12.0 25.79
1 1:2 RV/Diesel 11.44 6.01 8.0 22.83 *4 min/rev disc speed
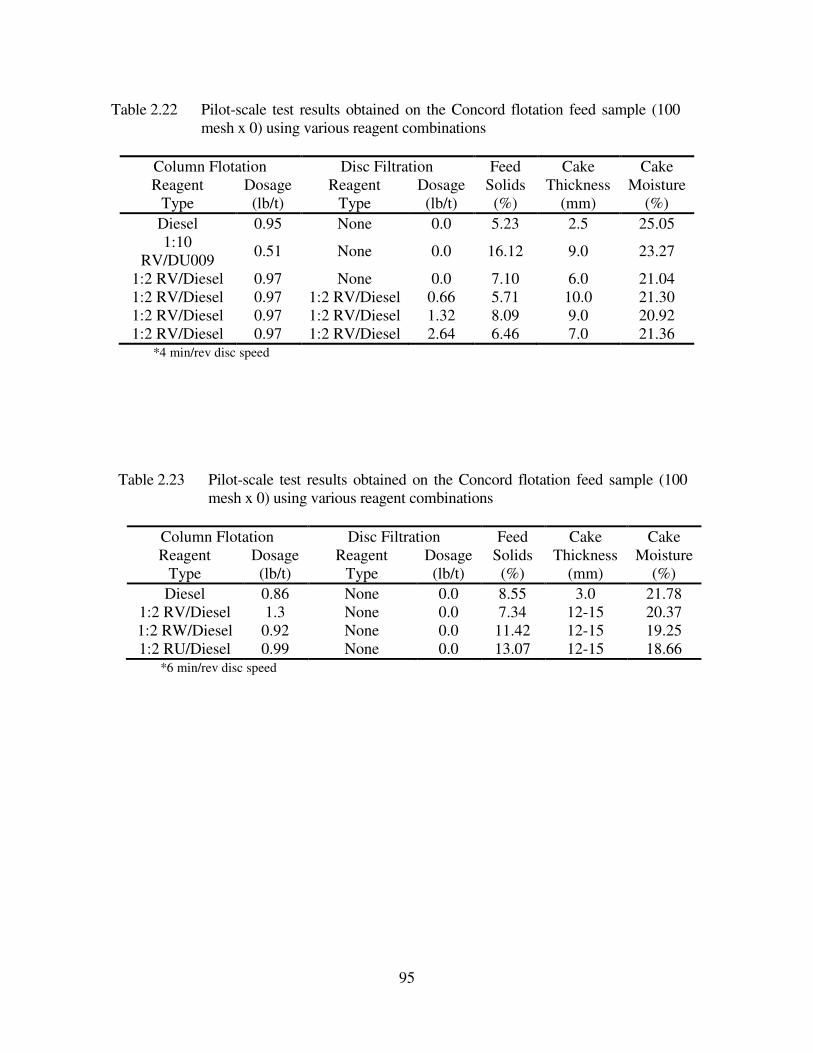
95
Table 2.22 Pilot-scale test results obtained on the Concord flotation feed sample (100
mesh x 0) using various reagent combinations
Column Flotation Disc Filtration Feed Cake Cake
Reagent Dosage Reagent Dosage Solids Thickness Moisture
Type (lb/t) Type (lb/t) (%) (mm) (%)
Diesel 0.95 None 0.0 5.23 2.5 25.05
1:10
RV/DU009 0.51 None 0.0 16.12 9.0 23.27
1:2 RV/Diesel 0.97 None 0.0 7.10 6.0 21.04
1:2 RV/Diesel 0.97 1:2 RV/Diesel 0.66 5.71 10.0 21.30
1:2 RV/Diesel 0.97 1:2 RV/Diesel 1.32 8.09 9.0 20.92
1:2 RV/Diesel 0.97 1:2 RV/Diesel 2.64 6.46 7.0 21.36 *4 min/rev disc speed
Table 2.23 Pilot-scale test results obtained on the Concord flotation feed sample (100
mesh x 0) using various reagent combinations
Column Flotation Disc Filtration Feed Cake Cake
Reagent Dosage Reagent Dosage Solids Thickness Moisture
Type (lb/t) Type (lb/t) (%) (mm) (%)
Diesel 0.86 None 0.0 8.55 3.0 21.78
1:2 RV/Diesel 1.3 None 0.0 7.34 12-15 20.37
1:2 RW/Diesel 0.92 None 0.0 11.42 12-15 19.25
1:2 RU/Diesel 0.99 None 0.0 13.07 12-15 18.66 *6 min/rev disc speed
96
2.3.5. Buchanan Site
a) Site Description
Consolidation Coal Company’s Buchanan Mine #1 is an underground coal mine located
two miles south of Route 460, adjacent to State Route 632, at Mavisdale, Buchanan County,
Virginia. Consol Energy Inc., located in Pittsburgh, Pennsylvania, is the parent company of
Consolidation Coal Company. The Buchanan preparation plant processes approximately 5
million tons of 37.5 mm x 0 raw coal (2006) from the Pocahontas 3 Seam for use in the
metallurgical and steam markets.
The objectives of this study were to (i) identify the best possible reagents and
combinations thereof for this specific coal and (ii) identify the conditions under which a given
dewatering aid can give the best performance. To meet the objectives, laboratory and pilot scale
tests were conducted to evaluate the performance of various types and dosages of dewatering
aids.
b) Reagents
The investigation, both laboratory and pilot-scale, was performed with varying amounts
of three types of dewatering aids, namely RW, RU, and RV. Since these dewatering aids are
insoluble in water, they were dissolved in a solvent. In both laboratory and pilot scale
experiments diesel was used as the solvent. The ratio of reagents-to-solvent was optimized in
previous studies by varying the individual dosages (0.5 to 3lb/ton), while maintaining the total
blend dosage constant. For this test program, the optimum combination for a given dewatering
aid and solvent is one to two (1:2) dewatering aid-to-diesel ratio.
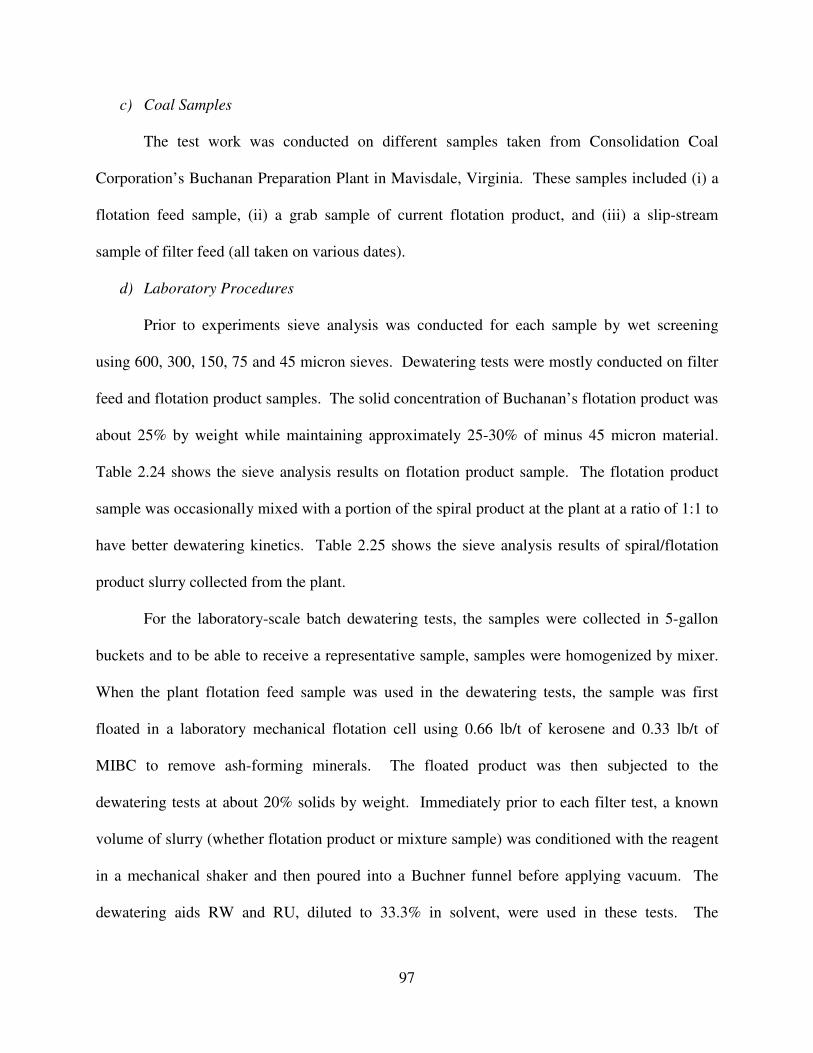
97
c) Coal Samples
The test work was conducted on different samples taken from Consolidation Coal
Corporation’s Buchanan Preparation Plant in Mavisdale, Virginia. These samples included (i) a
flotation feed sample, (ii) a grab sample of current flotation product, and (iii) a slip-stream
sample of filter feed (all taken on various dates).
d) Laboratory Procedures
Prior to experiments sieve analysis was conducted for each sample by wet screening
using 600, 300, 150, 75 and 45 micron sieves. Dewatering tests were mostly conducted on filter
feed and flotation product samples. The solid concentration of Buchanan’s flotation product was
about 25% by weight while maintaining approximately 25-30% of minus 45 micron material.
Table 2.24 shows the sieve analysis results on flotation product sample. The flotation product
sample was occasionally mixed with a portion of the spiral product at the plant at a ratio of 1:1 to
have better dewatering kinetics. Table 2.25 shows the sieve analysis results of spiral/flotation
product slurry collected from the plant.
For the laboratory-scale batch dewatering tests, the samples were collected in 5-gallon
buckets and to be able to receive a representative sample, samples were homogenized by mixer.
When the plant flotation feed sample was used in the dewatering tests, the sample was first
floated in a laboratory mechanical flotation cell using 0.66 lb/t of kerosene and 0.33 lb/t of
MIBC to remove ash-forming minerals. The floated product was then subjected to the
dewatering tests at about 20% solids by weight. Immediately prior to each filter test, a known
volume of slurry (whether flotation product or mixture sample) was conditioned with the reagent
in a mechanical shaker and then poured into a Buchner funnel before applying vacuum. The
dewatering aids RW and RU, diluted to 33.3% in solvent, were used in these tests. The
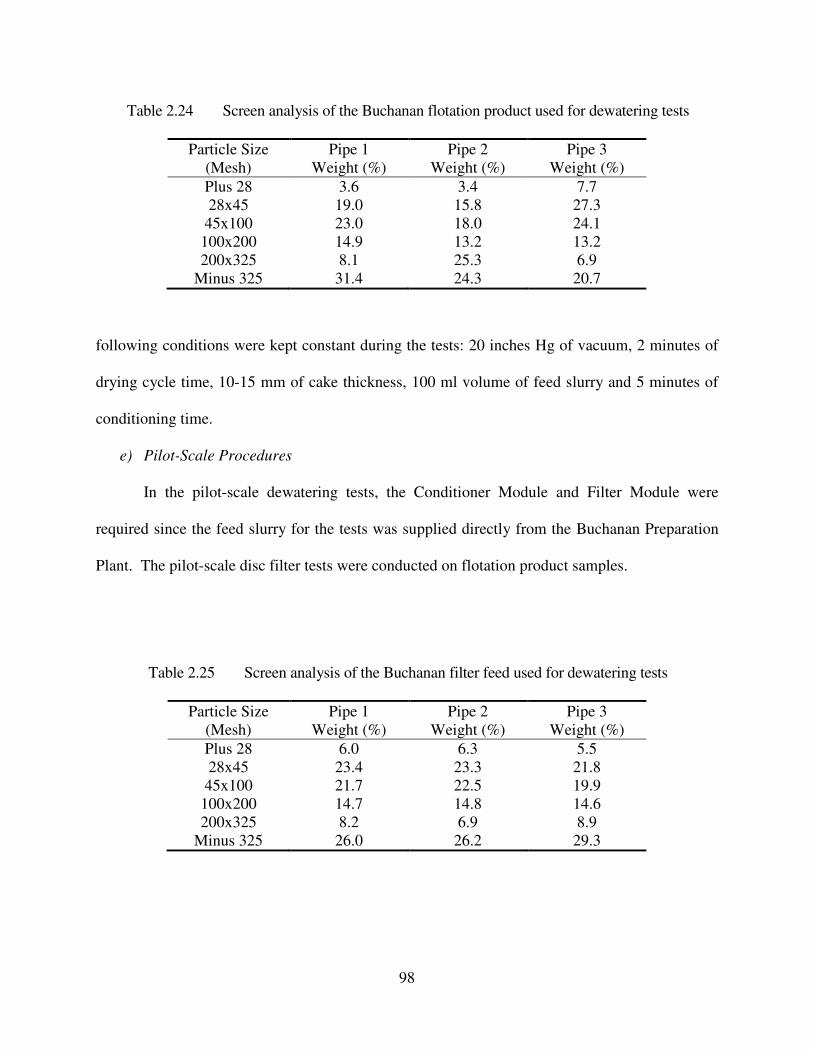
98
following conditions were kept constant during the tests: 20 inches Hg of vacuum, 2 minutes of
drying cycle time, 10-15 mm of cake thickness, 100 ml volume of feed slurry and 5 minutes of
conditioning time.
e) Pilot-Scale Procedures
In the pilot-scale dewatering tests, the Conditioner Module and Filter Module were
required since the feed slurry for the tests was supplied directly from the Buchanan Preparation
Plant. The pilot-scale disc filter tests were conducted on flotation product samples.
Table 2.25 Screen analysis of the Buchanan filter feed used for dewatering tests
Particle Size Pipe 1 Pipe 2 Pipe 3
(Mesh) Weight (%) Weight (%) Weight (%)
Plus 28 6.0 6.3 5.5
28x45 23.4 23.3 21.8
45x100 21.7 22.5 19.9
100x200 14.7 14.8 14.6
200x325 8.2 6.9 8.9
Minus 325 26.0 26.2 29.3
Table 2.24 Screen analysis of the Buchanan flotation product used for dewatering tests
Particle Size Pipe 1 Pipe 2 Pipe 3
(Mesh) Weight (%) Weight (%) Weight (%)
Plus 28 3.6 3.4 7.7
28x45 19.0 15.8 27.3
45x100 23.0 18.0 24.1
100x200 14.9 13.2 13.2
200x325 8.1 25.3 6.9
Minus 325 31.4 24.3 20.7
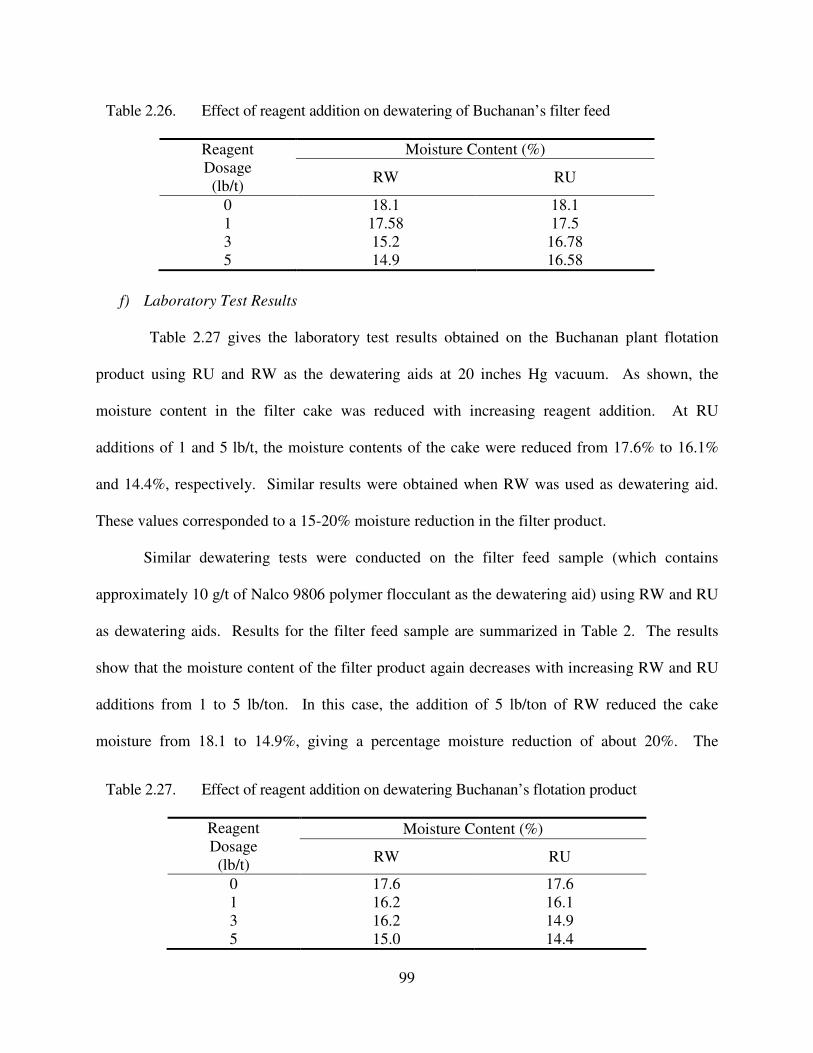
99
f) Laboratory Test Results
Table 2.27 gives the laboratory test results obtained on the Buchanan plant flotation
product using RU and RW as the dewatering aids at 20 inches Hg vacuum. As shown, the
moisture content in the filter cake was reduced with increasing reagent addition. At RU
additions of 1 and 5 lb/t, the moisture contents of the cake were reduced from 17.6% to 16.1%
and 14.4%, respectively. Similar results were obtained when RW was used as dewatering aid.
These values corresponded to a 15-20% moisture reduction in the filter product.
Similar dewatering tests were conducted on the filter feed sample (which contains
approximately 10 g/t of Nalco 9806 polymer flocculant as the dewatering aid) using RW and RU
as dewatering aids. Results for the filter feed sample are summarized in Table 2. The results
show that the moisture content of the filter product again decreases with increasing RW and RU
additions from 1 to 5 lb/ton. In this case, the addition of 5 lb/ton of RW reduced the cake
moisture from 18.1 to 14.9%, giving a percentage moisture reduction of about 20%. The
Table 2.27. Effect of reagent addition on dewatering Buchanan’s flotation product
Reagent
Dosage
(lb/t)
Moisture Content (%)
RW RU
0 17.6 17.6
1 16.2 16.1
3 16.2 14.9
5 15.0 14.4
Table 2.26. Effect of reagent addition on dewatering of Buchanan’s filter feed
Reagent
Dosage
(lb/t)
Moisture Content (%)
RW RU
0 18.1 18.1
1 17.58 17.5
3 15.2 16.78
5 14.9 16.58
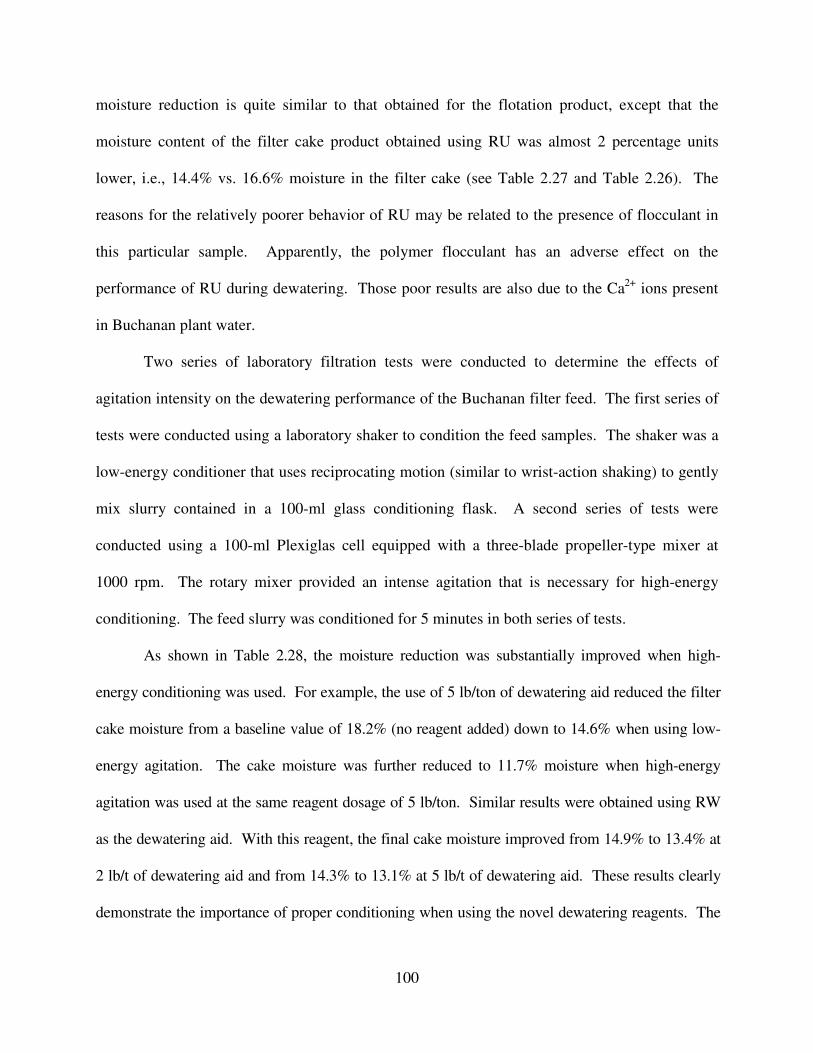
100
moisture reduction is quite similar to that obtained for the flotation product, except that the
moisture content of the filter cake product obtained using RU was almost 2 percentage units
lower, i.e., 14.4% vs. 16.6% moisture in the filter cake (see Table 2.27 and Table 2.26). The
reasons for the relatively poorer behavior of RU may be related to the presence of flocculant in
this particular sample. Apparently, the polymer flocculant has an adverse effect on the
performance of RU during dewatering. Those poor results are also due to the Ca2+
ions present
in Buchanan plant water.
Two series of laboratory filtration tests were conducted to determine the effects of
agitation intensity on the dewatering performance of the Buchanan filter feed. The first series of
tests were conducted using a laboratory shaker to condition the feed samples. The shaker was a
low-energy conditioner that uses reciprocating motion (similar to wrist-action shaking) to gently
mix slurry contained in a 100-ml glass conditioning flask. A second series of tests were
conducted using a 100-ml Plexiglas cell equipped with a three-blade propeller-type mixer at
1000 rpm. The rotary mixer provided an intense agitation that is necessary for high-energy
conditioning. The feed slurry was conditioned for 5 minutes in both series of tests.
As shown in Table 2.28, the moisture reduction was substantially improved when high-
energy conditioning was used. For example, the use of 5 lb/ton of dewatering aid reduced the filter
cake moisture from a baseline value of 18.2% (no reagent added) down to 14.6% when using low-
energy agitation. The cake moisture was further reduced to 11.7% moisture when high-energy
agitation was used at the same reagent dosage of 5 lb/ton. Similar results were obtained using RW
as the dewatering aid. With this reagent, the final cake moisture improved from 14.9% to 13.4% at
2 lb/t of dewatering aid and from 14.3% to 13.1% at 5 lb/t of dewatering aid. These results clearly
demonstrate the importance of proper conditioning when using the novel dewatering reagents. The
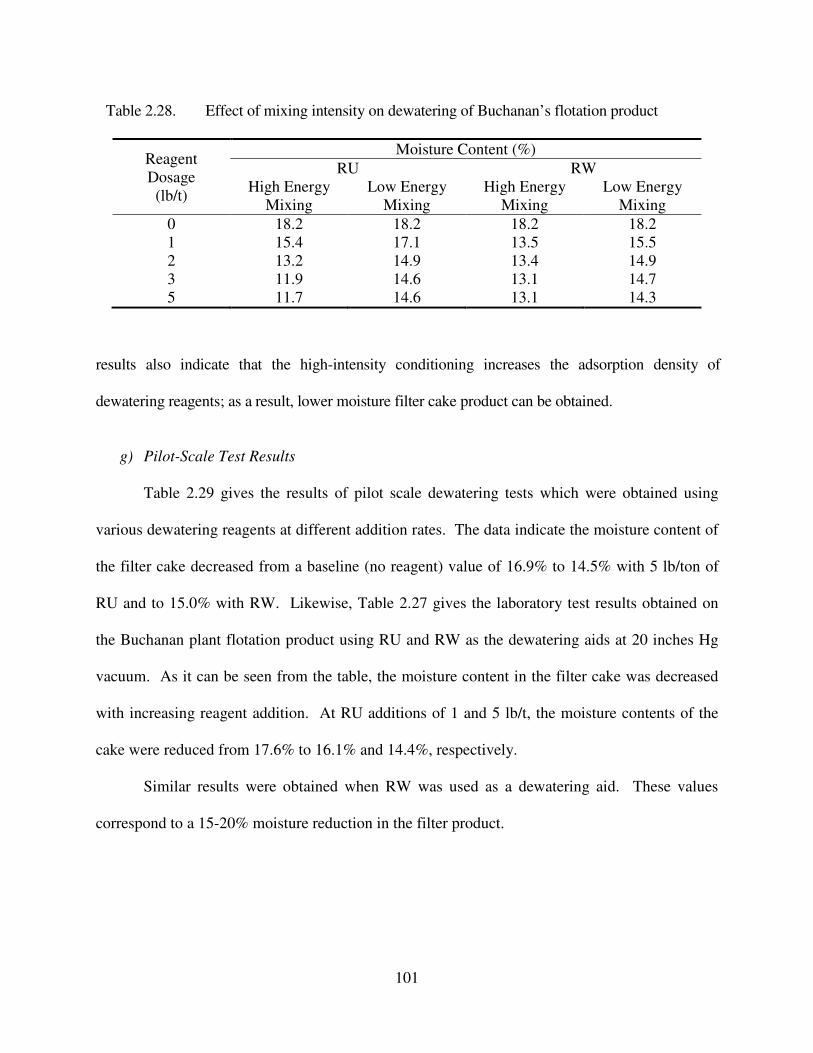
101
results also indicate that the high-intensity conditioning increases the adsorption density of
dewatering reagents; as a result, lower moisture filter cake product can be obtained.
g) Pilot-Scale Test Results
Table 2.29 gives the results of pilot scale dewatering tests which were obtained using
various dewatering reagents at different addition rates. The data indicate the moisture content of
the filter cake decreased from a baseline (no reagent) value of 16.9% to 14.5% with 5 lb/ton of
RU and to 15.0% with RW. Likewise, Table 2.27 gives the laboratory test results obtained on
the Buchanan plant flotation product using RU and RW as the dewatering aids at 20 inches Hg
vacuum. As it can be seen from the table, the moisture content in the filter cake was decreased
with increasing reagent addition. At RU additions of 1 and 5 lb/t, the moisture contents of the
cake were reduced from 17.6% to 16.1% and 14.4%, respectively.
Similar results were obtained when RW was used as a dewatering aid. These values
correspond to a 15-20% moisture reduction in the filter product.
Table 2.28. Effect of mixing intensity on dewatering of Buchanan’s flotation product
Reagent
Dosage
(lb/t)
Moisture Content (%)
RU RW
High Energy
Mixing
Low Energy
Mixing
High Energy
Mixing
Low Energy
Mixing
0 18.2 18.2 18.2 18.2
1 15.4 17.1 13.5 15.5
2 13.2 14.9 13.4 14.9
3 11.9 14.6 13.1 14.7
5 11.7 14.6 13.1 14.3
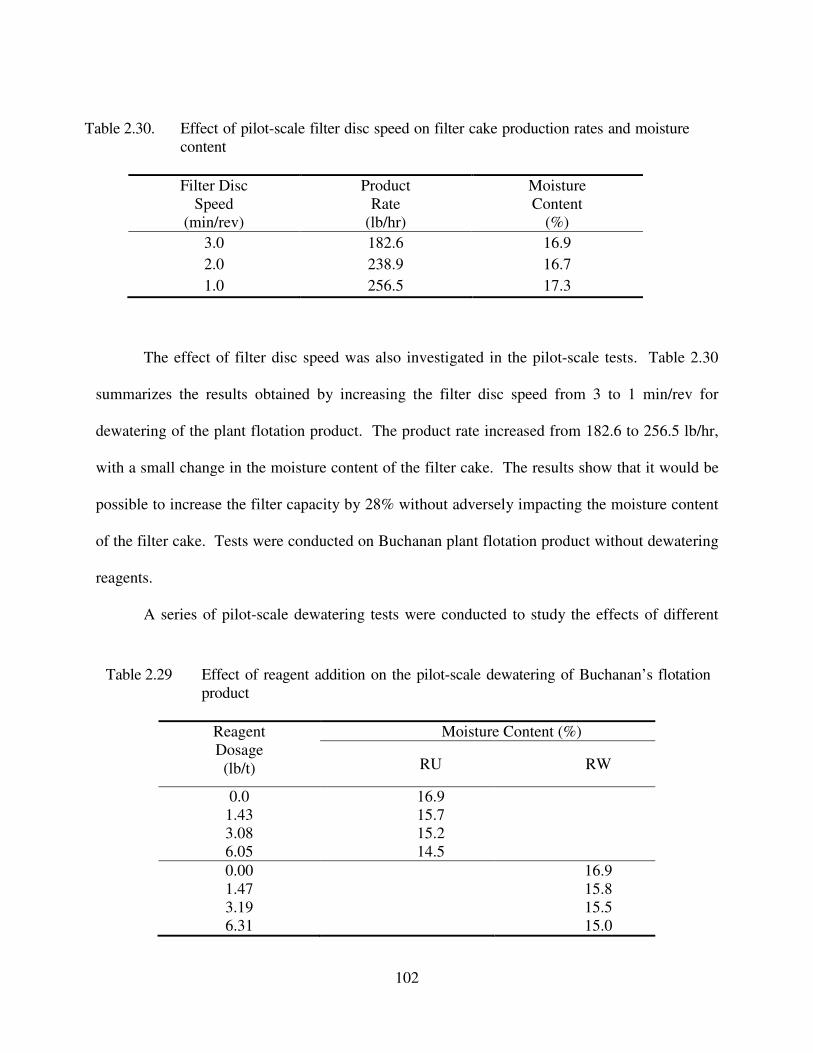
102
The effect of filter disc speed was also investigated in the pilot-scale tests. Table 2.30
summarizes the results obtained by increasing the filter disc speed from 3 to 1 min/rev for
dewatering of the plant flotation product. The product rate increased from 182.6 to 256.5 lb/hr,
with a small change in the moisture content of the filter cake. The results show that it would be
possible to increase the filter capacity by 28% without adversely impacting the moisture content
of the filter cake. Tests were conducted on Buchanan plant flotation product without dewatering
reagents.
A series of pilot-scale dewatering tests were conducted to study the effects of different
Table 2.29 Effect of reagent addition on the pilot-scale dewatering of Buchanan’s flotation
product
Reagent
Dosage
(lb/t)
Moisture Content (%)
RU RW
0.0 16.9
1.43 15.7
3.08 15.2
6.05 14.5
0.00 16.9
1.47 15.8
3.19 15.5
6.31 15.0
Table 2.30. Effect of pilot-scale filter disc speed on filter cake production rates and moisture
content
Filter Disc
Speed
(min/rev)
Product
Rate
(lb/hr)
Moisture
Content
(%)
3.0 182.6 16.9
2.0 238.9 16.7
1.0 256.5 17.3
103
vacuum levels on moisture reduction. The initial results, which are presented in Table 2.31,
were obtained without dewatering aid addition. The data show that it is possible to reduce the
product moisture from 19.7% to 17.1% by simply increasing the vacuum level from 5 to 15
inches Hg. It seems that a further increase in vacuum is not advantageous in terms of further
lowering the moisture contents of the filter products. It should be mentioned here that the disc
filters in the Buchanan preparation plant are currently operated at vacuum levels of only 10.5-
11.0 inches Hg. Because of such low vacuum levels, the plant filter product typically contains
21-22% moisture. The present work shows that by increasing the vacuum levels from 5-11 in
Hg, the plant could probably obtain a filter product with 17-18% moisture. Besides dewatering
aid addition, vacuum level is one of the important operating conditions determining the final
product moisture in the filter cake.
Table 2.32 gives the pilot-scale test results obtained on the Buchanan plant flotation
product using RW as the dewatering aid at various vacuum pressures. As shown, the moisture
content in the filter cake was reduced with increasing vacuum pressure. At vacuum pressure
increasing from 10-20 in Hg, the moisture contents of the cake were reduced from 18.2 to 16.8%
and 16.3%, respectively.
The test results given in Table 2.33 indicate that a further improvement in filter cake
moisture (about two percentage points) was obtained when using RU as dewatering aid. As the
vacuum levels increased from 10 to 20 in Hg, the moisture content of the cake were reduced
from 16.8 % to 14.5% and 14.3%, respectively.
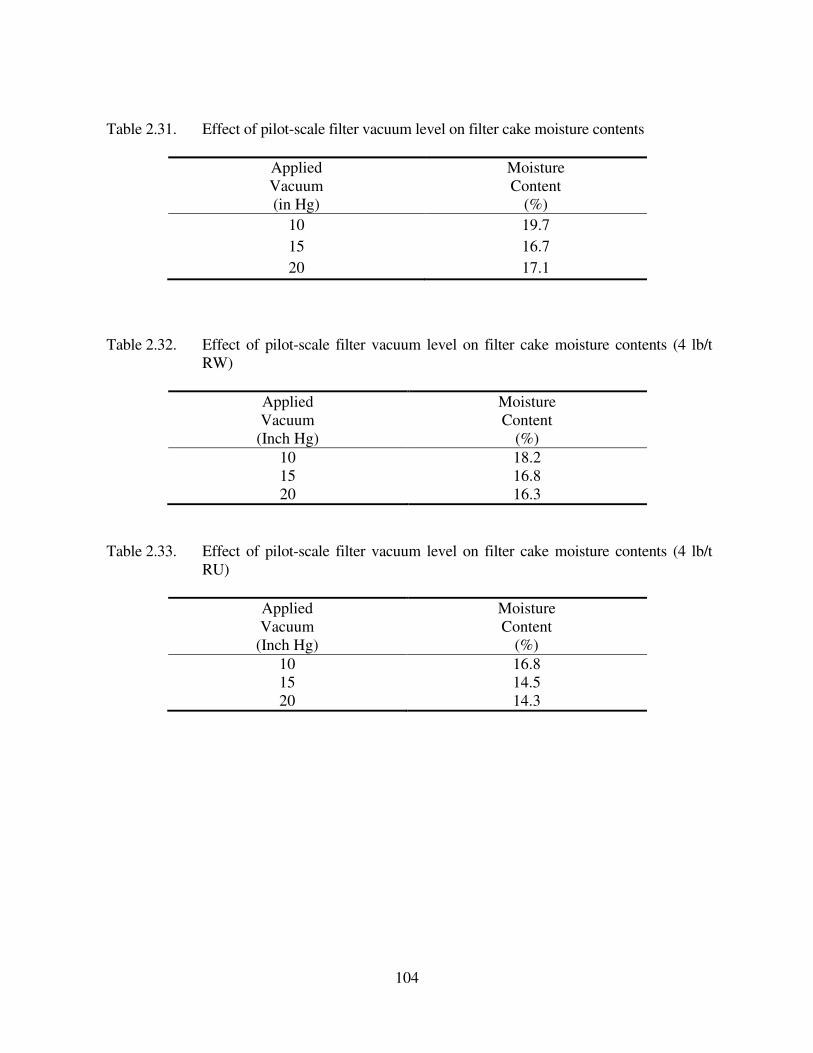
104
Table 2.31. Effect of pilot-scale filter vacuum level on filter cake moisture contents
Applied
Vacuum
(in Hg)
Moisture
Content
(%)
10 19.7
15 16.7
20 17.1
Table 2.32. Effect of pilot-scale filter vacuum level on filter cake moisture contents (4 lb/t
RW)
Applied
Vacuum
Moisture
Content
(Inch Hg) (%)
10 18.2
15 16.8
20 16.3
Table 2.33. Effect of pilot-scale filter vacuum level on filter cake moisture contents (4 lb/t
RU)
Applied
Vacuum
Moisture
Content
(Inch Hg) (%)
10 16.8
15 14.5
20 14.3
105
2.3.6. Elkview Site
a) Site Description
The Elkview coal cleaning plant, B.C Canada, is processing 1,400 metric tons per hour
(t/hr) of run-of-the-mine (ROM) coals. The materials that are floated and dewatered are
classifying cyclone products. The cyclone overflows (O/F) are fed to five banks of mechanically
agitated flotation cells, while the underflows (U/F) are fed to sieve bends (60 mesh). The sieve
bend U/F joins cyclone O/F and are fed to the flotation cells, while the sieve bend O/F bypasses
the flotation cells. The froth product and the sieve bend O/F’s are combined and fed to vacuum
disc filters to reduce the moisture to approximately 21.5%. The filter cake is then fed to a
thermal dryer to further reduce the moisture to 8.4%. Typically, the thermal dryer is operating at
its maximum capacity, i.e., 65 t/hr of water evaporated, and cannot handle additional froth
product. Under this condition, operators cannot pull the flotation cells hard, causing a significant
loss of fine coal.
The primary objective of the project was to develop appropriate methods of reducing the
filter cake moisture to the level that can eliminate the situation where the thermal dryer is acting
as a bottleneck for increased production. These novel dewatering aids are designed to increase
hydrophobicity. As such, the dewatering aids can be added to a flotation cell displacing some, or
perhaps even all, of the conventional collector (kerosene) that is currently used. This can result
in a higher flotation recovery while at the same time improving dewatering. However, the novel
dewatering aids would work better if they were added to a separate conditioner with a strong
agitation since the energy dissipation in a flotation cell is generally less than that in a well-
designed conditioner. Therefore, the extent of moisture reduction may be less when the froth
cell is used for conditioning. Adding the dewatering reagent in place of collector for flotation
106
may be sufficient since relatively small moisture reduction may be sufficient in eliminating the
bottleneck at the thermal dryer and thereby allowing operators to pull the flotation cell hard and
increase the recovery. To meet this objective, a series of dewatering tests have been conducted
at Virginia Tech. The present work was limited to testing the novel dewatering aids to reduce
the moisture of the filter cakes produced from the vacuum disc filters at Elkview.
b) Reagents
The investigation, both laboratory and pilot-scale, was performed with varying amounts
of three types of dewatering aids, namely RW, RU and RV. Since these dewatering aids are
insoluble in water, they were dissolved in a solvent. In both laboratory and pilot scale
experiments diesel was used as the solvent. The ratio of reagents-to-solvent was optimized in
previous studies by varying the individual dosages (0.5 to 3 lb/ton), while maintaining the total
blend dosage constant. For this test program, the optimum combination for a given dewatering
aid and solvent is one to two (1:2) dewatering aid-to-diesel ratio. When flotation feed was used,
the sample was subjected to laboratory flotation tests using 0.66 lb/t of kerosene or RV as
collectors and 0.44 lb/t of MIBC as frother.
c) Coal Samples
Two types of samples were received from the Elkview site, i.e., a standard metallurgical
coal (Std-Met) and a medium-volatile metallurgical coal (Mid-Vol Met). In each case, both
flotation feed (minus 60 mesh, 2-3% solid by weight) and vacuum filter feed (67% froth product
and 33% sieve bend overflow, 25% solids by weight) samples were received.
d) Laboratory Procedures
Most of the laboratory filtration tests were conducted using a 2-inch diameter Buchner
vacuum filter at 20-inch vacuum pressure (68 kPa) and 2 minutes of drying cycle time. To
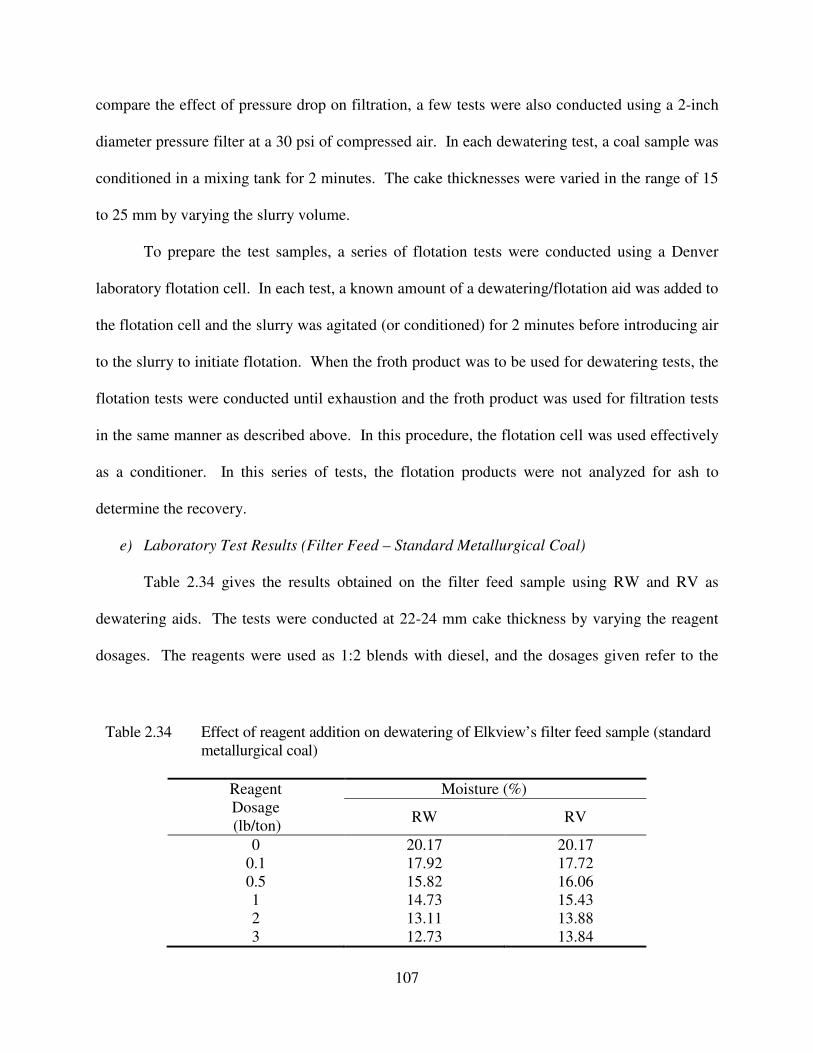
107
compare the effect of pressure drop on filtration, a few tests were also conducted using a 2-inch
diameter pressure filter at a 30 psi of compressed air. In each dewatering test, a coal sample was
conditioned in a mixing tank for 2 minutes. The cake thicknesses were varied in the range of 15
to 25 mm by varying the slurry volume.
To prepare the test samples, a series of flotation tests were conducted using a Denver
laboratory flotation cell. In each test, a known amount of a dewatering/flotation aid was added to
the flotation cell and the slurry was agitated (or conditioned) for 2 minutes before introducing air
to the slurry to initiate flotation. When the froth product was to be used for dewatering tests, the
flotation tests were conducted until exhaustion and the froth product was used for filtration tests
in the same manner as described above. In this procedure, the flotation cell was used effectively
as a conditioner. In this series of tests, the flotation products were not analyzed for ash to
determine the recovery.
e) Laboratory Test Results (Filter Feed – Standard Metallurgical Coal)
Table 2.34 gives the results obtained on the filter feed sample using RW and RV as
dewatering aids. The tests were conducted at 22-24 mm cake thickness by varying the reagent
dosages. The reagents were used as 1:2 blends with diesel, and the dosages given refer to the
Table 2.34 Effect of reagent addition on dewatering of Elkview’s filter feed sample (standard
metallurgical coal)
Reagent
Dosage
(lb/ton)
Moisture (%)
RW RV
0 20.17 20.17
0.1 17.92 17.72
0.5 15.82 16.06
1 14.73 15.43
2 13.11 13.88
3 12.73 13.84
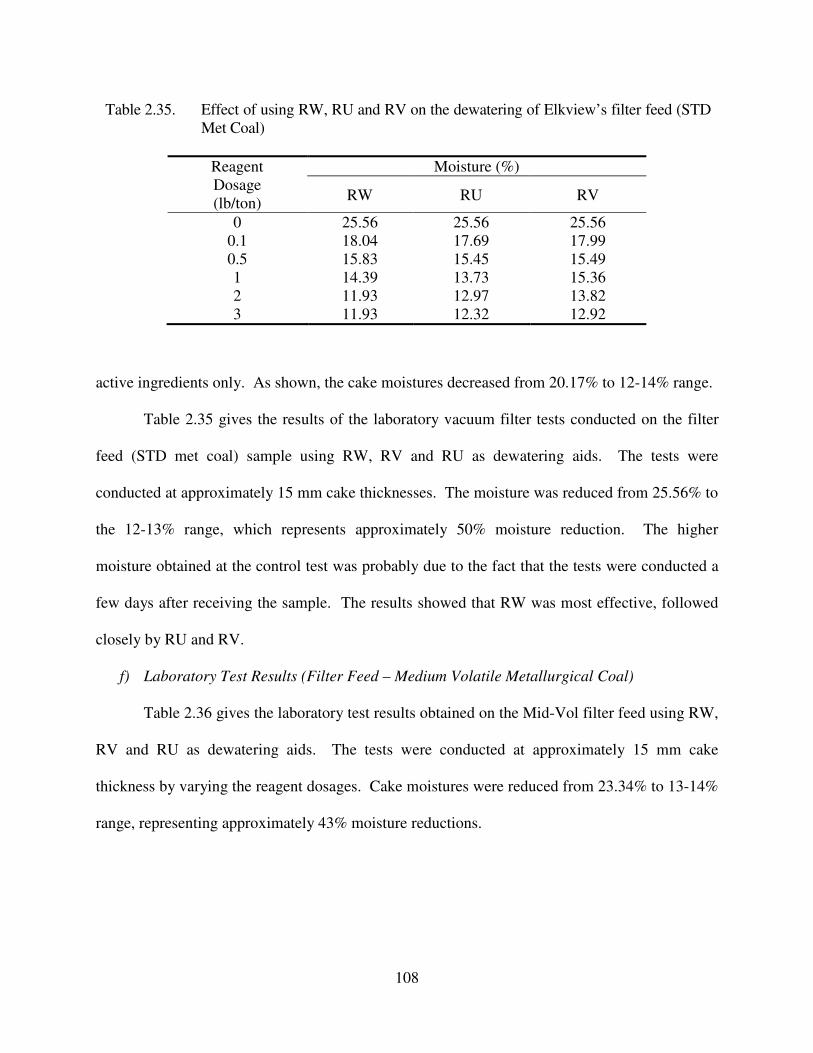
108
active ingredients only. As shown, the cake moistures decreased from 20.17% to 12-14% range.
Table 2.35 gives the results of the laboratory vacuum filter tests conducted on the filter
feed (STD met coal) sample using RW, RV and RU as dewatering aids. The tests were
conducted at approximately 15 mm cake thicknesses. The moisture was reduced from 25.56% to
the 12-13% range, which represents approximately 50% moisture reduction. The higher
moisture obtained at the control test was probably due to the fact that the tests were conducted a
few days after receiving the sample. The results showed that RW was most effective, followed
closely by RU and RV.
f) Laboratory Test Results (Filter Feed – Medium Volatile Metallurgical Coal)
Table 2.36 gives the laboratory test results obtained on the Mid-Vol filter feed using RW,
RV and RU as dewatering aids. The tests were conducted at approximately 15 mm cake
thickness by varying the reagent dosages. Cake moistures were reduced from 23.34% to 13-14%
range, representing approximately 43% moisture reductions.
Table 2.35. Effect of using RW, RU and RV on the dewatering of Elkview’s filter feed (STD
Met Coal)
Reagent
Dosage
(lb/ton)
Moisture (%)
RW RU RV
0 25.56 25.56 25.56
0.1 18.04 17.69 17.99
0.5 15.83 15.45 15.49
1 14.39 13.73 15.36
2 11.93 12.97 13.82
3 11.93 12.32 12.92
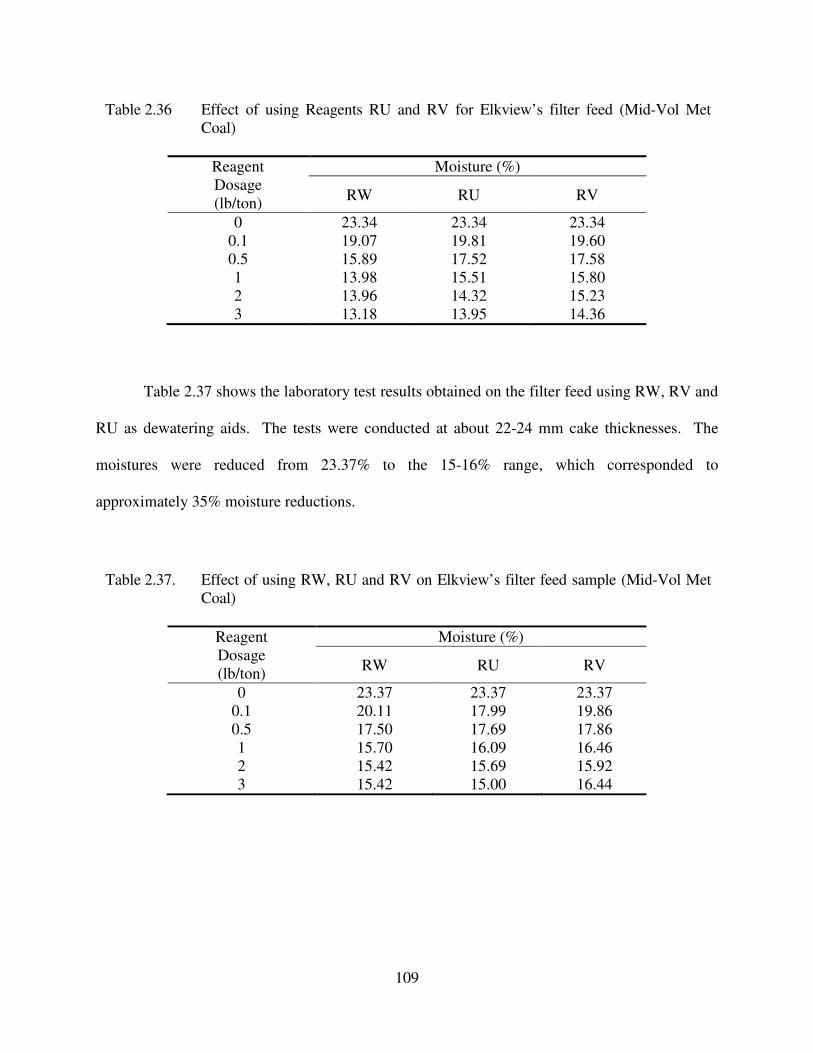
109
Table 2.37 shows the laboratory test results obtained on the filter feed using RW, RV and
RU as dewatering aids. The tests were conducted at about 22-24 mm cake thicknesses. The
moistures were reduced from 23.37% to the 15-16% range, which corresponded to
approximately 35% moisture reductions.
Table 2.37. Effect of using RW, RU and RV on Elkview’s filter feed sample (Mid-Vol Met
Coal)
Reagent
Dosage
(lb/ton)
Moisture (%)
RW RU RV
0 23.37 23.37 23.37
0.1 20.11 17.99 19.86
0.5 17.50 17.69 17.86
1 15.70 16.09 16.46
2 15.42 15.69 15.92
3 15.42 15.00 16.44
Table 2.36 Effect of using Reagents RU and RV for Elkview’s filter feed (Mid-Vol Met
Coal)
Reagent
Dosage
(lb/ton)
Moisture (%)
RW RU RV
0 23.34 23.34 23.34
0.1 19.07 19.81 19.60
0.5 15.89 17.52 17.58
1 13.98 15.51 15.80
2 13.96 14.32 15.23
3 13.18 13.95 14.36
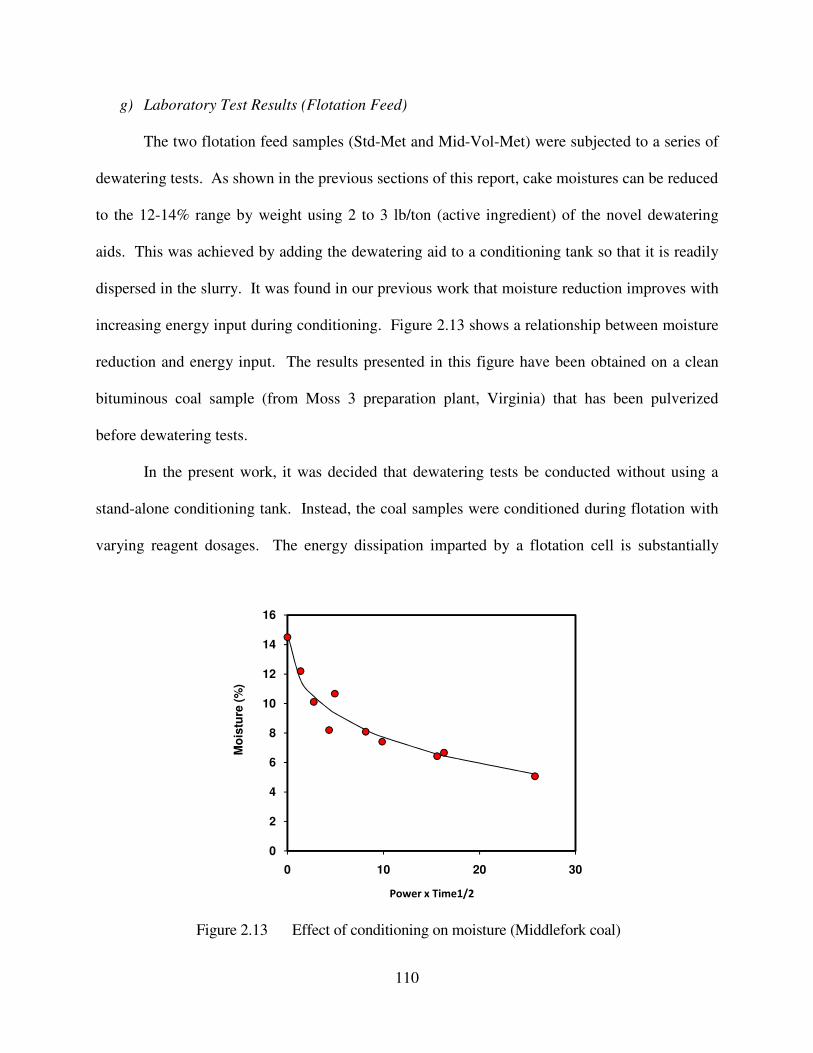
110
g) Laboratory Test Results (Flotation Feed)
The two flotation feed samples (Std-Met and Mid-Vol-Met) were subjected to a series of
dewatering tests. As shown in the previous sections of this report, cake moistures can be reduced
to the 12-14% range by weight using 2 to 3 lb/ton (active ingredient) of the novel dewatering
aids. This was achieved by adding the dewatering aid to a conditioning tank so that it is readily
dispersed in the slurry. It was found in our previous work that moisture reduction improves with
increasing energy input during conditioning. Figure 2.13 shows a relationship between moisture
reduction and energy input. The results presented in this figure have been obtained on a clean
bituminous coal sample (from Moss 3 preparation plant, Virginia) that has been pulverized
before dewatering tests.
In the present work, it was decided that dewatering tests be conducted without using a
stand-alone conditioning tank. Instead, the coal samples were conditioned during flotation with
varying reagent dosages. The energy dissipation imparted by a flotation cell is substantially
Figure 2.13 Effect of conditioning on moisture (Middlefork coal)
0
2
4
6
8
10
12
14
16
0 10 20 30
Mo
istu
re (
%)
Power x Time1/2
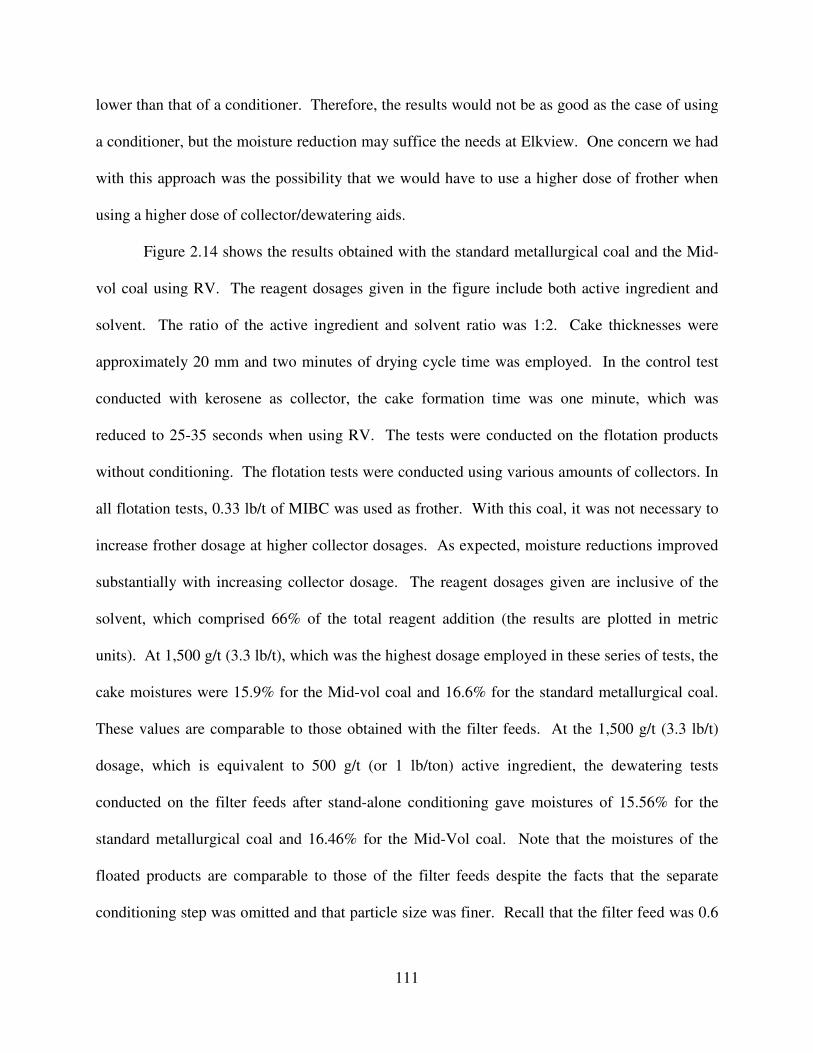
111
lower than that of a conditioner. Therefore, the results would not be as good as the case of using
a conditioner, but the moisture reduction may suffice the needs at Elkview. One concern we had
with this approach was the possibility that we would have to use a higher dose of frother when
using a higher dose of collector/dewatering aids.
Figure 2.14 shows the results obtained with the standard metallurgical coal and the Mid-
vol coal using RV. The reagent dosages given in the figure include both active ingredient and
solvent. The ratio of the active ingredient and solvent ratio was 1:2. Cake thicknesses were
approximately 20 mm and two minutes of drying cycle time was employed. In the control test
conducted with kerosene as collector, the cake formation time was one minute, which was
reduced to 25-35 seconds when using RV. The tests were conducted on the flotation products
without conditioning. The flotation tests were conducted using various amounts of collectors. In
all flotation tests, 0.33 lb/t of MIBC was used as frother. With this coal, it was not necessary to
increase frother dosage at higher collector dosages. As expected, moisture reductions improved
substantially with increasing collector dosage. The reagent dosages given are inclusive of the
solvent, which comprised 66% of the total reagent addition (the results are plotted in metric
units). At 1,500 g/t (3.3 lb/t), which was the highest dosage employed in these series of tests, the
cake moistures were 15.9% for the Mid-vol coal and 16.6% for the standard metallurgical coal.
These values are comparable to those obtained with the filter feeds. At the 1,500 g/t (3.3 lb/t)
dosage, which is equivalent to 500 g/t (or 1 lb/ton) active ingredient, the dewatering tests
conducted on the filter feeds after stand-alone conditioning gave moistures of 15.56% for the
standard metallurgical coal and 16.46% for the Mid-Vol coal. Note that the moistures of the
floated products are comparable to those of the filter feeds despite the facts that the separate
conditioning step was omitted and that particle size was finer. Recall that the filter feed was 0.6
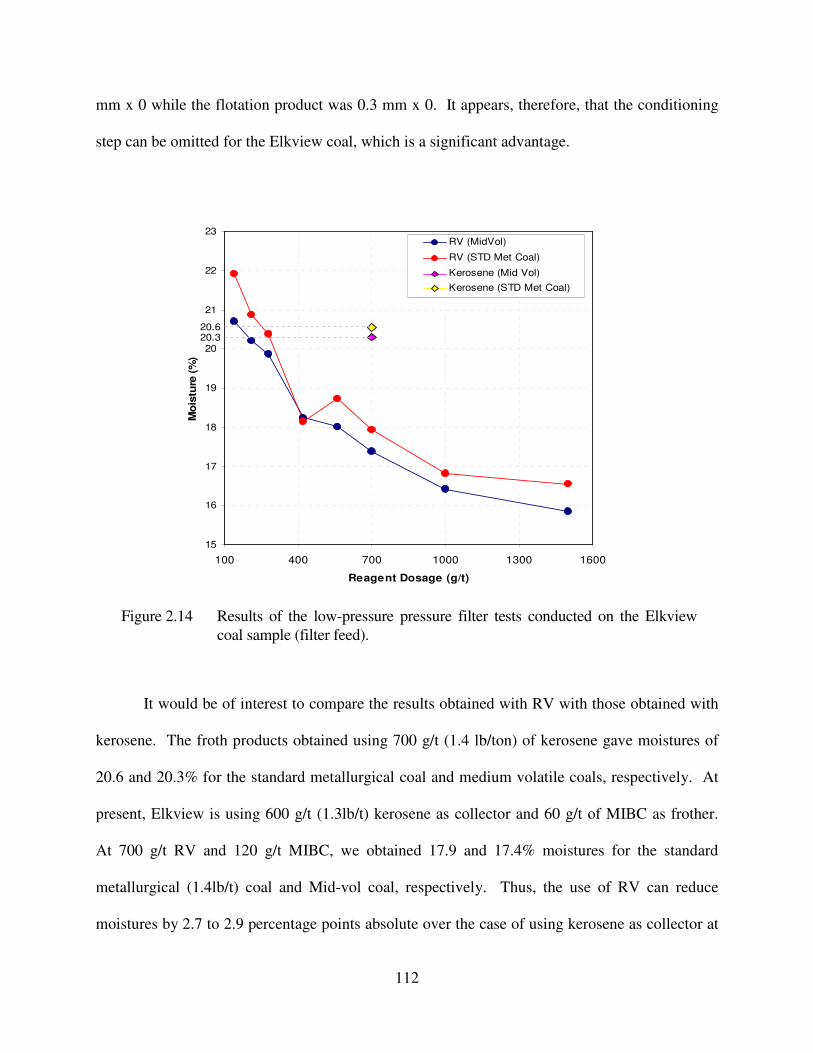
112
mm x 0 while the flotation product was 0.3 mm x 0. It appears, therefore, that the conditioning
step can be omitted for the Elkview coal, which is a significant advantage.
It would be of interest to compare the results obtained with RV with those obtained with
kerosene. The froth products obtained using 700 g/t (1.4 lb/ton) of kerosene gave moistures of
20.6 and 20.3% for the standard metallurgical coal and medium volatile coals, respectively. At
present, Elkview is using 600 g/t (1.3lb/t) kerosene as collector and 60 g/t of MIBC as frother.
At 700 g/t RV and 120 g/t MIBC, we obtained 17.9 and 17.4% moistures for the standard
metallurgical (1.4lb/t) coal and Mid-vol coal, respectively. Thus, the use of RV can reduce
moistures by 2.7 to 2.9 percentage points absolute over the case of using kerosene as collector at
Figure 2.14 Results of the low-pressure pressure filter tests conducted on the Elkview
coal sample (filter feed).
20.320.6
15
16
17
18
19
20
21
22
23
100 400 700 1000 1300 1600
Reagent Dosage (g/t)
Mo
istu
re (
%)
RV (MidVol)
RV (STD Met Coal)
Kerosene (Mid Vol)
Kerosene (STD Met Coal)

113
dosage levels that are currently employed at Elkview. Figure 2.14 shows that further reductions
in moisture can be achieved at higher reagent dosages.
114
2.3.7. Smith Branch Site
a) Site Description
One of the most promising coal samples evaluated in this project was obtained from the
Smith Branch impoundment located near the Pinnacle Mine Complex. The complex, which is
owned by Cleveland Cliffs Mining, consists of an underground mining operation, a surface wash
plant, and the waste coal impoundment. The Pinnacle site contains approximately 100 million
tons of unmined coal reserves of which 3.3-4.0 million tons are processed annually by the wash
plant. The waste coal from the plant is diverted to the Smith Branch Impoundment, which is
believed to contain 2.85 million tons of potentially recoverable fine coal.
b) Coal Samples
A number of coal samples were used to conduct dewatering tests during the evaluation
and scale-up tests. Samples were taken from the PinnOak Company’s Pinnacle Plant site and
Smith Branch Impoundment near Pineville, WV. The samples consisted of a Vibracore
composite sample taken from the Smith Branch Impoundment, a grab sample of current
thickener underflow (taken in 2002), and a slip-stream sample of current thickener feed. All of
these samples were tested in both the laboratory and pilot scale using newly-developed
dewatering aids. Shown below is an overview of the samples used in dewatering tests.
i) Laboratory Tests
Smith Branch Vibracore Composite Sample (68% solid, 30% ash)
Plant’s Thickener Underflow Sample (12% solid, 33% ash)
Plant’s Thickener Feed Sample (1.6% solid, 46% ash)
ii) Pilot Scale Tests
Smith Branch Vibracore Composite Sample (68% solid, 30% ash)
Plant’s Thickener Feed Sample (1.6% solid, 46% ash)
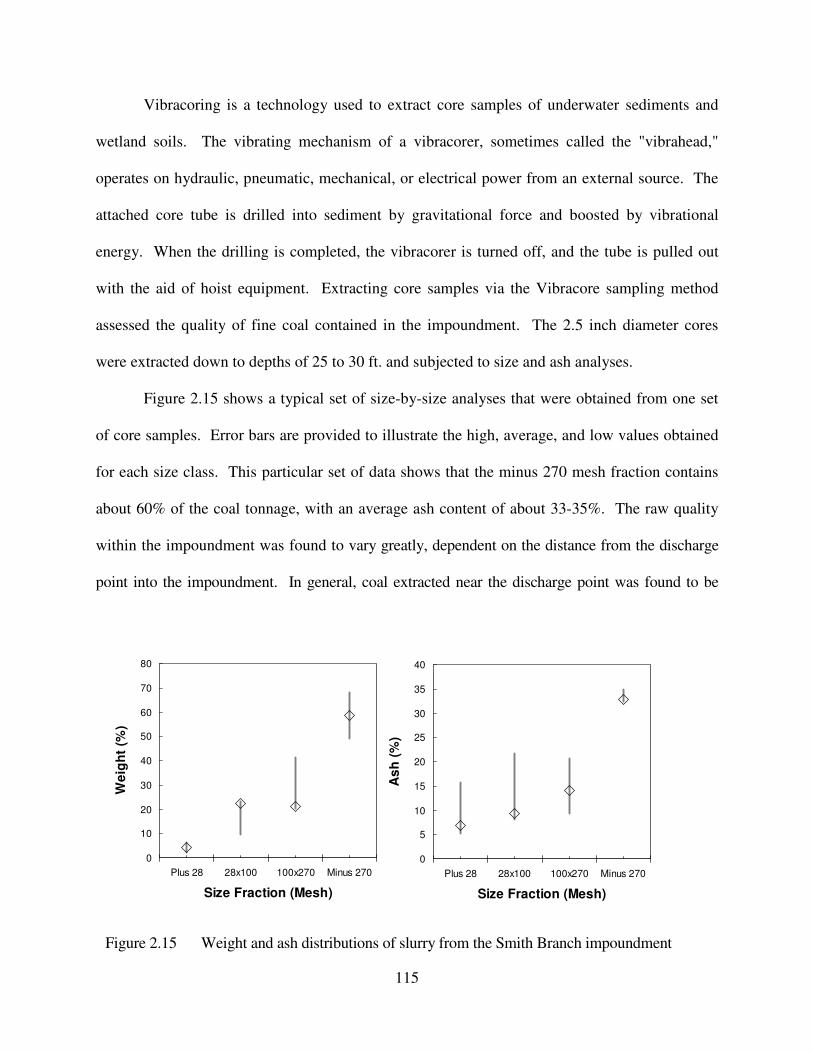
115
Vibracoring is a technology used to extract core samples of underwater sediments and
wetland soils. The vibrating mechanism of a vibracorer, sometimes called the "vibrahead,"
operates on hydraulic, pneumatic, mechanical, or electrical power from an external source. The
attached core tube is drilled into sediment by gravitational force and boosted by vibrational
energy. When the drilling is completed, the vibracorer is turned off, and the tube is pulled out
with the aid of hoist equipment. Extracting core samples via the Vibracore sampling method
assessed the quality of fine coal contained in the impoundment. The 2.5 inch diameter cores
were extracted down to depths of 25 to 30 ft. and subjected to size and ash analyses.
Figure 2.15 shows a typical set of size-by-size analyses that were obtained from one set
of core samples. Error bars are provided to illustrate the high, average, and low values obtained
for each size class. This particular set of data shows that the minus 270 mesh fraction contains
about 60% of the coal tonnage, with an average ash content of about 33-35%. The raw quality
within the impoundment was found to vary greatly, dependent on the distance from the discharge
point into the impoundment. In general, coal extracted near the discharge point was found to be
Figure 2.15 Weight and ash distributions of slurry from the Smith Branch impoundment
0
10
20
30
40
50
60
70
80
Plus 28 28x100 100x270 Minus 270
Size Fraction (Mesh)
We
igh
t (%
)
0
5
10
15
20
25
30
35
40
Plus 28 28x100 100x270 Minus 270
Size Fraction (Mesh)
As
h (
%)
116
coarser and higher in ash, while the coal extracted farther away from the discharge point was finer
and lower in ash. Also, coal fines extracted from a greater depth were found to be of better quality
than coal taken from more shallow locations. This was expected because the coal fines deposited
earlier in the life of the mine were discarded before several improvements were made to the fine
coal circuits in the existing preparation plant. The average ash content of the remaining 40% had
an ash content of less than 15%.
c) Laboratory Procedures
The laboratory flotation and dewatering equipment consists of a Denver laboratory
flotation cell, a vacuum pump, a mechanical shaker, a stand-alone mixer – in some cases – and a
Buchner Funnel with a fitted filter medium. All the vacuum filtration tests were conducted using
a 2.5 inch diameter Buchner Funnel at 20-25 inch Hg (68 kPa) with a 40X60 wire screen mesh
filter medium.
The dewatering tests were conducted to determine the best reagents and dosages for
different samples and to investigate under what conditions a given dewatering aid can give the
best performance. All the coal samples were tested within three days of receipt in order to
minimize any artificial negative effects of aging or surface property changes on dewatering.
Because the samples were taken from the waste pond, thickener feed discharge, and thickener
underflow discharge, they possessed high impurities. For this reason, a cleaning step was
employed before the filter tests. Depending on the solid content, the samples were prepared first
by either diluting or decanting to 16-17% solids and floated in a laboratory Denver flotation cell
approximately at 1000 rpm using 0.88 lb/t kerosene and 0.33 lb/t MIBC to remove ash. A
limited number of flotation feed and product samples were analyzed for ash. Then, the samples
were collected in a separate container to be used in filtration tests. The dewatering aids RW, RU,
117
and RV were tested and diluted to 33.3% in solvent. When using the dewatering aids,
conditioning is critical, and increased energy input in conditioning yields improved moisture
reductions. For this reason, prior to each filter test, a known volume of slurry was conditioned
with the dewatering aids in the mechanical shaker and, in some cases, the stand-alone mixer.
When the mechanical shaker was used, the conditioning time was kept at 5 minutes, and when
the stand-alone mixer was used, the conditioning time was kept at 2 minutes. Then, the
conditioned sample was poured into the Buchner funnel for filtration. During the tests, the cake
thickness was determined by the amount of the slurry sample used. Some of the conditions were
kept constant during the tests. For example, a 7-10 mm cake thickness was determined for 2
minutes of drying time.
d) Pilot-Scale Procedures
The continuous dewatering test rig used at the Smith Branch site incorporated three main
components, a column module, conditioner module, and a disc filter module, along with some
other ancillary components. The details about the modules were described previously. For the
pilot-scale tests, feed slurry was supplied from either the existing preparation pond reclaim
facilities or in barrels and directed into the circuit feed sump. During the tests, the slurry was fed
at a constant rate into a 12 inch diameter column by means of a peristaltic pump and flexible
piping. The flotation column was used to produce a filter feed and reject ultra-fine hydrophilic
clay that negatively impacts the effectiveness of some of the dewatering aids. Then, the clean
coal froth was routed to the multi-stage conditioner module by gravity while the column reject
slurry flowed, also by gravity, to a refuse sump. After adding appropriate dewatering reagents,
the conditioned slurry was pumped at a constant rate into the filter test module. Next, the
conditioned slurry was dewatered in the filter module. The filter cake was discharged into a
118
container and immediately transferred to an oven for moisture analysis while the filter effluent
was pumped to the reject sump. In addition, if any excess feed problems occurred, the column
feed sump and conditioner tanks were allowed to overflow in a controlled manner.
e) Laboratory Results (Vibracore Samples)
The objective of the test series was to conduct preliminary investigations that evaluate the
performance of dewatering aids. The laboratory tests were conducted on the Pinnacle Smith
Branch Vibracore Composite Sample. Prior to the dewatering tests, the sample was cleaned
using a Laboratory Denver Flotation Cell using 0.88 lb/t kerosene and 0.33 lb/t MIBC at 16.7 %
solid content. Of the samples, the vibracore sample was very important because the data from
the laboratory studies was also used to provide practical justification for the pilot scale test
program which would soon to be carried out using Peterson Disc Filter.
A series of initial batch laboratory filter dewatering tests was conducted to determine
whether the floated vibracore coal would respond well to the addition of the novel dewatering
aids. A 62.5 mm diameter Buchner filter was used for these tests. The solids content of the
sample was 16.0%. and a vacuum setup point of 20 inches Hg was utilized. The tests typically
provided a cake thickness of 7-8 mm without reagent and 8-10 mm with reagent. A conditioning
time of 5 minutes and a drying cycle time of 2 minutes was used. The volume of the slurry was
100 ml. The impoundment sample was floated at 16.7% solids using 0.88 lb/t kerosene and 0.33
lb/t MIBC before the filter tests. Table 2.38 gives the laboratory test results when RW was used
as the dewatering aid. As shown, the moisture content in the filter cake was reduced when
reagent addition was increased. At 1 and 5 lb/t RW additions, the moisture contents of the cake
were reduced from 28.7% to 24.6% and 14.3%, respectively. The lower value corresponds to a
50% moisture reduction in the filter product.
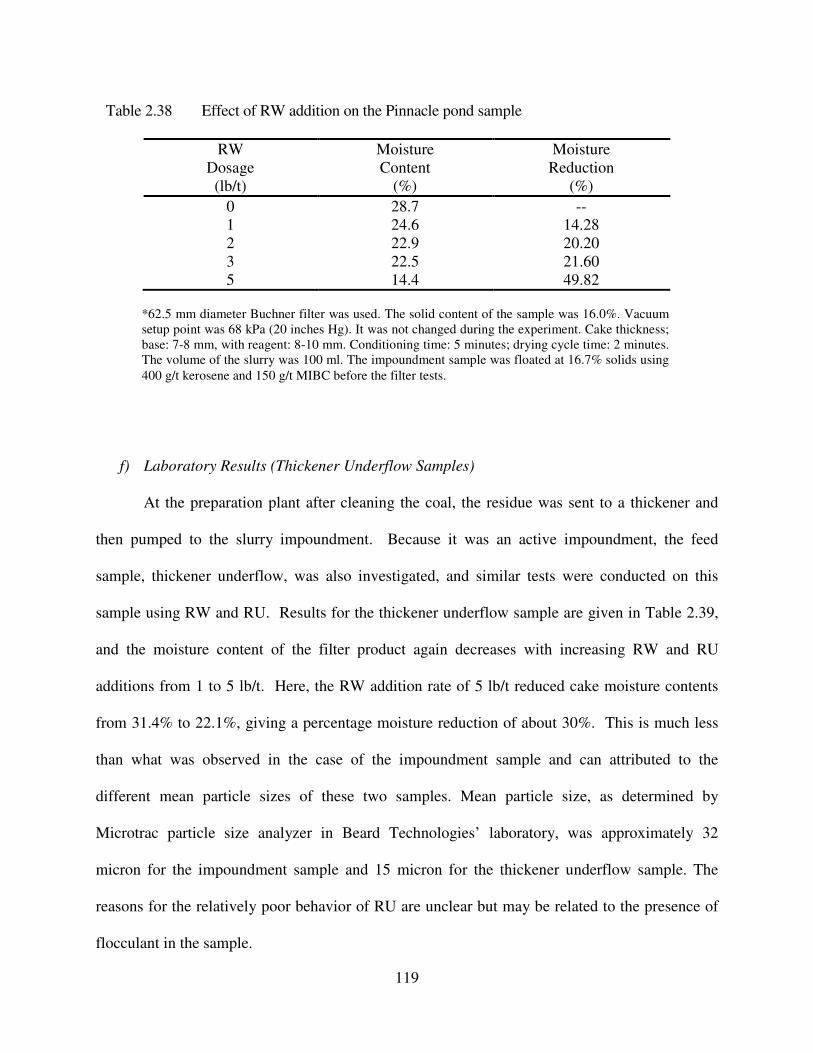
119
f) Laboratory Results (Thickener Underflow Samples)
At the preparation plant after cleaning the coal, the residue was sent to a thickener and
then pumped to the slurry impoundment. Because it was an active impoundment, the feed
sample, thickener underflow, was also investigated, and similar tests were conducted on this
sample using RW and RU. Results for the thickener underflow sample are given in Table 2.39,
and the moisture content of the filter product again decreases with increasing RW and RU
additions from 1 to 5 lb/t. Here, the RW addition rate of 5 lb/t reduced cake moisture contents
from 31.4% to 22.1%, giving a percentage moisture reduction of about 30%. This is much less
than what was observed in the case of the impoundment sample and can attributed to the
different mean particle sizes of these two samples. Mean particle size, as determined by
Microtrac particle size analyzer in Beard Technologies’ laboratory, was approximately 32
micron for the impoundment sample and 15 micron for the thickener underflow sample. The
reasons for the relatively poor behavior of RU are unclear but may be related to the presence of
flocculant in the sample.
Table 2.38 Effect of RW addition on the Pinnacle pond sample
RW
Dosage
(lb/t)
Moisture
Content
(%)
Moisture
Reduction
(%)
0 28.7 --
1 24.6 14.28
2 22.9 20.20
3 22.5 21.60
5 14.4 49.82
*62.5 mm diameter Buchner filter was used. The solid content of the sample was 16.0%. Vacuum
setup point was 68 kPa (20 inches Hg). It was not changed during the experiment. Cake thickness;
base: 7-8 mm, with reagent: 8-10 mm. Conditioning time: 5 minutes; drying cycle time: 2 minutes.
The volume of the slurry was 100 ml. The impoundment sample was floated at 16.7% solids using
400 g/t kerosene and 150 g/t MIBC before the filter tests.
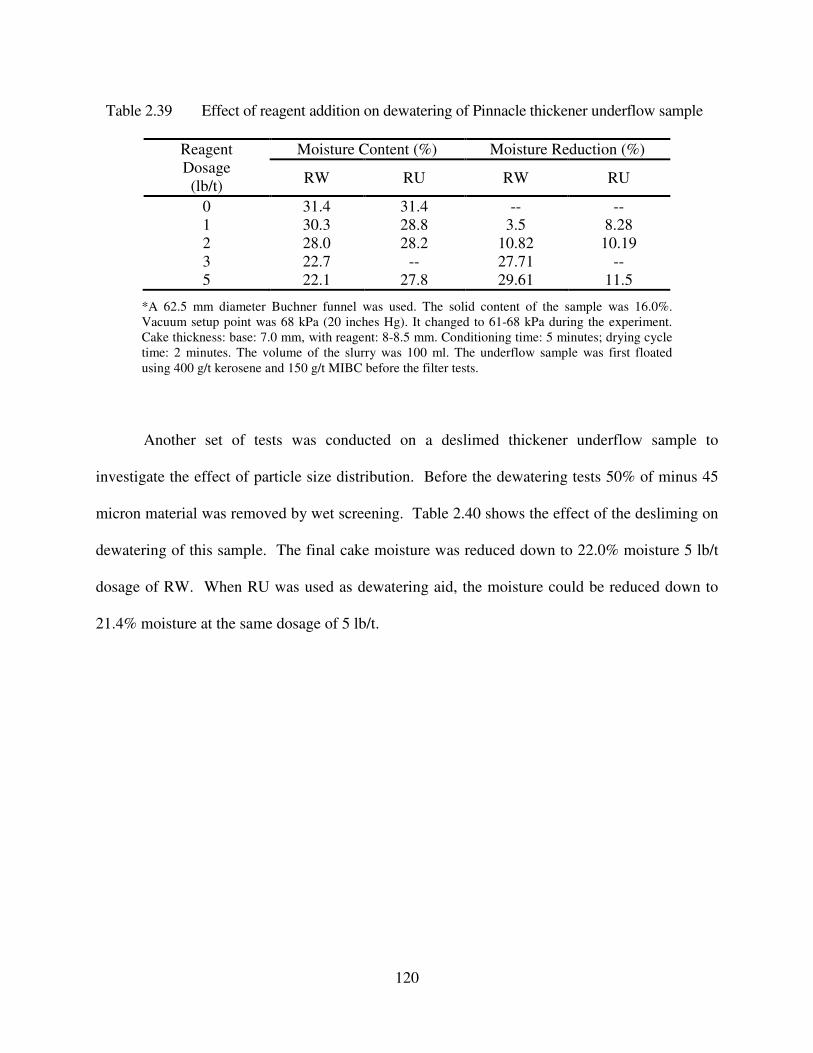
120
Another set of tests was conducted on a deslimed thickener underflow sample to
investigate the effect of particle size distribution. Before the dewatering tests 50% of minus 45
micron material was removed by wet screening. Table 2.40 shows the effect of the desliming on
dewatering of this sample. The final cake moisture was reduced down to 22.0% moisture 5 lb/t
dosage of RW. When RU was used as dewatering aid, the moisture could be reduced down to
21.4% moisture at the same dosage of 5 lb/t.
Table 2.39 Effect of reagent addition on dewatering of Pinnacle thickener underflow sample
Reagent
Dosage
(lb/t)
Moisture Content (%) Moisture Reduction (%)
RW RU RW RU
0 31.4 31.4 -- --
1 30.3 28.8 3.5 8.28
2 28.0 28.2 10.82 10.19
3 22.7 -- 27.71 --
5 22.1 27.8 29.61 11.5
*A 62.5 mm diameter Buchner funnel was used. The solid content of the sample was 16.0%.
Vacuum setup point was 68 kPa (20 inches Hg). It changed to 61-68 kPa during the experiment.
Cake thickness: base: 7.0 mm, with reagent: 8-8.5 mm. Conditioning time: 5 minutes; drying cycle
time: 2 minutes. The volume of the slurry was 100 ml. The underflow sample was first floated
using 400 g/t kerosene and 150 g/t MIBC before the filter tests.
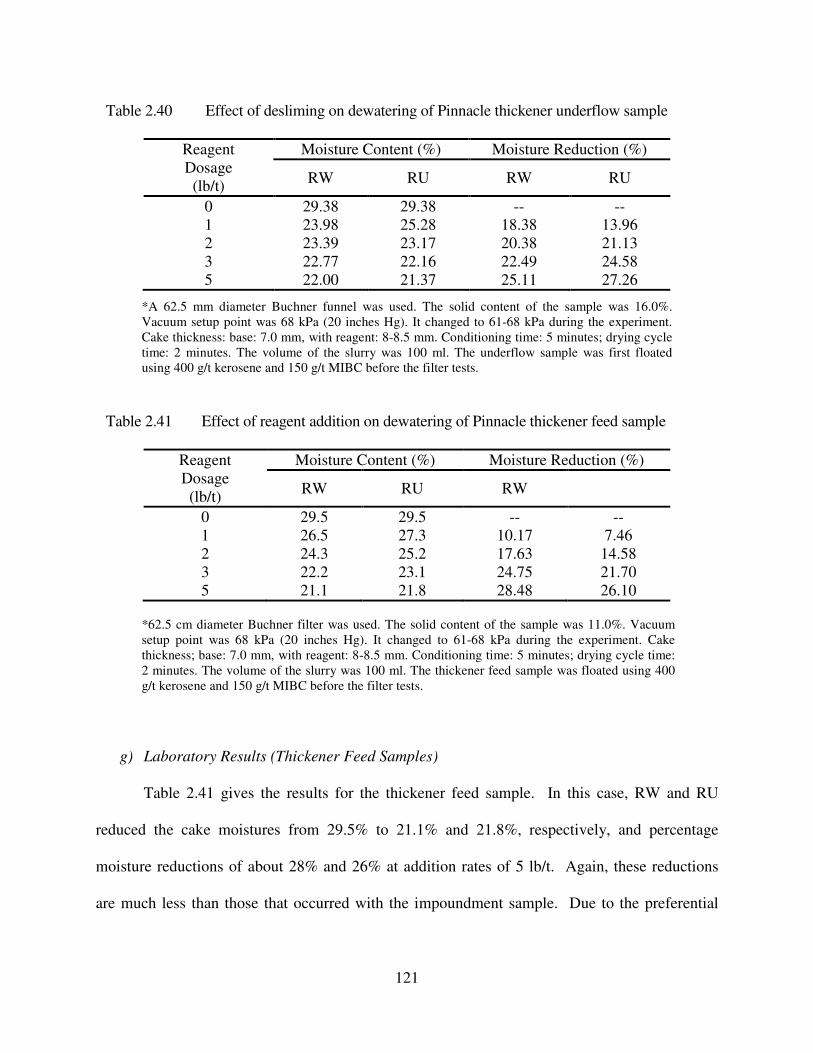
121
g) Laboratory Results (Thickener Feed Samples)
Table 2.41 gives the results for the thickener feed sample. In this case, RW and RU
reduced the cake moistures from 29.5% to 21.1% and 21.8%, respectively, and percentage
moisture reductions of about 28% and 26% at addition rates of 5 lb/t. Again, these reductions
are much less than those that occurred with the impoundment sample. Due to the preferential
Table 2.40 Effect of desliming on dewatering of Pinnacle thickener underflow sample
Reagent
Dosage
(lb/t)
Moisture Content (%) Moisture Reduction (%)
RW RU RW RU
0 29.38 29.38 -- --
1 23.98 25.28 18.38 13.96
2 23.39 23.17 20.38 21.13
3 22.77 22.16 22.49 24.58
5 22.00 21.37 25.11 27.26
*A 62.5 mm diameter Buchner funnel was used. The solid content of the sample was 16.0%.
Vacuum setup point was 68 kPa (20 inches Hg). It changed to 61-68 kPa during the experiment.
Cake thickness: base: 7.0 mm, with reagent: 8-8.5 mm. Conditioning time: 5 minutes; drying cycle
time: 2 minutes. The volume of the slurry was 100 ml. The underflow sample was first floated
using 400 g/t kerosene and 150 g/t MIBC before the filter tests.
Table 2.41 Effect of reagent addition on dewatering of Pinnacle thickener feed sample
Reagent
Dosage
(lb/t)
Moisture Content (%) Moisture Reduction (%)
RW RU RW
0 29.5 29.5 -- --
1 26.5 27.3 10.17 7.46
2 24.3 25.2 17.63 14.58
3 22.2 23.1 24.75 21.70
5 21.1 21.8 28.48 26.10
*62.5 cm diameter Buchner filter was used. The solid content of the sample was 11.0%. Vacuum
setup point was 68 kPa (20 inches Hg). It changed to 61-68 kPa during the experiment. Cake
thickness; base: 7.0 mm, with reagent: 8-8.5 mm. Conditioning time: 5 minutes; drying cycle time:
2 minutes. The volume of the slurry was 100 ml. The thickener feed sample was floated using 400
g/t kerosene and 150 g/t MIBC before the filter tests.
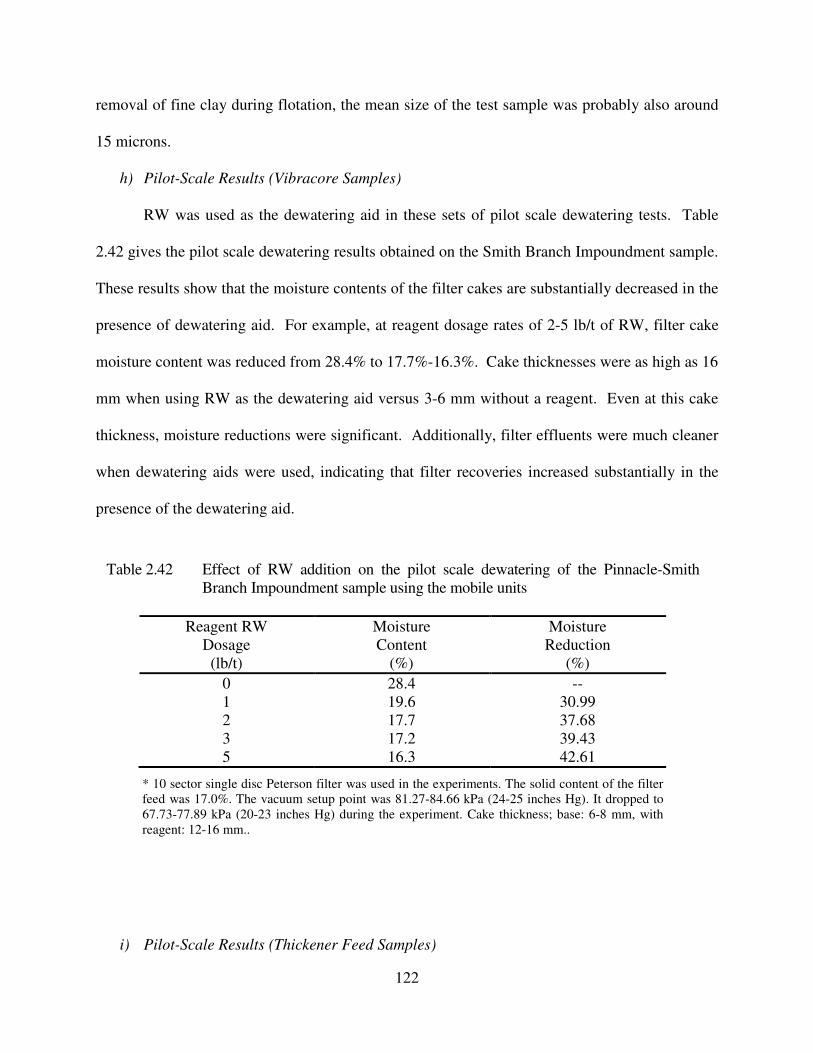
122
removal of fine clay during flotation, the mean size of the test sample was probably also around
15 microns.
h) Pilot-Scale Results (Vibracore Samples)
RW was used as the dewatering aid in these sets of pilot scale dewatering tests. Table
2.42 gives the pilot scale dewatering results obtained on the Smith Branch Impoundment sample.
These results show that the moisture contents of the filter cakes are substantially decreased in the
presence of dewatering aid. For example, at reagent dosage rates of 2-5 lb/t of RW, filter cake
moisture content was reduced from 28.4% to 17.7%-16.3%. Cake thicknesses were as high as 16
mm when using RW as the dewatering aid versus 3-6 mm without a reagent. Even at this cake
thickness, moisture reductions were significant. Additionally, filter effluents were much cleaner
when dewatering aids were used, indicating that filter recoveries increased substantially in the
presence of the dewatering aid.
i) Pilot-Scale Results (Thickener Feed Samples)
Table 2.42 Effect of RW addition on the pilot scale dewatering of the Pinnacle-Smith
Branch Impoundment sample using the mobile units
Reagent RW
Dosage
(lb/t)
Moisture
Content
(%)
Moisture
Reduction
(%)
0 28.4 --
1 19.6 30.99
2 17.7 37.68
3 17.2 39.43
5 16.3 42.61
* 10 sector single disc Peterson filter was used in the experiments. The solid content of the filter
feed was 17.0%. The vacuum setup point was 81.27-84.66 kPa (24-25 inches Hg). It dropped to
67.73-77.89 kPa (20-23 inches Hg) during the experiment. Cake thickness; base: 6-8 mm, with
reagent: 12-16 mm..
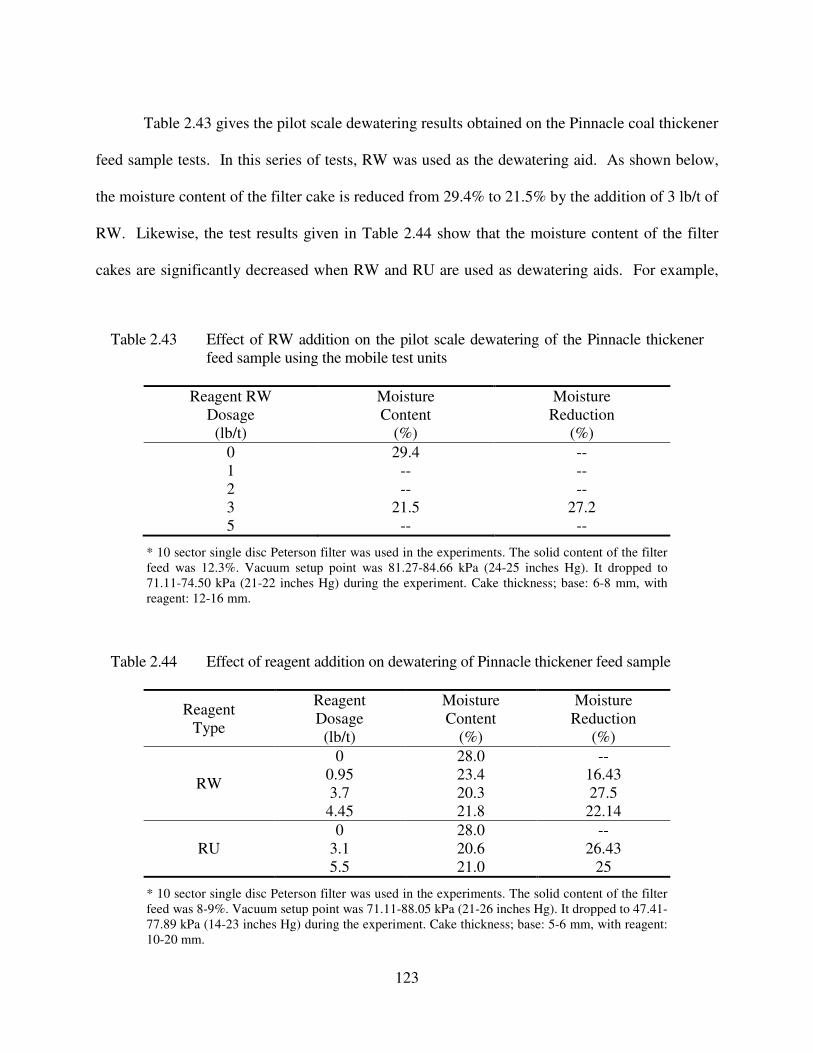
123
Table 2.43 gives the pilot scale dewatering results obtained on the Pinnacle coal thickener
feed sample tests. In this series of tests, RW was used as the dewatering aid. As shown below,
the moisture content of the filter cake is reduced from 29.4% to 21.5% by the addition of 3 lb/t of
RW. Likewise, the test results given in Table 2.44 show that the moisture content of the filter
cakes are significantly decreased when RW and RU are used as dewatering aids. For example,
Table 2.43 Effect of RW addition on the pilot scale dewatering of the Pinnacle thickener
feed sample using the mobile test units
Reagent RW
Dosage
(lb/t)
Moisture
Content
(%)
Moisture
Reduction
(%)
0 29.4 --
1 -- --
2 -- --
3 21.5 27.2
5 -- --
* 10 sector single disc Peterson filter was used in the experiments. The solid content of the filter
feed was 12.3%. Vacuum setup point was 81.27-84.66 kPa (24-25 inches Hg). It dropped to
71.11-74.50 kPa (21-22 inches Hg) during the experiment. Cake thickness; base: 6-8 mm, with
reagent: 12-16 mm.
Table 2.44 Effect of reagent addition on dewatering of Pinnacle thickener feed sample
Reagent
Type
Reagent
Dosage
(lb/t)
Moisture
Content
(%)
Moisture
Reduction
(%)
RW
0 28.0 --
0.95 23.4 16.43
3.7 20.3 27.5
4.45 21.8 22.14
RU
0 28.0 --
3.1 20.6 26.43
5.5 21.0 25
* 10 sector single disc Peterson filter was used in the experiments. The solid content of the filter
feed was 8-9%. Vacuum setup point was 71.11-88.05 kPa (21-26 inches Hg). It dropped to 47.41-
77.89 kPa (14-23 inches Hg) during the experiment. Cake thickness; base: 5-6 mm, with reagent:
10-20 mm.

124
filter cake moisture contents were reduced from 28.0% to 23.4% at 2.09 lb/t and 20.3% at a 3.7
lb/t reagent dosage. RU performs as well as RW in terms of moisture reduction. The moisture
content in the filter cake was reduced from 28% to 20.6% in the presence of 3.1 lb/t of RU.
These results are in good agreement with those obtained in the previous laboratory tests.
125
2.3.8. Moatize Site
a) Site Specific Information
A new reserve is being developed by Companhia Vale do Rio Doce (CVRD). The coal
sample was from the Section 2A of the reserve. CVRD is in the process of designing a coal
preparation plant with a throughput capacity of 4,000 metric tonnes per hour (t/h). The coal
sample received was a fine coal (0.25 mm x 0), which will be fed to a single-stage flotation
circuit. Columns are chosen over mechanically agitated cells, because the former can produce
cleaner froth products. The throughput capacity of the flotation circuit will be around 440 to 560
t/h.
The CVRD is looking for the possibility of reducing the moisture of the column flotation
product to less than 15% by weight using horizontal belt filters (HBF). It has been a challenge to
achieve such a low level of moisture with a by-zero froth product using a vacuum filter. It is
possible, however, to achieve the objective, if the HBF is used in conjunction with the novel
dewatering aids developed at Virginia Tech. For this reason a series of laboratory dewatering
tests have been conducted on a coal sample from the Moatize region in Mozambique.
b) Experimental Design
Flotation and Dewatering Aids
During this investigation, dewatering tests were performed with varying amounts of two
types of dewatering aids, RU, and RV. Since these dewatering aids are insoluble in water, they
were dissolved in diesel which was used as a solvent. The ratio of reagents-to-solvent was
optimized in previous studies by varying the individual dosages (0.5 to 3lb/t), while maintaining
the total blend dosage constant. For this test program, the optimum combination for a given
dewatering aid and solvent is one to two (1:2) dewatering aid-diesel ratio. When flotation tests
126
were conducted, RV, Nalco-9855 and kerosene were used as collectors while Nalco-9840 was
used as frother.
Samples and Procedures
Coal Samples: The coal sample was received as wet cake in a bucket, which had been
obtained by decantation. Prior to each series of dewatering tests, a portion of the wet cake was
removed from the bucket, mixed with a volume of tap water, and agitated for a minimum of 3
hours. After the agitation, part of the slurry was transferred to a Denver D-12 laboratory flotation
cell and subjected to flotation. The froth product was then used as a feed to a series of laboratory
vacuum filtration tests.
Procedure: The froth product from a single-stage laboratory flotation tests was placed in
container, and agitated to obtain a homogenous suspension of clean coal. A volume of the
suspension was removed by means of a cup of known volume. The suspension was then
subjected to vacuum filtration tests using a 2-inch diameter Buchner filter using a fabric filter
medium. The thickness of the filter cake formed on the filter cloth was varied by controlling the
volume of the suspension filtered. When the slurry volume was varied from 100, 150 to 200 ml,
the cake thicknesses varied from approximately 10, 15, and 20-22 mm. When the slurry volume
was varied from 100, 150 to 200 ml, the cake thicknesses varied from approximately 10, 15, and
20-22 mm. At a given filtration experiment, the initial vacuum pressure was set at 20-inch Hg,
which was reduced to 15- to 17-inch Hg at the end of the 2 minutes of filtration time employed
in the present work.
Initially, the flotation tests were conducted at 5 to 6%. In later experiments, the solid
concentration was increased to 10% to obtain froth products with a higher solid content. In some
127
experiments, the feeds to filtration experiments were conditioned in a standalone conditioner. In
others, the flotation cell was used as a conditioner.
c) Results and Discussions
Using Flotation Cell as Conditioner
The first set of dewatering tests was conducted by adding the dewatering aids directly
into the flotation cell without using a stand-alone conditioning tank. In this procedure, the
flotation cell was used effectively as a conditioner. This was possible because the dewatering
aids being tested in the project can increase the hydrophobicity of coal, as noted previously. The
froth products obtained from the flotation tests were then subjected to dewatering tests using the
Buchner filter. Each test was conducted at 15 mm cake thickness and 2 minutes of filtration
time, including cake formation and drying cycle times.
For comparison, a series of dewatering tests was also conducted using kerosene as
collector. The use of Nalco 9855 and RV gave substantially lower cake moistures than the diesel
at low reagent dosages. At 0.88 lb/t, diesel produced a cake with 22.8% moisture, while using
RV resulted in 18.1% moisture reduction.
Using a Standalone Conditioner
In the second set of tests, flotation tests were conducted using 0.88 lb/t of kerosene as
collector. The froth product (approximately 10% solids) was conditioned in the presence of a
dewatering aid for 2 minutes in a small, rectangular-shaped conditioner prior to dewatering test.
The results obtained using varying amounts of two different dewatering aids (RV and RU) are
given in Table 2.45.
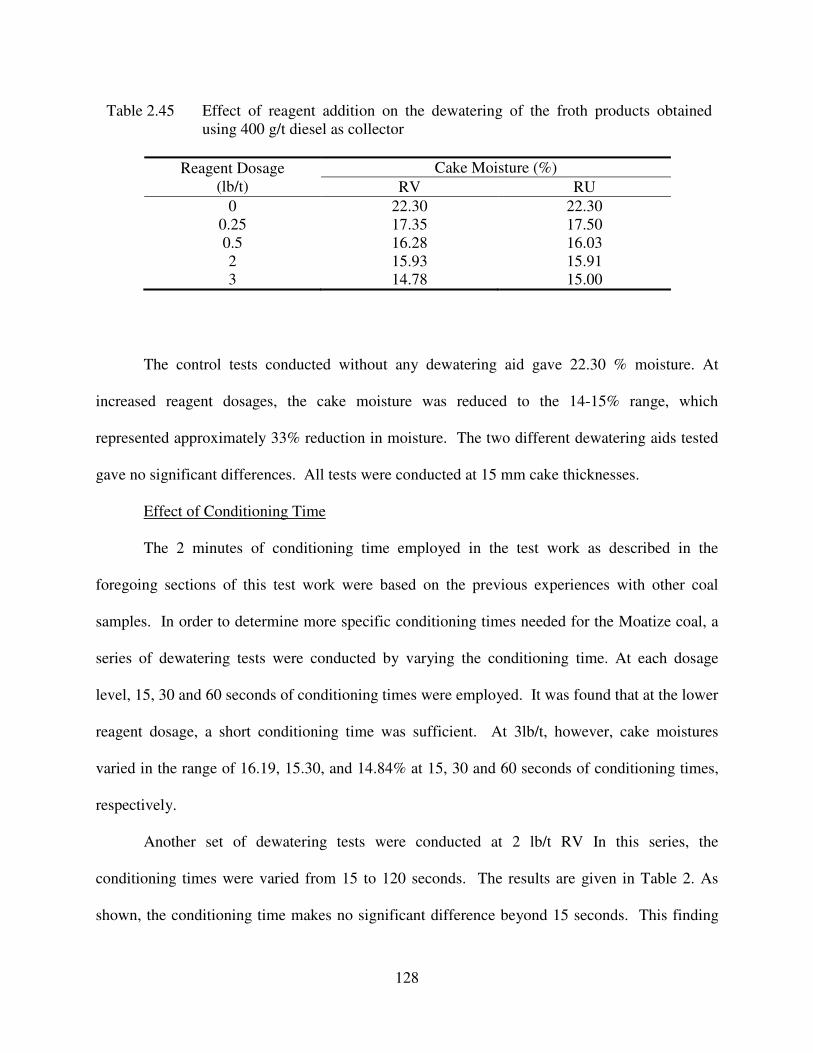
128
The control tests conducted without any dewatering aid gave 22.30 % moisture. At
increased reagent dosages, the cake moisture was reduced to the 14-15% range, which
represented approximately 33% reduction in moisture. The two different dewatering aids tested
gave no significant differences. All tests were conducted at 15 mm cake thicknesses.
Effect of Conditioning Time
The 2 minutes of conditioning time employed in the test work as described in the
foregoing sections of this test work were based on the previous experiences with other coal
samples. In order to determine more specific conditioning times needed for the Moatize coal, a
series of dewatering tests were conducted by varying the conditioning time. At each dosage
level, 15, 30 and 60 seconds of conditioning times were employed. It was found that at the lower
reagent dosage, a short conditioning time was sufficient. At 3lb/t, however, cake moistures
varied in the range of 16.19, 15.30, and 14.84% at 15, 30 and 60 seconds of conditioning times,
respectively.
Another set of dewatering tests were conducted at 2 lb/t RV In this series, the
conditioning times were varied from 15 to 120 seconds. The results are given in Table 2. As
shown, the conditioning time makes no significant difference beyond 15 seconds. This finding
Table 2.45 Effect of reagent addition on the dewatering of the froth products obtained
using 400 g/t diesel as collector
Reagent Dosage
(lb/t)
Cake Moisture (%)
RV RU
0 22.30 22.30
0.25 17.35 17.50
0.5 16.28 16.03
2 15.93 15.91
3 14.78 15.00
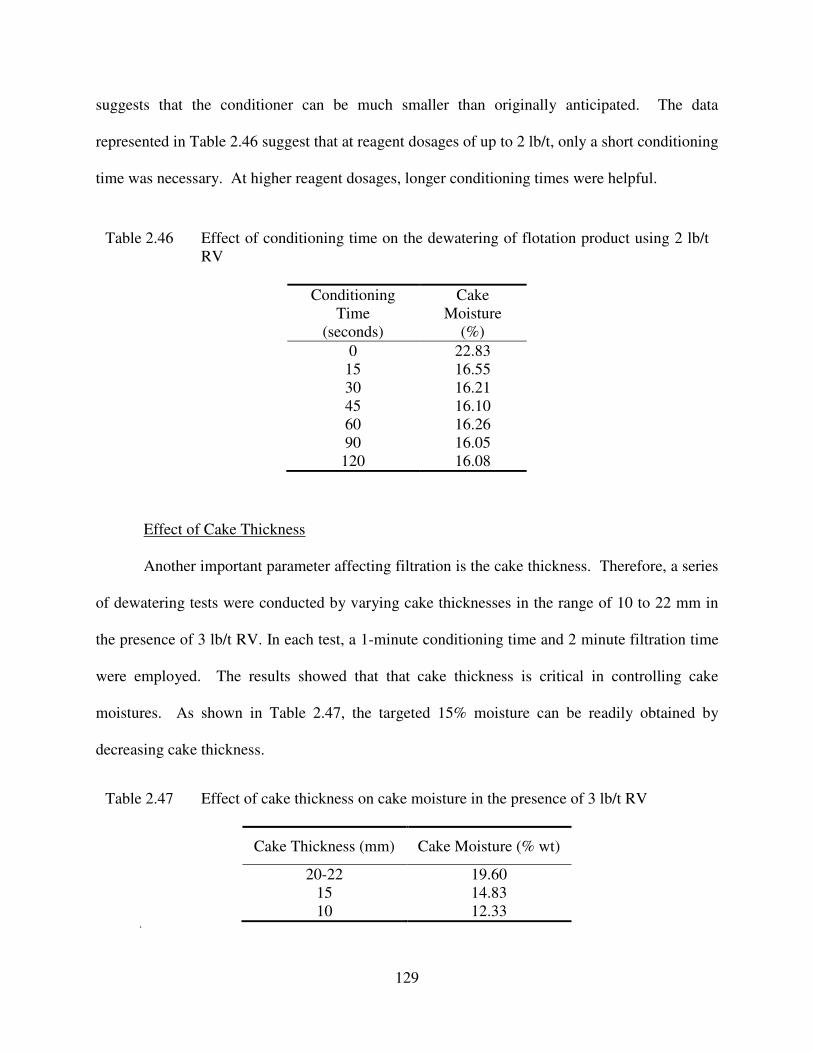
129
suggests that the conditioner can be much smaller than originally anticipated. The data
represented in Table 2.46 suggest that at reagent dosages of up to 2 lb/t, only a short conditioning
time was necessary. At higher reagent dosages, longer conditioning times were helpful.
Effect of Cake Thickness
Another important parameter affecting filtration is the cake thickness. Therefore, a series
of dewatering tests were conducted by varying cake thicknesses in the range of 10 to 22 mm in
the presence of 3 lb/t RV. In each test, a 1-minute conditioning time and 2 minute filtration time
were employed. The results showed that that cake thickness is critical in controlling cake
moistures. As shown in Table 2.47, the targeted 15% moisture can be readily obtained by
decreasing cake thickness.
Table 2.46 Effect of conditioning time on the dewatering of flotation product using 2 lb/t
RV
Conditioning
Time
(seconds)
Cake
Moisture
(%)
0 22.83
15 16.55
30 16.21
45 16.10
60 16.26
90 16.05
120 16.08
Table 2.47 Effect of cake thickness on cake moisture in the presence of 3 lb/t RV
Cake Thickness (mm) Cake Moisture (% wt)
20-22 19.60
15 14.83
10 12.33
a)
130
2.4. SUMMARY AND CONCLUSIONS
Laboratory- and pilot-scale dewatering tests were conducted on various fine coal samples
received from several coal preparation plants. The objectives of the dewatering tests were to
maximize the effects of novel dewatering aids in terms of final cake moisture and the dewatering
kinetics in order to evaluate possible industrial applications. The evaluation tests were
conducted using various types and dosages of novel dewatering aids while varying operating
parameters (e.g., cake formation time, dry cycle time, vacuum and air pressure and cake
thickness.) Laboratory tests were conducted using a Buchner Funnel and air pressure filters
while the pilot-scale tests were conducted using vacuum disc and horizontal belt filters. During
pilot-scale tests, a two-step conditioner was also used to ensure effective mixing of the aids. In
some of the dewatering tests, a column flotation unit was utilized to produce fresh coal.
Currently, fine particle coal reports to the Mingo Logan Preparation Plant’s discard fine
stream due to the inability of centrifuges to capture this material. A series of laboratory- and
pilot-scale dewatering tests were also conducted to study the feasibility of using the novel
dewatering aids in conjunction with horizontal belt filters to recover this fine coal. The tests
varied types and dosages of dewatering aids added to feeds comprised of different mixtures of
relatively coarse and fine coal particles. Dewatering test results showed that a 20% moisture
reduction along with almost 50% increase in kinetics could be achieved on fine coal feeds
(nearly 43% particles of this product was passing 325 mesh (-44 µm) and contained 81% ash).
When fine coal samples were subjected to dewatering tests after re-cleaning to reduce the
amount of hydrophilic ash forming minerals, the moisture reduction was further increased to
35%. Similar results were obtained when tests were conducted on relatively coarser samples
131
comprised of 50% fine and 50% spiral product: the moisture could be reduced by 20-30% while
increasing the kinetics by 30-50%.
On-site pilot-scale tests using HBF showed that, when the operating parameters are
optimized, it is possible to lower the moisture of fine coal samples by 18% and coarser samples
by 30%. Results also indicated that adequate mixing time and intensity is very critical and
should be optimized. Using flocculants along with the novel dewatering aids additionally
increased the effectiveness by increasing kinetics. If the dewatering aids are used along with the
required equipment (i.e., column and HBF), the additional annual net revenue was calculated to
be $1.57 million with the payback time of 3.1 years.
Several pilot-scale dewatering tests were also conducted on Coal Clean Preparation Plant
feeds (100% -325 mesh) to investigate the possible application of novel dewatering aids. The
fine coal was treated by using a column flotation unit and fed to a pilot-scale disc filter. The
results showed that under optimized conditions, it is possible to lower the moisture by almost
20% while increasing the dewatering kinetics. Based on the results that were obtained on coal
from this site, it appears possible to increase the fine circuit’s recovery while lowering the
moisture.
Coal samples obtained from Concord Preparation plant were subjected to flotation and
dewatering tests to investigate the recovery of the fine coal at acceptable moisture levels.
Laboratory test results showed that the moisture could be reduced by 26%, and to verify these
results, a number of on-site pilot-scale tests were also conducted. Pilot-scale results confirmed
that dewatering aids are capable of lowering the final cake moisture by 21%. Additionally, a
number of tests were conducted using the dewatering aids as collectors, wherein the dosage was
only 50% of a normal diesel dosage. Under these conditions, it was observed that recovery was
132
increased and the moisture was lowered by 7%. When the same dosage as diesel was utilized,
the moisture was further reduced, giving a 14% overall reduction. The dewatering kinetics were
also increased.
Several dewatering tests were conducted on Buchanan filter feed samples. The final cake
moisture was found to be 18.1% for the control tests and 14.9% in the presence of a novel
dewatering aid. Similar tests were conducted with the pilot-scale unit and comparable moisture
reductions were obtained. However, considering the relatively coarser size of the coal, the
results were not good as expected. This may be attributed to water chemistry (i.e., excessive
amounts of Ca2+
ions present in Buchanan plant water.) Additionally, a series of tests were
conducted to investigate the effect of mixing intensity and time. It was found that supplying
proper mixing intensity and time may lower the final cake moisture substantially. One study
showed that total moisture reduction was around 36% under proper mixing conditions as
compared to 19% when the mixing was not sufficient.
A number of coal samples were received from Elkview Coal Preparation Plant, where
insufficient moisture reduction causes a bottle neck in production. Laboratory dewatering test
results indicated that the final cake moisture may be lowered by 35-50% depending on the coal
feed type. Using dewatering aids as collectors at a 700 g/t dosage, the recovery was the same or
better as compared to diesel. Without any additional dewatering aids, a moisture reduction of
about 13% was observed.
An investigation was also conducted to determine if the novel dewatering aids could be
utilized in industrial applications for fine coal beneficiation at the Smith Branch Reclamation
Site. To this end, a series of laboratory- and pilot-scale dewatering tests were conducted on
samples from this site. The results showed that the moisture content of the filter cake was
133
reduced as reagent addition was increased. At 1 and 5 lb/t RW additions, the moisture contents
of the cake were reduced from an initial 28.7% to 24.6%, and to 14.3%, respectively. The latter
value corresponds to a 50% moisture reduction overall in the filter product. A number of
laboratory tests were also conducted on thickener feed and thickener underflow samples, wherein
the moisture was reduced by 25-27%. Pilot-scale tests produced similar results.
In a coal preparation plant that will be built in Moatize, Mozambique, Companhia Vale
Rio Doce seeks to lower the moisture of it’s column flotation product to less than 15% (by
weight) using horizontal belt filters (HBF). Achieving this low moisture level on a by-zero froth
product is very challenging using a vacuum filter. It is possible, however, to achieve this level if
the HBF is used in conjunction with the novel dewatering aids. This was proven during a series
of laboratory dewatering tests on a coal sample from the Moatize region. Results indicated that
considerably low moistures are possible when using the novel aids as only dewatering agents.
Furthermore, when using the aids as collector, it is also possible to obtain low moisture contents.
Additionally, the Moatize coal can be treated using relatively shorter chemical mixing times.
Overall, test results clearly showed that when operating parameters are optimized, use of
novel dewatering aids can generate substantial moisture reductions that cannot be achieved by
mechanical means. Additionally, the dewatering kinetics can be increased, which in turn may
greatly increase the throughput of filter operations. The dewatering aids can also be used as
collectors where mixing is not possible. They not only produce similar or better results than
conventional collectors, but also lowering moisture contents.
134
2.5. REFERENCES
1. Y.A. Liu, The Physical Cleaning of Coal: Present and Developing Methods. Energy,
Power, and Environment, Vol. 17. 1982.
2. P. Somasundaran, .Advances in Mineral Processing 1986, Littleton: The Society of
Mining Engineers of AIME. 756.
3. B.K. Parekah, J.D. Miller, Advances in Flotation Technology, 1999, Littleton: Society for
Mining, Metallurgy, and Exploration. 463.
4. Wills, B.A., Coal Preparation Technology: D.G. Osborne Graham & Trotman Ltd,
Minerals Engineering, 1988. 1(4): p. 374-375.
5. Svarovsky, Solid-Liquid Separation. 1991, London: Butterworth.
6. Akers, R.J., Solid-Liquid Separation: Edited by L. Svarovsky, published by
Butterworths, London, The Chemical Engineering Journal, 1978. 15(1): p. 77-79.
7. D.J. Condie, M.H., and C.J. Veal, Modelling The Vacuum Filtration of Fine Coal.
Filtration & Separation, 1996.
8. Condie, D.J. and C.J. Veal, Modelling the Vacuum Filtration of Fine Coal: Part 2.
Filtration & Separation, 1997. 34(9): p. 957-963.
135
CHAPTER 3 SIMULATION AND SCALE-UP
3.1. INTRODUCTION
There are certain difficulties in coal processing, especially with fine coal cleaning
and dewatering. When coal is cleaned by flotation – the most dominant fine coal
cleaning method – the product is in slurry form and has to be dewatered to acceptable
moisture levels before sale.[1-3] As stated in the previous chapter, the final cake
moisture and the production rate of a filter unit are important factors which must be
optimized for an effective operation.[2] The Mingo Logan Preparation Plant is a
particular site which has suffered from inefficiencies in flotation and especially
dewatering. The plant has been losing valuable coal because its current operation design
does not allow recovering the entire fine coal fraction from centrifuges. Typically,
centrifuges are very effective at coarse sizes, but the fine coal recovery is relatively low;
and when the fine size fraction is increased, the moisture is increased to levels that are
unacceptable.
Taking these facts into account, a detailed dewatering study was undertaken to
investigate the feasibility of a vacuum filtration operation, a vacuum disc filter or a
horizontal belt filter (HBF). Based on the promising results obtained using novel
dewatering aids, it was proposed that vacuum filtration may be used to decrease the loss
of fines fraction and effectively lower the moisture.
In addition to the feasibility study, a number of parallel dewatering tests were
conducted to develop empirical models and simulations for a vacuum disc filter or HBF.
The results from these dewatering tests, including the plots, tables and the general
136
information were used to create the empirical model by correlating and combining the
filtration parameters. Development of an effective computer simulation will be valuable
in handling the complexities involved in data analysis and general performance
evaluation.
Data from the dewatering tests require moderately straightforward analysis in
order to make them useful for the simulation development. As a starting point, some
qualitative screening tests were carried out to determine what effects certain reagents and
other fundamental dewatering parameters have on final cake moisture. After establishing
the key parameters and their influences on cake moisture, more specific tests were
undertaken to evaluate overall performance.
It should be noted that there is not a standard procedure for dewatering modeling
and simulation. However, it is essential to perform the analysis to assess the variations in
cake thickness, cake weight, vacuum pressure, filtration time, concentration in the slurry,
particle size and distribution, filtration rate, etc.; experience has shown that these
parameters have a marked effect on the dewatering performance and profound influence
in designing the simulation.
3.2. EXPERIMENTAL
The filtration tests were carried out with a simple apparatus to determine the
effects of the parameters on final cake moisture. For these tests, a Buchner Funnel
equipped with a filter cloth is used. The general procedure to obtain the dewatering data
is as follows:
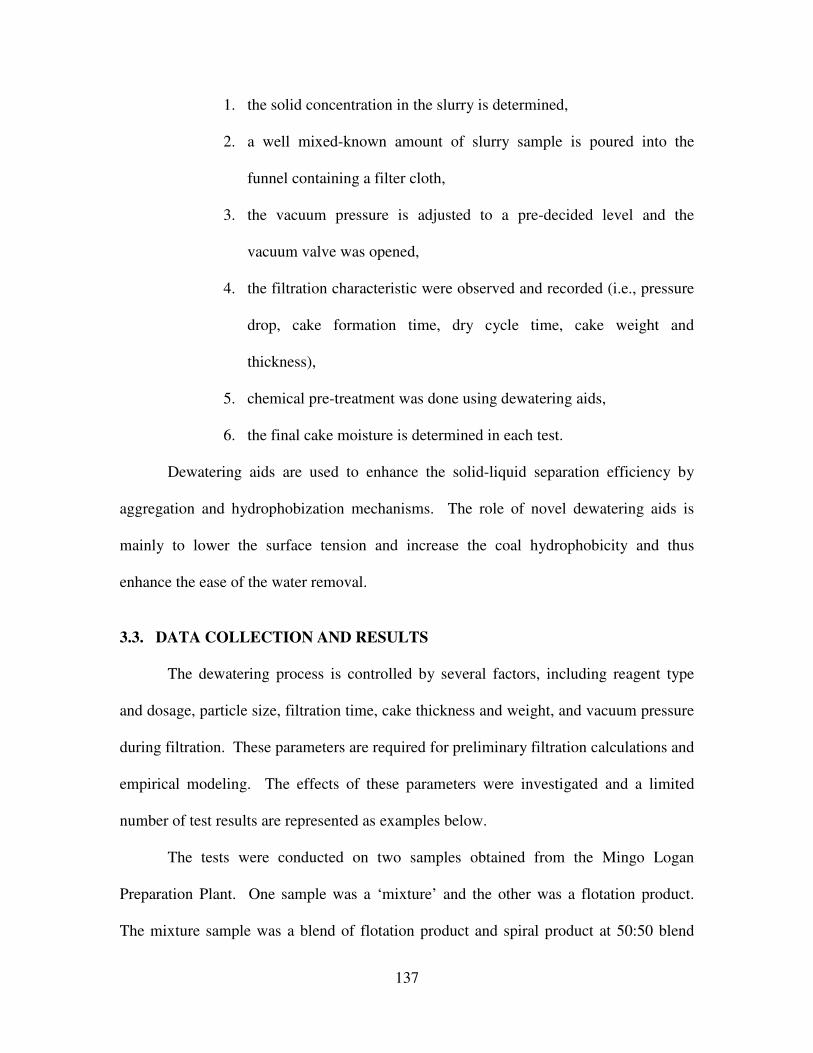
137
1. the solid concentration in the slurry is determined,
2. a well mixed-known amount of slurry sample is poured into the
funnel containing a filter cloth,
3. the vacuum pressure is adjusted to a pre-decided level and the
vacuum valve was opened,
4. the filtration characteristic were observed and recorded (i.e., pressure
drop, cake formation time, dry cycle time, cake weight and
thickness),
5. chemical pre-treatment was done using dewatering aids,
6. the final cake moisture is determined in each test.
Dewatering aids are used to enhance the solid-liquid separation efficiency by
aggregation and hydrophobization mechanisms. The role of novel dewatering aids is
mainly to lower the surface tension and increase the coal hydrophobicity and thus
enhance the ease of the water removal.
3.3. DATA COLLECTION AND RESULTS
The dewatering process is controlled by several factors, including reagent type
and dosage, particle size, filtration time, cake thickness and weight, and vacuum pressure
during filtration. These parameters are required for preliminary filtration calculations and
empirical modeling. The effects of these parameters were investigated and a limited
number of test results are represented as examples below.
The tests were conducted on two samples obtained from the Mingo Logan
Preparation Plant. One sample was a ‘mixture’ and the other was a flotation product.
The mixture sample was a blend of flotation product and spiral product at 50:50 blend
138
ratios. The second sample was 100% flotation product. The -325 size fraction was
determined to be about 30-35% for the mixture sample and 40-45% for the flotation
product sample.
The first series of evaluation tests were conducted to determine the effects of the
filter cloth and particle size on dewatering performance. As expected, the kinetics and
moisture values were more acceptable with the coarser material (i.e., the mixture sample)
compared to flotation product. Results also showed that among the filter cloths that were
tested, 60X40 mesh screen produced the best results. After establishing the optimum
filter cloth type and how the two samples responded to filtration, another set of tests was
conducted to investigate the effects of reagent type and dosage, filtration time, vacuum
pressure cake weight and thickness. The following tables represent the general trend of
the effects of these parameters on the mixture sample. Identical tests were conducted for
the flotation product sample as well, but only the mixture sample results are given as
examples.
Example 1: Effect of Reagent Type and Dosage
A series of tests were conducted to investigate the effect of reagent type and
dosage. The results showed that RU and RV performances were encouraging at 1 to
3lb/t. To increase the filtration rate Nalco 9806 was also used. Table 3.1 shows the
effect of reagent type and dosage.
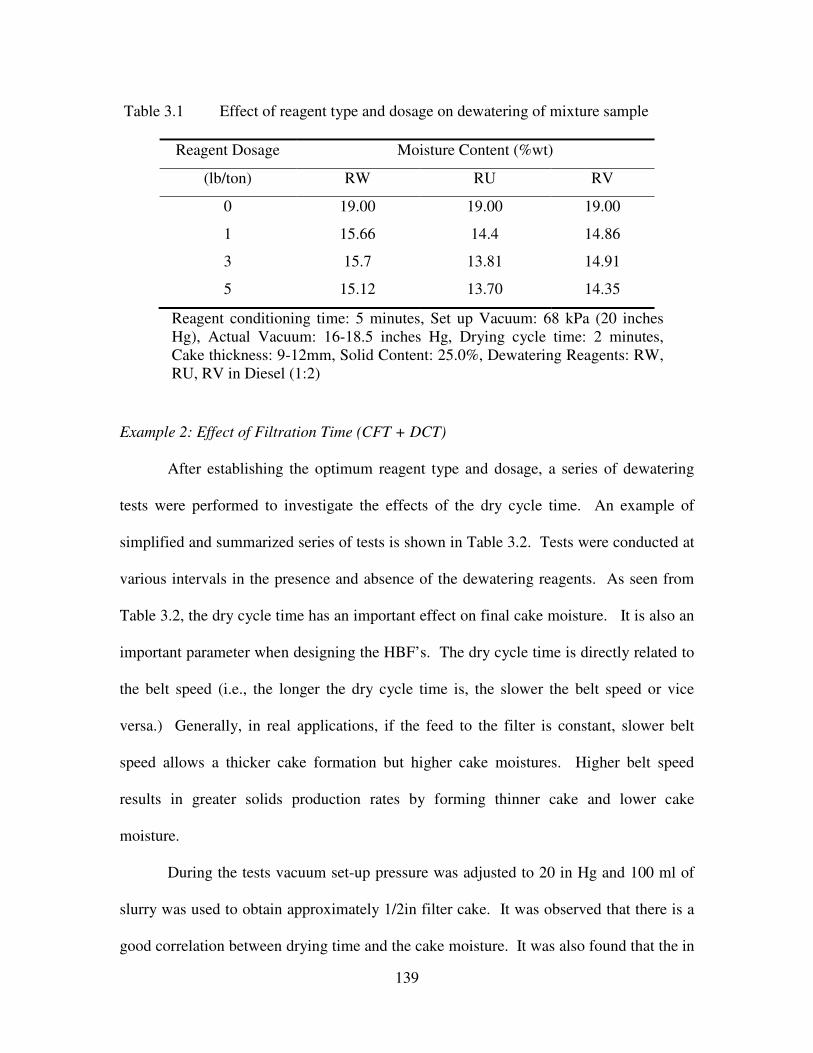
139
Example 2: Effect of Filtration Time (CFT + DCT)
After establishing the optimum reagent type and dosage, a series of dewatering
tests were performed to investigate the effects of the dry cycle time. An example of
simplified and summarized series of tests is shown in Table 3.2. Tests were conducted at
various intervals in the presence and absence of the dewatering reagents. As seen from
Table 3.2, the dry cycle time has an important effect on final cake moisture. It is also an
important parameter when designing the HBF’s. The dry cycle time is directly related to
the belt speed (i.e., the longer the dry cycle time is, the slower the belt speed or vice
versa.) Generally, in real applications, if the feed to the filter is constant, slower belt
speed allows a thicker cake formation but higher cake moistures. Higher belt speed
results in greater solids production rates by forming thinner cake and lower cake
moisture.
During the tests vacuum set-up pressure was adjusted to 20 in Hg and 100 ml of
slurry was used to obtain approximately 1/2in filter cake. It was observed that there is a
good correlation between drying time and the cake moisture. It was also found that the in
Table 3.1 Effect of reagent type and dosage on dewatering of mixture sample
Reagent Dosage Moisture Content (%wt)
(lb/ton) RW RU RV
0 19.00 19.00 19.00
1 15.66 14.4 14.86
3 15.7 13.81 14.91
5 15.12 13.70 14.35
Reagent conditioning time: 5 minutes, Set up Vacuum: 68 kPa (20 inches
Hg), Actual Vacuum: 16-18.5 inches Hg, Drying cycle time: 2 minutes,
Cake thickness: 9-12mm, Solid Content: 25.0%, Dewatering Reagents: RW,
RU, RV in Diesel (1:2)
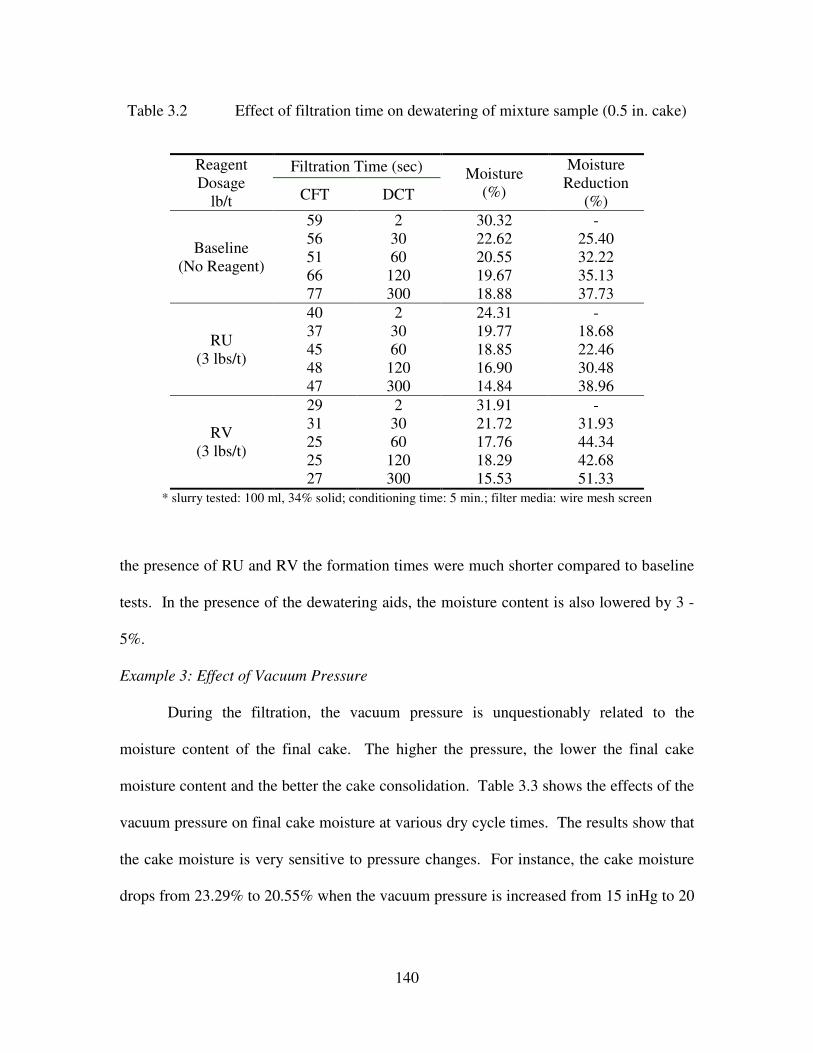
140
the presence of RU and RV the formation times were much shorter compared to baseline
tests. In the presence of the dewatering aids, the moisture content is also lowered by 3 -
5%.
Example 3: Effect of Vacuum Pressure
During the filtration, the vacuum pressure is unquestionably related to the
moisture content of the final cake. The higher the pressure, the lower the final cake
moisture content and the better the cake consolidation. Table 3.3 shows the effects of the
vacuum pressure on final cake moisture at various dry cycle times. The results show that
the cake moisture is very sensitive to pressure changes. For instance, the cake moisture
drops from 23.29% to 20.55% when the vacuum pressure is increased from 15 inHg to 20
Table 3.2 Effect of filtration time on dewatering of mixture sample (0.5 in. cake)
Reagent
Dosage
lb/t
Filtration Time (sec) Moisture
(%)
Moisture
Reduction
(%) CFT DCT
Baseline
(No Reagent)
59 2 30.32
22.62
20.55
19.67
18.88
-
56 30 25.40
51 60 32.22
66 120 35.13
77 300 37.73
RU
(3 lbs/t)
40 2 24.31
19.77
18.85
16.90
14.84
-
37 30 18.68
45 60 22.46
48 120 30.48
47 300 38.96
RV
(3 lbs/t)
29 2 31.91
21.72
17.76
18.29
15.53
-
31 30 31.93
25 60 44.34
25 120 42.68
27 300 51.33
* slurry tested: 100 ml, 34% solid; conditioning time: 5 min.; filter media: wire mesh screen
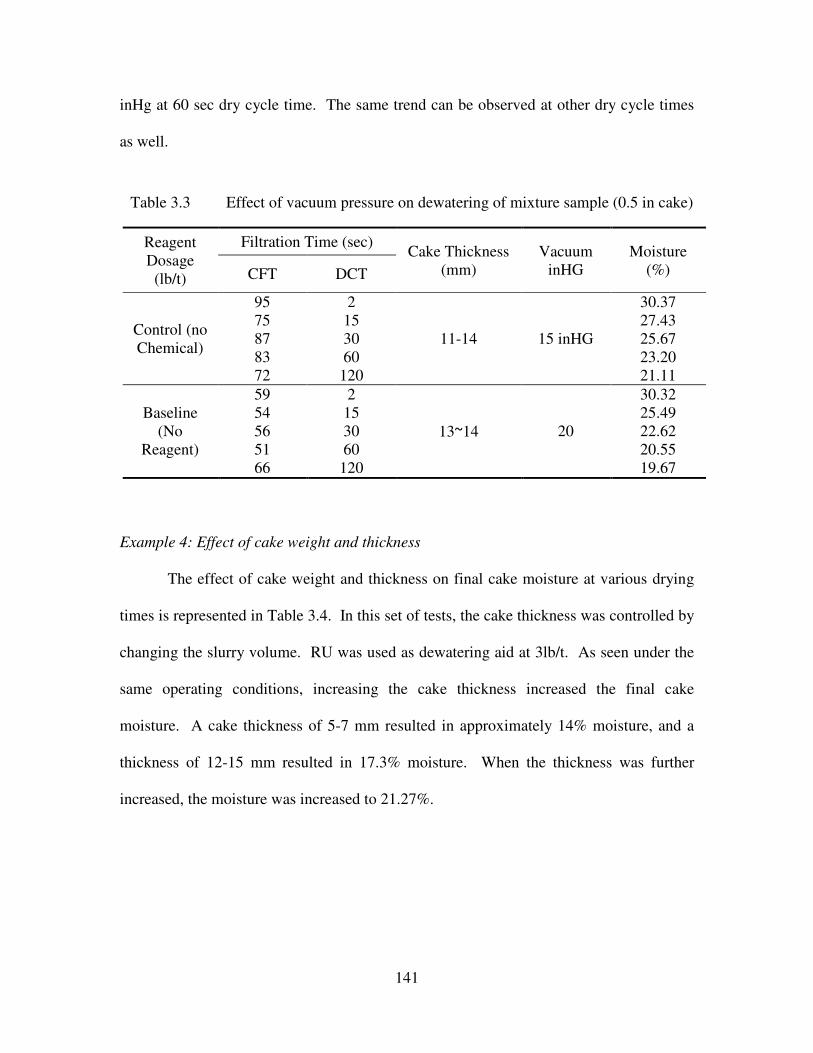
141
inHg at 60 sec dry cycle time. The same trend can be observed at other dry cycle times
as well.
Example 4: Effect of cake weight and thickness
The effect of cake weight and thickness on final cake moisture at various drying
times is represented in Table 3.4. In this set of tests, the cake thickness was controlled by
changing the slurry volume. RU was used as dewatering aid at 3lb/t. As seen under the
same operating conditions, increasing the cake thickness increased the final cake
moisture. A cake thickness of 5-7 mm resulted in approximately 14% moisture, and a
thickness of 12-15 mm resulted in 17.3% moisture. When the thickness was further
increased, the moisture was increased to 21.27%.
Table 3.3 Effect of vacuum pressure on dewatering of mixture sample (0.5 in cake)
Reagent
Dosage
(lb/t)
Filtration Time (sec) Cake Thickness
(mm)
Vacuum
inHG
Moisture
(%) CFT DCT
Control (no
Chemical)
95 2
11-14 15 inHG
30.37
75 15 27.43
87 30 25.67
83 60 23.20
72 120 21.11
Baseline
(No
Reagent)
59 2
13~14 20
30.32
54 15 25.49
56 30 22.62
51 60 20.55
66 120 19.67
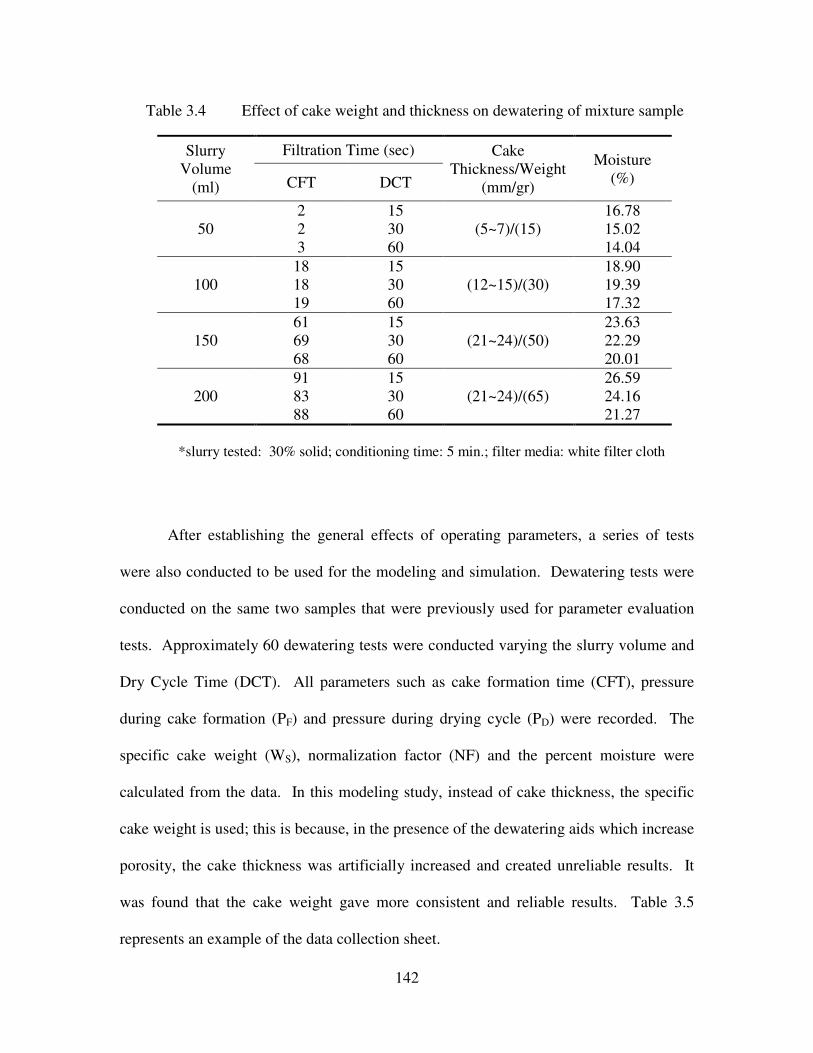
142
After establishing the general effects of operating parameters, a series of tests
were also conducted to be used for the modeling and simulation. Dewatering tests were
conducted on the same two samples that were previously used for parameter evaluation
tests. Approximately 60 dewatering tests were conducted varying the slurry volume and
Dry Cycle Time (DCT). All parameters such as cake formation time (CFT), pressure
during cake formation (PF) and pressure during drying cycle (PD) were recorded. The
specific cake weight (WS), normalization factor (NF) and the percent moisture were
calculated from the data. In this modeling study, instead of cake thickness, the specific
cake weight is used; this is because, in the presence of the dewatering aids which increase
porosity, the cake thickness was artificially increased and created unreliable results. It
was found that the cake weight gave more consistent and reliable results. Table 3.5
represents an example of the data collection sheet.
Table 3.4 Effect of cake weight and thickness on dewatering of mixture sample
Slurry
Volume
(ml)
Filtration Time (sec) Cake
Thickness/Weight
(mm/gr)
Moisture
(%) CFT DCT
50
2 15
(5~7)/(15)
16.78
2 30 15.02
3 60 14.04
100
18 15
(12~15)/(30)
18.90
18 30 19.39
19 60 17.32
150
61 15
(21~24)/(50)
23.63
69 30 22.29
68 60 20.01
200
91 15
(21~24)/(65)
26.59
83 30 24.16
88 60 21.27
*slurry tested: 30% solid; conditioning time: 5 min.; filter media: white filter cloth
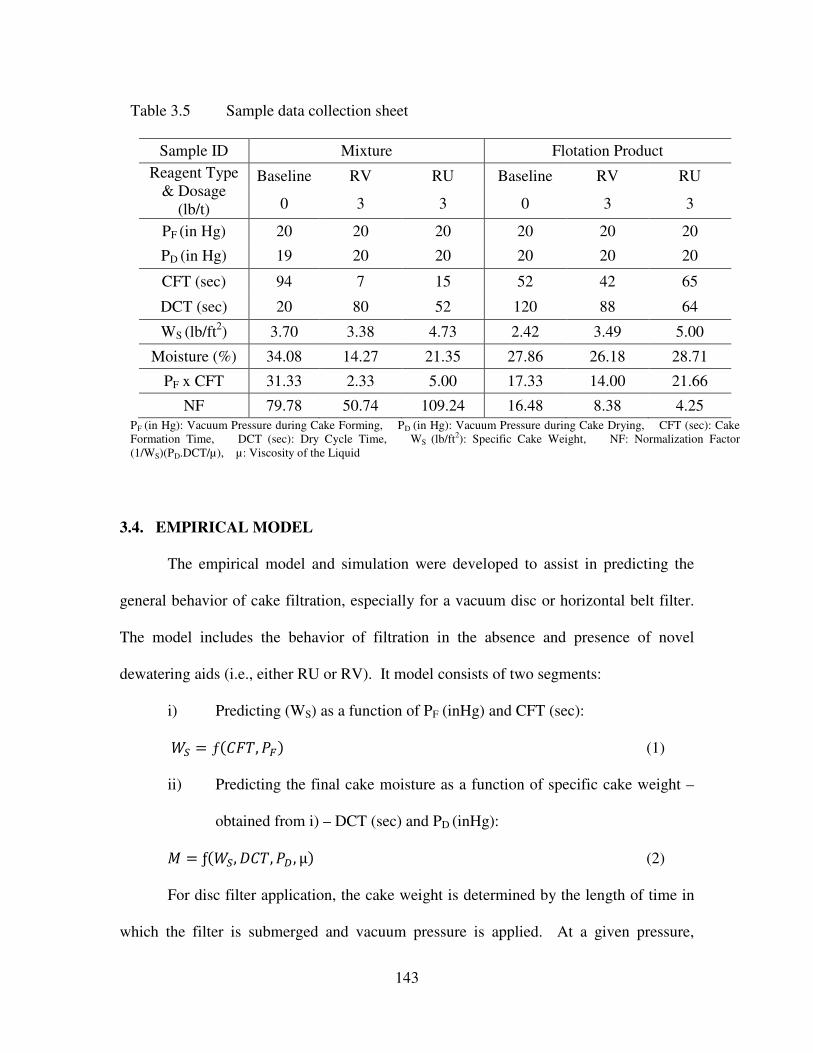
143
3.4. EMPIRICAL MODEL
The empirical model and simulation were developed to assist in predicting the
general behavior of cake filtration, especially for a vacuum disc or horizontal belt filter.
The model includes the behavior of filtration in the absence and presence of novel
dewatering aids (i.e., either RU or RV). It model consists of two segments:
i) Predicting (WS) as a function of PF (inHg) and CFT (sec):
�� = ƒ����, �� (1)
ii) Predicting the final cake moisture as a function of specific cake weight –
obtained from i) – DCT (sec) and PD (inHg):
= ƒ���, ���, � , μ� (2)
For disc filter application, the cake weight is determined by the length of time in
which the filter is submerged and vacuum pressure is applied. At a given pressure,
Table 3.5 Sample data collection sheet
Sample ID Mixture Flotation Product
Reagent Type
& Dosage
(lb/t)
Baseline RV RU Baseline RV RU
0 3 3 0 3 3
PF (in Hg) 20 20 20 20 20 20
PD (in Hg) 19 20 20 20 20 20
CFT (sec) 94 7 15 52 42 65
DCT (sec) 20 80 52 120 88 64
WS (lb/ft2) 3.70 3.38 4.73 2.42 3.49 5.00
Moisture (%) 34.08 14.27 21.35 27.86 26.18 28.71
PF x CFT 31.33 2.33 5.00 17.33 14.00 21.66
NF 79.78 50.74 109.24 16.48 8.38 4.25
PF (in Hg): Vacuum Pressure during Cake Forming, PD (in Hg): Vacuum Pressure during Cake Drying, CFT (sec): Cake
Formation Time, DCT (sec): Dry Cycle Time, WS (lb/ft2): Specific Cake Weight, NF: Normalization Factor
(1/WS)(PD.DCT/µ), µ: Viscosity of the Liquid
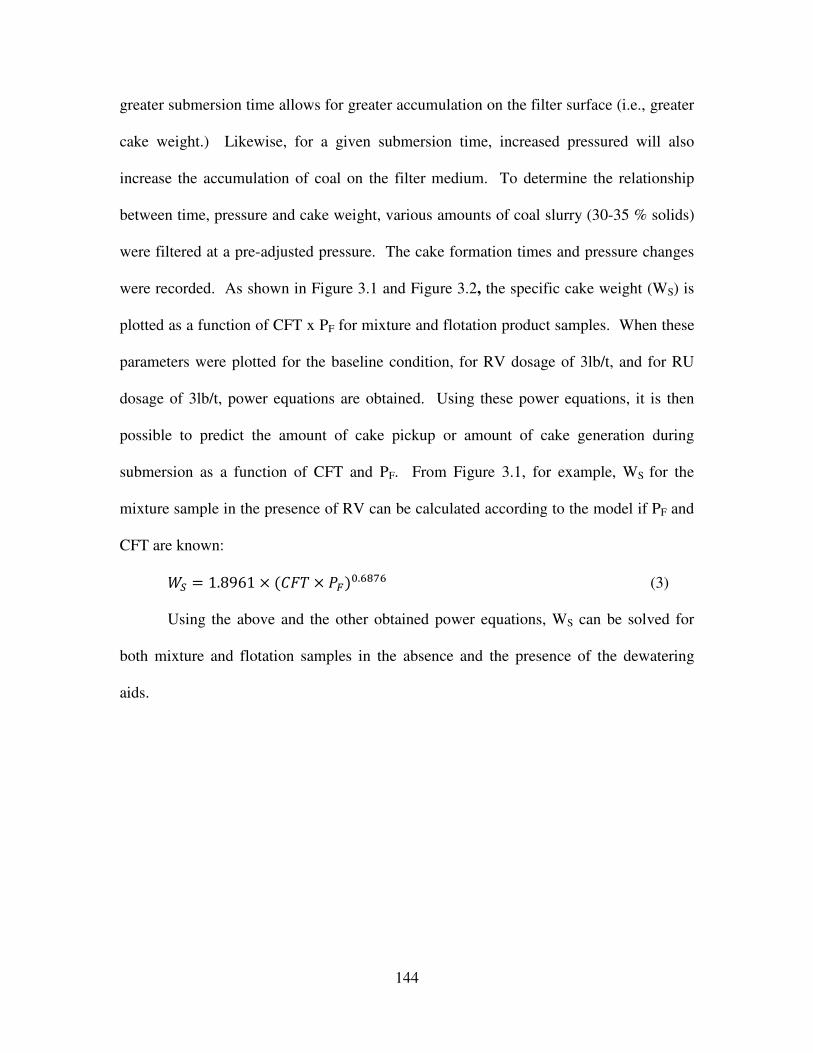
144
greater submersion time allows for greater accumulation on the filter surface (i.e., greater
cake weight.) Likewise, for a given submersion time, increased pressured will also
increase the accumulation of coal on the filter medium. To determine the relationship
between time, pressure and cake weight, various amounts of coal slurry (30-35 % solids)
were filtered at a pre-adjusted pressure. The cake formation times and pressure changes
were recorded. As shown in Figure 3.1 and Figure 3.2, the specific cake weight (WS) is
plotted as a function of CFT x PF for mixture and flotation product samples. When these
parameters were plotted for the baseline condition, for RV dosage of 3lb/t, and for RU
dosage of 3lb/t, power equations are obtained. Using these power equations, it is then
possible to predict the amount of cake pickup or amount of cake generation during
submersion as a function of CFT and PF. From Figure 3.1, for example, WS for the
mixture sample in the presence of RV can be calculated according to the model if PF and
CFT are known:
�� = 1.8961 × ���� × ���.���� (3)
Using the above and the other obtained power equations, WS can be solved for
both mixture and flotation samples in the absence and the presence of the dewatering
aids.
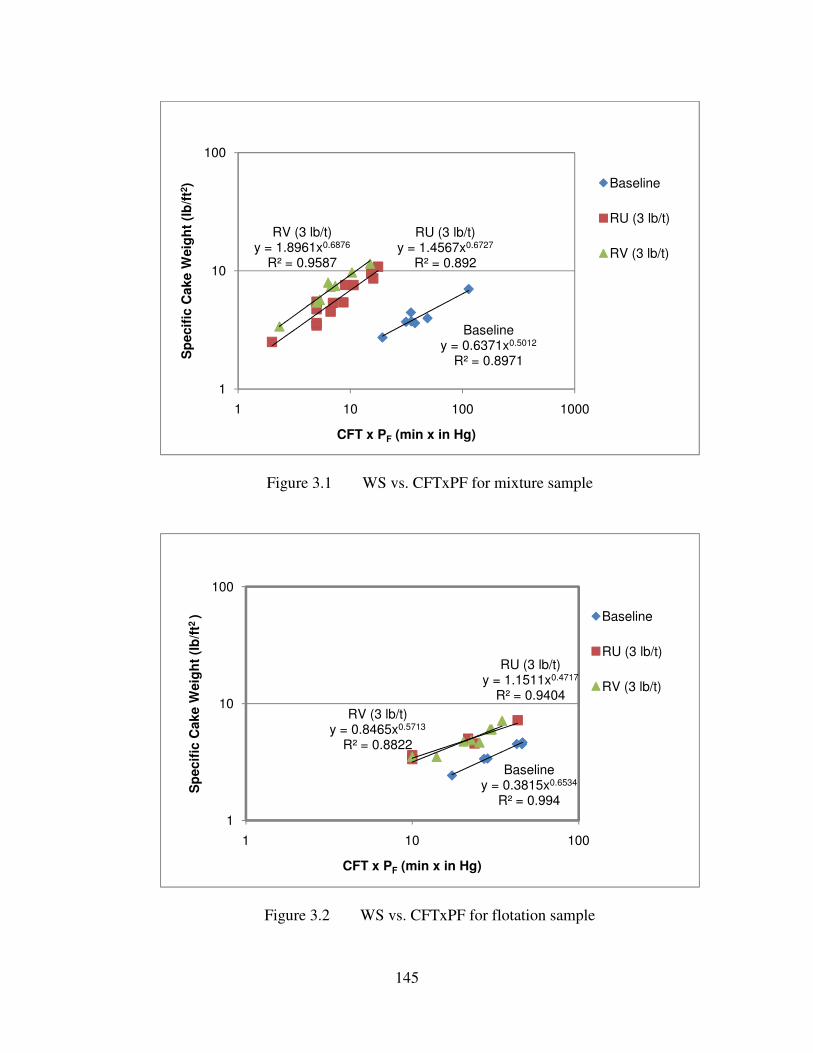
145
Figure 3.2 WS vs. CFTxPF for flotation sample
Baseliney = 0.3815x0.6534
R² = 0.994
RU (3 lb/t)y = 1.1511x0.4717
R² = 0.9404
RV (3 lb/t)y = 0.8465x0.5713
R² = 0.8822
1
10
100
1 10 100
Sp
ecif
ic C
ake W
eig
ht
(lb
/ft2
)
CFT x PF (min x in Hg)
Baseline
RU (3 lb/t)
RV (3 lb/t)
Figure 3.1 WS vs. CFTxPF for mixture sample
Baseliney = 0.6371x0.5012
R² = 0.8971
RU (3 lb/t) y = 1.4567x0.6727
R² = 0.892
RV (3 lb/t)y = 1.8961x0.6876
R² = 0.9587
1
10
100
1 10 100 1000
Sp
ecif
ic C
ake W
eig
ht
(lb
/ft2
)
CFT x PF (min x in Hg)
Baseline
RU (3 lb/t)
RV (3 lb/t)
146
In filtration, cake formation is followed by cake drying which results in a product
with a particular final moisture. Final cake moisture is controlled by the pressure during
the drying cycle time (PD) and the length of the drying cycle time (DCT), the weight of
the cake (WS) and the viscosity (µ) of the liquid. WS is obtained from the Figure 3.1 and
Figure 3.2. Empirically, a normalization factor is also determined as a function of PD,
DCT and µ:
�� = ���×� µ
(4)
Using the normalization factor and calculated specific cake weight, the best data
fit is obtained when the final cake moisture is plotted as a function of the normalization
factor and the specific cake weight:
∝ " #$%& "���×� ' & (5)
When the above relationship was plotted, the equations in Figure 3.4 and Figure
3.3 were obtained. The plots include both the mixture and the flotation product. The
equations then allow for calculation of the final cake moisture, which accounts for
parameters during cake formation and cake drying cycles, and the specific cake weight.
For instance, to predict the final cake moisture of the mixture sample in the presence of
RV (at 3lb/t dosage), the following model equation can be used:
= −4.779ln �-� + 25.898 (6)
Substituting X with (5), the equation becomes
= −4.779ln 1" #$%& "���×� ' &2 + 25.898 (7)
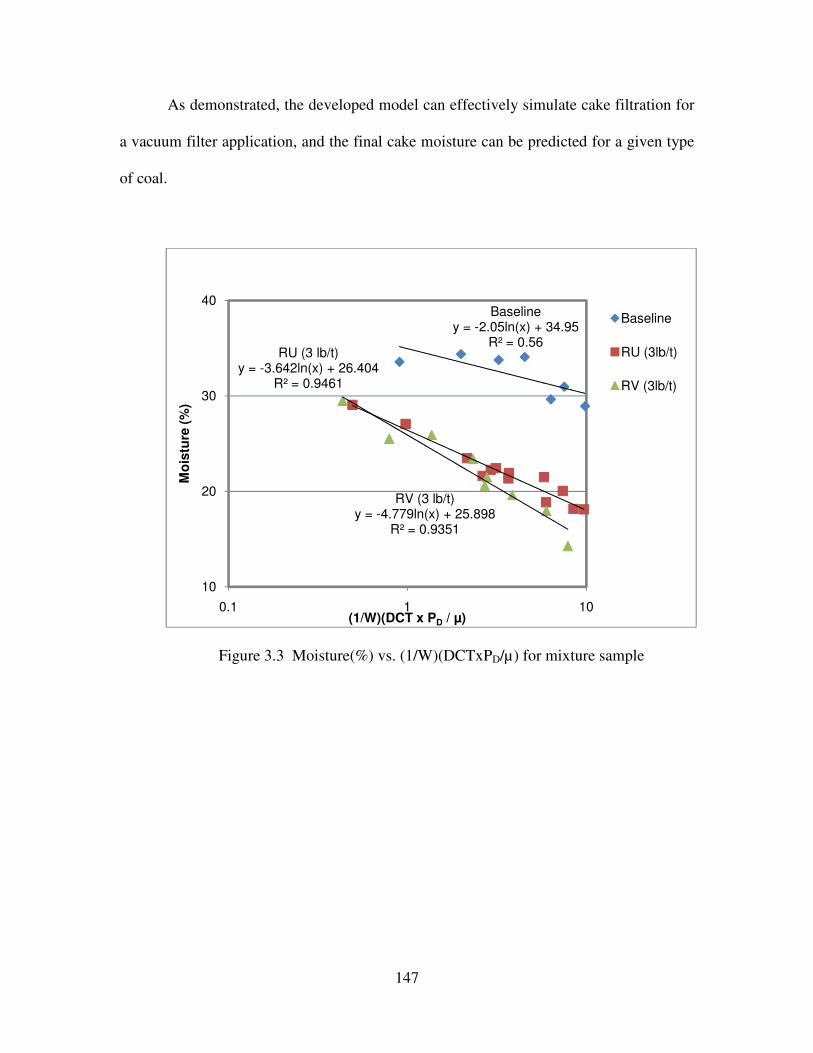
147
As demonstrated, the developed model can effectively simulate cake filtration for
a vacuum filter application, and the final cake moisture can be predicted for a given type
of coal.
Figure 3.3 Moisture(%) vs. (1/W)(DCTxPD/µ) for mixture sample
Baseliney = -2.05ln(x) + 34.95
R² = 0.56RU (3 lb/t)
y = -3.642ln(x) + 26.404R² = 0.9461
RV (3 lb/t)y = -4.779ln(x) + 25.898
R² = 0.9351
10
20
30
40
0.1 1 10
Mo
istu
re (
%)
(1/W)(DCT x PD / µ)
Baseline
RU (3lb/t)
RV (3lb/t)
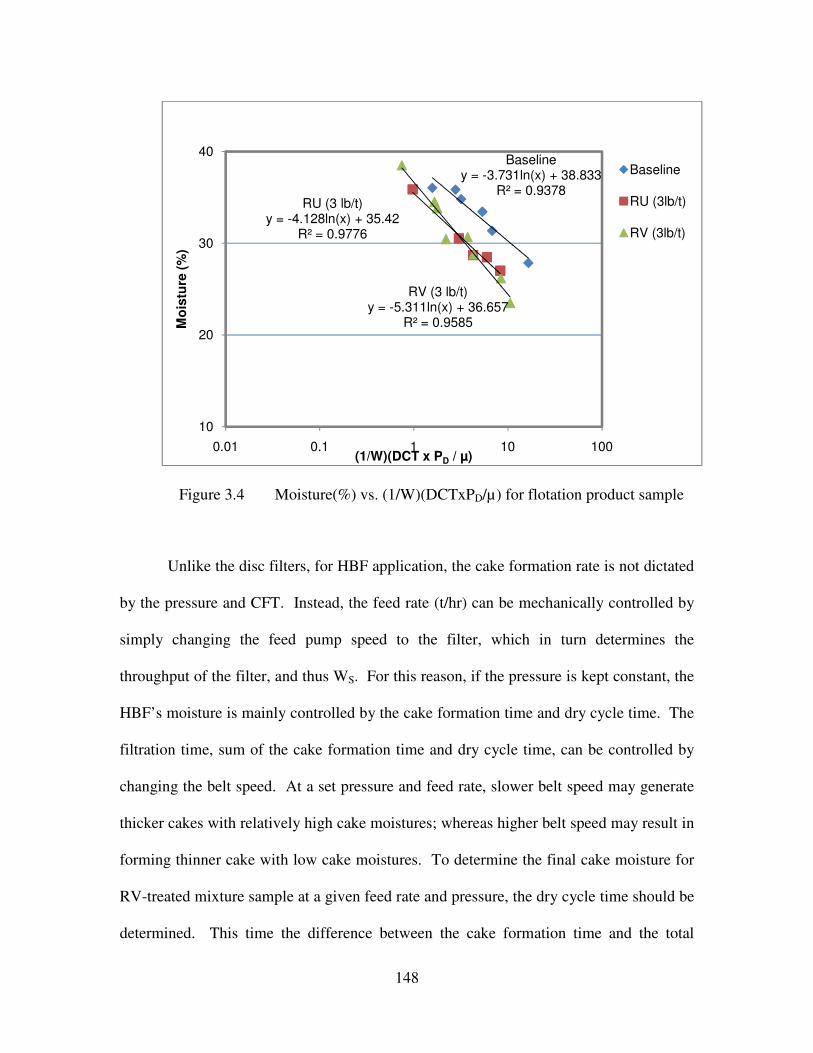
148
Unlike the disc filters, for HBF application, the cake formation rate is not dictated
by the pressure and CFT. Instead, the feed rate (t/hr) can be mechanically controlled by
simply changing the feed pump speed to the filter, which in turn determines the
throughput of the filter, and thus WS. For this reason, if the pressure is kept constant, the
HBF’s moisture is mainly controlled by the cake formation time and dry cycle time. The
filtration time, sum of the cake formation time and dry cycle time, can be controlled by
changing the belt speed. At a set pressure and feed rate, slower belt speed may generate
thicker cakes with relatively high cake moistures; whereas higher belt speed may result in
forming thinner cake with low cake moistures. To determine the final cake moisture for
RV-treated mixture sample at a given feed rate and pressure, the dry cycle time should be
determined. This time the difference between the cake formation time and the total
Figure 3.4 Moisture(%) vs. (1/W)(DCTxPD/µ) for flotation product sample
Baseliney = -3.731ln(x) + 38.833
R² = 0.9378RU (3 lb/t)
y = -4.128ln(x) + 35.42R² = 0.9776
RV (3 lb/t)y = -5.311ln(x) + 36.657
R² = 0.9585
10
20
30
40
0.01 0.1 1 10 100
Mo
istu
re (
%)
(1/W)(DCT x PD / µ)
Baseline
RU (3lb/t)
RV (3lb/t)
149
filtration time (TFT). The cake formation time can be predicted from the equations that
were obtained from Figure 1:
��� = " #�3& × " $%#.�4�#& 56.7897 (8)
and
��� = ��� + ��� (9)
Substituting (8) into (9) and rearranging:
��� = ��� − :" #�3& × " $%#.�4�#& 56.7897; (10)
So, once the dry cycle time is predicted from (10), the final cake moisture for a
horizontal belt filter can also be predicted using (7).
Table 3.6 and Table 3.7 show examples for specific cake weight, dry cycle time
and final cake moistures for mixture and flotation product samples. Both the disc and the
horizontal belt filters are modeled.
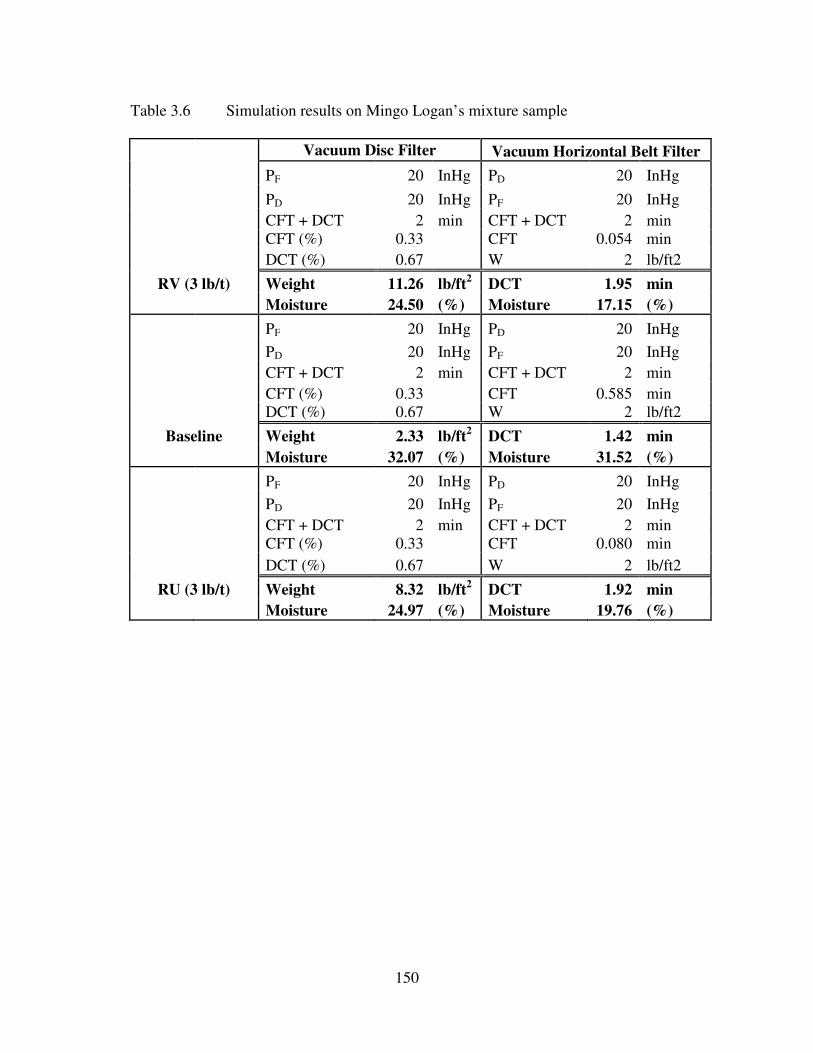
150
Table 3.6 Simulation results on Mingo Logan’s mixture sample
Vacuum Disc Filter Vacuum Horizontal Belt Filter
PF 20 InHg PD 20 InHg
PD 20 InHg PF 20 InHg
CFT + DCT 2 min CFT + DCT 2 min
CFT (%) 0.33 CFT 0.054 min
DCT (%) 0.67 W 2 lb/ft2
RV (3 lb/t) Weight 11.26 lb/ft2 DCT 1.95 min
Moisture 24.50 (%) Moisture 17.15 (%)
PF 20 InHg PD 20 InHg
PD 20 InHg PF 20 InHg
CFT + DCT 2 min CFT + DCT 2 min
CFT (%) 0.33 CFT 0.585 min
DCT (%) 0.67 W 2 lb/ft2
Baseline Weight 2.33 lb/ft2 DCT 1.42 min
Moisture 32.07 (%) Moisture 31.52 (%)
PF 20 InHg PD 20 InHg
PD 20 InHg PF 20 InHg
CFT + DCT 2 min CFT + DCT 2 min
CFT (%) 0.33 CFT 0.080 min
DCT (%) 0.67 W 2 lb/ft2
RU (3 lb/t) Weight 8.32 lb/ft2 DCT 1.92 min
Moisture 24.97 (%) Moisture 19.76 (%)
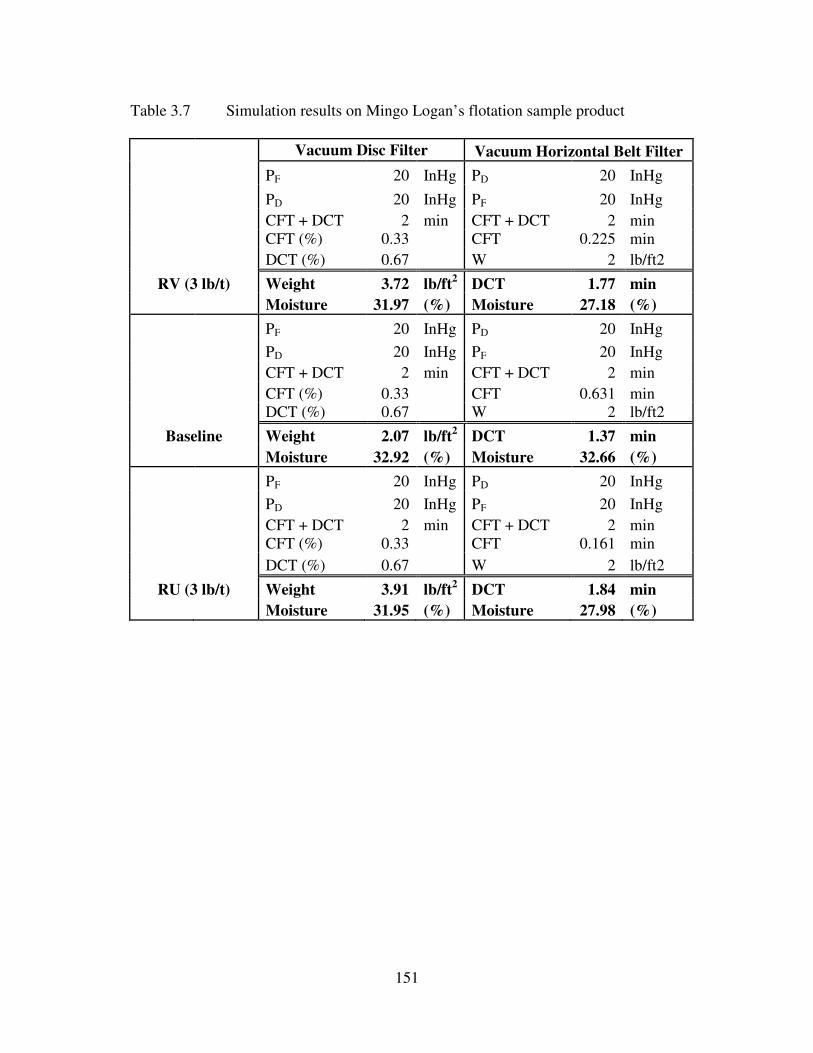
151
Table 3.7 Simulation results on Mingo Logan’s flotation sample product
Vacuum Disc Filter Vacuum Horizontal Belt Filter
PF 20 InHg PD 20 InHg
PD 20 InHg PF 20 InHg
CFT + DCT 2 min CFT + DCT 2 min
CFT (%) 0.33 CFT 0.225 min
DCT (%) 0.67 W 2 lb/ft2
RV (3 lb/t) Weight 3.72 lb/ft2 DCT 1.77 min
Moisture 31.97 (%) Moisture 27.18 (%)
PF 20 InHg PD 20 InHg
PD 20 InHg PF 20 InHg
CFT + DCT 2 min CFT + DCT 2 min
CFT (%) 0.33 CFT 0.631 min
DCT (%) 0.67 W 2 lb/ft2
Baseline Weight 2.07 lb/ft2 DCT 1.37 min
Moisture 32.92 (%) Moisture 32.66 (%)
PF 20 InHg PD 20 InHg
PD 20 InHg PF 20 InHg
CFT + DCT 2 min CFT + DCT 2 min
CFT (%) 0.33 CFT 0.161 min
DCT (%) 0.67 W 2 lb/ft2
RU (3 lb/t) Weight 3.91 lb/ft2 DCT 1.84 min
Moisture 31.95 (%) Moisture 27.98 (%)
152
3.5. SUMMARY AND CONCLUSIONS
The complexities associated with data and general performance analysis of coal
dewatering processes have typically required an abundance of tests to predict final
moistures under a given set of conditions. As such, an empirical model was developed
for vacuum filtration applications based on data obtained from two comprehensive tests.
The tests were conducted on two samples with different size distributions by varying
parameters such as dry cycle time, vacuum pressure during cake formation, and cake
drying time, formation time, cake weight and thickness. Additionally, different types and
dosages of dewatering aids were utilized. Based on the test data, models were established
and a scale-up simulation was created for vacuum disc filter and horizontal belt filter.
Simulation results indicated that dewatering aids are most effective when used in
horizontal belt filtration due to increased dewatering kinetics, which allow the filter to
employ a longer cake drying time. This also allows more flexibility in controlling the
cake moisture and throughput capacity when the horizontal belt filter is utilized. On the
contrary, when using disc filters, the total filtration time is almost equally shared (1:1
ratio) between cake formation and drying times. Thus, the disc filter is not as effective at
dewatering. It was also found that cake thickness may sometimes be deceiving because of
increased cake porosity caused by dewatering aid addition. A more reliable evaluation
can be made, however, by using specific cake weight instead of cake thickness in the
simulation.
153
3.6. REFERENCES
1. Smith, M.R., Solid-Liquid Separation Process and Technology: By L. Svarovsky.
Handbook of Powder Technology, vol. 5, 1985, 147 pp., Chemical Engineering
Science, 1987. 42(11): p. 2802-2803.
2. Holdich, R.G., Solid-Liquid Separation Equipment Selection and Modelling.
Minerals Engineering, 2003. 16(2): p. 75-83.
3. Akers, R.J., Solid-Liquid Separation : Edited by L. Svarovsky, 1978. 15(1): p.
77-79.
154
CHAPTER 4 INDUSTRIAL DEMONSTRATION OF DEWATERING
AIDS
4.1. INTRODUCTION
4.1.1. General Background
The United States possesses approximately 25.1 % of the world’s coal reserves with 400
coalfields and small deposits. Coal alone is the largest source of fuel for domestic energy
production, and 90% of that energy source is consumed in power plants. Almost 52% of the
domestic electric power generation is supplied by coal, which accounts for about 33% of the total
energy production. Coal is also used directly by the manufacturing industries that produce
chemicals, cement, paper, ceramics and various metal products. [1, 2]
Annually, more than 1.1 billion tons of coal is mined in the United States. About 600-650
million tons are processed yearly, and, typically, 350-400 million tons are handled in wet
processing. Most of the coal preparation plants only process fine coal from the size fraction
greater than 100 mesh (150 micrometer). For large size material, 16 X 100 mesh (1.0 X 150
micrometer), water-only cyclones and spirals are utilized. Depending on the quantity of the
material present, material smaller than 100 mesh in the total plant feed may either be treated or
discarded. If it is not treated, the fine material – material smaller than 100 mesh – is sent to a
thickener. Then, it is pumped to a slurry impoundment. If the fine material is to be treated,
classifying cyclones are utilized to remove the coal particles finer than 325 mesh (45
micrometer), and the 100 X 325 mesh size material is treated by utilizing flotation; however,
processing and associated costs are significantly increased when dealing with the finer material.
This fact has been a necessary limiting factor for coal processors, sometimes leaving no
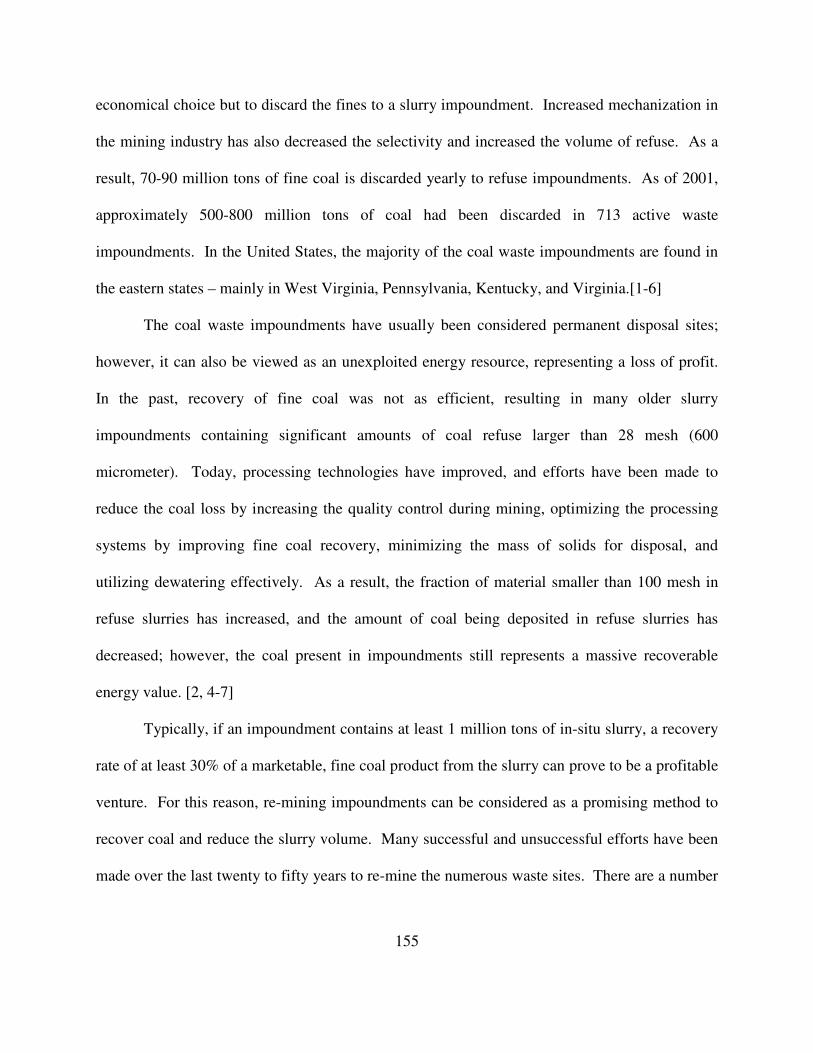
155
economical choice but to discard the fines to a slurry impoundment. Increased mechanization in
the mining industry has also decreased the selectivity and increased the volume of refuse. As a
result, 70-90 million tons of fine coal is discarded yearly to refuse impoundments. As of 2001,
approximately 500-800 million tons of coal had been discarded in 713 active waste
impoundments. In the United States, the majority of the coal waste impoundments are found in
the eastern states – mainly in West Virginia, Pennsylvania, Kentucky, and Virginia.[1-6]
The coal waste impoundments have usually been considered permanent disposal sites;
however, it can also be viewed as an unexploited energy resource, representing a loss of profit.
In the past, recovery of fine coal was not as efficient, resulting in many older slurry
impoundments containing significant amounts of coal refuse larger than 28 mesh (600
micrometer). Today, processing technologies have improved, and efforts have been made to
reduce the coal loss by increasing the quality control during mining, optimizing the processing
systems by improving fine coal recovery, minimizing the mass of solids for disposal, and
utilizing dewatering effectively. As a result, the fraction of material smaller than 100 mesh in
refuse slurries has increased, and the amount of coal being deposited in refuse slurries has
decreased; however, the coal present in impoundments still represents a massive recoverable
energy value. [2, 4-7]
Typically, if an impoundment contains at least 1 million tons of in-situ slurry, a recovery
rate of at least 30% of a marketable, fine coal product from the slurry can prove to be a profitable
venture. For this reason, re-mining impoundments can be considered as a promising method to
recover coal and reduce the slurry volume. Many successful and unsuccessful efforts have been
made over the last twenty to fifty years to re-mine the numerous waste sites. There are a number
156
of impoundments that are already being mined, and recently, increases in coal prices have started
to improve the overall economics of waste coal recovery.[4-6, 8]
4.1.2. Smith Branch Impoundment
The Smith Branch impoundment is located in Wyoming Country, West Virginia. At the
time of this project, Beard Technologies Inc. owned the permit to re-mine and recover coal from
this site. The impoundment currently serves the Pinnacle mining complex, which is now owned
by Cleveland Cliffs Mining. The waste coal impoundment is estimated to contain 2.85 million
Figure 4.1. Pinnacle waste coal impoundment cross-section from vibracore analysis
157
tons of potentially recoverable fine coal (see Figure 4.1). The impoundment is an active site and
continues to receive coal slurry refuse from the existing Pinnacle preparation plant as thickener
underflow. Approximately 200,000 tons of additional fine coal is discharged into the
impoundment annually by the existing Pinnacle preparation plant.
This site was ideally suited for a demonstration project since the dewatering aids made it
possible to convert the waste coal impoundment at this site from environmental liability into a
profitable resource.
4.1.3. Preliminary Analysis
Considering the amount of the fines that are going to be fed from the waste pond to the
preparation plant, the success of this project was strongly depended on an effective cleaning and
dewatering operation. Thus, Virginia Tech personnel conducted preliminary assessments on
equipment specification, preliminary circuit design and preliminary cost analysis. A conceptual
circuit design was also developed by personnel at Virginia Tech using standard process design
and cost estimation procedures (Figure 4.2).
The circuit was developed to recover the waste coal fines therefore it included an
advanced flotation processes together with the dewatering technologies developed. The
flowsheet was designed based on average feed rate (dry basis) of 103 tph for the pond reclaim
and was assumed to operate for two 8-hour shifts per day and 250 days per year with 90%
availability. The projections indicated that the POC circuit installed for pond reclamation would
produce clean coal around 68.7 tph and required two 8-disc filters to achieve the target capacity
of 34.0 tph. The raw plant feed will be screened at 6.3 mm and the oversize discarded. The
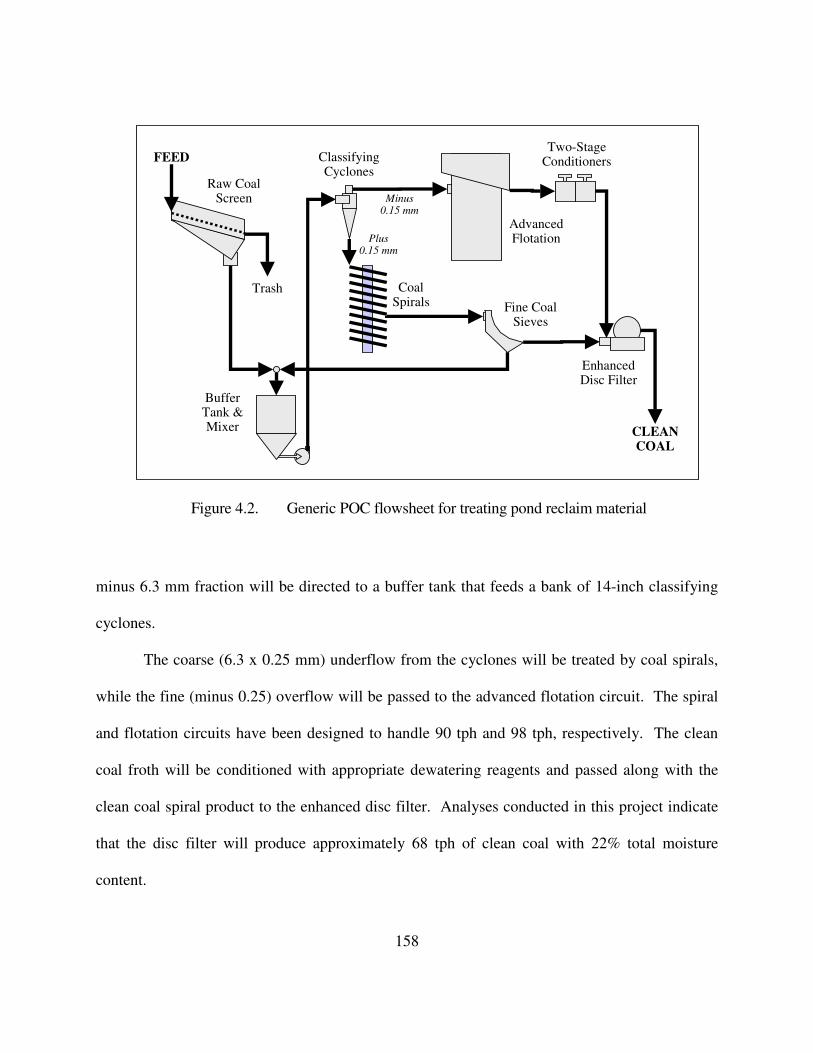
158
minus 6.3 mm fraction will be directed to a buffer tank that feeds a bank of 14-inch classifying
cyclones.
The coarse (6.3 x 0.25 mm) underflow from the cyclones will be treated by coal spirals,
while the fine (minus 0.25) overflow will be passed to the advanced flotation circuit. The spiral
and flotation circuits have been designed to handle 90 tph and 98 tph, respectively. The clean
coal froth will be conditioned with appropriate dewatering reagents and passed along with the
clean coal spiral product to the enhanced disc filter. Analyses conducted in this project indicate
that the disc filter will produce approximately 68 tph of clean coal with 22% total moisture
content.
AdvancedFlotation
EnhancedDisc Filter
CLEANCOAL
Two-StageConditioners
CoalSpirals
Trash
FEED
Fine CoalSieves
ClassifyingCyclones
Plus0.15 mm
Minus0.15 mm
BufferTank &Mixer
Raw CoalScreen
Figure 4.2. Generic POC flowsheet for treating pond reclaim material

159
The results of the cost-benefit analyses (done by Virginia Tech personnel) for the POC
circuit showed that a payback time of slightly more than 6 years were estimated
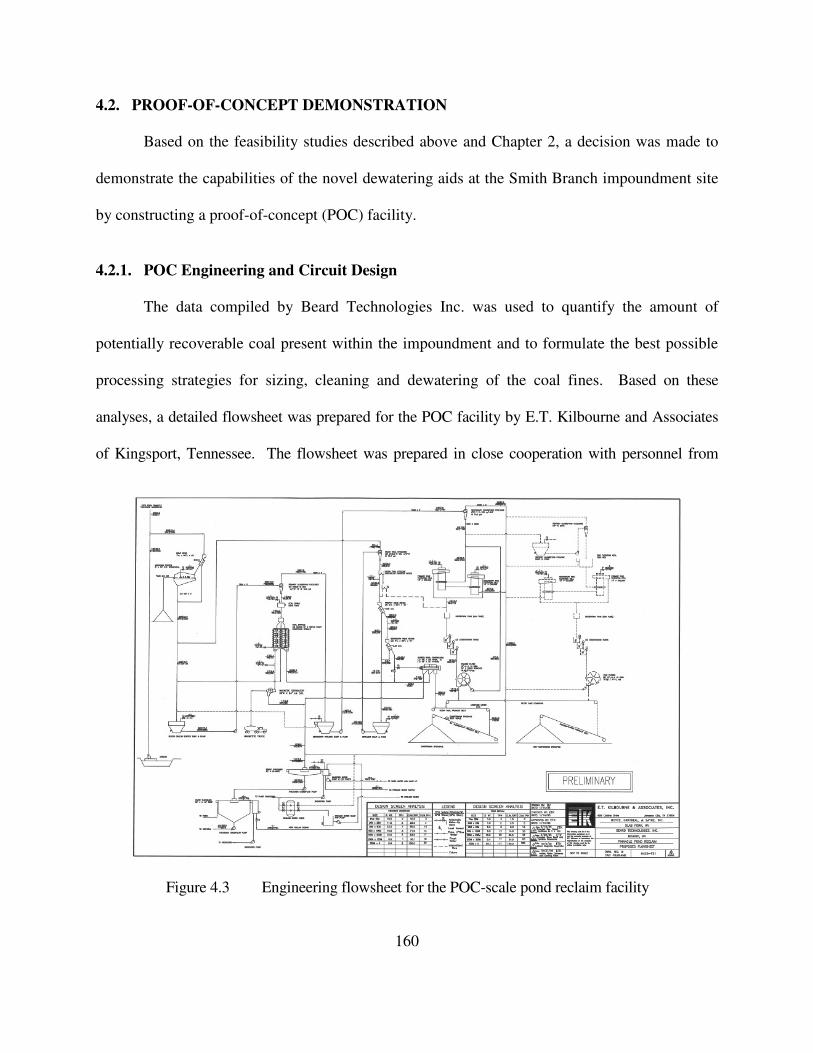
160
4.2. PROOF-OF-CONCEPT DEMONSTRATION
Based on the feasibility studies described above and Chapter 2, a decision was made to
demonstrate the capabilities of the novel dewatering aids at the Smith Branch impoundment site
by constructing a proof-of-concept (POC) facility.
4.2.1. POC Engineering and Circuit Design
The data compiled by Beard Technologies Inc. was used to quantify the amount of
potentially recoverable coal present within the impoundment and to formulate the best possible
processing strategies for sizing, cleaning and dewatering of the coal fines. Based on these
analyses, a detailed flowsheet was prepared for the POC facility by E.T. Kilbourne and Associates
of Kingsport, Tennessee. The flowsheet was prepared in close cooperation with personnel from
Figure 4.3 Engineering flowsheet for the POC-scale pond reclaim facility
161
Beard Technologies and Virginia Tech. The detailed flowsheet included mass and flow balances,
equipment specifications, and size distributions for the various process streams. A proof copy of the
POC flowsheet is provided in Figure 4.3 as an AutoCAD drawing.
Once the flowsheet was completed, detailed listings of required unit operations, such as
equipment type, unit size, throughput capacity, reagent/chemical requirements, power
requirements, air/water requirements, operating limitations, vendor cut-sheets, were produced by
technical personnel at Beard Technologies. Detailed plant layout diagrams were prepared by
Boyce, Graybeal and Sayre (BGS), Inc. of Slab Fork, West Virginia. The layout diagrams
specified the physical arrangement of all primary operations, ancillary processing units,
connecting streams, location of electrical wiring, arrangement of piping and plumbing, and other
pertinent electrical/mechanical requirements. The engineering drawings and specifications were
of sufficient detail to permit mechanical/electrical subcontractors to fabricate, construct, and
assemble the proposed POC circuitry.
4.2.2. POC Fabrication and Installation
Bid packages were prepared for soliciting bids for major purchases of equipment,
materials, fabricated components, and services necessary to complete the installation of the POC
circuitry. Upon receipt, the bid packages were reviewed, and appropriate vendors were selected
based on cost, availability, and suitability. This work included (i) fabrication of all required
components associated with the various POC circuits, (ii) shipping of POC modules, ancillary
equipment and construction materials to the POC site, (iii) inspection of all purchased POC
modules, ancillary equipment and materials to ensure that they are of suitable workmanship and are
162
structurally, mechanically and/or electrically operational, and (iv) preparation of operation,
maintenance, and safety manuals for each unit operation.
After developing the flowsheet, the installation of all unit operations, piping, electrical
wiring, and instrumentation were undertaken. The on-site construction work was contracted and
managed by Boyce, Graybeal and Sayre (BGS), Inc. of Slab Fork, West Virginia. The fabrication
and on-site construction activities required approximately one year to complete. The plant
incorporates some of the most advanced technologies available to the coal preparation industry
as POC circuits. The most significant of these included a two-stage advanced column flotation
circuit for fine coal separation, a three-stage bank of agitated mixing tanks to condition the
dewatering aids and a paste thickener to convert the fine high-ash wastes into a high-solids
product for disposal with minimal environmental impact.
A simplified process flow diagram of the as-built plant incorporating the POC dewatering
circuitry is provided in Figure 4.4. A photograph of the nearly completed plant is shown in
Figure 4.5. The plant was designed with a raw feed nameplate capacity of approximately 200
tph of dry solids. The plant sizes/classifies the feed from the dredge into four nominal size
fractions, plus28 mesh, 28 x 100 mesh, 100 x 325 mesh, and minus 325 mesh. The initial
separation occurs on a sieve bend and single deck vibrating screen. The plus28 mesh material
(screen oversize) is discharged to a stockpile outside the plant, and the minus 28 mesh reports to a
30,000 gallon surge tank. Material from the surge tank is pumped into 20 inch diameter classifying
cyclones, which nominally sizes the feed at about 100 mesh.
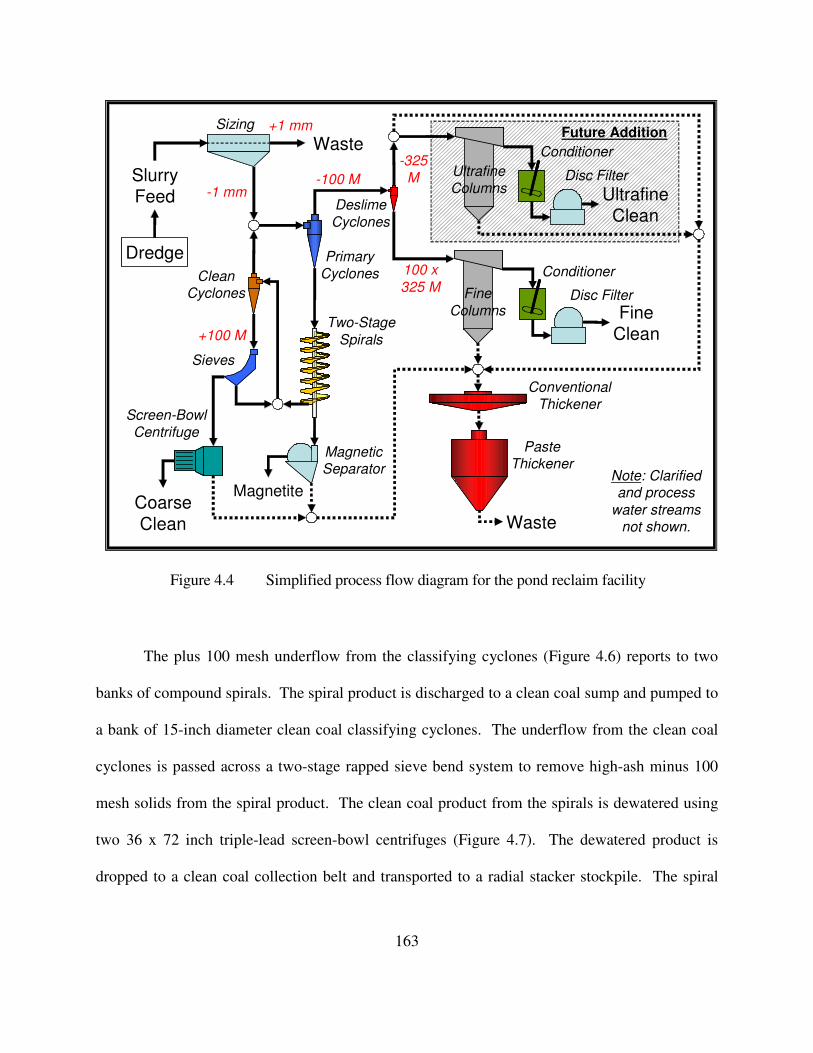
163
The plus 100 mesh underflow from the classifying cyclones (Figure 4.6) reports to two
banks of compound spirals. The spiral product is discharged to a clean coal sump and pumped to
a bank of 15-inch diameter clean coal classifying cyclones. The underflow from the clean coal
cyclones is passed across a two-stage rapped sieve bend system to remove high-ash minus 100
mesh solids from the spiral product. The clean coal product from the spirals is dewatered using
two 36 x 72 inch triple-lead screen-bowl centrifuges (Figure 4.7). The dewatered product is
dropped to a clean coal collection belt and transported to a radial stacker stockpile. The spiral
Deslime
Cyclones
Magnetite
CleanCyclones
+1 mm
SlurryFeed
Sizing
Waste
-100 M
Coarse
Clean
Primary
Cyclones
Fine
Columns FineClean
Two-Stage
Spirals
-325
M
+100 M
100 x
325 M
Waste
Screen-Bowl
Centrifuge
Ultrafine
Columns
Conditioner
Disc Filter
UltrafineClean
MagneticSeparator
Sieves
Disc Filter
Conditioner
Conventional
Thickener
PasteThickener
-1 mm
Future Addition
Note: Clarified and process
water streams not shown.
Dredge
Figure 4.4 Simplified process flow diagram for the pond reclaim facility
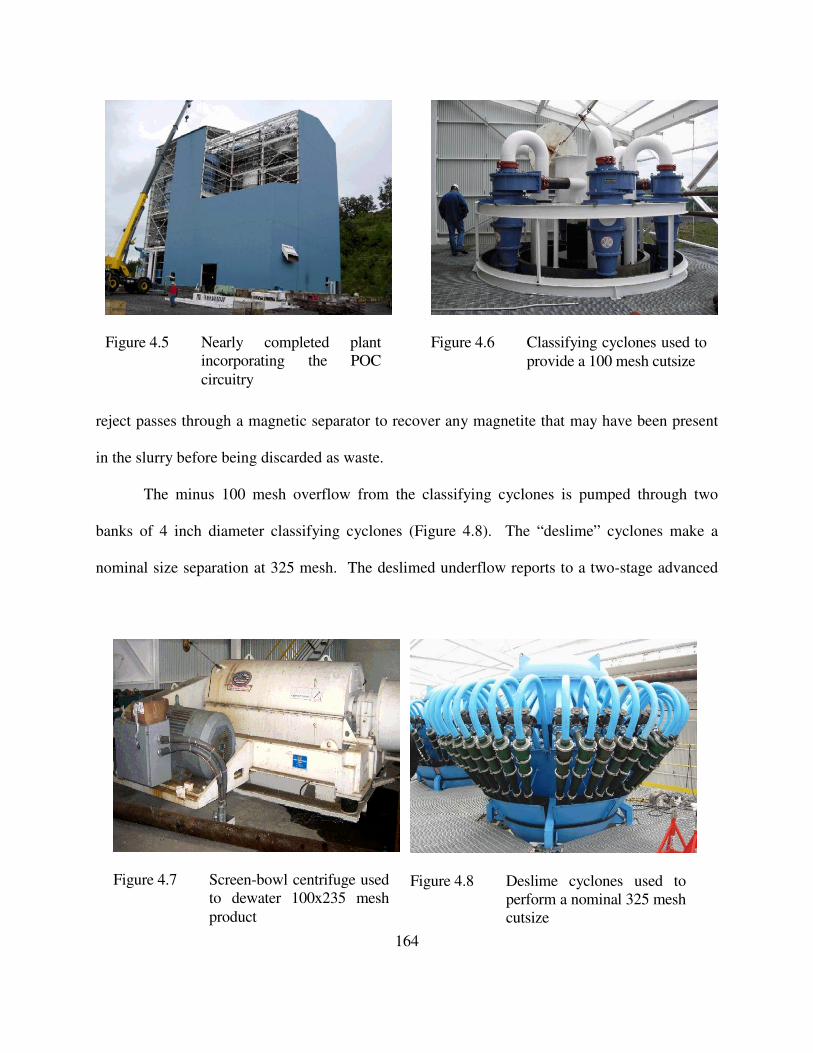
164
reject passes through a magnetic separator to recover any magnetite that may have been present
in the slurry before being discarded as waste.
The minus 100 mesh overflow from the classifying cyclones is pumped through two
banks of 4 inch diameter classifying cyclones (Figure 4.8). The “deslime” cyclones make a
nominal size separation at 325 mesh. The deslimed underflow reports to a two-stage advanced
Figure 4.5 Nearly completed plant
incorporating the POC
circuitry
Figure 4.6 Classifying cyclones used to
provide a 100 mesh cutsize
Figure 4.7 Screen-bowl centrifuge used
to dewater 100x235 mesh
product
Figure 4.8 Deslime cyclones used to
perform a nominal 325 mesh
cutsize
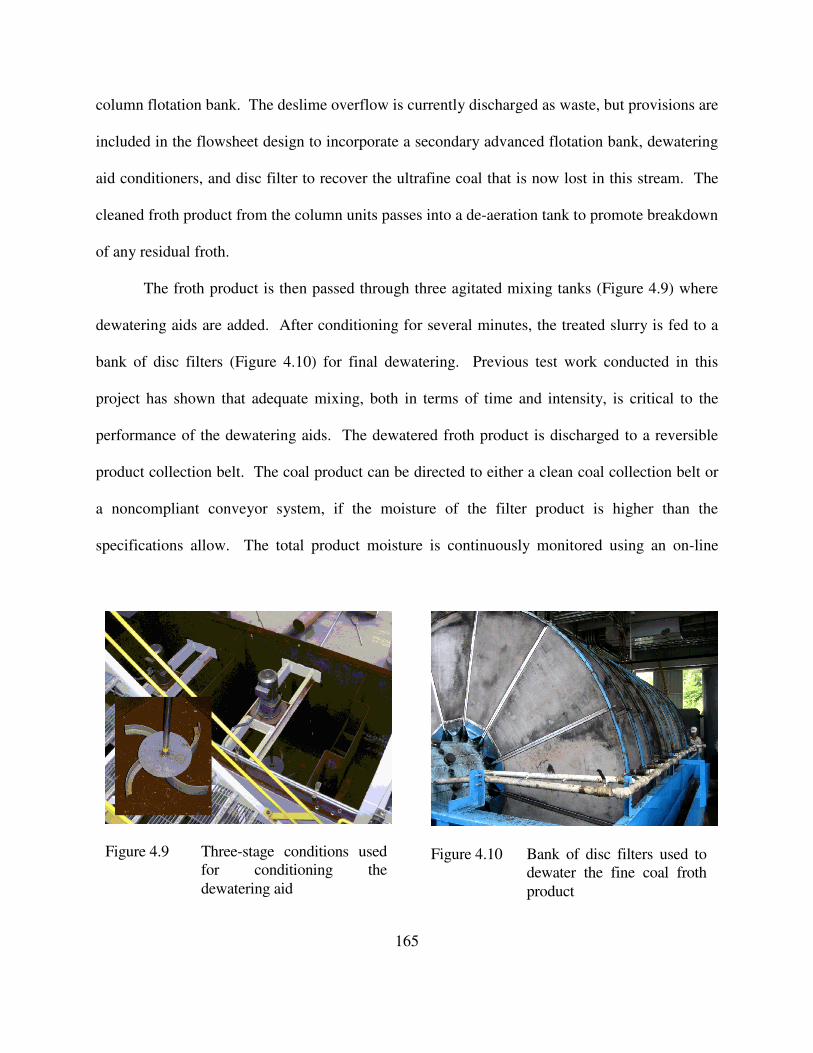
165
column flotation bank. The deslime overflow is currently discharged as waste, but provisions are
included in the flowsheet design to incorporate a secondary advanced flotation bank, dewatering
aid conditioners, and disc filter to recover the ultrafine coal that is now lost in this stream. The
cleaned froth product from the column units passes into a de-aeration tank to promote breakdown
of any residual froth.
The froth product is then passed through three agitated mixing tanks (Figure 4.9) where
dewatering aids are added. After conditioning for several minutes, the treated slurry is fed to a
bank of disc filters (Figure 4.10) for final dewatering. Previous test work conducted in this
project has shown that adequate mixing, both in terms of time and intensity, is critical to the
performance of the dewatering aids. The dewatered froth product is discharged to a reversible
product collection belt. The coal product can be directed to either a clean coal collection belt or
a noncompliant conveyor system, if the moisture of the filter product is higher than the
specifications allow. The total product moisture is continuously monitored using an on-line
Figure 4.9 Three-stage conditions used
for conditioning the
dewatering aid
Figure 4.10 Bank of disc filters used to
dewater the fine coal froth
product
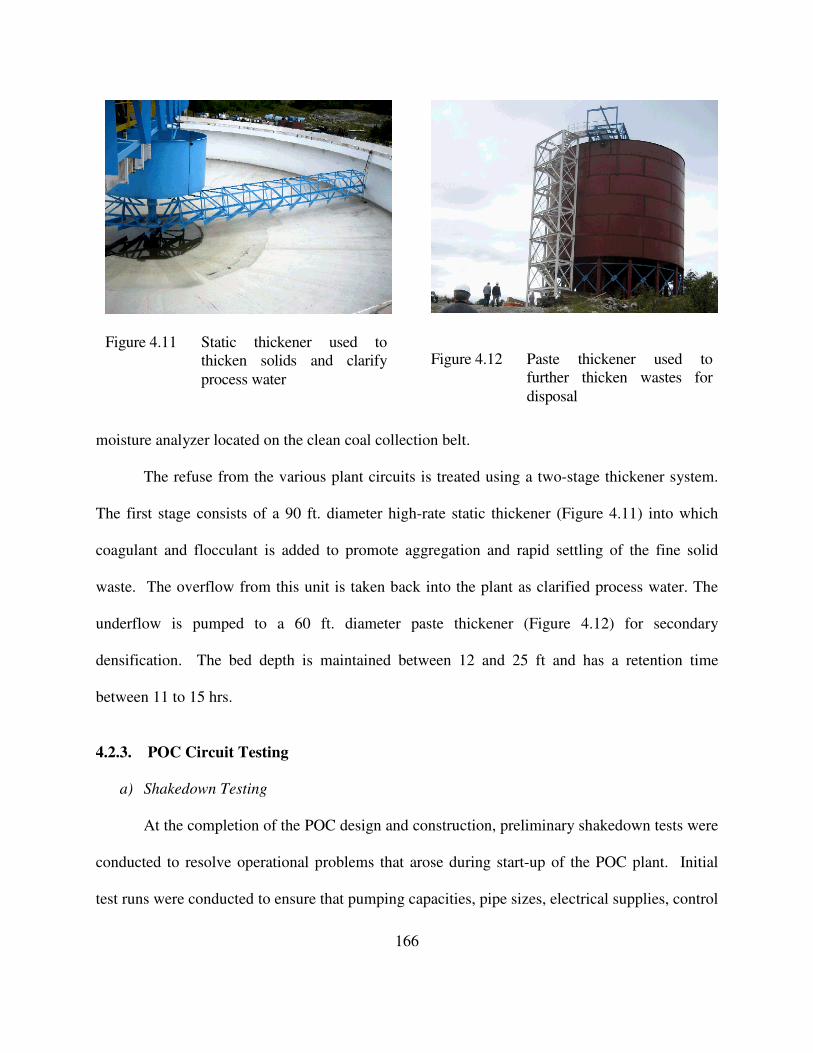
166
Figure 4.11 Static thickener used to
thicken solids and clarify
process water
moisture analyzer located on the clean coal collection belt.
The refuse from the various plant circuits is treated using a two-stage thickener system.
The first stage consists of a 90 ft. diameter high-rate static thickener (Figure 4.11) into which
coagulant and flocculant is added to promote aggregation and rapid settling of the fine solid
waste. The overflow from this unit is taken back into the plant as clarified process water. The
underflow is pumped to a 60 ft. diameter paste thickener (Figure 4.12) for secondary
densification. The bed depth is maintained between 12 and 25 ft and has a retention time
between 11 to 15 hrs.
4.2.3. POC Circuit Testing
a) Shakedown Testing
At the completion of the POC design and construction, preliminary shakedown tests were
conducted to resolve operational problems that arose during start-up of the POC plant. Initial
test runs were conducted to ensure that pumping capacities, pipe sizes, electrical supplies, control
Figure 4.12 Paste thickener used to
further thicken wastes for
disposal
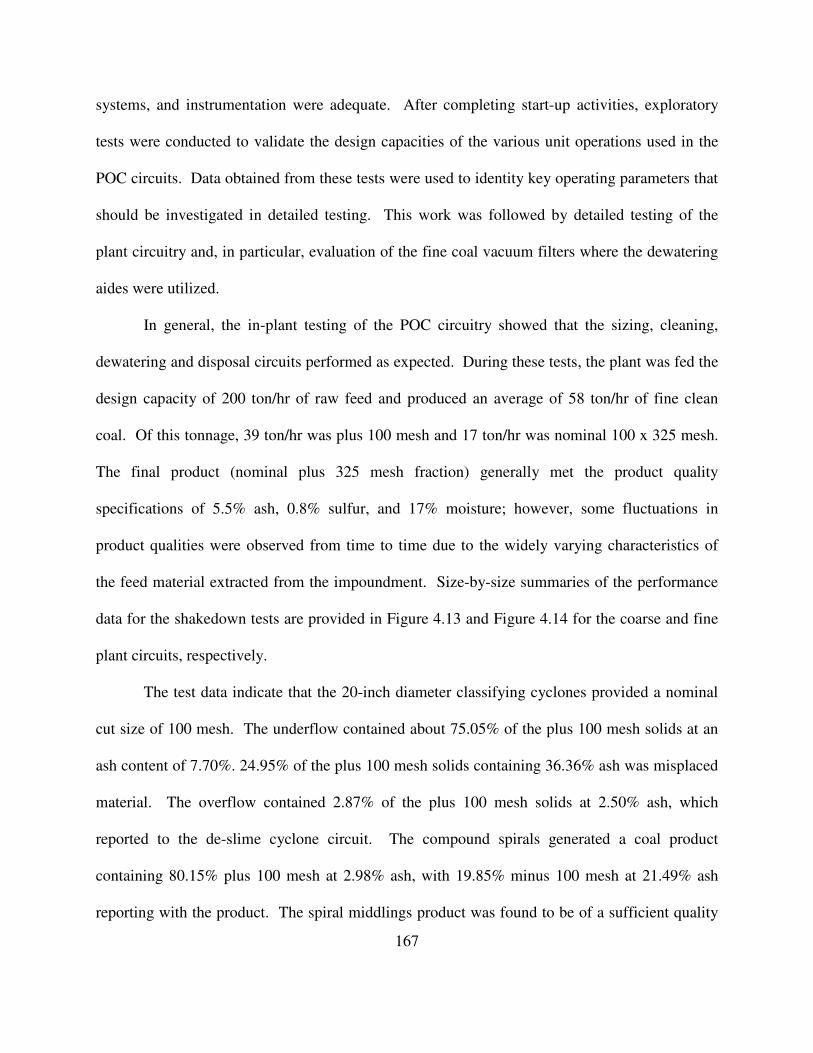
167
systems, and instrumentation were adequate. After completing start-up activities, exploratory
tests were conducted to validate the design capacities of the various unit operations used in the
POC circuits. Data obtained from these tests were used to identity key operating parameters that
should be investigated in detailed testing. This work was followed by detailed testing of the
plant circuitry and, in particular, evaluation of the fine coal vacuum filters where the dewatering
aides were utilized.
In general, the in-plant testing of the POC circuitry showed that the sizing, cleaning,
dewatering and disposal circuits performed as expected. During these tests, the plant was fed the
design capacity of 200 ton/hr of raw feed and produced an average of 58 ton/hr of fine clean
coal. Of this tonnage, 39 ton/hr was plus 100 mesh and 17 ton/hr was nominal 100 x 325 mesh.
The final product (nominal plus 325 mesh fraction) generally met the product quality
specifications of 5.5% ash, 0.8% sulfur, and 17% moisture; however, some fluctuations in
product qualities were observed from time to time due to the widely varying characteristics of
the feed material extracted from the impoundment. Size-by-size summaries of the performance
data for the shakedown tests are provided in Figure 4.13 and Figure 4.14 for the coarse and fine
plant circuits, respectively.
The test data indicate that the 20-inch diameter classifying cyclones provided a nominal
cut size of 100 mesh. The underflow contained about 75.05% of the plus 100 mesh solids at an
ash content of 7.70%. 24.95% of the plus 100 mesh solids containing 36.36% ash was misplaced
material. The overflow contained 2.87% of the plus 100 mesh solids at 2.50% ash, which
reported to the de-slime cyclone circuit. The compound spirals generated a coal product
containing 80.15% plus 100 mesh at 2.98% ash, with 19.85% minus 100 mesh at 21.49% ash
reporting with the product. The spiral middlings product was found to be of a sufficient quality
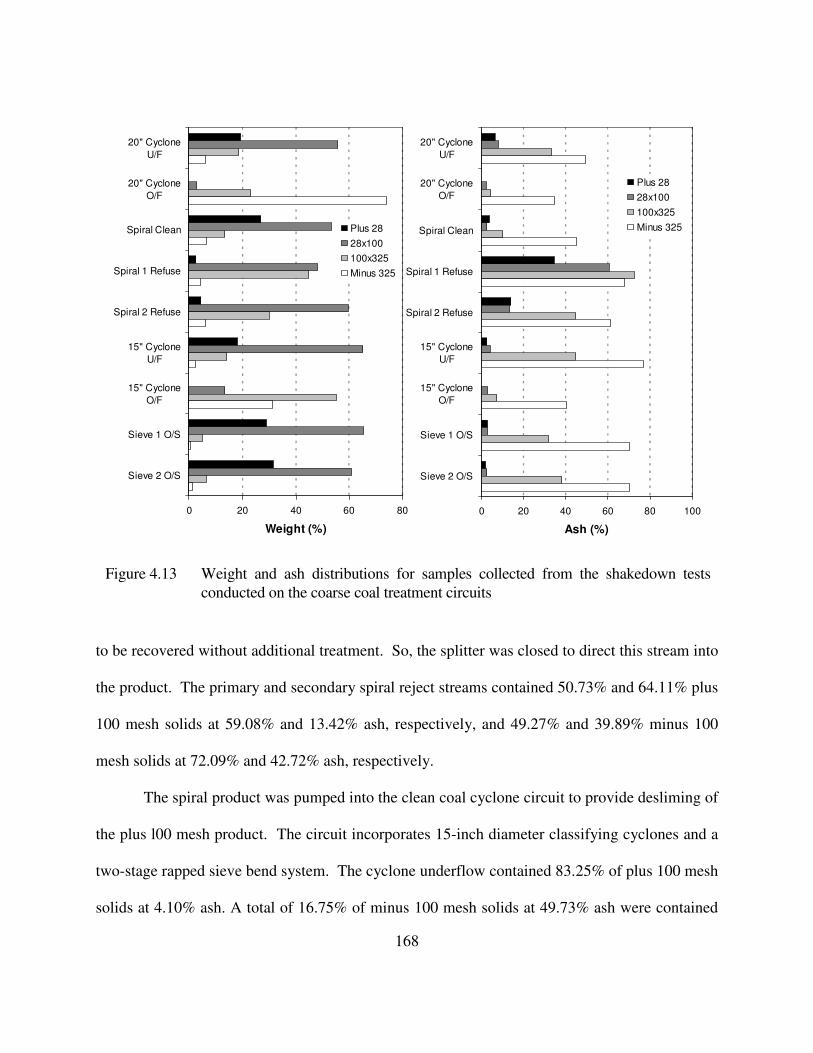
168
to be recovered without additional treatment. So, the splitter was closed to direct this stream into
the product. The primary and secondary spiral reject streams contained 50.73% and 64.11% plus
100 mesh solids at 59.08% and 13.42% ash, respectively, and 49.27% and 39.89% minus 100
mesh solids at 72.09% and 42.72% ash, respectively.
The spiral product was pumped into the clean coal cyclone circuit to provide desliming of
the plus l00 mesh product. The circuit incorporates 15-inch diameter classifying cyclones and a
two-stage rapped sieve bend system. The cyclone underflow contained 83.25% of plus 100 mesh
solids at 4.10% ash. A total of 16.75% of minus 100 mesh solids at 49.73% ash were contained
0 20 40 60 80
20" Cyclone
U/F
20" Cyclone
O/F
Spiral Clean
Spiral 1 Refuse
Spiral 2 Refuse
15" Cyclone
U/F
15" Cyclone
O/F
Sieve 1 O/S
Sieve 2 O/S
Weight (%)
Plus 28
28x100
100x325
Minus 325
0 20 40 60 80 100
20" Cyclone
U/F
20" Cyclone
O/F
Spiral Clean
Spiral 1 Refuse
Spiral 2 Refuse
15" Cyclone
U/F
15" Cyclone
O/F
Sieve 1 O/S
Sieve 2 O/S
Ash (%)
Plus 28
28x100
100x325
Minus 325
Figure 4.13 Weight and ash distributions for samples collected from the shakedown tests
conducted on the coarse coal treatment circuits
169
in this stream. The overflow, which reports to the de-slime cyclone circuit, contained 13.51% of
plus 100 mesh at a 2.84% ash. The two-stage rapped sieve was used to remove minus 100 mesh
contamination and associated ash from the coarse circuit product. The higher quality of the
oversize product produced by the primary and secondary rapped sieve bends reduced the amount
of minus 100 mesh in the product from 16.75% to 7.46% with a corresponding ash reduction
from 11.74% to 5.47%. The undersize solids from the rapped sieve bend circuit were circulated
back to the clean coal sump.
The product from the cyclone/spiral circuit was dewatered through two 36 x 72 inch
screen bowl centrifuges. The coal product from the screen-bowl was 5.18% ash, which
0 20 40 60 80 100
4" Cyclone U/F
4" Cyclone O/F
Rougher Froth
Rougher Tails
Cleaner Froth
Screen-Bowl
Cake
Disc Filter
Cake
Combined
Clean
Thickener U/F
Weight (%)
Plus 28
28x100
100x325
Minus 325
0 20 40 60 80
4" Cyclone U/F
4" Cyclone O/F
Rougher Froth
Rougher Tails
Cleaner Froth
Screen-Bowl
Cake
Disc Filter
Cake
Combined
Clean
Thickener U/F
Ash (%)
Plus 28
28x100
100x325
Minus 325
Figure 4.14 Weight and ash distributions for samples collected from the shakedown tests
conducted on the fine coal treatment circuits
170
contained 78.29% plus 100 mesh at 4.17% ash and 21.71% minus 100 mesh at 8.82% ash.
The shakedown test data showed that the 4-inch diameter classifying cyclones provided a
nominal cut size of 325 mesh. The deslimed underflow contained 73.06% plus 325 mesh (6.52%
ash) and 26.94% minus 325 mesh (47.12% ash). The deslime overflow, which was discarded to
the static thickener as waste, contained 12.05% plus 325 mesh (4.77% ash). The loss of low-ash
material in this stream was expected because the ultrafine cleaning circuit had not yet been added
to the plant circuitry. The clean froth product from the entire column flotation circuit was found
to contain 6.66% ash. This product contained 78.34% plus 325 mesh at 2.84% ash and 21.66%
minus 325 mesh at 20.45% ash. The rougher column reject (i.e., feed to the cleaner column) was
found to contain 39.12% ash. Of the rougher column reject, 51.72% was plus 325 mesh (11.17%
ash) and 48.28% was minus 325 mesh (69.05% ash). The ash content of the cleaner column
froth was 26.69%, and of that percentage, 60.81% at a 5.72% ash is plus 325 mesh and 39.19%
at 59.22% ash is minus 325 mesh. The high ash content of the minus 325 mesh fraction can be
attributed to problems associated with the entrainment of fine clay in the column froth. As such,
the froth quality is expected to improve after modifications are made to the wash water system.
So, more minus 325 mesh clay is eliminated from the froth products.
As indicated previously, the product from the deslime cyclone/column flotation circuit is
dewatered by using a twelve-disc 12.5 ft diameter vacuum disc filter. In the shakedown tests,
the filter product was found to contain 8.76% ash (74.88% plus 325 mesh at 3.21% ash and
25.12% minus 325 mesh at 25.30% ash). The higher ash in the minus 325 mesh size fraction
was found to have a major impact on both the final ash quality of the filter product and on the
overall product moisture. On average, the moisture of the filter cake was found to be
171
approximately 26% in the absence of dewatering aids. The addition of dewatering aids reduced
the filter moisture to below 18%.
The 90 ft diameter, high-rate thickener required modifications to allow optimum
operation during the shakedown tests. The required modifications were to raise the flume above
the liquid level in the thickener unit to avoid surface froth entering into the clarified water tank,
flatten the slope and increase the width of the flume for capacity to slow the velocity and
minimize the agitation of the slurry material, and divert the slurry flow down into the center well
at the end of the flume to reduce short-circuiting of slurry out of the center well into the main
body of the thickener. The underflow from the static thickener provided the feed for the paste
thickener. The paste thickener, which is still being subjected to shakedown testing, appears to be
capable of handling the varying feed rates, size distributions, and qualities of waste slurry from the
processing plant.
b) Detailed Testing
After completing the shakedown tests, several series of detailed tests were performed for the
POC dewatering circuit. For comparison, a set of laboratory dewatering tests were conducted
during the detailed testing. Both the laboratory and POC-scale tests were completed using RV.
The laboratory filtration tests were conducted using a 2.5- inch diameter Buchner funnel. After
establishing the optimum operating conditions and reagent blends using the laboratory filter, the
dewatering aid was added to the feed of the three-stage conditioners that were located just ahead
of the vacuum disc filter. As indicated previously, adequate mixing is critical because previous
studies showed that the moisture reduction improves with increasing energy input during
conditioning. For this reason, the full three-stages of conditioners were used in all of the POC-
scale dewatering tests.
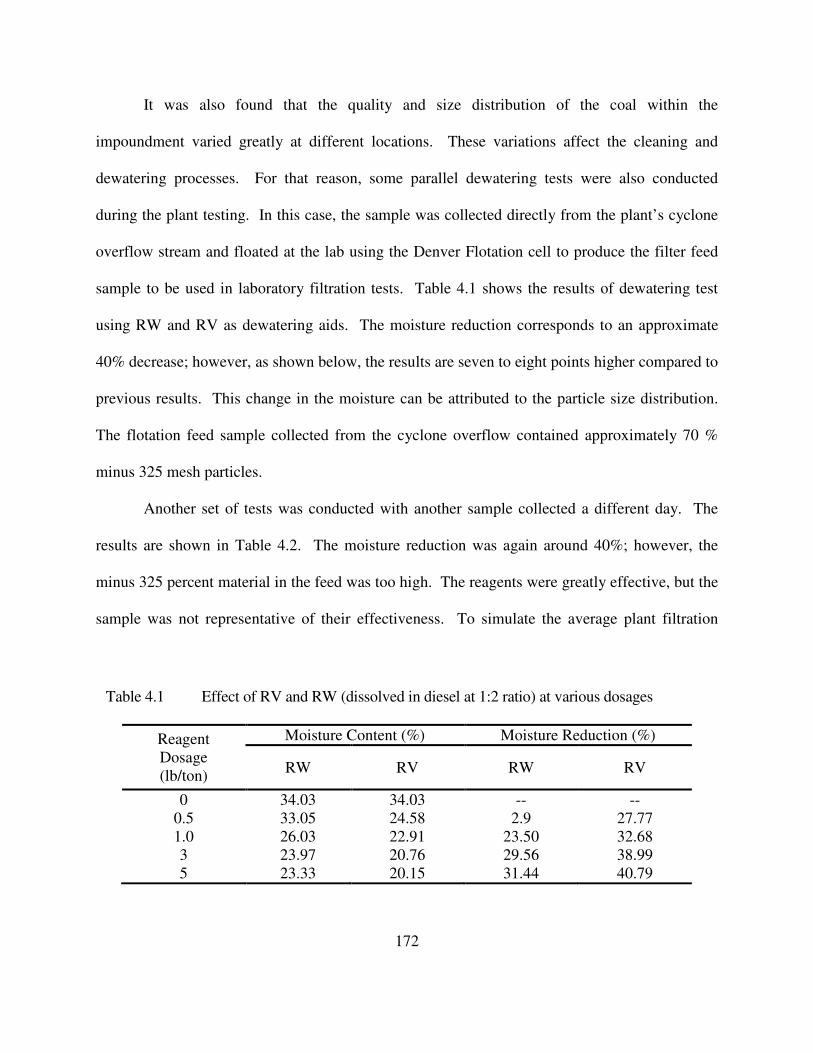
172
It was also found that the quality and size distribution of the coal within the
impoundment varied greatly at different locations. These variations affect the cleaning and
dewatering processes. For that reason, some parallel dewatering tests were also conducted
during the plant testing. In this case, the sample was collected directly from the plant’s cyclone
overflow stream and floated at the lab using the Denver Flotation cell to produce the filter feed
sample to be used in laboratory filtration tests. Table 4.1 shows the results of dewatering test
using RW and RV as dewatering aids. The moisture reduction corresponds to an approximate
40% decrease; however, as shown below, the results are seven to eight points higher compared to
previous results. This change in the moisture can be attributed to the particle size distribution.
The flotation feed sample collected from the cyclone overflow contained approximately 70 %
minus 325 mesh particles.
Another set of tests was conducted with another sample collected a different day. The
results are shown in Table 4.2. The moisture reduction was again around 40%; however, the
minus 325 percent material in the feed was too high. The reagents were greatly effective, but the
sample was not representative of their effectiveness. To simulate the average plant filtration
Table 4.1 Effect of RV and RW (dissolved in diesel at 1:2 ratio) at various dosages
Reagent
Dosage
(lb/ton)
Moisture Content (%) Moisture Reduction (%)
RW RV RW RV
0 34.03 34.03 -- --
0.5 33.05 24.58 2.9 27.77
1.0 26.03 22.91 23.50 32.68
3 23.97 20.76 29.56 38.99
5 23.33 20.15 31.44 40.79
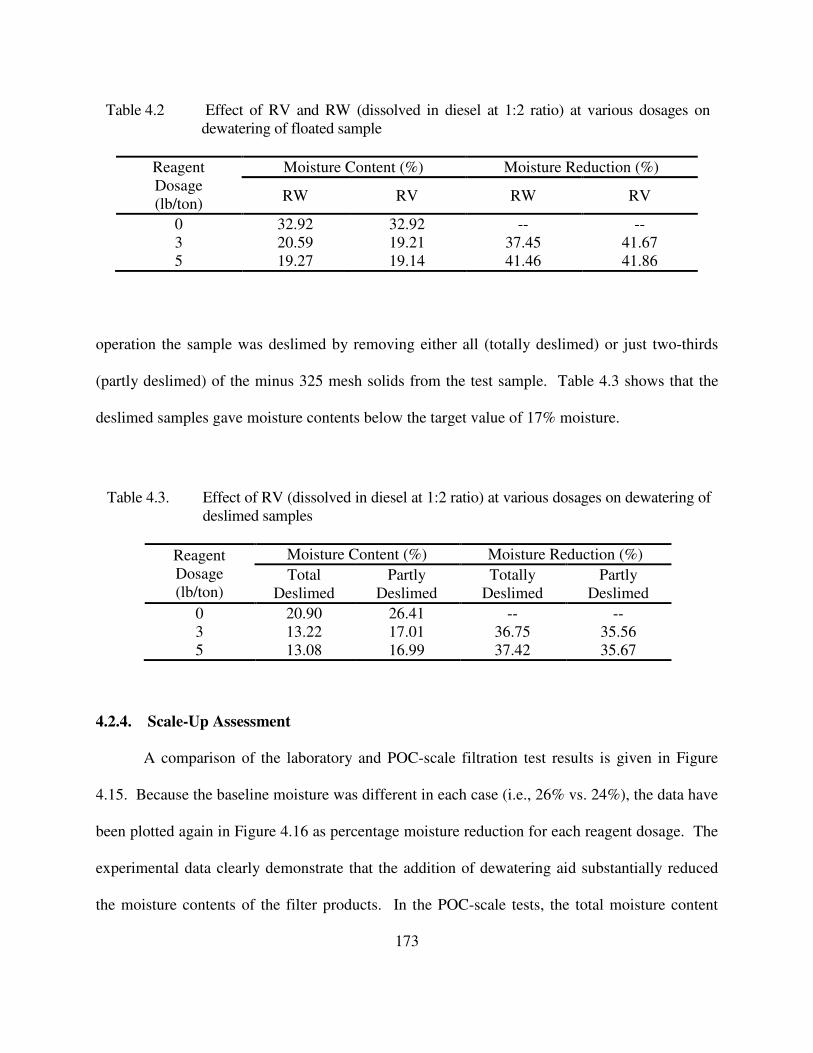
173
operation the sample was deslimed by removing either all (totally deslimed) or just two-thirds
(partly deslimed) of the minus 325 mesh solids from the test sample. Table 4.3 shows that the
deslimed samples gave moisture contents below the target value of 17% moisture.
4.2.4. Scale-Up Assessment
A comparison of the laboratory and POC-scale filtration test results is given in Figure
4.15. Because the baseline moisture was different in each case (i.e., 26% vs. 24%), the data have
been plotted again in Figure 4.16 as percentage moisture reduction for each reagent dosage. The
experimental data clearly demonstrate that the addition of dewatering aid substantially reduced
the moisture contents of the filter products. In the POC-scale tests, the total moisture content
Table 4.3. Effect of RV (dissolved in diesel at 1:2 ratio) at various dosages on dewatering of
deslimed samples
Reagent
Dosage
(lb/ton)
Moisture Content (%) Moisture Reduction (%)
Total
Deslimed
Partly
Deslimed
Totally
Deslimed
Partly
Deslimed
0 20.90 26.41 -- --
3 13.22 17.01 36.75 35.56
5 13.08 16.99 37.42 35.67
Table 4.2 Effect of RV and RW (dissolved in diesel at 1:2 ratio) at various dosages on
dewatering of floated sample
Reagent
Dosage
(lb/ton)
Moisture Content (%) Moisture Reduction (%)
RW RV RW RV
0 32.92 32.92 -- --
3 20.59 19.21 37.45 41.67
5 19.27 19.14 41.46 41.86
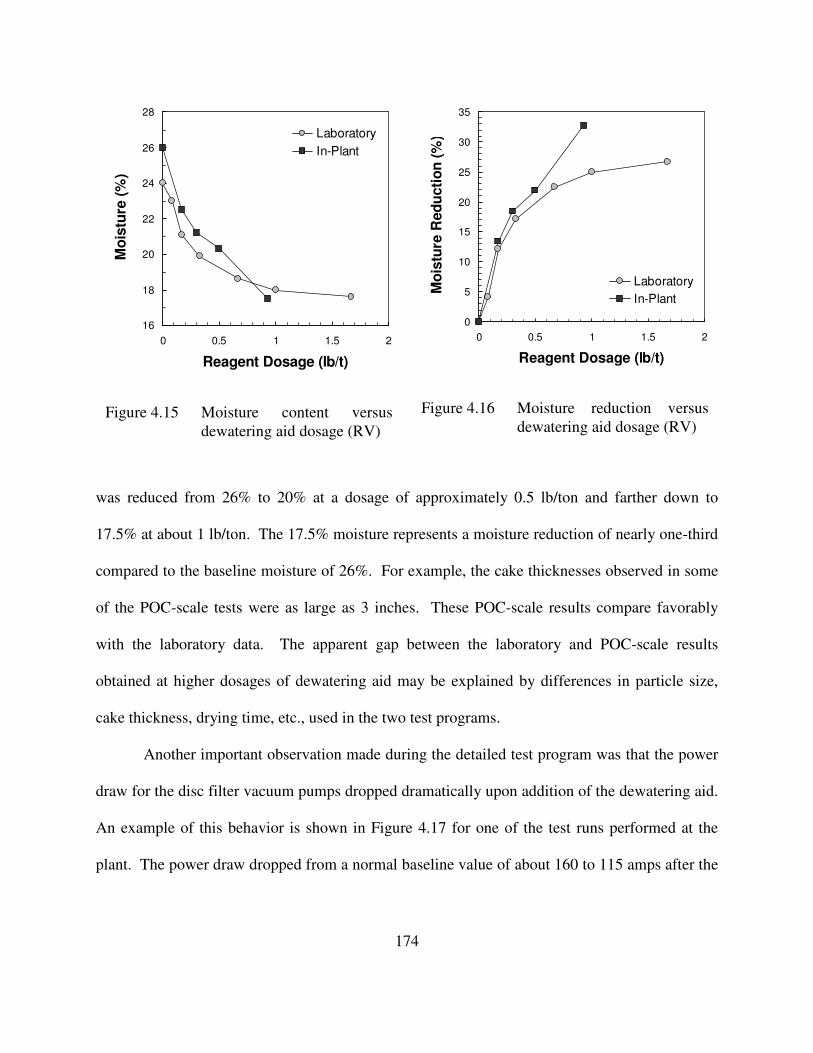
174
was reduced from 26% to 20% at a dosage of approximately 0.5 lb/ton and farther down to
17.5% at about 1 lb/ton. The 17.5% moisture represents a moisture reduction of nearly one-third
compared to the baseline moisture of 26%. For example, the cake thicknesses observed in some
of the POC-scale tests were as large as 3 inches. These POC-scale results compare favorably
with the laboratory data. The apparent gap between the laboratory and POC-scale results
obtained at higher dosages of dewatering aid may be explained by differences in particle size,
cake thickness, drying time, etc., used in the two test programs.
Another important observation made during the detailed test program was that the power
draw for the disc filter vacuum pumps dropped dramatically upon addition of the dewatering aid.
An example of this behavior is shown in Figure 4.17 for one of the test runs performed at the
plant. The power draw dropped from a normal baseline value of about 160 to 115 amps after the
16
18
20
22
24
26
28
0 0.5 1 1.5 2
Reagent Dosage (lb/t)
Mo
istu
re (
%)
Laboratory
In-Plant
Figure 4.15 Moisture content versus
dewatering aid dosage (RV)
0
5
10
15
20
25
30
35
0 0.5 1 1.5 2
Reagent Dosage (lb/t)
Mo
istu
re R
ed
ucti
on
(%
)
Laboratory
In-Plant
Figure 4.16 Moisture reduction versus
dewatering aid dosage (RV)
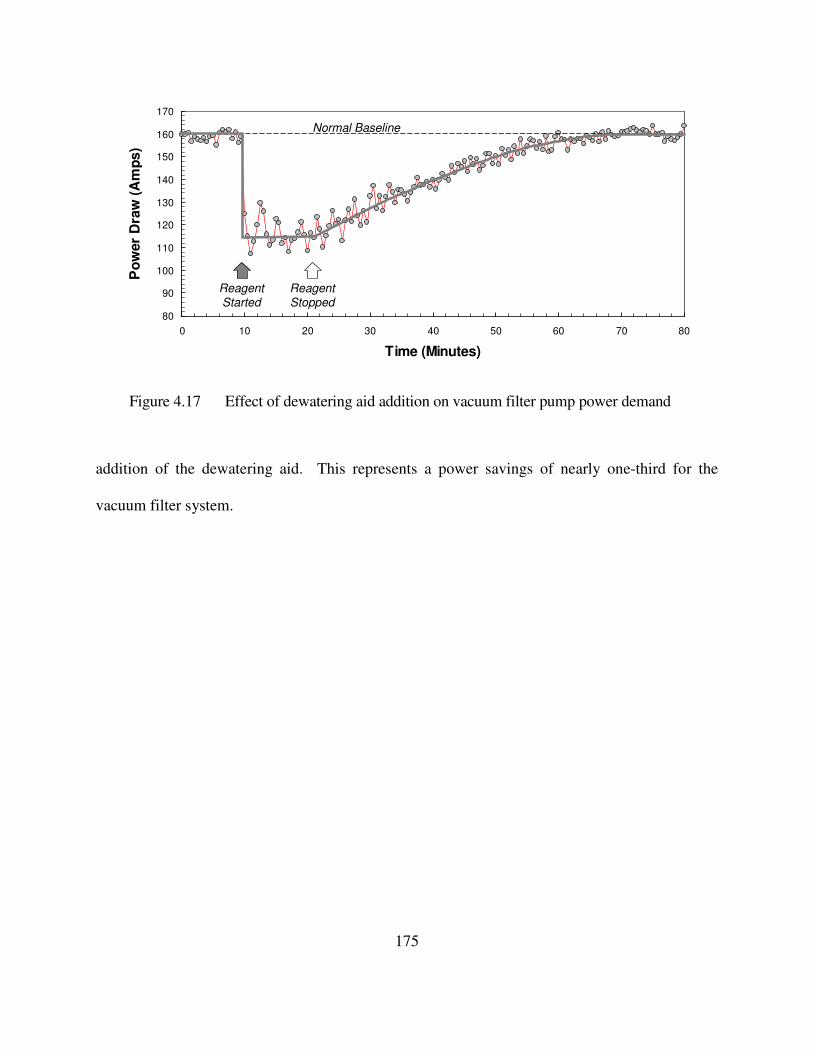
175
addition of the dewatering aid. This represents a power savings of nearly one-third for the
vacuum filter system.
80
90
100
110
120
130
140
150
160
170
0 10 20 30 40 50 60 70 80
Time (Minutes)
Po
wer D
raw
(A
mp
s)
ReagentStarted
ReagentStopped
Normal Baseline
Figure 4.17 Effect of dewatering aid addition on vacuum filter pump power demand
176
4.3. SUMMARY AND CONCLUSIONS
In the present work, capabilities of novel dewatering aids were successfully tested on the
fine coal that is processed at the Smith Branch impoundment site. In United Stated, annually,
approximately 1.1 billion tons of coal is mined and 600-650 million tons of the production is wet
processed while remainder is utilized as is. Typically, wet processing methods are responsible
for processing 350-400 million tons of coal. However, especially for fine materials smaller than
100 mesh, cleaning and dewatering costs have significantly been high. This fact has been a
limiting factor for the coal processing industry. As a result, depending on the quality and the
quantity of the fine size fraction, coal has been either treated and sold or discarded to waste
slurry impoundments.
As of 2001, there are 713 active waste slurry impoundments in which approximately 500-
800 million tons of coal lies. Considering today’s economical conditions however, the coal in
the waste slurry impoundments may now be an unexploited energy source. Consequently, re-
mining the impoundments may be considered a promising method to recover this coal which
previously represented a loss of profit.
The Smith Branch impoundment, located in West Virginia, is estimated to contain 2.85
million tons of potentially recoverable fine coal. At the time of this work, Beard Technologies
Inc. owned the permit to re-mine and recover coal from this site. Considering the amount of fine
size fraction, the success in recovering the coal from this impoundment was strongly dependent
on successful cleaning and a very effective dewatering operation. Thus, this site was ideally
suited for a demonstration project since the novel dewatering aids made it possible to convert the
waste coal impoundment at this site from environmental liability into a profitable resource.
177
Based on the feasibility studies, Beard Technologies constructed a POC circuit. The
plant was designed with a raw feed capacity of approximately 200 tph of dry solids. The plant
sizes/classifies the feed from the dredge into four nominal size fractions, plus28 mesh, 28 x 100
mesh, 100 x 325 mesh, and minus 325 mesh. The circuit incorporates the novel dewatering
technology together with advanced flotation process to ensure maximum moisture reduction and
coal recovery for the 100 x 325 mesh material.
Cleaning is done by a two-stage advanced column flotation bank. The cleaned froth
product from the column units passes into a de-aeration tank to promote breakdown of any
residual froth. The froth product is then passed through three agitated mixing tanks where
dewatering aids are added. Previous test work has shown that adequate mixing, both in terms of
time and intensity, is critical to the performance of the dewatering aids. After conditioning for
several minutes, the treated slurry is fed to a bank of a twelve-disc, 12.5ft diameter vacuum disc
filter for final dewatering.
In the POC-scale tests, the total moisture content was reduced from 26% to 20% at a
dosage of approximately 0.5 lb/ton and further to 17.5% at approximately 1 lb/ton of novel
dewatering aid; this represents a total moisture reduction of nearly 33%. As well, dewatering
kinetics were also increased i.e., the cake thicknesses observed in some of the POC-scale tests
were as much as 3 inches. These POC-scale results also compare favorably with the laboratory
data.
Another important observation made during the detailed test program was that the current
required for the disc filter vacuum pumps dropped dramatically upon addition of the dewatering
aid. The normal baseline current value was about 160 amps, but fell to 115 amps after the
178
addition of the dewatering aid. This represents a power savings of nearly 30% for the vacuum
filter system.
In conclusion, testing of the POC-scale facility demonstrated that the novel dewatering
aids made it possible to achieve low moisture contents and also improved the handling
characteristics of fine coal products produced via re-mining of a waste coal impoundment.
179
4.4. REFERENCES
1. Administration, Energy .Information. Official Energy Statistics from the U.S
Government. 2009
Available from:http://www.eia.doe.gov/.
2. Energy, U.S.DOE. 2009
Available from:http://www.energy.gov/energysources/coal.htm.
3. Svarovsky, Solid-Liquid Separation. 1991, London: Butterworth.
4. Clean-Energy.US., About Coal. 2009
Available from:http://www.clean-energy.us/facts/coal.htm.
5. World Coal Institute, Coal Facts 2007. 2009
Available from:http://www.worldcoal.org/.
6. Coal Impoundment Location & Information System,. List Coal Impoundments. 2009
Available from:http://www.coalimpoundment.org/.
7. J. Gregory, Solid-liquid separation, ed. 1984,
8. Dickenson, T.C., Filters and Filtration Handbook. 4 ed. 1997:
180
CHAPTER 5 DEWATERING OTHER MINERALS
5.1. INTRODUCTION
In the previous chapters, the feasibility of using novel dewatering aids was investigated in
detail. These dewatering aids adsorb on the surface of the hydrophobic particles such as coal,
and increase the hydrophobicity. The results obtained from laboratory, pilot, and full scale tests
that were conducted on several coal samples confirmed that the dewatering aids are capable of
decreasing the final cake moisture by 20-50 % and increasing the filtration kinetics to a point that
cannot be achieved with existing mechanical capabilities. In order to investigate and confirm
that the novel dewatering aids can also be effective on other minerals and hydrophilic particles, a
number of dewatering tests were conducted on minerals such as copper and hydrophilic materials
such as kaolin clay and fly ash.
5.2. KAOLIN CLAY
5.2.1. Background Information
Kaolin clay, a hydrated aluminum silicate (Al2Si2O5(OH)4), is a white, soft mineral and is
mainly composed of fine-grained, plate-like particles. It is commonly referred to as "China
Clay," which refers to its discovery in Kao-Lin, China. Kaolin clay deposits are classified as
either primary or secondary. Primary kaolin results from residual weathering or hydrothermal
alteration of feldspar and muscovite. Secondary kaolin is sedimentary in origin.[4, 1, 2]
Kaolin is a distinctive industrial mineral due to its unique physical, physiochemical, and
chemical properties. For example, it remains chemically inert over a relatively wide pH range, it
is non-abrasive, and it has low thermal and electrical conductivities. As a result, it has broad
applications in many industries including (by percent): paper and filling (45%), refractory (16%),
181
ceramics (15%), fiberglass (6%) cement (6%), rubber and plastic (5%) and paint catalyst and
others (7%). In the paper industry, high-brightness kaolin is used for coating, and low-brightness
kaolin is used as filler.[4, 5, 6]
The total global kaolin production is estimated (2007) to be 37.8 million tons per year,
and the US has approximately 20% of the clay production share in the world markets. The other
major kaolin producers are Brazil, Czech Republic, Germany, Republic of Korea and United
Kingdom. In the US, a stream of kaolin-containing rocks reaches from Eufaula, Alabama
approximately 250 miles to Aiken, South Carolina. This stream contains 7 to 10 billion metric
tons of sedimentary kaolin. 90% of US kaolin production is concentrated in a 150-mile-long
segment of this stream that extends from Macon, Georgia to Aiken, South Carolina. Georgia is
responsible for producing 92% of the tonnage and 96% of the dollar value, while South Carolina
produces 4% of the tonnage and 2% of the dollar value. Kaolin from this region of the US is of
high quality due to its high brightness and relatively low viscosity at high solids concentration
(70%).[2-4, 7]
By and large, all kaolin is mined using open pit methods utilizing shovels, draglines, and
backhoes. Two processing methods – one dry, the other wet – are used in the production of
kaolin. The dry process is rather simple and inexpensive, while the wet process employs
sophisticated separation techniques to improve the color brightness and size consistency.[1, 5]
In the wet process, kaolin clay is treated with magnetic separation, flotation, selective
flocculation, leaching, or combinations of multiple methods, and usually contains more than 80%
moisture content. The most difficult phase of processing is dewatering of this moisture content,
due to the naturally ultra-fine particle size of the clay. Fine particles require more complex and
intense chemical and mechanical treatment due to the larger surface area to be dewatered and
182
smaller capillaries. This, along with the kaolin clay’s natural hydrophilic characteristics, gives
higher capillary pressures. In industry, kaolin clay is dewatered using vacuum drum filters and
various types of pressure filters, which can lower the moisture to 40% to 60%. In kaolin clay
dewatering, a unique function of the filtration process is also to remove chemicals from the clay.
Depending on the market requirements the filtration is followed by spray drying, which,
although costly, is the only method capable of producing a very low moisture product
(approximately 10% to 30%).[4, 8-10]
In this section, the effects of novel dewatering aids were investigated using two new
methods, namely Two Step Hydrophobization and Foam Assisted Dewatering Method.
5.2.2. Two Step Hydrophobization Method
a) Experimental
A number of kaolin clay samples with various properties were obtained from different
companies for use in dewatering tests. The tests utilized a two-step hydrophobization technique,
described below. The samples are:
i) Thiele Kaolin Company’s Kaolin Clay Sample (25% solid, pH 7.2)
ii) J.M.H Corporation’s PSD Filter Vat Clay Sample (30% solid, pH 4)
iii) J.M.H Corporation’s PSD Filter pre-leached Clay Sample (30% solid, pH 9.5)
b) Results and Discussion
1) Thieles’ Sample (30% solid at pH 7)
In the first set of laboratory dewatering tests, East Georgia kaolin clay sample received from
Thiele Clay Company was subjected to dewatering tests using the two-step hydrophobization
method. The as-received sample was first subjected to some simple analyses, such as pH value
and solid content determination. The measured pH value for the clay slurry sample was 7.14 and
183
had 25% solids with a size that was finer than 2µm. In this set of tests, a laboratory pressure
filter unit was used for all tests at 60psi pressure. The as-received sample was first agitated for a
given period of time to keep the clay particles suspended and well-dispersed in the slurry,
followed by dilution using Blacksburg tap water from 25% to 8%. In the first dewatering test, a
known volume of the diluted sample was taken and tested at 60psi pressure without any surface
treatment. During this control test, the dewatering kinetics were noticeably low, giving
approximately 25 minutes cake formation time, where the adjusted drying cycle time was 5
minutes. The cake thickness was 1.5 to 2mm, having an average of 39.14% final moisture. The
following tests were done in the presence of various dosages of dodecylamine chloride (DAC) to
create a slightly hydrophobic surface as the first step of two-step hydrophobization. After DAC
was added, the slurry was agitated for 5 minutes with the stand-alone 3cm, three-bladed,
propeller-type mixer, transferred to the pressure filter, and subjected to the same tests. During
these tests, it was observed that the slurry was becoming more viscous by further addition of
DAC after about 10 lb/ton. This may be attributed to the spontaneous flocculation facilitated by
amine during mixing. As shown in Table 5.1, in the presence of DAC, the moisture contents
were reduced to 32.14% and 31.90% at 5lb/ton and 10lb/ton reagent addition, respectively. The
cake formation time, which is an indicator of dewatering kinetics, was also cut down to 4-8
minutes, even though the cake thickness was increased to 2mm to 4mm. The increased cake
thickness may be an indication to an increased diameter of capillaries, which in turn, lower the
capillary pressure and ease the water removal from the cake.
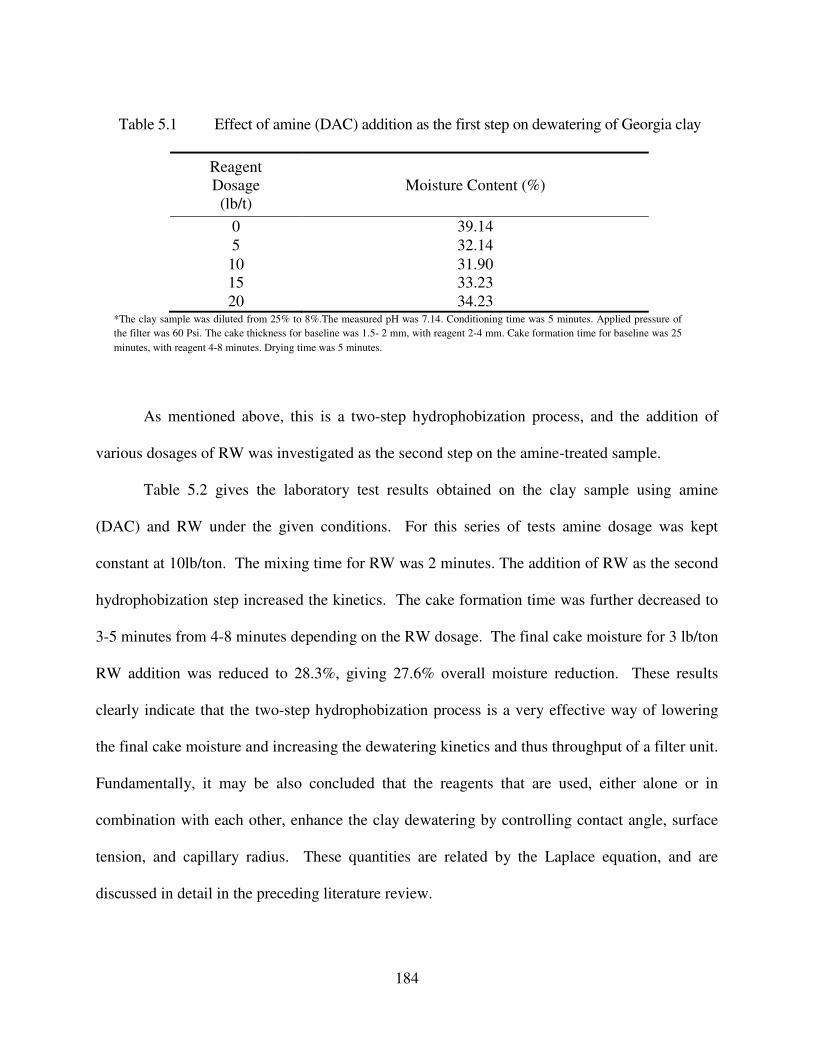
184
As mentioned above, this is a two-step hydrophobization process, and the addition of
various dosages of RW was investigated as the second step on the amine-treated sample.
Table 5.2 gives the laboratory test results obtained on the clay sample using amine
(DAC) and RW under the given conditions. For this series of tests amine dosage was kept
constant at 10lb/ton. The mixing time for RW was 2 minutes. The addition of RW as the second
hydrophobization step increased the kinetics. The cake formation time was further decreased to
3-5 minutes from 4-8 minutes depending on the RW dosage. The final cake moisture for 3 lb/ton
RW addition was reduced to 28.3%, giving 27.6% overall moisture reduction. These results
clearly indicate that the two-step hydrophobization process is a very effective way of lowering
the final cake moisture and increasing the dewatering kinetics and thus throughput of a filter unit.
Fundamentally, it may be also concluded that the reagents that are used, either alone or in
combination with each other, enhance the clay dewatering by controlling contact angle, surface
tension, and capillary radius. These quantities are related by the Laplace equation, and are
discussed in detail in the preceding literature review.
Table 5.1 Effect of amine (DAC) addition as the first step on dewatering of Georgia clay
Reagent
Dosage
(lb/t)
Moisture Content (%)
0 39.14
5 32.14
10 31.90
15 33.23
20 34.23 *The clay sample was diluted from 25% to 8%.The measured pH was 7.14. Conditioning time was 5 minutes. Applied pressure of
the filter was 60 Psi. The cake thickness for baseline was 1.5- 2 mm, with reagent 2-4 mm. Cake formation time for baseline was 25
minutes, with reagent 4-8 minutes. Drying time was 5 minutes.
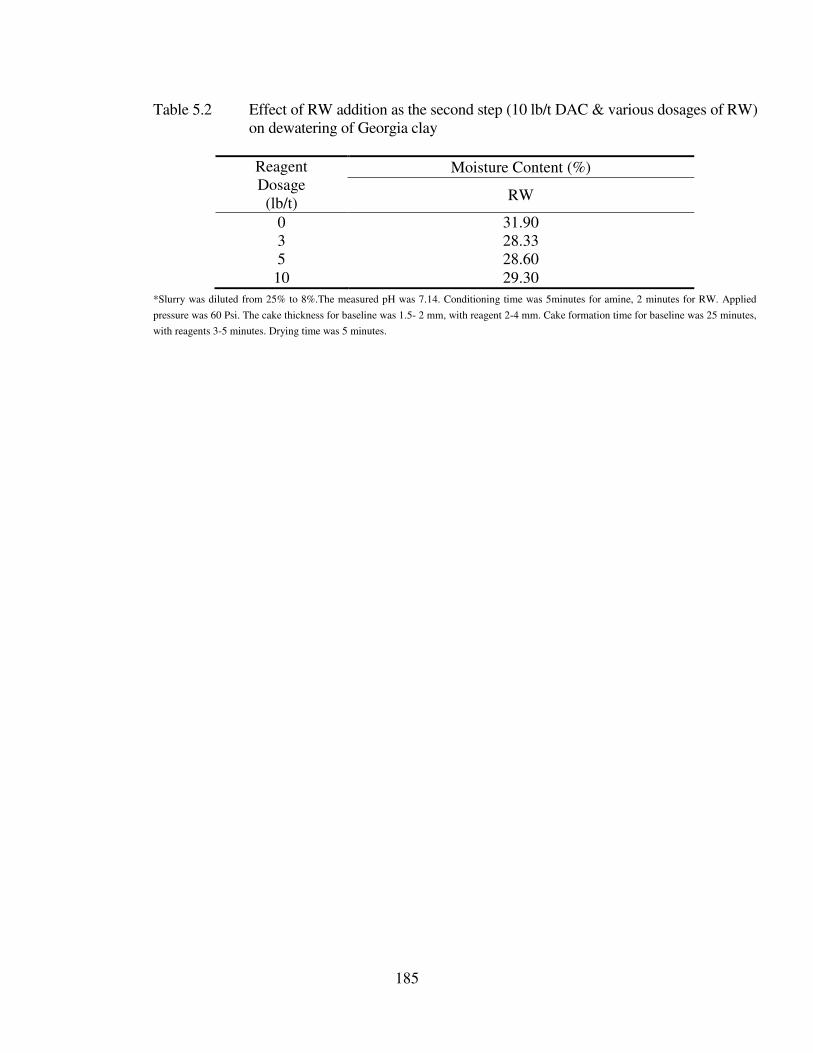
185
Table 5.2 Effect of RW addition as the second step (10 lb/t DAC & various dosages of RW)
on dewatering of Georgia clay
Reagent
Dosage
(lb/t)
Moisture Content (%)
RW
0 31.90
3 28.33
5 28.60
10 29.30
*Slurry was diluted from 25% to 8%.The measured pH was 7.14. Conditioning time was 5minutes for amine, 2 minutes for RW. Applied
pressure was 60 Psi. The cake thickness for baseline was 1.5- 2 mm, with reagent 2-4 mm. Cake formation time for baseline was 25 minutes,
with reagents 3-5 minutes. Drying time was 5 minutes.
186
2) J.M.H Corporation’s PSD Filter Vat Kaolin Clay Sample (30% solid, pH 4)
In this set of dewatering tests, East Georgia kaolin clay samples received from J.M.
Huber Corporation were subjected to dewatering tests to investigate the effect of using the two-
step hydrophobization method. The same test procedure was followed, except that the 2.5inch-
diameter, 6inch-height, Buchner funnel vacuum filter at 25in. Hg vacuum pressure was used
instead of a pressure filter. The filter cloth was supplied from the same company. The first
sample tested was PSD filter Vat Kaolin Clay sample that had 30% solid content, and a pH of
about 4.
Tests results obtained on the as-received clay sample show that varying amine addition
did not make any significant difference in final cake moisture where the baseline moisture was
approximately 40-41%. However, dewatering kinetics was observed to increase with increasing
amine addition. When RW was added to the amine-treated sample as the second step of
hydrophobization, the moisture reduction was not significant, i.e., 1-2 %. This might be
explained by the fact that the magnitude of zeta potential has an important influence on the
aggregation of particles in water. When the magnitude of zeta potential is low, the repulsive
force between the particles is reduced so that the particles come closer and form agglomerates,
which occur at acidic pH. Agglomeration increases the settling rate of particles, resulting in fast
dewatering kinetics. On the contrary, it may induce the trapping of water in the agglomerate
structures, which directly increases the moisture content of the final cake. The solid
concentration of the slurry is of interest, too, because dewatering kinetics and final cake moisture
are affected by the settling rate. As the suspended solid increases, a lower settling rate will occur
up to a certain concentration level, which will, in turn, affect moisture content. High solid
content also makes reagent conditioning difficult because of the high viscosity. This may be
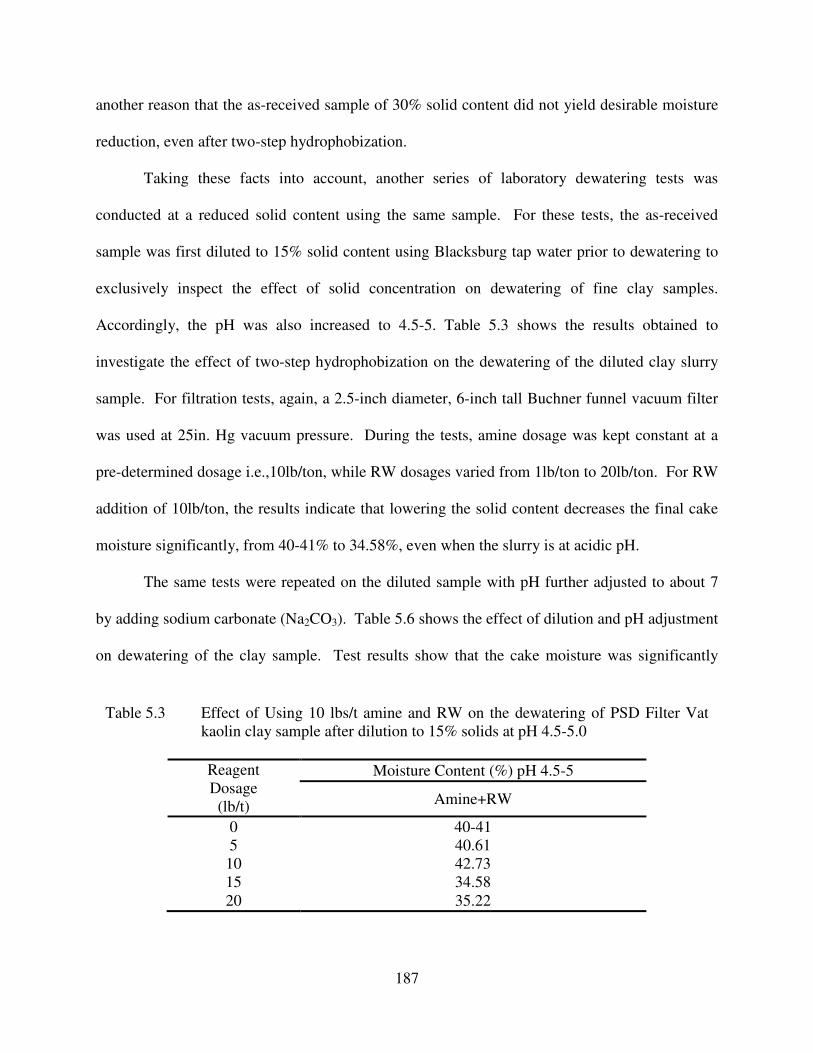
187
another reason that the as-received sample of 30% solid content did not yield desirable moisture
reduction, even after two-step hydrophobization.
Taking these facts into account, another series of laboratory dewatering tests was
conducted at a reduced solid content using the same sample. For these tests, the as-received
sample was first diluted to 15% solid content using Blacksburg tap water prior to dewatering to
exclusively inspect the effect of solid concentration on dewatering of fine clay samples.
Accordingly, the pH was also increased to 4.5-5. Table 5.3 shows the results obtained to
investigate the effect of two-step hydrophobization on the dewatering of the diluted clay slurry
sample. For filtration tests, again, a 2.5-inch diameter, 6-inch tall Buchner funnel vacuum filter
was used at 25in. Hg vacuum pressure. During the tests, amine dosage was kept constant at a
pre-determined dosage i.e.,10lb/ton, while RW dosages varied from 1lb/ton to 20lb/ton. For RW
addition of 10lb/ton, the results indicate that lowering the solid content decreases the final cake
moisture significantly, from 40-41% to 34.58%, even when the slurry is at acidic pH.
The same tests were repeated on the diluted sample with pH further adjusted to about 7
by adding sodium carbonate (Na2CO3). Table 5.6 shows the effect of dilution and pH adjustment
on dewatering of the clay sample. Test results show that the cake moisture was significantly
Table 5.3 Effect of Using 10 lbs/t amine and RW on the dewatering of PSD Filter Vat
kaolin clay sample after dilution to 15% solids at pH 4.5-5.0
Reagent
Dosage
(lb/t)
Moisture Content (%) pH 4.5-5
Amine+RW
0 40-41
5 40.61
10 42.73
15 34.58
20 35.22
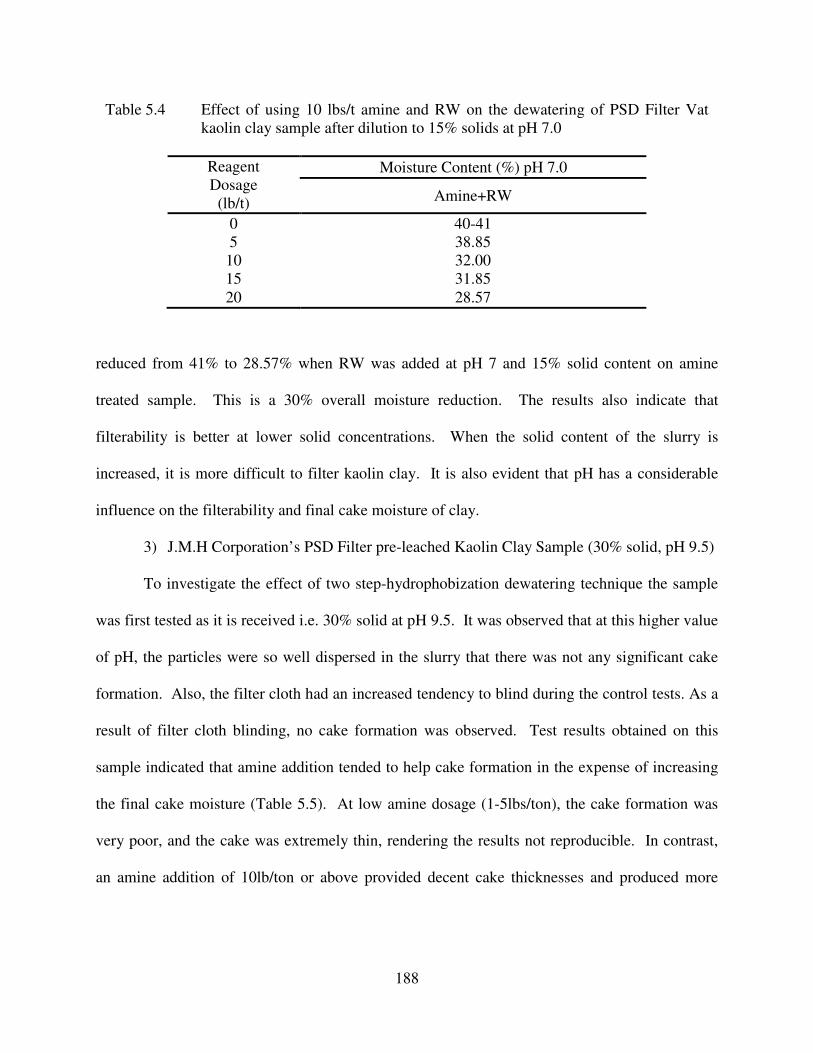
188
reduced from 41% to 28.57% when RW was added at pH 7 and 15% solid content on amine
treated sample. This is a 30% overall moisture reduction. The results also indicate that
filterability is better at lower solid concentrations. When the solid content of the slurry is
increased, it is more difficult to filter kaolin clay. It is also evident that pH has a considerable
influence on the filterability and final cake moisture of clay.
3) J.M.H Corporation’s PSD Filter pre-leached Kaolin Clay Sample (30% solid, pH 9.5)
To investigate the effect of two step-hydrophobization dewatering technique the sample
was first tested as it is received i.e. 30% solid at pH 9.5. It was observed that at this higher value
of pH, the particles were so well dispersed in the slurry that there was not any significant cake
formation. Also, the filter cloth had an increased tendency to blind during the control tests. As a
result of filter cloth blinding, no cake formation was observed. Test results obtained on this
sample indicated that amine addition tended to help cake formation in the expense of increasing
the final cake moisture (Table 5.5). At low amine dosage (1-5lbs/ton), the cake formation was
very poor, and the cake was extremely thin, rendering the results not reproducible. In contrast,
an amine addition of 10lb/ton or above provided decent cake thicknesses and produced more
Table 5.4 Effect of using 10 lbs/t amine and RW on the dewatering of PSD Filter Vat
kaolin clay sample after dilution to 15% solids at pH 7.0
Reagent
Dosage
(lb/t)
Moisture Content (%) pH 7.0
Amine+RW
0 40-41
5 38.85
10 32.00
15 31.85
20 28.57
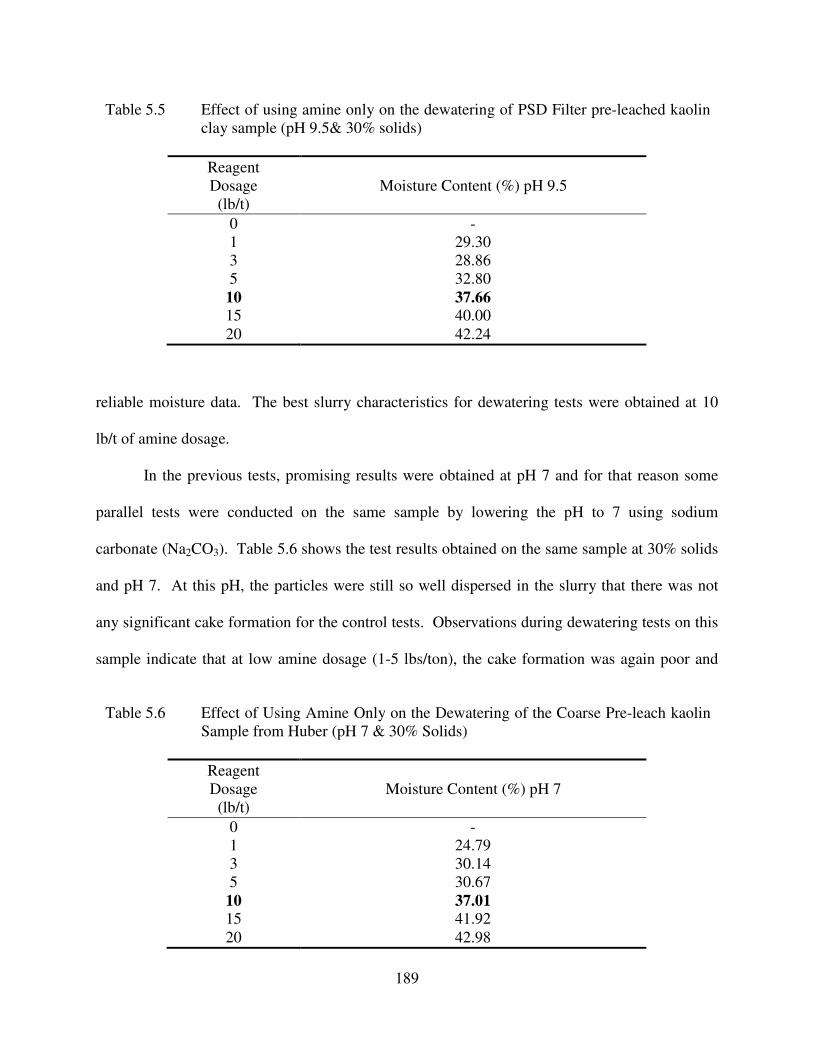
189
reliable moisture data. The best slurry characteristics for dewatering tests were obtained at 10
lb/t of amine dosage.
In the previous tests, promising results were obtained at pH 7 and for that reason some
parallel tests were conducted on the same sample by lowering the pH to 7 using sodium
carbonate (Na2CO3). Table 5.6 shows the test results obtained on the same sample at 30% solids
and pH 7. At this pH, the particles were still so well dispersed in the slurry that there was not
any significant cake formation for the control tests. Observations during dewatering tests on this
sample indicate that at low amine dosage (1-5 lbs/ton), the cake formation was again poor and
Table 5.5 Effect of using amine only on the dewatering of PSD Filter pre-leached kaolin
clay sample (pH 9.5& 30% solids)
Reagent
Dosage
(lb/t)
Moisture Content (%) pH 9.5
0 -
1 29.30
3 28.86
5 32.80
10 37.66
15 40.00
20 42.24
Table 5.6 Effect of Using Amine Only on the Dewatering of the Coarse Pre-leach kaolin
Sample from Huber (pH 7 & 30% Solids)
Reagent
Dosage
(lb/t)
Moisture Content (%) pH 7
0 -
1 24.79
3 30.14
5 30.67
10 37.01
15 41.92
20 42.98
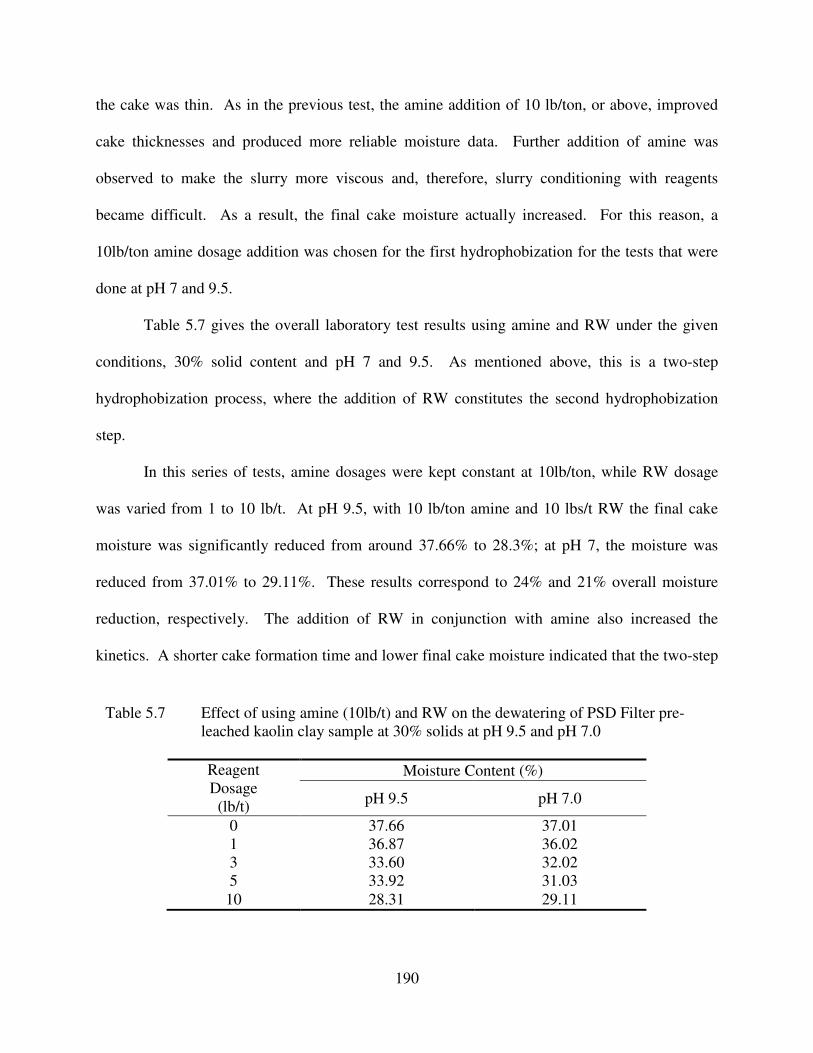
190
the cake was thin. As in the previous test, the amine addition of 10 lb/ton, or above, improved
cake thicknesses and produced more reliable moisture data. Further addition of amine was
observed to make the slurry more viscous and, therefore, slurry conditioning with reagents
became difficult. As a result, the final cake moisture actually increased. For this reason, a
10lb/ton amine dosage addition was chosen for the first hydrophobization for the tests that were
done at pH 7 and 9.5.
Table 5.7 gives the overall laboratory test results using amine and RW under the given
conditions, 30% solid content and pH 7 and 9.5. As mentioned above, this is a two-step
hydrophobization process, where the addition of RW constitutes the second hydrophobization
step.
In this series of tests, amine dosages were kept constant at 10lb/ton, while RW dosage
was varied from 1 to 10 lb/t. At pH 9.5, with 10 lb/ton amine and 10 lbs/t RW the final cake
moisture was significantly reduced from around 37.66% to 28.3%; at pH 7, the moisture was
reduced from 37.01% to 29.11%. These results correspond to 24% and 21% overall moisture
reduction, respectively. The addition of RW in conjunction with amine also increased the
kinetics. A shorter cake formation time and lower final cake moisture indicated that the two-step
Table 5.7 Effect of using amine (10lb/t) and RW on the dewatering of PSD Filter pre-
leached kaolin clay sample at 30% solids at pH 9.5 and pH 7.0
Reagent
Dosage
(lb/t)
Moisture Content (%)
pH 9.5 pH 7.0
0 37.66 37.01
1 36.87 36.02
3 33.60 32.02
5 33.92 31.03
10 28.31 29.11
191
hydrophobization technique greatly enhances the clay dewatering by controlling the contact
angle, surface tension, and capillary radius.
Alum is also used in industry to coagulate the clay particles and facilitate dewatering at
different pH and solid concentrations. In brief tests with alum, no significant changes were
observed in final cake moisture, despite observed increases in kinetics. In some cases, moisture
levels actually increased substantially.
192
5.2.3. Foam Aided Dewatering Method
There are no previously published studies on foam dewatering and the mechanisms which
render this method effective are not completely understood at this time. However, tests
conducted at Virginia tech suggest the following: first, the foam increases the void spaces
(porosity) within the cake structure and, second, foam lowers the surface tension of particles
such that in a clay slurry system, for example, the foam may actually increase the dewatering
efficiency. This idea is in agreement with Laplace’s theory, i.e., lowering surface tension,
increasing capillary radius and contact angle. To investigate this new concept, some tests were
conducted using foam.
a) Experimental
For this study, the Thiele Kaolin Company sample was used. It is a flotation product and
contains approximately 25% solids. In some of the tests, the clay slurry is diluted with tap water
down to 5~8% solid for dewatering testing. A set of tests was conducted at natural pH of about
7.2.
Two procedures were tested to apply foam to clay dewatering. These methods are:
i) Method 1: A foam-generating agent (Tergitol) was added to the slurry, and then
agitated strongly with air blown into the slurry until it was filled with foam. The
foamy slurry is then subjected to the pressure filtration tests.
ii) Method 2: The foam was generated separately by agitating the foam-generating
agent containing water in presence of blowing air. Then the foam that was
generated was added onto the top of clay cake inside the pressure filter chamber
after the cake formation time.
193
In foam dewatering tests Tergitol (with different NP numbers) were used as foaming
agent. One of the advantages for using Tergitol as foaming agent is that it does not contaminate
the clay surface because it does not adsorb onto the clay surface.
b) Results and Discussion
The preliminary test results showed that the vacuum filtration was not effective with the
foam dewatering of clay. With consideration of the natural difficulty in clay dewatering, and
unsatisfactory moisture reduction obtained from vacuum filtration, all the tests were conducted
using a laboratory-scale pressure filter. In each dewatering test, a desired volume of clay slurry
was prepared using the methods that was described, and then transferred to the pressure filter.
During the filtration, cake formation time and drying cycle time were recorded. The air pressure
for filtration was set at 60 psi for all the tests. #44 filter papers manufactured by Whatman
Company were chosen as filtration media. The filtrate obtained with #44 filter paper was always
very clear.
Foam Aided Clay Dewatering Tests at pH 7.2
Method 1: To investigate the effect of foam on clay dewatering, clay sample was
conditioned with various dosages of Tergitol NP-7 and Tergitol NP-9 (surfactants that are
capable of generating foam in a solution) and aerated to create a foamy environment. In this set
of test, after adjusting the slurry ph to 7.14, Tergitol, foam generating agent, was added to the
slurry and agitated strongly while injecting air. 5 minutes was given for this process. The
pressure for filtration was adjusted to 60 Psi. Table 5.8 shows that Tergitol NP-7 or Tergitol NP-
9 alone could reduce the cake moisture down to as low as 25%. This moisture reduction
correspond to approximately 35 % overall reduction. The results also showed that, Tergitol was
very effective at low dosage i.e., 3 lb/t and higher dosages did not make a lot difference.
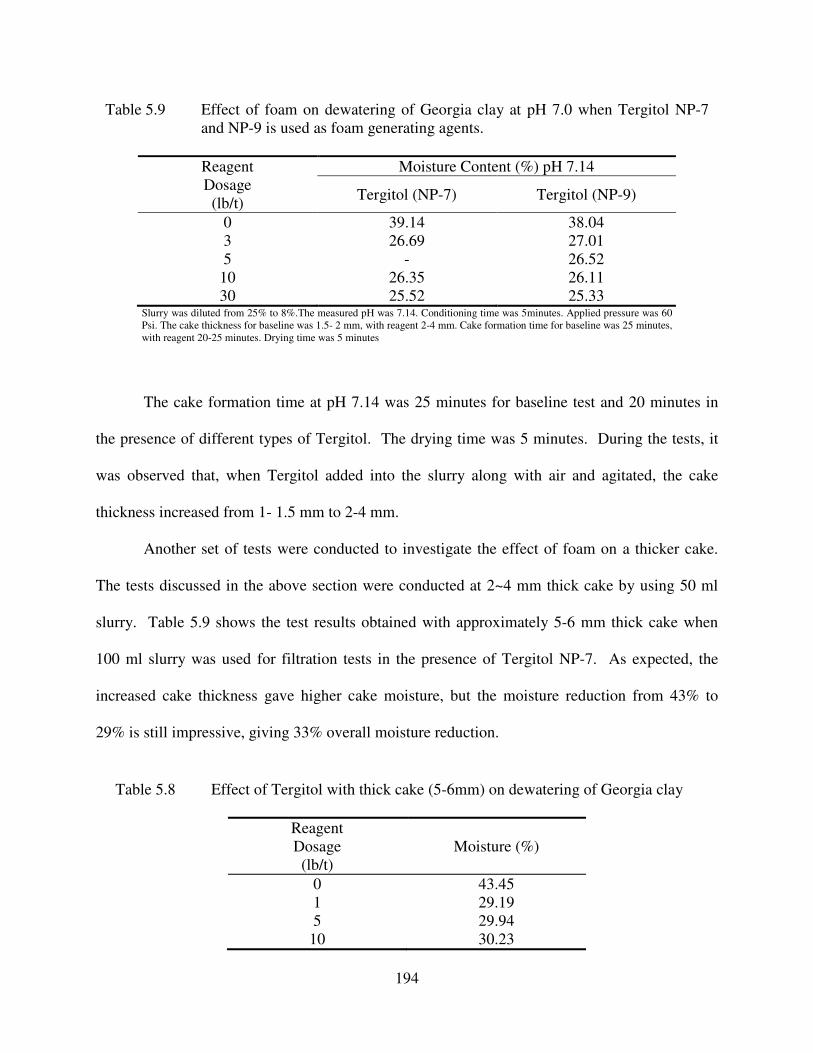
194
The cake formation time at pH 7.14 was 25 minutes for baseline test and 20 minutes in
the presence of different types of Tergitol. The drying time was 5 minutes. During the tests, it
was observed that, when Tergitol added into the slurry along with air and agitated, the cake
thickness increased from 1- 1.5 mm to 2-4 mm.
Another set of tests were conducted to investigate the effect of foam on a thicker cake.
The tests discussed in the above section were conducted at 2~4 mm thick cake by using 50 ml
slurry. Table 5.9 shows the test results obtained with approximately 5-6 mm thick cake when
100 ml slurry was used for filtration tests in the presence of Tergitol NP-7. As expected, the
increased cake thickness gave higher cake moisture, but the moisture reduction from 43% to
29% is still impressive, giving 33% overall moisture reduction.
Table 5.8 Effect of Tergitol with thick cake (5-6mm) on dewatering of Georgia clay
Reagent
Dosage
(lb/t)
Moisture (%)
0 43.45
1 29.19
5 29.94
10 30.23
Table 5.9 Effect of foam on dewatering of Georgia clay at pH 7.0 when Tergitol NP-7
and NP-9 is used as foam generating agents.
Reagent
Dosage
(lb/t)
Moisture Content (%) pH 7.14
Tergitol (NP-7) Tergitol (NP-9)
0 39.14 38.04
3 26.69 27.01
5 - 26.52
10 26.35 26.11
30 25.52 25.33 Slurry was diluted from 25% to 8%.The measured pH was 7.14. Conditioning time was 5minutes. Applied pressure was 60
Psi. The cake thickness for baseline was 1.5- 2 mm, with reagent 2-4 mm. Cake formation time for baseline was 25 minutes,
with reagent 20-25 minutes. Drying time was 5 minutes
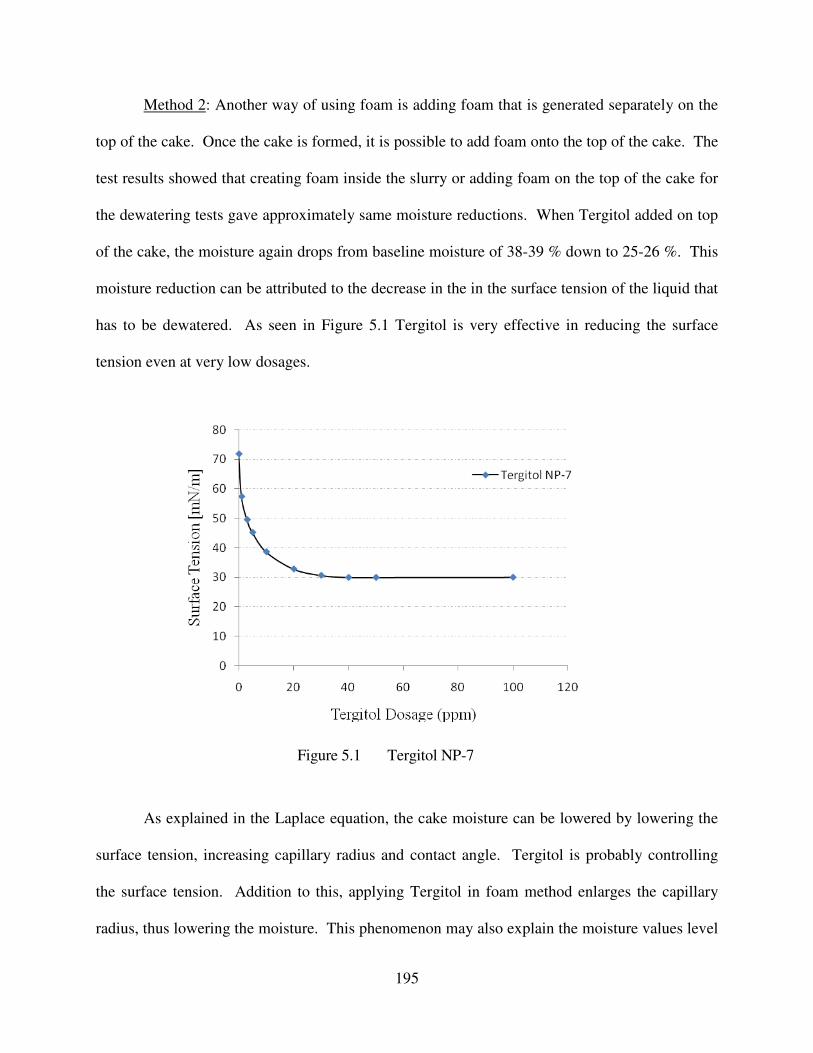
195
Method 2: Another way of using foam is adding foam that is generated separately on the
top of the cake. Once the cake is formed, it is possible to add foam onto the top of the cake. The
test results showed that creating foam inside the slurry or adding foam on the top of the cake for
the dewatering tests gave approximately same moisture reductions. When Tergitol added on top
of the cake, the moisture again drops from baseline moisture of 38-39 % down to 25-26 %. This
moisture reduction can be attributed to the decrease in the in the surface tension of the liquid that
has to be dewatered. As seen in Figure 5.1 Tergitol is very effective in reducing the surface
tension even at very low dosages.
As explained in the Laplace equation, the cake moisture can be lowered by lowering the
surface tension, increasing capillary radius and contact angle. Tergitol is probably controlling
the surface tension. Addition to this, applying Tergitol in foam method enlarges the capillary
radius, thus lowering the moisture. This phenomenon may also explain the moisture values level
Figure 5.1 Tergitol NP-7
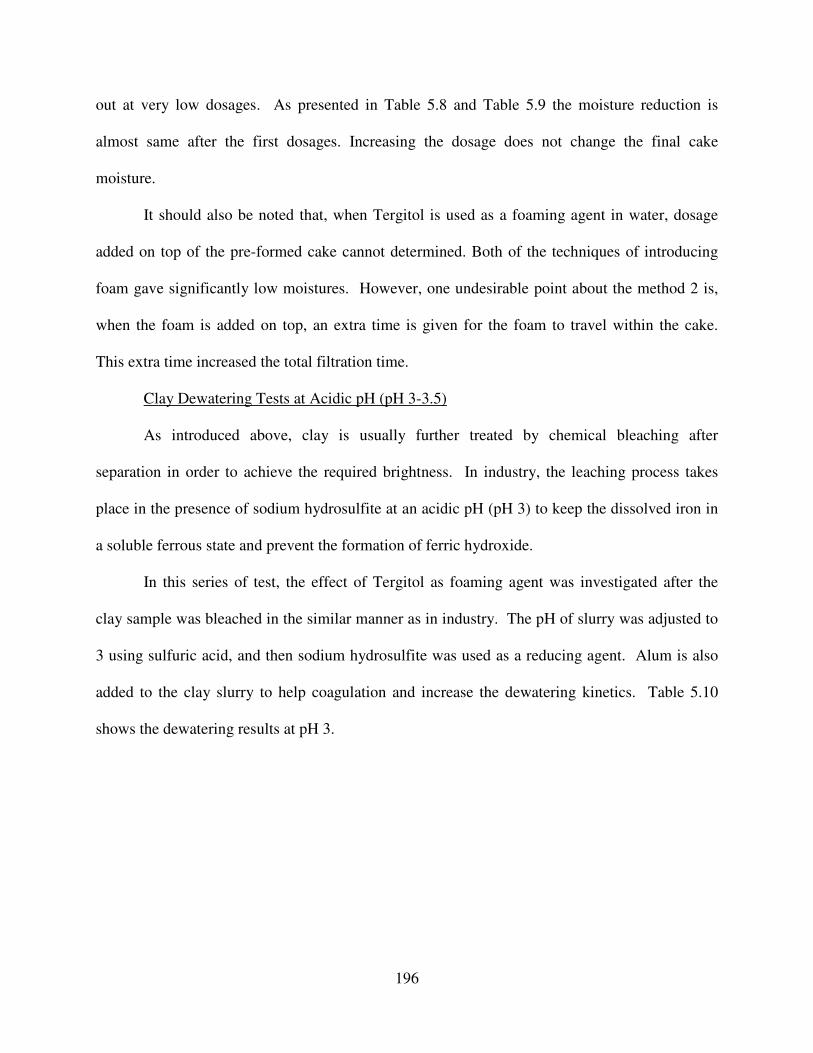
196
out at very low dosages. As presented in Table 5.8 and Table 5.9 the moisture reduction is
almost same after the first dosages. Increasing the dosage does not change the final cake
moisture.
It should also be noted that, when Tergitol is used as a foaming agent in water, dosage
added on top of the pre-formed cake cannot determined. Both of the techniques of introducing
foam gave significantly low moistures. However, one undesirable point about the method 2 is,
when the foam is added on top, an extra time is given for the foam to travel within the cake.
This extra time increased the total filtration time.
Clay Dewatering Tests at Acidic pH (pH 3-3.5)
As introduced above, clay is usually further treated by chemical bleaching after
separation in order to achieve the required brightness. In industry, the leaching process takes
place in the presence of sodium hydrosulfite at an acidic pH (pH 3) to keep the dissolved iron in
a soluble ferrous state and prevent the formation of ferric hydroxide.
In this series of test, the effect of Tergitol as foaming agent was investigated after the
clay sample was bleached in the similar manner as in industry. The pH of slurry was adjusted to
3 using sulfuric acid, and then sodium hydrosulfite was used as a reducing agent. Alum is also
added to the clay slurry to help coagulation and increase the dewatering kinetics. Table 5.10
shows the dewatering results at pH 3.
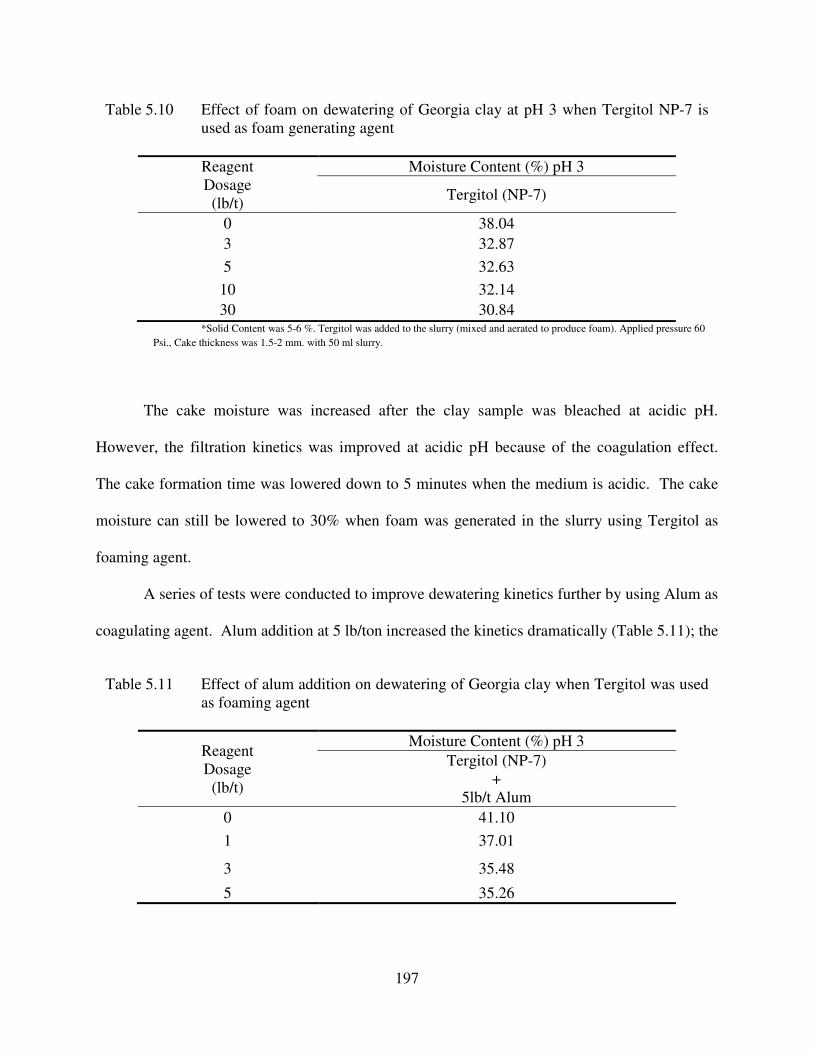
197
The cake moisture was increased after the clay sample was bleached at acidic pH.
However, the filtration kinetics was improved at acidic pH because of the coagulation effect.
The cake formation time was lowered down to 5 minutes when the medium is acidic. The cake
moisture can still be lowered to 30% when foam was generated in the slurry using Tergitol as
foaming agent.
A series of tests were conducted to improve dewatering kinetics further by using Alum as
coagulating agent. Alum addition at 5 lb/ton increased the kinetics dramatically (Table 5.11); the
Table 5.10 Effect of foam on dewatering of Georgia clay at pH 3 when Tergitol NP-7 is
used as foam generating agent
Reagent
Dosage
(lb/t)
Moisture Content (%) pH 3
Tergitol (NP-7)
0 38.04
3 32.87
5 32.63
10 32.14
30 30.84 *Solid Content was 5-6 %. Tergitol was added to the slurry (mixed and aerated to produce foam). Applied pressure 60
Psi., Cake thickness was 1.5-2 mm. with 50 ml slurry.
Table 5.11 Effect of alum addition on dewatering of Georgia clay when Tergitol was used
as foaming agent
Reagent
Dosage
(lb/t)
Moisture Content (%) pH 3
Tergitol (NP-7)
+
5lb/t Alum
0 41.10
1 37.01
3 35.48
5 35.26

198
cake formation time drops down to 50 seconds from 5 minutes, but it also caused slight increase
in cake moisture.
All the cakes were also visually inspected and it was observed that when the foam was
generated in the clay slurry and dewatered, the bubbles left numerous small pockets creating a
flaky structure which is an indication of a drastic increase in porosity.
199
5.3. FLY ASH
5.3.1. Background Information
When coal is burned in a power generation facility or in an industrial boiler, it produces
noncombustible mineral matter called ash. This residue is partitioned into bottom ash (or slag),
and fly ash. Bottom ash is coarse in nature and falls to the bottom of the combustion chamber,
where it is easy to collect during routine cleaning. The properties of bottom ash make it a good
road base and construction material, so it can be readily given away or sold. On the other hand,
fly ash is lighter and very fine in nature, and remains suspended in the flue gas which is not so
easily disposed of. Most fly ash is captured by particulate emission control devices, such as
electrostatic precipitators or filter fabric collectors – commonly referred to as baghouses – before
release to the atmosphere. There are also two other byproducts of coal combustion air control
technologies, namely flue-gas desulfurization (FGD) and fluidized-bed combustion (FBC)
wastes. Collectively, all the residue materials are named as coal combustion products (CCP).[11,
12, 13]
In 2004, approximately 64 million metric tons of fly ash was produced, 25.5 million
metric tons of which were used in a variety of engineering applications. Approximately 61% of
the useable fly ash finds its application as an addition to cement in concrete production.
Depending on the intended final use, quality requirements for fly ash vary. For concrete
applications, there are four important characteristics: loss of ignition (LOI), fineness, chemical
composition and uniformity. LOI is especially critical for concrete application. It is a
measurement of unburned coal (carbon) that remains in the fly ash. Basically, carbon content in
fly ash may result in significant air-entrainment problems in fresh concrete, and it may also
unfavorably affect the durability of concrete.[12, 13, 14] At high LOI, carbon can be either
200
reclaimed or discarded utilizing flotation which is widely demonstrated. Clean fly ash that is
hydrophilic in nature is dewatered to generate a dry product for end use.[12, 14-16]
5.3.2. Two Step Hydrophobization Technique
a) Experimental
Several fly ash samples with various carbon contents were provided for flotation and
dewatering tests. The samples were received from stockpiles at two power plants, one located in
Kentucky and the other in Mexico.
i) Kentucky Fly Ash Samples
• 65 % Ash-35 % Carbon (LOI); (91 % -325 mesh material)
• 100% Fly Ash; (100% -325 material)
Only laboratory dewatering tests were conducted on the above samples, utilizing the two-
step hydrophobization technique previously described.
ii) Mexico Fly Ash Sample
The carbon content (LOI) for this sample ranged from 2.59% to 5.85% with an average
of 4.03% at 10-12 % moisture. The amount of the -100 mesh material was approximately 76%,
the +1 mm was 8%, and the -1mm x 100 mesh was 16%. On this sample a number of flotation
and dewatering tests were conducted to produce clean and dry fly ash product. The tests
included both laboratory and pilot scale tests, described below.
A number of laboratory flotation tests were conducted to lower the LOI using a procedure
that was suggested by the company which supplied the fly ash samples. The samples were
prepared at 25 % solids, and conditioned with the collector (2.67 lb/t) for 8 minutes at 2000 rpm
in Denver cell. This step is designed as a conditioning step. After conditioning, a known
amount of water was added to lower the slurry solid content down to 20%. After frother addition
201
at about 0.18 lb/t, the flotation was initiated at 950 rpm. After 12 minutes of flotation and
sample collection, another 0.67 lb/t of collector was added as the second step and conditioned for
4 more minutes. Right after the mixing the flotation was continued for another 4 minutes and
bulk samples were collected. Subsequent to sample generation, dewatering tests were conducted
using various types and dosages of chemicals.
Pilot scale tests were conducted on the same sample and tests were run to produce clean
fly ash samples for dewatering tests. The general layout of the pilot scale circuitry includes
• A 12” wide fine sieve to classify the raw feed at nominally 100 mesh. The screen feed
was delivered by a pump and buckets from the barrels
• A conical bottom slurry pump, approximately 250 gallons capacity, received the
underflow from the sieve screen. A mixer was used in the sump to aid in keeping the
solids in suspension
• A centrifugal pump to circulate the slurry from the sump to the upper floor level and back
into the sump using 3” diameter PVC piping.
• A bank of 4, 3 cu ft conventional flow-through type flotation cells utilized as primary
cells. Feed to these cells was supplied by a slip stream taken from the 3” diameter pump
discharge pipe.
• A bank of 4, 3 cu ft conventional cell to cell type flotation cells utilizing the first cell as
conditioner (air valve closed) and the remaining cells as secondary cells.
• Barrels were used to collect the floated product and tails product. The tails product was
flocculated in barrels and the water decanted to thicken the product.
• A 2 sq ft, single disc vacuum filter to dewater the thickened product.
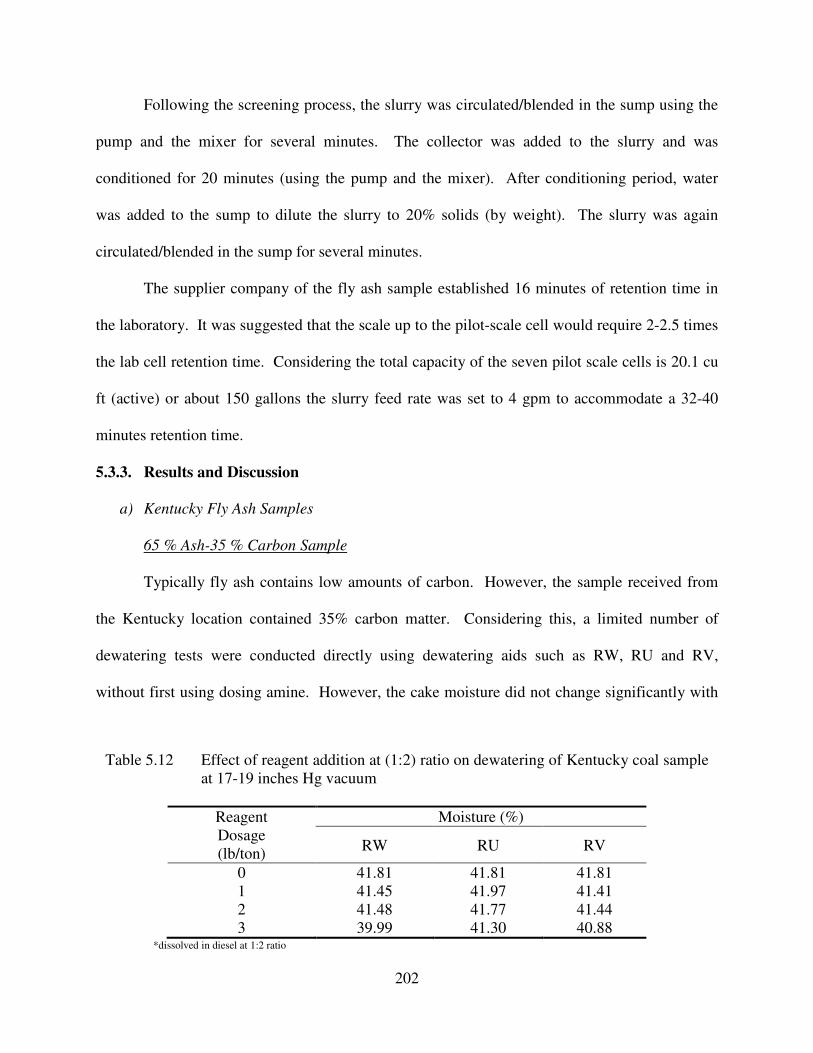
202
Following the screening process, the slurry was circulated/blended in the sump using the
pump and the mixer for several minutes. The collector was added to the slurry and was
conditioned for 20 minutes (using the pump and the mixer). After conditioning period, water
was added to the sump to dilute the slurry to 20% solids (by weight). The slurry was again
circulated/blended in the sump for several minutes.
The supplier company of the fly ash sample established 16 minutes of retention time in
the laboratory. It was suggested that the scale up to the pilot-scale cell would require 2-2.5 times
the lab cell retention time. Considering the total capacity of the seven pilot scale cells is 20.1 cu
ft (active) or about 150 gallons the slurry feed rate was set to 4 gpm to accommodate a 32-40
minutes retention time.
5.3.3. Results and Discussion
a) Kentucky Fly Ash Samples
65 % Ash-35 % Carbon Sample
Typically fly ash contains low amounts of carbon. However, the sample received from
the Kentucky location contained 35% carbon matter. Considering this, a limited number of
dewatering tests were conducted directly using dewatering aids such as RW, RU and RV,
without first using dosing amine. However, the cake moisture did not change significantly with
Table 5.12 Effect of reagent addition at (1:2) ratio on dewatering of Kentucky coal sample
at 17-19 inches Hg vacuum
Reagent
Dosage
(lb/ton)
Moisture (%)
RW RU RV
0 41.81 41.81 41.81
1 41.45 41.97 41.41
2 41.48 41.77 41.44
3 39.99 41.30 40.88 *dissolved in diesel at 1:2 ratio
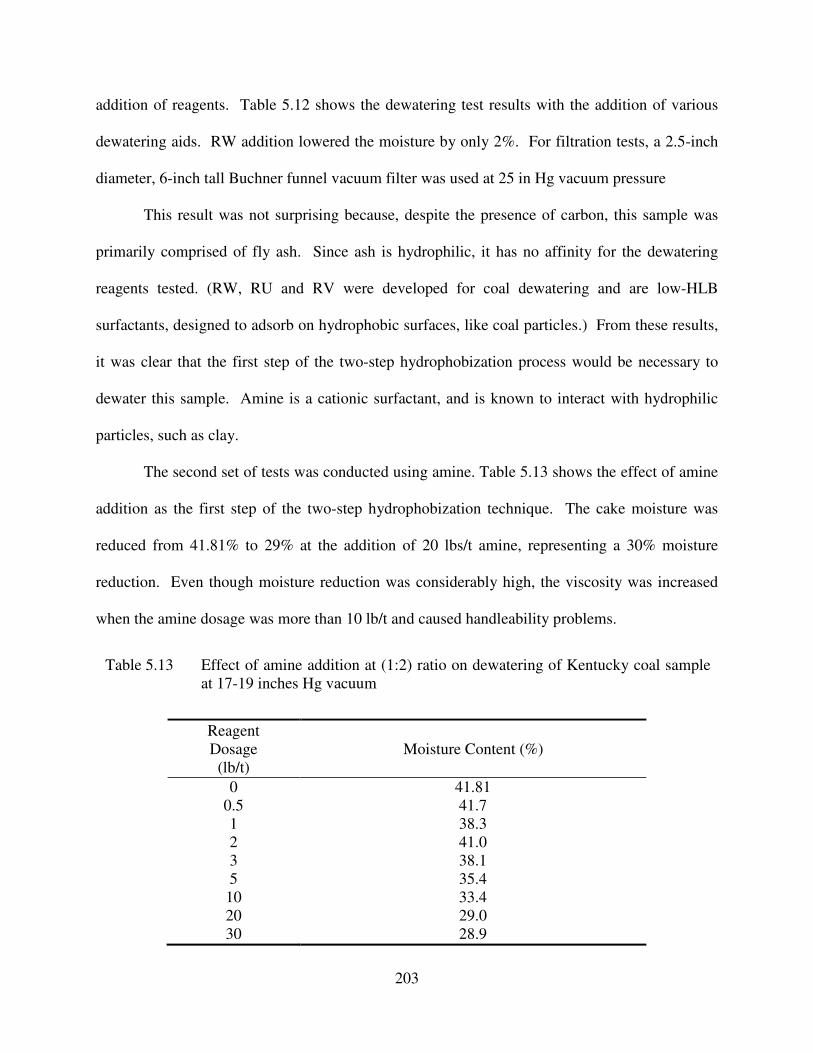
203
addition of reagents. Table 5.12 shows the dewatering test results with the addition of various
dewatering aids. RW addition lowered the moisture by only 2%. For filtration tests, a 2.5-inch
diameter, 6-inch tall Buchner funnel vacuum filter was used at 25 in Hg vacuum pressure
This result was not surprising because, despite the presence of carbon, this sample was
primarily comprised of fly ash. Since ash is hydrophilic, it has no affinity for the dewatering
reagents tested. (RW, RU and RV were developed for coal dewatering and are low-HLB
surfactants, designed to adsorb on hydrophobic surfaces, like coal particles.) From these results,
it was clear that the first step of the two-step hydrophobization process would be necessary to
dewater this sample. Amine is a cationic surfactant, and is known to interact with hydrophilic
particles, such as clay.
The second set of tests was conducted using amine. Table 5.13 shows the effect of amine
addition as the first step of the two-step hydrophobization technique. The cake moisture was
reduced from 41.81% to 29% at the addition of 20 lbs/t amine, representing a 30% moisture
reduction. Even though moisture reduction was considerably high, the viscosity was increased
when the amine dosage was more than 10 lb/t and caused handleability problems.
Table 5.13 Effect of amine addition at (1:2) ratio on dewatering of Kentucky coal sample
at 17-19 inches Hg vacuum
Reagent
Dosage
(lb/t)
Moisture Content (%)
0 41.81
0.5 41.7
1 38.3
2 41.0
3 38.1
5 35.4
10 33.4
20 29.0
30 28.9
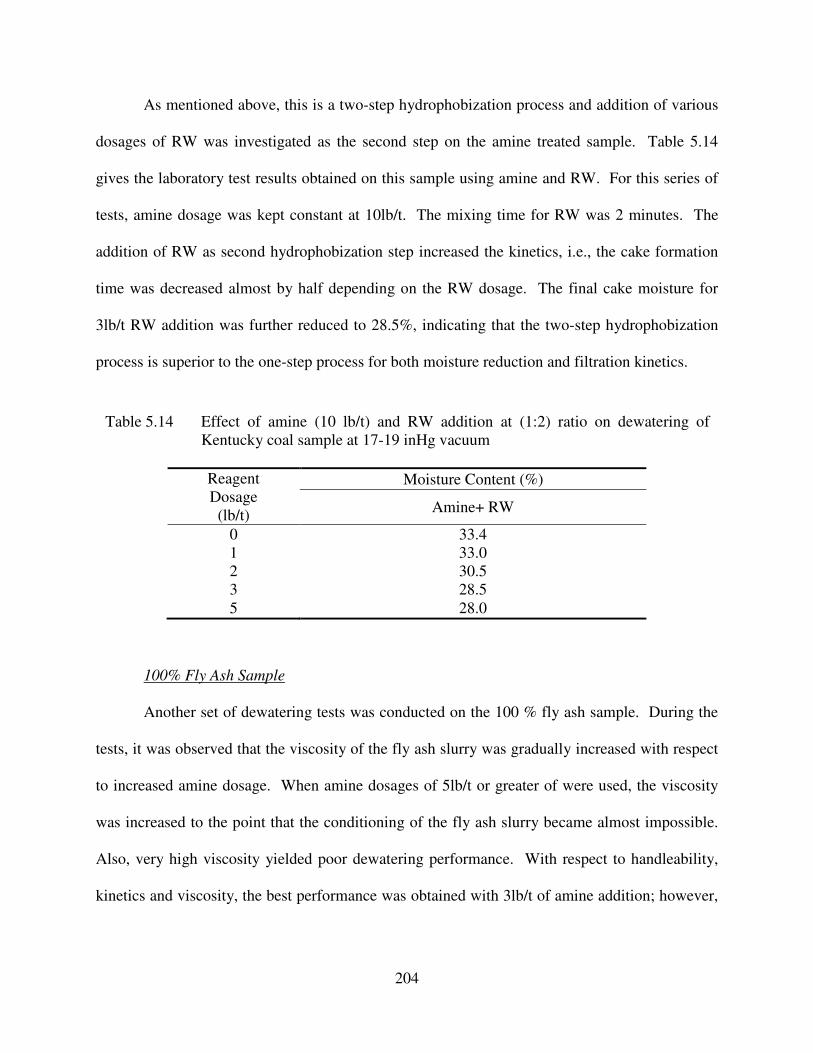
204
As mentioned above, this is a two-step hydrophobization process and addition of various
dosages of RW was investigated as the second step on the amine treated sample. Table 5.14
gives the laboratory test results obtained on this sample using amine and RW. For this series of
tests, amine dosage was kept constant at 10lb/t. The mixing time for RW was 2 minutes. The
addition of RW as second hydrophobization step increased the kinetics, i.e., the cake formation
time was decreased almost by half depending on the RW dosage. The final cake moisture for
3lb/t RW addition was further reduced to 28.5%, indicating that the two-step hydrophobization
process is superior to the one-step process for both moisture reduction and filtration kinetics.
100% Fly Ash Sample
Another set of dewatering tests was conducted on the 100 % fly ash sample. During the
tests, it was observed that the viscosity of the fly ash slurry was gradually increased with respect
to increased amine dosage. When amine dosages of 5lb/t or greater of were used, the viscosity
was increased to the point that the conditioning of the fly ash slurry became almost impossible.
Also, very high viscosity yielded poor dewatering performance. With respect to handleability,
kinetics and viscosity, the best performance was obtained with 3lb/t of amine addition; however,
Table 5.14 Effect of amine (10 lb/t) and RW addition at (1:2) ratio on dewatering of
Kentucky coal sample at 17-19 inHg vacuum
Reagent
Dosage
(lb/t)
Moisture Content (%)
Amine+ RW
0 33.4
1 33.0
2 30.5
3 28.5
5 28.0
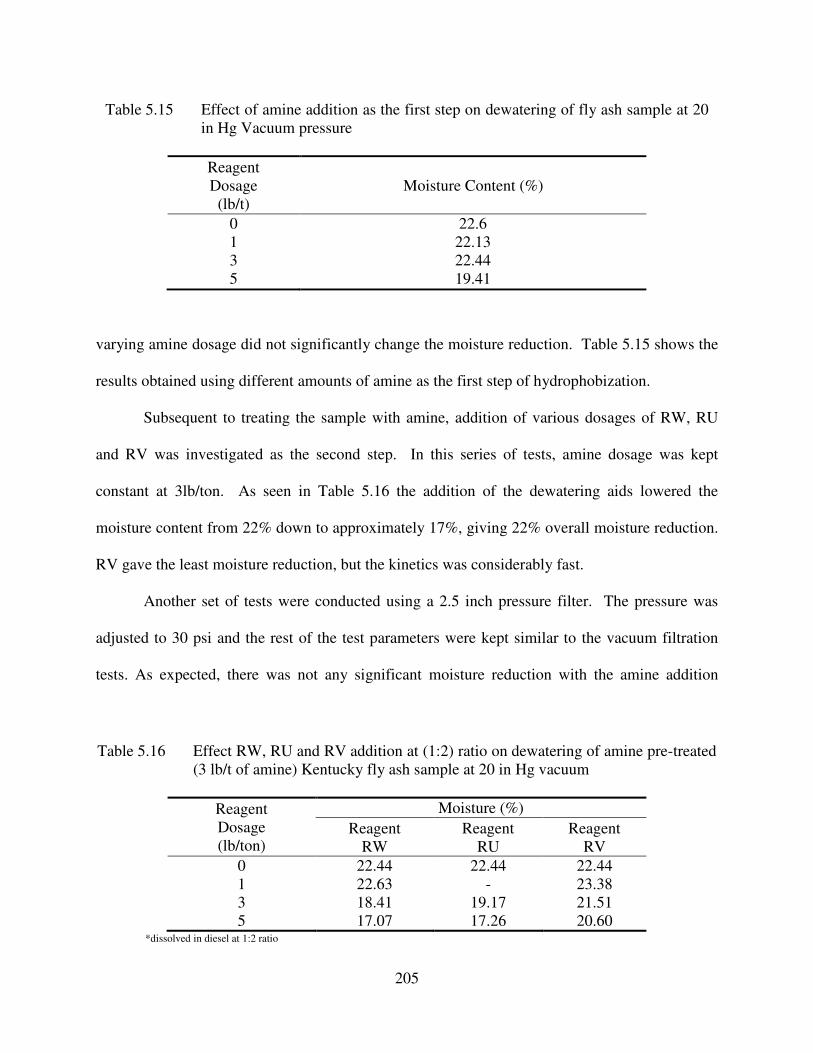
205
varying amine dosage did not significantly change the moisture reduction. Table 5.15 shows the
results obtained using different amounts of amine as the first step of hydrophobization.
Subsequent to treating the sample with amine, addition of various dosages of RW, RU
and RV was investigated as the second step. In this series of tests, amine dosage was kept
constant at 3lb/ton. As seen in Table 5.16 the addition of the dewatering aids lowered the
moisture content from 22% down to approximately 17%, giving 22% overall moisture reduction.
RV gave the least moisture reduction, but the kinetics was considerably fast.
Another set of tests were conducted using a 2.5 inch pressure filter. The pressure was
adjusted to 30 psi and the rest of the test parameters were kept similar to the vacuum filtration
tests. As expected, there was not any significant moisture reduction with the amine addition
Table 5.16 Effect RW, RU and RV addition at (1:2) ratio on dewatering of amine pre-treated
(3 lb/t of amine) Kentucky fly ash sample at 20 in Hg vacuum
Reagent
Dosage
(lb/ton)
Moisture (%)
Reagent
RW
Reagent
RU
Reagent
RV
0 22.44 22.44 22.44
1 22.63 - 23.38
3 18.41 19.17 21.51
5 17.07 17.26 20.60 *dissolved in diesel at 1:2 ratio
Table 5.15 Effect of amine addition as the first step on dewatering of fly ash sample at 20
in Hg Vacuum pressure
Reagent
Dosage
(lb/t)
Moisture Content (%)
0 22.6
1 22.13
3 22.44
5 19.41
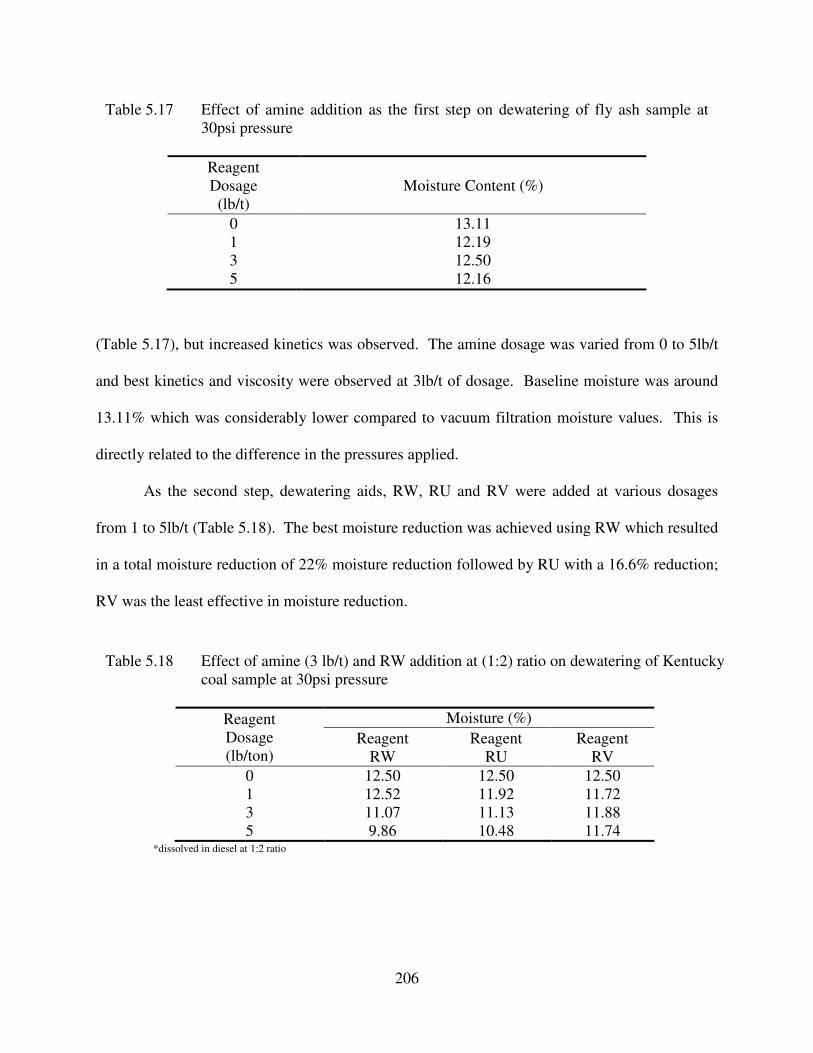
206
(Table 5.17), but increased kinetics was observed. The amine dosage was varied from 0 to 5lb/t
and best kinetics and viscosity were observed at 3lb/t of dosage. Baseline moisture was around
13.11% which was considerably lower compared to vacuum filtration moisture values. This is
directly related to the difference in the pressures applied.
As the second step, dewatering aids, RW, RU and RV were added at various dosages
from 1 to 5lb/t (Table 5.18). The best moisture reduction was achieved using RW which resulted
in a total moisture reduction of 22% moisture reduction followed by RU with a 16.6% reduction;
RV was the least effective in moisture reduction.
Table 5.18 Effect of amine (3 lb/t) and RW addition at (1:2) ratio on dewatering of Kentucky
coal sample at 30psi pressure
Reagent
Dosage
(lb/ton)
Moisture (%)
Reagent
RW
Reagent
RU
Reagent
RV
0 12.50 12.50 12.50
1 12.52 11.92 11.72
3 11.07 11.13 11.88
5 9.86 10.48 11.74 *dissolved in diesel at 1:2 ratio
Table 5.17 Effect of amine addition as the first step on dewatering of fly ash sample at
30psi pressure
Reagent
Dosage
(lb/t)
Moisture Content (%)
0 13.11
1 12.19
3 12.50
5 12.16
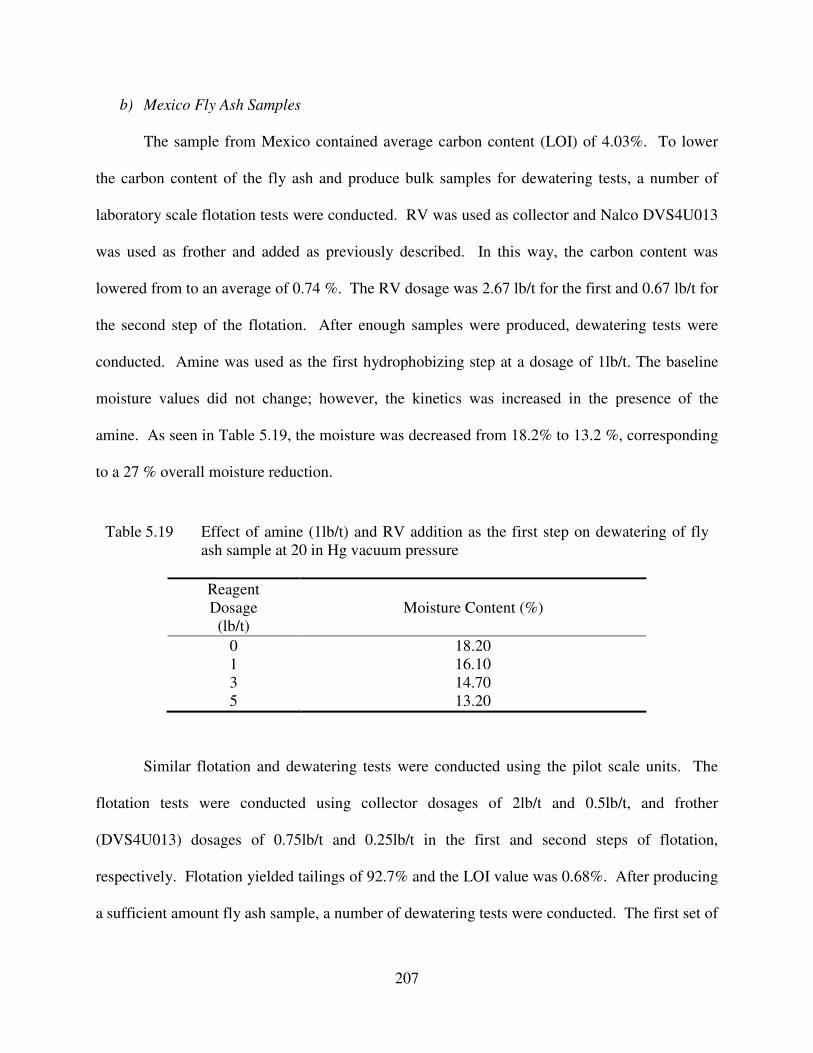
207
b) Mexico Fly Ash Samples
The sample from Mexico contained average carbon content (LOI) of 4.03%. To lower
the carbon content of the fly ash and produce bulk samples for dewatering tests, a number of
laboratory scale flotation tests were conducted. RV was used as collector and Nalco DVS4U013
was used as frother and added as previously described. In this way, the carbon content was
lowered from to an average of 0.74 %. The RV dosage was 2.67 lb/t for the first and 0.67 lb/t for
the second step of the flotation. After enough samples were produced, dewatering tests were
conducted. Amine was used as the first hydrophobizing step at a dosage of 1lb/t. The baseline
moisture values did not change; however, the kinetics was increased in the presence of the
amine. As seen in Table 5.19, the moisture was decreased from 18.2% to 13.2 %, corresponding
to a 27 % overall moisture reduction.
Similar flotation and dewatering tests were conducted using the pilot scale units. The
flotation tests were conducted using collector dosages of 2lb/t and 0.5lb/t, and frother
(DVS4U013) dosages of 0.75lb/t and 0.25lb/t in the first and second steps of flotation,
respectively. Flotation yielded tailings of 92.7% and the LOI value was 0.68%. After producing
a sufficient amount fly ash sample, a number of dewatering tests were conducted. The first set of
Table 5.19 Effect of amine (1lb/t) and RV addition as the first step on dewatering of fly
ash sample at 20 in Hg vacuum pressure
Reagent
Dosage
(lb/t)
Moisture Content (%)
0 18.20
1 16.10
3 14.70
5 13.20
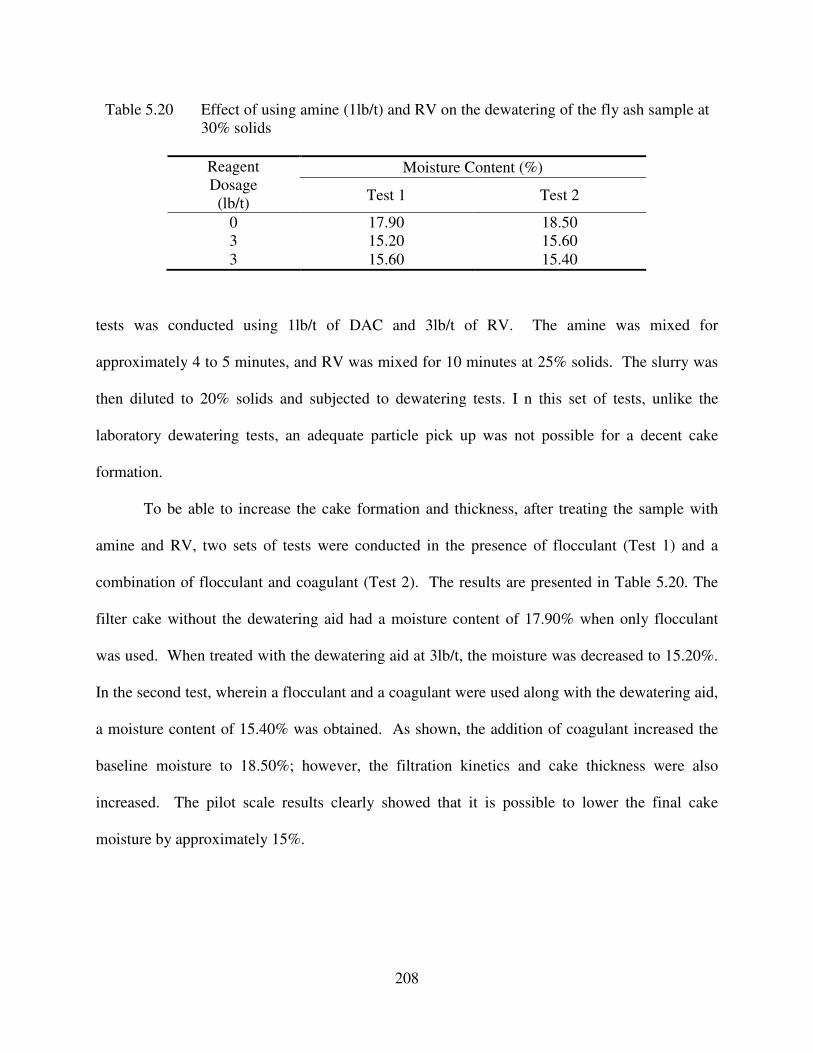
208
tests was conducted using 1lb/t of DAC and 3lb/t of RV. The amine was mixed for
approximately 4 to 5 minutes, and RV was mixed for 10 minutes at 25% solids. The slurry was
then diluted to 20% solids and subjected to dewatering tests. I n this set of tests, unlike the
laboratory dewatering tests, an adequate particle pick up was not possible for a decent cake
formation.
To be able to increase the cake formation and thickness, after treating the sample with
amine and RV, two sets of tests were conducted in the presence of flocculant (Test 1) and a
combination of flocculant and coagulant (Test 2). The results are presented in Table 5.20. The
filter cake without the dewatering aid had a moisture content of 17.90% when only flocculant
was used. When treated with the dewatering aid at 3lb/t, the moisture was decreased to 15.20%.
In the second test, wherein a flocculant and a coagulant were used along with the dewatering aid,
a moisture content of 15.40% was obtained. As shown, the addition of coagulant increased the
baseline moisture to 18.50%; however, the filtration kinetics and cake thickness were also
increased. The pilot scale results clearly showed that it is possible to lower the final cake
moisture by approximately 15%.
Table 5.20 Effect of using amine (1lb/t) and RV on the dewatering of the fly ash sample at
30% solids
Reagent
Dosage
(lb/t)
Moisture Content (%)
Test 1 Test 2
0 17.90 18.50
3 15.20 15.60
3 15.60 15.40
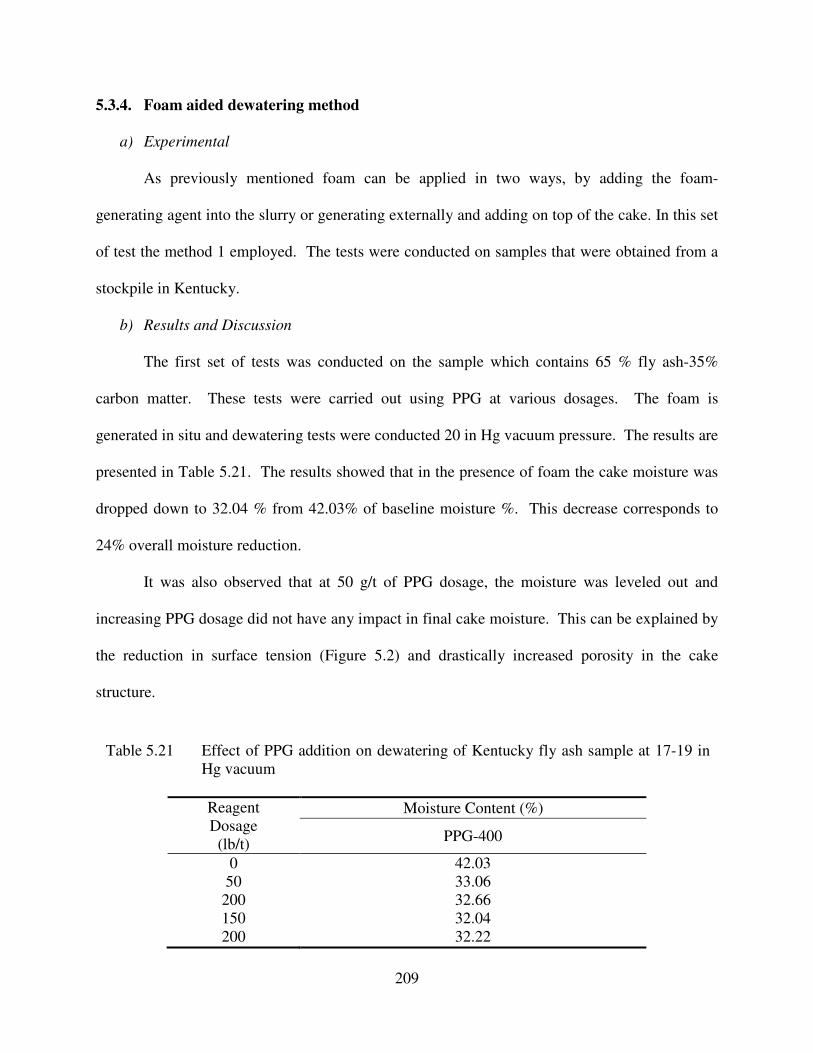
209
5.3.4. Foam aided dewatering method
a) Experimental
As previously mentioned foam can be applied in two ways, by adding the foam-
generating agent into the slurry or generating externally and adding on top of the cake. In this set
of test the method 1 employed. The tests were conducted on samples that were obtained from a
stockpile in Kentucky.
b) Results and Discussion
The first set of tests was conducted on the sample which contains 65 % fly ash-35%
carbon matter. These tests were carried out using PPG at various dosages. The foam is
generated in situ and dewatering tests were conducted 20 in Hg vacuum pressure. The results are
presented in Table 5.21. The results showed that in the presence of foam the cake moisture was
dropped down to 32.04 % from 42.03% of baseline moisture %. This decrease corresponds to
24% overall moisture reduction.
It was also observed that at 50 g/t of PPG dosage, the moisture was leveled out and
increasing PPG dosage did not have any impact in final cake moisture. This can be explained by
the reduction in surface tension (Figure 5.2) and drastically increased porosity in the cake
structure.
Table 5.21 Effect of PPG addition on dewatering of Kentucky fly ash sample at 17-19 in
Hg vacuum
Reagent
Dosage
(lb/t)
Moisture Content (%)
PPG-400
0 42.03
50 33.06
200 32.66
150 32.04
200 32.22
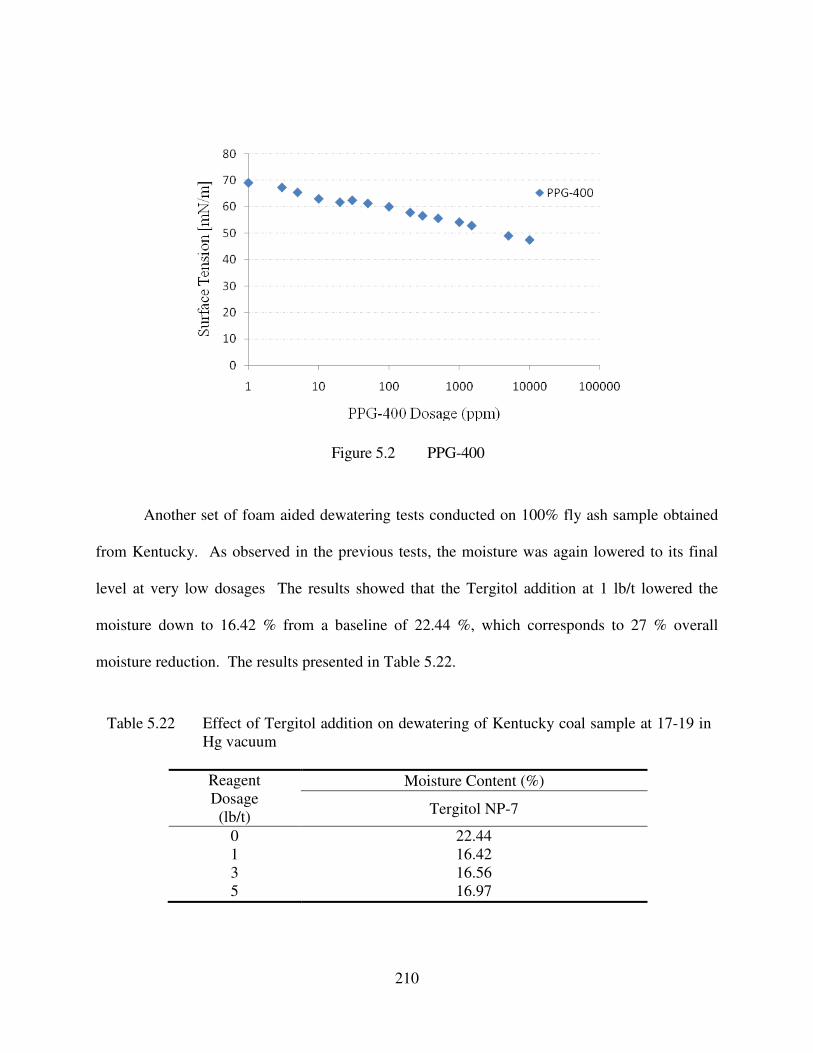
210
Another set of foam aided dewatering tests conducted on 100% fly ash sample obtained
from Kentucky. As observed in the previous tests, the moisture was again lowered to its final
level at very low dosages The results showed that the Tergitol addition at 1 lb/t lowered the
moisture down to 16.42 % from a baseline of 22.44 %, which corresponds to 27 % overall
moisture reduction. The results presented in Table 5.22.
Table 5.22 Effect of Tergitol addition on dewatering of Kentucky coal sample at 17-19 in
Hg vacuum
Reagent
Dosage
(lb/t)
Moisture Content (%)
Tergitol NP-7
0 22.44
1 16.42
3 16.56
5 16.97
Figure 5.2 PPG-400
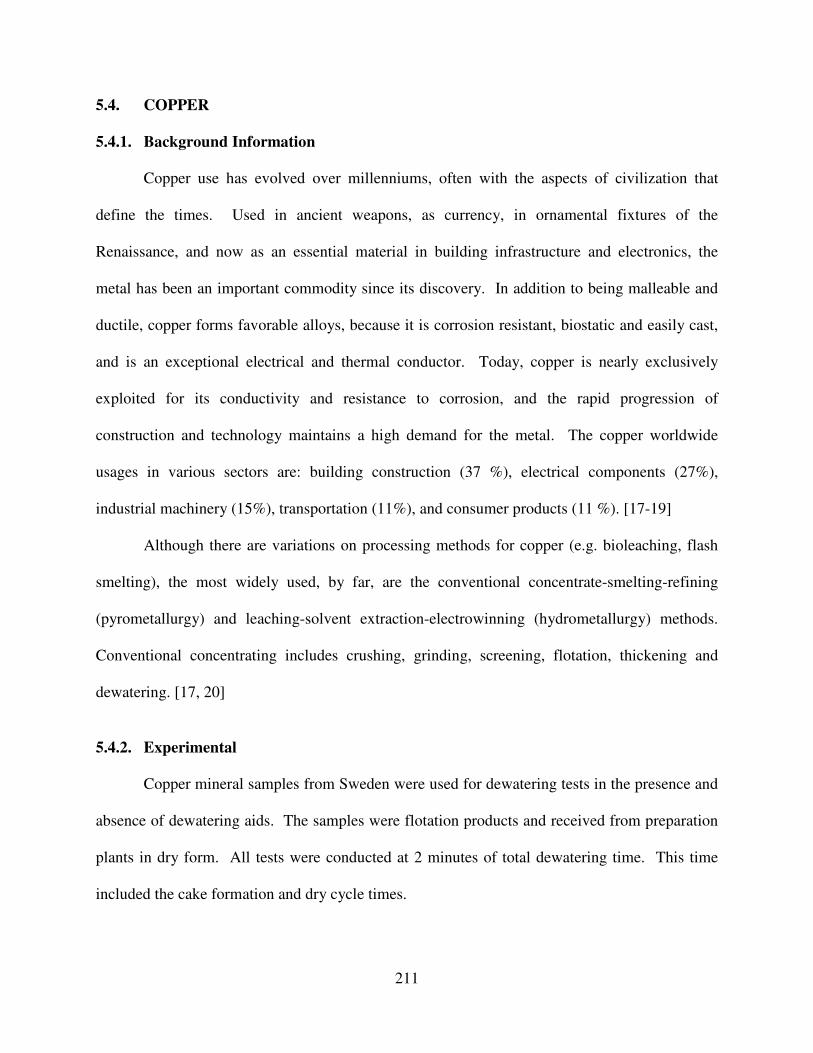
211
5.4. COPPER
5.4.1. Background Information
Copper use has evolved over millenniums, often with the aspects of civilization that
define the times. Used in ancient weapons, as currency, in ornamental fixtures of the
Renaissance, and now as an essential material in building infrastructure and electronics, the
metal has been an important commodity since its discovery. In addition to being malleable and
ductile, copper forms favorable alloys, because it is corrosion resistant, biostatic and easily cast,
and is an exceptional electrical and thermal conductor. Today, copper is nearly exclusively
exploited for its conductivity and resistance to corrosion, and the rapid progression of
construction and technology maintains a high demand for the metal. The copper worldwide
usages in various sectors are: building construction (37 %), electrical components (27%),
industrial machinery (15%), transportation (11%), and consumer products (11 %). [17-19]
Although there are variations on processing methods for copper (e.g. bioleaching, flash
smelting), the most widely used, by far, are the conventional concentrate-smelting-refining
(pyrometallurgy) and leaching-solvent extraction-electrowinning (hydrometallurgy) methods.
Conventional concentrating includes crushing, grinding, screening, flotation, thickening and
dewatering. [17, 20]
5.4.2. Experimental
Copper mineral samples from Sweden were used for dewatering tests in the presence and
absence of dewatering aids. The samples were flotation products and received from preparation
plants in dry form. All tests were conducted at 2 minutes of total dewatering time. This time
included the cake formation and dry cycle times.
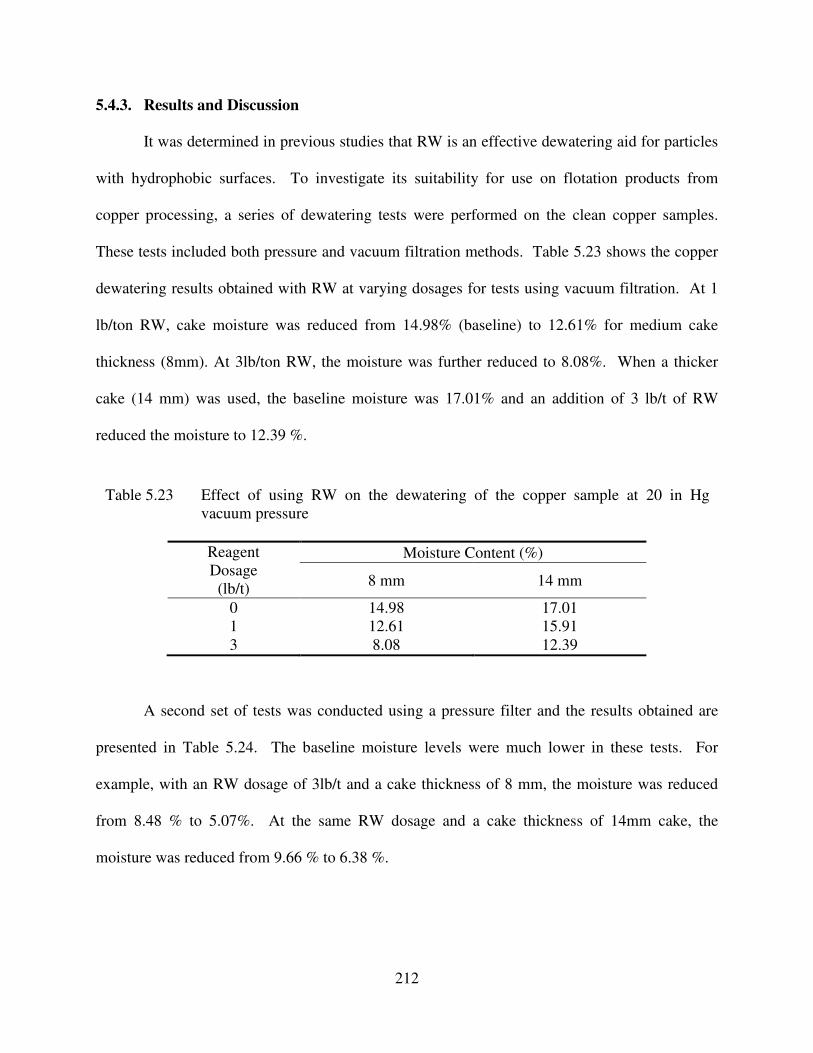
212
5.4.3. Results and Discussion
It was determined in previous studies that RW is an effective dewatering aid for particles
with hydrophobic surfaces. To investigate its suitability for use on flotation products from
copper processing, a series of dewatering tests were performed on the clean copper samples.
These tests included both pressure and vacuum filtration methods. Table 5.23 shows the copper
dewatering results obtained with RW at varying dosages for tests using vacuum filtration. At 1
lb/ton RW, cake moisture was reduced from 14.98% (baseline) to 12.61% for medium cake
thickness (8mm). At 3lb/ton RW, the moisture was further reduced to 8.08%. When a thicker
cake (14 mm) was used, the baseline moisture was 17.01% and an addition of 3 lb/t of RW
reduced the moisture to 12.39 %.
A second set of tests was conducted using a pressure filter and the results obtained are
presented in Table 5.24. The baseline moisture levels were much lower in these tests. For
example, with an RW dosage of 3lb/t and a cake thickness of 8 mm, the moisture was reduced
from 8.48 % to 5.07%. At the same RW dosage and a cake thickness of 14mm cake, the
moisture was reduced from 9.66 % to 6.38 %.
Table 5.23 Effect of using RW on the dewatering of the copper sample at 20 in Hg
vacuum pressure
Reagent
Dosage
(lb/t)
Moisture Content (%)
8 mm 14 mm
0 14.98 17.01
1 12.61 15.91
3 8.08 12.39
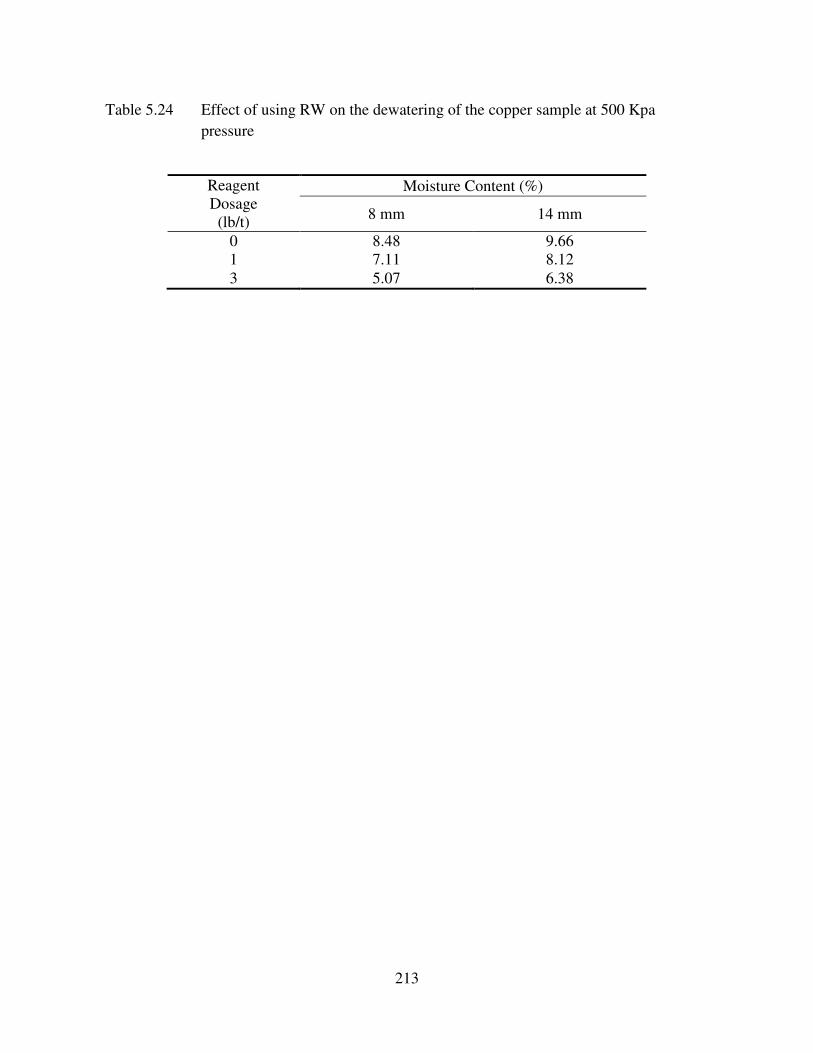
213
Table 5.24 Effect of using RW on the dewatering of the copper sample at 500 Kpa
pressure
Reagent
Dosage
(lb/t)
Moisture Content (%)
8 mm 14 mm
0 8.48 9.66
1 7.11 8.12
3 5.07 6.38
214
5.5. SUMMARY AND CONCLUSIONS
Dewatering tests were conducted to effectively reduce moisture content in kaolin clay,
copper and fly ash samples. The experimental work included a variety of parameters (e.g.,
vacuum and air pressure, cake thickness, pH, and LOI) and two new dewatering techniques were
utilized: a two-step hydrophobization method using novel dewatering aids, and a foam-aided
dewatering method.
Kaolin clay is one of the most difficult minerals to dewater due to hydrophilic nature and
ultrafine particle size. It has been shown that kaolin clay samples can be dewatered using both of
the new methods. Two-step hydrophobization was tested on samples with various pH values.
During pressure filtration (60psi) tests on Thiele’s clay samples (pH 7), the moisture was
lowered from 39.14% to 31.90% and 28.33% when using amine and Reagent W, respectively.
This corresponds to approximately 28% overall moisture reduction. Using amine and RW
together, the kinetics were also increased such that the cake formation time was lowered from 25
minutes to 3-5 minutes, for a cake thickness of 2-4 mm at 60psi. The results showed that the
slurry pH and the solid content are two very important parameters when using two step
hydrophobization methods.
It was confirmed that the two-step hydrophobization method can also be very effective in
vacuum filtration when the slurry is diluted. For PSD Filter Vat kaolin clay sample diluted to
15% solids, it is possible to lower the final cake moisture by 16% at pH 4.5 and 31% at pH 7.
Foam-aided dewatering may be applied using two different methods. The foam can either
be generated in the slurry or added on top of the filter cake separately. Tergitol was used as the
foam generating agent. The results confirmed that, when the final cake moistures are considered,
both methods of foam application gave the same moisture reductions. However, considering the
215
filtration time constraints, it was found to be more favorable to generate foam in the slurry. The
foam-aided dewatering test results also showed that very low dosages of Tergitol addition
lowered the final cake moisture by 19% at pH 3 and 35% at pH 7. Also, Alum can be used to
increase the filtration kinetics, even though it may cause a slight increase in final cake moisture.
For example, in one test, cake formation time was lowered from 5 minutes to 50 seconds.
In addition to utilizing the above methods in clay dewatering, similar tests were
conducted on various fly ash samples. These test results have shown that depending on the fly
ash properties, the two-step hydrophobization method is significantly effective in reducing the
final cake moisture and increasing the dewatering kinetics. For samples obtained from
Kentucky, it was possible to lower the overall cake moisture by 24-32 % in vacuum filtration and
11-24 % in pressure filtration.
Dewatering tests utilizing two-step hydrophobization conducted on another fly ash
sample from Mexico confirmed similar results. This sample was treated with 1 lb/t of amine and
3lb/t of RV. The tests were conducted using a 2.5-inch diameter, 6-inch tall Buchner funnel
vacuum filter, operated at vacuum pressure of 25 inches of Hg. The moisture was decreased
from 18.2% to 13.2%, corresponding to a 27% overall moisture reduction. A brief study was
also conducted using a pilot-scale vacuum disc filter. The results showed that a 15-17%
moisture reduction was obtained when the two-step hydrophobization method was used in the
presence of dewatering aids.
The foam-aided dewatering method was tested on various fly ash samples. PPG-400 and
Tergitol were used to produce foam. At low dosages of these foaming agents, the final cake
moisture was lowered by 23-27% when the foam was generated in-situ. This confirms that high
moisture reductions are obtainable with relatively low dosages of foaming agents.
216
Novel dewatering aids were also tested on (hydrophobic) copper samples in both vacuum
and pressure filtration tests. The vacuum filtration tests results showed that 45% and 30%
overall moisture reduction can be obtained at 8mm and 14mm cake thicknesses, respectively.
The pressure filtration tests showed that the moisture can be lowered to 5% and 6.3% at 8mm
and 14 mm cake thicknesses, respectively.
Overall, both the two-step hydrophobization and foam-aided dewatering methods are
capable of reducing the moisture of several mineral types to levels which cannot be achieved
with current mechanical techniques. As well, the experimental results showed that the kinetics
are also increased drastically when these methods are employed, which in turn increases the
throughput of a filter unit.
217
5.6. REFERENCES
1. Elzea Kegel, Industrial Minerals and Rocks, Commodities, Markets and Uses, SME
2006, 7th
edition
2. USGS-Mineral Commodity Summaries – Clays 2008
Available from: http://minerals.usgs.gov/minerals/pubs/commodity/clays/mcs-2008-
clays.pdf)
3. Michael L. Zientek and Greta J. Orris, USGS-Geology and Nonfuel Mineral Deposits of
the United States,Open-File Report 2005-1294A
Available from: http://pubs.usgs.gov/of/2005/1294/a/of2005-1294a.pdf)
4. Yildirim, I., "Surface Free Energy Characterization of Powders", Ph.D. dissertation,
Virginia Tech, April 2001.
5. Roe-Hoan Yoon and Joseph Shi, Processing of Kaolin Clay, 1986
6. Professor Haydn Murray, Industrial Clays Case Study, March 2002 No64 MMSD,
Indiana University
7. Robert L. Virta, Clay and Shale, USGS-2006 Minerals Yearbook, 2008
8. Rushton, A., Ward, A.S. and Holdich, R.G., Solid-Liquid Filtration and Separation
Technology",VCH, New York, 2000.
9. San, O. and Hosten, C., Filtration Behavior of Flocculated Kaolin Slurries", Proceedings
of the 6th International Mineral Processing Symposium, Turkey, 655-660, 1996.
10. Basilio, C.I., Recent Advances in the Processing of Kaolin", Thiele Kaolin Company,
11. American Coal Council & American Coal Ash Association, Coal Ash Fact Sheet 2005,
Available from: www.acaa-usa.org
12. American Coal Ash Association, Fly Ash Facts for highway Engineers, Technical report
(FHWA-IF-03-019), 2003
13. W. Lee Daniels, Barry Stewart, Kathryn Haering, and Carl Zipper, The Potential for
Beneficial Reuse of Coal Fly Ash in Southwest Virginia Mining Environments, Virginia
Cooperative Extension Publication (460-134) 2002
14. Kelly, T.D., and Matos, G.R., Sullivan D.E., Historical Statistics for Mineral and
Material Commodities in the United States: U.S. Geological Survey Data Series 140,
Available from: http://pubs.usgs.gov/ds/2005/140/.
218
15. M.Niewiadomski, J.Hupka, J.D.Miller, Flotation of Fine Coal Particles From Fly Ash ,
Fizyochemiczne Problemy Mineralurgii, 31 (1997), 221-228
16. Paul H. Zandhuis, Michael V. Ciocco, Richard P. Killmeyer, McMahan L. Gray, Yee
Soong, Technique for Determining the Potential Recovery of Carbon from Fly ash,
NETL 2001 Conference on Unburned carbon (UBC) on Utility Fly Ash
17. Copper Development Association, Inc., Copper Supply and Consumption, Annual Data
2004
18. Lugaski, Thomas P., Copper: The Red Metal, University of Nevada, Reno, NV, 1997.
19. Phelps Dodge Corporation, 2004 Annual Report, Phoenix, AZ, 2004.
20. U.S. Geological Survey, Mineral Commodity Summaries, USGS, Reston, VA, January
2005.
219
CHAPTER 6 CONCLUSIONS
In the preceding chapters, the results of the dewatering test work have been discussed to
determine the effectiveness of using novel dewatering aids for reducing the moisture of the fine
coal and other mineral products. Overall, the aids can provide an economically feasible means
of dewatering fine particles, often producing more desirable results than can be achieved by
mechanical means alone. Additionally, a completely new dewatering method – foam-aided
dewatering – was developed and tested, also with favorable results. This chapter summarizes the
general conclusions from these investigations.
Laboratory- and pilot-scale dewatering tests were conducted on various fine coal samples
to do engineering evaluations of the novel dewatering aids. The aids were capable of increasing
the contact angle and lowering the surface tension of the water, while increasing the capillary
radius, all of which are responsible lowering the final cake moistures. The evaluation tests were
conducted using different types and dosages of the novel dewatering aids while varying
operating parameters. A Buchner Funnel vacuum filter and an air pressure filters were used for
laboratory tests while a vacuum disc filter (VDF) and a horizontal belt filter (HBF) were utilized
for pilot-scale tests. Laboratory test results showed that the use of dewatering aids can
substantially decrease the final cake moisture by as much as 50%, while increasing the
dewatering kinetics by 30-50%. Due to the improvements in moisture reduction and increased
kinetics, it was estimated that the Mingo Logan Preparation Plant can realize additional annual
net revenue of $1.57 million with a payback time of 3.1 years.
Other results also indicated that adequate conditioning time and intensity are critical to
obtain desired moisture reductions. Thus, mixing should be optimized. In one test, moisture
220
reduction was around 36% after proper conditioning as compared to 19% when the conditioning
was not sufficient. For this reason, for both laboratory- and pilot-scale test work, conditioning
tanks were used.
A number of tests were conducted using the dewatering aids as collectors where
conditioning was not possible. When the reagent dosage was only 50% of a normal diesel
dosage, it was observed that coal recovery was increased and the moisture was lowered by 7%.
In the pilot-scale tests, when the reagent dosage was the same as diesel, the moisture reduction
was further reduced, giving a 14% overall reduction in addition to increased kinetics.
At the Buchanan coal preparation plant, VA, the use of novel dewatering aids improved
both the moisture reduction and throughput, although the moisture reduction was less than
anticipated. This was primarily due to water chemistry and possibly due to insufficient
conditioning, which may have negatively affected the performance. The plant water had large
amounts of Ca2+
ions, and conditioner was not equipped with a properly-sized impeller.
An empirical scale-up model was developed to predict final moistures under a given set
of operating conditions i.e. the reagent type and dosage, filtration time, vacuum pressure, and
cake weight. The model was for the scale-up of vacuum disc filters and horizontal belt filters.
The model shows that dewatering aids can be most effective when used in conjunction with a
HBF which allows control of cake thickness and drying cycle time independently.
The benefits of using the novel dewatering aids have been demonstrated in full-scale at
the Smith Branch impoundment site. In the full-scale operation, the total moisture content was
reduced from 26% to 20% at a reagent dosage of approximately 0.5 lb/ton, and further to 17.5%
at approximately 1 lb/ton; this represents a total moisture reduction of nearly 33%. The use of
221
the dewatering aids also reduced the power consumption by 30% for the vacuum disc filter.
Furthermore, the use of the novel dewatering aids improved handlability of the coal.
Two new dewatering techniques were tested for minerals that are hydrophilic in nature: a
two-step hydrophobization method using novel dewatering aids, and a foam-aided dewatering
method. The results showed that the use of these new dewatering methods can effectively reduce
the moisture contents in kaolin clay and fly ash samples
The two-step hydrophobization process was tested on kaolin clay samples at different pH
and solids contents. A pressure filtration test conducted at 60 psi showed that substantial
moisture reductions could be obtained. Using the addition of amine at the first hydrophobization
step and a novel dewatering aid at the second hydrophobization step, the moisture was reduced
and the kinetics were increased. It was confirmed that the two-step hydrophobization method
can also be very effective in vacuum filtration when the clay slurry is diluted.
The foam-aided dewatering method can be implemented in two different ways. The foam
can either be generated in the slurry or added on top of the filter cake separately. Even though
both of the methods are very effective in reducing the cake moisture, when considering filtration
time constraints, it was found that generating the foam in the slurry is more favorable. Test
results showed that significant moisture reductions could be obtained in a wide range of slurry
pH values.
Similar dewatering tests were also conducted on different fly ash samples. These test
results have shown that depending on the fly ash properties, the two-step hydrophobization
method is effective in reducing the final cake moisture and increasing the dewatering kinetics.
222
Additionally, the foam-aided dewatering method was tested on various fly ash samples. It was
confirmed that high moisture reductions are obtainable with relatively low dosages of foaming
agents.
Novel dewatering aids were also tested on copper samples in both vacuum and pressure
filtration tests. The vacuum filtration test results showed that 30-45% overall moisture reduction
can be obtained depending on the cake thicknesses. The pressure filtration tests showed that, in
the presence of dewatering aids, the moisture can be lowered to 5% and 6.3% at 8 mm and 14
mm cake thicknesses, respectively.
Overall, test results clearly showed that when operating parameters are optimized, use of
novel dewatering aids can generate substantial moisture reductions in mechanical dewatering.
Additionally, the dewatering kinetics can be increased, which in turn should increase the
throughput of filter operations. The dewatering aids can also be used as collectors where
installation of a conditioner is not possible. They not only produce similar or better results than
conventional collectors, but also lower moisture contents. Both the two-step hydrophobization
and foam-aided dewatering methods are capable of reducing the moistures of ultrafine mineral
particles that are difficult to be dewatered using the currently available mechanical dewatering
devices.
223
FUTURE WORK
In view of the results and conclusions of the experimental work included in this dissertation,
some recommendations regarding potential future work are provided below:
• Novel dewatering aids were successfully tested on fine coal and significant moisture
reductions were obtained. The dewatering aids effectively increased the hydrophobicity
of the coal surface. The same approach could also be applied to coarse coal, i.e., 2 inches
x 2 mm size. Typically, after density separation, the coarse coal is spray-washed and fed
to dewatering screens to remove excess water. At this stage the novel dewatering aids
might be sprayed on the coal travelling on the screen. To increase the effectiveness of
the dewatering aids for coarse coal application, an appropriate surface tension reducing
agent might also be blended with dewatering aid.
• The novel dewatering aids are water insoluble and needs a certain amount of
conditioning. Test results confirmed that conditioning intensity and time are two
important parameters for dewatering aid dispersion and adsorption. In laboratory- and
pilot-scale tests, the proper conditioning was supplied by in-house build mixing tanks.
However, conditioning in this way may not be possible for full-scale applications.
Alternatively, inline mixers might be investigated to properly condition the dewatering
aids for real operations. It would be very beneficial to conduct dewatering tests to
investigate the effect of different types of inline mixers at various solid contents and flow
rates.
224
• A two-step hydrophobization dewatering technique was successfully tested in the
laboratory on clay samples. The results confirmed that significant moisture reductions
and increased kinetics can be obtained. To be able to confirm the moisture reductions
that were obtained in laboratory tests, pilot-scale tests should be conducted under various
operating parameters.
• In the two-step hydrophobization technique, the first step involved treatment with a
cationic reagent and the second step involved use of novel dewatering aids. Dewatering
aids are effective at relatively low dosages; however, in some cases, the required dosages
of cationic reagent were high. This may not be acceptable for full-scale applications.
Taking this fact into account, a series of laboratory tests should be conducted to
investigate new types of cationic reagents which may be used at considerably lower
dosages.
• Foam aided dewatering tests were conducted on clay samples. The results showed that
this technique can be successfully utilized over a wide range of pH values to dewater the
clay particles. Additional laboratory tests should be conducted using various solid
contents and particle size distributions. Afterward, pilot-scale work would be needed to
better define the effectiveness of the technique.
• While lowering the moisture content of fine particles, dewatering aids have been shown
to also increase the filtration kinetics. This is especially important for coal processing
plants that utilize in horizontal belt filters (HBF), because they are able to take full

225
advantage of the increased kinetics. Plants using HBF should be selected to further
evaluate the combined benefits of dewatering aids.