Embed Size (px)
Citation preview
Vladimir Putin’s Russia continued to assert its influence with bothallies and adversaries in 2016. As Russia’s air campaign in Syriaentered its second year, the government of Bashar al-Assad
regained the momentum against opposition and ISIL forces. Russianfighter jets routinely violated NATO airspace in the Baltic, and in themonths prior to the U.S. presidential election, a series of high-profilehacking attacks targeted the Democratic Party and its presidential nom-inee Hillary Clinton. Thousands of private e-mails were subsequentlyleaked on the Internet, and Russian intelligence services were implicatedin the cyberattack. After the victory of Republican candidate DonaldTrump in the November U.S. presidential election, a senior Russian offi-cial confirmed that there had been contact between Russia and the Trumpcampaign.
Russia
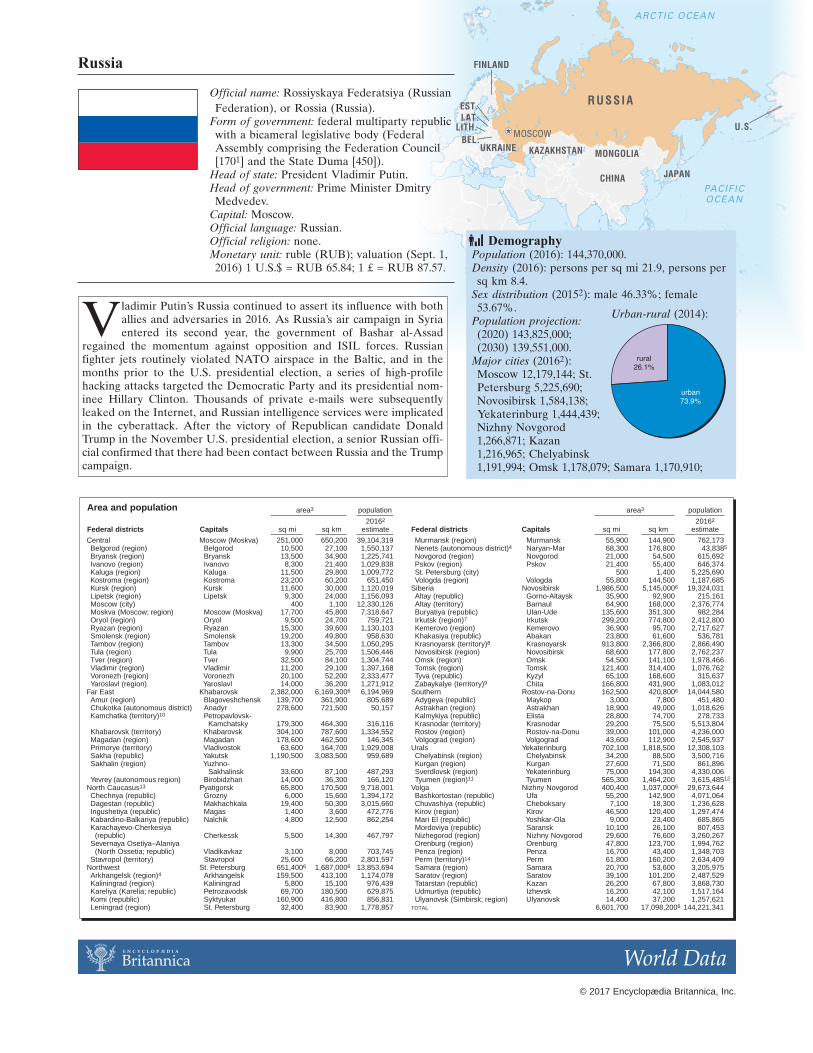
Official name: Rossiyskaya Federatsiya (RussianFederation), or Rossia (Russia).
Form of government: federal multiparty republicwith a bicameral legislative body (FederalAssembly comprising the Federation Council[1701] and the State Duma [450]).
Head of state: President Vladimir Putin.Head of government: Prime Minister Dmitry
Medvedev.Capital: Moscow.Official language: Russian.Official religion: none.Monetary unit: ruble (RUB); valuation (Sept. 1,2016) 1 U.S.$ = RUB 65.84; 1 £ = RUB 87.57.
DemographyPopulation (2016): 144,370,000.Density (2016): persons per sq mi 21.9, persons persq km 8.4.
Sex distribution (20152): male 46.33%; female53.67%.
Population projection:(2020) 143,825,000;(2030) 139,551,000.
Major cities (20162):Moscow 12,179,144; St.Petersburg 5,225,690;Novosibirsk 1,584,138;Yekaterinburg 1,444,439;Nizhny Novgorod1,266,871; Kazan 1,216,965; Chelyabinsk1,191,994; Omsk 1,178,079; Samara 1,170,910;
Area and population area3 population area3 population
20162 20162
Federal districts Capitals sq mi sq km estimate Federal districts Capitals sq mi sq km estimate
Central Moscow (Moskva) 251,000 650,200 39,104,319Belgorod (region) Belgorod 10,500 27,100 1,550,137Bryansk (region) Bryansk 13,500 34,900 1,225,741Ivanovo (region) Ivanovo 8,300 21,400 1,029,838Kaluga (region) Kaluga 11,500 29,800 1,009,772Kostroma (region) Kostroma 23,200 60,200 651,450Kursk (region) Kursk 11,600 30,000 1,120,019Lipetsk (region) Lipetsk 9,300 24,000 1,156,093Moscow (city) 400 1,100 12,330,126Moskva (Moscow; region) Moscow (Moskva) 17,700 45,800 7,318,647Oryol (region) Oryol 9,500 24,700 759,721Ryazan (region) Ryazan 15,300 39,600 1,130,103Smolensk (region) Smolensk 19,200 49,800 958,630Tambov (region) Tambov 13,300 34,500 1,050,295Tula (region) Tula 9,900 25,700 1,506,446Tver (region) Tver 32,500 84,100 1,304,744Vladimir (region) Vladimir 11,200 29,100 1,397,168Voronezh (region) Voronezh 20,100 52,200 2,333,477Yaroslavl (region) Yaroslavl 14,000 36,200 1,271,912
Far East Khabarovsk 2,382,000 6,169,3006 6,194,969Amur (region) Blagoveshchensk 139,700 361,900 805,689Chukotka (autonomous district) Anadyr 278,600 721,500 50,157Kamchatka (territory)10 Petropavlovsk-
Kamchatsky 179,300 464,300 316,116Khabarovsk (territory) Khabarovsk 304,100 787,600 1,334,552Magadan (region) Magadan 178,600 462,500 146,345Primorye (territory) Vladivostok 63,600 164,700 1,929,008Sakha (republic) Yakutsk 1,190,500 3,083,500 959,689Sakhalin (region) Yuzhno-
Sakhalinsk 33,600 87,100 487,293Yevrey (autonomous region) Birobidzhan 14,000 36,300 166,120
North Caucasus13 Pyatigorsk 65,800 170,500 9,718,001Chechnya (republic) Grozny 6,000 15,600 1,394,172Dagestan (republic) Makhachkala 19,400 50,300 3,015,660Ingushetiya (republic) Magas 1,400 3,600 472,776Kabardino-Balkariya (republic) Nalchik 4,800 12,500 862,254Karachayevo-Cherkesiya
(republic) Cherkessk 5,500 14,300 467,797Severnaya Osetiya–Alaniya
(North Ossetia; republic) Vladikavkaz 3,100 8,000 703,745Stavropol (territory) Stavropol 25,600 66,200 2,801,597
Northwest St. Petersburg 651,4006 1,687,0006 13,853,694Arkhangelsk (region)4 Arkhangelsk 159,500 413,100 1,174,078Kaliningrad (region) Kaliningrad 5,800 15,100 976,439Kareliya (Karelia; republic) Petrozavodsk 69,700 180,500 629,875Komi (republic) Syktyukar 160,900 416,800 856,831Leningrad (region) St. Petersburg 32,400 83,900 1,778,857
Murmansk (region) Murmansk 55,900 144,900 762,173Nenets (autonomous district)4 Naryan-Mar 68,300 176,800 43,8385
Novgorod (region) Novgorod 21,000 54,500 615,692Pskov (region) Pskov 21,400 55,400 646,374St. Petersburg (city) 500 1,400 5,225,690Vologda (region) Vologda 55,800 144,500 1,187,685
Siberia Novosibirsk 1,986,500 5,145,0006 19,324,031Altay (republic) Gorno-Altaysk 35,900 92,900 215,161Altay (territory) Barnaul 64,900 168,000 2,376,774Buryatiya (republic) Ulan-Ude 135,600 351,300 982,284Irkutsk (region)7 Irkutsk 299,200 774,800 2,412,800Kemerovo (region) Kemerovo 36,900 95,700 2,717,627Khakasiya (republic) Abakan 23,800 61,600 536,781Krasnoyarsk (territory)8 Krasnoyarsk 913,800 2,366,800 2,866,490Novosibirsk (region) Novosibirsk 68,600 177,800 2,762,237Omsk (region) Omsk 54,500 141,100 1,978,466Tomsk (region) Tomsk 121,400 314,400 1,076,762Tyva (republic) Kyzyl 65,100 168,600 315,637Zabaykalye (territory)9 Chita 166,800 431,900 1,083,012
Southern Rostov-na-Donu 162,500 420,8006 14,044,580Adygeya (republic) Maykop 3,000 7,800 451,480Astrakhan (region) Astrakhan 18,900 49,000 1,018,626Kalmykiya (republic) Elista 28,800 74,700 278,733Krasnodar (territory) Krasnodar 29,200 75,500 5,513,804Rostov (region) Rostov-na-Donu 39,000 101,000 4,236,000Volgograd (region) Volgograd 43,600 112,900 2,545,937
Urals Yekaterinburg 702,100 1,818,500 12,308,103Chelyabinsk (region) Chelyabinsk 34,200 88,500 3,500,716Kurgan (region) Kurgan 27,600 71,500 861,896Sverdlovsk (region) Yekaterinburg 75,000 194,300 4,330,006Tyumen (region)11 Tyumen 565,300 1,464,200 3,615,48512
Volga Nizhny Novgorod 400,400 1,037,0006 29,673,644Bashkortostan (republic) Ufa 55,200 142,900 4,071,064Chuvashiya (republic) Cheboksary 7,100 18,300 1,236,628Kirov (region) Kirov 46,500 120,400 1,297,474Mari El (republic) Yoshkar-Ola 9,000 23,400 685,865Mordoviya (republic) Saransk 10,100 26,100 807,453Nizhegorod (region) Nizhny Novgorod 29,600 76,600 3,260,267Orenburg (region) Orenburg 47,800 123,700 1,994,762Penza (region) Penza 16,700 43,400 1,348,703Perm (territory)14 Perm 61,800 160,200 2,634,409Samara (region) Samara 20,700 53,600 3,205,975Saratov (region) Saratov 39,100 101,200 2,487,529Tatarstan (republic) Kazan 26,200 67,800 3,868,730Udmurtiya (republic) Izhevsk 16,200 42,100 1,517,164Ulyanovsk (Simbirsk; region) Ulyanovsk 14,400 37,200 1,257,621
TOTAL 6,601,700 17,098,2006 144,221,341
Urban-rural (2014):
© 2017 Encyclopædia Britannica, Inc.
World DataE N C Y C L O P Æ D I A
Britannica
Demography (continued)Rostov-na-Donu 1,119,875; Ufa 1,110,976; Krasnoyarsk1,066,934; Perm 1,041,876; Voronezh 1,032,382; Volgograd1,016,137.
Migration (2015): immigrants 598,617; emigrants 353,233.Refugees (20162): 339,836, of which from Ukraine 311,651.Households. Total households (2004) 51,209,000; average house-hold size (2006) 2.7; distribution by size (2002)15: 1 person22.3%; 2 persons 27.6%; 3 persons 23.8%; 4 persons 17.0%; 5persons 5.7%; 6 or more persons 3.6%.
National economyBudget (2013). Revenue: RUB 13,019,900,000,000 (tax rev-enue 53.5%, of which VAT 27.2%, excise duties 4.0%, taxon corporate profits 2.7%; nontax revenue 46.5%, of whichcustoms duties 38.5%). Expenditures: RUB 13,342,900,-000,000 (social and cultural activities 39.3%; defense andsecurity 31.2%; national economy 13.9%; general govern-ment 6.4%).
Public debt (external, outstanding; March 2016):U.S.$31,754,000,000.
Gross national income (GNI; 2015): U.S.$1,668,650,000,000(U.S.$11,400 per capita); purchasing power parity GNI (U.S.$23,790 per capita).
Production (metric tons except as noted). Agriculture, forestry, fishing (2014): wheat 59,711,382, sugar beets 33,513,369, potatoes31,501,354, barley 20,444,258, corn (maize) 11,332,138, sunflower seeds 9,033,716, oats 5,273,812, cabbages 3,328,87622, 23, rye3,280,759, tomatoes 2,644,22023, dry onions 1,984,93723, carrots and turnips 1,604,65623, apples 1,572,00023, dry peas 1,502,845,rapeseed 1,464,008, cucumbers 1,068,00023, rice 1,048,566, linseed 393,002, currants 373,00023, garlic 232,84323, raspberries143,00023, gooseberries 55,00023; livestock (number of live animals) 22,246,750 sheep, 19,563,964 cattle, 19,081,411 pigs,448,371,000 chickens, 3,284,17623 beehives; roundwood (2015) 205,507,000 cu m, of which fuelwood 7%; fisheries production4,386,770 (from aquaculture 4%); aquatic plants production 9,456 (from aquaculture 25%). Mining and quarrying (2015): palla-dium 80,000 kg (world rank: 1); gem diamonds 21,500,000 carats (world rank: 1); industrial diamonds 16,000,000 carats (worldrank: 1); nickel 240,00024 (world rank: 2); mica 100,000 (world rank: 2); cobalt 6,30024 (world rank: 2); vanadium 15,00024 (worldrank: 3); gold 242,000 kg (world rank: 3); iron ore 112,000,00024 (world rank: 5); copper ore 740,00024 (world rank: 7); molybde-num 4,80024 (world rank: 8). Manufacturing (value added in U.S.$’000,000; 2014): refined petroleum products 66,710; food andbeverages 39,788; base metals 25,805; chemicals and chemical products 25,057; general purpose machinery 15,651; cement,bricks, and ceramics 11,652; transportation equipment 10,054; furniture and wood products 9,510; fabricated metal products7,046; scientific instruments 6,344; rubber and plastic products 6,011; electrical machinery and apparatus 5,271; paper and paperproducts 4,480; publishing 3,660.
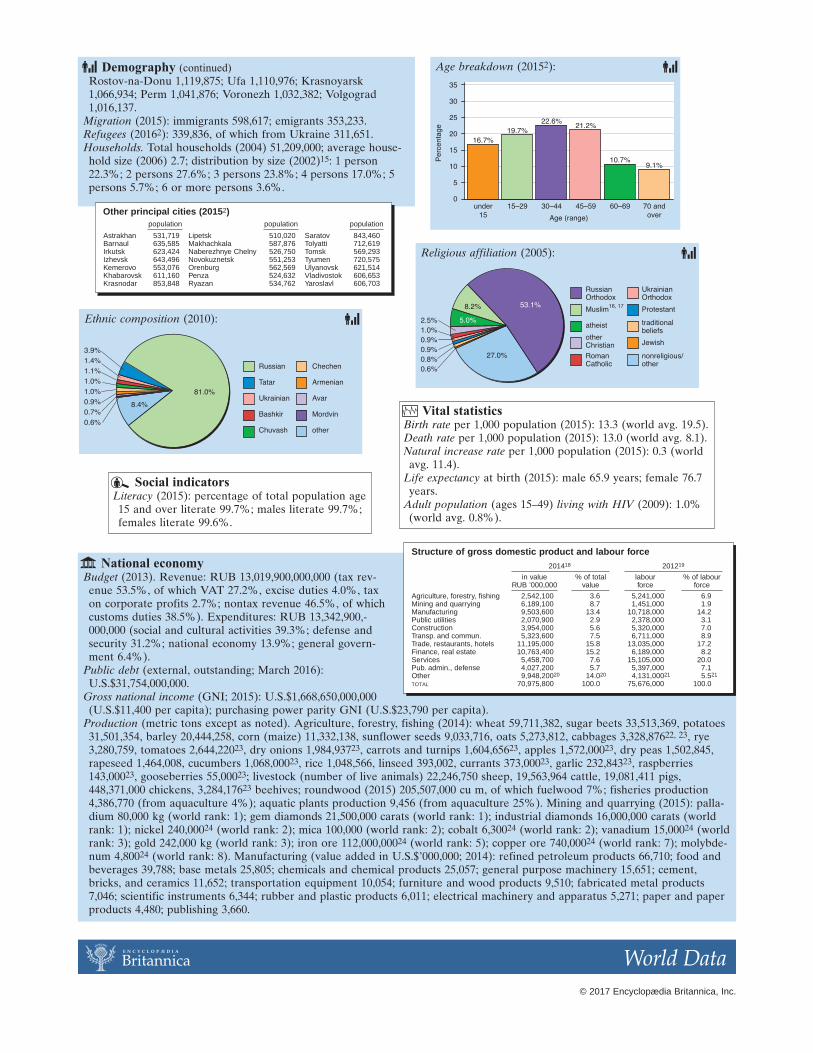
Ethnic composition (2010):
Age breakdown (20152):
Religious affiliation (2005):
Social indicatorsLiteracy (2015): percentage of total population age15 and over literate 99.7%; males literate 99.7%;females literate 99.6%.
Vital statisticsBirth rate per 1,000 population (2015): 13.3 (world avg. 19.5).Death rate per 1,000 population (2015): 13.0 (world avg. 8.1).Natural increase rate per 1,000 population (2015): 0.3 (worldavg. 11.4).
Life expectancy at birth (2015): male 65.9 years; female 76.7years.
Adult population (ages 15–49) living with HIV (2009): 1.0%(world avg. 0.8%).
Other principal cities (20152)population population population
Astrakhan 531,719Barnaul 635,585Irkutsk 623,424Izhevsk 643,496Kemerovo 553,076Khabarovsk 611,160Krasnodar 853,848
Lipetsk 510,020Makhachkala 587,876Naberezhnye Chelny 526,750Novokuznetsk 551,253Orenburg 562,569Penza 524,632Ryazan 534,762
Saratov 843,460Tolyatti 712,619Tomsk 569,293Tyumen 720,575Ulyanovsk 621,514Vladivostok 606,653Yaroslavl 606,703
Structure of gross domestic product and labour force201418 201219
in value % of total labour % of labourRUB ’000,000 value force force
Agriculture, forestry, fishing 2,542,100 3.6 5,241,000 6.9Mining and quarrying 6,189,100 8.7 1,451,000 1.9Manufacturing 9,503,600 13.4 10,718,000 14.2Public utilities 2,070,900 2.9 2,378,000 3.1Construction 3,954,000 5.6 5,320,000 7.0Transp. and commun. 5,323,600 7.5 6,711,000 8.9Trade, restaurants, hotels 11,195,000 15.8 13,035,000 17.2Finance, real estate 10,763,400 15.2 6,189,000 8.2Services 5,458,700 7.6 15,105,000 20.0Pub. admin., defense 4,027,200 5.7 5,397,000 7.1Other 9,948,20020 14.020 4,131,00021 5.521
TOTAL 70,975,800 100.0 75,676,000 100.0
© 2017 Encyclopædia Britannica, Inc.
World DataE N C Y C L O P Æ D I A
Britannica
National economy (continued)Energy production (consumption): electricity (kW-hr;
2014) 1,064,000,000,000 (1,065,000,000,000), by source(2013): fossil fuels 66.0%; nuclear energy 16.1%;renewable energy 17.9%; hard coal (metric tons;2012–13) 280,000,000 ([2011] 147,000,000); lignite(metric tons; 2012–13) 76,500,000 ([2011] 77,600,000);crude petroleum (barrels; 2012–13) 3,609,000,000([2011] 1,803,000,000); petroleum products (metric tons; 2012)253,725,000 ([2011] 111,754,000); natural gas (cu m; 2014)578,700,000,000 (409,200,000,000).
Population economically active (2015): total 76,588,000; participa-tion rates: ages 15–72, male 76.0%; female 63.0%; unemployed6.0%, of which youth (ages 15–24) 16.0%.
Land use as % of total land area (2011): in temporary crops or leftfallow 7.4%, in permanent crops 0.1%, in pasture 5.6%, forestarea 49.4%.
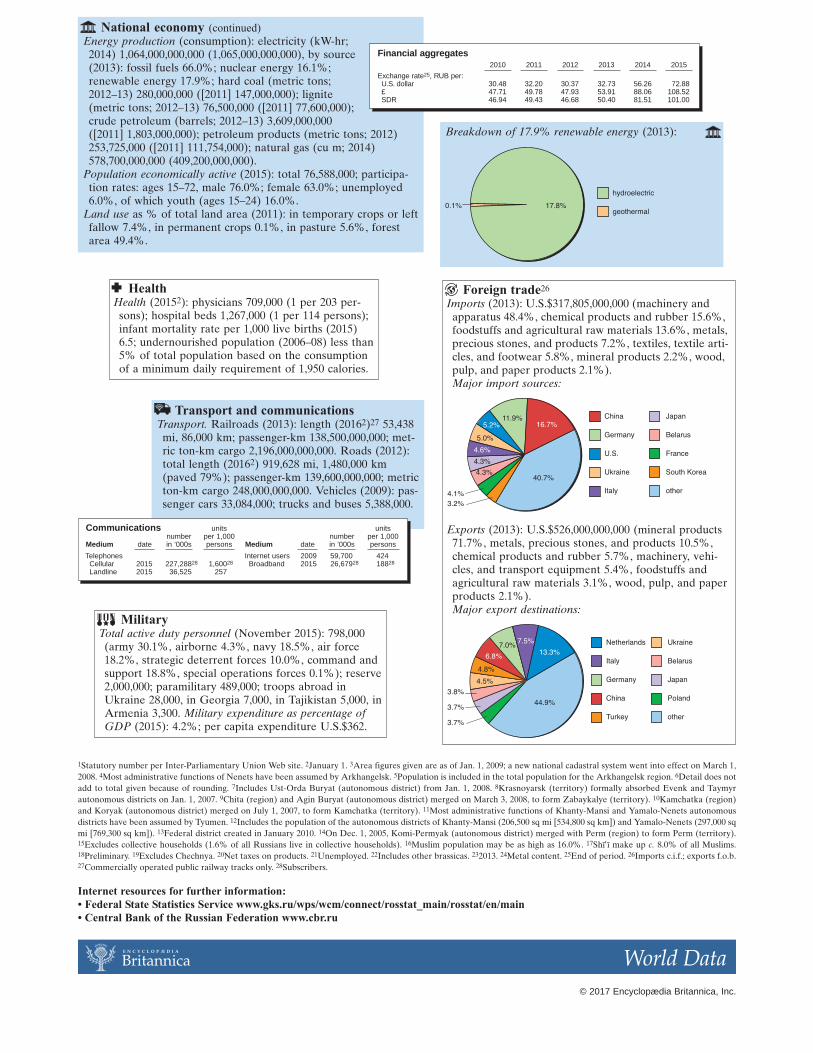
Foreign trade26
Imports (2013): U.S.$317,805,000,000 (machinery andapparatus 48.4%, chemical products and rubber 15.6%,foodstuffs and agricultural raw materials 13.6%, metals,precious stones, and products 7.2%, textiles, textile arti-cles, and footwear 5.8%, mineral products 2.2%, wood,pulp, and paper products 2.1%).Major import sources:
Exports (2013): U.S.$526,000,000,000 (mineral products71.7%, metals, precious stones, and products 10.5%,chemical products and rubber 5.7%, machinery, vehi-cles, and transport equipment 5.4%, foodstuffs andagricultural raw materials 3.1%, wood, pulp, and paperproducts 2.1%). Major export destinations:
Transport and communicationsTransport. Railroads (2013): length (20162)27 53,438
mi, 86,000 km; passenger-km 138,500,000,000; met-ric ton-km cargo 2,196,000,000,000. Roads (2012):total length (20162) 919,628 mi, 1,480,000 km(paved 79%); passenger-km 139,600,000,000; metricton-km cargo 248,000,000,000. Vehicles (2009): pas-senger cars 33,084,000; trucks and buses 5,388,000.
MilitaryTotal active duty personnel (November 2015): 798,000
(army 30.1%, airborne 4.3%, navy 18.5%, air force18.2%, strategic deterrent forces 10.0%, command andsupport 18.8%, special operations forces 0.1%); reserve2,000,000; paramilitary 489,000; troops abroad inUkraine 28,000, in Georgia 7,000, in Tajikistan 5,000, inArmenia 3,300. Military expenditure as percentage ofGDP (2015): 4.2%; per capita expenditure U.S.$362.
HealthHealth (20152): physicians 709,000 (1 per 203 per-sons); hospital beds 1,267,000 (1 per 114 persons);infant mortality rate per 1,000 live births (2015)6.5; undernourished population (2006–08) less than5% of total population based on the consumptionof a minimum daily requirement of 1,950 calories.
1Statutory number per Inter-Parliamentary Union Web site. 2January 1. 3Area figures given are as of Jan. 1, 2009; a new national cadastral system went into effect on March 1,2008. 4Most administrative functions of Nenets have been assumed by Arkhangelsk. 5Population is included in the total population for the Arkhangelsk region. 6Detail does notadd to total given because of rounding. 7Includes Ust-Orda Buryat (autonomous district) from Jan. 1, 2008. 8Krasnoyarsk (territory) formally absorbed Evenk and Taymyrautonomous districts on Jan. 1, 2007. 9Chita (region) and Agin Buryat (autonomous district) merged on March 3, 2008, to form Zabaykalye (territory). 10Kamchatka (region)and Koryak (autonomous district) merged on July 1, 2007, to form Kamchatka (territory). 11Most administrative functions of Khanty-Mansi and Yamalo-Nenets autonomousdistricts have been assumed by Tyumen. 12Includes the population of the autonomous districts of Khanty-Mansi (206,500 sq mi [534,800 sq km]) and Yamalo-Nenets (297,000 sqmi [769,300 sq km]). 13Federal district created in January 2010. 14On Dec. 1, 2005, Komi-Permyak (autonomous district) merged with Perm (region) to form Perm (territory).15Excludes collective households (1.6% of all Russians live in collective households). 16Muslim population may be as high as 16.0%. 17Shi(i make up c. 8.0% of all Muslims.18Preliminary. 19Excludes Chechnya. 20Net taxes on products. 21Unemployed. 22Includes other brassicas. 232013. 24Metal content. 25End of period. 26Imports c.i.f.; exports f.o.b.27Commercially operated public railway tracks only. 28Subscribers.
Internet resources for further information:• Federal State Statistics Service www.gks.ru/wps/wcm/connect/rosstat_main/rosstat/en/main• Central Bank of the Russian Federation www.cbr.ru
Breakdown of 17.9% renewable energy (2013):
Communications units unitsnumber per 1,000 number per 1,000
Medium date in ’000s persons Medium date in ’000s persons
TelephonesCellular 2015 227,28828 1,60028
Landline 2015 36,525 257
Internet users 2009 59,700 424Broadband 2015 26,67928 18828
Financial aggregates2010 2011 2012 2013 2014 2015
Exchange rate25, RUB per:U.S. dollar 30.48 32.20 30.37 32.73 56.26 72.88£ 47.71 49.78 47.93 53.91 88.06 108.52SDR 46.94 49.43 46.68 50.40 81.51 101.00
© 2017 Encyclopædia Britannica, Inc.
World DataE N C Y C L O P Æ D I A
Britannica


![[WeGO] Ulyanovsk](https://img.pdfslide.us/doc/110x75/559c40371a28ab07518b45b1/wego-ulyanovsk.jpg)


![[2015 e-Government Program] Action Plan : Ulyanovsk(Russia)](https://img.pdfslide.us/doc/110x75/58f2b0bd1a28ab7b398b45a5/2015-e-government-program-action-plan-ulyanovskrussia.jpg)