Embed Size (px)
Citation preview

R e t h i n k i n g h i g h S c h o o l
Tracy A. HuebnerGrace Calisi Corbett
Edited by Joy Zimmerman
We want to gratefully acknowledge Diana Joy Bernbaum and Kate Phillippo for their contributions to this report.
R e t h i n k i n g h i g h S c h o o lsupporting al l students to be college-ready in math
A s t u d y b y f o r t h e B i l l & M e l i n d a G a t e s F o u n d a t i o n

01
Students who do not take and pass a rigorous math sequence in high school — generally, Algebra I, Geometry, and Algebra II1 — are ineligible for admission to many four-year colleges and universities.2 With almost two-thirds of future jobs expected to require college-level math skills,3 these students are not just missing out on important academic opportunities, they may also be closed out of significant economic opportunities.
HigH scHool students find unequal access and support in matH
Ensuring that students can confidently perform as successful mathematicians is a process that starts on day one of the K–12 education experience. By the time students reach high school, they must be ready to jump into college-preparatory math courses. Yet many start the ninth grade unprepared to succeed in such classes. This is especially true for our nation’s most under-served students, who often begin high school far behind in math.4 Making up this lost ground requires intensive remediation and other support, which many schools are unable to offer.5
Yet, even when students are ready for college preparatory cours-es, there is no guarantee their high school will offer the full array of math courses required for college admissions. One prominent study about factors contributing to academic success found a correlation between the higher-level math courses available at a community’s high school and the income level in that commu-nity. The researchers found, for example, that only 44 percent of high schools serving high-poverty communities offer Calculus. In comparison, among those schools serving the nation’s wealth-iest communities, 72 percent offer Calculus.6
And even when schools do offer a full range of rigorous math courses, not all students are aware of which ones are re-quired for college admission. In some states, students can meet the math requirements for high school graduation yet still not have met the math requirement for admissions to the state’s institutions of higher education. California students, for example, must take two years of math for a high school diploma,7 while the state-supported university systems —
(x-2)2 + [y-(-3)]2 = 42In mathematics classes across the country, many students identify themselves as being in one of two camps:
those who can do math and those who can’t. Such labels may be assumed by the students themselves or un-
consciously assigned to them by the adults in their lives based on students’ math achievement. Whatever its
source, the can’t label may be a costly one.
dx=x+c

02
California State University (CSU) and University of Califor-nia (UC) — require, at a minimum, that students successfully complete three years of math.8
tHe urgent need to improve matHematics education
The lack of universally high-quality math education across the nation’s K–12 schools has resulted in disappointing achieve-ment overall. On the National Assessment of Education Progress (NAEP), which is considered the only nationally representative assessment of what students know and can do in various sub-jects, more than 75 percent of high school seniors taking the exam in 2005 scored below proficient in mathematics.9 Such dis-appointing results are likely to remain the norm until we can en-sure that all high school students have the opportunity — and are encouraged — to take rigorous college-preparatory math courses and that they receive the high-quality instruction and support necessary to be successful in these classes.
While research has identified some key elements of a strong mathematics program, it is helpful to understand what these el-ements might look like in practice. To that end, this report, the latest in the Rethinking High School series, introduces three of the key program elements identified in the research and three schools — all supported in part by the Bill & Melinda Gates Foun-dation — that show what these elements look like when taken to heart by a committed staff.
The next section of this report presents each element and provides a brief introduction to the schools. A subsequent section then profiles each school in greater depth, providing a context and more detail about how the particular element is being implemented.
foundations for success: elements of a strong matH program tHat serves all students
The program elements identified by the research and explored in this report are:
Offering high-level math courses and supports ǰ 10
Continually improving teachers’ skills and math content ǰknowledge11
Using student information to drive instruction ǰ 12
Offering high-level math courses and supports
Many states have minimal math standards, but schools and districts can choose to go beyond those standards. The math coursework a school or district offers is by far the most concrete piece of evidence of its academic plans or aspirations for its stu-dents. A recent U.S. Department of Education study found that access to academically challenging coursework in high school significantly increased the likelihood of a student successfully completing a bachelor’s degree.13 According to the report, access to and enrollment in challenging courses had a greater impact than any other factor, including income level and parents’ level of education.14
Continually improving teachers’ skills and math content knowledge
A large body of research makes clear that effectiveness in teach-ing mathematics requires a combination of strong teaching skills and solid knowledge of the subject matter of mathematics.15 Teaching higher-level math to high-need students is uniquely
03
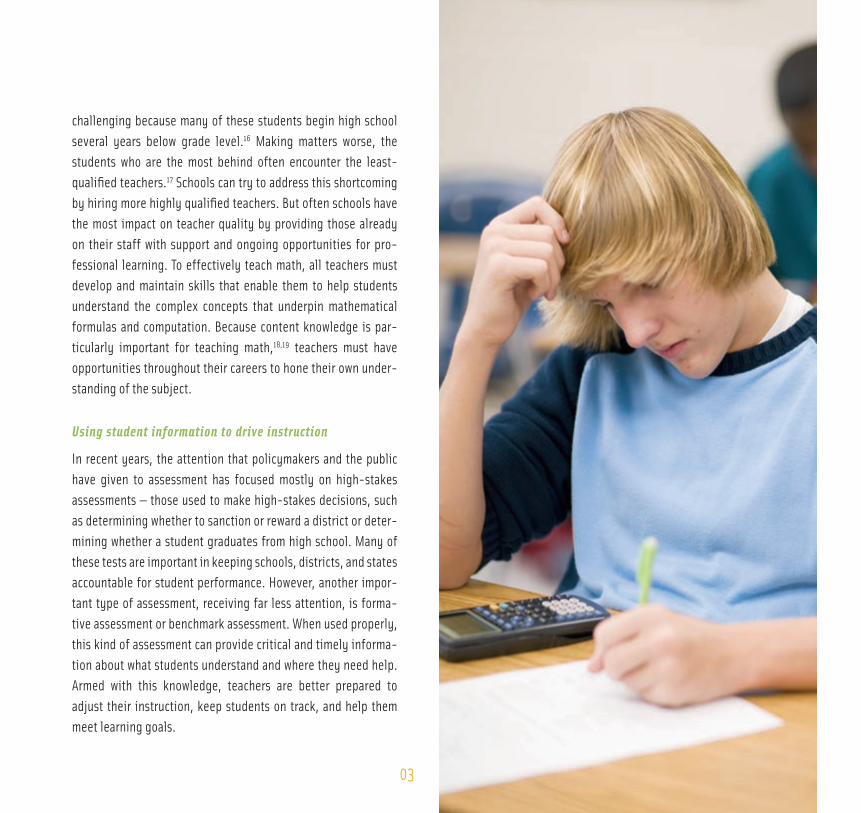
challenging because many of these students begin high school several years below grade level.16 Making matters worse, the students who are the most behind often encounter the least-qualified teachers.17 Schools can try to address this shortcoming by hiring more highly qualified teachers. But often schools have the most impact on teacher quality by providing those already on their staff with support and ongoing opportunities for pro-fessional learning. To effectively teach math, all teachers must develop and maintain skills that enable them to help students understand the complex concepts that underpin mathematical formulas and computation. Because content knowledge is par-ticularly important for teaching math,18,19 teachers must have opportunities throughout their careers to hone their own under-standing of the subject.
Using student information to drive instruction
In recent years, the attention that policymakers and the public have given to assessment has focused mostly on high-stakes assessments — those used to make high-stakes decisions, such as determining whether to sanction or reward a district or deter-mining whether a student graduates from high school. Many of these tests are important in keeping schools, districts, and states accountable for student performance. However, another impor-tant type of assessment, receiving far less attention, is forma-tive assessment or benchmark assessment. When used properly, this kind of assessment can provide critical and timely informa-tion about what students understand and where they need help. Armed with this knowledge, teachers are better prepared to adjust their instruction, keep students on track, and help them meet learning goals.
4
interlake high school
granby high school
tHe scHools
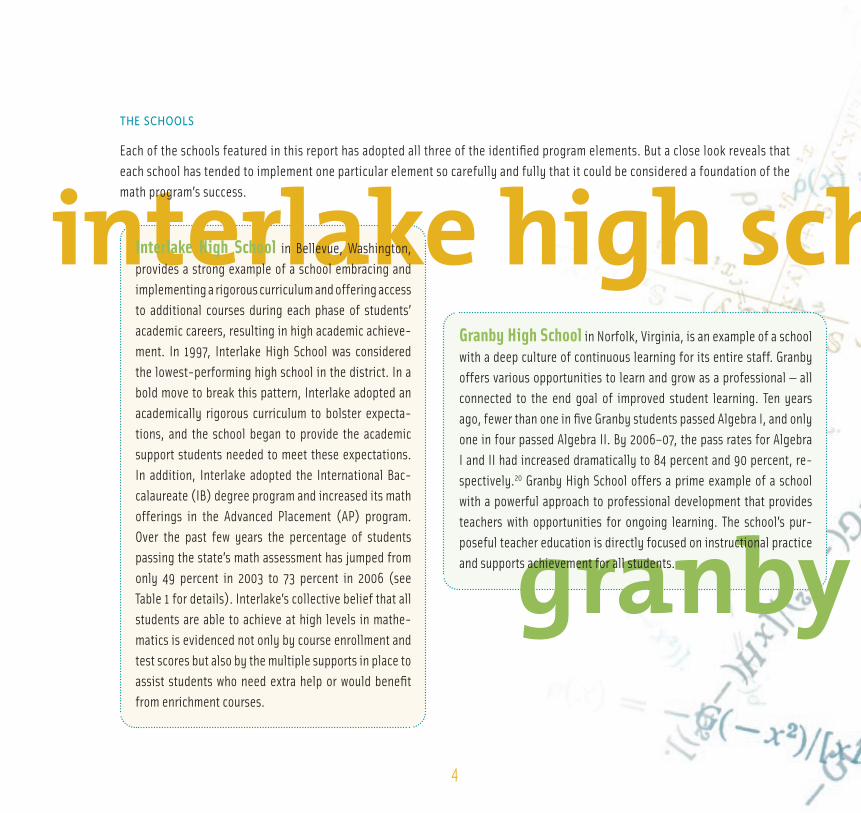
Each of the schools featured in this report has adopted all three of the identified program elements. But a close look reveals that each school has tended to implement one particular element so carefully and fully that it could be considered a foundation of the math program’s success.
Interlake High School in Bellevue, Washington, provides a strong example of a school embracing and implementing a rigorous curriculum and offering access to additional courses during each phase of students’ academic careers, resulting in high academic achieve-ment. In 1997, Interlake High School was considered the lowest-performing high school in the district. In a bold move to break this pattern, Interlake adopted an academically rigorous curriculum to bolster expecta-tions, and the school began to provide the academic support students needed to meet these expectations. In addition, Interlake adopted the International Bac-calaureate (IB) degree program and increased its math offerings in the Advanced Placement (AP) program. Over the past few years the percentage of students passing the state’s math assessment has jumped from only 49 percent in 2003 to 73 percent in 2006 (see Table 1 for details). Interlake’s collective belief that all students are able to achieve at high levels in mathe-matics is evidenced not only by course enrollment and test scores but also by the multiple supports in place to assist students who need extra help or would benefit from enrichment courses.
Granby High School in Norfolk, Virginia, is an example of a school with a deep culture of continuous learning for its entire staff. Granby offers various opportunities to learn and grow as a professional — all connected to the end goal of improved student learning. Ten years ago, fewer than one in five Granby students passed Algebra I, and only one in four passed Algebra II. By 2006–07, the pass rates for Algebra I and II had increased dramatically to 84 percent and 90 percent, re-spectively.20 Granby High School offers a prime example of a school with a powerful approach to professional development that provides teachers with opportunities for ongoing learning. The school’s pur-poseful teacher education is directly focused on instructional practice and supports achievement for all students.

5
interlake high school
granby high school
Fenway High School in Boston, Massachusetts, was created as a program for at-risk students. Although the majority of its students begin high school performing below grade level, Fenway staff set their sights high, and the school has become one of the better-performing high schools in the district. The school has achieved suc-cess in large part by making good use of formative assessment and other means of pinpointing and monitoring students’ needs, then adjusting instruction accordingly. Students keep portfolios and develop exhibitions that demonstrate understanding, for example, and teachers draw on continuous conversations with students to help guide math instruction. Math teachers work collaboratively to keep track of student learning and to improve instruction to ensure that all students meet the state re-quirement for math achievement as well as the school’s higher standard of pass-ing four years of math. In 2006, 91 percent of the school’s tenth graders passed the state’s math exam.21 On average, approximately one-third of Fenway’s seniors take college-level math classes at Emmanuel College and receive college credits.
To effectively teach math, all teachers must develop and maintain skills that enable them to help students understand
the complex concepts that underpin mathematical formulas and computation.
fenway high school

6
interlake High school
B e l l e v u e , W a s h i n g t o n
7
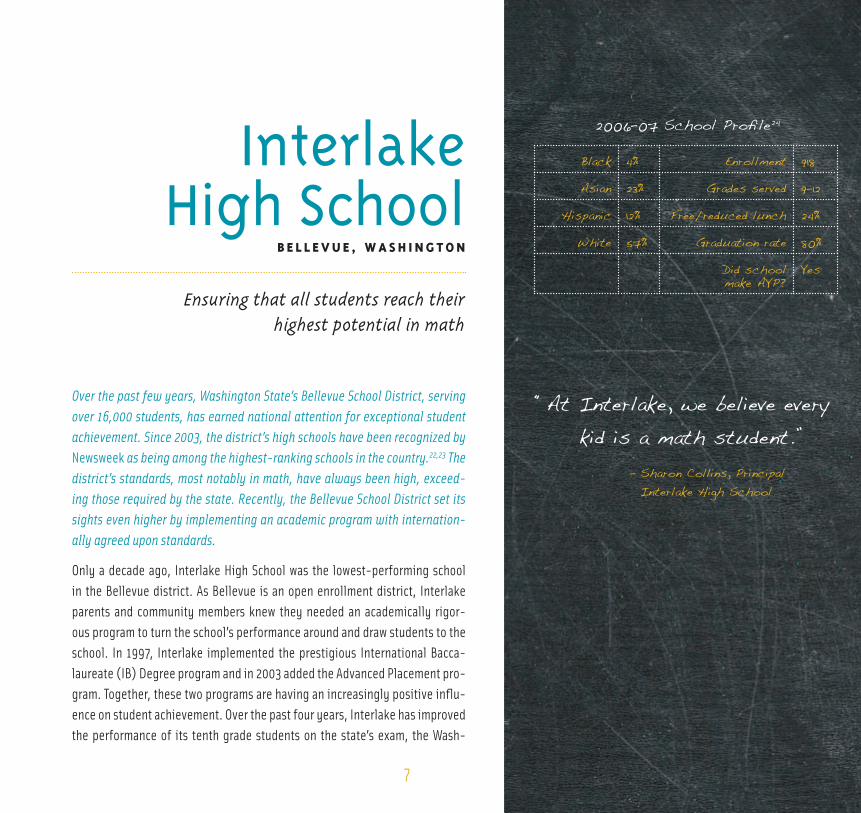
Over the past few years, Washington State’s Bellevue School District, serving over 16,000 students, has earned national attention for exceptional student achievement. Since 2003, the district’s high schools have been recognized by Newsweek as being among the highest-ranking schools in the country.22,23 The district’s standards, most notably in math, have always been high, exceed-ing those required by the state. Recently, the Bellevue School District set its sights even higher by implementing an academic program with internation-ally agreed upon standards.
Only a decade ago, Interlake High School was the lowest-performing school in the Bellevue district. As Bellevue is an open enrollment district, Interlake parents and community members knew they needed an academically rigor-ous program to turn the school’s performance around and draw students to the school. In 1997, Interlake implemented the prestigious International Bacca-laureate (IB) Degree program and in 2003 added the Advanced Placement pro-gram. Together, these two programs are having an increasingly positive influ-ence on student achievement. Over the past four years, Interlake has improved the performance of its tenth grade students on the state’s exam, the Wash-
2006–07 School Profile24
Black 4% Enrollment 918
Asian 23% Grades served 9–12
Hispanic 12% Free/reduced lunch 24%
White 57% Graduation rate 80%
Did school make AYP?
Yes
interlake High school
B e l l e v u e , W a s h i n g t o n
Ensuring that all students reach their highest potential in math
“At Interlake, we believe every kid is a math student.”
– Sharon Collins, Principal Interlake High School
8
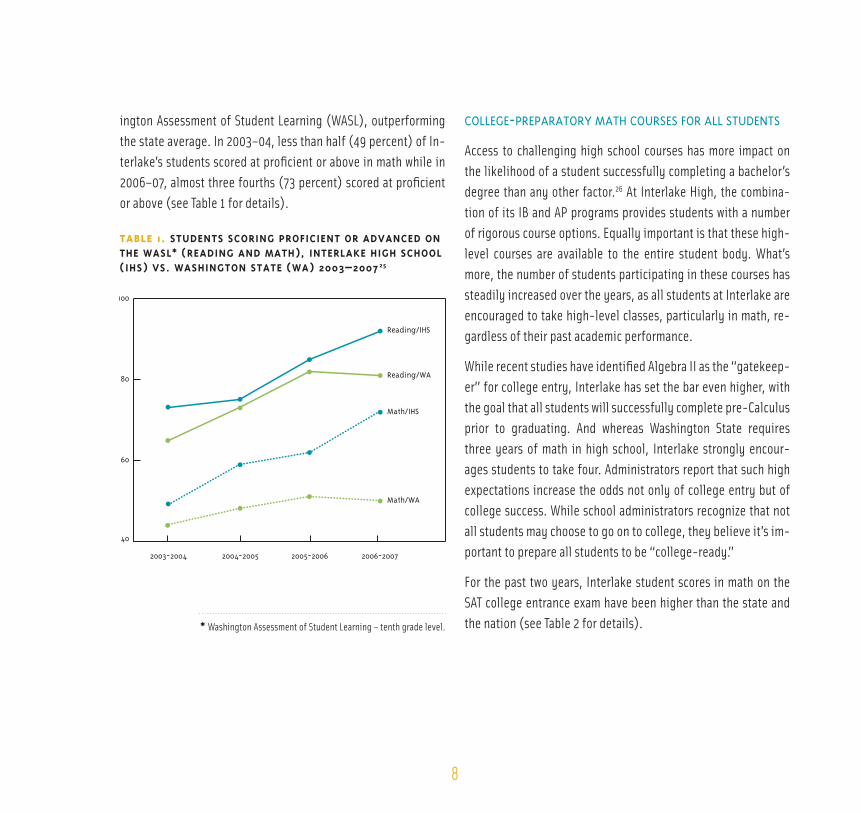
ington Assessment of Student Learning (WASL), outperforming the state average. In 2003–04, less than half (49 percent) of In-terlake’s students scored at proficient or above in math while in 2006–07, almost three fourths (73 percent) scored at proficient or above (see Table 1 for details).
taBle 1. StudentS Scoring Proficient or AdvAnced on the WASL1 (reAding And mAth), interLAke high SchooL (ihS) vS. WAShington StAte (WA) 2003–200725
1 Washington Assessment of Student Learning – tenth grade level.
40
60
80
100
2003-2004 2004-2005 2005-2006 2006-2007
Math/IHS
Reading/IHS
Reading/WA
Math/WA
* Washington Assessment of Student Learning – tenth grade level.
college-preparatory matH courses for all students
Access to challenging high school courses has more impact on the likelihood of a student successfully completing a bachelor’s degree than any other factor.26 At Interlake High, the combina-tion of its IB and AP programs provides students with a number of rigorous course options. Equally important is that these high-level courses are available to the entire student body. What’s more, the number of students participating in these courses has steadily increased over the years, as all students at Interlake are encouraged to take high-level classes, particularly in math, re-gardless of their past academic performance.
While recent studies have identified Algebra II as the “gatekeep-er” for college entry, Interlake has set the bar even higher, with the goal that all students will successfully complete pre-Calculus prior to graduating. And whereas Washington State requires three years of math in high school, Interlake strongly encour-ages students to take four. Administrators report that such high expectations increase the odds not only of college entry but of college success. While school administrators recognize that not all students may choose to go on to college, they believe it’s im-portant to prepare all students to be “college-ready.”
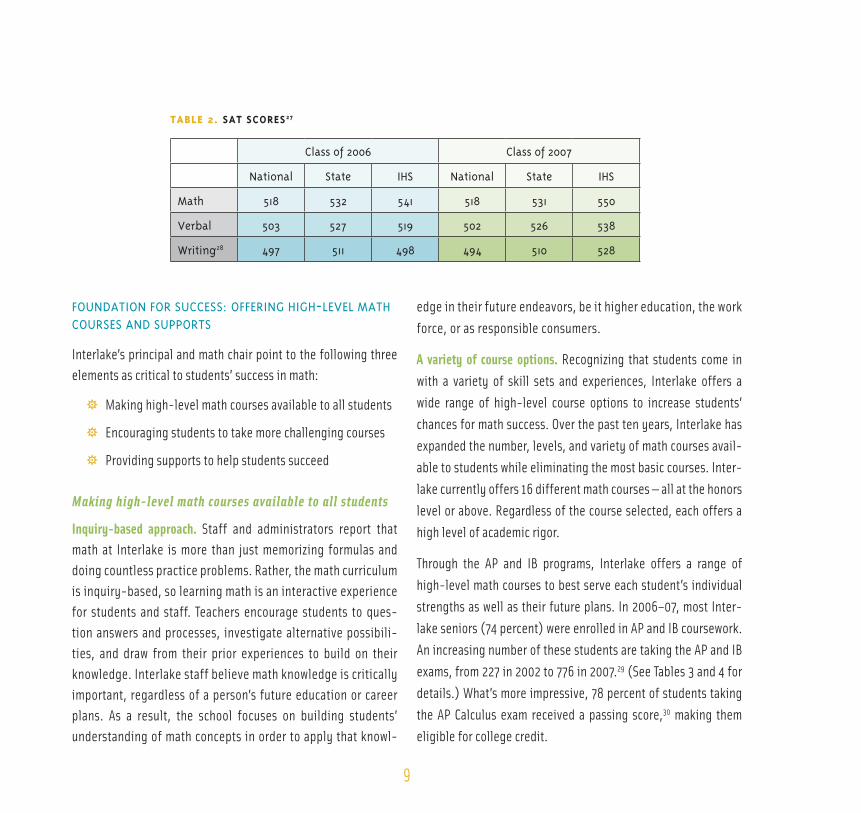
For the past two years, Interlake student scores in math on the SAT college entrance exam have been higher than the state and the nation (see Table 2 for details).
ington Assessment of Student Learning (WASL), outperforming the state average. In 2003–04, less than half (49 percent) of In-terlake’s students scored at proficient or above in math while in 2006–07, almost three fourths (73 percent) scored at proficient or above (see Table 1 for details).
taBle 1. StudentS Scoring Proficient or AdvAnced on the WASL* (reAding And mAth), interLAke high SchooL (ihS) vS. WAShington StAte (WA) 2003–200725
9
taBle 2. SAt ScoreS27
class of 2006 class of 2007
national state iHs national state iHs
math 518 532 541 518 531 550
verbal 503 527 519 502 526 538
Writing28 497 511 498 494 510 528
edge in their future endeavors, be it higher education, the work force, or as responsible consumers.
A variety of course options. Recognizing that students come in with a variety of skill sets and experiences, Interlake offers a wide range of high-level course options to increase students’ chances for math success. Over the past ten years, Interlake has expanded the number, levels, and variety of math courses avail-able to students while eliminating the most basic courses. Inter-lake currently offers 16 different math courses — all at the honors level or above. Regardless of the course selected, each offers a high level of academic rigor.
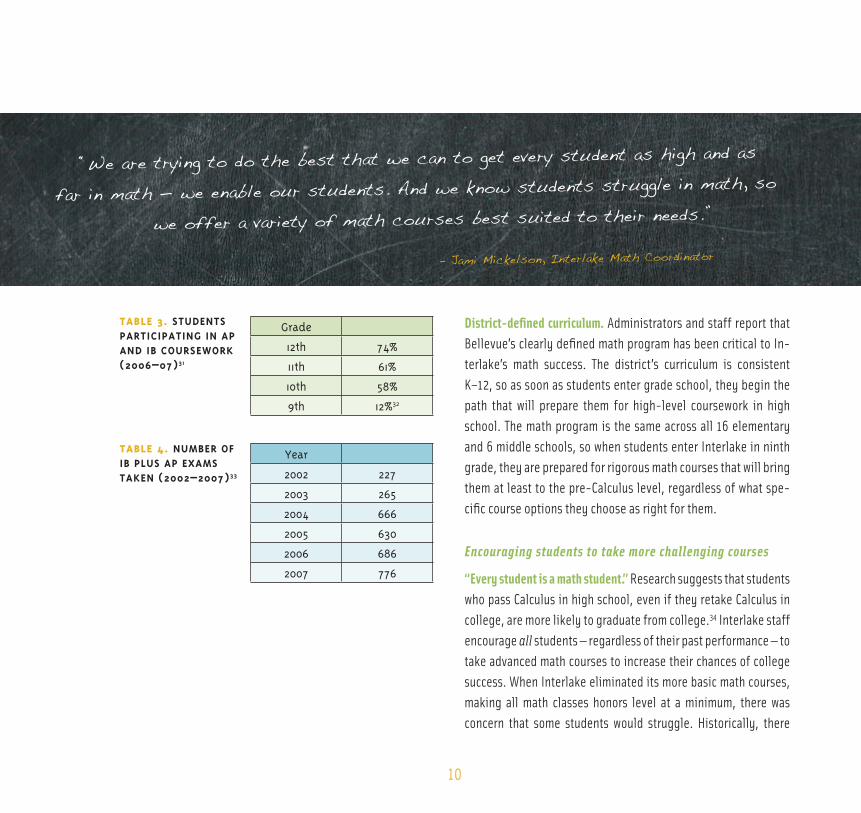
Through the AP and IB programs, Interlake offers a range of high-level math courses to best serve each student’s individual strengths as well as their future plans. In 2006–07, most Inter-lake seniors (74 percent) were enrolled in AP and IB coursework. An increasing number of these students are taking the AP and IB exams, from 227 in 2002 to 776 in 2007.29 (See Tables 3 and 4 for details.) What’s more impressive, 78 percent of students taking the AP Calculus exam received a passing score,30 making them eligible for college credit.
foundation for success: offering HigH-level matH courses and supports
Interlake’s principal and math chair point to the following three elements as critical to students’ success in math:
Making high-level math courses available to all students ǰ
Encouraging students to take more challenging courses ǰ
Providing supports to help students succeed ǰ
Making high-level math courses available to all students
Inquiry-based approach. Staff and administrators report that math at Interlake is more than just memorizing formulas and doing countless practice problems. Rather, the math curriculum is inquiry-based, so learning math is an interactive experience for students and staff. Teachers encourage students to ques-tion answers and processes, investigate alternative possibili-ties, and draw from their prior experiences to build on their knowledge. Interlake staff believe math knowledge is critically important, regardless of a person’s future education or career plans. As a result, the school focuses on building students’ understanding of math concepts in order to apply that knowl-
10
taBle 3. StudentS PArticiPAting in AP And iB courSeWork (2006–07)31
grade
12th 74%
11th 61%
10th 58%
9th 12%32
taBle 4. numBer of iB PLuS AP exAmS tAken (2002–2007)33
year
2002 227
2003 265
2004 666
2005 630
2006 686
2007 776
District-defined curriculum. Administrators and staff report that Bellevue’s clearly defined math program has been critical to In-terlake’s math success. The district’s curriculum is consistent K–12, so as soon as students enter grade school, they begin the path that will prepare them for high-level coursework in high school. The math program is the same across all 16 elementary and 6 middle schools, so when students enter Interlake in ninth grade, they are prepared for rigorous math courses that will bring them at least to the pre-Calculus level, regardless of what spe-cific course options they choose as right for them.
Encouraging students to take more challenging courses
“Every student is a math student.” Research suggests that students who pass Calculus in high school, even if they retake Calculus in college, are more likely to graduate from college.34 Interlake staff encourage all students — regardless of their past performance — to take advanced math courses to increase their chances of college success. When Interlake eliminated its more basic math courses, making all math classes honors level at a minimum, there was concern that some students would struggle. Historically, there
“We are trying to do the best that we can to get every student as high and as
far in math — we enable our students. And we know students struggle in math, so
we offer a variety of math courses best suited to their needs.”
– Jami Mickelson, Interlake Math Coordinator

had always been a few lower-level math classes where students would often do just the minimum to get by. However, Jami Mickel-son, Interlake’s math coordinator, reported that when these stu-dents were combined into higher-level classes, they rose to the challenge. A majority of the students were achieving at a higher level in a more rigorous class. She believes that for many of the students, they had the skill, but needed an opportunity to experi-ence rigorous coursework alongside their peers.
Providing supports to help students succeed
For many students, success in high-level math courses requires more than just encouragement; they need support to increase their chances for success. Interlake offers a wide variety of support op-tions — some beginning even before a student steps into the school. What makes Interlake’s support unique is the number of programs and the variety of support. In addition, many of these programs not only focus on remediation but on acceleration as well.
Student StoryIn 1997, Anar immigrated to the United States from war-
torn Azerbaijan as an 8-year-old who had never been to
school. He received intense tutoring and support from the
Bellevue school system and quickly caught up to his peers.
Anar recalls that his fourth grade teacher mentioned col-
lege. Unfamiliar with the term, Anar asked his teacher what
college was, and he remembers it was explained as the
next step after high school. From that point on, he recalls,
“There was no if college, it was always when.” Once enrolled
at Interlake, Anar took the necessary coursework, actively
participated in sports and the community, and even as-
sisted his family financially with a part-time job. Anar set
his sights on the University of Washington, but needed help
with his college application. College Corps Program volun-
teers assisted, including helping him write an essay that
he recalls truly captured his experiences and hopes for his
future. Anar used the knowledge gained from College Corps
to help his mother apply to the University of Washington’s
nursing program. Both he and his mother were accepted
and are now both proud college freshmen.
Anar Veliyev, Interlake Class of 2007
11
12
“Starting Strong.” A program designed for incoming freshmen of-fers support for students who have struggled in their middle school classes. Staff work with middle school teachers to identify eighth grade students who could benefit from additional assistance and are offered the opportunity to come to Interlake the summer be-fore their freshman year and get a head start on their classes.
College Corps Program. Selecting the right college and applying can be daunting tasks. To help, Interlake makes a College Corps Program available to all students and provides specially trained community volunteers to assist students with every aspect of the college process, including identifying and selecting the right school, preparing the application, and applying for available fi-nancial assistance.
“It prepared me mentally — I was not afraid entering my first day
of high school. I was ready to go!”
– Josh Andreychuk, Interlake Class of 2010
Tutorial High. Where students can receive tutoring every day, in every subject, from 2:30–3:05 pm.
Safe Study. An after-school program where students can receive assistance for a variety of social or emotional issues that may have a negative impact on their school work, such as coping with stress, assistance with time management, or ideas to help them organizationally.
Math Support. A class that meets at the end of the school day and is required of students who are struggling academically, but also open for all who would like a little more assistance with math.

What is the IB program? The International Baccalaureate (IB) degree program is an academically rigorous, college preparatory program
currently offered in 125 countries, including the United States.35 Created in the 1960s to serve international stu-
dents studying in other countries, IB has since become a challenging college preparatory program recognized
by many elite universities around the world. Most U.S. high schools that offer the IB program use it to supple-
ment their regular coursework, rather than as the only path students can take to graduation. Students can take
their school’s regular coursework, select some individual IB courses, or enroll in the IB diploma program, which
has a rigorous set of requirements leading to an IB diploma. To earn an IB diploma, students must take classes
in six subject areas (English, second language, individuals and society, sciences, math, and arts) and advanced
classes in three of the fields. At the core of the program are three requirements: an extended essay, a Theory of
Knowledge class, and a class entitled, Creativity, Action, and Service (CAS). CAS exposes students to activities
that differ from the academic rigors of the program’s other classes. For example, students participate in physi-
cal, creative, and social activities, including community service. The internationally created curriculum exposes
students to a variety of perspectives, and the overall structure provides students who choose the IB program
with a well-rounded education, preparing them for the rigors of postsecondary studies. Students earning an IB
diploma also may qualify to earn college-level credits through IB courses.
13

14
granby High school
n o R F o l K , v i R g i n i a
15
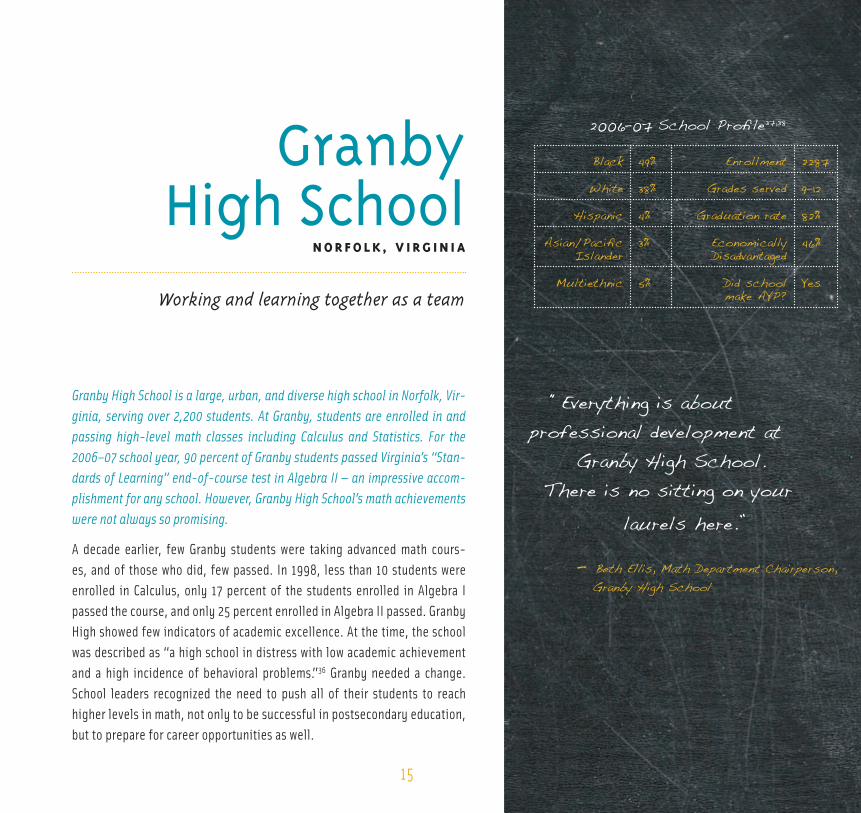
Granby High School is a large, urban, and diverse high school in Norfolk, Vir-ginia, serving over 2,200 students. At Granby, students are enrolled in and passing high-level math classes including Calculus and Statistics. For the 2006–07 school year, 90 percent of Granby students passed Virginia’s “Stan-dards of Learning” end-of-course test in Algebra II — an impressive accom-plishment for any school. However, Granby High School’s math achievements were not always so promising.
A decade earlier, few Granby students were taking advanced math cours-es, and of those who did, few passed. In 1998, less than 10 students were enrolled in Calculus, only 17 percent of the students enrolled in Algebra I passed the course, and only 25 percent enrolled in Algebra II passed. Granby High showed few indicators of academic excellence. At the time, the school was described as “a high school in distress with low academic achievement and a high incidence of behavioral problems.”36 Granby needed a change. School leaders recognized the need to push all of their students to reach higher levels in math, not only to be successful in postsecondary education, but to prepare for career opportunities as well.
2006–07 School Profile37,38
Black 49% Enrollment 2287
White 38% Grades served 9–12
Hispanic 4% Graduation rate 82%
Asian/Pacific Islander
3% Economically Disadvantaged
46%
Multiethnic 5% Did school make AYP?
Yes
granby High school
n o R F o l K , v i R g i n i a
Working and learning together as a team
“Everything is about professional development at Granby High School. There is no sitting on your laurels here.”
– Beth Ellis, Math Department Chairperson, Granby High School
16
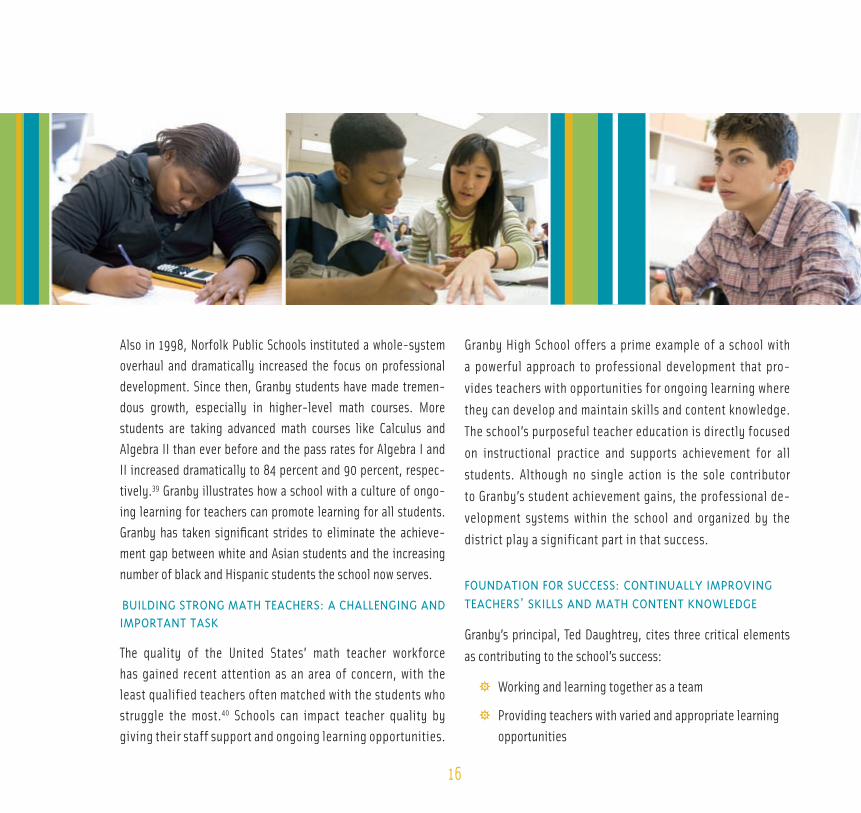
Also in 1998, Norfolk Public Schools instituted a whole-system overhaul and dramatically increased the focus on professional development. Since then, Granby students have made tremen-dous growth, especially in higher-level math courses. More students are taking advanced math courses like Calculus and Algebra II than ever before and the pass rates for Algebra I and II increased dramatically to 84 percent and 90 percent, respec-tively.39 Granby illustrates how a school with a culture of ongo-ing learning for teachers can promote learning for all students. Granby has taken significant strides to eliminate the achieve-ment gap between white and Asian students and the increasing number of black and Hispanic students the school now serves.
Building strong matH teacHers: a cHallenging and important task
The quality of the United States’ math teacher workforce has gained recent attention as an area of concern, with the least qualified teachers often matched with the students who struggle the most.40 Schools can impact teacher quality by giving their staff support and ongoing learning opportunities.
Granby High School offers a prime example of a school with a powerful approach to professional development that pro-vides teachers with opportunities for ongoing learning where they can develop and maintain skills and content knowledge. The school’s purposeful teacher education is directly focused on instructional practice and supports achievement for all students. Although no single action is the sole contributor to Granby’s student achievement gains, the professional de-velopment systems within the school and organized by the district play a significant part in that success.
foundation for success: continually improving teacHers’ skills and matH content knoWledge
Granby’s principal, Ted Daughtrey, cites three critical elements as contributing to the school’s success:
Working and learning together as a team ǰ
Providing teachers with varied and appropriate learning ǰopportunities
17
Ensuring professional development impacts student ǰachievement
Working and learning together as a team
High expectations leave little room for missed teaching opportu-nities. Granby’s teachers realized that they could no longer work as individuals but needed to work together as a team. Granby has instituted a culture of ongoing learning and support so new math staff members are not expected to learn on their own, but become part of the school’s community of learners. Teachers are immersed in on-the-job learning — from their peers in collabora-tive teams and departments, from the analysis of student perfor-mance data, and from getting observation-based feedback from their school and district leaders.
In an ideal high school, teachers in the same academic depart-ment would come together on a regular basis to give and re-ceive support aimed at enhancing their instructional practices. However, this is rarely the case. Instead, teachers tend to work in isolation, with little opportunity to collaborate and share or
learn new strategies. If professional change is discouraged within a department, its members can stagnate. But if change is encouraged, departments can become hotbeds of innovation and collaboration.41 Such is the case in Granby’s mathematics department. Here, professional learning is a constant, guided by teachers’ real-world needs and, thus, targeted to their daily ef-forts to help all students succeed in mathematics.
Providing teachers with varied and appropriate learning opportunities
Take any group of teachers in a given academic department and variety is the apt descriptor. In any group of teachers, even those working in the same academic area, one is likely to find a range of content knowledge, teaching experience, pedagogical skills, and beliefs about student learning. Add to such variables the fact that each teacher deals with a different group of students and it’s clear that teachers’ professional learning needs are likely to be equally varied. Granby recognizes that when it comes to professional development, one size does not fit all. So while
“I really like that feeling that, yes, we are all under a microscope. You have got to grow, and you have got to learn. You know you are going to stumble along the way, just as the students do, and I think that is a really healthy environment.”
– Beth Ellis, Math Department Chairperson, Granby High School

18
the school emphasizes the need for all teachers, veterans and novices alike, to continue their professional growth, it takes a targeted approach to professional development, providing mul-tiple and varied learning opportunities. While the opportunities and strategies listed below may exist in many schools, rarely do they exist at one site to create such a rich and supportive teacher learning community.
New teacher guidance and support. Teachers who are new to Gran-by participate in a range of learning opportunities designed to orient them to the school, district, the profession, and to bol-ster their subject matter knowledge. New teachers take part in a three-year teacher induction program that promotes their effec-tiveness and helps keep them in their positions — critical, since few states or districts have induction programs or requirements. They work closely with a coach who observes their teaching and gives detailed feedback and guidance.
Subject-specific support teams. In addition to meeting as a de-partment, teachers meet in subject-specific teams that work to-gether to plan units, develop lesson plans, and evaluate student data. Teams discuss student needs and develop extra academic supports as needed. Granby teachers report knowing each oth-er’s work intimately and are therefore able to hold each other ac-countable for teaching all of their students to a high standard.
Ongoing learning opportunities for experienced teachers. Granby teachers also have access to a range of professional development experiences that complement what they are learning from de-partmental colleagues. Professional development leaders target learning opportunities to the needs of the students and to the individual staff members in need of the support.
Room for learning When asked how professional development benefits vet-eran staff, Beth Ellis recounts her experience with one of the school’s most experienced math teachers. Mrs. Taylor* had been teaching at the school for years and had a reputation as one of the toughest math teachers. She generally spent most of her class periods writing problems on the board while stu-dents copied the problems at their desks. Her philosophy was that some students get it, others don’t. Students in her classes had a high rate of failure, which supported her view.
In 2000, when Granby focused on professional development and exploring new teaching strategies, Mrs. Taylor was the school’s biggest opponent. As Beth Ellis recalls, the school took the approach that “you cannot blame the student for not learning — you must look to yourself. Whenever there’s a prob-lem with a student, we ask, ‘What can we do and what can the teacher do to make that child successful?’”
After several group meetings and targeted workshops focused on different approaches to teaching, Mrs. Taylor implemented some of the new ideas in her own classroom. She found that students who had struggled in the past were succeeding with some of the alternative strategies. There was more than one way to teach Algebra, and if a student didn’t get it, she should try something else. Eventually, she saw her classes’ grades improve and pass rates increase. Now Mrs. Tay-lor leads the Algebra department and is its biggest advocate for continuous improvement.
* a pseudonym

19
Ensuring professional development impacts student achievement
Student achievement is the bottom line of teacher professional development in an effective math program. Between 1998 and 2007, Granby students have made tremendous gains on Virginia’s “Standards of Learning” end-of-course tests in math (see Table 6 for details). Equally impressive is the school’s success in nar-rowing the achievement gap in math, as evidenced by a pass rate of 84 percent for black students in Algebra I versus 85 percent for white students in 2006–07.42
Granby’s math department chairperson, Beth Ellis, reports, “We have so many students who, seven years ago, would have been taking general math and are now taking Algebra II.” Based on what she sees in classroom observations and in student performance data, she identifies needs for increasing the math teachers’ con-tent knowledge and teaching skills. She then uses this up-close knowledge of Granby math teachers’ professional learning needs to mobilize resources — within Granby and the district — to meet these needs. With her guidance, department meetings become defacto professional development sessions.
taBle 6. grAnBy PerformAnce dAtA: Percent of StudentS PASSing StAndArdS of LeArning end-of-courSe teSt43,44
0
20
40
60
80
100
2006-07 2006-07 2006-07
ALGEBRA IIGEOMETRYALGEBRA I
1997-98 1997-98 1997-98
20
fenway High school
B o s t o n , M a s s a C h u s e t t s
21
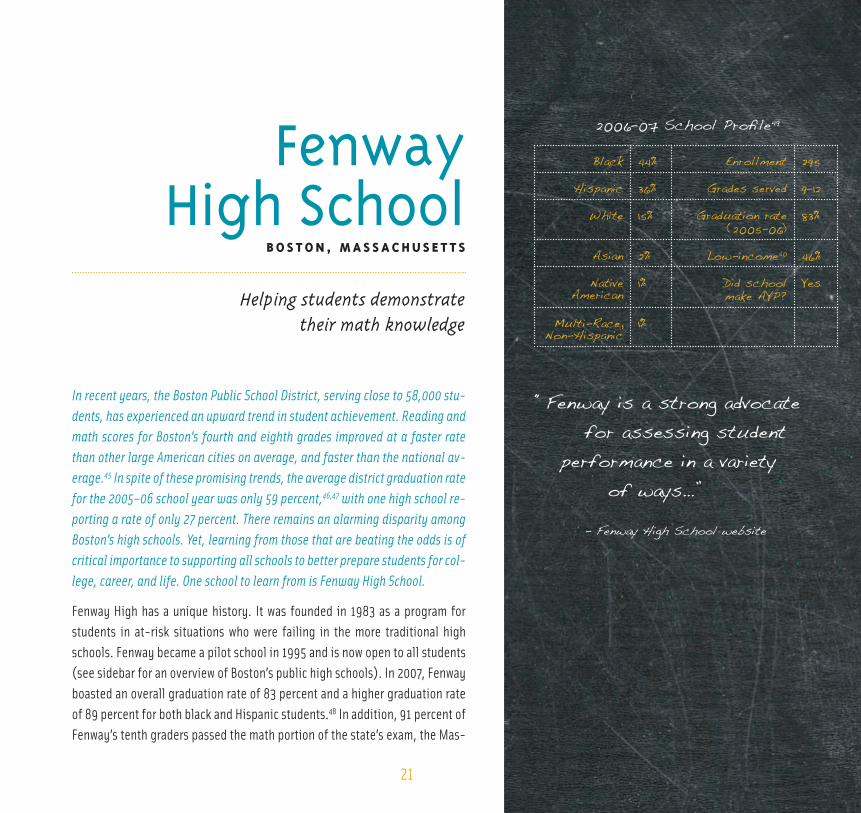
In recent years, the Boston Public School District, serving close to 58,000 stu-dents, has experienced an upward trend in student achievement. Reading and math scores for Boston’s fourth and eighth grades improved at a faster rate than other large American cities on average, and faster than the national av-erage.45 In spite of these promising trends, the average district graduation rate for the 2005–06 school year was only 59 percent,46,47 with one high school re-porting a rate of only 27 percent. There remains an alarming disparity among Boston’s high schools. Yet, learning from those that are beating the odds is of critical importance to supporting all schools to better prepare students for col-lege, career, and life. One school to learn from is Fenway High School.
Fenway High has a unique history. It was founded in 1983 as a program for students in at-risk situations who were failing in the more traditional high schools. Fenway became a pilot school in 1995 and is now open to all students (see sidebar for an overview of Boston’s public high schools). In 2007, Fenway boasted an overall graduation rate of 83 percent and a higher graduation rate of 89 percent for both black and Hispanic students.48 In addition, 91 percent of Fenway’s tenth graders passed the math portion of the state’s exam, the Mas-
2006–07 School Profile49
Black 44% Enrollment 295
Hispanic 36% Grades served 9–12
White 15% Graduation rate (2005-06)
83%
Asian 2% Low-income50 46%
Native American
1% Did school make AYP?
Yes
Multi-Race, Non-Hispanic
1%
fenway High school
B o s t o n , M a s s a C h u s e t t s
Helping students demonstrate their math knowledge
“Fenway is a strong advocate for assessing student performance in a variety of ways…”
– Fenway High School website
22
sachusetts Comprehensive Assessment System (MCAS). Fenway has high expectations for its students and requires all to take and pass four years of math in order to graduate.
fostering a dynamic learning environment
Fenway has an innovative approach to student learning, most notably in math. Staff members work from the assumption that students who can demonstrate or explain math solutions, not just find the right answers, have a deeper understanding of math. Consequently, teachers shape instruction around mul-tiple assessments that gauge students’ understanding of criti-cal math concepts. The school’s approach helps students retain information and concepts that they can apply to other problems or scenarios they may face in other classes or later in life. It also provides the school with deeper insight into students’ math un-derstanding and achievement — information that ultimately is used to help improve learning.
foundation for success: using student informa-tion to drive instruction
Fenway’s principal and math chair both agree that their continuous improvement in mathematics is supported by three key elements:
Developing students’ deep understanding of math ǰ
Using formative assessments to gauge student performance ǰ
Providing resources that both enhance and support ǰstudents’ math knowledge
Developing students’ deep understanding of math
Communicating math. Because the ability to demonstrate or ex-plain math knowledge is at the core of Fenway’s math program, opportunities to communicate math concepts are critical. Walk into any math class and you will hear students and staff talking about math — their understanding of problems and concepts as well as their struggles. While performance on quizzes and exams
“Fenway is a strong advocate for assessing student performance in a variety of
ways: classroom-based diagnostics, portfolios, exhibitions, standardized tests, work
internships, integrated projects, and college acceptances (for seniors). Teachers
write in-depth narrative reports on all students twice a year and give quarterly
grades in-between the reports.”
– From Fenway High School’s website 51
is vitally important, a student’s ability to communicate mathe-matical understanding to others is considered equally important. Fenway’s philosophy is that a student who can teach a concept to another person is more likely to truly understand that concept and therefore retain the information.
Developing math knowledge and confidence. Starting when stu-dents first enter Fenway as freshmen, they have opportunities to present their math ideas to an audience. Throughout their careers at Fenway, students are required to present high-level math problems — from a math fair during freshman year to ex-hibitions held annually. While presenting can be intimidating for some, over time, students develop a strong foundation in math and the confidence needed to be successful. Some of the opportunities to make math presentations are formal — in front of staff, parents, peers, and community members — but a ma-jority are informal and imbedded in everyday interactions and conversations. Regardless of the setting, staff encourage stu-dents to discuss math with one another and with staff to help students develop their understanding of math as well as their skills as presenters — skills that can benefit them regardless of their future aspirations.
Staff point to the skills that this process engenders — a culture of engaged learners who can articulate their beliefs and knowl-edge. Students are continuously discussing and communicating their understanding and sharing their learnings with peers and teachers, creating a dynamic learning environment. Students work in groups and support and challenge each other to clearly articulate their knowledge. Jonathan Spath, Fenway’s math chair, reported that when a student is struggling with a math problem,
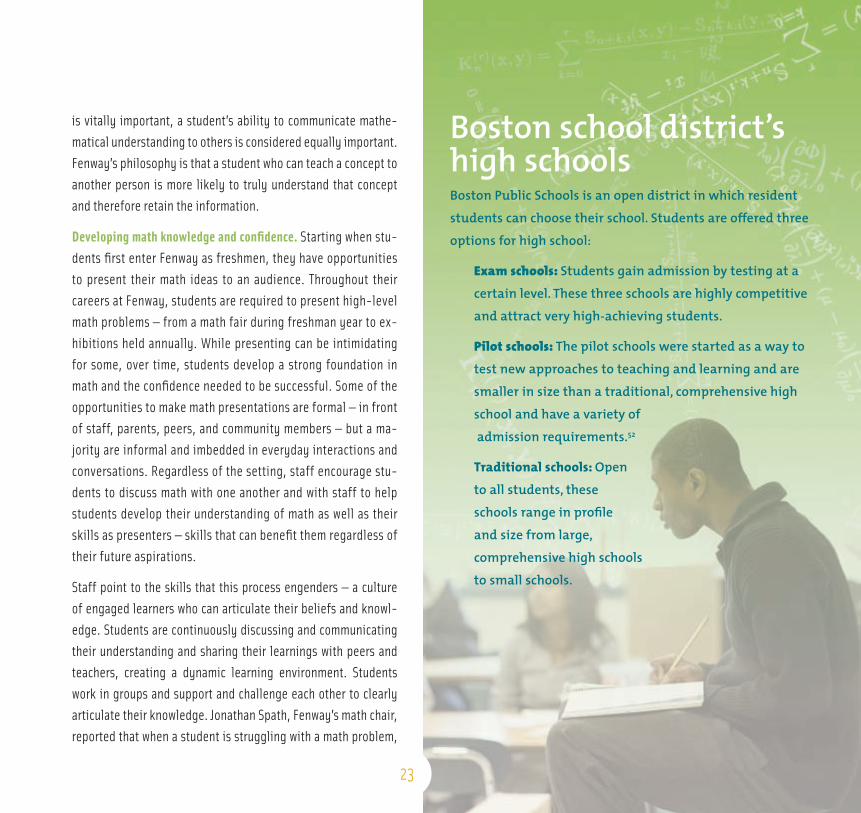
Boston school district’s high schools Boston Public Schools is an open district in which resident
students can choose their school. Students are offered three
options for high school:
Exam schools: Students gain admission by testing at a
certain level. These three schools are highly competitive
and attract very high-achieving students.
Pilot schools: The pilot schools were started as a way to
test new approaches to teaching and learning and are
smaller in size than a traditional, comprehensive high
school and have a variety of
admission requirements.52
Traditional schools: Open
to all students, these
schools range in profile
and size from large,
comprehensive high schools
to small schools.
23

24
classmates are just as likely as the teacher to jump in and of-fer assistance in the form of an alternative explanation. Each of these interactions — from discussions to presentations to group work — provide critical student information, which helps Jona-than assess student understanding and performance.
Using formative assessments to gauge student performance
Formative assessments. Fenway math staff rely on formative as-sessments to inform their teaching practice. As students are al-ways discussing and communicating their understanding of math concepts, teachers use these conversations to gather continuous and timely information about students’ comprehension, gauging where they may need assistance. In addition, teachers grade stu-dents and provide feedback on more formal assessments, such as portfolios and exhibitions.
Authentic assessments. In addition to emphasizing presentation skills, teachers require students to keep portfolios of their math work. Portfolios provide valuable indicators of students’ under-
standing and growth. After each unit, every student must submit a portfolio, which is usually a collection of the student’s best work and a two- to four-page write-up addressing specific competen-cies. Students are required to choose at least three competencies or skills to write about, using examples from their work to dem-onstrate understanding. A valuable authentic assessment, these portfolios are key to building on a student’s knowledge of math.
Research suggests that students whose teachers use informa-tion gleaned from these kinds of assessments (both formal and informal) to inform their instruction often fare better on high-stakes assessments as compared to students whose instruction is more aligned to “teaching to the test.”53 At Fenway, with the various measures the school has in place to assess student learn-ing along the way, there has been a steady increase in students’ performance on the math portion of the statewide MCAS test over the past four years.
Student performance. Since 2004, Fenway students’ performance on the math portion of MCAS has improved considerably — more students are performing at the two highest levels (“proficient”
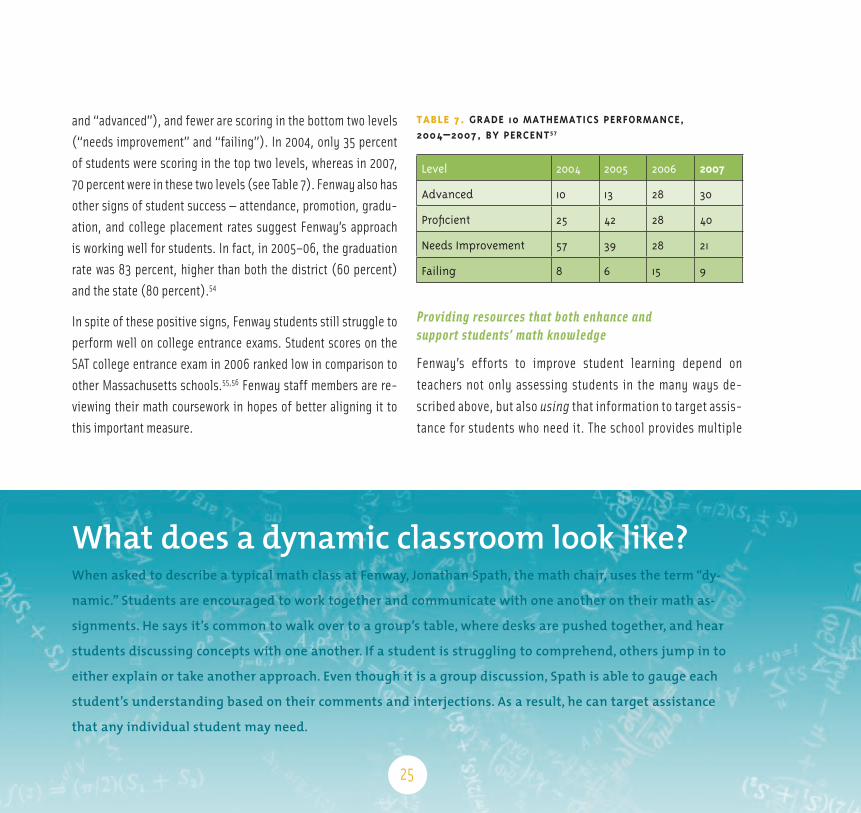
and “advanced”), and fewer are scoring in the bottom two levels (“needs improvement” and “failing”). In 2004, only 35 percent of students were scoring in the top two levels, whereas in 2007, 70 percent were in these two levels (see Table 7). Fenway also has other signs of student success — attendance, promotion, gradu-ation, and college placement rates suggest Fenway’s approach is working well for students. In fact, in 2005–06, the graduation rate was 83 percent, higher than both the district (60 percent) and the state (80 percent).54
In spite of these positive signs, Fenway students still struggle to perform well on college entrance exams. Student scores on the SAT college entrance exam in 2006 ranked low in comparison to other Massachusetts schools.55,56 Fenway staff members are re-viewing their math coursework in hopes of better aligning it to this important measure.
taBle 7. grAde 10 mAthemAticS PerformAnce, 2004–2007, By Percent57
level 2004 2005 2006 2007
advanced 10 13 28 30
proficient 25 42 28 40
needs improvement 57 39 28 21
failing 8 6 15 9
Providing resources that both enhance and support students’ math knowledge
Fenway’s efforts to improve student learning depend on teachers not only assessing students in the many ways de-scribed above, but also using that information to target assis-tance for students who need it. The school provides multiple
What does a dynamic classroom look like?When asked to describe a typical math class at Fenway, Jonathan Spath, the math chair, uses the term “dy-
namic.” Students are encouraged to work together and communicate with one another on their math as-
signments. He says it’s common to walk over to a group’s table, where desks are pushed together, and hear
students discussing concepts with one another. If a student is struggling to comprehend, others jump in to
either explain or take another approach. Even though it is a group discussion, Spath is able to gauge each
student’s understanding based on their comments and interjections. As a result, he can target assistance
that any individual student may need.
25
opportunities for remediation and acceleration to increase students’ math knowledge.
Fenway’s innovative approach to assessment requires constant teacher observation, communication, and intervention. The school’s math teachers regularly engage in detailed conversa-tions about math during weekly two-hour meetings. In these meetings, teachers discuss the needs of individual students and determine the best supports to meet each student’s goals. Some of the support available to students includes after-school, one-on-one sessions with math staff as well as access to the school’s Learning Center, which provides targeted support during the school day and is open to all students after school.
In addition to remedial supports, Fenway offers resources to accelerate students’ learning so they can excel in higher-level math classes. Fenway has a partnership with Emmanuel Col-lege, a liberal arts and sciences college, where students can take college-level math courses and earn college credit. On average, approximately one-third of Fenway’s seniors have taken advan-tage of this opportunity to enroll in college-level math classes at Emmanuel. Access to this caliber of courses is of particular importance, especially for underserved students, given the re-lationship between taking rigorous math courses in high school and being successful later in college.
26

27
endnotes1 Since there is not a standard math requirement across all four-year colleges, we use the term “rigorous math sequence” to imply a course pattern that builds on itself and is not considered remedial. Courses in this sequence generally include Algebra I, Geometry, and Algebra II.
2 Many colleges require applicants to have taken at least three years of math including Algebra I, Geometry, and Algebra II. See, for example, State notes: College ready standards, Education Commission of the States, http://mb2.ecs.org/reports/Report.aspx?id=743, collected November 26, 2007.
3 Carnevale, A.P., & Desrochers, D.M. (2003). The democratization of mathematics. In B.L. Madison & L.A. Steen (Eds.), Quantitative literacy: Why numeracy matters for schools and colleges (pp. 21–31). Princeton, NJ: National Council on Education and the Disciplines.
4 Neild, R., & Balfanz, R. (2006). An extreme degree of difficulty: The educational demographics of urban neighborhood high schools. Journal of Education for Students Placed at Risk, 11(2), 123–141. Mahwah, NJ: Lawrence Erlbaum Associates, Inc.
5 Ibid.
6 Adelman, C. (2006). The toolbox revisited: Paths to degree completion from high school through college. Washington, DC: U.S. Department of Education.
7 Including Algebra I.
8 Including Algebra I, II, and Geometry. Data for California is taken from the UC Counselor Conference 2007 and includes both the CSU system and the UC system. Combined, both systems enrolled over 580,400 undergraduate students in 2006.
9 Perie, M., Grigg, W.S., & Dion, G.S. (2005). The Nation’s Report Card: Mathematics 2005 (NCES 2006–453); U.S. Department of Education, Institute of Education Sciences, National Center for Education Statistics. Washington, DC: U.S. Government Printing Office.
10 For examples of studies reviewing high standards in math for all students, see: Spillane, J. (2004). State standards, assessment, and accountability instruments in practice: Where the rubber meets the road. Evanston, IL: Northwestern University, Institute for Policy Research. For support to students to meet these high standards, see, for example: Balfanz, R., McPartland, J.M., & Shaw, A. (2002). Re-conceptualizing extra help for high school students in a high standards era. Baltimore, MD: Center for Social Organization of Schools, Johns Hopkins University.
11 See, for example: Ball, D. (2003, February 6). What mathematical knowl-edge is needed for teaching mathematics? Remarks from the Secretary’s Summit on Mathematics, U.S. Department of Education; Birman, B., Desimone, L., Porter, A., & Garet, M. (2000). Designing professional development that works. Educational Leadership, 57(8), 28–33.
12 See, for example: Black, P., & Wiliam, D. (1998). Inside the black box: Raising standards through classroom assessment. Phi Delta Kappan, 80(2), 139–148.
13 Adelman (2006).
14 Ibid.
15 See, for example: Ball, D. (1991). Teaching mathematics for understand-ing: What do teachers need to know about subject matter? In M. Kennedy (Ed.), Teaching academic subjects to diverse learners (pp. 63–83). New York: Teachers College Press; Hill, H., Rowan, B., & Ball, D. (2005). Effects of teach-ers’ mathematical knowledge for teaching on student achievement. American Educational Research Journal, 42(2), 371–406.
16 Neild & Balfanz (2006).
17 Greenberg, E., Rhodes, D., Ye, X., & Stancavage, F. (2004, April). Prepared to teach: Teacher preparation and student achievement in eighth-grade mathematics. Washington, DC: AIR.
27

28
18 Ball, D. (1988). Research on teaching mathematics: Making subject mat-ter knowledge part of the equation. In J. Brophy (Ed.), Advances in research on teaching: Vol. 2. Teachers’ subject matter knowledge and classroom instruction. Greenwich, CT: JAI Press.
19 National Council of Teachers of Mathematics (NCTM). (2000). Principles and standards for school mathematics (p. 7). Reston, VA: NCTM.
20 Information from Virginia Department of Education, https://p1pe.doe.virginia.gov/reportcard/, collected November 26, 2007.
21 Information from Massachusetts Department of Education, http://profiles.doe.mass.edu, collected November 20, 2007.
22 No ranking available for 2004.
23 Bondy, H., Brillman, D., & Kaufman, B. (2006). America’s top public high schools. Newsweek. Collected October 8, 2007.
24 Information from the Office of Superintendent of Public Instruction, Washington State Report Card, http://reportcard.ospi.k12.wa.us/summary.aspx?year=2006-07, collected October 1, 2007.
25 Ibid., collected October 10, 2007.
26 Adelman (2006).
27 Information from Bellevue School District, http://www.bsd405.org/Default.aspx?tabid=505, collected October 15, 2007.
28 Writing section of SAT introduced in 2006.
29 Bellevue School District (2007).
30 Defined as a 3 or higher on the AP exam or “passing” on the IB exam.
31 Bellevue School District (2007).
32 School year 2006–07 is the first year of a self-contained, gifted program at Interlake High School.
33 Bellevue School District (2007).
34 Adelman (2006).
35 Information from International Baccalaureate, http://www.ibo.org/who/index.cfm, collected October 3, 2007.
36 Information from Northwest Regional Educational Laboratory, Schools Making Progress series, Granby High School, http://www.nwrel.org/scpd/sslc/descriptions/grnby/index.asp, collected July 2, 2007.
37 R. Brown (personal communication, December 3, 2007).
38 Ibid. Data also provided by Norfolk Public Schools, collected November 28, 2007.
39 Information from Virginia Department of Education, https://p1pe.doe.virginia.gov/reportcard/, collected November 26, 2007.
40 Greenberg, Rhodes, Ye, & Stancavage (2004, April).
41 See, for example: Darling-Hammond, L. (1994, November). The current status of teaching and teacher development in the United States. New York: Teachers College, Columbia University; Darling-Hammond, L. (1996, March). The quiet revolution: Rethinking teacher development. Educational Leader-ship, 53(6), 4–10; McLaughlin, M.W., & Talbert, J.E. (1993). Contexts that matter for teaching and learning. Stanford, CA: Center for Research on the Context of Secondary School Teaching, Stanford University.
42 Information from Norfolk Public Schools, http://cf.nps.k12.va.us/per-form06/performhs/pr_hs06.cfm?DID=001, collected November 26, 2007.
43 Information from Norfolk Public Schools, Division performance report executive summary: 2004–05, http://www.nps.k12.va.us, collected February 9, 2006.
44 Information from Norfolk Public Schools, http://cf.nps.k12.va.us/per-form06/performhs/pr_hs06.cfm?DID=001, collected November 26, 2007.
NOTE: Data for 2003–05 school years differs from data reported in Division performance report executive summary.
28

29
45 The National Assessment of Educational Progress. (2006). The Nation’s Report Card: Trial Urban District Assessment, mathematics 2005 (NCES 2006-457rev). Washington, DC: U.S. Department of Education, National Center for Education Statistics, Institute of Education Sciences.
46 This four-year graduation rate applies to students who started ninth grade in September of 2002 and graduated in June 2006. Students who did not graduate in the four-year time period are identified as “still in school.”
47 Information from Massachusetts Department of Education, http://pro-files.doe.mass.edu/, collected November 26, 2007.
48 Ibid.
49 Information from Massachusetts Department of Education, http://pro-files.doe.mass.edu/home.asp?mode=so&view=all&mcasyear=2007&ot=5&o=1, collected November 13, 2007.
50 Low income is an indication of whether a student meets any one of the following criteria: eligible for free or reduced price lunch, receives Transitional Aid to Families benefits, or eligible for food stamps.
51 Information from http://fenway.boston.k12.ma.us/AboutFenway/Over-view/Assessment.shtml, collected November 13, 2007.
52 For more information on Boston’s Pilot High Schools, see: Strong results, high demand: A four-year study of Boston’s Pilot high schools, executive summary (2007, November). Boston: Center for Collaborative Education.
53 Atkin, J. M., & Coffey, J. (Eds.). (2003). Everyday assessment in the sci-ence classroom. Arlington, VA: National Science Teachers Association.
54 Massachusetts Department of Education (2005).
55 For example, in 2006, the average math score was 422 out of a possible 800, which ranked Fenway only 285 out of 336 schools.
56 Information from The Boston Globe, “2006 SAT scores for Massachusetts High Schools,” http://www.boston.com, collected November 20, 2007.
57 Information from Massachusetts Department of Education, 2007 MCAS annual comparisons, http://profiles.doe.mass.edu, collected November 20, 2007.
29
30
referencesAdelman, C. (2006). The toolbox revisited: Paths to degree completion from high school through college. Washington, DC: U.S. Department of Education.
Carnevale, A.P., & Desrochers, D.M. (2003). The democratization of mathematics. In B.L. Madison & L.A. Steen (Eds.), Quantita-tive literacy: Why numeracy matters for schools and colleges (pp. 21–31). Princeton, NJ: National Council on Education and the Disciplines.
Ball, D. (1991). Teaching mathematics for understanding: What do teachers need to know about subject matter? In M. Kennedy (Ed.), Teaching academic subjects to diverse learners (pp. 63–83). New York: Teachers College Press.
Ball, D. (1988). Research on teaching mathematics: Making subject matter knowledge part of the equation. In J. Brophy (Ed.), Advanc-es in research on teaching: Vol. 2. Teachers’ subject matter knowledge and classroom instruction. Greenwich, CT: JAI Press.
Darling-Hammond, L. (1994, November). The current status of teaching and teacher development in the United States. New York: Teachers College, Columbia University.
Darling-Hammond, L. (1996, March). The quiet revolution: Rethinking teacher development. Educational Leadership, 53(6), 4–10.
McLaughlin, M.W., & Talbert, J.E. (1993). Contexts that matter for teaching and learning. Stanford, CA: Center for Research on the Context of Secondary School Teaching, Stanford University.

©2008. Bill & Melinda Gates Foundation. All rights reserved.
Public and private organizations have joined
together to invest billions of dollars to help
identify barriers to college-readiness and
strategies that help students succeed. Since
2000, the Bill & Melinda Gates Foundation
has invested more than $1.7 billion to im-
prove more than 1,800 schools in 47 states
and the District of Columbia. The Foundation
and its partners are focused on increasing
graduation and college-readiness rates by
supporting the creation of new high-quality
high schools and the transformation of ex-
isting low-performing high schools into
more focused and effective learning envi-
ronments. The Foundation’s investments are
aimed at creating a portfolio of innovative
education options that serve a full spectrum
of students’ needs with the goal that ev-
ery student is well prepared for success in
college, career, and life regardless of their
background or circumstance.
The Bill & Melinda Gates Foundation (www.gatesfoundation.org) works to promote greater equity in four areas: global health, education, public libraries, and support for at-risk families in Washington state and Oregon. The Seattle-based foundation joins lo-cal, national, and international partners to ensure that advances in these areas reach those who need them most. The Foundation is led by Bill Gates’s father, William H. Gates, Sr., and Patty Stonesifer.
WestEd, a nonprofit research, development, and service agency, works with education and other communities to promote excellence, achieve equity, and improve learning for children, youth, and adults. While WestEd serves the states of Arizona, California, Nevada, and Utah as one of the nation’s Regional Educational Laboratories, our agency’s work extends throughout the United States and abroad. It has 14 offices nationwide, from Washington and Boston to Arizona, Southern California, and its headquarters in San Francisco.
For more information about WestEd:
visit our Web site http://www.WestEd.org; call 415.565.3000 or, toll-free, (877) 4-WestEd; or write: WestEd, 730 Harrison Street, San Francisco, CA 94107-1242.