Embed Size (px)
Citation preview
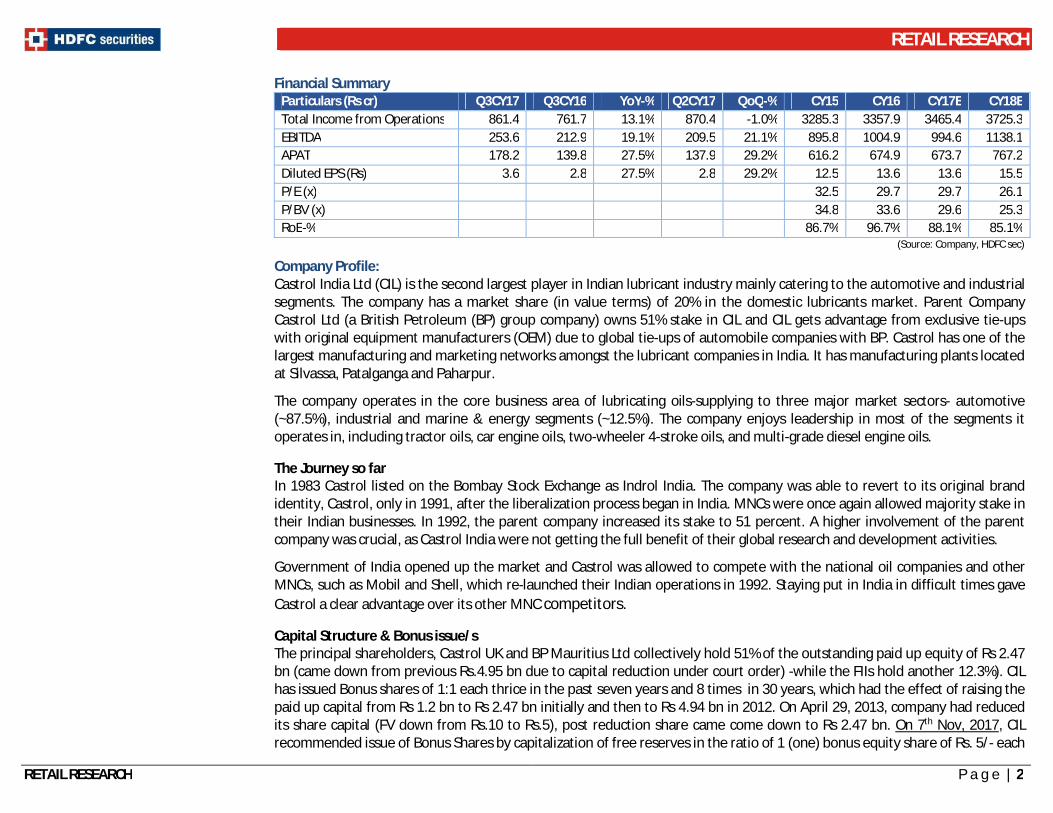
RETAIL RESEARCH Event based Stock opportunity 14 Dec 2017
Castrol India Ltd
RETAIL RESEARCH P a g e | 1
Industry CMP Recommendation Add on dips to Sequential Targets Time Horizon Lubricants Rs. 405 Buy at CMP and add on declines Rs. 377-383 Rs. 449 and 512 4-6 quarters
Castrol India Ltd (CIL) is the second largest player in Indian lubricant industry mainly catering to the automotive and industrial segments. The company has a market share (in value terms) of 20% in the domestic lubricants market. Parent Company Castrol Ltd (a British Petroleum (BP) group company) owns 51% stake in CIL and CIL gets advantage from exclusive tie-ups with original equipment manufacturers (OEM) due to global tie-ups of automobile companies with BP. Castrol has one of the largest manufacturing and marketing networks amongst the lubricant companies in India. It has manufacturing plants located at Silvassa, Patalganga and Paharpur.
Investment Rationale: • Lower crude oil price/ lube oil price and resurgence in volume growth to increase its sales and margins. • Revival in CV sales to help arrest decline in lubricants volume. • Robust balance sheet and strong financial track record. • Castrol has consistently been investing 6-7% of its sales in brand building.
Concerns: • Slower-than-expected growth in auto volumes and industrial growth. • Sharp increase in raw material prices. • A “natural” reason for lubricant volumes to decline thanks to newer technology and adoption of electric vehicles. • Higher competition. Exchange rate volatility. • Stake sale by promoter could impact investor’s confidence on the stock.
View and Valuation: Given the rapid pace of industrialization and good growth in automobile sales, we are comfortable about the growth prospects for lubricants market and business growth of Castrol in the medium term. The company is in a strong position to benefit from growth prospects on account of its strong brands and enduring relationships with key stakeholders. CIL continues to remain optimistic about the Indian lubricant market and its business growth.
After a subdued CY17, Castrol looks forward to a much better CY18. The Castrol management is confident about prospects of its business in India over the long term and has decided to continue making investments in India unabated by recent slow growth. Lower crude oil and lube oil prices augur well for the margin trajectory. The stock goes ex-bonus on Dec 21, 2017 (1:1) and could see some buying ahead of this date. We believe the stock makes for good investment over the short to medium long term. The stock deserves to get valuation of an FMCG player given the brand pull it carries especially as volume growth seems to have resumed. We feel investors could buy the stock at the CMP and add on dips to Rs. 377 - 383 band (~24.5x of CY18E EPS) for sequential targets of Rs 449 and Rs 512 (29x and 33x of CY18E EPS). At the CMP of Rs 405 the stock trades at 26.1x of CY18E EPS.
HDFC Scrip Code CASINDEQNR
BSE Code 500870
NSE Code CASTROLIND
Bloomberg CSTRL IN
CMP Dec 14 2017 Rs. 405
Equity Capital (Rs crs) 247.5
Face Value (Rs) 5.0
Equity Share O/S (crs) 49.5
Market Cap (Rs crs) 20031.3
Book Value (Rs) 12.05
Avg. 52 Wk Volumes 833405
52 Week High 453.8
52 Week Low 353.2
Shareholding Pattern % (Sept 30, 17)
Promoters 51.0
Institutions 30.6
Non Institutions 18.4
Total 100.0 Fundamental Research Analyst Abdul Karim [email protected]
RETAIL RESEARCH
RETAIL RESEARCH P a g e | 2
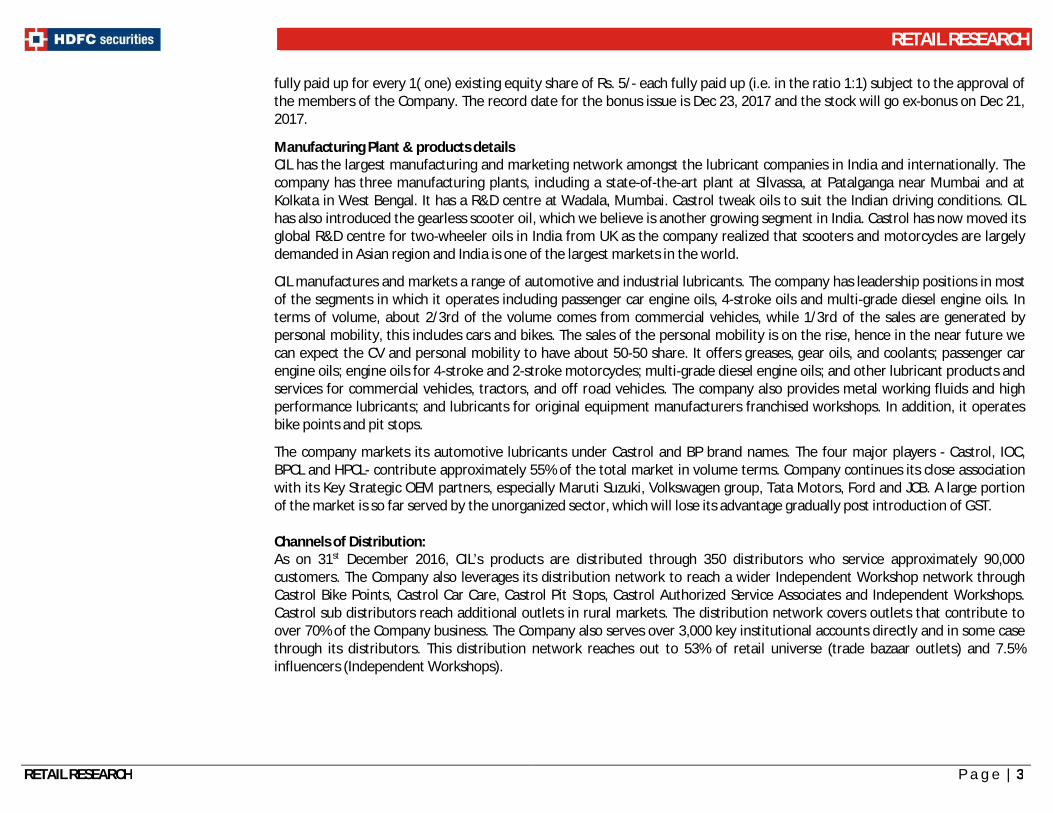
Financial Summary Particulars (Rs cr) Q3CY17 Q3CY16 YoY-% Q2CY17 QoQ-% CY15 CY16 CY17E CY18E Total Income from Operations 861.4 761.7 13.1% 870.4 -1.0% 3285.3 3357.9 3465.4 3725.3 EBITDA 253.6 212.9 19.1% 209.5 21.1% 895.8 1004.9 994.6 1138.1 APAT 178.2 139.8 27.5% 137.9 29.2% 616.2 674.9 673.7 767.2 Diluted EPS (Rs) 3.6 2.8 27.5% 2.8 29.2% 12.5 13.6 13.6 15.5 P/E (x) 32.5 29.7 29.7 26.1 P/BV (x) 34.8 33.6 29.6 25.3 RoE-% 86.7% 96.7% 88.1% 85.1%
(Source: Company, HDFC sec)
Company Profile: Castrol India Ltd (CIL) is the second largest player in Indian lubricant industry mainly catering to the automotive and industrial segments. The company has a market share (in value terms) of 20% in the domestic lubricants market. Parent Company Castrol Ltd (a British Petroleum (BP) group company) owns 51% stake in CIL and CIL gets advantage from exclusive tie-ups with original equipment manufacturers (OEM) due to global tie-ups of automobile companies with BP. Castrol has one of the largest manufacturing and marketing networks amongst the lubricant companies in India. It has manufacturing plants located at Silvassa, Patalganga and Paharpur.
The company operates in the core business area of lubricating oils-supplying to three major market sectors- automotive (~87.5%), industrial and marine & energy segments (~12.5%). The company enjoys leadership in most of the segments it operates in, including tractor oils, car engine oils, two-wheeler 4-stroke oils, and multi-grade diesel engine oils. The Journey so far In 1983 Castrol listed on the Bombay Stock Exchange as Indrol India. The company was able to revert to its original brand identity, Castrol, only in 1991, after the liberalization process began in India. MNCs were once again allowed majority stake in their Indian businesses. In 1992, the parent company increased its stake to 51 percent. A higher involvement of the parent company was crucial, as Castrol India were not getting the full benefit of their global research and development activities.
Government of India opened up the market and Castrol was allowed to compete with the national oil companies and other MNCs, such as Mobil and Shell, which re-launched their Indian operations in 1992. Staying put in India in difficult times gave Castrol a clear advantage over its other MNC competitors. Capital Structure & Bonus issue/s The principal shareholders, Castrol UK and BP Mauritius Ltd collectively hold 51% of the outstanding paid up equity of Rs 2.47 bn (came down from previous Rs.4.95 bn due to capital reduction under court order) -while the FIIs hold another 12.3%). CIL has issued Bonus shares of 1:1 each thrice in the past seven years and 8 times in 30 years, which had the effect of raising the paid up capital from Rs 1.2 bn to Rs 2.47 bn initially and then to Rs 4.94 bn in 2012. On April 29, 2013, company had reduced its share capital (FV down from Rs.10 to Rs.5), post reduction share came come down to Rs 2.47 bn. On 7th Nov, 2017, CIL recommended issue of Bonus Shares by capitalization of free reserves in the ratio of 1 (one) bonus equity share of Rs. 5/- each
RETAIL RESEARCH
RETAIL RESEARCH P a g e | 3
fully paid up for every 1( one) existing equity share of Rs. 5/- each fully paid up (i.e. in the ratio 1:1) subject to the approval of the members of the Company. The record date for the bonus issue is Dec 23, 2017 and the stock will go ex-bonus on Dec 21, 2017.
Manufacturing Plant & products details CIL has the largest manufacturing and marketing network amongst the lubricant companies in India and internationally. The company has three manufacturing plants, including a state-of-the-art plant at Silvassa, at Patalganga near Mumbai and at Kolkata in West Bengal. It has a R&D centre at Wadala, Mumbai. Castrol tweak oils to suit the Indian driving conditions. CIL has also introduced the gearless scooter oil, which we believe is another growing segment in India. Castrol has now moved its global R&D centre for two-wheeler oils in India from UK as the company realized that scooters and motorcycles are largely demanded in Asian region and India is one of the largest markets in the world.
CIL manufactures and markets a range of automotive and industrial lubricants. The company has leadership positions in most of the segments in which it operates including passenger car engine oils, 4-stroke oils and multi-grade diesel engine oils. In terms of volume, about 2/3rd of the volume comes from commercial vehicles, while 1/3rd of the sales are generated by personal mobility, this includes cars and bikes. The sales of the personal mobility is on the rise, hence in the near future we can expect the CV and personal mobility to have about 50-50 share. It offers greases, gear oils, and coolants; passenger car engine oils; engine oils for 4-stroke and 2-stroke motorcycles; multi-grade diesel engine oils; and other lubricant products and services for commercial vehicles, tractors, and off road vehicles. The company also provides metal working fluids and high performance lubricants; and lubricants for original equipment manufacturers franchised workshops. In addition, it operates bike points and pit stops.
The company markets its automotive lubricants under Castrol and BP brand names. The four major players - Castrol, IOC, BPCL and HPCL- contribute approximately 55% of the total market in volume terms. Company continues its close association with its Key Strategic OEM partners, especially Maruti Suzuki, Volkswagen group, Tata Motors, Ford and JCB. A large portion of the market is so far served by the unorganized sector, which will lose its advantage gradually post introduction of GST. Channels of Distribution: As on 31st December 2016, CIL’s products are distributed through 350 distributors who service approximately 90,000 customers. The Company also leverages its distribution network to reach a wider Independent Workshop network through Castrol Bike Points, Castrol Car Care, Castrol Pit Stops, Castrol Authorized Service Associates and Independent Workshops. Castrol sub distributors reach additional outlets in rural markets. The distribution network covers outlets that contribute to over 70% of the Company business. The Company also serves over 3,000 key institutional accounts directly and in some case through its distributors. This distribution network reaches out to 53% of retail universe (trade bazaar outlets) and 7.5% influencers (Independent Workshops).
RETAIL RESEARCH
RETAIL RESEARCH P a g e | 4
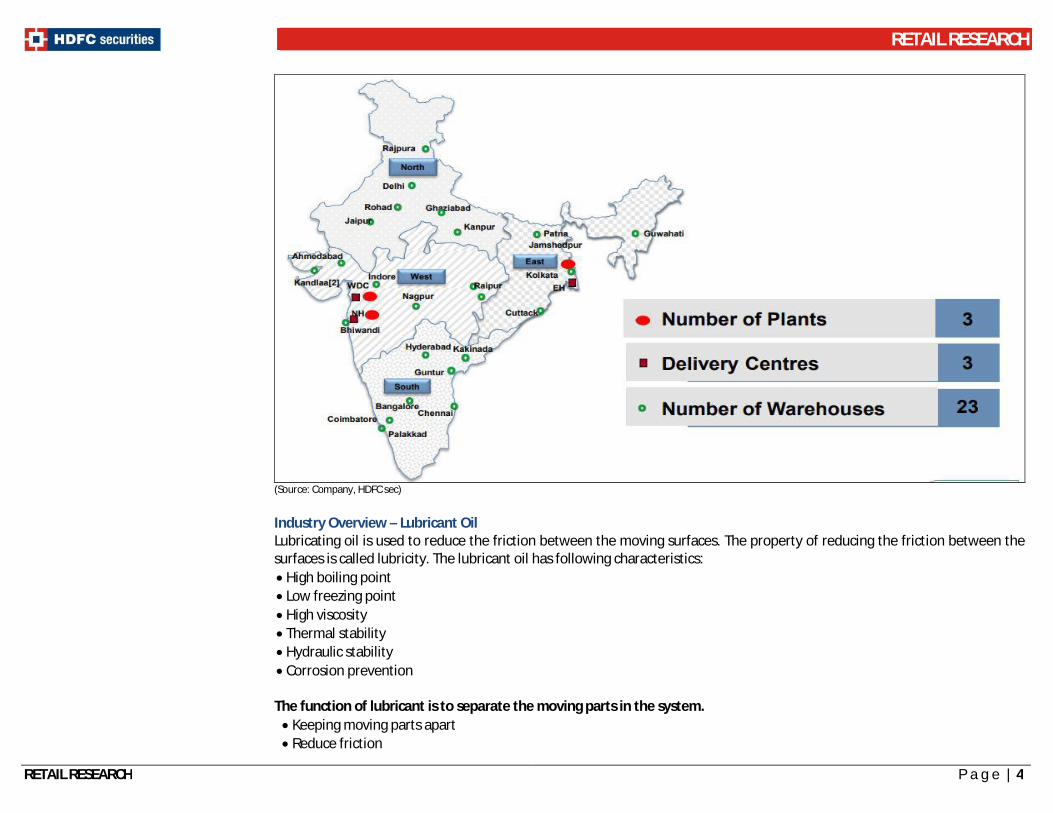
(Source: Company, HDFC sec)
Industry Overview – Lubricant Oil Lubricating oil is used to reduce the friction between the moving surfaces. The property of reducing the friction between the surfaces is called lubricity. The lubricant oil has following characteristics: High boiling point Low freezing point High viscosity Thermal stability Hydraulic stability Corrosion prevention
The function of lubricant is to separate the moving parts in the system. Keeping moving parts apart Reduce friction
RETAIL RESEARCH
RETAIL RESEARCH P a g e | 5
Transfer heat Transmit power Protect against wear Prevent corrosion Seal for gases
India is the third largest lubricant market in the world after the U.S.A. and China. India produces 5 to 6 percent of the total global lube production. The Indian lubricant market is mainly divided into two parts - industrial lubricants and automotive lubricants. Indian automotive lubricants constitute 65% whereas industrial lubricant oil constitutes 35% of the market. The majority market share of the India lubricant market is covered by automotive lubricants. The Indian lubricant market is expected to rise at a rate of 4.65%, the fastest in the Asia-Pacific region, during the forecast period of 2017-2022.
The India auto lubricant manufacturer produces classified into two types:
(1) Private Lubricant Manufacturer- Castrol India Ltd., Tide Water Oil Corporation Ltd., Gulf Oil Corporation Ltd Company Name Brand Name Major Product Castrol India Ltd Castrol Castrol GTX Modern Engine , Castrol GTX 20W50, Castrol Edge , CASTROL GTX DIESEL,
Castrol MAGNATEC Gulf Oil Corporation Ltd Super fleet Super fleet LE Max 15w-40, Super fleet Max 15w-40, Gulfco 1049 Max Tide Water Oil Corp Ltd Veedol HDB 30, 40, 50, HDB 20W, 40, HDB 30, 40, HDC30, 40, HDC Fleet 30, 40
(Source: Company, HDFC sec) (2) PSUs – Indian Oil Corporation, Bharat Petroleum Corporation Ltd., Hindustan Petroleum Corporation Ltd
Company Name Brand Name Major Product BPCL MAK MAK Supreme, MAK Multigrade, MAK Gold, MAK Gold Plus, MAK Diamond HPCL HP HP Extra Super Motor Oil, HP Cruise, HP Racer, HP Laal Ghoda, HP Milcy Power, HP Pumpset OIL IOC SERVO SERVO 2T Supreme, SERVO Pride, SERVO Ultra, SERVO Premium
(Source: Company, HDFC sec) The synthetic oil market share will grow in India: The lubricants industry in India is dominated by IOC (Servo brand), Bharat Petroleum Corporation (MAK) and Hindustan Petroleum Corporation (Turbo). These have almost half the market share. The rest is with private multinationals, including Shell, Gulf Oil, Castrol, Exxon Mobil, Total, IPOL and smaller companies. However, Castrol dominates the automotive lubricant oil market, with 19% share of the bazaar segment, followed by IOCL, which has 14% share of the bazaar segment according to industry estimates. Private players like Castrol, Shell, Gulf Oil, etc. account for 75% of the bazaar segment while the oil PSUs account for 25%.
Expecting demand boost in the industry With economic reforms gaining momentum, India’s long term prospects for growth remain optimistic. Demand for automotive lubricants is generally driven by usage of vehicles in the country, while the growth in recent years has been due to rapid expansion of vehicle population. Lower fuel prices and stable interest rates, in particular, are expected to drive the demand for cars and two wheelers and hence automotive manufacturing. Apart from this, with increasing rural incomes due
RETAIL RESEARCH
RETAIL RESEARCH P a g e | 6
to favorable monsoon condition and better sources of finance, the trend of growth in two-wheeler sales in rural markets is expected to continue. Already, 50% of two-wheelers are sold in the small towns and villages. Providing reliable supply of engine oils in these geographies is a sizeable opportunity.
Recent development in the Industry: In October 2017, Gulf Oil Lubricants India Ltd (Gulf Oil International) announced that its 2nd plant in Chennai was nearing
completion and the company expected to start operations at the plant by the end of the year. In October 2017, GP Petroleum Ltd announced that it would be closing its Daman plant, after the government discontinued
tax benefits under the GST (Goods & Services Tax) system. In October 2017, Suzuki, India’s largest car manufacturer launched Ecstar – its own brand of lubricants and coolants. In June 2017, Shell Lubricants planned to increase its market share by over 5% in segments like petrochemicals, textile,
fertilizer, and defense.
Investment Rationale
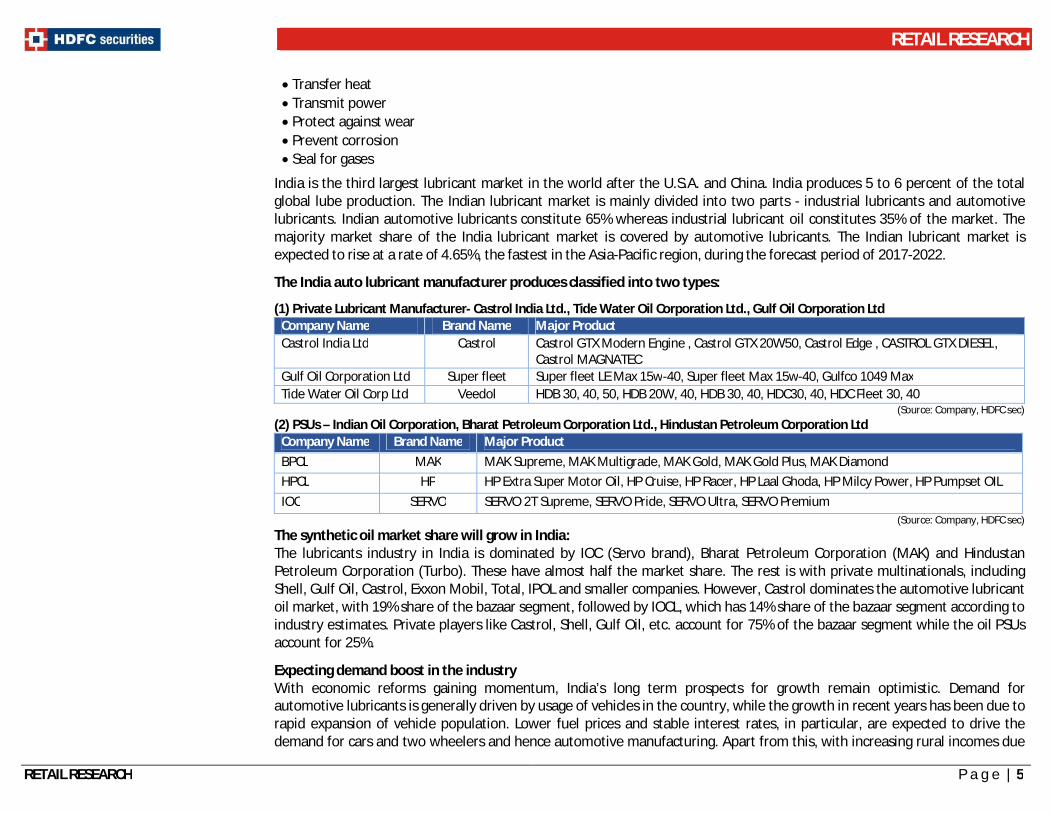
Steady crude oil price and improvement in volume to increase its margins With the steady trend in crude oil prices, raw material costs (base oil prices) are not expected to go up much, aiding the improvement in margins. With expectations of an increase in auto sales, the management expects an increase in its volumes. With flattish trend in base oil prices (from USD750/t to USD 820/t now) and improved product mix, we now expect Castrol’s gross margin/litre to expand. If the Brent crude price sustains at a range of USD 60-65/bbl and as new base oil capacities are commissioned globally, base oil prices could fall further, increasing Castrol’s gross margins. During the last five years, when oil prices declined YoY in CY09, CY13 and CY15, Castrol achieved the highest YoY growth in its gross margins/litre. If base oil prices soften further or sustain at present level, it could lead to further margin expansion and rerating.
Base Oil Prices:
(Source: Bloomberg, HDFC Sec)
RETAIL RESEARCH
RETAIL RESEARCH P a g e | 7
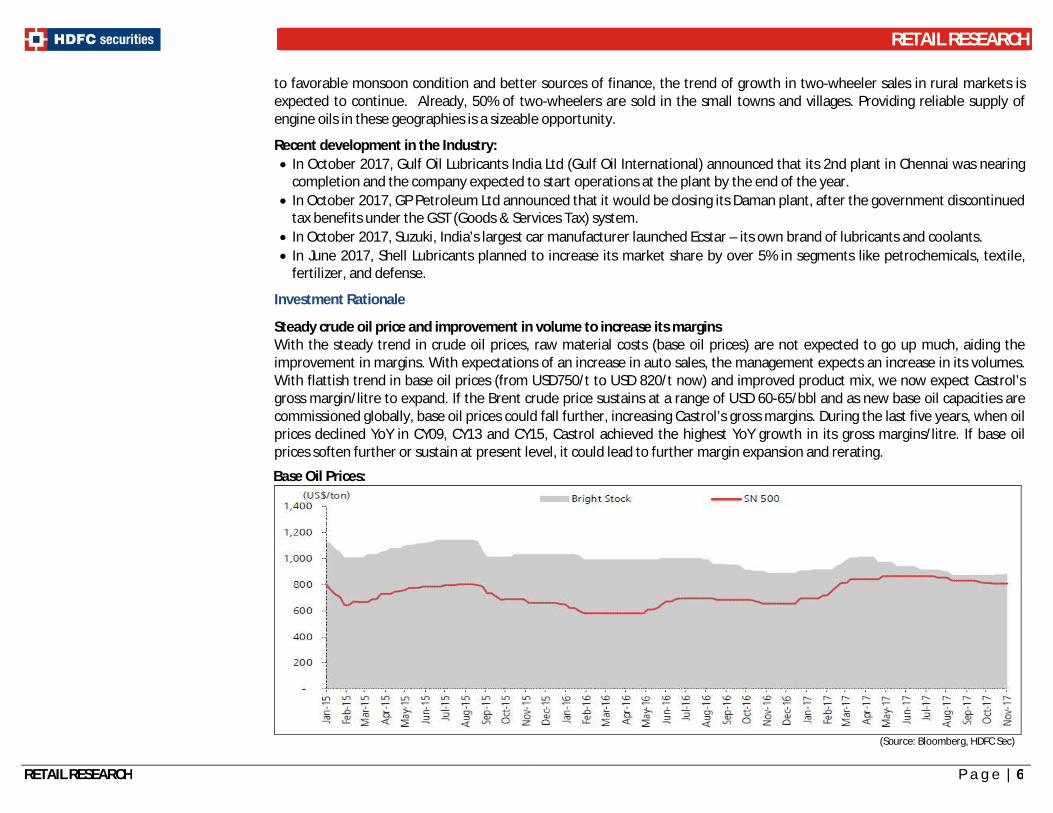
Revival in CV sales to help arrest decline in lubricants volume and lead to consistent volume growth; As on 31st Dec 2016, automotive lubricants account for ~87.5% of its revenues. A demand revival in Indian automotive industry could spur its volume growth. With revival in heavy commercial vehicle sales growth , CIL has also reported volume growth of 7.4% in Q3CY17, compared to last 5-yr CAGR decline of 1.2%, driven by recovery in CV and industrial segments. Despite GST related de-stocking in Q3CY17, CIL reported volume growth of 7.2% (YoY). There are initial signs of recovery in demand for diesel engine oil and industrial lubes, both of which have been subdued over the past few years. A potential recovery in lubricants demand driven by a buoyant economy may augur well in the near term, though the volume growth may not sustain at a high pace due to lengthening drain intervals and high competitive intensity. With over 85% share in sales, acceleration in auto demand should drive CIL’s lubricant volume growth. We expect Infrastructure development such as road and highways could support auto volume growth. Over the past 15 years, India has doubled the length of its national highways. At present the total length of highways in India stands at only 33 lacs kms road network including expressway, National highway, state highways, Major district road, and rural and other roads compared with 43 lacs km in China. As the network of highways in India increases over the next five years, it should also help drive consumption of better-quality cars and trucks in India.
Commercial Vehicle (CV), Passenger Vehicle (PV) and 2W sales in India over the last 3 years
(Source: Company, HDFC sec)
CIL’s sales volumes have de-grown over the years, not only due to increasing drain interval, but also because it has deliberately vacated the price-sensitive volume-driven market. Castrol depends on technology innovation and path breaking new product launches to drive growth and ability to organically generate growth through internal initiatives which is the most sustainable source of growth. Castrol management is very optimistic for volume growth going forward. We expect that
RETAIL RESEARCH
RETAIL RESEARCH P a g e | 8
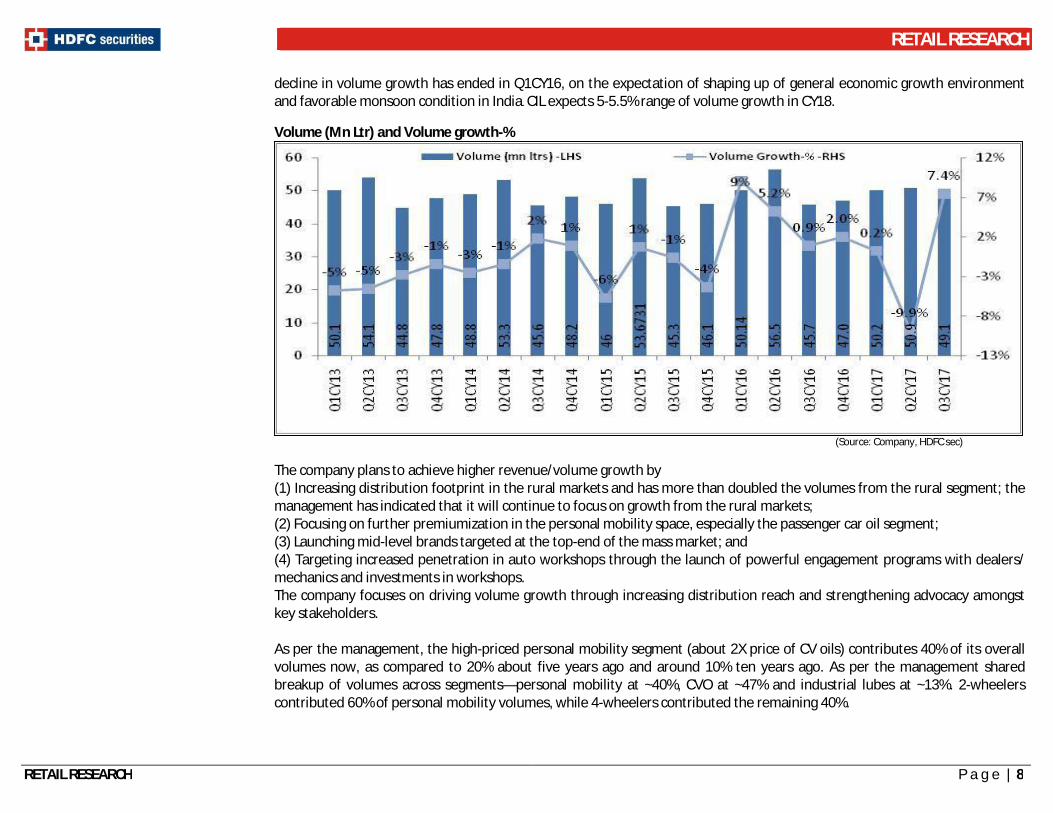
decline in volume growth has ended in Q1CY16, on the expectation of shaping up of general economic growth environment and favorable monsoon condition in India. CIL expects 5-5.5% range of volume growth in CY18.
Volume (Mn Ltr) and Volume growth-%
(Source: Company, HDFC sec)
The company plans to achieve higher revenue/volume growth by (1) Increasing distribution footprint in the rural markets and has more than doubled the volumes from the rural segment; the management has indicated that it will continue to focus on growth from the rural markets; (2) Focusing on further premiumization in the personal mobility space, especially the passenger car oil segment; (3) Launching mid-level brands targeted at the top-end of the mass market; and (4) Targeting increased penetration in auto workshops through the launch of powerful engagement programs with dealers/ mechanics and investments in workshops. The company focuses on driving volume growth through increasing distribution reach and strengthening advocacy amongst key stakeholders. As per the management, the high-priced personal mobility segment (about 2X price of CV oils) contributes 40% of its overall volumes now, as compared to 20% about five years ago and around 10% ten years ago. As per the management shared breakup of volumes across segments—personal mobility at ~40%, CVO at ~47% and industrial lubes at ~13%. 2-wheelers contributed 60% of personal mobility volumes, while 4-wheelers contributed the remaining 40%.
RETAIL RESEARCH
RETAIL RESEARCH P a g e | 9
Robust balance sheet and strong financial track record: The financial highlights of the past ten years make for pleasant reading. The net revenues from operations have grown consistently each year over that of the base year 2006. In figure terms, the revenues from operations rose from Rs 1802.5 cr (CY06) to Rs 3370.3 cr (CY16) - 6% CAGR over the period. The Company reported EBITDA margin at a range of 27-30% and PAT margin at a range of 18.5-20% over the last 2 years.
The dividend payout amounts to close to 85% of the post tax profit. The high payout could partly be due to the fact that the company does not require a high fixed asset base to sell its produce on the one hand, and the point that the company sells almost cash down with low inventory levels to boot, and no long term or short term investments to take care of. Hence the cash support needed for working capital finance too is limited. As of CY16, one of the biggest expenses item on revenue account is advertising and sales promotion expenditure amounting to Rs 245.5 cr, (7.3% of Net Sales). The fixed asset base, inclusive of intangible assets stood at Rs.184 cr generated gross revenues excluding other income of Rs 3370 cr as on 31st Dec 2016. The cash flow statement definitely reveals a company in full flow. The company generated net cash of Rs 822 cr (Vs Rs 697 cr in CY15) from operations. The company has been debt free for many years.
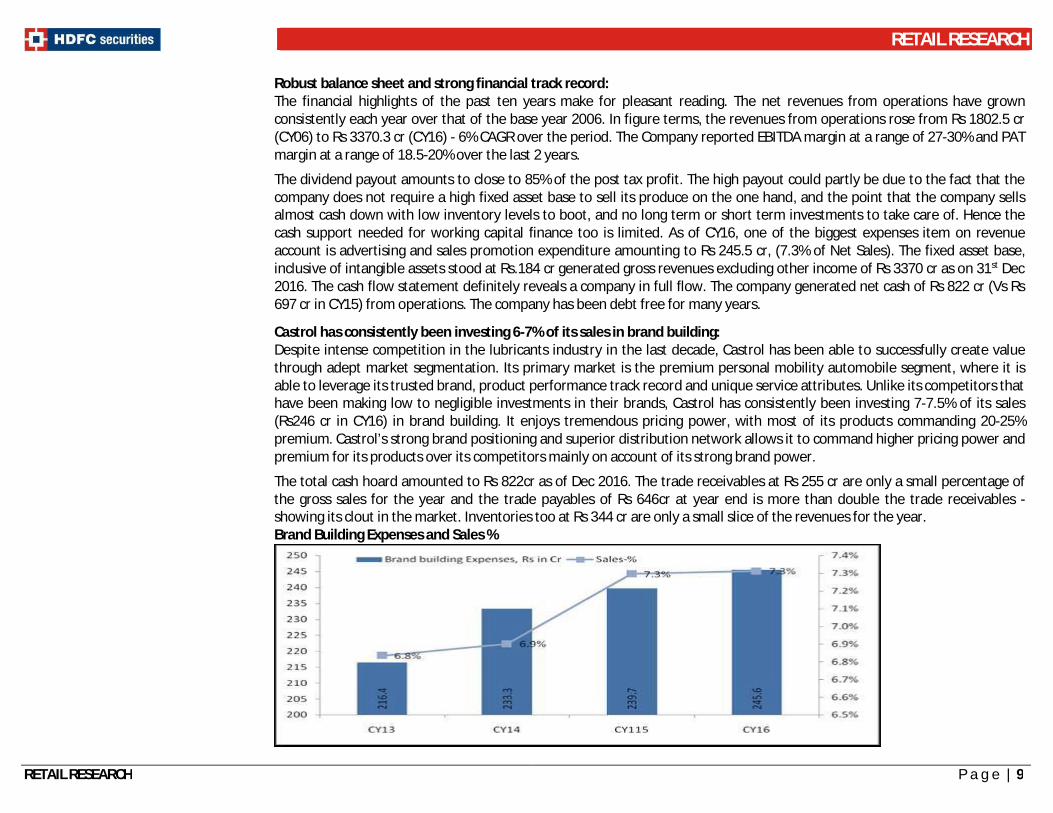
Castrol has consistently been investing 6-7% of its sales in brand building: Despite intense competition in the lubricants industry in the last decade, Castrol has been able to successfully create value through adept market segmentation. Its primary market is the premium personal mobility automobile segment, where it is able to leverage its trusted brand, product performance track record and unique service attributes. Unlike its competitors that have been making low to negligible investments in their brands, Castrol has consistently been investing 7-7.5% of its sales (Rs246 cr in CY16) in brand building. It enjoys tremendous pricing power, with most of its products commanding 20-25% premium. Castrol’s strong brand positioning and superior distribution network allows it to command higher pricing power and premium for its products over its competitors mainly on account of its strong brand power.
The total cash hoard amounted to Rs 822cr as of Dec 2016. The trade receivables at Rs 255 cr are only a small percentage of the gross sales for the year and the trade payables of Rs 646cr at year end is more than double the trade receivables - showing its clout in the market. Inventories too at Rs 344 cr are only a small slice of the revenues for the year. Brand Building Expenses and Sales %
RETAIL RESEARCH
RETAIL RESEARCH P a g e | 10
To benefit from industry transition The distribution channel for automotive lubricants (lubes) witnessed a major transition from the traditional ‘public sector petrol pumps’ to ‘bazaar trade’, which was positive for private sector players such as Castrol, Shell and Gulf Oil. The distribution channel is now undergoing another transition. With engine technology advancing and maintenance becoming more sophisticated, the workshop channel is gaining traction at the cost of other distribution formats. This is likely to lead to further polarization in the industry and benefit large lube marketers like Castrol that have strong/established relationships with original equipment manufacturers (OEMs). Further Castrol has been focusing on niche premium personal mobility shields business which includes passenger car and two-wheeler oils. The micro-marketing approach in passenger cars and the use of digital and social media were strong enablers in these segments. This was complemented by strong growth in distribution network.
The company used a tactic strategy to be popular in fast moving consumer goods sector, that of selling in economically priced sachets. It launched 40 ml sachets of Super TT. Consumers would buy sachets in bulk and keep them in their scooters and bikes, and at fuel stations they would use their sachets instead of buying a lubricant available there. This strategy was a huge hit.
Risk and Concerns:
Slower-than-expected growth in auto volumes: Automotive volumes in India are seeing a revival this year after being weak in the last two years. We expect the revival in volumes to gather pace over the next two years. However, if the positive momentum fails to sustain, it will negatively impact Castrol’s volumes.
Sharp increase in raw material prices: Crude is expected to increase in terms of prices. Base oil prices will depend not only on crude, but they will also depend on the capacity of the market and supply and demand situation. Increase in input costs like base oil price could impact Castrol’s margins.
Slow industrial and automotive growth will keep demand muted: Sluggish automotive and industrial growth will hinder lubricant demand. Auto industry has been facing continued economic headwinds.
There is a “natural” reason for lubricant volumes to decline thanks to newer technology For example, for Tata Motors trucks, earlier they used to change the oil every 9,000km; they upgraded and went to 18,000km and now they are talking about 40,000km. So, the amount of lubricant oil getting used is coming down. Further if electric vehicles get more popular, the demand for lube oils could fall as these vehicles do not require them.
RETAIL RESEARCH
RETAIL RESEARCH P a g e | 11
Strict government’s emission norms: The Indian government’s decision to pull forward the application of stricter emissions standards to meet global norms has sent the automobile and lubricant industry into a spin and means investments of billions of dollars over the next few years, costs that will be inevitably passed on to vehicle buyers.
Higher competition There are more than 14 players in the market and hence pricing pressure is high. Any increase in competitive intensity may force Castrol to reduce its premium pricing to protect market share. Competition in the Indian lubricant market is intense and is likely to remain so in the foreseeable future. Most international players have identified India as a focus market. The industry has also witnessed a trend of some OEMs introducing lubricants under their own brand name, further impacting the competitive landscape. New players like Petronas and Rizol Petro Products have entered or planning to enter India.
Exchange rate volatility Significant rupee depreciation could impact the growth of the company as the raw material is priced based on import parity in local Rupees. Recent INR depreciation against the USD could be a concern for the company in near future.
Stake sale by promoter could impact investor’s confidence on the stock: BP, the promoter of Castrol India sold 11.5% stake worth up to $287 million (nearly Rs 2,000 crore)in May 2016 and 8.5% stake worth up to $261 million (nearly Rs 1800 crore) in August 2016 in its Indian subsidiary Castrol India though a block trade. This could result in an overhang for the stock in the near term. However its stake has now came down to ~51% post the 8.5% stake sale. Hence post the stake sale the overhang could disappear.
The parent was in some financial distress. The offer for sale by the parent (11.5% and 8.5% completed in two different tranches) driven by divestment targets to fund liability pertaining to Gulf of Mexico oil spill. The financial trouble of the parent may in future impact Castrol if things turn for the worse for BP. Q3CY17 result review: Castrol India Ltd's reported marginally better numbers than street expectations in Q3CY17, with net revenue growth of 13.5% (YoY) to Rs 861.4cr led by a combination of healthy volume growth (~7.2%) and higher realizations, EBITDA growth of 19.1%(YoY) to Rs 253.6cr & PAT growth of 14.2% (YoY) to Rs 178.2 cr aided by higher other income (Rs 33.3cr vs Rs 15.5cr in Q3CY16), which included one-off gains Rs 18.6cr from the sale of property. Improvement in gross margins (+133 bps) and EBITDA margins (+149 bps) was encouraging. Healthy volume offtake, better realizations and stability in the base oil prices supported the overall growth. Key highlights from Concall (Q3CY17): CIL entered into new exclusive supply partnerships with Piaggio and extended existing OEM partnerships with VW group
and Volvo cars, The company feels that electric and hybrid vehicles have still a long way to go and cars will still run on combustion engines
in near to medium term,
RETAIL RESEARCH
RETAIL RESEARCH P a g e | 12
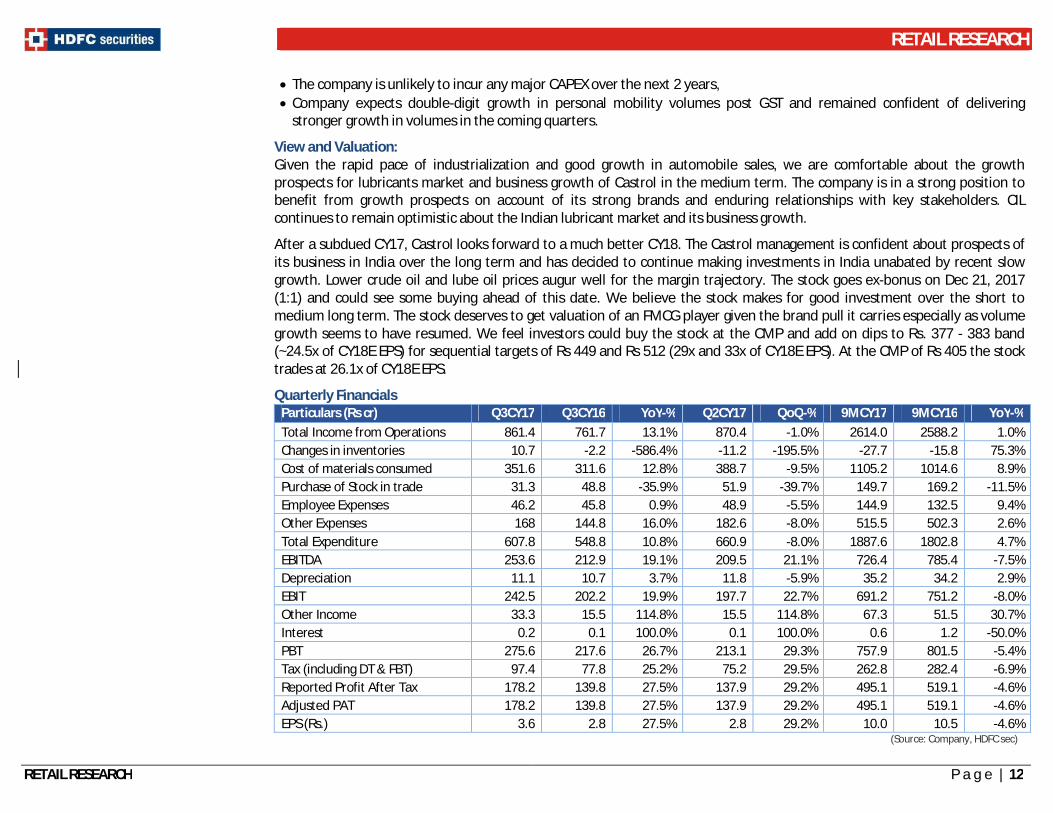
The company is unlikely to incur any major CAPEX over the next 2 years, Company expects double-digit growth in personal mobility volumes post GST and remained confident of delivering
stronger growth in volumes in the coming quarters.
View and Valuation: Given the rapid pace of industrialization and good growth in automobile sales, we are comfortable about the growth prospects for lubricants market and business growth of Castrol in the medium term. The company is in a strong position to benefit from growth prospects on account of its strong brands and enduring relationships with key stakeholders. CIL continues to remain optimistic about the Indian lubricant market and its business growth.
After a subdued CY17, Castrol looks forward to a much better CY18. The Castrol management is confident about prospects of its business in India over the long term and has decided to continue making investments in India unabated by recent slow growth. Lower crude oil and lube oil prices augur well for the margin trajectory. The stock goes ex-bonus on Dec 21, 2017 (1:1) and could see some buying ahead of this date. We believe the stock makes for good investment over the short to medium long term. The stock deserves to get valuation of an FMCG player given the brand pull it carries especially as volume growth seems to have resumed. We feel investors could buy the stock at the CMP and add on dips to Rs. 377 - 383 band (~24.5x of CY18E EPS) for sequential targets of Rs 449 and Rs 512 (29x and 33x of CY18E EPS). At the CMP of Rs 405 the stock trades at 26.1x of CY18E EPS.
Quarterly Financials Particulars (Rs cr) Q3CY17 Q3CY16 YoY-% Q2CY17 QoQ-% 9MCY17 9MCY16 YoY-% Total Income from Operations 861.4 761.7 13.1% 870.4 -1.0% 2614.0 2588.2 1.0% Changes in inventories 10.7 -2.2 -586.4% -11.2 -195.5% -27.7 -15.8 75.3% Cost of materials consumed 351.6 311.6 12.8% 388.7 -9.5% 1105.2 1014.6 8.9% Purchase of Stock in trade 31.3 48.8 -35.9% 51.9 -39.7% 149.7 169.2 -11.5% Employee Expenses 46.2 45.8 0.9% 48.9 -5.5% 144.9 132.5 9.4% Other Expenses 168 144.8 16.0% 182.6 -8.0% 515.5 502.3 2.6% Total Expenditure 607.8 548.8 10.8% 660.9 -8.0% 1887.6 1802.8 4.7% EBITDA 253.6 212.9 19.1% 209.5 21.1% 726.4 785.4 -7.5% Depreciation 11.1 10.7 3.7% 11.8 -5.9% 35.2 34.2 2.9% EBIT 242.5 202.2 19.9% 197.7 22.7% 691.2 751.2 -8.0% Other Income 33.3 15.5 114.8% 15.5 114.8% 67.3 51.5 30.7% Interest 0.2 0.1 100.0% 0.1 100.0% 0.6 1.2 -50.0% PBT 275.6 217.6 26.7% 213.1 29.3% 757.9 801.5 -5.4% Tax (including DT & FBT) 97.4 77.8 25.2% 75.2 29.5% 262.8 282.4 -6.9% Reported Profit After Tax 178.2 139.8 27.5% 137.9 29.2% 495.1 519.1 -4.6% Adjusted PAT 178.2 139.8 27.5% 137.9 29.2% 495.1 519.1 -4.6% EPS (Rs.) 3.6 2.8 27.5% 2.8 29.2% 10.0 10.5 -4.6%
(Source: Company, HDFC sec)
RETAIL RESEARCH
RETAIL RESEARCH P a g e | 13
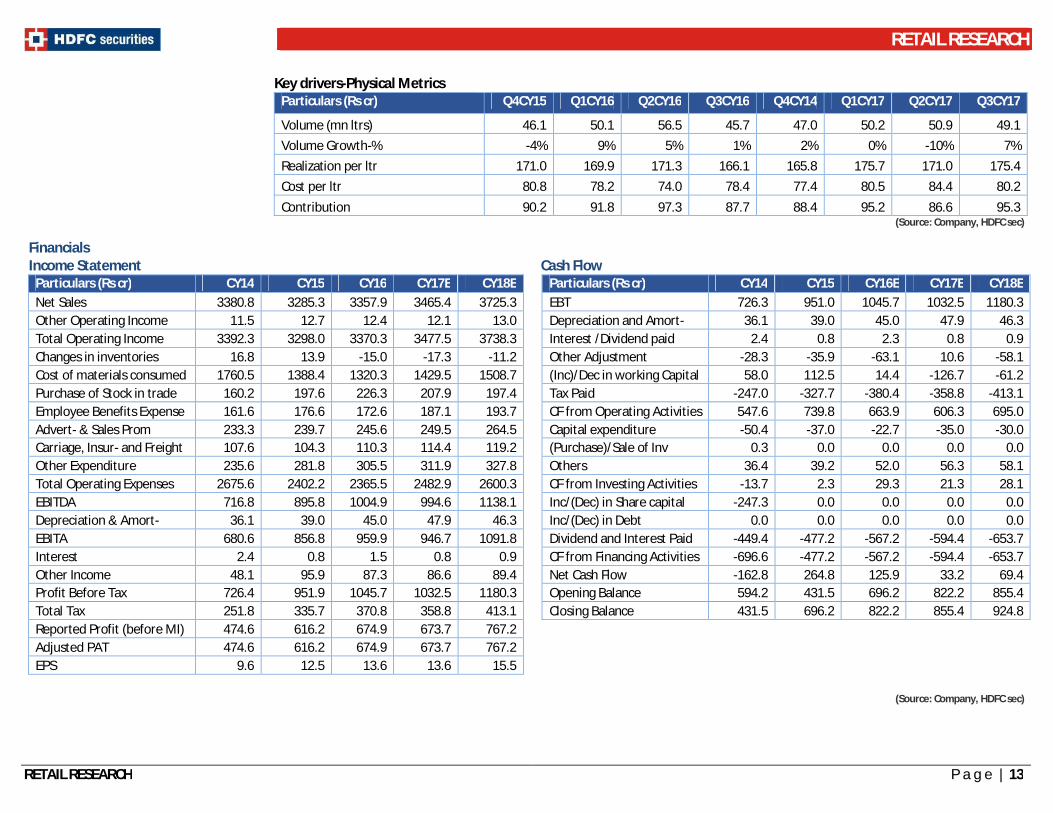
Key drivers-Physical Metrics Particulars (Rs cr) Q4CY15 Q1CY16 Q2CY16 Q3CY16 Q4CY14 Q1CY17 Q2CY17 Q3CY17
Volume (mn ltrs) 46.1 50.1 56.5 45.7 47.0 50.2 50.9 49.1 Volume Growth-% -4% 9% 5% 1% 2% 0% -10% 7% Realization per ltr 171.0 169.9 171.3 166.1 165.8 175.7 171.0 175.4 Cost per ltr 80.8 78.2 74.0 78.4 77.4 80.5 84.4 80.2 Contribution 90.2 91.8 97.3 87.7 88.4 95.2 86.6 95.3
(Source: Company, HDFC sec)
Financials Income Statement Cash Flow
Particulars (Rs cr) CY14 CY15 CY16 CY17E CY18E
Particulars (Rs cr) CY14 CY15 CY16E CY17E CY18E Net Sales 3380.8 3285.3 3357.9 3465.4 3725.3
EBT 726.3 951.0 1045.7 1032.5 1180.3
Other Operating Income 11.5 12.7 12.4 12.1 13.0
Depreciation and Amort- 36.1 39.0 45.0 47.9 46.3 Total Operating Income 3392.3 3298.0 3370.3 3477.5 3738.3
Interest /Dividend paid 2.4 0.8 2.3 0.8 0.9
Changes in inventories 16.8 13.9 -15.0 -17.3 -11.2
Other Adjustment -28.3 -35.9 -63.1 10.6 -58.1 Cost of materials consumed 1760.5 1388.4 1320.3 1429.5 1508.7
(Inc)/Dec in working Capital 58.0 112.5 14.4 -126.7 -61.2
Purchase of Stock in trade 160.2 197.6 226.3 207.9 197.4
Tax Paid -247.0 -327.7 -380.4 -358.8 -413.1 Employee Benefits Expense 161.6 176.6 172.6 187.1 193.7
CF from Operating Activities 547.6 739.8 663.9 606.3 695.0
Advert- & Sales Prom 233.3 239.7 245.6 249.5 264.5
Capital expenditure -50.4 -37.0 -22.7 -35.0 -30.0 Carriage, Insur- and Freight 107.6 104.3 110.3 114.4 119.2
(Purchase)/Sale of Inv 0.3 0.0 0.0 0.0 0.0
Other Expenditure 235.6 281.8 305.5 311.9 327.8
Others 36.4 39.2 52.0 56.3 58.1 Total Operating Expenses 2675.6 2402.2 2365.5 2482.9 2600.3
CF from Investing Activities -13.7 2.3 29.3 21.3 28.1
EBITDA 716.8 895.8 1004.9 994.6 1138.1
Inc/(Dec) in Share capital -247.3 0.0 0.0 0.0 0.0 Depreciation & Amort- 36.1 39.0 45.0 47.9 46.3
Inc/(Dec) in Debt 0.0 0.0 0.0 0.0 0.0
EBITA 680.6 856.8 959.9 946.7 1091.8
Dividend and Interest Paid -449.4 -477.2 -567.2 -594.4 -653.7 Interest 2.4 0.8 1.5 0.8 0.9
CF from Financing Activities -696.6 -477.2 -567.2 -594.4 -653.7
Other Income 48.1 95.9 87.3 86.6 89.4
Net Cash Flow -162.8 264.8 125.9 33.2 69.4 Profit Before Tax 726.4 951.9 1045.7 1032.5 1180.3
Opening Balance 594.2 431.5 696.2 822.2 855.4
Total Tax 251.8 335.7 370.8 358.8 413.1
Closing Balance 431.5 696.2 822.2 855.4 924.8 Reported Profit (before MI) 474.6 616.2 674.9 673.7 767.2
Adjusted PAT 474.6 616.2 674.9 673.7 767.2 EPS 9.6 12.5 13.6 13.6 15.5
(Source: Company, HDFC sec)
RETAIL RESEARCH
RETAIL RESEARCH P a g e | 14
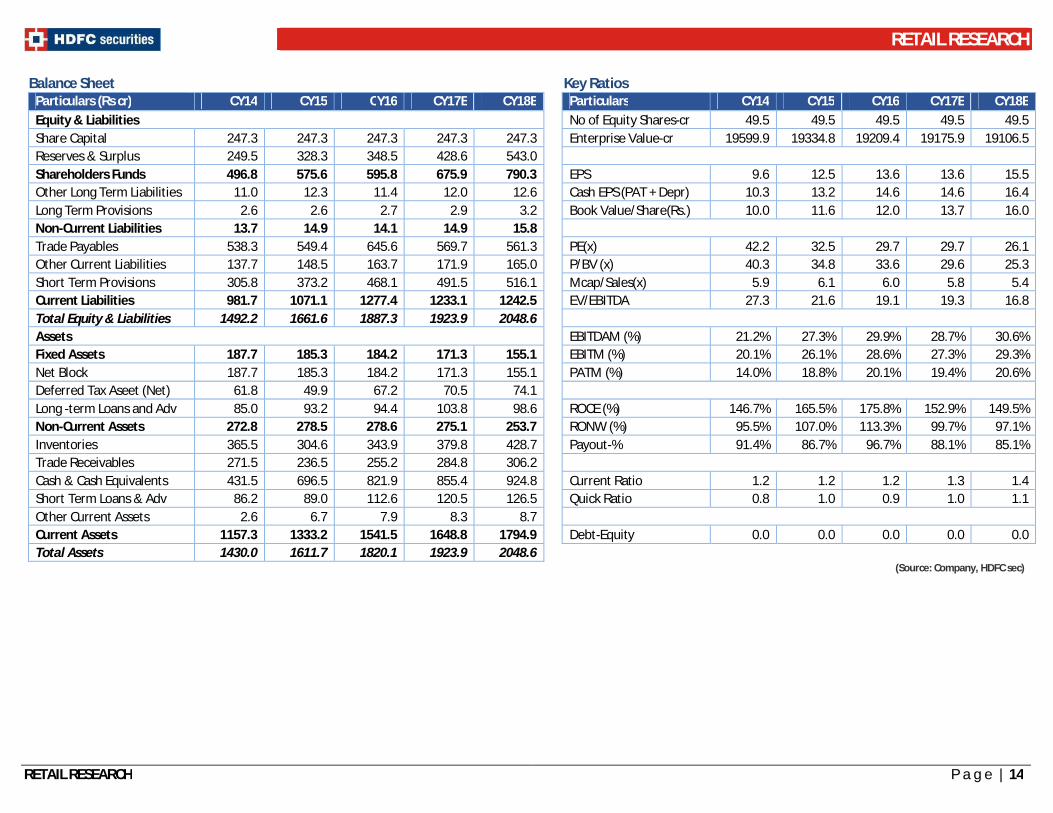
Balance Sheet Key Ratios Particulars (Rs cr) CY14 CY15 CY16 CY17E CY18E
Particulars CY14 CY15 CY16 CY17E CY18E
Equity & Liabilities
No of Equity Shares-cr 49.5 49.5 49.5 49.5 49.5 Share Capital 247.3 247.3 247.3 247.3 247.3
Enterprise Value-cr 19599.9 19334.8 19209.4 19175.9 19106.5
Reserves & Surplus 249.5 328.3 348.5 428.6 543.0
Shareholders Funds 496.8 575.6 595.8 675.9 790.3
EPS 9.6 12.5 13.6 13.6 15.5
Other Long Term Liabilities 11.0 12.3 11.4 12.0 12.6
Cash EPS (PAT + Depr) 10.3 13.2 14.6 14.6 16.4 Long Term Provisions 2.6 2.6 2.7 2.9 3.2
Book Value/Share(Rs.) 10.0 11.6 12.0 13.7 16.0
Non-Current Liabilities 13.7 14.9 14.1 14.9 15.8
Trade Payables 538.3 549.4 645.6 569.7 561.3
PE(x) 42.2 32.5 29.7 29.7 26.1
Other Current Liabilities 137.7 148.5 163.7 171.9 165.0
P/BV (x) 40.3 34.8 33.6 29.6 25.3 Short Term Provisions 305.8 373.2 468.1 491.5 516.1
Mcap/Sales(x) 5.9 6.1 6.0 5.8 5.4
Current Liabilities 981.7 1071.1 1277.4 1233.1 1242.5
EV/EBITDA 27.3 21.6 19.1 19.3 16.8 Total Equity & Liabilities 1492.2 1661.6 1887.3 1923.9 2048.6
Assets
EBITDAM (%) 21.2% 27.3% 29.9% 28.7% 30.6% Fixed Assets 187.7 185.3 184.2 171.3 155.1
EBITM (%) 20.1% 26.1% 28.6% 27.3% 29.3%
Net Block 187.7 185.3 184.2 171.3 155.1
PATM (%) 14.0% 18.8% 20.1% 19.4% 20.6% Deferred Tax Aseet (Net) 61.8 49.9 67.2 70.5 74.1
Long -term Loans and Adv 85.0 93.2 94.4 103.8 98.6
ROCE (%) 146.7% 165.5% 175.8% 152.9% 149.5% Non-Current Assets 272.8 278.5 278.6 275.1 253.7
RONW (%) 95.5% 107.0% 113.3% 99.7% 97.1%
Inventories 365.5 304.6 343.9 379.8 428.7
Payout-% 91.4% 86.7% 96.7% 88.1% 85.1% Trade Receivables 271.5 236.5 255.2 284.8 306.2
Cash & Cash Equivalents 431.5 696.5 821.9 855.4 924.8
Current Ratio 1.2 1.2 1.2 1.3 1.4 Short Term Loans & Adv 86.2 89.0 112.6 120.5 126.5
Quick Ratio 0.8 1.0 0.9 1.0 1.1
Other Current Assets 2.6 6.7 7.9 8.3 8.7
Current Assets 1157.3 1333.2 1541.5 1648.8 1794.9
Debt-Equity 0.0 0.0 0.0 0.0 0.0
Total Assets 1430.0 1611.7 1820.1 1923.9 2048.6 (Source: Company, HDFC sec)
RETAIL RESEARCH
RETAIL RESEARCH P a g e | 15
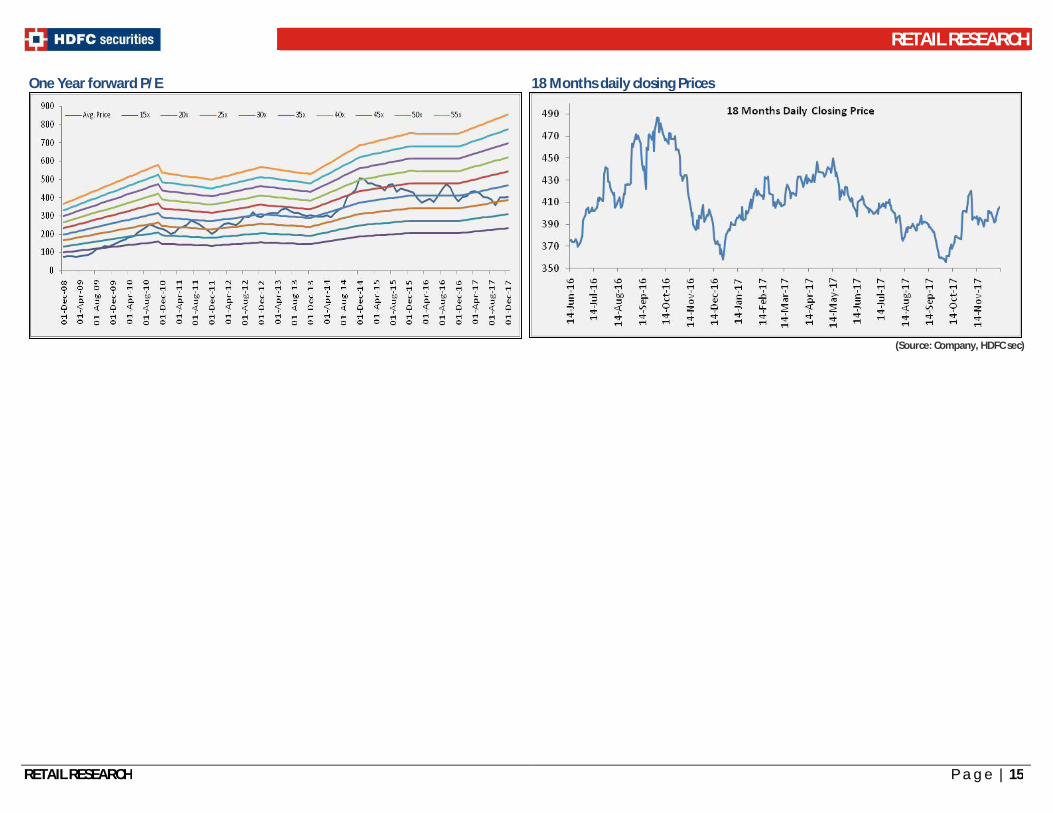
One Year forward P/E 18 Months daily closing Prices
(Source: Company, HDFC sec)
RETAIL RESEARCH
RETAIL RESEARCH P a g e | 16
Fundamental Research Analyst: Abdul Karim ([email protected]) HDFC securities Limited, I Think Techno Campus, Building - B, "Alpha", Office Floor 8, Near Kanjurmarg Station, Opp. Crompton Greaves, Kanjurmarg (East), Mumbai 400 042 Phone: (022) 3075 3400 Fax: (022) 2496 5066 Website: www.hdfcsec.com Email: [email protected]. Compliance Officer: Binkle R. Oza Email: [email protected] Phone: (022) 3045 3600 __________________________________________________________________________________________________________________________________________________________________________________________ Disclosure: I, (Abdul Karim, MBA), authors and the names subscribed to this report, hereby certify that all of the views expressed in this research report accurately reflect our views about the subject issuer(s) or securities. HSL has no material adverse disciplinary history as on the date of publication of this report. We also certify that no part of our compensation was, is, or will be directly or indirectly related to the specific recommendation(s) or view(s) in this report. Research Analyst or his/her relative or HDFC Securities Ltd. does not have any financial interest in the subject company. Also Research Analyst or his relative or HDFC Securities Ltd. or its Associate does not have beneficial ownership of 1% or more in the subject company at the end of the month immediately preceding the date of publication of the Research Report. Further Research Analyst or his relative or HDFC Securities Ltd. or its associate does not have any material conflict of interest. Any holding in stock – No HDFC Securities Limited (HSL) is a SEBI Registered Research Analyst having registration no. INH000002475. Disclaimer: This report has been prepared by HDFC Securities Ltd and is meant for sole use by the recipient and not for circulation. The information and opinions contained herein have been compiled or arrived at, based upon information obtained in good faith from sources believed to be reliable. Such information has not been independently verified and no guaranty, representation of warranty, express or implied, is made as to its accuracy, completeness or correctness. All such information and opinions are subject to change without notice. This document is for information purposes only. Descriptions of any company or companies or their securities mentioned herein are not intended to be complete and this document is not, and should not be construed as an offer or solicitation of an offer, to buy or sell any securities or other financial instruments. This report is not directed to, or intended for display, downloading, printing, reproducing or for distribution to or use by, any person or entity who is a citizen or resident or located in any locality, state, country or other jurisdiction where such distribution, publication, reproduction, availability or use would be contrary to law or regulation or what would subject HSL or its affiliates to any registration or licensing requirement within such jurisdiction. If this report is inadvertently send or has reached any individual in such country, especially, USA, the same may be ignored and brought to the attention of the sender. This document may not be reproduced, distributed or published for any purposes without prior written approval of HSL. Foreign currencies denominated securities, wherever mentioned, are subject to exchange rate fluctuations, which could have an adverse effect on their value or price, or the income derived from them. In addition, investors in securities such as ADRs, the values of which are influenced by foreign currencies effectively assume currency risk. It should not be considered to be taken as an offer to sell or a solicitation to buy any security. HSL may from time to time solicit from, or perform broking, or other services for, any company mentioned in this mail and/or its attachments. HSL and its affiliated company(ies), their directors and employees may; (a) from time to time, have a long or short position in, and buy or sell the securities of the company(ies) mentioned herein or (b) be engaged in any other transaction involving such securities and earn brokerage or other compensation or act as a market maker in the financial instruments of the company(ies) discussed herein or act as an advisor or lender/borrower to such company(ies) or may have any other potential conflict of interests with respect to any recommendation and other related information and opinions. HSL, its directors, analysts or employees do not take any responsibility, financial or otherwise, of the losses or the damages sustained due to the investments made or any action taken on basis of this report, including but not restricted to, fluctuation in the prices of shares and bonds, changes in the currency rates, diminution in the NAVs, reduction in the dividend or income, etc. HSL and other group companies, its directors, associates, employees may have various positions in any of the stocks, securities and financial instruments dealt in the report, or may make sell or purchase or other deals in these securities from time to time or may deal in other securities of the companies / organizations described in this report.
HSL or its associates might have managed or co-managed public offering of securities for the subject company or might have been mandated by the subject company for any other assignment in the past twelve months. HSL or its associates might have received any compensation from the companies mentioned in the report during the period preceding twelve months from t date of this report for services in respect of managing or co-managing public offerings, corporate finance, investment banking or merchant banking, brokerage services or other advisory service in a merger or specific transaction in the normal course of business. HSL or its analysts did not receive any compensation or other benefits from the companies mentioned in the report or third party in connection with preparation of the research report. Accordingly, neither HSL nor Research Analysts have any material conflict of interest at the time of publication of this report. Compensation of our Research Analysts is not based on any specific merchant banking, investment banking or brokerage service transactions. HSL may have issued other reports that are inconsistent with and reach different conclusion from the information presented in this report. Research entity has not been engaged in market making activity for the subject company. Research analyst has not served as an officer, director or employee of the subject company. We have not received any compensation/benefits from the subject company or third party in connection with the Research Report.
This report is intended for non-Institutional Clients only. The views and opinions expressed in this report may at times be contrary to or not in consonance with those of Institutional Research or PCG Research teams of HDFC Securities Ltd. and/or may have different time horizons
HDFC Securities Limited, SEBI Reg. No.: NSE-INB/F/E 231109431, BSE-INB/F 011109437, AMFI Reg. No. ARN: 13549, PFRDA Reg. No. POP: 04102015, IRDA Corporate Agent License No.: HDF 2806925/HDF C000222657, SEBI Research Analyst Reg. No.: INH000002475, CIN - U67120MH2000PLC152193.