Embed Size (px)
Citation preview
Castrol IndiaAnalyst Meeting - 2014
Confidential – Not to be shared
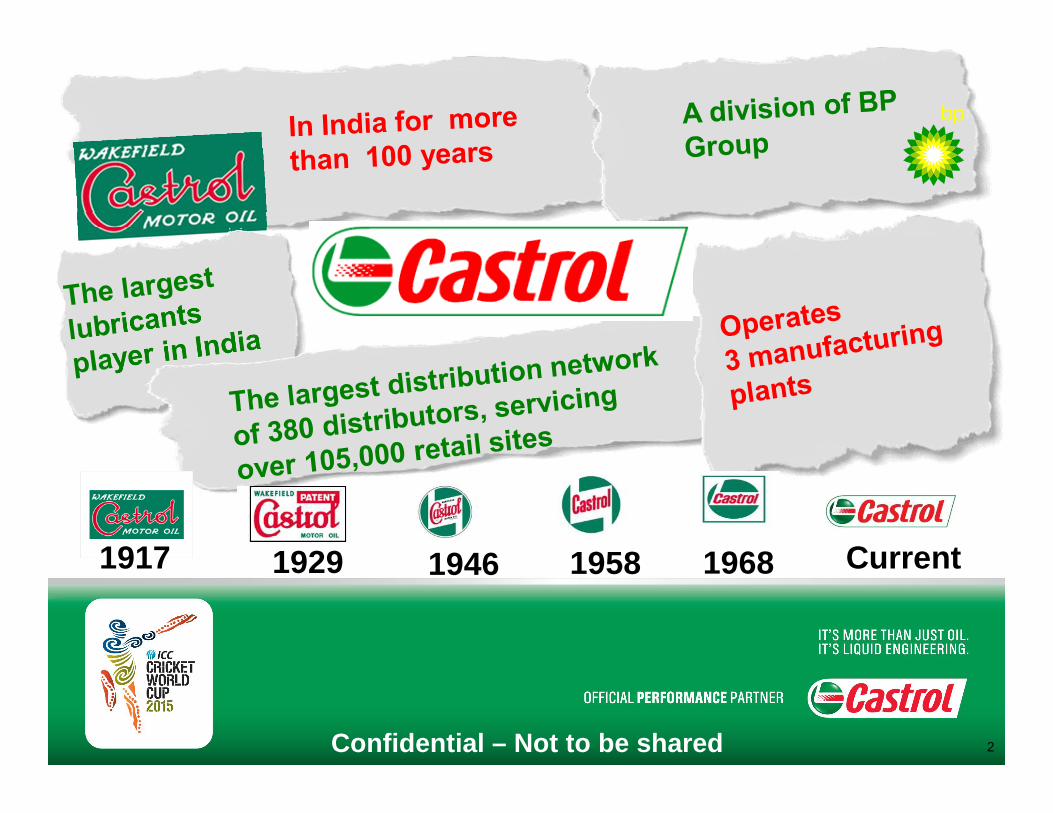
1917 1929 1946 1958 1968 Current
Confidential – Not to be shared 2
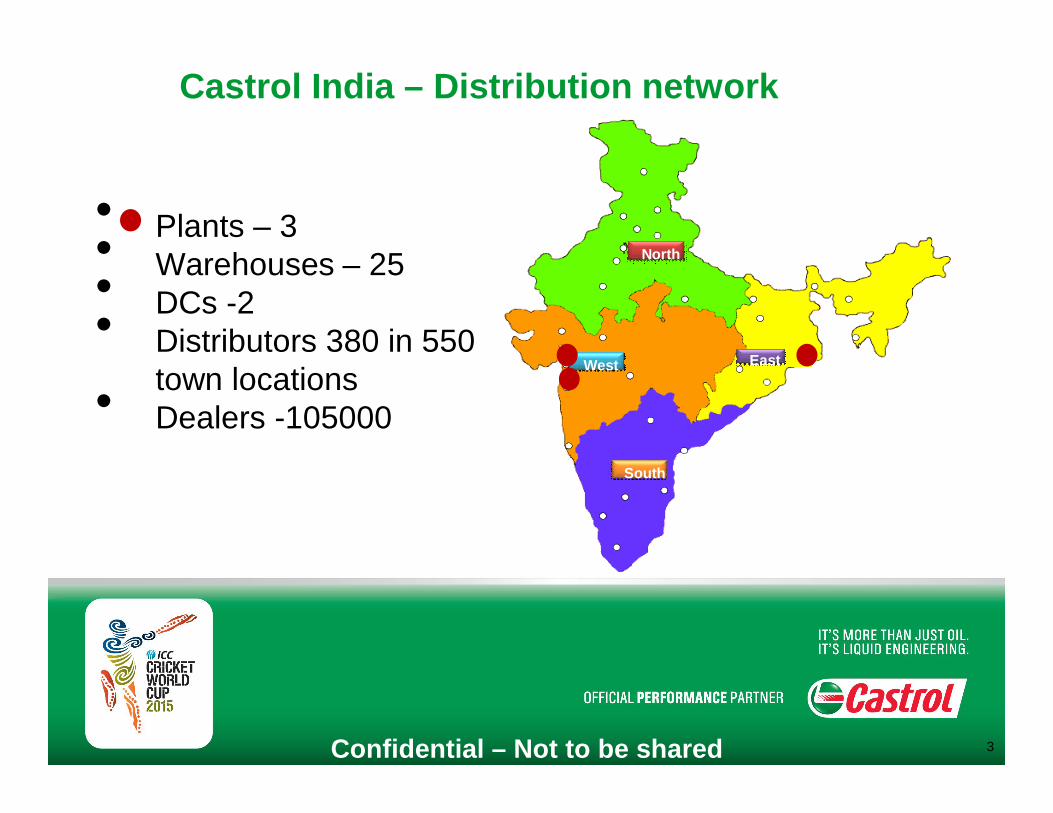
Castrol India – Distribution network
• Plants – 3 • Warehouses – 25• DCs -2 • Distributors 380 in 550 town locations• Dealers -105000
AS-IS
North
South
West East
Plants - 3Warehouses – 25DCs- 2
AS-IS
NorthNorth
SouthSouth
WestWest EastEast
Confidential – Not to be shared 3
Our Strategy & Strengths
Confidential – Not to be shared 4
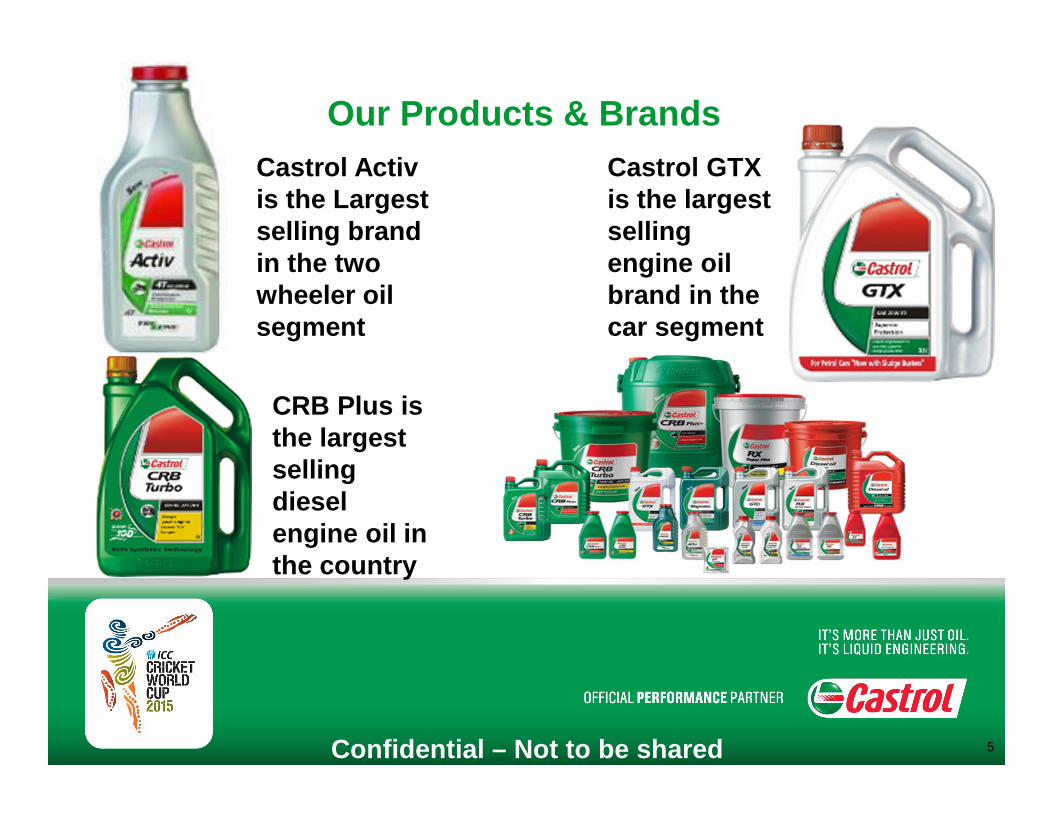
Our Products & BrandsCastrol Activis the Largest selling brand in the two wheeler oil segment
Castrol GTX is the largest selling engine oil brand in the car segment
CRB Plus is the largest selling diesel engine oil in the country
Confidential – Not to be shared 5
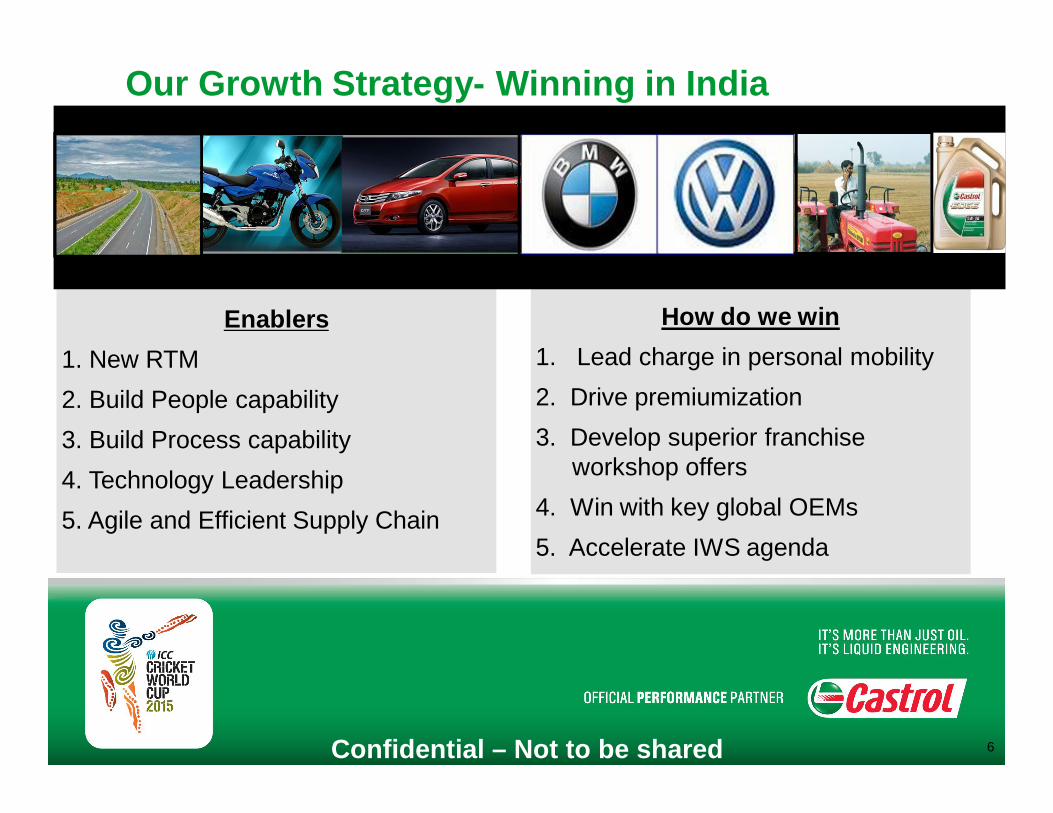
How do we win1. Lead charge in personal mobility2. Drive premiumization3. Develop superior franchise
workshop offers 4. Win with key global OEMs5. Accelerate IWS agenda
Our Growth Strategy- Winning in India
Enablers1. New RTM2. Build People capability 3. Build Process capability4. Technology Leadership5. Agile and Efficient Supply Chain
Confidential – Not to be shared 6
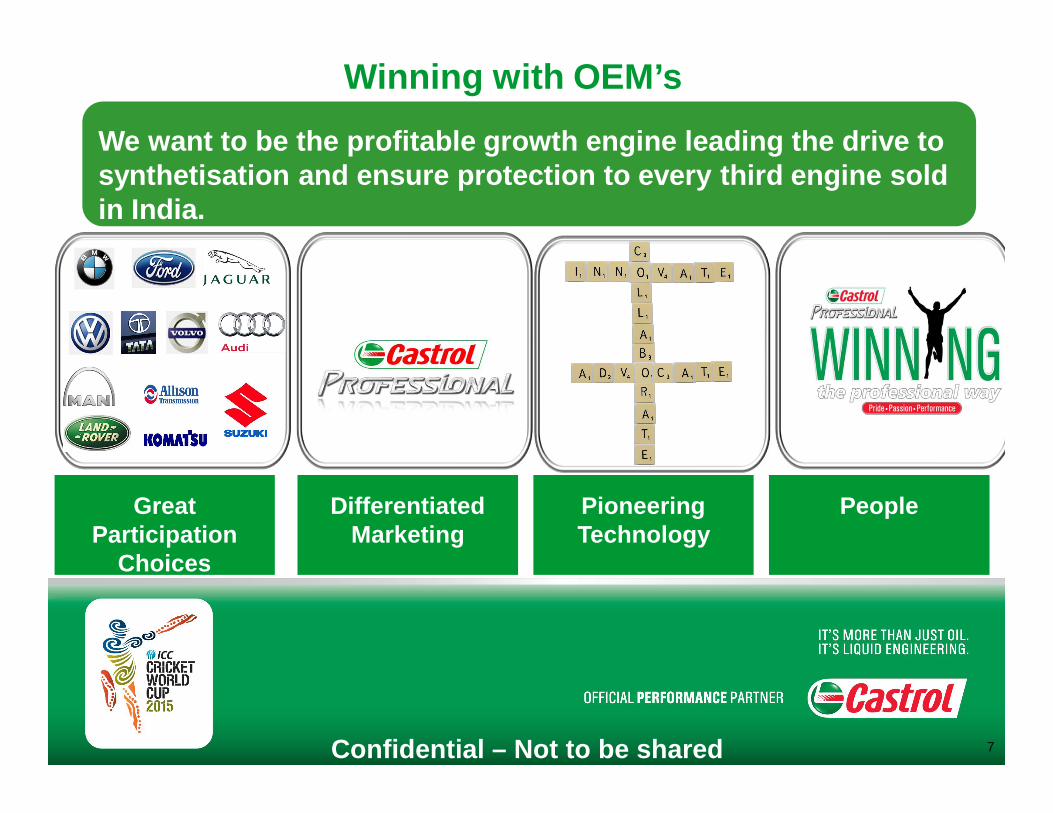
Great Participation
Choices
Differentiated Marketing
Pioneering Technology
People
Winning with OEM’s
We want to be the profitable growth engine leading the drive to synthetisation and ensure protection to every third engine sold in India.
Confidential – Not to be shared 7
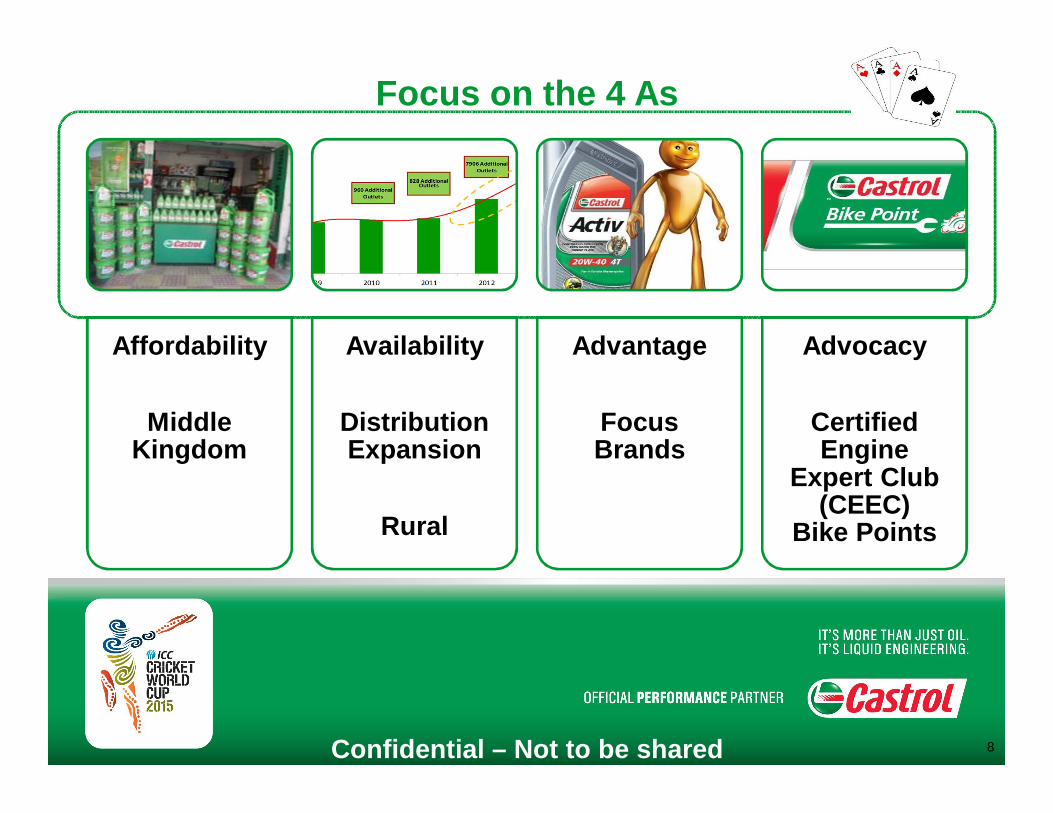
Affordability
Middle Kingdom
Availability
Distribution Expansion
Rural
Advantage
Focus Brands
Advocacy
Certified Engine
Expert Club (CEEC)
Bike Points
Focus on the 4 As
Confidential – Not to be shared 8
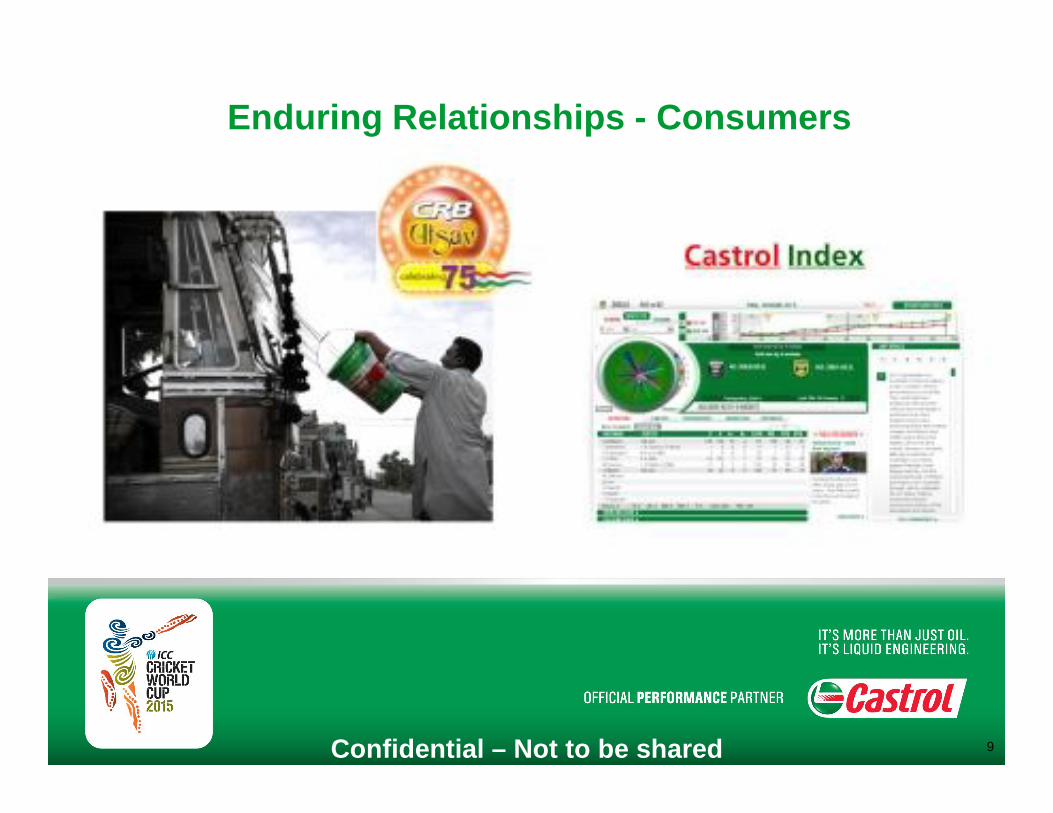
Enduring Relationships - Consumers
Confidential – Not to be shared 9
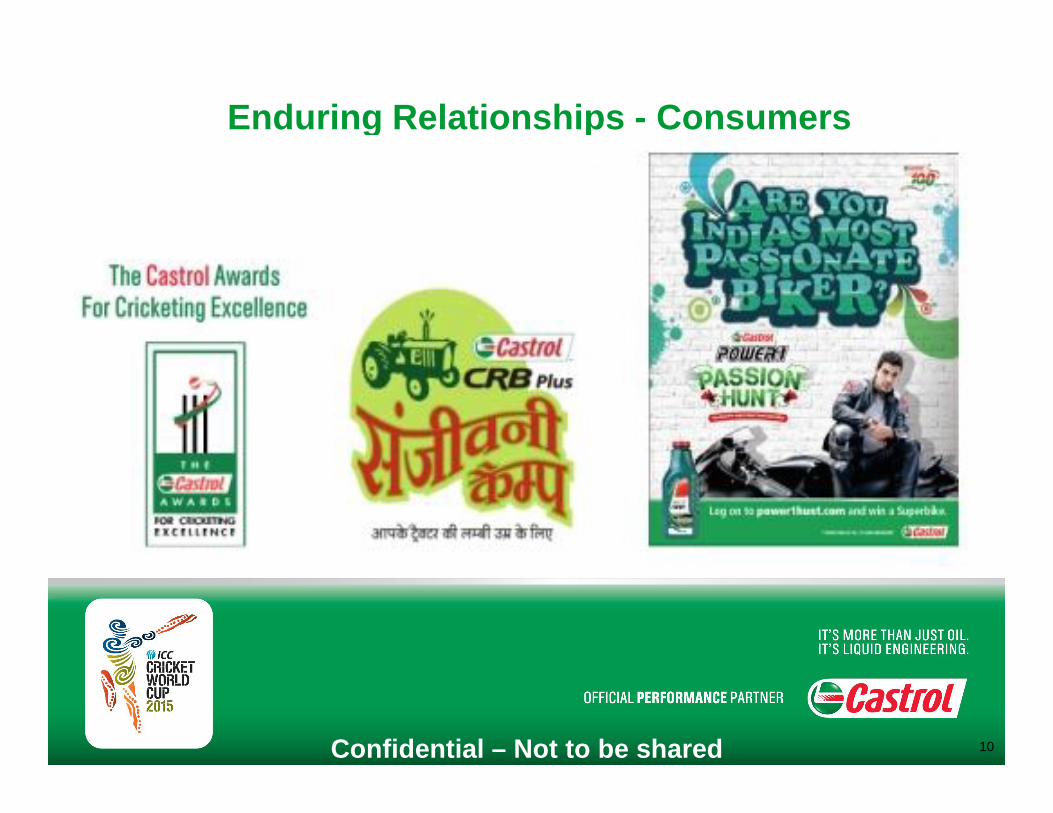
Enduring Relationships - Consumers
Confidential – Not to be shared 10
Enduring Relationships - Customers
Confidential – Not to be shared 11
Enduring Relationships - OEMs
Confidential – Not to be shared 12
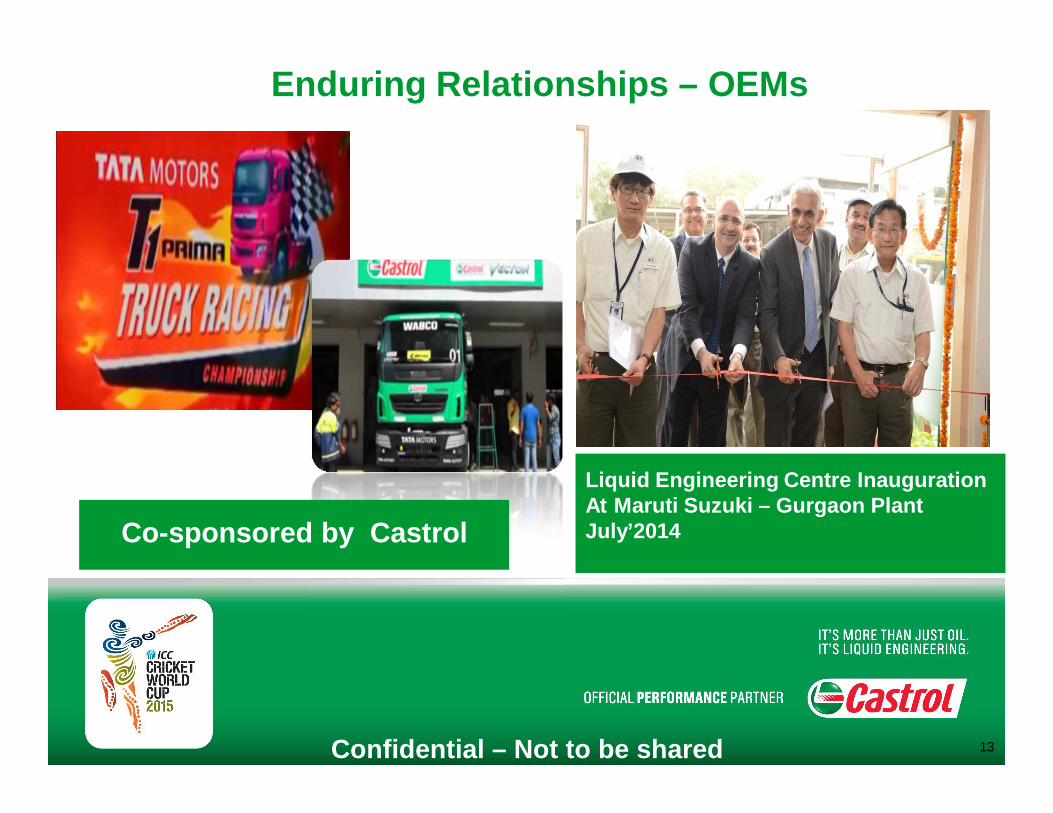
Enduring Relationships – OEMs
Confidential – Not to be shared 13
Liquid Engineering Centre InaugurationAt Maruti Suzuki – Gurgaon PlantJuly’2014Co-sponsored by Castrol
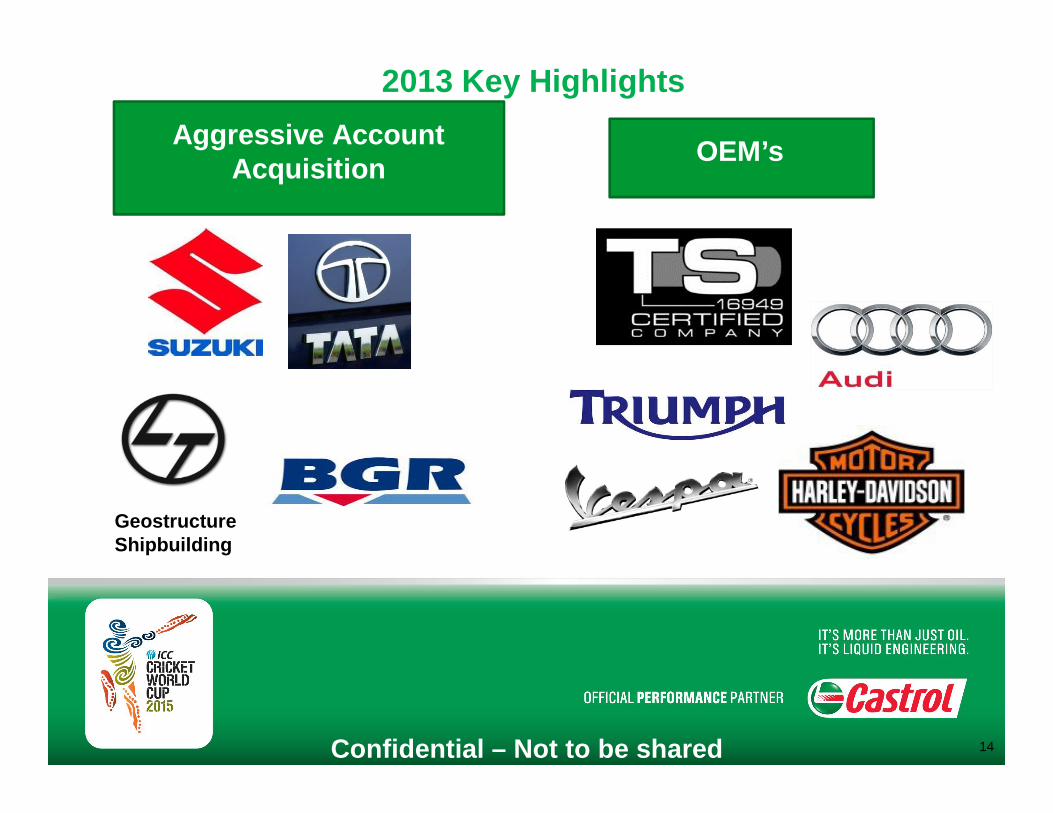
2013 Key Highlights
OEM’s Aggressive Account Acquisition
GeostructureShipbuilding
Confidential – Not to be shared 14
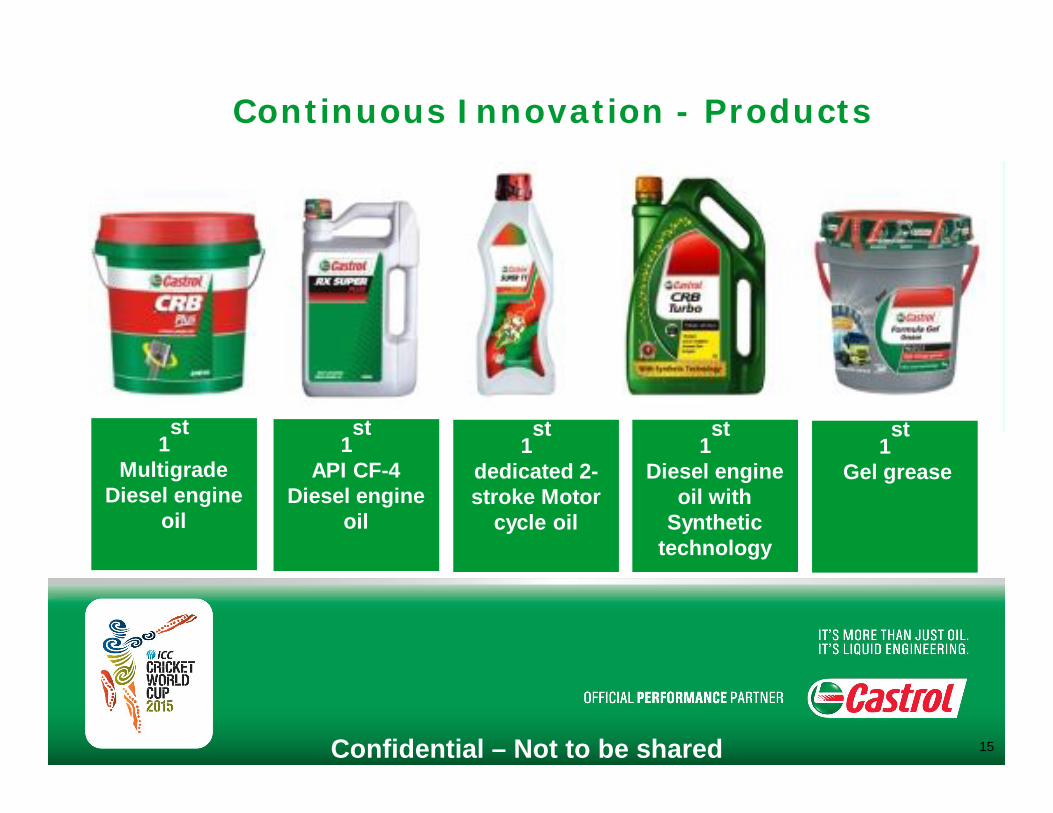
Continuous Innovation - Products
Confidential – Not to be shared
1st
Diesel engine oil with
Synthetic technology
15
1st
MultigradeDiesel engine
oil
1st
API CF-4 Diesel engine
oil
1st
dedicated 2-stroke Motor
cycle oil
1st
Gel grease
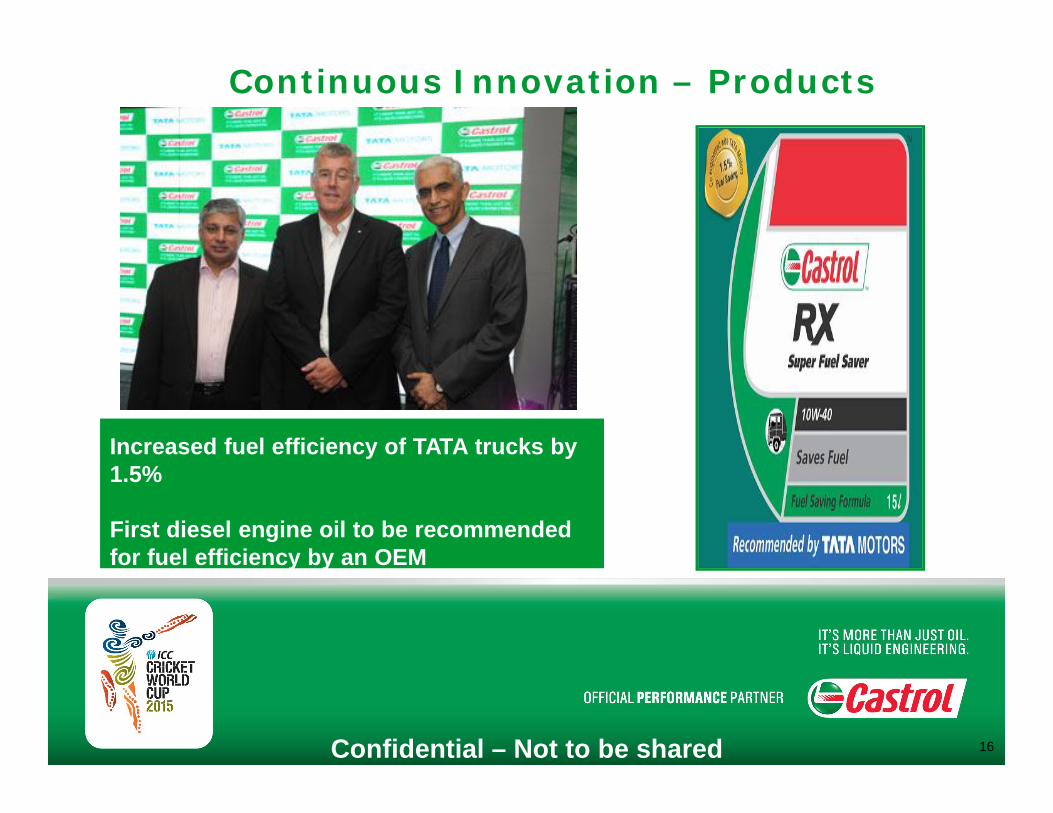
Continuous Innovation – Products
Confidential – Not to be shared
Increased fuel efficiency of TATA trucks by 1.5%
First diesel engine oil to be recommended for fuel efficiency by an OEM
Increased fuel efficiency of TATA trucks by 1.5%
First diesel engine oil to be recommended for fuel efficiency by an OEM
16
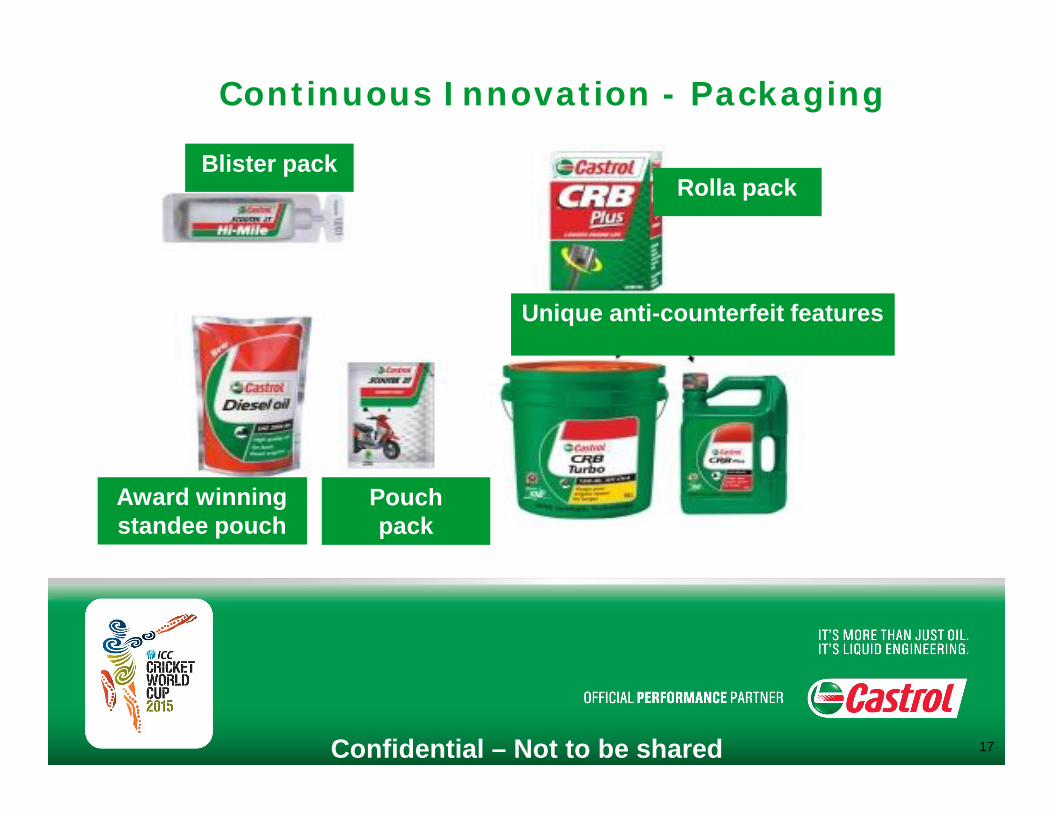
Continuous Innovation - Packaging
Confidential – Not to be shared
Award winning standee pouch
Pouch pack
Blister packRolla pack
Unique anti-counterfeit features
17
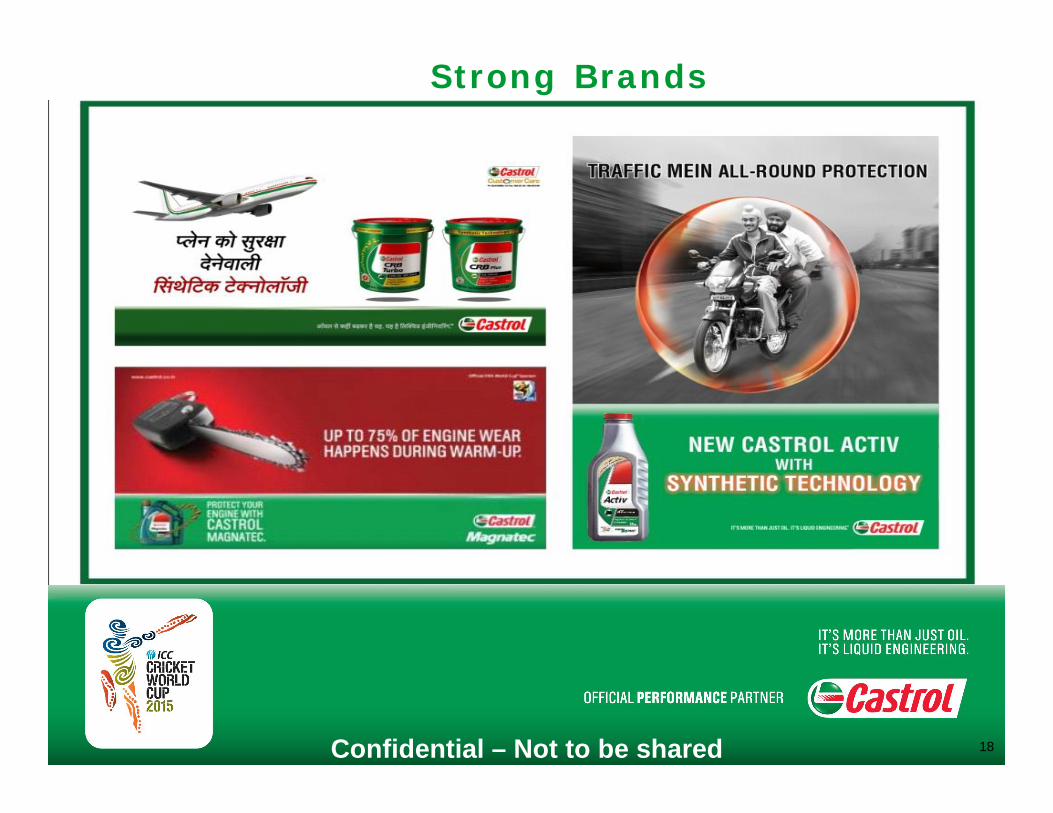
Strong Brands
Confidential – Not to be shared 18
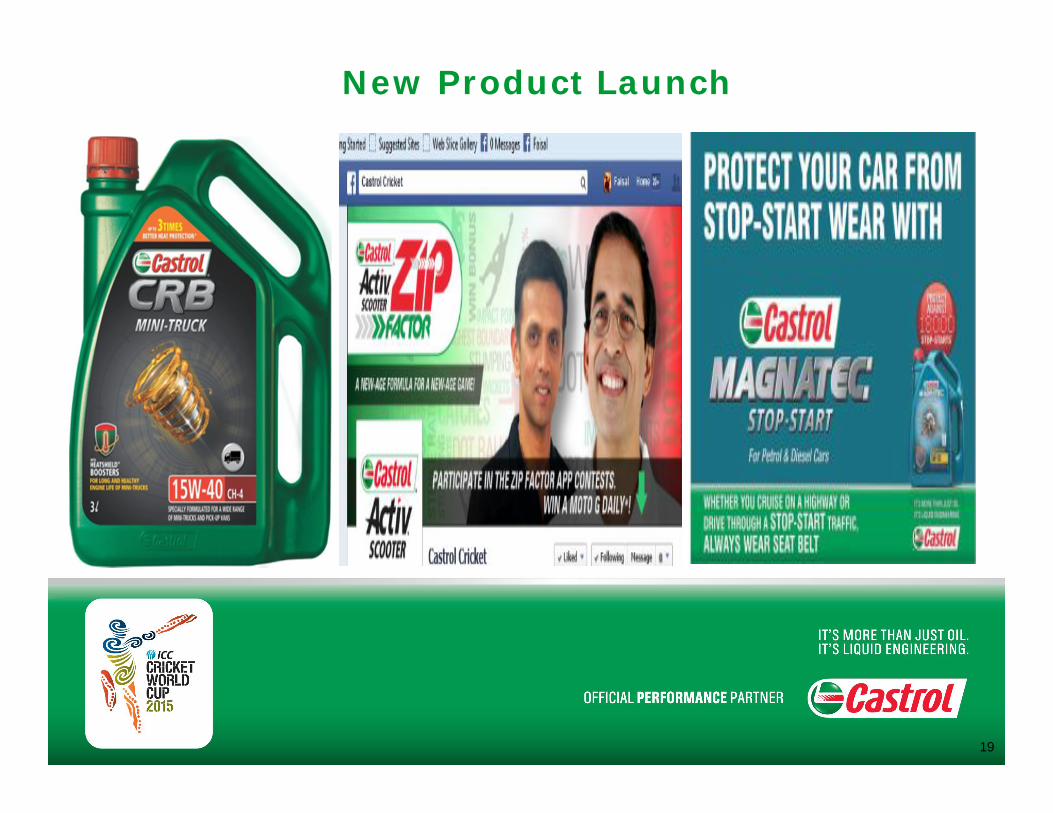
New Product Launch
19
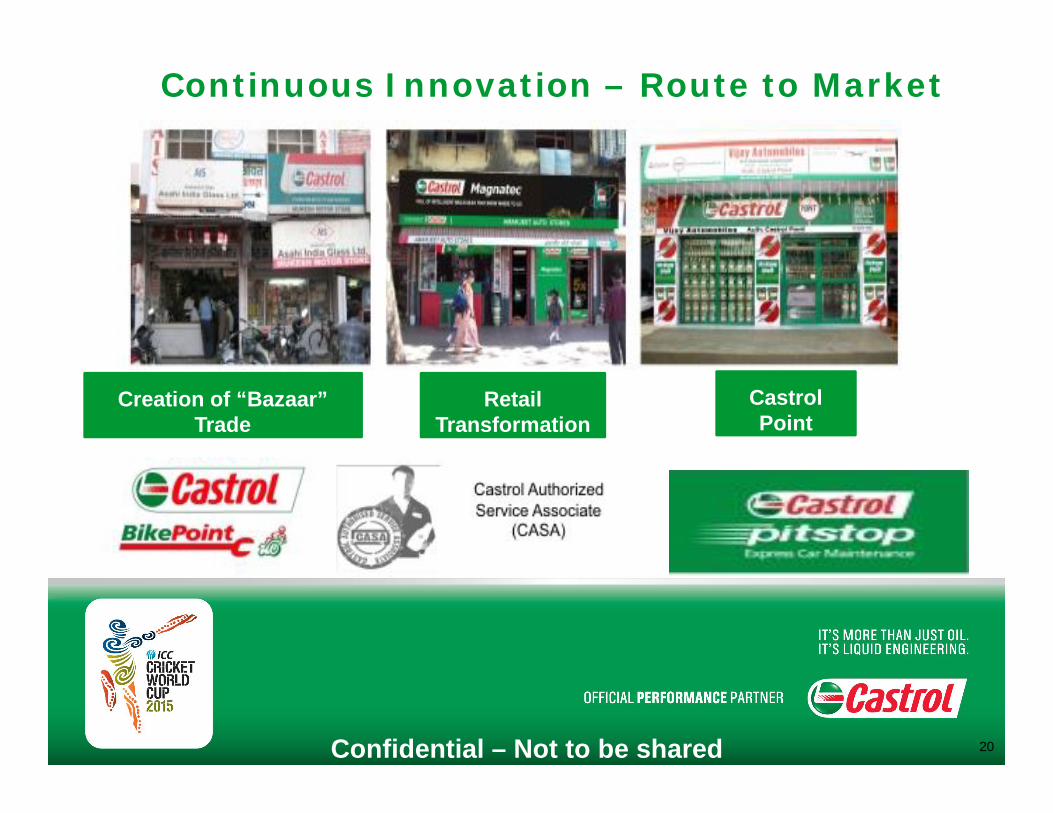
Continuous Innovation – Route to Market
Confidential – Not to be shared
Castrol Point
Retail Transformation
Creation of “Bazaar” Trade
20
21
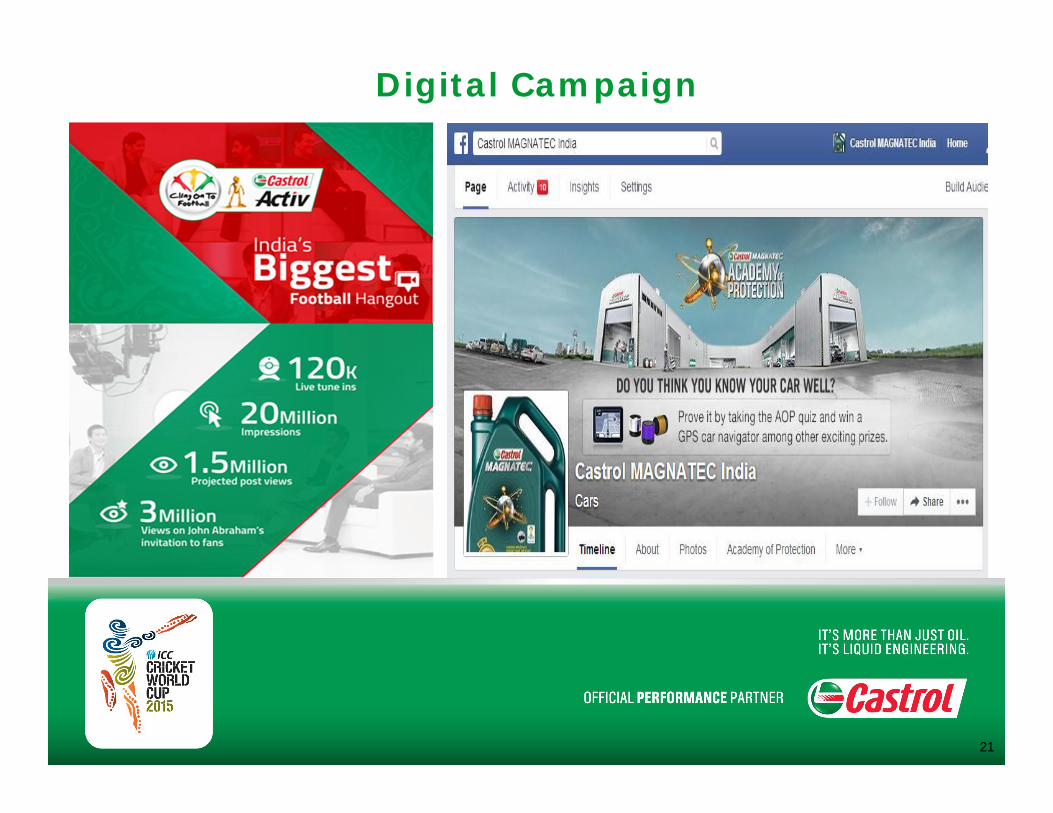
Digital Campaign
22
Awards & Recognition
• Castrol CEO ranked amongst Top 100 CEOs by Business Today-PWC -2013
• Won the top Indian company award under the sector Specialty Oils and Lubricants at the D & B Corporate Awards - 2014.
• Good Road safety project won Black Elephant Kyoorius Advertising & Digital Awards - 2014
• Paharpur Plant awarded 14th Annual Greentech Environment Award in Silver Category in Petrochemical Sector - 2013
• Patalganga Plant won Certificate of Merit from the National Safety Council Maharashtra Chapter for Zero Accident Frequency Rate - 2013
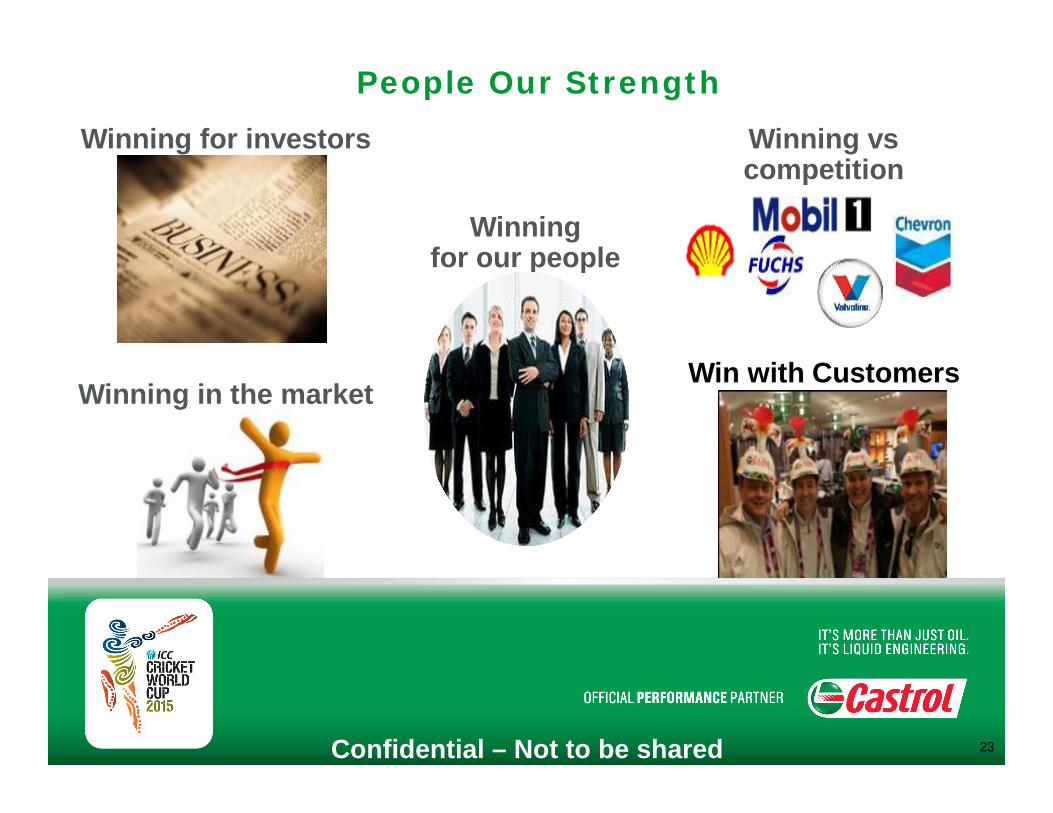
People Our Strength
Winning for investors Winning vs competition
Winning in the market
Winningfor our people
Win with Customers
Confidential – Not to be shared 23
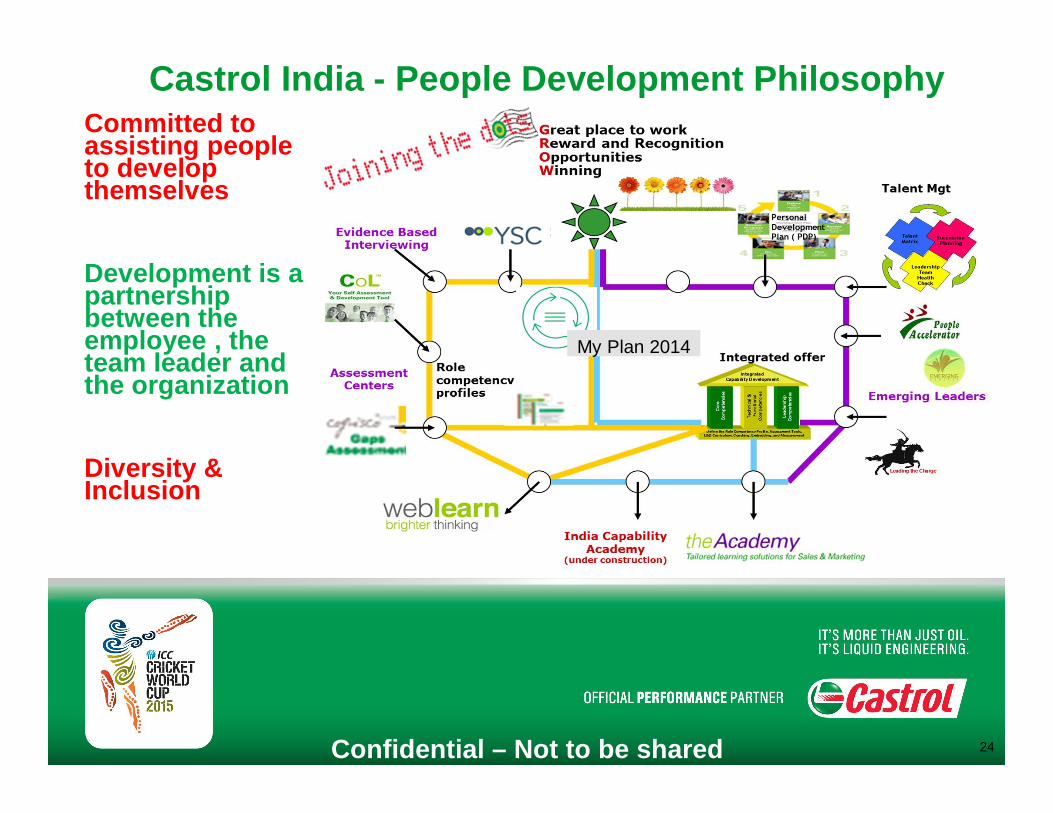
Castrol India - People Development PhilosophyCommitted to assisting people to develop themselves
Development is a partnership between the employee , the team leader and the organization
Diversity & Inclusion
My Plan 2014
Confidential – Not to be shared 24
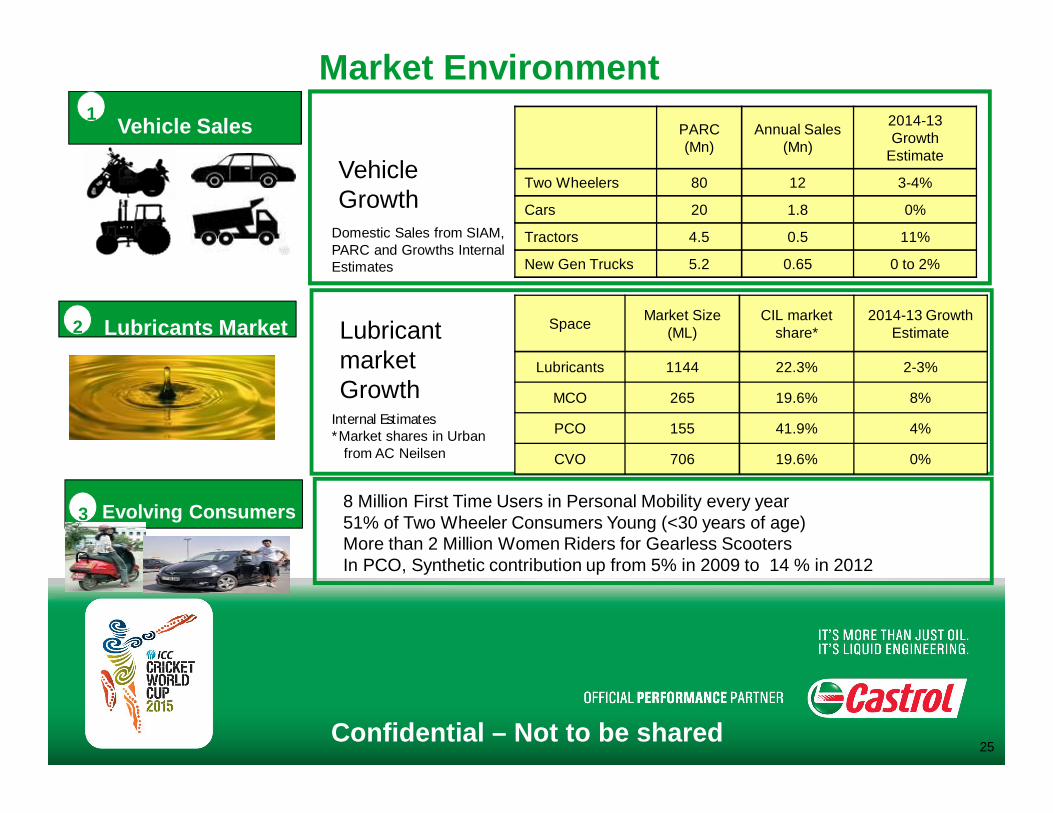
Market Environment
8 Million First Time Users in Personal Mobility every year51% of Two Wheeler Consumers Young (<30 years of age)More than 2 Million Women Riders for Gearless ScootersIn PCO, Synthetic contribution up from 5% in 2009 to 14 % in 2012
Lubricants Market2
Evolving Consumers3
Lubricant marketGrowth
Vehicle Growth
Vehicle Sales1
Domestic Sales from SIAM, PARC and Growths Internal Estimates
Space Market Size (ML)
CIL market share*
2014-13 Growth Estimate
Lubricants 1144 22.3% 2-3%
MCO 265 19.6% 8%
PCO 155 41.9% 4%
CVO 706 19.6% 0%
PARC (Mn)
Annual Sales (Mn)
2014-13 Growth
Estimate
Two Wheelers 80 12 3-4%
Cars 20 1.8 0%
Tractors 4.5 0.5 11%
New Gen Trucks 5.2 0.65 0 to 2%
Internal Estimates*Market shares in Urban
from AC Neilsen
Confidential – Not to be shared25
Value to Shareholders
Confidential – Not to be shared 26
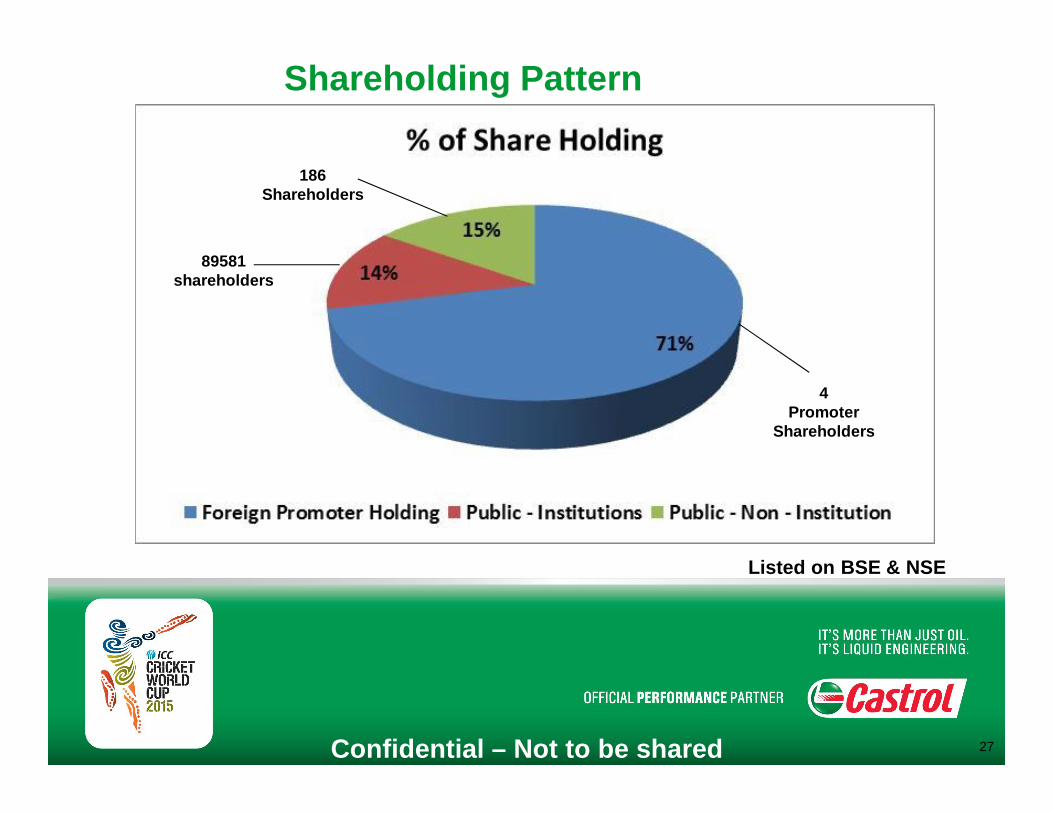
Shareholding Pattern
Listed on BSE & NSE
Confidential – Not to be shared 27
186 Shareholders
89581shareholders
4Promoter
Shareholders
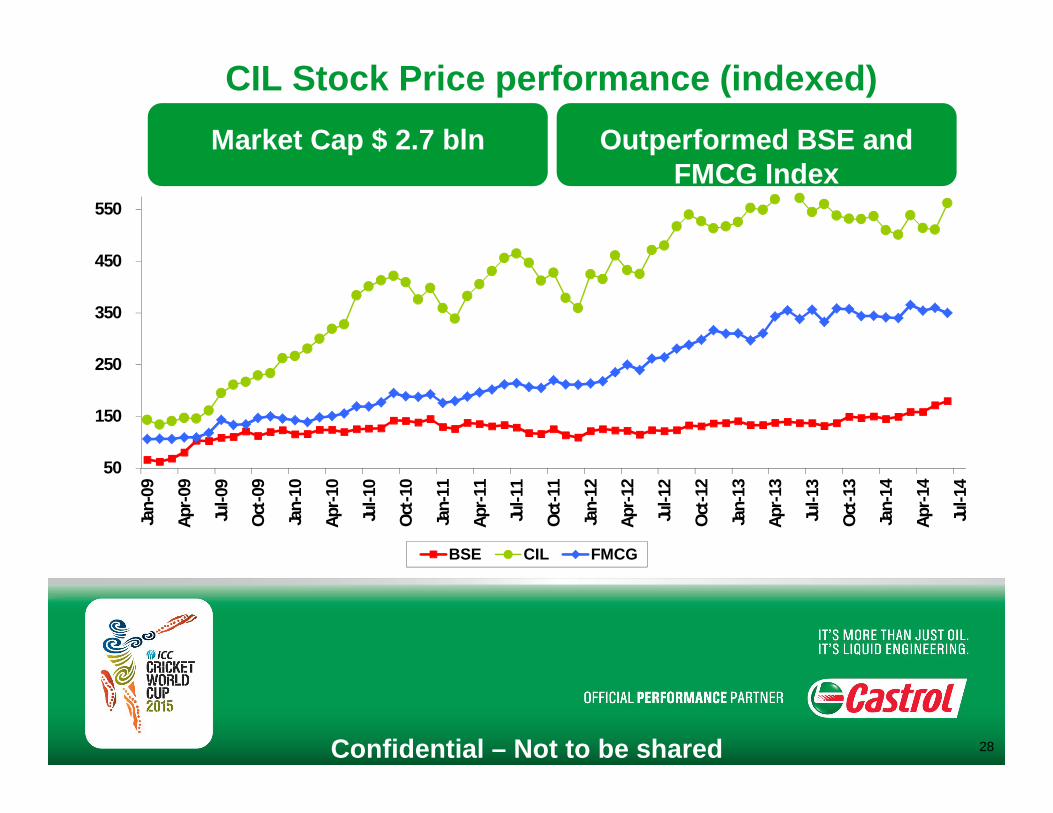
CIL Stock Price performance (indexed)Outperformed BSE and
FMCG Index
Confidential – Not to be shared
50
150
250
350
450
550
Jan-
09
Apr-
09
Jul-0
9
Oct
-09
Jan-
10
Apr-
10
Jul-1
0
Oct
-10
Jan-
11
Apr-
11
Jul-1
1
Oct
-11
Jan-
12
Apr-
12
Jul-1
2
Oct
-12
Jan-
13
Apr-
13
Jul-1
3
Oct
-13
Jan-
14
Apr-
14
Jul-1
4
BSE CIL FMCG
28
Market Cap $ 2.7 bln
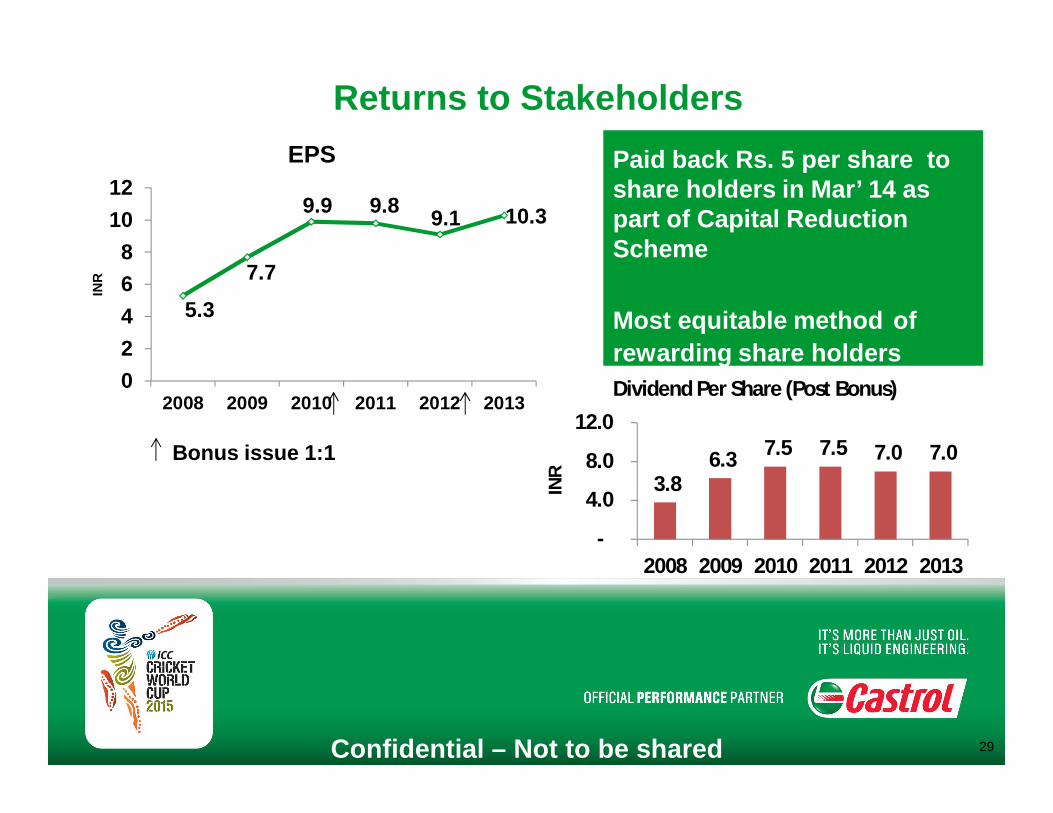
Returns to Stakeholders
Bonus issue 1:1
Paid back Rs. 5 per share to share holders in Mar’ 14 as part of Capital Reduction Scheme
Most equitable method of rewarding share holders
5.3
7.7
9.9 9.8 9.1 10.3
02468
1012
2008 2009 2010 2011 2012 2013
INR
EPS
3.8 6.3 7.5 7.5 7.0 7.0
-
4.0
8.0
12.0
2008 2009 2010 2011 2012 2013IN
R
Dividend Per Share (Post Bonus)
Confidential – Not to be shared 29
-
100
200
300
400
500
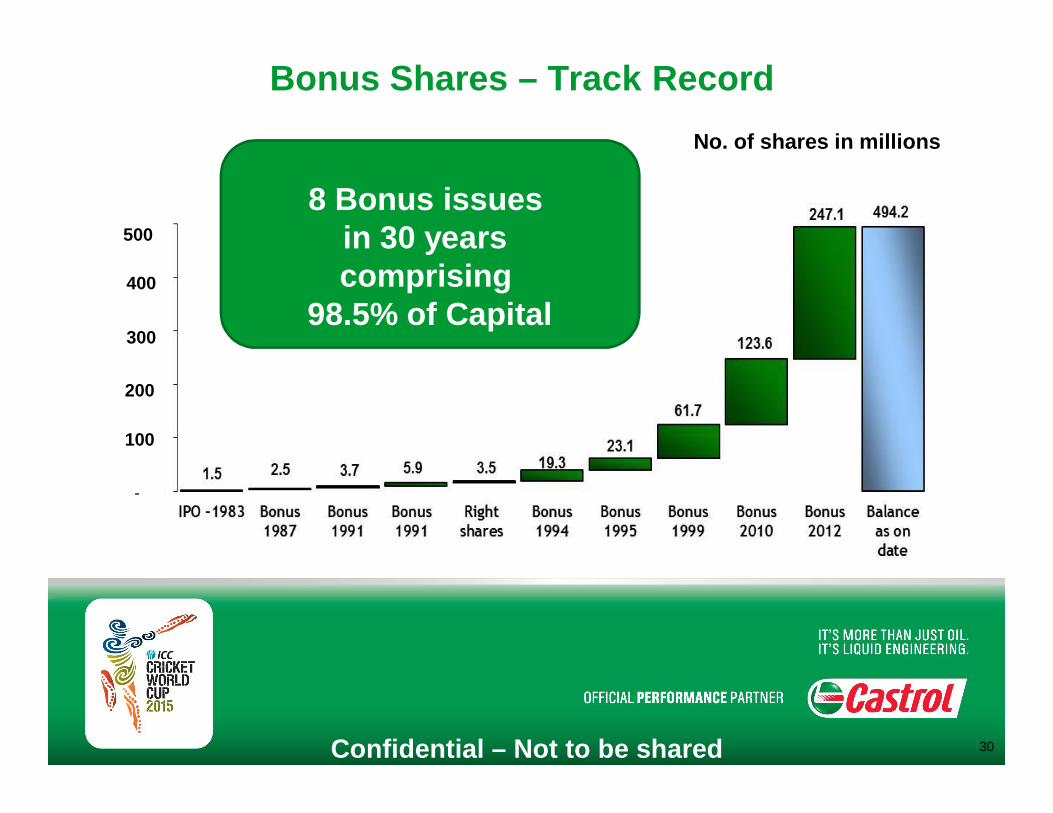
Bonus Shares – Track RecordNo. of shares in millions
8 Bonus issues in 30 years comprising
98.5% of Capital
Confidential – Not to be shared 30
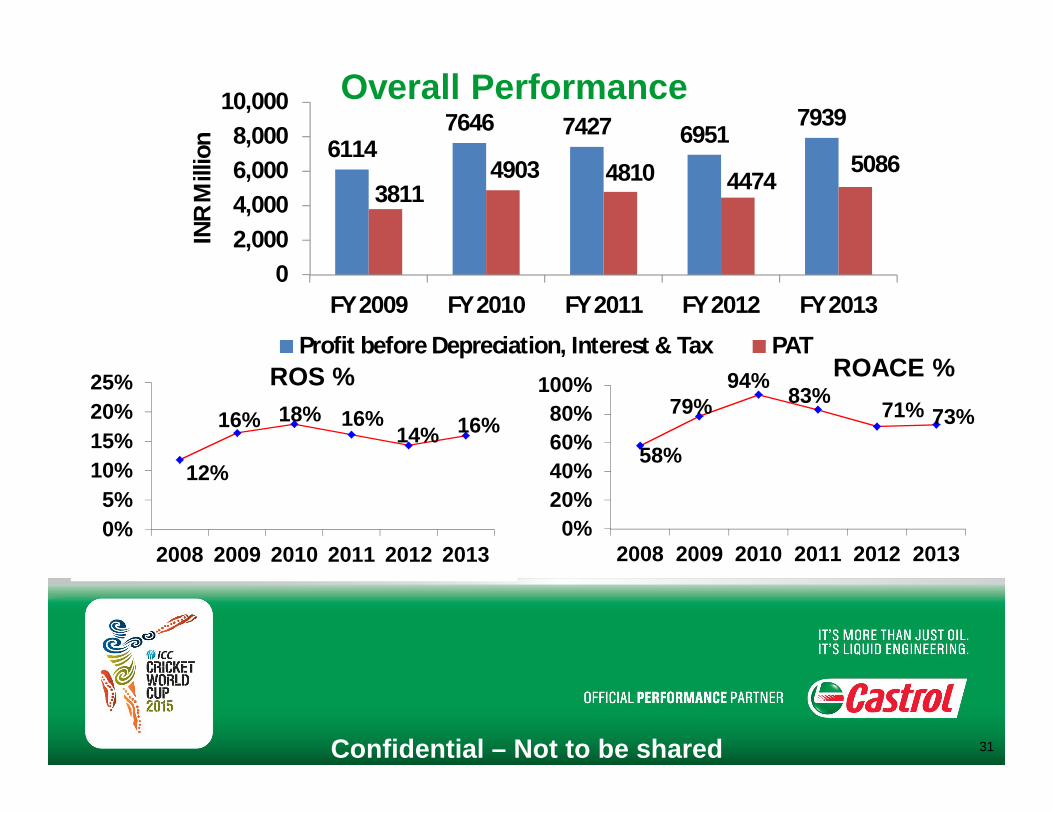
Overall Performance
Confidential – Not to be shared
12%
16% 18% 16%14% 16%
0%5%
10%15%20%25%
2008 2009 2010 2011 2012 2013
ROS %
58%
79%94%
83% 71% 73%
0%20%40%60%80%
100%
2008 2009 2010 2011 2012 2013
ROACE %
61147646 7427 6951
7939
38114903 4810 4474
5086
02,0004,0006,0008,000
10,000
FY 2009 FY 2010 FY 2011 FY 2012 FY 2013
INR
Mill
ion
Profit before Depreciation, Interest & Tax PAT
31
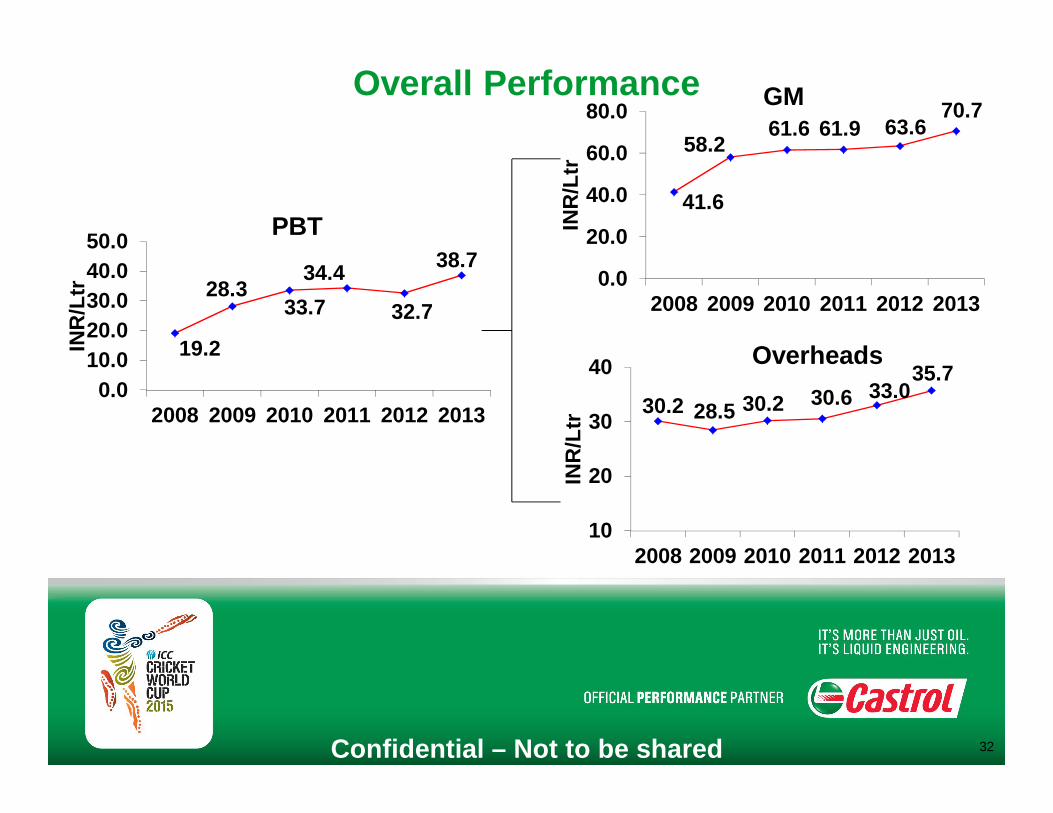
Overall Performance
Confidential – Not to be shared
19.2
28.3 33.7
34.4
32.7
38.7
0.010.020.030.040.050.0
2008 2009 2010 2011 2012 2013
INR
/Ltr
PBT 41.6
58.2 61.6 61.9 63.6
70.7
0.0
20.0
40.0
60.0
80.0
2008 2009 2010 2011 2012 2013
INR
/Ltr
GM
30.2 28.5 30.2 30.6 33.0 35.7
10
20
30
40
2008 2009 2010 2011 2012 2013IN
R/L
tr
Overheads
32
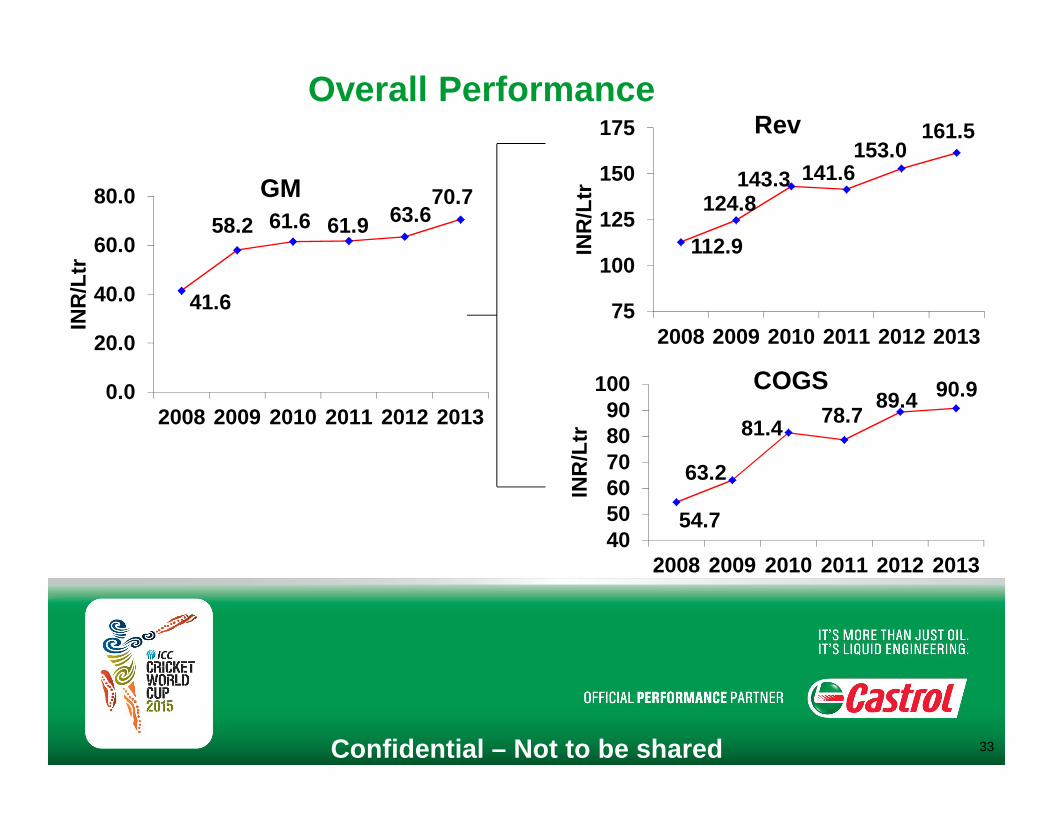
Overall Performance
Confidential – Not to be shared
41.6
58.2 61.6 61.9 63.6 70.7
0.0
20.0
40.0
60.0
80.0
2008 2009 2010 2011 2012 2013
INR
/Ltr
GM
112.9
124.8 143.3 141.6
153.0 161.5
75
100
125
150
175
2008 2009 2010 2011 2012 2013
INR
/Ltr
Rev
54.7
63.2
81.4 78.7 89.4 90.9
405060708090
100
2008 2009 2010 2011 2012 2013IN
R/L
tr
COGS
33
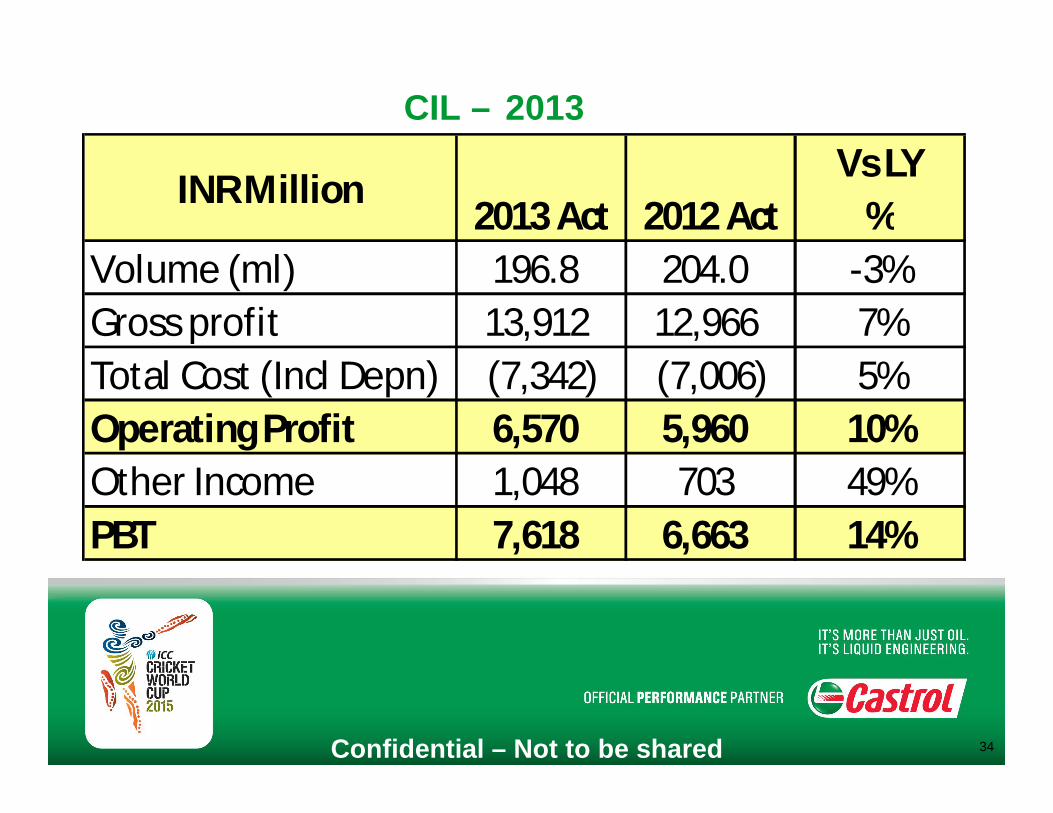
CIL – 2013
INR Million2013 Act 2012 Act
Vs LY %
Volume (ml) 196.8 204.0 -3%Gross profit 13,912 12,966 7%Total Cost (Incl Depn) (7,342) (7,006) 5%Operating Profit 6,570 5,960 10%Other Income 1,048 703 49%PBT 7,618 6,663 14%
Confidential – Not to be shared 34
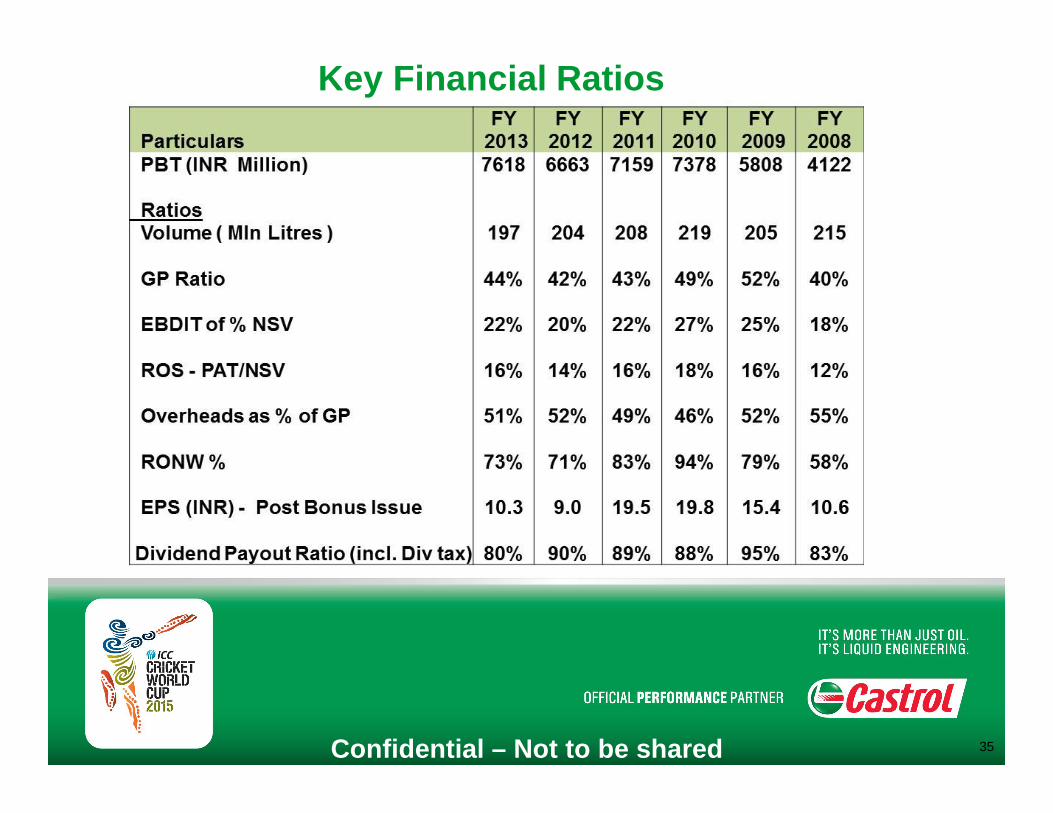
Key Financial Ratios
Confidential – Not to be shared 35
36
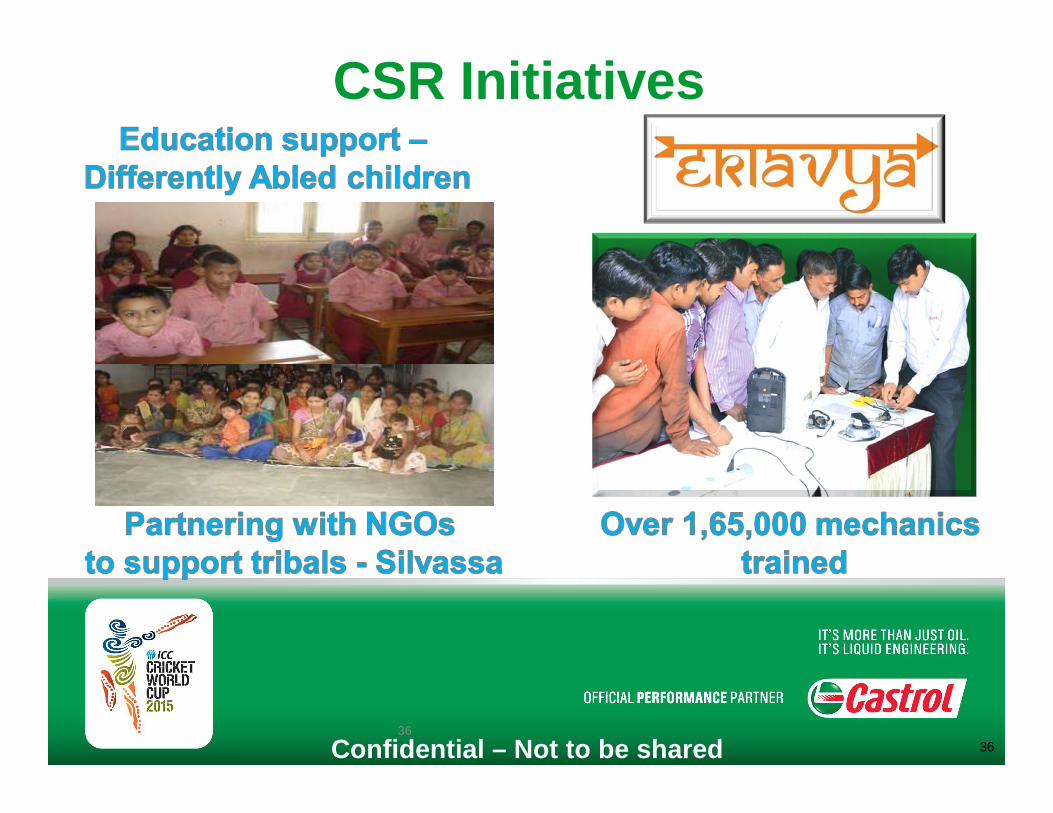
CSR Initiatives
Confidential – Not to be shared 36
Confidential – Not to be shared 37