Embed Size (px)
Citation preview
1 3
Hum Genet (2016) 135:309–326DOI 10.1007/s00439-015-1620-z
ORIGINAL INVESTIGATION
Resolving the ancestry of Austronesian‑speaking populations
Pedro A. Soares1,2,3 · Jean A. Trejaut4 · Teresa Rito2,5,6 · Bruno Cavadas2,7 · Catherine Hill3 · Ken Khong Eng3,8 · Maru Mormina3,9 · Andreia Brandão2,7,10,11 · Ross M. Fraser12,13 · Tse‑Yi Wang4 · Jun‑Hun Loo4 · Christopher Snell3 · Tsang‑Ming Ko14 · António Amorim2,7,15 · Maria Pala10 · Vincent Macaulay16 · David Bulbeck17 · James F. Wilson12,18 · Leonor Gusmão2,19 · Luísa Pereira2,7,20 · Stephen Oppenheimer21 · Marie Lin4 · Martin B. Richards3,10
Received: 19 September 2015 / Accepted: 18 November 2015 / Published online: 18 January 2016 © The Author(s) 2016. This article is published with open access at Springerlink.com
genome-wide data, we performed the most comprehensive analysis of the region to date, obtaining highly consistent results across all three systems and allowing us to recon-cile the models. We infer a primarily common ancestry for Taiwan/ISEA populations established before the Neolithic, but also detected clear signals of two minor Late Holocene migrations, probably representing Neolithic input from both Mainland Southeast Asia and South China, via Tai-wan. This latter may therefore have mediated the Austro-nesian language dispersal, implying small-scale migration and language shift rather than large-scale expansion.
Abstract There are two very different interpretations of the prehistory of Island Southeast Asia (ISEA), with genetic evidence invoked in support of both. The “out-of-Taiwan” model proposes a major Late Holocene expansion of Neolithic Austronesian speakers from Taiwan. An alter-native, proposing that Late Glacial/postglacial sea-level rises triggered largely autochthonous dispersals, accounts for some otherwise enigmatic genetic patterns, but fails to explain the Austronesian language dispersal. Combin-ing mitochondrial DNA (mtDNA), Y-chromosome and
Electronic supplementary material The online version of this article (doi:10.1007/s00439-015-1620-z) contains supplementary material, which is available to authorized users.
* Martin B. Richards [email protected]
1 Department of Biology, CBMA (Centre of Molecular and Environmental Biology), University of Minho, Campus de Gualtar, 4710-057 Braga, Portugal
2 IPATIMUP (Institute of Molecular Pathology and Immunology of the University of Porto), Rua Dr. Roberto Frias s/n, 4200-465 Porto, Portugal
3 Faculty of Biological Sciences, University of Leeds, Leeds LS2 9JT, UK
4 Molecular Anthropology and Transfusion Medicine Research Laboratory, Mackay Memorial Hospital, Taipei City 10449, Taiwan
5 Life and Health Sciences Research Institute (ICVS), School of Health Sciences, University of Minho, Campus de Gualtar, 4710-057 Braga, Portugal
6 ICVS/3B’s-PT Government Associate Laboratory, Braga, Guimarães, Portugal
7 I3S - Institute for Research Innovation in Health, University of Porto, 4200-135 Porto, Portugal
8 Centre for Global Archaeological Research, Universiti Sains Malaysia (USM), 11800 Penang, Malaysia
9 Department of Applied Social Studies, University of Winchester, Sparkford Road, Winchester SO22 4NR, UK
10 Department of Biological Sciences, School of Applied Sciences, University of Huddersfield, Queensgate, Huddersfield HD1 3DH, UK
11 ICBAS - Institute of Biomedical Sciences Abel Salazar, University of Porto, 4050-313 Porto, Portugal
12 Centre for Global Health Research, Usher Institute of Population Health Sciences and Informatics, University of Edinburgh, Teviot Place, Edinburgh EH8 9AG, Scotland, UK
13 Synpromics Ltd, Nine Edinburgh Bioquarter, Edinburgh EH16 4UX, UK
14 Department of Obstetrics and Gynecology, National Taiwan University, Roosevelt Rd., Taipei 10617, Taiwan
15 Faculty of Sciences, University of Porto, Rua do Campo Alegre, s/n, 4169-007 Porto, Portugal
16 Department of Statistics, University of Glasgow, 15 University Gardens, Glasgow G12 8QQ, UK
310 Hum Genet (2016) 135:309–326
1 3
Introduction
Austronesian languages are spoken throughout Taiwan, Island Southeast Asia (ISEA), parts of New Guinea and most of the Pacific Islands. The high linguistic diversity observed in the aboriginal groups of Taiwan, compared to the single language branch (Malayo-Polynesian) spoken throughout the remainder of this vast distribution (Ross 2005), has suggested to historical linguists a homeland on the island of Taiwan (Blust 1976, 1995). The Taiwan-ese linguistic homeland model has received further sup-port in recent years from the work of Ross (2009), which effectively nests Malayo-Polynesian within the Formosan language tree, and has led in turn to the prevailing “out-of-Taiwan” model (Bellwood 1997; Hung et al. 2011) for the spread by demic diffusion of farming—referring spe-cifically to rice agriculture—and red-slipped pottery from 4000 years ago (4 ka) in ISEA, culminating in the spread of Austronesian Oceanic speakers into the Pacific within the last 3 ka (Bellwood 1997; Spriggs 2003, 2007). In prac-tice, the Neolithic in ISEA is defined by the appearance of ceramics, and less ubiquitously new shell artefacts and cloth and barkcloth technologies, and any role of rice or other introduced agriculture has proved much more conten-tious (Spriggs 2011).
The “out-of-Taiwan” model has been dominant for 30 years, despite challenges on many fronts. Languages can be transmitted horizontally, so a root in Taiwan need not automatically imply a demic diffusion model. More complex pictures are emerging for ISEA, in which coastal language shift and language transmissions play the major role (Donohue and Denham 2010, 2015). This paves the way for a modified small-scale “out-of-Taiwan” model that retains the linguistic argument for the origin of the Austro-nesian family in Taiwan without assuming any large-scale population movement or replacement, or that rice agricul-ture is the driving force (Diamond and Bellwood 2003; Oppenheimer 2004; Spriggs 2011).
In fact, a key driver of human mobility may have been the dramatic transformation in the landscape of ISEA in the late Pleistocene/early Holocene. Sea-level rises due to global warming at the end of the last glaciation separated the ancient Sunda continent—for millennia an extension of mainland Asia—into present-day ISEA and Mainland Southeast Asia (MSEA). These are thought to have been concentrated in three major episodes, from 15 to 13.5 ka, 11.5 to 10 ka and 7 to 8 ka (Pelejero et al. 1999). Alter-native models to “out-of-Taiwan” have argued that it may have been the rapid coastal transformation and resulting land-loss (Solheim 2006) that had the most profound effect on genetic patterns in the region, rather than a more recent expansion from Taiwan (Oppenheimer 1998; Oppenheimer and Richards 2001; Soares et al. 2008, 2011) However, although such models attempt to explain the current popu-lation structure in ISEA, they have been less successful in incorporating the linguistic evidence suggesting an Austro-nesian origin in Taiwan (Barker and Richards 2013).
On the genetic side, many seemingly contradictory results have been published in recent years, shifting the per-spective back and forth between a strong Neolithic expan-sion and minor or non-existent dispersals from Taiwan. The two-layer colonization model (Pleistocene colonization and mid-Holocene “out-of-Taiwan” expansion) (Bellwood 1997) often remains the lens through which data are inter-preted. Thus, genetic variation is often categorised either as autochthonous (first colonization or “Melanesian”) or as a later Asian input interpreted as “Austronesian” (Fried-laender et al. 2008; Kayser et al. 2008b). The “Asian” sig-nal on the mtDNA is generated by the so-called “Polyne-sian motif” (Delfin et al. 2012; Melton et al. 1995; Redd et al. 1995; Soares et al. 2011; Sykes et al. 1995; Trejaut et al. 2005), which approaches 100 % in many Remote Pacific islands.
However, Soares et al. (2011) estimated an arrival of this clade (or its ancestor) in Near Oceania ~6 to 10 ka. Although the motif has an ultimately mainland Asian ancestry (in haplogroup B4a1a) sometime in the last 10–20 ka (Soares et al. 2011), it was already well estab-lished in Near Oceania by the mid-Holocene. This implies that the contribution of a Neolithic “out-of-Taiwan” migra-tion to Remote Pacific Islanders is negligible in the mtDNA [as well as Y-chromosome (Capelli et al. 2001; Kayser et al. 2000)] variation in the last 3 ka. But, for ISEA, too, the picture is far from consistent with an “out-of-Taiwan” demic expansion. The largest surveys consistently sug-gest a far more complex picture than the two-layer model (Capelli et al. 2001; Hill et al. 2007; Karafet et al. 2010; Trejaut et al. 2014; Tumonggor et al. 2013). Sea-level rises probably shaped much of the genetic structure of ISEA (Hill et al. 2007; Karafet et al. 2010), with major dispersals originating in what is now the mainland [including mtDNA
17 Department of Archaeology and Natural History, College of Asia and the Pacific, The Australian National University, Acton, Canberra, ACT 2601, Australia
18 MRC Human Genetics Unit, Institute of Genetics and Molecular Medicine, University of Edinburgh, Western General Hospital, Edinburgh EH4 2XU, Scotland
19 DNA Diagnostic Laboratory (LDD), State University of Rio de Janeiro (UERJ), Rua São Francisco Xavier, Rio de Janeiro 20550-900, Brazil
20 Faculty of Medicine, University of Porto, Al. Prof. Hernâni Monteiro, 4200-319 Porto, Portugal
21 Institute of Human Sciences, School of Anthropology, University of Oxford, The Pauling Centre, 58a Banbury Road, Oxford OX2 6QS, UK
311Hum Genet (2016) 135:309–326
1 3
haplogroup B4a1a (Soares et al. 2011)] as well as across what is now ISEA [including haplogroup E (Soares et al. 2008)].
Genome-wide data have also led to challenges to the “out-of-Taiwan” model, albeit with caveats (discussed below). The Pan-Asian SNP Consortium (Abdulla et al. 2009) suggested that the diversity of Taiwanese aboriginals is likely a sub-set of the ISEA diversity, implying that dis-persals between Taiwan and ISEA took place in the reverse direction. This would match the situation seen in mtDNA haplogroup E, inferred to have expanded in ISEA in the postglacial period and reached Taiwan within the last 8 ka (Soares et al. 2008).
Here we perform founder analyses with large new mtDNA datasets, both control-region and whole-genome sequences, and—for the first time—Y-chromosome data. Founder analysis estimates dispersal times and quantifies the contribution of each migration to the present-day popu-lation. We develop an explicit set of criteria by which to evaluate candidate “out-of-Taiwan” markers, and show that haplogroup M7c3, analysed here at the maximal resolution level of whole-mtDNAs, and found in aboriginal Taiwanese and the Philippines at moderate frequencies, but only low frequencies in ISEA and the western Pacific, fulfils these criteria almost perfectly. However, the other major candi-dates proposed for the “out-of-Taiwan” dispersal, haplo-groups E and B4a1a, fail to meet any of them.
Single-locus studies of the uni-parental marker systems can today provide exquisite resolution, but they are, of course, subject to greater stochastic effects than the auto-somal genome. We therefore here back up mtDNA and Y-chromosome variation with fresh analyses of the auto-somal genome-wide structure of Southeast Asians. These multi-locus analyses support the view that the spread of the red-slipped pottery Neolithic and Austronesian languages in ISEA were indeed accompanied by dispersals of sea-farers from Taiwan, but beyond the Philippines the primary mechanism for the spread of both was acculturation. In fact, a slightly earlier Neolithic dispersal from MSEA, involving paddle-impressed ceramics and possibly accompanied by Austroasiatic languages, had a substantially greater genetic impact on much of ISEA, especially in the south.
Methods
mtDNA founder analysis
Founder analysis (Richards et al. 2000) works by identify-ing founder types (the result of individual migration events from source to sink in the past) and then partitioning clus-ters derived from them in the sink population on the basis of their coalescence times, to estimate arrival times. This
mtDNA founder analysis departed from reduced-median networks (Bandelt et al. 1995) of data from HVS-I (the first hypervariable segment) of the mtDNA control region (between nucleotide positions 16,051 and 16,400), usu-ally augmented by haplogroup-diagnostic coding-region variants.
For our sink region, we analysed 2216 mtDNA sequences from Island Southeast Asia (556 from the Philip-pines, 340 from Borneo, and 1320 from the rest of Indo-nesia), including 320 new sequences from ISEA (183 from Sabah, Brunei and Kalimantan in Borneo) and published data (Table S1). For the source we included 6070 Chinese sequences, 1429 from MSEA, 827 aboriginal Taiwanese and 4573 sequences throughout North and Central Asia. We included additional data from Malaysia (519 Malays and 308 Orang Asli), 55 unpublished sequences from Singapore and published data from other regions to further resolve the phylogenetic networks (Table S2). A second database was created with the aim of performing a founder analysis for Remote Oceania. Adding to the sequences above, datasets for New Guinea (846), the Karkar Islands (47), the Solo-mon Islands (258), the Bismarck Archipelago (1005) and Bougainville (255) were included in the new source popu-lation. Sequences from Vanuatu (130) and throughout Poly-nesia (148) were included in the sink population (Table S3).
We analysed the data phylogenetically haplogroup by haplogroup, and carried out the founder analysis as before (Rito et al. 2013), including a 200-year scan as a prelimi-nary step. We estimated errors using the approach of Sail-lard et al. (2000), to allow for non-star-like founder clus-ters. In this approach, we replaced the number of samples in the ρ estimation by an effective number of samples based on the number of samples that would be present in a completely star-like network associated with the same level of uncertainty as we have implemented before (Soares et al. 2012) including at the whole-population level for South African populations (Rito et al. 2013). We employed a mutation rate of one mutation every 16,677 years for the range 16,051–16,400 (Soares et al. 2009) in the founder analysis.
We regard the scan as a heuristic approach to detecting and dating peaks of immigration, and the partition analy-sis as an attempt to quantify and place confidence limits upon them. Following examination of the heuristic scan, we then used archaeological evidence to finalize the dates chosen for the partition analysis, which should compen-sate for any systematic bias in the HVS-I mutation rate we adopted. 4.5 ka approximates the earliest likely arrival of both the putative “out-of-Taiwan” Neolithic and the pad-dle-impressed-ware Neolithic from MSEA in ISEA and is likely to be conservative in the case of the former—an age of 4.5 ka is more persuasive for the influence of MSEA
312 Hum Genet (2016) 135:309–326
1 3
than Taiwan, which more likely postdates 4 ka (Anderson 2005; Spriggs 2007). The putative episode of sea-level rise at ~8 ka (Pelejero et al. 1999) was initially the least well-established of the three episodes (Blanchon and Shaw 1995), but a rapid rise between 7.4 and 6.5 ka has recently received clear support (Bird et al. 2010). The existence of human dispersals at around this time is, however, supported by whole-mtDNA genome evidence from haplogroup E in ISEA and Taiwan (Soares et al. 2008), and by the founder analysis scan. For the primary settlement, we used 50 ka as a rough approximation; evidence from Niah Cave and New Guinea suggest an age upwards of 49 ka (Hunt et al. 2007; Summerhayes et al. 2010).
Y‑chromosome founder analysis
We enhanced the resolution of previously available data (Capelli et al. 2001) by augmenting with 10 more Y-STR (short tandem repeat) markers and five more SNPs. Add-ing to the ten previous Y-chromosome STRs (DYS388, DYS393, DYS392, DYS19, DYS390, DYS391, DYS425, DYS426, DYS389I and DYS389II), we included an addi-tional ten: DYS460, DYS461, DYS438, DYS448, DYS458, DYS437, DYS439, H4, A10 and DYS635. We typed the ten Y-STRs in a multiplex that also included the previously typed Y-STRs, DYS388 and DYS425 (Capelli et al. 2001), to control against mixing of samples across the studies, and as a result we excluded several samples. The DYS426 marker gave inconsistent typing results across the dataset and we therefore excluded this locus from further analyses. Table S4 shows a list of the primers used in the multiplex. We ran the samples on an ABI 16-capillary 3130XL DNA Analyser at the University of Leeds.
Five SNPs were added that included: M230, which allowed the identification of the Pacific haplogroup S; M324, which allowed the identification of O3a against O3* in the previous dataset (Capelli et al. 2001); M50, which allowed the identification of subclade O1a2 within O1a, which were to prove highly relevant to identifying “out-of-Taiwan” founders; and M38 and M208, which permit the identification of subclades C-M38 and the Pacific C-M208 in samples previously labelled C* haplogroup only (Capelli et al. 2001). We typed M230, M324 and M208 using restriction analysis (Table S5 indicate primers and enzymes used), and M50 and M38 using denaturing high-perfor-mance liquid chromatography (dHPLC), as described pre-viously (Underhill et al. 2000). We ran the samples on an automated 3500HT Wave (Transgenomic) dHPLC instru-ment and analyzed the results with the Navigator software. Fig. S1 summarises the SNPs analysed and the distribution of the clades identified across the sampling locations.
We used the SNP data to test the reliability of the STR analyses by constructing a median-joining network
(Bandelt et al. 1999) of the overall Y-STR data. Initially we calculated a highly reticulated network using the same standard weight (10) for all STRs. We registered the num-ber of occurrences of each STR change, and used these values to generate a graduated weighting scheme for a new network reconstruction (weight of 1 for the STR showing the highest number of occurrences and a weight of 10 for the lowest). We repeated this process until the phylogeny became stable with further iterations. The final weight-ing scheme gave DYS458 a weight of 1, while DYS388, DYS425, DYS437 and DYS438 were each given a weight of 10. The new STR network showed a remarkable con-gruence with the clustering of SNP-defined lineages (Fig. S2), with just a few minor exceptions (most particularly, ten C-M38 lineages that separated from the main cluster), showing that, although the SNP tree is limited, the Y-STR data, suitably analysed, can provide an unbiased and relia-ble reconstruction of ancestry. STR markers are, of course, far more unstable than bi-allelic variants but, if we consider the difficulties associated with generating a reliable tree of mtDNA haplogroups based on HVS-I data alone, we can assume we have a comparable resolution to the maternal founder analysis counterpart—possibly higher.
Zhivotovsky et al. (2004) calculated an effective muta-tion rate of 6.9 × 10⁻⁴ mutations in 25 years per Y-STR, or an average Y-STR mutation rate of 2.76 × 10⁻⁵ mutations per year, which is slower than estimated Y-STR pedigree rates by an order of magnitude (Gusmão et al. 2005). Since our dataset included a star-like clade that is confined to Remote Oceania (Fig. S3), and considering that the coloni-zation time of this region is well established by radiocarbon evidence, we opted for re-calibrating the specific 19 Y-STR average mutation rate using the settlement of the Remote Pacific as the calibration point. To this end, we constructed a network of haplogroup C-M208 and applied weights obtained previously in the general Y-STR network (Fig. S4) to the network. C-M208 shows three main branches, two present in Madang and Vanuatu and a third present only in Remote Oceania (excluding Vanuatu) from Fiji to French Polynesia. The expansion into Remote Oceania began as early as ~3.3 ka, indicated by radiocarbon estimates at a Lapita site in Vanuatu (Bedford et al. 2006), while West-ern Polynesia (Tonga and Samoa) was colonised ~2.9 ka (Rieth and Hunt 2008). The star-like subclade, C-M208, was not present in Vanuatu and we therefore assumed an estimate of 3000 years for the age of this subclade, whose westernmost location was Fiji [see discussion in Clark and Anderson (2009)]. We estimated an average Y-STR muta-tion rate of 4.08 × 10⁻⁵ mutations per year, meaning nearly 50 % faster than the one calculated by Zhivotovsky et al. (2004). We must emphasize that this average mutation rate corresponds specifically to this group of STRs, and also that we are dealing with a very recent human event in the
313Hum Genet (2016) 135:309–326
1 3
calibration. Our estimated mutation rate is still substan-tially slower when compared with father–son transmission studies (Ballantyne et al. 2010; Gusmão et al. 2005).
As for the HVS-I mtDNA data, we calculated networks for each clade. We rooted the networks by estimating the root through midpoint rooting and using an outgroup of the consensus STR length of the closest available clade to fur-ther pinpoint a hypothetical root. Again we selected found-ers using both f1 and f2 criteria (Richards et al. 2000). We used the Bayesian migration partition tool (Richards et al. 2000) in the same two ways: a scan of equally distant inter-vals of 200 years (Rito et al. 2013; Soares et al. 2012) and a model of migration with migration time windows based on the scan and archaeological and climatological data. This is the first direct application of founder analysis to Y-chromo-some data.
The partition model included, as for mtDNA, migrations at 0.5 ka (for recent gene flow), 4.5 ka (Neolithic) and 8 ka (postglacial migrations) differing only in the time of the older migration (20 ka instead of 50 ka). We do not expect the ρ statistic (Forster et al. 1996) to be a good estimator of age for more ancient lineages in a highly mutating sys-tem such as STRs. Because of this, using a realistic time of first settlement based on archaeology of ~50 ka (Hunt et al. 2007) in the partition model would cause the older lineages dating to about 20 ka to be statistically allocated in the postglacial migration at 8 ka, to which they are closer, which we believe would be quite misleading. We therefore opted for including a migration at the time of the peak, 20 ka, even though the age of the peak probably does not correspond to the time of migration.
Validation: founder analyses for Remote Oceania
To evaluate the performance of the methodology, we also executed a founder analysis from ISEA/Near Oceania into Remote Oceania. The well-characterized time of expansion into the Remote Pacific islands provides a valuable frame-work for testing the clock and the founder analysis meth-odology that we employed. The expansion into Remote Oceania may have begun before 3 ka into Vanuatu (Bed-ford et al. 2006), but the major migration into Western Polynesia began only within the last 3 ka (Rieth and Hunt 2008). In our founder analysis using a 200-year scan we obtained the same pattern for the two criteria: a single peak at 3000 years (Fig. S5), fitting very well the archaeological data.
We obtained a similar pattern for the Y-chromosome analysis (Fig. S5). However, contrary to the mtDNA anal-ysis, we should re-emphasize that this is very far from a completely independent check for the methodology, since the rate of the Y-STRs we employed was calibrated assum-ing 3000 years for the major founder clade entering Remote
Oceania. It is nevertheless reassuring that the time of the peak was not affected by the inclusion of the other clades in the analysis. We should note also that the estimated muta-tion rate is to be employed in determining migratory frac-tions in ISEA and not the Pacific, so its use does not pro-vide circular evidence, only the cross-checking.
Genome‑wide analysis
We used 1251 samples taken from the Pan-Asian SNP Gen-otyping Database (Abdulla et al. 2009; Ngamphiw et al. 2011) (Table S6). We used the West African Yoruba data as an outgroup, as well as a South Asian group. The objec-tive of the analysis is to compare the genome-wide patterns with the haploid marker results.
The initial dataset contained 54,794 SNPs. We pruned this dataset for linkage disequilibrium (LD) using PLINK (Purcell et al. 2007). One SNP in pairs with LD higher than r2 = 0.1 was removed in windows of 50 SNPs shifted five SNPs each time, as used before (Pierron et al. 2014; Verdu et al. 2014). We used a total of 23,332 SNPs in further analyses. We employed ADMIXTURE (Alexander et al. 2009) to estimate population structure using a maximum likelihood approach, assuming different numbers (2–15) of ancestral populations or genetic components (K). A few populations, namely the "Negrito" groups in Malaysia, dis-played a single private component for very low values of K that is not present elsewhere, most probably due to the effect of strong genetic drift. As the objective of the analy-sis was to display overall geographic patterns to provide a frame of comparison with the uniparental markers’ phylo-geography, and since these populations did not provide any relevant information in this regard, we opted for excluding them from the final analysis. We performed a cross-valida-tion by inspecting the cross-validation error (CVE) in the analyses with different values of K (2–15). Theoretically, the one with the lowest CVE should be the most accurate. A graphic of the variation of the CVE obtained is shown in Fig. S6. Although the CVE does not vary much above K = 5, K = 10 displays the lowest value.
To visualize the distribution of specific mtDNA clades or autosomal components, we displayed the frequency dis-tributions using the Kriging algorithm of Surfer 8. Data points used for the mtDNA and the genome-wide compo-nents are shown in Fig. S7.
Whole‑mitochondrial genomes
We analysed lineages from across the range of variation in mtDNA haplogroup M7, but with a particular focus on the candidate “out-of-Taiwan” marker, M7c3c. We generated a total of 114 new M7 sequences, including 38 Taiwanese, 20 Vietnamese, 16 Indonesians, 12 Peninsular Malaysians,
314 Hum Genet (2016) 135:309–326
1 3
7 East Malaysians, 6 Laotians, 4 Chinese, 4 Micronesians (from Nauru and Kiribati), 3 Bruneians, 2 Filipinos, 1 Bur-mese and 1 Thai. We also extracted 51 new M7 sequences from the raw data of the 1000 Genomes project (unavaila-ble at the start of this study). We performed whole-mtDNA sequencing as previously described (Torroni et al. 2001) using an ABI 48-capillary 3730 DNA Analyser (Taipei) an ABI 16-capillary 3130XL DNA Analyser (Leeds) and an ABI 16-capillary 3100 DNA Analyser (Porto). Details on the new and published sequences used in the phylo-genetic reconstruction of haplogroup M7 are indicated in Table S7. We deposited the new whole-mtDNA sequences in GenBank (accession numbers JX987440-JX987470 and KU131308-KU131390). For comparison with mtDNA hap-logroup M7, we also re-analysed haplogroups B4a1 and E using all the available published whole-mtDNA genome sequences. We list the samples we used in the analyses in Tables S8 and S9.
We reconstructed phylogenies of haplogroups M7, B4a1a and E using Network 4.6 software with the reduced-median algorithm (Bandelt et al. 1995), resolving reticu-lations on the basis of the relative rates of the mutations involved (Soares et al. 2009). We estimated ages for the dif-ferent phylogenies using both the ρ statistic (Forster et al. 1996) and maximum likelihood (ML), using the mtDNA clock of Soares and collaborators that corrects for purify-ing selection from the long-term phylogenetic rate of one mutation every 3624 years (Soares et al. 2009). We esti-mated branch lengths in ML using PAML 3.13 (Yang 1997) assuming the HKY85 substitution model with gamma-dis-tributed rates (32 categories). We also employed a synony-mous mutation rate of one substitution every 7884 years (Soares et al. 2009) using the ρ statistic (Forster et al. 1996). We have discussed in some detail previously the potential impact of mutation rate uncertainty on phylogeo-graphic conclusions (Mellars et al. 2013) and we re-calcu-lated the confidence intervals in similar fashion here.
We obtained Bayesian skyline plots (BSPs) (Drummond et al. 2005) using BEAST 1.4.6. (Drummond and Rambaut 2007) to detect signatures of population increment associ-ated with the haplogroups under analysis. We employed a relaxed molecular clock (lognormal in distribution across branches and uncorrelated between them), a mutation rate of 2.514 × 10⁻⁸ mutations per site per year for the whole-mtDNA genome (Pereira et al. 2010) and the HKY model of nucleotide substitutions with gamma-distributed rates, assuming a generation time of 25 years. We compared dif-ferent signatures of population growth in ISEA and abo-riginal Taiwanese data for the three haplogroups analysed, M7c3c, B4a1a and E.
Given a recent age estimate for haplogroup E based on a single ancient DNA sequence (Ko et al. 2014) that diverges significantly from previous estimates for this haplogroup,
we performed a new estimate that was also based on ancient DNA sequences. Ancient DNA calibration is becoming a widely used approach (Ho et al. 2007), but estimates based on a single sequence are highly divergent and present large confidence intervals (Fu et al. 2013b). Calibrating a clock with only a single ancient DNA sequence can be mislead-ing, particularly for recent samples for which even the sto-chastic presence of one more or one less mutation than the expected clade average can lead to strong departures from a realistic mutation rate. For calibration purposes, we added two more ancient East Asian sequences to the haplogroup E sequence described by Ko et al. (2014). One dates to the same time-frame as the E sequence: Boshan 11, from north-east China, at 8.18 ka (Fu et al. 2013b). The second one is older: Tianyuan 1301, also from north-east China, at 39.5 ka (Fu et al. 2013a); it is important to include this in the analysis, since haplogroup E as a whole will neces-sarily be older than the ancient haplogroup E sequence. In the analysis, we used a tree that represents a snapshot of human diversity (Table S10), which allows a better esti-mate of the evolutionary parameters in mtDNA, with all the main haplogroup E branches represented. We employed a relaxed molecular clock (lognormal in distribution across branches and uncorrelated between them) using BEAST 1.4.6. (Drummond and Rambaut 2007), with a constant population size and the HKY model of nucleotide substitu-tions, with gamma-distributed rates.
Results
mtDNA control‑region and Y‑chromosome founder analyses
To investigate the genetic input into ISEA through time, we carried out founder analyses with both mitochondrial DNA (mtDNA) control-region sequences—for the maternal line of descent—and Y-chromosome variation using a 19 Y-STR dataset within SNP-defined lineages—for the paternal line of descent. Founder analysis is a quantitative phylogeo-graphic approach developed to evaluate the diversity of lin-eage clusters that has arisen within a particular geographic sink region (in this case, ISEA), following migration from a specified (assumed) source region (in this case, MSEA/China/Taiwan). Using the molecular clock to convert to time depth, these values are a proxy for the minimum arrival age of each founder cluster in the sink (Richards et al. 2000).
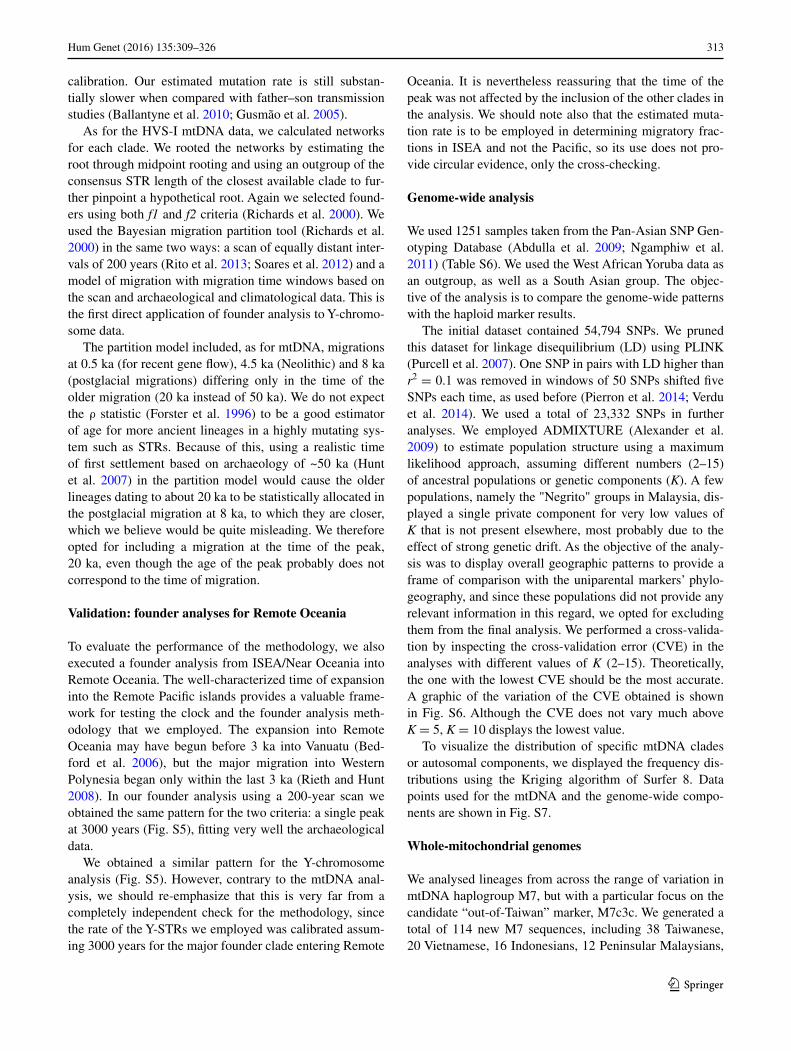
For maternal lineages, the 200-year scan of founder lin-eages dispersing into ISEA (Fig. 1a) identified two major coalescence peaks (corresponding to bursts of immigration) under the two criteria we employed, f1 and f2 (Fig. 1a) (Table S11), at 4.6–4.8 ka and at 8–10 ka, respectively. We
315Hum Genet (2016) 135:309–326
1 3
also observed a slight hump ~55 ka with the f2 criterion alone.
For Y-chromosome variation (Fig. 1b), we obtained very similar peaks with both criteria (one at 4–5 ka and a second at ~8 ka). Rather remarkably, the two main peaks in two different genetic systems with distinct mutation rates and estimated using two distinct founder criteria are consist-ent across each of these different analyses. In addition, we observed an increment representing very recent migrations and, with the f2 criterion, a further extra peak at 10–11 ka. This peak might signal the second well-defined episodic flood immediately after the Younger Dryas (Pelejero et al. 1999). We did not include it in the migration model,
however, for two reasons: it was detected only under a sin-gle criterion and with one genetic system; and, in any case, founders at this peak will be included statistically in the ~8 ka migration that overall can be defined as postglacial migrations. The oldest arrivals here date to ~20 ka, largely haplogroup K and C lineages. This may well correspond with the ancient minor peak for mtDNA; we expect ρ dat-ing with STRs to provide severe underestimates for ancient clades because of mutational saturation. However, for the present analysis this is a minor issue, since we are con-cerned primarily with events in the Holocene. Particularly in the case of K, an older age than this could be expected, considering that K probably evolved in the region since the
Fig. 1 Founder analysis results for ISEA, assuming Taiwan as source, for mtDNA (female lineages) and Y-chromosome variation (male lineages). a Probabilistic distribution of mtDNA founder clus-ters across migration times scanned at 200-year intervals from 0 to 70 ka, using two criteria for founder identification, f1 and f2; b proba-bilistic distribution of Y-chromosome founder clusters across migra-tion times scanned at 200-year intervals from 0 to 70 ka, using two criteria for founder identification, f1 and f2; c proportion of founder
lineages in a four-migration model for mtDNA and Y-chromosome variation using two criteria for founder identification, f1 and f2; d probabilistic distribution of each individual lineage in mtDNA and Y-chromosome variation in a four-migration model chromosome using two criteria for founder identification, f1 and f2. Individual founder clusters with more than 2 % frequency in overall ISEA (sink populations) are indicated at the left-hand side of each plot
316 Hum Genet (2016) 135:309–326
1 3
first settlement as displayed by the high prevalence of K* and K subclades in the ancient Sahul populations, includ-ing Aboriginal Australians (Hudjashov et al. 2007).
We then partitioned the founders in ISEA using a migra-tion model informed not only by the scan results in the two genetic systems, but also archaeological and palaeoclima-tological evidence, to quantify the contribution of each immigration event to the extant mtDNA and Y-chromo-some gene pools in ISEA. The model from mtDNA data here assumes migrations at 4.5, 8 and 50 ka, corresponding to Neolithic immigration, postglacial expansions and first Pleistocene settlement. We assumed a further dispersal at 0.5 ka to allow for any recent/historical gene flow.
For Y-chromosome variation, we used a more recent age of 20 ka to cover the more ancient migrations, as mentioned above. However, the matching of peaks at 4–5 ka and 8–10 ka for both the paternal and maternal line of descent is striking. The overall contribution at each proposed migration time for each of the two founder criteria in the mtDNA and Y-chromosome variation is shown graphically in Fig. 1c, d. The mtDNAs coalescing at the time of the first settlement (~50 ka) accounted for ~10 to 20 % of modern mtDNA lineages in ISEA. Note that many lineages from the ancient Sunda continent would very likely be present across both ISEA and MSEA, which were only finally sep-arated by sea-level rise ~8 ka. However, MSEA is a source region in this analysis, so this value in the founder analy-sis corresponds to ancient lineages private to ISEA only. In the mtDNA analysis, lineages descending directly from the haplogroups carried by the first settlers correspond to M*, N*, R* and possibly haplogroup F3 (Fig. 1d). Although a recently published ancient mtDNA haplogroup E sequence (Ko et al. 2014) was used to suggest a Taiwanese source for this clade, an early origin in ISEA (Soares et al. 2008) remains more likely, as discussed below. At this ancient time-frame, Y-chromosome lineages (with STR ρ dating) are uninformative due to saturation, but haplogroups K* and even C may date to the first colonization at that time. These are above 30 % in the Y-chromosome analysis.
Overall, the migration at ~8 ka contributes the most line-ages to the current gene pool of ISEA with a fraction of ~40–50 % in both mtDNA and Y-chromosome variation (Fig. 1c). We stress again that, statistically, this migration time could include lineages entering ISEA throughout the period of sea-level rises, from 14 to 8 ka, covering all three flooding episodes (Pelejero et al. 1999). This partition prob-abilistically includes major and well-studied haplogroups such as B4a1a (Soares et al. 2011), subclades of haplo-group E (Soares et al. 2008), F1a*, and subclades of hap-logroup M shared between ISEA and MSEA, with B4a1a and E the major contributors. In Y-chromosome variation, this migration includes most clusters within haplogroups O2a1 and O3 and a subclade of O1a (Fig. S4), matching to
some extent the results of Karafet et al. (2010) indicating that O1a* entered ISEA before the Neolithic. We should note that in our recent Y-chromosome survey (Trejaut et al. 2014), O2 and O3 clades declined in frequency moving north from ISEA towards Taiwan, the opposite of what one might expect from an “out-of-Taiwan” movement. A pre-vious survey (Karafet et al. 2010) also suggested that O3, O2a1 and O1a* entered ISEA from the mainland before the Neolithic period.
The contribution at the time of the Neolithic, at 4–5 ka, varied with the criterion and the genetic system, but 25–35 % is probably the best estimate (Fig. 1c). (The f1 criterion in mtDNA probably overestimates recent migra-tion due to the large size of the source sample used.) Only one major founder presented significant differences between the analyses: B4b appears Neolithic in f1 crite-rion and part of the postglacial migration in the f2 criterion (Fig. 1d). This haplogroup deserves further attention in the future. The widely held model for the spread of the Neo-lithic in ISEA implicates expanding pre-Austronesian/Aus-tronesian speakers from South China/Taiwan (Bellwood 1997); but in fact not all of the Neolithic founders we iden-tify support this hypothetical “out-of-Taiwan” dispersal. A large fraction of Neolithic mtDNA founder clusters from haplogroups B5a1 and F1a1a (~10 % out of the 25–35 % Neolithic lineages in the analysis) appear to have originated in MSEA, and are rare or absent in either Taiwan or the Philippines.
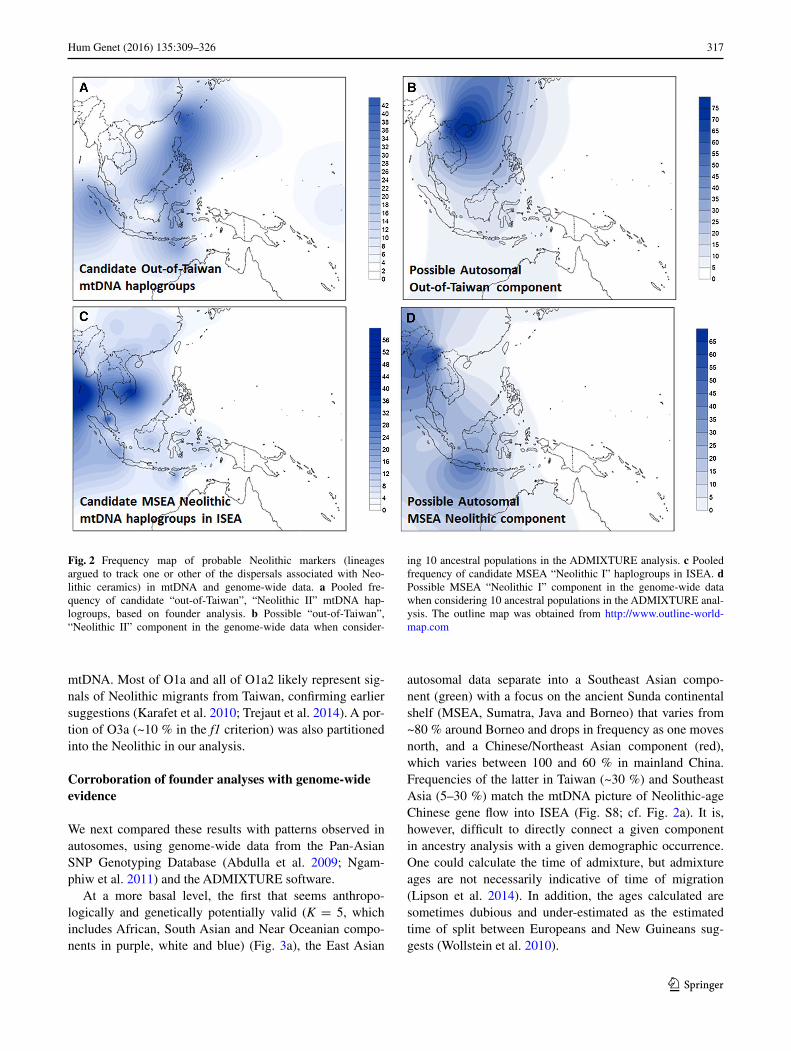
Our results therefore suggest that mid-Holocene Neo-lithic immigration into ISEA was in part via MSEA, temporally associated with spread of basket-marked and carved paddle-impressed pottery, which appeared across MSEA as early as red-slipped pottery appeared in Tai-wan (Bulbeck 2011), and possibly involving speakers of Austroasiatic languages (i.e. Anderson’s “Neolithic I”) (Anderson 2005). The mtDNA haplogroups M7c3c, Y2, F1a4a, B4c1c and possibly B4b (which shows contrast-ing patterns under the two criteria) may, however, rep-resent genuine “out-of-Taiwan” clades in ISEA. These founders are all derived from Chinese-mainland source haplogroups, and within Austronesian-speaking popula-tions they have a higher overall frequency in Taiwan and the Philippines (Fig. 2a). This input, at ~20 %, lends sup-port to a modified, small-scale “out-of-Taiwan” model [Anderson’s “Neolithic II” (Anderson 2005; Donohue and Denham 2010)], proposed to explain the appearance of red-slipped pottery in relation to the early dispersal of Austronesian languages.
On the male line of descent, the Neolithic contribution is lower (15–20 %) but, since MSEA is not represented in the Y-chromosome dataset, all these Neolithic founders are likely to represent the putative “out-of-Taiwan” dispersal, mirroring closely the ~20 % “out-of-Taiwan” founders for
317Hum Genet (2016) 135:309–326
1 3
mtDNA. Most of O1a and all of O1a2 likely represent sig-nals of Neolithic migrants from Taiwan, confirming earlier suggestions (Karafet et al. 2010; Trejaut et al. 2014). A por-tion of O3a (~10 % in the f1 criterion) was also partitioned into the Neolithic in our analysis.
Corroboration of founder analyses with genome‑wide evidence
We next compared these results with patterns observed in autosomes, using genome-wide data from the Pan-Asian SNP Genotyping Database (Abdulla et al. 2009; Ngam-phiw et al. 2011) and the ADMIXTURE software.
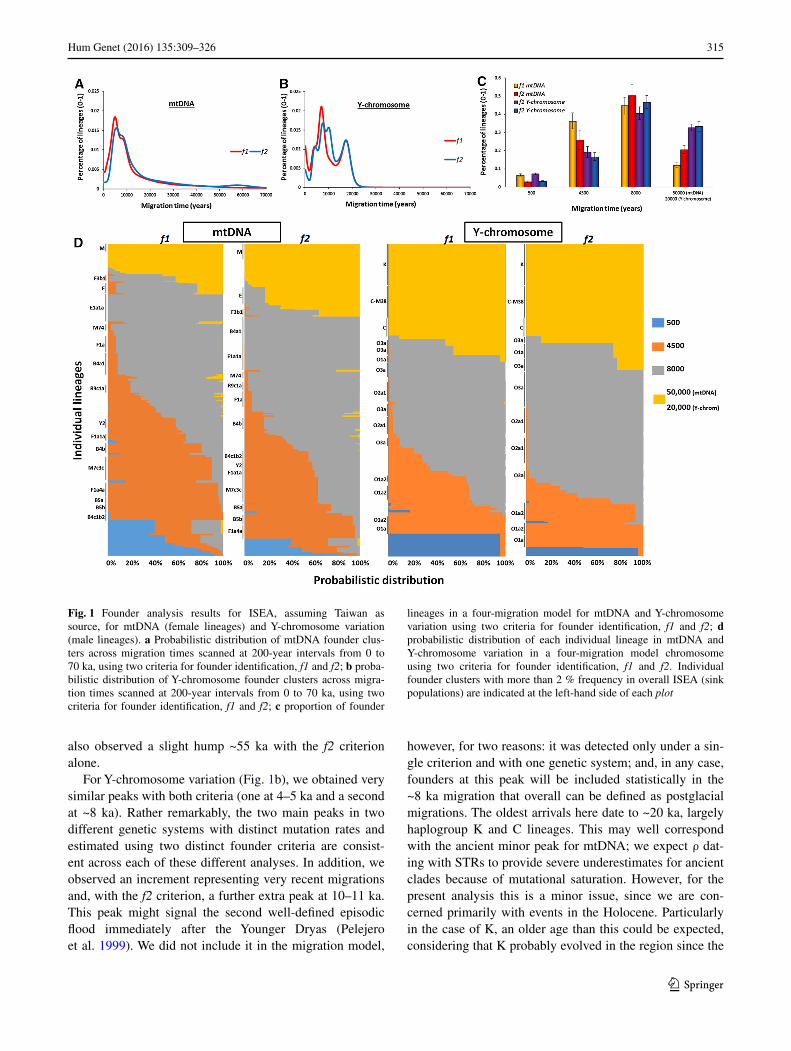
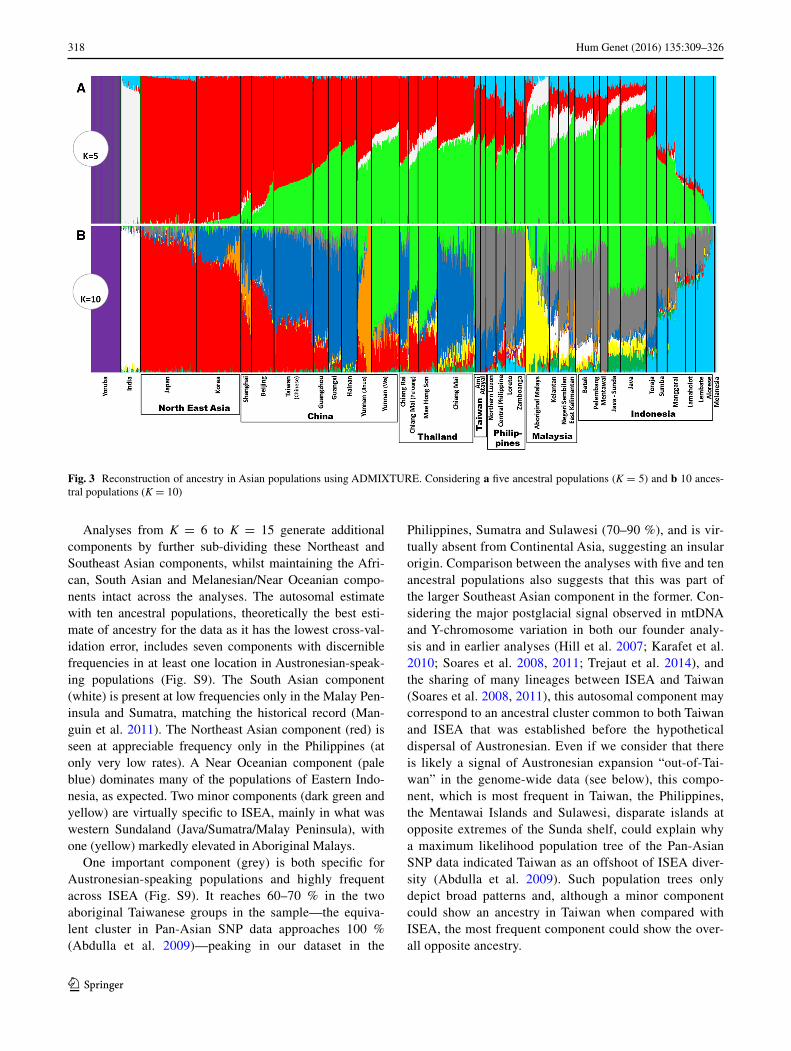
At a more basal level, the first that seems anthropo-logically and genetically potentially valid (K = 5, which includes African, South Asian and Near Oceanian compo-nents in purple, white and blue) (Fig. 3a), the East Asian
autosomal data separate into a Southeast Asian compo-nent (green) with a focus on the ancient Sunda continental shelf (MSEA, Sumatra, Java and Borneo) that varies from ~80 % around Borneo and drops in frequency as one moves north, and a Chinese/Northeast Asian component (red), which varies between 100 and 60 % in mainland China. Frequencies of the latter in Taiwan (~30 %) and Southeast Asia (5–30 %) match the mtDNA picture of Neolithic-age Chinese gene flow into ISEA (Fig. S8; cf. Fig. 2a). It is, however, difficult to directly connect a given component in ancestry analysis with a given demographic occurrence. One could calculate the time of admixture, but admixture ages are not necessarily indicative of time of migration (Lipson et al. 2014). In addition, the ages calculated are sometimes dubious and under-estimated as the estimated time of split between Europeans and New Guineans sug-gests (Wollstein et al. 2010).
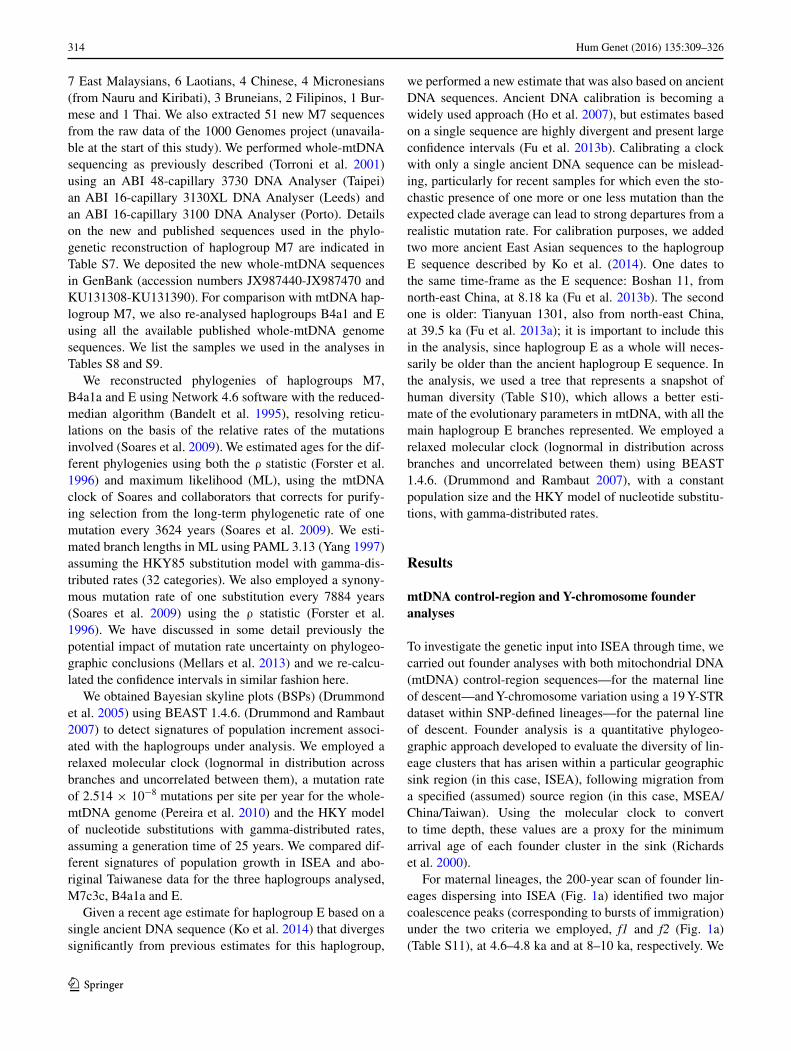
Fig. 2 Frequency map of probable Neolithic markers (lineages argued to track one or other of the dispersals associated with Neo-lithic ceramics) in mtDNA and genome-wide data. a Pooled fre-quency of candidate “out-of-Taiwan”, “Neolithic II” mtDNA hap-logroups, based on founder analysis. b Possible “out-of-Taiwan”, “Neolithic II” component in the genome-wide data when consider-
ing 10 ancestral populations in the ADMIXTURE analysis. c Pooled frequency of candidate MSEA “Neolithic I” haplogroups in ISEA. d Possible MSEA “Neolithic I” component in the genome-wide data when considering 10 ancestral populations in the ADMIXTURE anal-ysis. The outline map was obtained from http://www.outline-world-map.com
318 Hum Genet (2016) 135:309–326
1 3
Analyses from K = 6 to K = 15 generate additional components by further sub-dividing these Northeast and Southeast Asian components, whilst maintaining the Afri-can, South Asian and Melanesian/Near Oceanian compo-nents intact across the analyses. The autosomal estimate with ten ancestral populations, theoretically the best esti-mate of ancestry for the data as it has the lowest cross-val-idation error, includes seven components with discernible frequencies in at least one location in Austronesian-speak-ing populations (Fig. S9). The South Asian component (white) is present at low frequencies only in the Malay Pen-insula and Sumatra, matching the historical record (Man-guin et al. 2011). The Northeast Asian component (red) is seen at appreciable frequency only in the Philippines (at only very low rates). A Near Oceanian component (pale blue) dominates many of the populations of Eastern Indo-nesia, as expected. Two minor components (dark green and yellow) are virtually specific to ISEA, mainly in what was western Sundaland (Java/Sumatra/Malay Peninsula), with one (yellow) markedly elevated in Aboriginal Malays.
One important component (grey) is both specific for Austronesian-speaking populations and highly frequent across ISEA (Fig. S9). It reaches 60–70 % in the two aboriginal Taiwanese groups in the sample—the equiva-lent cluster in Pan-Asian SNP data approaches 100 % (Abdulla et al. 2009)—peaking in our dataset in the
Philippines, Sumatra and Sulawesi (70–90 %), and is vir-tually absent from Continental Asia, suggesting an insular origin. Comparison between the analyses with five and ten ancestral populations also suggests that this was part of the larger Southeast Asian component in the former. Con-sidering the major postglacial signal observed in mtDNA and Y-chromosome variation in both our founder analy-sis and in earlier analyses (Hill et al. 2007; Karafet et al. 2010; Soares et al. 2008, 2011; Trejaut et al. 2014), and the sharing of many lineages between ISEA and Taiwan (Soares et al. 2008, 2011), this autosomal component may correspond to an ancestral cluster common to both Taiwan and ISEA that was established before the hypothetical dispersal of Austronesian. Even if we consider that there is likely a signal of Austronesian expansion “out-of-Tai-wan” in the genome-wide data (see below), this compo-nent, which is most frequent in Taiwan, the Philippines, the Mentawai Islands and Sulawesi, disparate islands at opposite extremes of the Sunda shelf, could explain why a maximum likelihood population tree of the Pan-Asian SNP data indicated Taiwan as an offshoot of ISEA diver-sity (Abdulla et al. 2009). Such population trees only depict broad patterns and, although a minor component could show an ancestry in Taiwan when compared with ISEA, the most frequent component could show the over-all opposite ancestry.
Fig. 3 Reconstruction of ancestry in Asian populations using ADMIXTURE. Considering a five ancestral populations (K = 5) and b 10 ances-tral populations (K = 10)
319Hum Genet (2016) 135:309–326
1 3
Two autosomal components that might signal Neolithic dispersals can be compared with the patterns obtained from Neolithic founder candidates in the mtDNA analysis. One of these components (paler green in Fig. 3b) is frequent in MSEA/Southwest China (up to ~70 %) and varies from 5 to 40 % in Indonesia (Fig. 2d), but is absent from Tai-wan and rare in the Philippines. It is probably a relatively recent arrival as it is not evenly distributed across ISEA. The MSEA Neolithic candidates in the mtDNA also show a strong peak of frequency in MSEA and frequencies of 5–30 % in Indonesia, but are rare in the Philippines and Tai-wan (Fig. 2c). We can also match these distributions with the presence of basket-marked and carved paddle-impressed pottery: in Sarawak, assemblages at ~4.5 ka with carved cord-wrapped or basketry-wrapped paddle-impressed pot-tery (Bellwood 1997; Bulbeck 2008) show the influence of an early Neolithic from MSEA in Western Indonesia.
The final component (dark blue in Fig. 3b) has a high frequency in South China (Fig. 2b) and is also seen in Tai-wan at ~25–30 %, in the Philippines at ~20–30 % (except in one location which is almost zero) and across Indonesia/Malaysia at 1–10 %, declining overall from Taiwan within Austronesian-speaking populations. The mtDNA candi-dates for “out-of-Taiwan” markers (Fig. 2a) also show an overall frequency of up to ~35 % in Taiwan and the Philip-pines, but are almost absent in parts of Borneo, Java and Eastern Indonesia. Sumatra superficially presents a more discordant picture between genome-wide and mtDNA results, but the sampling of the Pan-Asian SNP dataset involves only Batak people whilst our mtDNA sampling involved the wider Sumatran population. We should also bear in mind that the genome-wide sampling lacks major areas of ISEA, including the whole of Borneo.
Therefore, the overall picture from the ADMIX-TURE analysis with 10 ancestral populations where the
cross-validation error was the lowest, is concordant with the mtDNA and Y-chromosome pattern, with a minor Neo-lithic input from MSEA, probably immediately preceding a Neolithic input from Taiwan (Anderson 2005) that had a strong demographic impact in the Philippines, but a much more minor genetic input elsewhere in the Indo-Malaysian Archipelago.
Confirmation with whole‑mtDNA genome data
Although providing much larger sample sizes, the low phylogenetic resolution of mtDNA HVS-I data can create problems for phylogeographic analyses such as founder analysis, for example by conflating distinct founders. In parallel, we therefore checked the phylogeographic sig-nal with the much better resolved whole-mtDNA genomes for the major “out-of-Taiwan” haplogroup in the founder analysis, M7c3c. In particular, we wished to compare the results for M7c3c with the two putative postglacial signals for haplogroups E and B4a1a (Soares et al. 2008, 2011).
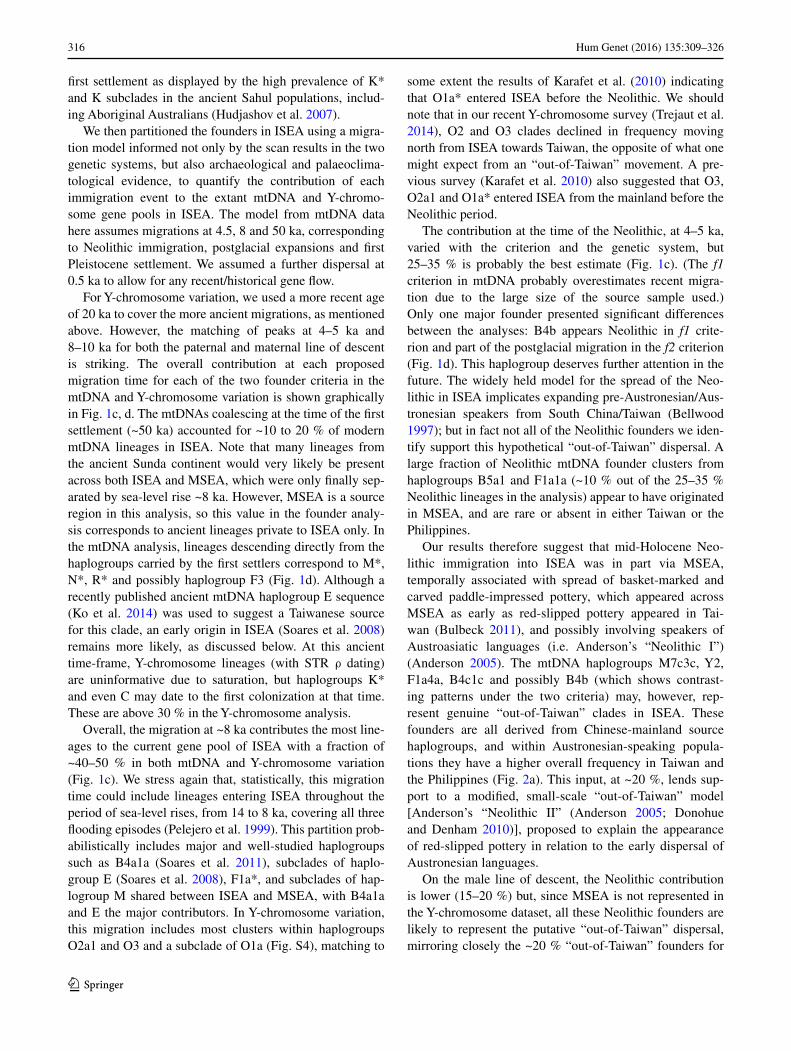
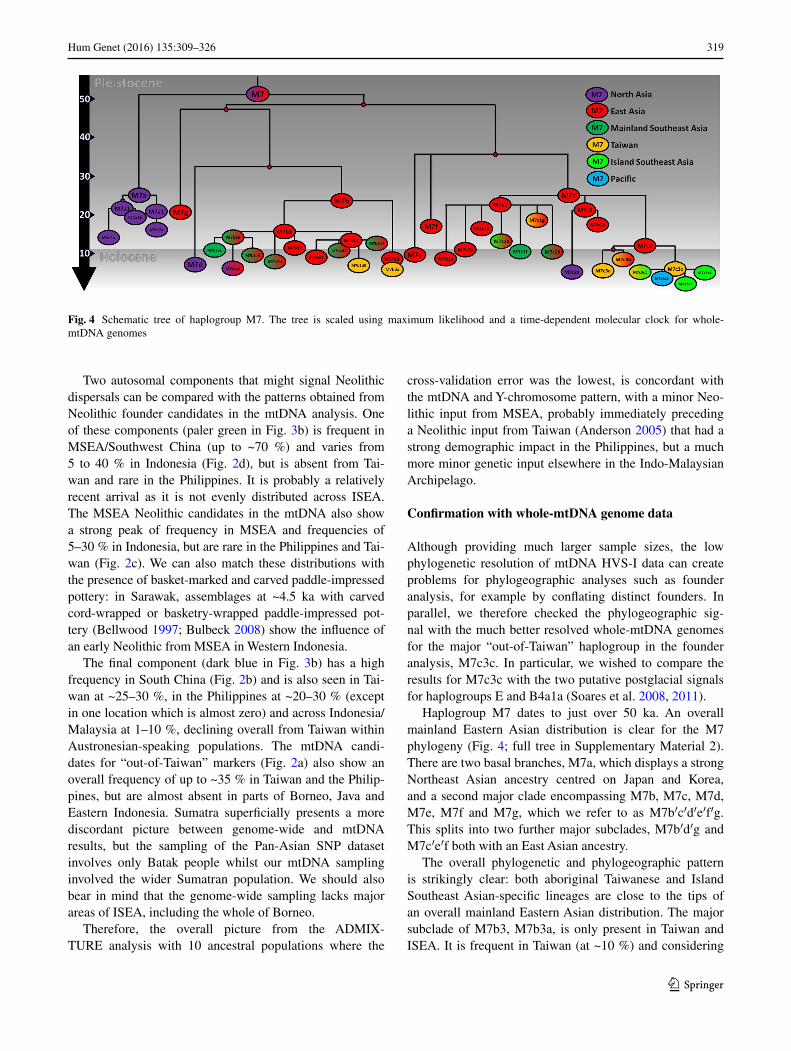
Haplogroup M7 dates to just over 50 ka. An overall mainland Eastern Asian distribution is clear for the M7 phylogeny (Fig. 4; full tree in Supplementary Material 2). There are two basal branches, M7a, which displays a strong Northeast Asian ancestry centred on Japan and Korea, and a second major clade encompassing M7b, M7c, M7d, M7e, M7f and M7g, which we refer to as M7b′c′d′e′f′g. This splits into two further major subclades, M7b′d′g and M7c′e′f both with an East Asian ancestry.
The overall phylogenetic and phylogeographic pattern is strikingly clear: both aboriginal Taiwanese and Island Southeast Asian-specific lineages are close to the tips of an overall mainland Eastern Asian distribution. The major subclade of M7b3, M7b3a, is only present in Taiwan and ISEA. It is frequent in Taiwan (at ~10 %) and considering
Fig. 4 Schematic tree of haplogroup M7. The tree is scaled using maximum likelihood and a time-dependent molecular clock for whole-mtDNA genomes
320 Hum Genet (2016) 135:309–326
1 3
its age (~6 ka) seems likely to have arrived in Taiwan with the rice Neolithic from South China; but it is vanish-ingly infrequent across ISEA. In M7b1, M7b1d3 is also restricted to Taiwan, and with a similar age may also have arrived from China with the Neolithic, but again it is virtu-ally absent from ISEA.
In M7c′e′f, the three subclades branch from a single node and all show evidence of East Asian ancestry. Within M7c, M7c3 is by far the most frequent and the only one to disperse significantly into Taiwan and ISEA. This clade probably had an origin in South China, with several sub-clades also present in Taiwan. Its major subclade, M7c3c [M7c1c in Hill et al. (2007)], here re-dated with whole-mtDNA genomes to ~5 ka, is restricted to Austronesian-speaking populations (both Taiwan and ISEA). Given the presence of other subclades of M7c3 in Taiwan and South China, the most probable source for M7c3c is in Taiwan (amongst M7c3 arrivals from China, again perhaps with the rice Neolithic), with subsequent dispersal into ISEA. Several subclades of M7c3c exist throughout Taiwan and ISEA, and there is also one in the Pacific (M7c3c2, found in both Micronesia and the Solomon Islands), dating to less than 3 ka. This pattern confirms M7c3c as a strong can-didate for an “out-of-Taiwan” marker, as indicated by the HVS-I founder analysis.
We can contrast this distinctive pattern with the distribu-tion of haplogroups B4a1a and E, both of which are—like M7c3c—largely restricted to insular, Austronesian-speak-ing populations. For that reason they have been proposed as candidates for “out-of-Taiwan” markers, but neither shows a direct ancestry in South China. We propose here a set of phylogeographic parameters that we expect to see fulfilled in a clear-cut “out-of-Taiwan” marker:
(a) If the haplogroup was carried into Taiwan from South China by rice-agriculturists ~6 to 8 ka, the dispersal’s timing should be bracketed by the age of the ancestral clade seen in South China (upper bound) and the insu-lar Austronesian-specific subclade (lower bound);
(b) the insular and Austronesian-specific subclade should date to after the arrival of rice-agriculturists from China ~5.5 ka, but before the “out-of-Taiwan” migra-tion ~4.5 ka;
(c) the founder age in ISEA for the subclade should date to ~4.5 ka, the time of the “out-of-Taiwan” dispersal;
(d) the founder age from Taiwan/Philippines to the rest of ISEA should be lower than the date of the “out-of-Tai-wan” migration, ~4 ka; and
(e) the expansion of the clade in Taiwan should predate the expansion in ISEA.
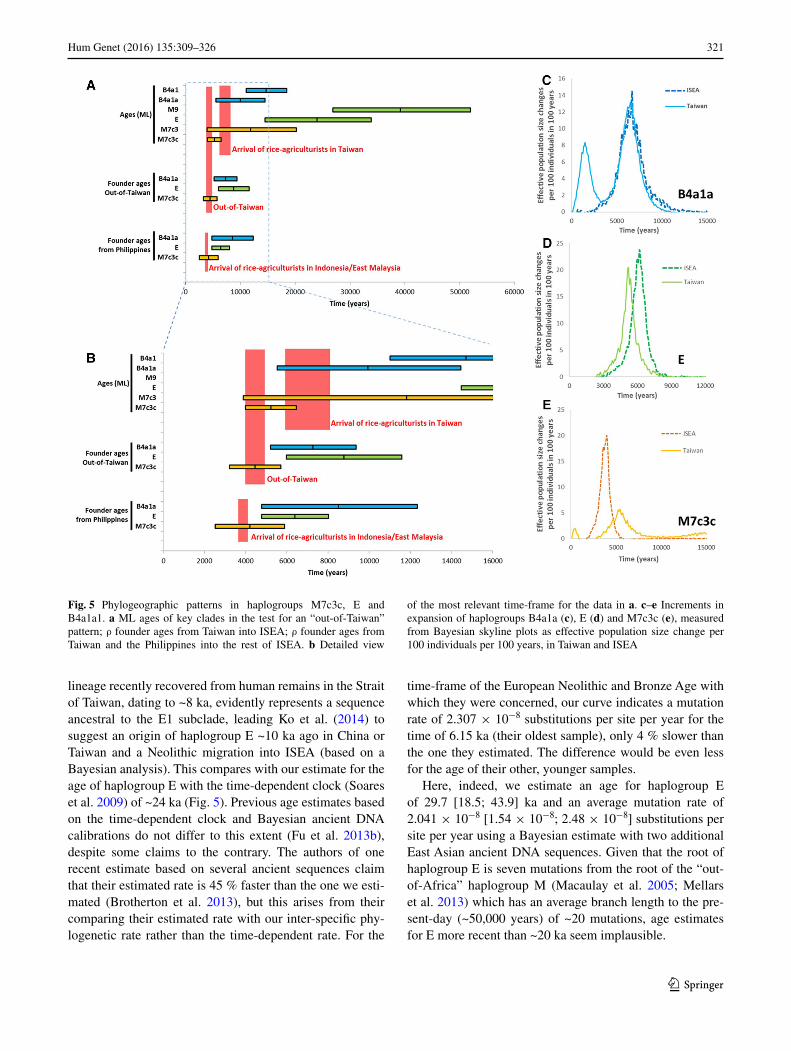
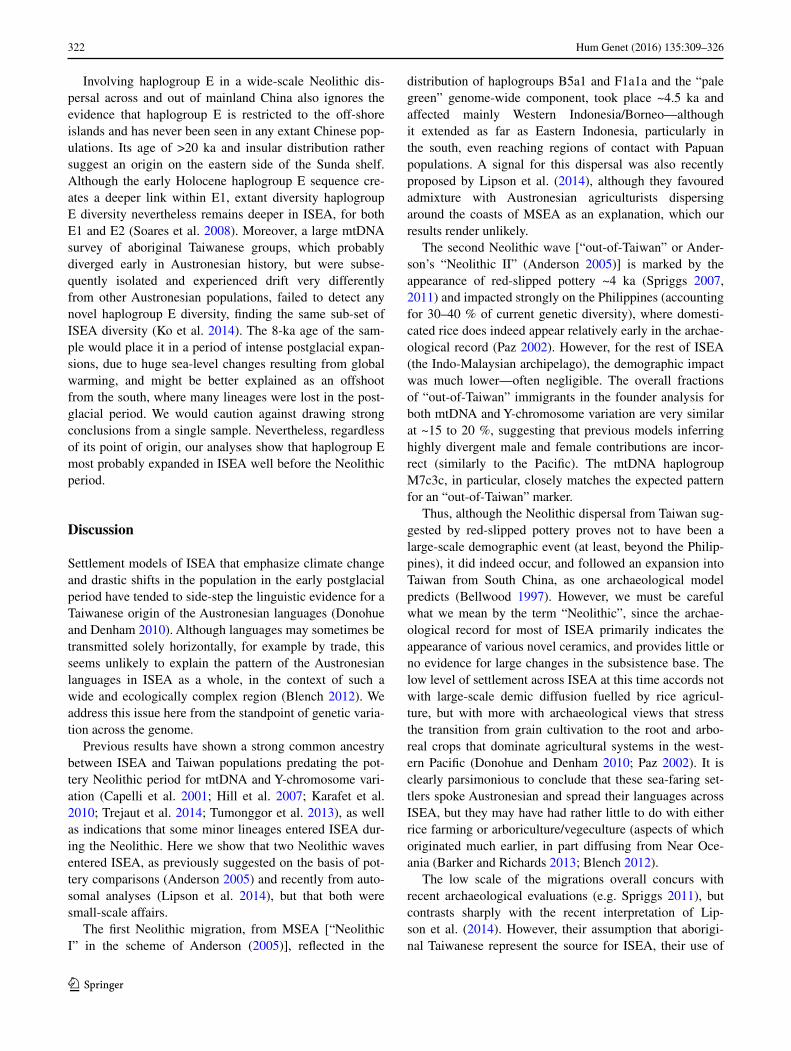
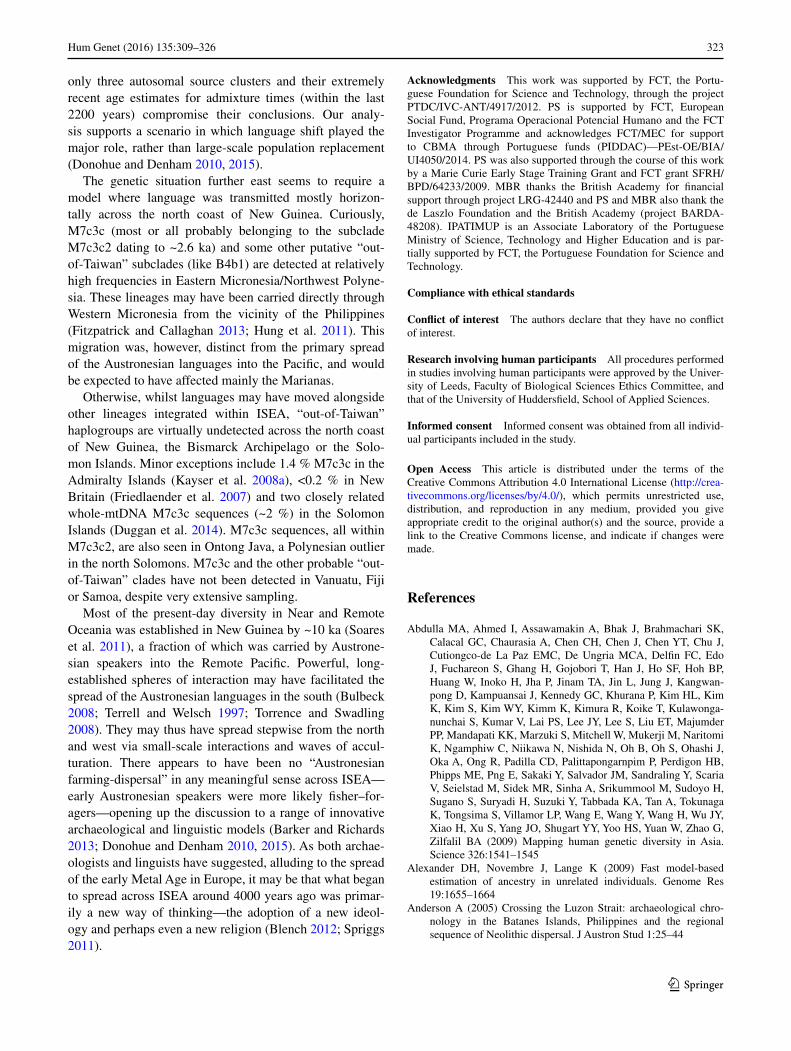
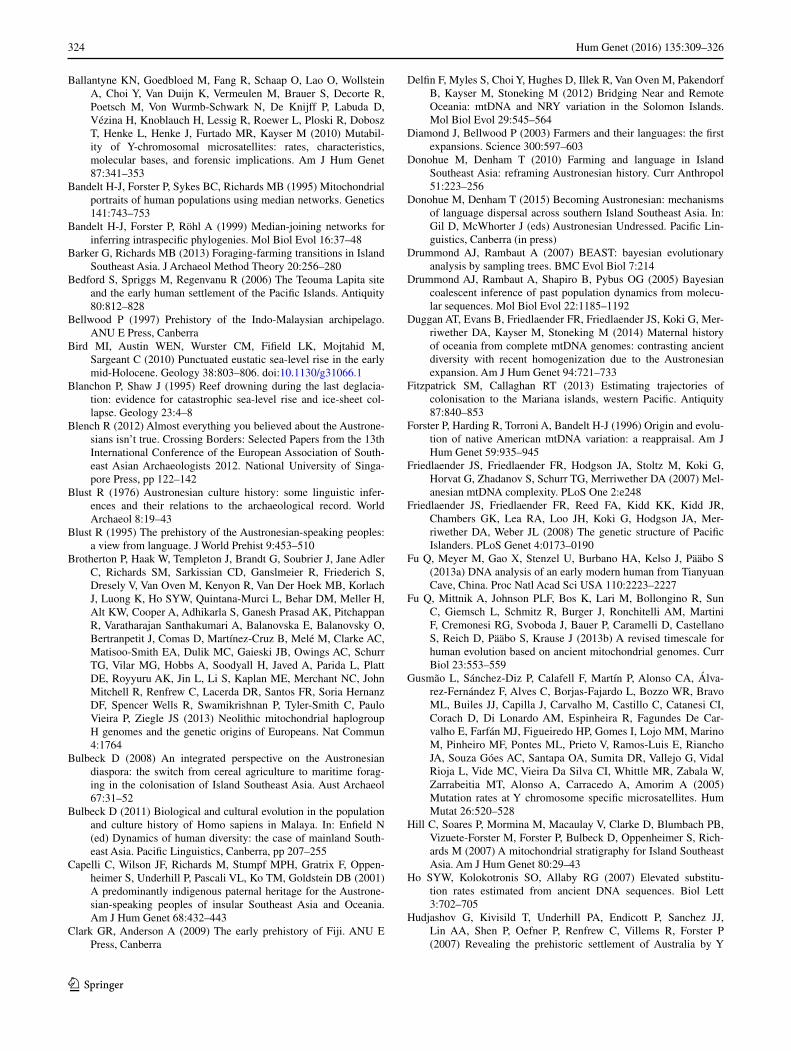
We evaluated each of these points in turn (Fig. 5; Table S12; note that taking into account mutation-rate
uncertainty, as documented in Table S12 does not alter the conclusions). First, we consider the ML ages of key sub-clades, then founder ages, and finally Bayesian skyline plot (BSP) expansion time estimates. Regarding (a), B4a1a appears in Austronesian-speaking populations between 14.7 [11.0; 18.5] ka, the age of the continental ancestral clade B4a1, and 9.9 [5.5; 14.5] ka, the age of B4a1a; hap-logroup E appears between 39.2 [26.9; 52.0] ka, the age of ancestral M9, and 24.0 [14.5; 33.9] ka; and M7c3c appears between 11.8 [3.9; 20.2] ka- the age of M7c3- and 5.2 [4.0; 6.5] ka. Only M7c3c clearly fits an arrival in Taiwan in line with the “out-of-Taiwan” model. B4a1a cannot be com-pletely ruled out from these estimates, given the 95 % con-fidence interval of the age estimate, but it is nevertheless very unlikely (Fig. 5a, b).
Point (b) stipulates that the insular subclade should orig-inate after the hypothetical arrival of rice-agriculturists in Taiwan and before the dispersal “out-of-Taiwan”. M7c3c, at 5.2 [4.0; 6.5] ka, follows this pattern; B4a1a, at 9.9 [5.5; 14.5] ka, and haplogroup E, at 24.0 [14.5; 33.9] ka, both suggest an earlier origin within currently Austronesian-speaking populations.
Taking point (c), an average founder age for M7c3c from Taiwan into ISEA is 4.4 [3.2; 5.7] ka, matching the 4.5 ka prediction of the “out-of-Taiwan” model. Haplo-groups E and B4a1a yield 8.8 [6.0; 11.6] ka and 7.3 [5.2; 9.4] ka, respectively, suggesting earlier postglacial expan-sions. When including the Philippines along with Taiwan as part of the source for the dispersal—point (d)—the founder for haplogroup M7c3c dated a little lower at 4.2 [2.5; 5.9] ka—a striking match to the hypothetical Austronesian arrival in the Indo-Malaysian archipelago. Haplogroup E, by contrast, yielded 6.4 [4.8; 8.0], and the B4a1a point esti-mate actually increased to 8.5 [4.8; 12.3] ka, when com-pared with the previous founder age estimate into ISEA as a whole, clearly indicating that the “out-of-Taiwan” assumption of the founder model in this case is likely to be false.
Finally (e), we used BSPs to estimate the expansion time of each haplogroup. Figure 5c–e show the increment or rate of expansion (corresponding skyline plots in Fig. S10; data in Table S13). The B4a1a data for Taiwan and ISEA (Fig. 5c) suggest a very similar time of expansion, starting ~10 ka (with a second expansion restricted to Tai-wan ~2000 years ago). However, haplogroup E expanded in ISEA before Taiwan (Fig. 5d), starting ~8 ka for ISEA and ~7 ka for Taiwan. Finally, for M7 we see a first expan-sion in Taiwan starting ~7.5 ka, peaking at 5.2 ka, while for ISEA the expansion starts later at 5.2 ka with peak at ~4 ka, corresponding closely to the “out-of-Taiwan” model.
Therefore, haplogroup M7c3c meets all the criteria expected for an “out-of-Taiwan” marker, whereas haplo-groups E and B4a1a meet none of them. Yet a haplogroup E
321Hum Genet (2016) 135:309–326
1 3
lineage recently recovered from human remains in the Strait of Taiwan, dating to ~8 ka, evidently represents a sequence ancestral to the E1 subclade, leading Ko et al. (2014) to suggest an origin of haplogroup E ~10 ka ago in China or Taiwan and a Neolithic migration into ISEA (based on a Bayesian analysis). This compares with our estimate for the age of haplogroup E with the time-dependent clock (Soares et al. 2009) of ~24 ka (Fig. 5). Previous age estimates based on the time-dependent clock and Bayesian ancient DNA calibrations do not differ to this extent (Fu et al. 2013b), despite some claims to the contrary. The authors of one recent estimate based on several ancient sequences claim that their estimated rate is 45 % faster than the one we esti-mated (Brotherton et al. 2013), but this arises from their comparing their estimated rate with our inter-specific phy-logenetic rate rather than the time-dependent rate. For the
time-frame of the European Neolithic and Bronze Age with which they were concerned, our curve indicates a mutation rate of 2.307 × 10⁻⁸ substitutions per site per year for the time of 6.15 ka (their oldest sample), only 4 % slower than the one they estimated. The difference would be even less for the age of their other, younger samples.
Here, indeed, we estimate an age for haplogroup E of 29.7 [18.5; 43.9] ka and an average mutation rate of 2.041 × 10⁻⁸ [1.54 × 10⁻⁸; 2.48 × 10⁻⁸] substitutions per site per year using a Bayesian estimate with two additional East Asian ancient DNA sequences. Given that the root of haplogroup E is seven mutations from the root of the “out-of-Africa” haplogroup M (Macaulay et al. 2005; Mellars et al. 2013) which has an average branch length to the pre-sent-day (~50,000 years) of ~20 mutations, age estimates for E more recent than ~20 ka seem implausible.
Fig. 5 Phylogeographic patterns in haplogroups M7c3c, E and B4a1a1. a ML ages of key clades in the test for an “out-of-Taiwan” pattern; ρ founder ages from Taiwan into ISEA; ρ founder ages from Taiwan and the Philippines into the rest of ISEA. b Detailed view
of the most relevant time-frame for the data in a. c–e Increments in expansion of haplogroups B4a1a (c), E (d) and M7c3c (e), measured from Bayesian skyline plots as effective population size change per 100 individuals per 100 years, in Taiwan and ISEA
322 Hum Genet (2016) 135:309–326
1 3
Involving haplogroup E in a wide-scale Neolithic dis-persal across and out of mainland China also ignores the evidence that haplogroup E is restricted to the off-shore islands and has never been seen in any extant Chinese pop-ulations. Its age of >20 ka and insular distribution rather suggest an origin on the eastern side of the Sunda shelf. Although the early Holocene haplogroup E sequence cre-ates a deeper link within E1, extant diversity haplogroup E diversity nevertheless remains deeper in ISEA, for both E1 and E2 (Soares et al. 2008). Moreover, a large mtDNA survey of aboriginal Taiwanese groups, which probably diverged early in Austronesian history, but were subse-quently isolated and experienced drift very differently from other Austronesian populations, failed to detect any novel haplogroup E diversity, finding the same sub-set of ISEA diversity (Ko et al. 2014). The 8-ka age of the sam-ple would place it in a period of intense postglacial expan-sions, due to huge sea-level changes resulting from global warming, and might be better explained as an offshoot from the south, where many lineages were lost in the post-glacial period. We would caution against drawing strong conclusions from a single sample. Nevertheless, regardless of its point of origin, our analyses show that haplogroup E most probably expanded in ISEA well before the Neolithic period.
Discussion
Settlement models of ISEA that emphasize climate change and drastic shifts in the population in the early postglacial period have tended to side-step the linguistic evidence for a Taiwanese origin of the Austronesian languages (Donohue and Denham 2010). Although languages may sometimes be transmitted solely horizontally, for example by trade, this seems unlikely to explain the pattern of the Austronesian languages in ISEA as a whole, in the context of such a wide and ecologically complex region (Blench 2012). We address this issue here from the standpoint of genetic varia-tion across the genome.
Previous results have shown a strong common ancestry between ISEA and Taiwan populations predating the pot-tery Neolithic period for mtDNA and Y-chromosome vari-ation (Capelli et al. 2001; Hill et al. 2007; Karafet et al. 2010; Trejaut et al. 2014; Tumonggor et al. 2013), as well as indications that some minor lineages entered ISEA dur-ing the Neolithic. Here we show that two Neolithic waves entered ISEA, as previously suggested on the basis of pot-tery comparisons (Anderson 2005) and recently from auto-somal analyses (Lipson et al. 2014), but that both were small-scale affairs.
The first Neolithic migration, from MSEA [“Neolithic I” in the scheme of Anderson (2005)], reflected in the
distribution of haplogroups B5a1 and F1a1a and the “pale green” genome-wide component, took place ~4.5 ka and affected mainly Western Indonesia/Borneo—although it extended as far as Eastern Indonesia, particularly in the south, even reaching regions of contact with Papuan populations. A signal for this dispersal was also recently proposed by Lipson et al. (2014), although they favoured admixture with Austronesian agriculturists dispersing around the coasts of MSEA as an explanation, which our results render unlikely.
The second Neolithic wave [“out-of-Taiwan” or Ander-son’s “Neolithic II” (Anderson 2005)] is marked by the appearance of red-slipped pottery ~4 ka (Spriggs 2007, 2011) and impacted strongly on the Philippines (accounting for 30–40 % of current genetic diversity), where domesti-cated rice does indeed appear relatively early in the archae-ological record (Paz 2002). However, for the rest of ISEA (the Indo-Malaysian archipelago), the demographic impact was much lower—often negligible. The overall fractions of “out-of-Taiwan” immigrants in the founder analysis for both mtDNA and Y-chromosome variation are very similar at ~15 to 20 %, suggesting that previous models inferring highly divergent male and female contributions are incor-rect (similarly to the Pacific). The mtDNA haplogroup M7c3c, in particular, closely matches the expected pattern for an “out-of-Taiwan” marker.
Thus, although the Neolithic dispersal from Taiwan sug-gested by red-slipped pottery proves not to have been a large-scale demographic event (at least, beyond the Philip-pines), it did indeed occur, and followed an expansion into Taiwan from South China, as one archaeological model predicts (Bellwood 1997). However, we must be careful what we mean by the term “Neolithic”, since the archae-ological record for most of ISEA primarily indicates the appearance of various novel ceramics, and provides little or no evidence for large changes in the subsistence base. The low level of settlement across ISEA at this time accords not with large-scale demic diffusion fuelled by rice agricul-ture, but with more with archaeological views that stress the transition from grain cultivation to the root and arbo-real crops that dominate agricultural systems in the west-ern Pacific (Donohue and Denham 2010; Paz 2002). It is clearly parsimonious to conclude that these sea-faring set-tlers spoke Austronesian and spread their languages across ISEA, but they may have had rather little to do with either rice farming or arboriculture/vegeculture (aspects of which originated much earlier, in part diffusing from Near Oce-ania (Barker and Richards 2013; Blench 2012).
The low scale of the migrations overall concurs with recent archaeological evaluations (e.g. Spriggs 2011), but contrasts sharply with the recent interpretation of Lip-son et al. (2014). However, their assumption that aborigi-nal Taiwanese represent the source for ISEA, their use of
323Hum Genet (2016) 135:309–326
1 3
only three autosomal source clusters and their extremely recent age estimates for admixture times (within the last 2200 years) compromise their conclusions. Our analy-sis supports a scenario in which language shift played the major role, rather than large-scale population replacement (Donohue and Denham 2010, 2015).
The genetic situation further east seems to require a model where language was transmitted mostly horizon-tally across the north coast of New Guinea. Curiously, M7c3c (most or all probably belonging to the subclade M7c3c2 dating to ~2.6 ka) and some other putative “out-of-Taiwan” subclades (like B4b1) are detected at relatively high frequencies in Eastern Micronesia/Northwest Polyne-sia. These lineages may have been carried directly through Western Micronesia from the vicinity of the Philippines (Fitzpatrick and Callaghan 2013; Hung et al. 2011). This migration was, however, distinct from the primary spread of the Austronesian languages into the Pacific, and would be expected to have affected mainly the Marianas.
Otherwise, whilst languages may have moved alongside other lineages integrated within ISEA, “out-of-Taiwan” haplogroups are virtually undetected across the north coast of New Guinea, the Bismarck Archipelago or the Solo-mon Islands. Minor exceptions include 1.4 % M7c3c in the Admiralty Islands (Kayser et al. 2008a), <0.2 % in New Britain (Friedlaender et al. 2007) and two closely related whole-mtDNA M7c3c sequences (~2 %) in the Solomon Islands (Duggan et al. 2014). M7c3c sequences, all within M7c3c2, are also seen in Ontong Java, a Polynesian outlier in the north Solomons. M7c3c and the other probable “out-of-Taiwan” clades have not been detected in Vanuatu, Fiji or Samoa, despite very extensive sampling.
Most of the present-day diversity in Near and Remote Oceania was established in New Guinea by ~10 ka (Soares et al. 2011), a fraction of which was carried by Austrone-sian speakers into the Remote Pacific. Powerful, long-established spheres of interaction may have facilitated the spread of the Austronesian languages in the south (Bulbeck 2008; Terrell and Welsch 1997; Torrence and Swadling 2008). They may thus have spread stepwise from the north and west via small-scale interactions and waves of accul-turation. There appears to have been no “Austronesian farming-dispersal” in any meaningful sense across ISEA—early Austronesian speakers were more likely fisher–for-agers—opening up the discussion to a range of innovative archaeological and linguistic models (Barker and Richards 2013; Donohue and Denham 2010, 2015). As both archae-ologists and linguists have suggested, alluding to the spread of the early Metal Age in Europe, it may be that what began to spread across ISEA around 4000 years ago was primar-ily a new way of thinking—the adoption of a new ideol-ogy and perhaps even a new religion (Blench 2012; Spriggs 2011).
Acknowledgments This work was supported by FCT, the Portu-guese Foundation for Science and Technology, through the project PTDC/IVC-ANT/4917/2012. PS is supported by FCT, European Social Fund, Programa Operacional Potencial Humano and the FCT Investigator Programme and acknowledges FCT/MEC for support to CBMA through Portuguese funds (PIDDAC)—PEst-OE/BIA/UI4050/2014. PS was also supported through the course of this work by a Marie Curie Early Stage Training Grant and FCT grant SFRH/BPD/64233/2009. MBR thanks the British Academy for financial support through project LRG-42440 and PS and MBR also thank the de Laszlo Foundation and the British Academy (project BARDA-48208). IPATIMUP is an Associate Laboratory of the Portuguese Ministry of Science, Technology and Higher Education and is par-tially supported by FCT, the Portuguese Foundation for Science and Technology.
Compliance with ethical standards
Conflict of interest The authors declare that they have no conflict of interest.
Research involving human participants All procedures performed in studies involving human participants were approved by the Univer-sity of Leeds, Faculty of Biological Sciences Ethics Committee, and that of the University of Huddersfield, School of Applied Sciences.
Informed consent Informed consent was obtained from all individ-ual participants included in the study.
Open Access This article is distributed under the terms of the Creative Commons Attribution 4.0 International License (http://crea-tivecommons.org/licenses/by/4.0/), which permits unrestricted use, distribution, and reproduction in any medium, provided you give appropriate credit to the original author(s) and the source, provide a link to the Creative Commons license, and indicate if changes were made.
References
Abdulla MA, Ahmed I, Assawamakin A, Bhak J, Brahmachari SK, Calacal GC, Chaurasia A, Chen CH, Chen J, Chen YT, Chu J, Cutiongco-de La Paz EMC, De Ungria MCA, Delfin FC, Edo J, Fuchareon S, Ghang H, Gojobori T, Han J, Ho SF, Hoh BP, Huang W, Inoko H, Jha P, Jinam TA, Jin L, Jung J, Kangwan-pong D, Kampuansai J, Kennedy GC, Khurana P, Kim HL, Kim K, Kim S, Kim WY, Kimm K, Kimura R, Koike T, Kulawonga-nunchai S, Kumar V, Lai PS, Lee JY, Lee S, Liu ET, Majumder PP, Mandapati KK, Marzuki S, Mitchell W, Mukerji M, Naritomi K, Ngamphiw C, Niikawa N, Nishida N, Oh B, Oh S, Ohashi J, Oka A, Ong R, Padilla CD, Palittapongarnpim P, Perdigon HB, Phipps ME, Png E, Sakaki Y, Salvador JM, Sandraling Y, Scaria V, Seielstad M, Sidek MR, Sinha A, Srikummool M, Sudoyo H, Sugano S, Suryadi H, Suzuki Y, Tabbada KA, Tan A, Tokunaga K, Tongsima S, Villamor LP, Wang E, Wang Y, Wang H, Wu JY, Xiao H, Xu S, Yang JO, Shugart YY, Yoo HS, Yuan W, Zhao G, Zilfalil BA (2009) Mapping human genetic diversity in Asia. Science 326:1541–1545
Alexander DH, Novembre J, Lange K (2009) Fast model-based estimation of ancestry in unrelated individuals. Genome Res 19:1655–1664
Anderson A (2005) Crossing the Luzon Strait: archaeological chro-nology in the Batanes Islands, Philippines and the regional sequence of Neolithic dispersal. J Austron Stud 1:25–44
324 Hum Genet (2016) 135:309–326
1 3
Ballantyne KN, Goedbloed M, Fang R, Schaap O, Lao O, Wollstein A, Choi Y, Van Duijn K, Vermeulen M, Brauer S, Decorte R, Poetsch M, Von Wurmb-Schwark N, De Knijff P, Labuda D, Vézina H, Knoblauch H, Lessig R, Roewer L, Ploski R, Dobosz T, Henke L, Henke J, Furtado MR, Kayser M (2010) Mutabil-ity of Y-chromosomal microsatellites: rates, characteristics, molecular bases, and forensic implications. Am J Hum Genet 87:341–353
Bandelt H-J, Forster P, Sykes BC, Richards MB (1995) Mitochondrial portraits of human populations using median networks. Genetics 141:743–753
Bandelt H-J, Forster P, Röhl A (1999) Median-joining networks for inferring intraspecific phylogenies. Mol Biol Evol 16:37–48
Barker G, Richards MB (2013) Foraging-farming transitions in Island Southeast Asia. J Archaeol Method Theory 20:256–280
Bedford S, Spriggs M, Regenvanu R (2006) The Teouma Lapita site and the early human settlement of the Pacific Islands. Antiquity 80:812–828
Bellwood P (1997) Prehistory of the Indo-Malaysian archipelago. ANU E Press, Canberra
Bird MI, Austin WEN, Wurster CM, Fifield LK, Mojtahid M, Sargeant C (2010) Punctuated eustatic sea-level rise in the early mid-Holocene. Geology 38:803–806. doi:10.1130/g31066.1
Blanchon P, Shaw J (1995) Reef drowning during the last deglacia-tion: evidence for catastrophic sea-level rise and ice-sheet col-lapse. Geology 23:4–8
Blench R (2012) Almost everything you believed about the Austrone-sians isn’t true. Crossing Borders: Selected Papers from the 13th International Conference of the European Association of South-east Asian Archaeologists 2012. National University of Singa-pore Press, pp 122–142
Blust R (1976) Austronesian culture history: some linguistic infer-ences and their relations to the archaeological record. World Archaeol 8:19–43
Blust R (1995) The prehistory of the Austronesian-speaking peoples: a view from language. J World Prehist 9:453–510
Brotherton P, Haak W, Templeton J, Brandt G, Soubrier J, Jane Adler C, Richards SM, Sarkissian CD, Ganslmeier R, Friederich S, Dresely V, Van Oven M, Kenyon R, Van Der Hoek MB, Korlach J, Luong K, Ho SYW, Quintana-Murci L, Behar DM, Meller H, Alt KW, Cooper A, Adhikarla S, Ganesh Prasad AK, Pitchappan R, Varatharajan Santhakumari A, Balanovska E, Balanovsky O, Bertranpetit J, Comas D, Martínez-Cruz B, Melé M, Clarke AC, Matisoo-Smith EA, Dulik MC, Gaieski JB, Owings AC, Schurr TG, Vilar MG, Hobbs A, Soodyall H, Javed A, Parida L, Platt DE, Royyuru AK, Jin L, Li S, Kaplan ME, Merchant NC, John Mitchell R, Renfrew C, Lacerda DR, Santos FR, Soria Hernanz DF, Spencer Wells R, Swamikrishnan P, Tyler-Smith C, Paulo Vieira P, Ziegle JS (2013) Neolithic mitochondrial haplogroup H genomes and the genetic origins of Europeans. Nat Commun 4:1764
Bulbeck D (2008) An integrated perspective on the Austronesian diaspora: the switch from cereal agriculture to maritime forag-ing in the colonisation of Island Southeast Asia. Aust Archaeol 67:31–52
Bulbeck D (2011) Biological and cultural evolution in the population and culture history of Homo sapiens in Malaya. In: Enfield N (ed) Dynamics of human diversity: the case of mainland South-east Asia. Pacific Linguistics, Canberra, pp 207–255
Capelli C, Wilson JF, Richards M, Stumpf MPH, Gratrix F, Oppen-heimer S, Underhill P, Pascali VL, Ko TM, Goldstein DB (2001) A predominantly indigenous paternal heritage for the Austrone-sian-speaking peoples of insular Southeast Asia and Oceania. Am J Hum Genet 68:432–443
Clark GR, Anderson A (2009) The early prehistory of Fiji. ANU E Press, Canberra
Delfin F, Myles S, Choi Y, Hughes D, Illek R, Van Oven M, Pakendorf B, Kayser M, Stoneking M (2012) Bridging Near and Remote Oceania: mtDNA and NRY variation in the Solomon Islands. Mol Biol Evol 29:545–564
Diamond J, Bellwood P (2003) Farmers and their languages: the first expansions. Science 300:597–603
Donohue M, Denham T (2010) Farming and language in Island Southeast Asia: reframing Austronesian history. Curr Anthropol 51:223–256
Donohue M, Denham T (2015) Becoming Austronesian: mechanisms of language dispersal across southern Island Southeast Asia. In: Gil D, McWhorter J (eds) Austronesian Undressed. Pacific Lin-guistics, Canberra (in press)
Drummond AJ, Rambaut A (2007) BEAST: bayesian evolutionary analysis by sampling trees. BMC Evol Biol 7:214
Drummond AJ, Rambaut A, Shapiro B, Pybus OG (2005) Bayesian coalescent inference of past population dynamics from molecu-lar sequences. Mol Biol Evol 22:1185–1192
Duggan AT, Evans B, Friedlaender FR, Friedlaender JS, Koki G, Mer-riwether DA, Kayser M, Stoneking M (2014) Maternal history of oceania from complete mtDNA genomes: contrasting ancient diversity with recent homogenization due to the Austronesian expansion. Am J Hum Genet 94:721–733
Fitzpatrick SM, Callaghan RT (2013) Estimating trajectories of colonisation to the Mariana islands, western Pacific. Antiquity 87:840–853
Forster P, Harding R, Torroni A, Bandelt H-J (1996) Origin and evolu-tion of native American mtDNA variation: a reappraisal. Am J Hum Genet 59:935–945
Friedlaender JS, Friedlaender FR, Hodgson JA, Stoltz M, Koki G, Horvat G, Zhadanov S, Schurr TG, Merriwether DA (2007) Mel-anesian mtDNA complexity. PLoS One 2:e248
Friedlaender JS, Friedlaender FR, Reed FA, Kidd KK, Kidd JR, Chambers GK, Lea RA, Loo JH, Koki G, Hodgson JA, Mer-riwether DA, Weber JL (2008) The genetic structure of Pacific Islanders. PLoS Genet 4:0173–0190
Fu Q, Meyer M, Gao X, Stenzel U, Burbano HA, Kelso J, Pääbo S (2013a) DNA analysis of an early modern human from Tianyuan Cave, China. Proc Natl Acad Sci USA 110:2223–2227
Fu Q, Mittnik A, Johnson PLF, Bos K, Lari M, Bollongino R, Sun C, Giemsch L, Schmitz R, Burger J, Ronchitelli AM, Martini F, Cremonesi RG, Svoboda J, Bauer P, Caramelli D, Castellano S, Reich D, Pääbo S, Krause J (2013b) A revised timescale for human evolution based on ancient mitochondrial genomes. Curr Biol 23:553–559
Gusmão L, Sánchez-Diz P, Calafell F, Martín P, Alonso CA, Álva-rez-Fernández F, Alves C, Borjas-Fajardo L, Bozzo WR, Bravo ML, Builes JJ, Capilla J, Carvalho M, Castillo C, Catanesi CI, Corach D, Di Lonardo AM, Espinheira R, Fagundes De Car-valho E, Farfán MJ, Figueiredo HP, Gomes I, Lojo MM, Marino M, Pinheiro MF, Pontes ML, Prieto V, Ramos-Luis E, Riancho JA, Souza Góes AC, Santapa OA, Sumita DR, Vallejo G, Vidal Rioja L, Vide MC, Vieira Da Silva CI, Whittle MR, Zabala W, Zarrabeitia MT, Alonso A, Carracedo A, Amorim A (2005) Mutation rates at Y chromosome specific microsatellites. Hum Mutat 26:520–528
Hill C, Soares P, Mormina M, Macaulay V, Clarke D, Blumbach PB, Vizuete-Forster M, Forster P, Bulbeck D, Oppenheimer S, Rich-ards M (2007) A mitochondrial stratigraphy for Island Southeast Asia. Am J Hum Genet 80:29–43
Ho SYW, Kolokotronis SO, Allaby RG (2007) Elevated substitu-tion rates estimated from ancient DNA sequences. Biol Lett 3:702–705
Hudjashov G, Kivisild T, Underhill PA, Endicott P, Sanchez JJ, Lin AA, Shen P, Oefner P, Renfrew C, Villems R, Forster P (2007) Revealing the prehistoric settlement of Australia by Y
325Hum Genet (2016) 135:309–326
1 3
chromosome and mtDNA analysis. Proc Natl Acad Sci USA 104:8726–8730
Hung H-C, Carson MT, Bellwood P, Campos FZ, Piper PJ, Dizon E, Bolunia MJ, Oxenham M, Chi Z (2011) The first settlement of Remote Oceania: the Philippines to the Marianas: supplementary information on radiocarbon dating of the Nagsabaran site. Antiq-uity 85:909–926
Hunt CO, Gilbertson DD, Rushworth G (2007) Modern humans in Sarawak, Malaysian Borneo, during Oxygen Isotope Stage 3: palaeoenvironmental evidence from the Great Cave of Niah. J Archaeol Sci 34:1953–1969
Karafet TM, Hallmark B, Cox MP, Sudoyo H, Downey S, Lansing JS, Hammer MF (2010) Major east-west division underlies Y chromosome stratification across Indonesia. Mol Biol Evol 27:1833–1844
Kayser M, Brauer S, Weiss G, Underhill P, Roewer L, Schiefenhövel W, Stoneking M (2000) Melanesian origin of Polynesian Y chro-mosomes. Curr Biol 10:1237–1246
Kayser M, Choi Y, Van Oven M, Mona S, Brauer S, Trent RJ, Suarkia D, Schiefenhövel W, Stoneking M (2008a) The impact of the Austronesian expansion: evidence from mtDNA and Y chromo-some diversity in the Admiralty Islands of Melanesia. Mol Biol Evol 25:1362–1374
Kayser M, Lao O, Saar K, Brauer S, Wang X, Nürnberg P, Trent R, Stoneking M (2008b) Genome-wide analysis indicates more Asian than Melanesian ancestry of Polynesians. Am J Hum Genet 82:194–198
Ko AMS, Chen CY, Fu Q, Delfin F, Li M, Chiu HL, Stoneking M, Ko YC (2014) Early Austronesians: into and out of Taiwan. Am J Hum Genet 94:426–436
Lipson M, Loh PR, Patterson N, Moorjani P, Ko YC, Stoneking M, Berger B, Reich D (2014) Reconstructing Austronesian popula-tion history in Island Southeast Asia. Nat Commun 5:4689
Macaulay V, Hill C, Achilli A, Rengo C, Clarke D, Meehan W, Black-burn J, Semino O, Scozzari R, Cruciani F, Taha A, Shaari NK, Raja JM, Ismail P, Zainuddin Z, Goodwin W, Bulbeck D, Ban-delt H-J, Oppenheimer S, Torroni A, Richards M (2005) Single, rapid coastal settlement of Asia revealed by analysis of complete mitochondrial genomes. Science 308:1034–1036
Manguin P-Y, Mani A, Wade G (2011) Early interactions between South and Southeast Asia. Institute of Southeast Asian Studies, Singapure
Mellars P, Gori KC, Carr M, Soares PA, Richards MB (2013) Genetic and archaeological perspectives on the initial modern human colonization of southern Asia. Proc Natl Acad Sci USA 110:10699–10704
Melton T, Peterson R, Redd AJ, Saha N, Sofro ASM, Martinson J, Stoneking M (1995) Polynesian genetic affinities with Southeast Asian populations as identified by mtDNA analysis. Am J Hum Genet 57:403–414
Ngamphiw C, Assawamakin A, Xu S, Shaw PJ, Yang JO, Ghang H, Bhak J, Liu E, Tongsima S, Consortium HP-AS (2011) PanSN-Pdb: the Pan-Asian SNP genotyping database. PLoS One 6:e21451
Oppenheimer S (1998) Eden in the east: the drowned continent of Southeast Asia. Phoenix, London
Oppenheimer S (2004) The ‘Express Train from Taiwan to Poly-nesia’: on the congruence of proxy lines of evidence. World Archaeol 36:591–600
Oppenheimer S, Richards M (2001) Fast trains, slow boats, and the ancestry of the Polynesian islanders. Sci Prog 84:157–181
Paz V (2002) Island Southeast Asia: spread or friction zone. In: Bellwood P, Renfrew C (eds) Examining the farming/language dispersal hypothesis. MacDonald Institute for Archaeological Research, Cambridge, pp 275–285
Pelejero C, Kienast M, Wang L, Grimalt JO (1999) The flooding of Sundaland during the last deglaciation: imprints in hemipelagic sediments from the southern South China Sea. Earth Planet Sci Lett 171:661–671
Pereira L, Silva NM, Franco-Duarte R, Fernandes V, Pereira JB, Costa MD, Martins H, Soares P, Behar DM, Richards MB, Macaulay V (2010) Population expansion in the North African Late Pleis-tocene signalled by mitochondrial DNA haplogroup U6. BMC Evol Biol 10:390
Pierron D, Razafindrazaka H, Pagani L, Ricaut FX, Antao T, Capre-don M, Sambo C, Radimilahy C, Rakotoarisoa JA, Blench RM, Letellier T, Kivisild T (2014) Genome-wide evidence of Austro-nesian-Bantu admixture and cultural reversion in a hunter-gath-erer group of Madagascar. Proc Natl Acad Sci USA 111:936–941
Purcell S, Neale B, Todd-Brown K, Thomas L, Ferreira MAR, Bender D, Maller J, Sklar P, De Bakker PIW, Daly MJ, Sham PC (2007) PLINK: a tool set for whole-genome association and population-based linkage analyses. Am J Hum Genet 81:559–575
Redd AJ, Takezaki N, Sherry ST, McGarvey ST, Sofro ASM, Stonek-ing M (1995) Evolutionary history of the COII/tRNALys inter-genic 9 base pair deletion in human mitochondrial DNAs from the Pacific. Mol Biol Evol 12:604–615
Richards M, Macaulay V, Hickey E, Vega E, Sykes B, Guida V, Rengo C, Sellitto D, Cruciani F, Kivisild T, Villems R, Thomas M, Rychkov S, Rychkov O, Rychkov Y, Golge M, Dimitrov D, Hill E, Bradley D, Romano V, Cali F, Vona G, Demaine A, Papiha S, Triantaphyllidis C, Stefanescu G, Hatina J, Belledi M, Di Rienzo A, Novelletto A, Oppenheim A, Norby S, Al-Zaheri N, Santachi-ara-Benerecetti S, Scozzari R, Torroni A, Bandelt H-J (2000) Tracing European founder lineages in the Near Eastern mtDNA pool. Am J Hum Genet 67:1251–1276
Rieth TM, Hunt TL (2008) A radiocarbon chronology for Samoan prehistory. J Archaeol Sci 35:1901–1927
Rito T, Richards MB, Fernandes V, Alshamali F, Cerny V, Pereira L, Soares P (2013) The first modern human dispersals across Africa. PLoS One 8:e80031
Ross M (2005) The Batanic languages in relation to the early history of the Malayo-Polynesian subgroup of Austronesian. J Austron Stud 1:P1–P24
Ross M (2009) Proto Austronesian verbal morphology: a reappraisal. In: Adelaar A, Pawley A (eds) Austronesian historical linguistics and culture history: a festschrift for Robert Blust. Pacific Lin-guistics, Canberra, pp 295–326
Saillard J, Forster P, Lynnerup N, Bandelt H-J, Norby S (2000) mtDNA variation among Greenland Eskimos: the edge of the Beringian expansion. Am J Hum Genet 67:718–726
Soares P, Trejaut JA, Loo JH, Hill C, Mormina M, Lee CL, Chen YM, Hudjashov G, Forster P, Macaulay V, Bulbeck D, Oppen-heimer S, Lin M, Richards MB (2008) Climate change and postglacial human dispersals in Southeast Asia. Mol Biol Evol 25:1209–1218
Soares P, Ermini L, Thomson N, Mormina M, Rito T, Röhl A, Salas A, Oppenheimer S, Macaulay V, Richards MB (2009) Correct-ing for purifying selection: an improved human mitochondrial molecular clock. Am J Hum Genet 84:740–759
Soares P, Rito T, Trejaut J, Mormina M, Hill C, Tinkler-Hundal E, Braid M, Clarke DJ, Loo JH, Thomson N, Denham T, Donohue M, Macaulay V, Lin M, Oppenheimer S, Richards MB (2011) Ancient voyaging and Polynesian origins. Am J Hum Genet 88:239–247
Soares P, Alshamali F, Pereira JB, Fernandes V, Silva NM, Afonso C, Costa MD, Musilová E, Macaulay V, Richards MB, Černý V, Pereira L (2012) The expansion of mtDNA haplogroup L3 within and out of Africa. Mol Biol Evol 29:915–927
Solheim WG (2006) Archaeology and culture in Southeast Asia: unraveling the Nusantao. UP Press, Philippines
326 Hum Genet (2016) 135:309–326
1 3
Spriggs M (2003) Chronology of the Neolithic transition in Island Southeast Asia and the Western Pacific: a view from 2003. Rev Archaeol 24:57–80
Spriggs M (2007) The Neolithic and Austronesian expansion within Island Southeast Asia and into the Pacific. In: Chiu S, Sand C (eds) From Southeast Asia to the Pacific: Archaeological per-spectives on the Austronesian expansion and the Lapita cultural complex. Academica Sinica, Taipei, pp 104–125
Spriggs M (2011) Archaeology and the Austronesian expansion: where are we now? Antiquity 85:510–528
Summerhayes GR, Leavesley M, Fairbairn A, Mandui H, Field J, Ford A, Fullagar R (2010) Human adaptation and plant use in highland New Guinea 49,000 to 44,000 years ago. Science 330:78–81
Sykes B, Leiboff A, Low-Beer J, Tetzner S, Richards M (1995) The origins of the Polynesians: an interpretation from mitochondrial lineage analysis. Am J Hum Genet 57:1463–1475
Terrell JE, Welsch RL (1997) Lapita and the temporal geography of prehistory. Antiquity 71:548–572
Torrence R, Swadling P (2008) Social networks and the spread of Lapita. Antiquity 82:600–616
Torroni A, Rengo C, Guida V, Cruciani F, Sellitto D, Coppa A, Cal-deron FL, Simionati B, Valle G, Richards M, Macaulay V, Scoz-zari R (2001) Do the four clades of the mtDNA haplogroup L2 evolve at different rates? Am J Hum Genet 69:1348–1356
Trejaut JA, Kivisild T, Jun HL, Chien LL, Chun LH, Chia JH, Zheng YL, Lin M (2005) Traces of archaic mitochondrial lineages per-sist in Austronesian-speaking Formosan populations. PLoS Biol 3:e376
Trejaut JA, Poloni ES, Yen JC, Lai YH, Loo JH, Lee CL, He CL, Lin M (2014) Taiwan Y-chromosomal DNA variation and its rela-tionship with Island Southeast Asia. BMC Genetics 15:77
Tumonggor MK, Karafet TM, Hallmark B, Lansing JS, Sudoyo H, Hammer MF, Cox MP (2013) The Indonesian archipelago: an ancient genetic highway linking Asia and the Pacific. J Hum Genet 58:165–173
Underhill PA, Shen P, Lin AA, Jin L, Passarino G, Yang WH, Kauff-man E, Bonné-Tamir B, Bertranpetit J, Francalacci P, Ibrahim M, Jenkins T, Kidd JR, Mehdi SQ, Seielstad MT, Wells RS, Piazza A, Davis RW, Feldman MW, Cavalli-Sforza LL, Oefner PJ (2000) Y chromosome sequence variation and the history of human populations. Nat Genet 26:358–361
Verdu P, Pemberton TJ, Laurent R, Kemp BM, Gonzalez-Oliver A, Gorodezky C, Hughes CE, Shattuck MR, Petzelt B, Mitch-ell J, Harry H, William T, Worl R, Cybulski JS, Rosenberg NA, Malhi RS (2014) Patterns of admixture and population structure in native populations of Northwest North America. PLoS Genet 10:e1004530
Wollstein A, Lao O, Becker C, Brauer S, Trent RJ, Nürnberg P, Stoneking M, Kayser M (2010) Demographic history of Oceania inferred from genome-wide data. Curr Biol 20:1983–1992
Yang Z (1997) PAML: a program package for phylogenetic analysis by maximum likelihood. Comput Appl Biosci 13:555–556
Zhivotovsky LA, Underhill PA, Cinnioǧlu C, Kayser M, Morar B, Kivisild T, Scozzari R, Cruciani F, Destro-Bisol G, Spedini G, Chambers GK, Herrera RJ, Yong KK, Gresham D, Tournev I, Feldman MW, Kalaydjieva L (2004) The effective mutation rate at Y chromosome short tandem repeats, with application to human population-divergence time. Am J Hum Genet 74:50–61