Embed Size (px)
Citation preview
Hindawi Publishing CorporationISRN ChromatographyVolume 2013 Article ID 506923 12 pageshttpdxdoiorg1011552013506923
Research ArticleDevelopment and Validation of a Stability IndicatingRP-HPLC Method for the Determination of Two Sun ProtectionFactors (Koptrizon and Tinosorb S) in Topical PharmaceuticalFormulations Using Experimental Designs
Chinmoy Roy12 and Jitamanyu Chakrabarty2
1 Analytical Research and Development Dr Reddyrsquos Laboratories Ltd Bachupally Hyderabad Andhra Pradesh 500090 India2Department of Chemistry National Institute of Technology Durgapur West Bengal 713209 India
Correspondence should be addressed to Chinmoy Roy chinmoyanalystgmailcom
Received 11 March 2013 Accepted 15 April 2013
Academic Editors C Akbay and J A P Coelho
Copyright copy 2013 C Roy and J Chakrabarty This is an open access article distributed under the Creative Commons AttributionLicense which permits unrestricted use distribution and reproduction in any medium provided the original work is properlycited
Anovel simple validated stability indicatingHPLCmethodwas developed for determination ofKoptrizon andTinosorb S Stabilityindicating power of the method was established by forced degradation study The chromatographic separation was achieved withWaters X Bridge C18 column by using mobile phase consisting of a mixture of acetonitrile tetrahydrofuran water (38 38 24vvv) The method fulfilled validation criteria and was shown to be sensitive with limits of detection (LOD) and quantitation(LOQ) of 0024 and 008 120583gmLminus1 for Koptrizon and 0048 and 016 120583gmLminus1 for Tinosorb S respectively The developed method isvalidated for parameters like precision accuracy linearity solution stability specificity and ruggedness as per ICH norms Designexpert with ANOVA software with linear model was applied and a 23 full factorial design was employed to estimate the modelcoefficients and also to check the robustness of the method Results of the two-level full factorial design 23 with 10 runs includingtwo-centre-point analysis based on the variance analysis (ANOVA) demonstrated that all three factors as well as the interactionsbetween retention time of Koptrizon Tinosorb S and USP plate count for Koptrizon are statistically significant
1 Introduction
Frequent exposure toUV radiation causes pronouncedharm-ful effects on human health UV radiation-induced effects aremanifested as acute responses namely sunburn hyperplasiaand immunosuppressant and as chronic responses primarilyphoto carcinogenesis and photo ageing [1]
The molecules employed in cosmetic products to protectskin from the sun are classified as physical and chemicalsunscreens Physical sunscreens are represented mainly byzinc and titanium oxides which interrupt the path of UVlight by scattering or reflection Chemical sunscreens aregenerally aromatic compounds conjugated with an electron-donating group in ldquoorthordquo or ldquoparardquo position and an electronacceptor group This chemical structure favours electron
delocalization and therefore helps excitation of moleculesfrom ground state to an excited state The energy requiredfor this transition corresponds to the energies of ultravioletA (UVA) and Ultraviolet B (UVB) radiations [2 3]
Chronic exposure to UVB (280ndash320 nm) wavelengthsinduces damage to human skin such as burns and erythemabut increases evidence of demonstrates that UVA radiation(320ndash400 nm) contributes to photo aging which results inthe accumulation of massive amounts of abnormal elasticmaterial in the dermis of photo-aged skin and modificationin collagen structure [4ndash6]
The use of sunscreen products is a widely accepted wayof primary prevention against the harmful effects of solarradiation To limit sun exposure one is advised to wearloose fitting tightly woven clothing to stay in the shade
2 ISRN Chromatography
between 11 am and 3 pm and to use a sunscreen with a sunprotection factor (SPF) of 15 or higher liberally reapplyingevery 2 h or after working swimming playing or exercisingoutdoors [7ndash9]
The necessity to provide high SPF and screening effi-ciency against both UVA andUVBwavelengths has led to thedevelopment of sunscreen formulations with multiple addedsunscreen chemicals [10]
The literature survey reveals that several techniques havebeen reported such as derivative spectrophotometry [11] highperformance thin layer chromatography (HPTLC) [12 13]gas chromatography and GC-MS [14] High performanceliquid chromatography (HPLC) [15ndash23] in vitro and in vivoassessment of skin penetration and systemic absorption inhuman volunteers [24 25] and in vitro SPF determination byUV [26] for individual or combination of sunscreen agents incosmetic products
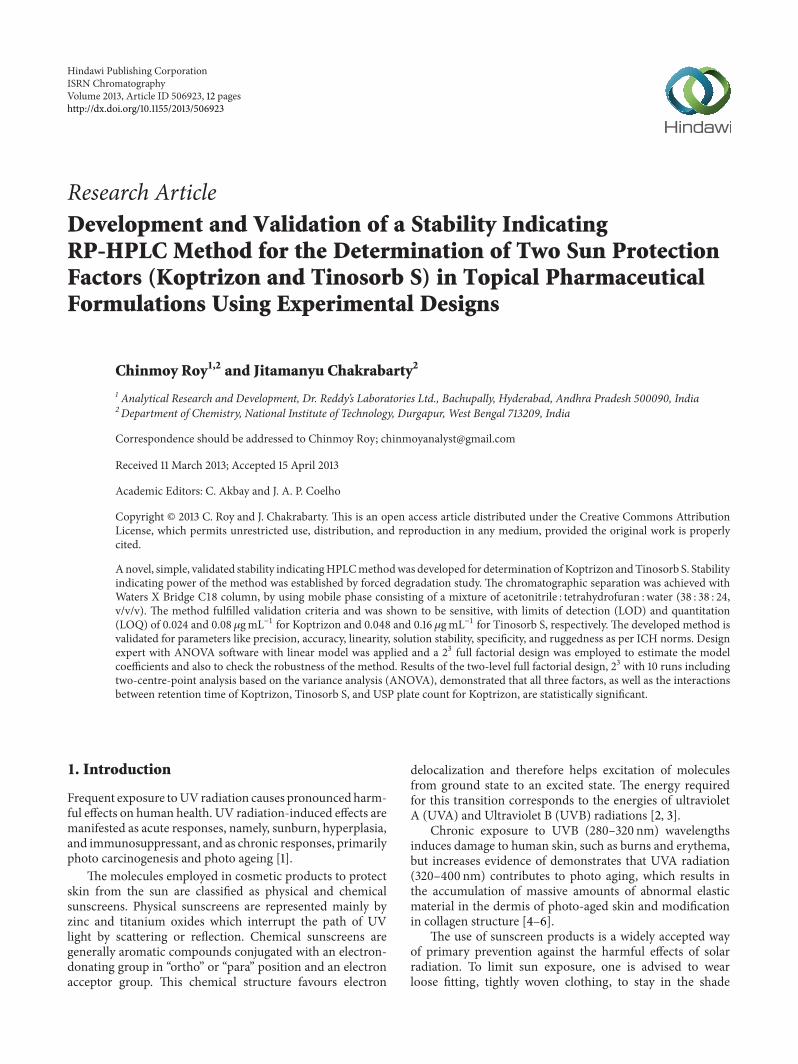
Koptrizon (KPT) or Ethylhexyl triazone chemicallyknown as 4-[[46-bis[[4-(2-ethylhexoxy-oxomethyl)phe-nyl]amino]-135-triazin-2-yl]amino] benzoic acid 2-ethyl-hexyl ester (Figure 1(a)) is an oil-soluble UVB filter (maxi-mum absorption 314 nm) manufactured by BASF under thetrade mark Uvinul T150 and used in cosmetic formulationat concentrations up to 5 Due to its insolubility in waterand affinity to the skin keratin it is particularly suitable forwater-resistant products Its excellent photostability and highabsorption coefficient make it a valuable ingredient when ahigh SPF value is required [27]
Tinosorb S (TIN) or Bemotrizinol chemically knownas 221015840-[6-(4-methoxyphenyl)-135-triazine-24-diyl] bis5-[(2-ethylhexyl)oxy]phenol (Figure 1(b)) is an oil-solubleorganic compound that is added to sunscreens to absorbUV rays TIN is a broad-spectrum UV absorber absorbingUVB as well as UVA rays It has two absorption peaks 310and 340 nm It is highly photostable TIN has strong syner-gistic effects on the SPF when formulated with BisoctrizoleEthylhexyl triazone or Iscotrizinol It is the most effectiveUV absorber available measured by SPF based on themaximum concentration permitted by European legislation[28ndash31]
There is not any method reported to estimate sunscreenagents KPT and TIN simultaneously in sunscreen formu-lations It is essential to have a good analysis method toprovide assurance of quality and effectiveness of the productsThe purpose of this research work is to develop simpleaccurate and stability indicating method for simultaneousdetermination of Koptrizon and Tinosorb S in sunscreen for-mulations by HPLC Design of experiment (DOE) techniquewas employed to study the effect of critical factors on themethod performance
The drug product stability guideline Q1A (R2) issued bythe International Conference on Harmonization (ICH) [32]suggests that stress studies should be carried out on a drugto establish its inherent stability characteristics leading toidentification of degradation products and hence supportingthe suitability of the proposed analytical procedures It alsorequires that analytical procedures for testing the stability ofsamples should be stability indicating and should be fullyvalidated
2 Experimental
21 Materials and Reagents Sunscreen topical formulationand placebo were provided by Dr Reddyrsquos Lab IndiaKoptrizon (Potency 997) and Tinosorb S (Potency 991)working standards were provided by BASF India HPLCgrade acetonitrile and tetrahydrofuran were purchased fromRankem India 02 120583m PTFE syringe filter and Also 02 120583mNylon syringe filter were procured from Millipore IndiaWater for HPLC was generated using Milli-Q Plus waterpurification system (Millipore Milford MA USA)
22 Chromatographic Conditions and Equipments HPLC(Allaince Waters with Empower 2 software) photo stabilitychamber (Sanyo Leicestershire UK) dry air oven (CintexMumbai India) XS205 dual range balance (Mettler Toledo)andCintex digital water bathwere used for specificity studiesAll chromatographic experiments were performed in theisocratic mode Separation was achieved on Waters X BridgeC18 (50 times 46mm 35 120583) column as stationary phase by usingmixture of acetonitrile tetrahydrofuran water (38 38 24vvv) as mobile phase Other parameters such as run time6 minutes 12mLminminus1 as flow rate injection volume of5 120583L and column temperature of 50∘C were finalized duringdevelopment KPT and TIN were detected at 311 nmMixtureof tetrahydrofuran acetonitrile (80 20 vv) was used asdiluents
The stress degraded samples and the solution stabilitysamples were analyzed using a PDA detector covering therange of 200ndash400 nm
23 Procedure
231 Standard Solution Preparation An accurately weighed15mg each of KPT andTINworking standards was taken into100mL volumetric flasks About 70mL of diluent was addedto this and sonicated in an ultrasonic bath to dissolve Wemade up the volume with diluent mixed well
232 Sample Solution Preparation An accurately weighedsample equivalent to 15mg of KPT and TIN was taken into100mL volumetric flask About 70mL of diluent was addedto this and sonicated in an ultrasonic bath for 15min withintermittent shaking We made up the volume with diluentmixed well We filtered a portion of solution through 02120583mNylon syringe filter
3 Results and Discussion
31 Method Development and Optimization Prime objectiveof an RP-HPLC method development for determination ofKPT and TIN in topical dosage form was that the methodshould be able to determine assay of drug in single runand should be accurate reproducible robust and stabilityindicating All degradation products from stress conditionsshould be well separated from each other Method should besimple so that it can be useful in analytical research and qual-ity control laboratory for routine use Furthermore primary
ISRN Chromatography 3
O
O
NHN
NN
NH
O
O
HN
O
O
(a)
N
N
N
O
OHO HO O
(b)
Figure 1 Chemical structure of (a) Koptrizon and (b) Tinosorb S
developed method was challenged by forced degradation as aprevalidation
32 Mobile Phase and Chromatographic Conditions Opti-mization Column selection and mobile phase selectionwere done simultaneously A method development wasstarted with Waters Symmetry C18 50 times 39mm 5120583mcolumn as stationary phase Mobile phase was buffer (10mMammonium formate pH 45 by formic acid) 14-Dioxane20 80 vv flow rate 10mLminminus1 column temperature 40∘CPeak broadening with less plate count for both the peakswas observed Further trial was carried out with differentcolumns such as X Bridge (50 times 46mm 35120583) keepingmobile phase and rest of chromatographic conditions thesame and peak broadening with less plate count for boththe peaks was observed In the next trial column was XBridge (50 times 46mm 35 120583) and mobile phase consisted ofacetonitrile tetrahydrofuran water (38 38 24 vvv) peaktailing for Tinosorb S peak was observed To reduce runtime and improve TIN peak shape an attempt was madeby increasing column temperature to 45∘C and flow rate to12mLminminus1 Peak shape for TIN improved but run timedid not reduce Further trial was for reducing run time Toreduce run time an attempt was made by increasing columntemperature to 50∘C and flow rate to 15mLminminus1 Goodpeak symmetry for both the peaks was observed for KPT andTIN with 60 minutes run timeThe chromatogram is shownin Figure 2 Different ratios of acetonitrile tetrahydrofuranwere tried as diluent but recovery problem was encoun-tered With consideration of solubility of two components
acetonitrile tetrahydrofuran (20 80 vv) was used as dilu-ent and satisfactory recovery was achieved
33 AnalyticalMethodValidation After satisfactory develop-ment of method it was subjected to method validation as perICHguideline [33]Themethodwas validated to demonstratethat it is suitable for its intended purpose by the standardprocedure Analytical method validation was carried out bymeans of system suitability accuracy precision linearityrobustness solution stability and filter compatibility
331 System Suitability System suitability parameters weremeasured so as to verify the system method and columnperformance The RSD (relative standard deviation) ofKOP and TIN was calculated from peak area count of fivereplicate injections (standard preparation) to be below 020Low values of RSD of replicate injections indicate that thesystem is precise Results of other system suitability param-eters such as theoretical plates tailing factor are presented inTable 1
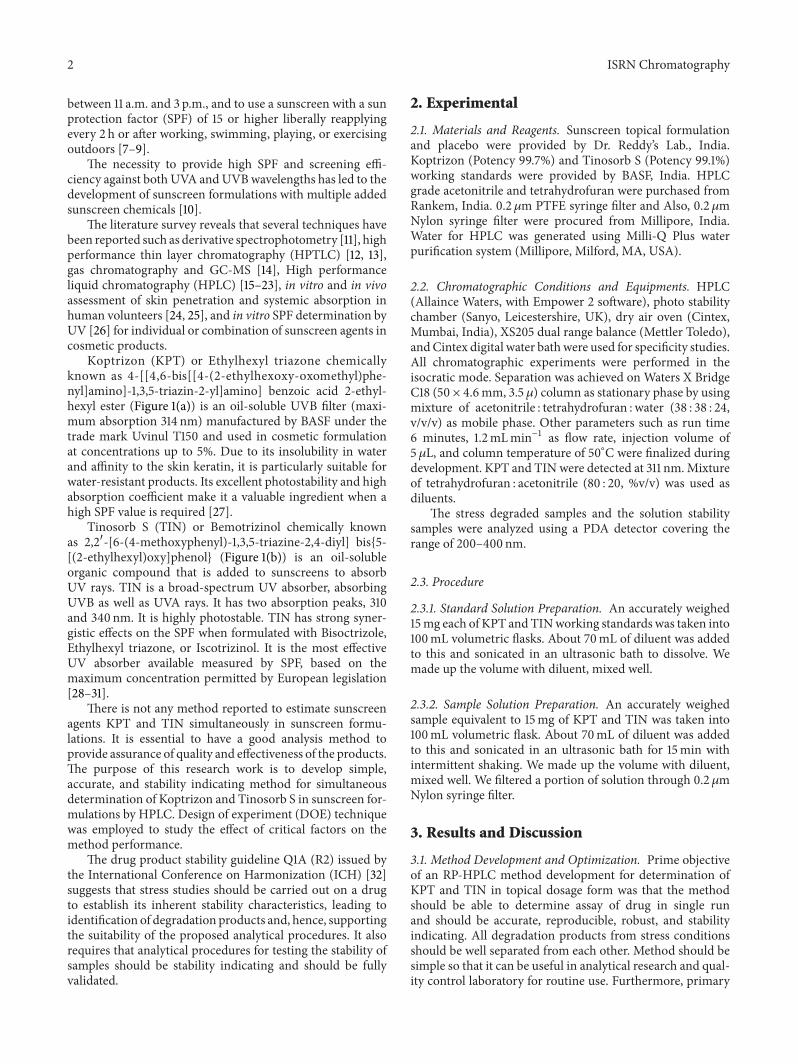
332 Specificity Specificity is the ability of the method tomeasure the analyte response in the presence of its potentialimpurities [33] Forced degradation studies were performedto demonstrate selectivity and stability indicating capabilityof the proposed RP-HPLC method Figure 2 shows thatthere is not any interference at the RT (retention time) ofKOP and TIN due to blank and placebo and degradationproducts Placebo standard and sample chromatogramssare presented in Figures 2(a) 2(b) and 2(c) respectively
4 ISRN Chromatography
Table 1 System suitability results (precision intermediate precision and robustness)
Parameter Theoretical platesfor KPT gt 2000
Tailing factorfor KPT le 20
RSDlowast of standardArea (KPT) le 20
Theoretical platesfor TIN gt 3000
Tailing factorfor TIN le 20
RSDlowast of standardArea (TIN) le 20
Precision 3512 10 03 4363 09 03Intermediate precision 3912 10 02 4578 10 04At 17mLminminus1 flow rate 3163 10 03 3917 09 04At 13mLminminus1 flow rate 3802 10 02 4789 09 02At 55∘C column temp 3128 10 03 3938 09 01At 45∘C column temp 3757 10 03 4594 09 03Mobile phase THF +5 3117 10 04 4070 09 05Mobile phase THF minus5 3701 10 01 4416 09 03lowastDetermined on five values THF tetrahydrofuran
Table 2 Data of forced degradation study for Koptrizon and Tinosorb S
Stress conditions Koptrizon Tinosorb SPA PTH Deg Purity flag PA PTH Deg Purity flag
Acidic hydrolysis 0088 0326 25 No 0097 0302 14 No(5(N) HCl at 70∘C 5 hrs)Alkaline hydrolysis 0145 0381 437 No 0130 0367 396 No(5(N) NaOH at 70∘C 5 hrs)Oxidation 0076 0311 145 No 0094 0299 92 No(30 H2O2 at 70
∘C 2 hrs)Thermal exposed 0071 0306 ND No 0091 0307 ND No(At 105∘C 6 hrs)Photolytic exposed 0089 0341 ND No 0084 0325 ND No(12 million lux hr visible light and 200whm2 UV light)PA purity angle PTH purity threshold Deg degradation ND no degradation
Significant degradation was observed when the drug productwas subjected to oxidation (30 vv H
2
O2
70∘C 2 h) andbase hydrolysis (5(N) NaOH 70∘C 5 h) Significant degrada-tion was not observed when KOP and TIN were subjected toacid hydrolysis (5(N) HCl 70∘C 5 h) Sample chromatogramfor base degradation and peroxide oxidation studies arepresented in Figure 2(d) andFigure 2(e) respectively Also nosignificant degradation was observed when the drug productwas photolytic exposed (12million lux hours and 200whmminus2UV light) and thermal exposed (105∘C 6 h) Peaks due toKOP and TIN were investigated for spectral purity in thechromatogram of all exposed samples and found spectrallypure Peak purity angles were less than peak purity thresholdsfor KOP and TINThe purity and assay of KOP and TINwereunaffected by the presence of impurities and degradationproducts thus confirming the stability-indicating power ofthe developedmethod Results from forced degradation studyare given in Table 2
333 Method Precision (Repeatability) The precision of theassay method was verified by repeatability and by intermedi-ate precision Precision was investigated using sample prepa-ration procedure for six real lotion samples and analysing byproposedmethodThe average assay values (119899 = 6) of KOPand TIN were 1024 992 and 988 respectively with
RSD of less than 10 Intermediate precision (reproducibil-ity) was studied using different columns and performing theanalysis on different days Results are presented in Table 3along with precision data Low values of RSD indicate thatthe method is precise
334 Accuracy To confirm the accuracy of the proposedmethod recovery experiments were carried out by standardaddition technique Three different levels (50 100 and150) of standards were added to preanalysed placebosamples in triplicate The percentage recoveries of KOP andTIN at each level and each replicate were determined Themean of percentage recoveries (119899 = 3) and the RSD werecalculated The amount recovered was within plusmn1 of theamount added which indicates that the method is accurateand also there is no interference due to excipients presentin topical formulation The results of recoveries for assay areshown in Table 4
335 Limit of Detection (LOD) and Quantification (LOQ)The LOD and LOQ were determined at a signal-to-noiseratio of 3 1 and 10 1 respectively by injecting a series ofdilute solutions with known concentrations The limit ofdetection and limit of quantification values of KOP and TINare reported in Table 3
ISRN Chromatography 5
AU
002040608
Minutes05 1 15 2 25 3 35 4 45 5 55 6
(a)
Kopt
rizon
-28
52
Tino
sorb
S-4
275
AU
002040608
Minutes05 1 15 2 25 3 35 4 45 5 55 6
(b)
Kopt
rizon
-28
5
Tino
sorb
S-4
273
AU
002040608
Minutes05 1 15 2 25 3 35 4 45 5 55 6
(c)
047
2
101
146
6
176
5
226
3
Kopt
rizon
-28
47
Tino
sorb
S-4
249
AU
002040608
Minutes05 1 15 2 25 3 35 4 45 5 55 6
(d)
043
1
145
7
188
6
Kopt
rizon
-28
56
Tino
sorb
S-4
28
002040608
Minutes05 1 15 2 25 3 35 4 45 5 55
AU
(e)
Figure 2 A typical chromatogram of (a) placebo (b) standard (c) sample (d) base degrdation sample and (e) peroxide degradation sample
336 Linearity Linearity was demonstrated from 50 to150 of standard concentration using minimum five cali-bration levels (50 75 100 125 and 150) for theKOP and TIN compounds which gave us a good confidenceon analytical method with respect to linear range Theresponse was found linear for all KOP and TIN from 50 to150 of standard concentration and correlation coefficientwas greater than 0999 Bias was also found within plusmn05The results of correlation coefficients 119884-intercept bias andlinearity equations for KOP and TIN are presented in Table 3
337 Robustness As defined by the ICH the robustness ofan analytical procedure describes its capability to remainunaffected by small and deliberate variations in methodparameters [33] The robustness as a measure of methodcapacity to remain unaffected by small but deliberate changesin chromatographic conditions was studies by testing influ-ence of small changes in flow rate (15 plusmn 02mLminminus1)change in column oven temperature (50 plusmn 5∘C) and changein mobile phase tetrahydrofuran composition (38 plusmn 5)No significant effect was observed on system suitability
6 ISRN Chromatography
Pareto chart
4078
3398
2719
2039
1359
68
0
1 2 3 4 5 6 7Rank
AB
C
Bonferroni limit 438176119905-value limit 257058
119905-v
alue
of|
effec
t|
(a)
Pareto chart
3803
3423
3042
2662
2282
1901
1521
1141
761
38
0
1 2 3 4 5 6 7Rank
AB
C
Bonferroni limit 438176119905-value limit 257058
119905-v
alue
of|
effec
t|
(b)
Bonferroni limit 438176
119905-value limit 257058
1 2 3 4 5 6 7
Pareto chartC
A B
Rank
0
365
73
1096
1461
119905-v
alue
of|
effec
t|
(c)
Figure 3 Pareto chart effect of factor (a) C gt A gt B in retention time of KPT (b) C gt B gt A in retention time of TIN (c) and C gt A gtB inplate count of KPT
Table 3 Method precision intermediate precision result LOD LOQ evaluations and linearity data for KPT and TIN
Parameter Koptrizon Tinosorb SPrecision Day-1repeatability (119899 = 6) 1013 plusmn 039 038 031 1002 plusmn 051 051 041( Assay plusmn SD RSD 95 CL)Intermediate precisionreproducibility (119899 = 6) 1002 plusmn 053 053 042 999 plusmn 029 029 024( Assay plusmn SD RSD 95 CL)LOD (120583gmLminus1) 0024 0048LOQ (120583gmLminus1) 008 016Linearity range (120583gmLminus1) 008ndash2258 016ndash2251Correlation coefficient 099999 099999Intercept (a) 210315 203208Slope (b) 27767747 13163737Bias at 100 response 0050 010295 CL 95 confidence interval
ISRN Chromatography 7
4
35
3
25
2
13 14 15 16 17
RT o
f Kop
triz
on
One factor
2
A flow
(a)
4
35
3
25
2
RT o
f Kop
triz
on
One factor
2
45 47 49 51 53 55
B column temperature
(b)
33 35 37 39 41 43
2
25
3
35
4
45
5
RT o
f Kop
triz
on
One factor
C THF composition
(c)
6
55
5
45
4
35
3
13 14 15 16 17
One factor
A flow
RT o
f Tin
osor
b S
(d)
6
55
5
45
4
35
3
45 47 49 51 53 55
RT o
f Tin
osor
b S
One factor
B column temperature
(e)
7
6
5
4
3
33 35 37 39 41 43
One factor
C THF composition
RT o
f Tin
osor
b S
(f)
4500
4000
3500
3000
2500
13 14 15 16 17
Kopt
rizon
pla
te co
unt
One factor
A flow
(g)
4500
4000
3500
3000
2500
45 47 49 51 53 55B column temperature
Kopt
rizon
pla
te co
unt
One factor
(h)
4500
4000
3500
3000
2500
33 35 37 39 41 43C THF composition
Kopt
rizon
pla
te co
unt
One factor
(i)
Figure 4 Single factor interaction (a) flow rate in RT of KPT (b) column temperature in KPT (c) THF composition in KPT (d) flow ratein RT of TIN (e) column temperature in RT of TIN (f) THF composition in RT of TIN (g) flow rate in USP plate count of KPT (h) columntemperature in USP plate count of KPT (i) THF composition in USP plate count KPT
parameters such as theoretical plates and tailing factor RSDof KOP and TIN was calculated from peak area count offive replicate injections when small but deliberate changeswere made to chromatographic conditions The results arepresented in Table 1 along with system suitability parametersof precision and intermediate precision study Thus themethod was found to be robust with respect to variability inprevious conditions
338 Experimental Design Approach Design Expert Soft-ware (Stat-Ease Inc Statistic made easy Minneapolis MNUSA version 700) was used for the experimental design
throughout this screening process study The full factorialdesign requires fewer measurements than the classical one-at-a-time experiment to give the same precision At thesame time it detects and estimates any interaction betweenthe factors In order to study the simultaneous variationof the factors on the considered responses a multivariateapproach using design of experiments is recommended inrobustness testing However if an analytical method is fastand requires the testing of a few factors (three or less) agood choice for robustness testing may be design expertwidely employed because of its high efficiency with respectto lesser number of runs required in full factorial mode In
8 ISRN Chromatography
5
4
3
2
5553
5149
4745 13
1415
1617RT
of K
optr
izon
B column temperature
A flow
(a)
5
3
12
4
5553
5149
4745 33
3537
3941
43
RT o
f Kop
triz
on
B column temperature C THF co
mposition
(b)
RT o
f Kop
triz
on
A flow
C THF co
mposition
12
4
6
3
5
1716
1514
13 3335
3739
4143
(c)
RT o
f Tin
osor
b S
A flow
B column temperature
24
68
1716
1514
13
5553
5149
4745
(d)
RT o
f Tin
osor
b S
C THF compositionB column temperature
2
4
6
8
3335
3739
414355
5351
4947
45
(e)
RT o
f Tin
osor
b S
C THF co
mposition
A flow
24
68
3335
3739
4143
1716
1514
13
(f)
Kopt
rizon
plat
e cou
nt
A flow
B column temperature
5000
4000
3000
2000
4749
5153
5517
16
15
14
13 45
(g)
Kopt
rizon
plat
e cou
nt
A flow
C THF composition
5000
4000
3000
2000
4341
3937
3533
17
16
15
14
13
(h)
Kopt
rizon
plat
e cou
nt
B column temperature C THF composition
5000
4000
3000
2000
4547
4951
5355
3335
3739
4143
(i)
Figure 5Three-dimensional plot of the fully factorial for predicted response RT of KPT plotted on 119910-axis as a function of factor (a) A (flowrate) and B (column temperature) fixed factor C ( tetrahydrofuran 380) (b) B (column temperature) and C ( tetrahydrofuran) fixedfactor A (flow rate 15mLminminus1) (c) A (flow rate) and C ( tetrahydrofuran) fixed factor B (column temperature 50∘C) RT of TIN plottedon 119910-axis as a function of factor (d) A (flow rate) and B (column temperature) fixed factor C ( tetrahydrofuran 380) (e) B (columntemperature) and C ( tetrahydrofuran) fixed factor A (flow rate 15mLminminus1) (f) A (flow rate) and C ( tetrahydrofuran) fixed factor B(column temperature 50∘C) Plate count of KPT plotted on 119910-axis as a function of factor (g) A (flow rate) and B (column temperature) fixedfactor C ( tetrahydrofuran 380) (h) A (flow rate) and C ( tetrahydrofuran) fixed factor B (column temperature 50∘C) (i) B (columntemperature) and C ( tetrahydrofuran) fixed factor A (flow rate 15mLminminus1)
order to study the three variables at two levels the designused in robustness testing of KOP and TIN retention timesand theoretical plate number for TIN was a 23 full factorialdesign ANOVA with linear model was applied to estimatethe model coefficients and also check the robustness of themethod Three factors and two levels caused full factorialdesign 23 in addition to that two centre points resultedtotal of ten experimental pointsmdashwhich were carried outin random order Effect of two factors in the resulting RTresponses of KPT TIN and plate count of KPT shown in
Pareto chart (Figure 3) Three factors were considered flowrate mLminminus1 (A) column temperature (B) and tetrahy-drofuran composition in mobile phase (C) The factorsand level considered (responses) for the study are shownin Table 5 Standards and sample of KOP and TIN wereprepared in assay concentration The critical retention timefor both KOP and TIN and also USP plate count for KOPpeak were studied as response All factors show negativeeffect in all three responses for one-factor-at-a-time response(Figure 4)
ISRN Chromatography 9
Overlay plot
A flow
B co
lum
n te
mpe
ratu
re55
53
49
51
47
4513 14 15 16 17
2
(a)
Overlay plot
A flow
C T
HF
com
posit
ion
13 14 15 16 17
43
41
39
37
35
33
2
(b)
Figure 6 Graphical plot of the fully factorial design space for (a) changing factors A (flow rate) and B (column temperature) fixed factor C( Tetrahydrofuran) (b) changing factors A (flow rate) and C ( Tetrahydrofuran) fixed factor B (column temperature)
Table 4 Accuracy results for Koptrizon and Tinosorb S (119899 = 3)
Activecomponents
Amount added(120583gmLminus1)
Amountrecovered(120583gmLminus1)
Recovery plusmn SD RSD
749 754 1007 plusmn 063 062KPT 1498 1530 1021 plusmn 049 048
2247 2204 981 plusmn 053 054756 755 990 plusmn 000 000
TIN 1512 1547 1023 plusmn 156 1522268 2227 982 plusmn 033 034
The ANOVA statistical test was employed to determinethe significant and most contributing factors where theywere ranked on the basis of degree of 119865 ratio The higherthe 119865 value corresponds with smaller ldquoProb gt 119865rdquo valuethe more significant are the resultant model and individualcoefficient Table 6 shows the reading of ANOVA analysiswhere 119865 value and 119875 value of the model were 7433 and00001 respectively demonstrating that the estimated modelfits the experimental data satisfactorily Also the 1198772 valuewas nearly close to 1 (099) which indicates that 99 ofthe data variability was successfully explained by the modelThis means that with slight change of temperature flow rateand tetrahydrofuran composition in mobile phase duringanalysis retention time (RT) of KPT will be affected Hencefrom this data generated by the model it can be explainedthat RT of KPT is decreasing with increasing in mobilephase flow rate column temperature and tetrahydrofurancomposition as shown in Figures 5(a) 5(b) and 5(c) Table 7shows the reading of ANOVA analysis where 119865-value and119875-value of the model were 63025 and 00001 respectivelydemonstrating that the estimated model fits satisfactorilywith the experimental data And also the 1198772 value wasnearly close to 1 (099) which indicates that 98 of the
data variability was successfully explained by the modelThis means that with slight change of temperature flowrate and tetrahydrofuran composition in mobile phaseduring analysis RT of TIN will be affected Hence fromthis data generated by the model it explained that RT ofTIN is decreasing with increasing in mobile phase flow ratecolumn temperature and tetrahydrofuran compositionas shown in Figures 5(d) 5(e) and 5(f) Table 8 shows thereading of ANOVA analysis where 119865-value and 119875-value ofthe model were 11187 and 00001 respectively showing thatthe estimated model fits the experimental data satisfactorilyAnd also the 1198772 value was nearly close to 1 (098) whichindicates that 99 of the data variability was successfullyexplained by themodelThismeans that with slight change oftemperature flow rate and tetrahydrofuran compositionin mobile phase during analysis the USP plate count ofKPT will be affected Hence from this data generated by themodel it explained that plate count of KPT is decreasing withincreasing in mobile phase flow rate column temperatureand tetrahydrofuran composition as shown in Figures 5(g)5(h) and 5(i)
339 Design Space DOE revolves around the concept ofthe design space the multidimensional combination andinteraction of input variables and process parameters thathave been demonstrated to provide assurance of qualityWorking within the design space is not considered as achange Movement out of the design space is considered tobe a change and would normally initiate a regulatory postap-proval change process Design space is proposed by the appli-cant and is subject to regulatory assessment and approval[34ndash36] Design space was established by employing fullfactorial design variables of flow rate (A) 13ndash17mLminminus1column temperature (B) 45ndash55∘C and tetrahydrofurancomposition in mobile phase (C) 33ndash43 and their respec-tive responses which are presented in Figure 6
10 ISRN Chromatography
Table 5 The range and levels of the variables in the 23 full factorial design
Std RunFactor 1 Factor 2 Factor 3 Response 1 Response 2 Response 3
A flow rate B column temp C THF comp RT of KPT RT of TIN Plate count of KPT(mLminminus1) (∘C) () (min) (min) (min)
0 2 15 50 38 28 43 34760 7 15 50 38 28 42 33467 1 13 55 43 22 32 28064 3 17 55 33 31 47 32002 4 17 45 33 39 60 41086 5 17 45 43 22 32 27678 6 17 55 43 18 26 22043 8 13 55 33 38 58 41145 9 13 45 43 28 41 33361 10 13 45 33 51 79 48040 2 15 50 38 28 43 3476
Table 6 ANOVA for 23 full factorial design response RT of Koptrizon (min)
Source Sum of squares df Mean square 119865 value 119875 value prob gt 119865Model 0073284126 3 0024428 7433259616 lt00001 Significant
Amdashflow 0008862903 1 0008863 2696911034 lt00001Bmdashcolumn temp 0009766119 1 0009766 2971752743 lt00001CmdashTHF comp 0054655104 1 0054655 1663111507 lt00001
Curvature 882574119864 minus 05 1 883119864 minus 05 268560136 01622 Not significantResidual 0000164316 5 329119864 minus 05
Lack of fit 0000164316 4 411119864 minus 05
Pure error 0 1 0Cor total 0073536699 9Std dev 0006488107 119877
2 0996565345Mean 0591672677 Adjusted 1198772 0994848018Values of prob gt 119865 less than 005 indicates that model is significant
3310 Stability of Sample Solution Stability of sample solu-tion was established by its storage at ambient temperaturefor 24 hrs The assays of KOP and TIN were analysed It wasfound that labelled amounts ofKOPat 0 12 and 24 hrswere1013 1007 and 1016 respectively and labelled amounts ofTIN were 1002 998 and 997 respectively
3311 Filter Compatibility Filter compatibility was per-formed for nylon 02 120583m syringe filter (Millipore) and PTFE02 120583m syringe filter (Millipore) To confirm the filter com-patibility in proposedmethod filtration recovery experimentwas carried out by sample filtration technique Samples werefiltered through both syringe filters and percentage assaywas determined and compared against centrifuged sampleSample solution did not show any significant change inassay percentage with respect to centrifuged sample It wasfound that labelled amounts of KPT at centrifuged sample022120583m nylon syringe filter and 022120583m PTFE syringe filterwere 1005 1003 and 998 respectively and for TIN were1002 1005 and 1005 In the result obtained difference in assay was not more than plusmn10 which indicates that bothsyringe filters have good compatibility with sample
4 Conclusion
The experimental design describes the key HPLC methodcomponents including column temperature mobile phaseflow rate and tetrahydrofuran composition in mobilephaseThe interrelationships are studied and the preliminaryoptimized conditions are obtained for each combinationHere a better understanding of the factors influencing chro-matographic separation and greater confidence in the abilityof the methods to meet their intended purposes is doneMoreover this approach ensures better design of productA gradient RP-HPLC method was successfully developedfor the estimation of KOP and TIN in topical dosageform The method validation results have proved that themethod is selective precise accurate linear robust filtercompatible and stability indicating The drug is stable inthermal and photolytic conditions and degrades in acidicbasic and oxidative conditions The method robustness wasdemonstrated using experimental design techniques takinginto consideration the selectivity of the RP HPLC methodThe short run time (60min) enables rapid determinationof drug Moreover it may be applied for determination
ISRN Chromatography 11
Table 7 ANOVA for 23 full factorial design response RT of Tinosorb S (min)
Source Sum of squares df Mean square 119865 value 119875 value Prob gt 119865Model 0057184881 3 0019061627 6302536737 lt00001 Significant
Amdashflow 0006317517 1 0006317517 2088823992 lt00001Bmdashcolumn temp 0007126362 1 0007126362 2356260641 lt00001CmdashTHF comp 0043741001 1 0043741001 1446252558 lt00001
Curvature 167021119864 minus 06 1 167021119864 minus 06 0055223918 08235 Not significantResidual 0000151222 5 302444119864 minus 05
Lack of fit 0000134936 4 337339119864 minus 05 2071326494 04746 Not significantPure error 162861119864 minus 05 1 162861119864 minus 05
Cor total 0057337773 9Std dev 0005047971 119877
2 0997333484Mean 0484279065 Adjusted 1198772 0996000226Values of prob gt 119865 less than 005 indicates that model is significant
Table 8 ANOVA for 23 full factorial design response Koptrizon plate count
Source Sum of squares df Mean square 119865 value 119875 value Prob gt 119865Model 5139776375 3 1713258792 1118731376 lt00001 Significant
Amdashflow 966745125 1 966745125 6312695487 00005Bmdashcolumn temp 905185125 1 905185125 591071825 00006CmdashTHF comp 3267846125 1 3267846125 2133852755 lt00001
Curvature 65025 1 65025 0004246031 09506 Not significantResidual 765715 5 153143Lack of fit 681215 4 17030375 2015428994 04800 Not significantPure error 8450 1 8450Cor total 52164129 9Std dev 1130166101 119877
2 0985308578Mean 34161 Adjusted 1198772 0977962866Values of prob gt 119865 less than 005 indicates that model is significant
of KOP and TIN in the study of content uniformity tubehomogeneity and in vitro release test profiling of KOP andTIN topical dosage forms where sample load is higher andhigh throughput is essential for faster delivery of results
Conflict of Interests
The authors of the paper declare that there is no directfinancial relation with the commercial identities mentionedin the paper that might lead to a conflict of interests
Acknowledgments
Theauthorswould like to thankMsDr Reddyrsquos LaboratoriesLtd for supporting this work The authorsrsquo Intellectual Prop-erty Management (IPM) department has given this paperinternal publication no PUB00228-13
References
[1] A Chisvert M C Pascaul-Marti and A Salvador ldquoDetermi-nation of the UV filters worldwideauthorized in sunscreens byHPLC Use of cyclodextrins as mobile phase modifierrdquo Journalof Chromatography A vol 921 no 2 pp 207ndash215 2001
[2] C Couteau A Faure J Fortin E Paparis and L J M CoiffardldquoStudy of the photostability of 18 sunscreens in creams bymeasuring the SPF in vitrordquo Journal of Pharmaceutical andBiomedical Analysis vol 44 no 1 pp 270ndash273 2007
[3] A Salvador and A Chisvert ldquoSunscreen analysis a criticalsurvey on UV filters determinationrdquo Analytica Chimica Actavol 537 no 1-2 pp 1ndash14 2005
[4] B A Gilchrest N A Soter J L Hawk et al ldquoHistologicalchanges associated with ultraviolet A-induced erythema innormal human skinrdquo Journal of the American Academy ofDermatology vol 9 no 2 pp 213ndash219 1983
[5] T Takeuchi J Uitto and E F Bernstein ldquoA novel in vivo modelfor evaluating agents that protect against ultraviolet A-inducedphotoagingrdquo Journal of Investigative Dermatology vol 110 no4 pp 343ndash347 1998
[6] J M Menter A M Patta R M Sayre J Dowdy and I WillisldquoEffect of UV irradiation on type I collagen fibril formation inneutral collagen solutionsrdquo Photodermatology Photoimmunol-ogy and Photomedicine vol 17 no 3 pp 114ndash120 2001
[7] 2010 httpwwwwhointuvsun protectionen[8] A Rampaul I P Parkin and L P Cramer ldquoDamaging and
protective properties of inorganic components of sunscreensapplied to cultured human skin cellsrdquo Journal of Photochemistryand Photobiology A vol 191 no 2-3 pp 138ndash148 2007
12 ISRN Chromatography
[9] L M Peruchi and S Rath ldquoDevelopment and application of aHPLC method for eight sunscreen agents in suncare productsrdquoInternational Journal of Cosmetic Science vol 34 no 1 pp 226ndash233 2012
[10] J Flor M R Davolos andM A Correa ldquoSunscreensrdquoQuimicaNova vol 30 no 1 pp 153ndash158 2007
[11] H M Chawla and S Mrig ldquoSimultaneous quantitative estima-tion of oxybenzone and 2-ethylhexyl-4- methoxycinnamate insunscreen formulations by second order derivative spectropho-tometryrdquo Journal of Analytical Chemistry vol 64 no 6 pp 585ndash592 2009
[12] E Westgate and J Sherma ldquoDetermination of the sunscreenoxybenzone in lotions by reversed-phase HPTLCwith ultravio-let absorption densitometryrdquo Journal of Liquid Chromatographyand Related Technologies vol 23 no 4 pp 609ndash615 2000
[13] AW Sobanska and E Brzezinska ldquoNormal-phase TLC analysisof UV filters avobenzone and octocrylene in sunscreen prepa-rationsrdquo Journal of Planar Chromatography vol 24 no 2 pp154ndash159 2011
[14] K Ikeda S Suzuki and Y Watanabe ldquoDetermination ofsunscreen agents in cosmetic products by reversed-phase high-performance liquid chromatographyrdquo Journal of Chromatogra-phy vol 513 pp 321ndash326 1990
[15] L Dencausse A Galland J L Clamou and J Basso ldquoValidationofHPLCmethod for quantitative determination of TinosorbSand three other sunscreens in a high protection cosmeticproductrdquo International Journal of Cosmetic Science vol 30 no5 pp 373ndash382 2008
[16] A Salvador and A Chisvert ldquoAn environmentally friendly(ldquogreenrdquo) reversed-phase liquid chromatography method forUV filters determination in cosmeticsrdquoAnalytica Chimica Actavol 537 no 1-2 pp 15ndash24 2005
[17] E R M Kedor-Hackmann M L De Lourdes Perez GonzalezA K Singh and M I R M Santoro ldquoValidation of a HPLCmethod for simultaneous determination of five sunscreens inlotion preparationrdquo International Journal of Cosmetic Sciencevol 28 no 3 pp 219ndash224 2006
[18] S Scalia ldquoDetermination of sunscreen agents in cosmetic prod-ucts by supercritical fluid extraction and high-performanceliquid chromatographyrdquo Journal of Chromatography A vol 870no 1-2 pp 199ndash205 2000
[19] S Simeoni R Tursilli A Bianchi and S Scalia ldquoAssayof common sunscreen agents in suncare products by high-performance liquid chromatography on a cyanopropyl-bondedsilica columnrdquo Journal of Pharmaceutical and Biomedical Anal-ysis vol 38 no 2 pp 250ndash255 2005
[20] M Nyeborg M Pissavini Y Lemasson and O Doucet ldquoVali-dation of HPLC method for the simultaneous and quantitativedetermination of 12 UV-filters in cosmeticsrdquo InternationalJournal of Cosmetic Science vol 32 no 1 pp 47ndash53 2010
[21] M Wharton M Geary N OrsquoConnor and B Murphy ldquoA rapidHigh Performance Liquid Chromatographic (HPLC) methodfor the simultaneous determination of seven UV filters foundin sunscreen and cosmeticsrdquo International Journal of CosmeticScience vol 33 no 2 pp 164ndash170 2011
[22] F M P Vilela Y M Fonseca F T M C Vicentini M J VFonseca and M D P H Do Amaral ldquoDetermination of threeultraviolet filters in sunscreen formulations and from skin pen-etration studies by high-performance liquid chromatographyrdquoQuimica Nova vol 34 no 5 pp 879ndash883 2011
[23] A W Sobanska and J Pyzowski ldquoQuantification of sunscreenethylhexyl triazone in topical skin-care products by normal-phase TLCdensitometryrdquo Scientific World Journal vol 2012Article ID 807516 6 pages 2012
[24] G Potard C Laugel H Schaefer and J P Marty ldquoThe strippingtechnique in vitro absorption and penetration of five UV filterson excised fresh human skinrdquo Skin Pharmacology and AppliedSkin Physiology vol 13 no 6 pp 336ndash344 2000
[25] G Potard C Laugel A Baillet H Schaefer and J P MartyldquoQuantitative HPLC analysis of sunscreens and caffeine duringin vitro percutaneous penetration studiesrdquo International Journalof Pharmaceutics vol 189 no 2 pp 249ndash260 1999
[26] M D Bleasel and S Aldous ldquoIn vitro evaluation of sunprotection factors of sunscreen agents using a novel UV spec-trophotometric techniquerdquo International Journal of CosmeticScience vol 30 no 4 pp 259ndash270 2008
[27] Uvinul grades UV absorbers for cosmetic products BASFtechnical information
[28] G Vielhaber S Grether-Beck O Koch W Johncock andJ Krutmann ldquoSunscreens with an absorption maximum ofge360 nm provide optimal protection against UVA1-inducedexpression of matrix metalloproteinase-1 interleukin-1 andinterleukin-6 in human dermal fibroblastsrdquo Photochemical andPhotobiological Sciences vol 5 no 3 pp 275ndash282 2006
[29] E Chatelain and B Gabard ldquoPhotostabilization of butyl me-thoxydibenzoylmethane (Avobenzone) and Ethylhexyl me-thoxycinnamate by bis-ethylhexyloxyphenol methoxyphenyltriazine (Tinosorb S) a new UV broadband filterrdquo Photochemi-cal and Photobioogical Sciences vol 74 no 3 pp 401ndash406 2001
[30] httpwwwcibacomtinosorb-s brochurepdf[31] C Couteau M Pommier E Paparis and L J M Coiffard
ldquoStudy of the efficacy of 18 sun filters authorized in EuropeanUnion tested in vitrordquo Pharmazie vol 62 no 6 pp 449ndash4522007
[32] ICH Q1A (R2) ldquoStability Testing of new Drug Substances andProductsrdquo in Proceedings of the International Conference onHarmonization 2003
[33] ICH Q2 (R1) ldquoValidation of analytical procedures text andmethodologyrdquo in Proceedings of the International Conference onHarmonization 2005
[34] J Peterson ldquoStatistical Analysis QbD Classics What Your ICHQ8 Design Space Needsrdquo Pharma Qbd 2010
[35] U Smith ldquoOptimizing Design of Experiments for Fluid BedCoatingrdquo Pharma Qbd 2010
[36] M Anderson ldquoDesign space Framing a QbD Design Spacewith Tolerance Intervalsrdquo Pharma Qbd 2012
Submit your manuscripts athttpwwwhindawicom
Hindawi Publishing Corporationhttpwwwhindawicom Volume 2014
Inorganic ChemistryInternational Journal of
Hindawi Publishing Corporation httpwwwhindawicom Volume 2014
International Journal ofPhotoenergy
Hindawi Publishing Corporationhttpwwwhindawicom Volume 2014
Carbohydrate Chemistry
International Journal of
Hindawi Publishing Corporationhttpwwwhindawicom Volume 2014
Journal of
Chemistry
Hindawi Publishing Corporationhttpwwwhindawicom Volume 2014
Advances in
Physical Chemistry
Hindawi Publishing Corporationhttpwwwhindawicom
Analytical Methods in Chemistry
Journal of
Volume 2014
Bioinorganic Chemistry and ApplicationsHindawi Publishing Corporationhttpwwwhindawicom Volume 2014
SpectroscopyInternational Journal of
Hindawi Publishing Corporationhttpwwwhindawicom Volume 2014
The Scientific World JournalHindawi Publishing Corporation httpwwwhindawicom Volume 2014
Medicinal ChemistryInternational Journal of
Hindawi Publishing Corporationhttpwwwhindawicom Volume 2014
Chromatography Research International
Hindawi Publishing Corporationhttpwwwhindawicom Volume 2014
Applied ChemistryJournal of
Hindawi Publishing Corporationhttpwwwhindawicom Volume 2014
Hindawi Publishing Corporationhttpwwwhindawicom Volume 2014
Theoretical ChemistryJournal of
Hindawi Publishing Corporationhttpwwwhindawicom Volume 2014
Journal of
Spectroscopy
Analytical ChemistryInternational Journal of
Hindawi Publishing Corporationhttpwwwhindawicom Volume 2014
Journal of
Hindawi Publishing Corporationhttpwwwhindawicom Volume 2014
Quantum Chemistry
Hindawi Publishing Corporationhttpwwwhindawicom Volume 2014
Organic Chemistry International
ElectrochemistryInternational Journal of
Hindawi Publishing Corporation httpwwwhindawicom Volume 2014
Hindawi Publishing Corporationhttpwwwhindawicom Volume 2014
CatalystsJournal of
2 ISRN Chromatography
between 11 am and 3 pm and to use a sunscreen with a sunprotection factor (SPF) of 15 or higher liberally reapplyingevery 2 h or after working swimming playing or exercisingoutdoors [7ndash9]
The necessity to provide high SPF and screening effi-ciency against both UVA andUVBwavelengths has led to thedevelopment of sunscreen formulations with multiple addedsunscreen chemicals [10]
The literature survey reveals that several techniques havebeen reported such as derivative spectrophotometry [11] highperformance thin layer chromatography (HPTLC) [12 13]gas chromatography and GC-MS [14] High performanceliquid chromatography (HPLC) [15ndash23] in vitro and in vivoassessment of skin penetration and systemic absorption inhuman volunteers [24 25] and in vitro SPF determination byUV [26] for individual or combination of sunscreen agents incosmetic products
Koptrizon (KPT) or Ethylhexyl triazone chemicallyknown as 4-[[46-bis[[4-(2-ethylhexoxy-oxomethyl)phe-nyl]amino]-135-triazin-2-yl]amino] benzoic acid 2-ethyl-hexyl ester (Figure 1(a)) is an oil-soluble UVB filter (maxi-mum absorption 314 nm) manufactured by BASF under thetrade mark Uvinul T150 and used in cosmetic formulationat concentrations up to 5 Due to its insolubility in waterand affinity to the skin keratin it is particularly suitable forwater-resistant products Its excellent photostability and highabsorption coefficient make it a valuable ingredient when ahigh SPF value is required [27]
Tinosorb S (TIN) or Bemotrizinol chemically knownas 221015840-[6-(4-methoxyphenyl)-135-triazine-24-diyl] bis5-[(2-ethylhexyl)oxy]phenol (Figure 1(b)) is an oil-solubleorganic compound that is added to sunscreens to absorbUV rays TIN is a broad-spectrum UV absorber absorbingUVB as well as UVA rays It has two absorption peaks 310and 340 nm It is highly photostable TIN has strong syner-gistic effects on the SPF when formulated with BisoctrizoleEthylhexyl triazone or Iscotrizinol It is the most effectiveUV absorber available measured by SPF based on themaximum concentration permitted by European legislation[28ndash31]
There is not any method reported to estimate sunscreenagents KPT and TIN simultaneously in sunscreen formu-lations It is essential to have a good analysis method toprovide assurance of quality and effectiveness of the productsThe purpose of this research work is to develop simpleaccurate and stability indicating method for simultaneousdetermination of Koptrizon and Tinosorb S in sunscreen for-mulations by HPLC Design of experiment (DOE) techniquewas employed to study the effect of critical factors on themethod performance
The drug product stability guideline Q1A (R2) issued bythe International Conference on Harmonization (ICH) [32]suggests that stress studies should be carried out on a drugto establish its inherent stability characteristics leading toidentification of degradation products and hence supportingthe suitability of the proposed analytical procedures It alsorequires that analytical procedures for testing the stability ofsamples should be stability indicating and should be fullyvalidated
2 Experimental
21 Materials and Reagents Sunscreen topical formulationand placebo were provided by Dr Reddyrsquos Lab IndiaKoptrizon (Potency 997) and Tinosorb S (Potency 991)working standards were provided by BASF India HPLCgrade acetonitrile and tetrahydrofuran were purchased fromRankem India 02 120583m PTFE syringe filter and Also 02 120583mNylon syringe filter were procured from Millipore IndiaWater for HPLC was generated using Milli-Q Plus waterpurification system (Millipore Milford MA USA)
22 Chromatographic Conditions and Equipments HPLC(Allaince Waters with Empower 2 software) photo stabilitychamber (Sanyo Leicestershire UK) dry air oven (CintexMumbai India) XS205 dual range balance (Mettler Toledo)andCintex digital water bathwere used for specificity studiesAll chromatographic experiments were performed in theisocratic mode Separation was achieved on Waters X BridgeC18 (50 times 46mm 35 120583) column as stationary phase by usingmixture of acetonitrile tetrahydrofuran water (38 38 24vvv) as mobile phase Other parameters such as run time6 minutes 12mLminminus1 as flow rate injection volume of5 120583L and column temperature of 50∘C were finalized duringdevelopment KPT and TIN were detected at 311 nmMixtureof tetrahydrofuran acetonitrile (80 20 vv) was used asdiluents
The stress degraded samples and the solution stabilitysamples were analyzed using a PDA detector covering therange of 200ndash400 nm
23 Procedure
231 Standard Solution Preparation An accurately weighed15mg each of KPT andTINworking standards was taken into100mL volumetric flasks About 70mL of diluent was addedto this and sonicated in an ultrasonic bath to dissolve Wemade up the volume with diluent mixed well
232 Sample Solution Preparation An accurately weighedsample equivalent to 15mg of KPT and TIN was taken into100mL volumetric flask About 70mL of diluent was addedto this and sonicated in an ultrasonic bath for 15min withintermittent shaking We made up the volume with diluentmixed well We filtered a portion of solution through 02120583mNylon syringe filter
3 Results and Discussion
31 Method Development and Optimization Prime objectiveof an RP-HPLC method development for determination ofKPT and TIN in topical dosage form was that the methodshould be able to determine assay of drug in single runand should be accurate reproducible robust and stabilityindicating All degradation products from stress conditionsshould be well separated from each other Method should besimple so that it can be useful in analytical research and qual-ity control laboratory for routine use Furthermore primary
ISRN Chromatography 3
O
O
NHN
NN
NH
O
O
HN
O
O
(a)
N
N
N
O
OHO HO O
(b)
Figure 1 Chemical structure of (a) Koptrizon and (b) Tinosorb S
developed method was challenged by forced degradation as aprevalidation
32 Mobile Phase and Chromatographic Conditions Opti-mization Column selection and mobile phase selectionwere done simultaneously A method development wasstarted with Waters Symmetry C18 50 times 39mm 5120583mcolumn as stationary phase Mobile phase was buffer (10mMammonium formate pH 45 by formic acid) 14-Dioxane20 80 vv flow rate 10mLminminus1 column temperature 40∘CPeak broadening with less plate count for both the peakswas observed Further trial was carried out with differentcolumns such as X Bridge (50 times 46mm 35120583) keepingmobile phase and rest of chromatographic conditions thesame and peak broadening with less plate count for boththe peaks was observed In the next trial column was XBridge (50 times 46mm 35 120583) and mobile phase consisted ofacetonitrile tetrahydrofuran water (38 38 24 vvv) peaktailing for Tinosorb S peak was observed To reduce runtime and improve TIN peak shape an attempt was madeby increasing column temperature to 45∘C and flow rate to12mLminminus1 Peak shape for TIN improved but run timedid not reduce Further trial was for reducing run time Toreduce run time an attempt was made by increasing columntemperature to 50∘C and flow rate to 15mLminminus1 Goodpeak symmetry for both the peaks was observed for KPT andTIN with 60 minutes run timeThe chromatogram is shownin Figure 2 Different ratios of acetonitrile tetrahydrofuranwere tried as diluent but recovery problem was encoun-tered With consideration of solubility of two components
acetonitrile tetrahydrofuran (20 80 vv) was used as dilu-ent and satisfactory recovery was achieved
33 AnalyticalMethodValidation After satisfactory develop-ment of method it was subjected to method validation as perICHguideline [33]Themethodwas validated to demonstratethat it is suitable for its intended purpose by the standardprocedure Analytical method validation was carried out bymeans of system suitability accuracy precision linearityrobustness solution stability and filter compatibility
331 System Suitability System suitability parameters weremeasured so as to verify the system method and columnperformance The RSD (relative standard deviation) ofKOP and TIN was calculated from peak area count of fivereplicate injections (standard preparation) to be below 020Low values of RSD of replicate injections indicate that thesystem is precise Results of other system suitability param-eters such as theoretical plates tailing factor are presented inTable 1
332 Specificity Specificity is the ability of the method tomeasure the analyte response in the presence of its potentialimpurities [33] Forced degradation studies were performedto demonstrate selectivity and stability indicating capabilityof the proposed RP-HPLC method Figure 2 shows thatthere is not any interference at the RT (retention time) ofKOP and TIN due to blank and placebo and degradationproducts Placebo standard and sample chromatogramssare presented in Figures 2(a) 2(b) and 2(c) respectively
4 ISRN Chromatography
Table 1 System suitability results (precision intermediate precision and robustness)
Parameter Theoretical platesfor KPT gt 2000
Tailing factorfor KPT le 20
RSDlowast of standardArea (KPT) le 20
Theoretical platesfor TIN gt 3000
Tailing factorfor TIN le 20
RSDlowast of standardArea (TIN) le 20
Precision 3512 10 03 4363 09 03Intermediate precision 3912 10 02 4578 10 04At 17mLminminus1 flow rate 3163 10 03 3917 09 04At 13mLminminus1 flow rate 3802 10 02 4789 09 02At 55∘C column temp 3128 10 03 3938 09 01At 45∘C column temp 3757 10 03 4594 09 03Mobile phase THF +5 3117 10 04 4070 09 05Mobile phase THF minus5 3701 10 01 4416 09 03lowastDetermined on five values THF tetrahydrofuran
Table 2 Data of forced degradation study for Koptrizon and Tinosorb S
Stress conditions Koptrizon Tinosorb SPA PTH Deg Purity flag PA PTH Deg Purity flag
Acidic hydrolysis 0088 0326 25 No 0097 0302 14 No(5(N) HCl at 70∘C 5 hrs)Alkaline hydrolysis 0145 0381 437 No 0130 0367 396 No(5(N) NaOH at 70∘C 5 hrs)Oxidation 0076 0311 145 No 0094 0299 92 No(30 H2O2 at 70
∘C 2 hrs)Thermal exposed 0071 0306 ND No 0091 0307 ND No(At 105∘C 6 hrs)Photolytic exposed 0089 0341 ND No 0084 0325 ND No(12 million lux hr visible light and 200whm2 UV light)PA purity angle PTH purity threshold Deg degradation ND no degradation
Significant degradation was observed when the drug productwas subjected to oxidation (30 vv H
2
O2
70∘C 2 h) andbase hydrolysis (5(N) NaOH 70∘C 5 h) Significant degrada-tion was not observed when KOP and TIN were subjected toacid hydrolysis (5(N) HCl 70∘C 5 h) Sample chromatogramfor base degradation and peroxide oxidation studies arepresented in Figure 2(d) andFigure 2(e) respectively Also nosignificant degradation was observed when the drug productwas photolytic exposed (12million lux hours and 200whmminus2UV light) and thermal exposed (105∘C 6 h) Peaks due toKOP and TIN were investigated for spectral purity in thechromatogram of all exposed samples and found spectrallypure Peak purity angles were less than peak purity thresholdsfor KOP and TINThe purity and assay of KOP and TINwereunaffected by the presence of impurities and degradationproducts thus confirming the stability-indicating power ofthe developedmethod Results from forced degradation studyare given in Table 2
333 Method Precision (Repeatability) The precision of theassay method was verified by repeatability and by intermedi-ate precision Precision was investigated using sample prepa-ration procedure for six real lotion samples and analysing byproposedmethodThe average assay values (119899 = 6) of KOPand TIN were 1024 992 and 988 respectively with
RSD of less than 10 Intermediate precision (reproducibil-ity) was studied using different columns and performing theanalysis on different days Results are presented in Table 3along with precision data Low values of RSD indicate thatthe method is precise
334 Accuracy To confirm the accuracy of the proposedmethod recovery experiments were carried out by standardaddition technique Three different levels (50 100 and150) of standards were added to preanalysed placebosamples in triplicate The percentage recoveries of KOP andTIN at each level and each replicate were determined Themean of percentage recoveries (119899 = 3) and the RSD werecalculated The amount recovered was within plusmn1 of theamount added which indicates that the method is accurateand also there is no interference due to excipients presentin topical formulation The results of recoveries for assay areshown in Table 4
335 Limit of Detection (LOD) and Quantification (LOQ)The LOD and LOQ were determined at a signal-to-noiseratio of 3 1 and 10 1 respectively by injecting a series ofdilute solutions with known concentrations The limit ofdetection and limit of quantification values of KOP and TINare reported in Table 3
ISRN Chromatography 5
AU
002040608
Minutes05 1 15 2 25 3 35 4 45 5 55 6
(a)
Kopt
rizon
-28
52
Tino
sorb
S-4
275
AU
002040608
Minutes05 1 15 2 25 3 35 4 45 5 55 6
(b)
Kopt
rizon
-28
5
Tino
sorb
S-4
273
AU
002040608
Minutes05 1 15 2 25 3 35 4 45 5 55 6
(c)
047
2
101
146
6
176
5
226
3
Kopt
rizon
-28
47
Tino
sorb
S-4
249
AU
002040608
Minutes05 1 15 2 25 3 35 4 45 5 55 6
(d)
043
1
145
7
188
6
Kopt
rizon
-28
56
Tino
sorb
S-4
28
002040608
Minutes05 1 15 2 25 3 35 4 45 5 55
AU
(e)
Figure 2 A typical chromatogram of (a) placebo (b) standard (c) sample (d) base degrdation sample and (e) peroxide degradation sample
336 Linearity Linearity was demonstrated from 50 to150 of standard concentration using minimum five cali-bration levels (50 75 100 125 and 150) for theKOP and TIN compounds which gave us a good confidenceon analytical method with respect to linear range Theresponse was found linear for all KOP and TIN from 50 to150 of standard concentration and correlation coefficientwas greater than 0999 Bias was also found within plusmn05The results of correlation coefficients 119884-intercept bias andlinearity equations for KOP and TIN are presented in Table 3
337 Robustness As defined by the ICH the robustness ofan analytical procedure describes its capability to remainunaffected by small and deliberate variations in methodparameters [33] The robustness as a measure of methodcapacity to remain unaffected by small but deliberate changesin chromatographic conditions was studies by testing influ-ence of small changes in flow rate (15 plusmn 02mLminminus1)change in column oven temperature (50 plusmn 5∘C) and changein mobile phase tetrahydrofuran composition (38 plusmn 5)No significant effect was observed on system suitability
6 ISRN Chromatography
Pareto chart
4078
3398
2719
2039
1359
68
0
1 2 3 4 5 6 7Rank
AB
C
Bonferroni limit 438176119905-value limit 257058
119905-v
alue
of|
effec
t|
(a)
Pareto chart
3803
3423
3042
2662
2282
1901
1521
1141
761
38
0
1 2 3 4 5 6 7Rank
AB
C
Bonferroni limit 438176119905-value limit 257058
119905-v
alue
of|
effec
t|
(b)
Bonferroni limit 438176
119905-value limit 257058
1 2 3 4 5 6 7
Pareto chartC
A B
Rank
0
365
73
1096
1461
119905-v
alue
of|
effec
t|
(c)
Figure 3 Pareto chart effect of factor (a) C gt A gt B in retention time of KPT (b) C gt B gt A in retention time of TIN (c) and C gt A gtB inplate count of KPT
Table 3 Method precision intermediate precision result LOD LOQ evaluations and linearity data for KPT and TIN
Parameter Koptrizon Tinosorb SPrecision Day-1repeatability (119899 = 6) 1013 plusmn 039 038 031 1002 plusmn 051 051 041( Assay plusmn SD RSD 95 CL)Intermediate precisionreproducibility (119899 = 6) 1002 plusmn 053 053 042 999 plusmn 029 029 024( Assay plusmn SD RSD 95 CL)LOD (120583gmLminus1) 0024 0048LOQ (120583gmLminus1) 008 016Linearity range (120583gmLminus1) 008ndash2258 016ndash2251Correlation coefficient 099999 099999Intercept (a) 210315 203208Slope (b) 27767747 13163737Bias at 100 response 0050 010295 CL 95 confidence interval
ISRN Chromatography 7
4
35
3
25
2
13 14 15 16 17
RT o
f Kop
triz
on
One factor
2
A flow
(a)
4
35
3
25
2
RT o
f Kop
triz
on
One factor
2
45 47 49 51 53 55
B column temperature
(b)
33 35 37 39 41 43
2
25
3
35
4
45
5
RT o
f Kop
triz
on
One factor
C THF composition
(c)
6
55
5
45
4
35
3
13 14 15 16 17
One factor
A flow
RT o
f Tin
osor
b S
(d)
6
55
5
45
4
35
3
45 47 49 51 53 55
RT o
f Tin
osor
b S
One factor
B column temperature
(e)
7
6
5
4
3
33 35 37 39 41 43
One factor
C THF composition
RT o
f Tin
osor
b S
(f)
4500
4000
3500
3000
2500
13 14 15 16 17
Kopt
rizon
pla
te co
unt
One factor
A flow
(g)
4500
4000
3500
3000
2500
45 47 49 51 53 55B column temperature
Kopt
rizon
pla
te co
unt
One factor
(h)
4500
4000
3500
3000
2500
33 35 37 39 41 43C THF composition
Kopt
rizon
pla
te co
unt
One factor
(i)
Figure 4 Single factor interaction (a) flow rate in RT of KPT (b) column temperature in KPT (c) THF composition in KPT (d) flow ratein RT of TIN (e) column temperature in RT of TIN (f) THF composition in RT of TIN (g) flow rate in USP plate count of KPT (h) columntemperature in USP plate count of KPT (i) THF composition in USP plate count KPT
parameters such as theoretical plates and tailing factor RSDof KOP and TIN was calculated from peak area count offive replicate injections when small but deliberate changeswere made to chromatographic conditions The results arepresented in Table 1 along with system suitability parametersof precision and intermediate precision study Thus themethod was found to be robust with respect to variability inprevious conditions
338 Experimental Design Approach Design Expert Soft-ware (Stat-Ease Inc Statistic made easy Minneapolis MNUSA version 700) was used for the experimental design
throughout this screening process study The full factorialdesign requires fewer measurements than the classical one-at-a-time experiment to give the same precision At thesame time it detects and estimates any interaction betweenthe factors In order to study the simultaneous variationof the factors on the considered responses a multivariateapproach using design of experiments is recommended inrobustness testing However if an analytical method is fastand requires the testing of a few factors (three or less) agood choice for robustness testing may be design expertwidely employed because of its high efficiency with respectto lesser number of runs required in full factorial mode In
8 ISRN Chromatography
5
4
3
2
5553
5149
4745 13
1415
1617RT
of K
optr
izon
B column temperature
A flow
(a)
5
3
12
4
5553
5149
4745 33
3537
3941
43
RT o
f Kop
triz
on
B column temperature C THF co
mposition
(b)
RT o
f Kop
triz
on
A flow
C THF co
mposition
12
4
6
3
5
1716
1514
13 3335
3739
4143
(c)
RT o
f Tin
osor
b S
A flow
B column temperature
24
68
1716
1514
13
5553
5149
4745
(d)
RT o
f Tin
osor
b S
C THF compositionB column temperature
2
4
6
8
3335
3739
414355
5351
4947
45
(e)
RT o
f Tin
osor
b S
C THF co
mposition
A flow
24
68
3335
3739
4143
1716
1514
13
(f)
Kopt
rizon
plat
e cou
nt
A flow
B column temperature
5000
4000
3000
2000
4749
5153
5517
16
15
14
13 45
(g)
Kopt
rizon
plat
e cou
nt
A flow
C THF composition
5000
4000
3000
2000
4341
3937
3533
17
16
15
14
13
(h)
Kopt
rizon
plat
e cou
nt
B column temperature C THF composition
5000
4000
3000
2000
4547
4951
5355
3335
3739
4143
(i)
Figure 5Three-dimensional plot of the fully factorial for predicted response RT of KPT plotted on 119910-axis as a function of factor (a) A (flowrate) and B (column temperature) fixed factor C ( tetrahydrofuran 380) (b) B (column temperature) and C ( tetrahydrofuran) fixedfactor A (flow rate 15mLminminus1) (c) A (flow rate) and C ( tetrahydrofuran) fixed factor B (column temperature 50∘C) RT of TIN plottedon 119910-axis as a function of factor (d) A (flow rate) and B (column temperature) fixed factor C ( tetrahydrofuran 380) (e) B (columntemperature) and C ( tetrahydrofuran) fixed factor A (flow rate 15mLminminus1) (f) A (flow rate) and C ( tetrahydrofuran) fixed factor B(column temperature 50∘C) Plate count of KPT plotted on 119910-axis as a function of factor (g) A (flow rate) and B (column temperature) fixedfactor C ( tetrahydrofuran 380) (h) A (flow rate) and C ( tetrahydrofuran) fixed factor B (column temperature 50∘C) (i) B (columntemperature) and C ( tetrahydrofuran) fixed factor A (flow rate 15mLminminus1)
order to study the three variables at two levels the designused in robustness testing of KOP and TIN retention timesand theoretical plate number for TIN was a 23 full factorialdesign ANOVA with linear model was applied to estimatethe model coefficients and also check the robustness of themethod Three factors and two levels caused full factorialdesign 23 in addition to that two centre points resultedtotal of ten experimental pointsmdashwhich were carried outin random order Effect of two factors in the resulting RTresponses of KPT TIN and plate count of KPT shown in
Pareto chart (Figure 3) Three factors were considered flowrate mLminminus1 (A) column temperature (B) and tetrahy-drofuran composition in mobile phase (C) The factorsand level considered (responses) for the study are shownin Table 5 Standards and sample of KOP and TIN wereprepared in assay concentration The critical retention timefor both KOP and TIN and also USP plate count for KOPpeak were studied as response All factors show negativeeffect in all three responses for one-factor-at-a-time response(Figure 4)
ISRN Chromatography 9
Overlay plot
A flow
B co
lum
n te
mpe
ratu
re55
53
49
51
47
4513 14 15 16 17
2
(a)
Overlay plot
A flow
C T
HF
com
posit
ion
13 14 15 16 17
43
41
39
37
35
33
2
(b)
Figure 6 Graphical plot of the fully factorial design space for (a) changing factors A (flow rate) and B (column temperature) fixed factor C( Tetrahydrofuran) (b) changing factors A (flow rate) and C ( Tetrahydrofuran) fixed factor B (column temperature)
Table 4 Accuracy results for Koptrizon and Tinosorb S (119899 = 3)
Activecomponents
Amount added(120583gmLminus1)
Amountrecovered(120583gmLminus1)
Recovery plusmn SD RSD
749 754 1007 plusmn 063 062KPT 1498 1530 1021 plusmn 049 048
2247 2204 981 plusmn 053 054756 755 990 plusmn 000 000
TIN 1512 1547 1023 plusmn 156 1522268 2227 982 plusmn 033 034
The ANOVA statistical test was employed to determinethe significant and most contributing factors where theywere ranked on the basis of degree of 119865 ratio The higherthe 119865 value corresponds with smaller ldquoProb gt 119865rdquo valuethe more significant are the resultant model and individualcoefficient Table 6 shows the reading of ANOVA analysiswhere 119865 value and 119875 value of the model were 7433 and00001 respectively demonstrating that the estimated modelfits the experimental data satisfactorily Also the 1198772 valuewas nearly close to 1 (099) which indicates that 99 ofthe data variability was successfully explained by the modelThis means that with slight change of temperature flow rateand tetrahydrofuran composition in mobile phase duringanalysis retention time (RT) of KPT will be affected Hencefrom this data generated by the model it can be explainedthat RT of KPT is decreasing with increasing in mobilephase flow rate column temperature and tetrahydrofurancomposition as shown in Figures 5(a) 5(b) and 5(c) Table 7shows the reading of ANOVA analysis where 119865-value and119875-value of the model were 63025 and 00001 respectivelydemonstrating that the estimated model fits satisfactorilywith the experimental data And also the 1198772 value wasnearly close to 1 (099) which indicates that 98 of the
data variability was successfully explained by the modelThis means that with slight change of temperature flowrate and tetrahydrofuran composition in mobile phaseduring analysis RT of TIN will be affected Hence fromthis data generated by the model it explained that RT ofTIN is decreasing with increasing in mobile phase flow ratecolumn temperature and tetrahydrofuran compositionas shown in Figures 5(d) 5(e) and 5(f) Table 8 shows thereading of ANOVA analysis where 119865-value and 119875-value ofthe model were 11187 and 00001 respectively showing thatthe estimated model fits the experimental data satisfactorilyAnd also the 1198772 value was nearly close to 1 (098) whichindicates that 99 of the data variability was successfullyexplained by themodelThismeans that with slight change oftemperature flow rate and tetrahydrofuran compositionin mobile phase during analysis the USP plate count ofKPT will be affected Hence from this data generated by themodel it explained that plate count of KPT is decreasing withincreasing in mobile phase flow rate column temperatureand tetrahydrofuran composition as shown in Figures 5(g)5(h) and 5(i)
339 Design Space DOE revolves around the concept ofthe design space the multidimensional combination andinteraction of input variables and process parameters thathave been demonstrated to provide assurance of qualityWorking within the design space is not considered as achange Movement out of the design space is considered tobe a change and would normally initiate a regulatory postap-proval change process Design space is proposed by the appli-cant and is subject to regulatory assessment and approval[34ndash36] Design space was established by employing fullfactorial design variables of flow rate (A) 13ndash17mLminminus1column temperature (B) 45ndash55∘C and tetrahydrofurancomposition in mobile phase (C) 33ndash43 and their respec-tive responses which are presented in Figure 6
10 ISRN Chromatography
Table 5 The range and levels of the variables in the 23 full factorial design
Std RunFactor 1 Factor 2 Factor 3 Response 1 Response 2 Response 3
A flow rate B column temp C THF comp RT of KPT RT of TIN Plate count of KPT(mLminminus1) (∘C) () (min) (min) (min)
0 2 15 50 38 28 43 34760 7 15 50 38 28 42 33467 1 13 55 43 22 32 28064 3 17 55 33 31 47 32002 4 17 45 33 39 60 41086 5 17 45 43 22 32 27678 6 17 55 43 18 26 22043 8 13 55 33 38 58 41145 9 13 45 43 28 41 33361 10 13 45 33 51 79 48040 2 15 50 38 28 43 3476
Table 6 ANOVA for 23 full factorial design response RT of Koptrizon (min)
Source Sum of squares df Mean square 119865 value 119875 value prob gt 119865Model 0073284126 3 0024428 7433259616 lt00001 Significant
Amdashflow 0008862903 1 0008863 2696911034 lt00001Bmdashcolumn temp 0009766119 1 0009766 2971752743 lt00001CmdashTHF comp 0054655104 1 0054655 1663111507 lt00001
Curvature 882574119864 minus 05 1 883119864 minus 05 268560136 01622 Not significantResidual 0000164316 5 329119864 minus 05
Lack of fit 0000164316 4 411119864 minus 05
Pure error 0 1 0Cor total 0073536699 9Std dev 0006488107 119877
2 0996565345Mean 0591672677 Adjusted 1198772 0994848018Values of prob gt 119865 less than 005 indicates that model is significant
3310 Stability of Sample Solution Stability of sample solu-tion was established by its storage at ambient temperaturefor 24 hrs The assays of KOP and TIN were analysed It wasfound that labelled amounts ofKOPat 0 12 and 24 hrswere1013 1007 and 1016 respectively and labelled amounts ofTIN were 1002 998 and 997 respectively
3311 Filter Compatibility Filter compatibility was per-formed for nylon 02 120583m syringe filter (Millipore) and PTFE02 120583m syringe filter (Millipore) To confirm the filter com-patibility in proposedmethod filtration recovery experimentwas carried out by sample filtration technique Samples werefiltered through both syringe filters and percentage assaywas determined and compared against centrifuged sampleSample solution did not show any significant change inassay percentage with respect to centrifuged sample It wasfound that labelled amounts of KPT at centrifuged sample022120583m nylon syringe filter and 022120583m PTFE syringe filterwere 1005 1003 and 998 respectively and for TIN were1002 1005 and 1005 In the result obtained difference in assay was not more than plusmn10 which indicates that bothsyringe filters have good compatibility with sample
4 Conclusion
The experimental design describes the key HPLC methodcomponents including column temperature mobile phaseflow rate and tetrahydrofuran composition in mobilephaseThe interrelationships are studied and the preliminaryoptimized conditions are obtained for each combinationHere a better understanding of the factors influencing chro-matographic separation and greater confidence in the abilityof the methods to meet their intended purposes is doneMoreover this approach ensures better design of productA gradient RP-HPLC method was successfully developedfor the estimation of KOP and TIN in topical dosageform The method validation results have proved that themethod is selective precise accurate linear robust filtercompatible and stability indicating The drug is stable inthermal and photolytic conditions and degrades in acidicbasic and oxidative conditions The method robustness wasdemonstrated using experimental design techniques takinginto consideration the selectivity of the RP HPLC methodThe short run time (60min) enables rapid determinationof drug Moreover it may be applied for determination
ISRN Chromatography 11
Table 7 ANOVA for 23 full factorial design response RT of Tinosorb S (min)
Source Sum of squares df Mean square 119865 value 119875 value Prob gt 119865Model 0057184881 3 0019061627 6302536737 lt00001 Significant
Amdashflow 0006317517 1 0006317517 2088823992 lt00001Bmdashcolumn temp 0007126362 1 0007126362 2356260641 lt00001CmdashTHF comp 0043741001 1 0043741001 1446252558 lt00001
Curvature 167021119864 minus 06 1 167021119864 minus 06 0055223918 08235 Not significantResidual 0000151222 5 302444119864 minus 05
Lack of fit 0000134936 4 337339119864 minus 05 2071326494 04746 Not significantPure error 162861119864 minus 05 1 162861119864 minus 05
Cor total 0057337773 9Std dev 0005047971 119877
2 0997333484Mean 0484279065 Adjusted 1198772 0996000226Values of prob gt 119865 less than 005 indicates that model is significant
Table 8 ANOVA for 23 full factorial design response Koptrizon plate count
Source Sum of squares df Mean square 119865 value 119875 value Prob gt 119865Model 5139776375 3 1713258792 1118731376 lt00001 Significant
Amdashflow 966745125 1 966745125 6312695487 00005Bmdashcolumn temp 905185125 1 905185125 591071825 00006CmdashTHF comp 3267846125 1 3267846125 2133852755 lt00001
Curvature 65025 1 65025 0004246031 09506 Not significantResidual 765715 5 153143Lack of fit 681215 4 17030375 2015428994 04800 Not significantPure error 8450 1 8450Cor total 52164129 9Std dev 1130166101 119877
2 0985308578Mean 34161 Adjusted 1198772 0977962866Values of prob gt 119865 less than 005 indicates that model is significant
of KOP and TIN in the study of content uniformity tubehomogeneity and in vitro release test profiling of KOP andTIN topical dosage forms where sample load is higher andhigh throughput is essential for faster delivery of results
Conflict of Interests
The authors of the paper declare that there is no directfinancial relation with the commercial identities mentionedin the paper that might lead to a conflict of interests
Acknowledgments
Theauthorswould like to thankMsDr Reddyrsquos LaboratoriesLtd for supporting this work The authorsrsquo Intellectual Prop-erty Management (IPM) department has given this paperinternal publication no PUB00228-13
References
[1] A Chisvert M C Pascaul-Marti and A Salvador ldquoDetermi-nation of the UV filters worldwideauthorized in sunscreens byHPLC Use of cyclodextrins as mobile phase modifierrdquo Journalof Chromatography A vol 921 no 2 pp 207ndash215 2001
[2] C Couteau A Faure J Fortin E Paparis and L J M CoiffardldquoStudy of the photostability of 18 sunscreens in creams bymeasuring the SPF in vitrordquo Journal of Pharmaceutical andBiomedical Analysis vol 44 no 1 pp 270ndash273 2007
[3] A Salvador and A Chisvert ldquoSunscreen analysis a criticalsurvey on UV filters determinationrdquo Analytica Chimica Actavol 537 no 1-2 pp 1ndash14 2005
[4] B A Gilchrest N A Soter J L Hawk et al ldquoHistologicalchanges associated with ultraviolet A-induced erythema innormal human skinrdquo Journal of the American Academy ofDermatology vol 9 no 2 pp 213ndash219 1983
[5] T Takeuchi J Uitto and E F Bernstein ldquoA novel in vivo modelfor evaluating agents that protect against ultraviolet A-inducedphotoagingrdquo Journal of Investigative Dermatology vol 110 no4 pp 343ndash347 1998
[6] J M Menter A M Patta R M Sayre J Dowdy and I WillisldquoEffect of UV irradiation on type I collagen fibril formation inneutral collagen solutionsrdquo Photodermatology Photoimmunol-ogy and Photomedicine vol 17 no 3 pp 114ndash120 2001
[7] 2010 httpwwwwhointuvsun protectionen[8] A Rampaul I P Parkin and L P Cramer ldquoDamaging and
protective properties of inorganic components of sunscreensapplied to cultured human skin cellsrdquo Journal of Photochemistryand Photobiology A vol 191 no 2-3 pp 138ndash148 2007
12 ISRN Chromatography
[9] L M Peruchi and S Rath ldquoDevelopment and application of aHPLC method for eight sunscreen agents in suncare productsrdquoInternational Journal of Cosmetic Science vol 34 no 1 pp 226ndash233 2012
[10] J Flor M R Davolos andM A Correa ldquoSunscreensrdquoQuimicaNova vol 30 no 1 pp 153ndash158 2007
[11] H M Chawla and S Mrig ldquoSimultaneous quantitative estima-tion of oxybenzone and 2-ethylhexyl-4- methoxycinnamate insunscreen formulations by second order derivative spectropho-tometryrdquo Journal of Analytical Chemistry vol 64 no 6 pp 585ndash592 2009
[12] E Westgate and J Sherma ldquoDetermination of the sunscreenoxybenzone in lotions by reversed-phase HPTLCwith ultravio-let absorption densitometryrdquo Journal of Liquid Chromatographyand Related Technologies vol 23 no 4 pp 609ndash615 2000
[13] AW Sobanska and E Brzezinska ldquoNormal-phase TLC analysisof UV filters avobenzone and octocrylene in sunscreen prepa-rationsrdquo Journal of Planar Chromatography vol 24 no 2 pp154ndash159 2011
[14] K Ikeda S Suzuki and Y Watanabe ldquoDetermination ofsunscreen agents in cosmetic products by reversed-phase high-performance liquid chromatographyrdquo Journal of Chromatogra-phy vol 513 pp 321ndash326 1990
[15] L Dencausse A Galland J L Clamou and J Basso ldquoValidationofHPLCmethod for quantitative determination of TinosorbSand three other sunscreens in a high protection cosmeticproductrdquo International Journal of Cosmetic Science vol 30 no5 pp 373ndash382 2008
[16] A Salvador and A Chisvert ldquoAn environmentally friendly(ldquogreenrdquo) reversed-phase liquid chromatography method forUV filters determination in cosmeticsrdquoAnalytica Chimica Actavol 537 no 1-2 pp 15ndash24 2005
[17] E R M Kedor-Hackmann M L De Lourdes Perez GonzalezA K Singh and M I R M Santoro ldquoValidation of a HPLCmethod for simultaneous determination of five sunscreens inlotion preparationrdquo International Journal of Cosmetic Sciencevol 28 no 3 pp 219ndash224 2006
[18] S Scalia ldquoDetermination of sunscreen agents in cosmetic prod-ucts by supercritical fluid extraction and high-performanceliquid chromatographyrdquo Journal of Chromatography A vol 870no 1-2 pp 199ndash205 2000
[19] S Simeoni R Tursilli A Bianchi and S Scalia ldquoAssayof common sunscreen agents in suncare products by high-performance liquid chromatography on a cyanopropyl-bondedsilica columnrdquo Journal of Pharmaceutical and Biomedical Anal-ysis vol 38 no 2 pp 250ndash255 2005
[20] M Nyeborg M Pissavini Y Lemasson and O Doucet ldquoVali-dation of HPLC method for the simultaneous and quantitativedetermination of 12 UV-filters in cosmeticsrdquo InternationalJournal of Cosmetic Science vol 32 no 1 pp 47ndash53 2010
[21] M Wharton M Geary N OrsquoConnor and B Murphy ldquoA rapidHigh Performance Liquid Chromatographic (HPLC) methodfor the simultaneous determination of seven UV filters foundin sunscreen and cosmeticsrdquo International Journal of CosmeticScience vol 33 no 2 pp 164ndash170 2011
[22] F M P Vilela Y M Fonseca F T M C Vicentini M J VFonseca and M D P H Do Amaral ldquoDetermination of threeultraviolet filters in sunscreen formulations and from skin pen-etration studies by high-performance liquid chromatographyrdquoQuimica Nova vol 34 no 5 pp 879ndash883 2011
[23] A W Sobanska and J Pyzowski ldquoQuantification of sunscreenethylhexyl triazone in topical skin-care products by normal-phase TLCdensitometryrdquo Scientific World Journal vol 2012Article ID 807516 6 pages 2012
[24] G Potard C Laugel H Schaefer and J P Marty ldquoThe strippingtechnique in vitro absorption and penetration of five UV filterson excised fresh human skinrdquo Skin Pharmacology and AppliedSkin Physiology vol 13 no 6 pp 336ndash344 2000
[25] G Potard C Laugel A Baillet H Schaefer and J P MartyldquoQuantitative HPLC analysis of sunscreens and caffeine duringin vitro percutaneous penetration studiesrdquo International Journalof Pharmaceutics vol 189 no 2 pp 249ndash260 1999
[26] M D Bleasel and S Aldous ldquoIn vitro evaluation of sunprotection factors of sunscreen agents using a novel UV spec-trophotometric techniquerdquo International Journal of CosmeticScience vol 30 no 4 pp 259ndash270 2008
[27] Uvinul grades UV absorbers for cosmetic products BASFtechnical information
[28] G Vielhaber S Grether-Beck O Koch W Johncock andJ Krutmann ldquoSunscreens with an absorption maximum ofge360 nm provide optimal protection against UVA1-inducedexpression of matrix metalloproteinase-1 interleukin-1 andinterleukin-6 in human dermal fibroblastsrdquo Photochemical andPhotobiological Sciences vol 5 no 3 pp 275ndash282 2006
[29] E Chatelain and B Gabard ldquoPhotostabilization of butyl me-thoxydibenzoylmethane (Avobenzone) and Ethylhexyl me-thoxycinnamate by bis-ethylhexyloxyphenol methoxyphenyltriazine (Tinosorb S) a new UV broadband filterrdquo Photochemi-cal and Photobioogical Sciences vol 74 no 3 pp 401ndash406 2001
[30] httpwwwcibacomtinosorb-s brochurepdf[31] C Couteau M Pommier E Paparis and L J M Coiffard
ldquoStudy of the efficacy of 18 sun filters authorized in EuropeanUnion tested in vitrordquo Pharmazie vol 62 no 6 pp 449ndash4522007
[32] ICH Q1A (R2) ldquoStability Testing of new Drug Substances andProductsrdquo in Proceedings of the International Conference onHarmonization 2003
[33] ICH Q2 (R1) ldquoValidation of analytical procedures text andmethodologyrdquo in Proceedings of the International Conference onHarmonization 2005
[34] J Peterson ldquoStatistical Analysis QbD Classics What Your ICHQ8 Design Space Needsrdquo Pharma Qbd 2010
[35] U Smith ldquoOptimizing Design of Experiments for Fluid BedCoatingrdquo Pharma Qbd 2010
[36] M Anderson ldquoDesign space Framing a QbD Design Spacewith Tolerance Intervalsrdquo Pharma Qbd 2012
Submit your manuscripts athttpwwwhindawicom
Hindawi Publishing Corporationhttpwwwhindawicom Volume 2014
Inorganic ChemistryInternational Journal of
Hindawi Publishing Corporation httpwwwhindawicom Volume 2014
International Journal ofPhotoenergy
Hindawi Publishing Corporationhttpwwwhindawicom Volume 2014
Carbohydrate Chemistry
International Journal of
Hindawi Publishing Corporationhttpwwwhindawicom Volume 2014
Journal of
Chemistry
Hindawi Publishing Corporationhttpwwwhindawicom Volume 2014
Advances in
Physical Chemistry
Hindawi Publishing Corporationhttpwwwhindawicom
Analytical Methods in Chemistry
Journal of
Volume 2014
Bioinorganic Chemistry and ApplicationsHindawi Publishing Corporationhttpwwwhindawicom Volume 2014
SpectroscopyInternational Journal of
Hindawi Publishing Corporationhttpwwwhindawicom Volume 2014
The Scientific World JournalHindawi Publishing Corporation httpwwwhindawicom Volume 2014
Medicinal ChemistryInternational Journal of
Hindawi Publishing Corporationhttpwwwhindawicom Volume 2014
Chromatography Research International
Hindawi Publishing Corporationhttpwwwhindawicom Volume 2014
Applied ChemistryJournal of
Hindawi Publishing Corporationhttpwwwhindawicom Volume 2014
Hindawi Publishing Corporationhttpwwwhindawicom Volume 2014
Theoretical ChemistryJournal of
Hindawi Publishing Corporationhttpwwwhindawicom Volume 2014
Journal of
Spectroscopy
Analytical ChemistryInternational Journal of
Hindawi Publishing Corporationhttpwwwhindawicom Volume 2014
Journal of
Hindawi Publishing Corporationhttpwwwhindawicom Volume 2014
Quantum Chemistry
Hindawi Publishing Corporationhttpwwwhindawicom Volume 2014
Organic Chemistry International
ElectrochemistryInternational Journal of
Hindawi Publishing Corporation httpwwwhindawicom Volume 2014
Hindawi Publishing Corporationhttpwwwhindawicom Volume 2014
CatalystsJournal of
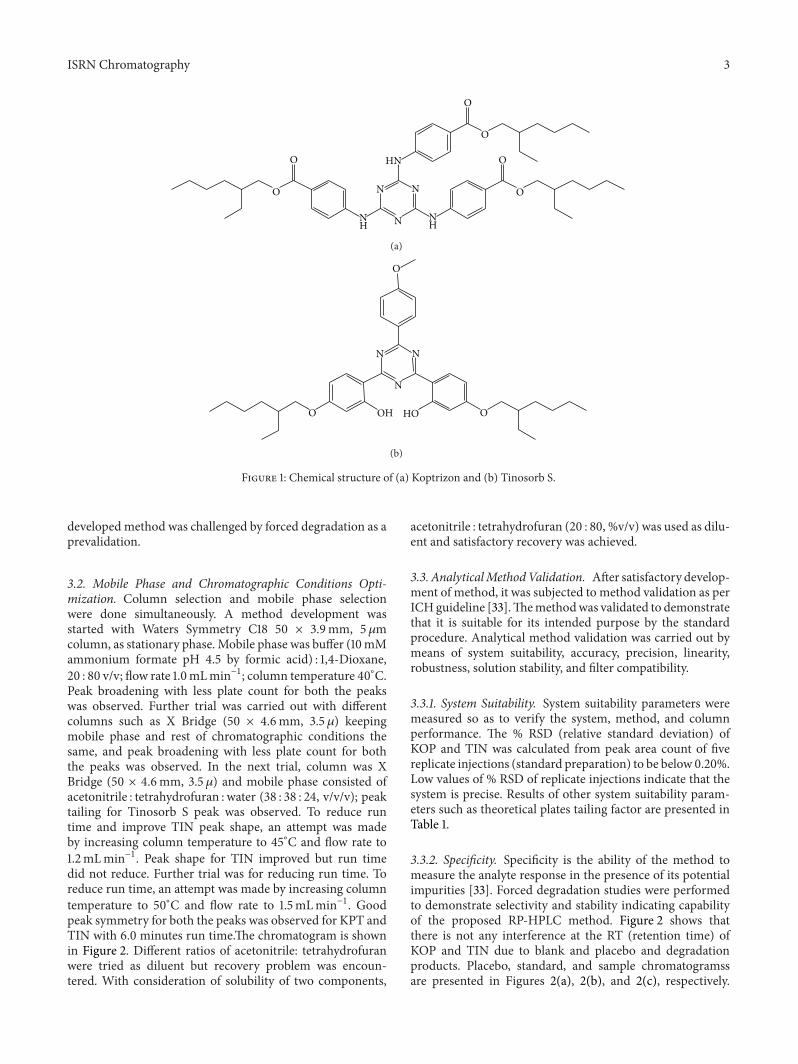
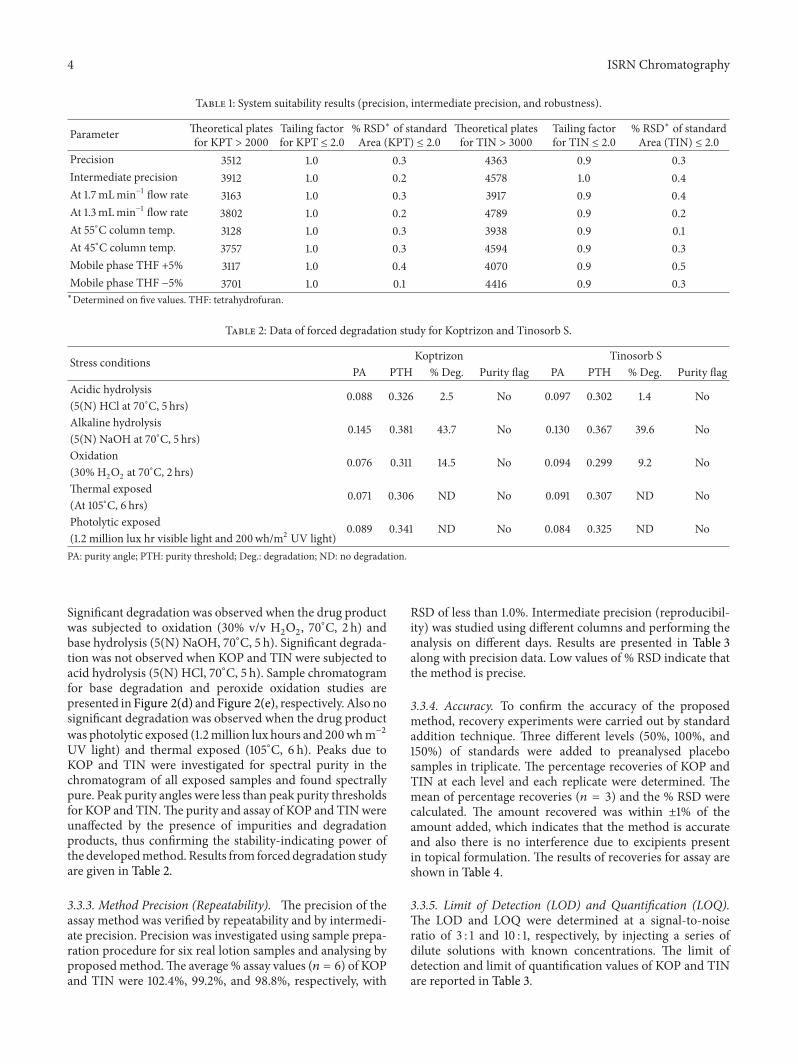
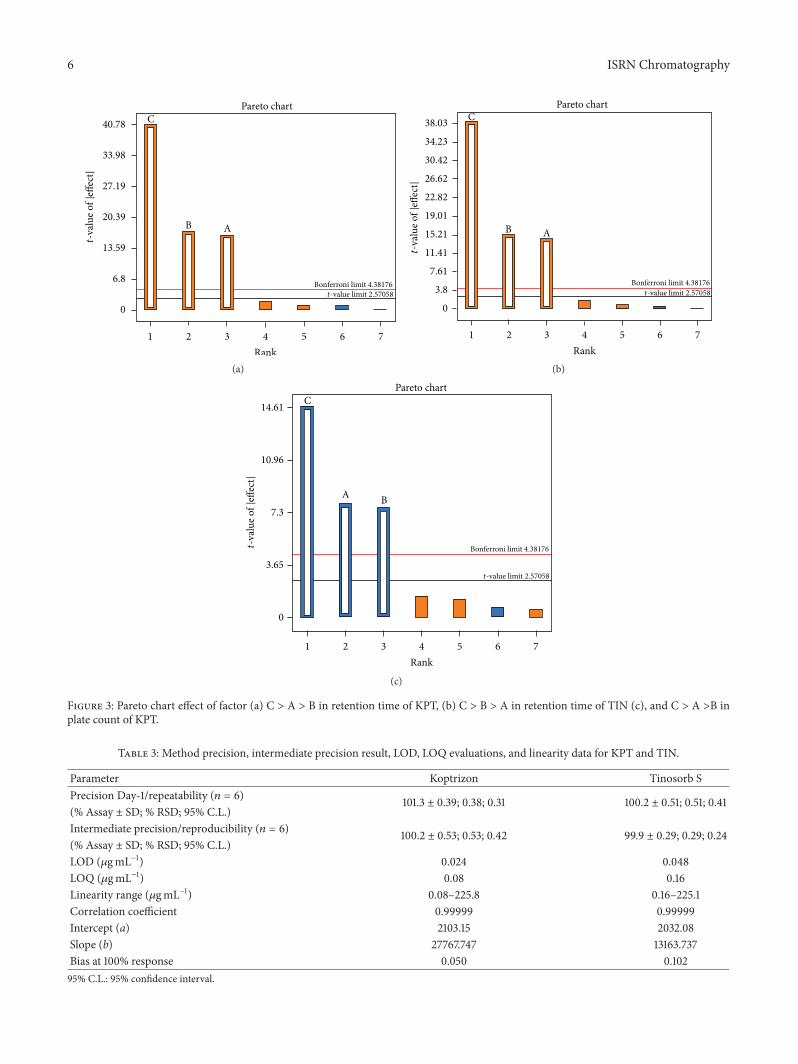
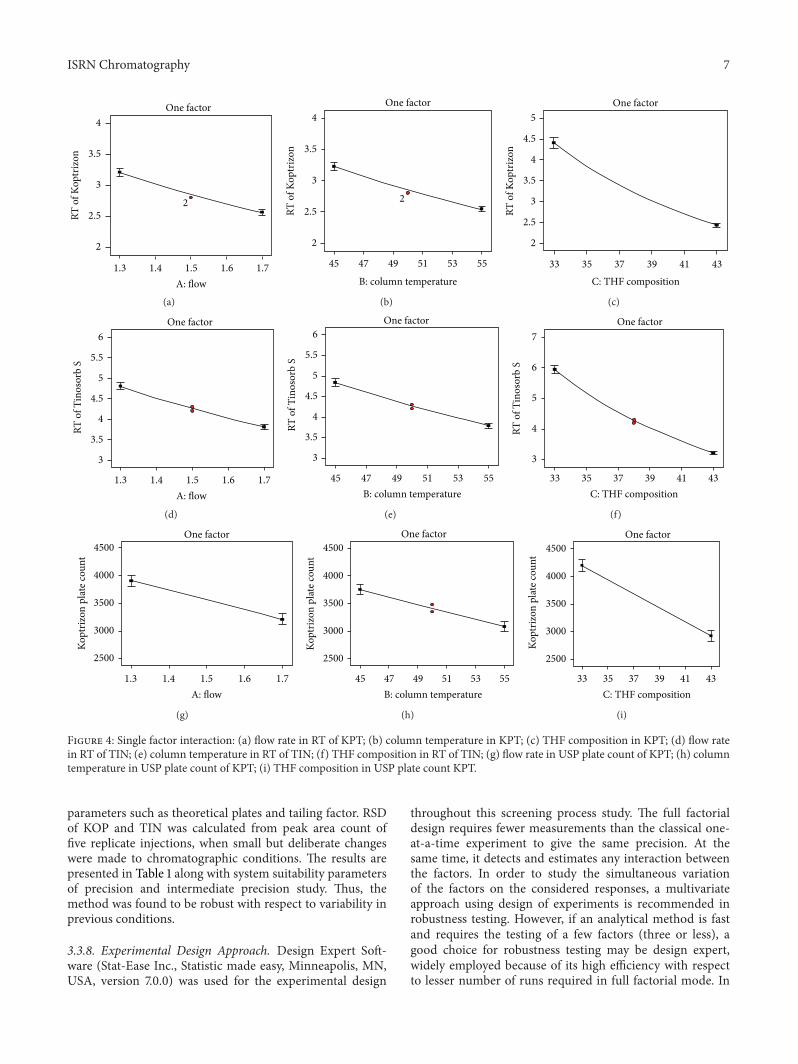
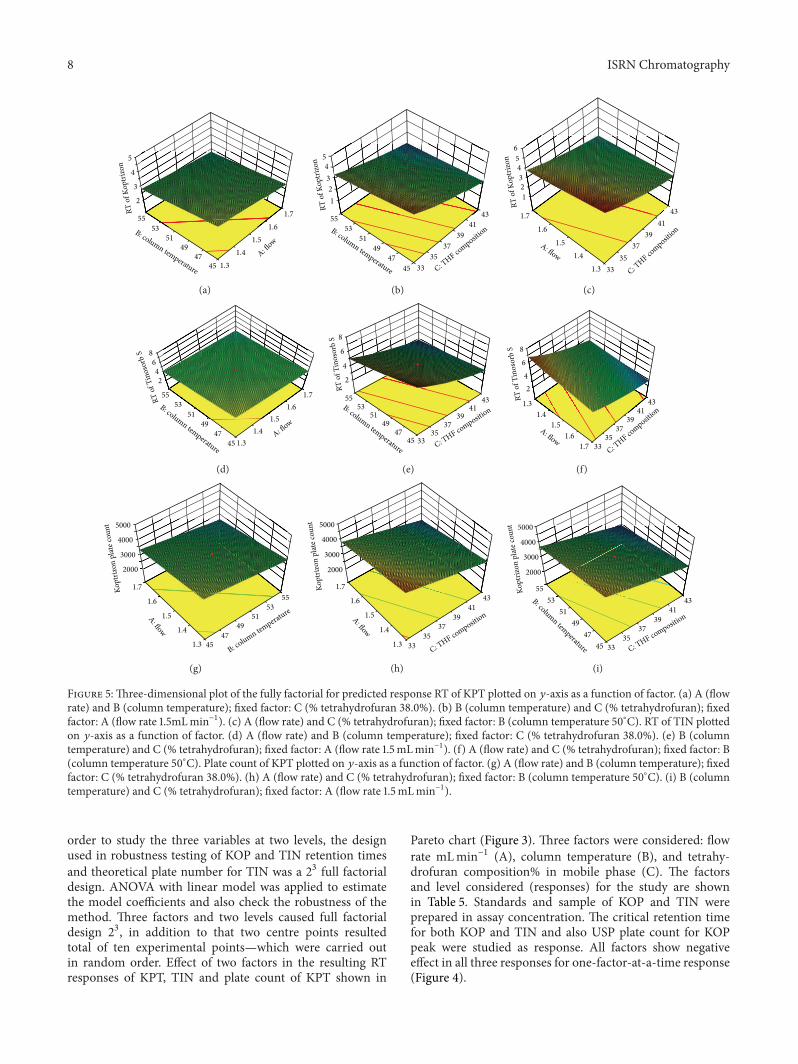
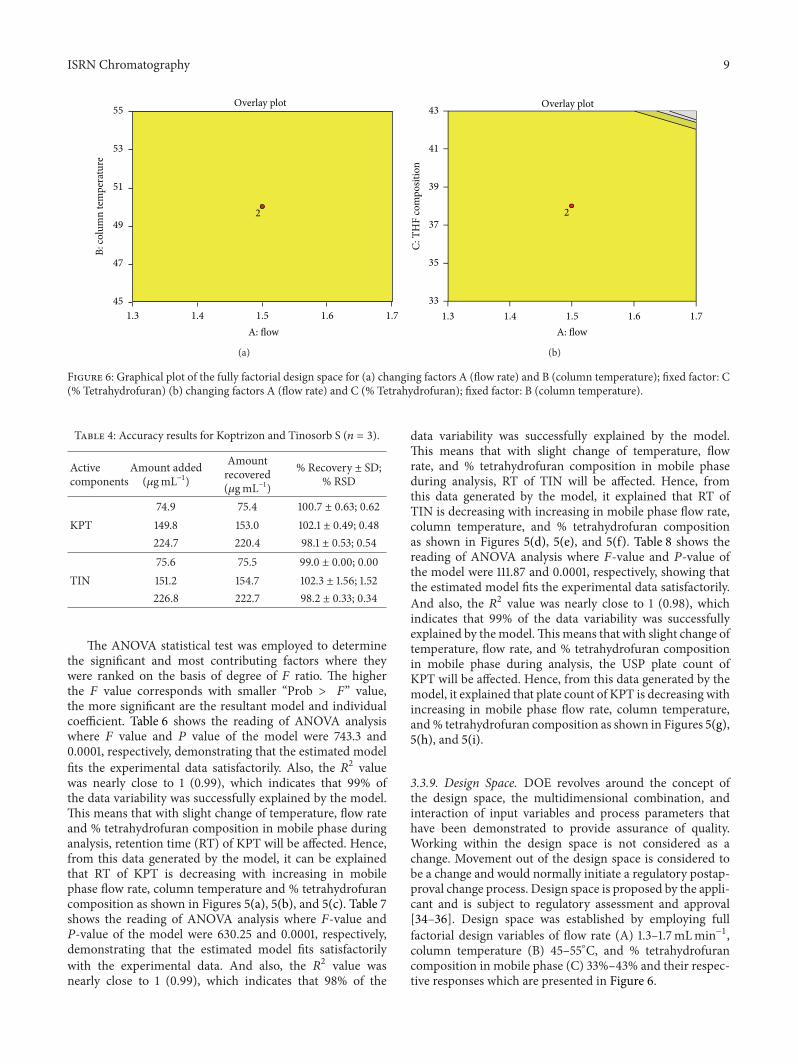
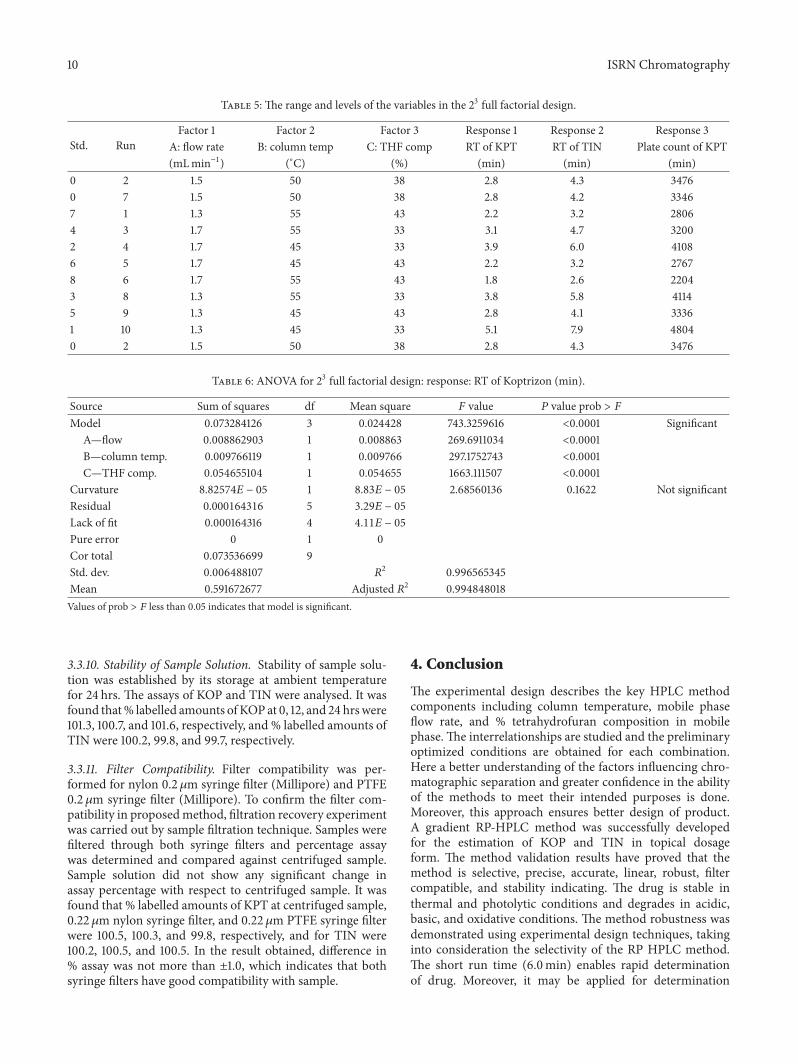
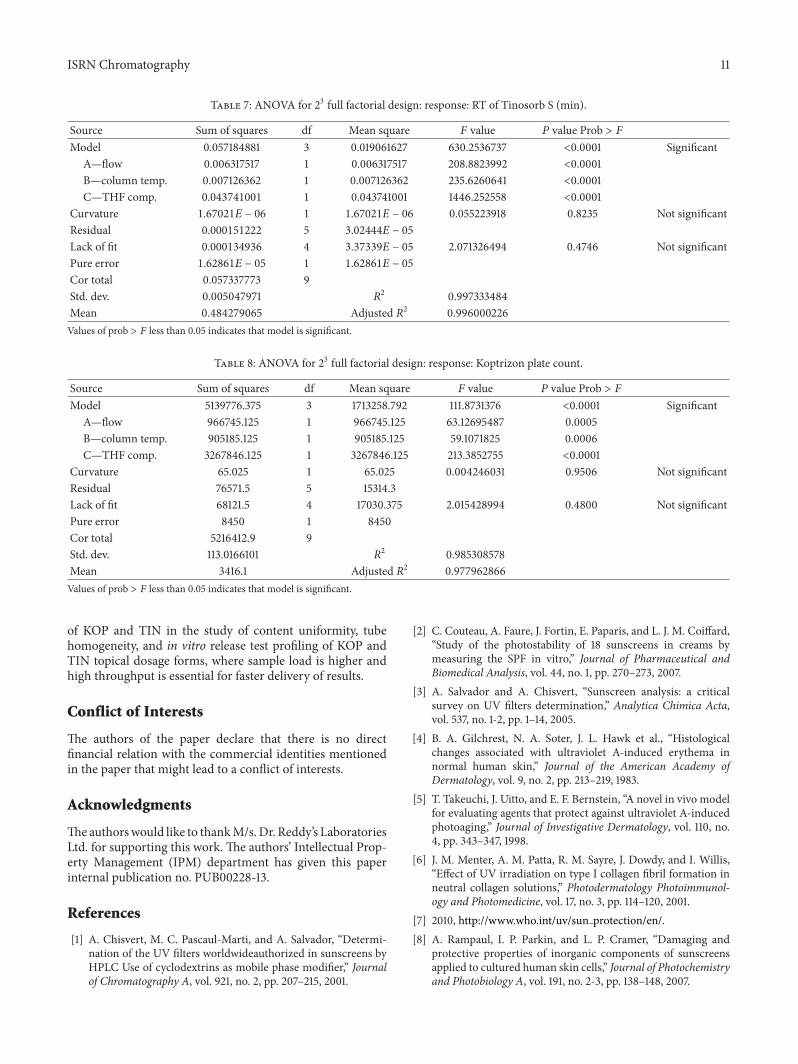