Embed Size (px)
Citation preview
eJIFCC2017Vol28No2pp142-155Page 142
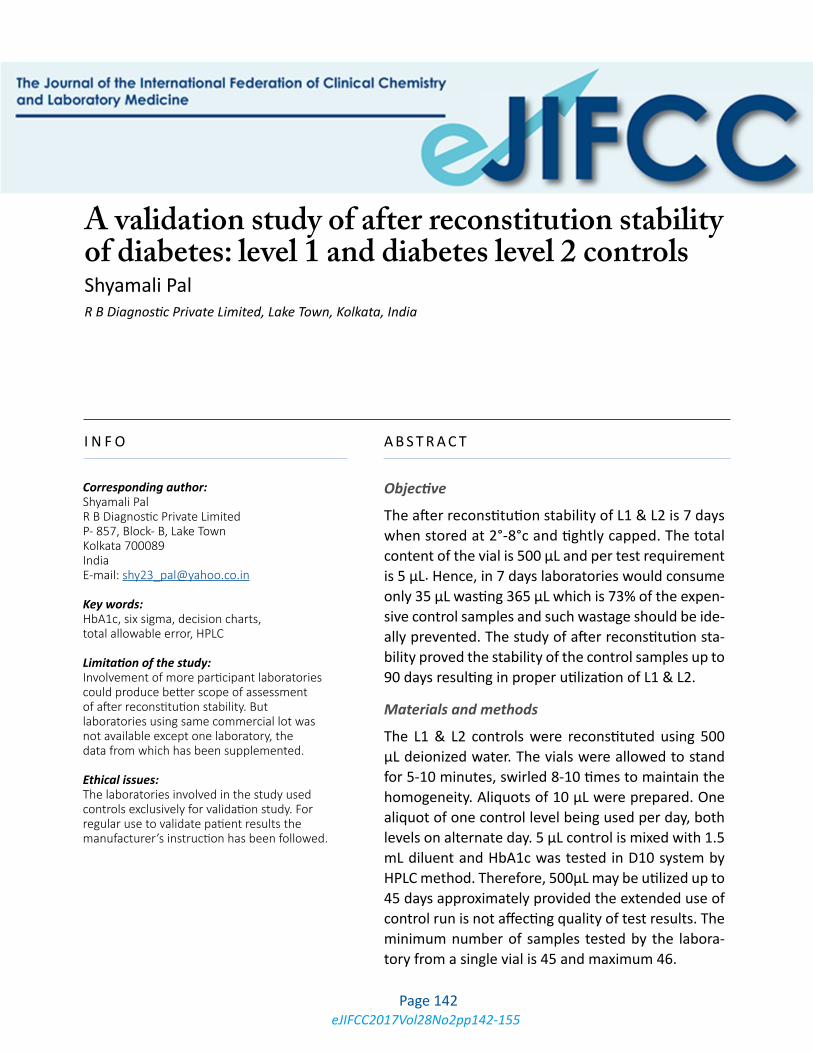
A validation study of after reconstitution stability of diabetes: level 1 and diabetes level 2 controlsShyamali PalR B Diagnostic Private Limited, Lake Town, Kolkata, India
I N F O A B S T R A C T
Objective
The after reconstitution stability of L1 & L2 is 7 days when stored at 2°-8°c and tightly capped. The total content of the vial is 500 µL and per test requirement is 5 µL. Hence, in 7 days laboratories would consume only 35 µL wasting 365 µL which is 73% of the expen-sive control samples and such wastage should be ide-ally prevented. The study of after reconstitution sta-bility proved the stability of the control samples up to 90 days resulting in proper utilization of L1 & L2.
Materials and methods
The L1 & L2 controls were reconstituted using 500 µL deionized water. The vials were allowed to stand for 5-10 minutes, swirled 8-10 times to maintain the homogeneity. Aliquots of 10 µL were prepared. One aliquot of one control level being used per day, both levels on alternate day. 5 µL control is mixed with 1.5 mL diluent and HbA1c was tested in D10 system by HPLC method. Therefore, 500µL may be utilized up to 45 days approximately provided the extended use of control run is not affecting quality of test results. The minimum number of samples tested by the labora-tory from a single vial is 45 and maximum 46.
Corresponding author:Shyamali PalR B Diagnostic Private LimitedP- 857, Block- B, Lake TownKolkata 700089IndiaE-mail: [email protected]
Key words:HbA1c, six sigma, decision charts, total allowable error, HPLC
Limitation of the study: Involvement of more participant laboratories could produce better scope of assessment of after reconstitution stability. But laboratories using same commercial lot was not available except one laboratory, the data from which has been supplemented.
Ethical issues: The laboratories involved in the study used controls exclusively for validation study. For regular use to validate patient results the manufacturer’s instruction has been followed.

eJIFCC2017Vol28No2pp142-155Page 143
Shyamali PalA validation study of after reconstitution stability of diabetes
Results
Three lots were tested of which one lot has been tested in two laboratories. Mean, SD, CV%, TAE, %Bias, z-score and sigma calculations were done. The medical method decision charts were created for all lots based upon normalized operational specifications which showed excel-lent precision in both control levels. Number of rejections in the study was nil.
Conclusion
The extended use of controls is validated.
Abbreviations (in alphabetical order)
L1: Lyphochek Diabetic control level 1L2: Lyphochek Diabetic control level 2HbA1c: Glycosylated HemoglobinHPLC: High Performance Liquid ChromatographyTAE: Total Allowable Error
INTRODUCTION
The IUPAC technical committee recommended validation study in a single laboratory provided the study is appropriate to the fitness of pur-pose and the validated document is continually verified (1). The recommendation suggested to estimate measurement trueness, recovery and linearity. In the present study, the valida-tion of stability of reconstituted analyte was in question. So, the number of rejections, CV% as an indicator of measurement trueness, %bias and z-score are the parameters to be estimated (2). As the values of the analyte have been pro-vided in the manufacturers insert so TAE may be obtained from the same. In 1974, Westgard, Carey and Wold introduced the concept of TAE to provide a quantitative approach for judging the acceptability of method performance (2)
and on 2009, Clinical and Laboratory Standards Institute (CLSI) published the TAE of all clini-cal chemistry analytes (3). It has been recom-mended to use the CLSI table for TEA or to use 95% confidence interval of the limit of possible analytic error whichever is appropriate/less (4). If the result of reconstituted sample remains within the range provided by manufacturer ap-parently it may be said that the after reconsti-tution period may be extended. To validate the extended stability after reconstitution, Sigma should to be calculated and approved finally from medical method decision chart (5, 6). The medical method decision chart is based on sig-ma calculations and operating point ≥ 5 sigma is the marker of excellence of performance.
MATERIALS AND METHODS
Lyphochek Bilevel Diabetes Controls (L1 &L2) were reconstituted using 0.5 ml deionized wa-ter. Calibrated auto pipette was used for recon-stitution. The stopper was replaced and the control samples were allowed to stand for 5-10 minutes. The vials were gently swirled 8-10 times before preservation in aliquots to main-tain homogeneity. 10 µL reconstituted controls were kept in each aliquot. The aliquots were preserved at 2°C-8°C (7). One aliquot was taken out every day and 5 µL of reconstituted sample was mixed in 1.5 mL diluent. The aliquot was brought to room temperature and swirled be-fore mixing with diluent. The L1 & L2 aliquots were used on alternate day. Hence approxi-mately 45 aliquots of one level control would be consumed in 90 days. Three vials of Lot num-bers 33870, 33890 and 33920 were tested for 90 days generating 135 numbers L1 & L2 data i.e., 135 number results generated per level per lot. Lot 33920 have been tested in two differ-ent laboratories (incidentally common lot was supplied) hence 135 number data of both levels could have been accumulated from two labora-tories. Both level control samples of same lot

eJIFCC2017Vol28No2pp142-155Page 144
Shyamali PalA validation study of after reconstitution stability of diabetes
were reconstituted and aliquoted on the same day and time. HbA1c was measured in BIORAD D10 system by Ion Exchange HPLC method. As the objective was to establish after reconstitu-tion stability of control samples hence method and mode needed to be user specific and wide-ly accepted.
STATISTICAL CALCULATIONS
Statistical calculations were as per the guideline of Westgard et al (4). Mean, SD, CV%, %Bias of every lot have been calculated. Bias is the dif-ference of laboratory mean and Peer group mean. The manufacturer’s mean of Lot 33870 were 5.4% (L1), 9.9 % (L2). The peer mean were 5.38% and 9.79%. The manufacturer’s mean for lot 33890 were 5.3% and 9.8%. Peer mean were 5.48 & 9.79. The manufacturer’s mean for 33920 were 5.4 & 9.8 and peer mean were 5.42% and 9.84% respectively. Peer means were used for statistical calculations as per CLSI guideline and Westgard’s rule. TAE is the percentage of total allowable deviation range. The ratio of manufacturer’s allowable deviation
and manufacturer’s target mean is expressed in % (8). When TAE is more than 20% as per CLSI guideline 20% has been considered as optimum TAE (4). From TAE, %Bias and CV% Sigma is cal-culated (TAE-%Bias/CV%). Method decision charts were plotted on the basis of calculations from Westgard Website.
RESULTS AND DISCUSSION
The after reconstitution stability was tested in three consecutive lots 33870, 33890 & 33920. The bias was calculated considering peer mean as target mean. As per Multi QC rule ± 3SD would be considered as acceptable allowable error (TAE) keeping the option of one day 2-3SD result in the warning range when the laboratory uses its own laboratory mean [8]. In lot 33870 calculated TAE (from peer mean and SD) of L1 was 20.9 and in 33920 both level values were 28.5 and 20. But as per CLSI guideline optimum TAE should be 20% [Table 1]. So, instead 20.9 & 28.5 the TAE was considered to be 20. No result was found to have exceeded ± 2SD. Hence num-ber of rejection/warning range result in three
Table 1 HbA1c Peer results of lots 33870, 33890, 33920
Control Lot
number
Target (%) Peer SDRange
(±3SDX2)
TAE (%)= Range x 100/
Peer mean
Level Peer Insert Peer Insert Peer Insert Peer Insert
L1 33870 5.38 5.4 0.184 0.2 1.104 1.2 20.0 22.22
L2 33870 9.79 9.9 0.257 0.4 1.542 2.4 15.6 24.24
L1 33890 5.48 5.3 0.166 0.2 0.996 1.2 18.2 22.64
L2 33890 9.87 9.8 0.245 0.4 1.47 2.4 14.9 24.5
L1 33920 5.42 5.4 0.184 0.2 1.104 1.2 20.0 22.22
L2 33920 9.84 9.8 0.328 0.4 1.968 2.4 20.0 24.5

eJIFCC2017Vol28No2pp142-155Page 145
Shyamali PalA validation study of after reconstitution stability of diabetes
lots was zero. The peer mean & SD were con-sidered for TAE calculation as they are narrower than manufacturer’s range (Insert value), based on statistical calculation of worldwide results and system and method specific.
Two lot results showed intra laboratory preci-sion findings. After reconstitution stability of Lot 33870 & 33890 were tested using two L1 & two L2 vials for 90 & 92 days. One aliquot tested on alternated day so 45 aliquots consumed within 90 days and 46 consumed by 92 days. The sigma values were 8.0, 6.3 & 7.3, 5.9 [Tables 2 & 3].
Z-Score calculation is recommended for accu-racy check of internal quality control [9] and in both lots both level z-score are within ± 2 [Tables 2 & 3].
The inter performance testing of one lot has been done in two laboratories with lot no. 33920. Both laboratory tested 3 vials of L1 & L2 for 90 days obtaining total 270 results [Tables 4 & 5]. The sigma values were above 6 and z-scores within limit. The sigma and z-score of all three lots satis-fies the criteria of standard performance.
NMean
HbA1c (%)
SD CV%
Deviation from peer mean
%Bias
Tests pervial
Sigma z-scoreAllow-ablebias*
Allow-able
impre-cision*
Criticalerror*
182 5.47 0.127 2.32 0.09 1.67 45+46 8.0 0.49 8.3 11.6 -0.641
+46+45
182 9.52 0.191 2.01 -0.27 2.96 45+46 6.3 -1.13 19 13 -1.911
+46+45
Table 2 Statistical evaluation of HbA1c values of Lot 33870
*Allowable Bias- Normal Operational Specifications along Y-axis. Calculated as: %Bias*100/TAE (%)*Allowable Imprecision- Normal Operational Specifications along X-axis. Calculated as: CV%*100/TAE (%)N- Number of tests performed Critical error – Calculations obtained from “Quality Control Grid Calculator”. Critical error < ±2.0 shows excellent performance
NMean
HbA1c (%)
SD CV%
Deviation from peer mean
%Bias
Tests pervial
Sigma z-scoreAllow-ablebias*
Allow-able
impre-cision*
Criticalerror*
180 5.56 0.127 2.285 0.08 1.46 45+45 7.3 0.48 8 12.5 -0.834
+45+45
183 9.67 0.262 2.2 -0.20 2.02 46+46 5.9 -0.82 13.6 14.7 -1.337
+45+46
Table 3 Statistical evaluation of Lot 33890

eJIFCC2017Vol28No2pp142-155Page 146
Shyamali PalA validation study of after reconstitution stability of diabetes
The use of normalized operation specification chart (NOPSPECs) is being done from the early 1990s. The chart describes the operational lim-its for imprecision and inaccuracy with respect to a desired level of quality assurance for the particular analyte [10]. The chart is the medical decision chart to select a QC procedure (11, 12). The idea of the medical decision chart is to ex-press the values on the X and Y axis as % of TAE. The X-axis is plotted as imprecisionmeasure% TAE i.e., percentage of allowable imprecision and Y axis Bias measure% TAE or percentage of allowable bias of the method to be validated (Charts 1-8). The charts may be downloaded from Westgards website. Sigma would be automatically calcu-lated from the input of TAE (%), CV% & % Bias.
The medical decision chart is based on CLSI guideline by Westgard et al where maximum allowable bias is 20% and CV is 10% resulting 2 sigma. Considering allowable Bias measure%TAE 20 the colour codes in the charts showed the less the imprecision (CV %) the higher is the sigma value (2-6, colour codes red –green). The method is validated if sigma is ≥4, good if sigma is ≥5, excellent when sigma is ≥ 6. The sigma op-erating points below 6 are beyond the level of excellence as above 6 sigma no grade has been prescribed yet. Calculations were described be-low Table 2 and followed for all three lots. The operational specification chart for both con-trols in 3 groups were evaluated (Tables 1-5, Charts 1-8). Analytical accuracy for all the assay
Table 4 Statistical evaluation of Lot 33920 (Laboratory 1)
NMean
HbA1c (%)
SD CV%
Deviation from peer mean
%Bias
Tests pervial
Sigma z-scoreAllow-ablebias*
Allow-able
impre-cision*
Criticalerror*
135 5.49 0.17 2.5 0.07 1.3 45+45 7.5 0.27 6.5 12.5 -0.569
+45
135 9.97 0.203 2.04 0.13 1.32 45+45 9.2 0.39 6.6 10.2 -0.336
+45
Table 5 Statistical evaluation of Lot 33920 (Laboratory 2)
NMean
HbA1c (%)
SD CV%
Deviation from peer mean
%Bias
Tests pervial
Sigma z-scoreAllow-ablebias*
Allow-able
impre-cision*
Criticalerror*
135 5.55 0.23 2.2 0.13 2.4 45+45 8.0 0.5 12 11 -0.923
+45
135 10.18 0.206 2.02 0.34 3.45 45+45 8.2 1.03 17.2 10.1 -1.37
+45

eJIFCC2017Vol28No2pp142-155Page 147
Shyamali PalA validation study of after reconstitution stability of diabetes
performance are within optimum excellence decision range (Charts 1-8). Hence, the diabetic controls may be used for 3 months instead of 7 days after reconstitution.
As per the QC calculator rule critical error up to 2 indicates excellent precision. In the present study, the critical errors of all the lots are < ± 2. The stability of the reconstituted control have satisfactorily passed both operating points and critical error criteria. So, the utilization of diabet-ic controls up to 90 days is acceptable if reconsti-tuted control material is kept in aliquot at 2°-8°C and one aliquot is being used once (13, 14).
CONCLUSION
1. The use of diabetic controls of BIORAD for extended days is validated and veri-fied. The controls may be used for ap-proximately 90 days provided they are preserved properly.
2. The study is having an important practi-cal application value. The laboratory has saved 5-fold expenditure i.e. 1 control in 7 days, hence 6 control vials in 45 days approximately. Such cost saving would be beneficial for the patient care ser-vices as the laboratory would be able to perform HbA1c at a patient beneficial rate. HbA1c is a prognostic marker of diabetes so the aim of the laboratories should be to offer the test at a moder-ate cost.
3. Any waste should be discouraged. The study showed prevention of waste of expensive controls.
REFERENCES1. Thompson M, Stephen L R E, Wood R. Harmonized guidelines for single lab validation of methods of analy-sis (IUPAC technical report). Pure and Applied Chemistry; Vol.74:p.835-55,2009.
2. Westgard J O, Carey R N, Wold S. Criteria for judging precision and accuracy in method development and eval-uation. Clin. Chem; Vol.20: p.825-33, 1974.
3. Clinical and Laboratory Standards Institute (CLSI). Esti-mation of total analysis error for clinical laboratory meth-ods. CLSI EP 21-A-2003.
4. Westgard J O, Westgard S A. Total analytic error dis-cussed in Clinical Laboratory News. Clinical Laboratory News, AACC; Sept.p.8-10, 2013.
5. Dong – Hyun J, Kang Ki-Ju. A method for optimal mate-rial selection aided with decision making theory. Science Direct; Vol.21.p.199-206, 2000.
6. Westgard J 0. A method evaluation decision chart (Medx Chart) for judging method performance. Clinical Laboratory Science; Vol.8, p.277-83, 1995.
7. Kit Inserts, BIORAD, Lot numbers 33870, 33890, 33920.
8. Westgard J O, Klee G G. Quality management. Chap-ter16 in Fundamentals of Clinical Chemistry, 4th edition. Burtis C Ed, WB Saunders Company, Philadelphia, 1996, p.211-23.
9. Asian B, Mudjet A, Cevlik T, Bolayrli M, Emerk K. Un-certainty in proficiency testing schemes: KBUDEK experi-ence. Clin. Biochem, vol.42, issue 5, p.321, 2009.
10. Westgard J O. Charts of Operational Process Specifi-cations (OPSpecs charts) for assuring precision, recovery and Quality Control needed to satisfy proficiency testing performance criteria. Clin. Chem. 38/7, p.1226-33, 1992.
11. Westgard J O, Stein B. An automatic process for select-ing statistical QC procedures to assure clinical or analyti-cal quality requirements. Clin .Chem.43, 0. 400-3, 1997.
12. Westgard J O. Six sigma quality design and control: Desirable precision and requisite QC for laboratory mea-surement processes. Madison, Wis: Westgard QC: 2001.
13. Westgard J O. Managing quality vs. measuring uncer-tainty in the medical laboratory. Clin Chem Lab Med.48, p.31-40, 2010.
14. Westgard J O. Critical error grid calculator. Westgard website: tools.westgard.com/qccalculator.html

eJIFCC2017Vol28No2pp142-155Page 148
Shyamali PalA validation study of after reconstitution stability of diabetes
Test or Analyte Analyst
Methodology Date
Quality Requirement Sigma Limits sAllowable Total Error 20.0 6 3.33Offset 0.0 5 4.00
Method Performance 4 5.00Bias (% diff) 1.7 3 6.67Imprecision (% CV) 2.3 2 10.00Sigma Metric 8.0
HbA1c,33870,L1
Ion Exchange HPLC
Dr.Shyamali Pal
0.0
5.0
10.0
15.0
20.0
25.0
0.0 2.0 4.0 6.0 8.0 10.0 12.0
Allo
wabl
e In
accu
racy
(bi
as, %
)
Allowable Imprecision (s, % )
Medical Decision Chart6 Sigma
5 Sigma
4 Sigma
3 Sigma
2 Sigma
Operating Point
Chart 1 Method decision chart of L1, 33870

eJIFCC2017Vol28No2pp142-155Page 149
Shyamali PalA validation study of after reconstitution stability of diabetes
Test or Analyte HbA1c,33870, L2 Analyst Dr.Shyamali Pal
Methodology Ion Exchange HPLC Date
Quality Requirement Sigma Limits S
Allowable Total Error 15.6 6 2.60
Offset 0.0 5 3.12
Method Performance 4 3.90
Bias (% diff) 3.0 3 5.20
Imprecision (% CV) 2.0 2 7.80
Sigma Metric 6.3
Chart 2 Method decision chart of L2, 33870

eJIFCC2017Vol28No2pp142-155Page 150
Shyamali PalA validation study of after reconstitution stability of diabetes
Test or Analyte Analyst
Methodology Date
Quality Requirement Sigma Limits sAllowable Total Error 18.2 6 3.03Offset 0.0 5 3.64
Method Performance 4 4.55Bias (% diff) 1.5 3 6.07Imprecision (% CV) 2.3 2 9.10Sigma Metric 7.3
HbA1c,33890,L1
Ion Exchange HPLC
Dr.Shyamali Pal
0.0
2.0
4.0
6.0
8.0
10.0
12.0
14.0
16.0
18.0
20.0
0.0 2.0 4.0 6.0 8.0 10.0
Allo
wabl
e In
accu
racy
(bi
as, %
)
Allowable Imprecision (s, % )
Medical Decision Chart6 Sigma
5 Sigma
4 Sigma
3 Sigma
2 Sigma
Operating Point
Chart 3 Method decision chart of L1, 33890

eJIFCC2017Vol28No2pp142-155Page 151
Shyamali PalA validation study of after reconstitution stability of diabetes
Test or Analyte Analyst
Methodology Date
Quality Requirement Sigma Limits sAllowable Total Error 14.9 6 2.48Offset 0.0 5 2.98
Method Performance 4 3.73Bias (% diff) 2.0 3 4.97Imprecision (% CV) 2.2 2 7.45Sigma Metric 5.9
HbA1c,33890,L2
Ion Exchange HPLC
Dr.Shyamali Pal
0.0
2.0
4.0
6.0
8.0
10.0
12.0
14.0
16.0
0.0 2.0 4.0 6.0 8.0
Allo
wabl
e In
accu
racy
(bi
as, %
)
Allowable Imprecision (s, % )
Medical Decision Chart6 Sigma
5 Sigma
4 Sigma
3 Sigma
2 Sigma
Operating Point
Chart 4 Method decision chart of L2, 33890

eJIFCC2017Vol28No2pp142-155Page 152
Shyamali PalA validation study of after reconstitution stability of diabetes
Test or Analyte Analyst
Methodology Date
Quality Requirement Sigma Limits sAllowable Total Error 20.0 6 3.33Offset 0.0 5 4.00
Method Performance 4 5.00Bias (% diff) 1.3 3 6.67Imprecision (% CV) 2.5 2 10.00Sigma Metric 7.5
HbA1c,33920,L1, Laboratory1
Ion Exchange HPLC
Dr.Shyamali Pal
0.0
5.0
10.0
15.0
20.0
25.0
0.0 2.0 4.0 6.0 8.0 10.0 12.0
Allo
wabl
e In
accu
racy
(bi
as, %
)
Allowable Imprecision (s, % )
Medical Decision Chart6 Sigma
5 Sigma
4 Sigma
3 Sigma
2 Sigma
Operating Point
Chart 5 Method decision chart of L1, 33920 (Laboratory 1)

eJIFCC2017Vol28No2pp142-155Page 153
Shyamali PalA validation study of after reconstitution stability of diabetes
Test or Analyte Analyst
Methodology Date
Quality Requirement Sigma Limits sAllowable Total Error 20.0 6 3.33Offset 0.0 5 4.00
Method Performance 4 5.00Bias (% diff) 1.3 3 6.67Imprecision (% CV) 2.0 2 10.00Sigma Metric 9.2
HbA1c,33920,L2,Laboratory 1
Ion Exchange HPLC
Dr.Shyamali Pal
0.0
5.0
10.0
15.0
20.0
25.0
0.0 2.0 4.0 6.0 8.0 10.0 12.0
Allo
wabl
e In
accu
racy
(bi
as, %
)
Allowable Imprecision (s, % )
Medical Decision Chart6 Sigma
5 Sigma
4 Sigma
3 Sigma
2 Sigma
Operating Point
Chart 6 Method decision chart of L2, 33920 (Laboratory 1)

eJIFCC2017Vol28No2pp142-155Page 154
Shyamali PalA validation study of after reconstitution stability of diabetes
Test or Analyte Analyst
Methodology Date
Quality Requirement Sigma Limits sAllowable Total Error 20.0 6 3.33Offset 0.0 5 4.00
Method Performance 4 5.00Bias (% diff) 2.4 3 6.67Imprecision (% CV) 2.2 2 10.00Sigma Metric 8.0
HbA1c,33920,L1,Laboratory 2
Ion Exchange HPLC
Dr.Shyamali Pal
0.0
5.0
10.0
15.0
20.0
25.0
0.0 2.0 4.0 6.0 8.0 10.0 12.0
Allo
wabl
e In
accu
racy
(bi
as, %
)
Allowable Imprecision (s, % )
Medical Decision Chart6 Sigma
5 Sigma
4 Sigma
3 Sigma
2 Sigma
Operating Point
Chart 7 Method decision chart of L1, 33920 (Laboratory 2)

eJIFCC2017Vol28No2pp142-155Page 155
Shyamali PalA validation study of after reconstitution stability of diabetes
Test or Analyte Analyst
Methodology Date
Quality Requirement Sigma Limits sAllowable Total Error 20.0 6 3.33Offset 0.0 5 4.00
Method Performance 4 5.00Bias (% diff) 3.5 3 6.67Imprecision (% CV) 2.0 2 10.00Sigma Metric 8.2
HbA1c,33920,L2,Laboratory 2
Ion Exchange HPLC
Dr.Shyamali Pal
0.0
5.0
10.0
15.0
20.0
25.0
0.0 2.0 4.0 6.0 8.0 10.0 12.0
Allo
wabl
e In
accu
racy
(bi
as, %
)
Allowable Imprecision (s, % )
Medical Decision Chart6 Sigma
5 Sigma
4 Sigma
3 Sigma
2 Sigma
Operating Point
Chart 8 Method decision chart of L2, 33920 (Laboratory 2)