Embed Size (px)
Citation preview
Pravara Journal of Science & Technology 2017; 1(1)
3
Development and validation of stability indicating HPTLC method for the
determination of metronidazole in bulk and dosage form Charushila J. Bhangale*, Vijay D. Wagh
Pravara Rural Education Society’s College of Pharmacy (For Women), Chincholi, Nasik,
Maharashtra, India.
Abstract
A simple, selective, precise and stability-indicating high-performance thin- layer
chromatographic method for densitometric determination of metronidazole both as a bulk drug
and in tablet dosage form was developed and validated as per the International Conference on
Harmonisation guidelines. The method employed TLC aluminium plates precoated with silica gel
60F 254 as the stationary phase. The solvent system consisted of Toluene: ethyl acetate:
methanol: ammonia (3.0:1.5:0.5:0.1%). Densitometric measurement of metronidazole was
performed in the absorbance mode at 277 nm. The system was found to give compact spot for
metronidazole (Rf value of 0.50 ± 0.02). The calibration curve of the drug was linear in the
range of 500 – 3000 ng/spot with r2
Keywords: Degradation; HPTLC; Metronidazole; Validation.
= 0.999 ± 0.0001. Metronidazole was subjected to acid and
alkali hydrolysis, oxidation, dry heat and photo degradation. There was no interference of the
excipients on the determination of the active pharmaceutical ingredients. Proposed stability
indicating method is accurate, specific and reproducible for the estimation of metronidazole in
the bulk and dosage form.
1. Introduction
Metronidazole (MND) is 2-methyl-5-nitro-1H-imidazole-1-ethanol. possesses activity against protozoa and anaerobic bacteria [Remington, 2010]( Fig. 1.)
Fig. 1 Chemical structure of metronidazole
Metronidazole is extensively used as antiamoebic, antiprotozoal and antibacterial drugs [Wol ME 1958]. The discovery of the antibacterial and antitrichomonal properties of the antibiotic azomycin led to the investigation of nitroimidazoles as antiparasitic agents [Coser C; Julon L 1958]. Anaerobic bacterial infections caused by, Fusobacteria, Bacteroides species and Clostridia are best treated by metronidazole therapy [Lofmark S et al. 2010]. Metronidazole is a nitroimidazole derivative. It is a recommended treatment

Pravara Journal of Science & Technology 2017; 1(1)
4
during pregnancy for infections with bacterial vaginosis and Trichomonas vaginalis [Kimberly MA et al. 2010].
A literature survey reveals that few analytical methods like UV [Mishra AK et al. 2014; Naveed S et al. 2014; Das J et al. 2014; Mastanamma SK et al. 2015] and HPLC [Oltean EG et al. 2011; Salvesen B et al. 1984; Tashtoush BM 2008; Ghante MR et al. 2012; Danao KR et al. 2012] are reported .However, to our knowledge, no information related to the stability-indicating high-performance thin-layer chromatography (HPTLC) determination of metronidazole in pharmaceutical dosage forms has ever been mentioned in literature. The parent drug stability test guidelines (Q1A) issued by International Conference on Harmonisation (ICH) requires that analytical test procedures for stability samples should be fully validated and the assays should be stability indicating [ICH 2003; Bakshi M et al. 2002; Sethi PD 1996]. An ideal stability-indicating method shall quantify the drug and its degradation products.
Hence, an attempt has been made to develop an accurate, specific and reproducible method for the determination of metronidazole in presence of degradation product for the content analysis during stability studies from pharmaceutical dosage form.
2. Experimental
2.1 Materials
Metronidazole was supplied as a gift sample from Pfizer Ltd. Mumbai, India. All chemicals and reagents used were of analytical grade and purchased from Merck Chemicals, Mumbai, India.
2.2 HPTLC instrumentation
HPTLC was performed on 20 cm X 10 cm aluminium plates precoated with silica gel 60F 254 (E. Merck, Germany). Before chromatography the plates were prewashed by development with methanol and activated at 60 0
2.3 Calibration curve of metronidazole
C for 5 min. The samples were spotted in the form of bands of width 6 mm with Camag Linomat 5applicator fitted with 100 µl syringe with a constant application rate of 150 nl/ sec and space between two bands was 15 mm. Linear ascending development with Toluene: ethyl acetate: methanol: ammonia (3.0:1.5:0.5:0.1 v/v/v) as mobile phase was performed in a Camag twin trough glass chamber previously saturated with mobile phase vapour for 25 min at room temperature. The development distance was 80 mm. Subsequent to the development; TLC plates were dried in current of air with the help of an air dryer. Densitometric scanning was performed using Camag TLC scanner 3 in the absorbance mode at 277 nm. The slit dimensions were 6 mm X 0.45 mm. The source of radiation utilized was deuterium lamp emitting a continuous UV spectrum in the range of 200 - 400 nm.
A stock solution of metronidazole (1000 µg/ml) was prepared in methanol. Different volume of stock solution 0.5, 1.0, 1.5, 2.0, 2.5, 3.0 µl were spotted in six replicates on TLC plates to obtain concentration of 500, 1000, 1500, 2000, 2500, 3000 ng/spot of metronidazole, respectively. The data of peak area versus drug concentration were treated by linear least square regression.
2.4 Method validation
2.4.1 Precision
Repeatability of sample application and measurement of peak area were carried out
Pravara Journal of Science & Technology 2017; 1(1)
5
using six replicates of the same spot (1500 ng/spot of metronidazole). The intra-day and inter-day variation for the determination of metronidazole was carried out at three different concentration levels of 1000, 1500 and 2000 ng/spot.
2.4.2 Robustness of the method
By introducing various changes in the previous chromatographic conditions the effects on the results were examined.
2.4.3 Limit of detection and limit of quantification
In order to determine detection and quantification limit, concentrations in the lower part of the linear range of calibration curve were used. The LOQ and LOD were calculated using equation; LOD = 3 Х N/B and LOQ = 10 Х N/B; where, ‘N’, is standard deviation of the peak areas of the drugs (n = 3), taken as a measure of noise, and ‘B’ is the slope of the corresponding calibration curve.
2.4.4 Specificity
The specificity of the method was ascertained by analyzing standard drug and sample. The spot for metronidazole in sample was confirmed by comparing the Rf
2.4.5 Recovery studies
values and spectra of the spot with that of standard. The peak purity of metronidazole was accessed by comparing the spectra at three different levels, i.e., peak start (S), peak apex (M) and peak end (E) positions of the spot.
Recovery study was carried out by over spotting 80%, 100% and 120% of the standard drug to the preanalysed sample of 1200 ng/spot. At each level of the amount, three determinations were performed.
2.5 Analysis of metronidazole in marketed formulation
The contents of twenty capsules were accurately weighed; an amount of powder equivalent to 100 mg metronidazole was transferred into 100 ml calibrated volumetric flask, extracted with 40 ml methanol, sonicated for 20 min and diluted to mark with same solvent. The resulting solution was filtered, using 0.45 μm filter (Millifilter, Milford, MA). The 1.2 µl of the above solution (1200 ng/ spot) was applied on TLC plate followed by development and scanning as described in section 2.2. The analysis was repeated for six times. The possibility of excipients interferences in the analysis was studied.
2.6 Forced degradation of metronidazole
2.6.1 Acid and base induced degradation
The 10 mg of metronidazole was separately dissolved in 10 ml methanolic solution of 1 M HCl and 1 M NaOH. These solutions were kept for 8 h at room temperature in the dark in order to exclude the possible degradative effect of light. The 1 ml of above solution was taken and neutralized, then diluted up to 10 ml with methanol. The resultant solution were applied on TLC plates in triplicates (12 µl each, i.e. 1200 ng/spot). The chromatograms were run as described in section 2.2.
2.6.2 Hydrogen peroxide – induced degradation
The 10 mg of metronidazole was separately dissolved in 10 ml methanolic solution of hydrogen peroxide (10 % v/v). The solution was kept for 8 h at room temperature in the dark in order to exclude the possible degradative effect of light. The 1 ml of above solution was taken and diluted up to 10 ml with methanol. The resultant solution was applied on TLC plate in triplicate (12 µl
Pravara Journal of Science & Technology 2017; 1(1)
6
each, i.e. 1200 ng / spot). The chromatograms were run as described in section 2.2.
2.6.3 Dry heat degradation products
Metronidazole 10 mg was stored at 550
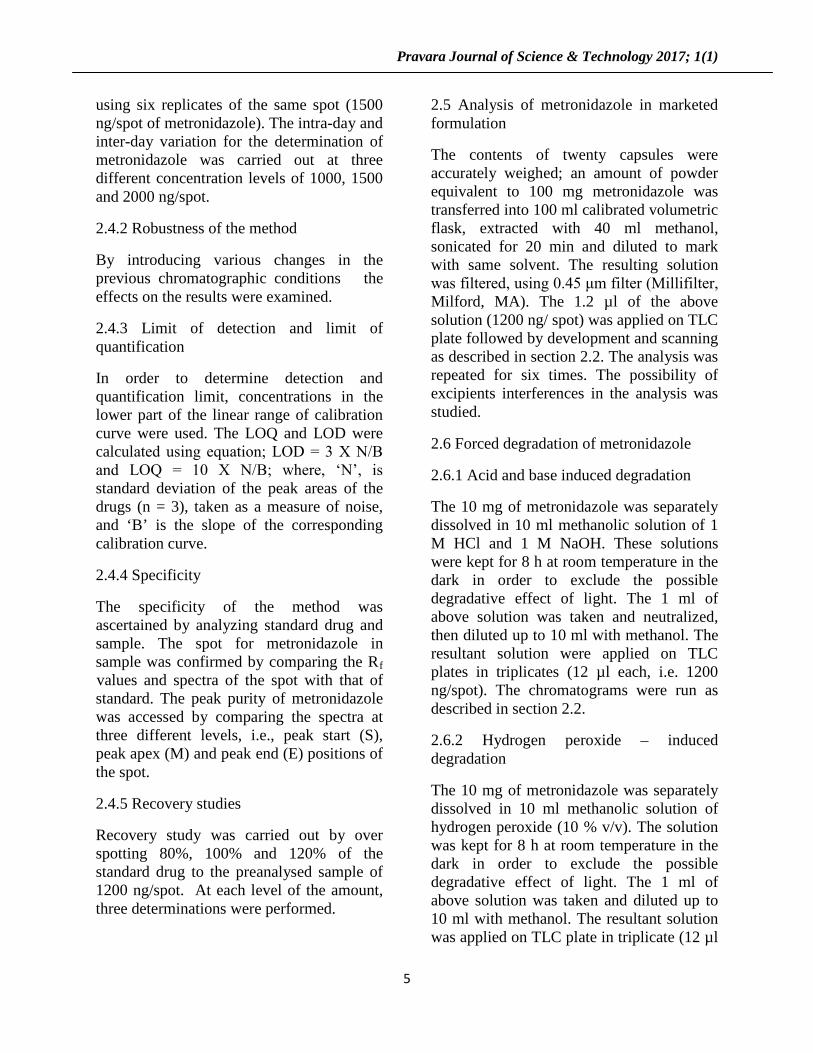
The TLC procedure was optimised with a view to develop a stability-indicating assay method. Both the pure drug and the degraded products were spotted on the TLC plates and run in different solvent systems. Initially, Toluene: ethyl acetate in varying ratios was tried. The developed spot was diffused. To the above mobile phase, 0.5 ml
methanol was added. The peak was not symmetrical in nature and tailing was observed. To improve resolution, 0.1 ml of ammonia was added. The mobile phase Toluene: ethyl acetate: methanol: ammonia (3.0:1.5:0.5:0.1 %) gave good resolution, sharp and symmetrical peak with RC for
3 h in oven. It was transferred to 10 ml volumetric flask containing methanol and volume was made up to the mark. 1.2 µl (1200 ng per spot) was applied on TLC plate in triplicate and chromagram were run as described in section 2.2.
2.6.4 Light heat degradation products
The 10 mg of metronidazole was dissolved in 10 ml of methanol. The solution was kept in the sun light for 8 h. The 1 ml of above solution was taken and diluted up to 10 ml with methanol. The resultant solution was applied on TLC plate in triplicate (12 µl each, i.e. 1200 ng/ spot). The chromatograms were run as described in section 2.2.
3. Results and Discussion
3.1 Optimization of the procedure
f value of 0.50 for metronidazole as shown in Fig. 2.
Fig. 2 A typical HPTLC chromatogram of metronidazole
It was observed that prewashing of TLC plates with methanol (followed by drying and activation) and pre-saturation of TLC chamber with mobile phase for 25 min ensure good reproducibility and peak shape of metronidazole.
3.2 Calibration curve
The linear regression data for the calibration curve (n = 6) showed a good linear relationship over the concentration range 500 – 3000 ng/ spot with respect to peak area. No significant difference was observed in the slopes of standard curves. The results are shown in Table 1.
Table 1: Linear regression data for the calibration curve
Linearity range (ng /spot) 500 - 3000
Coefficient of Correlation r2 0.999 ± 0.0001 ± SD
Slope ± SD 2.707 ± 0.0393
Intercept ± SD 414.26 ± 58.479
Pravara Journal of Science & Technology 2017; 1(1)
7
3.3 Validation of the method
3.3.1 Precision
Precision of the method was determined in the terms of intra-day and inter-day variation (%RSD). Intra-day precision (%RSD) was assessed by analyzing standard drug solutions within the calibration range, three times on the same day.
Inter-day precision (%RSD) was assessed by analyzing drug solutions within the calibration range on three different days over a period of a week. The results depicted revealed high precision of the method is presented in Table 2.
Table 2: Intra-day and inter-day precision
Intra-day Precision Inter-day precision Amount ng/spot
Amount found ng/spot SD %RSD Amount found ng/spot SD
%RSD
1000 1002.25 12.97 1.71 1005.89 6.10 1.61 1500 1502.19 3.00 0.76 1501.83 1.72 0.54 2000 1992.01 5.62 1.38 2002.11 1.42 0.38
3.3.2 Robustness of the method
The standard deviation of peak areas was calculated for parameter and % RSD was found to be less than 2%. The low value of % RSD shown in Table 3 indicated robustness of the method.
3.3.3 Limit of detection and limit of quantitation Detection limit and quantification limit was calculated by the method as described in section 2.4.3 and found to be 46.22 and 116.35 ng/ spot, respectively. This indicates adequate sensitivity of the method. 3.3.4 Specificity The peak purity of the metronidazole was assessed by comparing the spectra at peak start, peak apex and peak end positions of the spot. 3.3.5 Recovery studies When the proposed method used for extraction and subsequent analysis of metronidazole from pharmaceutical dosage form after over spotting with 80%, 100%
and 120 % of additional drug. The recovery was 99.99 – 100.74 as listed in Table 4.
3.4 Analysis of marketed formulation
A single spot of Rf
3.5 Stability- indicating property
0.50 ± 0.02 was observed in chromatogram of the metronidazole samples extracted from capsules. There was no interference from the excipients commonly present in the dosage form. The metronidazole content was found to be 100.17% with a % RSD of 0.481. The low % RSD value indicated the suitability of this method for routine analysis of metronidazole in pharmaceutical dosage form.
The chromatogram of samples degraded with acid, base, hydrogen peroxide and light showed well separated spots of pure metronidazole as well as some additional peaks at different Rf values. The spots of degraded product were well resolved from the drug spot as shown in Fig. 3.

Pravara Journal of Science & Technology 2017; 1(1)
8
The number of degradation product with their Rf values, content of metronidazole
remained and percentage recovery were calculated and listed in Table 6.
Fig. 3 Forced degradation of MND by HPTLC: A) 1MHCl + MND; B) 1M NaOH + MND;
C) 10% H2O2 + MND; d) Dry heat MND; E) Light hat MND
Table 3: Robustness of the method
Parameters SD of peak area %RSD Mobile phase composition Tolune: ethyl acetate: methanol:ammonia (3.5:0.5:0.5:0.1 v / v/v/v)
62.59 1.07
Tolune: ethyl acetate: methanol:ammonia (2.5:1.0:1.5:0.1 v / v/v/v)
76.92 1.28
Mobile phase volume 5.1 ml 48.96 0.84 10.2 ml 41.47 0.43 Development distance 7 cm 24.58 0.39 7.5 cm 37.46 0.45 8 cm 42.78 0.66 Relative humidity 55 42.03 0.75 65 69.93 1.13 Duration of saturation 20 min 16.29 0.33 25 min 23.30 0.47 30 min 39.08 0.80 Activation of prewashed TLC plates 8 min 39.38 0.81 10 min 10.19 0.13 12 min 9.81 0.19 Time from spotting to chromatography 36.39 0.53 Time from chromatography to scanning 45.03 0.92
Pravara Journal of Science & Technology 2017; 1(1)
9
Table 4: Recovery Studies
Initial amount (ng) Excess drug added to the analyte (%) %Recovery %RSD 1200 80 100.02 1.25 1200 100 99.99 0.89
1200 120 100.74 1.47 The summary of validation parameters were listed in Table 5.
Table 5: Summary of validation parameters
Parameter HPTLC Linearity range 500-3000[ng /spot]
Regression equation [Y = mX + C]
Y = 2.702x + 447
Correlation coefficient 0.999 Limit of detection [ng ] 46.22 Limit of quantitation [ng] 116.35
% Recovery [ n = 3] 99.99 – 100.74 Ruggedness [% ]
Analyst I [n = 3] 99.85 Analyst II [n = 3] 99.56 Precision [% RSD] Repeatability [n = 6] 1.47 Inter-day [n = 3] 0.38-1.61 Intra-day [n = 3] 0.76-1.71 Robustness Robust Specificity Specific
Table 6: Forced degradation of Metronidazole
Sr.no. Sample exposure condition
Number of degradation product (Rf
Metronidazole remained value) (ng/1200ng)
Recovery (%)
1 1M HCl,8h,RT 1 (0.71) 1156.67 96.38 2 1M NaOH,8h,RT 3 (0.54,0.69,0.74) 1045.89 87.03 3 10% H2O2, 2 (0.66,0.72) 8h,RT 1098.36 91.53 4 Dry heat,3h,550 1(0.23) C 1126.21 93.85 5 Light heat,8h No degradation 1202.26 100.18 a
RT = Room temperature

Pravara Journal of Science & Technology 2017; 1(1)
10
4. Conclusion
The proposed HPTLC method is simple, rapid, accurate, specific and stability –indicating without interference from the excipients or from degradation product. Statistical analysis proves that the method is precise, reproducible and found to be suitable for routine analysis of metronidazole as bulk drug and in pharmaceutical formulations. As this drug is separated from its degradation products and therefore can be regarded as stability- indicating.
5. Acknowledgement
The authors are thankful to PRES’s College of Pharmacy, Chincholi, Nashik for providing necessary facilities. The authors are also thankful to Pfizer Ltd., Mumbai for providing gift sample and Merck Chemicals, India for analytical grade reagents.
Conflict of Interests
The authors declare that they have no conflict of interests.
References
[1]Remington (2010), The Science and Practice of Pharmacy; Volume II; 21st edn, Lippincott Williams & Wilkins, Philadelphia:1669.
[2] Wol ME, John Wiley and Sons(1958) Text book of Burgers Medicinal Chemistry, 4th edn, New York, 979.
[3] Coser C, Julon L (1958) Ann.inst.Pasteur. 96:238.
[4] Lofmark S, Edlund C , Nord CE (2010) Metronidazole Is Still the Drug of Choice for Treatment of Anaerobic Infections. Clinical Infectious Diseases 50: S16-S23.
[5] Kimberly MA, Stuart A, Centers for Disease Control and Prevention (2010) Guidelines for Treatment of Sexually Transmitted Diseases. MMWR Morbidity and Mortality Weekly Report 47: 8-10.
[6] Mishra AK , Kumar AA,
[7] Naveed S, Waheed N , Nazeer S(2014) Degradation Study of Metronidazole in Active and Different Formulation by UV Spectroscopy.J Bioequiv Availab 6(4 ):124-127.
Mishra AA et al.(2014) Development of ultraviolet spectroscopic method for the estimation of metronidazole benzoate from pharmaceutical formulation. J Nat Sci Biol Med. 5(2): 261–264.
[8] Das J, Dhua M(2014) UV-Spectrophotometric Assay Method Development and Validation of Metronidazole in Bulk and Tablet Formulation . Journal of pharma scitech 3 (2) :106-109.
[9] Mastanamma SK, Sravani K, Anil T (2015) UV differential spectrophotometric method for the estimation of metronidazole in bulk and pharmaceutical formulation. Rasayan J.Chem 8( 3): 303 - 309 .
[10] Oltean EG, Nica A (2011) Development and validation of a RP- HPLC method for the quantization studies of metronidazole in tablets and powders dosage forms. medicamentul veterinar / veterinary drug 5 (2) : 71-73.
[11] Salvesen B, Leinebo O, Bergan T(1984) Assay of metronidazole by HPLC compared with microbial method. Scand J Gastroenterol Suppl. 91:31-43.
[12] Tashtoush BM, Jacobson EL, Jacobson MK(2008) Validation of a simple and rapid HPLC method for determination of metronidazole in dermatological

Pravara Journal of Science & Technology 2017; 1(1)
11
formulations. Drug Dev Ind Pharm. 34(8):840-844.
[13] Ghante MR, Pannu HK, Loni Aet al.(2012) Development and validation of a RP- HPLC method for simultaneous estimation of metronidazole and norfloxacin in bulk and tablet dosage form. International Journal of Pharmacy and Pharmaceutical Sciences 4(4):241-245
[14] Danao KR, Hiradeve SM , Moon RS et al. (2010) RP-HPLC simultaneous estimation of metronidazole and diloxanide furoate in combination. International journal of pharmacy & life sciences, 1(2):82-85.
[15]International Conference on Harmonisation (ICH) of Technical Requirements for the Registration of Pharmaceutical for Human Use (2003) Stability testing of new drugs substance and products Q1A (R2):1-18.
[16]Bakshi M, Singh S(2002)Development of validated stability-indicating assay methods- critical review, J. Pharm. Biomed. Anal. 28: 1011-1040.
[17] Sethi PD (1996) HPTLC: Quantitative Analysis of Pharmaceutical formulation,CBS Publications, New Delhi: 162-165.
Pravara Journal of Science & Technology 2017; 1(1)
12
Application of Sliding Mode Controller To Regulate Process C.B. Kadu1, P.J. Parvat2, S.V. Raut3*
1 Associate Professor, Department of Instrumentation & Control Engineering, Pravara Rural Engineering College,
Loni, Savitribai Phule University of Pune
2 Associate Professor, Department of Instrumentation & Control Engineering, Pravara Rural Engineering College,
Loni, Savitribai Phule University of Pune 3 PG student, Department of Instrumentation & Control Engineering, Pravara Rural Engineering College, Loni,
Savitribai Phule University of Pune
Abstract
This article deals with application of sliding mode control for process control. Reaching phase and sliding phase design by using Lyapunov stability criteria, to fulfil the sliding condition. Approximated FOPDT model parameters used to calculate tuning parameters and these parameters are used to design continuous sliding mode control. This approach has been demonstrated with an example of water tank level control system with disturbance.
Keywords: Sliding mode controller, FOPDT model, Variable structure control, real time system
application
1. Introduction: In SMC, the sliding means it measures of the current system behaviour and produces a switching feedback controller [Oscar Chamacho, 2000]. In the architecture of SMC, the controller is designed in such way that the system state to lie within a very small neighbourhood of the switching function instead the disturbances and perturbations uncertainties , modelling error, and variations in system parameters . The ease of implementation and short computational and numerical algorithm required in the implementation of SMC in microcontrollers is another advantage of this technique. 1.1 Concept of Sliding Mode Controller Sliding Mode Control (SMC) is rapidly gaining popularity due to its practical
success and fairly straight forward firm ware implementation. [V.I, Utkin, 1997] SMC produces a discontinuous on/off signal that forces the system to slide along the desired systems behaviour. Unlike Proportional Integral Derivative (PID) controllers, which are perhaps the most commonly used feedback controller, SMC uses a discrete sliding decision rule in which the system flows through both continuous and discrete modes resulting in a hybrid feedback configuration. The major advantage of sliding mode is low sensitivity to plant parameter variations and disturbances which eliminates the necessity of exact modelling. 1.2 Variable Structure Control (VSC) During the control process, the structure of control system varies from one structure to another thus earning the name variable
Pravara Journal of Science & Technology 2017; 1(1)
13
structure control [J.YHung, 1993], and as the structure is define by sliding mode the control is named as ’Sliding Mode Control’.
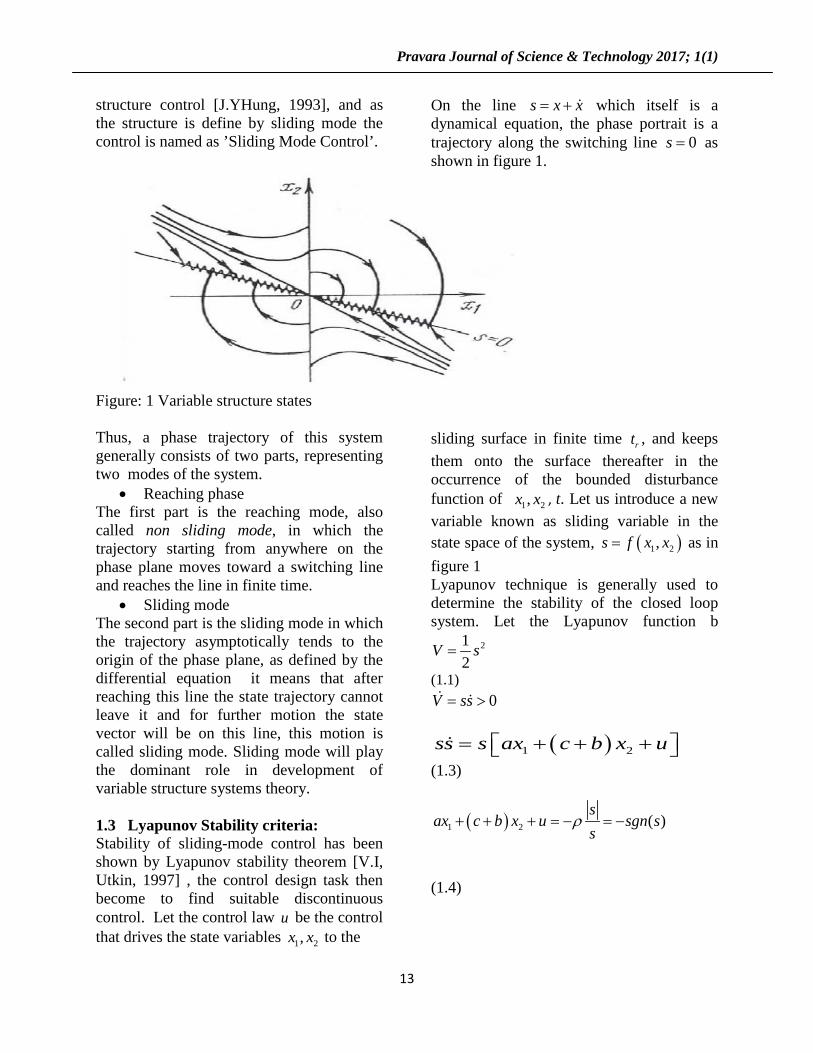
On the line s x x= + which itself is a dynamical equation, the phase portrait is a trajectory along the switching line 0s = as shown in figure 1.
Figure: 1 Variable structure states Thus, a phase trajectory of this system generally consists of two parts, representing two modes of the system.
• Reaching phase The first part is the reaching mode, also called non sliding mode, in which the trajectory starting from anywhere on the phase plane moves toward a switching line and reaches the line in finite time.
• Sliding mode The second part is the sliding mode in which the trajectory asymptotically tends to the origin of the phase plane, as defined by the differential equation it means that after reaching this line the state trajectory cannot leave it and for further motion the state vector will be on this line, this motion is called sliding mode. Sliding mode will play the dominant role in development of variable structure systems theory. 1.3 Lyapunov Stability criteria: Stability of sliding-mode control has been shown by Lyapunov stability theorem [V.I, Utkin, 1997] , the control design task then become to find suitable discontinuous control. Let the control law u be the control that drives the state variables 1 2,x x to the
sliding surface in finite time rt , and keeps them onto the surface thereafter in the occurrence of the bounded disturbance function of 1 2,x x , t. Let us introduce a new variable known as sliding variable in the state space of the system, ( )1 2,s f x x= as in figure 1 Lyapunov technique is generally used to determine the stability of the closed loop system. Let the Lyapunov function b
212
V s=
(1.1) 0V ss= >
( )1 2ss s ax c b x u= + + +
(1.3)
( )1 2 ( )s
ax c b x u sgn ss
ρ+ + + = − = −
(1.4)
Pravara Journal of Science & Technology 2017; 1(1)
14
1 2( ) sgn( )u ax c b x sρ= − − + −
(1.5) where condition of reachability as
0ss sρ= − < this approach leads to the eventual sliding mode switch scheme. 2. Sliding mode controller Design
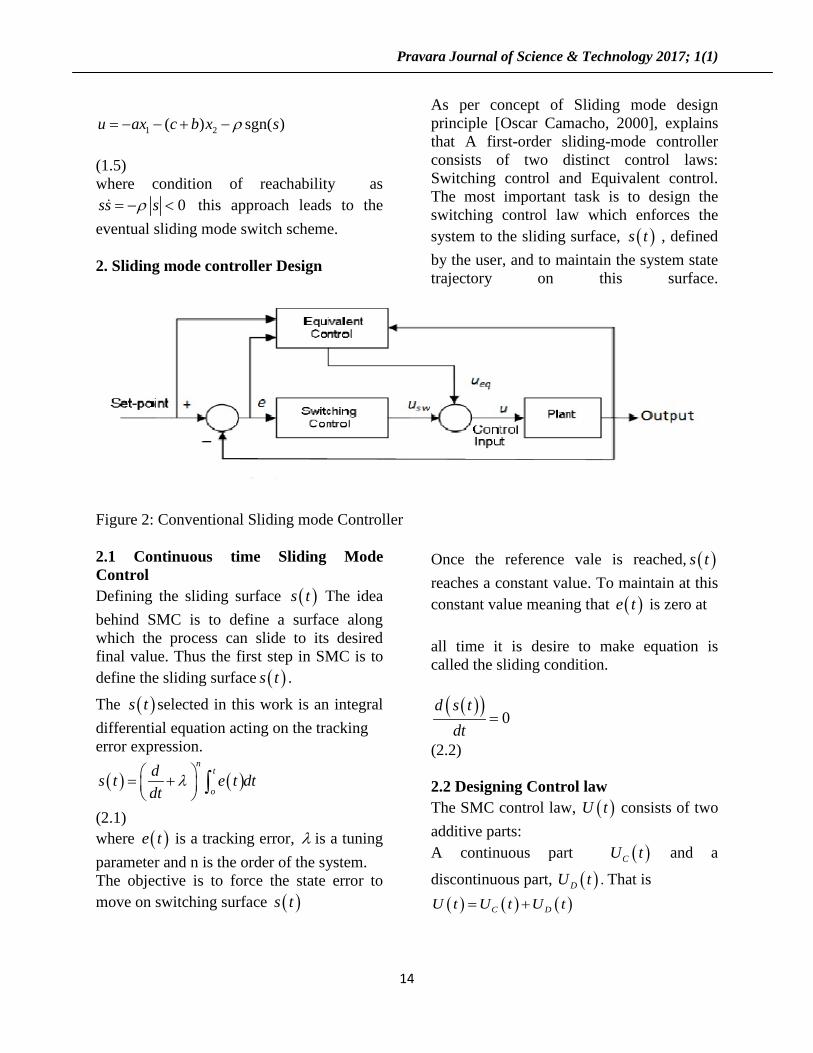
As per concept of Sliding mode design principle [Oscar Camacho, 2000], explains that A first-order sliding-mode controller consists of two distinct control laws: Switching control and Equivalent control. The most important task is to design the switching control law which enforces the system to the sliding surface, ( )s t , defined by the user, and to maintain the system state trajectory on this surface.
Figure 2: Conventional Sliding mode Controller 2.1 Continuous time Sliding Mode Control Defining the sliding surface ( )s t The idea behind SMC is to define a surface along which the process can slide to its desired final value. Thus the first step in SMC is to define the sliding surface ( )s t .
The ( )s t selected in this work is an integral differential equation acting on the tracking error expression.
( ) ( )n
t
o
ds t e t dtdt
λ = + ∫
(2.1)
where ( )e t is a tracking error, λ is a tuning parameter and n is the order of the system. The objective is to force the state error to move on switching surface ( )s t
Once the reference vale is reached, ( )s t reaches a constant value. To maintain at this constant value meaning that ( )e t is zero at all time it is desire to make equation is called the sliding condition.
( )( )0
d s tdt
=
(2.2)
2.2 Designing Control law The SMC control law, ( )U t consists of two additive parts: A continuous part ( )CU t and a
discontinuous part, ( )DU t . That is ( ) ( ) ( )C DU t U t U t= +
Pravara Journal of Science & Technology 2017; 1(1)
15
The control law usually results in fast motion to bring the state onto the sliding surface,
( )DU t , and a slower motion to proceed until
a desired state ( )CU t , is reached. The continuous part is given by ( ) ( ( ), ( ))U t f X t R t=
where ( )X t , ( )R t is a function of the controlled variable, and the reference value. The discontinuous part, ( )DU t , incorporates a nonlinear element that includes the switching element of the control law given by equation ,
( )( )tD D
s tU K
s δ=
+ (2.3) where DK is a tuning parameter responsible for the reaching mode, δ is a tuning parameter used to reduce the chattering problem. 3. SMC synthesis from FOPDT Model of process Oscar Camacho(2005)[4] explains proposed a method for sliding mode control for FOPDT open loop unstable processes, This section presents the development of a general SMC, whose open loop transfer function is given by First order Plus Dead time model from process data
( )0
1
t s
p peg s Ksτ
−
=+
(3.1) Where pK = Process gain , τ = Time constant ,
0t = Dead time FOPDT model these tuning parameters are used to obtain the initial estimates of the tuning terms in the SMC. In this chapter, a SMC structure based on the FOPDT model of the actual process is designed. Thus, the first step is to propose a way to handle the dead time term.
The dead time can be approximated in two different ways. A first-order Taylor series approximation for the dead time term produces
0
11
ot set s
− =+
(3.2) 3.1 SMC design based on Taylor’s series approximation Now the step to develop complete SMC law based on FOPDT model i.e ( )U t
As ( )( )
0
1
t s
p
X s eKU s sτ
−
=+
By Taylor’s series approximation produces
( )( ) ( )( )0
11 1p
X sK
U s s t s=
+ +
(3.3) In differential equation form
( ) ( ) ( ) ( )2
0 02 ( )d X t d Xt
t t X t KU tdt dt
τ τ+ + + =
(3.4) From this equation we can say that the order of system is second order thus sliding surface order i.e. 2n = and sliding surface
( )s t is given by
( ) ( ) ( )2
0
( ) / 2t
s t de t dt e t e t dtλ λ= + + ∫ and
(3.5) ( ) ( )2
2( ) 2 ( )d e t d et
s t e tdt dt
λ λ= + +
(3.6) Substituting the definition of the error, ( ) ( )( )e t R t X t= − where R(t) is the
reference value which is constant. Hence derivative of the constant value is zero.
Pravara Journal of Science & Technology 2017; 1(1)
16
( ) ( ) ( )22
22 2
( ) 2 0d X t dR td R t e t
dt dt dtλ λ
− + + =
(3.7) We get,
( ) ( ) ( ) ( ) ( )220 0
20 0
( ) 2C
dX t X t d R t dR tt tU t e tK t dt t dt dtτ τ λ λ
τ τ +
= + + + +
(3.8) Above equation mention as a continuous part of controller is known in SMC theory as Equivalent control i.e. equU . Rearranging the above equation we get
( ) ( ) ( ) ( )20 0
0 0
2C
d Xt X tt tU t e tK t dt tτ τ λ λ
τ τ +
= − + +
(3.9) ( )CU t can be simplified by doing
0
0
2 ttτλτ+
=
The resulting SMC summarised as follows: From equation (2.3) and (3.9) complete control law will be
( ) ( ) ( ) ( )( )
20
0D
X t s ttU t e t KK t s tτ λ
τ δ
= + + +
(3.10) Where
( ) ( ) ( ) ( )2
0
( ) 2tdX t
s t sig nK e t e tdt
λ λ
= − + +
∫
(3.11)
These equations present advantages from process control point of view, first they have a fixed structure depending on the λ parameters and the characteristic parameters of the FOPDT model, and second the action of the controller is considered in the sliding surface equation, by including the term
( )sign K For the tuning equations as first estimates, using the Nelder-Mead searching algorithm, [Oscar Chamacho, 2000; B.B.Musmade, 2011] the following equations were obtained
to determine the value of DK and δ As follow
0.76
0
0.51DK
K tτ
= (3.12)
0.68 0.12 2DK Kδ λ= + (3.13)
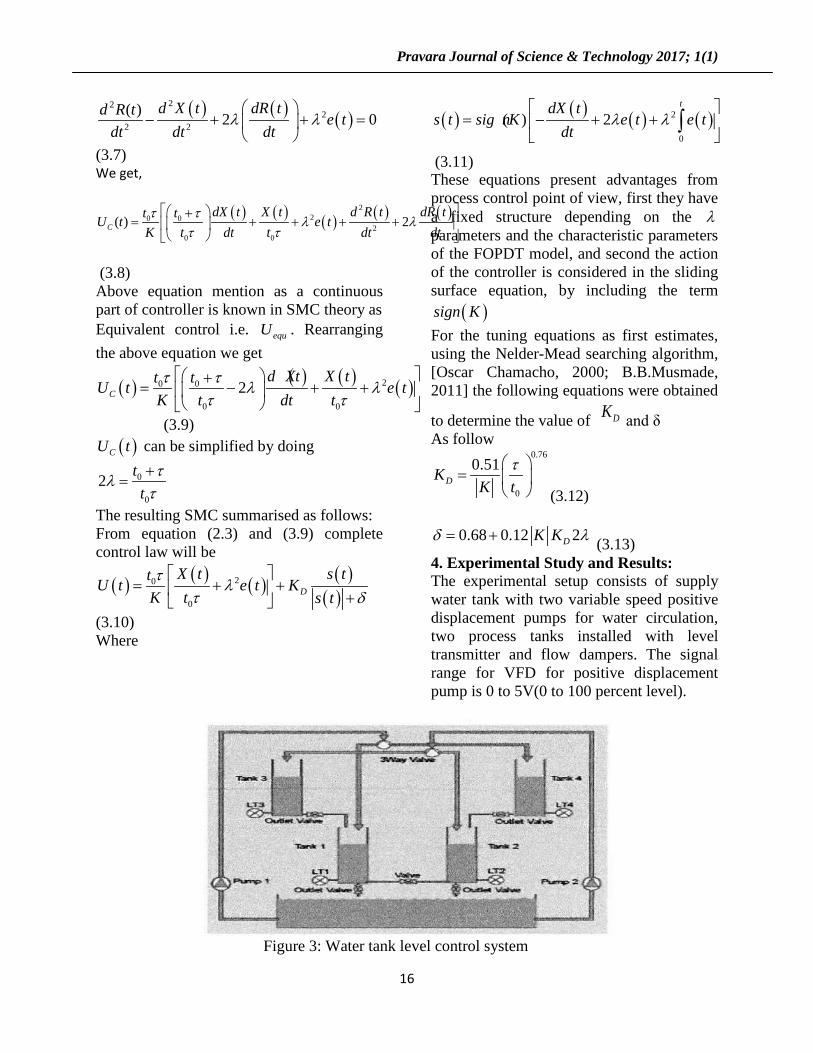
4. Experimental Study and Results: The experimental setup consists of supply water tank with two variable speed positive displacement pumps for water circulation, two process tanks installed with level transmitter and flow dampers. The signal range for VFD for positive displacement pump is 0 to 5V(0 to 100 percent level).
Figure 3: Water tank level control system

Pravara Journal of Science & Technology 2017; 1(1)
17
Sliding mode controller technique design to regulate nonlinear process, this controller is used to regulate real time data i.e. level of the tank. Level control setup is used for experimentation controller of this techniques are implemented in Matlab’s (Simulink), tuning parameters are calculated by approximating the Multivariable level control process, model by system identification and thus tuning parameters calculated from approximated model. The set point given is 40. level get settle at this point after action of controller, as level is
calibrated as 0 to 5V corresponding to 0-100 percent level. The process approximated FOPDT model given as Thus, from FOPDT model
( )4
0.6435 1
s
G ss
e−
=+
(4.1) Parameters of SMC calculated from approximated model, Parameters are used in the designing of Continuous and discontinuous part of design Tuning parameters by design formula obtained as
SMC Tuning Parameters Values DK 4.1430
δ 0.7675 λ 0.13925
Table 1: SMC tuning parameters Experimental Results
Figure 4: Plant Output
Figure 5: Control Output
Figure 6: Sliding Surface

Pravara Journal of Science & Technology 2017; 1(1)
18
Step response of plant as shown in fig (4), controller parameters obtained as Controller Rise time Settling time % overshoot
SMC 174.7965 2.860 5.032 Table 2: Experimental Results Results with Disturbance
Figure 7: Plant Output with 10% change in flow rate
Figure 8: Control Output 10% change in flow rate
Figure 9: Sliding Surface with 10% change in flow rate
5. Conclusion: In this paper, the basic of sliding mode control is studied along with its control strategies, its application to acquire the desired outcomes. It deals with the very basics of sliding motion, the presence of sliding surface and its control. From the empirical FOPDT model set of equations obtained is used to calculate the tuning parameters of SMC. With the performance of sliding mode controller for level control process, we can conclude that it gives better set point tracking and satisfactory disturbance rejection.
References [1] J.Y. Hung, W. Gao, J.C. Hung(1993), Variable structure control: a survey, IEEE Transactions on Industrial Electronics 40, pg.2-21 [2] V.I., Utkin, Variable structure systems with sliding modes(1997), Transactions of IEEE on Automatic Control, AC-22,No.2, pg.212-222 [3] Oscar Camacho, Carloas. A. Smith February (2000),’ Sliding mode control: An approach to regulate nonlinear chemical processes’, ISA Transactions [4] Oscar Camacho, Ruben Rojas, Winston Garcia(2007), ’Some long time delay Sliding Mode Control approaches’ ISA Transactions 46, pg.95-101
Pravara Journal of Science & Technology 2017; 1(1)
19
[5] lyas Eker January (2006), ’Sliding mode control with PID sliding surface and experimental application to an electromechanical plant’ ISA Transactions, Volume 45, pages 109-118. [6] B. B. Musmade, R. K. Munje, B. M. Patre March (2011)’Design of Sliding Mode Controller to Chemical Processes for Improved Performance’ International Journal of Control and Automation Vol.4, no.1. [7] Senthil Kumar B, Dr. K. Suresh Manic(2015) ’Sliding Mode Control of Rotary Inverted Pendulum’, International Journal of Applied Engineering Research, ISSN vol.no.66, 0973-4562. [8] M. Abid, A. Mansouri, A. G. Aissaoui (2008), Sliding Mode Application in Position Control of an Induction Machine, Journal of Electrical Engineering, Vol. 59, No.6, pp. 322-327. [9] Boiko I. (2005). Analysis of sliding modes in the frequency domain. Int. J. Control, 78 (13), pp. 969–981. [10] Oscar Camacho(2005), ’Sliding Mode Control in Process Industry’ Liptak, chapter 2.30, pg.351-360.
List of Notatations Acronyms FOPDT First order plus dead time SMC Sliding mode controller VSC Variable structure control Mathematical Notation G(s) transfer function KD control gain KP process gain K static gain δ delta (tuning parameter) λ lambda (Dead time) S switching surface V Lyapunov function
[11] V. Utkin, J. Guldner, J. Shi(1999),’Sliding Mode Control in Electromechanical Systems’, 2nd edition., Taylor and Francis, London.
[12] Utkin V. (1992). Sliding Modes in Control and Optimization, Berlin: Springer-Verlag
Pravara Journal of Science & Technology 2017; 1(1)
20
Evaluation Isolation and Characterization of Chemical constituents from
C. bonducella L. seed Sunayana Vikhe*
Pravara Rural College Of Pharmacy, Loni.
, Sunil Nirmal.
Abstract:
The objective of the present work is to study the different Pharmacognostic parameters of the seeds of C. bonducella and to isolate and characterize the chemical constituents from the seeds that are responsible for the activity. In pharmacognostic study of seeds of C. bonducella, macroscopy, microscopy, powder characteristic, and physical parameters were studied. Column chromatography of active extract; Structure elucidation of active fraction was done to isolate and characterize various chemical constituents. The alcohol soluble extractive value was found to be greater than water soluble extractive value. Petroleum ether extract showed the presence of steroids and terpenes. Ethanol extract showed positive test for flavonoids, alkaloids, glycosides, and tannins. By GC-MS analysis of saponified matter of petroleum ether extract contains fatty acid viz. hexadecanoic acid and 9-methyl-8-tridecen-2-ol, acetate. The unsaponified matter contains colour pigments namely lycoxanthin and carotene. Keywords: Caesalpinia bonducella, seeds, extract, Thin layer Chromatography, GC-MS.
Introduction: In present study Caesalpinia bonducella used as a drug candidate derived from Kingdom: Plantae, Order: Febales, Family: Caesalpiniacaeae, Genus: Caesalpinia, Species: C. bonducella; Part used: Seeds of C. bonducella linn. Commonly known as Kakachika, Karanja. Seed Used in the treatment of intermittent fever, asthma, colic. Also used as antiperiodic, in dyspepsia, dentrifice, filariasis [Nadkarni, K.M., 1986; Kirtikar, K.R., Basu, B.D., 1987; Anonymous, 1992]. The seed kernel of plant C. bonducella mainly contains bonducin [Elizabeth, M. Williamson], natin [Anonymous, 1996] and sulphur compounds [Ghatak NG, 1934]. The seed also contains fatty acids [Elizabeth, M. Williamson]. The root mainly shows the presence of diosgenin as chemical constituent [Elizabeth, M. Williamson, 2002]. The leaf also contains
proteins [Elizabeth, M. Williamson].The fruit contains saponins viz, saponin C and saponin D [Puri HS, 1980]. 2. Materials and methods: 2.1: Plant Material
Mature seeds of C. bonducella was collected and authenticated by Dr. T. Chakraborty, Joint Director, Botanical Survey of India (Voucher number: BSI/CAEB7PRAK).
2.2 Pharmacognostic evaluation: 2.2.1 Macroscopic evaluation: Different parameters were studied in macroscopic evaluation of C.bonducella seeds that are color, odor, size and shape [Khandelwal, K.R., 2005].
Pravara Journal of Science & Technology 2017; 1(1)
21
2.2.2 Microscopic evaluation:
Microchemical and powdered characteristic of fresh seed was taken for microscopical evaluation [Khandelwal, K.R., 2005].
2.3 Determination of foreign organic matter: The foreign organic matter was separated manually as completely as possible. Sample was weighed and percentage of foreign organic matter was determined from the weight of the drug taken [Anonymous, 1996].
2.4 Determination of moisture content:
Sample was dried to constant weight. After drying it was collected to room temperature in a desiccator. Weighed and calculated moisture content in terms of percent w/w [Anonymous, 1996].
2.5 Determination of ash values: Ash value contains inorganic radicals like phosphates carbonates and silicates of sodium, potassium, magnesium, calcium etc. Such radicles are then removed by treating with acid and then acid insoluble ash value is determined [Khandelwal K.R., 2005].
2.6 Determination of extractive values: Different extractive values like
alcohol soluble extractive, water soluble extractive values were performed by standard method [Anonymous, 1996].
2.7 Extraction:
The seeds of C. bonducella was collected and dried in the shade and then powdered in a grinder. The powdered seeds were utilized for extraction. Material was passed through 120 meshes to remove fine powders and coarse powder was used for extraction. A method described in [Chakrabarti et.al, 2003] was used for extraction of powdered plant.
Technique: Soxhlet Extraction.
Procedure: The extraction was carried out in several batches by using solvents like petroleum ether and 70% ethanol in water. The extraction was carried using petroleum ether in Soxhlet extractor till all the constituents were extracted. Absence of colored spot on plate indicates complete extraction. After completion of extraction, solvent was distilled off and concentrated extract was air-dried. The extract was stored in airtight container. The same procedure was followed using 70% ethanol [Chakrabarti et.al, 2003; Chakrabarti et.al, 2004].
2.8. Preliminary phytochemical test [Khandelwal, K.R., 2005]: The extracts obtained after extraction were characterized by preliminary phytochemical test for rough ideas of constituents present in extract. 2.9. Thin layer chromatography [Stahl, 1969]: 1. Detection of Sugar: Stationary phase=Silica gel-G, Mobile phase=Benzene: Glacial Acetic Acid: Methanol (20:20:60), Chamber saturation=30 min, Visualization= Anisaldehyde sulphuric acid, Extract=70% Ethanol 2. Detection of Alkaloids: Stationary phase=Silica gel-G, Mobile phase =Toluene: Ethyl acetate: Diethylamine (70:20:10), Chamber saturation=30 min, Visualization= Dragendorffs, Extract=70% Ethanol
3. Detection of flavonoids: Stationary phase=Silica gel-GS, Mobile phase= Ethylacetate: Formic acid: Glacial acetic acid: water (100:11:11:26), Chamber saturation=30 min, Visualization= Anisaldehyde- sulphric acid, Extract=70% Ethanol
4. Detection of Glycoside: Stationary phase=Silica gel-G, Mobile phase=Chloroform: Methanol: Water (65:35:10), Chamber saturation=30 min,
Pravara Journal of Science & Technology 2017; 1(1)
22
Visualization=Sodium Nitroprusside reagent, Extract=70% Ethanol
5. Detection of Terpene: Stationary phase= Silica gel-G, Mobile phase=Toluene: Ethylacetate (9:1), Chamber saturation=30 min, Visualization=Vanillin – Sulphuric Acid, Extract=Petroleum ether.
2.10 Column chromatography of active extract: Chemical constituents from 70% ethanol extract were isolated using column chromatography.
Experimental column chromatography: Height=55 cm, Diameter of column= 2 cm, Mobile phases= i) Ethyl acetate (100%), ii) Ethyl acetate: Methanol (9:1), iii) Ethyl acetate: Methanol (7:3), iv) Ethyl acetate: Methanol (5:5), v) Ethyl acetate Methanol: (3:7), vi) Ethyl acetate Methanol: (2:8), vii) Ethyl acetate Methanol: (1:9), Number of fractions collected= Seven.
2.11: Saponification of petroleum ether extract of C. bonducella seeds- Reflux the petroleum ether extract with 25 ml of ethanolic KOH for about 30 min. Took proportionate quantity of water and transferred to the separating funnel. It was shaking with solvent ether and the ethereal layer was collected and evaporated which contains unsaponified matter. Now the remaining hydro alcoholic layer was made acidic with 10% HCl and transferred it to the separating funnel and again shaken with solvent ether. This ethereal layer contains fatty acid. Unsaponifiable matter and fatty acids were analyzed by GC-MS.
2.12 Structure elucidation of active fraction: Fraction no. 1 eluted with ethyl acetate was found in more significant amount and pure in TLC hence it was subjected to GCMS and FTIR studies. Ethyl acetate (100%) fraction: Description: White, Solubility: Soluble in methanol.
Melting point : 136-1400
Sr. No.
C, Instrumental condition: 1.FT-IR, 2.GC-MS Analysis.
3. Results 3.1. Macroscopic evaluation: Table no.1
Parameter Features of seed
1 Color Green 2 Odor Characteristic 3 Taste Bitter 4 Size 2-4 cm long,1-2 cm
diameter 5 Shape circular
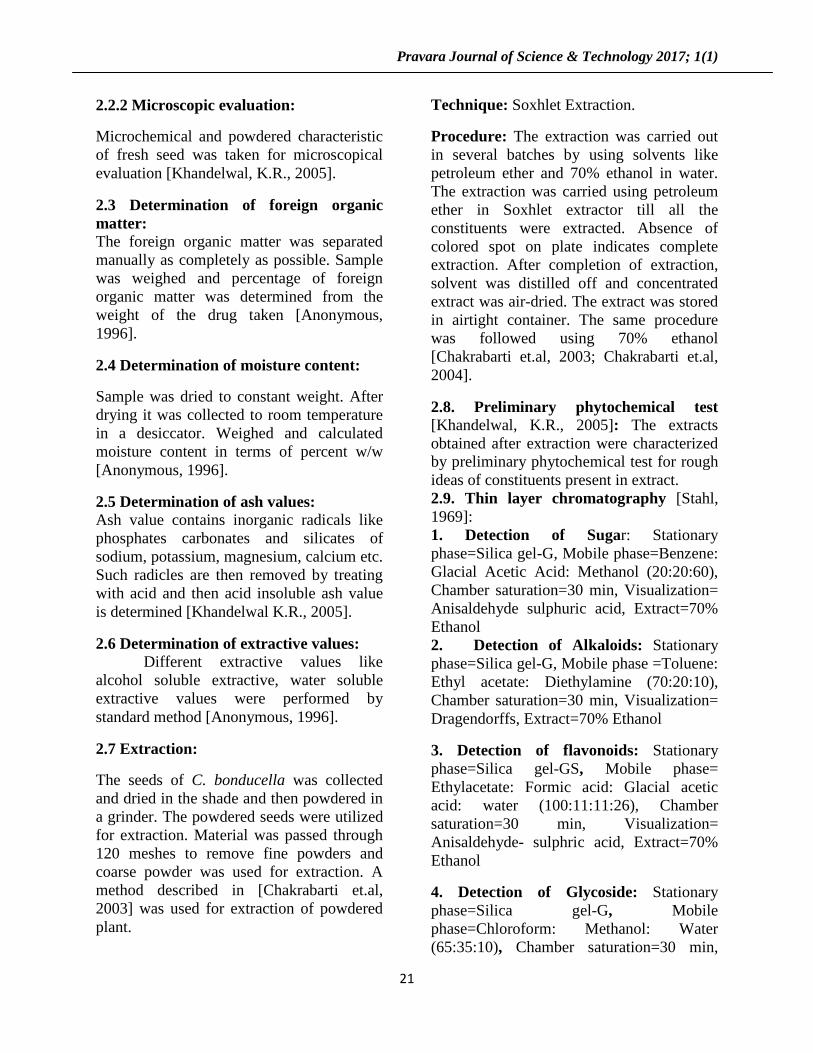
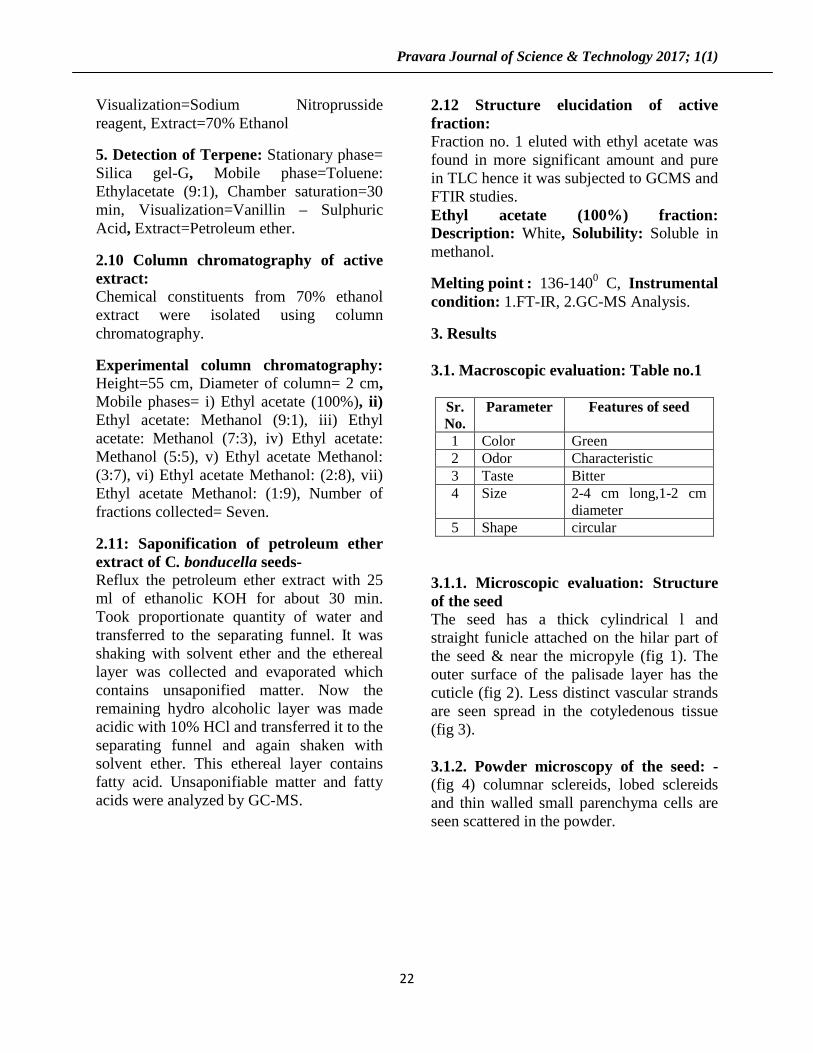
3.1.1. Microscopic evaluation: Structure of the seed The seed has a thick cylindrical l and straight funicle attached on the hilar part of the seed & near the micropyle (fig 1). The outer surface of the palisade layer has the cuticle (fig 2). Less distinct vascular strands are seen spread in the cotyledenous tissue (fig 3). 3.1.2. Powder microscopy of the seed: - (fig 4) columnar sclereids, lobed sclereids and thin walled small parenchyma cells are seen scattered in the powder.
Pravara Journal of Science & Technology 2017; 1(1)
23
Figure (1) Figure (2) Figure (3)
Figure (4)
3.2: Pharmacognostic constants: Table no.2
Sr. No. Evaluation parameters Value (%w/w) 1 Foreign organic matter 1 2 Moisture content 5.5 3 Total ash value 4.9 4 Water-soluble ash value 1 5 Acid-insoluble ash value 1 6 Water soluble extractive value 4.45 7 Alcohol soluble extractive value 10

Pravara Journal of Science & Technology 2017; 1(1)
24
3.3: Preliminary phytochemical test: Table no.3. Sr.no Chemical Test Petroleum ether
Extract 70% Ethanol Extract
1 Carbohydrate a) Molisch test b) Fehlings test c) Benedicts test d) Barfoed’s test
- - - -
- - - -
2 Protein a) Biuret test b) Millions test
- -
- -
3 Amino acid a) Ninhydrin test
-
-
4 Steroid a) Salkowski test b)Liebermann-Burchard reaction c) Liebermann’s reaction
+ + +
- - -
5 Glycoside a) Deoxysugares (Keller-killani test) b) Borntrager’s test
- -
+ +
6 Alkaloid a) Dragendroff’s test b) Mayer's test c) Hager’s test d) Wagner’s test
- - + -
+ + + -
7 Test for Flavonoids a) Lead acetate b) Sodium hydroxide c) Shinoda test
- - -
+ - +
8 Test for Saponins a) Foam formation test
-
-
9 Tannin(Phenolic compounds) a) 5% Ferric chloride test b) Lead acetate test c) Dilute Iodine test d) Dilute nitric acid test e) Potassium-dichromate test f) Acetic acid
- - - - - -
+ + - - - +
+: indicates presence of constituents - : indicates absence of constituents
Pravara Journal of Science & Technology 2017; 1(1)
25
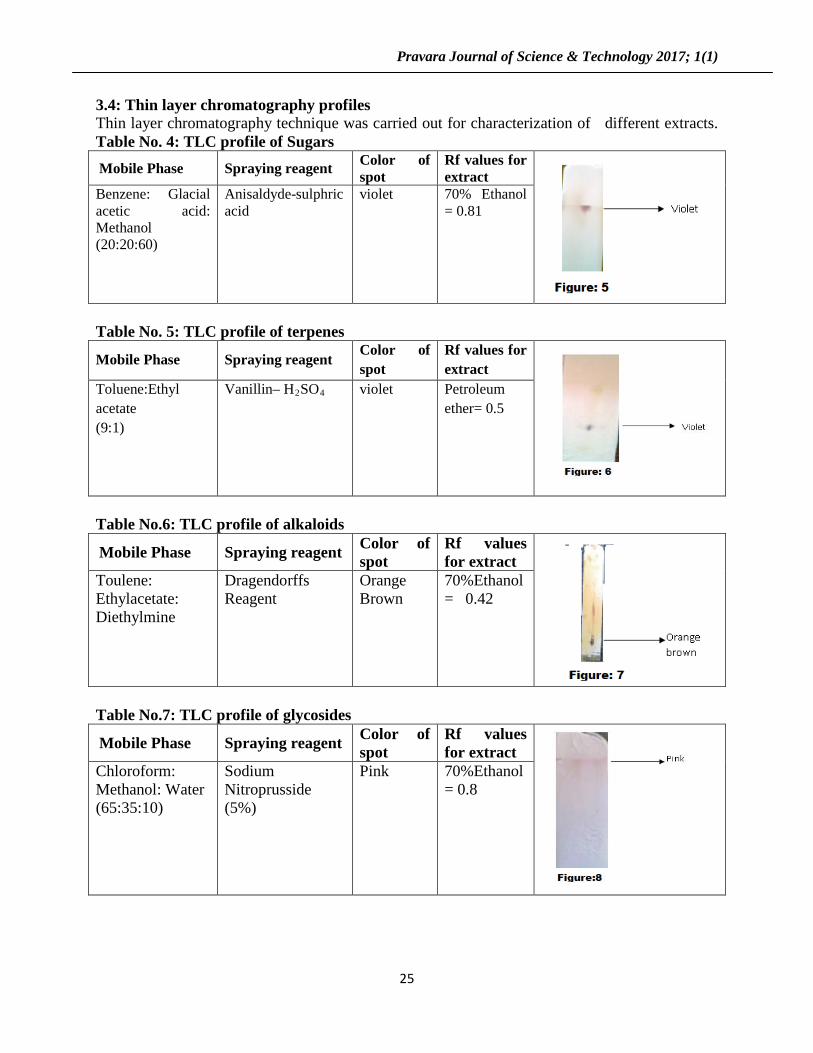
3.4: Thin layer chromatography profiles Thin layer chromatography technique was carried out for characterization of different extracts. Table No. 4: TLC profile of Sugars Mobile Phase Spraying reagent Color of
spot Rf values for extract
Benzene: Glacial acetic acid: Methanol (20:20:60)
Anisaldyde-sulphric acid
violet 70% Ethanol = 0.81
Table No. 5: TLC profile of terpenes
Mobile Phase Spraying reagent Color of spot
Rf values for extract
Toluene:Ethyl acetate (9:1)
Vanillin– H2SO violet 4
Petroleum ether= 0.5
Table No.6: TLC profile of alkaloids
Mobile Phase Spraying reagent Color of spot
Rf values for extract
Toulene: Ethylacetate: Diethylmine
Dragendorffs Reagent
Orange Brown
70%Ethanol = 0.42
Table No.7: TLC profile of glycosides
Mobile Phase Spraying reagent Color of spot
Rf values for extract
Chloroform: Methanol: Water (65:35:10)
Sodium Nitroprusside (5%)
Pink 70%Ethanol = 0.8

Pravara Journal of Science & Technology 2017; 1(1)
26
Table No.8 : TLC profile of flavonoids Mobile Phase
Spraying reagent
Color of spot
Rf values for extract
Ethyl acetate: Formic acid: Glacial acetic acid: water(100:11:11:26)
Anisaldehyde-sulphric acid
Green
70% Ethanol = 0.5
3.5. Column Chromatography: Table No. 9
Fraction Mobile phase Concentration Physical appearance % Yield (gram)
1 EA 100% White 1.1 gm
2 EA : MEOH (9:1) Brown 0.8 gm
3 EA : MEOH (7:3) Black brown 0.7 gm
4 EA : MEOH (5:5) Black brown 0.7 gm
5 EA : MEOH (3:7) Brown 0.5 gm
6 EA : MEOH (2:8) Brown 0.4 gm
7 EA : MEOH (1:9) Brown 0.4 gm
3.6. Saponification results: Table no. 10
Constituent Rt (min) Amount (%)
9-methyl-8-tridec an-2-ol-acetate 11.0 5.78 Hexedecanoic acid 13.0 74.8
3.7 Structure elucidation of active fraction:
1) GC-MS analysis of ethyl acetate fraction-

Pravara Journal of Science & Technology 2017; 1(1)
27
2) Carotene, 3, 3’, 4, 4’- tetrahydro-1, 1, 2, 2-tetrahydro-1, 1-dimethoxy-2, 2-dioxo
3) 2-Hexadecanol
4) FT-IR analysis of ethyl acetate (100%) fraction: Figure:10.
Peak No. Identified Compound Base peak
Major Peaks
1. (Rt 8.9) Carotene,3,3’,4,4-tetrahydro-1,1,2,2-tetrahydro-1,1-dimethoxy-2,2-dioxo
73 73,92,106
Peak No. Identified Compound
Base peak Major Peaks
2 (Rt 10.5) 2-Hexadecanol 57 55,69,83,97,111
Pravara Journal of Science & Technology 2017; 1(1)
28
4. Discussion:
Seeds of Caesalpinia bonducella (Caesalpiniaceae) were used for studying pharmacognostical, phytochemical characters and evaluation of chemical constituents.
5. References:
1. Nadkarni, K.M., 1986. Indian Materia Medica, 3rd
2. Kirtikar, K.R., Basu, B.D., 1987. Indian Medicinal Plants. 2
Edn, Vol. I, Bombay.
nd
3. Anonymous, 1992.The Wealth of India, Raw materials, Vol III, CSIR, New Delhi.
ed. Dehradun.
4. Elizabeth, M. Williamson, Major Herbs of Ayurveda, Churchill.
5. Ghatak NG., Chemical examination of kernals of the seeds of Caesalpinia Bonducella, Proc. Indian Acad. Sci., 1934: 4, 141.
6. Elizabeth, M. Williamson , 2002, Major Herbs of Ayurveda, Churchill.
7. Puri HS. Bull. Med. Ethnobot. Res., 1980: 1, 384
8. Khandelwal, K.R., (2005). Practical Pharmacognosy Techniques and Experiments, 13th
9. Anonymous (1996).The Indian Pharmacopoeia, Vol.I, the Controller of
ed, Nirali Prakashan.
Publications, Government of India, New Delhi.
10. Chakrabarti, S, Biswas, T.K., Rokeya, B., Ali, L., Mosihuzzaman, M., Nahar, N., Khan, A. K., Mukherjee, B., 2003. Advanced studies on the hypoglycemic effect of Caesalpinia bonducella F. in type 1 and 2 diabetes in Long Evans rats.Fitoterapia.84, 41-6.
11. Chakrabarti, S., Biswas, T.K., Seal, T., Rokeya, B., Ali, L., Khan, A.K., Nahar, N., Mosihuzzaman, M., Mukherjee, B., 2004. Antidiabetic activity of Caesalpinia bonducella F.in chronic type 2 diabetic model in Long-Evans rats and evaluation of insulin secretagogue property of its fractions on isolated islets.Epub.97, 117-22.
12. Stahl, 1969. Thin Layer Chromatography Laboratory Handbook, II nd
ed, Springer publication.

Pravara Journal of Science & Technology 2017; 1(1)
29
Preliminary Phytochemical Analysis of Agricultural Pond Fresh Water Algae
Aher A. A. and Wabale A. S*.
Department of Botany
Padmashri Vikhe Patil College of Arts, Science and Commerce, Pravaranagar
Abstract
Algae are a rich and diverse source of pharmacologically dynamic natural products. Present paper deals with the phytochemical analysis of algal members of division Chlorophyta, Bacillariophyta and Cyanophyata. Preliminary phytochemical analysis revealed the presence of principal bioactive compounds- phenols, saponins, tannins, amino acids, coumarins and flavonoids.Current drifts in drug study from natural sources have shown that algae are hopeful organisms to afford unique biochemically active compounds. The present analysis defines the main constituent’s biosynthesized by algae with nascent profitable influence in food science, therapeutic industry and community health.
Key Words: Algae, Phytochemical analysis, bioactive compounds
Introduction Secondary metabolites derived from
algae have a broad range of biological activities such as antibiotic, antiviral, antioxidant, antifouling, anti-inflammatory, cytotoxic and antimitotic activities. These secondary metabolites show various applications in pharmaceutical industries. With the increasing apprehension now-a-days microalgae are paid more concentration as nutraceuticals in the markets. Many researchers suggest that biological composition of microalgae such as protein, carbohydrate, minerals and bioactive compounds are of potential medicinal value that influences the nutritional value (Brown and Jeffrey 1992; Fuentes et al., 2000). Bioactive compounds: polyphenols, catechin, flavonols, glycosides, and phlorotannins discovered from methanol extract of red, green and brown algae are been reported to have uniqueness in their molecular skeleton and structures
contributing to the strong antioxidant activity (Khoddami et al., 2013). Materials and Methods Preparation of algal extract:
Fresh algal materials were collected from the agricultural pond at Wakadi village during August 2016. After collection, algal materials were immediately washed with distilled water to remove epiphytes and adhering debris, and then dried at room temperature. The dried tissues were grinded to a fine powder. 10 g of algal powder was completely homogenized and extracted with 100 ml of methanol, acetone, ether, chloroform, alcohol solvent and distilled water for 24hrs. Clarification of algal mixture was carried out by filtration method using Whatman No.1 filter paper. The crude extracts were stored in the dark. Further these extracts were stored for estimating secondary metabolites.

Pravara Journal of Science & Technology 2017; 1(1)
30
Preliminary phytochemical studies The above condensed algal
extracts,were preliminarily assessed for the phytochemicals such as phenol, flavonoid, saponin, glycosides, alkaloids, tannins and terpenoids as: Qualitative Phytochemical Analysis Preliminary phytochemical analysis was carried out for the extract as per standard methods described by Brain and Turner (1975) and Evans (1996). 1) Detection of Alkaloids: Extracts were dissolved individually in dilute hydrochloric acid and filtered. The filtrates were used to test the presence of alkaloids by using following reagents
i)Mayer’s test: Filtrates were treated with Mayer s reagent. Formation of a yellow cream precipitate indicates the presence of alkaloids. ii)Wagner s test: Filtrates were treated with Wagner s reagent. Formation of brown/reddish brown precipitate indicates the presence of alkaloids.
2) Detection of Flavonoids i) Lead acetate test: Extracts were treated with few drops of lead acetate solution. Formation of yellow color precipitate indicates that the presence of flavonoids. ii) H2SO4
3) Detection of Steroids
test: Extracts were treated with few drops of H2SO4. Formation of orange colour indicates that the presence of flavonoids.
Two ml of acetic anhydride was added to 1ml of the extracts, each with two ml of H2SO4
4) Detection of Terpenoids
. The colour was changed from violet to blue or green in some samples indicate that the presence of steroids.
Salkowski’sTest: 1ml of the extract was mixed with 2ml of chloroform and concentrated H2SO4
5) Detection of Anthroquinones:
(3ml) was carefully added to form a layer. An appearance of
reddish brown colour in the inner face was indicates that the presence of terpenoids.
Borntrager’s Test: About 1ml of the extract was boiled with 10% HCl for few minutes in a water bath. It was filtered and allowed to cool. Equal volume of CHCl3 was added to the filtrate. Few drops of 10% NH3 were added to the mixture and heated. Formation of pink colour indicates that the presence anthroquinones. 6) Detection of Phenols:
i) Ferric chloride test: 10mg extracts were treated with few drops of ferric chloride solution. Formation of bluish black colour indicates that the presence of phenol. ii) Lead acetate test: 10ml extracts was treated with few drops of lead acetate solution. Formation of yellow colour precipitate indicates that the presence of phenol.
7) Detection of Saponins: About 0.5ml of the extract was shaken with five ml of distilled water. Formation of frothing (appearance of creamy miss of small bubbles) shows that the presence of saponins. 8) Detection of Tannins: A small quantity of extract was mixed with water and heated on a water bath. The mixture was filtered and ferric chloride was added to the filtrate. A dark green colour was formed. It indicates that the presence of tannins. 9) Detection of Carbohydrates Benedict’s test
To 0.5 ml of filtrate, 0.5 ml of Benedict’s reagent is added. The mixture is heated on a boiling water bath for 2 minutes. A characteristic colored precipitate indicates the presence of sugar 10) Detection of Protein & Amino acids
i) Biuret test: To 0.5 ml of extract equal volume of 40% NaoH solution and two drops of one percent copper sulphate solution was added. The appearance of
Pravara Journal of Science & Technology 2017; 1(1)
31
violet colour indicates that the presence of protein. ii) Ninhydrin test: About 0.5 ml of extract was taken and two drops of freshly prepared 0.2% Ninhydrin reagent was added and heated. The appearance of pink or purple colour indicates that the presence of proteins, peptides or amino acids.
11) Test for Glycosides For 50 ml of extract is hydrolyzed with concentrated hydrochloric acid for 2 hours on a water bath, filtered and the hydrolysate is subjected to the following tests. Borntrager’s test: To 2 ml of filtered hydrolysate, 3 ml of chloroform is added and shaken, chloroform layer is separated and 10% ammonia solution is added to it. Pink colour indicates presence of glycosides. 12) Cardiac glycoside Keller-Killani test- To 2 ml of extract, glacial acetic acid, one drop 5 % ferric chloride and concentrated sulphuric acid were added. Appearance of reddish brown colour at the junction of the two liquid layers indicates the presence of cardiac glycosides. 13) Test for Anthocyanins The presence of anthocyanins has been demonstrated by adding 2 mL of the plant extract with 2 mL of 2 N HCl. The appearance of a pink-red color that turns purplish blue after addition of ammonia indicates the presence anthocyanins. 14) Coumarins: 3 ml of 10% NaOH was added to 2 ml of aqueous extract formation of yellow colour indicates coumarins. 15) Emodins: 2 ml of NH4
OH and 3 ml of benzene was added to extract appearance of red colour indicates presence of emodins.
16) Phlobatannins Deposition of red ppt when aqueous extract of each plant sample is boiled with 1% Aqueous HCl was taken as evidence for presence of Phlobatannins RESULTS AND DISCUSSION The preliminary phytochemical analysis of the fresh water extract revealed the presence of sugar, protein, phenols, alkaloids, flavonoids, tannins, anthocyanins, glycosides, coumarins, phlobatannins, carbohydrates, anthraquinone (Table 1). Conclusion:
The algae possess an excellent source of basic primary and secondary metabolites that provides them with an ability to be used as an indigenous folk medicine by traditional healers. This can further be investigated in a wide scale for the purpose of drug development against various diseases. Quantitative phytochemical estimation of algae is very important in identifying new sources of therapeutically, industrially important compounds. Primary and secondary metabolites in a good amount those are adequate enough to fight against infection and major ailments. Phytochemicals are not essential nutrients and are not required by the human body for sustaining life, but have important properties to prevent or to fight some common diseases. The quantitative estimation of the screened phytochemicals may pave a way for the further analysis of the role that they play against any pathological process. And further studies on the isolation and characterization of the bioactive compound.

Pravara Journal of Science & Technology 2017; 1(1)
32
Table:1-Preliminary Phytochemical analysis of fresh water extract Sr.No Phycochemical Methanol Alcohol Ether Acetone Chloroform Aqueous
1 Alkaloids i)Wagner’s Test ii)Mayer’s Test
- - - - + -
- - - -- + -
2 Flavonoids i)Lead Acetate + - - - - - ii)H2SO4 - test - - - - -
3 Phenols i) Ferric chloride - - - - - - ii)Lead acetate + + + - - +
4 Tannins i)Ferric chloride + + - + - -
5 Terpenoids - - - - - - 6 Saponin - - - - - - 7 Steroids - - - - - - 8 Anthocyanins - - - + - - 9 Coumarins + + - - - - 10 Emodins - - - - - - 11 Glycosides + + - + - - 12 Anthraquinone - - - + - - 13 Cardiac
glycosides - - - - - -
14 Phlobatanins - + - - - - 15 Proteins + + - - - - 16 Carbohydrates + + - - - - References: [1] Anand Prakash Singh and B. R. Chaudhary(2010),Preliminary phytochemical Analysis and In Vitro Antibacterial Screening of Pithophora oedogonia(Mont.) Wittrock- A Freshwater Green Alga Forming Mats in the Water BodiesJ. Algal Biomass Utln., 1 (2): 33-41 [2] Brain K.R., and T.D. Turner,( 1975), The Practical Evaluation Of Phytopharmaceuticals, Wright- Science Technical, Bristol Britain., 144. [3] Evans, W.C., (1966),Trease Evans Pharmacognosy., 14 th Ed, London: WB Saunders Ltd, 119- 159
[4] Eldeen, E-M.Seow, R. Abdullah, S.F. Sulaiman., (2010), In Antibacterial, Antioxidant, Total Phenolic Contents And Anti-HIV-1- Reverse Transcriptase Activities of Extracts of SevenPhyllanthus Sp. South African Journal of Botany77, 75-79. [5]JayshreeAnnamalai, ThangarajuNallamuthu(2014),Antioxidant Potential Phytochemicals From Methanol Extract of Chlorella Vulgaris And ChlamydomonasreinhardtiiJ. Algal Biomass Utln., 5 (4): 60-67 [6] Khoddami A., Wilkes M.A. and Roberts T.H. (2013), Techniques for Analysis of Plant Phenolic Compounds Molecules.18: 2328- 2375.

Pravara Journal of Science & Technology 2017; 1(1)
33
[7] Mehdi Mohammadi,NajmehKazeroni, MehranJavaheriBaboli (2015) Fatty Acid Composition Of The Marine Micro Alga TetraselmisChuiiButcher In Response To Culture Conditionsj. Algal Biomass Utln.,6 (2): 49- 55 [8] Prashant Tiwari, Bimlesh Kumar, Mandeep Kaur, Gurpreet Kaur, Harleen Kaur(2011),Phytochemical Screening and Extraction: A ReviewInternationalePharmaceuticaScienciaJan-March 1(1) [9] Subhabrata Paul, Ruma Pal, Rita Kundu. (2012),AntiproliferativeActivity of
Phormidiumvalderianum and Phormidiumtenue(Cyanobacteria) on Human Cervical Cancer Cells (HeLa) in vitroJ. Algal Biomass Utln., 3 (4): 30–37 [10] Vasanthi P, Parameswari CS (2015) Antioxidant Potential of Different Medicinal Plants International Journal for Pharmaceutical Research Scholars (IJPRS)4: 1-4
Pravara Journal of Science & Technology 2017; 1(1)
34
A Case Report of Bilateral Hydrouretero Nephrosis Caused By Urinary
Calculi and Inflammation in Kidney and Review of Literature M.Sekar1, M.Madhavi latha2, R.Ramesh1, S.Priyanka1, D.Jyothi1, Ch.Archana1,T.V.Harsha
Varun
1. Santhiram College of Pharmacy, Nandyal, Kurnool Dt, Andhra Pradesh
1*
2. Santhiram Medical College & General Hospital, Nandyal, Kurnool Dt, Andhra Pradesh
INTRODUCTION
Bilateral hydrouretero nephrosis (BHUN) is characterized by dilation or swelling ureter and the kidney resulting from blockage of the urinary tract along the path of urine flow towards the bladder.1
The prevalence of BHUN in general population is 37% where as it rising to 64.8% in elderly women but the evidence of male patients is not available.
The blockage could be most likely due to kidney stone or a stricture (which can happen from a local growth or a tissue mass compressing the out flow of the tract. The hydrouretero nephrosis is usually attributed to kinking of the ureters by bands or vessels and occasionally to compression of the ureter as it passes over the isthmus. The important pathological point is how much damage is done by the hydronephrosis to the renal tissue) as the nephrons can be damaged both by back pressure and by interference with their blood supply.
CASE REPORT
A 65 years, male patient was admitted in hospital two months before, he complained pain in the abdomen in past 25 days and the pain gradually moved to entire abdomen region. He also described difficulty in passing urine, drifting of urine and loose stools for last three days. He had no history
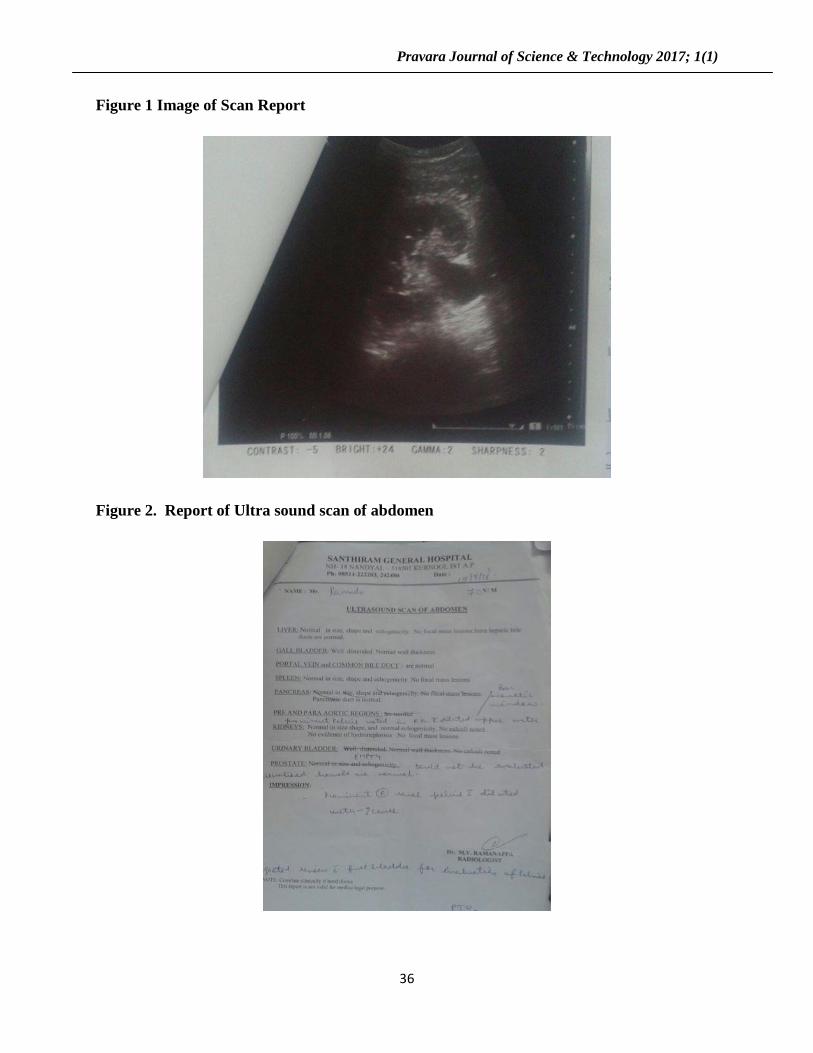
of diabetes and hypertension. There was no notable finding in physical examinations except bilateral pedal oedema. He was a non smoker and non alcoholic and there was no significant past history. Test for retro viral and hepatitis B & C were negative, the investigation of hemoglobin 10.3 g/dl level was low and slightly elevated /reduced renal parameters like serum creatinine 1.22mg/dl and blood urea 5.5mg/dl. The ultra sound abdomen and pelvis revealed prominent right renal pelvis with dilated ureter (Fig. 1). Intravenous urogram was not done due to altered parameters and patient was subjected to diuretic renogram to assess functional status and drainage pattern of the kidneys. Renogram revealed decreased tracer uptake and delayed excretion of tracer on both side of the kidneys. His blood and urine chemistry and blood count test were not significant. (Table 1) There was a history of surgery done for ten years before in the right hip joints.
DISCUSSION A patient with dual functioning of kidneys with ureamic symptoms and suspected to have BHUN. Patients with BHUN were significantly older.
There are several demographic groups that are considered to have an increased risk of hydro ureteo nephrosis. These groups include pregnant women (due to an

Pravara Journal of Science & Technology 2017; 1(1)
35
enlarging womb that may compress the ureters) men over age of the 50 years ( due to enlargement of prostate gland or prostate cancer), sexually active women (due to their risk for recurrent urinary tract infections) and those who are predisposed to recurrent kidney stones.2 A patient with dual functioning kidneys presenting with uraemic symptoms and suspected to have obstructive uropathy must be presumed to necessarily have bilateral renal obstruction.3
CONCLUSION
It is important that to try to identify the causes of BHUN and follow dilated ureter to bladder to try to determine the cause. The laboratory data is presented in Table 1. A renal ultrasound revealed bilateral hydroureteronephrosis with normal echogenicity of the parenchyma (Figure 1).
The goal of the treatment of BHUN is to free the blocked urine and regain the free flow of urine from the kidney to the bladder; the initial treatment of patients is directed at decreasing pain level and preventing any urinary tract infections by using antibiotics. Surgical interventions may be required but depends up on the causes of BHUN. Bladder catheterization may be all that is needed in some cases such as with urinary retention. A stent may be placed to bypass the obstructions and allow the urine to flow out of the kidney. A percutaneous nephrostomy can also be placed when a stent cannot be used.
Table – 1 Laboratory investigation (Blood)
Test Result Sodium 136 mEq/L
Potassium 2.9 mEq/L Chlorides 102 mEq/L TWBC 8 – 800 /c.mm
Polymorphs 75 % Lymphocytes 15 % Eosinophills 07 % Monocytes 03 % Basophills 00 %
ESR 10 mm/hr Heamoglobin 10.4 g/dl
RBS 77 mg/dl Sr creatinine 1.22 mg/dl Sr amylase 22U/l
Urea 55 mg/dl
Pravara Journal of Science & Technology 2017; 1(1)
36
Figure 1 Image of Scan Report
Figure 2. Report of Ultra sound scan of abdomen
Pravara Journal of Science & Technology 2017; 1(1)
37
REFERENCE
1. Singh I, Strandhopy JW, Assimos
DG. Pathophysiology of urinary tract
obstruction. In: Wein AJ, ed.
Campbell-Walsh Urology. 10th ed.
Philadelphia, PA: Elsevier Saunders;
2011: chap 40.
2. http://www.merckmanuals.com/hom
e/kidney-and-urinary-tract-
disorders/obstruction-of-the-urinary-
tract/urinary-tract-obstruction
3. Kawamura, D., & Lunsford, B.
(2012). The Kidneys. In Diagnostic
Medical Sonography: Abdomen and
Superficial Structures (3rd ed., pp.
306-311). Baltimore: Lippincott,
Williams and Wilkins. Lusaya, MD,
D. (2013, February 14).
.
Pravara Journal of Science & Technology 2017; 1(1)
1
Natural Coagulants for Wastewater treatment: Review V. D. Talnikar*
Chemical Engineering Department
Sir Visvesvaraya Institute of Technology, Chincholi, Nashik.
Abstract
The natural coagulants can treat water from high to low turbid water and having remarkable removal efficiency that can be used for drinking purposes. Natural coagulants are usually supposed safe in human health point of view. These natural coagulants are usually used as coagulant in tanning Industry, dairy industry waste water treatment. A number of seed extracts, Maize, Chitosan, Palm oil and vegetable oil, Bentonite etc. are the promising natural coagulants for treatment of waste water. These treatments are also proved to be economical. A review of natural coagulants its effectiveness, and its applications has been presented. Key words: Polluting industry, seed extracts, Maize, Chitosan, treatment.
Introduction At present, in order to decrease waste hazards and to restrict the resulted effects on the environment, investigators studying the possibility of using new methods and materials to treat wastewater. Coagulation and flocculation process are physical-chemical methods that widely used in the treatment of wastewater. The key concern of the environmental engineers is how to lower the coagulants and flocculants cost and to improve the characteristics of the produced sludge for safe utilizing. Flocculation and coagulation constitute the backbone process in most waste water and water treatment plants. Their aim is to increase the separation of particulate species in down-stream processes such as filtration and sedimentation and (Kaladevi and Preetha, 2013). The increasing industrialization and urbanization with considerably increasing the rate of water pollution. Curtail in supplies of natural resources of water have made this a serious limitation for industrial growth and for a reasonable standard of urban living (Baisali et al. 2006).
In order to decrease waste hazards and to restrict the resulted effects on the environment, research for the wastewater treatment is necessary. The applicability and possibility of using new methods and materials to treat wastewater is the demand. Coagulation and flocculation process are physical and chemical methods that are extensively used in the treatment of waste water. Presently, the prime concern of the environmental engineers is how to lower down the coagulants and flocculants cost and to improve the characteristics of the produced waste for safe utilization. Scope for the Treatment Tanning Industry is one of industries, which is considered as highly polluting industry (APPCB Information Bulletin. 2005). Tanneries generate wastewater in the range of 30 - 35 l/kg skin or hide processed with variable pH and high concentrations of suspended solids, BOD, COD. Major problems are due to wastewater containing heavy metals, toxic chemicals, chloride, lime with high dissolved and suspended salts and other pollutants (Durai et al. 2011). Tanning industry is one of the highest polluting industry which is highly complex and is characterized by high BOD, COD,

Pravara Journal of Science & Technology 2017; 1(1)
39
suspended solids, settleable solids, sulfide, chloride and chromium. Untreated tannery effluents when discharged directly into the water bodies or into the open lands cause irreversible damage to the environment. Coagulation–flocculation is one of the most important physicochemical treatment steps employed in industrial wastewater treatment to reduce the suspended and colloidal materials responsible for turbidity of the wastewater. During the last decade, more interest has been given on the use of natural coagulants in treating industrial wastewater (Tasneembano and Arjun, 2013). The dairy industry is generally considered to be largest source of food processing. These industries wastewater is characterized by high COD, BOD, nutrients etc. Such wastewater is to be treated natural coagulants and then tests are to be carried to check the water characteristics like BOD, COD, pH and turbidity, etc. The initial pH, Turbidity, COD are 7.41. 289.5 NTU, 10000 mg/l respectively (Chidanand and Manika 2015). An important concern of the environmental industries, is to lower the coagulants and flocculants cost and at the same time to improve the characteristics of the produced sludge to be safely utilized. To overcome this problem the use of natural coagulants are attempted to treat such kinds of wastewater. Natural Coagulants Choy et al. indicated turbidity in general is a measure of water cloudiness induced by suspended and colloidal matters and is also one of the major criteria in raw water monitoring to meet the stipulated water quality guidelines. Reduction of turbidity is often achieved using chemical coagulants such as alum. The use of alum is widely associated with potential development of health issues and generation of voluminous sludge. Natural coagulants that are available in abundance can certainly be considered in addressing the drawbacks associated with
the use of chemical coagulants (Choy, 2014). A coagulant is a substance which in solution, furnishes ionic charges opposite to those of the colloidal turbid particles present in water. Coagulants neutralize repelling the charges on the colloidal particles and produce a jelly- like spongy mass called a flock. Flocculation causes considerable increase in the density and size of coagulated particles resulting in an effective rate of settling of the particles in a solution or in the wastewater (Ellis, 1988). In order to treat water the natural coagulants proved to be effective one. Surjana Seed is a seed of tropical plant of Moringa oleifera from family of Moringaceae. Moringa oleifera commonly known as drum stick is the known species which grows quickly even at low altitudes, generally used as medicine, vegetable and sources of vegetable oil. In Indian region the Surjana is easily available (Patel, 2013). A number of seed extracts have been known to flocculate particles resin water and the following procedure has been used and which if developed may yield divides. It include; 1) Extract the seeds from the plant fruit. 2) Dry seeds for up to three days. 3) Grind the seeds to a fine powder. 4) Prepare a mixture of water and ground seed material (the volume of water depend on the type of seed material used) in case of Moringa oleifera , add 100 cm3of water for each seed; for peach or bean seeds, add water to each 0.3 to 0.5 g of ground material. 5) Mix this solution for 5 to 10 minutes: the faster it is stirred, the less time is required. 6) Finally, after the sediments settle, decant the treated water, testing it for pH, color and turbidity. But with wetland system, water hyacinth is the most popular plant used in phytoremediation (Yongabi, 2010). It has been reported that Moringa oleifera seeds reduces bacterial count in wastewater by at least 99% Wetland treatment system using
Pravara Journal of Science & Technology 2017; 1(1)
40
totora have been observed as efficient at removing nutrients and oxygen demanding substances from effluent. It has been seen to remove parasites, total and faecal coliforms from inflows by 88-99% (Yongabi, 2010).
Maize (scientific name: Zea mays) is commonly known as corn in many countries. The Maize seeds are easily and abundantly available in Indian region. The seed of maize plant may be washed with water to remove dust and were dried in an oven at 60 ± 2°C. The dried seed were crushed and powdered and sieved through 200 μm nylon sieves and used as coagulant. Researchers had tried to utilize maize seeds as coagulant aid (Patel, 2013).
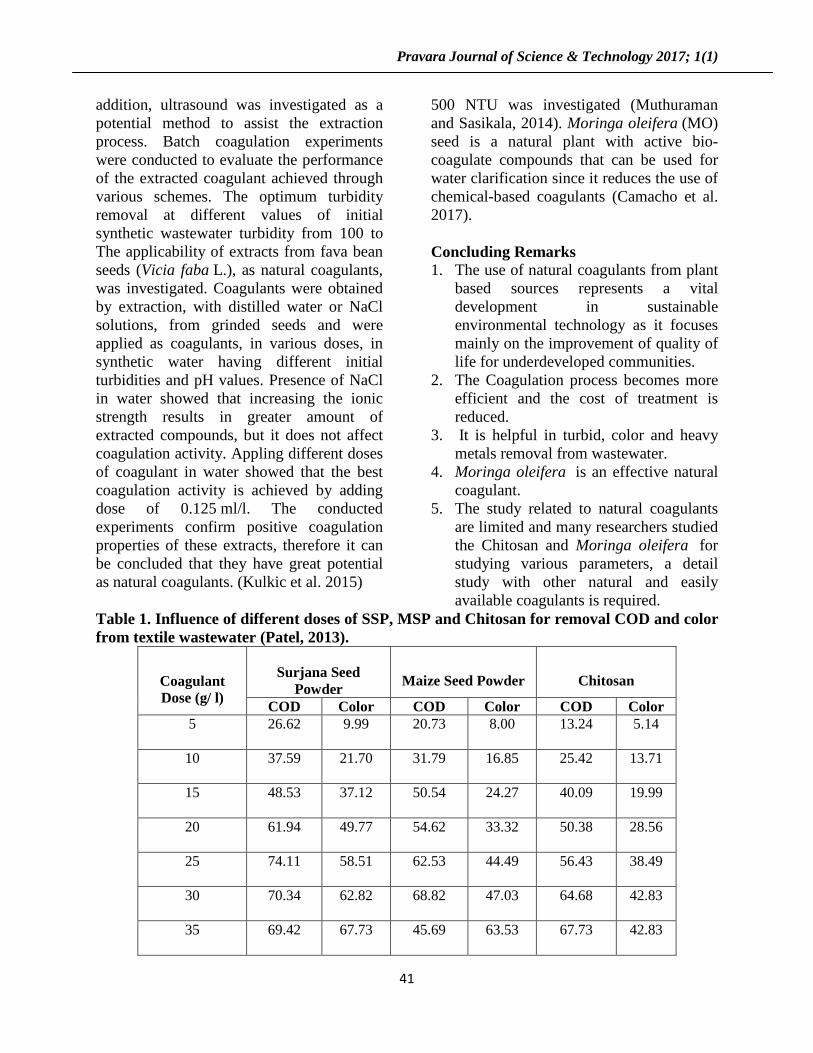
Chitosan is cellulose like biopolymer widely distributed in nature, especially in marine invertebrates, insects, fungi, and yeasts. Its deacetylation of chitin [poly-β-(1 → 4) -N-acetyl-Dglucosamine, is readily soluble in acidic solutions, which makes it more available for applications. Chitosan is a yellow colored powder, non-toxic, biodegradable, linear cationic polymer of high molecular weight with a number of applications including chromatography, water treatment, additives for cosmetics, textile treatment for antimicrobial activity, novel fibers for textiles, photographic papers, biodegradable films, biomedical devices, improvement of quality and shelf -life of food and microcapsule implants for controlled release in drug delivery. Also, it is utilized for recovery of suspended solids in processing wastes from poultry, eggs, cheese and vegetable operations (Patel, 2013). For the textile industry effluent treatment the Surjana Seed Powder, Maize Seed Powder and Chitosan showed prominent results. Table 1 shows that there was continuous removal with increases in coagulant doses up to 30.0 g l-1
Palm oil is one of the most important vegetable oil. The extraction and purification process create a lot of waste and is known as palm oil mill effluent (POME). Kaladevi and Preetha et al. showed the efficiency of natural coagulants for the treatment of POME with cacti species and zeamaize. Temperature, initial pH, mixing time, mixing speed and coagulant dose were the constant parameters throughout the experiment. Further treatment efficiency was determined by pH, conductivity, alkalinity, Turbidity, hardness, TDS, TSS, oil and grease, BOD and COD of the sample are estimated by standard method. The work indicated that both these traditional plants may contribute the treatment efficiency with respect to their potential characteristics (Kaladevi and Preetha, 2013).
, which may be due to increases of substantially. Natural
seed have been found to act as coagulant because natural seeds are naturally occurring polyelectrolytes (bio colloids).
Bentonite is a natural material that contains essential compounds such as aluminium, iron and clay materials which are useful for the treatment of wastewater. Moreover, bentonite is cheaper than several other chemicals and it fulfils the economic benefits of the operators as well as environmental concerns (Syafalni et al. 2013). Muthuraman and Sasikala investigated the ability of three plant materials, seeds such as Moringa oleifera, Strychnos potatorum and Phaseolus vulgaris, to act as natural coagulants was tested using synthetic turbid water formulated to resemble the drinking water. An improved and alternative method for the extraction of the active coagulant agent M. oleifera, S. potatorum, P. vulgaris seeds was developed and compared with the conventional water extraction method. In the new method the seeds were extracted using different solvents of NaCl and NaOH to extract the active coagulant agent from natural coagulants. In
Pravara Journal of Science & Technology 2017; 1(1)
41
addition, ultrasound was investigated as a potential method to assist the extraction process. Batch coagulation experiments were conducted to evaluate the performance of the extracted coagulant achieved through various schemes. The optimum turbidity removal at different values of initial synthetic wastewater turbidity from 100 to
500 NTU was investigated (Muthuraman and Sasikala, 2014). Moringa oleifera (MO) seed is a natural plant with active bio-coagulate compounds that can be used for water clarification since it reduces the use of chemical-based coagulants (Camacho et al. 2017).
The applicability of extracts from fava bean seeds (Vicia faba L.), as natural coagulants, was investigated. Coagulants were obtained by extraction, with distilled water or NaCl solutions, from grinded seeds and were applied as coagulants, in various doses, in synthetic water having different initial turbidities and pH values. Presence of NaCl in water showed that increasing the ionic strength results in greater amount of extracted compounds, but it does not affect coagulation activity. Appling different doses of coagulant in water showed that the best coagulation activity is achieved by adding dose of 0.125 ml/l. The conducted experiments confirm positive coagulation properties of these extracts, therefore it can be concluded that they have great potential as natural coagulants. (Kulkic et al. 2015)
Concluding Remarks 1. The use of natural coagulants from plant
based sources represents a vital development in sustainable environmental technology as it focuses mainly on the improvement of quality of life for underdeveloped communities.
2. The Coagulation process becomes more efficient and the cost of treatment is reduced.
3. It is helpful in turbid, color and heavy metals removal from wastewater.
4. Moringa oleifera is an effective natural coagulant.
5. The study related to natural coagulants are limited and many researchers studied the Chitosan and Moringa oleifera for studying various parameters, a detail study with other natural and easily available coagulants is required.
Table 1. Influence of different doses of SSP, MSP and Chitosan for removal COD and color from textile wastewater (Patel, 2013).
Coagulant Dose (g/ l)
Surjana Seed
Powder
Maize Seed Powder
Chitosan
COD Color COD Color COD Color 5 26.62
9.99 20.73 8.00 13.24 5.14
10 37.59
21.70 31.79 16.85 25.42 13.71
15 48.53
37.12 50.54 24.27 40.09 19.99
20 61.94
49.77 54.62 33.32 50.38 28.56
25 74.11
58.51 62.53 44.49 56.43 38.49
30 70.34
62.82 68.82 47.03 64.68 42.83
35 69.42
67.73 45.69 63.53 67.73 42.83

Pravara Journal of Science & Technology 2017; 1(1)
42
References
1.Baisali S, Chakrabarti P P, Vijaykumar A, Vijay K et al (2006)Wastewater treatment in dairy industries - possibility of reuse‖. Desalination 195:141–152.
2. APPCB Information Bulletin, (2005) Cleaner production concepts and methodologies for tanneries. .
3. Durai G, Rajasimman M, Rajamohan N et al (2011) Kinetic studies on biodegradation of tannery wastewater in a sequential batch bioreactor. J of Biotech Research, 3:19-26. 4. Tasneembano K, Arjun V, (2013) Treatment of Tannery Wastewater Using Natural Coagulants. IJIRSET 2:4061-4068.
5. Chidanand P, Manika H, (2015) Treatment of dairy wastewater by natural coagulants. International Research Journal of Engineering and Technology 2:1120-1125.
6. Choy S, Prasad K, Wu T, Raghunandan M et al. (2014) Utilization of plant-based natural coagulants as future alternatives towards sustainable water clarification. Journal of Environmental Sciences 26: 2178–2189.
7.Ellis Chlorination and Disinfection of Water (1988) Journal, American Water Association 336(4): 28 -44.
8. Yongabi K A, (2010) Biocoagulants for Water and Waste Water Purification: a Review. International Review of Chemical Engineering 2:444-458.
9. Patel H, Vashi R T, (2013) Comparison of naturally prepared coagulants for removal of
COD and color from textile wastewater, Global NEST Journal 15:522-528. 10. Kaladevi V, Preetha S S, (2013) Study on Traditional Plants Utilized for the Treatment of Effluent with Special Reference to Palm Oil Mill Industry. Universal Journal of Environmental Research and Technology 3:490-496. 11. Syafalni R, Abdullah I, Abustan A N, Ibrahim M et al (2013) Wastewater treatment using bentonite, the combinations of bentonite zeolite, bentonite-alum, and bentonite-limestone as adsorbent and coagulant. Int. J. of environmental sciences 4:379-391 Doi: 10.6088/ijes.2013040300014.
12. Muthuraman G, Sasikala S. (2014) Removal of turbidity from drinking water using natural coagulants. Journal of Industrial and Engineering Chemistry 20: 1727–1731 OI:10.1016/j.jiec.2013.08.023.
13. Camacho F, Sousa V, Bergamasco R et al (2017) The use of Moringa oleifera as a natural coagulant in surface water treatment. Chemical Engineering Journal 313: 226–237 DOI: 10.1016/j.cej.2016.12.031. 14. Kulkic D, Sciban M, Prodanovic J M, Tepic A et al (2015) Extracts of fava bean (Vicia faba L.) seeds as natural coagulants. Ecological Engineering 84: 229–232 Doi.org/10.1016/j.ecoleng.2015.09.008.
![Stability-Indicating HPTLC Method for Simultaneous ... for Simultaneous Estimation of Amoxicillin Trihydrate and Ambroxol ... [12], HPLC with photo diode array detection [13], voltametry](https://img.pdfslide.us/doc/110x75/5aa5a1bb7f8b9a517d8d8322/stability-indicating-hptlc-method-for-simultaneous-for-simultaneous-estimation.jpg)