Embed Size (px)
Citation preview
OPEN ACCESS
Eurasian Journal of Analytical Chemistry ISSN: 1306-3057
2017 12(2):87-105 DOI 10.12973/ejac.2017.00156a
© Authors. Terms and conditions of Creative Commons Attribution 4.0 International (CC BY 4.0) apply.
Correspondence: Ashok H. Akabari, C.K.Pithawalla Institute of Pharmaceutical Science and Research, India.
Development and Validation of Stability Indicating RP-HPLC Method for Estimation of Fluvastatin Sodium in Bulk
and Capsule Dosage Form
Ashok H. Akabari C. K. Pithawalla Institute of Pharmaceutical Science and Research, INDIA
Bhanubhai N. Suhagia Dharamsinh Desai University, INDIA
Mahesh G. Saralai C. K. Pithawalla Institute of Pharmaceutical Science and Research, INDIA
Vishnu A. Sutariya Shree Dhanvantary Pharmaceutical Analysis and Research Centre (SDPARC), INDIA
Received 18 January 2016 ▪ Revised 28 April 2016 ▪ Accepted 2 May 2016
ABSTRACT
A sensitive, specific and stability-indicating reversed phase high performance liquid
chromatography-diode array detection method was developed for the quantitative
determination of fluvastatin sodium in the presence of its degradation products. The
chromatographic separation was performed on a Phenomenex Luna C18 column (150 X 4.0
mm, 5µm) in isocratic mode using acetonitrile and 0.02M potassium phosphate buffer (50
+ 50, v/v, pH 5.0 adjusted with potassium hydroxide) as the mobile phase at a flow rate of
1.0 ml/min. The quantification was performed with a photodiode array detector at 235nm
based on peak area. The method showed good linearity over the concentration range of 5-
40 µg/mL with a detection limit of 1.1µg/mL and quantification limit of 3.3µg/mL. The
proposed LC method was used to investigate the kinetics of acidic and oxidative
degradation of fluvastatin sodium. The acidic and oxidative degradation had shown an
apparent first-order kinetics and rate constants were found to be 0.0191µg/mL/min and
0.0048µg/mL/min, respectively.
Keywords: fluvastatin, kinetic study, stability indicating method, anti hyperlipidemic agent,
development and validation
INTRODUCTION
Fluvastatin sodium (FVS), chemically is 7-[3-(4-fluorophenyl)-1-(1-methylethyl)-1H-indol-2-
yl]-3, 5 dihydroxy-6-heptenoic acid monosodium salt. These substance inhibit, by competition,
the 3-hydroxy-3-methylglutaryl coenzyme A reductase (HMG-Co A), thus preventing this
substance from catalyzing the conversion to mevolanate and consequently inhibiting the first
stage in cholesterol biosynthesis in humans [1].
A. H. Akabari et al.
88
Literature revealed that some analytical methods, such as differential plus
voltammetry [2-3], square-wave adsorptive-stripping voltammetry [4], cyclic voltammetry [5]
and other voltammetric techniques [6] have been reported for the determination of FVS in bulk
and pharmaceutical dosage form. First derivative spectrophotometry [7] and kinetic
spectrophotometric [8] determination of fluvastatin in pharmaceutical preparations have been
reported. FVS have been determined by capillary electrophoresis [9] (CE), high performance
liquid chromatography (HPLC) in biological fluids such as human and rat plasma [10-17].
Liquid chromatography- mass spectrometry [18-19] and gas chromatography- mass
spectrometry [20] have been reported for the determination of FVS in biological fluids. Photo
degradation studies of fluvastatin by HPTLC and spectrophotometry method have been
reported [21]. Simple and sensitive HPTLC method for the determination of FVS in bulk and
pharmaceutical dosage form has been reported [22].
To date, all analytical methods described in the literature for the determination of FVS
in biological fluids such as plasma involve voltammetric techniques, CE, HPLC, LC-MS and
GC-MS methods and require a tedious procedure for sample pre-treatment. The kinetic
spectrophotometric method was based on the formation of colored product between FVS and
4-chloro-7-nitrobenzofurazan (NBD-Cl) in acetone medium at 55 ± 2ºC. The reaction was
followed spectrophotometrically by measuring the increase in absorbance at 462 nm as a
function of time [8]. Mielcarek et al. has been studied a photodegradation of fluvastatin in
methanol or water, in accordance with the ICH recommendations of the first version by
HPTLC [21]. Gomes et al. developed the stability indicating HPLC method for determination
of FVS in pharmaceutical [17]. Gomes et al. studied limited stress condition like acidic, neutral,
alkaline and chemical oxidative degradation was discussed [17]. Gomes et al. was not studied
for the specificity, peak purity or correlation between spectra of standard and test FVS in the
presence of the degradation product that are likely to be present as an impurity in their
formulations. Literature survey reveals that there is no stability-indicating RP-HPLC method
has been reported to study the effect of temperature and photostability of FVS and for the
systematic degradation of FVS in acidic and oxidative conditions. Moreover, kinetic studies
and accelerated stability experiments are important to solve problems encountered in quality
control and to predict the expiry dates of pharmaceutical products. Since literature cites that
water or methanol plays a role in photodegradation of fluvastatin, therefore the original stock
solution of fluvastatin was prepared in water and immediately diluted by mobile phase
(acetonitrile and phosphate buffer mixture) [21].
Nowadays, photo stability studies are an integral part of the drug development process
and are widely recognized as one of the most important procedures in the registration of
pharmaceutical products [23]. Knowledge of the photochemical and photophysical properties
of the compound is necessary for appropriate handling, packaging and labelling the drug
substance and drug product [24]. Radiation has two main effects on the drugs. The first is the
influence of light on the stability of the drug substances and drug formulations. The second
aspect of drug–light interactions is that of the biological effects caused by the reaction of drugs,
Eurasian J Anal Chem
89
photoproducts or metabolites of drugs with light and biomolecules, resulted in drug induced
photosensitivity [25-26].
Most of the degradation reactions of pharmaceuticals occur at finite rates and are
chemical in nature. These reactions are affected by conditions such as solvent, concentration
of reactants, temperature, pH of the medium, radiation energy, and the presence of catalysts.
The order of the reaction is described based on the reaction rate and the concentration of the
reactant. The degradation of most pharmaceuticals can be classified as zero order, first order,
or pseudo first order. Thus, kinetic studies of the decomposition of drugs using stability testing
techniques are essential for the quality control (QC) of such products. Therefore, kinetic
determinations of acid degradation and oxidative degradation were carried out to predict the
expiry date of the drug [27-29].
The purposes of study were, 1) To develop and validate more sensitive, short analysis
time, specific and fully stability indicating RP-HPLC-DAD method for determination of FVS
in the presence of its degradation products according to ICH guidelines. 2) To obtain more
detail knowledge on the degradation kinetics of FVS in acidic and oxidative conditions.
Furthermore, the developed method was used to investigate the kinetics of the FVS in acid
and oxidative degradation at different temperatures. The kinetic parameters, such as apparent
order degradation rate constant (k), half-life (t1/2), and energy of activation for FVS were
calculated. Determine the shelf life, t90 for the FVS in acidic and oxidative conditions, assuming
that the product is satisfactory until at the time at which it has decomposed to 90% of its
original concentration (i.e., 10% of drug remain) at different temperatures. The proposed
method has several advantages over published methods, including high sensitivity and wider
linearity range of the proposed method, whereas the calibration range of the proposed method
is 5- 40 µg/ml while the calibration range of the published HPLC method [17] was 12- 28
µg/ml. Also, the proposed method can be used for quantitative determination of degradation
product FVS during the stability study with kinetic investigation. The proposed method is
studied for the specificity and the effect of light, temperature was discussed.
EXPERIMENTAL
Materials and Reagents
Fluvastatin sodium was supplied by Intas pharmaceutical ltd. Ahmedabad, India. HPLC
grade acetonitrile and water, hydrogen peroxide, ortho phosphoric acid and potassium
dihydrogen phosphate was procured from Merck, Mumbai, India.
Apparatus and Chromatographic Conditions
The liquid chromatography instrument (Shimadzu technologies, Kyoto, Japan) was
equipped with pump, photo diode array (PDA) detector, degasser, auto sampler and class-VP
chromatography software. Separation and quantitation were made on a Phenomenex Luna C18
A. H. Akabari et al.
90
column (5µm particle size, 150 x 4.6 mm id). The detection was performed at 235 nm, where
the maximum absorption was observed.
The mobile phase was prepared by mixing of acetonitrile and 0.02M phosphate buffer
with pH adjusted to 5.0 with potassium hydroxide, in ratio of 50:50, v/v, filtered through a
0.45µm nylon membrane filter (Rankem, New Delhi, India) and degassed before use. The flow
rate was 1.0 ml/min and the injection volume was 20 µL.
Preparation of stock solution
Stock standard solution of FVS (1 mg/mL) was prepared in water. An aliquot of this
solution was diluted in the mobile phase to obtain a standard working solution of 100 µg/mL
FVS.
Method Validation
Validation of the developed LC method was carried out as per the International
Conference on Harmonization (ICH) guidelines Q2 (R1) [29-33].
Specificity
The specificity of the HPLC method was evaluated to ensure that there was no
interference from the excipients contained in the pharmaceutical product or from products
resulting from forced degradation products. The specificity of the method was established by
comparing the chromatogram of FVS standard and FVS sample solution of the capsule dosage
form. Solutions containing 1 mg/mL of the FVS were prepared in water for the stress
degradation studies. The samples for degradation studies were prepared by transferring 5 ml
solution of FVS (1 mg/ml) to four different 50 mL volumetric flask. Sodium hydroxide solution
(5 ml, 0.1M), hydrochloric acid solution (5 ml, 0.1M HCl and 1M HCl) and hydrogen peroxide
solution (5 ml, 3%H2O2) were added in separate flasks for alkaline hydrolysis, acidic
hydrolysis and oxidative degradation, respectively. The solutions were heated at 70ºC for 120
min in thermostatically controlled water-bath. Aliquots were withdrawn after 120 min cooled
to room temperature, and neutralized (for acid and base induced degradation), appropriately
diluted with mobile phase to obtain a final concentration of 10 µg/ml of FVC and analyzed by
HPLC method.
Pure solid drug (in a 1 mm thick layer in a petri plate) was exposed to dry heat at 80°C
in an oven for 24 h to study the thermal stability of the drug. To study photostability, FVS was
exposed to direct sunlight for 24 h. Samples after 24 h were transferred to stoppered volumetric
flask and diluted with mobile phase and analyzed by HPLC method. The stress degradation
was performed in the dark to exclude the potential degradation effect of light. The peak purity
determination was performed with a PDA detector, that the analyzed chromatography peak
did not contain more than one substance. Peak purity of FVS was assessed by comparing
acquired spectra at the peak start (S), peak apex (M) and peak end (E).
Eurasian J Anal Chem
91
Linearity and Range
The standard working solution (100 µg/ml) was diluted with the mobile phase to
prepare sample solutions in the concentration range of 5.0–40.0 µg/ml FVS. The linearity and
range of the method were determined by plotting a calibration curve over the concentration
range of 5.0–40.0 µg/ml. The calibration curve was plotting by peak areas of FVS against
concentrations of FVS and the regression equation was calculated.
Precision
The repeatability was evaluated at the concentration of 20 µg/ml FVS solution six times
on the same day and under the same experimental conditions. The intraday precision was
evaluated at three different concentrations 10, 20 and 40 µg/ml of FVS by estimating the
corresponding responses three times on the same day and under the same experimental
condition. The interday precision was evaluated at three different concentrations of 10, 20 and
40 µg/ml of FVS by estimating the corresponding responses three times on the three
consecutive days and under the same experimental condition. The results were reported in
terms of percentage RSD.
Accuracy (% Recovery)
The accuracy of the method was studied at three concentrations of FVS, i.e., recovery
studies (80, 100 and 120%). Known amounts of standard solutions of FVS (8, 10, and 12 µg/ml)
were added to a pre-quantified sample solution of FVS (10µg/ml). All solutions were prepared
in triplicate and analyzed. The percentage recovery of spiked drug was calculated from the
regression equation.
LOD and LOQ
Limit of detection (LOD) and Limit of quantitation (LOQ) of FVS for the developed
method were calculated using equation, LOD = 3.3 ´ s/S and LOQ = 10 ´ s/S, where s is the
average standard deviation of the response and S is the mean slope of the calibration curve.
Robustness
The robustness of the method was evaluated by changing the composition of the mobile
phase, flow rate, pH of the mobile phase and column oven temperature over small ranges.
System suitability test
The system suitability tests were performed to prove that the resolution and
repeatability of the HPLC system were adequate for the analysis intended. The system
suitability test was carried out using six replicate injection of a standard solution containing
10µg/mL of FVS. The parameters measured were FVS retention time, chromatographic peak
symmetry (tailing factor) and theoretical plates.
A. H. Akabari et al.
92
Analysis of capsule dosage form
To prepare a sample solution, powder content of 20 capsules (Lescol- 20 mg FVS) were
weighed. The amount of powder equivalent to 100 mg of FVS was transferred in to 100ml of
volumetric flask, 60ml water is added. The resulting solution was sonicated for 15 min. It was
diluted to the mark with water and filter through 0.45µm nylon membrane filter. An
appropriate aliquot was diluted to the mark with mobile phase to obtain final solution
containing 10µg/mL of FVS and analyzed by HPLC.
Kinetic Investigation
Kinetic investigation of FVS in acidic degradation
The kinetics of the acid degradation of FVS was evaluated in 0.1 M HCl. Solutions
containing 1 mg/mL of the FVS were prepared in water. An appropriate aliquot of these
solutions were transferred into separate stoppered volumetric flasks, and diluted with 0.1 M
HCl to give a final concentration of 100µg/ml FVS. The flask were placed in a thermostatic
oven at different temperatures (50, 60, 70 80°C) for different time intervals of 30 min, 60 min
and 120 min. After the specified time, 1 ml aliquots taken were transferred to a 10 mL
volumetric flask and immediately cooled to room temperature and neutralized with 0.1 M
NaOH was checked by using pH strip and these solutions were diluted with mobile phase.
These solutions were injected in the HPLC system and the concentration of the remaining FVS
was calculated at each temperature and time interval.
Kinetic investigation of FVS in oxidative degradation
The kinetics of the oxidative degradation of FVS was evaluated in 3% H2O2. Solutions
containing 1 mg/mL of the FVS were prepared in water. An appropriate aliquot of these
solutions were transferred into separate stoppered volumetric flasks, and diluted with 3%
H2O2 to give a final concentration of 100µg/ml FVS. The flask was placed in a thermostatic
oven at different temperatures (50, 60, 70 80°C) for different time intervals of 30 min, 60 min
and 120 min. After the specified time, 1 ml aliquots transferred to a 10 ml volumetric flask and
immediately cooled to room temperature and this solution was diluted with mobile phase.
These solutions were injected in the HPLC system and the concentration of the remaining FVS
was calculated at 70°C temperature and each time interval.
The kinetic determinations were performed in the dark to exclude the possible
degradation effect of light. The first-order kinetics plots is ln of concentration versus time and
the kinetic parameters, such as the apparent order degradation rate constant (k), half-life (t1/2)
and energy of activation were determined..
Eurasian J Anal Chem
93
RESULTS AND DISCUSSION
Method development and optimization
The main criterion is to develop successful HPLC method for the determination of FVS
and its degradation product. The developed method should be able to determine FVS and its
degradation product in a single run. This method should be accurate, reproducible, robust,
stability indicating, free of interference from degradation products and straight forward
enough for routine use in quality control laboratory.
Regulatory agencies recommend the use of stability-indicating methods for the analysis
of stability of samples. Thus, stress studies are required in order to generate the stressed
samples, method development, and method validation [29-33]. In order to separate FVS and
degradation products produced under stress conditions, different mobile phases were used
and adjusted to obtain a rapid and simple assay method with a less retention time, reasonable
run time, and a sharp peak. Methanol, water and acetonitrile were evaluated in a different
ratio to obtain a sharp peak of FVS, well resolved from its degradation products. When only
acetonitrile and water were evaluated in a different ratio, retention time of fluvastatin reduced
but satisfactory resolution was not achieved as well as the peak was broad with tailing. These
problems were solved when water was replaced with phosphate buffer solution. Since the
buffer forms an ion pair with free silanol groups of the column, it reduces the tailing. Buffer
pH played a major role in separating all the degradation products of FVS. Further, as the pKa
of fluvastatin is 4.56, the probability of the drug remaining in the unionized form in acidic pH
is higher, which in turn has an effect on peak shape and retention time (Rt). The final mobile
phase pH was 5 which are adjusted with potassium hydroxide solution. Improved peak shape,
decrease in tailing, and reproducible response was observed at pH 5. The resolutions among
all degradation products were improved. Therefore, a retention time between 4 and 5 min was
chosen for the drug since it allowed both a rapid analysis of the drug, which is important for
routine analysis, and a complete drug separation from its degradation products.
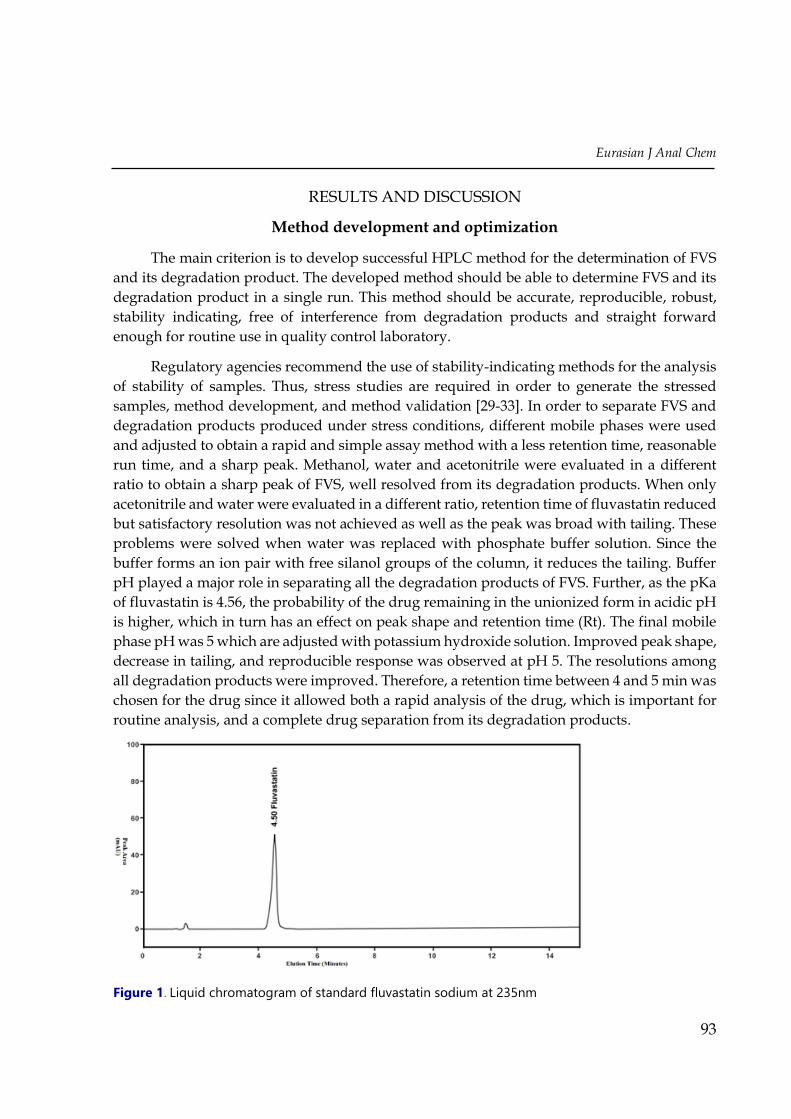
Figure 1. Liquid chromatogram of standard fluvastatin sodium at 235nm
A. H. Akabari et al.
94
A satisfactory separation with good peak symmetry and steady baseline was achieved
by using 0.02M phosphate buffer (pH 5.0 adjusted with potassium hydroxide) and acetonitrile
(50 + 50, v/v) as mobile phase and flow rate was 1.0 ml/min. The retention time of FVS was
4.50 ± 0.05 min (Figure 1). This mobile phase gave good resolution for the separation of FVS
and its degradation products and was selected for the proposed stability-indicating method.
The optimized conditions of the HPLC method were validated for the analysis of FVS in
capsule formulations and application for QC. Figure 1 shows a typical chromatogram obtained
by the proposed RP-HPLC method, demonstrating the resolution of the symmetrical peak
corresponding to FVS. The retention time observed (4.5 min) allows a fast determination of the
drug, which is suitable for QC laboratories.
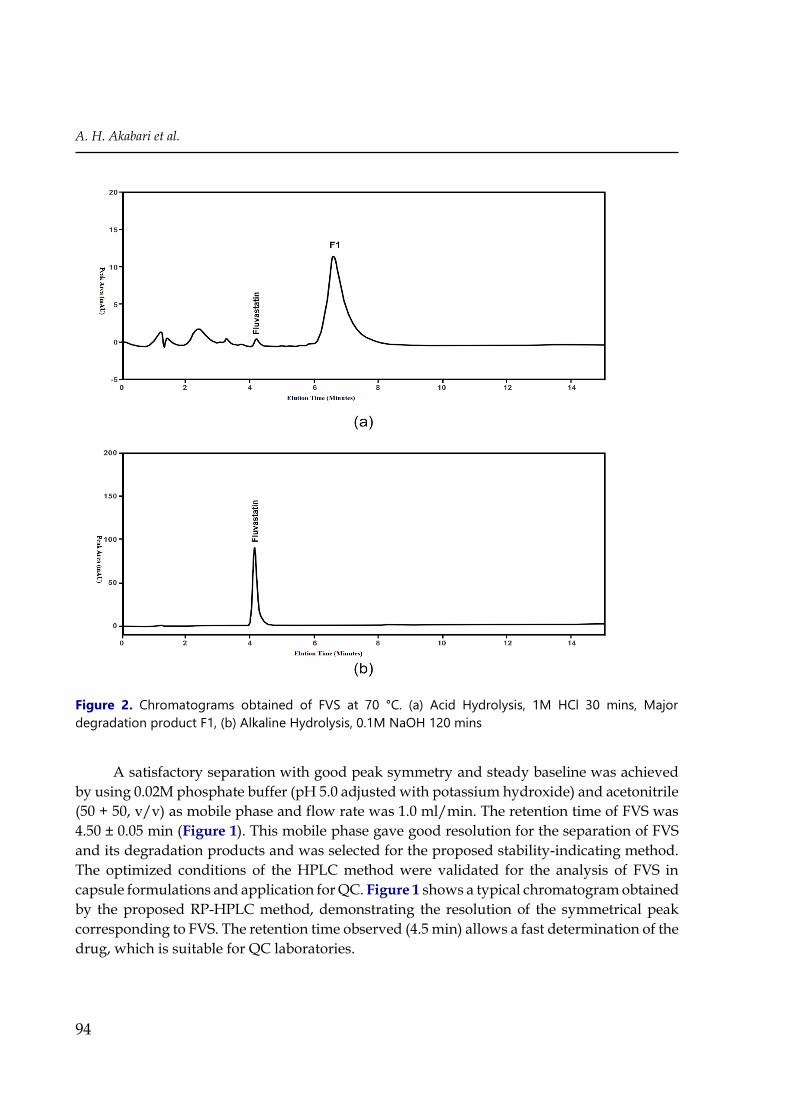
Figure 2. Chromatograms obtained of FVS at 70 °C. (a) Acid Hydrolysis, 1M HCl 30 mins, Major
degradation product F1, (b) Alkaline Hydrolysis, 0.1M NaOH 120 mins
Eurasian J Anal Chem
95
Method Validation
Specificity
Forced degradation or stress testing is undertaken to demonstrate specificity when
developing stability-indicating methods, particularly when little information is available
about potential degradation products. The ICH guideline entitled “Stability Testing of New
Drug Substances and Products” requires stress testing to be carried out to elucidate the
inherent stability characteristics of the active substances [33].
The chromatographic peak purity index for fluvastatin in presence of degradation
products resulting from stress conditions was higher than 0.9999. These results indicated that
the proposed method is specific and stability-indicating, and can be applied for stability
studies and QC analysis of FVS in pharmaceutical products, with advantages when compared
to the previously published methods.
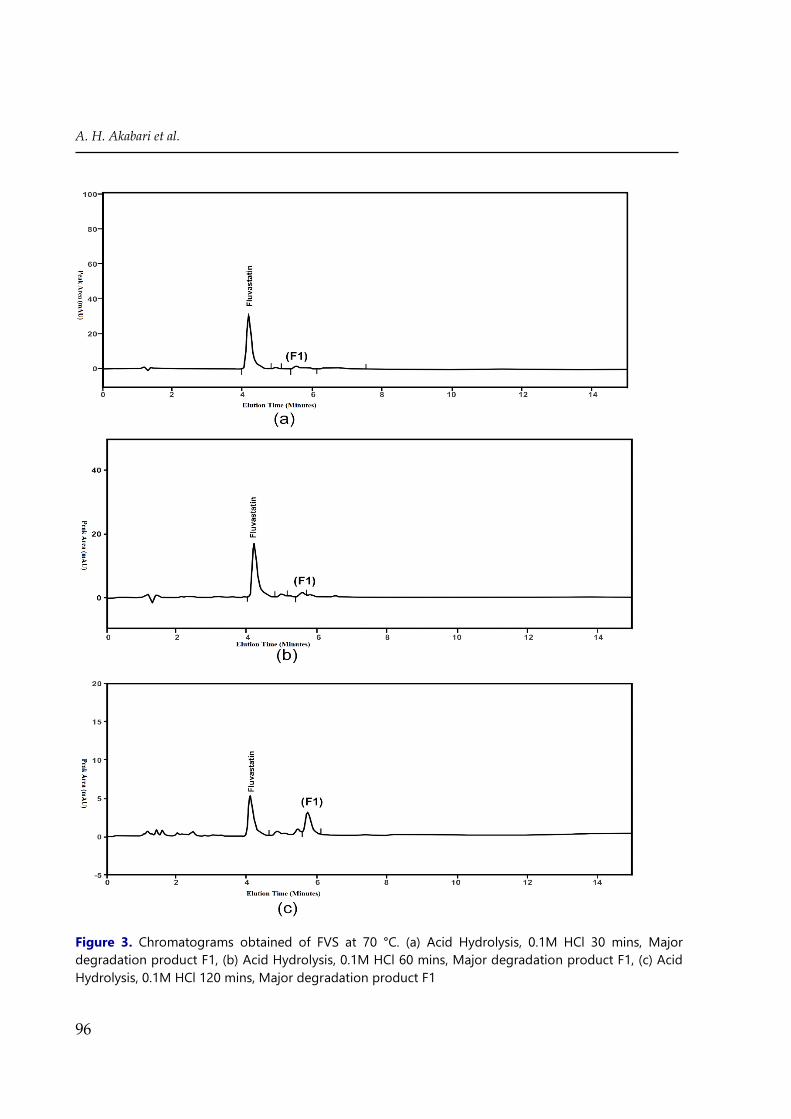
The acid hydrolysis was carried out in 0.1 M HCl and 1M HCl at 70°C for 120 min and
30 min respectively. FVS is unstable and degrades rapidly (approximately 45%/h) when
exposed to acidic conditions in 0.1MHCl. The decomposition rate of FVS in 1 M HCl was fast
compared to 0.1MHCl indicate that the concentration of HCl increase decomposition rate of
FVS also increases. Drug recovery at levels of 10.1% of the acid hydrolysis sample at 70°C in
0.1 M HCl (Figure 3(a)) and negligible amount recovered in 1M HCl (Figure 2(a)).
The alkaline degradation was carried out in 0.1 M NaOH at 70°C for 2 hr and the
percentage of drug decomposition was found to be 61.2%. During alkaline degradation
condition decrease in the original drug peak area was observed and no additional peaks were
observed in the chromatogram (Figure 2(b)).
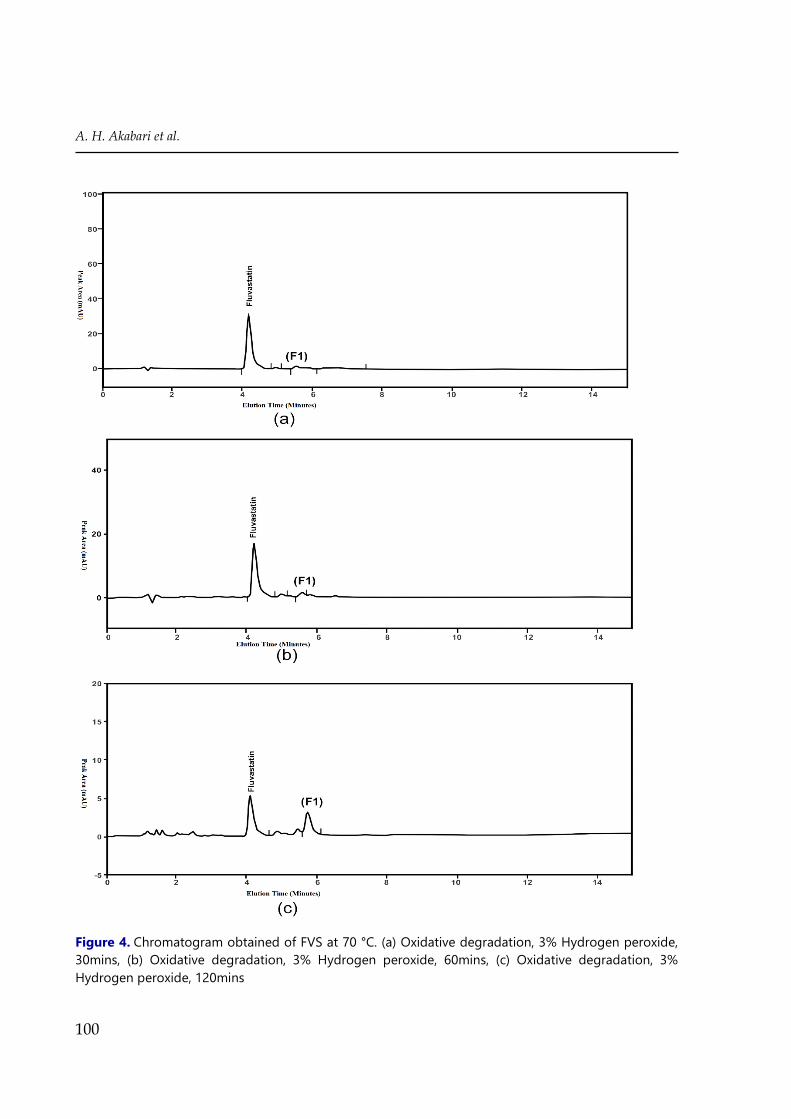
The oxidative degradation was carried out in 3% H2O2 at 70°C for 2 hr and the percentage
of drug decomposition was found to be 43%. During oxidative degradation condition decrease
in the original drug peak area was observed and no additional peaks were observed in the
chromatogram (Figure 4(c)). The FVS has undergone thermal and photolytic degradation very
slightly i.e. 2.65 and 6.47% respectively, no additional peaks were observed in the
chromatogram, suggested significant stability under these conditions compare to acid, alkaline
hydrolysis and oxidative conditions. The drug FVS and the degradation product formed under
various stress condition showed good resolution and not interfere in the determination FVS.
A regular decrease in the concentration of FVS with increasing time intervals was observed in
acidic, alkaline hydrolysis and oxidative condition. The degradation study indicated that FVS
was found to be susceptible to acid, alkaline hydrolysis and oxidative reaction. The number of
the degradation product with their retention time, the content of fluvastatin sodium remained,
and percentage recovery is listed in Table 1.
A. H. Akabari et al.
96
Figure 3. Chromatograms obtained of FVS at 70 °C. (a) Acid Hydrolysis, 0.1M HCl 30 mins, Major
degradation product F1, (b) Acid Hydrolysis, 0.1M HCl 60 mins, Major degradation product F1, (c) Acid
Hydrolysis, 0.1M HCl 120 mins, Major degradation product F1
Eurasian J Anal Chem
97
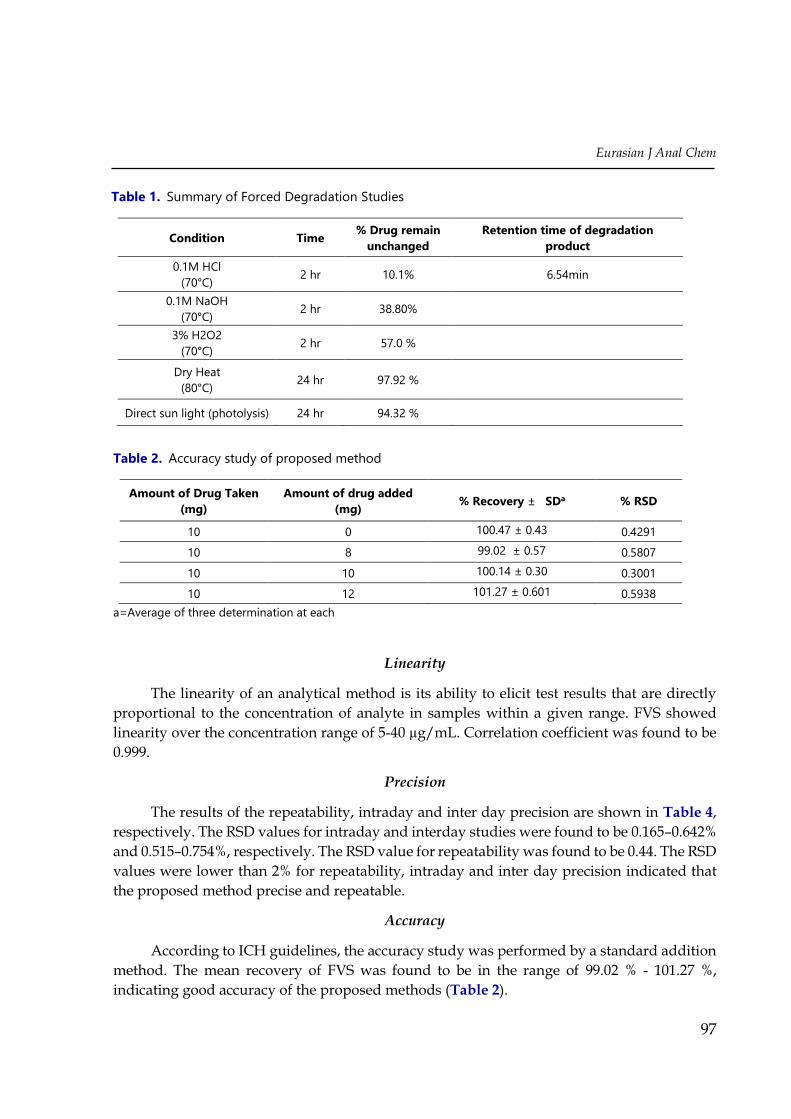
Linearity
The linearity of an analytical method is its ability to elicit test results that are directly
proportional to the concentration of analyte in samples within a given range. FVS showed
linearity over the concentration range of 5-40 µg/mL. Correlation coefficient was found to be
0.999.
Precision
The results of the repeatability, intraday and inter day precision are shown in Table 4,
respectively. The RSD values for intraday and interday studies were found to be 0.165–0.642%
and 0.515–0.754%, respectively. The RSD value for repeatability was found to be 0.44. The RSD
values were lower than 2% for repeatability, intraday and inter day precision indicated that
the proposed method precise and repeatable.
Accuracy
According to ICH guidelines, the accuracy study was performed by a standard addition
method. The mean recovery of FVS was found to be in the range of 99.02 % - 101.27 %,
indicating good accuracy of the proposed methods (Table 2).
Table 1. Summary of Forced Degradation Studies
Condition Time % Drug remain
unchanged
Retention time of degradation
product
0.1M HCl
(70°C) 2 hr 10.1% 6.54min
0.1M NaOH
(70°C) 2 hr 38.80%
3% H2O2
(70°C) 2 hr 57.0 %
Dry Heat
(80°C) 24 hr 97.92 %
Direct sun light (photolysis) 24 hr 94.32 %
Table 2. Accuracy study of proposed method
Amount of Drug Taken
(mg)
Amount of drug added
(mg) % Recovery ± SDa % RSD
10 0 100.47 ± 0.43 0.4291
10 8 99.02 ± 0.57 0.5807
10 10 100.14 ± 0.30 0.3001
10 12 101.27 ± 0.601 0.5938
a=Average of three determination at each
A. H. Akabari et al.
98
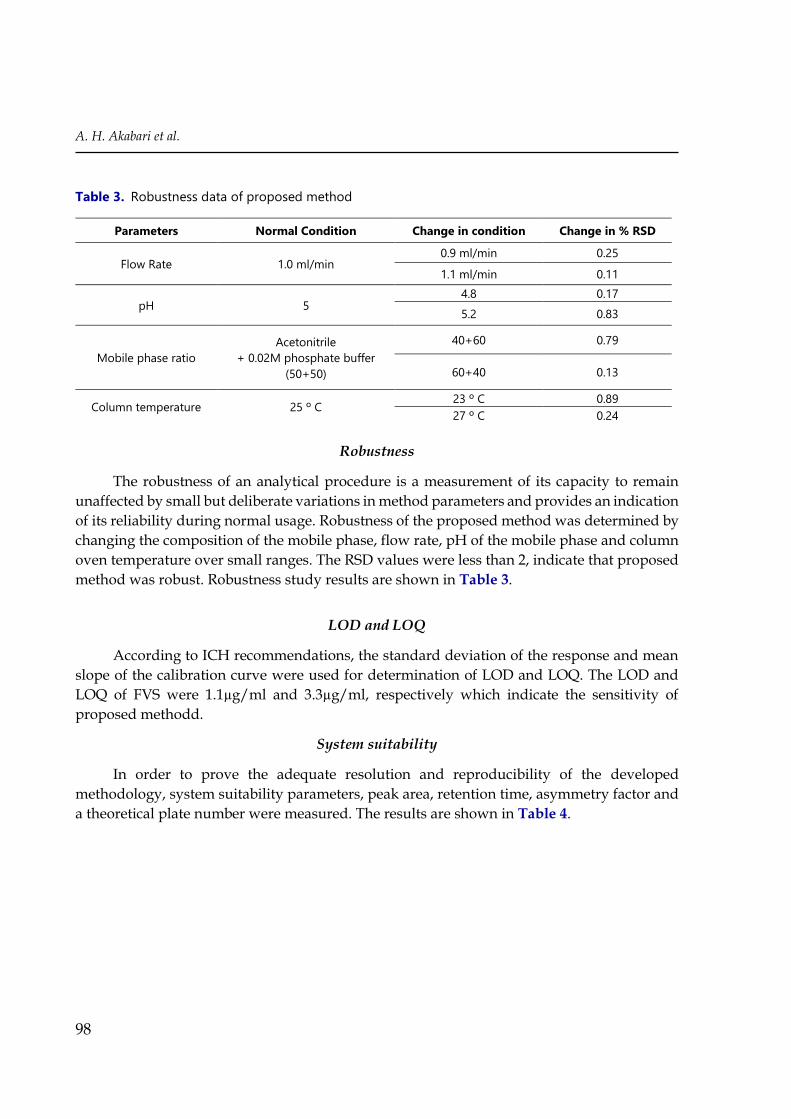
Robustness
The robustness of an analytical procedure is a measurement of its capacity to remain
unaffected by small but deliberate variations in method parameters and provides an indication
of its reliability during normal usage. Robustness of the proposed method was determined by
changing the composition of the mobile phase, flow rate, pH of the mobile phase and column
oven temperature over small ranges. The RSD values were less than 2, indicate that proposed
method was robust. Robustness study results are shown in Table 3.
LOD and LOQ
According to ICH recommendations, the standard deviation of the response and mean
slope of the calibration curve were used for determination of LOD and LOQ. The LOD and
LOQ of FVS were 1.1µg/ml and 3.3µg/ml, respectively which indicate the sensitivity of
proposed methodd.
System suitability
In order to prove the adequate resolution and reproducibility of the developed
methodology, system suitability parameters, peak area, retention time, asymmetry factor and
a theoretical plate number were measured. The results are shown in Table 4.
Table 3. Robustness data of proposed method
Parameters Normal Condition Change in condition Change in % RSD
Flow Rate 1.0 ml/min 0.9 ml/min 0.25
1.1 ml/min 0.11
pH 5 4.8 0.17
5.2 0.83
Mobile phase ratio
Acetonitrile
+ 0.02M phosphate buffer
(50+50)
40+60 0.79
60+40 0.13
Column temperature 25 º C 23 º C 0.89
27 º C 0.24
Eurasian J Anal Chem
99
Analysis of Marketed Formulation
The proposed stability indicating LC method was successfully applied to the
determination of FVS in capsule dosage forms. The assay result was found to be 101.75% ±
0.26, which is good agreement with the label claim.
Kinetic investigation
Kinetic investigation of FVS in acidic degradation
The kinetics of degradation of FVS was investigated in 0.1MHCl. The increased
concentration of acid increased the formation of the main degradation product, and the area
of the FVS peak decreased drastically (Figure 2(a), (b), (c), 2-(a)). A regular decrease in the
concentration of intact FVS with increasing time intervals was observed. During the acidic
degradation major degradation product was observed at 6.54mins without interfering the
elution of drug peak (FVS=4.5mins) (Figure 3(a), (b), (c), 2-(a)). At the selected temperature
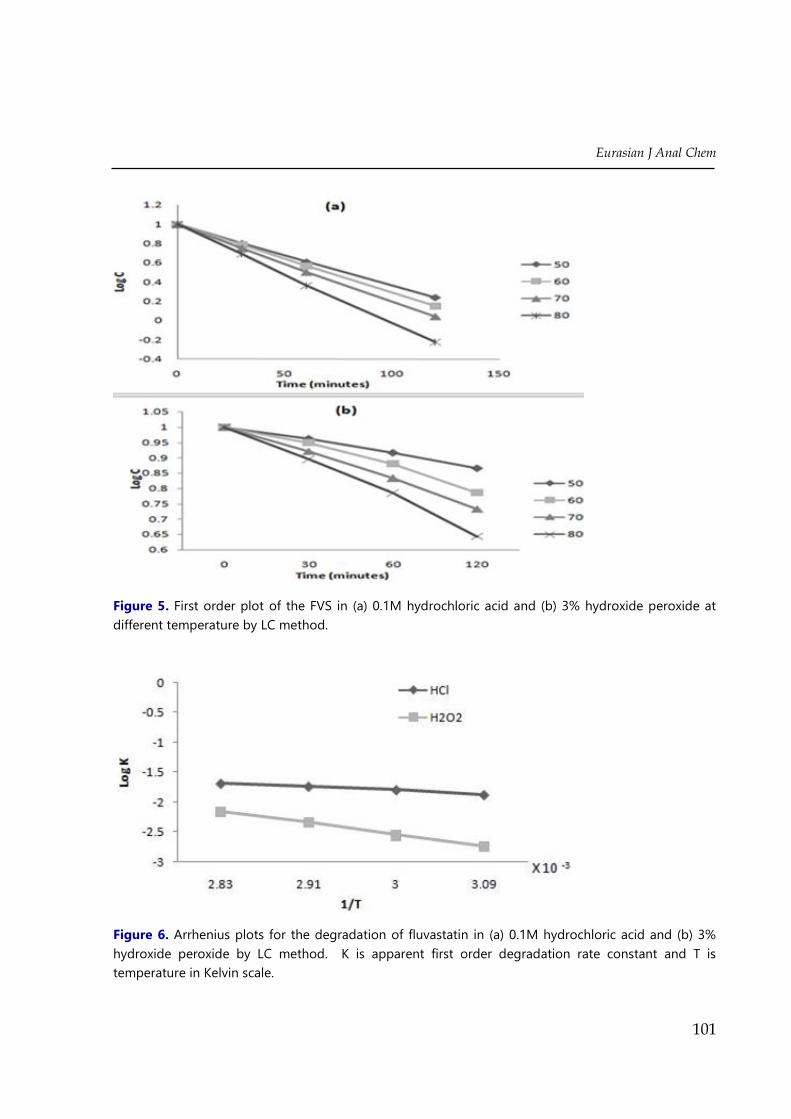
(50, 60, 70 80°C) the acid degradation of FVS processes first-order kinetics (Figure 5(a)). The
apparent first order degradation rate constant and the half life at each temperature are shown
in Table 5. The influence of temperature on the reaction rate constant (kobs) in 0.1MHCl was
given by the Arrhenius equation.
ln 𝑘𝑜𝑏𝑠 = ln𝐴 −𝐸𝑎𝑅𝑇
(1)
where A is the frequency factor, E the energy of activation, R the universal gas constant,
and T is the absolute temperature.
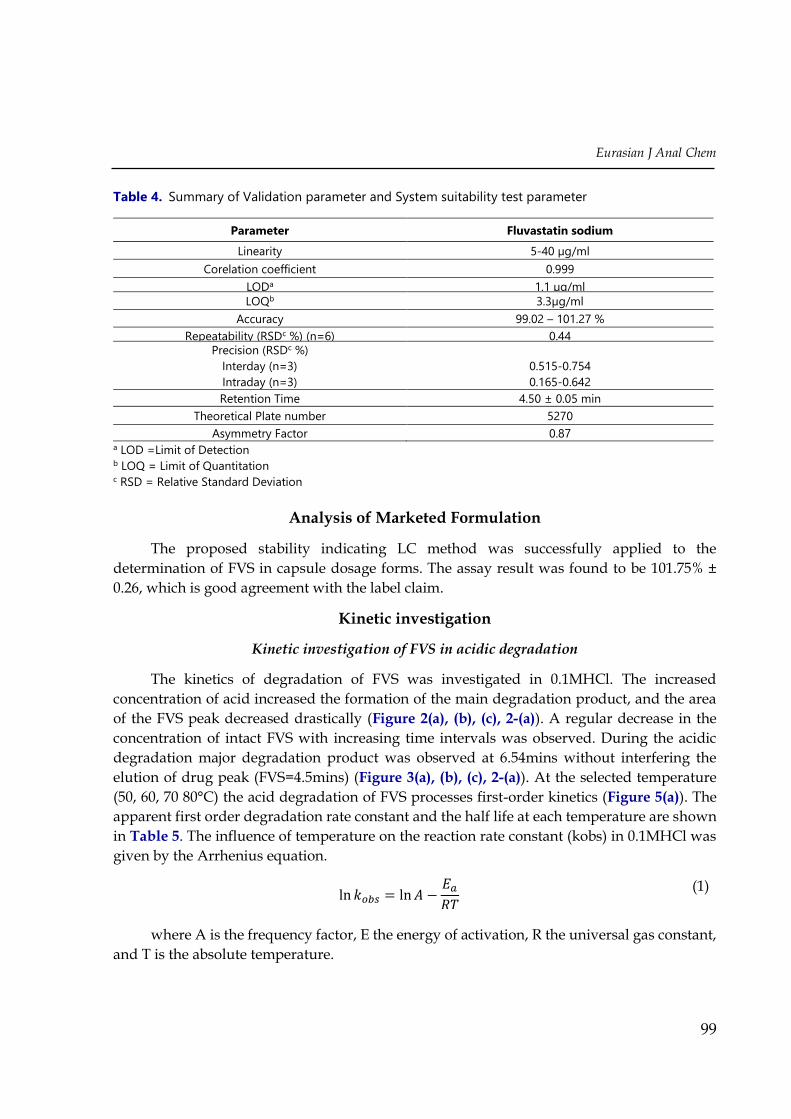
Table 4. Summary of Validation parameter and System suitability test parameter
Parameter Fluvastatin sodium
Linearity 5-40 µg/ml
Corelation coefficient 0.999
LODa 1.1 µg/ml
LOQb 3.3µg/ml
Accuracy 99.02 – 101.27 %
Repeatability (RSDc %) (n=6) 0.44
Precision (RSDc %)
Interday (n=3)
Intraday (n=3)
0.515-0.754
0.165-0.642
Retention Time 4.50 ± 0.05 min
Theoretical Plate number 5270
Asymmetry Factor 0.87 a LOD =Limit of Detection b LOQ = Limit of Quantitation c RSD = Relative Standard Deviation
A. H. Akabari et al.
100
Figure 4. Chromatogram obtained of FVS at 70 °C. (a) Oxidative degradation, 3% Hydrogen peroxide,
30mins, (b) Oxidative degradation, 3% Hydrogen peroxide, 60mins, (c) Oxidative degradation, 3%
Hydrogen peroxide, 120mins
Eurasian J Anal Chem
101
Figure 5. First order plot of the FVS in (a) 0.1M hydrochloric acid and (b) 3% hydroxide peroxide at
different temperature by LC method.
Figure 6. Arrhenius plots for the degradation of fluvastatin in (a) 0.1M hydrochloric acid and (b) 3%
hydroxide peroxide by LC method. K is apparent first order degradation rate constant and T is
temperature in Kelvin scale.
A. H. Akabari et al.
102
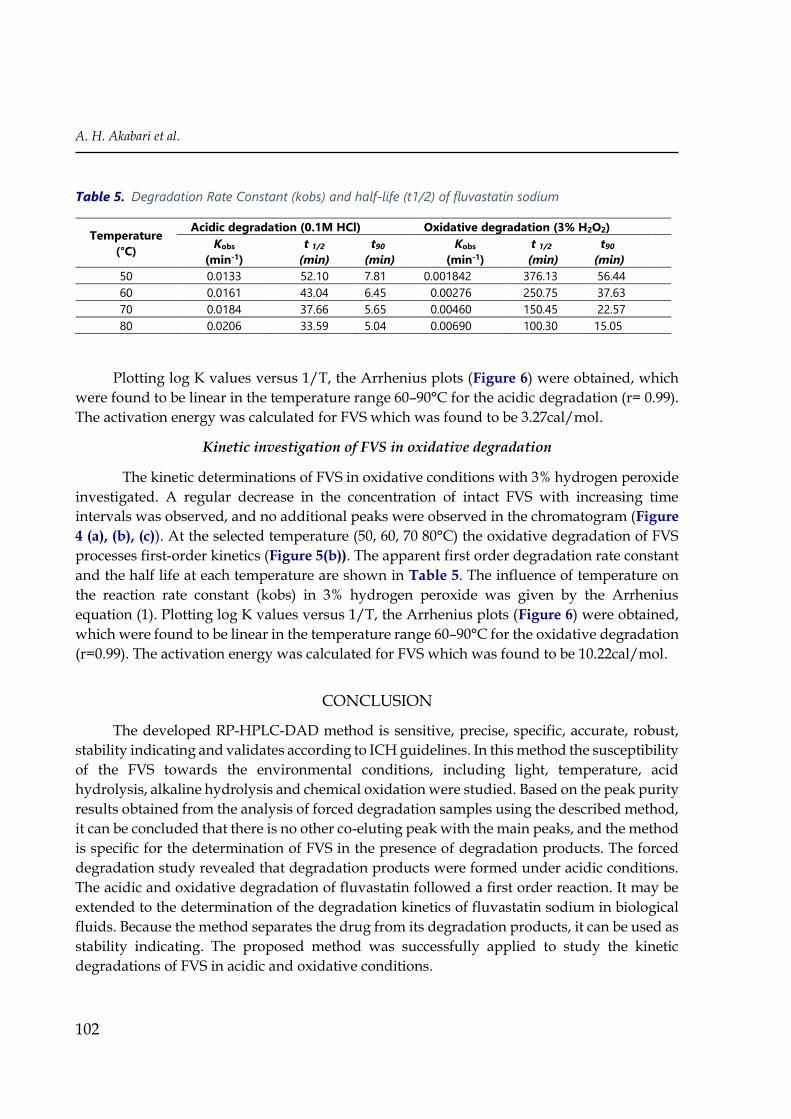
Plotting log K values versus 1/T, the Arrhenius plots (Figure 6) were obtained, which
were found to be linear in the temperature range 60–90°C for the acidic degradation (r= 0.99).
The activation energy was calculated for FVS which was found to be 3.27cal/mol.
Kinetic investigation of FVS in oxidative degradation
The kinetic determinations of FVS in oxidative conditions with 3% hydrogen peroxide
investigated. A regular decrease in the concentration of intact FVS with increasing time
intervals was observed, and no additional peaks were observed in the chromatogram (Figure
4 (a), (b), (c)). At the selected temperature (50, 60, 70 80°C) the oxidative degradation of FVS
processes first-order kinetics (Figure 5(b)). The apparent first order degradation rate constant
and the half life at each temperature are shown in Table 5. The influence of temperature on
the reaction rate constant (kobs) in 3% hydrogen peroxide was given by the Arrhenius
equation (1). Plotting log K values versus 1/T, the Arrhenius plots (Figure 6) were obtained,
which were found to be linear in the temperature range 60–90°C for the oxidative degradation
(r=0.99). The activation energy was calculated for FVS which was found to be 10.22cal/mol.
CONCLUSION
The developed RP-HPLC-DAD method is sensitive, precise, specific, accurate, robust,
stability indicating and validates according to ICH guidelines. In this method the susceptibility
of the FVS towards the environmental conditions, including light, temperature, acid
hydrolysis, alkaline hydrolysis and chemical oxidation were studied. Based on the peak purity
results obtained from the analysis of forced degradation samples using the described method,
it can be concluded that there is no other co-eluting peak with the main peaks, and the method
is specific for the determination of FVS in the presence of degradation products. The forced
degradation study revealed that degradation products were formed under acidic conditions.
The acidic and oxidative degradation of fluvastatin followed a first order reaction. It may be
extended to the determination of the degradation kinetics of fluvastatin sodium in biological
fluids. Because the method separates the drug from its degradation products, it can be used as
stability indicating. The proposed method was successfully applied to study the kinetic
degradations of FVS in acidic and oxidative conditions.
Table 5. Degradation Rate Constant (kobs) and half-life (t1/2) of fluvastatin sodium
Temperature
(°C)
Acidic degradation (0.1M HCl) Oxidative degradation (3% H2O2)
Kobs
(min-1)
t 1/2
(min)
t90
(min)
Kobs
(min-1)
t 1/2
(min)
t90
(min)
50 0.0133 52.10 7.81 0.001842 376.13 56.44
60 0.0161 43.04 6.45 0.00276 250.75 37.63
70 0.0184 37.66 5.65 0.00460 150.45 22.57
80 0.0206 33.59 5.04 0.00690 100.30 15.05
Eurasian J Anal Chem
103
ACKNOWLEDGEMENTS
The authors are thanks to Intas pharmaceutical ltd. Ahmedabad, Gujarat, India for the gratis
samples of pure fluvastatin sodium.The author wish to thank to Shree Dhanvantary
Pharmaceutical Analysis and Research Centre (SDPARC), Kim, Gujarat, India to provide
research facility.
REFERENCES
1. United States Pharmacopeia and National Formulary (2007). The United States Pharmacopeial Convention INC, Rockville, 3, 961-964.
2. Yan, J. L., & Lu, X. P. (2006). Determination of fluvastatin sodium by differential pulse voltammetry. J Chin Clin Medicine, 1, 33-36.
3. Yan, J. L. (2006). Determination of Fluvastatin Sodium by Differential Pulse Voltammetry. Pak J Bio Science, 9, 2156-2158.
4. N. Marta, M. P. S., N. Henri P. A., & D. Matos, C. (2008). Direct Electroanalytical Determination of Fluvastatin in a Pharmaceutical Dosage Form, Batch and Flow Analysis. Anal lett, 41, 2794–2804.
5. Dogan, B. T., Uslu, B., & Ozkan, S. A. (2007). Selective electrochemical behavior of highly conductive boron-doped diamond electrodes for fluvastatin sodium oxidation. Diam Relat Mater, 16, 1695-1704.
6. Ozkan, S. A., & Uslu, B. (2002). Electrochemical study of fluvastatin sodium analytical application to pharmaceutical dosage forms, human serum, and simulated gastric juice. Anal Bioanal Chem, 372, 582-586.
7. Erk, N. (2002). Rapid spectrophotometric method for quantitative determination of simvastatin and fluvastatin in human serum and pharmaceutical formulations. Die Pharmazie, 57, 817-819.
8. Ashour, S., Bahbouh, M., & Khateeb, M. (2010). Kinetic spectrophotometric determination of fluvastatin in pharmaceutical preparations. Int J Biomed Sci., 6, 19–26.
9. Dogrukol-Ak, D., Kircali, K., Tunçel, M., & Aboul-Enein, H.Y. (2001). Validated analysis of fluvastatin in a pharmaceutical formulation and serum by capillary electrophoresis. Biomed Chromatogr, 15, 389-392.
10. Nakashima, A., Saxer, C., Niina, M., Masudam Iwasaki, K., & Furukawa, K. (2001). Determination of fluvastatin and its five metabolites in human plasma using simple gradient reversed-phase high-performance liquid chromatography with ultra-violet detection. J Chromatogr B Biomed Appl, 760, 17-25.
11. Um, S. Y., Jung, S. H., Jung, S. J., Kim, J. I., Chung, S. Y., Lee, & H. J., et al. (2006). Column switching high-performance liquid chromatographic analysis of fluvastatin in rat plasma by direct injection. J Pharm Biomed Anal, 41, 1458–1462.
12. Al-Rawithi, S., Hussein, R. F., & Alzahrani, A. (2003). Sensitive assay for the determination of fluvastatin in plasma utilizing high-performance liquid chromatography with fluorescence detection. Ther Drug Monit, 25, 88–92.
13. Lanchote, V. L., Roch sa, A., & Alboquerque, F. U. V., Coelho, E. B., Bonato, P. S. (2001). Stereoselective analysis of fluvastatin in human plasma for pharmacokinetic studies. J Chromatogr B Biomed Appl, 765, 81-88.
14. Toreson, H., & Eriksson, B. M. (1996). Determination of fluvastatin enantiomers and the racemate in human blood plasma by liquid chromatography and fluorometric detection. J Chromatogr A, 729, 29-34.
A. H. Akabari et al.
104
15. Kalafsky, G., Smith, H. T., & Choc, M. G. (1993). High-performance liquid-chromatographic method for the determination of fluvastatin in human plasma. J Chromatogr Biomed Appl, 125, 307-313.
16. Toreson, H., & Eriksson, B. M. (1997). Liquid chromatographic determination of fluvastatin and its enantiomers in blood plasma by automated solid phase extraction. Chromatographia, 45, 29-34.
17. Gomes, F. P., Garcia, P. L., Alves, J. M. P., Singh, A. K., Kedor-Hackmann, E. R. K., & Santoro, M. I. R. M. (2009). Development and validation of stability-indicating hplc methods for quantitative determination of pravastatin, fluvastatin, atorvastatin and rosuvastatin in pharmaceuticals. Anal Lett, 42, 1784–1804.
18. Nirogi, R. V. S., Kandikere, V. N., Shrivastava, W., Mudigonda, & K., Datla, P. V. (2006). Liquid chromatography/negative ion electrospray tandem mass spectrometry method for the quantification of fluvastatin in human plasma, validation and its application to pharmacokinetic studies. Rapid Commun Mass Spectrom, 20, 1225–1230.
19. Di Pietro, G., Coelho, E. B., Geleilete, T. M., Marques, M. P., & Lanchote, V. L. (2006). Chiral evaluation of fluvastatin in human plasma by high-performance liquid chromatography electrospray mass spectrometry. J Chromogr B, 832, 256-261.
20. Leis, H. J., & Windischhofer, W. (2005). Quantitative determination of fluvastatin in human plasma by gas chromatography/negative ion chemical ionization mass spectrometry using [18O2]-fluvastatin as an internal standard. Rapid Commun Mass Spectrom, 19, 128-132.
21. Mielcarek, J., Kula, M., Zych, R., & Grobelny, P. (2005). Kinetics Studies on Fluvastatin photodegradation solution. React Kinet Catal Lett, 86, 119-126.
22. Akabari, A. H., Shah, U. H., Solanki, S., Patel, M., & Suhagia, B. N. (2014). Development and Validation of sensitive HPTLC method for quantitative analysis of fluvastatin sodium in bulk and pharmaceutical dosage form. International Journal of Pharmaceutical Research, 6(2), 73-78.
23. Aman, W., & Thoma, K. (2002). The influence of formulation and manufacturing process on the photostability of tablets. Int J Pharm, 243, 33–41.
24. Onoue Tsuda, Y. (2006). Analytical studies on the prediction of photosensitive/ phototoxic potential of pharmaceutical substances. Pharma Res, 23, 156–164.
25. Tonnesen, H. H. (2001). Formulation and stability testing of photolabile drugs. Int J Pharm, 225, 1–14.
26. Clothier, R. H. (2007). Phototoxicity and acute toxicity studies conducted by the frame Alternatives Laboratory, a brief review. Altern Lab Anim, 35, 515–159.
27. Ahuja, S. S. (2007). Assuring quality of drugs by monitoring impurities. Adv Drug Deliv Rev, 59, 3–11.
28. Connors, K. A., Amidon, G. R., & Stella, V. J. (1986). Chemical stability of Pharmaceuticals, A Handbook for Pharmacists, 2nd ed. New York, Wiley, p. 274-284.
29. Akabari, A. H., Shah, D. R., Shah, S. A., & Suhagia, B. N. (2015). Kinetic Determinations of Pitavastatin Calcium by Stability Indicating HPTLC Method, Journal of Liquid Chromatography & Related Technologies, 38(4), 521-531.
30. ICH (2005). Q2R1, Validation of analytical procedures, text and methodology. International Conference on Harmonization, Geneva.
31. Bakshi, M., & Singh, S. (2002). Development of validated stability indicating assay methods-critical review. J Pharm Biomed Anal, 28, 1011-40.
32. Swartz, & M., Krull, I. (2005). Developing and validating stability indicating methods. LC-GC, 23, 586–93.
33. ICH (2005). QA1R2, Stability Testing of New Drug Substances and Products. International Conference on Harmonization, Geneva.
Eurasian J Anal Chem
105
http://iserjournals.com/journals/ejac