Embed Size (px)
Citation preview

REPORT DOCUMENTATION PAGE Form Approved
OMB No. 0704-0188 The public reporting burden for this collection of information is estimated to average 1 hour per response, including the time for reviewing instructions, searching existing data sources, gathering and maintaining the data needed, and completing and reviewing the collection of information. Send comments regarding this burden estimate or any other aspect of this collection of information, including suggestions for reducing this burden, to Department of Defense, Washington Headquarters Services, Directorate for information on Operations and Reports (0704-0188), 1215 Jefferson Davis Highway, Suite 1204, Arlington, VA 22202-4302. Respondents should be aware that notwithstanding any other provision of law, no person shall be subject to any penalty for failing to comply with a collection of information if it does not display a currently valid OMB control number. PLEASE DO NOT RETURN YOUR FORM TO THE ABOVE ADDRESS.
1. REPORT DATE (DD-MM-YYYY)12-08-2015
2. REPORT TYPE
Final 3. DATES COVERED (From - To)
4. TITLE AND SUBTITLETest Operations Procedure (TOP) 08-2-060 Post-Decontamination Vapor Sampling and Analytical Test Methods
5a. CONTRACT NUMBER
5b. GRANT NUMBER
5c. PROGRAM ELEMENT NUMBER
6. AUTHORS 5d. PROJECT NUMBER
5e. TASK NUMBER
5f. WORK UNIT NUMBER
7. PERFORMING ORGANIZATION NAME(S) AND ADDRESS(ES)U.S. Army Dugway Proving Ground West Desert Test Center (TEDT-DPW) Dugway, UT 84022-5000
8. PERFORMING ORGANIZATIONREPORT NUMBER
TOP 08-2-060
9. SPONSORING/MONITORING AGENCY NAME(S) AND ADDRESS(ES)U.S. Army Test and Evaluation Command CSTE-TM (Range Infrastructure Division) 2202 Aberdeen Boulevard Aberdeen Proving Ground, MD 21005-5001
10. SPONSOR/MONITOR’SACRONYM(S)
11. SPONSOR/MONITOR’S REPORTNUMBER(S)
Same as item 8 12. DISTRIBUTION/AVAILABILITY STATEMENT
Distribution Statement A. Approved for public release; distribution is unlimited.
13. SUPPLEMENTARY NOTESDefense Technical Information Center (DTIC), AD No.:
14. ABSTRACTThe Post-Decontamination Vapor Sampling and Analytical Test Methods Test Operations Procedure (TOP) contains the procedures for the measurement of contaminant vapor present after an item is decontaminated that could pose an exposure hazard to unprotected personnel. The chemical contaminants may include chemical warfare agents (CWAs) or their simulants, nontraditional agents (NTAs), toxic industrial chemicals (TICs), and toxic industrial materials (TIMs). A vapor collection system is used to capture coupon off-gassing. Concentration is measured using chromatographic analytical methods. This laboratory-scale test method uses a range of test articles from coupons, panels, and small fielded equipment items. 15. SUBJECT TERMSVapor hazard; vapor sampling; chemical warfare agent; CWA; simulants; nontraditional agent; NTA; toxic industrial chemical; TIC; toxic industrial material; TIM; coupon; contamination; decontamination
16. SECURITY CLASSIFICATION OF: 17. LIMITATION OFABSTRACT
SAR
18. NUMBEROFPAGES
70
19a. NAME OF RESPONSIBLE PERSON
a. REPORT B. ABSTRACT C. THIS PAGE
Unclassified Unclassified Unclassified 19b. TELEPHONE NUMBER (include area code)
Standard Form 298 (Rev. 8-98) Prescribed by ANSI Std. Z39-18

(This page is intentionally blank.)

U.S. ARMY TEST AND EVALUATION COMMAND TEST OPERATIONS PROCEDURE
*Test Operations Procedure 08-2-060 12 August 2015 DTIC AD No. POST-DECONTAMINATION VAPOR SAMPLING AND ANALYTICAL TEST METHODS
Page Paragraph 1. SCOPE ................................................................................... 2 1.1 Purpose .................................................................................. 3 1.2 Objectives .............................................................................. 3 1.3 Limitations ............................................................................. 3 2. FACILITIES AND INSTRUMENTATION ......................... 4 2.1 Facilities ................................................................................ 4 2.2 Instrumentation ...................................................................... 6 2.3 Test Controls ......................................................................... 7 3. REQUIRED TEST CONDITIONS ....................................... 7 3.1 Preparations for Test ............................................................. 7 3.2 Environmental Documentation .............................................. 8 3.3 Test Readiness Review (TRR)/Operational Readiness Inspection (ORI) .................................................................... 8 3.4 Safety ..................................................................................... 9 3.5 Quality Assurance (QA)/Quality Control (QC) .................... 9 4. TEST PROCEDURES .......................................................... 10 4.1 General .................................................................................. 10 4.2 Test Method Outline .............................................................. 10 4.3 Hazards .................................................................................. 11 4.4 Calibration and Standards ..................................................... 11 4.5 Receipt Inspection ................................................................. 12 4.6 Trial Preparation Tasks ......................................................... 13 4.7 Preconditioning Procedure .................................................... 14 4.8 Contamination Procedure ...................................................... 15 4.9 Weathering/Exposure Procedure ........................................... 15 4.10 Decontamination Process ...................................................... 15 4.11 Vapor Test Procedure ............................................................ 15 4.12 Residual Contaminant Test Procedure .................................. 16 4.13 Chromatographic Analysis for Contaminant Procedure ....... 17 5. DATA REQUIRED ............................................................... 17 5.1 Data Recorded and Reported ................................................. 17 5.2 Data Review and Corrective Action ...................................... 19 5.3 Data Acceptance Parameters ................................................. 20 6. PRESENTATION OF DATA ............................................... 20 Approved for public release; distribution is unlimited.

TOP 08-2-060 12 August 2015
2
Page APPENDIX A. VAPOR CALCULATIONS FOR A SINGLE MATERIAL SYSTEM ............................................................................... A-1 B. VAPOR COMPOSITE SYSTEM CALCULTIONS (VCSC) .................................................................................. B-1 C. CONCENTRATION AND TOXIC LOAD (TL) PREDICTION ....................................................................... C-1 D. GLOSSARY .......................................................................... D-1 E. ABBREVIATIONS ............................................................... E-1 F. REFERENCES ...................................................................... F-1 G. APPROVAL AUTHORITY .................................................. G-1 1. SCOPE. a. The Post-Decontamination Vapor Sampling and Analytical Test Methods Test Operations Procedure (TOP) covers the procedures necessary to collect residual contaminant vapor from the test article after decontamination, analyze the contaminant concentration, and perform calculations and present the data. b. These procedures describe a vapor collection system to contain and sample off-gassing vapor. Appendices A, B, and C describe procedures for analyzing the residual vapor data collected to determine human toxicological effects. This laboratory-scale test method uses a range of test articles from small coupons, larger coupons or panels, and small fielded equipment items. Sizes can range from 1 centimeter (cm) in diameter through 50 × 20 × 15 cm and weighing 6.8 kilograms (kg). c. There are two types of vapor collection systems for conducting vapor sampling. The first type of vapor collection system is the vapor microchamber, which is constructed of a base material and a lid. The lid is sealed before each test to ensure there is no cross-contamination between tests. The lid is held in place with a pressure-tuned armature that ensures a complete seal between the lid and base when engaged. The chamber was designed to facilitate a laminar single-pass airflow configuration where the air is swept across the coupon and immediately directed to the vapor sampler. The second type of vapor collection system is the small item vapor (SIV) chamber. The SIV is a larger chamber up to 1 cubic meter (m3) with turbulent airflow that creates a well-mixed environment. The vapor sampler then samples a small portion of the chamber volume. The SIV has door allowing placement of the test article which must be sealed before vapor sampling. d. Commonly used bag-and-sample vapor hazard test methods (not described in this TOP) are not appropriate to determine the presence of a vapor hazard. Bag-and-sample test methods provide an indication that off-gassing may be present, but because the airflow rate is uncharacterized and the air volume is uncontrolled, the data collected cannot provide an accurate analysis of the vapor hazard.
TOP 08-2-060 12 August 2015
3
1.1 Purpose. a. The Post-Decontamination Vapor Sampling and Analytical Test Methods TOP contains the procedures for collecting and measuring residual contaminant vapor concentration present after the decontamination process that could pose a vapor exposure hazard to unprotected personnel. The agency that establishes the vapor exposure hazard is the U. S. Army Public Health Command (USAPHC), Aberdeen Proving Ground, MD. These procedures use a vapor collection system to capture samples of off-gassed contaminant vapor and chromatography to analyze the concentrations of the samples. Analyzing residual contamination enables testers to characterize the vapor source term of a test article after conducting a decontamination process. Chemical contaminants can include chemical warfare agents (CWAs) or their simulants, nontraditional agents (NTAs), toxic industrial chemicals (TICs), and other hazardous chemicals. b. Residual vapor data are used to characterize the emission profile of the test article and calculate toxic load values. The toxic load values can be applied to a range of operational scenarios to determine the vapor exposure hazard to unprotected individuals. The operational scenarios are provided by organizations that require the use of decontaminated equipment or infrastructure to perform mission-essential (ME) functions. 1.2 Objectives. a. Provide the procedure for the measurement of vapor source terms (emission factor and emission rate) after treatment with a decontamination system (decontaminant and/or applicator) used against CWAs, simulants, NTAs, TICs, or other hazardous chemicals. b. Provide procedures for analyzing the decontamination of equipment and infrastructure. 1.3 Limitations. a. The procedures contained in this TOP only provide an analysis of the ability of a decontamination system (decontaminant and/or applicator) to reduce a vapor hazard. Residual liquid testing is addressed in TOP 08-2-061A1*. b. This TOP includes procedures for analyzing the decontamination of equipment and infrastructure. Systems and procedures intended for skin or personnel decontamination are not included. c. This vapor test method applies only to decontaminated items that can subsequently be placed in a vapor collection system (with a characterized airflow, temperature control, and controlled volume) and will produce a vapor. Outdoor scenarios or poorly mixed indoor scenarios will require other modeling methods which are beyond the scope of this TOP. *Superscript numbers correspond to Appendix F, References.

TOP 08-2-060 12 August 2015
4
2. FACILITIES AND INSTRUMENTATION. 2.1 Facilities. Facilities, instrumentation, and safety procedures used for decontaminating chemical contaminants and simulants are strictly controlled. Detailed discussion and requirements for facilities and instrumentation are included in the test procedures of Section 4.
Item Requirement Chemical agent facility. Must be designed and constructed to ensure
safe and secure storage, handling, analysis, and decontamination of chemical contaminants (includes CWAs, TICs, NTAs, or other hazardous chemicals) used for Research, Development, Test, and Evaluation (RDT&E). Facility must be equipped and certified for work with chemical contaminants. The chemical agent laboratory, instruments, and personnel assignments must meet all requirements of Army Regulation (AR) 50-62 and AR 190-593 and the safety requirements of Department of the Army (DA) Pamphlet (PAM) 385-614, AR 385-105, and Army Materiel Command Regulation (AMCR) 385-1006.
Chemical agent test chamber. Must be fabricated with appropriate
construction materials (e.g., acrylic, stainless steel, glass, etc.) for containing the chemical contaminants, coupons, coupon holders, and decontaminant(s). The chamber must include doors with seals for ingress and egress of chemical contaminants, decontaminants, and applicator(s). The chamber may include glove ports. The chamber may have certified fume hoods for the containment of toxic chemicals. All exhaust air must be filtered to prevent any chemical release to the environment. A test chamber is significantly larger than a laboratory fume hood and may be used to contain a test fixture for conducting testing.
TOP 08-2-060 12 August 2015
5
Item Requirement Chemical agent test laboratory Equipment, interior surfaces, tools, and waste
must be easily decontaminable. Must have certified fume hoods for the containment of toxic chemicals. All exhaust air must be filtered and monitored to prevent any chemical release to the environment. The facility design should ensure safe transfer, handling, challenge, and disposal of chemical contaminants, decontaminating solutions, and solvents.
Chemical agent test fixture. Test fixture must be fabricated to contain the
contaminants, test articles, and decontaminants. The fixture must be constructed to allow contamination, decontamination, and handling of test articles deliberately contaminated with chemical agent in a temperature- and humidity-controlled environment. The test fixture should include controlled doors with seals for safe ingress and egress of all test materials and equipment. The fixture must include appropriate glove ports for conducting test operations. A test fixture maybe constructed to fit inside a laboratory fume hood, a laboratory, or a test chamber.
Off-gas box (microchamber or SIV)
Off-gas boxes are rigid containers for holding test articles for agent vapor desorption and sampling (precise interior dimensions must be known). Off-gas boxes larger than 30.5 × 30.5 × 25.4 cm require mixing fans to ensure adequate airflow across the test article. All off-gas boxes require, at a minimum, controllable temperature (humidity control may also be desirable). The off-gas box must be made of inert materials, e.g., stainless steel, T6061 aluminum, or equivalent. The construction material may be treated to further minimize interactivity with contaminant vapors (e.g., Sulfinert® treatment, Restek Corporation, Bellefonte, Pennsylvania)**
**The use of brand names does not constitute endorsement by the Army or any other agency of the Federal Government, nor does it imply that it is best suited for its intended application.

TOP 08-2-060 12 August 2015
6
2.2 Instrumentation. These instruments or their equivalent will be used. Instrumentation unique to a test will be listed in the test plan. Parameter Measuring Device Permissible Error of Measurement Residual contaminant vapor.
MINICAMS® (OI Analytical, College Station, Texas) or other equivalent near real-time (NRT) sampler.
± 15 percent of the contaminant vapor concentration in mg/m3, or ± 25 percent of the concentration at the minimum quantification limit (MQL).
Contamination droplet volume.
Calibrated repetitive pipette, syringe, or computerized dispensing system.
± 10 percent of the droplet volume (within the range specified for the contaminant and applicator).
Residual contaminant in samples from solid sorbent tubes (SSTs), or equivalent.
Gas chromatograph (GC), liquid chromatograph (LC), flame ionization detection (FID), flame photometric detection (FPD), or equivalents.
± 15 percent of the mass/volume of the contaminant per sample, or within ± 25 percent of the device MQL.
Temperature. Thermocouple, remote
temperature device, thermometer, or equivalent.
± 3°Celsius (C).
Relative humidity (RH).
Hydrometer or equivalent. ± 5 percentage points.
Differential pressure (∆P) for test chambers or fixtures only.
Pressure transducer. ± 0.09 mm mercury (Hg), or ± 12.5 Pascal (± 0.05 inch of water gauge (iwg)).
Air velocity (chamber, fixture, or off-gas box).
Hotwire anemometer or equivalent.
± 0.1 meters per second (m/sec).
Airflow rate (off-gas box).
Mass flow controller. ± 1 percent of full scale.
Contaminated surface area.
Digital color camera. Image resolution adequate to capture surface area. Pixels must be convertible to cm2.

TOP 08-2-060 12 August 2015
7
Parameter Measuring Device Permissible Error of Measurement Visual record (still). Digital color camera. Image resolution and frame
capture rate adequate to document details of testing.
Visual record (motion).
Digital video camera. Resolution adequate to document details of testing.
2.3 Test Controls.
Item Requirement Quality control (QC) check shots for MINICAMS® or equivalent.
Concentration, in mg/m3, ± 15 percent, or at the MQL ± 25 percent.
Process quality samples for GC, LC, or equivalent. These may be samples of a known mass or periodic calibration standards.
Contaminant in mass/volume, ± 15 percent, or at the MQL ± 25 percent.
3. REQUIRED TEST CONDITIONS. The test officer (TO) or other principle investigator, whether government or industry, will be responsible for all phases of planning, coordinating, and reporting of tests, and will follow the guidance in this TOP. 3.1 Preparations for Test. a. Familiarization. The test planning phase includes identifying potential problem areas by reviewing previous records and the results of similar tests. Review and consider data from previous similar tests to avoid duplication of testing and reduce the scope of the current test effort. Review relevant standing operating procedures (SOPs) and other procedures for applicability, completeness, and adequacy. b. Test Plan. (1) Based on the requirements in the test planning documentation [e.g., test and evaluation master plan (TEMP), system evaluation plan (SEP), etc.], develop a test plan that will include, at minimum, a test design, requirements or criteria, execution matrix, detailed procedures, quality assurance (QA)/QC measures, data management, statistical data analysis, and results presentation. (2) The test plan must be prepared, coordinated, and approved before any testing begins. The test procedures described herein must be used as the basis for the test plan. The procedures may require modification for unique items or materials to satisfy specific testing

TOP 08-2-060 12 August 2015
8
requirements in TEMP, SEP, or other program documentation. Deviations from these procedures will be coordinated and approved with all concerned organizations in advance of any testing, giving consideration to the possible effects the changes may have upon the validity and adequacy of the data. Any deviations from this TOP and the rationale for the deviation will be described in the test plan. c. Test Design. The sample size of test articles for test methods identified in this TOP may be determined by test article size, availability, cost, or other factors. A design of experiment (DOE) is recommended based on requirements and coordination with the test sponsor. The DOE will specify the necessary sample size for statistical analysis. If a DOE is not developed, then the recommended number of replicates is five coupons per test condition and five dose confirmation samples per contamination set for minimal statistical reliability. A test matrix will be designed to maximize available resources to meet stated objectives and criteria. If the sample size is less than recommended, statistical confidence limits will be calculated and reported, and reported as a test limitation. d. Use of Simulants. When using a chemical agent simulant in the conduct of this TOP, the selected properties of the simulant will be verified as being as closely related to those of the contaminant as possible. Because simulants do not have all of the same physical and chemical properties as the agent, simulant data alone are not sufficient to determine decontaminant performance. An agent-simulant relationship (ASR) must be established and coordinated with the test program community of interest before testing begins. e. Security. Security considerations will be adequately determined and provided for, as applicable to each test program. The security classification guide (SCG) and the installation operations security (OPSEC) requirements will be followed. f. Test Incident Reports (TIRs). Unless waived by the test sponsor, TIRs (or equivalent reports), will be prepared and distributed in accordance with (IAW) U.S. Army Test and Evaluation Command (ATEC) Regulation 73-17 and DA PAM 73-18, Appendix V. 3.2 Environmental Documentation. The test plan must cite the approved environmental documentation for each test program. 3.3 Test Readiness Review (TRR)/Operational Readiness Inspection (ORI). a. If required, programs will undergo a TRR before testing begins to ensure that the necessary resources are available to effectively and efficiently conduct the test. Representatives from essential organizations involved in the test program [which may include Warfighters, program office representatives, Test and Evaluation (T&E) Integrated Product Team (IPT) representatives, operational test agency (OTA) representatives, and contractors] will participate in this review and provide input to the proposed testing. The designated TO or TO’s delegate will conduct this review and present the status of all critical elements.

TOP 08-2-060 12 August 2015
9
b. An ORI may be required by the performing organization’s internal procedures to ensure readiness to begin testing. 3.4 Safety. a. It is the responsibility of the user of the TOP to establish appropriate health and safety practices for the execution of procedures in this TOP and handling of generated wastes. b. The primary emphasis in testing using toxic contaminants must be placed on safety. c. A composite risk management or hazard analysis may be required by the testing organization. d. A preoperational safety survey/inspection may be required before testing can begin. e. The safety data sheet(s) [SDS(s)] for the decontaminant(s) and contaminant(s) will be reviewed and maintained in the laboratory or chamber during testing. 3.5 Quality Assurance (QA)/Quality Control (QC). a. A chain-of-custody (CoC) process must be established before testing by labeling all test articles and all test samples to allow tracking of the data flow from test initiation to final data and to prevent misidentification during the test process. b. The test control samples will be used to demonstrate control of the test process across trials and throughout the analytical process. c. For chemical analysis of collection solvent, the chemical analysis procedure must be conducted using best laboratory practices [e.g., International Organization for Standardization (ISO) Standard 170259] for standards, blanks, and analytical controls. d. The sampler selected for use must be well-characterized using standard test methods and calibrated instrumentation. For example, the sampler’s collection efficiency at the test temperature and test humidity must be known. When using SSTs, it must be verified that the proper sorbent is selected, that the capacity of the sorbent is not exceeded (sorbent is saturated and the contaminant passes through), collection efficiency at the expected range of temperatures and humidities is determined, and that the SSTs are clean before their next use. When using solvents for collection or extraction, the stability of the agent in the solvent must be documented, and if the solvent is used as an extractant, the extraction efficiency must also be documented. A standardized method should be used, such as American Society for Testing and Materials International (ASTM) Standard D6196-0310, which addresses selection of sorbents, sampling, and thermal desorption analysis for volatile organic compounds (VOCs). e. Chemical agent must have a purity of 90 percent or greater (persistent nerve agent (VX) may only achieve a purity between 80 and 90 percent), and a purity certificate must be available. The purity of the agent must be analytically demonstrated at a frequency determined

TOP 08-2-060 12 August 2015
10
by the testing organization or based on experience with the agent used. Purity analysis must have been conducted within 12 months of the test [except for VX, which must be purity-analyzed within 6 months]. Purity certification will use one of the following methods: freezing point depression, nuclear magnetic resonance (NMR) analysis (preferred method), or GC analysis documented for each lot. f. Chemical Agent Standard Analytical Reference Material (CASARM) agent will be used unless weapons-grade agent is required by the test program. If weapons-grade agent is required, actual purity at the time of use will be determined and the purity certificate must be available. g. NTAs, TICs, and other contaminants must have a purity of at least 90 percent or an alternative purity approved by the test sponsor. h. If the samples collected during the test must be stored for longer than 1 day before they can be analyzed, storage control samples will be stored with the test samples. These storage control samples will then be analyzed with the test samples to show any sample degradation. i. All aspects of the testing will be performed with emphasis on acquiring valid, repeatable, credible, and verifiable data. 4. TEST PROCEDURES. 4.1 General. The contaminated surface area (i.e., the area wetted by the contaminant) must be measured as accurately as possible using a camera or may be determined by estimation. Estimating the contaminated surface area (based on the coupon and relative coverage sizes) introduces additional errors in subsequent calculations. Any estimating procedures must be documented. For camera measuring, the highest resolution that can be graphically resolved should be determined and documented. The camera should be calibrated for software calculation of the contaminated area (e.g., pixels/cm2). This value is used in the data analysis calculations to determine loading factors. 4.2 Test Method Outline. a. Receipt inspection (Paragraph 4.5). b. Trial preparation tasks (Paragraph 4.6). c. Preconditioning procedure (Paragraph 4.7). d. Contamination procedure (Paragraph 4.8). e. Weathering/exposure procedure (Paragraph 4.9).
TOP 08-2-060 12 August 2015
11
f. Decontamination process (Paragraph 4.10). g. Vapor test procedure (Paragraph 4.11). h. Residual contaminant test procedure (Paragraph 4.12). i. Chromatographic analysis for contaminant (Paragraph 4.13). 4.3 Hazards. a. Identified safety hazards are those associated with testing using toxic chemical surety materials, simulants, TICs, NTAs, other hazardous chemicals, and decontaminant chemicals that are hazardous in and of themselves (e.g., chlorine, hydrogen peroxide, etc.). Chemical safety guidelines are found in DA PAM 385-6111. b. A test plan must be developed with a safety section (which may include a composite risk management) identifying and addressing all safety concerns for each test conducted using these methods IAW AR 385-10. The safety section of the test plan will be coordinated with the test site’s safety office. 4.4 Calibrations and Standards. a. General chemical analytical calibration guidelines are found in best laboratory practices (e.g., practices in ISO 17025). These guidelines can be used for most chemical analytical equipment (e.g., GCs, LCs, etc.) and must be used whenever possible. A sample sequence will be created that includes the following: (1) A solvent blank to analyze method interferences. (2) At least five calibration standards (ranked low to high or high to low concentration). Preparation of standards must follow test site operating procedures. (3) A second solvent blank to analyze carryover. (4) At least one QC sample per detector to validate the calibration curve, including control samples. (5) A third solvent blank. b. The same method will be used to analyze all samples. c. Using the instrument software (where available), the calibration curve will be built from lowest to highest standard concentration. d. Plot information will be analyzed as follows:
TOP 08-2-060 12 August 2015
12
(1) Curve fit type (linear, quadratic, etc.) will be selected. (2) Point weighting method (equal, inverse, etc.) will be selected. (3) If the correlation value (R2) is greater than 0.995, then analysis will proceed. (4) If R2 is less than 0.995, then one data point can be removed and the calibration curve recalculated. This is optional. (5) If R2 is still less than 0.995, each data point will be analyzed to determine any errors. (6) Method adjustments will be made and the calibration repeated. (7) If correlation fails, help will be requested from within the organization. e. If all criteria are met, the QC sample will be loaded and processed in comparison with the calibration curve. The GC response will be used to calculate a concentration value for the QC sample. f. The calculated value for the QC sample must be within ± 15 percent of the expected value. g. If the QC calculated value is within the tolerance range, then the test method will proceed. h. If the QC calculated value is outside of the tolerance range, then a second QC sample will be run. (1) If the second QC calculated value is within the tolerance range, then the test method will proceed. (2) If the second QC calculated value is outside of the tolerance range, then corrective actions and recalibration will be performed to the instrument. i. After any maintenance action to the instrument, two QC samples must have calculated values within the ± 15 percent tolerance range or corrective actions and recalibration must be performed. 4.5 Receipt Inspection. a. The test articles (which may include coupons, panels, or small items of equipment) will be subjected to a visual receipt inspection in accordance with applicable directives such as equipment user/technical manuals after arrival at the test site. Evidence of damage or irregularities to the test articles will be recorded in the laboratory recordkeeping system and will

TOP 08-2-060 12 August 2015
13
be documented by still photographs. Damage and irregularities to be considered will include, but are not limited to, the following (if applicable): (1) Corrosion. (2) Broken connections. (3) Cracked or deteriorated surfaces. (4) Contamination with foreign material. (5) Discoloration. (6) Evidence of deterioration or illegible markings. (7) Incorrect number of items. (8) Missing components, instructions, or manuals. b. Each test article’s model, serial number, nomenclature, identifier, manufacturer, lot number, and other pertinent information/indicators, if applicable, will be recorded in the laboratory recordkeeping system. Assignment of a test item control number (TICN) to the test article is mandatory for future identification and tracking. The TICN will be marked on small items of equipment in a location that will not interfere with test procedures. Coupons/panels will be labeled on their reverse side with the TICN. The preferred method for marking the TICN is engraving. Other methods for labeling must consider the potential for analytical interference and record results of the methodology used to determine that no interference exist. The TICN and other pertinent information about the test article are linked in the laboratory recordkeeping system. c. If any items are determined to be unfit for testing, they will be rejected and replaced with items that are in suitable condition for testing. 4.6 Trial Preparation Tasks. a. The availability of all necessary equipment, test fixtures (if applicable), materials (including standard reference materials, if applicable), reagents, analytical capabilities, and necessary personnel will be ensured for the test. b. Any data analysis calculations required to ensure the necessary data are collected will be identified. c. Chemicals used for preparation of decontaminant formulations will be used as-received. Purity will be established based on supplied purity documents. Chemicals used as solvents will be purchased in the highest purity available from the manufacturer or distributor. Simulants will be purchased in the highest purity available from the manufacturer or distributor.

TOP 08-2-060 12 August 2015
14
d. Candidate decontaminants will be prepared IAW the manufacturer’s instructions. Fielded decontaminants will be prepared IAW applicable military technical manuals. Quality checks will be performed as necessary by routine analytical methods [such as pH (hydrogen-ion-concentration) measurement, titration, etc.]. The pot life as specified by the manufacturer will not be exceeded. This may require frequent preparation of the decontaminant during trial conduct. e. Test fixtures and off-gas boxes will be turned on and allowed to equilibrate at the specified test conditions. All equipment will be operational before the start of test. Off-gas boxes should be monitored to ensure that no residual vapor remains to create a positive bias in data collected. The procedure for determining/verifying that the interior of the off-gas box is a well-mixed environment with the test item in place will be performed IAW the Chemical Contaminant and Decontaminant Test Methodology Source Document, Second Edition, ECBC-TR-98012. f. The test setup, labeling of vials, trays, jars, etc., and other associated pretest tasks will be completed. g. Coupons/panels may require cleaning before testing to remove cutting oils or other preparation contaminants. The marked coupons/panels or small equipment articles will be stored in a secure, environmentally-controlled location. The test articles will be protected from unrelated environmental contaminants and degradation. h. All calibrated instrumentation will have a current calibration date (see Paragraph 4.4). i. Timing charts for staggering contamination, decontamination, and other test events may be required. The timing charts will assist in minimizing data scatter that may be caused by subtle differences in coupon treatment. j. The total length of vapor sampling [when using cumulative vapor samplers (e.g., SSTs)] will reflect a mission profile for the test program and will be delineated in the test plan. The default sampling length will be 12 hours. A vapor sampling plan will be developed to establish when vapor samplers should be replaced. k. Positive and negative controls will be prepared as described in Reference 1. 4.7 Preconditioning Procedure. a. Any required preconditioning of the test articles described in the test planning documentation will be performed. b. The positive and negative controls will be preconditioned using the same method as that used for the test articles (as described in the test planning documentation).

TOP 08-2-060 12 August 2015
15
c. The test articles will remain preconditioned until ready to execute the next step, Paragraph 4.8, Contamination Procedure. 4.8 Contamination Procedure. a. Test article contamination will be conducted as described in the test planning documentation. b. Test articles will be photographed to record and determine the contamination surface area coverage. A dye may need to be added to the contaminant to allow for better visibility and determination of contaminant coverage on some test article materials. When photographs cannot be taken, especially for complex surface test articles, an estimate of the surface coverage will be made and recorded based on the size of the coupon and relative size of the coverage. 4.9 Weathering/Exposure Procedure. a. After contamination, weathering procedures will be conducted as described in the test planning documentation. b. For testing using coupons/panels, each coupon/panel will be photographed to record and determine the contaminated surface area remaining after weathering/exposure. When photographs cannot be taken, especially for complex surface test articles, an estimate of the surface coverage will be recorded. c. The test articles will be moved to the decontamination area at the end of the weathering/exposure period. 4.10 Decontamination Process. a. The decontamination process will be conducted as described in the test planning documentation, based upon manufacturers’ instructions for candidate decontaminants and IAW applicable tactics, techniques, and procedures for fielded decontaminants. b. After decontamination, the test articles will be allowed to dry until no visible moisture is present. c. Any visible degradation of the test article surface will be recorded. 4.11 Vapor Test Procedure. a. The off-gas box temperature will be set if temperature conditioning is required. The off-gas box will be conditioned until the required temperature conditions are achieved before placing the test articles inside.

TOP 08-2-060 12 August 2015
16
b. The test articles will be placed in the vapor off-gas boxes specifically designed for containing and collecting residual vapor. NOTE: The off-gas box consists of a sealed container that allows a stream of air to be drawn across the test article and into a sampler or a detector. c. The off-gas box will be sealed and the airflow initiated based on the vapor sampler being used (MINCAMS®, SST, or equivalent). The airflow rate to be used will be specified in the test plan. Initiation of the airflow through the off-gas box begins the sample collection time and is recorded as time zero (t0). d. When using SSTs, the vapor sampling plan outlined in the test plan (e.g., change-out at 30-minute, 1-hour, or 2-hour intervals) will be followed. Dual SSTs may be desirable to minimize loss of data. When dual SSTs are used, the SSTs will be sampling in parallel. Collected SSTs will be taken to an analytical laboratory for thermal desorption or liquid extraction of the contaminant from the sorbent. The desorbed or extracted sample will then be analyzed by GC / mass spectrometer (MS), LC/MS, or other analytical instrumentation, depending upon the nature of the contaminant. e. The NRT sampling instrumentation calibration range and sampling cycle time will be determined based on the expected concentration of the vapor off-gassed from the test article. Concentrations from the higher end of the expected range will require a shorter sampling time to avoid detector saturation, which would result in a loss of data. 4.12 Residual Contaminant Test Procedure. a. Additional information may be collected from coupons or panels after vapor sampling using an extraction process for residual contaminant. b. Each coupon/panel will be placed in a container with extraction solvent. The size of the coupon/panel is an extremely important consideration in this procedure. The larger the test article size, the more solvent that will be required to extract the contaminant. The more extraction solvent used, the more diluted the contaminant will become, making it less likely to be detected. For most materials, the contaminated side will be placed face-up; however, if the material being tested floats, the sample will be placed face-down so that solvent contact occurs. Complete immersion of the test article will provide the best data. c. The container will be sealed with a lid lined with Teflon® polytetrafluoroethylene (PTFE) (DuPont™, E.I. du Pont de Nemours and Company, Wilmington, Delaware). d. In order to facilitate contaminant extraction, agitate the container by swirling for 30 seconds. e. The test article will remain in the extraction solvent for 60 minutes. Other extraction durations may be used but the change from the TOP must be documented in the test plan and the rationale described.

TOP 08-2-060 12 August 2015
17
f. At the end of the extraction period, the container will be swirled for 30 seconds before the lid is opened. After swirling, an analytical vial will be opened, and a clean pipette tip will be used to place an aliquot into the vial for analysis. 4.13 Chromatographic Analysis for Contaminant Procedure. a. Samples will be analyzed following existing chromatographic procedures. b. The samples may need to be diluted to concentrations within the analytical method calibration range. 5. DATA REQUIRED. 5.1 Data Recorded and Reported. 5.1.1 General Data. a. Receipt inspection data (test article information, photographs, etc.). b. TICN assigned to each test article. c. Surface area and contaminated surface area of each test article (cm2). d. Contaminant (agent, simulant, or other) purity (percent). e. Solvent purity (percent). f. Data required from the preconditioning, contamination, weathering, and decontamination procedures outlined in TOP 08-2-061A. g. Sampling time intervals (minutes:seconds). h. Flow rate of samplers (mL/min). i. NRT sampler concentration range (mg/m3). j. Results of NRT quality check shots (mg/m3). k. Trial date, start time, and end time. l. Residual contaminant vapor by NRT instrument (mg/m3). m. Mass of residual contaminant by SST (ng), if thermal desorption of the SST is performed.

TOP 08-2-060 12 August 2015
18
n. Mass per volume of residual contaminant (ng/mL) if liquid extraction of the SST is performed. o. Measured off-gas box temperature (°C). p. Measured off-gas box RH (percent). q. Air velocity above the test item (m/sec). r. Decontaminant and decontamination procedures used. s. Analytical instrument MQL, calibration range, and quality sample results (spikes, blanks, and standard) (ng). 5.1.2 Item Specific Data. a. Contaminant Delivery Applicator Data. NOTE: Data are for each applicator used. (1) Manufacturer name, model number, and volume dispensing range. (2) Applicator specifications, including accuracy and any other conformance specifications. (3) Calibration status (if applicable), including the last date calibrated. b. Decontaminant Delivery Applicator Data. NOTE: Data are for each applicator used. (1) For pipettes, syringes, and similar applicators: Data items specified in Paragraph 5.1.2.a. (2) For prototype equipment: Description of the decontamination system including configuration and identification number/name (if any). (3) For established equipment: Description of the decontamination system operation and operational parameters (e.g., flow rates, pressure, etc.). c. Water Rinse Applicator Data. Data items specified in Paragraph 5.1.2.a. d. Extraction Solvent Applicator Data. Data items specified in Paragraph 5.1.2.a. e. Environmental Conditioning Chamber Data.

TOP 08-2-060 12 August 2015
19
NOTE: The environmental conditioning chamber may not be used for every test. (1) Description of the chamber including manufacturer and model number for commercial items or a more detailed description for fabricated systems. (2) Chamber set points. f. Off-Gas Box Data. Description of the off-gas box and configuration of any devices attached to the box (e.g., mixing fans, sensors, etc.). g. Contaminated Surface Area Measuring Data. Camera manufacturer, model number, resolution, and description of area measurement calculation and associated error with calculation, if known. NOTE: Data required only if a camera is used to measure the contaminated surface area as described in Paragraph 4.1.b. h. Sorbent Tubes Data. SST supplier, description, part number, and sorbent used. NOTE: Data required only if SSTs are used to sample off-gassed vapor as described in Paragraph 4.11.d. i. Coupon or Panel Material Data. (1) Stock material description (e.g., bar stock, sheet, etc.), manufacturer and/or supplier, and part number/lot number (as applicable). (2) Any painting or coating applied to the material, including a description of the surface preparation method, the paint or coating used with manufacturer name and lot number, any primer used, method of application, resulting thickness on the material, date of preparation, and date of use (as applicable). j. Test Article Data. Description of each article, as applicable, including manufacturer and/or supplier, model number/serial number, article condition (new or used), if used, any history of use (if known). 5.2 Data Review and Corrective Action. a. The data may be tested for outliers during data analysis. A standardized method such as ASTM Standard E017813, will be used. Although ASTM Standard E0178 discusses multiple methods to test for outliers, the method discussed in Paragraphs 6.1 though 6.2 of ASTM Standard E0178 is recommended. Data points determined to be outliers may be excluded from statistical data analysis and should be flagged as being excluded, but must be reported along with the appropriate data set.

TOP 08-2-060 12 August 2015
20
b. Large data variances (high error percentages) are not always an indication of a poorly executed test and must be investigated in conjunction with the test sponsor before the data are rejected. 5.3 Data Acceptance Parameters. a. The following are the set point tolerance ranges in which trials should be conducted in order for the data generated to be acceptable for use. b. SST sampling time: 90 percent of the SST replacement intervals will be within ± 2 percent of the target sampling time. c. Sampling flow rate: 90 percent of flow rate measurements will be within ± 5 percent of the target flow rate. d. Temperature: 90 percent of temperature measurements will be within ± 5 °C of the target temperature. e. RH: 90 percent of relative humidity measurements will be within ± 5 percentage points of the target RH. 6. PRESENTATION OF DATA. a. A summary will be presented for each vapor sampler data package by trial, which will include but is not limited to calibration values, tabular test sample results, QC process sample results, outliers, method used for outlier determination, graphical presentation of test sample results (concentration versus time), etc. b. A graphical representation or summary table of each off-gas box temperature and RH versus time by trial will be presented. c. The emission factor calculations will be performed as described in Appendix B. A table of these results will be produced. d. Toxic load calculations (Appendix C) will be performed. Using operational scenarios provided by the sponsor, and/or the OTAs, the toxic load calculations will be integrated to provide vapor hazard predictions. e. Photographs will be used to document the agent spread and contaminated area on the test articles, and will be included in the report. f. Examples of various data formats are provided in Appendix A.
TOP 08-2-060 12 August 2015
A-1
APPENDIX A. VAPOR CALCULATIONS FOR A SINGLE MATERIAL SYSTEM.
TABLE LIST
Table Page A-1 EXAMPLE OF DISTILLED MUSTARD (HD) MASS COLLECTED FROM CONTAMINATION OFF-GASSING .......................................................................... A-3 A-2 EXAMPLE DATA FOR DISTILLED MUSTARD (HD) VAPOR CONCENTRATIONS CALCULATED WITH EQUATION A-1 .............................. A-3 A-3 MICROCHAMBER PERSISTENT NERVE AGENT (VX) EXAMPLE CONCENTRATION DATA ...................................................................................... A-4 A-4 MICROCHAMBER EXAMPLE LEAST SQUARES PARAMETERS .................... .A-12 A-5 MICROCHAMBER EXAMPLE OF EMISSION FUNCTION ERROR BOUNDS . .A-14 A-6 LARGE OFF-GAS BOX EXAMPLE LEAST SQUARES PARAMETERS ............ .A-14 A-7 LARGE OFF-GAS BOX EXAMPLE OF EMISSION FUNCTION ERROR BOUNDS .................................................................................................................... .A-17
FIGURE LIST
Figure Page A-1 Microchamber example of least squares results ......................................................... .A-12
A-2 Example residual plot for the microchamber .............................................................. .A-13
A-3 Emission function for microchamber vapor sampling with error bounds .................. .A-15
A-4 Large off-gas box example least squares results ......................................................... .A-16
A-5 Example residual plots for the large off-gas box ........................................................ .A-18
A-6 Selected concentration model for large off-gas box vapor sampling with error bounds ...................................................................................................................... .A-19

TOP 08-2-060 12 August 2015
A-2
APPENDIX A. VAPOR CALCULATIONS FOR A SINGLE MATERIAL SYSTEM.
A.1 CALCULATING VAPOR CONCENTRATION. To quantify the vapor emitted from residual contamination, the mass data collected must first be converted to a vapor concentration. NRT detection systems perform this conversion internally, but data from other systems, such as SSTs, must be converted by calculation. The vapor concentration is then used with a mass balance model to calculate the rate at which vapor is emitted from the residual contamination. The rate of vapor emission is used in the toxic load calculations described in Appendix B to scale the hazard to larger items and operationally relevant scenarios. NOTE: Calculations described in the following paragraphs are based on those in the U.S. Army Edgewood Chemical Biological Center (ECBC) Chemical Contaminant and Decontaminant Test Methodology Source Document, Second Edition, Document Number ECBC-TR-980. The integrating factor method14 was used to solve the equations instead of the numerical method used in ECBC-TR-980. Numerical methods are estimations and can introduce calculation errors; therefore, the analytical methods describe were used. A.2 RESIDUAL CONTAMINATION VAPOR COLLECTED. a. When an NRT detector is used to collect data, the vapor concentration will be calculated within the detection system. When SSTs are used, the collected mass data will be converted to a vapor concentration using Equation A-1. Conversion of units is not required in Equation A-1 because a value given in mg/m3 is equivalent to a value given in ng/mL.
Equation A-1
Where: c(t) = time-dependant vapor concentration from an SST (mg/m3) t = elapsed time (min) m(t) = time-dependant analyte mass on the tube (ng) ts = SST sampling duration (min) F = flow rate through the SST (mL/min) b. For example, Equation A-1 can be used to calculate distilled mustard (HD) vapor concentrations from the example SST masses shown in Table A-1 and the associated sampling periods shown in Table A-2. In this example, the flow rate for each SST was 500 mL/min. Based on the values in Tables A-1 and A-2, Equation A-1 yields the HD vapor concentrations shown in Table A-3.

TOP 08-2-060 12 August 2015
A-3
APPENDIX A. VAPOR CALCULATIONS FOR A SINGLE MATERIAL SYSTEM.
TABLE A-1. EXAMPLE OF DISTILLED MUSTARD (HD) MASS COLLECTED FROM CONTAMINATION OFF-GASSING
Test Article Number
HD Mass (ng) Collected at the Sorbent Tube Interval 3 9 9 29 59 59
1 35 50 46 136 231 173 2 32 46 52 136 254 202 3 34 49 53 164 217 166 4 33 46 54 154 222 222 5 41 48 57 151 241 212 6 41 45 47 158 219 194 7 32 55 54 142 257 205 8 38 53 45 133 256 199
NOTE: The sample interval midpoints for this table were at 5, 15, 25, 45, 90, and 150 minutes.
TABLE A-2. EXAMPLE DATA FOR DISTILLED MUSTARD (HD) VAPOR CONCENTRATIONS CALCULATED WITH EQUATION A-1
Test Article Number
HD Vapor Concentration (mg/m3) per Sorbent Tube Change-Out Interval 5 min 15 min 25 min 45 min 90 min 150 min
1 0.0233 0.0111 0.0102 0.0094 0.0078 0.0059 2 0.0213 0.0102 0.0116 0.0094 0.0086 0.0068 3 0.0227 0.0109 0.0118 0.0113 0.0074 0.0056 4 0.0220 0.0102 0.0120 0.0106 0.0075 0.0075 5 0.0273 0.0107 0.0127 0.0104 0.0082 0.0072 6 0.0273 0.0100 0.0104 0.0109 0.0074 0.0066 7 0.0213 0.0122 0.0120 0.0098 0.0087 0.0069 8 0.0253 0.0118 0.0100 0.0092 0.0087 0.0067
NOTE: A solid sorbent tube (SST) flow rate (F) of 500 mL/min was used to calculate these
example data using the mass concentrations in Table A.1 and the sampling periods in Table A-2.

TOP 08-2-060 12 August 2015
A-4
APPENDIX A. VAPOR CALCULATIONS FOR A SINGLE MATERIAL SYSTEM.
TABLE A-3. MICROCHAMBER PERSISTENT NERVE AGENT (VX) EXAMPLE CONCENTRATION DATA
Test Article
Number VX Concentration per Sampling Change-Out Interval (mg/m3)
10 min 30 min 60 min 180 min 360 min 720 min 1 0.297 0.289 0.277 0.261 0.185 0.121 2 0.262 0.345 0.36 0.287 0.237 0.172 3 0.288 0.408 0.398 0.346 0.249 0.154 4 0.220 0.271 0.287 0.237 0.165 0.125 5 0.206 0.286 0.311 0.269 0.202 0.121
A.3 EMISSION FACTOR MODEL. a. Equation A-2 is a mass balance equation that describes the relationship among the off-gas box vapor concentration, vapor emission from residual contamination on a single test article, and the test conditions, including the enclosure or room volume and airflow rate. Equation A-2 assumes that the air in the enclosed space (room, test, fixture, etc.) is well mixed. Also, the mass balance equation does not account for any test surfaces that could adsorb or react with the vapor. The emission factor model is temperature and humidity dependent.
, Equation A-2
Where:
= derivative of concentration with respect to time [(mg/(m3·min)]
c(t) = time-dependent off-gas box vapor concentration (mg/m3) V = available off-gas box volume (off-gas box volume minus the test article
volume) (m3) Q = mean airflow rate (m3/min) A = contaminated area (m2) E(t,β) = time-dependent emission factor of test article [mg/(m2 min)] β = the vector of regression coefficients for each emission function (β0, β1 and β2) b. The mass balance equation (Equation A-2) can be simplified by substituting the loading factor (l = A/V), and air exchange rate (n = Q/V) and rearranging (Equation A-3).

TOP 08-2-060 12 August 2015
A-5
APPENDIX A. VAPOR CALCULATIONS FOR A SINGLE MATERIAL SYSTEM.
, Equation A-3
Where:
= derivative of concentration with respect to time [(mg/(m3·min)]
c(t) = time-dependent off-gas box vapor concentration (mg/m3) E(t,β) = time-dependent emission factor of test article [mg/ (m2 min)] β = the vector of regression coefficients for each emission function (β0, β1 and β2) l = loading factor (1/m) n = air exchange rate in (min-1) c. For a known emission function, Equation A-3 can be analytically solved using the integrating factor method for many emission functions (reference 14) as shown in Equation A-4. When there is not an analytical solution, Equation A-4 can be numerically integrated using methods including and Simpson’s rule15. Another approach is to numerically solve Equation A-3 using implicit Runge-Kutta or Backward Euler15. These methods can be implemented in Matlab (MathWorks, Natick, Massachusetts), Octave (Free Software Foundation Inc., Boston Massachusetts), SAS (SAS Institute Inc., Cary North Carolina), R (R Foundation, Vienna, Austria), and other data analysis software.
, ′ Equation A-4
Where: c(t) = time-dependent off-gas box vapor concentration (mg/m3) E(t,β) = time-dependent emission function of test article [1/(mg × min)] β = the vector of regression coefficients for each emission function (β0, β1 and β2) l = loading factor (1/m) n = air exchange rate in (min-1) t’ = variable of integration e = Euler’s number (approximately 2.7182) dt’ = differential of time d. The emission function models the off-gassing process. It is not always possible to know the exact physics that will occur, so regression must be done using several different models.
TOP 08-2-060 12 August 2015
A-6
APPENDIX A. VAPOR CALCULATIONS FOR A SINGLE MATERIAL SYSTEM.
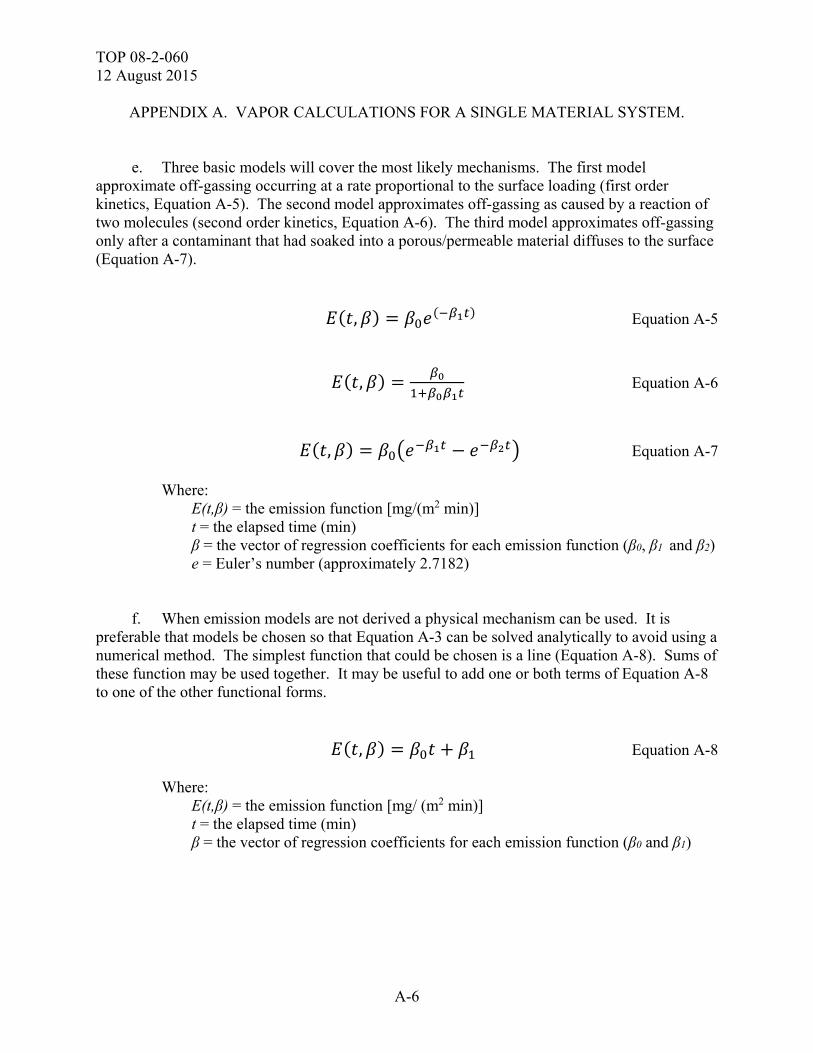
e. Three basic models will cover the most likely mechanisms. The first model approximate off-gassing occurring at a rate proportional to the surface loading (first order kinetics, Equation A-5). The second model approximates off-gassing as caused by a reaction of two molecules (second order kinetics, Equation A-6). The third model approximates off-gassing only after a contaminant that had soaked into a porous/permeable material diffuses to the surface (Equation A-7).
, Equation A-5
, Equation A-6
, Equation A-7 Where: E(t,β) = the emission function [mg/(m2 min)] t = the elapsed time (min) β = the vector of regression coefficients for each emission function (β0, β1 and β2) e = Euler’s number (approximately 2.7182) f. When emission models are not derived a physical mechanism can be used. It is preferable that models be chosen so that Equation A-3 can be solved analytically to avoid using a numerical method. The simplest function that could be chosen is a line (Equation A-8). Sums of these function may be used together. It may be useful to add one or both terms of Equation A-8 to one of the other functional forms.
, Equation A-8 Where: E(t,β) = the emission function [mg/ (m2 min)] t = the elapsed time (min) β = the vector of regression coefficients for each emission function (β0 and β1)

TOP 08-2-060 12 August 2015
A-7
APPENDIX A. VAPOR CALCULATIONS FOR A SINGLE MATERIAL SYSTEM.
g. Using the log normal distribution found in Equation A-9 as the emission function has been successful at fitting vapor sampling data. Unfortunately, Equation A-3 is not analytically solvable with this emission function. However, Equation A-4 can be integrated numerically and Equation A-3 can be solved numerically with this function.
, exp Equation A-9
Where: E(t,β) = the emission function [mg/ (m2 min)] t = the elapsed time (min) β = the vector of regression coefficients for each emission function (β0 and β1) h. If a new emission function is introduced it must have four or fewer β parameters. If too many parameters are allowed to vary, the model could be very close to all of the data points without actually representing the physical process. If more parameters are desired, more sorbent tubes will need to be collected in each replicate. i. When the air in the off-gas box (especially in a microchamber with a small free-air volume) is exchanged more than 50 times before the first data point is collected (i.e., when n multiplied by the time to the first data point collection is more than 50), solve Equation A-3. In these cases the air in the fixture is being exchanged faster than can be detected by the instrumentation and the concentration can be modeled as in Equation A-10.
, Equation A-10
Where: c(t) = the concentration as a function of time (mg/m3) t = the elapsed time (min) l = loading factor (1/m) n = air exchange rate (min-1) E(t, ) = time-dependent emission function of test article [mg/(m2·min)] β = vector of regression coefficients for each emission function (β0, β1 and β2
from Equations A-5 through A-8)

TOP 08-2-060 12 August 2015
A-8
APPENDIX A. VAPOR CALCULATIONS FOR A SINGLE MATERIAL SYSTEM.
j. When the number of air exchanges before the first data point is collected is less than 50 (i.e., when n multiplied by the time to the first data point collection is less than 50), the mass balance equation (Equation A-3) should be solved. Equations A-11 through A-14 are solutions to the mass balance equation (Equation A-3). These solutions were found by substituting Equations A-4 through A-8, respectively, into Equation A-3, and integrating. These solutions can be added together if necessary. In particular, Equation A-14 may be useful when added to these other solutions.
Equation A-11
Equation A-12
Equation A-13
1 Equation A-14 Where: c(t) = concentration as a function of time (mg/m3) t = elapsed time (min) β = vector of regression coefficients for each emission function (β0, β1 and β2
from Equations A-5 through A-8) e = Euler’s number approximately 2.718 l = loading factor (1/m) n = air exchange rate in (min-1) Ei = integrated exponential function A.4 REGRESSION AND SELECTION OF EMISSION FUNCTION. a. Several aspects of this system must be addressed to successfully implement regression techniques for this purpose. First, vapor data are usually heteroscedastic (the variance differs through time). Second, all of the analytical equations are nonlinear.

TOP 08-2-060 12 August 2015
A-9
APPENDIX A. VAPOR CALCULATIONS FOR A SINGLE MATERIAL SYSTEM.
(1) To account for heteroscedasticity, weighting should be applied to the regression. The error in measurement is expected to be inversely proportional to concentration. It usually makes sense to apply the weight using Equation A-15.
Equation A-15
Where: w(t) = weight function s(t) = standard deviation at each time interval (2) An alternate approach to weighting would be to conduct a transformation on the data (e.g., logarithmic transform). If this approach is used the process and rationale must be documented in the test report. (3) All of the solutions to Equation A-3 require nonlinear techniques to fit them to data. Regression using each of these solutions can be performed using the Levenberg-Marquardt algorithm. The convergence of the Levenberg-Mardquardt algorithm can be enhanced for Equations A-11 through A-14 by providing the partial derivatives of the functions with respect to the parameters (β). As an example, the derivatives of Equation A-11 are provided in Equations A-16 and A-17. The Levenberg-Marquardt algorithm is available in Matlab, Octave, SAS, R, or other data analysis software.
Equation A-16
Equation A-17
Where: ∂ = partial differential operator β = vector of regression coefficients for each emission function (β0, β1 and β2
from Equations B-5 through B-9) t = elapsed time (min) e = Euler’s number (approximately 2.7182) l = loading factor (1/m) n = air exchange rate (min-1)

TOP 08-2-060 12 August 2015
A-10
APPENDIX A. VAPOR CALCULATIONS FOR A SINGLE MATERIAL SYSTEM.
(4) The regression is calculated on all replicates of a trial (conducted on the same test article using the same challenge, challenge concentration, and trial conditions) at the same time. b. After regression is completed on all of the concentration models, best-fit analysis can be performed to determine which model best represents the data. The best representation of the data will have small and randomly distributed standardized residuals (residual adjusted by the actual data standard deviation). To check the size of the residuals (the difference between the model output and the actual data), the average relative difference (ARD) should be calculated using Equation A-1816.
∑| |
Equation A-18
Where: = average relative difference c(ti) = mean experimental concentration (mg/m3) at the ith time cm(ti) = model concentration (mg/m3) at the ith time N = number of data points c. To check the randomness of the residuals, the standardized residual plots should be examined. The standardized residuals should be randomly distributed above and below zero (i.e., not exhibit any systematic error). d. When two models perform similarly, the model with the fewest parameters should be chosen. This maximizes the degrees of freedom and will improve the results. e. After a model is selected, then the error bounds on the emission function need to be obtained. First the error bounds on the concentration model will be calculated, then these will be converted to emission function error bounds. (1) When the Levenberg-Marquard algorithm is performed, the software usually provides either a variance of the residuals or the standard deviation of the residuals. To generate concentration error bounds, five replicates (recommended) should be conducted per trial (more replicates will provide better confidence intervals). For simplicity, the largest value of s will be used to generate the concentration 95 percent confidence intervals (Equations A-19 and A-20). A tighter confidence interval can be calculated, but would need more rigorous justification.
TOP 08-2-060 12 August 2015
A-11
APPENDIX A. VAPOR CALCULATIONS FOR A SINGLE MATERIAL SYSTEM.
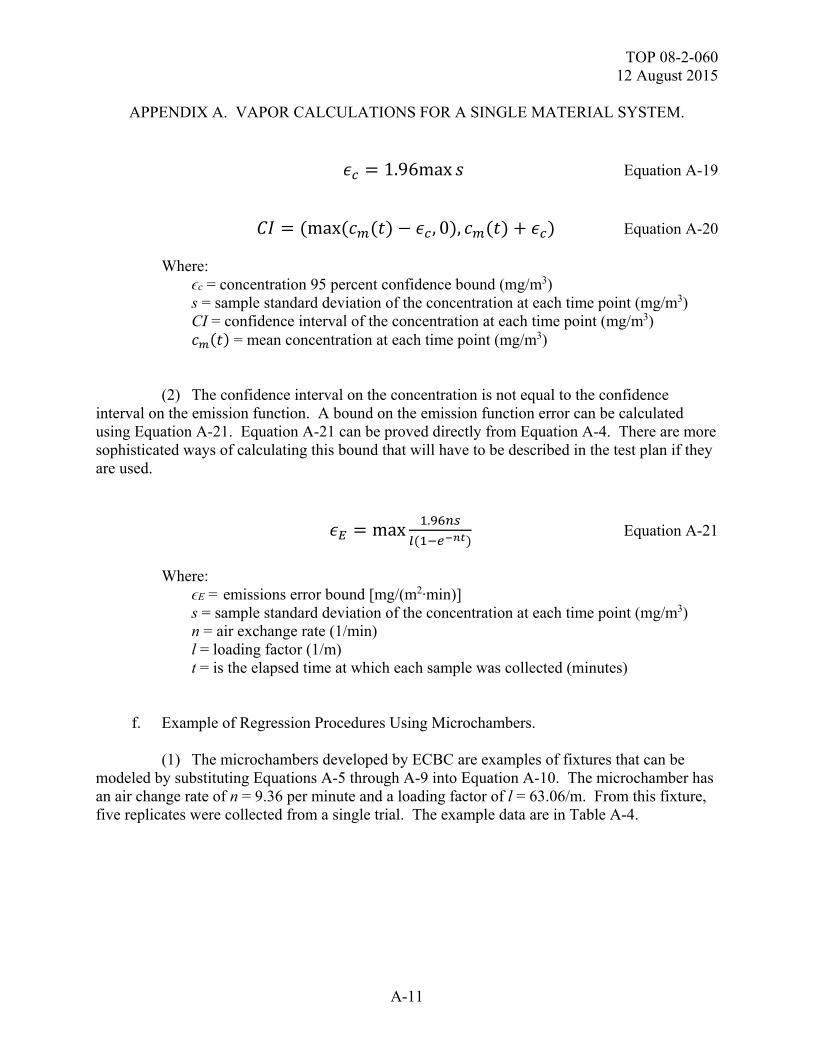
1.96max Equation A-19
max , 0 , Equation A-20 Where: ϵc = concentration 95 percent confidence bound (mg/m3) s = sample standard deviation of the concentration at each time point (mg/m3) CI = confidence interval of the concentration at each time point (mg/m3) = mean concentration at each time point (mg/m3) (2) The confidence interval on the concentration is not equal to the confidence interval on the emission function. A bound on the emission function error can be calculated using Equation A-21. Equation A-21 can be proved directly from Equation A-4. There are more sophisticated ways of calculating this bound that will have to be described in the test plan if they are used.
max.
Equation A-21
Where: ϵE = emissions error bound [mg/(m2·min)] s = sample standard deviation of the concentration at each time point (mg/m3) n = air exchange rate (1/min) l = loading factor (1/m) t = is the elapsed time at which each sample was collected (minutes) f. Example of Regression Procedures Using Microchambers. (1) The microchambers developed by ECBC are examples of fixtures that can be modeled by substituting Equations A-5 through A-9 into Equation A-10. The microchamber has an air change rate of n = 9.36 per minute and a loading factor of l = 63.06/m. From this fixture, five replicates were collected from a single trial. The example data are in Table A-4.

TOP 08-2-060 12 August 2015
A-12
APPENDIX A. VAPOR CALCULATIONS FOR A SINGLE MATERIAL SYSTEM.
TABLE A-4. MICROCHAMBER EXAMPLE LEAST SQUARES PARAMETERS
Model Equation First
Parameter Second
Parameter Third
Parametera
Average Relative Difference
(ARD) First order A.5 4.51 × 10⁻² 1.04 × 10⁻³ NA 0.144 Second order A.6 4.56 × 10⁻² 3.17 × 10⁻² NA 0.149 Linear A.7 -3.29 × 10⁻⁵ 4.43 × 10⁻² NA 0.139 Dual exponential A.8 5.11 × 10⁻² 1.28 × 10⁻³ 1.37 × 10⁻¹ 0.134
aSome models do not have a third parameter. These are marked not applicable (NA). (2) For the example dataset (Table A-4), the first time point is at 10 minutes. For the microchamber, the air exchange rate of 96/min is greater than the threshold value of 50 (Paragraph A.3.h). To find the emission function, the concentration will be modeled by substituting Equations A-5 through A-9 into Equation A-10. Parameters were calculated using the Levenberg-Marquardt algorithm. These models are shown in Figure A-1 and the parameter values are in Table A-4.
Figure A-1. Microchamber example of least squares results.

TOP 08-2-060 12 August 2015
A-13
APPENDIX A. VAPOR CALCULATIONS FOR A SINGLE MATERIAL SYSTEM.
(3) All of the models have small ARDs with the dual exponential doing the best for this data set. Figure A-2 shows the residuals for these models. From Figure A-2 it can be seen that the dual exponential model has the most consistent residuals. For this example the choice is clear, and the dual exponential model is chosen with the parameters given in Table A-5.
Figure A-2. Example residual plot for the microchamber.
A. First Order B. Second Order
C. Linear D. Dual Exponential

TOP 08-2-060 12 August 2015
A-14
APPENDIX A. VAPOR CALCULATIONS FOR A SINGLE MATERIAL SYSTEM.
TABLE A-5. MICROCHAMBER EXAMPLE OF EMISSION FUNCTION ERROR BOUNDS
Time (minutes)
Sample Standard Deviation (s)
(mg/m3)
Emission Function Error Bound (ϵE)
[mg/(m2·min)]
10 0.0367 0.0107 30 0.0543 0.0158 60 0.0482 0.0140
180 0.0372 0.0108 360 0.0319 0.0093 720 0.0211 0.0061
(4) The 95 percent emission function error bounds are calculated by using Equation A-21. Table A-6 shows the details of this calculation. The emission function error bound is the value that is maximized in Equation A-21. This value is added and subtracted from the selected model (Equation A-20). Figure A-3 shows the results of this calculation.
TABLE A-6. LARGE OFF-GAS BOX EXAMPLE LEAST SQUARES PARAMETERS.
Model Equation First
Parameter Second
Parameter Third
Parametera
Average Relative Difference
(ARD) First Order A.10 1.69 × 10⁻³ 2.30× 10⁻¹ NA 0.074 Second Order A.11 8.73 × 10⁷ 4.07 × 10³ NA 0.133 Linear A.12 -1.12 × 10⁻⁶ 1.97 × 10⁻⁴ NA 0.432 Dual Exponential A.13 1.69 × 10⁻³ 2.30 × 10⁻¹ 1.55 × 1025 0.074
aSome models do not have a third parameter. These are marked not applicable (NA).

TOP 08-2-060 12 August 2015
A-15
APPENDIX A. VAPOR CALCULATIONS FOR A SINGLE MATERIAL SYSTEM.
Figure A-3. Emission function for microchamber vapor sampling with error bounds.
0.0511 . . 0.0158 Equation A-22 Where: E(t) = time-dependent emission function of test article [mg/(m2·min)] t = elapsed time (min) g. Example of the Regression Procedure Using a Large Off-Gas Box. (1) The large off-gas box developed by ECBC is an example of a fixture that must be modeled with Equations A-11 through A-14. The large off-gas box has a total volume of 0.17 m3. Removing from the total volume the volume of instrumentation and a test article results in a free volume of 0.13 m3 which then equals 127 L (V). For this example, the SSTs have an airflow of 500 mL/min (Q). For this configuration, the exchange rate n = Q/V = 0.5/127 = 0.004/minute. The test article being used in this case is a laptop computer with an exposed area of 0.21 m2. Therefore l = A/V = 0.21/0.13 = 1.6/m. From this fixture, five replicates were collected from a single trial. The example input data are in Table A-3.

TOP 08-2-060 12 August 2015
A-16
APPENDIX A. VAPOR CALCULATIONS FOR A SINGLE MATERIAL SYSTEM.
(2) For this example dataset, the first data collection time point is at 15 minutes. That means that the air in the fixture was exchanged 0.06 times before the first data point was collected, which is much less that the 50 times exchange threshold (Paragraph A.3.h). To find the emission function, the concentration data were fit to the models in Equation A-11 through A-14. Parameters were calculated using the Levenberg-Marquardt algorithm. These models are shown in Figure A-4 and the parameter values are shown in Table A-7.
Figure A-4. First order model line is hidden behind the dual exponential model line.

TOP 08-2-060 12 August 2015
A-17
APPENDIX A. VAPOR CALCULATIONS FOR A SINGLE MATERIAL SYSTEM.
TABLE A-7. LARGE OFF-GAS BOX EXAMPLE OF EMISSION FUNCTION ERROR BOUNDS.
Time (minutes)
Standard Deviation (s)
(mg/m3)
Emission Function Error Bound (ϵE)
(mg/m3)
5 8.10 × 10⁻⁴ 1.99 × 10⁻⁴ 15 7.74 × 10⁻⁴ 6.48 × 10⁻⁵ 25 9.57 × 10⁻⁴ 4.90 × 10⁻⁵ 45 8.10 × 10⁻⁴ 2.40 × 10⁻⁵ 90 5.75 × 10⁻⁴ 9.28 × 10⁻⁶
150 6.35 × 10⁻⁴ 6.86 × 10⁻⁶
(3) The first-order model and the dual-exponential model have the same average relative difference. In this case preference is given to the model with the fewest parameters. To select the model, the residuals are analyzed to be sure the correct model is selected. Figure A-5 shows plots of the residuals. The top right and bottom left plots show residuals that are not evenly distributed above and below zero. Figure A-5 demonstrates that the first order model suffers less systematic error than the other models. For these reasons, the first order emission function is chosen with the parameters given in Table A-7.

TOP 08-2-060 12 August 2015
A-18
APPENDIX A. VAPOR CALCULATIONS FOR A SINGLE MATERIAL SYSTEM.
A. First Order B. Second Order
C. Linear D. Dual Exponential
Figure A-5. Example residual plots for the large off-gas box. (4) The 95 percent error bounds are calculated using Equation A-21. In this case, the 5-minute quotient is the largest; therefore, the largest bound on the emission function is 1.99 × 10⁻⁴. This value is added and subtracted from the selected model (Equation A-23). Figure A-6 shows the emission function derived from the large off-gas box dataset.

TOP 08-2-060 12 August 2015
A-19
APPENDIX A. VAPOR CALCULATIONS FOR A SINGLE MATERIAL SYSTEM.
1.69 10 . 1.99 10 Equation A-23
Where: E(t) = time-dependent emission function of test article [mg/(m2·min)] t = elapsed time (min)
Figure A-6. Selected concentration model for large off-gas box vapor sampling with error bounds.

TOP 08-2-060 12 August 2015
A-20
(This page is intentionally blank.)

TOP 08-2-060 12 August 2015
B-1
APPENDIX B. VAPOR COMPOSITE SYSTEM CALCUALTIONS (VCSC).
TABLE LIST
Table Page B-1 EXAMPLE PARAMETER VALUES FOR EMISSION FUNCTIONS AND AREAS OF CONTAMINATION ................................................................................ B-8
FIGURE LIST
Figure Page B-1 Conference room concentration modeled from the emission function ....................... . B-7
B-2 Example Vapor Composite System Calculation ......................................................... . B-9
B-3 VCSC with error ......................................................................................................... .B-10

TOP 08-2-060 12 August 2015
B-2
APPENDIX B. VAPOR COMPOSITE SYSTEM CALCUALTIONS (VCSC).
B.1 INTRODUCTION. Appendix A covers the calculation of emission functions from single materials. The emission function can be used to predict the concentration inside a room or within another enclosed area. Because most military assets are composed of multiple materials it is also useful to calculate the concentration off-gassed by a composite system, a system composed of multiple materials. B.2 CONCENTRATION PREDICTION FOR A SINGLE MATERIAL. a. Using the emission function derived in Appendix A, the concentration in an enclosed volume can be predicted by solving Equation A-3 with the loading factor (ls) and air exchange rate (ns) specific to the scenario using Equations B-1 and B-2. NOTE: Outdoor scenarios or poorly mixed indoor scenarios will require other modeling methods which are beyond the scope of this TOP, including Gaussian plume17, computational fluid dynamics (CFD)18, Second Order Integrated PUFF (SCIPUFF, L-3 Titan Corporation, Princeton, New Jersey)19, or Vapor, Liquid and Solid Tracking [VLSTRACK, Naval Surface Warfare Center (NSWC)20, Dahlgren Division, Dahlgren, Virginia].
Equation B-1
Equation B-2
Where: ls = scenario loading factor (1/m) ns = scenario exchange rate (1/min) As = scenario contaminated surface area (m2) Vs = free-air volume of the enclosed volume (m3) Qs = scenario airflow rate (m3/min) b. Equation A-3 is solvable with the emission functions described in Equations A-5 through A-8 and has the solutions given in Equations A-10 through A-13, but with l = ls and n = ns. These solutions and error bounds are in Equations B-3 and B-4. Because the emission function was selected in Appendix A, only the selected model needs to be calculated. These solutions assume that the contaminant vapor is well mixed in the enclosed area. Also, these models do not account for materials that could adsorb, absorb, or react with agent vapor. The scenario temperature and humidity need to match the experimental values to create a valid model of the scenario.

TOP 08-2-060 12 August 2015
B-3
APPENDIX B. VAPOR COMPOSITE SYSTEM CALCUALTIONS (VCSC).
1 Equation B-3
′ ′ 1 / Equation B-4
Where: ϵE = 95 percent error bound on the emission function calculated in Equation A-18 (mg/m3) ls = scenario loading factor (1/m) ns = scenario exchange rate (1/min) cs(t) = concentration as a function of time (mg/m3) t = elapsed time in minutes e = Euler’s number (approximately 2.7183) E(t) = emission function found in Appendix A [mg/(m2·min)] t’ = variable of integration dt = differential of time c. Well mixing is a valid assumption for test conditions in vapor off-gas boxes. However, as room volumes increase and airflow patterns become more complex, this assumption may not hold, which may decrease the accuracy of the predicted vapor concentrations and the resulting exposure analysis. Error bounds calculated in this process cannot account for the complexity of the airflow. d. The error bound on the emission function found in Appendix A can be used to derive the error bound on the concentration for the scenario using Equation B-3. The general form of the scenario concentration given the emission function and its error bounds are given in Equation B-4. Solutions to Equation B-4 can easily be derived from Equations A-10 through A-13. B.3 DEVELOPING VCSC FROM EMISSION FUNCTIONS. a. To predict the off-gassing of a composite system, the procedure in Paragraph B.2 will be generalized. The off-gassing from each contaminated area will be combined into the concentration for the composite system. b. To calculate the off-gassing a modified version of Equation A-2 is solved using Equation B-5. The modification simply replaces the emission function in Equation A-2 and contaminated area, with the sum of source terms for each contaminated area.

TOP 08-2-060 12 August 2015
B-4
APPENDIX B. VAPOR COMPOSITE SYSTEM CALCUALTIONS (VCSC).
∑ Equation B-5
Where:
= derivative of concentration with respect to time [(mg/(m3·min)].
cs(t) = time-dependent vapor concentration (mg/m3). Ai = contaminated area of the ith material. Ei(t) = time-dependent emission rate of ith material [mg/(m2·min)]. t = elapsed time (min). Ai = the contaminated area of the material (m2). Qs = mean airflow rate in the scenario (m3/min). Vs = available volume in the scenario (m3). c. The procedure to solve this equation is analogous to the procedures to solve Equation A-2. First the equation is rearranged in Equation B-6. Then the equation is simplified by substituting the loading factor for each material ( / ) and the air exchange rate (/ ). Finally, the integrating factor and the property of linearity of solution is applied to
derive Equation B-7. When there is not an analytical solution, Equation B-6 can be numerically integrated using methods including Simpson’s rule (reference 15). Another approach is to numerically solve Equation B-6 using implicit Runge-Kutta or Backward Euler (reference 15). These methods can be implemented in Matlab, Octave, SAS, R and other data analysis software.
∑ , Equation B-6
Where:
= derivative of concentration with respect to time [(mg/(m3·min)].
c(t) = time-dependent off-gas box vapor concentration (mg/m3). li = loading factor for the ith material. Ei(t,β) = time-dependent emission rate of ith material [mg/(m2·min)]. β = the vector of regression coefficients for each emission function (β0, β1 and β2)
ls = scenario loading factor (1/m) ns = scenario exchange rate (1/min).
∑ , ′ Equation B-7

TOP 08-2-060 12 August 2015
B-5
APPENDIX B. VAPOR COMPOSITE SYSTEM CALCUALTIONS (VCSC).
Where: c(t) = time-dependent off-gas box vapor concentration (mg/m3). Ei(t,β) = time-dependent emission function of contaminated area[1/(mg × min)].
β = the vector of regression coefficients for each emission function (β0, β1 and β2).
li = loading factor for each contaminated area(1/m). n = air exchange rate in (min-1). t’ = variable of integration. e = Euler’s number (approximately 2.7182). ϵEi = error bound on the emission function for each material. dt’ = differential of time. d. Equation B-6 can be arranged to demonstrate a useful property of the solutions. In Equation B-8 the sum has been moved out of the integral, which can be done because this is a finite sum. Also the error term was integrated and represented as a separate sum. Equation B-8 shows that the concentration is the sum of terms in the same form as Equation A-4. The total concentration in the fixture is simply that of the sum of the concentration profiles from each contaminated region. Also, the error is the sum of errors that have been converted by Equation B-3. Each region can be calculated separately and then summed together to generate the VCSC.
∑ , ′ ∑ 1 / Equation B-8
Where: c(t) = time-dependent off-gas box vapor concentration (mg/m3). Ei(t,β) = time-dependent emission function of contaminated area[1/(mg × min)]. β = the vector of regression coefficients for each emission function (β0, β1 and
β2). li = loading factor for each contaminated area(1/m). n = air exchange rate in (min-1). t’ = variable of integration. e = Euler’s number (approximately 2.7182). ϵEi = error bound on the emission function for each material. dt’ = differential of time. (1) When the air in the off-gas box (especially in a microchamber with a small free-air volume) is exchanged more than 50 times before the first data point is collected (i.e., when n multiplied by the time to the first data point collection is more than 50), there is no need to solve Equation B-3. In these cases the concentration can be modeled using Equation B-9.
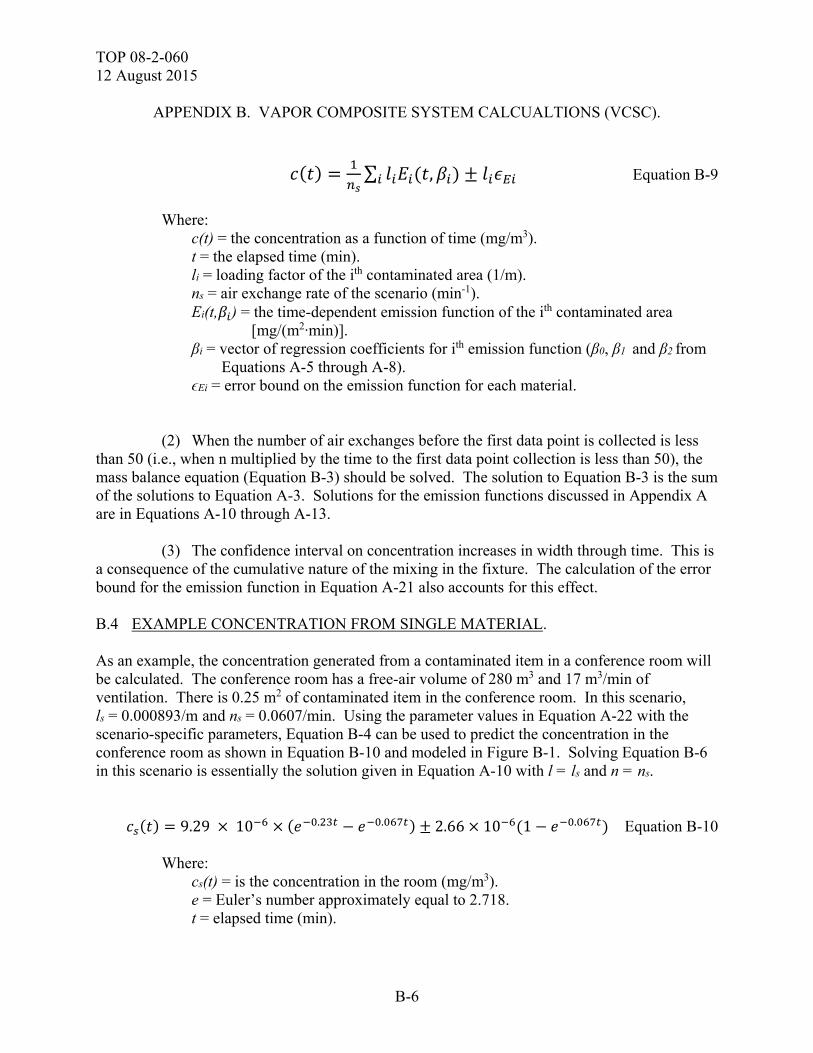
TOP 08-2-060 12 August 2015
B-6
APPENDIX B. VAPOR COMPOSITE SYSTEM CALCUALTIONS (VCSC).
∑ , Equation B-9
Where: c(t) = the concentration as a function of time (mg/m3). t = the elapsed time (min). li = loading factor of the ith contaminated area (1/m). ns = air exchange rate of the scenario (min-1).
Ei(t, ) = the time-dependent emission function of the ith contaminated area [mg/(m2·min)].
βi = vector of regression coefficients for ith emission function (β0, β1 and β2 from Equations A-5 through A-8).
ϵEi = error bound on the emission function for each material. (2) When the number of air exchanges before the first data point is collected is less than 50 (i.e., when n multiplied by the time to the first data point collection is less than 50), the mass balance equation (Equation B-3) should be solved. The solution to Equation B-3 is the sum of the solutions to Equation A-3. Solutions for the emission functions discussed in Appendix A are in Equations A-10 through A-13. (3) The confidence interval on concentration increases in width through time. This is a consequence of the cumulative nature of the mixing in the fixture. The calculation of the error bound for the emission function in Equation A-21 also accounts for this effect. B.4 EXAMPLE CONCENTRATION FROM SINGLE MATERIAL. As an example, the concentration generated from a contaminated item in a conference room will be calculated. The conference room has a free-air volume of 280 m3 and 17 m3/min of ventilation. There is 0.25 m2 of contaminated item in the conference room. In this scenario, ls = 0.000893/m and ns = 0.0607/min. Using the parameter values in Equation A-22 with the scenario-specific parameters, Equation B-4 can be used to predict the concentration in the conference room as shown in Equation B-10 and modeled in Figure B-1. Solving Equation B-6 in this scenario is essentially the solution given in Equation A-10 with l = ls and n = ns.
9.29 10 . . 2.66 10 1 . Equation B-10 Where: cs(t) = is the concentration in the room (mg/m3). e = Euler’s number approximately equal to 2.718. t = elapsed time (min).

TOP 08-2-060 12 August 2015
B-7
APPENDIX B. VAPOR COMPOSITE SYSTEM CALCUALTIONS (VCSC).
Figure B-1. Conference room concentration modeled from the emission function. B.5 EXAMPLE VCSC SCENARIO. a. To conduct a VCSC an emission function for each material is required. Assume we have a system comprised of three components made of different materials. The emission function for a chemical agent and the contaminated area for each material is in Table B-1. The total error for the emissions function is 143.23 mg/(m2 min). b. VCSC is calculated using Equation B-11 and shown in Figure B-2. Figure B-3 shows the VCSC with error bounds.

TOP 08-2-060 12 August 2015
B-8
APPENDIX B. VAPOR COMPOSITE SYSTEM CALCUALTIONS (VCSC).
TABLE B-1. EXAMPLE PARAMETER VALUES FOR EMISSION FUNCTIONS AND AREA OF CONTAMINATION
Material Emmision Equation βo β1 β2 β3
Area of Contamination
(mean ± standard deviation)
(cm2) Loading Factora
(1/m) Antenna A-9 4.456 1.935 1145 NA 0.127± 0.029 6.01× 10⁻⁴ Body A-9 2.652 2.226 1712 6.375 0.123± 0.005 5.82× 10⁻⁴ Screen A-6 9.863 × 10⁸ 0.0011 NA NA 0.365± 0.040 1.73× 10⁻³
aCalculated from the mean area of contamination and the free air volume for the large off-gas box (0.02115 m3).
. . 145.41.935
4.456
210.62.226
2.6520.7841
3.60 101 1.08 10
6.01 10 5.82 10 1.73 10 143.23 ′
Equation B-11

TOP 08-2-060 12 August 2015
B-9
APPENDIX B. VAPOR COMPOSITE SYSTEM CALCUALTIONS (VCSC).
Figure B-2. Example Vapor Composite System Calculation.

TOP 08-2-060 12 August 2015
B-10
APPENDIX B. VAPOR COMPOSITE SYSTEM CALCUALTIONS (VCSC).
Figure B-3. VCSC with error.

TOP 08-2-060 12 August 2015
C-1
APPENDIX C. CONCENTRATION AND TOXIC LOAD (TL) PREDICTION.
TABLE LIST
Table Page C-1 TOXIC LOAD (TL) EXPONENTS (TLE) FOR INHALATION (IH) OR OCULAR (OC) EXPOSURE FROM TWO DOCUMENT SOURCES ...................... C-2 C-2 EXAMPLE TOXIC LOAD (TL) VALUES FOR THE MEETING ATTENDEES (EXAMPLE CALCULATION SCENARIO) ............................................................... C-4
FIGURE LIST
Figure Page C-1 Toxic Load (TL) ......................................................................................................... . C-4

TOP 08-2-060 12 August 2015
C-2
APPENDIX C. CONCENTRATION AND TOXIC LOAD (TL) PREDICTION.
C.1 SCENARIO-SPECIFIC CONCENTRATION MODEL. The emission function selected using the procedures in Appendix A predicts the rate of contaminant emission per unit surface area (m2). Appendix B describes the VCSC that takes these emission functions and calculates a concentration from multiple materials. To predict the effect of this exposure on personnel the toxic load (TL) for a particular operationally relevant scenario can be calculated. C.2 CALCULATION OF TL. a. To calculate a TL, the toxic load exponent (TLE) must be selected based on the source of the derived requirements. The example TLE is a function of the contaminant and can be found in Table C-1 (taken from DA Field Manual (FM) 3-11.921). If the data correspond to the agent soman (GD), a TLE of 1.4 is selected. The inhalation (IH) or ocular (OC) exposure mild effect level should always be selected as the TLE for decontaminated items using the assumption that a decontaminated item is expected to be clean, but may not be clean (reference 12).
TABLE C-1. TOXIC LOAD (TL) EXPONENTS (TLE) FOR INHALATION (IH) OR OCULAR (OC) EXPOSURE FROM TWO DOCUMENT SOURCES
Effect Level
Soman (GD)
Persistent Nerve Agent (VX)
Distilled Mustard (HD)
FMa 3-11.9 USACHPPMb FM 3-11.9 USACHPPM FM 3-11.9 USACHPPM
Lethal 1.25 2 1 2 1.5 1 Severe 1.25 2 1 2 1 1 Mild 1.4 2 1 2 1 1
aField Manual. Reference 21, Appendix F. bU.S. Army Center for Health Promotion and Preventative Medicine (Currently known as the U.S. Army Public Health Command (USAPHC)). Reference 23, Appendix F.
NOTE: Selection is usually made from the mild effect level row.
b. The TL for a scenario is calculated using the scenario vapor concentration (Equation B-2). This calculation will generate a single number that can be compared with a requirement to determine if a scenario would induce a toxicological response. The TL is calculated using the ten Berge model22 (Equation C-1).

TOP 08-2-060 12 August 2015
C-3
APPENDIX C. CONCENTRATION AND TOXIC LOAD (TL) PREDICTION.
Equation C-1
Where: TL = the TL (mg min/m3). cs(t) = scenario concentration as a function of elapsed time (mg/m3). η = TL exponent. t0= start of personnel exposure. tf = end of exposure of personnel. dt = differential of time. c. The scenario error bound for the concentration is contained within the integral in Equation C-1. Being inside the integral causes the error term to increase with time. The size of the error term will limit the length of time that can be modeled accurately. When using Equation C-1, all three integrals should always be calculated (predicted TL, 95 percent upper bound, and 95 percent lower bounds). The usual use of this data is to determine if the TL was less than some toxicological level on some time interval. The TL can be calculated for various time intervals within the scenario duration by selecting different values for t0 and tf. d. Equation B-5 is numerically integrable using basic numerical integration, such as Gaussian quadrature, an adaptive method, Simpson’s rule or trapezoid rule (reference 15). Trapezoid rule (reference 15) is the least technically challenging of these, but may have significant error unless small time steps are chosen. Numerical methods to perform the integration are available in commercial and open-source software (e.g., Matlab, Octave, SAS). e. As an example, the TL will be calculated for the selected emission function in Equation A-22. There are five people (Attendees 1 through 5) in the meeting in a conference room. Attendee 1 attends the full 2 hours of the meeting. The rest of the attendees either arrive late or leave early. Attendee 1 executes the procedures in Paragraphs 4.6 through 4.11 using VX. However, Attendee 1 brings one item to the meeting instead of placing it in the fixture for vapor sampling. The item is the same material used in the examples in Paragraph 4.f of Appendix A. They will be exposed to the concentration calculated in Paragraph B.5 f. From the concentration in the conference room (Equation C-1) the TL for personnel that enter the room is calculated for the time intervals from Table C-2 and the TLE from Table C-1.

TOP 08-2-060 12 August 2015
C-4
APPENDIX C. CONCENTRATION AND TOXIC LOAD (TL) PREDICTION.
TABLE C-2. EXAMPLE TOXIC LOAD (TL) VALUES FOR THE MEETING ATTENDEES (EXAMPLE CALCULATION SCENARIO)
Attendee
Exposure (min)
TL [(mg/m3)TLEa min]
Error (%) Start End Duration
Lower Confidence Bound Predicted
Upper Confidence Bound
1 0 120 120 4.71 × 10⁻⁷ 5.44 × 10⁻⁷ 8.27 × 10⁻⁷ 52 2 0 60 60 4.71 × 10⁻⁷ 5.40 × 10⁻⁷ 6.39 × 10⁻⁷ 18 3 0 15 15 3.08 × 10⁻⁷ 3.19 × 10⁻⁷ 3.30 × 10⁻⁷ 3 4 30 90 60 1.93 × 10⁻⁸ 5.72 × 10⁻⁸ 1.98 × 10⁻⁷ 245 5 60 120 60 0.00 × 10⁻⁹ 3.44 × 10⁻⁹ 1.88 × 10⁻⁷ 5350
aToxic load exponent. g. Figure C-1 illustrates that the error bounds get wider as the duration of exposure increases using Attendee 1’s TL. For Attendee 2, the error is 18 percent of the predicted value over a 60-minute period of time (Table C-2). This is early in the trial so the error is small. For Attendee 5 the error is 5350 percent of the predicted value over a different 60-minute period (Table C-2). This illustrates the importance of calculating the error. Time periods selected can have drastically different errors even if they have the same duration.
Figure C-1. Toxic Load (TL)

TOP 08-2-060 12 August 2015
C-5
APPENDIX C. CONCENTRATION AND TOXIC LOAD (TL) PREDICTION.
h. The value of most interest here is the upper confidence bound. Even with the largeerrors, the upper confidence bound can be used to draw some conclusions. All of our attendees were below the mild effects level for 1 percent of the population, IAW Table E-4 of U.S. Army Center for Health Promotion and Preventative Medicine, Report 47-EM-5863-0423. Even with the decontaminated item in the room, the meeting attendees (all with an inhalation rate assumption of 15L/min) are not expected to have any ill effects from exposure to VX.
i. Using Equation C-2 a requirement expressed as a concentration can be converted to atoxic load value using the toxic load exponent and expected mission duration as the time factor. Once the requirement is expressed as a toxic load value, a direct comparison with the toxic load value calculated from the test data can be made.
Equation C-2
Where: TL = the TL (mg min/m3). c = requirement concentration (mg/m3). η = TL exponent.
T = requirement mission duration (minutes).

TOP 08-2-060 12 August 2015
C-6
(This page is intentionally blank.)

TOP 08-2-060 12 August 2015
D-1
APPENDIX D. GLOSSARY.
Term Definition Analytically integrable
Quality of being able to use the rules of calculus to find the value of an integral. Using the rules of calculus to find the value of an integral.
Decontamination The process of making material safe by absorbing, destroying,
neutralizing, rendering harmless, or removing chemical or biological agents and contamination.
Gaussian quadrature
A numerical method to find the value of an integral. Evaluation points of the function are chosen to minimize the error.
Heteroscedasticity The quality of data having different variances through time. Kinetics Study of the rate at which events occur in a system of chemical
reactions in relationship to surrounding environmental conditions. Levenberg-Marquardt
A numerical method to perform least-squares curve fitting.
Mass balance model
A model that is developed using an equation that balances the mass entering and exiting the system.
Microchamber A chamber with a small free-air volume that is used to collect data
about the off-gassing of test articles after decontamination. Numerical integration
A method of calculating the value of an integral using a family of algorithms.
Off-gas box A fixture used to contain a test article. The box will have an
associated vapor sampler or detector to sample any residual vapor off-gassing from the test article after decontamination.
Residual contamination
Contamination left on a surface that has been decontaminated.
Simpson’s Rule A numerical method to find the value of an integral. A series of
parabolas are fit to the evaluation points to calculate the area under the curve.
Simulant Compound that has physical or chemical properties that are similar
to a CWA and can be used to simulate the CWA for testing purposes.

TOP 08-2-060 12 August 2015
D-2
APPENDIX D. GLOSSARY.
Term Definition Sponsor The organization responsible for drafting, staffing, and revising
capabilities documents. For this TOP, sponsors include combat developers.
Ten Berge A model of chemical exposure that accounts for toxicological
effects. Toxic load Total toxicity of an exposure to a chemical that can be used to
determine likely toxicological effects to the individual.
TOP 08-2-060 12 August 2015
E-1
APPENDIX E. ABBREVIATIONS.
∆P differential pressure AD No. DTIC accession number AMCR Army Materiel Command Regulation AR Army Regulation ARD average relative difference ARL Air Resources Laboratory ASR agent-simulant relationship ASTM American Society for Testing and Materials ATEC U.S. Army Test and Evaluation Command ATTN attention C Celsius CALPUFF Evaluations of California Puff CASARM Chemical Agent Standard Analytical Reference Material CFD computational fluid dynamics cm centimeter CoC chain of custody CWA chemical warfare agent DA Department of the Army DOE design of experiment DTIC Defense Technical Information Center ECBC U.S. Army Edgewood Chemical and Biological Center EPA U.S. Environmental Protection Agency FID flame ionization detection FM Field Manual FPD flame photometric detection GC gas chromatograph GD soman HD distilled mustard Hg mercury HPAC Hazard Prediction and Assessment Capability IAW in accordance with IH inhalation IPT integrated product team ISO International Organization for Standardization iwg inch of water gauge
TOP 08-2-060 12 August 2015
E-2
APPENDIX E. ABBREVIATIONS.
kg kilogram LC liquid chromatograph m3 cubic meter m/sec meters per second MD Maryland ME mission essential mg milligram mL/min milliliter per minute MQL minimum quantification limit MS mass spectrometer NA not applicable ng nanogram ng/ml nanogram/milliliter NMR nuclear magnetic resonance NRT near real-time NSWC Naval Surface Warfare Center NTA nontraditional agent OC ocular OPSEC operations security ORI operational readiness inspection OTA Operational Test Agency PAM pamphlet pH hydrogen-ion concentration PTFE polytetrafluoroethylene QA quality assurance QC quality control R2 the correlation value RDT&E research, development, test, and evaluation RH relative humidity SAR same as report SCG security classification guide SCIPUFF Second Order Integrated PUFF SDS safety data sheet
TOP 08-2-060 12 August 2015
E-3
APPENDIX E. ABBREVIATIONS.
SEP System Evaluation Plan SIV small item vapor SOP Standing Operating Procedure SST solid sorbent tube
T&E test and evaluationTEMP Test and Evaluation Master Plan TIC toxic industrial chemicalTICN test item control number TIM toxic industrial materialTIR test incident report TL toxic loadTLE toxic load exponentTO test officerTOP Test Operations Procedure TRR Test Readiness Review
U.S. United StatesUSACHPPM U.S. Army Center for Health Promotion and Preventative Medicine USAPHC U.S. Army Public Health Command
VCSC Vapor Composite System Calculations VLSTRACK Vapor, Liquid, and Solid Tracking VOC volatile organic compound VX persistent nerve agent

TOP 08-2-060 12 August 2015
E-4
(This page is intentionally blank.)

TOP 08-2-060 12 August 2015
F-1
APPENDIX F. REFERENCES.
1. TOP 08-2-061A, Chemical Decontaminant Testing, 20 October 2014.
2. AR 50-6, Chemical Surety, 28 July 2008.
3. AR 190-59, Chemical Agent Security Program, 10 April 2012.
4. DA PAM 385-61, Toxic Chemical Agent Safety Standards, 13 November 2012.
5. AR 385-10, The Army Safety Program, 27 November 2013.
6. AMCR 385-100, Safety Manual, 26 September 1995.
7. ATEC Reg 73-1, System Test and Evaluation Policy, 22 March 2013.
8. DA PAM 73-1, Test and Evaluation: Test and Evaluation in Support of Systems Acquisition, 30 May 2003.
9. ISO Standard 17025:2005/Cor 1:2006, General Requirements for the Competence of Testing and Calibration Laboratories, 15 August 2006.
10. ASTM Standard D6196-03, Standard Practice for Selection of Sorbents, Sampling, and Thermal Desorption Analysis Procedures for Volatile Organic Compounds in Air, 2009.
11. DA PAM 385-61, Toxic Chemical Agent Safety Standards, 13 November 2012.
12. Edgewood Chemical Biological Center, The Chemical Contaminant and Decontaminant Test Methodology Source Document, Second Edition, ECBC-TR-980, March 2012.
13. ASTM Standard E0178-08, Standard Practice for Dealing With Outlying Observations, 2008.
14. Robert L. Borrelli, Courtney S. Coleman, Differential Equations: A Modeling Perspective, Second Edition, John Wiley and Sons, Hoboken, New Jersey, January 2004.
15. Atkinson, K., An Introduction to Numerical Analysis, Second Edition, John Wiley and Sons, Hoboken, New Jersey, January 1989.
16. NIST, e-Handbook of Statistical Methods, Section 4.4, Data Analysis for Process Modeling, http://www.itl.nist.gov/div898/handbook/pmd/section4/pmd4.htm, Last updated 1 April 2012.

TOP 08-2-060 12 August 2015
F-2
APPENDIX F. REFERENCES.
17. Air Resources Laboratory (ARL), National Oceanic and Atmospheric Administration, U.S. Department of Commerce, Washington, DC, Gaussian Plume Model, http://ready.arl.noaa.gov/READY_gaussian.php, modified 22 May 2009, accessed 3 June 2013.
18. Anderson, John D., Computational Fluid Dynamics: The Basics with Applications, McGraw-Hill, Columbus, Ohio, 1995.
19. Sykes, R. I., Parker, S.F., Henn, D. S., and Chowdhury, B., Second Order Closure Integrated Puff (SCIPUFF) Version 2.2, ARAP Report 729, L-3 Titan Corporation, Princeton, New Jersey, 2006.
20. Chang, J. C., Franzese, P., Chayantrakom, K., Hanna, S. R., Evaluations of California Puff (CALPUFF), Hazard Prediction and Assessment Capability (HPAC), and Vapor, Liquid and Solid Tracking (VLSTRACK) with Two Mesoscale Field Datasets, Journal of Applied Meteorology, American Meteorology Society, Boston, Massachusetts, Volume 42, Pp 453-466, April 2003.
21. FM 3-11.9, Potential Military Chemical/Biological Agents and Compounds, 10 January 2005.
22. U.S. Environmental Protection Agency (EPA) National Center for Environmental Assessment, Research Triangle Park, North Carolina, Ten Berge CxT Model External Draft Version 2.0, September 2008.
23. Acute Toxicity Estimation and Operation Risk Management of Chemical Warfare Agent Exposure, USACHPPM Report No. 47-EM-5863-04, 2004.

TOP 08-2-060 12 August 2015
F-3
APPENDIX F. REFERENCES.
For information only (related publications).
a. ASTM Standard E1154-89(2008), Standard Specification for Piston or Plunger OperatedVolumetric Apparatus, 1989, revised 2008.
b. ASTM Standard D 4597-10 Standard Practice for Sampling Workplace Atmospheres toCollect Gases or Vapors with Solid Sorbent Diffusive Samplers, 2010.
c. ASTM Standard D 6345-10 Standard Guide for Selection of Methods for Active,Integrative Sampling of Volatile Organic Compounds in Air, 2010.
d. ISO Standard 8655:2002 and 2005/Cor 1:2008, Laboratory Equipment: Piston-OperatedVolumetric Apparatus (All Parts), 9 December 2008.

TOP 08-2-060 12 August 2015
F-4
(This page is intentionally blank.)

TOP 08-2-060 12 August 2015
G-1
APPENDIX G. APPROVAL AUTHORITY.

TOP 08-2-060 12 August 2015
G-2
(This page is intentionally blank.)

TOP 08-2-060 12 August 2015
Forward comments, recommended changes, or any pertinent data which may be of use in improving this publication to the following address: Range Infrastructure Division (CSTE-TM), U.S. Army Test and Evaluation Command, 2202 Aberdeen Boulevard, Aberdeen Proving Ground, Maryland 21005-5001. Technical information may be obtained from the preparing activity: Commander, West Desert Test Center, U.S. Army Dugway Proving Ground, ATTN: TEDT-DPW, Dugway, UT 84022-5000. Additional copies can be requested through the following website: http://www.atec.army.mil/publications/topsindex.aspx, or through the Defense Technical Information Center, 8725 John J. Kingman Rd., STE 0944, Fort Belvoir, VA 22060-6218. This document is identified by the accession number (AD No.) printed on the first page.