Embed Size (px)
Citation preview
Standard Form 298 (Rev. 8-98) Prescribed by ANSI-Std Z39-18
REPORT DOCUMENTATION PAGE Form Approved OMB No. 0704-0188
Public reporting burden for this collection of information is estimated to average 1 hour per response, including the time for reviewing instructions, searching data sources, gathering and maintaining the data needed, and completing and reviewing the collection of information. Send comments regarding this burden estimate or any other aspect of this collection of information, including suggestions for reducing this burden to Washington Headquarters Service, Directorate for Information Operations and Reports, 1215 Jefferson Davis Highway, Suite 1204, Arlington, VA 22202-4302, and to the Office of Management and Budget, Paperwork Reduction Project (0704-0188) Washington, DC 20503.
PLEASE DO NOT RETURN YOUR FORM TO THE ABOVE ADDRESS.
1. REPORT DATE (DD-MM-YYYY) 11-21-2011
2. REPORT TYPEFinal Technical Report
3. DATES COVERED (From - To)11-18-2008 to 11-17-2011
4. TITLE AND SUBTITLE Resilient Architectures for Integrated Command and Control in a Contested Cyber Environment
5a. CONTRACT NUMBER FA8750-08-2-0020
5b. GRANT NUMBER
5c. PROGRAM ELEMENT NUMBER
6. AUTHOR(S) Levis, Alexander H. Kathleen M. Carley Gabor Karsai
5d. PROJECT NUMBER
5e. TASK NUMBER
5f. WORK UNIT NUMBER
7. PERFORMING ORGANIZATION NAME(S) AND ADDRESS(ES)System Architectures Laboratory Dept. of Electrical and Computer Engineering George Mason University, Fairfax, VA 22030
8. PERFORMING ORGANIZATION REPORT NUMBER SAL/FR-11-02
9. SPONSORING/MONITORING AGENCY NAME(S) AND ADDRESS(ES)Air Force Research Laboratory/Information Directorrate AFRL/RI 26 Electronic Parkway Rome, NY 13441-4514
10. SPONSOR/MONITOR'S ACRONYM(S)
11. SPONSORING/MONITORING AGENCY REPORT NUMBER
12. DISTRIBUTION AVAILABILITY STATEMENT Unclassified Unlimited
13. SUPPLEMENTARY NOTES
14. ABSTRACT The objective of this research effort was to exploit the C2 Wind Tunnel as an open experimental platform and use it to conduct computational experiments to investigate the resilience of C2 architectures to cyber and physical attacks. In addition, the concept of Integrated Command and Control was investigated with focus on collaborative mission analysis and Course of Action development. Three spirals were conducted, of increasing complexity, to investigate resilience in a contested cyber environment. In the third spiral, two levels were considered: the development of integrated COAs at the staff level when multiple components are involved and at the planning level when multiple Operations Centers are involved. Multiple modeling approaches were used including BPMN to model mission analysis and COA development, Colored Petri Nets to create executable models of these processes, Social Network Analysis to model the Operations centers and agent based modeling to describe their dynamic interactions when collaborating. 15. SUBJECT TERMS Command and Control, Resilient Architectures, Integrated C2, Contested Cyber Environment, Colored Petri Nets, Social network Analysis, Agent Based Modeling, Computational Experiments
16. SECURITY CLASSIFICATION OF: 17. LIMITATION OF ABSTRACT SAR
18. NUMBER OF PAGES 156
19a. NAME OF RESPONSIBLE PERSON Alexander H. Levis
a. REPORT Unclassified
b. ABSTRACT Unclassified
c. THIS PAGE Unclassified
19b. TELEPONE NUMBER (Include area code) 703 993 1619

SYSTEM ARCHITECTURES LABORATORY DEPT OF ELECTRICAL AND COMPUTER ENGINEERING
THE VOLGENAU SCHOOL OF ENGINEERING GEORGE MASON UNIVERSITY
Resilient Architectures for Integrated C2 in a Contested Cyber Environment
Contract No. FA8750-08-2-0020
FINAL TECHNICAL REPORT
18 November 2008 to 17 November 2011 Submitted to: Air Force Research Laboratory Attn: Dawn Trevisani AFRL/RI AFOSR/RISB 26 Electronic Parkway (315) 330 7311 Rome, NY 13441-4514 Submitted by: Alexander H. Levis George Mason University Tel: (703) 993 1619 System Architectures Lab Fax: (703) 993 1601 ECE Dept., MS 1G5 email:[email protected] Fairfax, VA 22030

ii
iii
REPORT CONTRIBUTORS
George Mason University Carnegie Mellon University Alexander H. Levis (PI) Kathleen M. Carley (Co-PI) Lee W. Wagenhals LCL Michael Lanham, USA Abbas K. Zaidi Geoffrey Morgan Robert J. Elder Ahmed Abu Jbara Mark Pflanz LCL Tom Saltysiak, USA Vanderbilt University Gabor Karsai (Co-PI) Himanshu Neema University of Colorado – Denver Harmon Nine Titsa Papantoni-Kazakos

iv
v
Table of Contents Page Contributors iii
List of Figures vii
List of Tables xi
Chapter 1: Introduction 1
Chapter 2: The C2 Wind Tunnel 3
2.1: Description 3
2.2: Enhancements Made 4
2.3: References 5
Chapter 3: Spiral 1: Establishing the Procedures for Experimentation 7
3.1: Introduction 7
3.2: Experiment Design 7
3.3: Experiment Results 11
3.4: Observations 19
3.5: Conclusions 20
Chapter 4: Spiral 2: Resilience of the AOC Weapon System 21
4.1: Introduction 21
4.2: Experiment Design 21
4.3: Scope of Experiment 23
4.4: Experiment Results 32
4.5: Observations 35
4.6: On the Use of Social Network Models 36
4.7: Conclusions 38
4.8: References 38
Chapter 5: Modeling Networks and Cyber Exploits 39
5.1: Modeling Networks 39
5.2: Modeling Cyber Exploits 41
Chapter 6: Spiral 3: Integrated Command and Control (C2) 45
6.1: Introduction 45
6.2: Technical Approach 45
6.3: Multi-model Integration and Experiment Setup 52
6.4: Analytic Results 58
vi
6.5: Conclusions 60
6.6: References 61
Chapter 7: Social Network Modeling and Simulation Of Integrated Resilient Command and Control (C2) In Contested Cyber Environments 63
7.1 Motivation 63
7.2 Social Network Modeling Of Integrated and Resilient AOCs Through Text-Mining and Data to Model (D2M) Processes 65
7.3 Social Network Analysis Using ORA 68
7.4 Discussion and Contributions 91
7.5 Further Information and Reading 94
7.6 References 94
Chapter 8: Simulating Integrated Resilient Command and Control (C2) in Contested Cyber Environments 95
8.1 Introduction 95
8.2 Agent Based Models (ABM) and Construct 95
8.3 Agent Based Model for Integrated Resilient Data Description and Virtual Experiment Setup 96
8.4 Measures of Interest for Assessing Resilience 100
8.5 Discussion and Contributions 104
8.6 Conclusions 105
8.7 References 105
Chapter 9: On Evaluating Resilience in C2 Architectures 107
9.1: Introduction 107
9.2: Key Topics in Considering Resilience 107
9.3: The Attributes of Resilience and their Measures 108
9.4: Combining the Measures to Evaluate Resilience 112
9.5: Comments and Conclusions 112
9.6 References 112
Chapter 10: Conclusion 115
10.1: Summary 115
10.2: Future Research 117
Appendix A: Modeling the Impact of Exploits on Computer Communication Networks 119
Appendix B: A Pacifica Scenario 145
vii
LIST OF FIGURES
Fig. 2.1 C2WT Model Integration Approach 4 Fig. 3.1 Spiral 1 Operational Concept 8 Fig. 3.2 Spiral 1 UAV-Target Configurations 9 Fig. 3.3 Spiral 1 C2WT Configuration 9 Fig. 3.4 Spiral 1 Plot of Trial Run Data 10 Fig. 3.5 Spiral 1 Comparison on Attack and No Attack Tracks 12 Fig. 3.6 Spiral 1 Data Collected for 10,000 Meter Target moving Directly Away (0 degrees) 12 Fig. 3.7 Spiral 1 Data Collected for 10,000 Meter Runs 13 Fig. 3.8 Spiral 1 Normalized Data for 10 KM, 0 degree Target Track Runs 14 Fig. 3.9 Spiral 1 Normalized Data Comparison for 10 and 30 KM, 45º Target Track 14 Fig. 3.10 Spiral 1 Normalized Data Comparison for 10 and 30 KM, 90º Target Track 15 Fig. 3.11 Spiral 1 Normalized Data Comparison for 10 and 30 KM, 135º Target Track 15 Fig. 3.12 Spiral 1 Break Point Analysis Example 10 KM, 0º Target Track 16 Fig. 3.13 Spiral 1 Break Point Analysis for 10 KM Target Range 17 Fig. 3.14 Spiral 1 Break Point Analysis for 10 KM Target Range (Polar Plot) 17 Fig. 3.15 Spiral 1 Break Point Analysis for 30 KM Target Range 18 Fig. 3.16 Spiral 1 Penalty for Failing to Stop Attack before the Break Point (10 KM) 19
Fig. 4.1 Spiral 2 Resilience Concept 22 Fig. 4.2 Spiral 2 Experiment Concept 22 Fig. 4.3 ATO Cycle 23 Fig. 4.4 High Level Process Model for Developing the ATO 24 Fig. 4.5 Model of Organizations and Information Exchanges 25 Fig. 4.6 AOC Process Model with Interactions with Tools 25 Fig. 4.7 Basic “As Is” AOC Architecture 26 Fig. 4.8 Network-based Resilient AOC Architecture 27 Fig. 4.9 Systems-based Resilient AOC Architecture 28 Fig. 4.10 Systems-based Resilient Behavior 28 Fig. 4.11 Systems and Network-based Resilient Architecture 29 Fig. 4.12 Conceptual Model of the Colored Petri Net 30 Fig. 4.13 OMNeT++ Model for the Network and System Federate 30 Fig. 4.14 Systems and Network-based Resilient Architecture 31 Fig. 4.15 Combining Results from Individual Federates 34 Fig. 4.16 Concept for Incorporating SORACSCS 36 Fig. 4.17 Integrating SORACSCS and the C2WT 37 Fig. 4.18 Integrating SORACSCS and the C2WT 38
Fig. 5.1 Top-level network model for Spiral 1 39 Fig. 5.2 Network Model for Spiral 2 40 Fig. 5.3 Network Model for Spiral 3 41
Fig. 6.1 Mission Analysis Component Collaboration 46 Fig. 6.2 COA Development Component Collaboration 46 Fig. 6.3 Mission Analysis Process in BPMN 47
viii
Fig. 6.4 Colored Petri Net Model of a Component’s Mission Analysis Phase 48 Fig. 6.5 Component Interoperation Model (Mission Analysis) 48 Fig. 6.6 OMNeT++ Model of the Communication Network 49 Fig. 6.7 Ops Centers Collaboration 50 Fig. 6.8 Ops Center Process in BPMN 50 Fig. 6.9 Colored Petri Net Model of an Ops Center 51 Fig. 6.10 Ops Centers Interoperation Model 51 Fig. 6.11 Spiral 3 Architecture 53 Fig. 6.12 Visualization Interface for Components Model 53 Fig. 6.13 The Visualization Interface for Ops Center Model 54 Fig. 6.14 Execution Flow 54 Fig. 6.15 Timed Influence Net 57 Fig. 6.16 Suggested COAs 57 Fig. 6.17 Experimental Setup 58 Fig. 6.18 Petri Net Structures with Delay Expressions 60
Fig. 7.1 Depiction of the relationship between GMU and CMU Foci 64 Fig. 7.2 AOC Organization 67 Fig. 7.3 Agent x Agent network sized by Centrality, Authority, colored by the 'category' of agent, removed isolates and pendants, and zoomed in 69 Fig. 7.4 Color scheme/legend for Fig. 7.3 69 Fig. 7.5 Agent x Agent Network of AOC divisions/teams/cells, AOC functional groups, and elements co-located with AOCs, sized by Centrality, Authority, colored by the 'category' of agent removed, isolates and pendants 70 Fig. 7.6 Color scheme/legend for Fig. 7.5 70 Fig. 7.7 The top ten agents with a presence in the 23 relevant measures ORA calculates 70 Fig. 7.8 The top ten organizations with a presence in the 19 relevant measures ORA calculates 71 Fig. 7.9 The top ten IT systems/resources with a presence in the 19 relevant measures ORA calculates 72 Fig. 7.10 Effects for Random Deletion/Targeting of IT-Systems 73 Fig. 7.11 Effects for Random Deletion/Targeting of combined agent node class 73 Fig. 7.12 Total Degree Distribution, All Agents 74 Fig. 7.13 Total Degree Distribution - IT-Systems Only 74 Fig. 7.14 Change in Diffusion of Knowledge over Time from ORA's NTA 89 Fig. 7.15 Change in Diffusion of Knowledge, at time period 25 of 25, for deletion of single agents at time 0 90 Fig. 7.16 Change in Diffusion of Knowledge over Time from ORA's NTA, using combinations of IT-Systems 90
Fig. 8.1 IT-Resource x IT-Resource Graph 97 Fig. 8.2 IT-System x IT-System network, including isolates 98 Fig. 8.3 IT-System x IT-System network, without isolates 98 Fig. 8.4 Average JPG Knowledge Score relative to baseline, 1/3 of experiment completed (40 time periods) 101 Fig. 8.5 Average JPG Knowledge Score relative to baseline, at end of the experiment (120 time periods) 101 Fig. 8.6 Number of IT systems affected by cyber attacks 102
ix
Fig. 8.7 Two Network Measures Change from Baseline 103 Fig. 8.8 Integrated AOCs increase Resilience 103 Fig. 8.9 Five Network Measures Changes from Baseline 103 Fig. 8.10 Average Diffusion of Knowledge as a Percentage of baseline, across four modes of operations 104 Fig. 8.11 Average Standard Deviation as a Percentage of baseline, across four modes of operations 104
Fig. 9.1 Temporal Aspects in Evaluating Resilience 108 Fig. 9.2 Abstract Visualization of Rate of Departure 109 Fig. 9.3 Measuring Capacity 111 Fig. 9.4 Resilience Evaluation 111 Fig. A.1 Model for the link connecting a satellite or tactical communications source to a router 122 Fig. A.2 Rejection rate as a function of transmission rate for different buffer sizes 128 Fig. A.3. Physical Topology and Backbone Network 137

x
xi
LIST OF TABLES
TABLE 4.1 Attack Time (in Seconds) by Type 32 TABLE 4.2 Number of People for Each Team and Task 33 TABLE 4.3 Hypothesized Results 34 TABLE 4.4 Summary of Results 35 TABLE 6.1 Air Force Component and Ops Centers 55 TABLE 6.2 Actionable Events 55 TABLE 6.3 Selected Set of Actionable Events (Output of Phase 1) 56 TABLE 6.4 Experiment Configurations 59 TABLE 6.5 Results of the Experiments 59 TABLE 7.1 Example general methods of affecting AOC IT systems 66 TABLE 7.2a Network Level Measures (for IT Systems only) 74TABLE 7.2b Centrality (total degree centrality) (for IT Systems only) 75 TABLE 7.2c Betweenness Centrality (for combined agent node class) 75 TABLE 7.2d Betweenness Centrality (for IT Systems only) 75 TABLE 7.3a Network Level Measures (for IT Systems only) 76TABLE 7.3b Centrality (total degree centrality) (for IT Systems only) 76 TABLE 7.3c Betweenness Centrality (for IT Systems only) 77 TABLE 7.4a Network Level Measures (for combined agent node class) 77 TABLE 7.4b Network Level Measures (for IT Systems only) 77TABLE 7.4c Centrality (total degree centrality) (for IT Systems only) 78 TABLE 7.4d Betweenness Centrality (for combined agent node class) 78 TABLE 7.4e Betweenness Centrality (for IT Systems only) 78 TABLE 7.5a Centrality (total degree centrality) (for IT Systems only) 79 TABLE 7.5b Betweenness Centrality (for combined agent node class) 79 TABLE 7.5c Betweenness Centrality (for IT Systems only) 80 TABLE 7.6a Network Level Measures (for IT Systems only) 80TABLE 7.6b Centrality (total degree centrality) (for IT Systems only) 81 TABLE 7.6c Betweenness Centrality (for combined agent node class) 81 TABLE 7.6d Betweenness Centrality (for IT Systems only) 82 TABLE 7.7a Network Level Measures (for combined agent node class) 82 TABLE 7.7b Network Level Measures (for IT Systems only) 83TABLE 7.7c Centrality (total degree centrality) (for IT Systems only) 83 TABLE 7.7d Betweenness Centrality (for combined agent node class) 83 TABLE 7.4e Betweenness Centrality (for IT Systems only) 84 TABLE 7.8a Network Level Measures (for combined agent node class) 84 TABLE 7.8b Network Level Measures (for IT Systems only) 84TABLE 7.8c Betweenness Centrality (for IT Systems only) 85 TABLE 7.8d Betweenness Centrality (for combined agent node class) 85 TABLE 7.8e Betweenness Centrality (for IT Systems only) 85 TABLE 7.9a Network Level Measures (for combined agent node class) 86 TABLE 7.9b Network Level Measures (for IT Systems only) 86
ix
TABLE 7.9c Centrality (total degree centrality) (for IT Systems only) 87 TABLE 7.9d Betweenness Centrality (for combined agent node class) 87 TABLE 7.9e Betweenness Centrality (for IT Systems only) 87 TABLE A.1 Abbreviation of different modulation schemes 126 TABLE A.2 Coding Gain 130 TABLE A.3 Notation 137
1 of 156
CHAPTER 1
INTRODUCTION
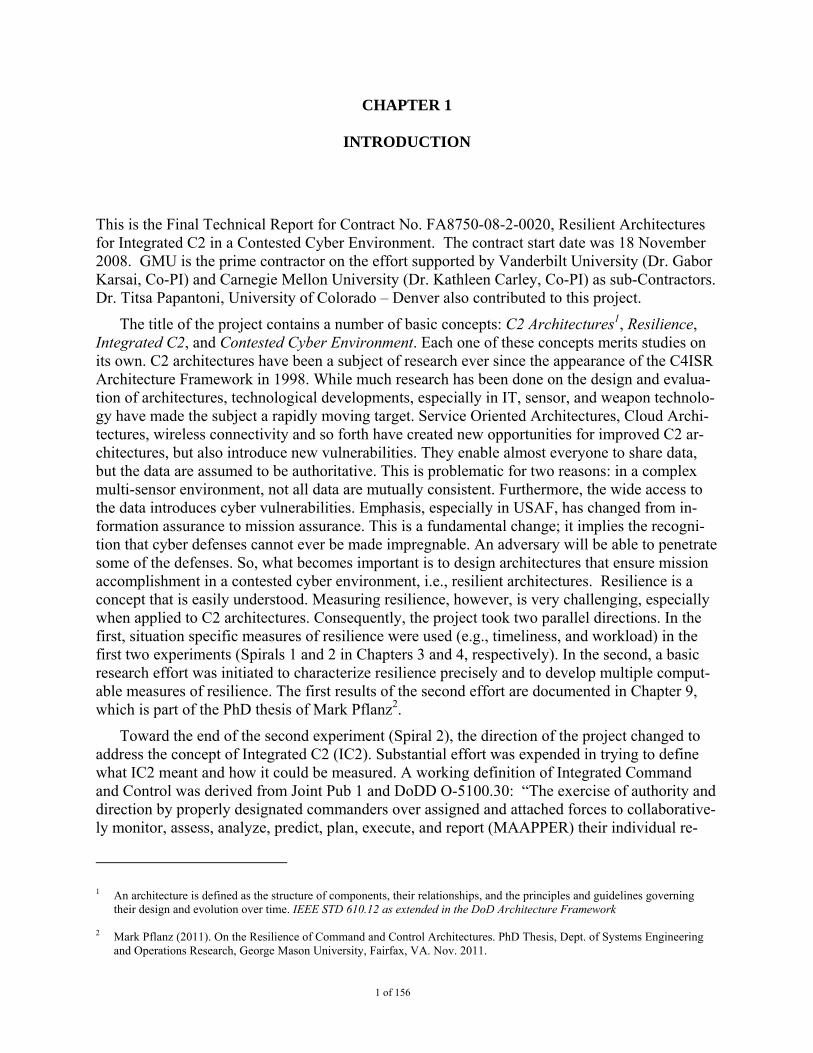
This is the Final Technical Report for Contract No. FA8750-08-2-0020, Resilient Architectures for Integrated C2 in a Contested Cyber Environment. The contract start date was 18 November 2008. GMU is the prime contractor on the effort supported by Vanderbilt University (Dr. Gabor Karsai, Co-PI) and Carnegie Mellon University (Dr. Kathleen Carley, Co-PI) as sub-Contractors. Dr. Titsa Papantoni, University of Colorado – Denver also contributed to this project.
The title of the project contains a number of basic concepts: C2 Architectures1, Resilience, Integrated C2, and Contested Cyber Environment. Each one of these concepts merits studies on its own. C2 architectures have been a subject of research ever since the appearance of the C4ISR Architecture Framework in 1998. While much research has been done on the design and evalua-tion of architectures, technological developments, especially in IT, sensor, and weapon technolo-gy have made the subject a rapidly moving target. Service Oriented Architectures, Cloud Archi-tectures, wireless connectivity and so forth have created new opportunities for improved C2 ar-chitectures, but also introduce new vulnerabilities. They enable almost everyone to share data, but the data are assumed to be authoritative. This is problematic for two reasons: in a complex multi-sensor environment, not all data are mutually consistent. Furthermore, the wide access to the data introduces cyber vulnerabilities. Emphasis, especially in USAF, has changed from in-formation assurance to mission assurance. This is a fundamental change; it implies the recogni-tion that cyber defenses cannot ever be made impregnable. An adversary will be able to penetrate some of the defenses. So, what becomes important is to design architectures that ensure mission accomplishment in a contested cyber environment, i.e., resilient architectures. Resilience is a concept that is easily understood. Measuring resilience, however, is very challenging, especially when applied to C2 architectures. Consequently, the project took two parallel directions. In the first, situation specific measures of resilience were used (e.g., timeliness, and workload) in the first two experiments (Spirals 1 and 2 in Chapters 3 and 4, respectively). In the second, a basic research effort was initiated to characterize resilience precisely and to develop multiple comput-able measures of resilience. The first results of the second effort are documented in Chapter 9, which is part of the PhD thesis of Mark Pflanz2.
Toward the end of the second experiment (Spiral 2), the direction of the project changed to address the concept of Integrated C2 (IC2). Substantial effort was expended in trying to define what IC2 meant and how it could be measured. A working definition of Integrated Command and Control was derived from Joint Pub 1 and DoDD O-5100.30: “The exercise of authority and direction by properly designated commanders over assigned and attached forces to collaborative-ly monitor, assess, analyze, predict, plan, execute, and report (MAAPPER) their individual re-
1 An architecture is defined as the structure of components, their relationships, and the principles and guidelines governing
their design and evolution over time. IEEE STD 610.12 as extended in the DoD Architecture Framework
2 Mark Pflanz (2011). On the Resilience of Command and Control Architectures. PhD Thesis, Dept. of Systems Engineering and Operations Research, George Mason University, Fairfax, VA. Nov. 2011.
2 of 156
sponsibilities to accomplish a common mission by engaging their forces as a whole.” Assuming that the JOPES process is applicable, we focused on the early steps: Mission Analysis, Course of Action (COA) Development, COA Analysis, COA Comparison, and COA Approval leading to Plan Development. The key condition for integrated C2 was that an integrated COA be devel-oped. An integrated COA is a COA in which all participating entities act as one organization in pursuit of common goal(s). Note that COA development is being done at the Command staff lev-el while plan development is being done at the Air Operations Center level.
To clarify the issues, an abstracted example was created based on the C2 challenges faced by the US Strategic Command. The mission of USSTRATCOM is to detect, deter, and prevent at-tacks against the United States and our allies and join with the other combatant commands to de-fend the nation should deterrence fail. Furthermore, STRATCOM is a Global Command that must be capable of conducting Global C2. Global C2 should enable centralized integration and synchronization and decentralized planning and operations. In Spiral 3, a model was constructed in which the staff of four component commands were modeled as they executed Mission Analy-sis and COA Development and Selection. Collaboration was modeled as information exchange among the four commands as they executed the steps of the JOPES process. These steps and the interactions were modeled using BPMN (Business Process Modeling and Notation.) A contested cyber environment was assumed in which two types of exploits were used – one causing delays through distributed denial of service (DDOS) and the other affecting data updates (the same un-updated messages kept being sent.) To conduct the computational experiments it was necessary that a scenario be developed (Appendix B). It is based on the unclassified Pacifica scenario with sufficient detail added to meet the needs of Spiral 3. The experiment and the results are included in Chapter 6. In parallel with the software implementation of cyber exploits, an analytical effort was undertaken to model different types of exploits that affect the computer communication networks. The results of that work are included in Appendix A.
The computational experiments were conducted on the C2 Wind Tunnel (Chapter 2) which is a model-driven simulation integration platform for conducting experiments that require the coor-dinated execution of multiple simulation engines. However, the demands of the computational experiments required enhancements to the C2WT. These are described in Chapter 5.
The Mission Analysis and COA development occur at the Staff level while planning is done at the Operations Center level. Such a center is a large structured organization that contains divi-sions and cells. A different modeling paradigm is appropriate to analyze the interactions (colla-borative planning) by four operations centers. While it is widely recognized that each center has unique characteristics due to the domain it addresses (air, space, or cyber) and the tasks it plans and then monitors their execution, for the purposes of this analysis, four Air Operations Centers were modeled to study resilience. Each center was modeled as a Social Network; this allowed their analysis and the collection of many measures regarding their structure (Chapter 7). In the following chapter (Chapter 8), agent based modeling is used to study information and belief dif-fusion through simulation.
As indicated at the beginning of this introduction, this project included a number of major concepts, each deserving its own study. Progress was achieved in all areas and especially in be-ginning to integrate them into one cohesive theory of Resilient Integrated C2.
3 of 156
CHAPTER 2
THE C2 WIND TUNNEL
2.1 DESCRIPTION
The C2 Wind Tunnel (C2WT) is a model-driven simulation integration platform for conducting experiments that require the coordinated execution of multiple simulation engines.
The C2WT has been developed in an AFOSR/PRET project by Vanderbilt, UC Berkeley and GMU for the rapid evaluation and assessment of C2 concepts and system designs in a human-centered environment [Sztipanovits, 2008] [IOpenC2WT, 2011]. The key insight of the project has been that integration of heterogeneous, multi-model simulations can be decomposed into two problems: simulation integration and model integration. While DoD’s High Level Architecture (HLA) provides a sound framework for composing simulations based on discrete event seman-tics, model integration has not been sufficiently addressed. The primary outcome of the C2WT project has been a model–integration framework based on meta-modeling [Sztipanovits et al., 2006], [Balogh et al., 2008]. The framework includes a Model Integration Language (MIL) for capturing the interaction among component models and provides tools for generating “glue code” from the integration model to couple the individual simulation tools to the HLA runtime infrastructure.
Deep composition is achieved by developing a model integration layer built on a rigorous formal foundation. The model integration layer is based on the formal models of modeling lan-guages called meta-models. The meta-models define the structural and behavioral semantics of the composed modeling languages and allow the formal specification of their relationship as constraints or transformations. The result of the meta-model composition is an integration meta-model which is embedded in Vanderbilt’s meta-programmable model builder tool and verifies the created models for cross-domain consistency. Continued work in meta-modeling and in for-mally defining structural and behavior semantics for modeling languages serves as the theoretical foundation for the design and implementation of a model-integration layer in the C2WT. The current work on model-based simulation integration fully exploits the fundamentally static struc-ture of the models: dynamics are created from simulating behaviors. In the C2 Wind Tunnel ar-chitecture, the heterogeneous models formally defining a simulation are transformed in configu-ration time. The result of this model transformation phase is a suite of configuration files, glue code, and the generation of a Simulation Controller that deploys and initializes all components and controls the execution of the simulation. Separation of the modeling, model transforma-tion/configuration, and simulation phases is a strong feature of the current C2WT architecture.
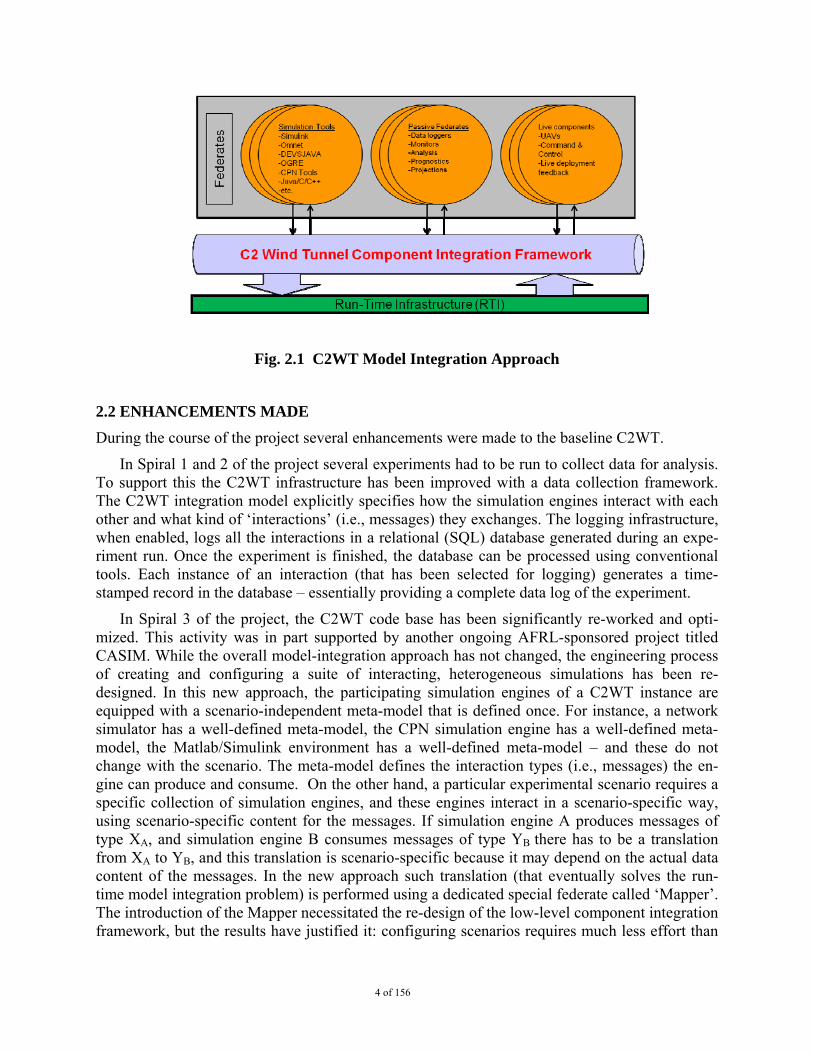
As shown on Fig. 2.1, the Integration Model is used configure a run-time component integra-tion framework layer of the C2WT that runs on the HLA RTI. The integration model captures how the various models (i.e., simulations) interact during experiments, and then it is used to con-figure the integration framework.
4 of 156
Fig. 2.1 C2WT Model Integration Approach
2.2 ENHANCEMENTS MADE
During the course of the project several enhancements were made to the baseline C2WT.
In Spiral 1 and 2 of the project several experiments had to be run to collect data for analysis. To support this the C2WT infrastructure has been improved with a data collection framework. The C2WT integration model explicitly specifies how the simulation engines interact with each other and what kind of ‘interactions’ (i.e., messages) they exchanges. The logging infrastructure, when enabled, logs all the interactions in a relational (SQL) database generated during an expe-riment run. Once the experiment is finished, the database can be processed using conventional tools. Each instance of an interaction (that has been selected for logging) generates a time-stamped record in the database – essentially providing a complete data log of the experiment.
In Spiral 3 of the project, the C2WT code base has been significantly re-worked and opti-mized. This activity was in part supported by another ongoing AFRL-sponsored project titled CASIM. While the overall model-integration approach has not changed, the engineering process of creating and configuring a suite of interacting, heterogeneous simulations has been re-designed. In this new approach, the participating simulation engines of a C2WT instance are equipped with a scenario-independent meta-model that is defined once. For instance, a network simulator has a well-defined meta-model, the CPN simulation engine has a well-defined meta-model, the Matlab/Simulink environment has a well-defined meta-model – and these do not change with the scenario. The meta-model defines the interaction types (i.e., messages) the en-gine can produce and consume. On the other hand, a particular experimental scenario requires a specific collection of simulation engines, and these engines interact in a scenario-specific way, using scenario-specific content for the messages. If simulation engine A produces messages of type XA, and simulation engine B consumes messages of type YB there has to be a translation from XA to YB, and this translation is scenario-specific because it may depend on the actual data content of the messages. In the new approach such translation (that eventually solves the run-time model integration problem) is performed using a dedicated special federate called ‘Mapper’. The introduction of the Mapper necessitated the re-design of the low-level component integration framework, but the results have justified it: configuring scenarios requires much less effort than
5 of 156
before. The CASIM project continues work on this problem by making the generation of the Mapper federate model-based: i.e. scenario integrators will not have to write code (except for complex mapping logic), and the federate will be automatically generated from models.
2.3 REFERENCES
Sztipanovits, J. (2008) “Partnership for Research Excellence and Transition (PRET) in Human System Interaction: System Interaction: Human Centric Design Environments for Command and Control Systems: The C2 Wind Tunnel”, Final report for FA9550-06-1-0267.
OpenC2WT (2011) https://wiki.isis.vanderbilt.edu/OpenC2WT/index.php/Main_Page : detailed project documentation, and sourced for all software components can be found on the Open Community Website of the C2WT.
Sztipanovits, J., T. Bapty, G. Biswas, G. Karsai, C. Tomlin, K. Goldberg, S. Sastry, P. Varaiya, A. Levis, S. Zaidi (2006). Model and System Integration Technology for the C2 Wind-tunnel: A Human Centric Design Environment for Command and Control Systems. Work-shop on AFOSR Information Fusion Program, at the Fusion 2006 Conference, Florence, Ita-ly, July, 2006.
Balogh, Gyorgy, Himanshu Neema, Graham Hemingway, Jeff Green, Brian W. Williams, Janos Sztipanovits, Gabor Karsai (2008): “Rapid Synthesis HLA-Based Heterogeneous Simulation: A Model-Based Integration Approach” ISIS Technical Report ISIS-08-90, March 30, 2008

6 of 156
7 of 156
CHAPTER 3
SPIRAL 1: ESTABLISHING THE PROCESURES FOR EXPERIMENTATION
3.1 INTRODUCTION
The technical approach for the overall effort was to exploit the C2 Wind Tunnel (C2WT) and use it as an experimental test bed for evaluating concepts that could enhance the resilience of com-mand and control architectures. Since this use of the C2WT and this type of experimentation was novel, the primary purpose of Spiral 1 was to develop the experimental procedures for using the C2WT that would be used for Spirals 2 and 3. In short, the goal of the spiral was to demon-strate the capabilities of the C2WT in modeling human centric command and control using a va-riety of modeling languages and tools and refine the procedures for using the C2WT to support experimentation on resilient C2 to support mission assurance. As part of the demonstration the GMU team would conduct an exemplary experiment.
It was decided to re-use many of the C2 Wind Tunnel components that had been developed to support the C2WT demonstration that took place at Barksdale AFB in October 2008 as part of the AFOSR funded PRET project [Sztipanovits, 2008]. The team set up a scenario based on the current C2WT capabilities that could be used to formulate, design, execute, and evaluate the first experiment designed to explore the elements of resilience of Command and Control systems.
At the start of Spiral 1, the C2WT configuration inherited from the PRET project included four types of federates: (1) a decision making organization federate that modeled various com-mand and control nodes of both friendly and adversary organizations, (2) an OMNeT++ federate that modeled the communications channels between organizations, (3) physics federates that modeled the movement of land based vehicles and aircraft over terrain, and (4) an environment federate that provided the geophysical position of the vehicles as they moved over terrain using Google Earth. The physics federates that modeled the movement of unmanned aerial vehicles (UAVs) included a model of camera sensor systems that displayed Google Earth images to hu-man operators who controlled the flight of the UAVs using joy sticks as they watched the Google Earth image. The C2WT had a set of physics federates that controlled the position of ground vehicles (targets) moving over roads shown on Google Earth. Each ground vehicle’s followed a scripted path. An observer of the C2WT demonstration was able to see the images that the UAVs gave to the operators, an overview image of the entire scenario as it unfolded, and various status messages that were generated. No data was collected for analysis and no experimental hy-potheses were developed and evaluated. While the demonstration illustrated the capabilities of the C2WT, it had not been used as a test bed to support the conduct of experiments.
3.2 EXPERIMENT DESIGN
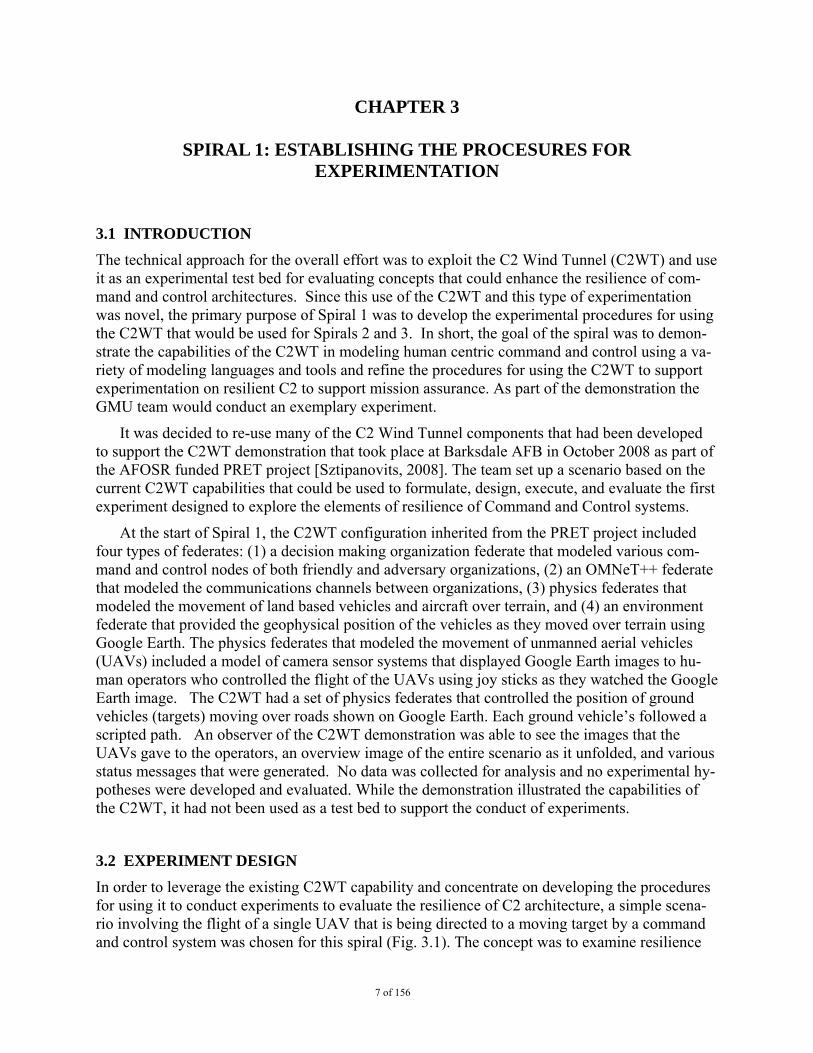
In order to leverage the existing C2WT capability and concentrate on developing the procedures for using it to conduct experiments to evaluate the resilience of C2 architecture, a simple scena-rio involving the flight of a single UAV that is being directed to a moving target by a command and control system was chosen for this spiral (Fig. 3.1). The concept was to examine resilience
8 of 156
as the ability of the system to successfully carry out its mission even when the C2 system is at-tacked. To do this, the C2 system must have sufficient extra capability to work through or by-pass the results of the attack. It most cases, time is an important factor because missions must be accomplished within a certain time window in order to be successful.
Fig. 3.1 Spiral 1 Operational Concept It was decided to have the UAV operate in an autonomous mode rather than have humans
“fly” the UAV as was done in the original demonstration of the C2WT. This was decided in part to eliminate the effects of the performance of the human operator from the results. Furthermore, the C2 system that was directing the UAV was not modeled in detail. The C2WT used the in-formation about the location of the target and sent it to the federate that “told” the UAV federate the heading to fly.
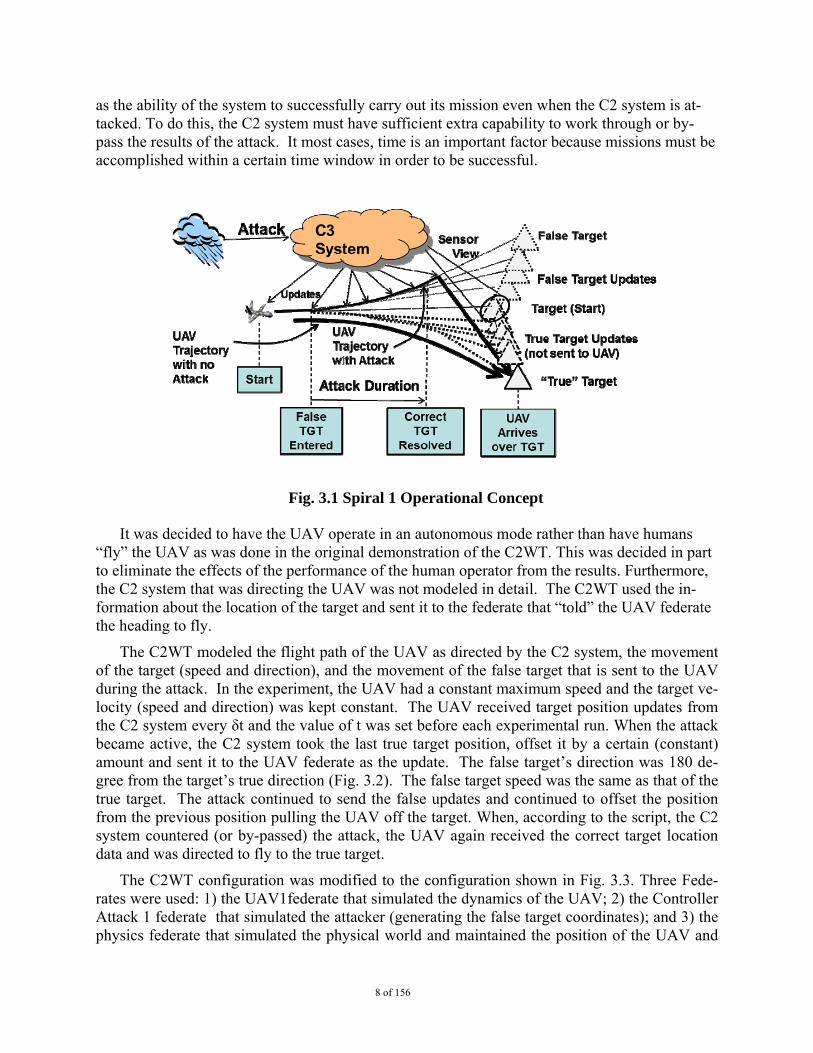
The C2WT modeled the flight path of the UAV as directed by the C2 system, the movement of the target (speed and direction), and the movement of the false target that is sent to the UAV during the attack. In the experiment, the UAV had a constant maximum speed and the target ve-locity (speed and direction) was kept constant. The UAV received target position updates from the C2 system every δt and the value of t was set before each experimental run. When the attack became active, the C2 system took the last true target position, offset it by a certain (constant) amount and sent it to the UAV federate as the update. The false target’s direction was 180 de-gree from the target’s true direction (Fig. 3.2). The false target speed was the same as that of the true target. The attack continued to send the false updates and continued to offset the position from the previous position pulling the UAV off the target. When, according to the script, the C2 system countered (or by-passed) the attack, the UAV again received the correct target location data and was directed to fly to the true target.
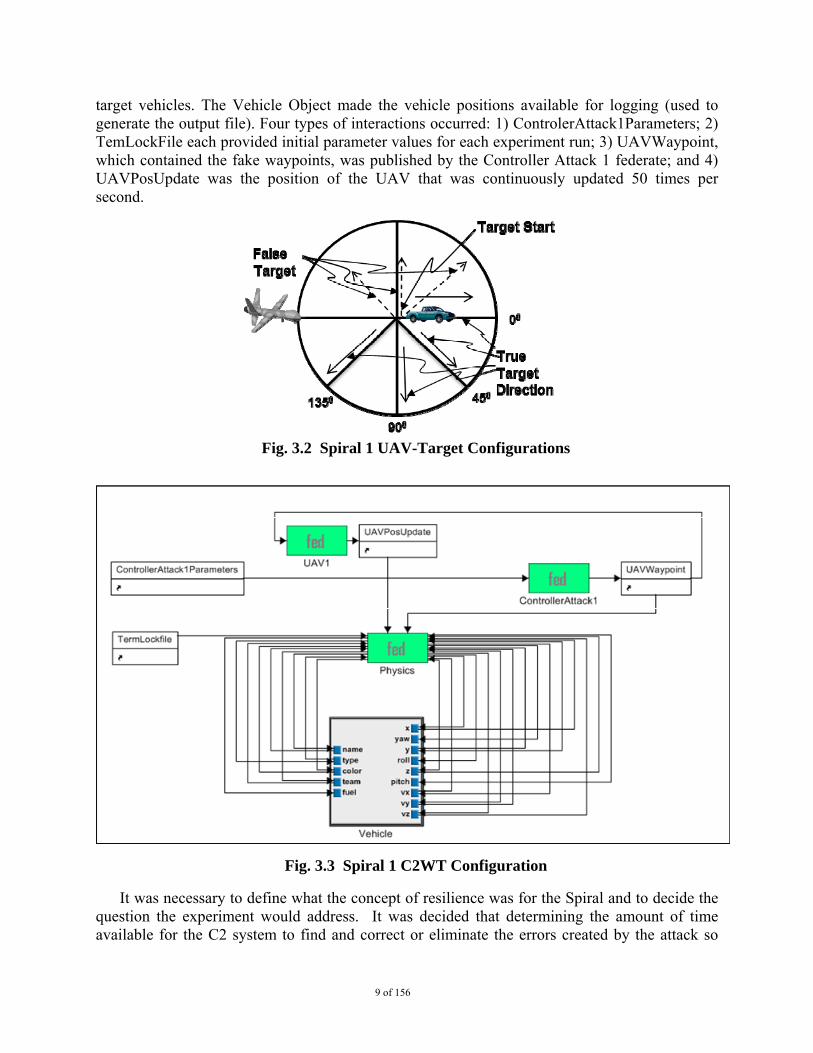
The C2WT configuration was modified to the configuration shown in Fig. 3.3. Three Fede-rates were used: 1) the UAV1federate that simulated the dynamics of the UAV; 2) the Controller Attack 1 federate that simulated the attacker (generating the false target coordinates); and 3) the physics federate that simulated the physical world and maintained the position of the UAV and
9 of 156
target vehicles. The Vehicle Object made the vehicle positions available for logging (used to generate the output file). Four types of interactions occurred: 1) ControlerAttack1Parameters; 2) TemLockFile each provided initial parameter values for each experiment run; 3) UAVWaypoint, which contained the fake waypoints, was published by the Controller Attack 1 federate; and 4) UAVPosUpdate was the position of the UAV that was continuously updated 50 times per second.
Fig. 3.2 Spiral 1 UAV-Target Configurations
Fig. 3.3 Spiral 1 C2WT Configuration
It was necessary to define what the concept of resilience was for the Spiral and to decide the question the experiment would address. It was decided that determining the amount of time available for the C2 system to find and correct or eliminate the errors created by the attack so
10 of 156
that the UAV reached its target in time was the desired output of the experiment. This informa-tion is directly related to the concept of a window of opportunity that is common in the evalua-tion of systems that service time sensitive or time critical targets. The window of opportunity is a time window during which a mission can be successfully carried out. Usually the window ends because the target disappears or enters a restricted area. For each real target, the likelihood of a mission being completed within the window of opportunity decreases as the time it takes to reach a target increases. Designing the experiment to obtain this timing information would assist in de-veloping requirements for evaluating error detection and correction techniques. The concept also could be used to evaluate alternative architecture designs for C2 and compare their performance to requirements.
Clearly there are many ways this concept of window of opportunity could be formulated. For this experiment, a concept we called “Overhead” was selected. Overhead was defined as the ad-ditional amount of time it took for the UAV to reach the target given an attack when compared to the amount of time it took with no attack. A measure for Overhead was formulated in two ways: 1) the increase in time measured in seconds; and 2) the percentage of increase of time to the tar-get compared to that with no attack.
The set of input parameters for the experiment was as follows:
1. Initial UAV position (X, Y, Z)= (0, 0, 300 meters); (UAV velocity is fixed at 40 M/s)
2. Initial target position (X, Y, Z=0)
3. Target Velocity (X, Y)
4. Attack start time
5. Attack end time
6. Target Update Rate, t (sec)
The output parameters included:
1. Summary Data:
a. The simulation run number
b. Attack Start Time (always set to 0 in this experiment)
c. Attack End Time
d. Simulation End Time (when the UAV reaches the target)
e. δT (the target update rate in seconds)
f. Final Target Position (X, Y, Z)
2. Position Data for each update during the simulation run
a. UAV position (X, Y, Z)
b. True Target Position (X, Y, Z)
c. False Target Position (X, Y, Z)
11 of 156
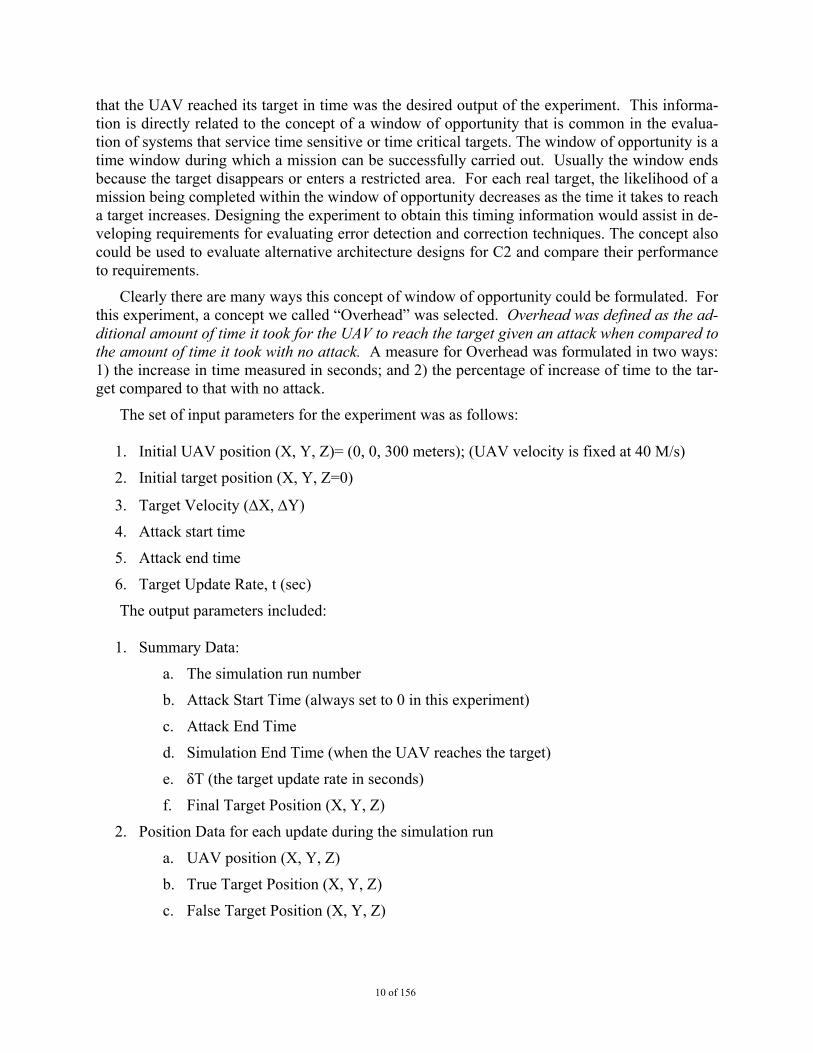
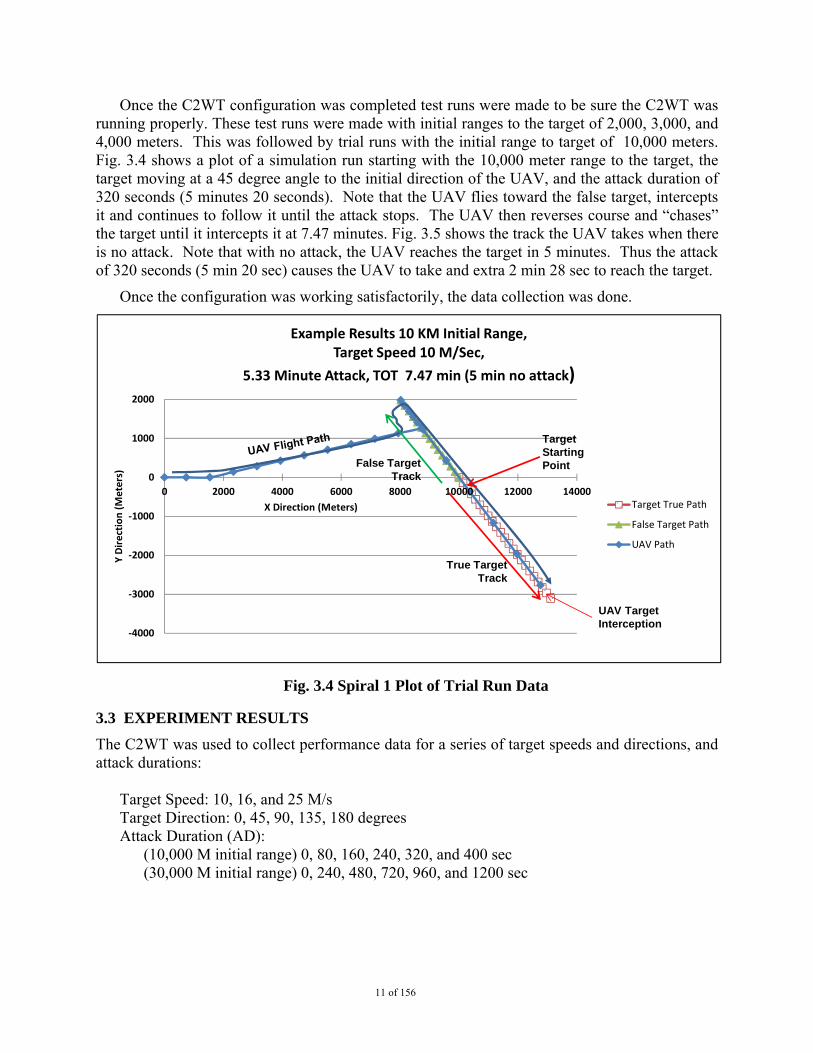
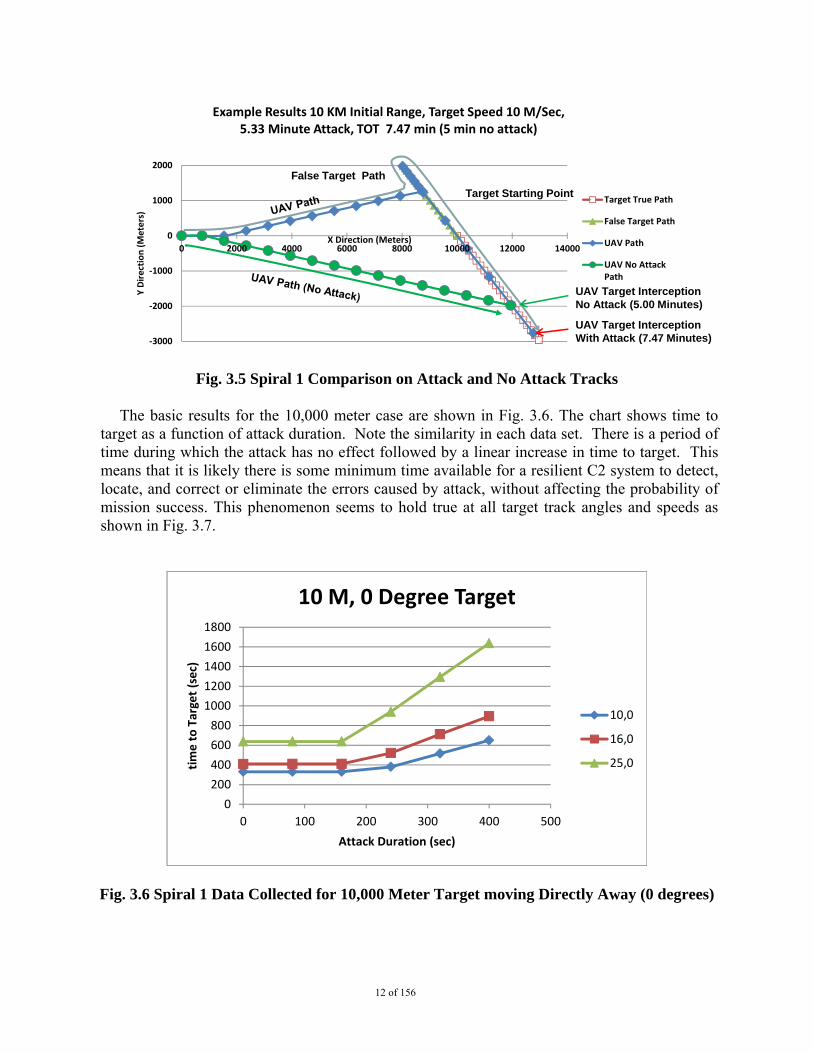
Once the C2WT configuration was completed test runs were made to be sure the C2WT was running properly. These test runs were made with initial ranges to the target of 2,000, 3,000, and 4,000 meters. This was followed by trial runs with the initial range to target of 10,000 meters. Fig. 3.4 shows a plot of a simulation run starting with the 10,000 meter range to the target, the target moving at a 45 degree angle to the initial direction of the UAV, and the attack duration of 320 seconds (5 minutes 20 seconds). Note that the UAV flies toward the false target, intercepts it and continues to follow it until the attack stops. The UAV then reverses course and “chases” the target until it intercepts it at 7.47 minutes. Fig. 3.5 shows the track the UAV takes when there is no attack. Note that with no attack, the UAV reaches the target in 5 minutes. Thus the attack of 320 seconds (5 min 20 sec) causes the UAV to take and extra 2 min 28 sec to reach the target.
Once the configuration was working satisfactorily, the data collection was done.
Fig. 3.4 Spiral 1 Plot of Trial Run Data
3.3 EXPERIMENT RESULTS
The C2WT was used to collect performance data for a series of target speeds and directions, and attack durations:
Target Speed: 10, 16, and 25 M/s Target Direction: 0, 45, 90, 135, 180 degrees Attack Duration (AD):
(10,000 M initial range) 0, 80, 160, 240, 320, and 400 sec (30,000 M initial range) 0, 240, 480, 720, 960, and 1200 sec
‐4000
‐3000
‐2000
‐1000
0
1000
2000
0 2000 4000 6000 8000 10000 12000 14000
Y Direction (Meters)
X Direction (Meters)
Example Results 10 KM Initial Range, Target Speed 10 M/Sec,
5.33 Minute Attack, TOT 7.47 min (5 min no attack)
Target True Path
False Target Path
UAV Path
False Target Track
True Target Track
Target Starting Point
UAV Target Interception
12 of 156
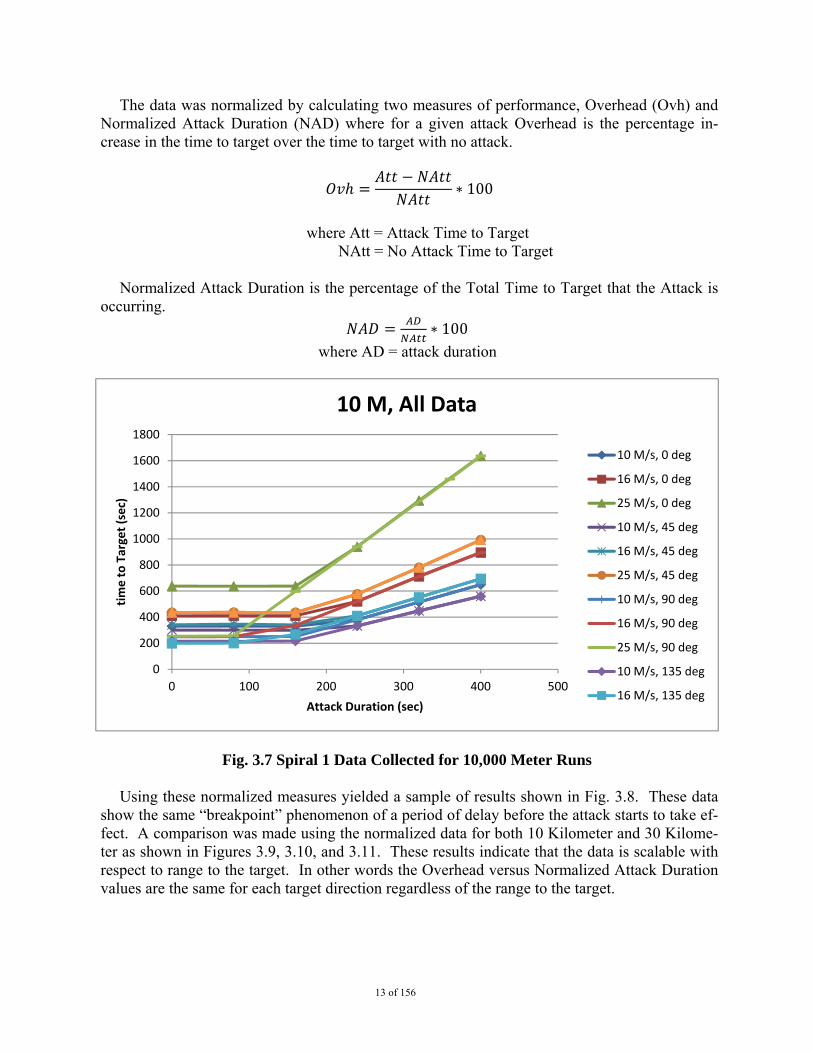
Fig. 3.5 Spiral 1 Comparison on Attack and No Attack Tracks The basic results for the 10,000 meter case are shown in Fig. 3.6. The chart shows time to
target as a function of attack duration. Note the similarity in each data set. There is a period of time during which the attack has no effect followed by a linear increase in time to target. This means that it is likely there is some minimum time available for a resilient C2 system to detect, locate, and correct or eliminate the errors caused by attack, without affecting the probability of mission success. This phenomenon seems to hold true at all target track angles and speeds as shown in Fig. 3.7.
Fig. 3.6 Spiral 1 Data Collected for 10,000 Meter Target moving Directly Away (0 degrees)
‐3000
‐2000
‐1000
0
1000
2000
0 2000 4000 6000 8000 10000 12000 14000
Y Direction (Meters)
X Direction (Meters)
Example Results 10 KM Initial Range, Target Speed 10 M/Sec, 5.33 Minute Attack, TOT 7.47 min (5 min no attack)
Target True Path
False Target Path
UAV Path
UAV No AttackPath
Target Starting Point
UAV Target InterceptionWith Attack (7.47 Minutes)
False Target Path
UAV Target InterceptionNo Attack (5.00 Minutes)
0
200
400
600
800
1000
1200
1400
1600
1800
0 100 200 300 400 500
time to Target (sec)
Attack Duration (sec)
10 M, 0 Degree Target
10,0
16,0
25,0
13 of 156
The data was normalized by calculating two measures of performance, Overhead (Ovh) and Normalized Attack Duration (NAD) where for a given attack Overhead is the percentage in-crease in the time to target over the time to target with no attack.
100
where Att = Attack Time to Target NAtt = No Attack Time to Target
Normalized Attack Duration is the percentage of the Total Time to Target that the Attack is
occurring.
100
where AD = attack duration
Fig. 3.7 Spiral 1 Data Collected for 10,000 Meter Runs Using these normalized measures yielded a sample of results shown in Fig. 3.8. These data
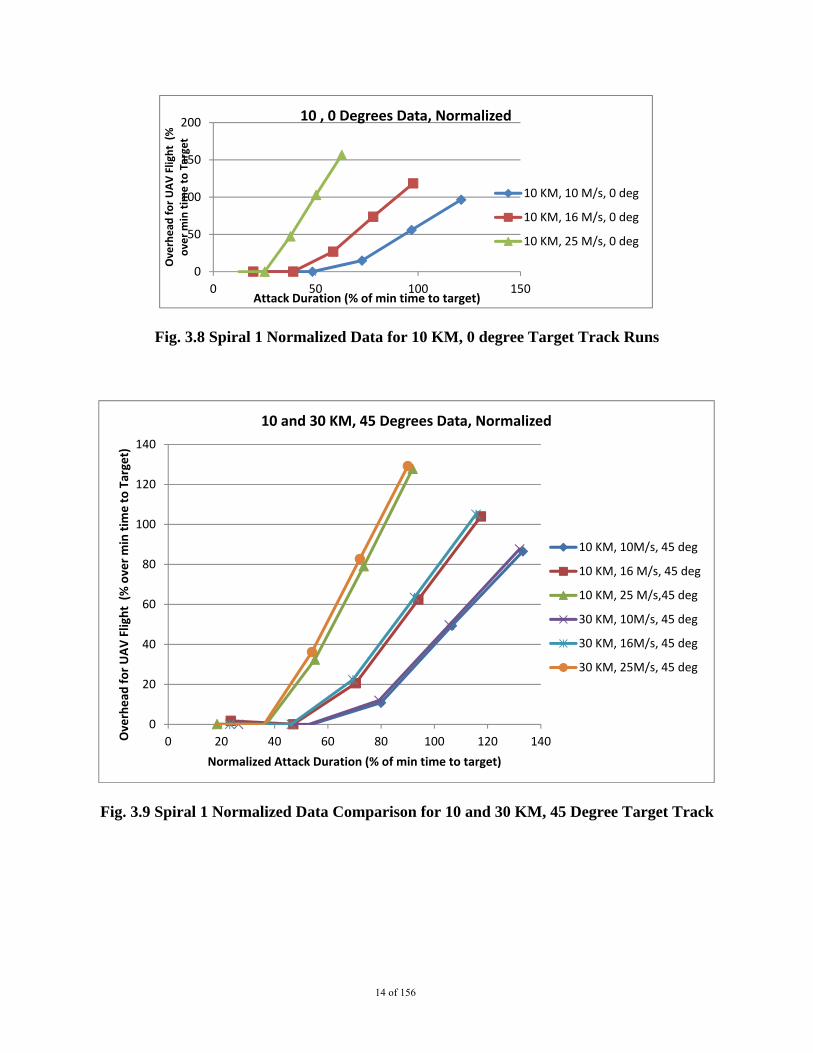
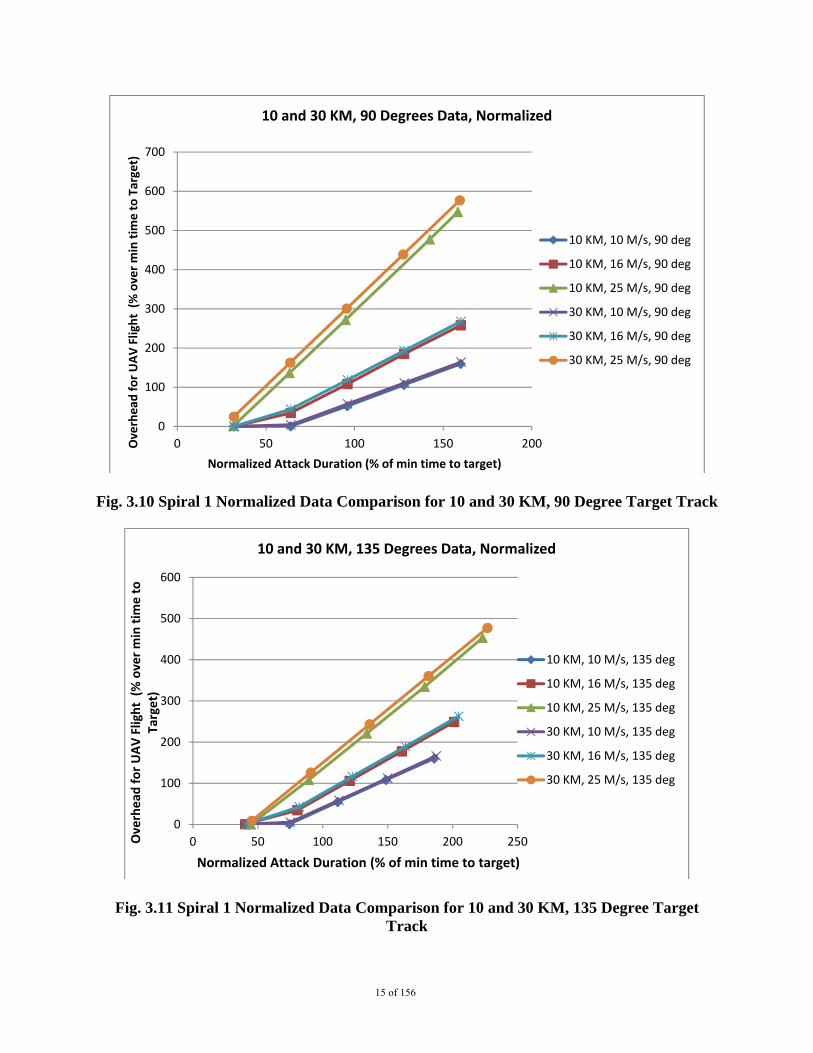
show the same “breakpoint” phenomenon of a period of delay before the attack starts to take ef-fect. A comparison was made using the normalized data for both 10 Kilometer and 30 Kilome-ter as shown in Figures 3.9, 3.10, and 3.11. These results indicate that the data is scalable with respect to range to the target. In other words the Overhead versus Normalized Attack Duration values are the same for each target direction regardless of the range to the target.
0
200
400
600
800
1000
1200
1400
1600
1800
0 100 200 300 400 500
time to Target (sec)
Attack Duration (sec)
10 M, All Data
10 M/s, 0 deg
16 M/s, 0 deg
25 M/s, 0 deg
10 M/s, 45 deg
16 M/s, 45 deg
25 M/s, 45 deg
10 M/s, 90 deg
16 M/s, 90 deg
25 M/s, 90 deg
10 M/s, 135 deg
16 M/s, 135 deg
14 of 156
Fig. 3.8 Spiral 1 Normalized Data for 10 KM, 0 degree Target Track Runs
Fig. 3.9 Spiral 1 Normalized Data Comparison for 10 and 30 KM, 45 Degree Target Track
0
50
100
150
200
0 50 100 150
Overhead
for UAV Flight (%
over min tim
e to Target
Attack Duration (% of min time to target)
10 , 0 Degrees Data, Normalized
10 KM, 10 M/s, 0 deg
10 KM, 16 M/s, 0 deg
10 KM, 25 M/s, 0 deg
0
20
40
60
80
100
120
140
0 20 40 60 80 100 120 140Overhead
for UAV Flight (% over min tim
e to Target)
Normalized Attack Duration (% of min time to target)
10 and 30 KM, 45 Degrees Data, Normalized
10 KM, 10M/s, 45 deg
10 KM, 16 M/s, 45 deg
10 KM, 25 M/s,45 deg
30 KM, 10M/s, 45 deg
30 KM, 16M/s, 45 deg
30 KM, 25M/s, 45 deg
15 of 156
Fig. 3.10 Spiral 1 Normalized Data Comparison for 10 and 30 KM, 90 Degree Target Track
Fig. 3.11 Spiral 1 Normalized Data Comparison for 10 and 30 KM, 135 Degree Target Track
0
100
200
300
400
500
600
700
0 50 100 150 200Overhead
for UAV Flight (% over min tim
e to Target)
Normalized Attack Duration (% of min time to target)
10 and 30 KM, 90 Degrees Data, Normalized
10 KM, 10 M/s, 90 deg
10 KM, 16 M/s, 90 deg
10 KM, 25 M/s, 90 deg
30 KM, 10 M/s, 90 deg
30 KM, 16 M/s, 90 deg
30 KM, 25 M/s, 90 deg
0
100
200
300
400
500
600
0 50 100 150 200 250Overhead
for UAV Flight (% over min tim
e to
Target)
Normalized Attack Duration (% of min time to target)
10 and 30 KM, 135 Degrees Data, Normalized
10 KM, 10 M/s, 135 deg
10 KM, 16 M/s, 135 deg
10 KM, 25 M/s, 135 deg
30 KM, 10 M/s, 135 deg
30 KM, 16 M/s, 135 deg
30 KM, 25 M/s, 135 deg
16 of 156
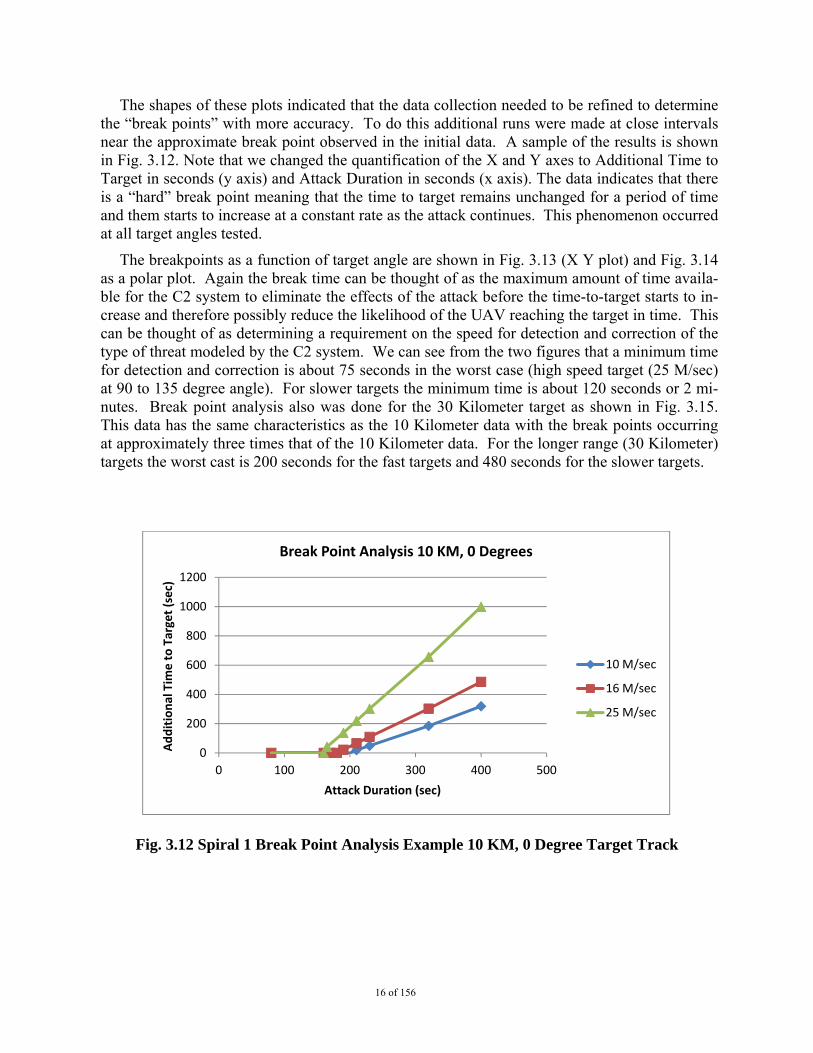
The shapes of these plots indicated that the data collection needed to be refined to determine the “break points” with more accuracy. To do this additional runs were made at close intervals near the approximate break point observed in the initial data. A sample of the results is shown in Fig. 3.12. Note that we changed the quantification of the X and Y axes to Additional Time to Target in seconds (y axis) and Attack Duration in seconds (x axis). The data indicates that there is a “hard” break point meaning that the time to target remains unchanged for a period of time and them starts to increase at a constant rate as the attack continues. This phenomenon occurred at all target angles tested.
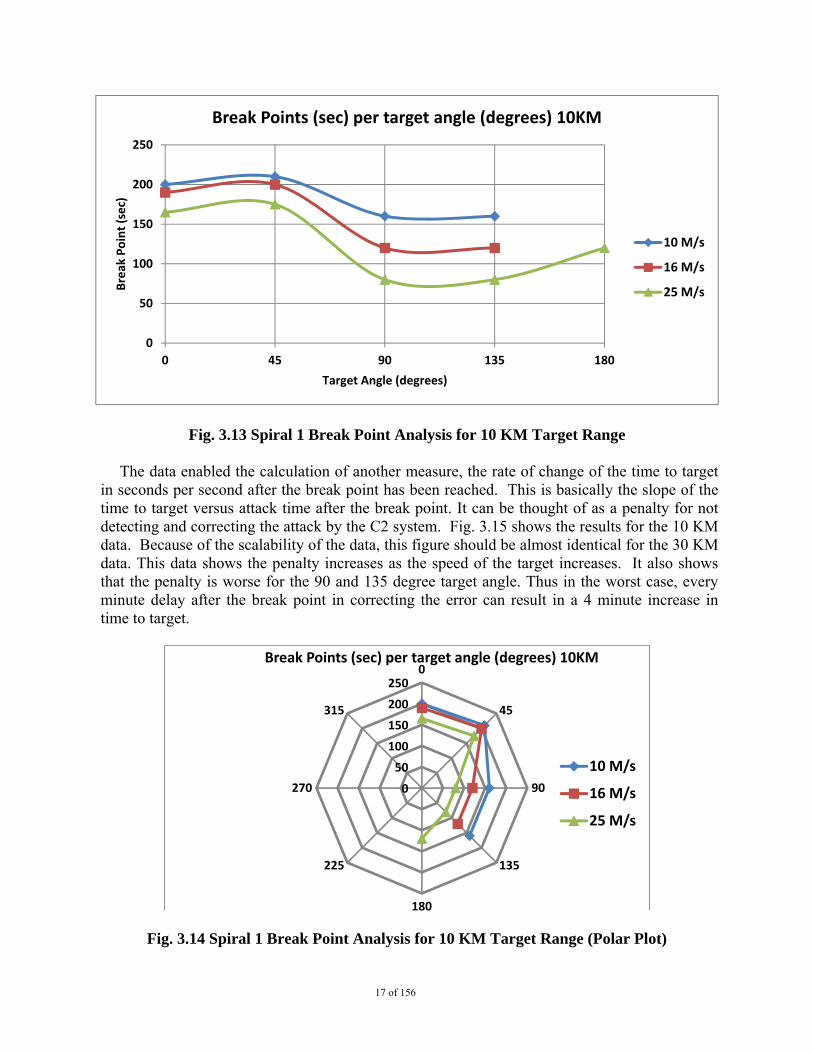
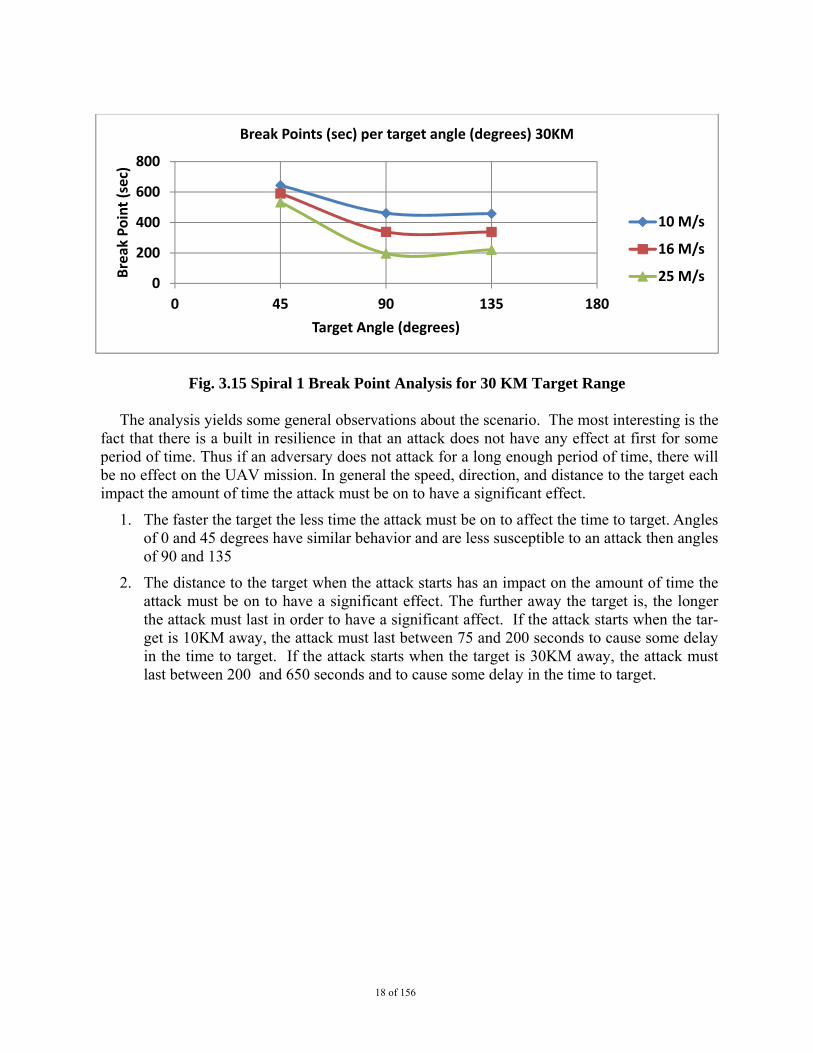
The breakpoints as a function of target angle are shown in Fig. 3.13 (X Y plot) and Fig. 3.14 as a polar plot. Again the break time can be thought of as the maximum amount of time availa-ble for the C2 system to eliminate the effects of the attack before the time-to-target starts to in-crease and therefore possibly reduce the likelihood of the UAV reaching the target in time. This can be thought of as determining a requirement on the speed for detection and correction of the type of threat modeled by the C2 system. We can see from the two figures that a minimum time for detection and correction is about 75 seconds in the worst case (high speed target (25 M/sec) at 90 to 135 degree angle). For slower targets the minimum time is about 120 seconds or 2 mi-nutes. Break point analysis also was done for the 30 Kilometer target as shown in Fig. 3.15. This data has the same characteristics as the 10 Kilometer data with the break points occurring at approximately three times that of the 10 Kilometer data. For the longer range (30 Kilometer) targets the worst cast is 200 seconds for the fast targets and 480 seconds for the slower targets.
Fig. 3.12 Spiral 1 Break Point Analysis Example 10 KM, 0 Degree Target Track
0
200
400
600
800
1000
1200
0 100 200 300 400 500
Additional Tim
e to Target (sec)
Attack Duration (sec)
Break Point Analysis 10 KM, 0 Degrees
10 M/sec
16 M/sec
25 M/sec
17 of 156
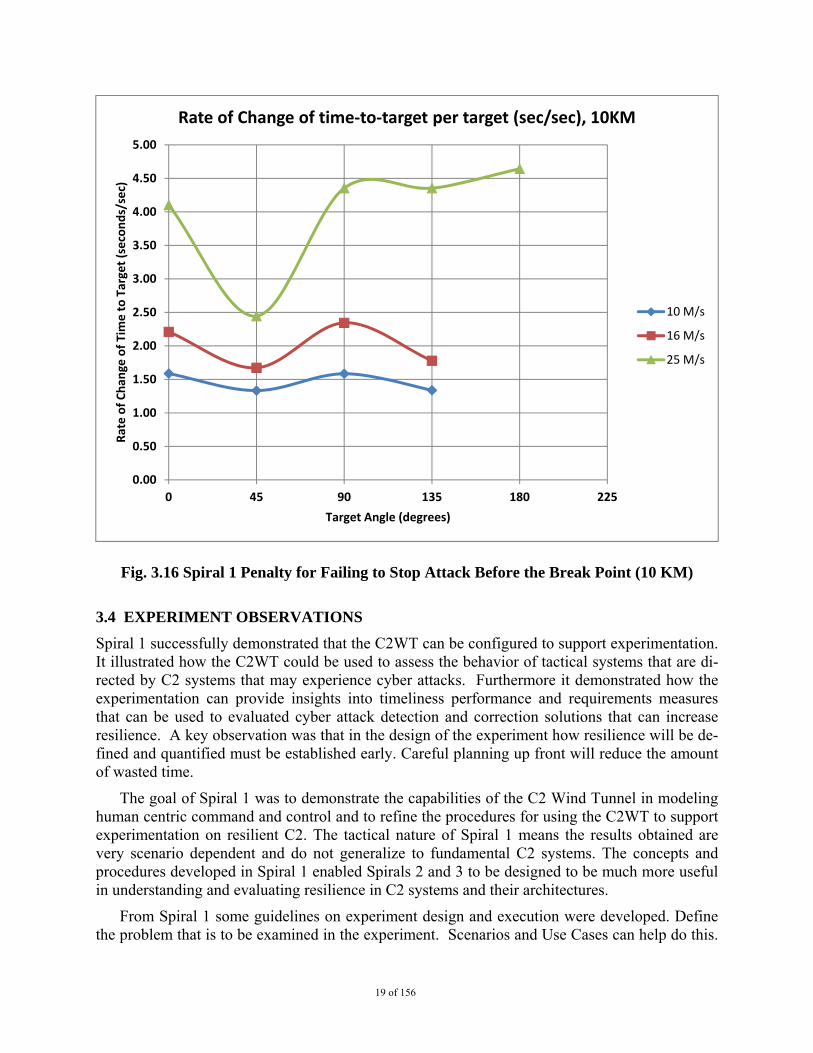
Fig. 3.13 Spiral 1 Break Point Analysis for 10 KM Target Range The data enabled the calculation of another measure, the rate of change of the time to target
in seconds per second after the break point has been reached. This is basically the slope of the time to target versus attack time after the break point. It can be thought of as a penalty for not detecting and correcting the attack by the C2 system. Fig. 3.15 shows the results for the 10 KM data. Because of the scalability of the data, this figure should be almost identical for the 30 KM data. This data shows the penalty increases as the speed of the target increases. It also shows that the penalty is worse for the 90 and 135 degree target angle. Thus in the worst case, every minute delay after the break point in correcting the error can result in a 4 minute increase in time to target.
Fig. 3.14 Spiral 1 Break Point Analysis for 10 KM Target Range (Polar Plot)
0
50
100
150
200
250
0 45 90 135 180
Break Point (sec)
Target Angle (degrees)
Break Points (sec) per target angle (degrees) 10KM
10 M/s
16 M/s
25 M/s
0
50
100
150
200
2500
45
90
135
180
225
270
315
Break Points (sec) per target angle (degrees) 10KM
10 M/s
16 M/s
25 M/s
18 of 156
Fig. 3.15 Spiral 1 Break Point Analysis for 30 KM Target Range
The analysis yields some general observations about the scenario. The most interesting is the fact that there is a built in resilience in that an attack does not have any effect at first for some period of time. Thus if an adversary does not attack for a long enough period of time, there will be no effect on the UAV mission. In general the speed, direction, and distance to the target each impact the amount of time the attack must be on to have a significant effect.
1. The faster the target the less time the attack must be on to affect the time to target. Angles of 0 and 45 degrees have similar behavior and are less susceptible to an attack then angles of 90 and 135
2. The distance to the target when the attack starts has an impact on the amount of time the attack must be on to have a significant effect. The further away the target is, the longer the attack must last in order to have a significant affect. If the attack starts when the tar-get is 10KM away, the attack must last between 75 and 200 seconds to cause some delay in the time to target. If the attack starts when the target is 30KM away, the attack must last between 200 and 650 seconds and to cause some delay in the time to target.
0
200
400
600
800
0 45 90 135 180
Break Point (sec)
Target Angle (degrees)
Break Points (sec) per target angle (degrees) 30KM
10 M/s
16 M/s
25 M/s
19 of 156
Fig. 3.16 Spiral 1 Penalty for Failing to Stop Attack Before the Break Point (10 KM)
3.4 EXPERIMENT OBSERVATIONS
Spiral 1 successfully demonstrated that the C2WT can be configured to support experimentation. It illustrated how the C2WT could be used to assess the behavior of tactical systems that are di-rected by C2 systems that may experience cyber attacks. Furthermore it demonstrated how the experimentation can provide insights into timeliness performance and requirements measures that can be used to evaluated cyber attack detection and correction solutions that can increase resilience. A key observation was that in the design of the experiment how resilience will be de-fined and quantified must be established early. Careful planning up front will reduce the amount of wasted time.
The goal of Spiral 1 was to demonstrate the capabilities of the C2 Wind Tunnel in modeling human centric command and control and to refine the procedures for using the C2WT to support experimentation on resilient C2. The tactical nature of Spiral 1 means the results obtained are very scenario dependent and do not generalize to fundamental C2 systems. The concepts and procedures developed in Spiral 1 enabled Spirals 2 and 3 to be designed to be much more useful in understanding and evaluating resilience in C2 systems and their architectures.
From Spiral 1 some guidelines on experiment design and execution were developed. Define the problem that is to be examined in the experiment. Scenarios and Use Cases can help do this.
0.00
0.50
1.00
1.50
2.00
2.50
3.00
3.50
4.00
4.50
5.00
0 45 90 135 180 225
Rate of Chan
ge of Time to Target (seconds/sec)
Target Angle (degrees)
Rate of Change of time‐to‐target per target (sec/sec), 10KM
10 M/s
16 M/s
25 M/s
20 of 156
For C2 systems define mission workflows and the components that support those workflows. Al-ternative architectures may be proposed to support those workflows. Define the cyber effects that are the focus of the experiment including type, location, duration. Then clarify the propositions and questions that will be answered by the experiment. These will lead to the development of the measures that need to be quantified and the parameters for which data must be collected by run-ning the C2WT configuration. Measures can be thought of as Measures of Performance (MOPs) whose values will be determined from the data collected. Requirements that are commensurate with the MOPs should be defined so that the values of the MOPs can be compared to the Re-quirements. Determine the C2WT configuration needed to collect the data for the calculations and determine how the input data and output data will be generated. Configure the C2WT ac-cordingly. Then estimated the input parameter values needed and run the C2WT over that set of values and collect the output data. Use the data in the formulas that quantify the MOPs. If alter-native architectures are being evaluated, then repeat the process for each.
Examine the results and compare them to the propositions and questions that were estab-lished. Adjust the parameter space if required and re-run the experiment. Adjust propositions if unexpected phenomenon are observed and re-run the experiment. Finally prepare and present the final results.
The C2WT used in the Barksdale AFB demo also used tools developed by the Center for Computational Analysis of Social and Organizational Systems (CASOS) at Carnegie Mellon University. They were not “integrated” as federates in the C2WT, but rather were used separate-ly and synchronized with the C2WT as the demonstration scenario unfolded. In addition to con-ducting an experiment using the C2WT, a sub goal of Spiral 1 was to determine how to integrate the CASOS tools (e.g. the Organizational Risk Analyzer (ORA)) with the C2WT. The results of this effort are presented in Chapter 7 of this report.
3.5 CONCLUSIONS
By design, the scenario for Spiral 1 was very limited. It was tactical and specialized and there-fore of limited value in understanding resiliency of C2 architectures. However, it established the feasibility of running controlled experiments to test hypotheses.
It was then decided that the next spiral would try to examine a more realistic C2 architecture and environment such as that of an Air Operations Center (AOC). We recognized that this would require considerable modification to the C2WT and careful design of the experimental questions and the data collection that would be needed. Particular attention needed to be placed on the questions that would be addressed in the experiment.
21 of 156
CHAPTER 4
SPIRAL 2: RESILIENCE OF THE AOC WEAPON SYSTEM
4.1 INTRODUCTION
Spiral 2 focused on the Air Operations Center (AOC) Weapon System as the command and con-trol architecture for the experiment. The overall objective of the experiment was to understand the effects of cyber attacks on Command and Control Systems such as those employed by the Air Operations Center and how different architectures can mitigate those effects. To do this we needed to develop a mechanism to measure resilience of alternative C2 structures (architectures) before the systems are deployed. This requires the development of models that represent the command and control system under investigation, the conversion of those models to federates in the C2WT and the design and conduct of experiments that measure the effects of potential cyber attacks on the C2 System. We decided to define a resilient system as a characteristic that allows the users (humans) of command and control systems to get their tasks done even though the sys-tems that support the processes have been attacked and are degraded.
4.2 EXPERIMENT DESIGN
The AOC is composed of teams that perform sets of processes (tasks or activities) to produce products on time according to a “battle rhythm.” Currently AOCs provide resilience by having enough manpower to be able to accomplish the command and control processes according to the battle rhythm without the use of systems and networks. Under this concept, if all systems and networks are working, a core group of humans use those systems to carry out the process and produce a series of products on time. These humans communicate with the systems either direct-ly or through networks and the systems perform many functions for the humans as they produce the products. When those systems are working, a fraction of the total number of people in the AOC is needed. The extra people build “backup” data and products concurrently with the sys-tem produced products. These people can be thought of as backups that allow the AOC to con-tinue to produce the products manually (Fig. 4.1) if needed. If a system fails, the team switches to the backup data and process. Once a system has failed during a process, the team does not try to re-use the system until that process is completed. When starting a new process, the team may again try to use the system. We hypothesized that by creating redundancy features in the sys-tems, services, and network it would be possible for the humans to continue to use their systems and data even if they are attacked and degraded by switching to backup systems and networks. If this is the case, then it may be possible to reduce the number of people that need to be present in the AOC to provide the required resilience. In short, we are proposing new features of the sys-tems, services, and networks that may enhance the resilience of the AOC Weapon System to cy-ber attacks against the networks or the systems. We are creating architecture descriptions of the concepts that can be evaluated to determine if those features can improve resilience. This ap-proach enables experimentation with alternative designs before actually committing to building a new system.
22 of 156
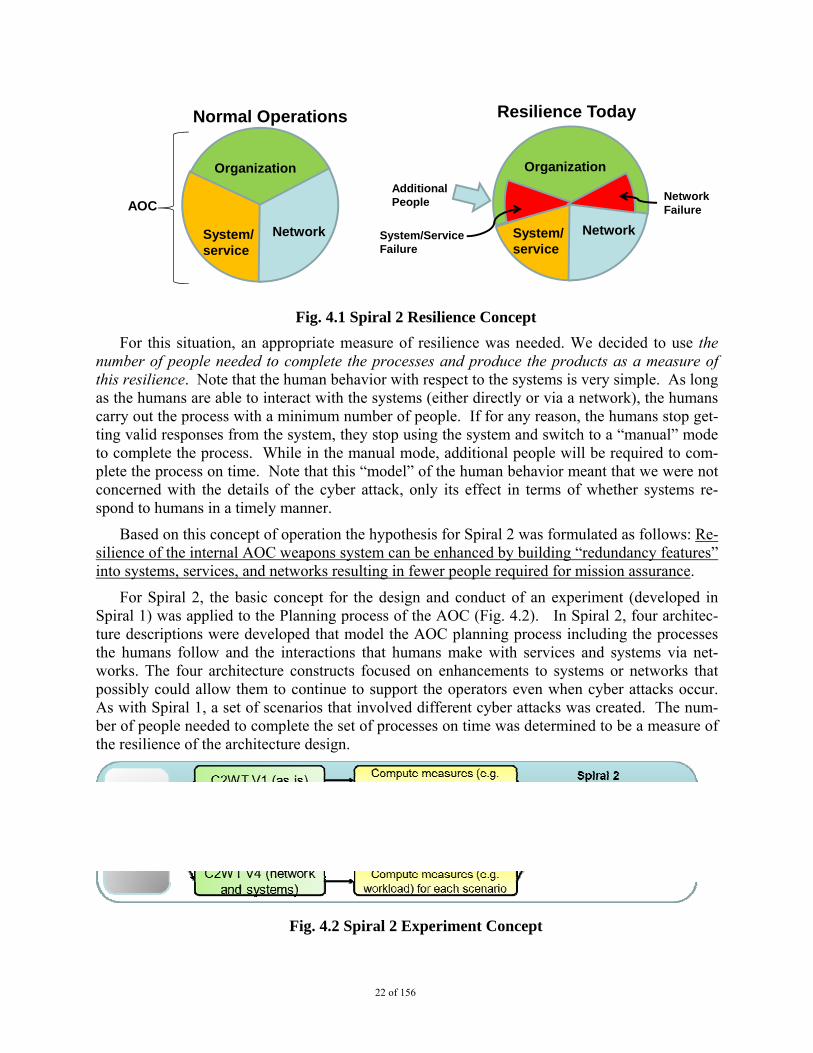
Fig. 4.1 Spiral 2 Resilience Concept
For this situation, an appropriate measure of resilience was needed. We decided to use the number of people needed to complete the processes and produce the products as a measure of this resilience. Note that the human behavior with respect to the systems is very simple. As long as the humans are able to interact with the systems (either directly or via a network), the humans carry out the process with a minimum number of people. If for any reason, the humans stop get-ting valid responses from the system, they stop using the system and switch to a “manual” mode to complete the process. While in the manual mode, additional people will be required to com-plete the process on time. Note that this “model” of the human behavior meant that we were not concerned with the details of the cyber attack, only its effect in terms of whether systems re-spond to humans in a timely manner.
Based on this concept of operation the hypothesis for Spiral 2 was formulated as follows: Re-silience of the internal AOC weapons system can be enhanced by building “redundancy features” into systems, services, and networks resulting in fewer people required for mission assurance.
For Spiral 2, the basic concept for the design and conduct of an experiment (developed in Spiral 1) was applied to the Planning process of the AOC (Fig. 4.2). In Spiral 2, four architec-ture descriptions were developed that model the AOC planning process including the processes the humans follow and the interactions that humans make with services and systems via net-works. The four architecture constructs focused on enhancements to systems or networks that possibly could allow them to continue to support the operators even when cyber attacks occur. As with Spiral 1, a set of scenarios that involved different cyber attacks was created. The num-ber of people needed to complete the set of processes on time was determined to be a measure of the resilience of the architecture design.
Fig. 4.2 Spiral 2 Experiment Concept
Organization
NetworkSystem/service
Organization
NetworkSystem/service
Additional People
Normal Operations Resilience Today
AOCNetwork Failure
System/Service Failure
23 of 156
4.3 SCOPE
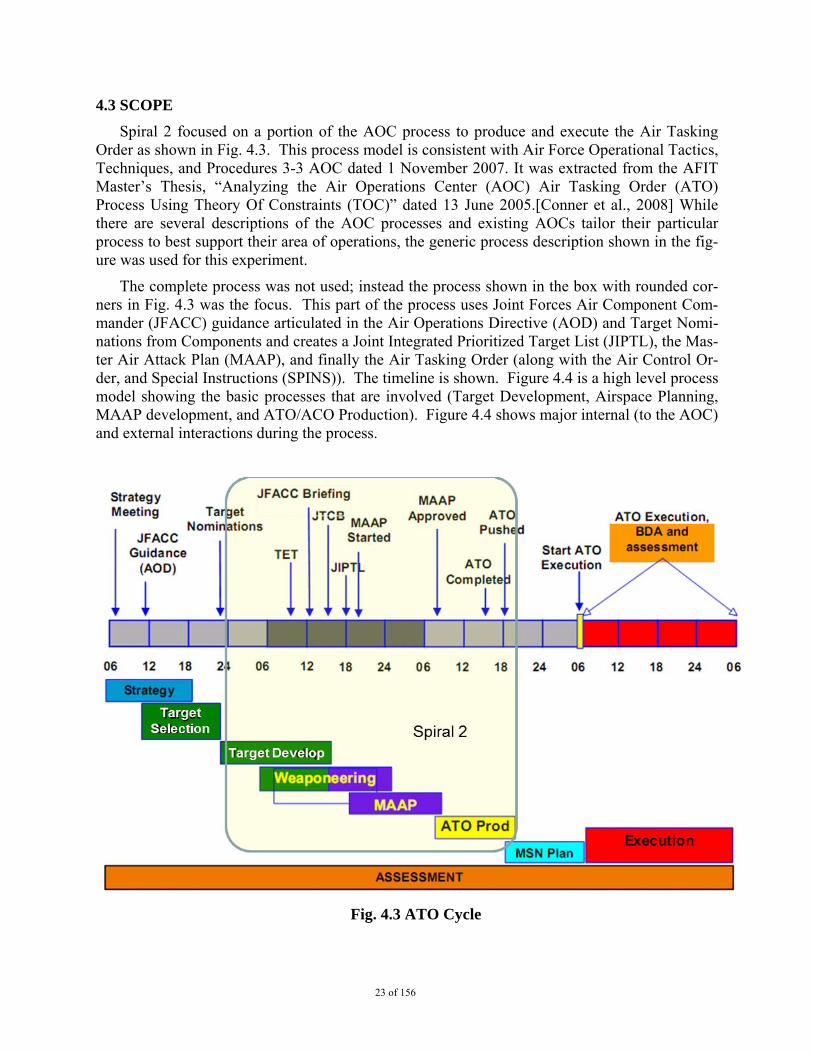
Spiral 2 focused on a portion of the AOC process to produce and execute the Air Tasking Order as shown in Fig. 4.3. This process model is consistent with Air Force Operational Tactics, Techniques, and Procedures 3-3 AOC dated 1 November 2007. It was extracted from the AFIT Master’s Thesis, “Analyzing the Air Operations Center (AOC) Air Tasking Order (ATO) Process Using Theory Of Constraints (TOC)” dated 13 June 2005.[Conner et al., 2008] While there are several descriptions of the AOC processes and existing AOCs tailor their particular process to best support their area of operations, the generic process description shown in the fig-ure was used for this experiment.
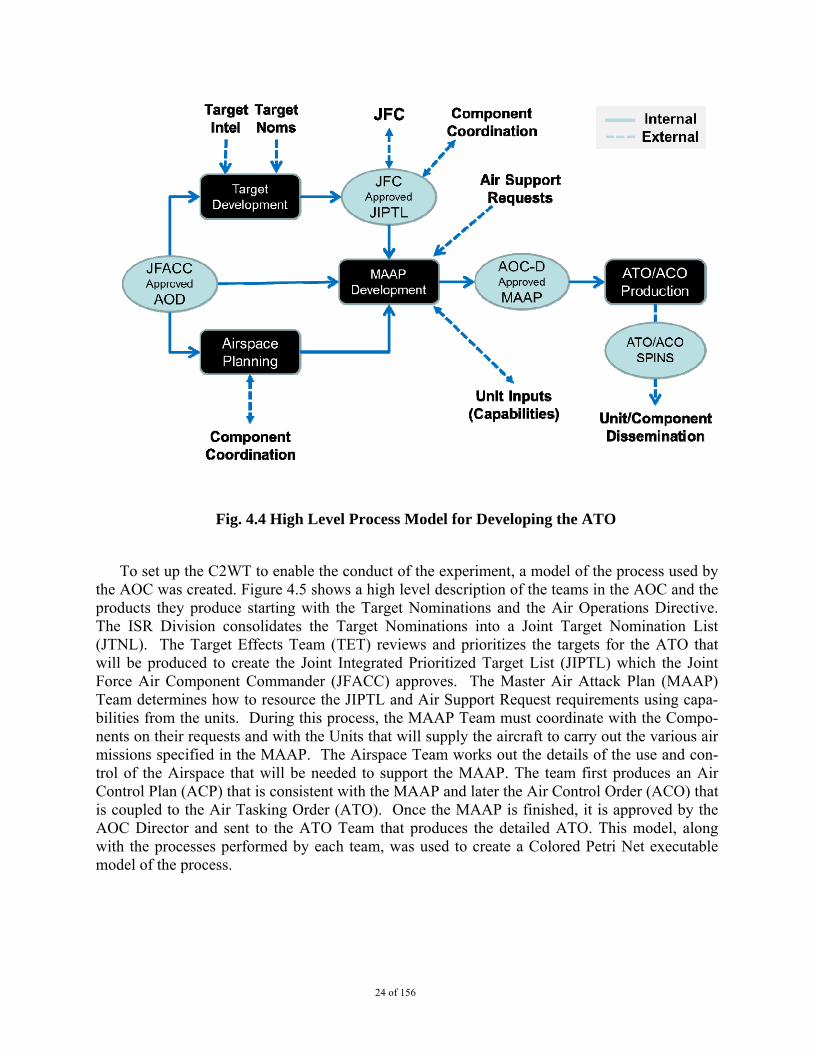
The complete process was not used; instead the process shown in the box with rounded cor-ners in Fig. 4.3 was the focus. This part of the process uses Joint Forces Air Component Com-mander (JFACC) guidance articulated in the Air Operations Directive (AOD) and Target Nomi-nations from Components and creates a Joint Integrated Prioritized Target List (JIPTL), the Mas-ter Air Attack Plan (MAAP), and finally the Air Tasking Order (along with the Air Control Or-der, and Special Instructions (SPINS)). The timeline is shown. Figure 4.4 is a high level process model showing the basic processes that are involved (Target Development, Airspace Planning, MAAP development, and ATO/ACO Production). Figure 4.4 shows major internal (to the AOC) and external interactions during the process.
Fig. 4.3 ATO Cycle
24 of 156
Fig. 4.4 High Level Process Model for Developing the ATO
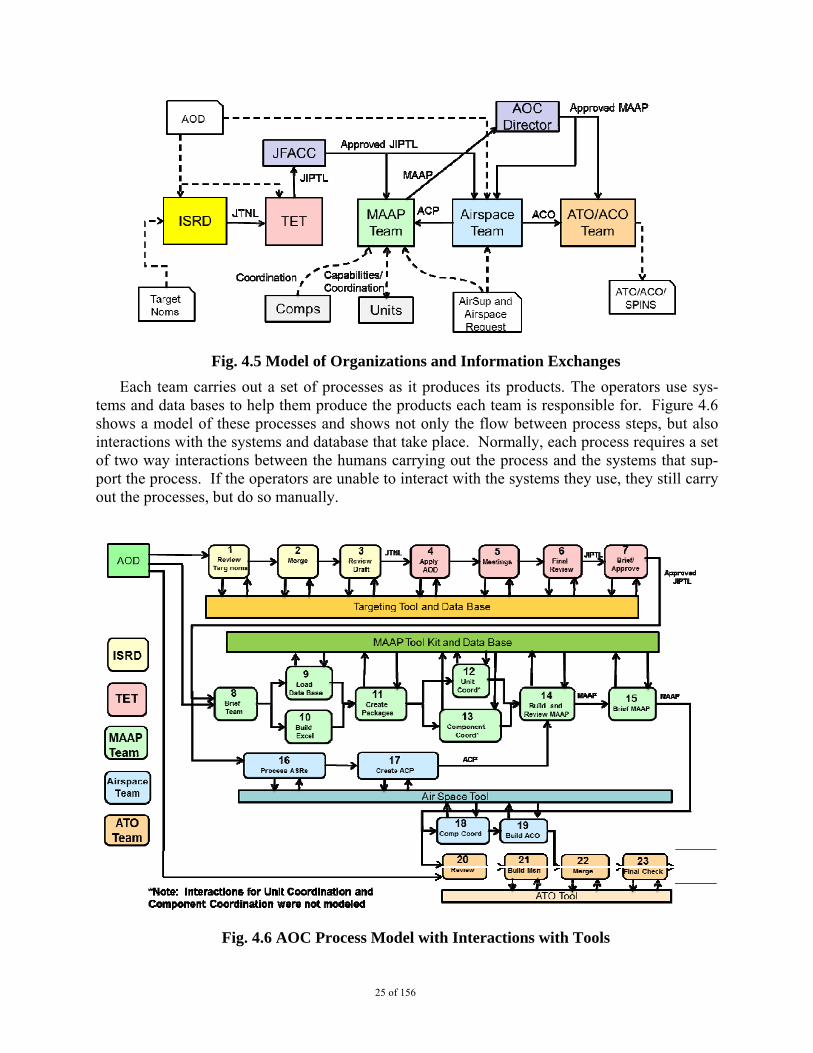
To set up the C2WT to enable the conduct of the experiment, a model of the process used by the AOC was created. Figure 4.5 shows a high level description of the teams in the AOC and the products they produce starting with the Target Nominations and the Air Operations Directive. The ISR Division consolidates the Target Nominations into a Joint Target Nomination List (JTNL). The Target Effects Team (TET) reviews and prioritizes the targets for the ATO that will be produced to create the Joint Integrated Prioritized Target List (JIPTL) which the Joint Force Air Component Commander (JFACC) approves. The Master Air Attack Plan (MAAP) Team determines how to resource the JIPTL and Air Support Request requirements using capa-bilities from the units. During this process, the MAAP Team must coordinate with the Compo-nents on their requests and with the Units that will supply the aircraft to carry out the various air missions specified in the MAAP. The Airspace Team works out the details of the use and con-trol of the Airspace that will be needed to support the MAAP. The team first produces an Air Control Plan (ACP) that is consistent with the MAAP and later the Air Control Order (ACO) that is coupled to the Air Tasking Order (ATO). Once the MAAP is finished, it is approved by the AOC Director and sent to the ATO Team that produces the detailed ATO. This model, along with the processes performed by each team, was used to create a Colored Petri Net executable model of the process.
25 of 156
Fig. 4.5 Model of Organizations and Information Exchanges
Each team carries out a set of processes as it produces its products. The operators use sys-tems and data bases to help them produce the products each team is responsible for. Figure 4.6 shows a model of these processes and shows not only the flow between process steps, but also interactions with the systems and database that take place. Normally, each process requires a set of two way interactions between the humans carrying out the process and the systems that sup-port the process. If the operators are unable to interact with the systems they use, they still carry out the processes, but do so manually.
Fig. 4.6 AOC Process Model with Interactions with Tools
26 of 156
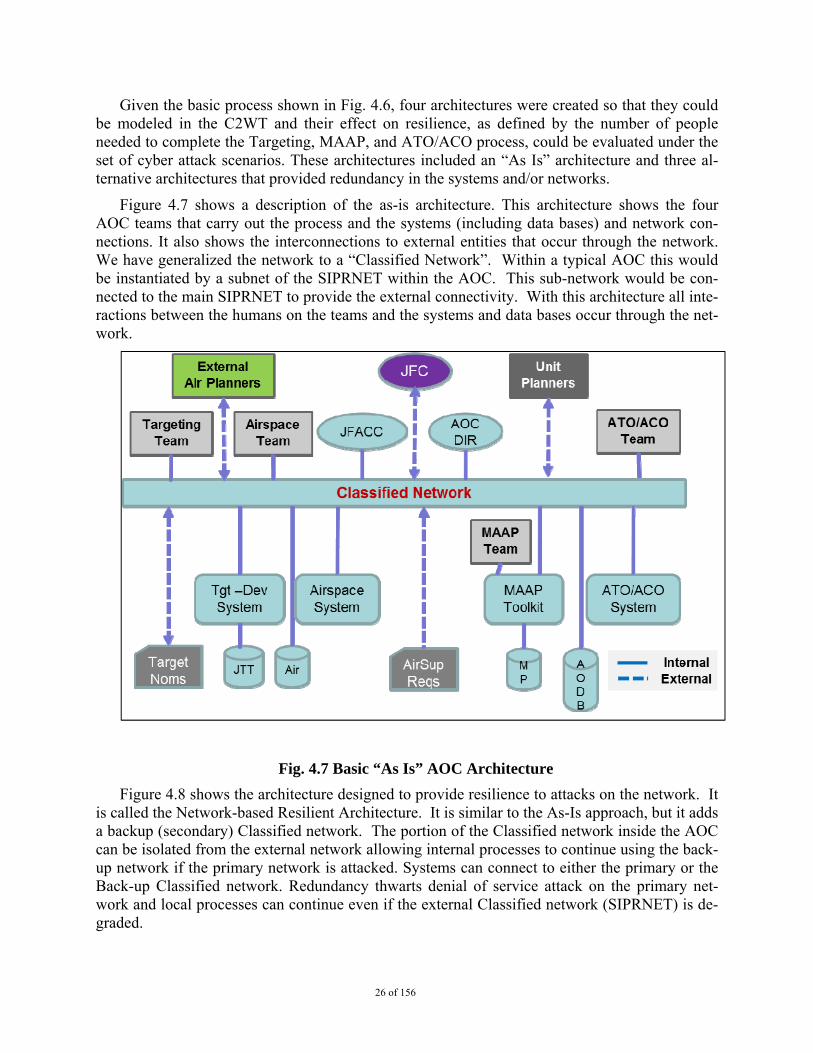
Given the basic process shown in Fig. 4.6, four architectures were created so that they could be modeled in the C2WT and their effect on resilience, as defined by the number of people needed to complete the Targeting, MAAP, and ATO/ACO process, could be evaluated under the set of cyber attack scenarios. These architectures included an “As Is” architecture and three al-ternative architectures that provided redundancy in the systems and/or networks.
Figure 4.7 shows a description of the as-is architecture. This architecture shows the four AOC teams that carry out the process and the systems (including data bases) and network con-nections. It also shows the interconnections to external entities that occur through the network. We have generalized the network to a “Classified Network”. Within a typical AOC this would be instantiated by a subnet of the SIPRNET within the AOC. This sub-network would be con-nected to the main SIPRNET to provide the external connectivity. With this architecture all inte-ractions between the humans on the teams and the systems and data bases occur through the net-work.
Fig. 4.7 Basic “As Is” AOC Architecture
Figure 4.8 shows the architecture designed to provide resilience to attacks on the network. It is called the Network-based Resilient Architecture. It is similar to the As-Is approach, but it adds a backup (secondary) Classified network. The portion of the Classified network inside the AOC can be isolated from the external network allowing internal processes to continue using the back-up network if the primary network is attacked. Systems can connect to either the primary or the Back-up Classified network. Redundancy thwarts denial of service attack on the primary net-work and local processes can continue even if the external Classified network (SIPRNET) is de-graded.
27 of 156
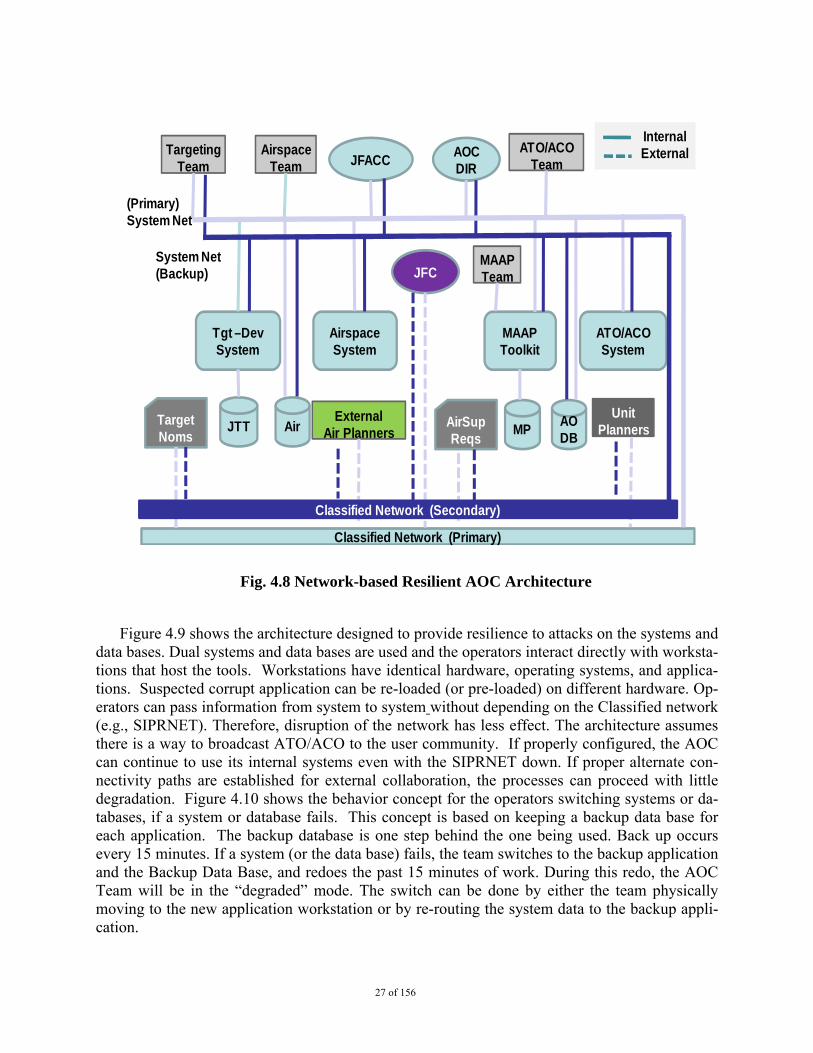
Fig. 4.8 Network-based Resilient AOC Architecture
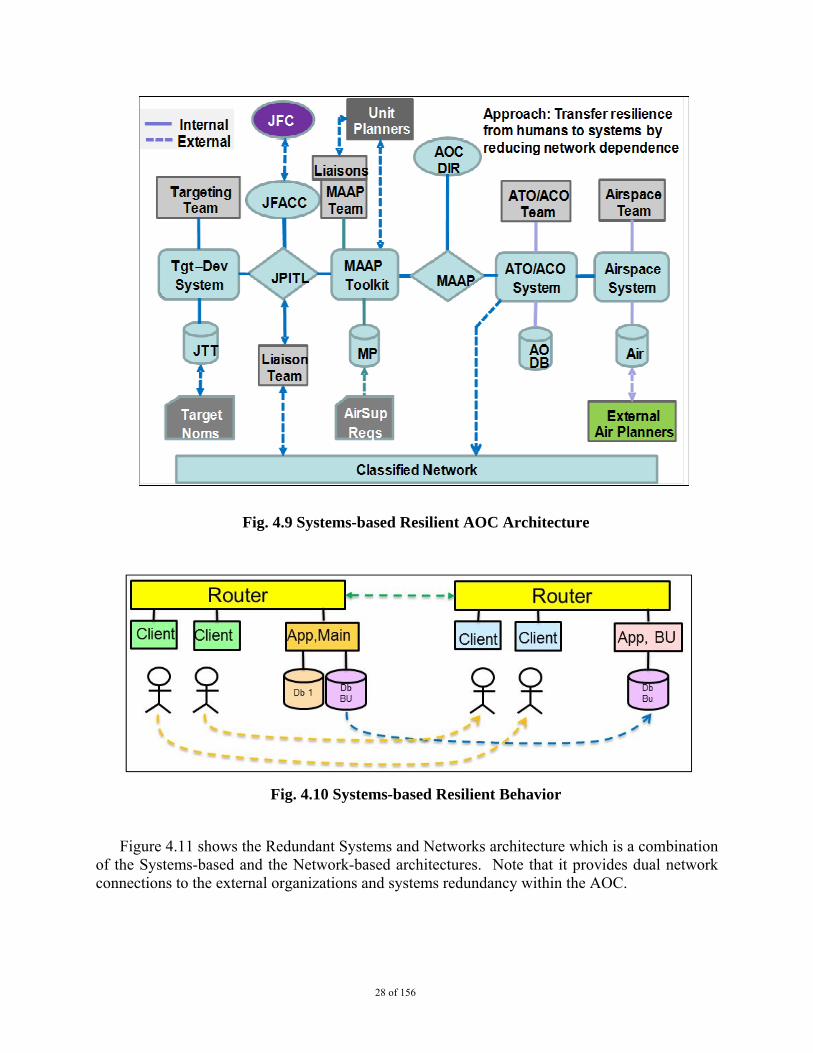
Figure 4.9 shows the architecture designed to provide resilience to attacks on the systems and data bases. Dual systems and data bases are used and the operators interact directly with worksta-tions that host the tools. Workstations have identical hardware, operating systems, and applica-tions. Suspected corrupt application can be re-loaded (or pre-loaded) on different hardware. Op-erators can pass information from system to system without depending on the Classified network (e.g., SIPRNET). Therefore, disruption of the network has less effect. The architecture assumes there is a way to broadcast ATO/ACO to the user community. If properly configured, the AOC can continue to use its internal systems even with the SIPRNET down. If proper alternate con-nectivity paths are established for external collaboration, the processes can proceed with little degradation. Figure 4.10 shows the behavior concept for the operators switching systems or da-tabases, if a system or database fails. This concept is based on keeping a backup data base for each application. The backup database is one step behind the one being used. Back up occurs every 15 minutes. If a system (or the data base) fails, the team switches to the backup application and the Backup Data Base, and redoes the past 15 minutes of work. During this redo, the AOC Team will be in the “degraded” mode. The switch can be done by either the team physically moving to the new application workstation or by re-routing the system data to the backup appli-cation.
Classified Network (Primary)
TargetingTeam
AirspaceTeam
MAAPTeam
ATO/ACOTeamJFACC
AOCDIR
Tgt –DevSystem
AirspaceSystem
MAAPToolkit
ATO/ACOSystem
JFC
TargetNoms
AirSupReqs
ExternalAir Planners
UnitPlanners
AODB
Air MPJTT
InternalExternal
(Primary)System Net
System Net(Backup)
Classified Network (Secondary)
28 of 156
Fig. 4.9 Systems-based Resilient AOC Architecture
Fig. 4.10 Systems-based Resilient Behavior
Figure 4.11 shows the Redundant Systems and Networks architecture which is a combination of the Systems-based and the Network-based architectures. Note that it provides dual network connections to the external organizations and systems redundancy within the AOC.
29 of 156
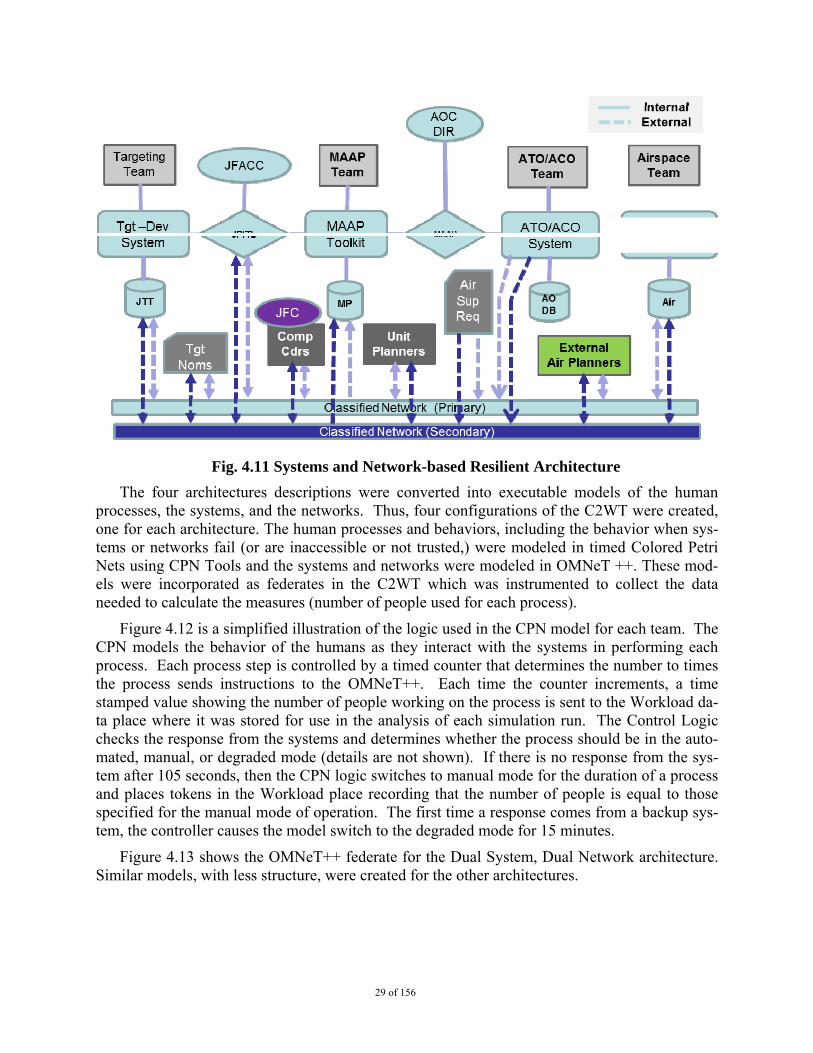
Fig. 4.11 Systems and Network-based Resilient Architecture
The four architectures descriptions were converted into executable models of the human processes, the systems, and the networks. Thus, four configurations of the C2WT were created, one for each architecture. The human processes and behaviors, including the behavior when sys-tems or networks fail (or are inaccessible or not trusted,) were modeled in timed Colored Petri Nets using CPN Tools and the systems and networks were modeled in OMNeT ++. These mod-els were incorporated as federates in the C2WT which was instrumented to collect the data needed to calculate the measures (number of people used for each process).
Figure 4.12 is a simplified illustration of the logic used in the CPN model for each team. The CPN models the behavior of the humans as they interact with the systems in performing each process. Each process step is controlled by a timed counter that determines the number to times the process sends instructions to the OMNeT++. Each time the counter increments, a time stamped value showing the number of people working on the process is sent to the Workload da-ta place where it was stored for use in the analysis of each simulation run. The Control Logic checks the response from the systems and determines whether the process should be in the auto-mated, manual, or degraded mode (details are not shown). If there is no response from the sys-tem after 105 seconds, then the CPN logic switches to manual mode for the duration of a process and places tokens in the Workload place recording that the number of people is equal to those specified for the manual mode of operation. The first time a response comes from a backup sys-tem, the controller causes the model switch to the degraded mode for 15 minutes.
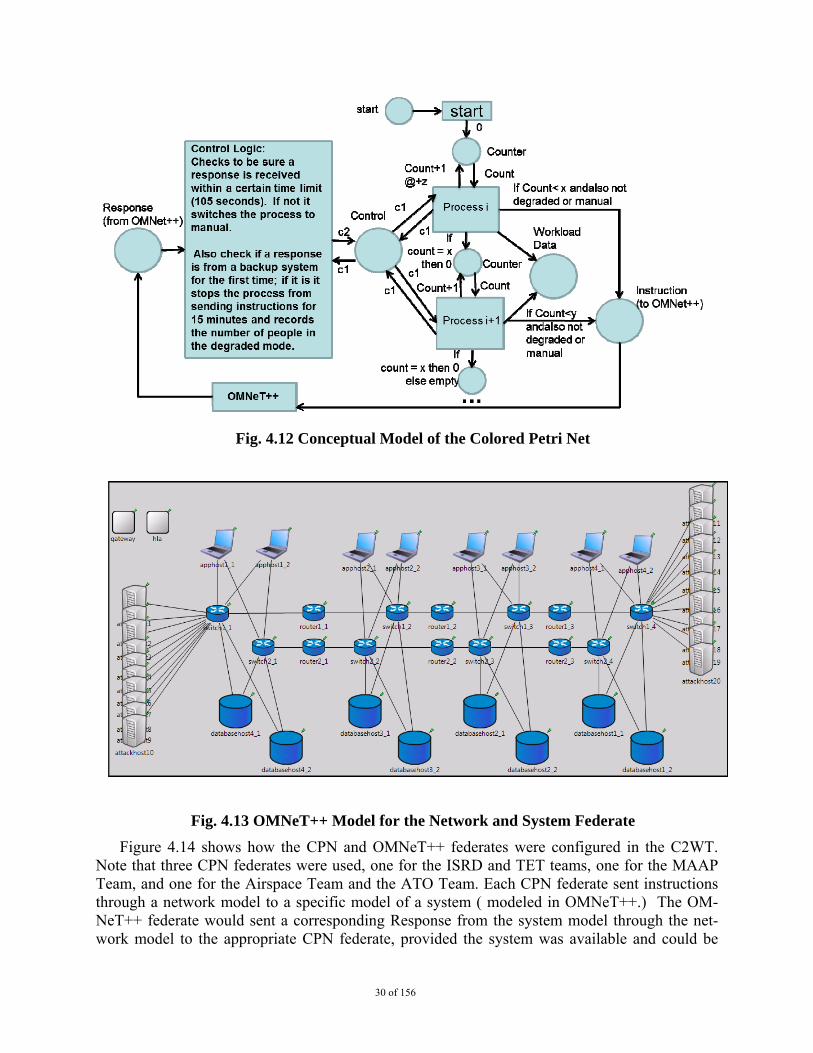
Figure 4.13 shows the OMNeT++ federate for the Dual System, Dual Network architecture. Similar models, with less structure, were created for the other architectures.
30 of 156
Fig. 4.12 Conceptual Model of the Colored Petri Net
Fig. 4.13 OMNeT++ Model for the Network and System Federate
Figure 4.14 shows how the CPN and OMNeT++ federates were configured in the C2WT. Note that three CPN federates were used, one for the ISRD and TET teams, one for the MAAP Team, and one for the Airspace Team and the ATO Team. Each CPN federate sent instructions through a network model to a specific model of a system ( modeled in OMNeT++.) The OM-NeT++ federate would sent a corresponding Response from the system model through the net-work model to the appropriate CPN federate, provided the system was available and could be
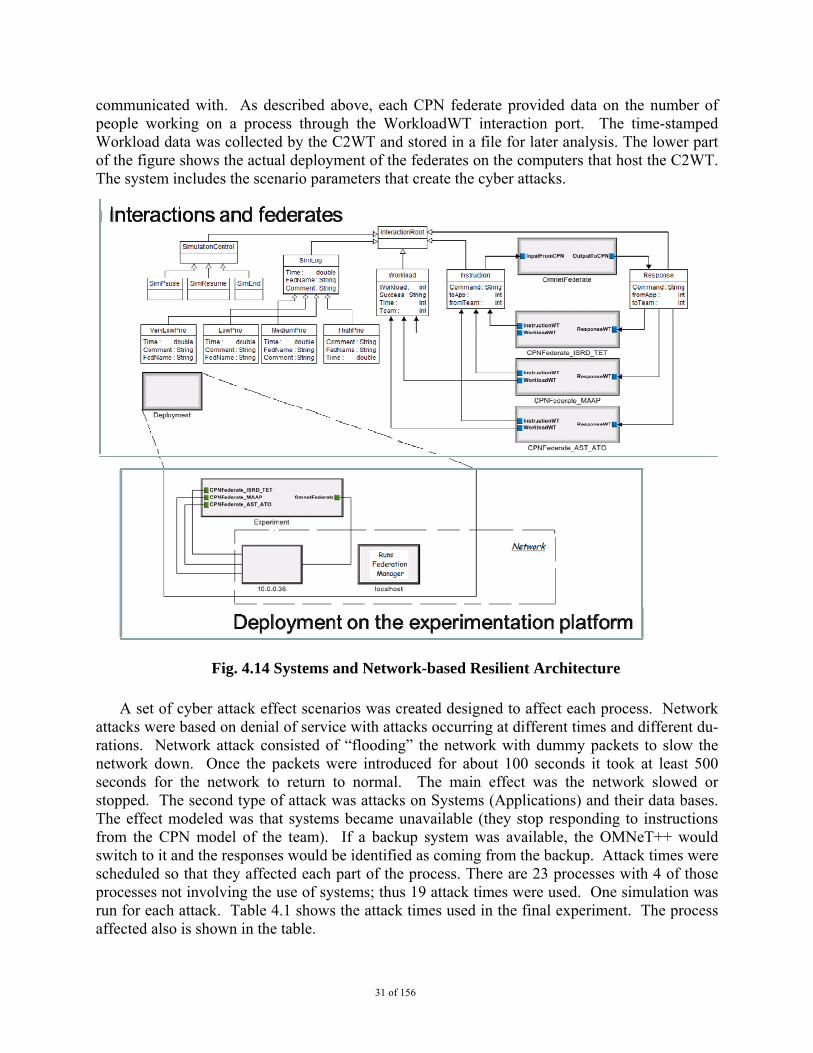
31 of 156
communicated with. As described above, each CPN federate provided data on the number of people working on a process through the WorkloadWT interaction port. The time-stamped Workload data was collected by the C2WT and stored in a file for later analysis. The lower part of the figure shows the actual deployment of the federates on the computers that host the C2WT. The system includes the scenario parameters that create the cyber attacks.
Fig. 4.14 Systems and Network-based Resilient Architecture
A set of cyber attack effect scenarios was created designed to affect each process. Network attacks were based on denial of service with attacks occurring at different times and different du-rations. Network attack consisted of “flooding” the network with dummy packets to slow the network down. Once the packets were introduced for about 100 seconds it took at least 500 seconds for the network to return to normal. The main effect was the network slowed or stopped. The second type of attack was attacks on Systems (Applications) and their data bases. The effect modeled was that systems became unavailable (they stop responding to instructions from the CPN model of the team). If a backup system was available, the OMNeT++ would switch to it and the responses would be identified as coming from the backup. Attack times were scheduled so that they affected each part of the process. There are 23 processes with 4 of those processes not involving the use of systems; thus 19 attack times were used. One simulation was run for each attack. Table 4.1 shows the attack times used in the final experiment. The process affected also is shown in the table.
32 of 156
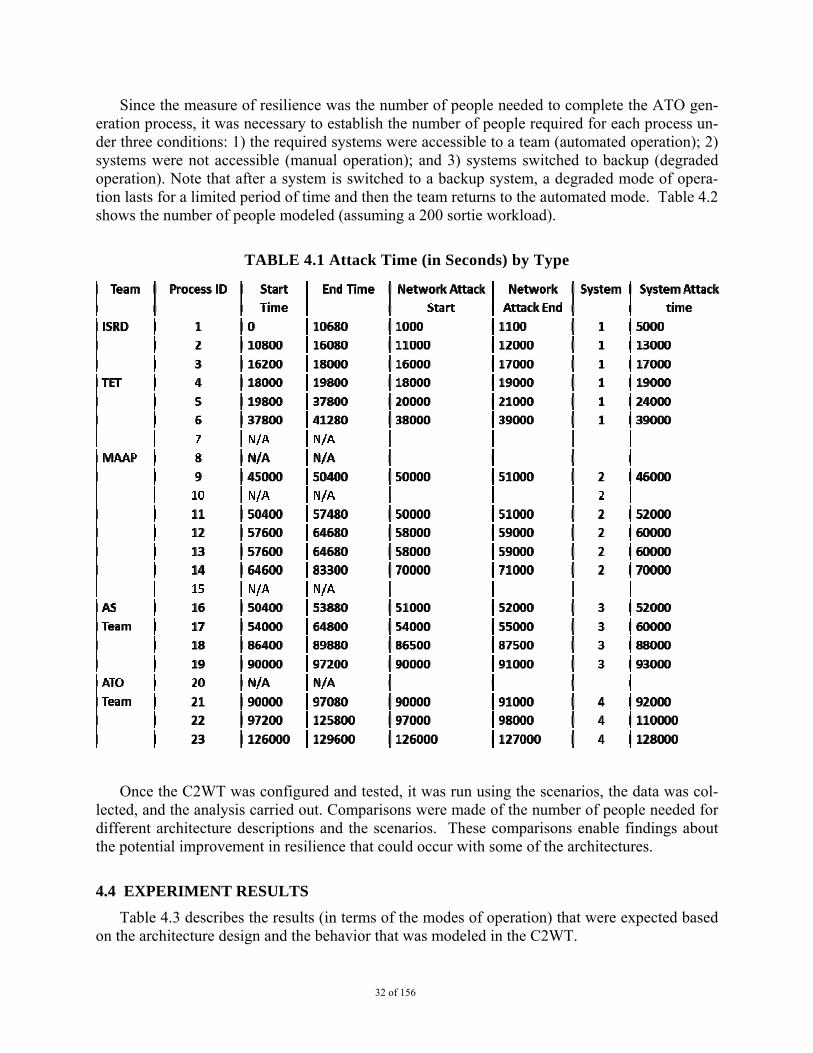
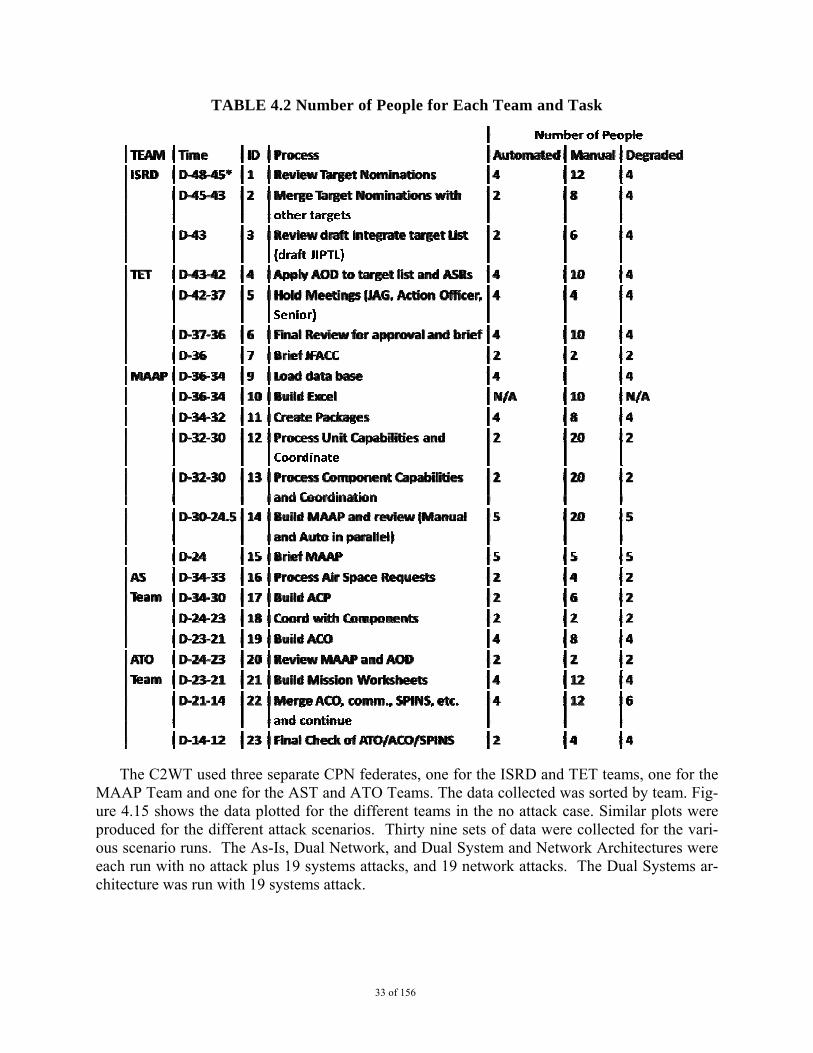
Since the measure of resilience was the number of people needed to complete the ATO gen-eration process, it was necessary to establish the number of people required for each process un-der three conditions: 1) the required systems were accessible to a team (automated operation); 2) systems were not accessible (manual operation); and 3) systems switched to backup (degraded operation). Note that after a system is switched to a backup system, a degraded mode of opera-tion lasts for a limited period of time and then the team returns to the automated mode. Table 4.2 shows the number of people modeled (assuming a 200 sortie workload).
TABLE 4.1 Attack Time (in Seconds) by Type
Once the C2WT was configured and tested, it was run using the scenarios, the data was col-lected, and the analysis carried out. Comparisons were made of the number of people needed for different architecture descriptions and the scenarios. These comparisons enable findings about the potential improvement in resilience that could occur with some of the architectures.
4.4 EXPERIMENT RESULTS
Table 4.3 describes the results (in terms of the modes of operation) that were expected based on the architecture design and the behavior that was modeled in the C2WT.
33 of 156
TABLE 4.2 Number of People for Each Team and Task
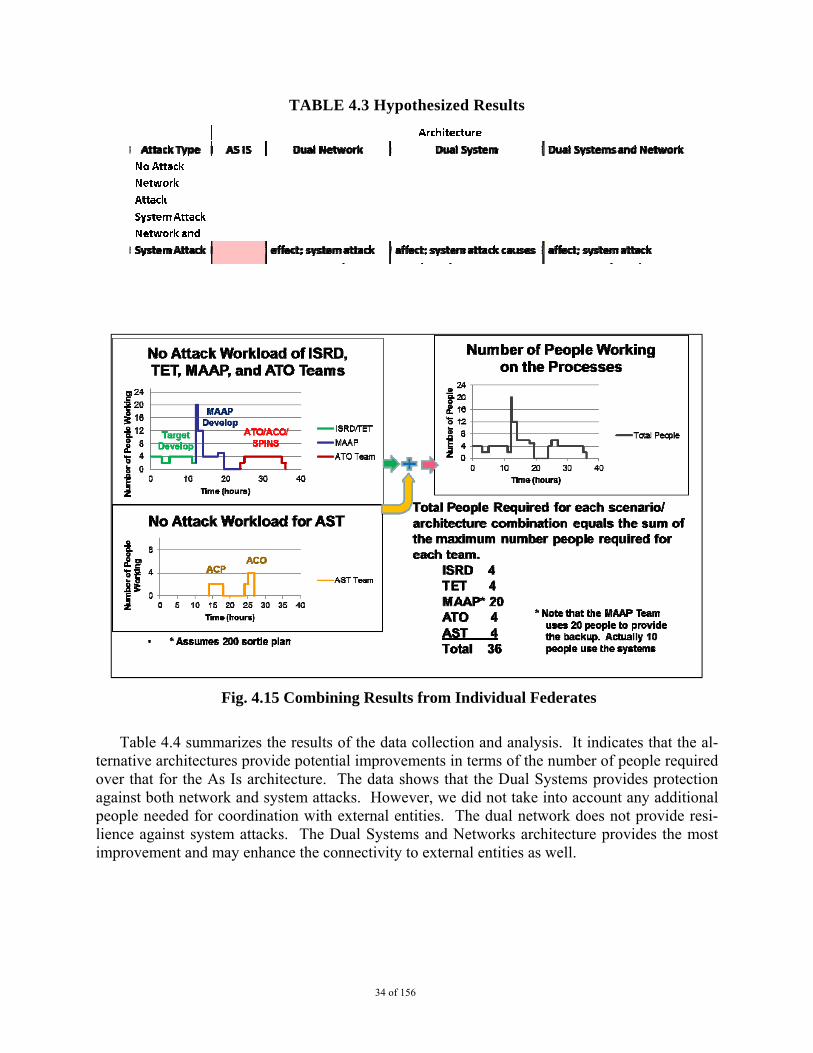
The C2WT used three separate CPN federates, one for the ISRD and TET teams, one for the MAAP Team and one for the AST and ATO Teams. The data collected was sorted by team. Fig-ure 4.15 shows the data plotted for the different teams in the no attack case. Similar plots were produced for the different attack scenarios. Thirty nine sets of data were collected for the vari-ous scenario runs. The As-Is, Dual Network, and Dual System and Network Architectures were each run with no attack plus 19 systems attacks, and 19 network attacks. The Dual Systems ar-chitecture was run with 19 systems attack.
34 of 156
TABLE 4.3 Hypothesized Results
Fig. 4.15 Combining Results from Individual Federates
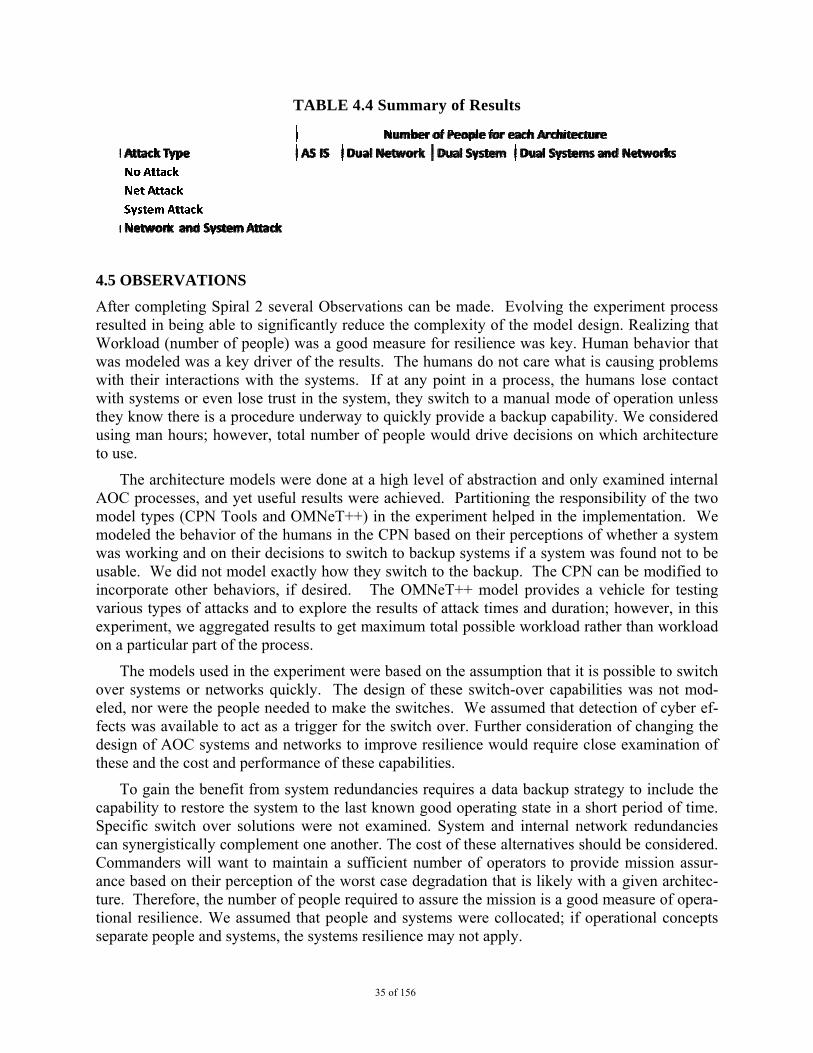
Table 4.4 summarizes the results of the data collection and analysis. It indicates that the al-ternative architectures provide potential improvements in terms of the number of people required over that for the As Is architecture. The data shows that the Dual Systems provides protection against both network and system attacks. However, we did not take into account any additional people needed for coordination with external entities. The dual network does not provide resi-lience against system attacks. The Dual Systems and Networks architecture provides the most improvement and may enhance the connectivity to external entities as well.
35 of 156
TABLE 4.4 Summary of Results
4.5 OBSERVATIONS
After completing Spiral 2 several Observations can be made. Evolving the experiment process resulted in being able to significantly reduce the complexity of the model design. Realizing that Workload (number of people) was a good measure for resilience was key. Human behavior that was modeled was a key driver of the results. The humans do not care what is causing problems with their interactions with the systems. If at any point in a process, the humans lose contact with systems or even lose trust in the system, they switch to a manual mode of operation unless they know there is a procedure underway to quickly provide a backup capability. We considered using man hours; however, total number of people would drive decisions on which architecture to use.
The architecture models were done at a high level of abstraction and only examined internal AOC processes, and yet useful results were achieved. Partitioning the responsibility of the two model types (CPN Tools and OMNeT++) in the experiment helped in the implementation. We modeled the behavior of the humans in the CPN based on their perceptions of whether a system was working and on their decisions to switch to backup systems if a system was found not to be usable. We did not model exactly how they switch to the backup. The CPN can be modified to incorporate other behaviors, if desired. The OMNeT++ model provides a vehicle for testing various types of attacks and to explore the results of attack times and duration; however, in this experiment, we aggregated results to get maximum total possible workload rather than workload on a particular part of the process.
The models used in the experiment were based on the assumption that it is possible to switch over systems or networks quickly. The design of these switch-over capabilities was not mod-eled, nor were the people needed to make the switches. We assumed that detection of cyber ef-fects was available to act as a trigger for the switch over. Further consideration of changing the design of AOC systems and networks to improve resilience would require close examination of these and the cost and performance of these capabilities.
To gain the benefit from system redundancies requires a data backup strategy to include the capability to restore the system to the last known good operating state in a short period of time. Specific switch over solutions were not examined. System and internal network redundancies can synergistically complement one another. The cost of these alternatives should be considered. Commanders will want to maintain a sufficient number of operators to provide mission assur-ance based on their perception of the worst case degradation that is likely with a given architec-ture. Therefore, the number of people required to assure the mission is a good measure of opera-tional resilience. We assumed that people and systems were collocated; if operational concepts separate people and systems, the systems resilience may not apply.
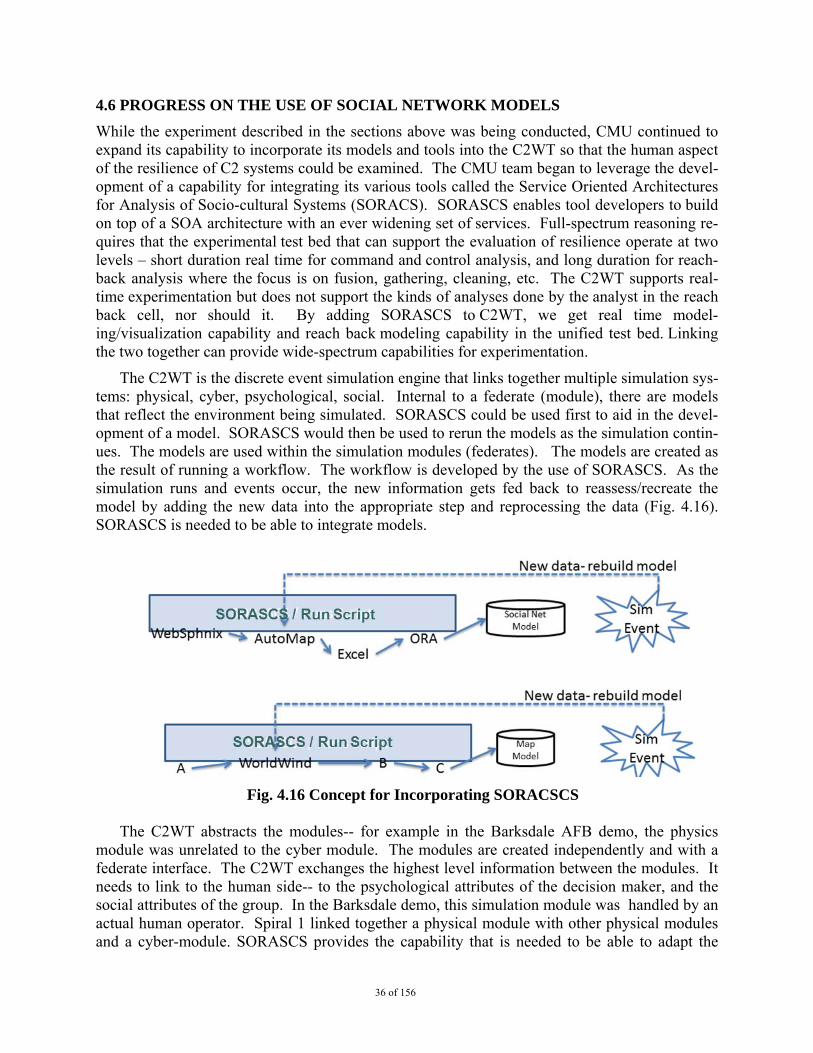
36 of 156
4.6 PROGRESS ON THE USE OF SOCIAL NETWORK MODELS
While the experiment described in the sections above was being conducted, CMU continued to expand its capability to incorporate its models and tools into the C2WT so that the human aspect of the resilience of C2 systems could be examined. The CMU team began to leverage the devel-opment of a capability for integrating its various tools called the Service Oriented Architectures for Analysis of Socio-cultural Systems (SORACS). SORASCS enables tool developers to build on top of a SOA architecture with an ever widening set of services. Full-spectrum reasoning re-quires that the experimental test bed that can support the evaluation of resilience operate at two levels – short duration real time for command and control analysis, and long duration for reach-back analysis where the focus is on fusion, gathering, cleaning, etc. The C2WT supports real-time experimentation but does not support the kinds of analyses done by the analyst in the reach back cell, nor should it. By adding SORASCS to C2WT, we get real time model-ing/visualization capability and reach back modeling capability in the unified test bed. Linking the two together can provide wide-spectrum capabilities for experimentation.
The C2WT is the discrete event simulation engine that links together multiple simulation sys-tems: physical, cyber, psychological, social. Internal to a federate (module), there are models that reflect the environment being simulated. SORASCS could be used first to aid in the devel-opment of a model. SORASCS would then be used to rerun the models as the simulation contin-ues. The models are used within the simulation modules (federates). The models are created as the result of running a workflow. The workflow is developed by the use of SORASCS. As the simulation runs and events occur, the new information gets fed back to reassess/recreate the model by adding the new data into the appropriate step and reprocessing the data (Fig. 4.16). SORASCS is needed to be able to integrate models.
Fig. 4.16 Concept for Incorporating SORACSCS The C2WT abstracts the modules-- for example in the Barksdale AFB demo, the physics
module was unrelated to the cyber module. The modules are created independently and with a federate interface. The C2WT exchanges the highest level information between the modules. It needs to link to the human side-- to the psychological attributes of the decision maker, and the social attributes of the group. In the Barksdale demo, this simulation module was handled by an actual human operator. Spiral 1 linked together a physical module with other physical modules and a cyber-module. SORASCS provides the capability that is needed to be able to adapt the
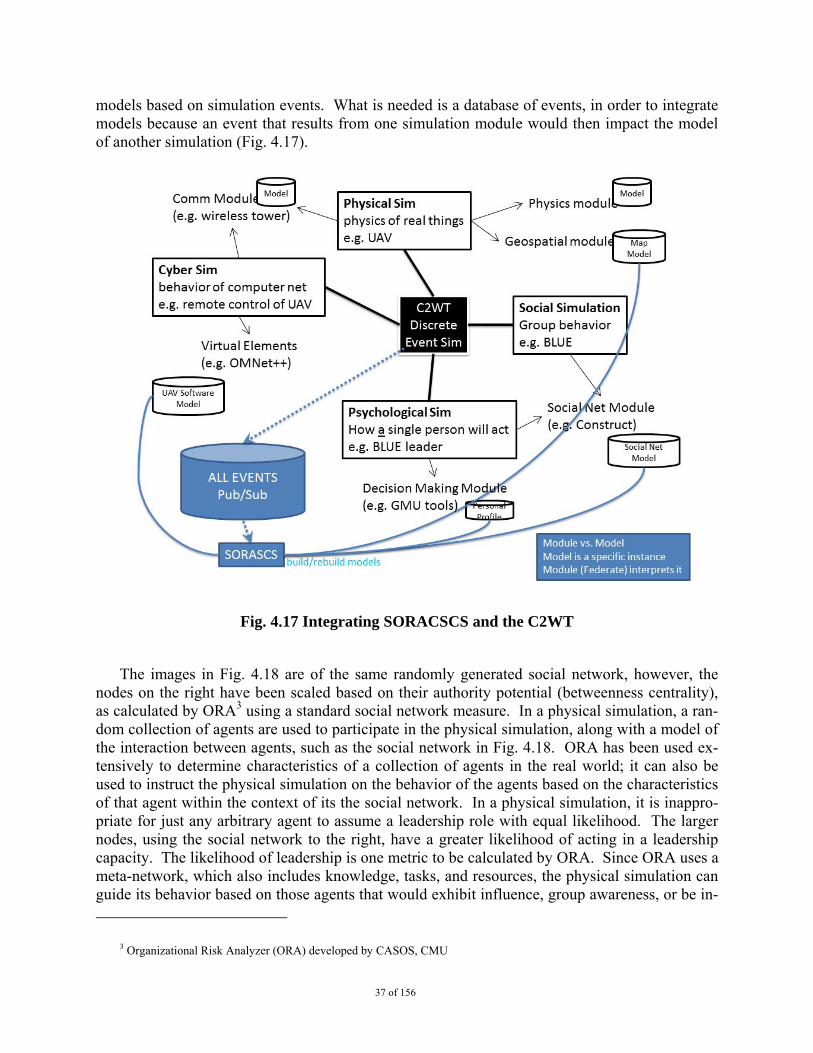
37 of 156
models based on simulation events. What is needed is a database of events, in order to integrate models because an event that results from one simulation module would then impact the model of another simulation (Fig. 4.17).
Fig. 4.17 Integrating SORACSCS and the C2WT
The images in Fig. 4.18 are of the same randomly generated social network, however, the nodes on the right have been scaled based on their authority potential (betweenness centrality), as calculated by ORA3 using a standard social network measure. In a physical simulation, a ran-dom collection of agents are used to participate in the physical simulation, along with a model of the interaction between agents, such as the social network in Fig. 4.18. ORA has been used ex-tensively to determine characteristics of a collection of agents in the real world; it can also be used to instruct the physical simulation on the behavior of the agents based on the characteristics of that agent within the context of its the social network. In a physical simulation, it is inappro-priate for just any arbitrary agent to assume a leadership role with equal likelihood. The larger nodes, using the social network to the right, have a greater likelihood of acting in a leadership capacity. The likelihood of leadership is one metric to be calculated by ORA. Since ORA uses a meta-network, which also includes knowledge, tasks, and resources, the physical simulation can guide its behavior based on those agents that would exhibit influence, group awareness, or be in-
3 Organizational Risk Analyzer (ORA) developed by CASOS, CMU
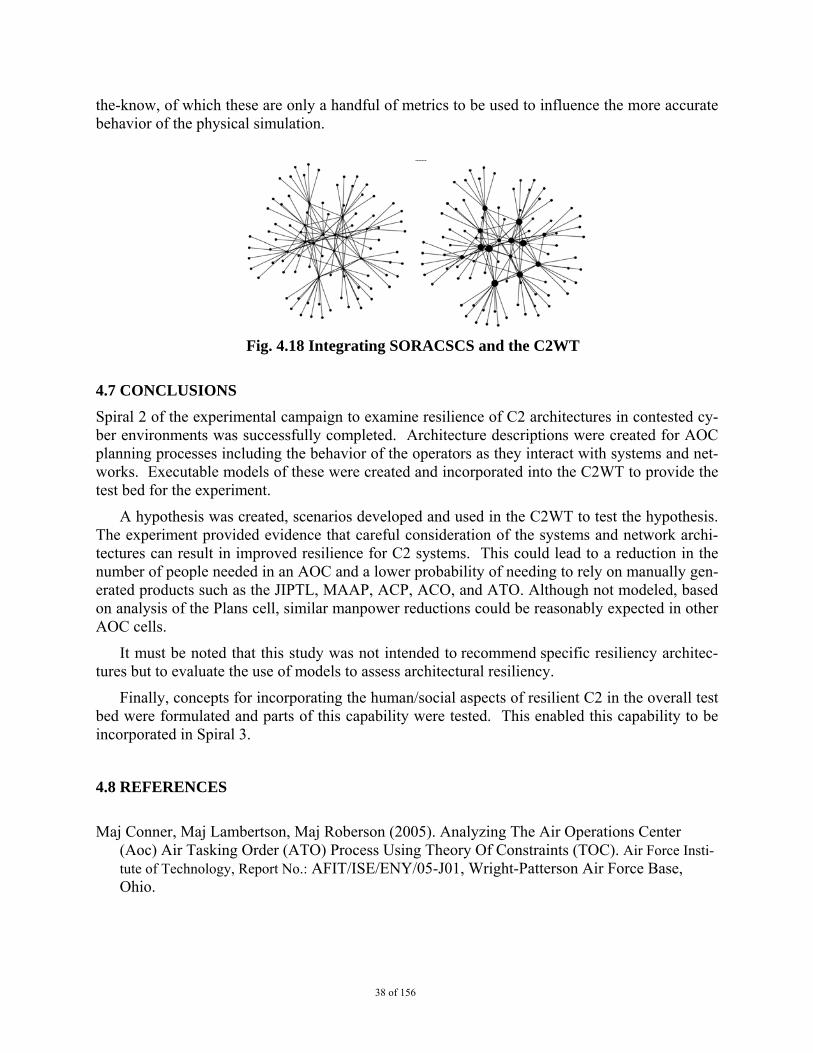
38 of 156
the-know, of which these are only a handful of metrics to be used to influence the more accurate behavior of the physical simulation.
Fig. 4.18 Integrating SORACSCS and the C2WT
4.7 CONCLUSIONS
Spiral 2 of the experimental campaign to examine resilience of C2 architectures in contested cy-ber environments was successfully completed. Architecture descriptions were created for AOC planning processes including the behavior of the operators as they interact with systems and net-works. Executable models of these were created and incorporated into the C2WT to provide the test bed for the experiment.
A hypothesis was created, scenarios developed and used in the C2WT to test the hypothesis. The experiment provided evidence that careful consideration of the systems and network archi-tectures can result in improved resilience for C2 systems. This could lead to a reduction in the number of people needed in an AOC and a lower probability of needing to rely on manually gen-erated products such as the JIPTL, MAAP, ACP, ACO, and ATO. Although not modeled, based on analysis of the Plans cell, similar manpower reductions could be reasonably expected in other AOC cells.
It must be noted that this study was not intended to recommend specific resiliency architec-tures but to evaluate the use of models to assess architectural resiliency.
Finally, concepts for incorporating the human/social aspects of resilient C2 in the overall test bed were formulated and parts of this capability were tested. This enabled this capability to be incorporated in Spiral 3.
4.8 REFERENCES
Maj Conner, Maj Lambertson, Maj Roberson (2005). Analyzing The Air Operations Center
(Aoc) Air Tasking Order (ATO) Process Using Theory Of Constraints (TOC). Air Force Insti-tute of Technology, Report No.: AFIT/ISE/ENY/05-J01, Wright-Patterson Air Force Base, Ohio.
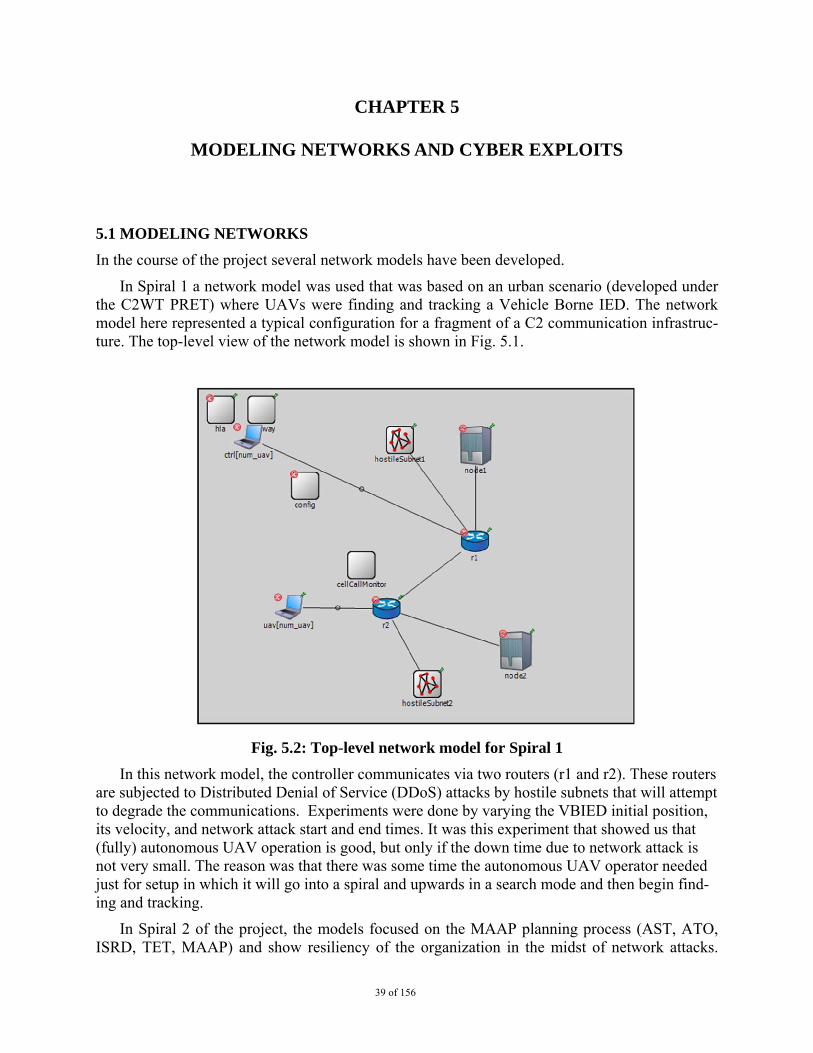
39 of 156
CHAPTER 5
MODELING NETWORKS AND CYBER EXPLOITS
5.1 MODELING NETWORKS
In the course of the project several network models have been developed.
In Spiral 1 a network model was used that was based on an urban scenario (developed under the C2WT PRET) where UAVs were finding and tracking a Vehicle Borne IED. The network model here represented a typical configuration for a fragment of a C2 communication infrastruc-ture. The top-level view of the network model is shown in Fig. 5.1.
Fig. 5.2: Top-level network model for Spiral 1 In this network model, the controller communicates via two routers (r1 and r2). These routers
are subjected to Distributed Denial of Service (DDoS) attacks by hostile subnets that will attempt to degrade the communications. Experiments were done by varying the VBIED initial position, its velocity, and network attack start and end times. It was this experiment that showed us that (fully) autonomous UAV operation is good, but only if the down time due to network attack is not very small. The reason was that there was some time the autonomous UAV operator needed just for setup in which it will go into a spiral and upwards in a search mode and then begin find-ing and tracking.
In Spiral 2 of the project, the models focused on the MAAP planning process (AST, ATO, ISRD, TET, MAAP) and show resiliency of the organization in the midst of network attacks.
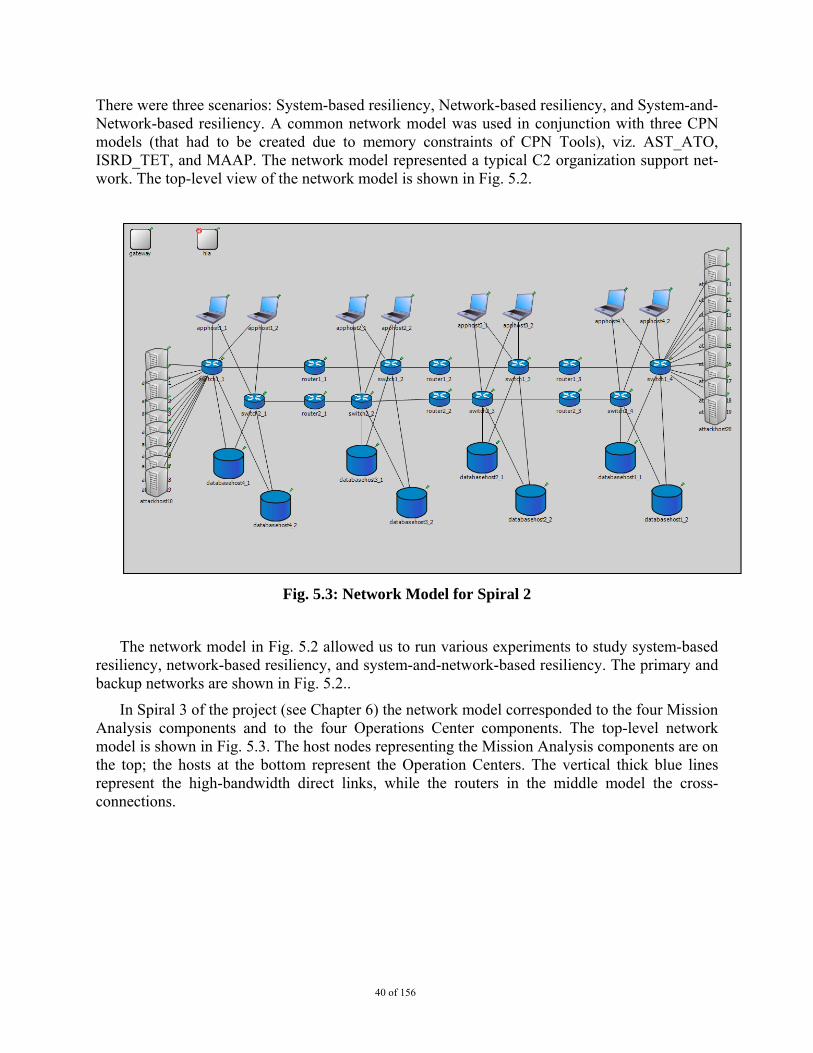
40 of 156
There were three scenarios: System-based resiliency, Network-based resiliency, and System-and-Network-based resiliency. A common network model was used in conjunction with three CPN models (that had to be created due to memory constraints of CPN Tools), viz. AST_ATO, ISRD_TET, and MAAP. The network model represented a typical C2 organization support net-work. The top-level view of the network model is shown in Fig. 5.2.
Fig. 5.3: Network Model for Spiral 2
The network model in Fig. 5.2 allowed us to run various experiments to study system-based resiliency, network-based resiliency, and system-and-network-based resiliency. The primary and backup networks are shown in Fig. 5.2..
In Spiral 3 of the project (see Chapter 6) the network model corresponded to the four Mission Analysis components and to the four Operations Center components. The top-level network model is shown in Fig. 5.3. The host nodes representing the Mission Analysis components are on the top; the hosts at the bottom represent the Operation Centers. The vertical thick blue lines represent the high-bandwidth direct links, while the routers in the middle model the cross-connections.
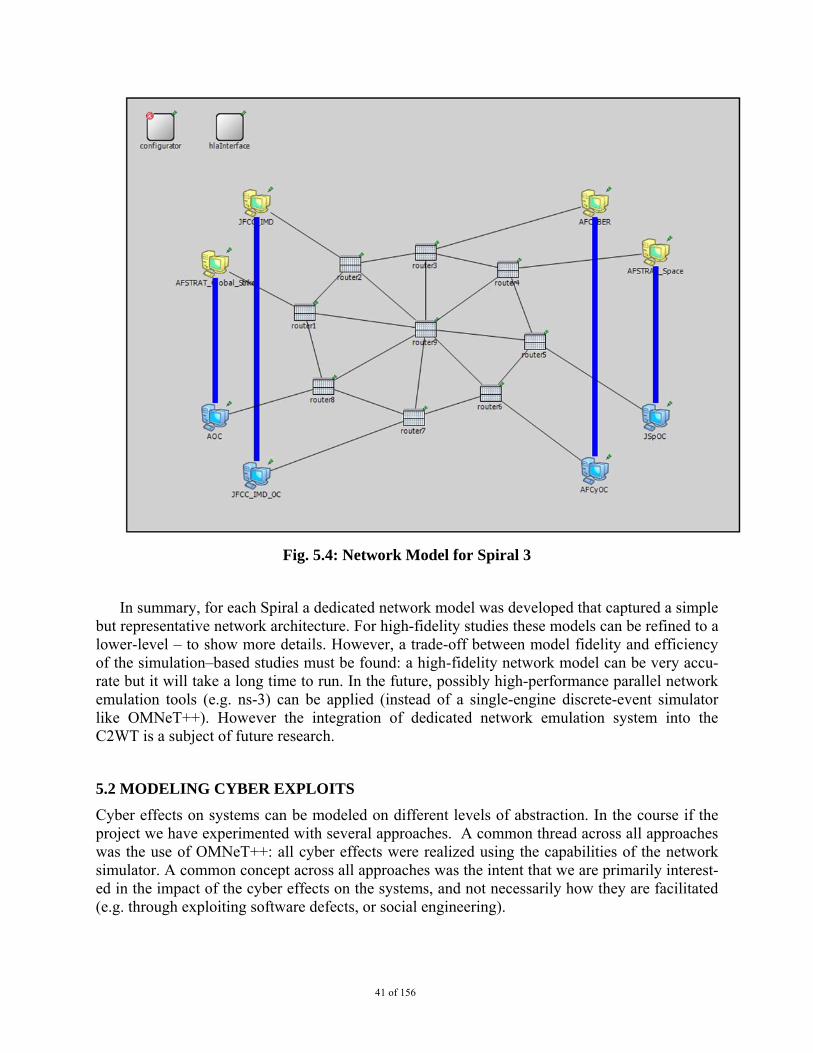
41 of 156
Fig. 5.4: Network Model for Spiral 3
In summary, for each Spiral a dedicated network model was developed that captured a simple but representative network architecture. For high-fidelity studies these models can be refined to a lower-level – to show more details. However, a trade-off between model fidelity and efficiency of the simulation–based studies must be found: a high-fidelity network model can be very accu-rate but it will take a long time to run. In the future, possibly high-performance parallel network emulation tools (e.g. ns-3) can be applied (instead of a single-engine discrete-event simulator like OMNeT++). However the integration of dedicated network emulation system into the C2WT is a subject of future research.
5.2 MODELING CYBER EXPLOITS
Cyber effects on systems can be modeled on different levels of abstraction. In the course if the project we have experimented with several approaches. A common thread across all approaches was the use of OMNeT++: all cyber effects were realized using the capabilities of the network simulator. A common concept across all approaches was the intent that we are primarily interest-ed in the impact of the cyber effects on the systems, and not necessarily how they are facilitated (e.g. through exploiting software defects, or social engineering).
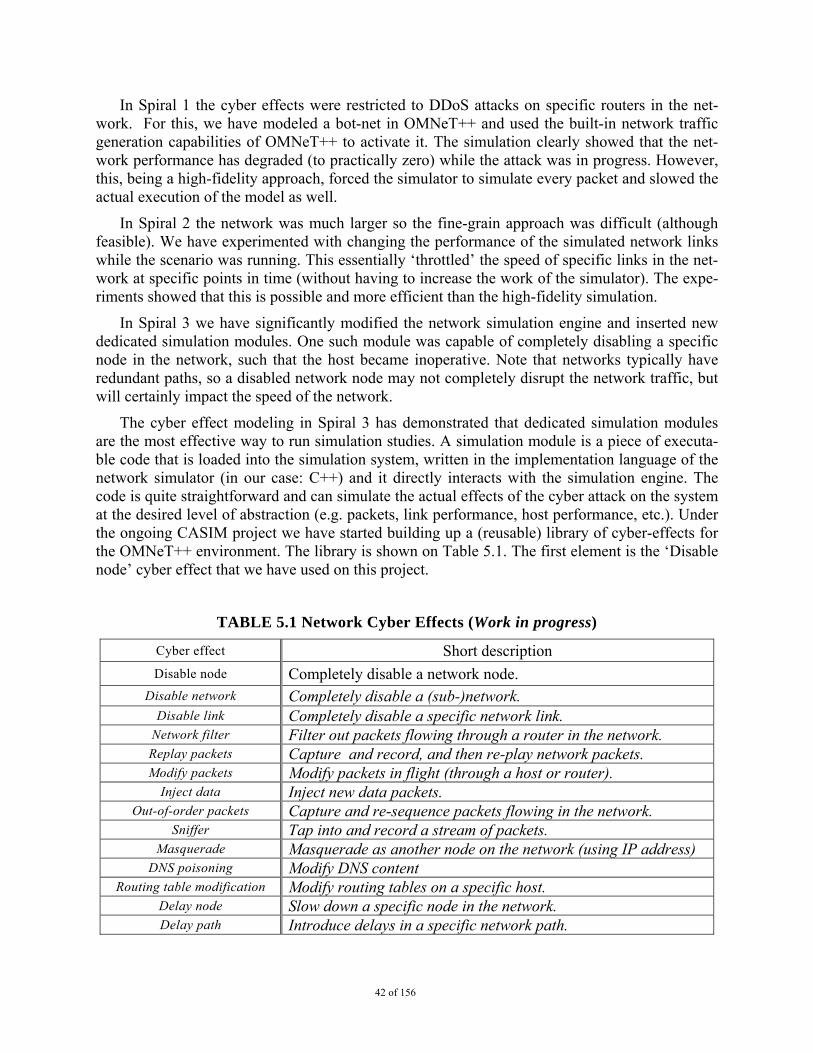
42 of 156
In Spiral 1 the cyber effects were restricted to DDoS attacks on specific routers in the net-work. For this, we have modeled a bot-net in OMNeT++ and used the built-in network traffic generation capabilities of OMNeT++ to activate it. The simulation clearly showed that the net-work performance has degraded (to practically zero) while the attack was in progress. However, this, being a high-fidelity approach, forced the simulator to simulate every packet and slowed the actual execution of the model as well.
In Spiral 2 the network was much larger so the fine-grain approach was difficult (although feasible). We have experimented with changing the performance of the simulated network links while the scenario was running. This essentially ‘throttled’ the speed of specific links in the net-work at specific points in time (without having to increase the work of the simulator). The expe-riments showed that this is possible and more efficient than the high-fidelity simulation.
In Spiral 3 we have significantly modified the network simulation engine and inserted new dedicated simulation modules. One such module was capable of completely disabling a specific node in the network, such that the host became inoperative. Note that networks typically have redundant paths, so a disabled network node may not completely disrupt the network traffic, but will certainly impact the speed of the network.
The cyber effect modeling in Spiral 3 has demonstrated that dedicated simulation modules are the most effective way to run simulation studies. A simulation module is a piece of executa-ble code that is loaded into the simulation system, written in the implementation language of the network simulator (in our case: C++) and it directly interacts with the simulation engine. The code is quite straightforward and can simulate the actual effects of the cyber attack on the system at the desired level of abstraction (e.g. packets, link performance, host performance, etc.). Under the ongoing CASIM project we have started building up a (reusable) library of cyber-effects for the OMNeT++ environment. The library is shown on Table 5.1. The first element is the ‘Disable node’ cyber effect that we have used on this project.
TABLE 5.1 Network Cyber Effects (Work in progress)
Cyber effect Short description Disable node Completely disable a network node.
Disable network Completely disable a (sub-)network. Disable link Completely disable a specific network link.
Network filter Filter out packets flowing through a router in the network. Replay packets Capture and record, and then re-play network packets. Modify packets Modify packets in flight (through a host or router).
Inject data Inject new data packets. Out-of-order packets Capture and re-sequence packets flowing in the network.
Sniffer Tap into and record a stream of packets. Masquerade Masquerade as another node on the network (using IP address)
DNS poisoning Modify DNS content Routing table modification Modify routing tables on a specific host.
Delay node Slow down a specific node in the network. Delay path Introduce delays in a specific network path.

43 of 156
In summary, we have learned that modeling cyber effects requires careful planning and effec-tive implementation. One can simulate cyber effect on very low-level, but it is going to be very (computationally) expensive, or on very high-level but then accuracy suffers. During the three Spirals we have experimented with various techniques, and argue that the last approach (i.e. add-ing simulation modules to the network simulator) is the most effective and flexible, as it does allow making trade-offs between accuracy and efficiency. On a related on-going project, we are working on a highly flexible and reusable library that implements these cyber effects.

44 of 156
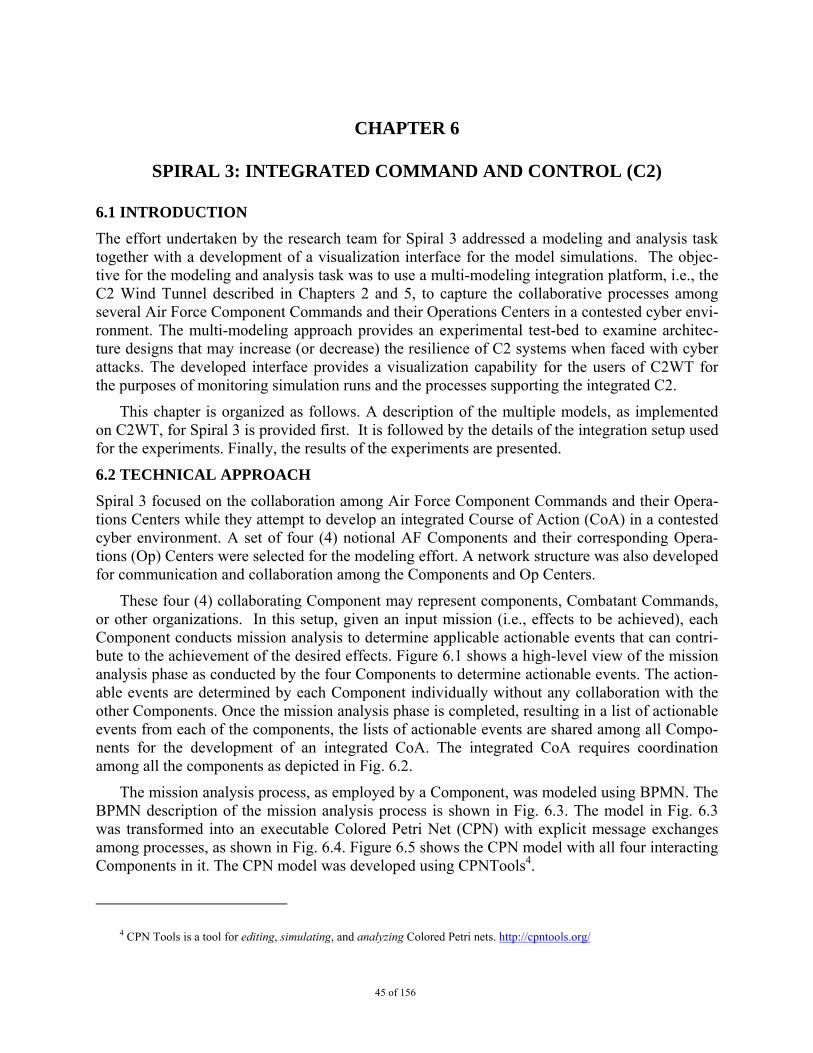
45 of 156
CHAPTER 6
SPIRAL 3: INTEGRATED COMMAND AND CONTROL (C2)
6.1 INTRODUCTION
The effort undertaken by the research team for Spiral 3 addressed a modeling and analysis task together with a development of a visualization interface for the model simulations. The objec-tive for the modeling and analysis task was to use a multi-modeling integration platform, i.e., the C2 Wind Tunnel described in Chapters 2 and 5, to capture the collaborative processes among several Air Force Component Commands and their Operations Centers in a contested cyber envi-ronment. The multi-modeling approach provides an experimental test-bed to examine architec-ture designs that may increase (or decrease) the resilience of C2 systems when faced with cyber attacks. The developed interface provides a visualization capability for the users of C2WT for the purposes of monitoring simulation runs and the processes supporting the integrated C2.
This chapter is organized as follows. A description of the multiple models, as implemented on C2WT, for Spiral 3 is provided first. It is followed by the details of the integration setup used for the experiments. Finally, the results of the experiments are presented.
6.2 TECHNICAL APPROACH
Spiral 3 focused on the collaboration among Air Force Component Commands and their Opera-tions Centers while they attempt to develop an integrated Course of Action (CoA) in a contested cyber environment. A set of four (4) notional AF Components and their corresponding Opera-tions (Op) Centers were selected for the modeling effort. A network structure was also developed for communication and collaboration among the Components and Op Centers.
These four (4) collaborating Component may represent components, Combatant Commands, or other organizations. In this setup, given an input mission (i.e., effects to be achieved), each Component conducts mission analysis to determine applicable actionable events that can contri-bute to the achievement of the desired effects. Figure 6.1 shows a high-level view of the mission analysis phase as conducted by the four Components to determine actionable events. The action-able events are determined by each Component individually without any collaboration with the other Components. Once the mission analysis phase is completed, resulting in a list of actionable events from each of the components, the lists of actionable events are shared among all Compo-nents for the development of an integrated CoA. The integrated CoA requires coordination among all the components as depicted in Fig. 6.2.
The mission analysis process, as employed by a Component, was modeled using BPMN. The BPMN description of the mission analysis process is shown in Fig. 6.3. The model in Fig. 6.3 was transformed into an executable Colored Petri Net (CPN) with explicit message exchanges among processes, as shown in Fig. 6.4. Figure 6.5 shows the CPN model with all four interacting Components in it. The CPN model was developed using CPNTools4.
4 CPN Tools is a tool for editing, simulating, and analyzing Colored Petri nets. http://cpntools.org/
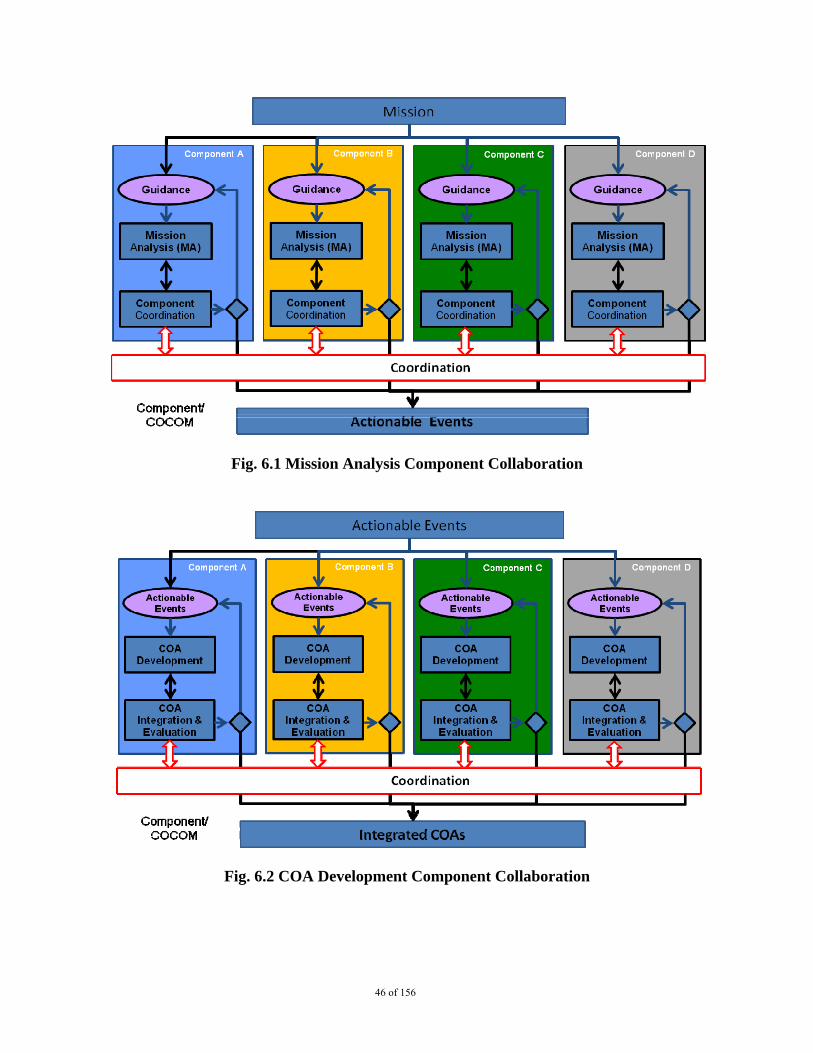
46 of 156
Fig. 6.1 Mission Analysis Component Collaboration
Fig. 6.2 COA Development Component Collaboration
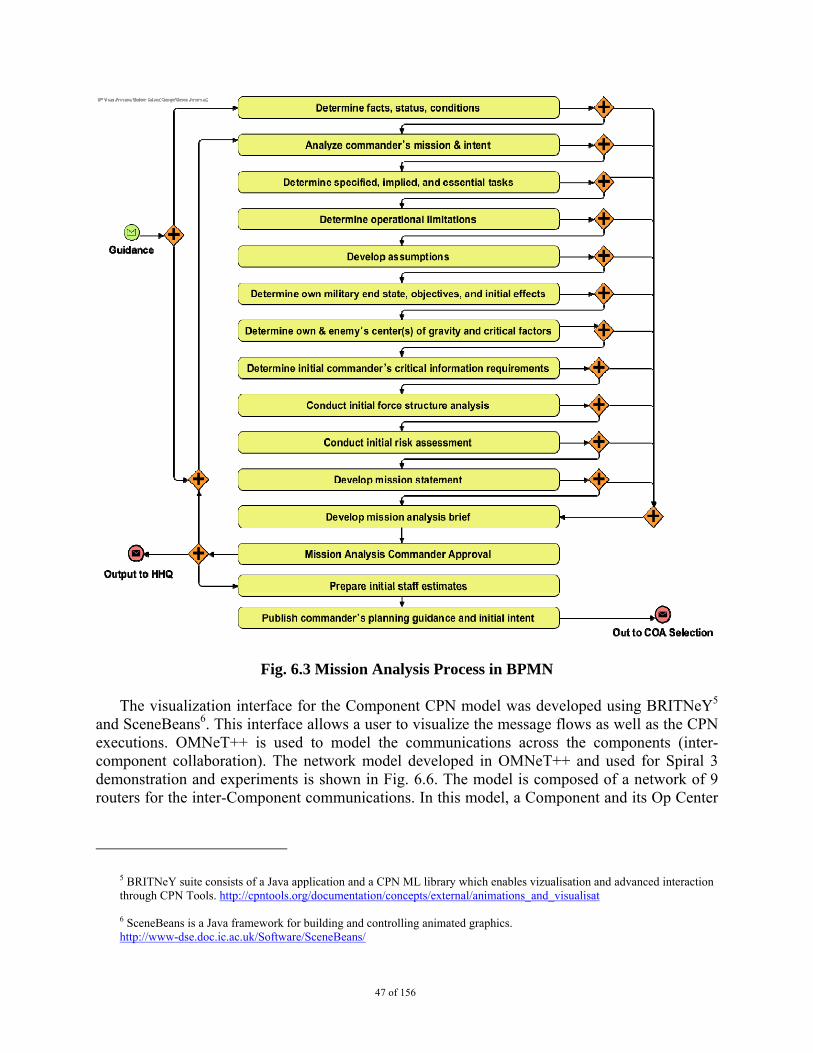
47 of 156
Fig. 6.3 Mission Analysis Process in BPMN
The visualization interface for the Component CPN model was developed using BRITNeY5 and SceneBeans6. This interface allows a user to visualize the message flows as well as the CPN executions. OMNeT++ is used to model the communications across the components (inter-component collaboration). The network model developed in OMNeT++ and used for Spiral 3 demonstration and experiments is shown in Fig. 6.6. The model is composed of a network of 9 routers for the inter-Component communications. In this model, a Component and its Op Center
5 BRITNeY suite consists of a Java application and a CPN ML library which enables vizualisation and advanced interaction through CPN Tools. http://cpntools.org/documentation/concepts/external/animations_and_visualisat 6 SceneBeans is a Java framework for building and controlling animated graphics. http://www-dse.doc.ic.ac.uk/Software/SceneBeans/
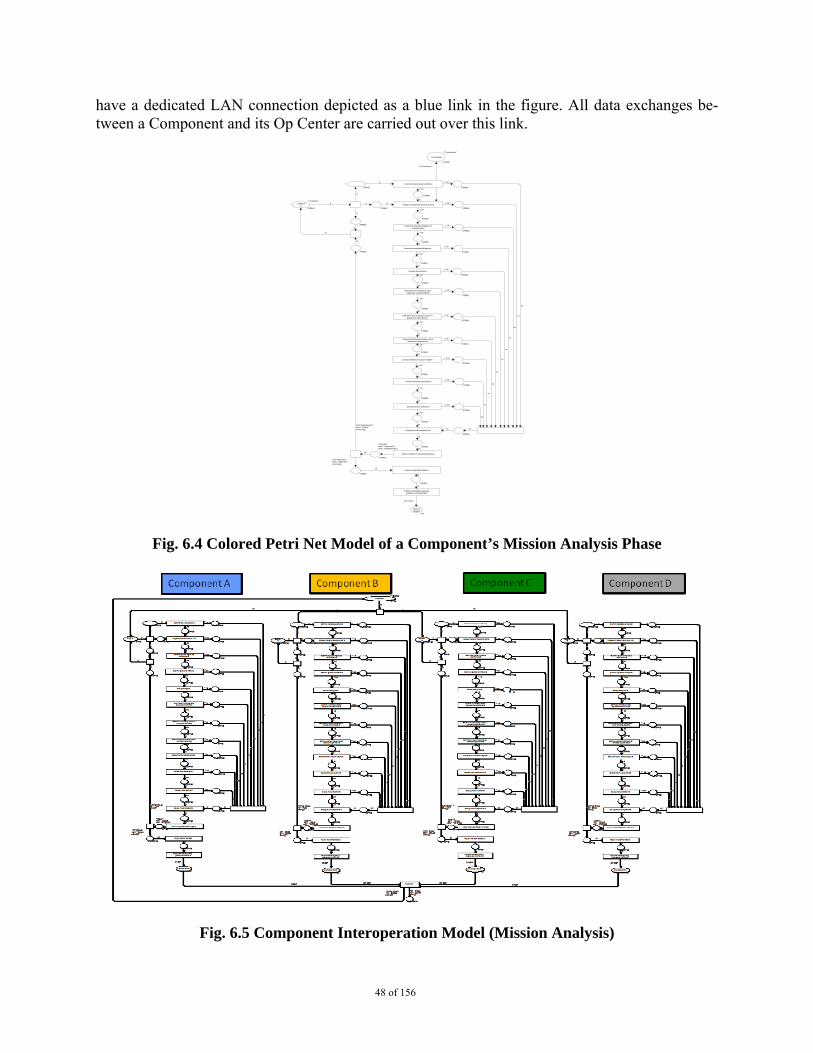
48 of 156
have a dedicated LAN connection depicted as a blue link in the figure. All data exchanges be-tween a Component and its Op Center are carried out over this link.
Fig. 6.4 Colored Petri Net Model of a Component’s Mission Analysis Phase
Fig. 6.5 Component Interoperation Model (Mission Analysis)
g
g
1`"ok"
1`"ok"
1`"ok"
1`"ok"
1`"ok"
1 "̀ok"
1`"ok"
1`"ok"
1`"ok"
1`"ok"
1`"ok"
1`"ok"
1`"ok"
1`"ok"
1`"ok"
1`"ok"
1`"ok"
1`"ok"
1`"Coordination"
1`"ok"
1`"ok"
1 "̀ok"
1`"ok"
g
g
(str,"CCIR")
g
g
str
if str="NotApproved"then 1`"Revise"else empty
gg
str
str
str
if str="Approved"then 1`"Approved"else empty
str
if aresult=1then 1 (̀"Approved")else 1 (̀"NotApproved") str
str
str str
str
str
str
str
str
str
str
str
str
str
str
str
str
str
str
str
str
str
str
str
str
str
Determine own & enemys centers of gravity and critical factors
Publish commanders planning guidance and initial intent
Prepare initial staff estimates
Mission Analysis Commander Approval
Develop mission analysis brief
Develop mission statement
Conduct initial risk assessment
Conduct initial force structure analysis
Determine initial commanders critical information requirements
determine own military end state objectives and initial effects
Develop assumptions
Determine operational limitations
Determine specified implied and essential tasks
Analyze commanders mission & intent
Determine facts status conditions
STRING
STRING
STRING
STRING
STRING
STRING
STRING
STRING
STRING
STRING
STRING
STRING
STRING
STRING
STRING
STRING
STRING
STRING
STRING
STRING
STRING
STRING
STRING
STRING
STRING
STRING
STRING
STRING
STRING
STRING
STRING
MissionAnalysis
MA
GuidanceA
1`"Guidance"
STRING
Coordination
1 "̀Coordination"
STRING
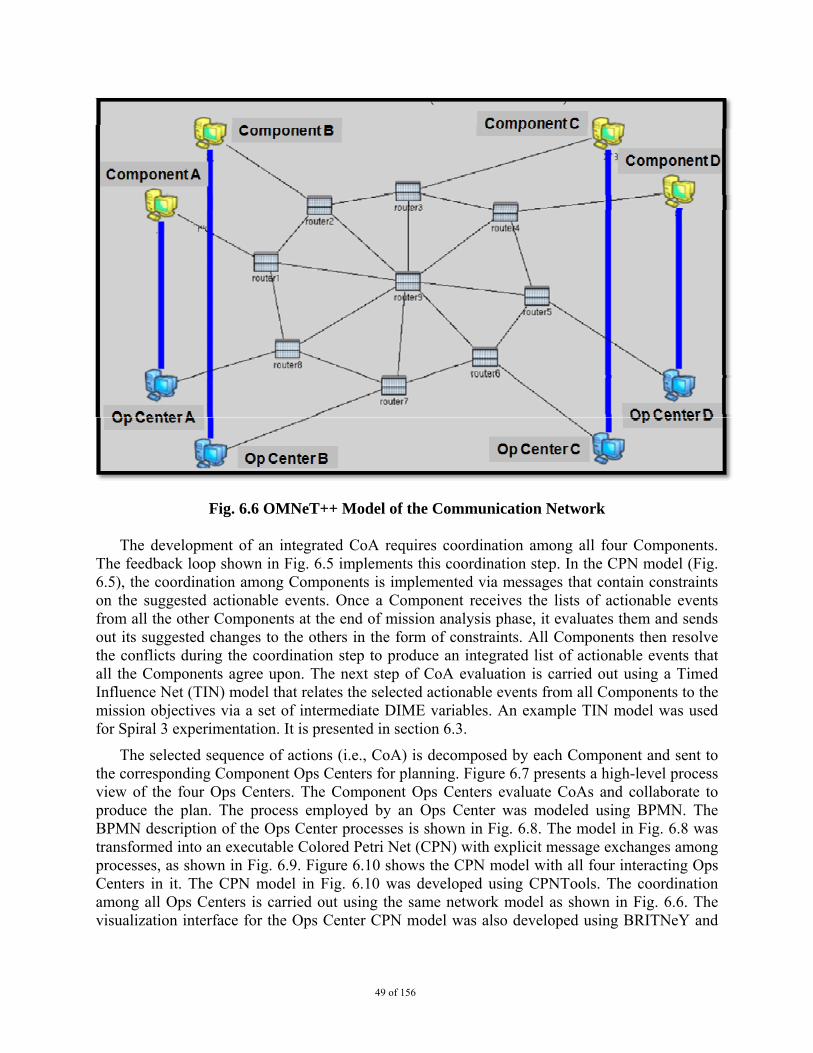
49 of 156
Fig. 6.6 OMNeT++ Model of the Communication Network
The development of an integrated CoA requires coordination among all four Components. The feedback loop shown in Fig. 6.5 implements this coordination step. In the CPN model (Fig. 6.5), the coordination among Components is implemented via messages that contain constraints on the suggested actionable events. Once a Component receives the lists of actionable events from all the other Components at the end of mission analysis phase, it evaluates them and sends out its suggested changes to the others in the form of constraints. All Components then resolve the conflicts during the coordination step to produce an integrated list of actionable events that all the Components agree upon. The next step of CoA evaluation is carried out using a Timed Influence Net (TIN) model that relates the selected actionable events from all Components to the mission objectives via a set of intermediate DIME variables. An example TIN model was used for Spiral 3 experimentation. It is presented in section 6.3.
The selected sequence of actions (i.e., CoA) is decomposed by each Component and sent to the corresponding Component Ops Centers for planning. Figure 6.7 presents a high-level process view of the four Ops Centers. The Component Ops Centers evaluate CoAs and collaborate to produce the plan. The process employed by an Ops Center was modeled using BPMN. The BPMN description of the Ops Center processes is shown in Fig. 6.8. The model in Fig. 6.8 was transformed into an executable Colored Petri Net (CPN) with explicit message exchanges among processes, as shown in Fig. 6.9. Figure 6.10 shows the CPN model with all four interacting Ops Centers in it. The CPN model in Fig. 6.10 was developed using CPNTools. The coordination among all Ops Centers is carried out using the same network model as shown in Fig. 6.6. The visualization interface for the Ops Center CPN model was also developed using BRITNeY and
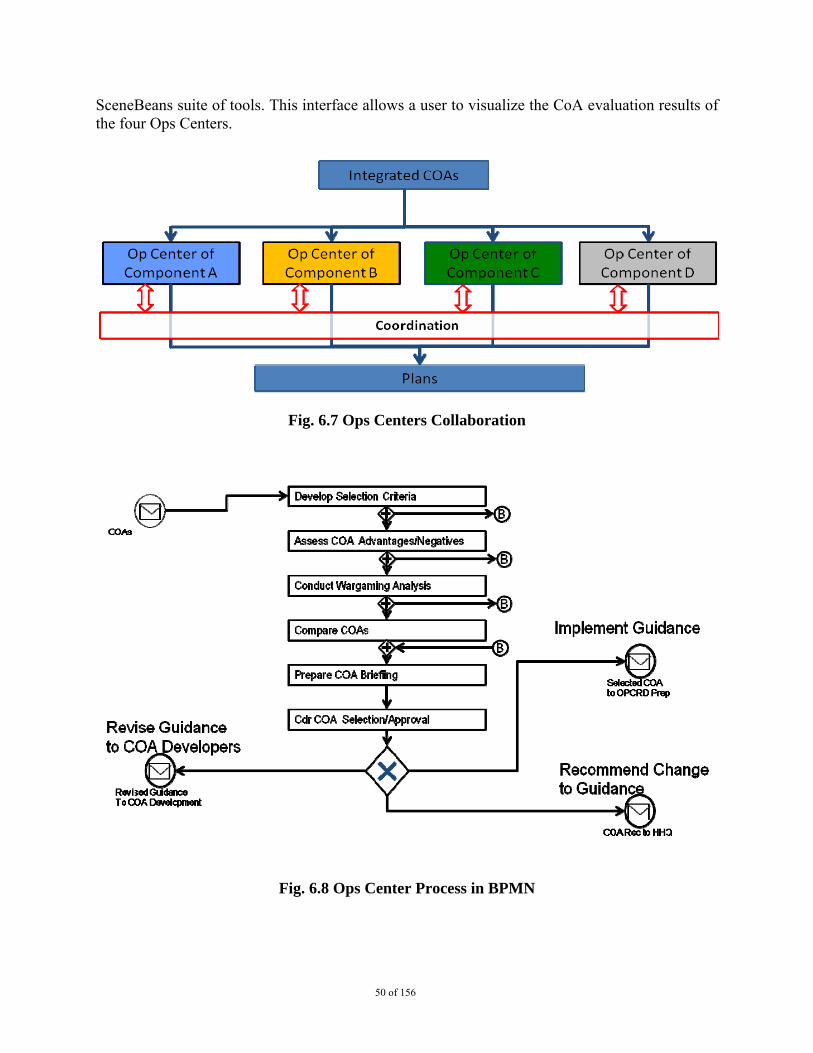
50 of 156
SceneBeans suite of tools. This interface allows a user to visualize the CoA evaluation results of the four Ops Centers.
Fig. 6.7 Ops Centers Collaboration
Fig. 6.8 Ops Center Process in BPMN
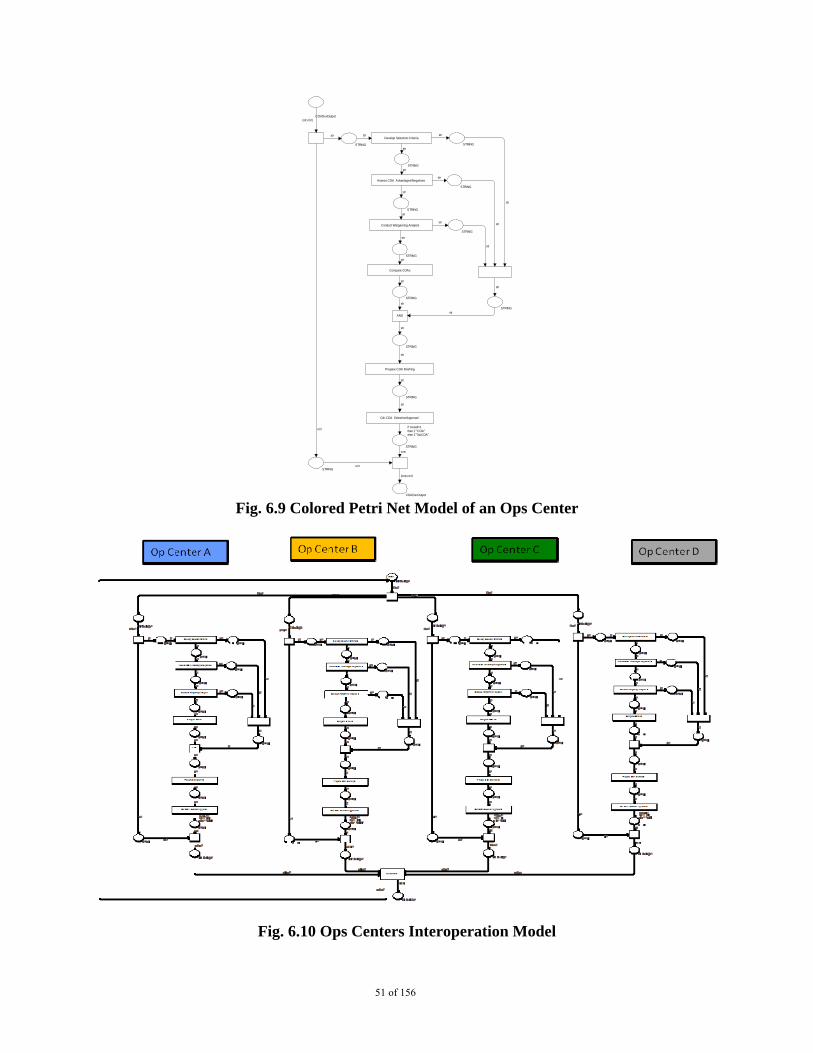
51 of 156
Fig. 6.9 Colored Petri Net Model of an Ops Center
Fig. 6.10 Ops Centers Interoperation Model
(coa,ccir)
(str,ccir)
ccir
coa
if cresult=1then 1`"COA"else 1`"NoCOA"
ccir
strstr
str
str
str
str
str
str
str
str
str
str
str
str
str
str
Cdr COA Selection/Approval
Prepare COA Briefiing
AND
Compare COAs
Conduct Wargaming Analysis
Assess COA Advantages/Negatives
Develop Selection Criteria
COADevOutpot
STRING
STRING
STRING
STRING
STRING
STRING
STRING
STRING
STRING
STRING
STRING
STRING
STRING
COADevOutpot
str
str
str
str
str
str
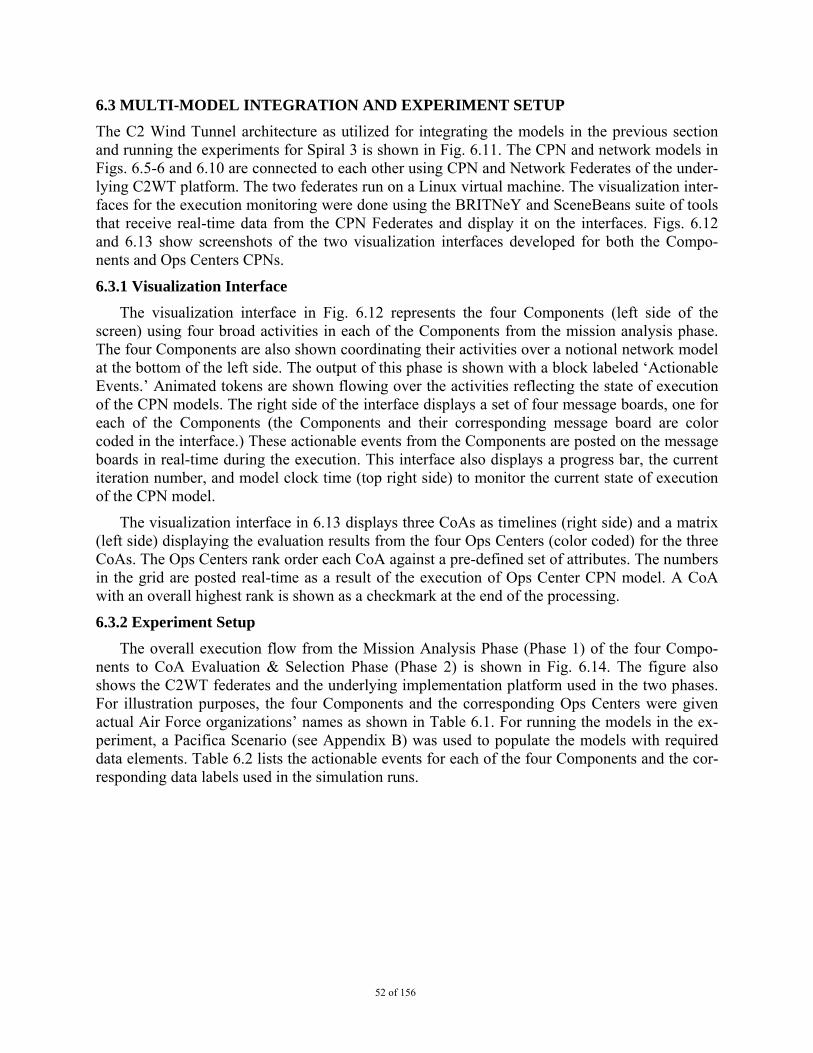
52 of 156
6.3 MULTI-MODEL INTEGRATION AND EXPERIMENT SETUP
The C2 Wind Tunnel architecture as utilized for integrating the models in the previous section and running the experiments for Spiral 3 is shown in Fig. 6.11. The CPN and network models in Figs. 6.5-6 and 6.10 are connected to each other using CPN and Network Federates of the under-lying C2WT platform. The two federates run on a Linux virtual machine. The visualization inter-faces for the execution monitoring were done using the BRITNeY and SceneBeans suite of tools that receive real-time data from the CPN Federates and display it on the interfaces. Figs. 6.12 and 6.13 show screenshots of the two visualization interfaces developed for both the Compo-nents and Ops Centers CPNs.
6.3.1 Visualization Interface
The visualization interface in Fig. 6.12 represents the four Components (left side of the screen) using four broad activities in each of the Components from the mission analysis phase. The four Components are also shown coordinating their activities over a notional network model at the bottom of the left side. The output of this phase is shown with a block labeled ‘Actionable Events.’ Animated tokens are shown flowing over the activities reflecting the state of execution of the CPN models. The right side of the interface displays a set of four message boards, one for each of the Components (the Components and their corresponding message board are color coded in the interface.) These actionable events from the Components are posted on the message boards in real-time during the execution. This interface also displays a progress bar, the current iteration number, and model clock time (top right side) to monitor the current state of execution of the CPN model.
The visualization interface in 6.13 displays three CoAs as timelines (right side) and a matrix (left side) displaying the evaluation results from the four Ops Centers (color coded) for the three CoAs. The Ops Centers rank order each CoA against a pre-defined set of attributes. The numbers in the grid are posted real-time as a result of the execution of Ops Center CPN model. A CoA with an overall highest rank is shown as a checkmark at the end of the processing.
6.3.2 Experiment Setup
The overall execution flow from the Mission Analysis Phase (Phase 1) of the four Compo-nents to CoA Evaluation & Selection Phase (Phase 2) is shown in Fig. 6.14. The figure also shows the C2WT federates and the underlying implementation platform used in the two phases. For illustration purposes, the four Components and the corresponding Ops Centers were given actual Air Force organizations’ names as shown in Table 6.1. For running the models in the ex-periment, a Pacifica Scenario (see Appendix B) was used to populate the models with required data elements. Table 6.2 lists the actionable events for each of the four Components and the cor-responding data labels used in the simulation runs.
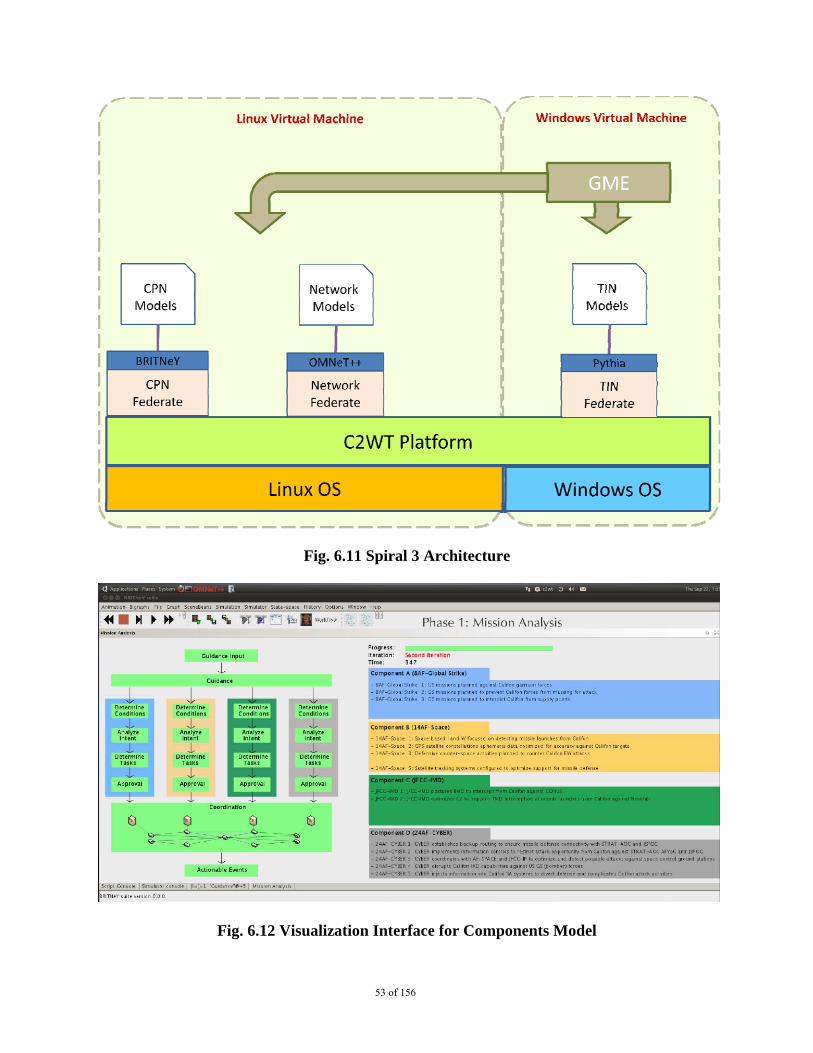
53 of 156
Fig. 6.11 Spiral 3 Architecture
Fig. 6.12 Visualization Interface for Components Model
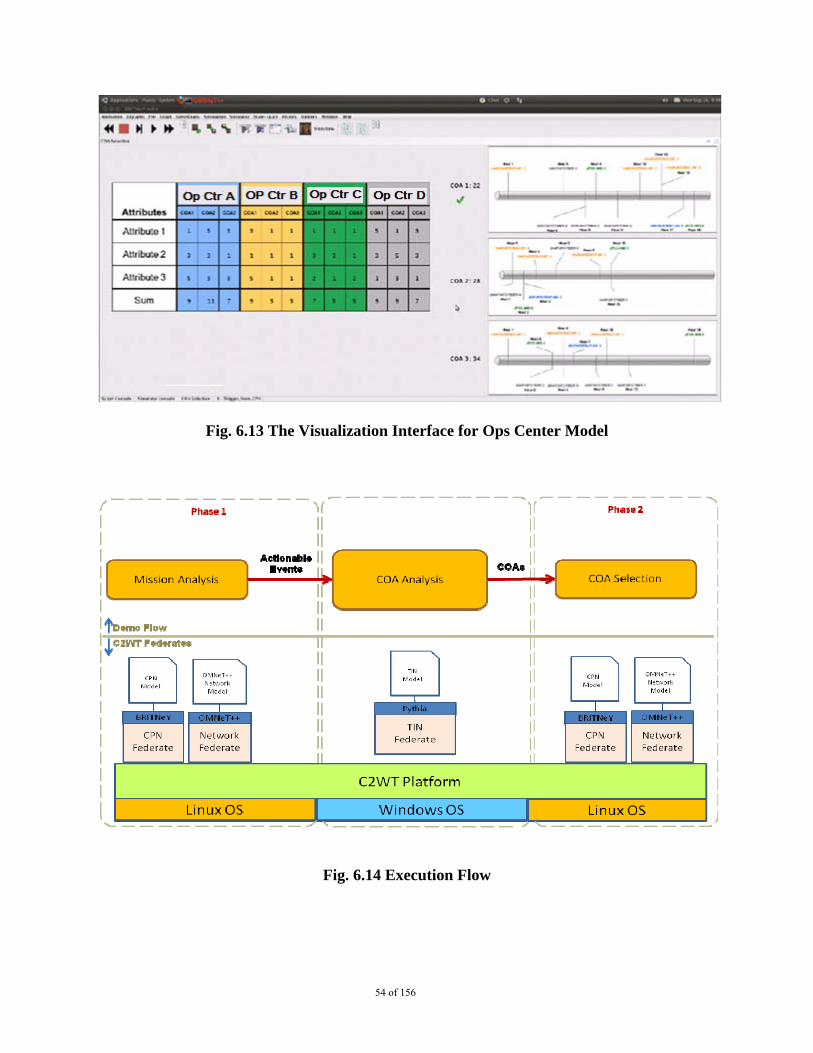
54 of 156
Fig. 6.13 The Visualization Interface for Ops Center Model
Fig. 6.14 Execution Flow
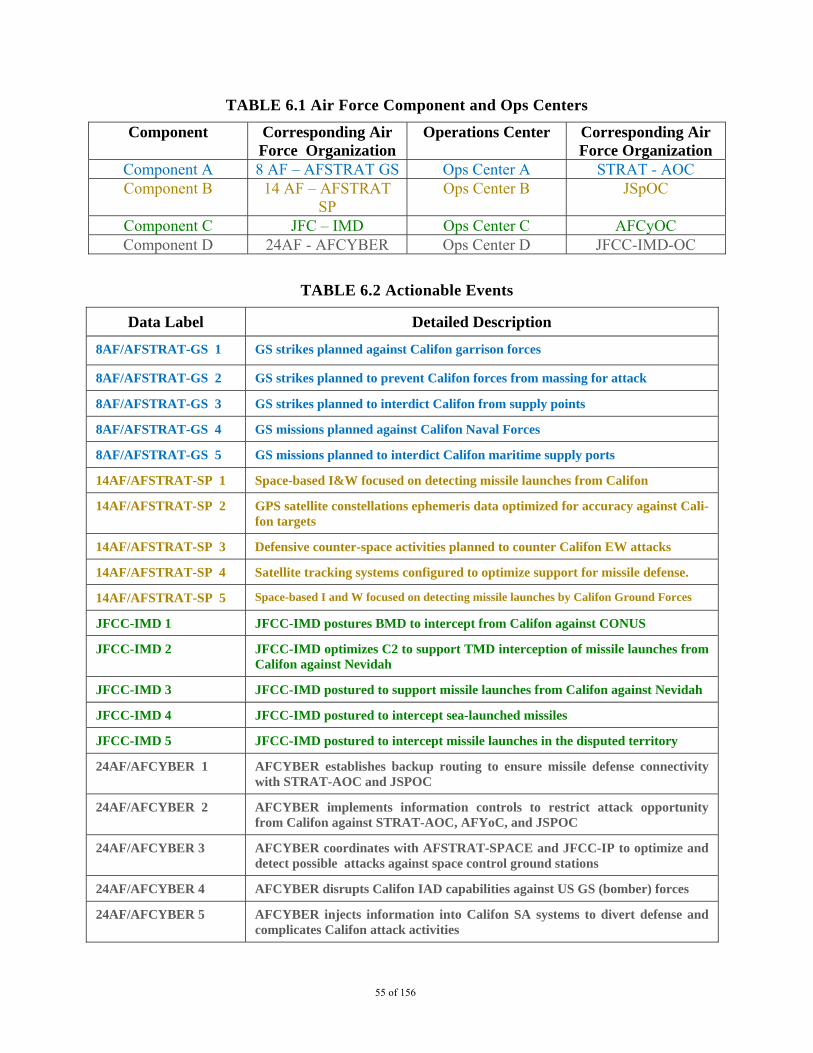
55 of 156
TABLE 6.1 Air Force Component and Ops Centers
Component Corresponding Air Force Organization
Operations Center Corresponding Air Force Organization
Component A 8 AF – AFSTRAT GS Ops Center A STRAT - AOC Component B 14 AF – AFSTRAT
SP Ops Center B JSpOC
Component C JFC – IMD Ops Center C AFCyOC Component D 24AF - AFCYBER Ops Center D JFCC-IMD-OC
TABLE 6.2 Actionable Events
Data Label Detailed Description
8AF/AFSTRAT-GS 1 GS strikes planned against Califon garrison forces
8AF/AFSTRAT-GS 2 GS strikes planned to prevent Califon forces from massing for attack
8AF/AFSTRAT-GS 3 GS strikes planned to interdict Califon from supply points
8AF/AFSTRAT-GS 4 GS missions planned against Califon Naval Forces
8AF/AFSTRAT-GS 5 GS missions planned to interdict Califon maritime supply ports
14AF/AFSTRAT-SP 1 Space-based I&W focused on detecting missile launches from Califon
14AF/AFSTRAT-SP 2 GPS satellite constellations ephemeris data optimized for accuracy against Cali-fon targets
14AF/AFSTRAT-SP 3 Defensive counter-space activities planned to counter Califon EW attacks
14AF/AFSTRAT-SP 4 Satellite tracking systems configured to optimize support for missile defense.
14AF/AFSTRAT-SP 5 Space-based I and W focused on detecting missile launches by Califon Ground Forces
JFCC-IMD 1 JFCC-IMD postures BMD to intercept from Califon against CONUS
JFCC-IMD 2 JFCC-IMD optimizes C2 to support TMD interception of missile launches from Califon against Nevidah
JFCC-IMD 3 JFCC-IMD postured to support missile launches from Califon against Nevidah
JFCC-IMD 4 JFCC-IMD postured to intercept sea-launched missiles
JFCC-IMD 5 JFCC-IMD postured to intercept missile launches in the disputed territory
24AF/AFCYBER 1 AFCYBER establishes backup routing to ensure missile defense connectivity with STRAT-AOC and JSPOC
24AF/AFCYBER 2 AFCYBER implements information controls to restrict attack opportunity from Califon against STRAT-AOC, AFYoC, and JSPOC
24AF/AFCYBER 3 AFCYBER coordinates with AFSTRAT-SPACE and JFCC-IP to optimize and detect possible attacks against space control ground stations
24AF/AFCYBER 4 AFCYBER disrupts Califon IAD capabilities against US GS (bomber) forces
24AF/AFCYBER 5 AFCYBER injects information into Califon SA systems to divert defense and complicates Califon attack activities
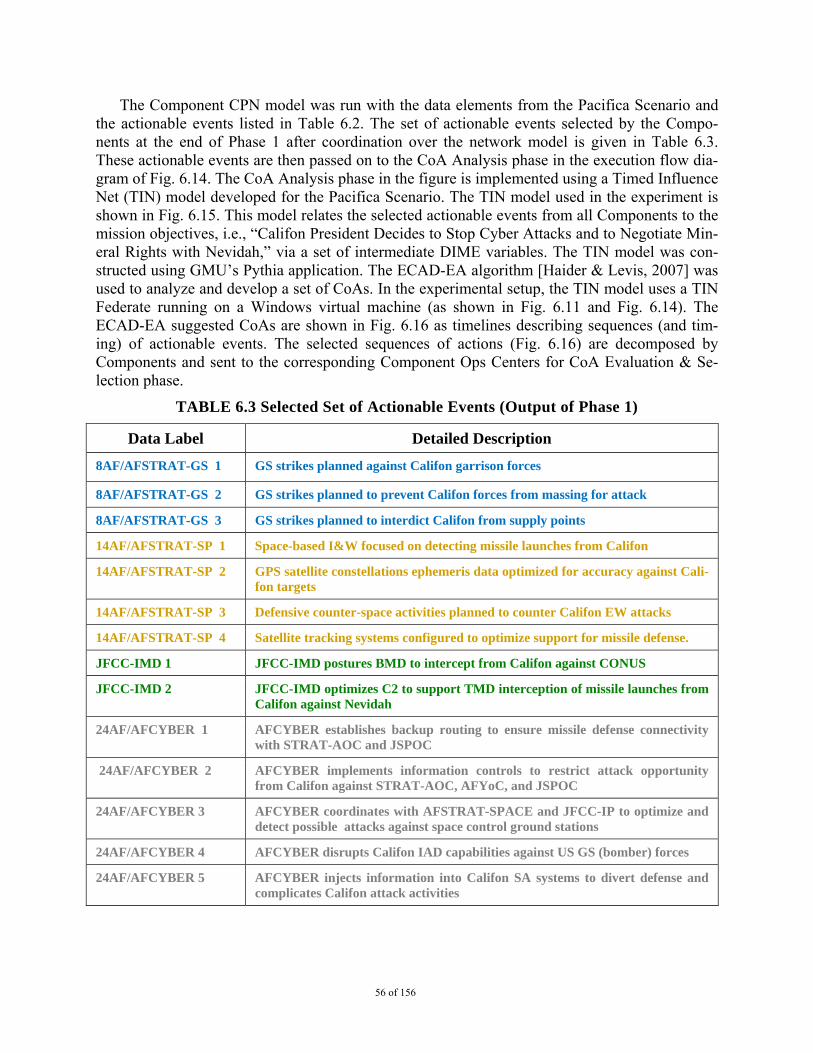
56 of 156
The Component CPN model was run with the data elements from the Pacifica Scenario and the actionable events listed in Table 6.2. The set of actionable events selected by the Compo-nents at the end of Phase 1 after coordination over the network model is given in Table 6.3. These actionable events are then passed on to the CoA Analysis phase in the execution flow dia-gram of Fig. 6.14. The CoA Analysis phase in the figure is implemented using a Timed Influence Net (TIN) model developed for the Pacifica Scenario. The TIN model used in the experiment is shown in Fig. 6.15. This model relates the selected actionable events from all Components to the mission objectives, i.e., “Califon President Decides to Stop Cyber Attacks and to Negotiate Min-eral Rights with Nevidah,” via a set of intermediate DIME variables. The TIN model was con-structed using GMU’s Pythia application. The ECAD-EA algorithm [Haider & Levis, 2007] was used to analyze and develop a set of CoAs. In the experimental setup, the TIN model uses a TIN Federate running on a Windows virtual machine (as shown in Fig. 6.11 and Fig. 6.14). The ECAD-EA suggested CoAs are shown in Fig. 6.16 as timelines describing sequences (and tim-ing) of actionable events. The selected sequences of actions (Fig. 6.16) are decomposed by Components and sent to the corresponding Component Ops Centers for CoA Evaluation & Se-lection phase.
TABLE 6.3 Selected Set of Actionable Events (Output of Phase 1)
Data Label Detailed Description
8AF/AFSTRAT-GS 1 GS strikes planned against Califon garrison forces
8AF/AFSTRAT-GS 2 GS strikes planned to prevent Califon forces from massing for attack
8AF/AFSTRAT-GS 3 GS strikes planned to interdict Califon from supply points
14AF/AFSTRAT-SP 1 Space-based I&W focused on detecting missile launches from Califon
14AF/AFSTRAT-SP 2 GPS satellite constellations ephemeris data optimized for accuracy against Cali-fon targets
14AF/AFSTRAT-SP 3 Defensive counter-space activities planned to counter Califon EW attacks
14AF/AFSTRAT-SP 4 Satellite tracking systems configured to optimize support for missile defense.
JFCC-IMD 1 JFCC-IMD postures BMD to intercept from Califon against CONUS
JFCC-IMD 2 JFCC-IMD optimizes C2 to support TMD interception of missile launches from Califon against Nevidah
24AF/AFCYBER 1 AFCYBER establishes backup routing to ensure missile defense connectivity with STRAT-AOC and JSPOC
24AF/AFCYBER 2 AFCYBER implements information controls to restrict attack opportunity from Califon against STRAT-AOC, AFYoC, and JSPOC
24AF/AFCYBER 3 AFCYBER coordinates with AFSTRAT-SPACE and JFCC-IP to optimize and detect possible attacks against space control ground stations
24AF/AFCYBER 4 AFCYBER disrupts Califon IAD capabilities against US GS (bomber) forces
24AF/AFCYBER 5 AFCYBER injects information into Califon SA systems to divert defense and complicates Califon attack activities
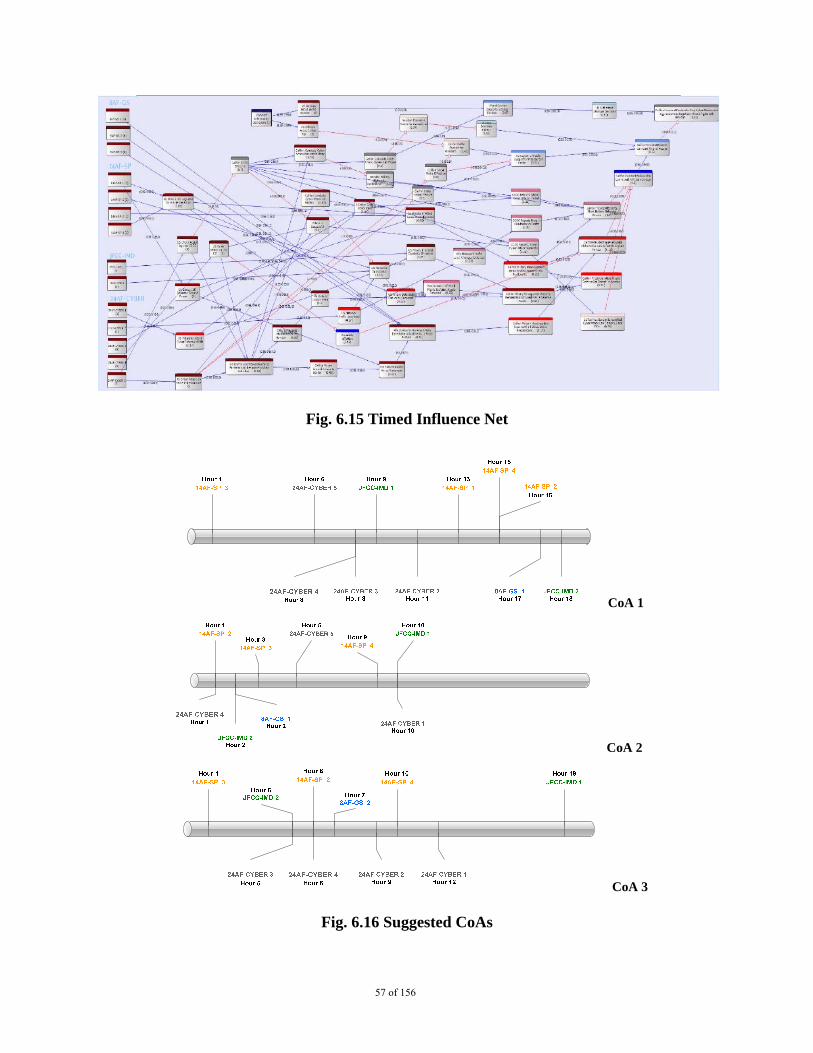
57 of 156
Fig. 6.15 Timed Influence Net
CoA 1
CoA 2
CoA 3
Fig. 6.16 Suggested CoAs
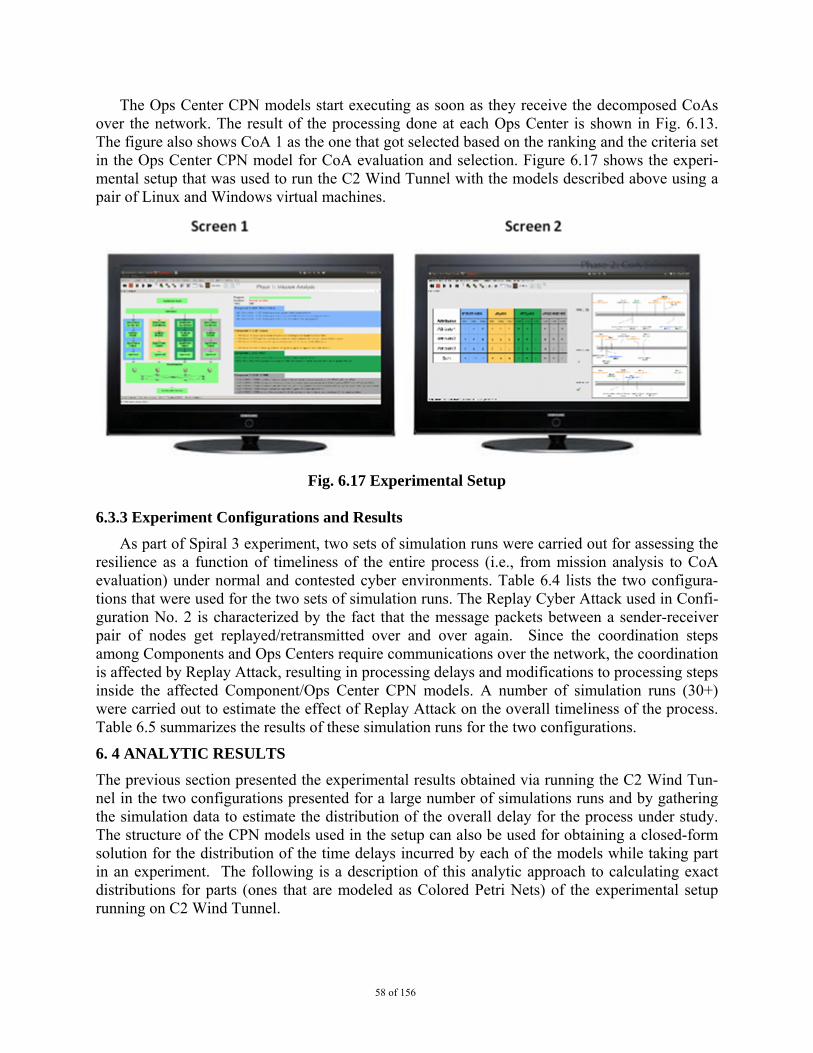
58 of 156
The Ops Center CPN models start executing as soon as they receive the decomposed CoAs over the network. The result of the processing done at each Ops Center is shown in Fig. 6.13. The figure also shows CoA 1 as the one that got selected based on the ranking and the criteria set in the Ops Center CPN model for CoA evaluation and selection. Figure 6.17 shows the experi-mental setup that was used to run the C2 Wind Tunnel with the models described above using a pair of Linux and Windows virtual machines.
Fig. 6.17 Experimental Setup
6.3.3 Experiment Configurations and Results
As part of Spiral 3 experiment, two sets of simulation runs were carried out for assessing the resilience as a function of timeliness of the entire process (i.e., from mission analysis to CoA evaluation) under normal and contested cyber environments. Table 6.4 lists the two configura-tions that were used for the two sets of simulation runs. The Replay Cyber Attack used in Confi-guration No. 2 is characterized by the fact that the message packets between a sender-receiver pair of nodes get replayed/retransmitted over and over again. Since the coordination steps among Components and Ops Centers require communications over the network, the coordination is affected by Replay Attack, resulting in processing delays and modifications to processing steps inside the affected Component/Ops Center CPN models. A number of simulation runs (30+) were carried out to estimate the effect of Replay Attack on the overall timeliness of the process. Table 6.5 summarizes the results of these simulation runs for the two configurations.
6. 4 ANALYTIC RESULTS
The previous section presented the experimental results obtained via running the C2 Wind Tun-nel in the two configurations presented for a large number of simulations runs and by gathering the simulation data to estimate the distribution of the overall delay for the process under study. The structure of the CPN models used in the setup can also be used for obtaining a closed-form solution for the distribution of the time delays incurred by each of the models while taking part in an experiment. The following is a description of this analytic approach to calculating exact distributions for parts (ones that are modeled as Colored Petri Nets) of the experimental setup running on C2 Wind Tunnel.
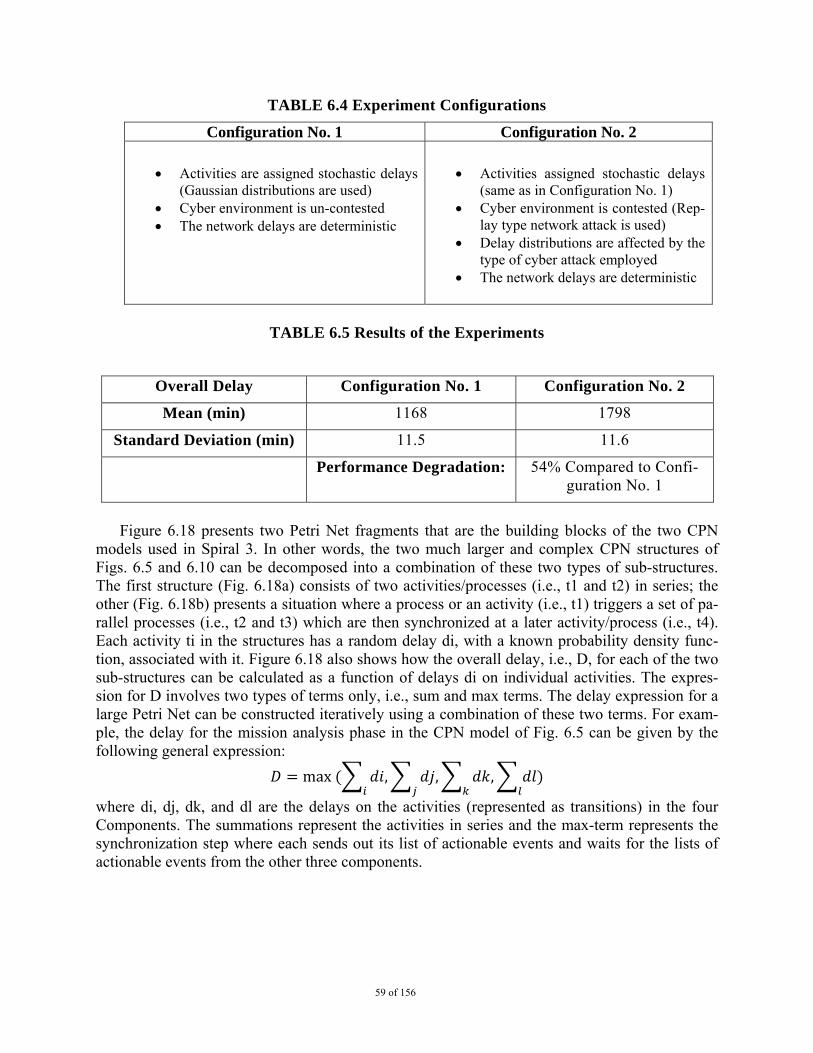
59 of 156
TABLE 6.4 Experiment Configurations
Configuration No. 1 Configuration No. 2
Activities are assigned stochastic delays
(Gaussian distributions are used) Cyber environment is un-contested The network delays are deterministic
Activities assigned stochastic delays
(same as in Configuration No. 1) Cyber environment is contested (Rep-
lay type network attack is used) Delay distributions are affected by the
type of cyber attack employed The network delays are deterministic
TABLE 6.5 Results of the Experiments
Overall Delay Configuration No. 1 Configuration No. 2
Mean (min) 1168 1798
Standard Deviation (min) 11.5 11.6
Performance Degradation: 54% Compared to Confi-guration No. 1
Figure 6.18 presents two Petri Net fragments that are the building blocks of the two CPN
models used in Spiral 3. In other words, the two much larger and complex CPN structures of Figs. 6.5 and 6.10 can be decomposed into a combination of these two types of sub-structures. The first structure (Fig. 6.18a) consists of two activities/processes (i.e., t1 and t2) in series; the other (Fig. 6.18b) presents a situation where a process or an activity (i.e., t1) triggers a set of pa-rallel processes (i.e., t2 and t3) which are then synchronized at a later activity/process (i.e., t4). Each activity ti in the structures has a random delay di, with a known probability density func-tion, associated with it. Figure 6.18 also shows how the overall delay, i.e., D, for each of the two sub-structures can be calculated as a function of delays di on individual activities. The expres-sion for D involves two types of terms only, i.e., sum and max terms. The delay expression for a large Petri Net can be constructed iteratively using a combination of these two terms. For exam-ple, the delay for the mission analysis phase in the CPN model of Fig. 6.5 can be given by the following general expression:
max , , ,
where di, dj, dk, and dl are the delays on the activities (represented as transitions) in the four Components. The summations represent the activities in series and the max-term represents the synchronization step where each sends out its list of actionable events and waits for the lists of actionable events from the other three components.
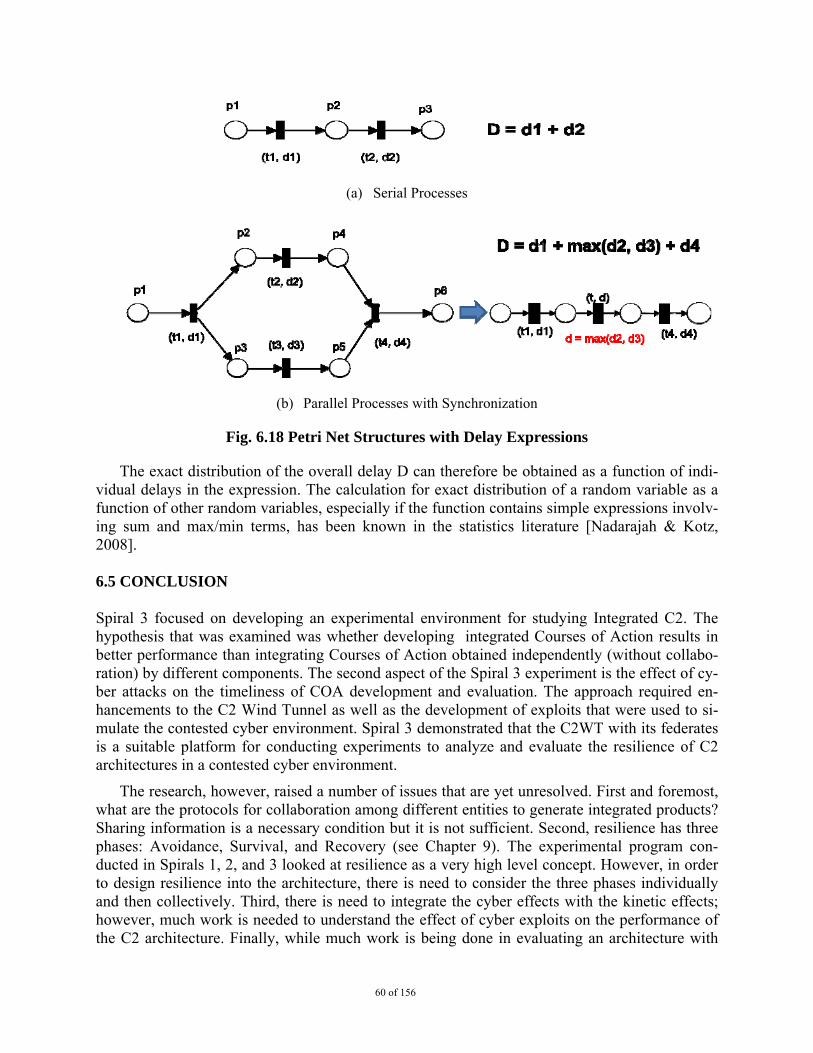
60 of 156
(a) Serial Processes
(b) Parallel Processes with Synchronization
Fig. 6.18 Petri Net Structures with Delay Expressions
The exact distribution of the overall delay D can therefore be obtained as a function of indi-vidual delays in the expression. The calculation for exact distribution of a random variable as a function of other random variables, especially if the function contains simple expressions involv-ing sum and max/min terms, has been known in the statistics literature [Nadarajah & Kotz, 2008]. 6.5 CONCLUSION Spiral 3 focused on developing an experimental environment for studying Integrated C2. The hypothesis that was examined was whether developing integrated Courses of Action results in better performance than integrating Courses of Action obtained independently (without collabo-ration) by different components. The second aspect of the Spiral 3 experiment is the effect of cy-ber attacks on the timeliness of COA development and evaluation. The approach required en-hancements to the C2 Wind Tunnel as well as the development of exploits that were used to si-mulate the contested cyber environment. Spiral 3 demonstrated that the C2WT with its federates is a suitable platform for conducting experiments to analyze and evaluate the resilience of C2 architectures in a contested cyber environment.
The research, however, raised a number of issues that are yet unresolved. First and foremost, what are the protocols for collaboration among different entities to generate integrated products? Sharing information is a necessary condition but it is not sufficient. Second, resilience has three phases: Avoidance, Survival, and Recovery (see Chapter 9). The experimental program con-ducted in Spirals 1, 2, and 3 looked at resilience as a very high level concept. However, in order to design resilience into the architecture, there is need to consider the three phases individually and then collectively. Third, there is need to integrate the cyber effects with the kinetic effects; however, much work is needed to understand the effect of cyber exploits on the performance of the C2 architecture. Finally, while much work is being done in evaluating an architecture with
61 of 156
respect to the behaviors and performance that it enables, little has been done in evaluating non-functional attributes such as resilience.
6.6 REFERENCES S. Haider and A. H. Levis, (2007) “Effective Courses of Action Determination to Achieve De-
sired Effects” in IEEE Trans. on Systems, Man and Cybernetics, Part A: Systems and Humans, Vol. 37, No. 6.
S. Nadarajah and S. Kotz, (2008) “Exact Distribution of the Max/Min of Two Gaussian Random Variables” in IEEE Trans. on Very Large Scale Integration (VLSI) System, Vol. 16, No. 2.

62 of 156
63 of 156
CHAPTER 7
SOCIAL NETWORK MODELING AND SIMULATION OF INTEGRATED RESILIENT COMMAND AND CONTROL (C2) IN CONTESTED CYBER
ENVIRONMENTS
7.1 MOTIVATION
When the United States Air Force (USAF) speaks of cyber and information security, it uses the concept of “mission assurance” (Webber, 2010) instead of limiting the discussion to cyber, phys-ical, space, or other specialized security. USAF officials want to assure themselves and their field commanders of their organizational ability to conduct their missions, especially in contested environments. Of particular concern has been assuring operational use of its telecommunications and IT systems.
The USAF has developed hardened permanent AOCs for some of the Geographic Combatant Commands, deployable packages for regions without a hardened AOC, as well as functional AOCs for the functional combatant commands. The consolidation of so many capabilities into each Falconer AOC has made its dependence on cyberspace and telecommunications networks readily apparent to the AOC System Program Office (SPO). A goal of the AOC SPO is to miti-gate the risks of dependence on telecommunications networks. The mitigations have to be suffi-cient to assure various sets of leadership those AOCs can meet their missions’ requirements in the face of contested cyber environments.
To make meaningful comparisons between the status quo and experimental futures, there must be robust efforts at modeling, simulating, and studying friendly forces. Critical tasks for the simulations and evidence-based research communities include understanding the interplay of friendly variables, being able to make predictions and run experiments to confirm or deny the predictions, and being able to communicate the results of those experiments and predictions. This chapter presents a step in the direction of providing repeatable, large-scale simulations of DoD organizations conducting cyberspace operations as well as the Military Departments’ (MILDEP) training, manning and equipping of forces to operate in contested cyber environ-ments.
7.1.1 Relationship between George Mason University (GMU) and Carnegie Mellon Univer-sity (CMU)
Chapter 6 discussed the use of the Pacifica scenario as a unifying background for the imple-mentation of the GMU and CMU models. Figure 7.1 depicts the overall concept of four (4) dif-ferent Air Component Commands (each belonging to a Combatant Command) coordinating and integrating a set of plans to achieve a common set of goals. Within the efforts required to accom-plish that strategic coordination and integration is the coordination and integration required by each operations center at the operational and tactical levels of war. The CMU research effort fo-cused on the interaction of the four operations centers. We chose to model each operations center uniformly as a doctrinal AN/USQ-163 Falconer Weapon System—while being aware that no fielded AOC is identical to doctrine and each as-built AOC is different from each other. Each of these operations centers is responsible for receiving, analyzing, processing and implementing orders from their respective Headquarters. We used a simplifying assumption that the relevant
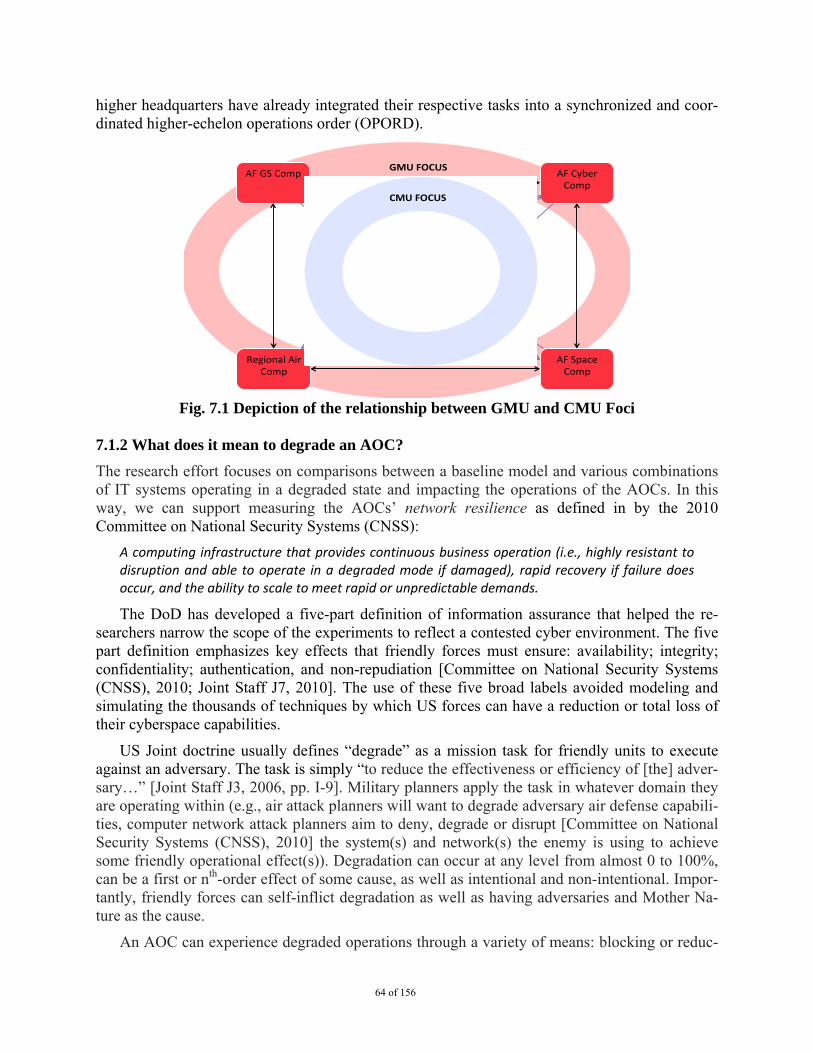
64 of 156
higher headquarters have already integrated their respective tasks into a synchronized and coor-dinated higher-echelon operations order (OPORD).
Fig. 7.1 Depiction of the relationship between GMU and CMU Foci
7.1.2 What does it mean to degrade an AOC?
The research effort focuses on comparisons between a baseline model and various combinations of IT systems operating in a degraded state and impacting the operations of the AOCs. In this way, we can support measuring the AOCs’ network resilience as defined in by the 2010 Committee on National Security Systems (CNSS):
A computing infrastructure that provides continuous business operation (i.e., highly resistant to disruption and able to operate in a degraded mode if damaged), rapid recovery if failure does occur, and the ability to scale to meet rapid or unpredictable demands.
The DoD has developed a five-part definition of information assurance that helped the re-searchers narrow the scope of the experiments to reflect a contested cyber environment. The five part definition emphasizes key effects that friendly forces must ensure: availability; integrity; confidentiality; authentication, and non-repudiation [Committee on National Security Systems (CNSS), 2010; Joint Staff J7, 2010]. The use of these five broad labels avoided modeling and simulating the thousands of techniques by which US forces can have a reduction or total loss of their cyberspace capabilities.
US Joint doctrine usually defines “degrade” as a mission task for friendly units to execute against an adversary. The task is simply “to reduce the effectiveness or efficiency of [the] adver-sary…” [Joint Staff J3, 2006, pp. I-9]. Military planners apply the task in whatever domain they are operating within (e.g., air attack planners will want to degrade adversary air defense capabili-ties, computer network attack planners aim to deny, degrade or disrupt [Committee on National Security Systems (CNSS), 2010] the system(s) and network(s) the enemy is using to achieve some friendly operational effect(s)). Degradation can occur at any level from almost 0 to 100%, can be a first or nth-order effect of some cause, as well as intentional and non-intentional. Impor-tantly, friendly forces can self-inflict degradation as well as having adversaries and Mother Na-ture as the cause.
An AOC can experience degraded operations through a variety of means: blocking or reduc-
1
AF Cyber Comp
AF GS Comp
AF Space Comp
Regional Air Comp
AF Cyber Ops Ctr
STRATCOM AOC
AF Space Ops Ctr
Regional AOC
GMU FOCUS
CMU FOCUS
65 of 156
ing the effectiveness of communications to external entities (e.g., loss or reduction in availabili-ty); loss of confidence in authenticity and accuracy (e.g., loss of integrity) in transmitted orders and information; loss of confidence by external units that the AOC has situational awareness of their operating environment. Degraded operations can also occur through loss of personnel and equipment, over-extension of personnel (e.g., too many expectations, not enough resources to meet them all), as well as any number of other situations that would prevent the AOC from oper-ating as the USAF designed and the COCOM commander expects. Table 7.1 provides a visual depiction of how different methods of attack create various effects.
7.1.3 The Mission and Structure of the AOC
The AOC Mission
The AOC provides operational-level command and control (C2) of air and space forces as the focal point for planning, directing, and assessing air and space operations. To integrate air and space operations and accomplish its mission, the AOC coordinates closely with superior and subordinate C2 nodes, as well as the headquarters of other functional and Service component commands [USAF, 2005].
The AOC is the senior element of a Theater Air Control System (TACS). The TACS is com-posed of both airborne and ground-based C2 elements. To effectively integrate the TACS ele-ments, the AOC develops and distributes numerous theater-wide guidance artifacts: Joint Air Operations Plan (JAOP); air operations directive (AOD); air defense plan (ADP); airspace con-trol plan (ACP); airspace control order (ACO); air tasking order special instructions (ATO spe-cial instructions (SPINS)); tactical operations data (TACOPDAT); and operations task link (OPTASKLINK). These documents provide overarching direction to the TACS elements. The documents define roles, responsibilities, and authorities for decentralized execution [USAF, 2005].
Five Major Divisions, Matrix Support among 15 functional groups
There are five major divisions in the AOC as Figure 7.2 illustrates. The model used in this study incorporates all these divisions as well as the functional groups shown in the figure. Each division has multiple subordinate teams as well as a chief and deputy chief. Many of the teams have subordinate cells as well as team chiefs and deputy team chiefs.
7.2 SOCIAL NETWORK MODELING OF INTEGRATED AND RESILIENT AOCS THROUGH TEXT-MINING AND DATA TO MODEL (D2M) PROCESSES
7.2.1 Social Network Data Description
The data for this project is from four source documents representing a mix of Joint and USAF service doctrine. These documents are available to the public and are therefore ideal to support unrestricted research. Their availability however does come with a few facts that future research-ers and readers need to remain aware of: the documents are written and edited by teams of indi-viduals; the documents’ authors consistently state that the doctrine they are writing is a common point of departure for fielded AOCs—that no AOC is structured exactly like depicted nor per-forms in the same manner as conveyed; the documents have a number of acronyms that have multiple original meanings even in such a small data set.
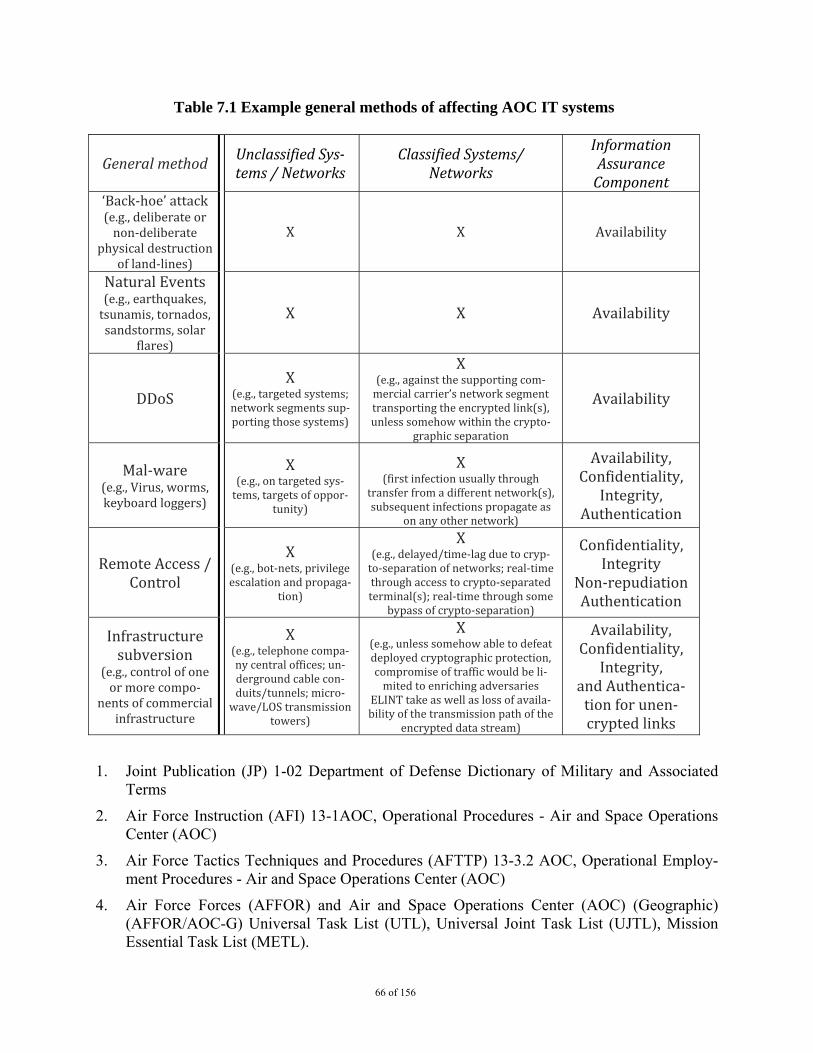
66 of 156
1. Joint Publication (JP) 1-02 Department of Defense Dictionary of Military and Associated Terms
2. Air Force Instruction (AFI) 13-1AOC, Operational Procedures - Air and Space Operations Center (AOC)
3. Air Force Tactics Techniques and Procedures (AFTTP) 13-3.2 AOC, Operational Employ-ment Procedures - Air and Space Operations Center (AOC)
4. Air Force Forces (AFFOR) and Air and Space Operations Center (AOC) (Geographic) (AFFOR/AOC-G) Universal Task List (UTL), Universal Joint Task List (UJTL), Mission Essential Task List (METL).
Table 7.1 Example general methods of affecting AOC IT systems
General method Unclassified Systems / Networks
Classified Systems/ Networks
Information Assurance Component
‘Back‐hoe’ attack (e.g., deliberate or non‐deliberate
physical destruction of land‐lines)
X X Availability
Natural Events (e.g., earthquakes, tsunamis, tornados, sandstorms, solar
flares)
X X Availability
DDoS X
(e.g., targeted systems; network segments sup‐porting those systems)
X (e.g., against the supporting com‐mercial carrier’s network segment transporting the encrypted link(s), unless somehow within the crypto‐
graphic separation
Availability
Mal‐ware (e.g., Virus, worms, keyboard loggers)
X (e.g., on targeted sys‐tems, targets of oppor‐
tunity)
X (first infection usually through
transfer from a different network(s), subsequent infections propagate as
on any other network)
Availability, Confidentiality,
Integrity, Authentication
Remote Access / Control
X (e.g., bot‐nets, privilege escalation and propaga‐
tion)
X (e.g., delayed/time‐lag due to cryp‐to‐separation of networks; real‐time through access to crypto‐separated terminal(s); real‐time through some
bypass of crypto‐separation)
Confidentiality, Integrity
Non‐repudiation Authentication
Infrastructure subversion
(e.g., control of one or more compo‐
nents of commercial infrastructure
X (e.g., telephone compa‐ny central offices; un‐derground cable con‐duits/tunnels; micro‐wave/LOS transmission
towers)
X (e.g., unless somehow able to defeat deployed cryptographic protection, compromise of traffic would be li‐mited to enriching adversaries
ELINT take as well as loss of availa‐bility of the transmission path of the
encrypted data stream)
Availability, Confidentiality,
Integrity, and Authentica‐tion for unen‐crypted links
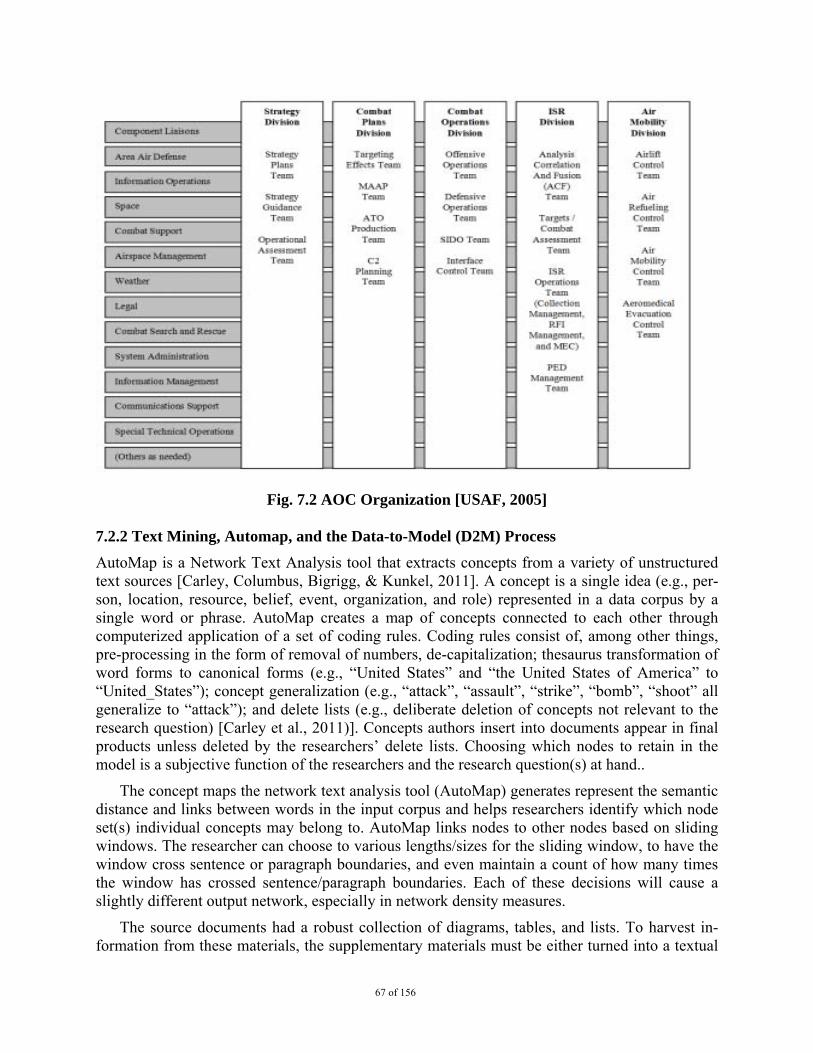
67 of 156
Fig. 7.2 AOC Organization [USAF, 2005] 7.2.2 Text Mining, Automap, and the Data-to-Model (D2M) Process
AutoMap is a Network Text Analysis tool that extracts concepts from a variety of unstructured text sources [Carley, Columbus, Bigrigg, & Kunkel, 2011]. A concept is a single idea (e.g., per-son, location, resource, belief, event, organization, and role) represented in a data corpus by a single word or phrase. AutoMap creates a map of concepts connected to each other through computerized application of a set of coding rules. Coding rules consist of, among other things, pre-processing in the form of removal of numbers, de-capitalization; thesaurus transformation of word forms to canonical forms (e.g., “United States” and “the United States of America” to “United_States”); concept generalization (e.g., “attack”, “assault”, “strike”, “bomb”, “shoot” all generalize to “attack”); and delete lists (e.g., deliberate deletion of concepts not relevant to the research question) [Carley et al., 2011)]. Concepts authors insert into documents appear in final products unless deleted by the researchers’ delete lists. Choosing which nodes to retain in the model is a subjective function of the researchers and the research question(s) at hand..
The concept maps the network text analysis tool (AutoMap) generates represent the semantic distance and links between words in the input corpus and helps researchers identify which node set(s) individual concepts may belong to. AutoMap links nodes to other nodes based on sliding windows. The researcher can choose to various lengths/sizes for the sliding window, to have the window cross sentence or paragraph boundaries, and even maintain a count of how many times the window has crossed sentence/paragraph boundaries. Each of these decisions will cause a slightly different output network, especially in network density measures.
The source documents had a robust collection of diagrams, tables, and lists. To harvest in-formation from these materials, the supplementary materials must be either turned into a textual
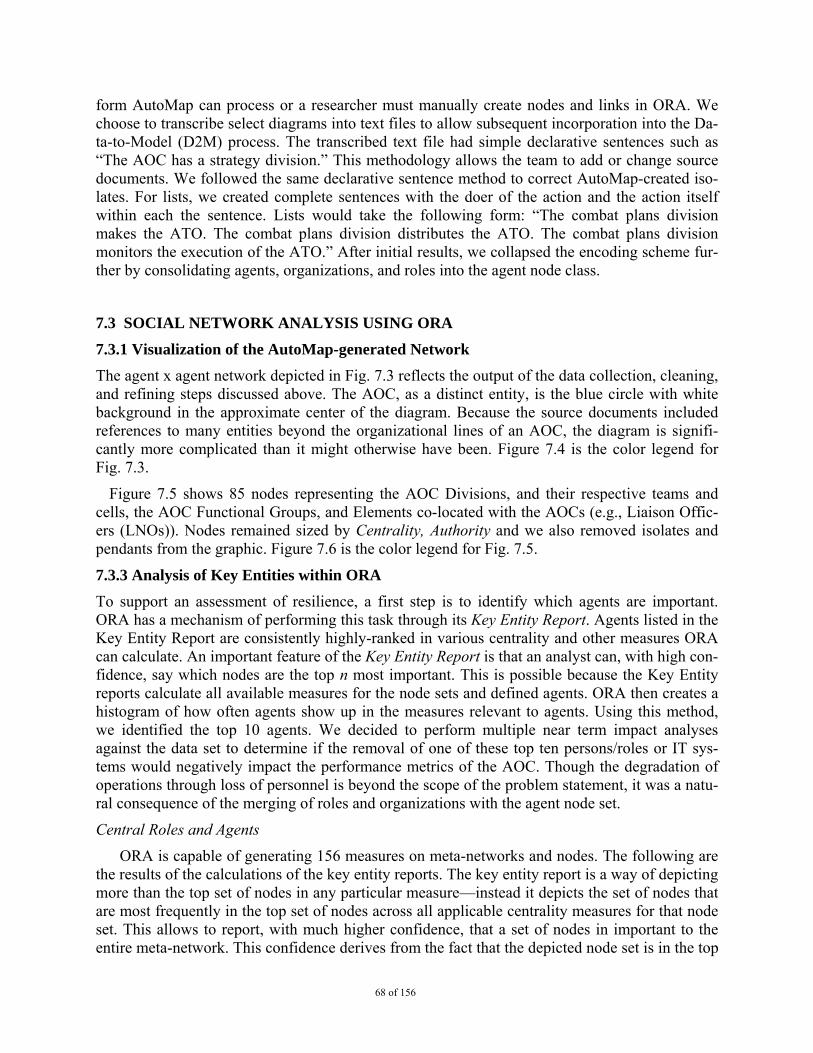
68 of 156
form AutoMap can process or a researcher must manually create nodes and links in ORA. We choose to transcribe select diagrams into text files to allow subsequent incorporation into the Da-ta-to-Model (D2M) process. The transcribed text file had simple declarative sentences such as “The AOC has a strategy division.” This methodology allows the team to add or change source documents. We followed the same declarative sentence method to correct AutoMap-created iso-lates. For lists, we created complete sentences with the doer of the action and the action itself within each the sentence. Lists would take the following form: “The combat plans division makes the ATO. The combat plans division distributes the ATO. The combat plans division monitors the execution of the ATO.” After initial results, we collapsed the encoding scheme fur-ther by consolidating agents, organizations, and roles into the agent node class.
7.3 SOCIAL NETWORK ANALYSIS USING ORA
7.3.1 Visualization of the AutoMap-generated Network
The agent x agent network depicted in Fig. 7.3 reflects the output of the data collection, cleaning, and refining steps discussed above. The AOC, as a distinct entity, is the blue circle with white background in the approximate center of the diagram. Because the source documents included references to many entities beyond the organizational lines of an AOC, the diagram is signifi-cantly more complicated than it might otherwise have been. Figure 7.4 is the color legend for Fig. 7.3.
Figure 7.5 shows 85 nodes representing the AOC Divisions, and their respective teams and cells, the AOC Functional Groups, and Elements co-located with the AOCs (e.g., Liaison Offic-ers (LNOs)). Nodes remained sized by Centrality, Authority and we also removed isolates and pendants from the graphic. Figure 7.6 is the color legend for Fig. 7.5.
7.3.3 Analysis of Key Entities within ORA
To support an assessment of resilience, a first step is to identify which agents are important. ORA has a mechanism of performing this task through its Key Entity Report. Agents listed in the Key Entity Report are consistently highly-ranked in various centrality and other measures ORA can calculate. An important feature of the Key Entity Report is that an analyst can, with high con-fidence, say which nodes are the top n most important. This is possible because the Key Entity reports calculate all available measures for the node sets and defined agents. ORA then creates a histogram of how often agents show up in the measures relevant to agents. Using this method, we identified the top 10 agents. We decided to perform multiple near term impact analyses against the data set to determine if the removal of one of these top ten persons/roles or IT sys-tems would negatively impact the performance metrics of the AOC. Though the degradation of operations through loss of personnel is beyond the scope of the problem statement, it was a natu-ral consequence of the merging of roles and organizations with the agent node set.
Central Roles and Agents
ORA is capable of generating 156 measures on meta-networks and nodes. The following are the results of the calculations of the key entity reports. The key entity report is a way of depicting more than the top set of nodes in any particular measure—instead it depicts the set of nodes that are most frequently in the top set of nodes across all applicable centrality measures for that node set. This allows to report, with much higher confidence, that a set of nodes in important to the entire meta-network. This confidence derives from the fact that the depicted node set is in the top
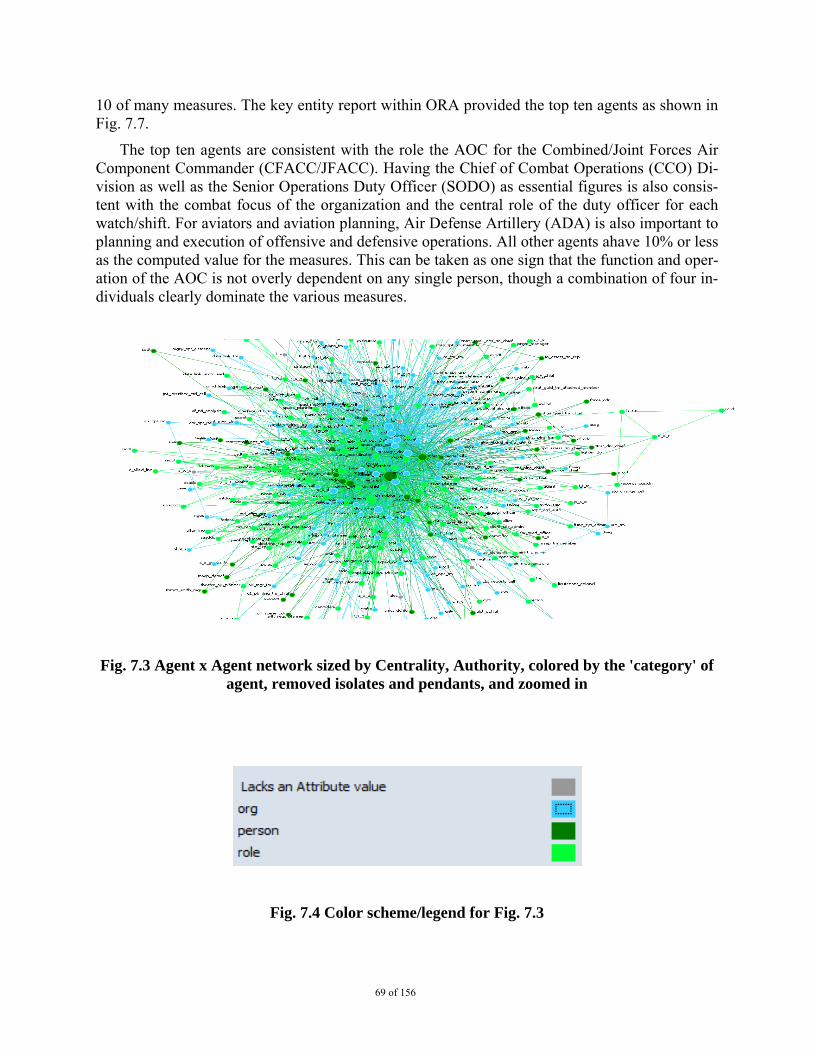
69 of 156
10 of many measures. The key entity report within ORA provided the top ten agents as shown in Fig. 7.7.
The top ten agents are consistent with the role the AOC for the Combined/Joint Forces Air Component Commander (CFACC/JFACC). Having the Chief of Combat Operations (CCO) Di-vision as well as the Senior Operations Duty Officer (SODO) as essential figures is also consis-tent with the combat focus of the organization and the central role of the duty officer for each watch/shift. For aviators and aviation planning, Air Defense Artillery (ADA) is also important to planning and execution of offensive and defensive operations. All other agents ahave 10% or less as the computed value for the measures. This can be taken as one sign that the function and oper-ation of the AOC is not overly dependent on any single person, though a combination of four in-dividuals clearly dominate the various measures.
Fig. 7.3 Agent x Agent network sized by Centrality, Authority, colored by the 'category' of agent, removed isolates and pendants, and zoomed in
Fig. 7.4 Color scheme/legend for Fig. 7.3
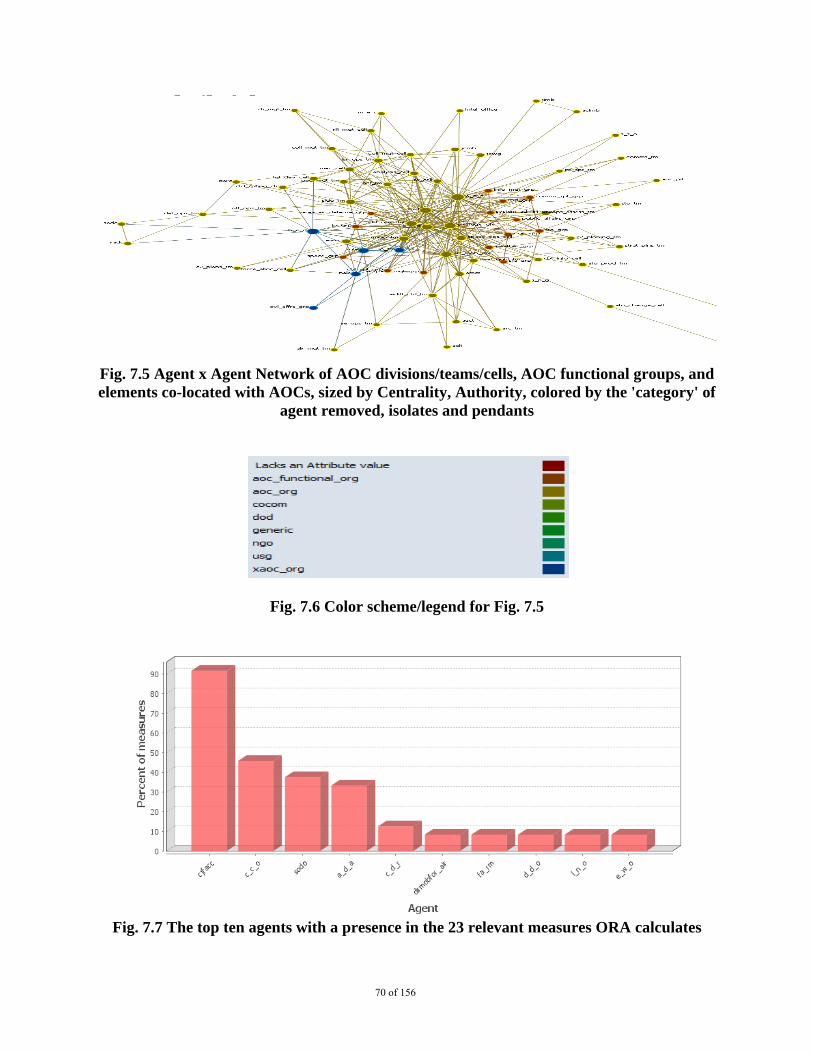
70 of 156
Fig. 7.5 Agent x Agent Network of AOC divisions/teams/cells, AOC functional groups, and elements co-located with AOCs, sized by Centrality, Authority, colored by the 'category' of
agent removed, isolates and pendants
Fig. 7.6 Color scheme/legend for Fig. 7.5
Fig. 7.7 The top ten agents with a presence in the 23 relevant measures ORA calculates
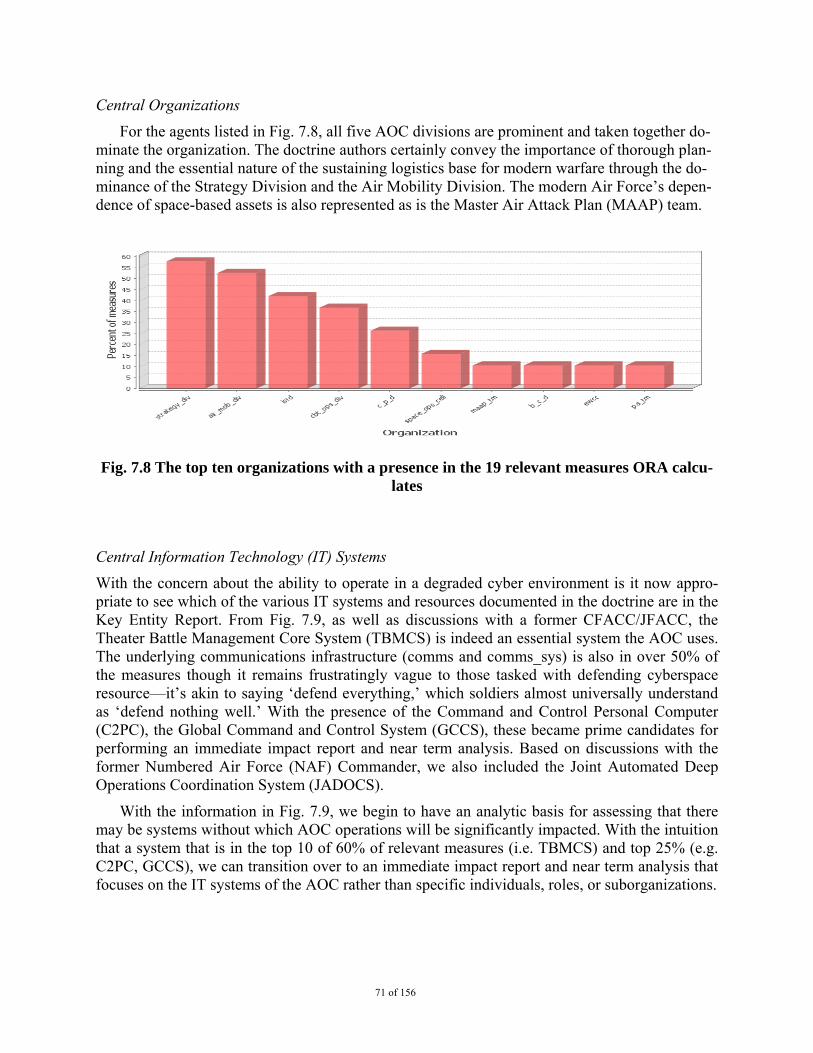
71 of 156
Central Organizations
For the agents listed in Fig. 7.8, all five AOC divisions are prominent and taken together do-minate the organization. The doctrine authors certainly convey the importance of thorough plan-ning and the essential nature of the sustaining logistics base for modern warfare through the do-minance of the Strategy Division and the Air Mobility Division. The modern Air Force’s depen-dence of space-based assets is also represented as is the Master Air Attack Plan (MAAP) team.
Fig. 7.8 The top ten organizations with a presence in the 19 relevant measures ORA calcu-lates
Central Information Technology (IT) Systems
With the concern about the ability to operate in a degraded cyber environment is it now appro-priate to see which of the various IT systems and resources documented in the doctrine are in the Key Entity Report. From Fig. 7.9, as well as discussions with a former CFACC/JFACC, the Theater Battle Management Core System (TBMCS) is indeed an essential system the AOC uses. The underlying communications infrastructure (comms and comms_sys) is also in over 50% of the measures though it remains frustratingly vague to those tasked with defending cyberspace resource—it’s akin to saying ‘defend everything,’ which soldiers almost universally understand as ‘defend nothing well.’ With the presence of the Command and Control Personal Computer (C2PC), the Global Command and Control System (GCCS), these became prime candidates for performing an immediate impact report and near term analysis. Based on discussions with the former Numbered Air Force (NAF) Commander, we also included the Joint Automated Deep Operations Coordination System (JADOCS).
With the information in Fig. 7.9, we begin to have an analytic basis for assessing that there may be systems without which AOC operations will be significantly impacted. With the intuition that a system that is in the top 10 of 60% of relevant measures (i.e. TBMCS) and top 25% (e.g. C2PC, GCCS), we can transition over to an immediate impact report and near term analysis that focuses on the IT systems of the AOC rather than specific individuals, roles, or suborganizations.
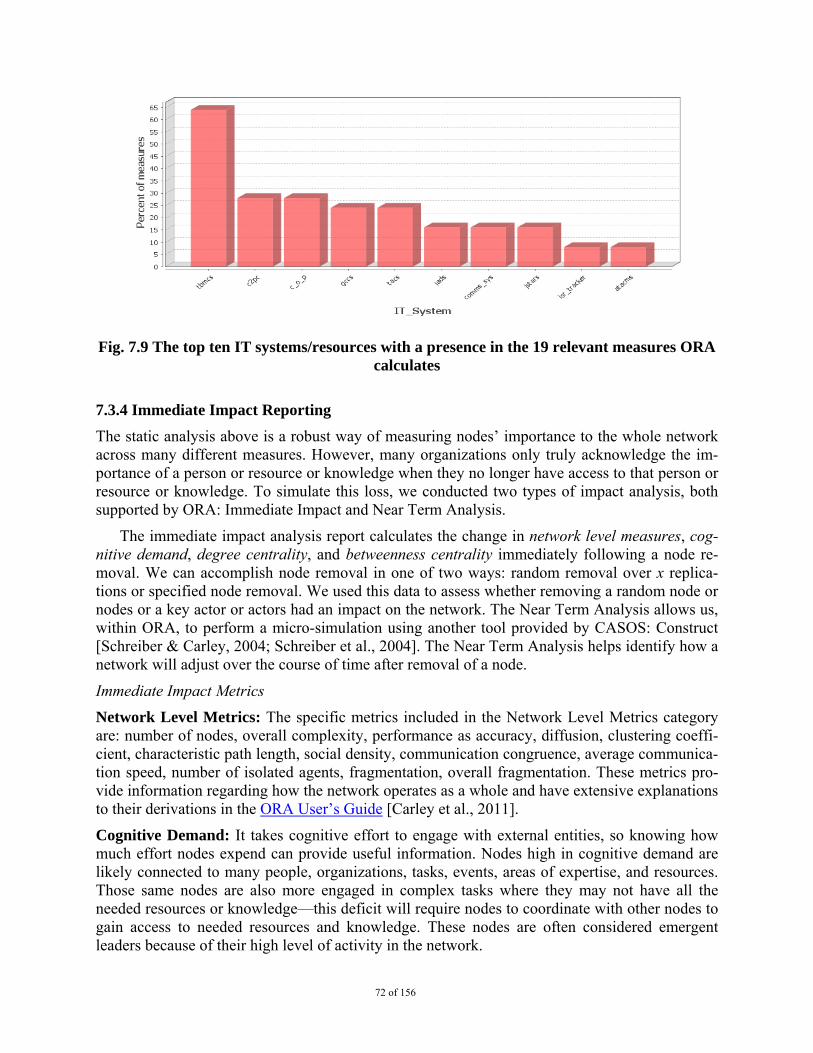
72 of 156
Fig. 7.9 The top ten IT systems/resources with a presence in the 19 relevant measures ORA calculates
7.3.4 Immediate Impact Reporting
The static analysis above is a robust way of measuring nodes’ importance to the whole network across many different measures. However, many organizations only truly acknowledge the im-portance of a person or resource or knowledge when they no longer have access to that person or resource or knowledge. To simulate this loss, we conducted two types of impact analysis, both supported by ORA: Immediate Impact and Near Term Analysis.
The immediate impact analysis report calculates the change in network level measures, cog-nitive demand, degree centrality, and betweenness centrality immediately following a node re-moval. We can accomplish node removal in one of two ways: random removal over x replica-tions or specified node removal. We used this data to assess whether removing a random node or nodes or a key actor or actors had an impact on the network. The Near Term Analysis allows us, within ORA, to perform a micro-simulation using another tool provided by CASOS: Construct [Schreiber & Carley, 2004; Schreiber et al., 2004]. The Near Term Analysis helps identify how a network will adjust over the course of time after removal of a node.
Immediate Impact Metrics
Network Level Metrics: The specific metrics included in the Network Level Metrics category are: number of nodes, overall complexity, performance as accuracy, diffusion, clustering coeffi-cient, characteristic path length, social density, communication congruence, average communica-tion speed, number of isolated agents, fragmentation, overall fragmentation. These metrics pro-vide information regarding how the network operates as a whole and have extensive explanations to their derivations in the ORA User’s Guide [Carley et al., 2011].
Cognitive Demand: It takes cognitive effort to engage with external entities, so knowing how much effort nodes expend can provide useful information. Nodes high in cognitive demand are likely connected to many people, organizations, tasks, events, areas of expertise, and resources. Those same nodes are also more engaged in complex tasks where they may not have all the needed resources or knowledge—this deficit will require nodes to coordinate with other nodes to gain access to needed resources and knowledge. These nodes are often considered emergent leaders because of their high level of activity in the network.
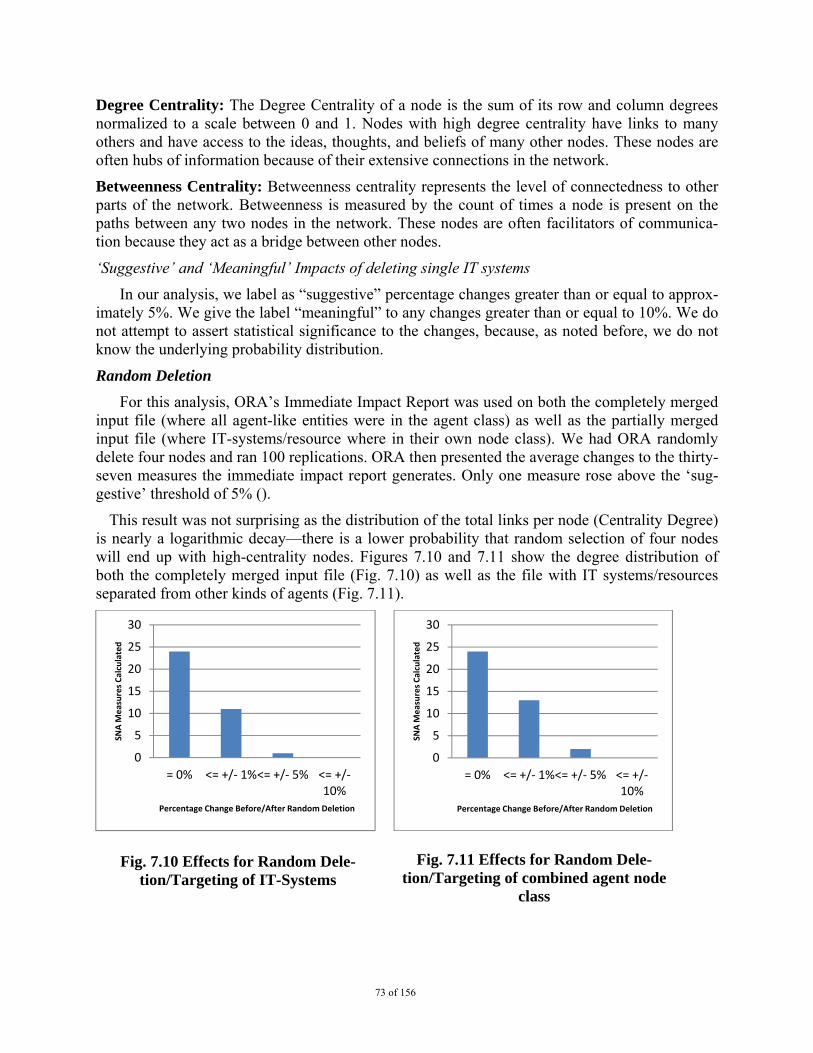
73 of 156
Degree Centrality: The Degree Centrality of a node is the sum of its row and column degrees normalized to a scale between 0 and 1. Nodes with high degree centrality have links to many others and have access to the ideas, thoughts, and beliefs of many other nodes. These nodes are often hubs of information because of their extensive connections in the network.
Betweenness Centrality: Betweenness centrality represents the level of connectedness to other parts of the network. Betweenness is measured by the count of times a node is present on the paths between any two nodes in the network. These nodes are often facilitators of communica-tion because they act as a bridge between other nodes.
‘Suggestive’ and ‘Meaningful’ Impacts of deleting single IT systems
In our analysis, we label as “suggestive” percentage changes greater than or equal to approx-imately 5%. We give the label “meaningful” to any changes greater than or equal to 10%. We do not attempt to assert statistical significance to the changes, because, as noted before, we do not know the underlying probability distribution.
Random Deletion
For this analysis, ORA’s Immediate Impact Report was used on both the completely merged input file (where all agent-like entities were in the agent class) as well as the partially merged input file (where IT-systems/resource where in their own node class). We had ORA randomly delete four nodes and ran 100 replications. ORA then presented the average changes to the thirty-seven measures the immediate impact report generates. Only one measure rose above the ‘sug-gestive’ threshold of 5% ().
This result was not surprising as the distribution of the total links per node (Centrality Degree) is nearly a logarithmic decay—there is a lower probability that random selection of four nodes will end up with high-centrality nodes. Figures 7.10 and 7.11 show the degree distribution of both the completely merged input file (Fig. 7.10) as well as the file with IT systems/resources separated from other kinds of agents (Fig. 7.11).
Fig. 7.10 Effects for Random Dele-tion/Targeting of IT-Systems
Fig. 7.11 Effects for Random Dele-tion/Targeting of combined agent node
class
0
5
10
15
20
25
30
= 0% <= +/‐ 1%<= +/‐ 5% <= +/‐10%
SNA M
easures Calculated
Percentage Change Before/After Random Deletion
0
5
10
15
20
25
30
= 0% <= +/‐ 1%<= +/‐ 5% <= +/‐10%
SNA M
easures Calculated
Percentage Change Before/After Random Deletion
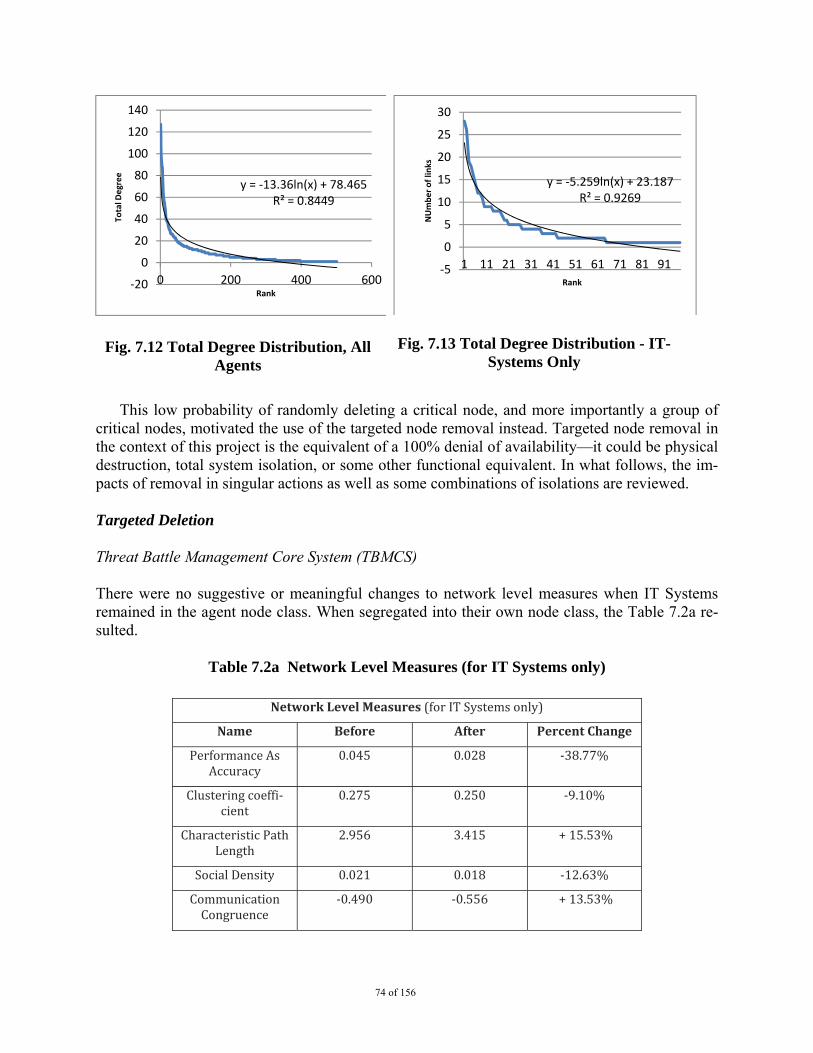
74 of 156
Fig. 7.12 Total Degree Distribution, All Agents
Fig. 7.13 Total Degree Distribution - IT-Systems Only
This low probability of randomly deleting a critical node, and more importantly a group of critical nodes, motivated the use of the targeted node removal instead. Targeted node removal in the context of this project is the equivalent of a 100% denial of availability—it could be physical destruction, total system isolation, or some other functional equivalent. In what follows, the im-pacts of removal in singular actions as well as some combinations of isolations are reviewed. Targeted Deletion Threat Battle Management Core System (TBMCS) There were no suggestive or meaningful changes to network level measures when IT Systems remained in the agent node class. When segregated into their own node class, the Table 7.2a re-sulted.
Table 7.2a Network Level Measures (for IT Systems only)
y = ‐13.36ln(x) + 78.465R² = 0.8449
‐20
0
20
40
60
80
100
120
140
0 200 400 600
Total D
egree
Rank
y = ‐5.259ln(x) + 23.187R² = 0.9269
‐5
0
5
10
15
20
25
30
1 11 21 31 41 51 61 71 81 91
NUmber of lin
ks
Rank
Network Level Measures (for IT Systems only)
Name Before After Percent Change
Performance As Accuracy
0.045 0.028 ‐38.77%
Clustering coeffi‐cient
0.275 0.250 ‐9.10%
Characteristic Path Length
2.956 3.415 + 15.53%
Social Density 0.021 0.018 ‐12.63%
Communication Congruence
‐0.490 ‐0.556 + 13.53%
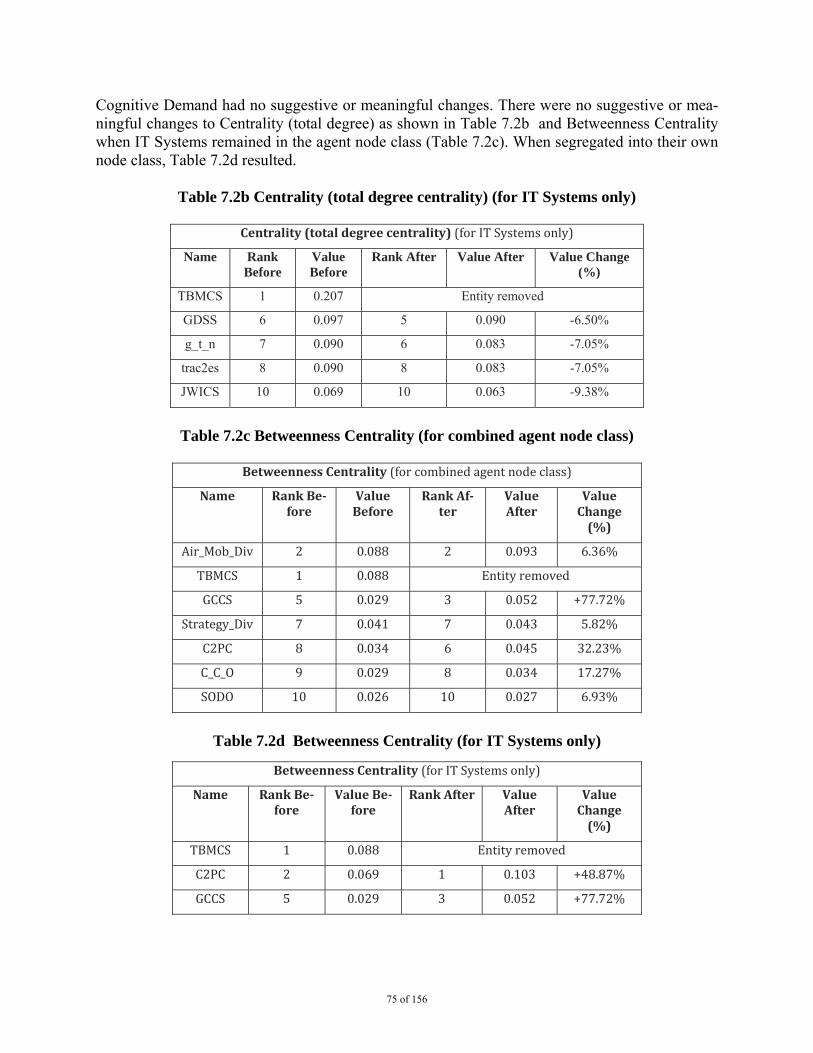
75 of 156
Cognitive Demand had no suggestive or meaningful changes. There were no suggestive or mea-ningful changes to Centrality (total degree) as shown in Table 7.2b and Betweenness Centrality when IT Systems remained in the agent node class (Table 7.2c). When segregated into their own node class, Table 7.2d resulted.
Table 7.2b Centrality (total degree centrality) (for IT Systems only)
Centrality (total degree centrality) (for IT Systems only)
Name Rank Before
Value Before
Rank After Value After Value Change (%)
TBMCS 1 0.207 Entity removed
GDSS 6 0.097 5 0.090 -6.50%
g_t_n 7 0.090 6 0.083 -7.05%
trac2es 8 0.090 8 0.083 -7.05%
JWICS 10 0.069 10 0.063 -9.38%
Table 7.2c Betweenness Centrality (for combined agent node class)
Betweenness Centrality (for combined agent node class)
Name Rank Before
Value Before
Rank After
Value After
Value Change (%)
Air_Mob_Div 2 0.088 2 0.093 6.36%
TBMCS 1 0.088 Entity removed
GCCS 5 0.029 3 0.052 +77.72%
Strategy_Div 7 0.041 7 0.043 5.82%
C2PC 8 0.034 6 0.045 32.23%
C_C_O 9 0.029 8 0.034 17.27%
SODO 10 0.026 10 0.027 6.93%
Table 7.2d Betweenness Centrality (for IT Systems only)
Betweenness Centrality (for IT Systems only)
Name Rank Before
Value Before
Rank After Value After
Value Change (%)
TBMCS 1 0.088 Entity removed
C2PC 2 0.069 1 0.103 +48.87%
GCCS 5 0.029 3 0.052 +77.72%
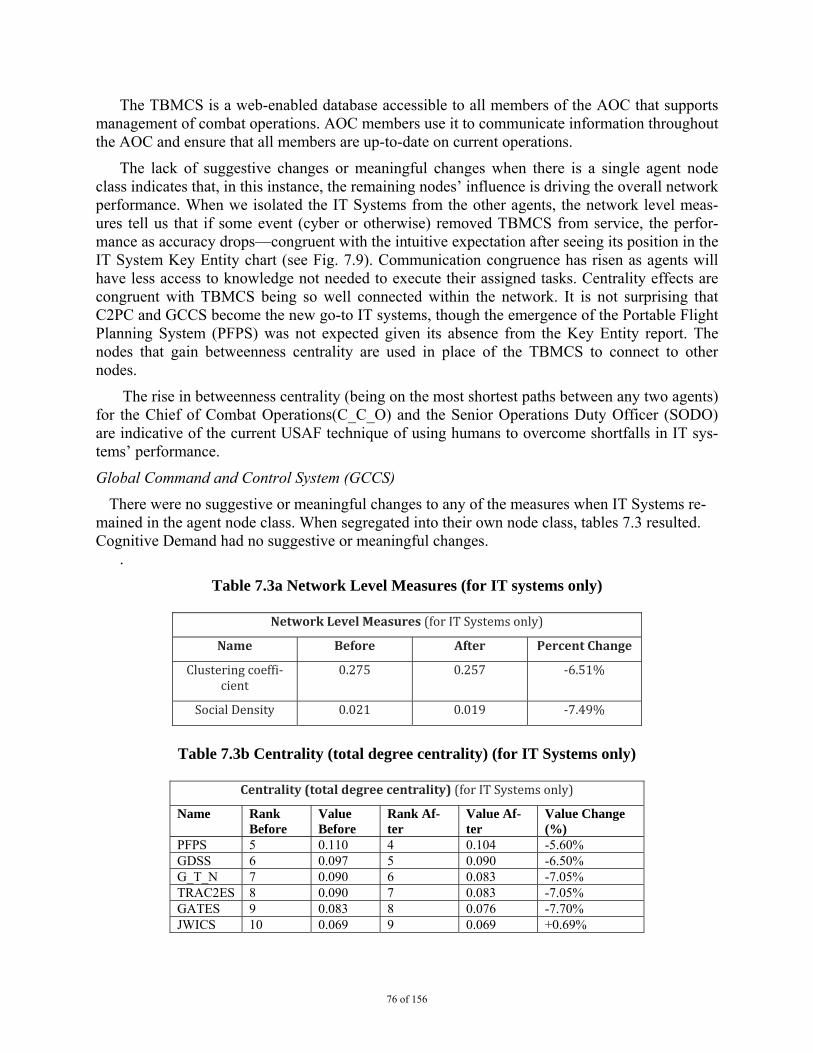
76 of 156
The TBMCS is a web-enabled database accessible to all members of the AOC that supports management of combat operations. AOC members use it to communicate information throughout the AOC and ensure that all members are up-to-date on current operations.
The lack of suggestive changes or meaningful changes when there is a single agent node class indicates that, in this instance, the remaining nodes’ influence is driving the overall network performance. When we isolated the IT Systems from the other agents, the network level meas-ures tell us that if some event (cyber or otherwise) removed TBMCS from service, the perfor-mance as accuracy drops—congruent with the intuitive expectation after seeing its position in the IT System Key Entity chart (see Fig. 7.9). Communication congruence has risen as agents will have less access to knowledge not needed to execute their assigned tasks. Centrality effects are congruent with TBMCS being so well connected within the network. It is not surprising that C2PC and GCCS become the new go-to IT systems, though the emergence of the Portable Flight Planning System (PFPS) was not expected given its absence from the Key Entity report. The nodes that gain betweenness centrality are used in place of the TBMCS to connect to other nodes.
The rise in betweenness centrality (being on the most shortest paths between any two agents) for the Chief of Combat Operations(C_C_O) and the Senior Operations Duty Officer (SODO) are indicative of the current USAF technique of using humans to overcome shortfalls in IT sys-tems’ performance.
Global Command and Control System (GCCS)
There were no suggestive or meaningful changes to any of the measures when IT Systems re-mained in the agent node class. When segregated into their own node class, tables 7.3 resulted. Cognitive Demand had no suggestive or meaningful changes.
.
Table 7.3a Network Level Measures (for IT systems only)
Network Level Measures (for IT Systems only)
Name Before After Percent Change
Clustering coeffi‐cient
0.275 0.257 ‐6.51%
Social Density 0.021 0.019 ‐7.49%
Table 7.3b Centrality (total degree centrality) (for IT Systems only)
Centrality (total degree centrality) (for IT Systems only)
Name Rank Before
Value Before
Rank Af-ter
Value Af-ter
Value Change (%)
PFPS 5 0.110 4 0.104 -5.60% GDSS 6 0.097 5 0.090 -6.50% G_T_N 7 0.090 6 0.083 -7.05% TRAC2ES 8 0.090 7 0.083 -7.05% GATES 9 0.083 8 0.076 -7.70% JWICS 10 0.069 9 0.069 +0.69%
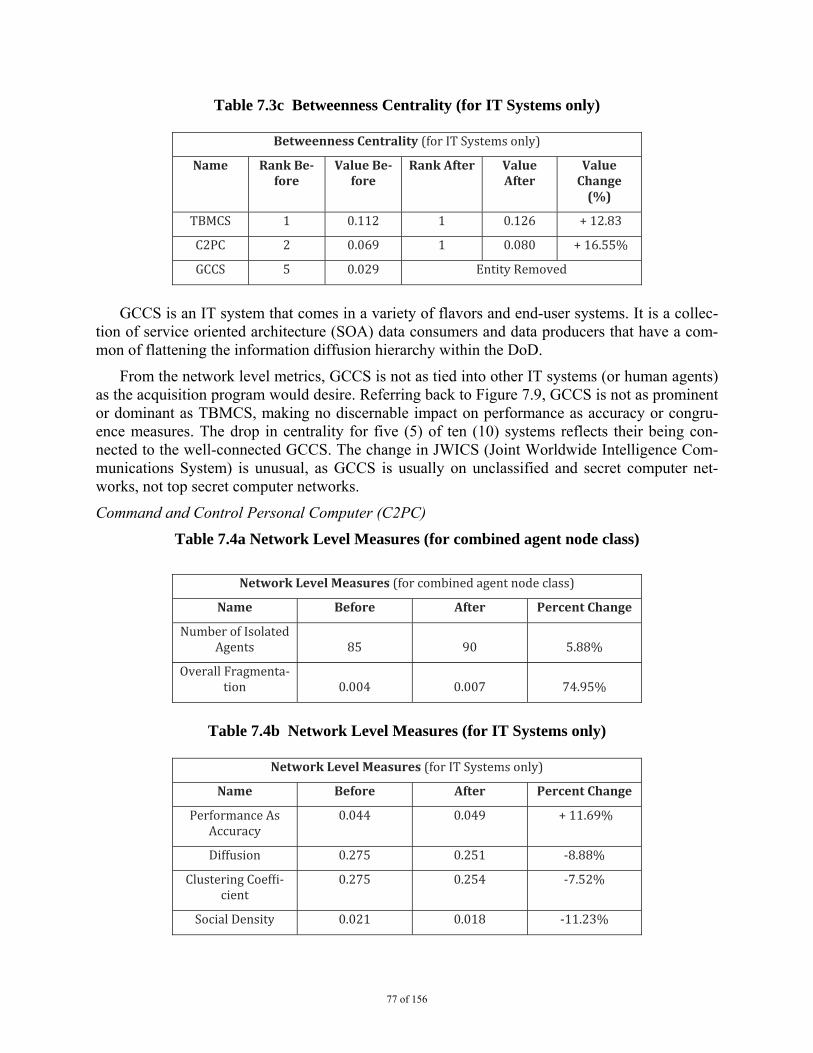
77 of 156
Table 7.3c Betweenness Centrality (for IT Systems only)
Betweenness Centrality (for IT Systems only)
Name Rank Before
Value Before
Rank After Value After
Value Change (%)
TBMCS 1 0.112 1 0.126 + 12.83
C2PC 2 0.069 1 0.080 + 16.55%
GCCS 5 0.029 Entity Removed
GCCS is an IT system that comes in a variety of flavors and end-user systems. It is a collec-
tion of service oriented architecture (SOA) data consumers and data producers that have a com-mon of flattening the information diffusion hierarchy within the DoD.
From the network level metrics, GCCS is not as tied into other IT systems (or human agents) as the acquisition program would desire. Referring back to Figure 7.9, GCCS is not as prominent or dominant as TBMCS, making no discernable impact on performance as accuracy or congru-ence measures. The drop in centrality for five (5) of ten (10) systems reflects their being con-nected to the well-connected GCCS. The change in JWICS (Joint Worldwide Intelligence Com-munications System) is unusual, as GCCS is usually on unclassified and secret computer net-works, not top secret computer networks.
Command and Control Personal Computer (C2PC)
Table 7.4a Network Level Measures (for combined agent node class)
Network Level Measures (for combined agent node class)
Name Before After Percent Change
Number of Isolated Agents 85 90 5.88%
Overall Fragmenta‐tion 0.004 0.007 74.95%
Table 7.4b Network Level Measures (for IT Systems only)
Network Level Measures (for IT Systems only)
Name Before After Percent Change
Performance As Accuracy
0.044 0.049 + 11.69%
Diffusion 0.275 0.251 ‐8.88%
Clustering Coeffi‐cient
0.275 0.254 ‐7.52%
Social Density 0.021 0.018 ‐11.23%
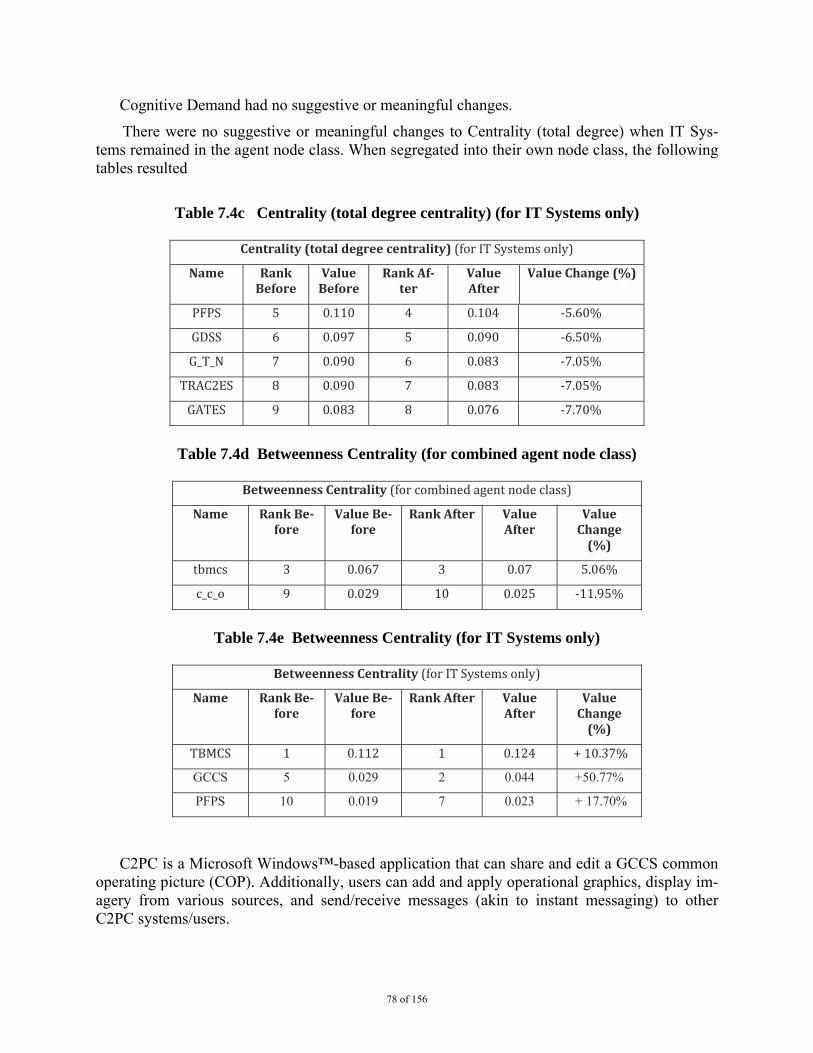
78 of 156
Cognitive Demand had no suggestive or meaningful changes.
There were no suggestive or meaningful changes to Centrality (total degree) when IT Sys-tems remained in the agent node class. When segregated into their own node class, the following tables resulted
Table 7.4c Centrality (total degree centrality) (for IT Systems only)
Centrality (total degree centrality) (for IT Systems only)
Name Rank Before
Value Before
Rank After
Value After
Value Change (%)
PFPS 5 0.110 4 0.104 ‐5.60%
GDSS 6 0.097 5 0.090 ‐6.50%
G_T_N 7 0.090 6 0.083 ‐7.05%
TRAC2ES 8 0.090 7 0.083 ‐7.05%
GATES 9 0.083 8 0.076 ‐7.70%
Table 7.4d Betweenness Centrality (for combined agent node class)
Betweenness Centrality (for combined agent node class)
Name Rank Before
Value Before
Rank After Value After
Value Change (%)
tbmcs 3 0.067 3 0.07 5.06%
c_c_o 9 0.029 10 0.025 ‐11.95%
Table 7.4e Betweenness Centrality (for IT Systems only)
Betweenness Centrality (for IT Systems only)
Name Rank Before
Value Before
Rank After Value After
Value Change (%)
TBMCS 1 0.112 1 0.124 + 10.37%
GCCS 5 0.029 2 0.044 +50.77%
PFPS 10 0.019 7 0.023 + 17.70%
C2PC is a Microsoft Windows™-based application that can share and edit a GCCS common operating picture (COP). Additionally, users can add and apply operational graphics, display im-agery from various sources, and send/receive messages (akin to instant messaging) to other C2PC systems/users.
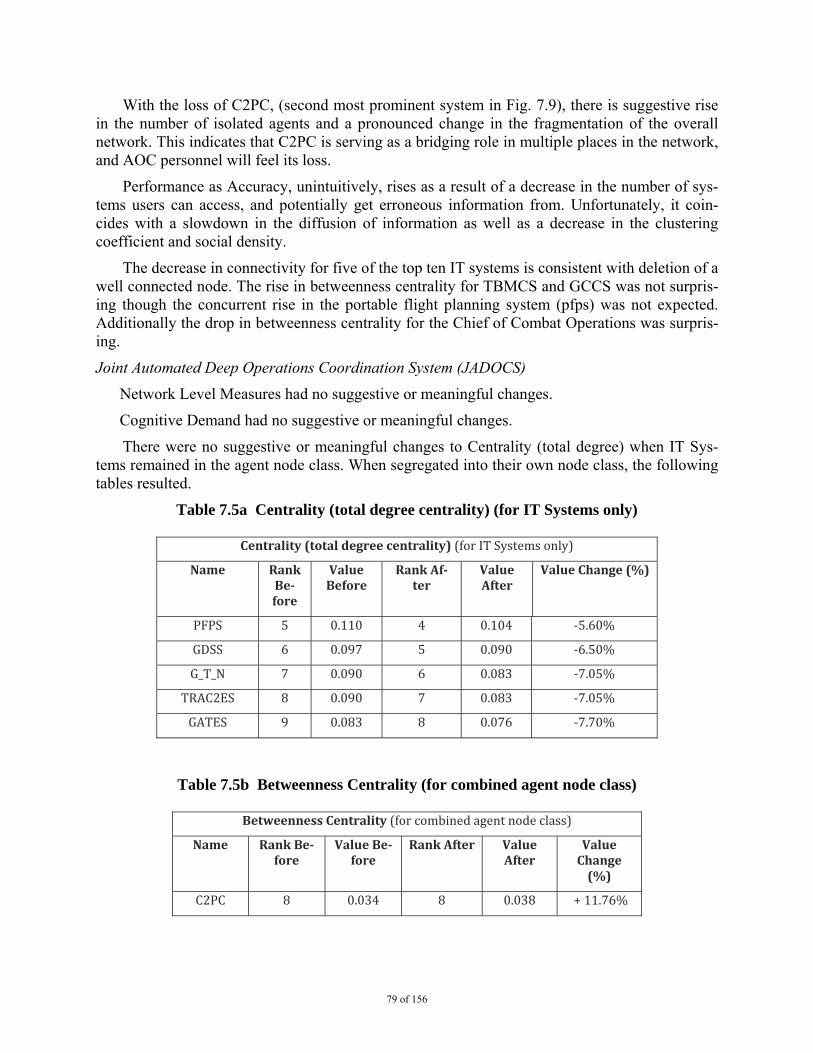
79 of 156
With the loss of C2PC, (second most prominent system in Fig. 7.9), there is suggestive rise in the number of isolated agents and a pronounced change in the fragmentation of the overall network. This indicates that C2PC is serving as a bridging role in multiple places in the network, and AOC personnel will feel its loss.
Performance as Accuracy, unintuitively, rises as a result of a decrease in the number of sys-tems users can access, and potentially get erroneous information from. Unfortunately, it coin-cides with a slowdown in the diffusion of information as well as a decrease in the clustering coefficient and social density.
The decrease in connectivity for five of the top ten IT systems is consistent with deletion of a well connected node. The rise in betweenness centrality for TBMCS and GCCS was not surpris-ing though the concurrent rise in the portable flight planning system (pfps) was not expected. Additionally the drop in betweenness centrality for the Chief of Combat Operations was surpris-ing.
Joint Automated Deep Operations Coordination System (JADOCS)
Network Level Measures had no suggestive or meaningful changes.
Cognitive Demand had no suggestive or meaningful changes.
There were no suggestive or meaningful changes to Centrality (total degree) when IT Sys-tems remained in the agent node class. When segregated into their own node class, the following tables resulted.
Table 7.5a Centrality (total degree centrality) (for IT Systems only)
Centrality (total degree centrality) (for IT Systems only)
Name Rank Before
Value Before
Rank After
Value After
Value Change (%)
PFPS 5 0.110 4 0.104 ‐5.60%
GDSS 6 0.097 5 0.090 ‐6.50%
G_T_N 7 0.090 6 0.083 ‐7.05%
TRAC2ES 8 0.090 7 0.083 ‐7.05%
GATES 9 0.083 8 0.076 ‐7.70%
Table 7.5b Betweenness Centrality (for combined agent node class)
Betweenness Centrality (for combined agent node class)
Name Rank Before
Value Before
Rank After Value After
Value Change (%)
C2PC 8 0.034 8 0.038 + 11.76%
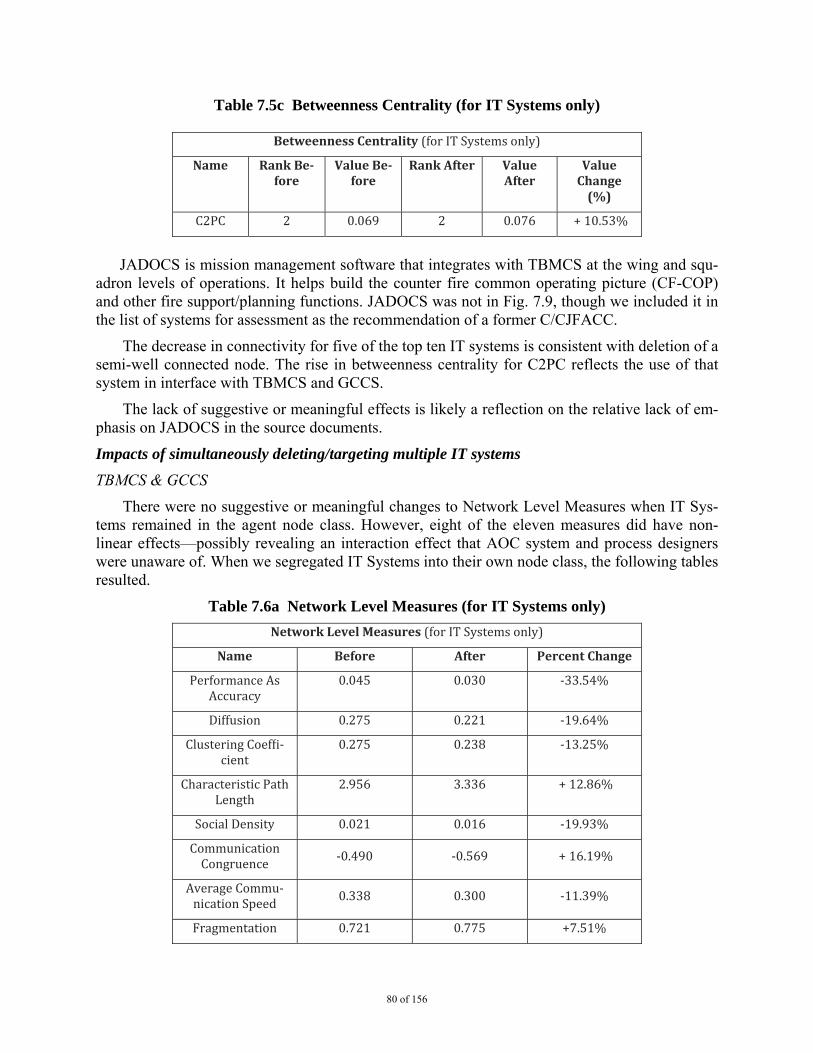
80 of 156
Table 7.5c Betweenness Centrality (for IT Systems only)
Betweenness Centrality (for IT Systems only)
Name Rank Before
Value Before
Rank After Value After
Value Change (%)
C2PC 2 0.069 2 0.076 + 10.53%
JADOCS is mission management software that integrates with TBMCS at the wing and squ-
adron levels of operations. It helps build the counter fire common operating picture (CF-COP) and other fire support/planning functions. JADOCS was not in Fig. 7.9, though we included it in the list of systems for assessment as the recommendation of a former C/CJFACC.
The decrease in connectivity for five of the top ten IT systems is consistent with deletion of a semi-well connected node. The rise in betweenness centrality for C2PC reflects the use of that system in interface with TBMCS and GCCS.
The lack of suggestive or meaningful effects is likely a reflection on the relative lack of em-phasis on JADOCS in the source documents.
Impacts of simultaneously deleting/targeting multiple IT systems
TBMCS & GCCS
There were no suggestive or meaningful changes to Network Level Measures when IT Sys-tems remained in the agent node class. However, eight of the eleven measures did have non-linear effects—possibly revealing an interaction effect that AOC system and process designers were unaware of. When we segregated IT Systems into their own node class, the following tables resulted.
Table 7.6a Network Level Measures (for IT Systems only)
Network Level Measures (for IT Systems only)
Name Before After Percent Change
Performance As Accuracy
0.045 0.030 ‐33.54%
Diffusion 0.275 0.221 ‐19.64%
Clustering Coeffi‐cient
0.275 0.238 ‐13.25%
Characteristic Path Length
2.956 3.336 + 12.86%
Social Density 0.021 0.016 ‐19.93%
Communication Congruence
‐0.490 ‐0.569 + 16.19%
Average Commu‐nication Speed
0.338 0.300 ‐11.39%
Fragmentation 0.721 0.775 +7.51%
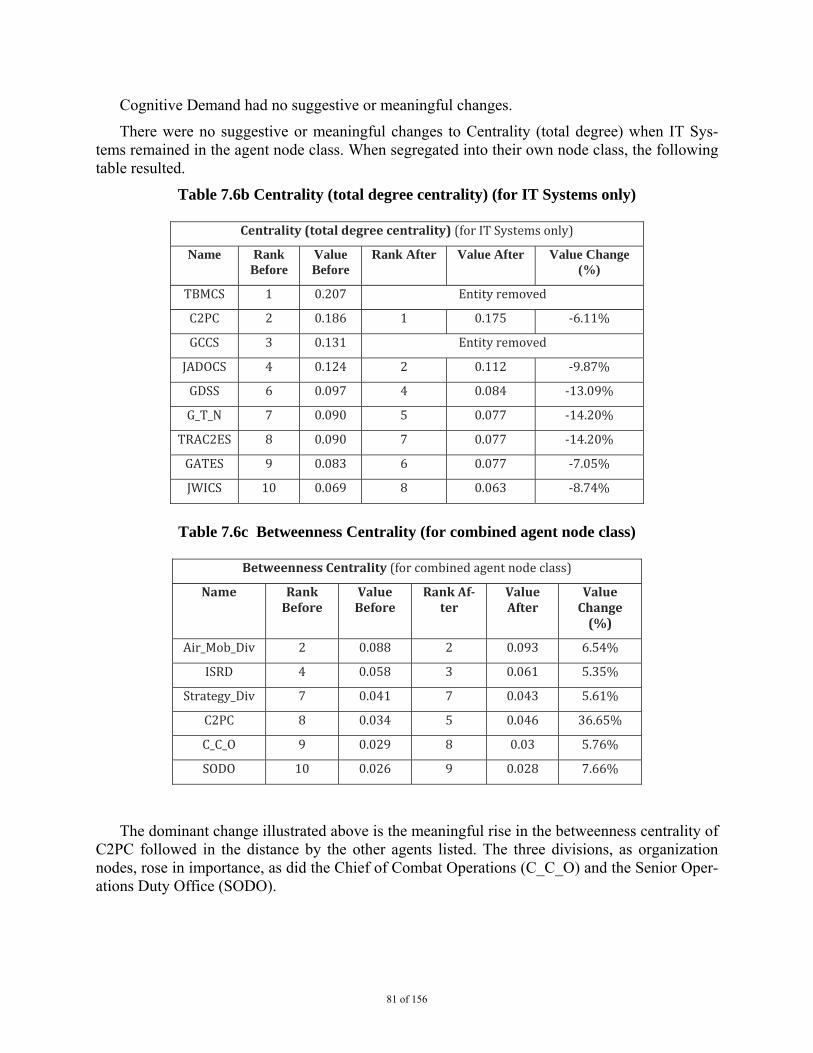
81 of 156
Cognitive Demand had no suggestive or meaningful changes.
There were no suggestive or meaningful changes to Centrality (total degree) when IT Sys-tems remained in the agent node class. When segregated into their own node class, the following table resulted.
Table 7.6b Centrality (total degree centrality) (for IT Systems only)
Centrality (total degree centrality) (for IT Systems only)
Name Rank Before
Value Before
Rank After Value After Value Change (%)
TBMCS 1 0.207 Entity removed
C2PC 2 0.186 1 0.175 ‐6.11%
GCCS 3 0.131 Entity removed
JADOCS 4 0.124 2 0.112 ‐9.87%
GDSS 6 0.097 4 0.084 ‐13.09%
G_T_N 7 0.090 5 0.077 ‐14.20%
TRAC2ES 8 0.090 7 0.077 ‐14.20%
GATES 9 0.083 6 0.077 ‐7.05%
JWICS 10 0.069 8 0.063 ‐8.74%
Table 7.6c Betweenness Centrality (for combined agent node class)
Betweenness Centrality (for combined agent node class)
Name Rank Before
Value Before
Rank After
Value After
Value Change (%)
Air_Mob_Div 2 0.088 2 0.093 6.54%
ISRD 4 0.058 3 0.061 5.35%
Strategy_Div 7 0.041 7 0.043 5.61%
C2PC 8 0.034 5 0.046 36.65%
C_C_O 9 0.029 8 0.03 5.76%
SODO 10 0.026 9 0.028 7.66%
The dominant change illustrated above is the meaningful rise in the betweenness centrality of C2PC followed in the distance by the other agents listed. The three divisions, as organization nodes, rose in importance, as did the Chief of Combat Operations (C_C_O) and the Senior Oper-ations Duty Office (SODO).
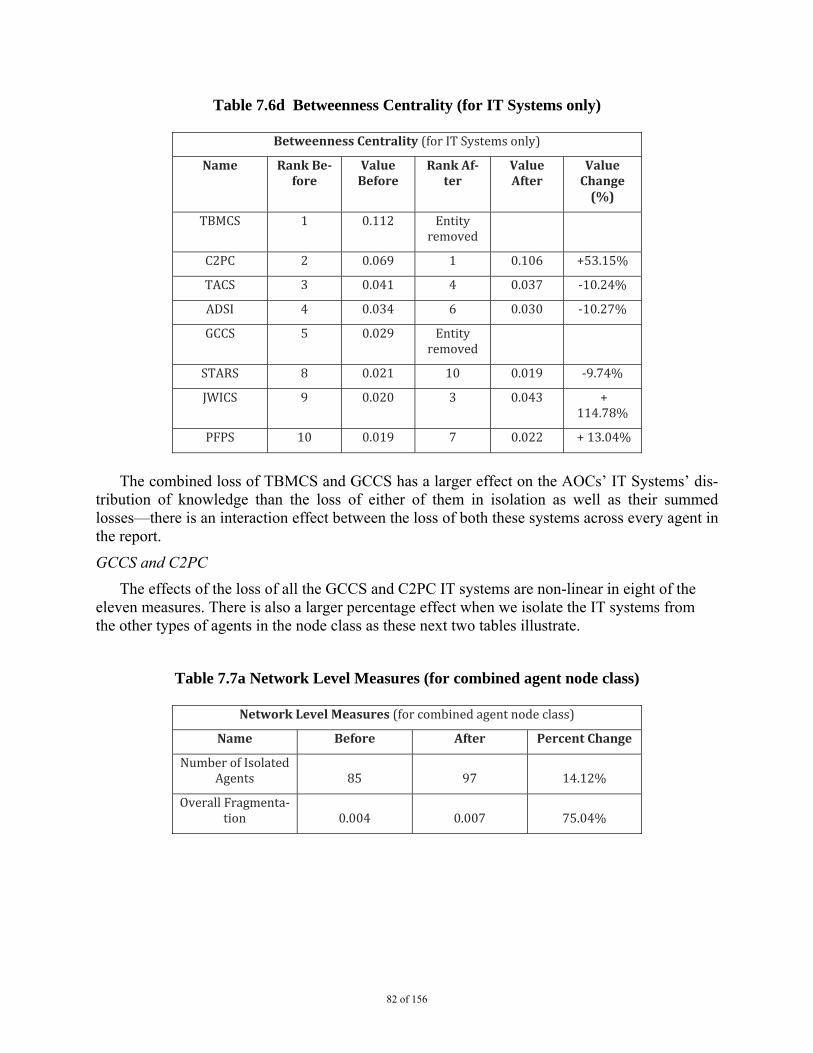
82 of 156
Table 7.6d Betweenness Centrality (for IT Systems only)
Betweenness Centrality (for IT Systems only)
Name Rank Before
Value Before
Rank After
Value After
Value Change (%)
TBMCS 1 0.112 Entity removed
C2PC 2 0.069 1 0.106 +53.15%
TACS 3 0.041 4 0.037 ‐10.24%
ADSI 4 0.034 6 0.030 ‐10.27%
GCCS 5 0.029 Entity removed
STARS 8 0.021 10 0.019 ‐9.74%
JWICS 9 0.020 3 0.043 + 114.78%
PFPS 10 0.019 7 0.022 + 13.04%
The combined loss of TBMCS and GCCS has a larger effect on the AOCs’ IT Systems’ dis-
tribution of knowledge than the loss of either of them in isolation as well as their summed losses—there is an interaction effect between the loss of both these systems across every agent in the report.
GCCS and C2PC
The effects of the loss of all the GCCS and C2PC IT systems are non-linear in eight of the eleven measures. There is also a larger percentage effect when we isolate the IT systems from the other types of agents in the node class as these next two tables illustrate.
Table 7.7a Network Level Measures (for combined agent node class)
Network Level Measures (for combined agent node class)
Name Before After Percent Change
Number of Isolated Agents 85 97 14.12%
Overall Fragmenta‐tion 0.004 0.007 75.04%
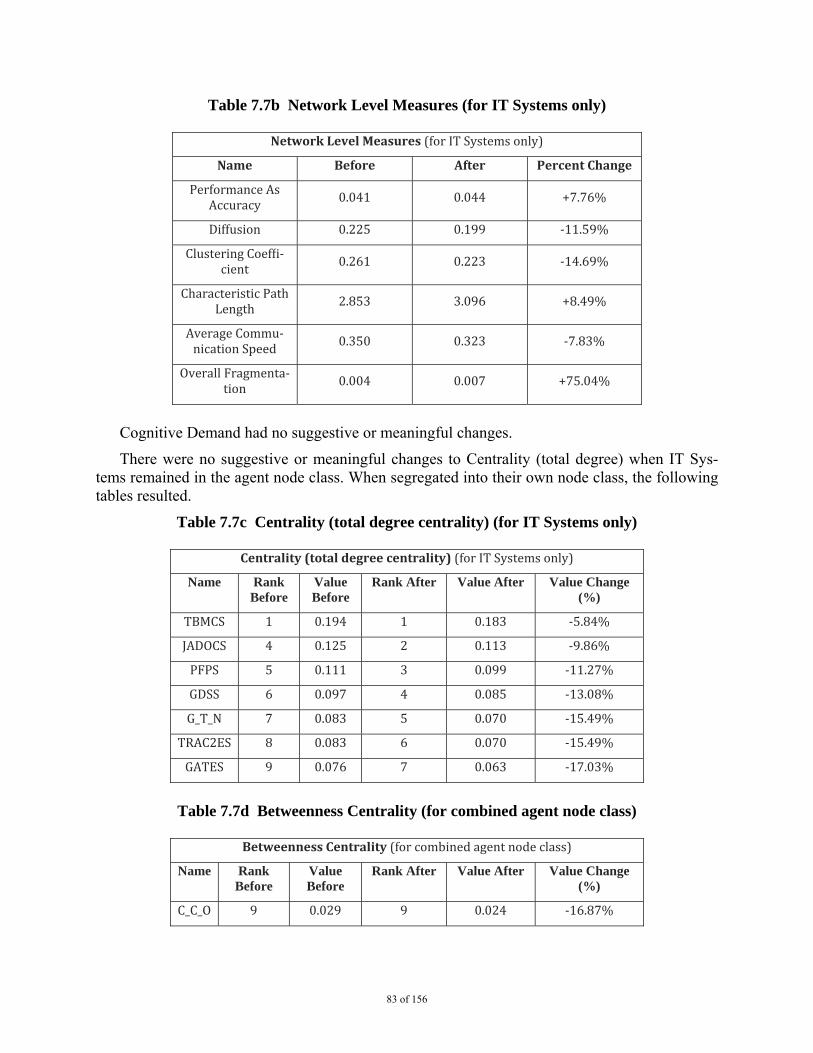
83 of 156
Table 7.7b Network Level Measures (for IT Systems only)
Network Level Measures (for IT Systems only)
Name Before After Percent Change
Performance As Accuracy
0.041 0.044 +7.76%
Diffusion 0.225 0.199 ‐11.59%
Clustering Coeffi‐cient
0.261 0.223 ‐14.69%
Characteristic Path Length
2.853 3.096 +8.49%
Average Commu‐nication Speed 0.350 0.323 ‐7.83%
Overall Fragmenta‐tion 0.004 0.007 +75.04%
Cognitive Demand had no suggestive or meaningful changes.
There were no suggestive or meaningful changes to Centrality (total degree) when IT Sys-tems remained in the agent node class. When segregated into their own node class, the following tables resulted.
Table 7.7c Centrality (total degree centrality) (for IT Systems only)
Centrality (total degree centrality) (for IT Systems only)
Name Rank Before
Value Before
Rank After Value After Value Change (%)
TBMCS 1 0.194 1 0.183 ‐5.84%
JADOCS 4 0.125 2 0.113 ‐9.86%
PFPS 5 0.111 3 0.099 ‐11.27%
GDSS 6 0.097 4 0.085 ‐13.08%
G_T_N 7 0.083 5 0.070 ‐15.49%
TRAC2ES 8 0.083 6 0.070 ‐15.49%
GATES 9 0.076 7 0.063 ‐17.03%
Table 7.7d Betweenness Centrality (for combined agent node class)
Betweenness Centrality (for combined agent node class)
Name Rank Before
Value Before
Rank After Value After Value Change (%)
C_C_O 9 0.029 9 0.024 ‐16.87%
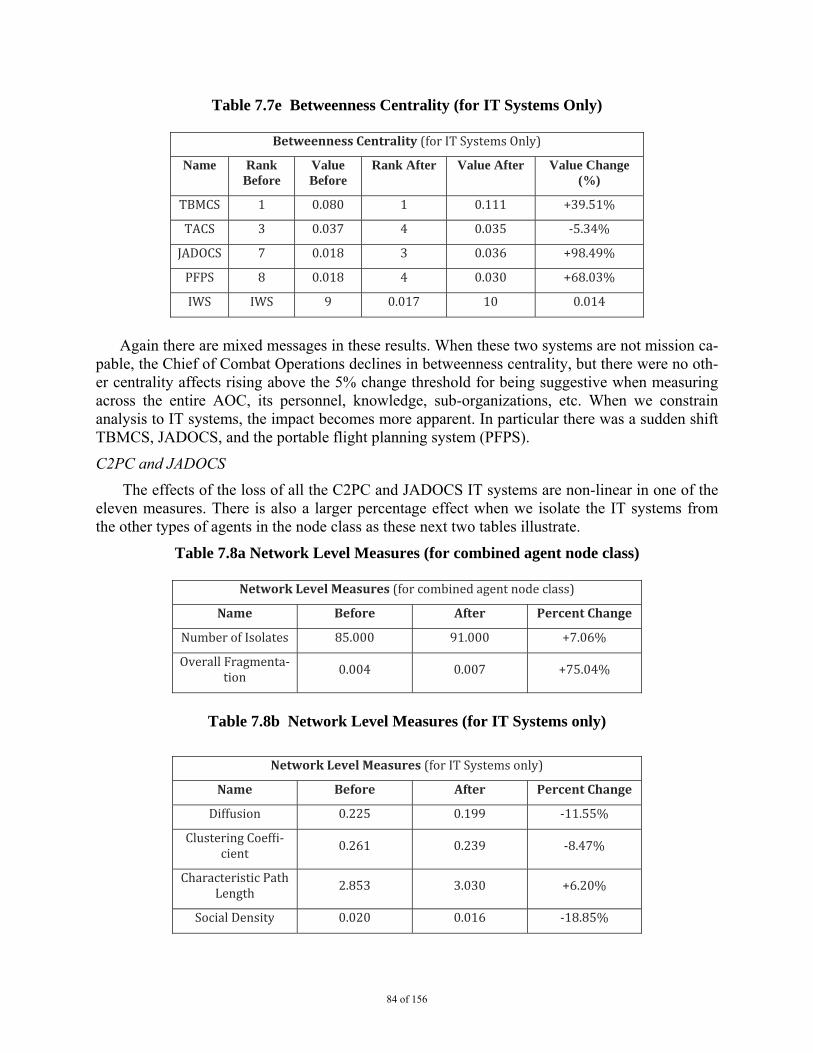
84 of 156
Table 7.7e Betweenness Centrality (for IT Systems Only)
Betweenness Centrality (for IT Systems Only)
Name Rank Before
Value Before
Rank After Value After Value Change (%)
TBMCS 1 0.080 1 0.111 +39.51%
TACS 3 0.037 4 0.035 ‐5.34%
JADOCS 7 0.018 3 0.036 +98.49%
PFPS 8 0.018 4 0.030 +68.03%
IWS IWS 9 0.017 10 0.014
Again there are mixed messages in these results. When these two systems are not mission ca-
pable, the Chief of Combat Operations declines in betweenness centrality, but there were no oth-er centrality affects rising above the 5% change threshold for being suggestive when measuring across the entire AOC, its personnel, knowledge, sub-organizations, etc. When we constrain analysis to IT systems, the impact becomes more apparent. In particular there was a sudden shift TBMCS, JADOCS, and the portable flight planning system (PFPS).
C2PC and JADOCS
The effects of the loss of all the C2PC and JADOCS IT systems are non-linear in one of the eleven measures. There is also a larger percentage effect when we isolate the IT systems from the other types of agents in the node class as these next two tables illustrate.
Table 7.8a Network Level Measures (for combined agent node class)
Network Level Measures (for combined agent node class)
Name Before After Percent Change
Number of Isolates 85.000 91.000 +7.06%
Overall Fragmenta‐tion
0.004 0.007 +75.04%
Table 7.8b Network Level Measures (for IT Systems only)
Network Level Measures (for IT Systems only)
Name Before After Percent Change
Diffusion 0.225 0.199 ‐11.55%
Clustering Coeffi‐cient 0.261 0.239 ‐8.47%
Characteristic Path Length 2.853 3.030 +6.20%
Social Density 0.020 0.016 ‐18.85%
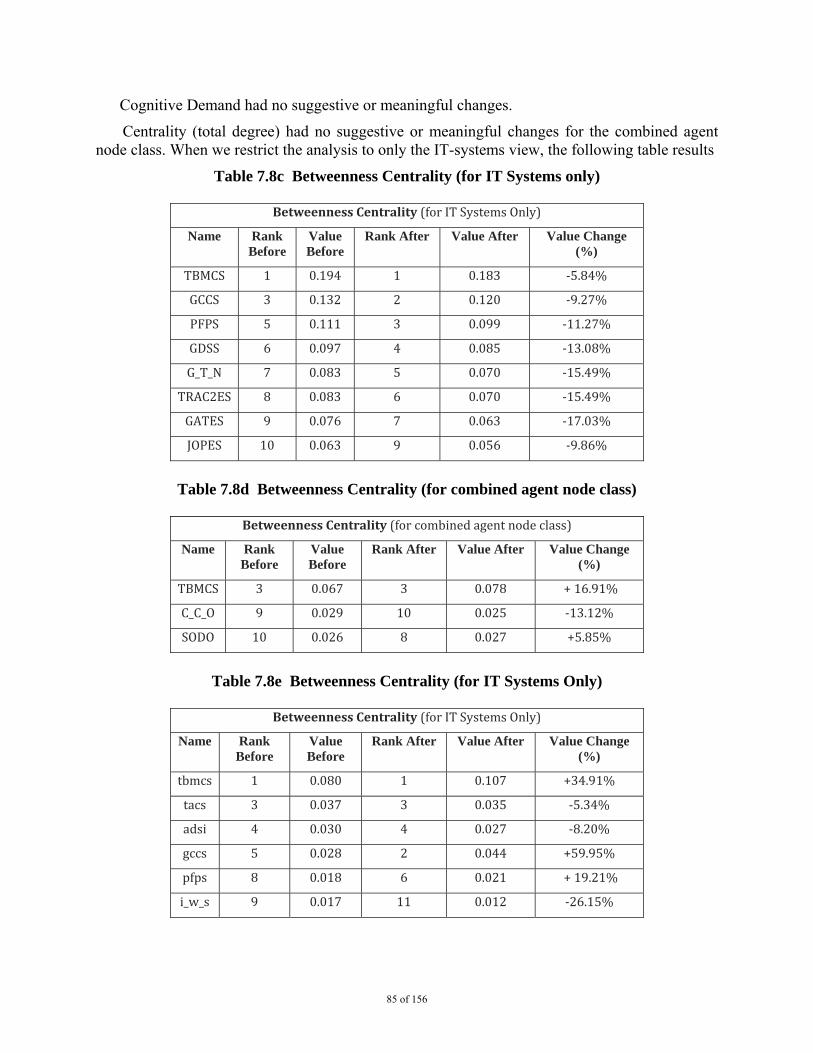
85 of 156
Cognitive Demand had no suggestive or meaningful changes.
Centrality (total degree) had no suggestive or meaningful changes for the combined agent node class. When we restrict the analysis to only the IT-systems view, the following table results
Table 7.8c Betweenness Centrality (for IT Systems only)
Betweenness Centrality (for IT Systems Only)
Name Rank Before
Value Before
Rank After Value After Value Change (%)
TBMCS 1 0.194 1 0.183 ‐5.84%
GCCS 3 0.132 2 0.120 ‐9.27%
PFPS 5 0.111 3 0.099 ‐11.27%
GDSS 6 0.097 4 0.085 ‐13.08%
G_T_N 7 0.083 5 0.070 ‐15.49%
TRAC2ES 8 0.083 6 0.070 ‐15.49%
GATES 9 0.076 7 0.063 ‐17.03%
JOPES 10 0.063 9 0.056 ‐9.86%
Table 7.8d Betweenness Centrality (for combined agent node class)
Betweenness Centrality (for combined agent node class)
Name Rank Before
Value Before
Rank After Value After Value Change (%)
TBMCS 3 0.067 3 0.078 + 16.91%
C_C_O 9 0.029 10 0.025 ‐13.12%
SODO 10 0.026 8 0.027 +5.85%
Table 7.8e Betweenness Centrality (for IT Systems Only)
Betweenness Centrality (for IT Systems Only)
Name Rank Before
Value Before
Rank After Value After Value Change (%)
tbmcs 1 0.080 1 0.107 +34.91%
tacs 3 0.037 3 0.035 ‐5.34%
adsi 4 0.030 4 0.027 ‐8.20%
gccs 5 0.028 2 0.044 +59.95%
pfps 8 0.018 6 0.021 + 19.21%
i_w_s 9 0.017 11 0.012 ‐26.15%
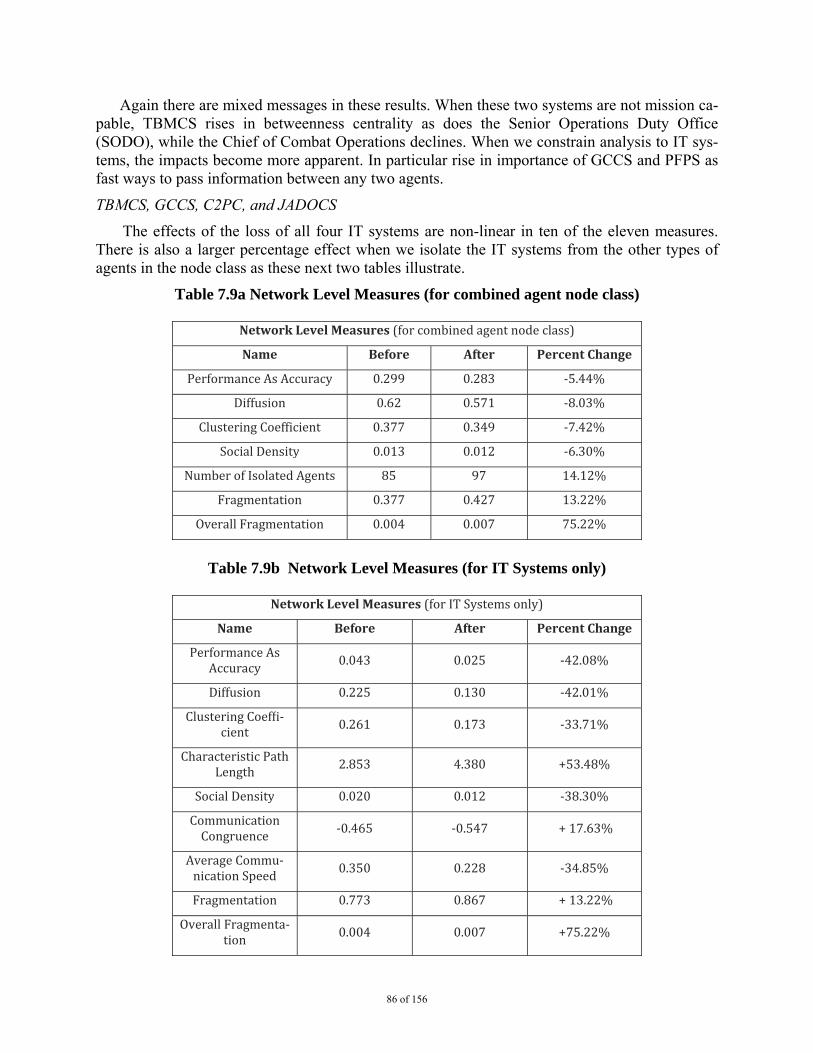
86 of 156
Again there are mixed messages in these results. When these two systems are not mission ca-pable, TBMCS rises in betweenness centrality as does the Senior Operations Duty Office (SODO), while the Chief of Combat Operations declines. When we constrain analysis to IT sys-tems, the impacts become more apparent. In particular rise in importance of GCCS and PFPS as fast ways to pass information between any two agents.
TBMCS, GCCS, C2PC, and JADOCS
The effects of the loss of all four IT systems are non-linear in ten of the eleven measures. There is also a larger percentage effect when we isolate the IT systems from the other types of agents in the node class as these next two tables illustrate.
Table 7.9a Network Level Measures (for combined agent node class)
Network Level Measures (for combined agent node class)
Name Before After Percent Change
Performance As Accuracy 0.299 0.283 ‐5.44%
Diffusion 0.62 0.571 ‐8.03%
Clustering Coefficient 0.377 0.349 ‐7.42%
Social Density 0.013 0.012 ‐6.30%
Number of Isolated Agents 85 97 14.12%
Fragmentation 0.377 0.427 13.22%
Overall Fragmentation 0.004 0.007 75.22%
Table 7.9b Network Level Measures (for IT Systems only)
Network Level Measures (for IT Systems only)
Name Before After Percent Change
Performance As Accuracy 0.043 0.025 ‐42.08%
Diffusion 0.225 0.130 ‐42.01%
Clustering Coeffi‐cient 0.261 0.173 ‐33.71%
Characteristic Path Length 2.853 4.380 +53.48%
Social Density 0.020 0.012 ‐38.30%
Communication Congruence
‐0.465 ‐0.547 + 17.63%
Average Commu‐nication Speed
0.350 0.228 ‐34.85%
Fragmentation 0.773 0.867 + 13.22%
Overall Fragmenta‐tion 0.004 0.007 +75.22%
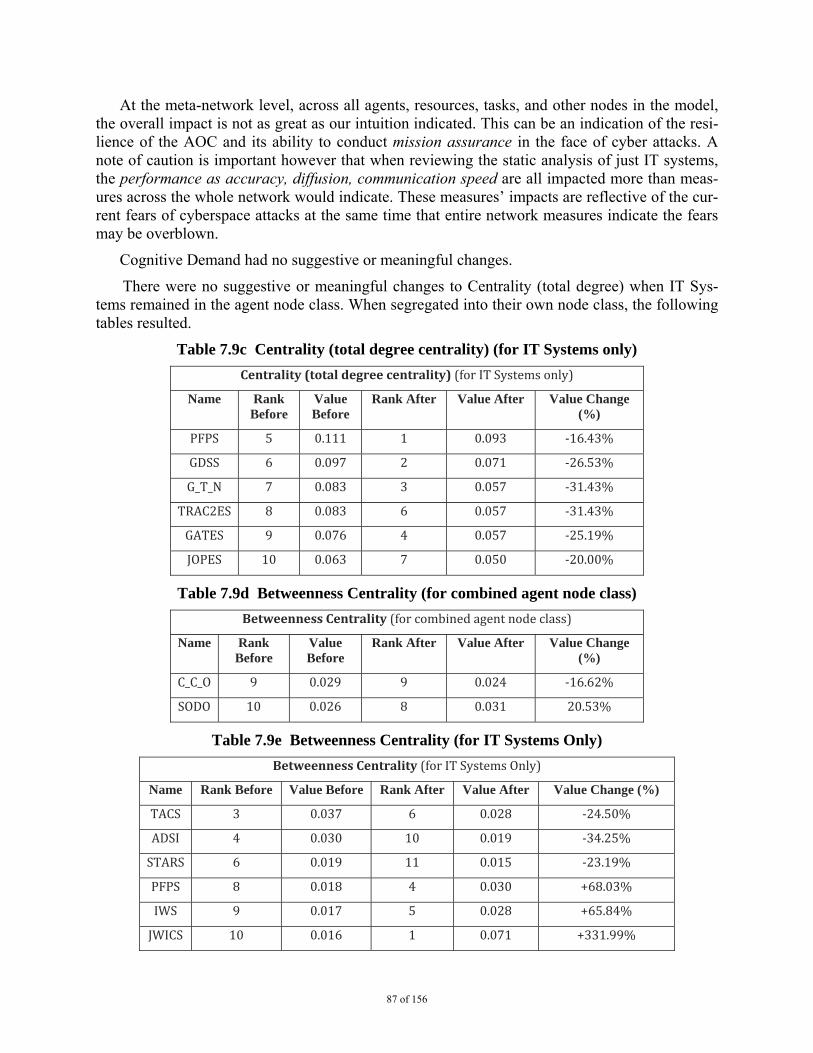
87 of 156
At the meta-network level, across all agents, resources, tasks, and other nodes in the model, the overall impact is not as great as our intuition indicated. This can be an indication of the resi-lience of the AOC and its ability to conduct mission assurance in the face of cyber attacks. A note of caution is important however that when reviewing the static analysis of just IT systems, the performance as accuracy, diffusion, communication speed are all impacted more than meas-ures across the whole network would indicate. These measures’ impacts are reflective of the cur-rent fears of cyberspace attacks at the same time that entire network measures indicate the fears may be overblown.
Cognitive Demand had no suggestive or meaningful changes.
There were no suggestive or meaningful changes to Centrality (total degree) when IT Sys-tems remained in the agent node class. When segregated into their own node class, the following tables resulted.
Table 7.9c Centrality (total degree centrality) (for IT Systems only)
Centrality (total degree centrality) (for IT Systems only)
Name Rank Before
Value Before
Rank After Value After Value Change (%)
PFPS 5 0.111 1 0.093 ‐16.43%
GDSS 6 0.097 2 0.071 ‐26.53%
G_T_N 7 0.083 3 0.057 ‐31.43%
TRAC2ES 8 0.083 6 0.057 ‐31.43%
GATES 9 0.076 4 0.057 ‐25.19%
JOPES 10 0.063 7 0.050 ‐20.00%
Table 7.9d Betweenness Centrality (for combined agent node class)
Betweenness Centrality (for combined agent node class)
Name Rank Before
Value Before
Rank After Value After Value Change (%)
C_C_O 9 0.029 9 0.024 ‐16.62%
SODO 10 0.026 8 0.031 20.53%
Table 7.9e Betweenness Centrality (for IT Systems Only)
Betweenness Centrality (for IT Systems Only)
Name Rank Before Value Before Rank After Value After Value Change (%)
TACS 3 0.037 6 0.028 ‐24.50%
ADSI 4 0.030 10 0.019 ‐34.25%
STARS 6 0.019 11 0.015 ‐23.19%
PFPS 8 0.018 4 0.030 +68.03%
IWS 9 0.017 5 0.028 +65.84%
JWICS 10 0.016 1 0.071 +331.99%
88 of 156
Again there are mixed messages in these results. When these four systems are not mission capable, the SODO will rise in importance while the Chief of Combat Operations declines, but there were no other centrality effects rising above the 5% change threshold for being suggestive when measuring across the entire AOC, its personnel, knowledge, sub-organizations, etc. Only when we constrain analysis to IT systems do the impacts become more apparent. In particular, there is a sudden shift to TS/SCI networks (JWICS) and their messaging and collaboration appli-cation (IWS).
Immediate Impact Reports Conclusions
Analysis of this model and this extreme case, a total denial of availability of four key IT sys-tems, in the context of the entire AOC, revealed a surprising but reassuring result: there are no catastrophic consequences predicted. This must be taken with a grain of salt however. The result is a snap shot in time, not a prediction over time. Equally important, the assessment assumes per-fect assumption of communications by remaining IT systems and perfect adaptation by hu-mans—neither of which is feasible without excellent continuity of operations plans and rehear-sals of those plans.
When assessed exclusively in an IT-System ecosystem context, there are many SNA meas-ures that are well past the ‘suggestive’ and ‘meaningful’ thresholds, some approaching a 50% drop in values from uncontested to contested environments. This is consistent with the percep-tion of technologists that the AOC is extremely vulnerable to cyber attacks.
7.3.5 Near Term Analysis and Conclusions
ORA has an additional way of assessing the impacts of various changes to a network. A re-searcher accesses this method through the Simulations Menu of ORA, and selecting the Near Term Analysis (NTA) option.
The NTA is a simplified interface and means of accessing the agent-based model (ABM) ap-plication, Construct. A more thorough discussion of Construct is in Chapter 8. Within NTA, agents interact with each other, exchanging knowledge, for one of two principal reasons: homo-phily (e.g., similarity as inferred from agents’ perception of their own knowledge and their per-ception of others’ knowledge) and expertise seeking (e.g., seeking knowledge an agent does not have). NTA requires a meta-network to have, minimally, the following node sets: agents, tasks, and knowledge. The simulation supports and uses a belief node set as well, though the node set is not mandatory.
When using NTA, a researcher has the option of exploring the impacts of various actions. Actions can include isolating/deleting of one or more agents, knowledge, tasks, and beliefs at the same or various times during the simulation. Another action could include adding knowledge (e.g., an intelligence report). Nodes can be isolated by directed specific targeting as well as through the use of ORA-calculated measures (i.e., Centrality, Total Degree; Cognitive Demand; Clique Count; Centrality, Betweenness; Exclusivity, Task; Exclusivity, Knowledge). In addition to using those measures, the researcher can set a specified isolation time as well as a specified number of nodes to isolate. The nodes a researcher can isolate are Agents, Knowledge, and Re-sources.
Figure 7.14 depicts the impact of single-node isolation at time zero (0) of each of the top nodes we deleted in the static analysis. The figure depicts the overall change in knowledge diffusion from the baseline. We set NTA to run for 25 time periods, meaning each agent has 25 opportuni-
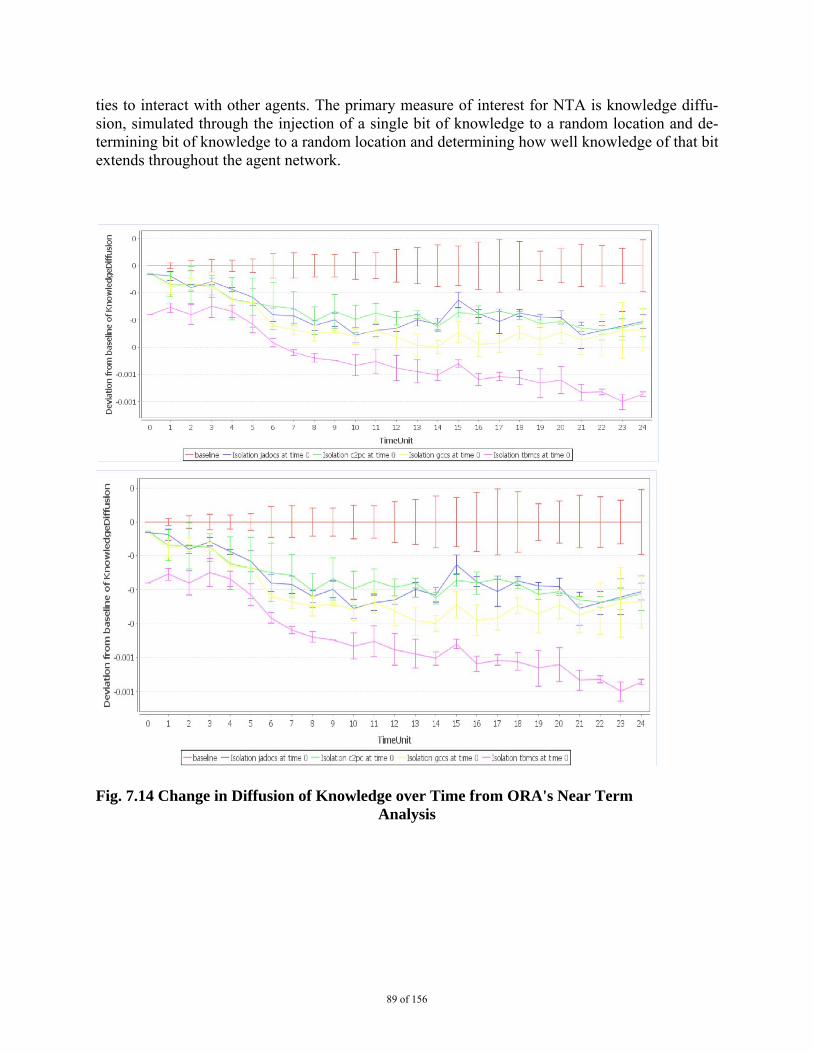
89 of 156
ties to interact with other agents. The primary measure of interest for NTA is knowledge diffu-sion, simulated through the injection of a single bit of knowledge to a random location and de-termining bit of knowledge to a random location and determining how well knowledge of that bit extends throughout the agent network.
Fig. 7.14 Change in Diffusion of Knowledge over Time from ORA's Near Term
Analysis
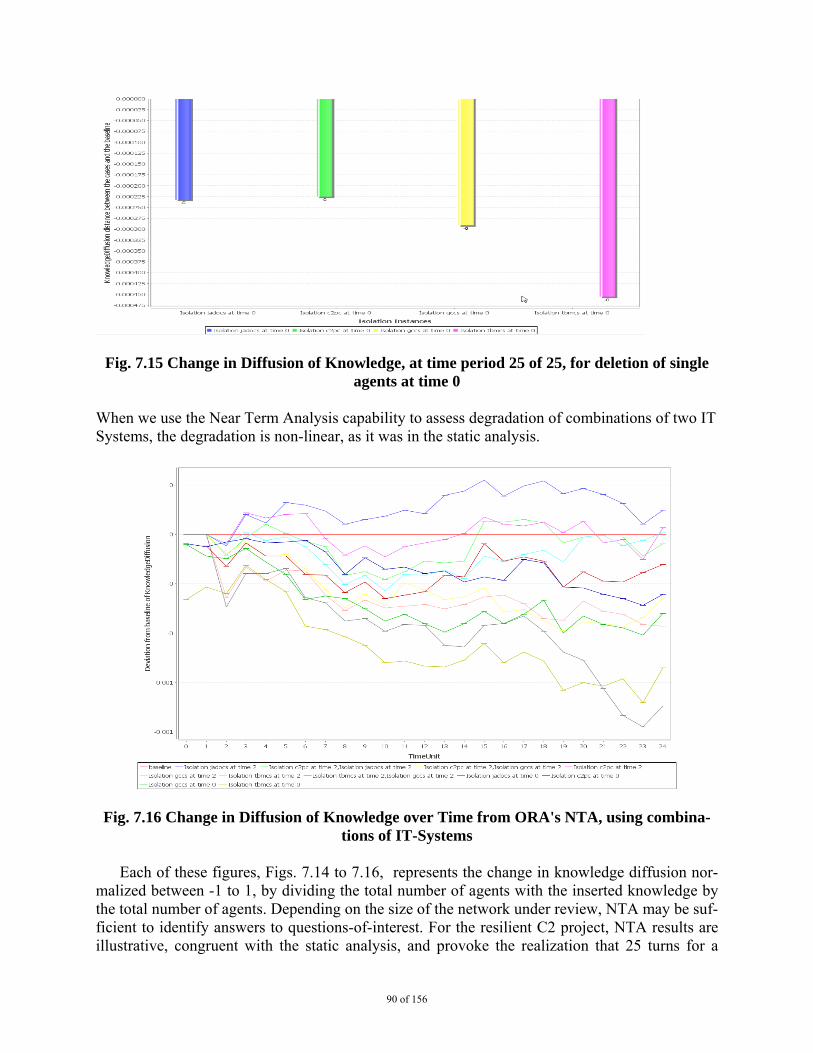
90 of 156
Fig. 7.15 Change in Diffusion of Knowledge, at time period 25 of 25, for deletion of single agents at time 0
When we use the Near Term Analysis capability to assess degradation of combinations of two IT Systems, the degradation is non-linear, as it was in the static analysis.
Fig. 7.16 Change in Diffusion of Knowledge over Time from ORA's NTA, using combina-tions of IT-Systems
Each of these figures, Figs. 7.14 to 7.16, represents the change in knowledge diffusion nor-malized between -1 to 1, by dividing the total number of agents with the inserted knowledge by the total number of agents. Depending on the size of the network under review, NTA may be suf-ficient to identify answers to questions-of-interest. For the resilient C2 project, NTA results are illustrative, congruent with the static analysis, and provoke the realization that 25 turns for a
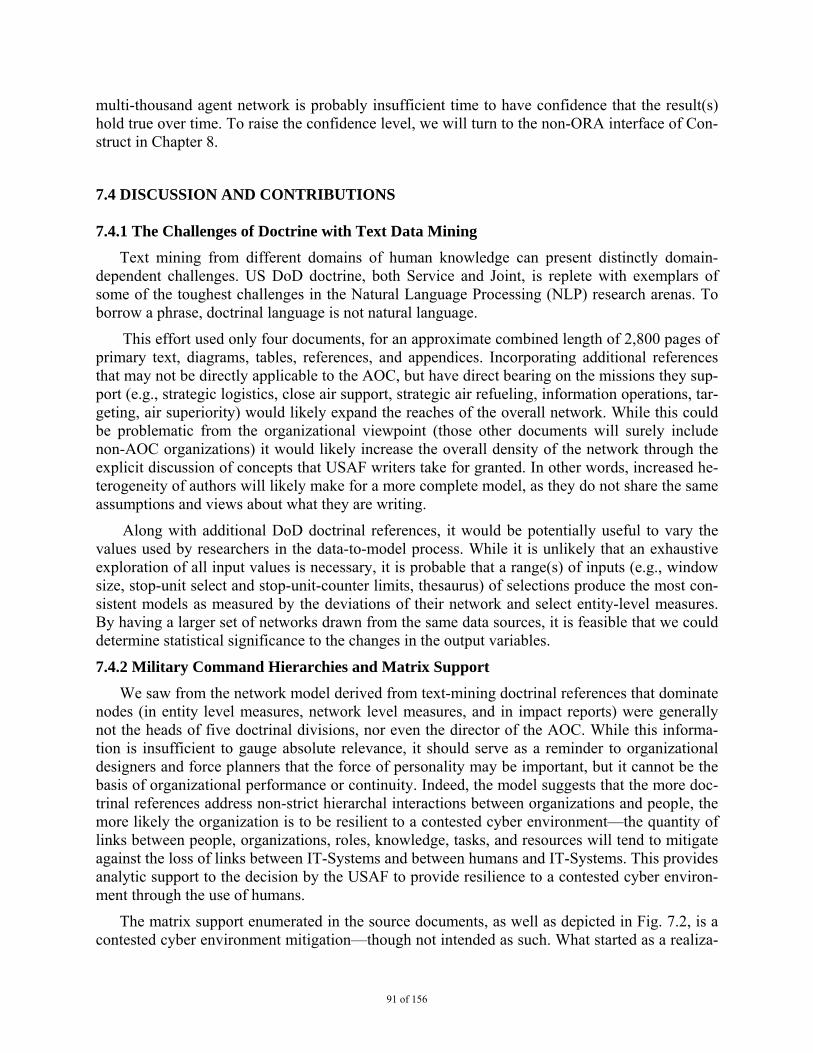
91 of 156
multi-thousand agent network is probably insufficient time to have confidence that the result(s) hold true over time. To raise the confidence level, we will turn to the non-ORA interface of Con-struct in Chapter 8.
7.4 DISCUSSION AND CONTRIBUTIONS 7.4.1 The Challenges of Doctrine with Text Data Mining
Text mining from different domains of human knowledge can present distinctly domain-dependent challenges. US DoD doctrine, both Service and Joint, is replete with exemplars of some of the toughest challenges in the Natural Language Processing (NLP) research arenas. To borrow a phrase, doctrinal language is not natural language.
This effort used only four documents, for an approximate combined length of 2,800 pages of primary text, diagrams, tables, references, and appendices. Incorporating additional references that may not be directly applicable to the AOC, but have direct bearing on the missions they sup-port (e.g., strategic logistics, close air support, strategic air refueling, information operations, tar-geting, air superiority) would likely expand the reaches of the overall network. While this could be problematic from the organizational viewpoint (those other documents will surely include non-AOC organizations) it would likely increase the overall density of the network through the explicit discussion of concepts that USAF writers take for granted. In other words, increased he-terogeneity of authors will likely make for a more complete model, as they do not share the same assumptions and views about what they are writing.
Along with additional DoD doctrinal references, it would be potentially useful to vary the values used by researchers in the data-to-model process. While it is unlikely that an exhaustive exploration of all input values is necessary, it is probable that a range(s) of inputs (e.g., window size, stop-unit select and stop-unit-counter limits, thesaurus) of selections produce the most con-sistent models as measured by the deviations of their network and select entity-level measures. By having a larger set of networks drawn from the same data sources, it is feasible that we could determine statistical significance to the changes in the output variables.
7.4.2 Military Command Hierarchies and Matrix Support
We saw from the network model derived from text-mining doctrinal references that dominate nodes (in entity level measures, network level measures, and in impact reports) were generally not the heads of five doctrinal divisions, nor even the director of the AOC. While this informa-tion is insufficient to gauge absolute relevance, it should serve as a reminder to organizational designers and force planners that the force of personality may be important, but it cannot be the basis of organizational performance or continuity. Indeed, the model suggests that the more doc-trinal references address non-strict hierarchal interactions between organizations and people, the more likely the organization is to be resilient to a contested cyber environment—the quantity of links between people, organizations, roles, knowledge, tasks, and resources will tend to mitigate against the loss of links between IT-Systems and between humans and IT-Systems. This provides analytic support to the decision by the USAF to provide resilience to a contested cyber environ-ment through the use of humans.
The matrix support enumerated in the source documents, as well as depicted in Fig. 7.2, is a contested cyber environment mitigation—though not intended as such. What started as a realiza-
92 of 156
tion that no finite hierarchy can cleanly divide all tasks among its branches, has lead to a hybrid of hierarchy and functional group organization. This hybridization clearly has benefits in sup-porting leaders’ task delegation and matching expertise to tasks. Additionally, the hybridization increases the formal and informal links between people, roles, and organizations. With increased links comes increased probabilities of interaction, information sharing, sharing a common culture and situation understanding, ultimately leading to organizational effectiveness. These additional links make the network resistant to catastrophic damage from random failures and attacks. The extra links also decrease the prominence of any particular agent, role, IT-System, and organiza-tion—further militating against loss of any single node in the overall network.
There is clearly trade space between additional links (compared to a strict hierarchy or strict matrix organization) and an excessive number of links that lead to inefficiencies. Those ineffi-ciencies are measurable in this kind of model—and models that replicate burdensome staffing and routing procedures would reflect the inefficiencies even more prominently. Inefficiencies are the bedfellow of resilience—a 100% efficient organization, with no mismatch between that which it needs and that which it has, that which it does and that which it needs to do, is an organ-ization that has little to no resilience in the face of non-optimal conditions.
7.4.3 Future Work
The immediate impact analysis report on agents and roles (e.g., total removal from the net-work) is not generally representative of a situation that would actually occur. While clearly loss of individuals occurs, one of the on-going tasks in every military organization is the training of subordinates and peers to assume the duties of fallen leaders. The over time execution of this task, as well as the near-continuous personnel turbulence of military organization is not well re-flected in the model but does serve to reduce the probability that tacit knowledge will be forever lost due to personnel loss or turbulence. That the model does not capture this information is pri-marily a reflection of the fact that the doctrine writers for the operations of the AOC would not generally write about inter-personal professional development, personnel manning policies, and a myriad other sub-domains of knowledge that they take for granted. Text mining takes nothing for granted and is generally constrained to the prima facie evidence in the documents from which to draw inferences and conclusions.
The immediate impact analyses we performed only looked at the top ten nodes in specific measures when a key node was removed from the network. By only looking at the top ten nodes in specific measures, we limited our analysis to a small, exclusive set of nodes. We also, for the sake of reducing modeling complexity, did not extensively reflect information technology-mediate communications or the inter-connectedness of that technology. By avoiding the technol-ogy-dependent discussions, we reduced the complexity of the model, but we come perilously close to making a critical assumption: that IT systems may go off-line in single instances, but systemic failure is unlikely and therefore not contemplated.
The static network analysis used only singular removal of the top agents and roles in the AOC. What our analysis did not perform, but the model enables, is combinatoric analysis of the loss of one or more IT systems as well as key people/roles or, in an extreme case, the loss of an organization—allowing determination of interaction effects between these nodes. To become more confident in the resilience of an organization, there needs to be some appreciation by its members of the number and types of bad situations it can absorb while still being able to conduct its critical missions. Combinatoric exploration should support an analytic assessment of which
93 of 156
systems, people, roles, processes, and knowledge have the greatest effects, singularly and in inte-ractions. Armed with even simulated data, AOCs can make more informed decisions about how resilient they are and how to get to whatever threshold they have deemed acceptable.
Static Social Analysis can provide a snap-shot in-time analysis of a network. It can also giv-en indicators about intermediate states between ‘everything normal’ and ‘everything is cata-strophically broken.’ Using the model to conduct limited exploration of degraded states of opera-tion would support commander’s desire to be confident in their continuity of operations (COOP) plans while avoiding impacts to on-going day-to-day requirements. Another aspect of the snap-shot in time the very different ways an AOC operates depending on where it and its supported forces are in the six-phase joint model of joint operations (i.e., Phase 0-Shape; Phase 1-Deter; Phase 2-Seize Initiative; Phase 3-Dominate; Phase 4-Stabilize; Phase 5-Enable Civil Authority). Impacts of various degraded states of operation will necessarily be a function where in those phases the AOC is working.
7.4.4 Conclusions and Implications to the US Air Force
Modeling and running analysis on the AOC can reveal significant implications to the Air Force as well as the Combatant Command the AOC supports. More broadly, turning our analytic capabilities towards ourselves gives commanders another way of assessing organizational, per-sonal, material, operational and training strengths and weakness. Importantly, the assessment can be non-invasive—that is the tools do not require days or weeks of exercises, war games, or oth-erwise detracting from daily functioning of the AOC.
The methods and tools used in this effort can help identify ways to improve resilience in the face of contested cyber environments. In concert with other tools the USAF, as well as its Sister Services, use, it can help identify areas of essential redundancy, less useful redundancy, and ap-parent no-value. These techniques, if given a feedback loop into the Services’ training and doc-trine pipelines, can also help refine and improve the authoring and maintenance of documents that are supposed to be the touchstones of all Service members.
Combined with ‘task-trackers’ and experience built-up over careers, these techniques can support leaderships’ decisions to distribute workload throughout the AOC as well as other organ-izations in supporting/supported relationships. While efficiency is not always the right goal of commander, it can frequently play a decisive role in internal and external resourcing decisions—having analytic tools to help assert integration and resilience can only decrease reliance on pas-sion and intuition.
Every organization has centers of gravity. While the AOC and inter-AOC line-and-block di-agrams give some indicators for center of gravity, the capabilities in ORA, AutoMap, and Con-struct can be used against enemy forces, they can just as interestingly be used in support of im-proving friend forces. Such self-views can help establish continuity of operations and disaster recovery (COOP/DR) plans –increasing the confidence of USAF commanders that their missions remain assured.
Finally, in the face of coming Service-wide budget cuts, having sets of tools that help fore-cast the impacts of task redistributions and realignments, as well as equipment changes in quanti-ties and capabilities, can only improve the quality of the discussions leading to decisions. Through a sustained and broad-based effort to incorporate the myriad of tasks each unit must ac-
94 of 156
complish, in isolation as well as in coordination with others, we can build a more complete un-derstanding of task work load at the organization as well as the individual levels.
7.5 FURTHER INFORMATION AND READING
There is additional methodological information and expository information in Carnegie Mel-lon University’s Institute of Software Research Technical Report CMU-ISR-11-120 available at http://www.casos.cs.cmu.edu/publications/papers.php
7.6 REFERENCES
Carley, Kathleen M., Columbus, Dave, Bigrigg, Michael, & Kunkel, Frank. (2011). AutoMap User's Guide 2011 [Technical report] / Carnegie Mellon University School of Computer Science Institute for Software Research International CMU-ISRI-11-108 Retrieved from http://www.casos.cs.cmu.edu/publications/papers/CMU-ISR-11-108.pdf
Carley, Kathleen M., Columbus, Dave, DeReno, Matthew , Reminga, Jeff , Storrick, Jon, & Columbus, Dave. (2011). ORA User’s Guide 2011: Carnegie Mellon University, School of Computer Science, Institute for Software Research.
Committee on National Security Systems (CNSS). (2010). (CNSSI) National Information Assurance (IA) Glossary (U) (Vol. CNSSI-4009). Ft Meade, MD: CNSS Secretariat, NSA.
Joint Staff J3. (2006). Information Operations. Washington, D.C.: Joint Staff Retrieved from http://www.dtic.mil/doctrine/new_pubs/jp6_0.pdf.
Joint Staff J7. (2010). Department of Defense Dictionary of Military and Associated Terms. Washington, D.C.: Joint Staff Retrieved from http://www.dtic.mil/doctrine/new_pubs/jp1_02.pdf.
Schreiber, Craig, & Carley, Kathleen M. (2004). Human and Organizational Risk Modeling, CMU-ISRI-04-122: Carnegie Mellon University.
Schreiber, Craig, Singh, Siddhartha, & Carley, Kathleen M. (2004). Construct - A Multi-agent Network Model for the Co-evolution of Agents and Socio-cultural Enviroments [Technical report] / Carnegie Mellon University School of Computer Science Institute for Software Research International CMU-ISRI-04-109 Retrieved from http://www.casos.cs.cmu.edu/publications/papers/schreiber_2004_constructmultiagent.pdf
USAF. (2005). Air Force Instruction (AFI) 13-1AOC, Operational Procedures - Air and Space Operations Center (AOC). Langley AFB: HQ USAF/XOOY Retrieved from http://www.af.mil/shared/media/epubs/AFI13-1AOCV3.pdf.
Webber, Richard E. (2010). Mission Assurance, Changing the Mindset. Paper presented at the Global Warfare Symposium, Beverly Hills, CA 90210. http://www.afa.org/events/natlsymp/2010/scripts/101118-Webber.pdf
95 of 156
CHAPTER 8
SIMULATING INTEGRATED RESILIENT COMMAND AND CONTROL (C2) IN CONTESTED CYBER ENVIRONMENTS
8.1 INTRODUCTION
Carnegie Mellon University (CMU) has several different ways of conducting simulations in support of assessing integrated resilient C2 in contested cyber environments. The first is inte-grated into Organization Risk Assessment (ORA) and is called Near Term Analysis (NTA). Sec-tion 7.3.5, entitled Near term Analysis and Conclusions, discussed NTA. The second method is through the use of Construct, an agent-based model (ABM) [Hirshman et al., 2010; Schreiber et al., 2004]. Construct is a validated information and belief diffusion simulation [Schreiber et al., 2004] that allows researchers and modelers to extend social network analysis (SNA) into the longitudinal realm—allowing overtime analysis of how these networks, and the individuals that comprise them, may perform.
These kinds of dynamic network organizational models have helped decision makers, ana-lysts, and researchers assess changes within and among organizational units. Illustrative applica-tions at CMU include impacts of learning on organizational performance, merger assessment, leadership assessment, group performance, evolution of inter-organizational activity, and the as-sessment of terror groups. Other applications include identification of effective intervention strategies for counter-terror, counter-narcotic trafficking, and counter insurgencies (Carley, 2007; Schreiber and Carley, 2007].
8.2 AGENT BASED MODELS (ABM) AND CONSTRUCT
ABMs can simulate a group/organization (e.g. behavior, information flow, process flow, task execution). The “agents” in ABMs have agency – the ability to affect both themselves and others through their actions—thus earning their moniker. In dynamic network organizational modeling, the network is distinct from the spatial environment - there is no virtual grid upon which agents sit or that otherwise artificially constrain agents’ behavior. Instead, agents occupy a multidimen-sional social topography where various socio-demographic, historical, technological and spatial considerations create and influence network relations. A combination of factors (social similari-ty, knowledge similarity, socio-demographic similarity, belief similarity, and physical adjacency) shape agents’ interaction spheres and networks. This network topology may be static or dynamic as well as represent multiple networks (e.g. formal authority and informal friendships, alliance and adversarial networks). Depending on the researcher and questions of interest, the model can also represent organizational dynamics, such as personnel turbulence (e.g., moves, hiring, firing, and shift work) and training.
In Construct, the agents, usually people (or at conceptually higher levels, groups or even countries), occupy a social network position that defines which other agents they can interact with. Construct operates at a middle level in terms of the cognitive realism of the agents, in that agents are boundedly rational and may not always correctly receive or interpret information from other actors, and at a high level in terms of the social realism of the agents through the imple-mentation of well-known drivers of human interaction, homophily (the preference for interaction with similar individuals) and expertise-seeking. Key features of Construct are: sub-modules for
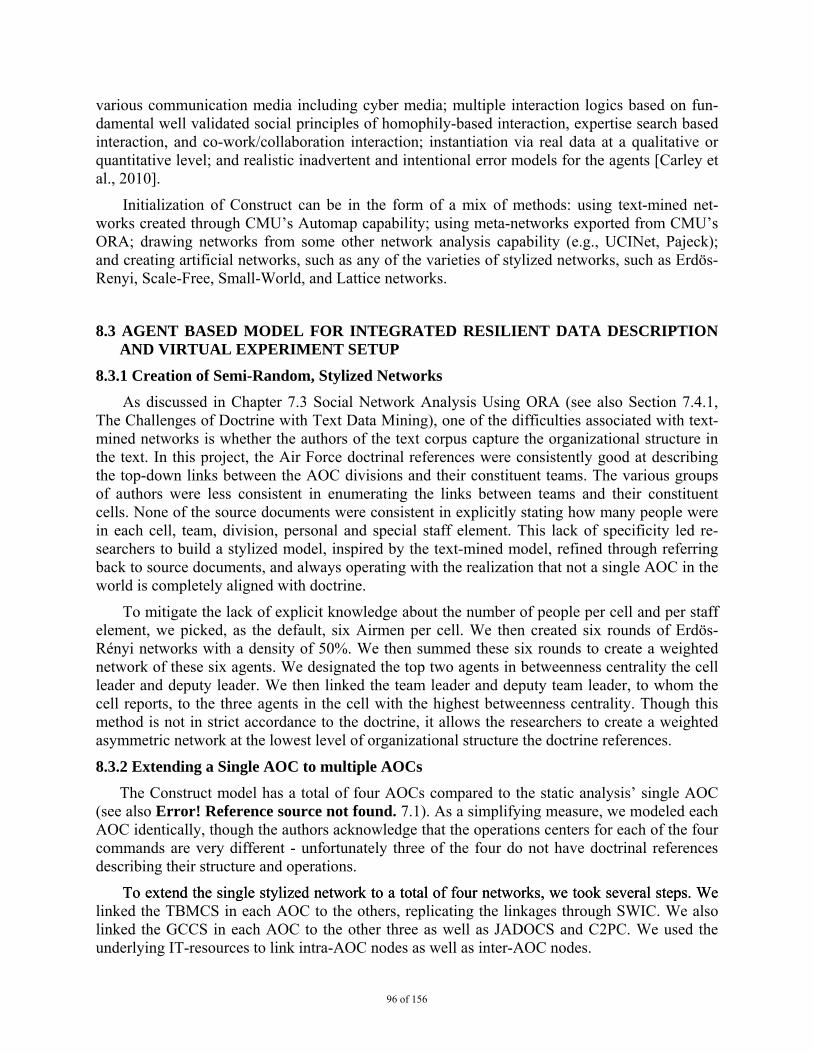
96 of 156
various communication media including cyber media; multiple interaction logics based on fun-damental well validated social principles of homophily-based interaction, expertise search based interaction, and co-work/collaboration interaction; instantiation via real data at a qualitative or quantitative level; and realistic inadvertent and intentional error models for the agents [Carley et al., 2010].
Initialization of Construct can be in the form of a mix of methods: using text-mined net-works created through CMU’s Automap capability; using meta-networks exported from CMU’s ORA; drawing networks from some other network analysis capability (e.g., UCINet, Pajeck); and creating artificial networks, such as any of the varieties of stylized networks, such as Erdös-Renyi, Scale-Free, Small-World, and Lattice networks.
8.3 AGENT BASED MODEL FOR INTEGRATED RESILIENT DATA DESCRIPTION AND VIRTUAL EXPERIMENT SETUP
8.3.1 Creation of Semi-Random, Stylized Networks
As discussed in Chapter 7.3 Social Network Analysis Using ORA (see also Section 7.4.1, The Challenges of Doctrine with Text Data Mining), one of the difficulties associated with text-mined networks is whether the authors of the text corpus capture the organizational structure in the text. In this project, the Air Force doctrinal references were consistently good at describing the top-down links between the AOC divisions and their constituent teams. The various groups of authors were less consistent in enumerating the links between teams and their constituent cells. None of the source documents were consistent in explicitly stating how many people were in each cell, team, division, personal and special staff element. This lack of specificity led re-searchers to build a stylized model, inspired by the text-mined model, refined through referring back to source documents, and always operating with the realization that not a single AOC in the world is completely aligned with doctrine.
To mitigate the lack of explicit knowledge about the number of people per cell and per staff element, we picked, as the default, six Airmen per cell. We then created six rounds of Erdös-Rényi networks with a density of 50%. We then summed these six rounds to create a weighted network of these six agents. We designated the top two agents in betweenness centrality the cell leader and deputy leader. We then linked the team leader and deputy team leader, to whom the cell reports, to the three agents in the cell with the highest betweenness centrality. Though this method is not in strict accordance to the doctrine, it allows the researchers to create a weighted asymmetric network at the lowest level of organizational structure the doctrine references.
8.3.2 Extending a Single AOC to multiple AOCs
The Construct model has a total of four AOCs compared to the static analysis’ single AOC (see also Error! Reference source not found. 7.1). As a simplifying measure, we modeled each AOC identically, though the authors acknowledge that the operations centers for each of the four commands are very different - unfortunately three of the four do not have doctrinal references describing their structure and operations.
To extend the single stylized network to a total of four networks, we took several steps. We To extend the single stylized network to a total of four networks, we took several steps. We linked the TBMCS in each AOC to the others, replicating the linkages through SWIC. We also linked the GCCS in each AOC to the other three as well as JADOCS and C2PC. We used the underlying IT-resources to link intra-AOC nodes as well as inter-AOC nodes.
97 of 156
The stylized model also included a number of IT-resources that form the core of the underly-ing telecommunication infrastructure. We kept the IT-resource population to a minimal subset that allows us to begin exploring the impacts of the telecommunications networking links when combined with the social and usage network links. In Fig. 8.1, it is important to note that we have begun recognizing that all IT-Resources and IT-Systems in the AOC are reliant on the commercial telecommunications company points of presence (TELCO_POP)—we omitted the various links to the multitude of military and commercial satellite links between AOCs. For the simulation, we treated IT-resources as mediating devices, but not as devices that could process data in the same way as IT-Systems such as TBMCS, GCCS, and others.
Fig. 8.1 IT-Resource x IT-Resource Graph
We used the list of IT agents we harvested from the text mined data such that there were over 140 IT systems per AOC. As previously noted with respect to organizational links and team/cell composition, the text corpus was consistent for showing the links between IT systems. The D2M process does not rely exclusively on same-node by same-node matrices though, so the next two figures, 8.2 and 8.3, represent a picture of IT-System by IT-systems out of context of the entire AOC. Each figure uses the same color scheme as Fig. 8.1.
Finally, given there is no doctrinal reference from which we can draw social network data between AOCs, we created a small world network between the AOC Directors, the division heads, and the division deputy-heads.
8.3.3 Simulation Configuration and Execution
To simulate two types of contested cyber environments, we needed to pick which of several effects friendly forces could face. The five categories of Information Assurance provided a rea-sonable starting place for the conceptual binning of types of attacks. Those five categories are: Confidentiality, Integrity, Availability, Authentication, and Non-Repudiation. We implemented
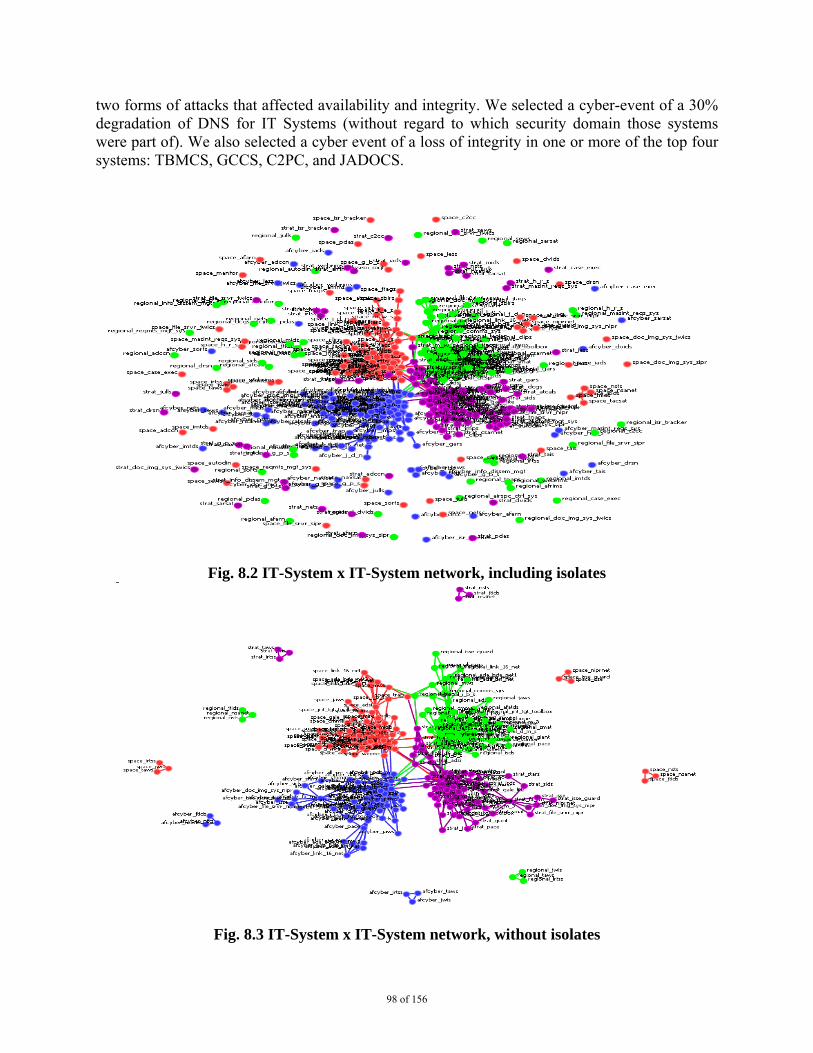
98 of 156
two forms of attacks that affected availability and integrity. We selected a cyber-event of a 30% degradation of DNS for IT Systems (without regard to which security domain those systems were part of). We also selected a cyber event of a loss of integrity in one or more of the top four systems: TBMCS, GCCS, C2PC, and JADOCS.
Fig. 8.2 IT-System x IT-System network, including isolates
Fig. 8.3 IT-System x IT-System network, without isolates
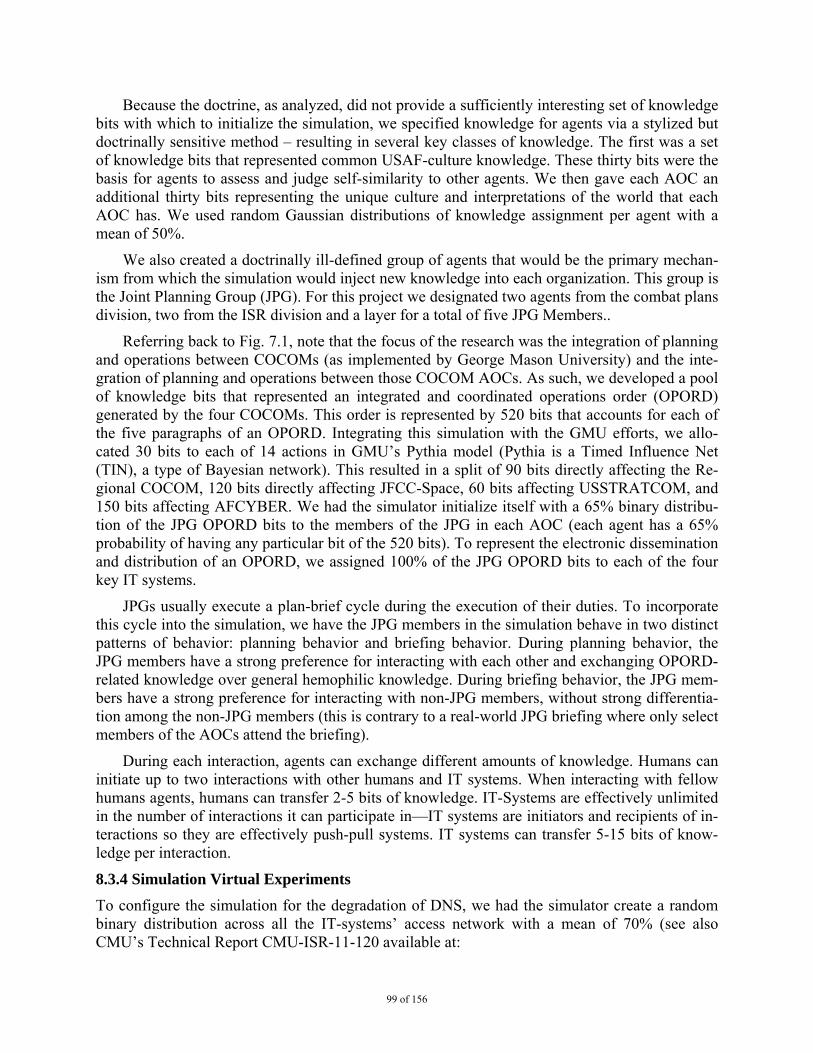
99 of 156
Because the doctrine, as analyzed, did not provide a sufficiently interesting set of knowledge bits with which to initialize the simulation, we specified knowledge for agents via a stylized but doctrinally sensitive method – resulting in several key classes of knowledge. The first was a set of knowledge bits that represented common USAF-culture knowledge. These thirty bits were the basis for agents to assess and judge self-similarity to other agents. We then gave each AOC an additional thirty bits representing the unique culture and interpretations of the world that each AOC has. We used random Gaussian distributions of knowledge assignment per agent with a mean of 50%.
We also created a doctrinally ill-defined group of agents that would be the primary mechan-ism from which the simulation would inject new knowledge into each organization. This group is the Joint Planning Group (JPG). For this project we designated two agents from the combat plans division, two from the ISR division and a layer for a total of five JPG Members..
Referring back to Fig. 7.1, note that the focus of the research was the integration of planning and operations between COCOMs (as implemented by George Mason University) and the inte-gration of planning and operations between those COCOM AOCs. As such, we developed a pool of knowledge bits that represented an integrated and coordinated operations order (OPORD) generated by the four COCOMs. This order is represented by 520 bits that accounts for each of the five paragraphs of an OPORD. Integrating this simulation with the GMU efforts, we allo-cated 30 bits to each of 14 actions in GMU’s Pythia model (Pythia is a Timed Influence Net (TIN), a type of Bayesian network). This resulted in a split of 90 bits directly affecting the Re-gional COCOM, 120 bits directly affecting JFCC-Space, 60 bits affecting USSTRATCOM, and 150 bits affecting AFCYBER. We had the simulator initialize itself with a 65% binary distribu-tion of the JPG OPORD bits to the members of the JPG in each AOC (each agent has a 65% probability of having any particular bit of the 520 bits). To represent the electronic dissemination and distribution of an OPORD, we assigned 100% of the JPG OPORD bits to each of the four key IT systems.
JPGs usually execute a plan-brief cycle during the execution of their duties. To incorporate this cycle into the simulation, we have the JPG members in the simulation behave in two distinct patterns of behavior: planning behavior and briefing behavior. During planning behavior, the JPG members have a strong preference for interacting with each other and exchanging OPORD-related knowledge over general hemophilic knowledge. During briefing behavior, the JPG mem-bers have a strong preference for interacting with non-JPG members, without strong differentia-tion among the non-JPG members (this is contrary to a real-world JPG briefing where only select members of the AOCs attend the briefing).
During each interaction, agents can exchange different amounts of knowledge. Humans can initiate up to two interactions with other humans and IT systems. When interacting with fellow humans agents, humans can transfer 2-5 bits of knowledge. IT-Systems are effectively unlimited in the number of interactions it can participate in—IT systems are initiators and recipients of in-teractions so they are effectively push-pull systems. IT systems can transfer 5-15 bits of know-ledge per interaction.
8.3.4 Simulation Virtual Experiments
To configure the simulation for the degradation of DNS, we had the simulator create a random binary distribution across all the IT-systems’ access network with a mean of 70% (see also CMU’s Technical Report CMU-ISR-11-120 available at:
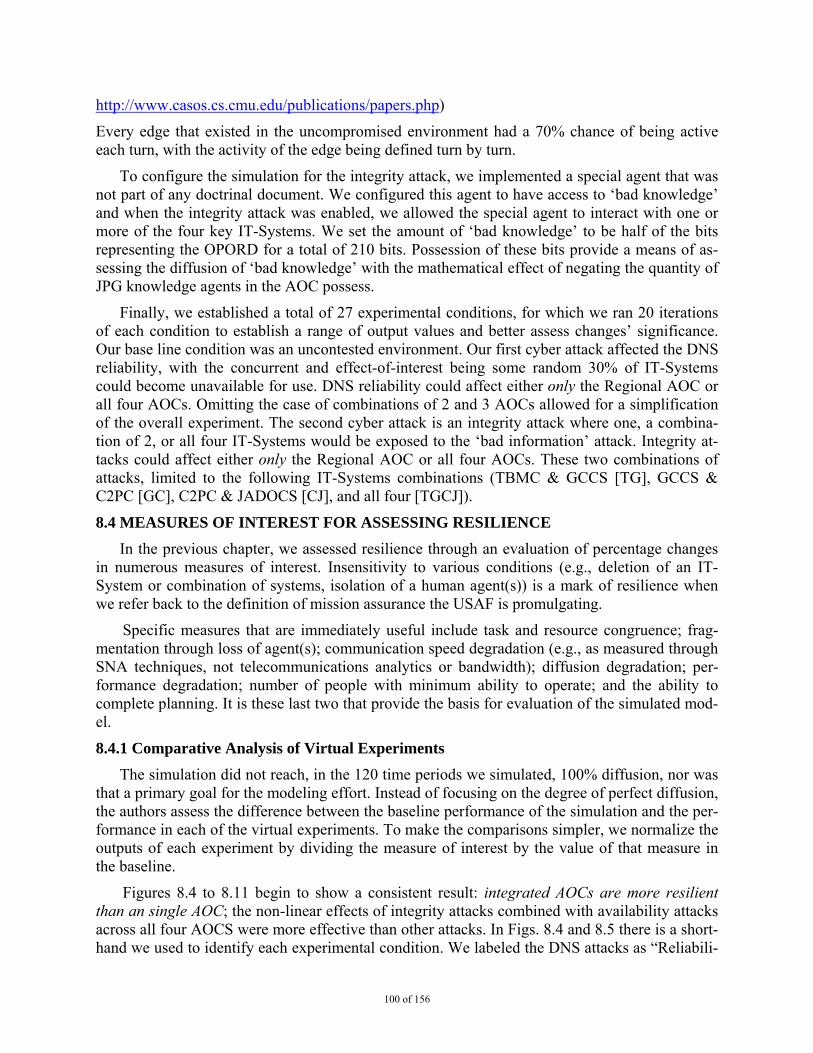
100 of 156
http://www.casos.cs.cmu.edu/publications/papers.php)
Every edge that existed in the uncompromised environment had a 70% chance of being active each turn, with the activity of the edge being defined turn by turn.
To configure the simulation for the integrity attack, we implemented a special agent that was not part of any doctrinal document. We configured this agent to have access to ‘bad knowledge’ and when the integrity attack was enabled, we allowed the special agent to interact with one or more of the four key IT-Systems. We set the amount of ‘bad knowledge’ to be half of the bits representing the OPORD for a total of 210 bits. Possession of these bits provide a means of as-sessing the diffusion of ‘bad knowledge’ with the mathematical effect of negating the quantity of JPG knowledge agents in the AOC possess.
Finally, we established a total of 27 experimental conditions, for which we ran 20 iterations of each condition to establish a range of output values and better assess changes’ significance. Our base line condition was an uncontested environment. Our first cyber attack affected the DNS reliability, with the concurrent and effect-of-interest being some random 30% of IT-Systems could become unavailable for use. DNS reliability could affect either only the Regional AOC or all four AOCs. Omitting the case of combinations of 2 and 3 AOCs allowed for a simplification of the overall experiment. The second cyber attack is an integrity attack where one, a combina-tion of 2, or all four IT-Systems would be exposed to the ‘bad information’ attack. Integrity at-tacks could affect either only the Regional AOC or all four AOCs. These two combinations of attacks, limited to the following IT-Systems combinations (TBMC & GCCS [TG], GCCS & C2PC [GC], C2PC & JADOCS [CJ], and all four [TGCJ]).
8.4 MEASURES OF INTEREST FOR ASSESSING RESILIENCE
In the previous chapter, we assessed resilience through an evaluation of percentage changes in numerous measures of interest. Insensitivity to various conditions (e.g., deletion of an IT-System or combination of systems, isolation of a human agent(s)) is a mark of resilience when we refer back to the definition of mission assurance the USAF is promulgating.
Specific measures that are immediately useful include task and resource congruence; frag-mentation through loss of agent(s); communication speed degradation (e.g., as measured through SNA techniques, not telecommunications analytics or bandwidth); diffusion degradation; per-formance degradation; number of people with minimum ability to operate; and the ability to complete planning. It is these last two that provide the basis for evaluation of the simulated mod-el.
8.4.1 Comparative Analysis of Virtual Experiments
The simulation did not reach, in the 120 time periods we simulated, 100% diffusion, nor was that a primary goal for the modeling effort. Instead of focusing on the degree of perfect diffusion, the authors assess the difference between the baseline performance of the simulation and the per-formance in each of the virtual experiments. To make the comparisons simpler, we normalize the outputs of each experiment by dividing the measure of interest by the value of that measure in the baseline.
Figures 8.4 to 8.11 begin to show a consistent result: integrated AOCs are more resilient than an single AOC; the non-linear effects of integrity attacks combined with availability attacks across all four AOCS were more effective than other attacks. In Figs. 8.4 and 8.5 there is a short-hand we used to identify each experimental condition. We labeled the DNS attacks as “Reliabili-
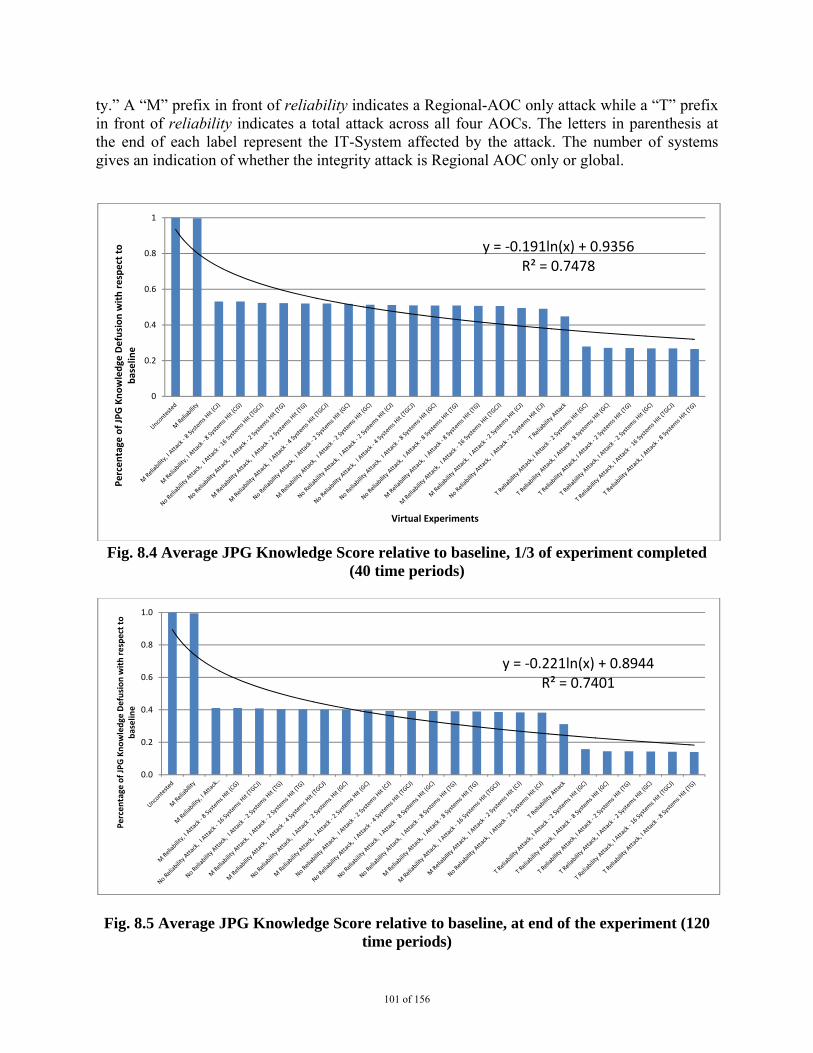
101 of 156
ty.” A “M” prefix in front of reliability indicates a Regional-AOC only attack while a “T” prefix in front of reliability indicates a total attack across all four AOCs. The letters in parenthesis at the end of each label represent the IT-System affected by the attack. The number of systems gives an indication of whether the integrity attack is Regional AOC only or global.
Fig. 8.4 Average JPG Knowledge Score relative to baseline, 1/3 of experiment completed (40 time periods)
Fig. 8.5 Average JPG Knowledge Score relative to baseline, at end of the experiment (120 time periods)
y = ‐0.191ln(x) + 0.9356R² = 0.7478
0
0.2
0.4
0.6
0.8
1
Percentage
of JPG Knowledge
Defusion with respect to
baselin
e
Virtual Experiments
y = ‐0.221ln(x) + 0.8944R² = 0.7401
0.0
0.2
0.4
0.6
0.8
1.0
Percentage
of JPG Knowledge
Defusion with respect to
baselin
e
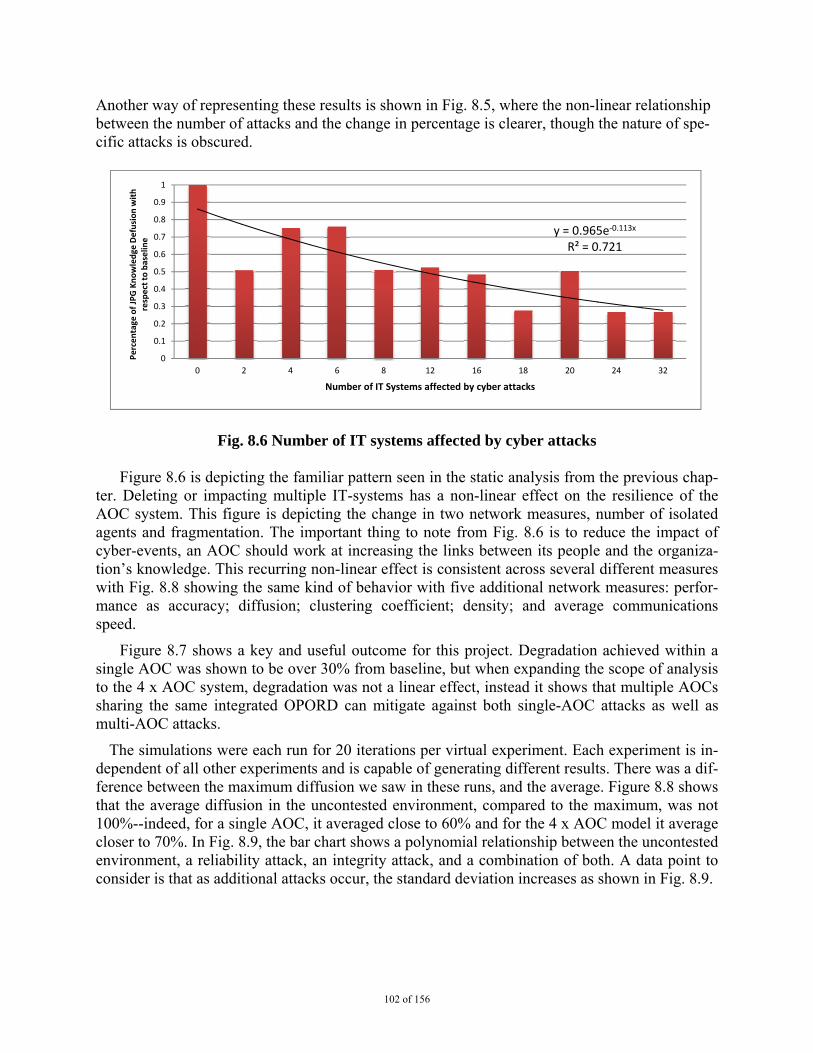
102 of 156
Another way of representing these results is shown in Fig. 8.5, where the non-linear relationship between the number of attacks and the change in percentage is clearer, though the nature of spe-cific attacks is obscured.
Fig. 8.6 Number of IT systems affected by cyber attacks
Figure 8.6 is depicting the familiar pattern seen in the static analysis from the previous chap-ter. Deleting or impacting multiple IT-systems has a non-linear effect on the resilience of the AOC system. This figure is depicting the change in two network measures, number of isolated agents and fragmentation. The important thing to note from Fig. 8.6 is to reduce the impact of cyber-events, an AOC should work at increasing the links between its people and the organiza-tion’s knowledge. This recurring non-linear effect is consistent across several different measures with Fig. 8.8 showing the same kind of behavior with five additional network measures: perfor-mance as accuracy; diffusion; clustering coefficient; density; and average communications speed.
Figure 8.7 shows a key and useful outcome for this project. Degradation achieved within a single AOC was shown to be over 30% from baseline, but when expanding the scope of analysis to the 4 x AOC system, degradation was not a linear effect, instead it shows that multiple AOCs sharing the same integrated OPORD can mitigate against both single-AOC attacks as well as multi-AOC attacks.
The simulations were each run for 20 iterations per virtual experiment. Each experiment is in-dependent of all other experiments and is capable of generating different results. There was a dif-ference between the maximum diffusion we saw in these runs, and the average. Figure 8.8 shows that the average diffusion in the uncontested environment, compared to the maximum, was not 100%--indeed, for a single AOC, it averaged close to 60% and for the 4 x AOC model it average closer to 70%. In Fig. 8.9, the bar chart shows a polynomial relationship between the uncontested environment, a reliability attack, an integrity attack, and a combination of both. A data point to consider is that as additional attacks occur, the standard deviation increases as shown in Fig. 8.9.
y = 0.965e‐0.113x
R² = 0.721
0
0.1
0.2
0.3
0.4
0.5
0.6
0.7
0.8
0.9
1
0 2 4 6 8 12 16 18 20 24 32
Percentage
of JPG Knowledge
Defusion with
respect to baselin
e
Number of IT Systems affected by cyber attacks
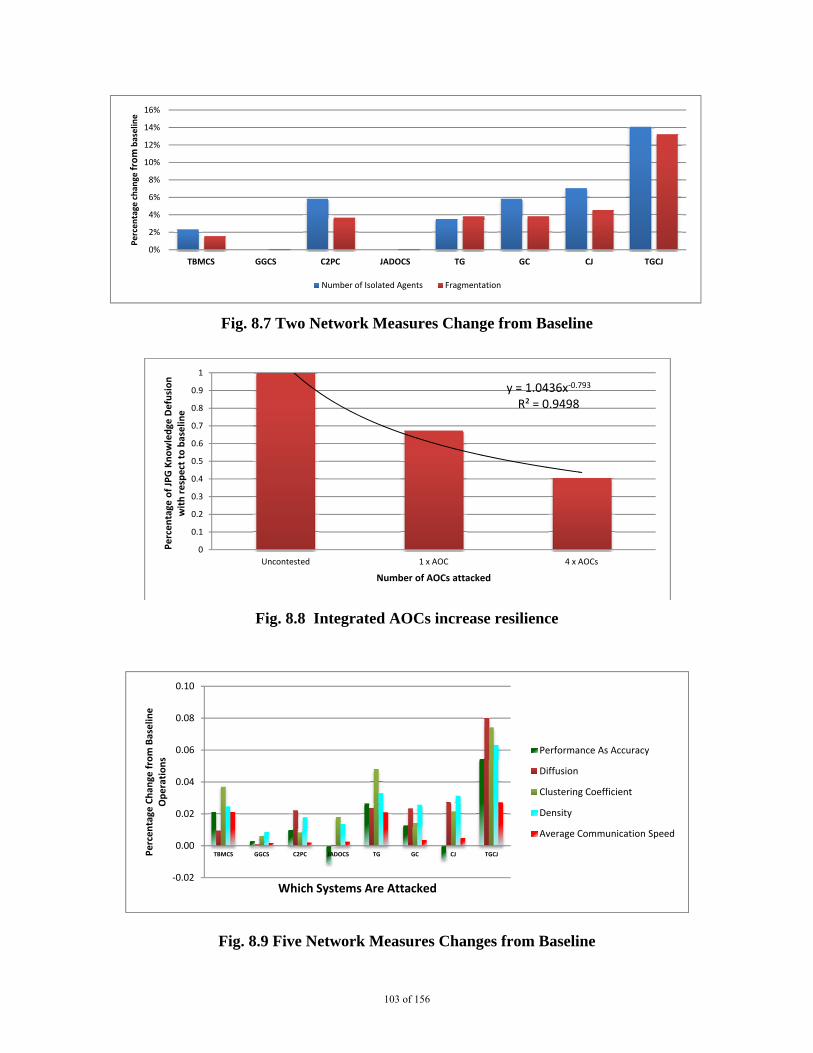
103 of 156
Fig. 8.7 Two Network Measures Change from Baseline
Fig. 8.8 Integrated AOCs increase resilience
Fig. 8.9 Five Network Measures Changes from Baseline
0%
2%
4%
6%
8%
10%
12%
14%
16%
TBMCS GGCS C2PC JADOCS TG GC CJ TGCJ
Percentage
chan
ge from
baselin
e
Number of Isolated Agents Fragmentation
y = 1.0436x‐0.793
R² = 0.9498
0
0.1
0.2
0.3
0.4
0.5
0.6
0.7
0.8
0.9
1
Uncontested 1 x AOC 4 x AOCs
Percentage
of JPG Knowledge
Defusion
with respect to baselin
e
Number of AOCs attacked
‐0.02
0.00
0.02
0.04
0.06
0.08
0.10
TBMCS GGCS C2PC JADOCS TG GC CJ TGCJPercentage
Chan
ge from Baselin
e
Operations
Which Systems Are Attacked
Performance As Accuracy
Diffusion
Clustering Coefficient
Density
Average Communication Speed
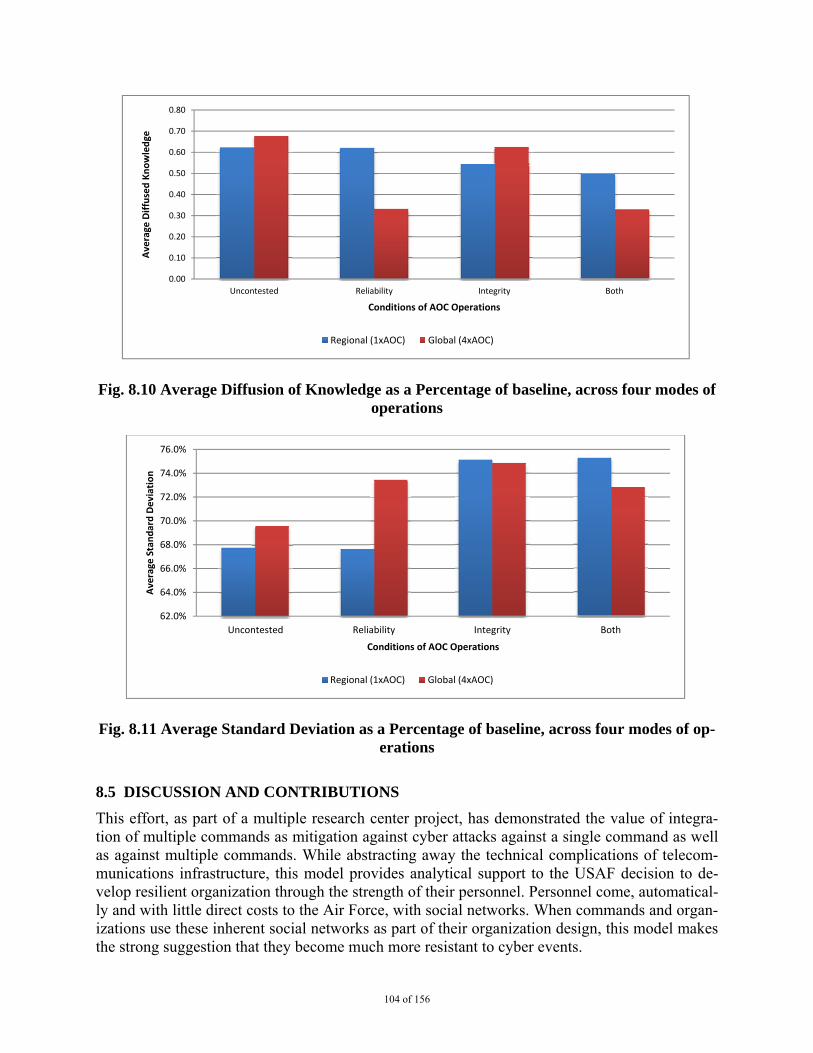
104 of 156
Fig. 8.10 Average Diffusion of Knowledge as a Percentage of baseline, across four modes of operations
Fig. 8.11 Average Standard Deviation as a Percentage of baseline, across four modes of op-erations
8.5 DISCUSSION AND CONTRIBUTIONS
This effort, as part of a multiple research center project, has demonstrated the value of integra-tion of multiple commands as mitigation against cyber attacks against a single command as well as against multiple commands. While abstracting away the technical complications of telecom-munications infrastructure, this model provides analytical support to the USAF decision to de-velop resilient organization through the strength of their personnel. Personnel come, automatical-ly and with little direct costs to the Air Force, with social networks. When commands and organ-izations use these inherent social networks as part of their organization design, this model makes the strong suggestion that they become much more resistant to cyber events.
0.00
0.10
0.20
0.30
0.40
0.50
0.60
0.70
0.80
Uncontested Reliability Integrity Both
Average
Diffused Knowledge
Conditions of AOC Operations
Regional (1xAOC) Global (4xAOC)
62.0%
64.0%
66.0%
68.0%
70.0%
72.0%
74.0%
76.0%
Uncontested Reliability Integrity Both
Average
Standard Deviation
Conditions of AOC Operations
Regional (1xAOC) Global (4xAOC)
105 of 156
The effort also contributed to a better understanding of domain specific text mining and how to accommodate some of the vagaries of DoD doctrinal documents. We explored several ways of mitigating the presence of diagrams, tables, and figures and were able to quantify the results and advantages of doing so.
We have shown ways of bridging the gap in doctrinal documents between the discussions of organizational structure and incorporating social networks into the model. Through the use of random stylized networks, we were able to develop interaction networks for individual agents within the cells of the AOC.
8.6 CONCLUSIONS
The most essential conclusion of this effort is that the AOC, as defined by its doctrinal references is surprisingly resistant to cyber-disruption and attack. When analysis incorporates more than single organizations or single types of entities, completely different results are not only feasible, but extremely likely: recall that from an IT-centric viewpoint, deletion of 4 IT systems created dramatic impacts but those same deletions, when viewed from the entire AOC viewpoint the de-letion caused fewer changes to network measures.
We provided an analytical basis to assert that integrated AOCs are more resilient than stand-alone organizations. Though there is always a danger that a too tightly coupled integration will lead to easily triggered cascading failure, we have no indication yet of where that point may be—we did not reach it in this simulation. This finding, in many ways, runs counter to the DoD’s ten-dency to slice responsibilities up between different organizations. That tendency is an outgrowth of the desire to maintain clear lines of authority and responsibility which are well established military axioms.
Increasing the probability that Airmen and other members of the DoD know each other, or are separated by one or two degrees can increase resiliency. Familiarity with others in distant lo-cations can increase the level of trust and confidence that messages and communications have been passed and been commonly understood. With that trust and confidence, temporary, or long-er-term communications outages can be weathered with less angst.
At a 2011 USAF war game a participant stated, with great succinctness and clarity of thought: “So the networks and systems are fried, it’s not like the war’s going to stop.” He went on to point out that 8th Air Force during WWII put hundreds of plans into the air over long pe-riods of time with nary a computer in sight - we can do it again, though it will be painful getting there.
8.8 REFERENCES
Carley, Kathleen M. Adaptive Organizations and Emergent Forms.
Carley, Kathleen M.; Moon, Il-Chul, Morgan, Geoffrey, and Lanham, Michael (2010). Adversary Modeling –Applications of Dynamic Network Analysis. In Alexander H. Levis & Kathleen M. Carley (Eds.), Computational Modeling of Cultural Dimensions in Adversary Organizations (pp. 172-203). Fairfax, VA: The Volgenau School of Engineering System Architectures Laboratory, George Mason University, Technical Report.
106 of 156
Hirshman, Brian R., Morgan, Geoffrey P., St. Charles, Jesse R., & M., Carley Kathleen. (2010). Construct Demo Input Deck (Institute of Software Research School of Computer Science, Trans.) (pp. 149). Pittsburgh, PA: Carnegie Mellon University.
Schreiber, C., and Kathleen M. Carley. (2007). Agent Interactions in Construct: An Empirical Validation using Calibrated Grounding. Paper presented at the 2007 BRIMS, Norfolk, VA.
Schreiber, Craig, Singh, Siddhartha, & Carley, Kathleen M. (2004). Construct - A Multi-agent Network Model for the Co-evolution of Agents and Socio-cultural Enviroments [Technical report] / Carnegie Mellon University School of Computer Science Institute for Software Research International CMU-ISRI-04-109 Retrieved from
http://www.casos.cs.cmu.edu/publications/papers/schreiber_2004_constructmultiagent.pdf
107 of 156
CHAPTER 9
ON EVALUATING RESILIENCE IN COMMAND AND CONTROL ARCHITECTURES*
9.1 INTRODUCTION
The word ‘resilience’ is derived from the Latin words ‘resilire’ and ‘resilio’ which meant: “the ability to rebound or jump-back.” The International Council on Systems Engineering (INCOSE) defines resilience as “the ability of organizational, hardware and software systems to mitigate the severity and likelihood of failures or losses, to adapt to changing conditions, and to respond ap-propriately after the fact” [1]. Many other highly related definitions for resilience have been de-veloped, however all involve the following common themes: avoidance, survival, recovery, dis-ruption. Therefore, we will use the following definition of resilience from [2]: the ability to avoid, survive and recover from disruption.
The objective of this paper is to describe a quantitative approach to measuring the expected resilience of a command and control system based on its architecture. The main idea is that resi-lience can be measured through its attributes, and that these measures may be combined into a holistic evaluation of resilience. To illustrate this approach, we consider the resilience of a com-mand and control system to exercise or implement a capability to a disruption. Section 9.2 high-lights key aspects in resilience that must be considered in any evaluation. Section 9.3 describes the attributes of resilience and their measures. Section 9.4 introduces a holistic means of com-bining the measures. Section 9.5 concludes the paper with observations and future work.
9.2 KEY TOPICS IN CONSIDERING RESILIENCE
Resilience includes the notion of disruption. A disruption is an adverse initiating event which may lead to catastrophic results. INCOSE defines disruption as “the initiating event of a reduc-tion in performance. A disruption may be either a sudden or a sustained event,” [1]. Jackson [2] defines disruptions as events which jeopardize a system’s ability to perform its intended capabili-ties.
Evaluation of resilience must also include temporal aspects. Timescales vary based upon the system under consideration. However, the timescale can be normalized to allow for fairer com-parisons. Figure 9.1 illustrates the significance of time when examining resilience.
In Fig. 9.1, phases of resilience identified in [2] are overlaid on the time axis. The evaluation begins at some initial time, defined as time t0. A disruption occurs at time td. The system reaches some minimum operating performance level at time tmin, and returns to a pre-disruption state at time tret. The avoidance phase of resilience runs from time t0 to time td, the survival phase runs from time td to tmin, and the recovery phase runs from tmin to tret. The performance is evaluated using a Measure of Performance (MoP) for a single capability of the system as described by the architecture. During the avoidance phase, a system is operating at some normal operating level of capability, defined above as Value2 (V2). When a disruption occurs at time td, the level of ca-pability decreases to some minimum value, V1, at time tmin. The system has a minimum thre-shold level of capability, VT, below which performance is deemed un-acceptable, or below which a catastrophic failure could result.
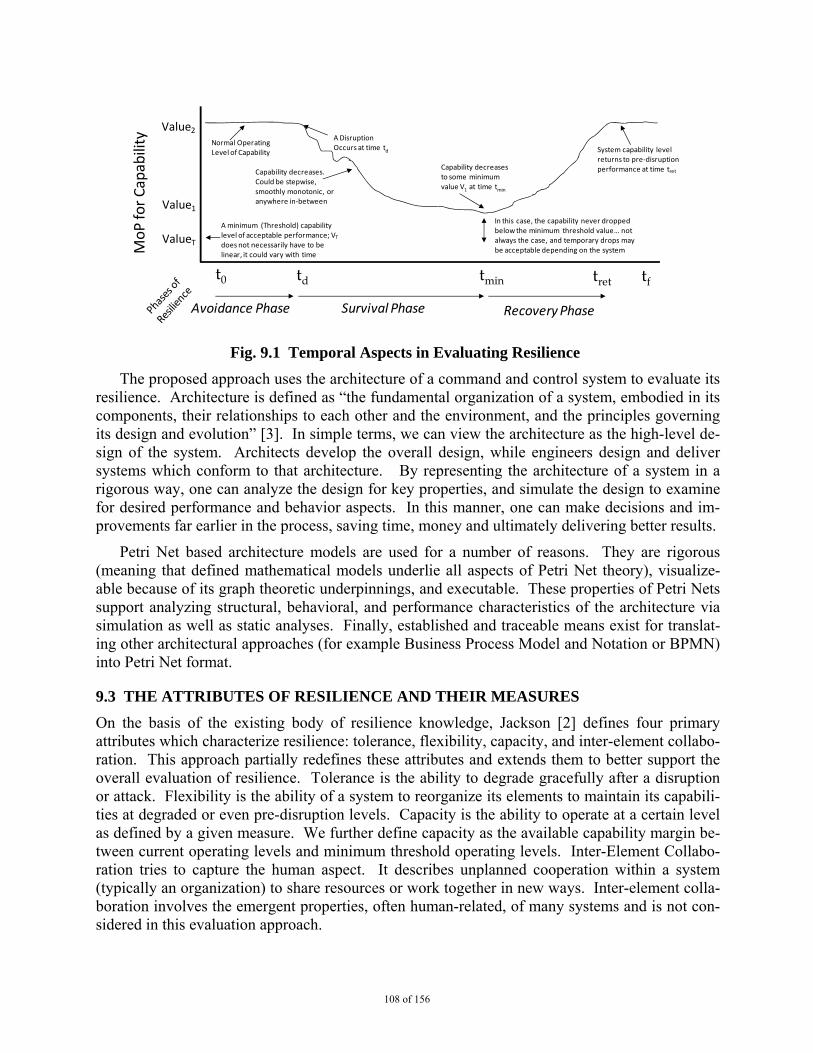
108 of 156
The proposed approach uses the architecture of a command and control system to evaluate its resilience. Architecture is defined as “the fundamental organization of a system, embodied in its components, their relationships to each other and the environment, and the principles governing its design and evolution” [3]. In simple terms, we can view the architecture as the high-level de-sign of the system. Architects develop the overall design, while engineers design and deliver systems which conform to that architecture. By representing the architecture of a system in a rigorous way, one can analyze the design for key properties, and simulate the design to examine for desired performance and behavior aspects. In this manner, one can make decisions and im-provements far earlier in the process, saving time, money and ultimately delivering better results.
Petri Net based architecture models are used for a number of reasons. They are rigorous (meaning that defined mathematical models underlie all aspects of Petri Net theory), visualize-able because of its graph theoretic underpinnings, and executable. These properties of Petri Nets support analyzing structural, behavioral, and performance characteristics of the architecture via simulation as well as static analyses. Finally, established and traceable means exist for translat-ing other architectural approaches (for example Business Process Model and Notation or BPMN) into Petri Net format.
9.3 THE ATTRIBUTES OF RESILIENCE AND THEIR MEASURES
On the basis of the existing body of resilience knowledge, Jackson [2] defines four primary attributes which characterize resilience: tolerance, flexibility, capacity, and inter-element collabo-ration. This approach partially redefines these attributes and extends them to better support the overall evaluation of resilience. Tolerance is the ability to degrade gracefully after a disruption or attack. Flexibility is the ability of a system to reorganize its elements to maintain its capabili-ties at degraded or even pre-disruption levels. Capacity is the ability to operate at a certain level as defined by a given measure. We further define capacity as the available capability margin be-tween current operating levels and minimum threshold operating levels. Inter-Element Collabo-ration tries to capture the human aspect. It describes unplanned cooperation within a system (typically an organization) to share resources or work together in new ways. Inter-element colla-boration involves the emergent properties, often human-related, of many systems and is not con-sidered in this evaluation approach.
MoPfor Capability
t0 td tmin tret tf
Survival Phase Recovery Phase
ValueT
Value2
Value1
Avoidance Phase
Normal Operating Level of Capability
A Disruption Occurs at time td
Capability decreases. Could be stepwise, smoothly monotonic, or anywhere in‐between
Capability decreases to some minimum value V1 at time tmin
A minimum (Threshold) capability level of acceptable performance; VTdoes not necessarily have to be linear, it could vary with time
System capability level returns to pre‐disruption performance at time tret
In this case, the capability never dropped below the minimum threshold value… not always the case, and temporary drops may be acceptable depending on the system
Fig. 9.1 Temporal Aspects in Evaluating Resilience
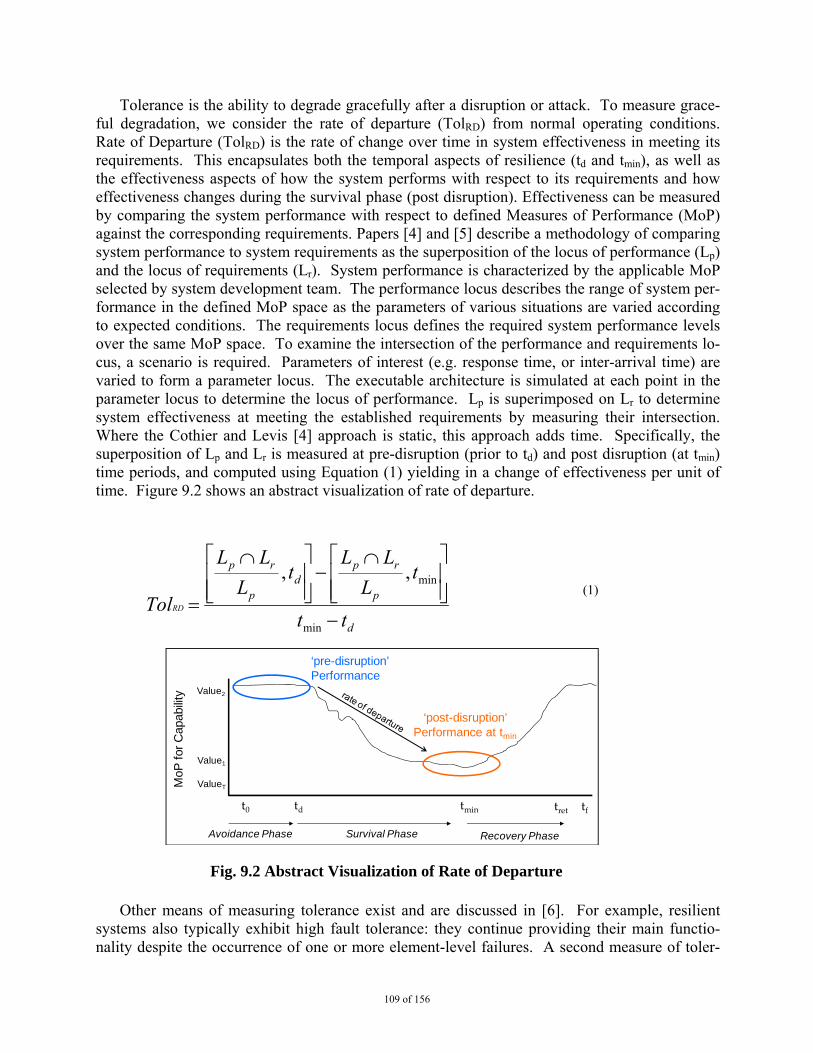
109 of 156
Tolerance is the ability to degrade gracefully after a disruption or attack. To measure grace-ful degradation, we consider the rate of departure (TolRD) from normal operating conditions. Rate of Departure (TolRD) is the rate of change over time in system effectiveness in meeting its requirements. This encapsulates both the temporal aspects of resilience (td and tmin), as well as the effectiveness aspects of how the system performs with respect to its requirements and how effectiveness changes during the survival phase (post disruption). Effectiveness can be measured by comparing the system performance with respect to defined Measures of Performance (MoP) against the corresponding requirements. Papers [4] and [5] describe a methodology of comparing system performance to system requirements as the superposition of the locus of performance (Lp) and the locus of requirements (Lr). System performance is characterized by the applicable MoP selected by system development team. The performance locus describes the range of system per-formance in the defined MoP space as the parameters of various situations are varied according to expected conditions. The requirements locus defines the required system performance levels over the same MoP space. To examine the intersection of the performance and requirements lo-cus, a scenario is required. Parameters of interest (e.g. response time, or inter-arrival time) are varied to form a parameter locus. The executable architecture is simulated at each point in the parameter locus to determine the locus of performance. Lp is superimposed on Lr to determine system effectiveness at meeting the established requirements by measuring their intersection. Where the Cothier and Levis [4] approach is static, this approach adds time. Specifically, the superposition of Lp and Lr is measured at pre-disruption (prior to td) and post disruption (at tmin) time periods, and computed using Equation (1) yielding in a change of effectiveness per unit of time. Figure 9.2 shows an abstract visualization of rate of departure.
(1)
Other means of measuring tolerance exist and are discussed in [6]. For example, resilient systems also typically exhibit high fault tolerance: they continue providing their main functio-nality despite the occurrence of one or more element-level failures. A second measure of toler-
d
p
rpd
p
rp
tt
tL
LLt
L
LL
TolRD
min
min,,
‘pre-disruption’ Performance
MoP
for
Cap
abili
ty
t0 td tmin tret tf
Survival Phase Recovery Phase
ValueT
Value2
Value1
Avoidance Phase
‘post-disruption’ Performance at tmin
Fig. 9.2 Abstract Visualization of Rate of Departure
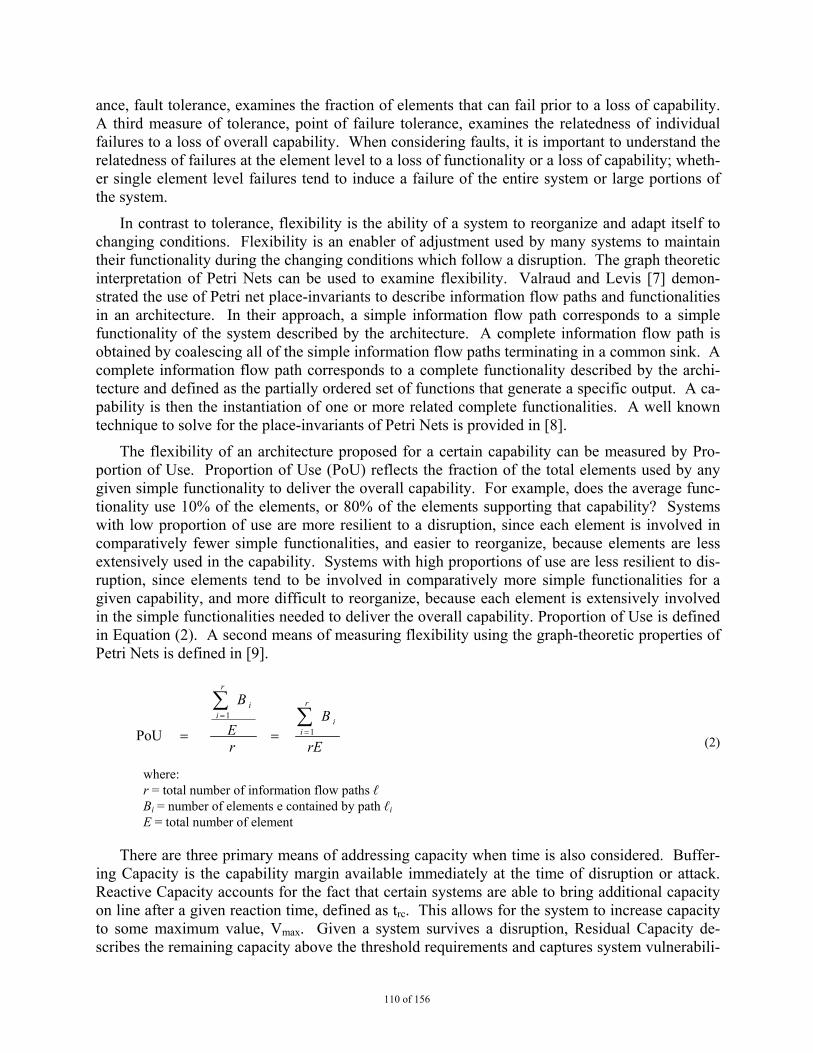
110 of 156
ance, fault tolerance, examines the fraction of elements that can fail prior to a loss of capability. A third measure of tolerance, point of failure tolerance, examines the relatedness of individual failures to a loss of overall capability. When considering faults, it is important to understand the relatedness of failures at the element level to a loss of functionality or a loss of capability; wheth-er single element level failures tend to induce a failure of the entire system or large portions of the system.
In contrast to tolerance, flexibility is the ability of a system to reorganize and adapt itself to changing conditions. Flexibility is an enabler of adjustment used by many systems to maintain their functionality during the changing conditions which follow a disruption. The graph theoretic interpretation of Petri Nets can be used to examine flexibility. Valraud and Levis [7] demon-strated the use of Petri net place-invariants to describe information flow paths and functionalities in an architecture. In their approach, a simple information flow path corresponds to a simple functionality of the system described by the architecture. A complete information flow path is obtained by coalescing all of the simple information flow paths terminating in a common sink. A complete information flow path corresponds to a complete functionality described by the archi-tecture and defined as the partially ordered set of functions that generate a specific output. A ca-pability is then the instantiation of one or more related complete functionalities. A well known technique to solve for the place-invariants of Petri Nets is provided in [8].
The flexibility of an architecture proposed for a certain capability can be measured by Pro-portion of Use. Proportion of Use (PoU) reflects the fraction of the total elements used by any given simple functionality to deliver the overall capability. For example, does the average func-tionality use 10% of the elements, or 80% of the elements supporting that capability? Systems with low proportion of use are more resilient to a disruption, since each element is involved in comparatively fewer simple functionalities, and easier to reorganize, because elements are less extensively used in the capability. Systems with high proportions of use are less resilient to dis-ruption, since elements tend to be involved in comparatively more simple functionalities for a given capability, and more difficult to reorganize, because each element is extensively involved in the simple functionalities needed to deliver the overall capability. Proportion of Use is defined in Equation (2). A second means of measuring flexibility using the graph-theoretic properties of Petri Nets is defined in [9].
(2) where: r = total number of information flow paths ℓ Bi = number of elements e contained by path ℓi E = total number of element
There are three primary means of addressing capacity when time is also considered. Buffer-
ing Capacity is the capability margin available immediately at the time of disruption or attack. Reactive Capacity accounts for the fact that certain systems are able to bring additional capacity on line after a given reaction time, defined as trc. This allows for the system to increase capacity to some maximum value, Vmax. Given a system survives a disruption, Residual Capacity de-scribes the remaining capacity above the threshold requirements and captures system vulnerabili-
rE
B
rE
B r
ii
r
ii
1
1
PoU
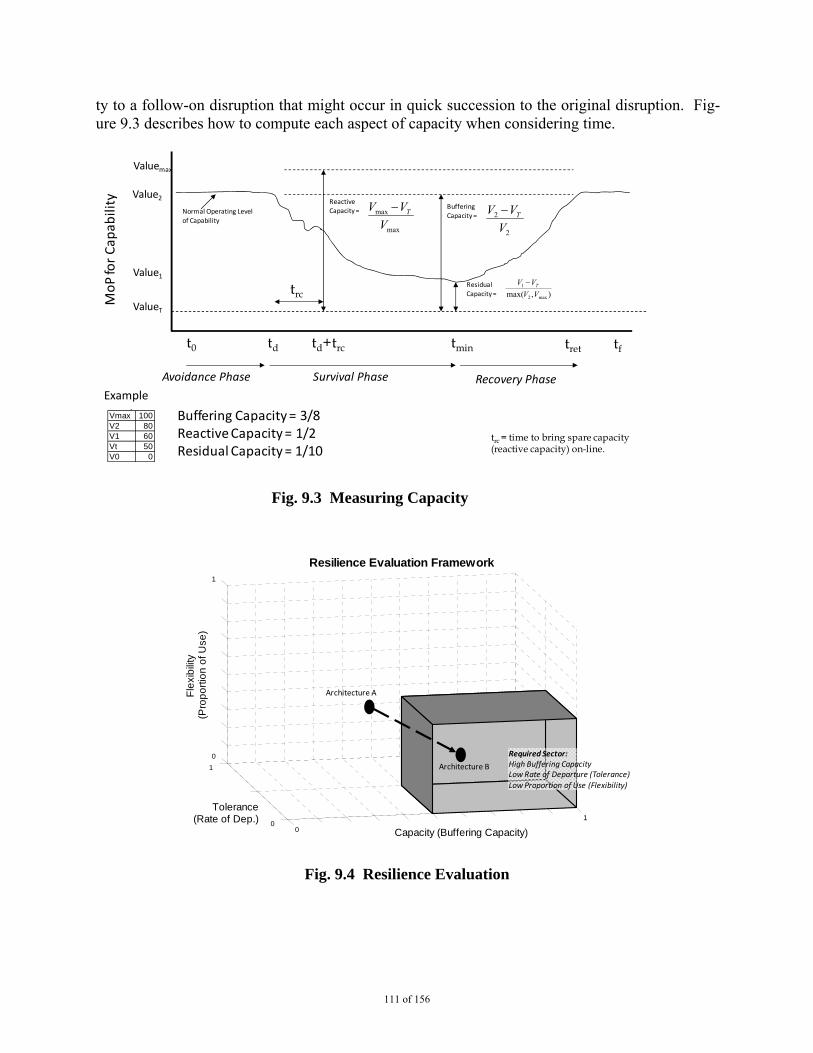
111 of 156
ty to a follow-on disruption that might occur in quick succession to the original disruption. Fig-ure 9.3 describes how to compute each aspect of capacity when considering time.
Fig. 9.4 Resilience Evaluation
Fig. 9.3 Measuring Capacity
0
10
1
0
1
Resilience Evaluation Framework
Capacity (Buffering Capacity)
Tolerance(Rate of Dep.)
Fle
xib
ility
(P
rop
ort
ion
of U
se)
Required Sector:High Buffering CapacityLow Rate of Departure (Tolerance)
Low Proportion of Use (Flexibility)
Architecture A
Architecture B
MoP for Cap
ability
t0 td tmin tret tf
ValueT
Value2
Value1
Normal Operating Level
of Capability
Example
Residual
Capacity =
Valuemax
Buffering
Capacity =
2
2
V
VV T
),max( max2
1
VV
VV T
pVmax 100V2 80V1 60Vt 50V0 0
Buffering Capacity = 3/8Reactive Capacity = 1/2Residual Capacity = 1/10
max
max
V
VV TReactive Capacity =
td+trc
trc
trc = time to bring spare capacity (reactive capacity) on-line.
Survival Phase Recovery PhaseAvoidance Phase
112 of 156
9.4 COMBINING THE MEASURES TO EVALUATE RESILIENCE
Section 9.3 defined measures for each attribute of resilience: capacity, tolerance, flexibility. A holistic evaluation is possible by first, selecting the appropriate metric for each attribute; second, measuring the architecture’s performance against each metric; and third, comparing the architec-ture’s performance against a required performance level for each attribute. Resilience-related improvements to the design can now be quantified and alternative architectures can be compared. The idea is to evaluate the resilience performance of the baseline architecture against the resi-lience requirements established by the system developers. Then either compare the baseline against alternative architectures, or make improvements to the baseline to move its performance into a desired range. (Fig. 9.4)
9.5 COMMENTS AND CONCLUSIONS
This chapter has described a quantitative means to evaluating the expected resilience of a com-mand and control system using its architecture. The key idea has been to use measures for each of the attributes of resilience, and then to combine these measures into a holistic assessment. By representing the architecture in a rigorous way using Petri nets, the approach supports simulation of the architecture and the analysis of static properties. This allows us to examine the expected performance (by executing the Petri net based architecture) and structural characteristics, such as information flow paths determined via analysis of the place invariants of the architecture. How-ever, this work focused on the survival phase of resilience. While flexibility does in part address characteristics beneficial during a recovery phase, such as the ability to reorganize, further re-search is needed to identify a complete end-to-end assessment of resilience that would include the avoidance, survival, and recovery phases
9.6 REFERENCES
[1] INCOSE, Resilient Systems Working Group homepage: http://www.incose.org/practice/techactivities/wg/rswg/
[2] S. Jackson, Architecting Resilient Systems: accident avoidance and survival and recovery from disruptions. Hoboken, NJ: Wiley Series in Systems Engineering and Management, 2010.
[3] ISO/IEC Systems and software engineering - Recommended practice for architectural de-scription of software-intensive systems, ISO/IEC 42010, 2007
[4] P. H. Cothier and A.H. Levis, Timeliness and Measures of Effectiveness in Command and Control, IEEE Transactions on Systems, Man, and Cybernetics Vol SMC-16, No 6, Novem-ber/December 1986.
[5] V. Bouthonnier and A.H. Levis, Effectiveness of C3 Systems, IEEE Transactions on Systems, Man, and Cybernetics Vol. SMC-16, No 14, January / February 1984
[6] M. A. Pflanz “On the Resilience of Command and Control Architectures” PhD Dissertation, Dept of Information Technology and Engineering, George Mason University, Fairfax, VA, November 2011 (in progress).
113 of 156
[7] F.R.H. Valraud and A. H. Levis, On the Quantitative Evaluation of Functionality in C3 Sys-tems, AFCEA International Press, pp132-139, August 1989.
[8] J. Martinez and M. Silva, C. Girrault and W. Reisig, "A simple and fast algorithm to ob-tain all invariants of generalized Petri nets", Informatik-Fachbrichte 52, pp. 301 - 303 , 1982: Springer-Verlag
[9] S.W. Liles “On The Characterization and Analysis of System of Systems Architectures” PhD Dissertation in Information Technology and Engineering, Volgenau School of Engineering, George Mason University, Fairfax, VA, August 2008

114 of 156
115 of 156
CHAPER 10
CONCLUSIONS 10.1 SUMMARY This project, as its title says, Resilient Architectures for Integrated Command and Control in a Contested Cyber Environment, addressed a number of key issues in Command and Control and established a foundation over which an integrated approach for designing and evaluating future Command an Control architectures can be built. By necessity, each of the key concepts had to be researched independently to set the foundation and then the process for integrating these con-cepts was started. Key basic contributions in defining resilience and in modeling analytically cy-ber exploits and their effect on computer communications networks were made and are docu-mented in this report (Chapter 9 and Appendix A, respectively.)
A program of computational experimentation was initiated consisting of three spirals. Spirals 1 (Chapter 3) and 2 (Chapter 4) focused on the resilience of planning in an Air Operations Center when subjected to cyber attacks. Resilience is currently provided by having back-up human teams that can execute the tasks (with some delay) if the C3 systems become compromised. In Spiral 2 the effect of having back-up systems and networks was explored. These experiments were conducted on an enhanced version of the C2 Wind Tunnel (Chapters 2 and 5.) A compa-nion set of experiments using Agent Based Modeling and Social Network Analysis focused on the resilience of multiple collaborating Air Operations Centers and showed that the inter-operation of the centers increases resilience (Chapters 7 and 8.)
The second major issue was the meaning and implementation of integrated Command and control. When multiple entities such as component commands or supported and supporting Combatant Commands need to conduct operations in which air, space and cyber operations (as well as Integrated Missile Defense and Information Operations) are to be integrated, the devel-opment of a set of integrated Courses of Action becomes problematic. The first finding was that integrating multiple COAs is not the same as an integrated COA. To achieve an integrated COA, it is first necessary (but not sufficient) for the various entities to arrive at a common view of the mission, i.e., the collaborative process of Mission Analysis should result in a common under-standing of the mission. Given that, another set of collaborative activities need to take place so that integrated COAs are developed. Spiral 3 addressed this issue by modeling four Component Command staff conducting Mission Analysis collaboratively and then COA development also collaboratively. Computational experiments were run to assess the resilience of these C2 archi-tectures (Chapter 6).
10.2 FUTURE RESEARCH
While much was accomplished, the research raised a number of questions to be explored as well as pointing to a set of integrated experiments in which the resilience measures that were devel-oped would be applied to the proposed Integrated c2 architectures to evaluate them and then im-prove them.
STRATCOM has issued a new Concept of Operations in which the development of Inte-grated COAs is to be achieved through the use of a complex structure of Councils, Committees,
116 of 156
Boards and Bureaus, and Working Groups (C2B2WG). Two forms of coordination and collabo-ration are enabled: Direct Collaboration as exemplified by the workings of elements of the B2C2WG in which participants representing different staff organizations and component com-mands are collaborating, and Indirect Collaboration which is achieved by having the same enti-ties participating in multiple elements of the B2C2WG structure. This needs to be modeled and analyzed. For example, in time sensitive planning, many of the C2B2WG elements do not get activated in order to obtain a short and timely process. How does that affect the quality of the integrated COAs and how is resilience affected? These are very open questions that have not been studied and have not yet been tested via exercises and table top war games. The approaches described in this report are well suited to address them in a methodical and technically sound ap-proach.
In the Social Network Analysis and Agent Based Modeling approach, a simplified model that made each AOC identical was developed. From this initial effort, a deliberate effort should be made to modify the structure of each Operations center to more closely align with the way each center sees itself. The process of aligning the model of each center with the as-built versions of STRATCOM’s Operations Centers (e.g., the GOC, JSpoC, Cyber Ops Center and AOC) would allow several things: a comparison between as-designed and as-built for each center; a compari-son between this universal design and a multi-design model to substantiate the use of general models; and increasing the face-value plausibility of the static and stylized models.
Figure 7.1 showed related, but not tightly coupled research efforts between GMU & CMU. Both research centers should expand the scope of future efforts to incorporate the bi-direction communications between COCOM HQs and their operations centers. The expansion of the scope of the model will allow a more detailed examination of cyber events in the context of an entire set of commands, without the simplifying assumption that each organization was an island unto itself.
Neither the CMU nor GMU models incorporate shift work. Shift work brings its own chal-lenges to any organization, not least of which are the shift-change briefs at the end/beginning of each shift. The model as built, where all agents can interact with each other regardless of the shift they are on, does not capture the complexity of maintaining shared knowledge across shift barriers. Nor does it directly incorporate the communications overhead associated with doubling a shift’s population, nor the long term performance drop of shift workers taken out of their nor-mal operating cycles. Shift work virtual experiments should incorporate at least two shift sche-dules: Day/Mid/Swing and Day/Night. Developing this additional complexity in the model will increase the face validity of the model as shift workers are generally not conducting face-to-face interactions except for short duration, high volume interactions (shift-change briefs).
Construct has a task-based interaction mechanism that does not have the capacity to mimic time-limited and task-prioritized tasks. Future simulations that incorporate such a capacity would automatically be able to help with the observation that different phases of a campaign can drive different results and solutions to the observed problem. Indeed, distinctions need to be made be-tween deliberate planning, contingency planning, and time sensitive planning.
Construct has an asynchronous communications mechanism in the form of email. We did not use this technique in this simulation. Future efforts at developing the simulation should consider not only email, but other methods of asynchronous communication. In addition to asynchronous technology such as email, or the DoD AMHS, modelers should include the more full bodied IT

117 of 156
communications infrastructure. All tech-related interactions are mediated with one or more com-puter terminals.
Future work should also attempt to identify if there is a tipping point where if a single addi-tional node or system becomes unavailable or less functional, some form of cascading failure is triggered.

118 of 156
119 of 156
APPENDIX A
MODELING THE IMPACT OF EXPLOITS ON COMPUTER COMMUNICATION NETWORKS
Network routers play a key role in data transport and are consequently attractive targets to adver-sary attacks. By manipulating, diverting or dropping data packets arriving at a compromised router, an adversary can mount denial-of-service, surveillance or man-in-the-middle attacks. We are focusing on the forms of malicious forwarding attacks on compromised routers and their im-pact on the network performance. The approach involves the following constructive steps: ■ Identify, categorize and model the various forms of malicious forwarding threats on rou-
ters.
■ Identify the operational performance metrics for the network, as evolving in time and set their boundaries associated with satisfactory operation.
■ Study the effect of each router attack on the network operational performance metrics.
A.1 INTRODUCTION Routers play a key role in modern packet switched network. To a first approximation, networks can be modeled as a series of point-to-point links connecting pairs of routers to form a directed graph. Since few endpoints are directly connected, data must be forwarded – hop-by-hop – from router to router, towards its ultimate destination. Therefore, if a router is compromised, it stands to reason that an attacker may drop, delay, reorder, corrupt, modify or divert any of the packets passing through. Such a capability can then be used to deny service to legitimate hosts, to im-plement ongoing network surveillance or to provide an efficient man-in-the-middle functionality for attacking end systems. Moreover, such attacks are not mere theoretical curiosities, but they are actively employed in practice. Attackers have repeatedly demonstrated their ability to com-promise routers, through combinations of social engineering and exploitation of weak passwords or latent software vulnerabilities [2, 21, 27]. Once a router is compromised an attacker need not modify the router’s code base to exploit its capabilities. Current standard command line interfac-es from vendors such as Cisco and Juniper are sufficiently powerful to drop and delay packets, send copies of packets to a third party, or “divert” packets through a third party and back. In fact, several widely published documents provide a standard cookbook for transparently “tunneling” packets from a compromised router through an arbitrary third-party host and back again – effec-tively amplifying the attacker’s abilities, including arbitrary packet sniffing, injection or modifi-cation [18, 45]. Such attacks can be extremely difficult to detect manually, and it can be even harder to isolate which particular router or group of routers has been compromised. The problem of detecting and removing compromised routers can be thought of as an instance of anomalous behavior-based intrusion detection. That is, a compromised router can potentially be identified by correct routers when it deviates from exhibiting expected behavior. This problem can be bro-ken into three distinct sub-problems:
120 of 156
1. Traffic validation. Traffic information is the basis of detecting anomalous behavior: given traffic entering a part of the network, and an expected behavior for the routers in the network (i.e. a known routing configuration), anomalous behavior is detected when the monitored traffic leaving one part of the network differs significantly from what is expected. However, implementing such validation practically can be quite tricky and requires tradeoffs between the overhead of monitoring, communication and accuracy.
2. Distributed detection. It is impossible for a single router to establish that its neighbor is ano-malous. Any such detection requires synchronizing a collection of traffic information and distributing the results so that anomalous behavior can be detected by sets of correct routers.
3. Response. Once a router, or set of routers, is thought to be faulty, the forwarding tables of correct routers must be changed to avoid using those compromised nodes. In addition, over longer time scales an appropriate alert must be raised so human forensic experts can respond appropriately.
There are two threats posed by a compromised router: the attacker may attack by means of the routing protocol (for example, by sending false advertisements) or by having the router vi-olate the forwarding decisions it should make based on its routing tables. The first situation is often referred to as an attack on the control plane, while the second is termed an attack on the data plane. The first threat has received, by far, the lion’s share of the attention in the research community, perhaps due its potential for catastrophic effects. By issuing false routing advertise-ments, a compromised router may manipulate how other routers view the network topology, and thereby disrupt service globally. For example, if a router claims that it is directly connected to all possible destinations, it may become a “black hole” for most traffic in the network. While this problem is by no means solved in practice, there has been significant progress towards this end in the research community, beginning with the work of Perlman. In her PhD thesis [36], Perl-man described robust flooding algorithms for delivering the key state across any connected net-work and a means for explicitly signing route advertisements. There have subsequently been a variety of efforts to impart similar guarantees to existing routing protocols with varying levels of cost and protection based on ensuring the authenticity of route updates and detecting inconsis-tency between route updates [12, 15, 19, 22, 24, 26, 42,44]. By contrast, the threat posed by subverting the forwarding process has received comparatively little attention. This is surprising since, in many ways this kind of attack presents a wider set of opportunities to the attacker – not only denial-of-service, but also packet sniffing, modification and insertion– and is both trivial to implement (a few lines typed into a command shell) and difficult to detect. Here, we focus en-tirely on the problem of malicious forwarding. The earliest work on fault-tolerant forwarding is also due to Perlman [36, 37]. Perlman developed a novel method for robust routing based on source routing, digitally signed route-setup packets, reserved buffers. However, many implemen-tation details are left open and the protocol requires higher network level participation to detect anomalies. Several researchers have subsequently proposed lighter-weight protocols for actively probing the forwarding path to test for consistency with advertised routes. Subramanian et al’s Listen protocol [44] does this by comparing TCP Data and Acknowledgment packets to provide evidence that a path is part of end-to-end connectivity. This approach only tests for gross connec-tivity and cannot reveal whether packets have been diverted, modified, created, reordered or se-lectively dropped. Padmanabhan and Simon’s Secure Traceroute [35] achieves a similar goal monitoring the traffic to the intermediate routers. Recently, Avramopoulos et al. [3, 4] presents a secure routing a combination of source routing, hop by hop authentication, end-to-end reliability
121 of 156
mechanisms and timeouts. But still it has a high overhead to be deployable in modern networks. The WATCHERS [9, 13] protocol detects disruptive routers based on a distributed network mon-itoring approach and a traffic invariant called conservation of flow. However, the WATCHERS protocol had many limitations in both its traffic validation mechanism and in its control protocol, many of which were documented by Hughes et al. [23]. Many of these weaknesses arose from the absence of a formal specification, a weak threat model and an excessive requirement for per-router state (bounded only by the total size of the network). Herzberg and Kutten [20] present an abstract model for Byzantine detection of compromised routers based on timeouts and acknowl-edgments from the destination and possibly from some of the intermediate routers to the source. The requirement of information from intermediate routers offers a trade-off between fault detec-tion time and message communication overhead.
A.2 PROBLEM STATEMENT AND GENERAL APPROACH/RESULTS
We consider the supporting communication network infrastructure in command and control ar-chitectures. We focus on the two-sided modeling of such infrastructures and their cyber vulne-rabilities for the Blue Forces and their adversaries. We modeled the computer communication infrastructures of both the Blue Forces and their
adversaries as packet switched backbone data networks whose major nodes are routers. We modeled some of the routers as connected to external traffics originating from either sa-
tellite or tactical communication environments and modeled the latter traffics. We modeled the data flows in the backbone data networks under normal conditions and iden-
tified performance metrics that may be affected by cyber exploits. Data forwarding exploits were characterized and their effects on the network performance
metrics were modeled. The environment of two interactive backbone data networks was modeled. A.3 MODELING A SATELLITE OR TACTICAL COMMUNICATION LINK
Our model for the link connecting a satellite or tactical communications source to a router is ex-hibited in Fig. A.1. In Fig. A.1, the information source may originate from either a satellite or from tactical communications and can be either analog or digital. To insure that the source signal is compatible with digital processing, we transform analog information sources into digital sources via the use of sampling and quantization. These techniques are called either formatting or source coding. The digital sources are considered being represented in the logical format of binary ones and zeros. Figure A.1 exhibits the formatting and transmission of baseband signals, where,
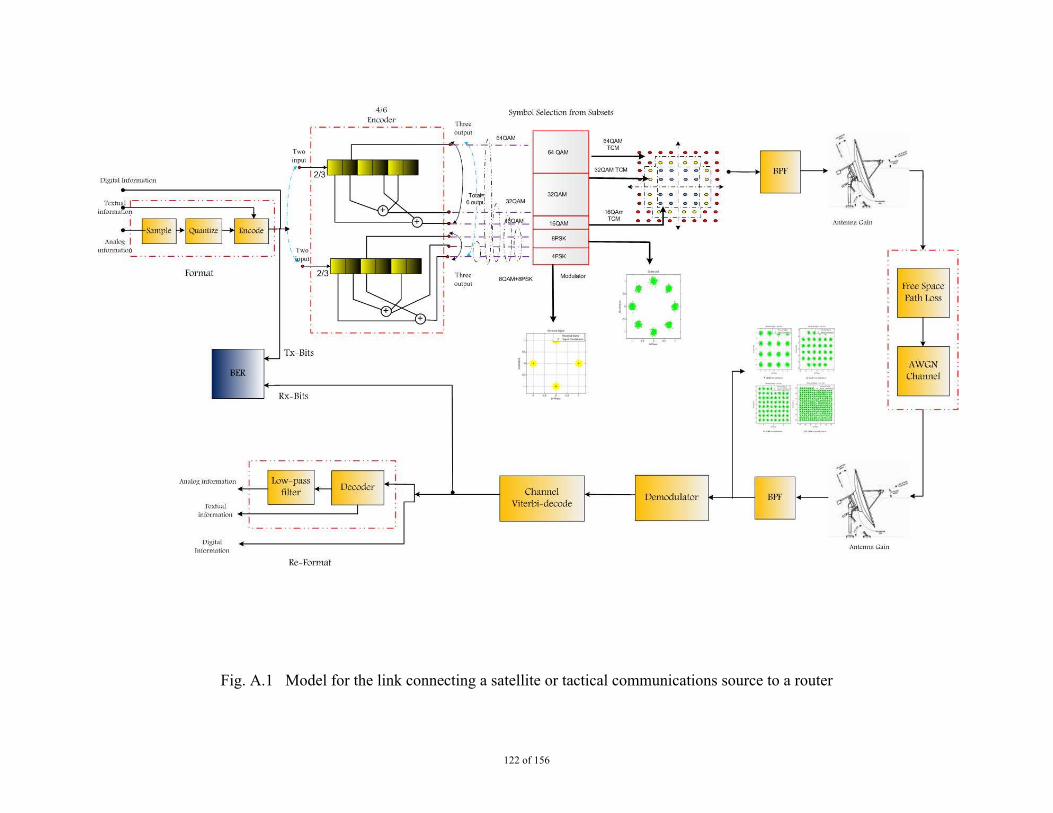
122 of 156
Fig. A.1 Model for the link connecting a satellite or tactical communications source to a router
123
1. Data is already in a digital format.
2. Textual information is transformed into binary digits by use of an encoder.
3. Analog information is formatted using three separate processes: sampling, quantization and coding.
The results for all three cases are binary digits, or “bit streams”. The bit streams are then transformed into pulse wave sequences via pulse modulation and the bit streams are recovered at the receiver via a demodulator.
The analog-to-digital (A/D) converter samples and quantizes the analog signal and represents the samples by binary sequences (bits 1 or 0). The source encoder accepts these binary sequences (digital signal) and encodes them into generally shorter sequences. The latter process is called source encoding or data compression; it compresses the signal by reducing redundancy, hence reducing the transmission speed, and thus reduces the signal bandwidth. The channel encoder accepts the output to the source encoder compressed signal and encodes it into a longer digital signal, adding error correction bits. Additional bits are intentionally added into the compressed encoded digital signal, so that some of the errors caused by the noise during transmission through the channel can be corrected at the receiver. Frequently, the transmission is in a high frequency passband, the modulator thus impresses the encoded digital symbols onto a carrier. Usually there is a power amplifier following the modulator. For high-frequency transmission, modulation and demodulation are usually performed in the intermediate frequency (IF). If this is the case, a fre-quency up-converter is inserted between the modulator and the power amplifier. For wireless and satellite systems, an antenna is the final stage of the transmitter. The transmission medium is usually called the channel, where, for satellite transmissions, noise is added to the signal, where fading and attenuation effects appear as a complex multiplicative factor on the signal. The term noise is used to represent a variety of random electrical disturbances caused from within and out-side the system sources. The channel noise normally possesses limited frequency bandwidth, so that it can be viewed as a filter. At the receiver, virtually the reverse signal processing happens. First the received weak signal is amplified (and down-converted if needed) and demodulated. Then the added due to error bits redundancy is removed by the channel decoder, and the source decoder recovers the signal to its original form before being sent to the user. A digital to analog (D/A) converter is needed for analog signals.
The digital modulator maps the digital information sequences to corresponding analog radio waveforms. In baseband representation, information sequences are mapped to a complex signal constellation and then transmitted from either a single antenna or multiple antennas. The infor-mation source, source encoder, channel encoder and modulator are collectively known as the transmitter. The physical medium over which the signals are transferred from the transmitter to the receiver is known as the channel. An ideal channel has no fading or other channel perturba-tions. The only concern for the receiver operating on an ideal channel is the disturbance caused by the presence of thermal noise primarily due to the receiver amplifier. The thermal base band noise is modeled as additive white Gaussian noise (AWGN).
In a satellite communication system, the channel is usually more complicated than the simple AWGN model. For example, the fixed-access line of a sight digital microwave radio channel is a multi-path fading channel. In such a channel, the received signal is the linear combination of components arriving via multiple channel paths reflected by obstacles such as trees, buildings or atmospheric disturbances. If multiple transmit antennas and receive antennas are used, the re-
124
flected radio signals typically travel over several uncorrelated propagation paths and arrive at different receive antennas with different phases and signal levels.
The block diagram in Fig. A.1 is just a typical system configuration. For a multi-user system and a multi-station system, a multiplexing and multiple access control stage is added; before the modulator for a multi-user system case; and before the transmitter for multi-station system case. Therefore, a real system configuration could be more complicated. In addition, the system shown in Fig. A.1 can also be simpler if Source and Channel coding may be unnecessary. In the latter case, only the source, modulator, channel, demodulator, amplifier, and antennas, for wire-less communication systems, are necessary. The fundamental objective of the communication system design is the effective delivery of information from transmitter to receiver, with accepta-ble information distortion, as dictated by the application. The channel model used most often is the Additive White Gaussian Noise (AWGN) channel. In an AWGN channel, independent iden-tically distributed noise samples are added to the transmitted information symbols. The noise samples have a Gaussian distribution, i.e., the conditional density of the channel output y given the input x is given by,
According to Shannon, reliable communication with arbitrarily low bit error rate (BER) in the AWGN channel can be achieved for transmission rates below
where W is the bandwidth occupied by the information bearing signal, S is the signal power and is the Gaussian noise variance.
Information can be defined in two forms: digital or analog. A analog signal is such that its amplitude can take any value within an open interval; thus the number of possible amplitude val-ues is then infinite. Voice is analog and can take any number of volume levels within its dynam-ic-range. Digital devices convert analog voice to a digital signal (A/D) by the process of sam-pling and quantization. The analog signal is first sampled and then quantized in a finite number of levels. Each level is then converted into a binary sequence. For example, we may quantize voice in 16 levels, where each of these levels can be represented by four bits. The same process can be performed for image and video signals.
Nearly all components are digital. The medium is the environment that the signal travels through. It can be air, space or various types of wires. Each medium offers its own unique set of advantages and distortions that determining what will be used as a carrier. A signal through space, as in satellite transmission, may require a very high frequency carrier that can overcome space and other atmospheric losses. The carrier frequency may be otherwise light, as in optical fiber, or microwave, as in mobile communications. Most mediums dictate the type of carrier (its frequency, amplitude) that can propagate effectively through it and the type of distortions that the carrier will be affected by. Wireless carriers are always analog, while wired carriers can be both analog and digital. Communications inside a computer are examples of purely digital repre-sentations: digital data over digital medium. LAN communications are digital data over analog medium. The AM and FM radios are examples of analog data over analog medium.
125
To convert an analog signal to a digital signal, the following three steps are required. First, the signal is passed through a lowpass filter to prevent aliasing. Second, the signal is sampled by a sample-and-hold circuit. Finally, the samples are quantized by an analog to digital converter (ADC) in order to be represented in digital form.
Digital modulation techniques are necessary for many digital communication systems, as ne-cessitated by the information transmission medium. In this, chapter, we discuss several modula-tion techniques that are applicable to digital communication systems. We present principles and applications information of most currently used digital modulation techniques, as well as new techniques that are currently being developed. We briefly discuss the role of modulation in a typ-ical digital communication system, basic modulation methods, and criteria for choosing modula-tion schemes. For each modulation scheme, the following topics are covered: historical back-ground, operation principles, bit error rate performance (power efficiency), bandwidth efficiency, block diagrams of modulator, demodulator, constellation for different modulation schemes, comparison, and applications. After presenting modulation schemes and their performances in the AWGN channel, we discuss their performances when an encoder and decoder are added to the overall system.
To provide an overview, we list the abbreviations and descriptive names of the various digi-tal modulation schemes that are listed in Table A.1. Among the listed schemes, ASK, PSK, and FSK are basic, while MSK, GMSK, QAM, etc. are advanced schemes. The advanced schemes are variations and combinations of the basic schemes. The constant envelope class is generally suitable for communication systems such as ASK and BSK; however, the generic FSK schemes in this class are inappropriate for satellite application since they have very low bandwidth effi-ciency in comparison to the PSK schemes. Binary FSK is used in the low-rate control channels of first generation cellular systems. The PSK schemes, including BPSK, QPSK, OQPSK, and MSK have been used in satellite communication systems. π/4-QPSK is worth special attention due to its ability to avoid 180" abrupt phase shift and to enable differential demodulation. It has been used in digital mobile cellular systems, such as the United States digital cellular (USDC) system. MSK has excellent power and bandwidth efficiency. Its modulator and demodulator are also not too complex. ASK is generally not suitable for systems with nonlinear power am-plifiers. QAM has been widely used in modems used in telephone networks, such as com-puter modems because it can achieve extremely high bandwidth efficiency. QAM can even be considered for satellite systems.
We begin our discussion of digital modulation by starting with the three basic forms of digi-tal modulation techniques: frequency shift keying (FSK), amplitude shift keying (ASK), and phase shift keying (PSK). In all these techniques, the transmitted information modifies a single parameter of a sinusoidal waveform: either frequency, or amplitude, or phase. The sinusoidal waveform, called the carrier, travels then through the corresponding medium, where the latter may be wire, air, water and space. The transmission medium generally introduces corruptions to the traveling sinusoidal waveform, and thus to the transmitted information. Below, we discuss each of the above three basic modulation techniques and their performance.
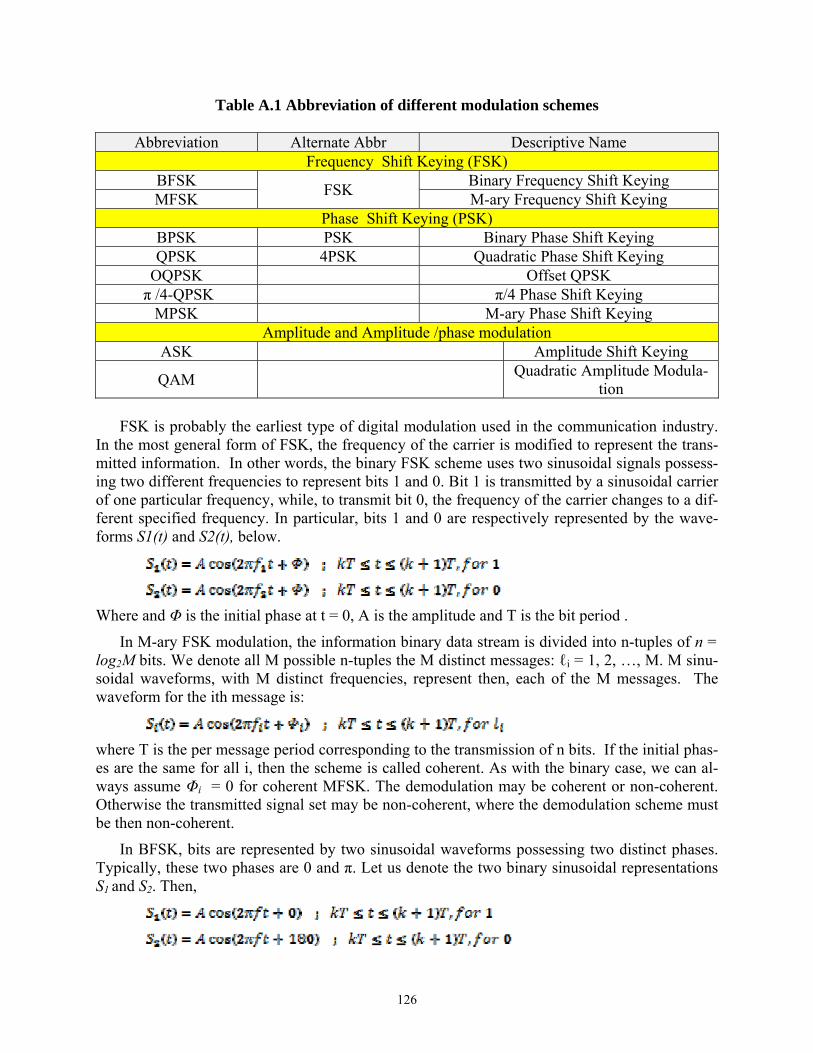
126
Table A.1 Abbreviation of different modulation schemes
Abbreviation Alternate Abbr Descriptive Name Frequency Shift Keying (FSK)
BFSK FSK
Binary Frequency Shift Keying MFSK M-ary Frequency Shift Keying
Phase Shift Keying (PSK) BPSK PSK Binary Phase Shift Keying QPSK 4PSK Quadratic Phase Shift Keying
OQPSK Offset QPSK π /4-QPSK π/4 Phase Shift Keying
MPSK M-ary Phase Shift Keying Amplitude and Amplitude /phase modulation
ASK Amplitude Shift Keying
QAM Quadratic Amplitude Modula-
tion
FSK is probably the earliest type of digital modulation used in the communication industry. In the most general form of FSK, the frequency of the carrier is modified to represent the trans-mitted information. In other words, the binary FSK scheme uses two sinusoidal signals possess-ing two different frequencies to represent bits 1 and 0. Bit 1 is transmitted by a sinusoidal carrier of one particular frequency, while, to transmit bit 0, the frequency of the carrier changes to a dif-ferent specified frequency. In particular, bits 1 and 0 are respectively represented by the wave-forms S1(t) and S2(t), below.
Where and Φ is the initial phase at t = 0, A is the amplitude and T is the bit period .
In M-ary FSK modulation, the information binary data stream is divided into n-tuples of n = log2M bits. We denote all M possible n-tuples the M distinct messages: ℓi = 1, 2, …, M. M sinu-soidal waveforms, with M distinct frequencies, represent then, each of the M messages. The waveform for the ith message is:
where T is the per message period corresponding to the transmission of n bits. If the initial phas-es are the same for all i, then the scheme is called coherent. As with the binary case, we can al-ways assume Φi = 0 for coherent MFSK. The demodulation may be coherent or non-coherent. Otherwise the transmitted signal set may be non-coherent, where the demodulation scheme must be then non-coherent.
In BFSK, bits are represented by two sinusoidal waveforms possessing two distinct phases. Typically, these two phases are 0 and π. Let us denote the two binary sinusoidal representations S1 and S2. Then,
127
In the above representation, the information bit is represented by a 180 degrees phase-change in a sinusoidal signal and the two bit representations are then called antipodal. This phase choice corresponds to a signal design that minimizes the probability of error in AWGN transmission, inducing a correlation coefficient of –1.
In BPSK, the unit circle is 2-quantized. As a generalization, M-quantized levels of 2π may be deployed, to create a variety of PSK modulation schemes. Given M, let i be a number from 1 to M. The allowed phases are then given by the following modulating angles.
In the above expression, M stands for the order of the modulation. M = 2, results in a BPSK scheme, M = 4 represents a QPSK scheme, and so on. We note that all PSK signals may be graphically represented by a signal constellation in a two-dimensional coordinate system. The following diagram shows some of the MPSK modulation schemes and their “constellations.”
As compared to the BPSK, for M larger than 2, the MPSK decreases the signal bandwidth. Indeed, in BPSK, a single bit is represented by a single sinusoidal waveform, while such a wave-form represents n = log2M bits in MPSK.
Among all the MPSK schemes, QPSK is the most frequently used because it does not suffer from Bit Error Rate (BER) degradation, while the bandwidth efficiency is sufficiently increased, as compared to the BPSK. Other MPSK schemes, on the other hand, increase bandwidth effi-ciency at the expenses of BER performance. In this section we will study QPSK in great detail.
If the transmission rate of the symbols is the same in QPSK and BPSK, it is intuitively ob-vious that BPSK transmits data half as fast as QPSK does. At the same time, we observe that the distance of adjacent points in the QPSK constellation is less than that of the BPSK. In compari-son to the BPSK, this causes demodulation problems, where the distinction of symbols worsens and the per symbol error performance thus degrades and so consequently does the bit error rate. However, as shown in the Fig. A.2, the bit error probability remains the same.
As compared to the QPSK, in 16-PSK, the signal space is subdivided into smaller regions. 16 sinusoidal signals or symbols are then available, where each symbol represents 4 bits. The bit rate is now four times that of the BPSK for the same symbol rate. Figure A.3 shows the 16-PSK signal at various stages during modulation.
π/4-QPSK has been designated as the American standard of the second-generation cellular mobile communications. It is a variation of the QPSK that mimics 8-PSK. Like QPSK, π/4-QPSK transmits two bits per symbol. So only four carrier signals are needed but this is where the twist comes in. In QPSK we have four signals that are used to send the four two- bit- length symbols. In π/4-QPSK, we have eight signals, instead: every alternate symbol is transmitted us-ing a π/4 shifted pattern of the QPSP constellation. As shown below, a symbol at (45º, 135º, 225º, -45º ) uses a signal on this path, while, even if the pattern remains unchanged, the next symbol uses path (0º, 90º, 180º, 270º). Thus, a phase shift always occurs, even when adjacent symbols are identical. The constellation diagram looks similar to the 8-PSK. Note that a 8-PSK constellation can be broken into two QPSK constellations as show below. In π/4-QPSK, one symbol is transmitted on the first type constellation and the next one is transmitted using the second type constellation. Even though the constellation looks like 8-PSK, on the network ana-
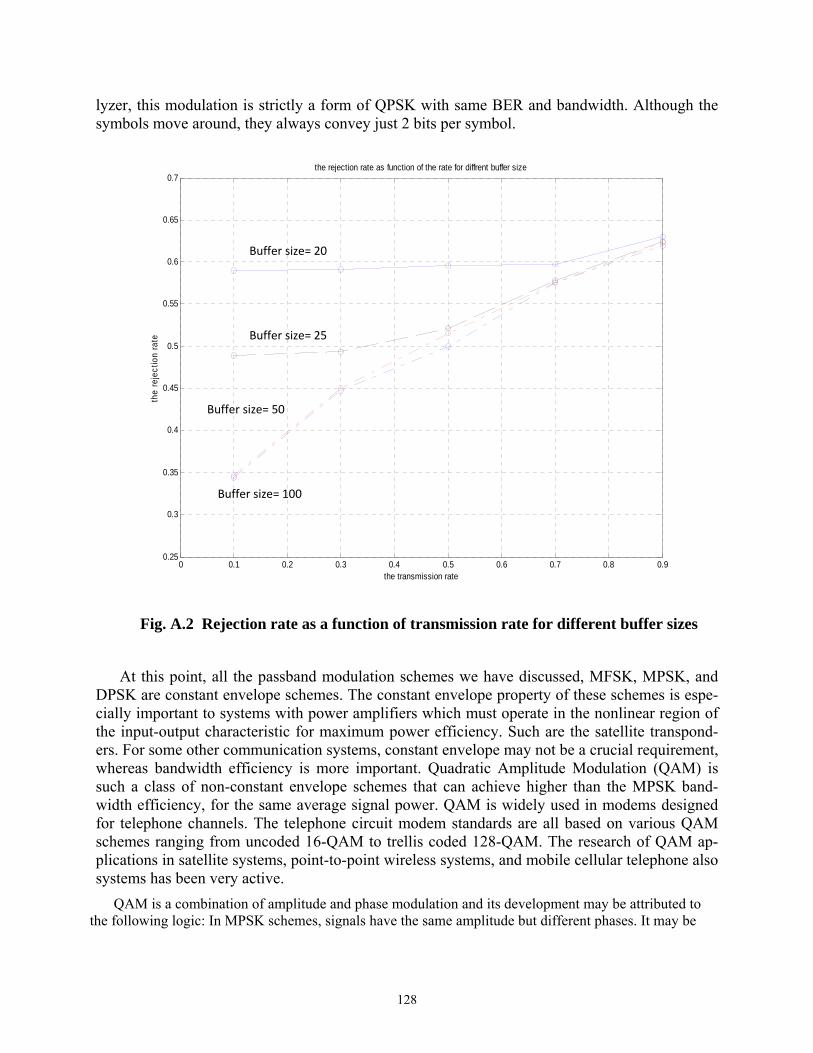
128
lyzer, this modulation is strictly a form of QPSK with same BER and bandwidth. Although the symbols move around, they always convey just 2 bits per symbol.
Fig. A.2 Rejection rate as a function of transmission rate for different buffer sizes
At this point, all the passband modulation schemes we have discussed, MFSK, MPSK, and DPSK are constant envelope schemes. The constant envelope property of these schemes is espe-cially important to systems with power amplifiers which must operate in the nonlinear region of the input-output characteristic for maximum power efficiency. Such are the satellite transpond-ers. For some other communication systems, constant envelope may not be a crucial requirement, whereas bandwidth efficiency is more important. Quadratic Amplitude Modulation (QAM) is such a class of non-constant envelope schemes that can achieve higher than the MPSK band-width efficiency, for the same average signal power. QAM is widely used in modems designed for telephone channels. The telephone circuit modem standards are all based on various QAM schemes ranging from uncoded 16-QAM to trellis coded 128-QAM. The research of QAM ap-plications in satellite systems, point-to-point wireless systems, and mobile cellular telephone also systems has been very active.
QAM is a combination of amplitude and phase modulation and its development may be attributed to the following logic: In MPSK schemes, signals have the same amplitude but different phases. It may be
0 0.1 0.2 0.3 0.4 0.5 0.6 0.7 0.8 0.90.25
0.3
0.35
0.4
0.45
0.5
0.55
0.6
0.65
0.7the rejection rate as function of the rate for diffrent buffer size
the transmission rate
the
reje
ctio
n ra
te
Buffer size= 20
Buffer size= 25
Buffer size= 100
Buffer size= 50
129
natural to consider both amplitude and phase modulations (QAM) as the next development step, where the transmitted signals are:
where is the amplitude and is the phase of the signal in the M-ary signal set. Simi-larly to the MPSK, a geometric representation called constellation is a very clear way of describ-ing a QAM signal set. A QAM signal is represented by a point or vector, or phasor. The two axes sometimes are simply labeled as I-axis and Q-axis.
Trellis Coded Modulation (TCM), introduced by Ungerboeck, is a very effective method for reducing the required power without any increase in the bandwidth requirement. The innovative aspect of TCM is the concept that encoding and modulation should not be treated as separate ent-ities, but rather, as a unique operation. We usually consider coding and modulation as two sepa-rate stages in a communication connection, while in TCM the two stages are united. Trellis Coded Modulation (TCM) is a relatively complex concept, especially due to the nonlinear nature of its operation. TCM belongs in the class of convolutional codes and has been applied for transmissions through telephone, satellite and microwave digital radio channels, where coding gains of the order of 3-6 dB may be obtained with no loss in bandwidth or data rate. Generally, the Hamming distance between binary representations of two signals does not possess a direct translation to their distance in the signal/symbol space (after modulation). It may be concluded, therefore, that the Hamming distance is not the correct distance representation between different symbols. On the other hand, the geometric distance between the signals or their Euclidean dis-tance (ED) may be the appropriate measure.
The objective of modulation is the transformation of encoded (for error correction) symbols into a signal-form that is suitable for transmission through the available channel. For AWGN channels with fading, noise is added to the latter signal-form, while other artifacts are also in-flicted upon it. At the receiver, the received noisy signal is first demodulated and the encoded symbols are recovered with some error. Then, the decoder (Viterbi Decoder) attempts to correct the errors using the extra information available due to the redundancy bits added by the channel encoder (Trellis Encoder).
As of the results in the information theory of Shannon, the best system performance can be obtained when codes for long message sequences are designed, as long as the transmission rate remains below the channel capacity. The receiver decides then among different long mes-sage/symbol sequences rather than making per symbol decisions. The induced probability of error is inversely proportional to the length of the symbol sequences decoded. TCM follows the Shannon principle: At the digital level, it collects a block of bits and encodes them by inserting extra error-correcting bits. The so extended binary sequences are then modulated for conversion to a analog form via the use of a sinusoidal carrier.
TCM combines the functions of a convolutional coder and a M-ary signal mapping that maps M = 2k input points into a larger constellation of M = 2k + 1 constellation points. For k = 2, we have a code of rate 2/3 that takes a 4PSK signal (M = 4) and produces a 8-PSK signal (M = 8). Thus, instead of expanding the bandwidth, as the signal transforms from 4PSK to 8PSK, it doubles the constellation points. The same scenario applies if we select k=4, and we choose a code rate 4/5 that takes a 16-QAM signal (M=16) and produces a 32-QAM signal (M = 32). Thus, instead of expanding the bandwidth, as the signal transforms from 16-QAM to 32-QAM, the system is upgraded to one with a larger number of constellation points.
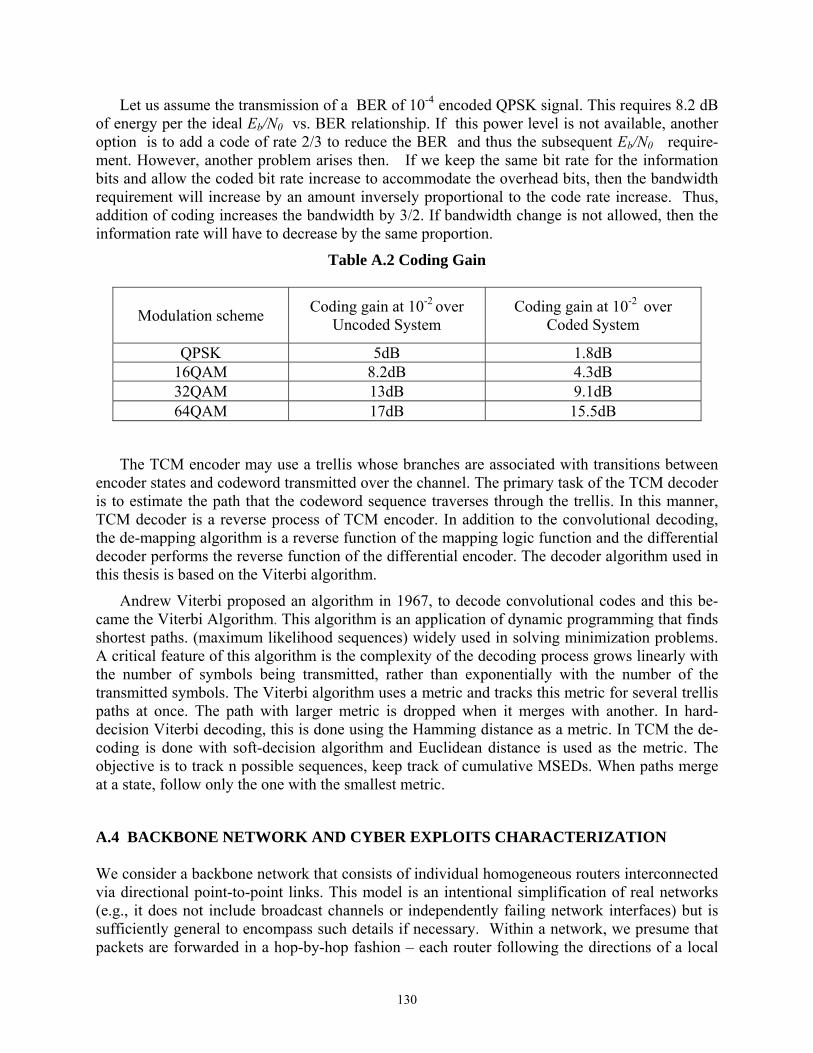
130
Let us assume the transmission of a BER of 10-4 encoded QPSK signal. This requires 8.2 dB of energy per the ideal Eb/N0 vs. BER relationship. If this power level is not available, another option is to add a code of rate 2/3 to reduce the BER and thus the subsequent Eb/N0 require-ment. However, another problem arises then. If we keep the same bit rate for the information bits and allow the coded bit rate increase to accommodate the overhead bits, then the bandwidth requirement will increase by an amount inversely proportional to the code rate increase. Thus, addition of coding increases the bandwidth by 3/2. If bandwidth change is not allowed, then the information rate will have to decrease by the same proportion.
Table A.2 Coding Gain
Modulation scheme Coding gain at 10-2 over
Uncoded System Coding gain at 10-2 over
Coded System
QPSK 5dB 1.8dB 16QAM 8.2dB 4.3dB 32QAM 13dB 9.1dB 64QAM 17dB 15.5dB
The TCM encoder may use a trellis whose branches are associated with transitions between encoder states and codeword transmitted over the channel. The primary task of the TCM decoder is to estimate the path that the codeword sequence traverses through the trellis. In this manner, TCM decoder is a reverse process of TCM encoder. In addition to the convolutional decoding, the de-mapping algorithm is a reverse function of the mapping logic function and the differential decoder performs the reverse function of the differential encoder. The decoder algorithm used in this thesis is based on the Viterbi algorithm.
Andrew Viterbi proposed an algorithm in 1967, to decode convolutional codes and this be-came the Viterbi Algorithm. This algorithm is an application of dynamic programming that finds shortest paths. (maximum likelihood sequences) widely used in solving minimization problems. A critical feature of this algorithm is the complexity of the decoding process grows linearly with the number of symbols being transmitted, rather than exponentially with the number of the transmitted symbols. The Viterbi algorithm uses a metric and tracks this metric for several trellis paths at once. The path with larger metric is dropped when it merges with another. In hard-decision Viterbi decoding, this is done using the Hamming distance as a metric. In TCM the de-coding is done with soft-decision algorithm and Euclidean distance is used as the metric. The objective is to track n possible sequences, keep track of cumulative MSEDs. When paths merge at a state, follow only the one with the smallest metric.
A.4 BACKBONE NETWORK AND CYBER EXPLOITS CHARACTERIZATION We consider a backbone network that consists of individual homogeneous routers interconnected via directional point-to-point links. This model is an intentional simplification of real networks (e.g., it does not include broadcast channels or independently failing network interfaces) but is sufficiently general to encompass such details if necessary. Within a network, we presume that packets are forwarded in a hop-by-hop fashion – each router following the directions of a local
131
forwarding table. As well, we assume that these forwarding tables are updated via a distributed link-state routing protocol such as OSPF or IS-IS. This is critical, as we depend on the routing protocol to provide each node with a global view of the current network topology. Finally, we also assume the administrative ability to assign and distribute shared keys to sets of nearby rou-ters. This overall model is consistent with the typical construction of large enterprise IP net-works or the internal structure of single ISP backbone networks, but is not well-suited for net-works that are composed of multiple administrative domains using BGP.
At this level of abstraction, we can assume a synchronous network model of synchronized clocks and bounded message delays. If the network behaves asynchronously for too long, then the routing tables will be updated, thereby changing the network topology. This assumption is common to all protocols we know of that have addressed the problem of detecting compromised routers.
We assume that attackers can compromise one or more routers in a network and may even compromise sets of adjacent routers as well. In general, we parameterize the strength of the ad-versary in terms of the maximum number of adjacent routers along a given path that can be com-promised. However, we assume that between any two un-compromised routers, there is suffi-cient path diversity so that the malicious routers do not partition the network. In some sense, this assumption is pedantic, since it is impossible to guarantee any network communication across such a partition. Another way to view this constraint is that path diversity between two points in the network is a necessary, but insufficient, condition for tolerating compromised routers.
The threats listed below completely cover the set of bad behaviors a router can exhibit in forwarding data. When all of these metrics are zero, then no router is forwarding traffic in a faul-ty manner.
Packet loss. A compromised router can drop any subset of the packets. As per Almes et
al. [1] loss can be measured as the amount of data arriving at the sink of path segment subtracted from the amount of data sent from its source.
Packet fabrication. A compromised router can generate packets and inject them into the traffic stream. This can be measured as the number of packets which are reported at the sink of a packet segment but not monitored as being sent by its source. Misrouting pack-ets can be considered an instance of both packet loss and packet fabrication.
Packet modification. One can consider this threat as a combination of packet loss and fa-brication, but it may not be detectable by simply comparing the number of packets arriv-ing at the sink with the number sent from the source. Instead, some summary of the con-tent needs to be maintained, and one measures the number of modified packets.
Packet reordering. A compromised router can reorder packets. Doing this can lead to performance problems or, in the extreme, denial of service. There are many reasonable and incompatible methods of measuring the amount of reordering, e.g. [5, 6, 31, 38].
Time behavior. A compromised router can delay traffic. Like reordering, doing this can lead to performance problems or, in the extreme, denial of service. There are simple me-trics one can use, such as the first n moments of the inter-packet delay distribution. However, such metrics are notoriously sensitive in packet networks.
132
We note that cyber exploits may be induced on the satellite/tactical communication links as well, where our models for such links are explained in Section 3 of this report. A form of such exploit is manifested by packet fabrication at the transmission end of the model in the Fig. A.1.
A.5. MODELING OF CYBER EXPLOITS In this section, we present models for the four categories of data forwarding threats listed in Sec-tion 4. We define by slot, the time occupied by a packet transmission.
Packet fabrication. For the backbone data network, we model the packet fabrication as the injection of a Poisson stream of packets, since Poisson traffic is a worst case scenario for a significant class of transmission protocols. Specifically, we assume that per slot, the attacker inserts k additional packets with probability Pk = e-λ λk / k! . For the satel-lite/tactical communication link in Section A.3, we model packet fabrication by rate in-crease in the Trellis codes.
Packet modification. We model the packet modification as packets being transmitted through a memoryless binary symmetric channel with probability of correct transmission p, where p may be less than 0.5. This model also represents a worst case scenario, where the less than 0.5 correct transmission conflicts with the well-established minimum dis-tance decoding scheme.
Packet reordering. There are two possibilities here: (1) The attacker changes the over-head encoding of packets, to induce altered packet ordering. This case may be absorbed within the packet modification model. (2) The attacker reshuffles the packets without changing their overhead encoding. Then, correct reordering induces some process com-plexity and delay which may be absorbed within the time behavior model.
Time behavior. We model adversary delay by delaying each packet independently by a random time T measured in slot units. One choice for the distribution of the random va-riable T is geometric, where then, P(T=n) = (1-α)αn ; n = 0, 1,.. ; 0 < α < 1.
A.6. PERFORMANCE METRICS AND EFFECTS OF CYBER EXPLOITS
In this section, we determine the network performance metrics affected by each of the data for-warding threat models presented in Section II.3, and study the effects of the later models on them. Since packet reordering is embedded in packet modification and time behavior, we do not present it as a separate treat category from now on.
• Packet fabrication. The fabricated packets increase the traffic flow in the network, resulting in queues’ overflows and denial of service. The affected network performance metrics are: traffic rates, data rejection rates and delays.
In view of the Poisson packet fabrication model in Section II.3, packet fabrication modifies the pertinent network metrics as follows:
Defining,
mn : New average message length, after generation of fabricated packets.
mo : Average message length before generation of fabricated packets.
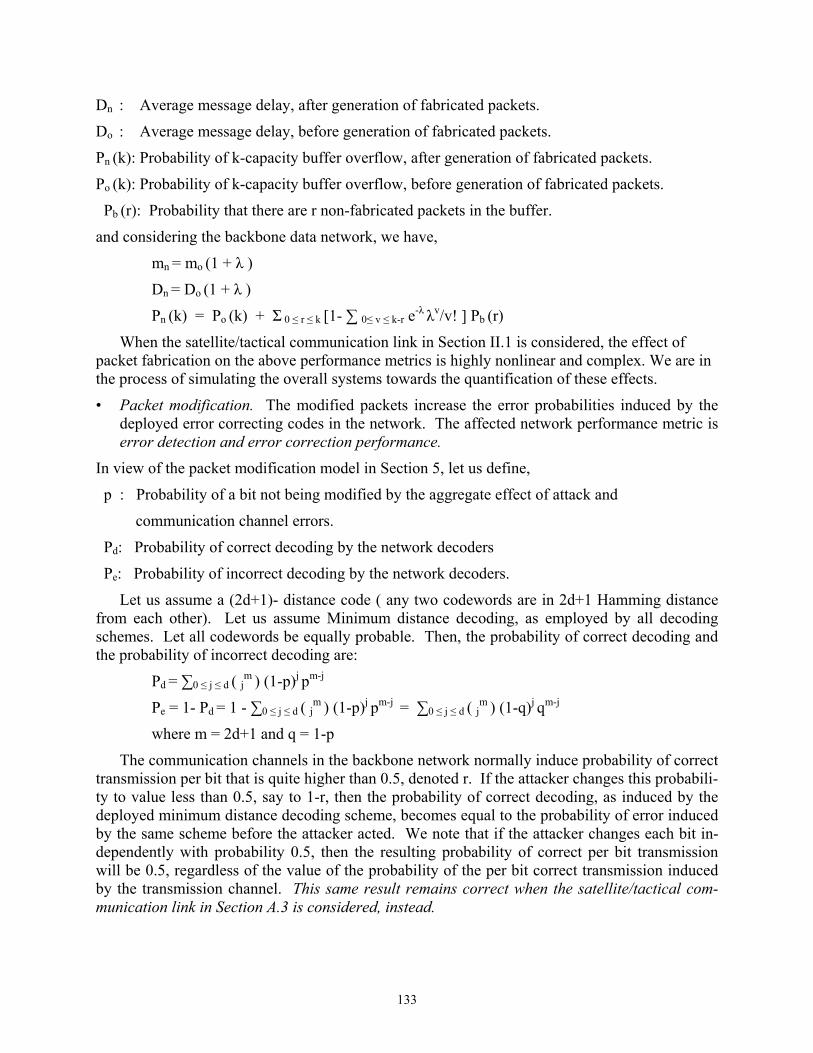
133
Dn : Average message delay, after generation of fabricated packets.
Do : Average message delay, before generation of fabricated packets.
Pn (k): Probability of k-capacity buffer overflow, after generation of fabricated packets.
Po (k): Probability of k-capacity buffer overflow, before generation of fabricated packets.
Pb (r): Probability that there are r non-fabricated packets in the buffer.
and considering the backbone data network, we have,
mn = mo (1 + λ )
Dn = Do (1 + λ )
Pn (k) = Po (k) + Σ 0 ≤ r ≤ k [1- ∑ 0≤ v ≤ k-r e-λ λv/v! ] Pb (r)
When the satellite/tactical communication link in Section II.1 is considered, the effect of packet fabrication on the above performance metrics is highly nonlinear and complex. We are in the process of simulating the overall systems towards the quantification of these effects.
• Packet modification. The modified packets increase the error probabilities induced by the deployed error correcting codes in the network. The affected network performance metric is error detection and error correction performance.
In view of the packet modification model in Section 5, let us define,
p : Probability of a bit not being modified by the aggregate effect of attack and
communication channel errors.
Pd: Probability of correct decoding by the network decoders
Pe: Probability of incorrect decoding by the network decoders.
Let us assume a (2d+1)- distance code ( any two codewords are in 2d+1 Hamming distance from each other). Let us assume Minimum distance decoding, as employed by all decoding schemes. Let all codewords be equally probable. Then, the probability of correct decoding and the probability of incorrect decoding are:
Pd = ∑0 ≤ j ≤ d ( jm ) (1-p)j pm-j
Pe = 1- Pd = 1 - ∑0 ≤ j ≤ d ( jm ) (1-p)j pm-j = ∑0 ≤ j ≤ d ( j
m ) (1-q)j qm-j
where m = 2d+1 and q = 1-p
The communication channels in the backbone network normally induce probability of correct transmission per bit that is quite higher than 0.5, denoted r. If the attacker changes this probabili-ty to value less than 0.5, say to 1-r, then the probability of correct decoding, as induced by the deployed minimum distance decoding scheme, becomes equal to the probability of error induced by the same scheme before the attacker acted. We note that if the attacker changes each bit in-dependently with probability 0.5, then the resulting probability of correct per bit transmission will be 0.5, regardless of the value of the probability of the per bit correct transmission induced by the transmission channel. This same result remains correct when the satellite/tactical com-munication link in Section A.3 is considered, instead.
134
• Time behavior. The added random delay per packet may cause violations of admission and intra-packet (jittering) delay constraints, resulting in increased data message rejection rates. The affected network performance metrics are transmission delays and message/data rejec-tion rates.
We may simplify the analysis by not distinguishing between message admission delay constraint and jittering and by thus assuming that any packet is rejected due to adversary time behavior if an additional delay of at least k time units is imposed on it by the attacker. In view of the delay model in Section 5, when focusing on the backbone data network, the probability Pr
k of rejection per packet due to adversary time behavior is given by the expression,
Prk
= 1 - (1- α )∑0 ≤ n ≤ k-1 αn = αk
The average additional delay due to adversary time behavior, Dk , of each packet that is not then rejected is given by the following expression:
Dk = (1-αk )-1 ∑1 ≤ n ≤ k-1 n (1-α )αn = [(1-α)(1-αk )]-1 [α – αk – (k-1)(1-α)αk ]
We used the scenario described below, for testing the models of data forwarding exploits that are described above.
• We considered one router forwarding data to a second router.
• We assumed that traffic is compromised at the first router, and wish to observe the effects on the traffic received by the second router.
• We represented the legitimate traffic at the first router, by generating a Poisson stream of messages whose length in packets is geometrically distributed.
• To simulate the buffer length at the first router, we generated frames of fixed length-in packet units- and adopted a round robin transmission policy, where the head packet of each message is stored, where one packet per message is transmitted per frame and where the maximum number of messages maintained at each point in time equals the frame length.
• We also assumed a admission delay constraint, where a message is dropped if its first packet is not transmitted within a fixed predetermined time limit.
• In the absence of exploits, a legitimate message is successfully received by the second router iff its head packet is transmitted within the delay constraint limit. Its delay is then the delay for the transmission of its first packet plus its length.
• In the absence of exploits, a message is rejected iff its head packet is not transmitted within the admission delay constraint limit. Average delays and rejection rates were computed in the absence of exploits.
• To study the effect of packet fabrication exploits, a Poisson traffic of fabricated packets was generated. This fabricated traffic expanded each message packet by a random num-ber of packets and caused rejection of legitimate messages due to two events: violation of the admission delay constraint as well as message interruptions due to fabricated pack-ets interfering with the continuity of the message transmission process.
135
• To study the effect of packet modification exploits, each legitimate packet was consi-dered correctly received by the second router with probability 0.5. If a packet is not cor-rectly received, the message that it belongs to was considered rejected.
• To study the effect of time behavior exploits, each legitimate packet was delayed by a random amount. If this amount exceeded a given fixed limit, the packet was rejected. A rejected packet caused rejection of the message it belonged to.
• The performance metrics computed were message rejected rates and message average de-lays for the successfully transmitted messages. These two metrics were computed in both the presence and the absence of exploits and the results were compared, to show the quantitative effects of exploits.
As an example of our obtained results, we include Fig. A.2, where message rejection rates are plotted against input message rates, for different buffer sizes and fixed admission delay con-straint equal to 106 slot lengths. From the figure, we observe rejection rate saturation at input rate 0.9, at all buffer sizes, due to the admission delay constraint taking over then. For input rates below 0.5, we note that rejection rates are sensitive to input rates, as the buffer size increas-es. Then, packet fabrication may have a dramatic effect on traffic rejection: If the actual mes-sage rate is 0.2 and the buffer size is 100, for example, then, if 0.2 rate fabricated traffic is added, the message rejection rate increases by 10%.
A.7. MODELING THE ENVIRONMENT OF TWO INTERACTIVE BACKBONE NETWORKS
We consider distributed C2 architectures, where fixed aggregate human/facilities resources are distributed into local “islands”, as dictated by the needs of the environment and the aggregate mission objective. Each local island contains human resources and facilities, and the islands are connected via a “backbone network” of “head- nodes”; the head nodes are comprised of island commanders and their support system (personnel and facilities).
We consider the case where the environment or/and the aggregate mission objective may change dynamically. Such scenario necessitates dynamic resource reallocation capabilities across the different islands in the architecture, as well as possible restructure of the architecture itself. The main issue here is:
What policies should be devised for the implementation of dynamic resource reallocation and possible architectural adaptation.
We consider each single network architecture as that shown in Fig. A.3, consisting of hu-man/facilities elements, termed man-sensors, man-sensor clusters, termed islands, a backbone network of cluster-heads, termed head- nodes and a global command represented by a fusion-center. The man-sensors, the head-nodes and the fusion-center will be respectively termed Man-Sensor Nodes (MSNs), Aggregation and Forwarding Nodes (AFNs) and Base Station (BS). Given a pre-determined aggregate mission objective, the MSNs, AFNs and BS perform the fol-lowing functions: (a) The MSNs are grouped into distinct islands, where each island contains a single AFN. Each MSN collects and preprocesses local data and transmits them to its local AFN, via some access protocol. Some of the MSNs may be low-cost and low-energy; thus, short-life devices. Other MSNs may be humans whose concentration-span or duration in the isl-
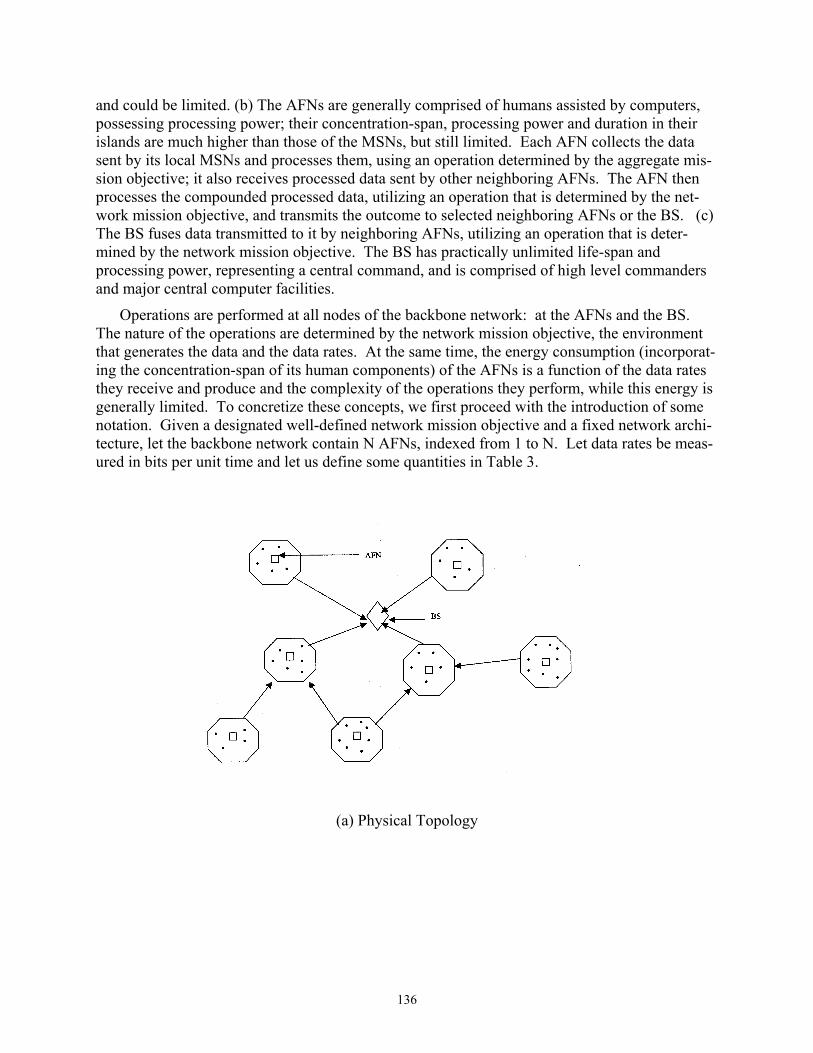
136
and could be limited. (b) The AFNs are generally comprised of humans assisted by computers, possessing processing power; their concentration-span, processing power and duration in their islands are much higher than those of the MSNs, but still limited. Each AFN collects the data sent by its local MSNs and processes them, using an operation determined by the aggregate mis-sion objective; it also receives processed data sent by other neighboring AFNs. The AFN then processes the compounded processed data, utilizing an operation that is determined by the net-work mission objective, and transmits the outcome to selected neighboring AFNs or the BS. (c) The BS fuses data transmitted to it by neighboring AFNs, utilizing an operation that is deter-mined by the network mission objective. The BS has practically unlimited life-span and processing power, representing a central command, and is comprised of high level commanders and major central computer facilities.
Operations are performed at all nodes of the backbone network: at the AFNs and the BS. The nature of the operations are determined by the network mission objective, the environment that generates the data and the data rates. At the same time, the energy consumption (incorporat-ing the concentration-span of its human components) of the AFNs is a function of the data rates they receive and produce and the complexity of the operations they perform, while this energy is generally limited. To concretize these concepts, we first proceed with the introduction of some notation. Given a designated well-defined network mission objective and a fixed network archi-tecture, let the backbone network contain N AFNs, indexed from 1 to N. Let data rates be meas-ured in bits per unit time and let us define some quantities in Table 3.
(a) Physical Topology
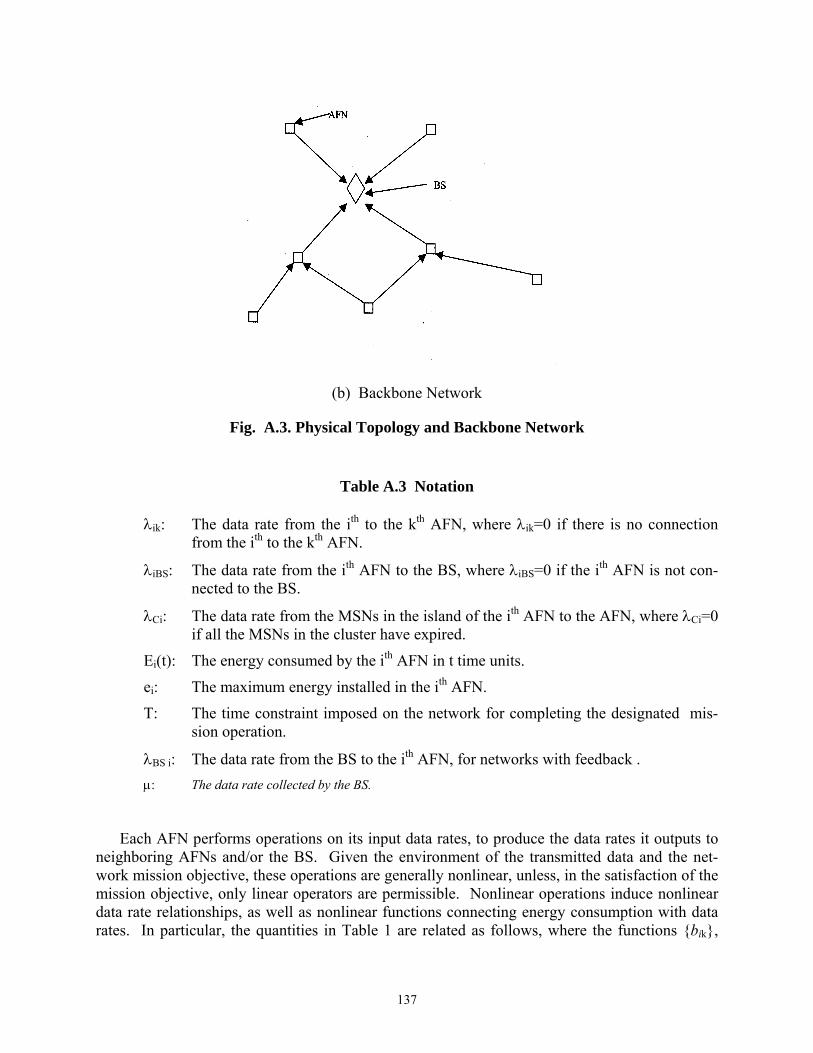
137
(b) Backbone Network
Fig. A.3. Physical Topology and Backbone Network
Table A.3 Notation
ik: The data rate from the ith to the kth AFN, where ik=0 if there is no connection from the ith to the kth AFN.
iBS: The data rate from the ith AFN to the BS, where iBS=0 if the ith AFN is not con-nected to the BS.
Ci: The data rate from the MSNs in the island of the ith AFN to the AFN, where Ci=0 if all the MSNs in the cluster have expired.
Ei(t): The energy consumed by the ith AFN in t time units.
ei: The maximum energy installed in the ith AFN.
T: The time constraint imposed on the network for completing the designated mis-sion operation.
BS i: The data rate from the BS to the ith AFN, for networks with feedback .
: The data rate collected by the BS.
Each AFN performs operations on its input data rates, to produce the data rates it outputs to neighboring AFNs and/or the BS. Given the environment of the transmitted data and the net-work mission objective, these operations are generally nonlinear, unless, in the satisfaction of the mission objective, only linear operators are permissible. Nonlinear operations induce nonlinear data rate relationships, as well as nonlinear functions connecting energy consumption with data rates. In particular, the quantities in Table 1 are related as follows, where the functions {bik},
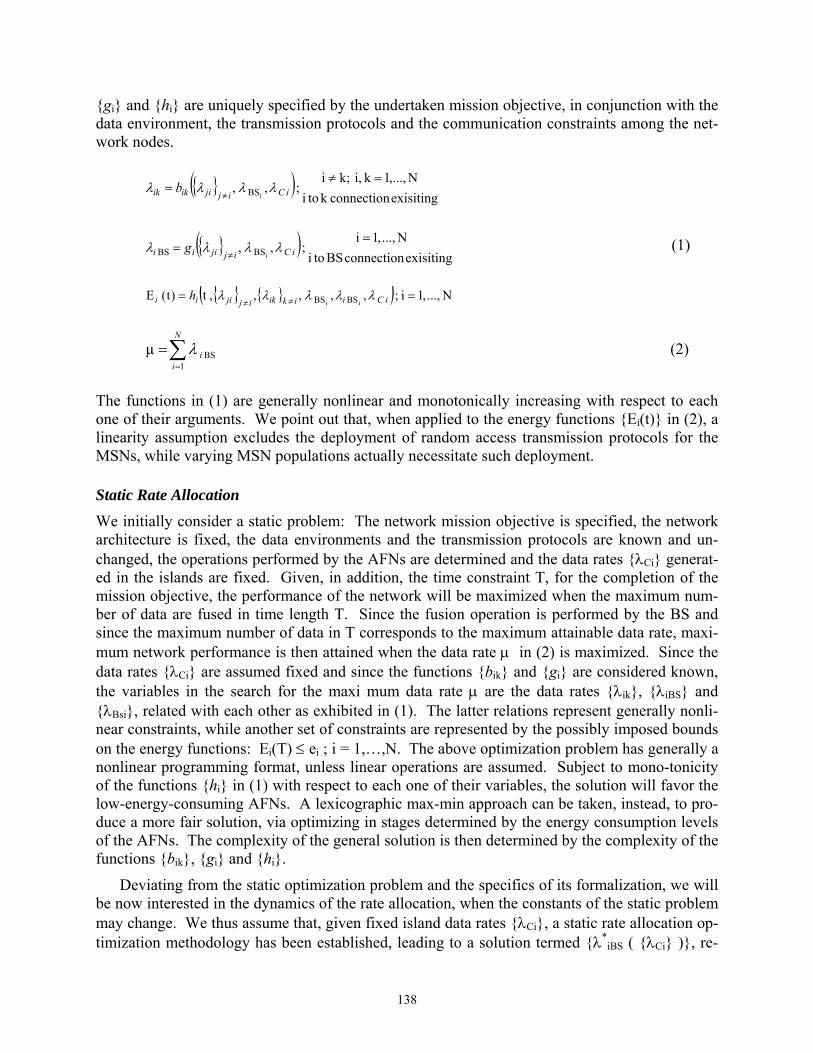
138
{gi} and {hi} are uniquely specified by the undertaken mission objective, in conjunction with the data environment, the transmission protocols and the communication constraints among the net-work nodes.
exisiting connectionk toi
N,...,1k i, ;ki;,,
iBS
iCijjiikik b
exisiting connection BStoi
N...,,1i ;,,
iBSBS
iCijjiii g (1)
N...,,1i;,,,,,t )t(E
ii BSBS iCiikikijjiii h
N
ii
1BS μ (2)
The functions in (1) are generally nonlinear and monotonically increasing with respect to each one of their arguments. We point out that, when applied to the energy functions {Ei(t)} in (2), a linearity assumption excludes the deployment of random access transmission protocols for the MSNs, while varying MSN populations actually necessitate such deployment. Static Rate Allocation
We initially consider a static problem: The network mission objective is specified, the network architecture is fixed, the data environments and the transmission protocols are known and un-changed, the operations performed by the AFNs are determined and the data rates {Ci} generat-ed in the islands are fixed. Given, in addition, the time constraint T, for the completion of the mission objective, the performance of the network will be maximized when the maximum num-ber of data are fused in time length T. Since the fusion operation is performed by the BS and since the maximum number of data in T corresponds to the maximum attainable data rate, maxi-mum network performance is then attained when the data rate in (2) is maximized. Since the data rates {Ci} are assumed fixed and since the functions {bik} and {gi} are considered known, the variables in the search for the maxi mum data rate are the data rates {ik}, {iBS} and {Bsi}, related with each other as exhibited in (1). The latter relations represent generally nonli-near constraints, while another set of constraints are represented by the possibly imposed bounds on the energy functions: Ei(T) ei ; i = 1,…,N. The above optimization problem has generally a nonlinear programming format, unless linear operations are assumed. Subject to mono-tonicity of the functions {hi} in (1) with respect to each one of their variables, the solution will favor the low-energy-consuming AFNs. A lexicographic max-min approach can be taken, instead, to pro-duce a more fair solution, via optimizing in stages determined by the energy consumption levels of the AFNs. The complexity of the general solution is then determined by the complexity of the functions {bik}, {gi} and {hi}.
Deviating from the static optimization problem and the specifics of its formalization, we will be now interested in the dynamics of the rate allocation, when the constants of the static problem may change. We thus assume that, given fixed island data rates {Ci}, a static rate allocation op-timization methodology has been established, leading to a solution termed {*
iBS ( {Ci} )}, re-
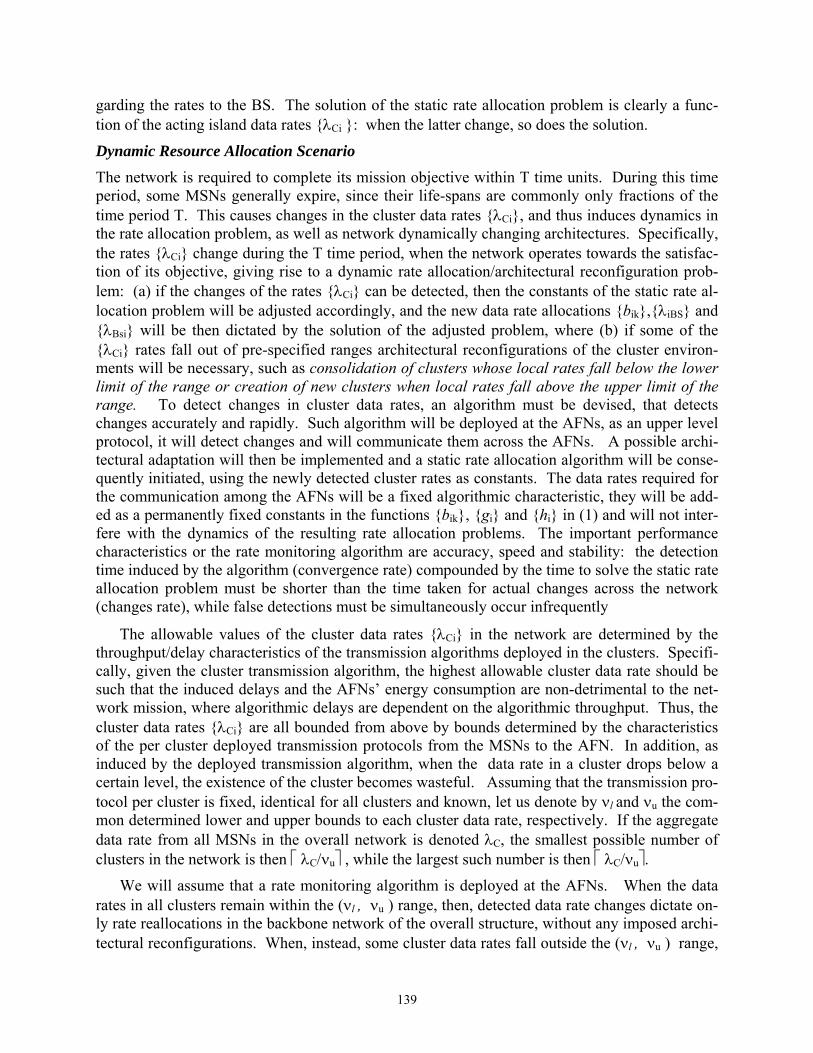
139
garding the rates to the BS. The solution of the static rate allocation problem is clearly a func-tion of the acting island data rates {Ci }: when the latter change, so does the solution.
Dynamic Resource Allocation Scenario
The network is required to complete its mission objective within T time units. During this time period, some MSNs generally expire, since their life-spans are commonly only fractions of the time period T. This causes changes in the cluster data rates {Ci}, and thus induces dynamics in the rate allocation problem, as well as network dynamically changing architectures. Specifically, the rates {Ci} change during the T time period, when the network operates towards the satisfac-tion of its objective, giving rise to a dynamic rate allocation/architectural reconfiguration prob-lem: (a) if the changes of the rates {Ci} can be detected, then the constants of the static rate al-location problem will be adjusted accordingly, and the new data rate allocations {bik},{iBS} and {Bsi} will be then dictated by the solution of the adjusted problem, where (b) if some of the {Ci} rates fall out of pre-specified ranges architectural reconfigurations of the cluster environ-ments will be necessary, such as consolidation of clusters whose local rates fall below the lower limit of the range or creation of new clusters when local rates fall above the upper limit of the range. To detect changes in cluster data rates, an algorithm must be devised, that detects changes accurately and rapidly. Such algorithm will be deployed at the AFNs, as an upper level protocol, it will detect changes and will communicate them across the AFNs. A possible archi-tectural adaptation will then be implemented and a static rate allocation algorithm will be conse-quently initiated, using the newly detected cluster rates as constants. The data rates required for the communication among the AFNs will be a fixed algorithmic characteristic, they will be add-ed as a permanently fixed constants in the functions {bik}, {gi} and {hi} in (1) and will not inter-fere with the dynamics of the resulting rate allocation problems. The important performance characteristics or the rate monitoring algorithm are accuracy, speed and stability: the detection time induced by the algorithm (convergence rate) compounded by the time to solve the static rate allocation problem must be shorter than the time taken for actual changes across the network (changes rate), while false detections must be simultaneously occur infrequently
The allowable values of the cluster data rates {Ci} in the network are determined by the throughput/delay characteristics of the transmission algorithms deployed in the clusters. Specifi-cally, given the cluster transmission algorithm, the highest allowable cluster data rate should be such that the induced delays and the AFNs’ energy consumption are non-detrimental to the net-work mission, where algorithmic delays are dependent on the algorithmic throughput. Thus, the cluster data rates {Ci} are all bounded from above by bounds determined by the characteristics of the per cluster deployed transmission protocols from the MSNs to the AFN. In addition, as induced by the deployed transmission algorithm, when the data rate in a cluster drops below a certain level, the existence of the cluster becomes wasteful. Assuming that the transmission pro-tocol per cluster is fixed, identical for all clusters and known, let us denote by l and u the com-mon determined lower and upper bounds to each cluster data rate, respectively. If the aggregate data rate from all MSNs in the overall network is denoted C, the smallest possible number of clusters in the network is then C/u , while the largest such number is then C/u.
We will assume that a rate monitoring algorithm is deployed at the AFNs. When the data rates in all clusters remain within the (l , u ) range, then, detected data rate changes dictate on-ly rate reallocations in the backbone network of the overall structure, without any imposed archi-tectural reconfigurations. When, instead, some cluster data rates fall outside the (l , u ) range,
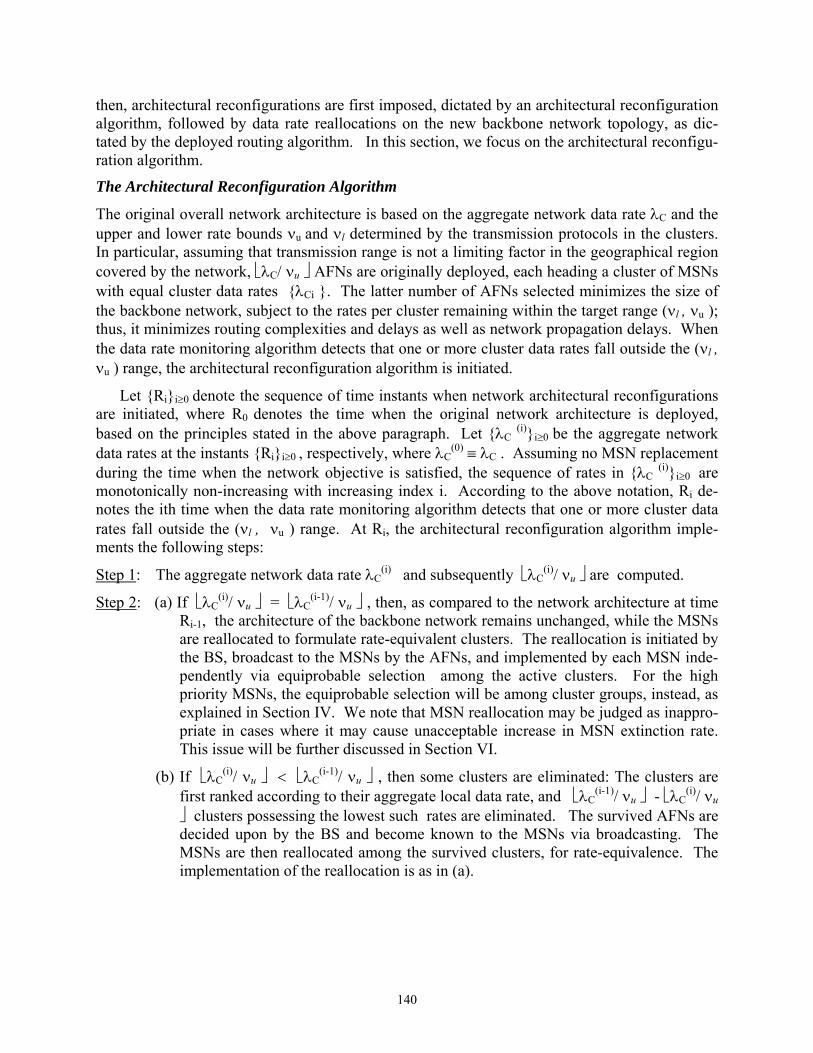
140
then, architectural reconfigurations are first imposed, dictated by an architectural reconfiguration algorithm, followed by data rate reallocations on the new backbone network topology, as dic-tated by the deployed routing algorithm. In this section, we focus on the architectural reconfigu-ration algorithm.
The Architectural Reconfiguration Algorithm
The original overall network architecture is based on the aggregate network data rate C and the upper and lower rate bounds u and l determined by the transmission protocols in the clusters. In particular, assuming that transmission range is not a limiting factor in the geographical region covered by the network, C/ u AFNs are originally deployed, each heading a cluster of MSNs with equal cluster data rates {Ci }. The latter number of AFNs selected minimizes the size of the backbone network, subject to the rates per cluster remaining within the target range (l , u ); thus, it minimizes routing complexities and delays as well as network propagation delays. When the data rate monitoring algorithm detects that one or more cluster data rates fall outside the (l , u ) range, the architectural reconfiguration algorithm is initiated.
Let {Ri}i0 denote the sequence of time instants when network architectural reconfigurations are initiated, where R0 denotes the time when the original network architecture is deployed, based on the principles stated in the above paragraph. Let {C (i)}i0 be the aggregate network data rates at the instants {Ri}i0 , respectively, where C
(0) C . Assuming no MSN replacement during the time when the network objective is satisfied, the sequence of rates in {C (i)}i0 are monotonically non-increasing with increasing index i. According to the above notation, Ri de-notes the ith time when the data rate monitoring algorithm detects that one or more cluster data rates fall outside the (l , u ) range. At Ri, the architectural reconfiguration algorithm imple-ments the following steps:
Step 1: The aggregate network data rate C(i) and subsequently C
(i)/ u are computed.
Step 2: (a) If C(i)/ u = C
(i-1)/ u , then, as compared to the network architecture at time Ri-1, the architecture of the backbone network remains unchanged, while the MSNs are reallocated to formulate rate-equivalent clusters. The reallocation is initiated by the BS, broadcast to the MSNs by the AFNs, and implemented by each MSN inde-pendently via equiprobable selection among the active clusters. For the high priority MSNs, the equiprobable selection will be among cluster groups, instead, as explained in Section IV. We note that MSN reallocation may be judged as inappro-priate in cases where it may cause unacceptable increase in MSN extinction rate. This issue will be further discussed in Section VI.
(b) If C(i)/ u C
(i-1)/ u , then some clusters are eliminated: The clusters are first ranked according to their aggregate local data rate, and C
(i-1)/ u - C(i)/ u
clusters possessing the lowest such rates are eliminated. The survived AFNs are decided upon by the BS and become known to the MSNs via broadcasting. The MSNs are then reallocated among the survived clusters, for rate-equivalence. The implementation of the reallocation is as in (a).
141
Two Interactive Network Architectures
Considering two interactive C2 architectures, we model their connectivity via a dedicated direct bi-directional link which connects the BS nodes of their backbone network representations. The overall performance metrics of the global system are: stability, robustness, controlled latency, error control and resistance to cyber exploits.
Lexicon
Limited life span: Limited presence in the island, due to expiration or mobility.
Expired MSN: Removed from the island, possibly due to mobility.
Energy function: Function of cumulative facilities utilization.
APPENDIX
Here, we describe how to generate Poisson traffic and a geometrically distributed set of messag-es. To generate a Poisson traffic of messages, with rate λ, we generate consecutive arrivals as follows: Given an arrival at time t0, the time t1 of the next arrival is found via the process given below. Using the random number generator, find a random number γ, between 0 and 1. Then, find t1 as:
t1 = λ-1ln (1-γ)
To generate a geometrically distributed message, with constant α, using the random number generator, generate a number γ between 0 and 1. Then, find the length k of the message the in-teger part of: logα (1-γ) - 1 REFERENCES
[1] G. Almes, S. Kalidindi, and M. Zekauskas. A one-way packet loss metric for IPPM. RFC 2680, Sept. 1999.
[2] X. Ao. Report on DIMACS Workshop on Large-Scale Internet Attacks, Sept. 2003.
[3] I. Avramopoulos, H. Kobayashi, R. Wang, and A. Krishnamurthy. Amendment to: Highly secure and efficient routing, Feb. 2004. Amendment.
[4] I. Avramopoulos, H. Kobayashi, R. Wang, and A. Krishnamurthy. Highly secure and effi-cient routing. In Proceedings of INFOCOM 2004 Conference, March 2004.
[5] J. Bellardo and S. Savage. Measuring packet reordering. In ACM SIGCOMM Internet Mea-surement Workshop(IMW02).
[6] J. C. R. Bennett, C. Partridge, and N. Shectman. Packet reordering is not pathological net-work behavior. IEEE/ACM Transactions on Networking (TON), 7(6):789–798, 1999.
142
[7] J. Black, S. Halevi, H. Krawczyk, T. Krovetz, and P. Rogaway. UMAC: Fast and secure message authentication. Lec. Notes in CS, 1666:216–233, 1999.
[8] B. H. Bloom. Space/time trade-offs in hash coding with allowable errors. Comm. Of the ACM, 13(7):422–426, July ’70.
[9] K. A. Bradley, S. Cheung, N. Puketza, B. Mukherjee, and R. A. Olsson. Detecting disrup-tive routers: A distributed network monitoring approach. In Proc. of the IEEE Symposium on Security and Privacy, pages 115–124, May 1998.
[10] T. D. Chandra and S. Toueg. Unreliable failure detectors for reliable distributed systems. Journal of the ACM, 43(2):225–267, 1996.
[11] K. M. Chandy and L. Lamport. Distributed snapshots: determining global states of distri-buted systems. ACM Transactions on Computer Systems, 3(1):63–75, 1985.
[12] S. Cheung. An efficient message authentication scheme for link state routing. In ACSAC, pages 90–98, 1997.
[13] S. Cheung and K. Levitt. Protecting routing infrastructures from denial of service using cooperative intrusion detection. I New Security Paradigms Workshop, 1997.
[14] Cisco Systems. Load balancing with cisco express forwarding http//www.cisco.com/warp/public/cc/pd/ifaa/pa/much/prodlit/loadb an.pdf.
[15] Y. Cosendai, M. Dacier, and P. Scotton. Intrusion detection mechanism to detect reachabili-ty attacks in PNNI networks. In Recent Advances in Intrusion Detection, 1999.
[16] N. G. Duffield and M. Grossglauser. Trajectory sampling for direct traffic reservation in COMM’00, pages 271–282.
[17] W. Feghali, B. Burres, G.Wolrich, and D. Carrigan. Security: Adding protection to the network via the network processor. Intel Technology Journal, 06:40–49, Aug. 2002.
[18] Gauis. Things to do in Ciscoland when you’re dead, Jan. ’00.
[19] M. T. Goodrich. Efficient and secure network routing algorithms, Jan 2001. Provisional patent filing.
[20] A. Herzberg and S. Kutten. Early detection of message forwardingfaults. SIAM J. Comput., 30(4):1169–1196, 2000.
[21] K. J. Houle, G. M. Weaver, N. Long, and R. Thomas. Trends indenial of service attack technology. Technical report,CERT Coordination Center, Oct. 2001.
[22] Y.-C. Hu, A. Perrig, and D. B. Johnson. Ariadne: A secureon-demand routing protocol for ad hoc networks. In The 8thACM Int. Conf. on MobiCom, Sep 2002.
[23] J. R. Hughes, T. Aura, and M. Bishop. Using conservation offlow as a security mechanism in network protocols. In IEEESymp. on Security and Privacy, pages 132–131, 2000.
[24] Y. Jou, F. Gong, C. Sargor, X. Wu, S. Wu, H. Chang, and F. Wang. Design and implemen-tation of a scalable intrusion detection system for the protection of network infrastructure. In DISCEX’00 Proceedings, volume 2, pages 69–83, 2000.
[25] Juniper Networks. JUNOS 6.4 Routing Protocols Configuration Guide. http://www.juniper.net/techpubs/software/junos/junos64/swconfig64-routing/html/.
[26] S. Kent, C. Lynn, J. Mikkelson, and K. Seo. Secure Border Gateway Protocol (Secure-BGP). IEEE Journal on Selected Areas in Communications, 18(4):582–592, Apr. 2000.
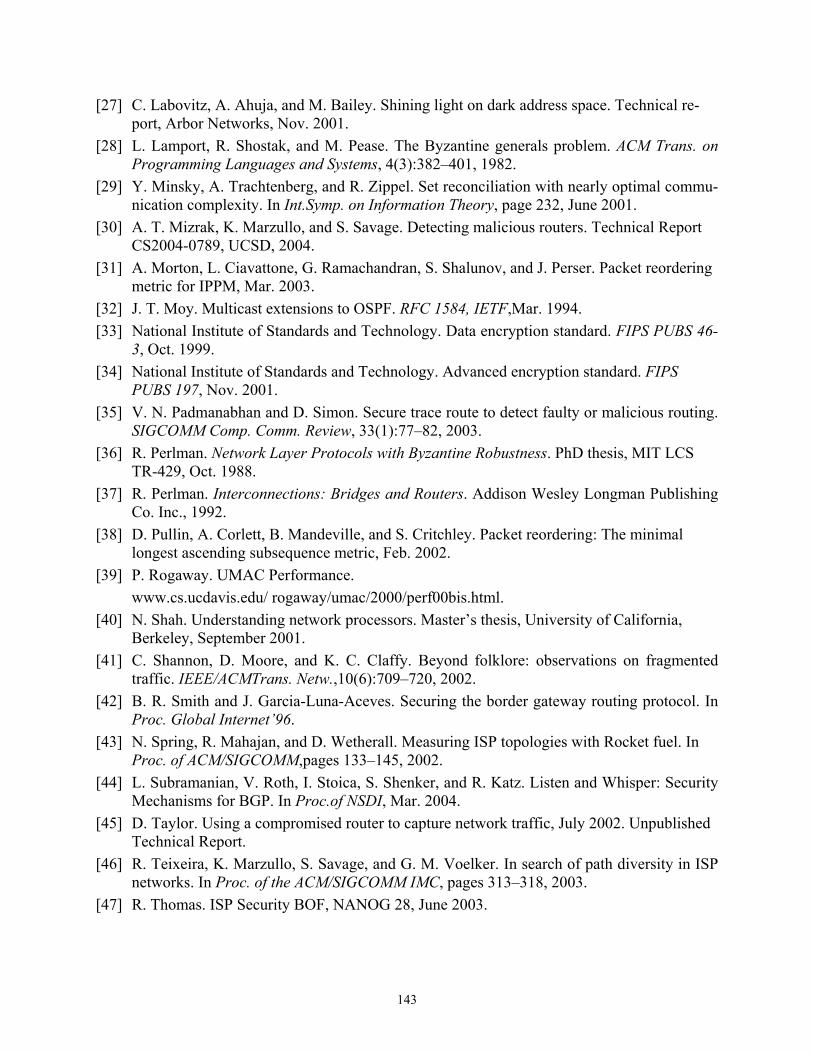
143
[27] C. Labovitz, A. Ahuja, and M. Bailey. Shining light on dark address space. Technical re-port, Arbor Networks, Nov. 2001.
[28] L. Lamport, R. Shostak, and M. Pease. The Byzantine generals problem. ACM Trans. on Programming Languages and Systems, 4(3):382–401, 1982.
[29] Y. Minsky, A. Trachtenberg, and R. Zippel. Set reconciliation with nearly optimal commu-nication complexity. In Int.Symp. on Information Theory, page 232, June 2001.
[30] A. T. Mizrak, K. Marzullo, and S. Savage. Detecting malicious routers. Technical Report CS2004-0789, UCSD, 2004.
[31] A. Morton, L. Ciavattone, G. Ramachandran, S. Shalunov, and J. Perser. Packet reordering metric for IPPM, Mar. 2003.
[32] J. T. Moy. Multicast extensions to OSPF. RFC 1584, IETF,Mar. 1994.
[33] National Institute of Standards and Technology. Data encryption standard. FIPS PUBS 46-3, Oct. 1999.
[34] National Institute of Standards and Technology. Advanced encryption standard. FIPS PUBS 197, Nov. 2001.
[35] V. N. Padmanabhan and D. Simon. Secure trace route to detect faulty or malicious routing. SIGCOMM Comp. Comm. Review, 33(1):77–82, 2003.
[36] R. Perlman. Network Layer Protocols with Byzantine Robustness. PhD thesis, MIT LCS TR-429, Oct. 1988.
[37] R. Perlman. Interconnections: Bridges and Routers. Addison Wesley Longman Publishing Co. Inc., 1992.
[38] D. Pullin, A. Corlett, B. Mandeville, and S. Critchley. Packet reordering: The minimal longest ascending subsequence metric, Feb. 2002.
[39] P. Rogaway. UMAC Performance.
www.cs.ucdavis.edu/ rogaway/umac/2000/perf00bis.html.
[40] N. Shah. Understanding network processors. Master’s thesis, University of California, Berkeley, September 2001.
[41] C. Shannon, D. Moore, and K. C. Claffy. Beyond folklore: observations on fragmented traffic. IEEE/ACMTrans. Netw.,10(6):709–720, 2002.
[42] B. R. Smith and J. Garcia-Luna-Aceves. Securing the border gateway routing protocol. In Proc. Global Internet’96.
[43] N. Spring, R. Mahajan, and D. Wetherall. Measuring ISP topologies with Rocket fuel. In Proc. of ACM/SIGCOMM,pages 133–145, 2002.
[44] L. Subramanian, V. Roth, I. Stoica, S. Shenker, and R. Katz. Listen and Whisper: Security Mechanisms for BGP. In Proc.of NSDI, Mar. 2004.
[45] D. Taylor. Using a compromised router to capture network traffic, July 2002. Unpublished Technical Report.
[46] R. Teixeira, K. Marzullo, S. Savage, and G. M. Voelker. In search of path diversity in ISP networks. In Proc. of the ACM/SIGCOMM IMC, pages 313–318, 2003.
[47] R. Thomas. ISP Security BOF, NANOG 28, June 2003.

144

B - 1
SAL
Appendix BAppendix B
A Pacifica Scenario
Alexander H. Levis
Robert J. Elder
Version 1.0
11/14/2011 1System Architectures Laboratory
SALScenario Narrative: Pacifica
The island of Pacifica contains three sovereign countries:
The Confederation of Washorgon States that includes the states of Washington and Oregon
The Rep blic of Ne idah that contains fo r states Ne ada Idaho Utah and The Republic of Nevidah that contains four states: Nevada, Idaho, Utah, and Arizona
The Peoples Republic of Califon that has unitary system with no defined state administrative boundaries
• The topography, trafficability, climatology, and surface lines of communication of the countries of Califon, Nevidah, and Washorgon match those of the real-world geographic entities of the area. Thus the island reflects diverse terrain, soil, and weather characteristics as well as abundant natural resources. In the north and northwest, lush mountains and moderate climates are the norm. Further south, the
System Architectures Laboratory
Sierra Nevada mountain chain and arid high desert prevail. In the southeast, the mountains are less extensive, but extremely dry conditions limit most forms of agricultural and industrial development. The island’s population consists of immigrants from North America (35% of the population), South America (25%), Asia (20%), and Europe (15%). Five percent are native Pacific Islanders. Washorgon and Nevidah are organized as federal systems with states that have defined regional powers and responsibilities.
11/14/2011 2

B - 2
SALPacifica Pol-Mil Overview
• Califon is a Regional Hegemon in long-standing conflict with Nevidahover minerals and other economic issues
• Nevidah is in mutual defense arrangement with Pacific nations including the USA
• Washorgon traditionally maintains neutrality with Califon and Nevidahdue to trade relationships and access to port facilities in Califon and Nevidah
• The year is 2022; the Pacifica mineral
System Architectures Laboratory
yfields are proving to be a great natural resource of rare minerals (the other major source is China)
• Califon has been conducting a campaign against Nevidah to obtain exclusive control of the mineral fields
CALIFON = REDWASHORGON = NEUTRAL
11/14/2011 3
SALStage Setter Overview
• The Hegemonic regional competitor, Califon, seeks to limit US influence on Nevidah and the ability of US to provide assurance to Nevidah by exploiting the dependence of US forces on spectrum & cyber
• Califon with technical support from China has established a Cyber Ops Center• Califon, with technical support from China, has established a Cyber Ops Center on the mountainous northwestern part of the country.
• The Califon Cyber Ops Center (CCOC) is a secure underground facility in an isolated area that is not easily accessible or targetable from the air
• The Cyber Ops Center has been conducting operations that are disrupting the economic life of Nevidah: disrupting the financial sector, disrupting the SCADA systems, conducting extensive identity theft.
• Up to this point, Califon has not attacked any of the military systems, or, to be more precise, no abnormal behaviors have been identified by Nevidah’sN t k O ti C t (NNOC)
System Architectures Laboratory
Network Operations Center (NNOC)
• The Califon Cyber warfare against Nevidah has been accelerating; Nevidah in consultation with the US is prepared to take action to persuade the Califon president to cease the cyber attacks and start serious negotiations to resolve the dispute about mineral rights.
• The United Nations has imposed sanctions on Califon in response to Nevidah’sprotests
11/14/20114
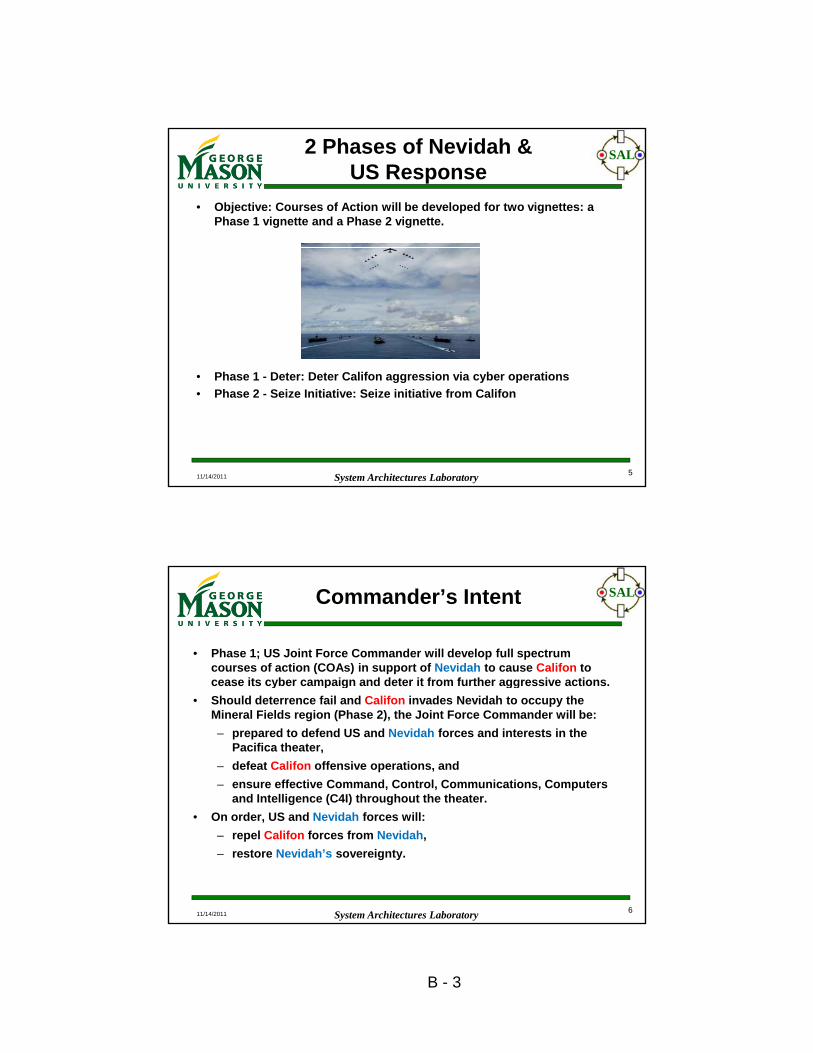
B - 3
SAL2 Phases of Nevidah & US Response
• Objective: Courses of Action will be developed for two vignettes: a Phase 1 vignette and a Phase 2 vignette.
System Architectures Laboratory
• Phase 1 - Deter: Deter Califon aggression via cyber operations
• Phase 2 - Seize Initiative: Seize initiative from Califon
11/14/2011 5
SALCommander’s Intent
• Phase 1; US Joint Force Commander will develop full spectrum courses of action (COAs) in support of Nevidah to cause Califon to cease its cyber campaign and deter it from further aggressive actions.cease its cyber campaign and deter it from further aggressive actions.
• Should deterrence fail and Califon invades Nevidah to occupy the Mineral Fields region (Phase 2), the Joint Force Commander will be:
– prepared to defend US and Nevidah forces and interests in the Pacifica theater,
– defeat Califon offensive operations, and
– ensure effective Command, Control, Communications, Computers and Intelligence (C4I) throughout the theater.
System Architectures Laboratory
g ( ) g
• On order, US and Nevidah forces will:
– repel Califon forces from Nevidah,
– restore Nevidah’s sovereignty.
11/14/2011 6
B - 4
SALConstraints/Restraints
• Operations will minimize risk to non-combatants
• Operations must minimize risk to US forcesp
• Actions must comply with international law
• No actions can infringe upon Washorgon’s neutral status
System Architectures Laboratory11/14/2011 7
SALPhase I: Deter Aggression
• Califon contests Nevidah mineral rights with cyber warfare
• Nevidah requests US assistance
US deploys Air Force aircraft to• US deploys Air Force aircraft to Nevidah airfields and a carrier strike force in order to conduct a combined exercise “Rising Storm”
System Architectures Laboratory11/14/2011 8
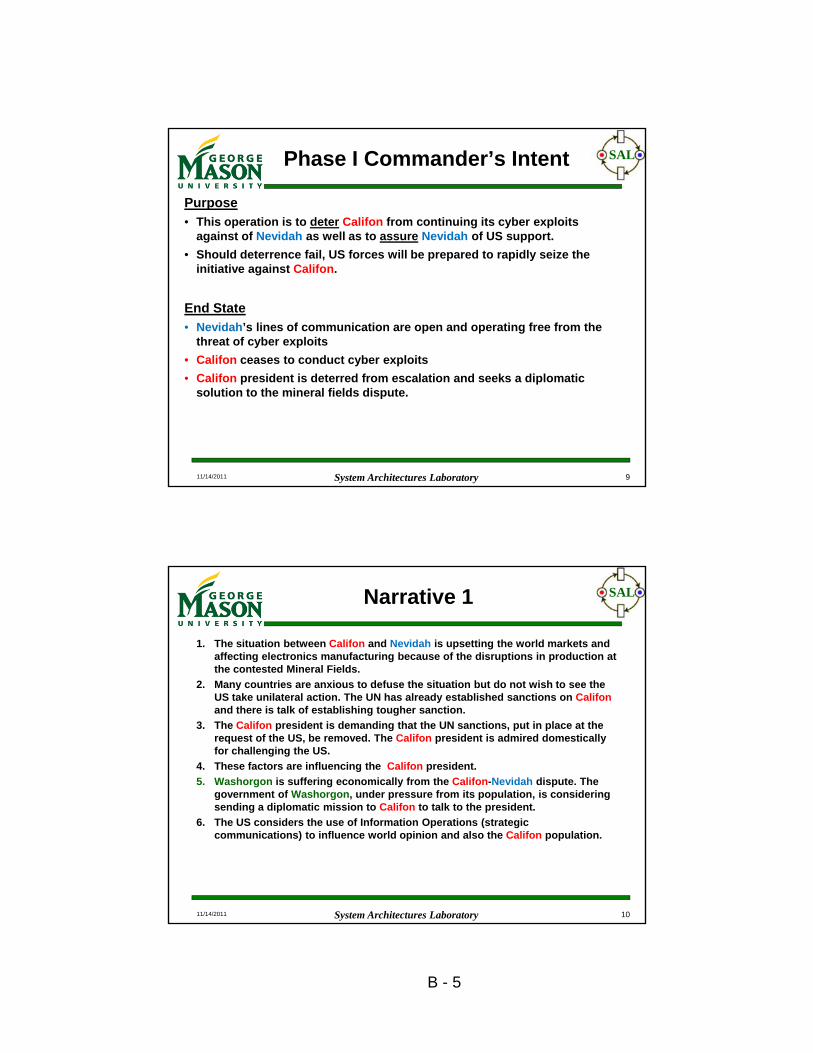
B - 5
SALPhase I Commander’s Intent
Purpose
• This operation is to deter Califon from continuing its cyber exploits against of Nevidah as well as to assure Nevidah of US support.
• Should deterrence fail, US forces will be prepared to rapidly seize the initiative against Califon.
End State
• Nevidah’s lines of communication are open and operating free from the threat of cyber exploits
• Califon ceases to conduct cyber exploits
System Architectures Laboratory
• Califon president is deterred from escalation and seeks a diplomatic solution to the mineral fields dispute.
11/14/2011 9
SALNarrative 1
1. The situation between Califon and Nevidah is upsetting the world markets and affecting electronics manufacturing because of the disruptions in production at the contested Mineral Fields.
2 Many countries are anxious to defuse the situation but do not wish to see the2. Many countries are anxious to defuse the situation but do not wish to see the US take unilateral action. The UN has already established sanctions on Califonand there is talk of establishing tougher sanction.
3. The Califon president is demanding that the UN sanctions, put in place at the request of the US, be removed. The Califon president is admired domestically for challenging the US.
4. These factors are influencing the Califon president.
5. Washorgon is suffering economically from the Califon-Nevidah dispute. The government of Washorgon, under pressure from its population, is considering
di di l ti i i t C lif t t lk t th id t
System Architectures Laboratory
sending a diplomatic mission to Califon to talk to the president.
6. The US considers the use of Information Operations (strategic communications) to influence world opinion and also the Califon population.
11/14/2011 10
B - 6
SALNarrative 2
7. The US and Nevidah plan to conduct a combined military exercise called “Rising Storm.” This involved bringing a US Navy carrier strike group in the territorial waters of Nevidah and also the stationing of US Air Force units on Nevidah military airfields, especially in the one near the Mineral Field.Nevidah military airfields, especially in the one near the Mineral Field.
8. In addition to manned aircraft, the US brings several UAVs, some for ISR but some are weaponized.
9. Nevidah considers a Special Forces mission to attack and disable the CalifonCyber Operations Center.
10. Nevidah asks the US to provide cyber support to the operation – first by providing intelligence and then helping to extract the Special Forces from the target area.
11. The US may use UAVs to conduct surveillance but also to support the Nevidah
System Architectures Laboratory
y ppoperation.
12. The US is capable of apply cyber exploits against the military assets of Califon, particularly the sensor assets of Califon and the communication links that enable Command and Control
11/14/2011 11
SALScenario: Califon
• Califon characteristics
– Califon president is the key decision maker
• CP admired domestically for willingness to challenge USA ally y g g y
• CP concerned over loss of prestige
• CP wants UN sanctions lifted
– Califon Air Defense with IADS
• There is one Air Defense Operations Center (ADOC)
• Divided into two sectors:
– Eastern Sector with the Eastern Sector Operations Center (SOC)
– Western Sector with Western SOC
System Architectures Laboratory
• There is one GCI (Ground Control Intercept) Station
• There are Visual Observation Points (VOPs)
– Califon Cyber Ops Center is the source of the cyber attacks
11/14/2011 12
B - 7
SALScenario: Washorgon
• Washorgon is neutral and has trade relations with both Califon and Nevidah
• Washorgon is concerned that hostilities between its neighbors are disrupting tradedisrupting trade
• Washorgon decides independently to send a diplomatic flight to Califon in an effort to diffuse the crisis
• Nevidah and the US are aware of the Washorgon plan
System Architectures Laboratory11/14/2011 13
SALSCENARIO: SOF mission (1)
• Nevidah plans to conduct a SOF raid to Califon’s Cyber Ops Center
• There are two operations:
– Insert in a covert manner the Special Forces team near the Cyber Ops Center and have the team incapacitate the Center by destroying itsCenter and have the team incapacitate the Center by destroying its power sources and its communications lines (land lines and satellite links)
– Extract the SOF team once the mission is accomplished
• Nevidah asks the US for support in conducting the SOF raid
• Possible cyber exploits against the Califon COC
– Attack internal network of the Cyber Ops Center
– Sniffer Attacks on nodes of the system
System Architectures Laboratory
Sniffer Attacks on nodes of the system
– Modify Route Attacks (misdirect exploits by Center)
– Out of Order packets to corrupt/disable exploits
11/14/2011 14
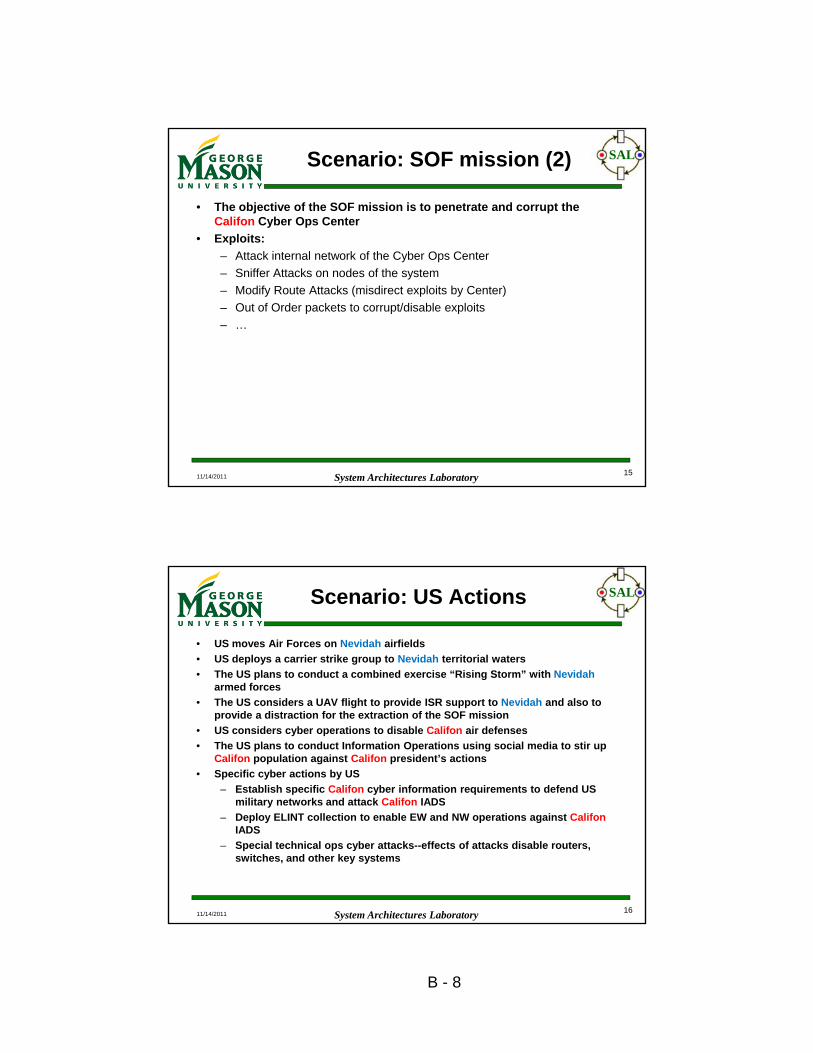
B - 8
SALScenario: SOF mission (2)
• The objective of the SOF mission is to penetrate and corrupt the Califon Cyber Ops Center
• Exploits:
– Attack internal network of the Cyber Ops Center
– Sniffer Attacks on nodes of the system
– Modify Route Attacks (misdirect exploits by Center)
– Out of Order packets to corrupt/disable exploits
– …
System Architectures Laboratory11/14/2011 15
SALScenario: US Actions
• US moves Air Forces on Nevidah airfields
• US deploys a carrier strike group to Nevidah territorial waters
• The US plans to conduct a combined exercise “Rising Storm” with Nevidaharmed forcesarmed forces
• The US considers a UAV flight to provide ISR support to Nevidah and also to provide a distraction for the extraction of the SOF mission
• US considers cyber operations to disable Califon air defenses
• The US plans to conduct Information Operations using social media to stir up Califon population against Califon president’s actions
• Specific cyber actions by US
– Establish specific Califon cyber information requirements to defend US military networks and attack Califon IADS
System Architectures Laboratory
military networks and attack Califon IADS
– Deploy ELINT collection to enable EW and NW operations against CalifonIADS
– Special technical ops cyber attacks--effects of attacks disable routers, switches, and other key systems
11/14/2011 16
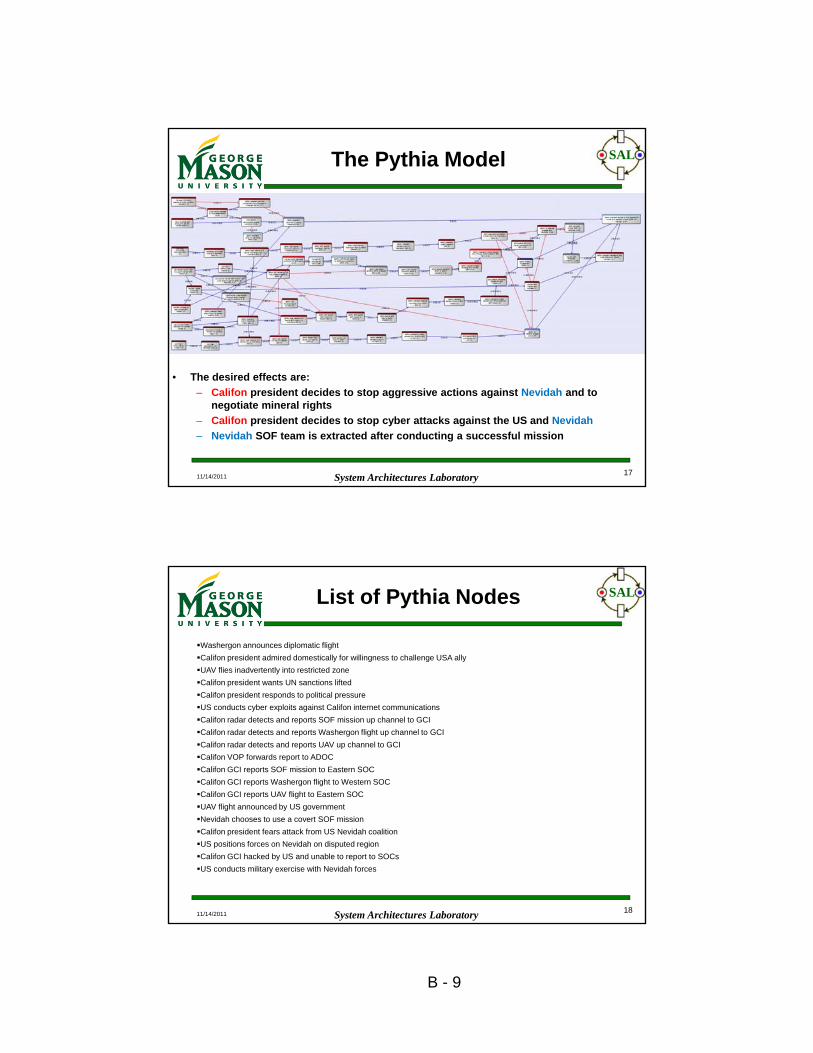
B - 9
SALThe Pythia Model
System Architectures Laboratory
• The desired effects are:
– Califon president decides to stop aggressive actions against Nevidah and to negotiate mineral rights
– Califon president decides to stop cyber attacks against the US and Nevidah
– Nevidah SOF team is extracted after conducting a successful mission
11/14/2011 17
SALList of Pythia Nodes
Washergon announces diplomatic flight
Califon president admired domestically for willingness to challenge USA ally
UAV flies inadvertently into restricted zone
Califon president wants UN sanctions liftedCalifon president wants UN sanctions lifted
Califon president responds to political pressure
US conducts cyber exploits against Califon internet communications
Califon radar detects and reports SOF mission up channel to GCI
Califon radar detects and reports Washergon flight up channel to GCI
Califon radar detects and reports UAV up channel to GCI
Califon VOP forwards report to ADOC
Califon GCI reports SOF mission to Eastern SOC
Califon GCI reports Washergon flight to Western SOC
Califon GCI reports UAV flight to Eastern SOC
UAV fli ht d b US t
System Architectures Laboratory11/14/2011 18
UAV flight announced by US government
Nevidah chooses to use a covert SOF mission
Califon president fears attack from US Nevidah coalition
US positions forces on Nevidah on disputed region
Califon GCI hacked by US and unable to report to SOCs
US conducts military exercise with Nevidah forces
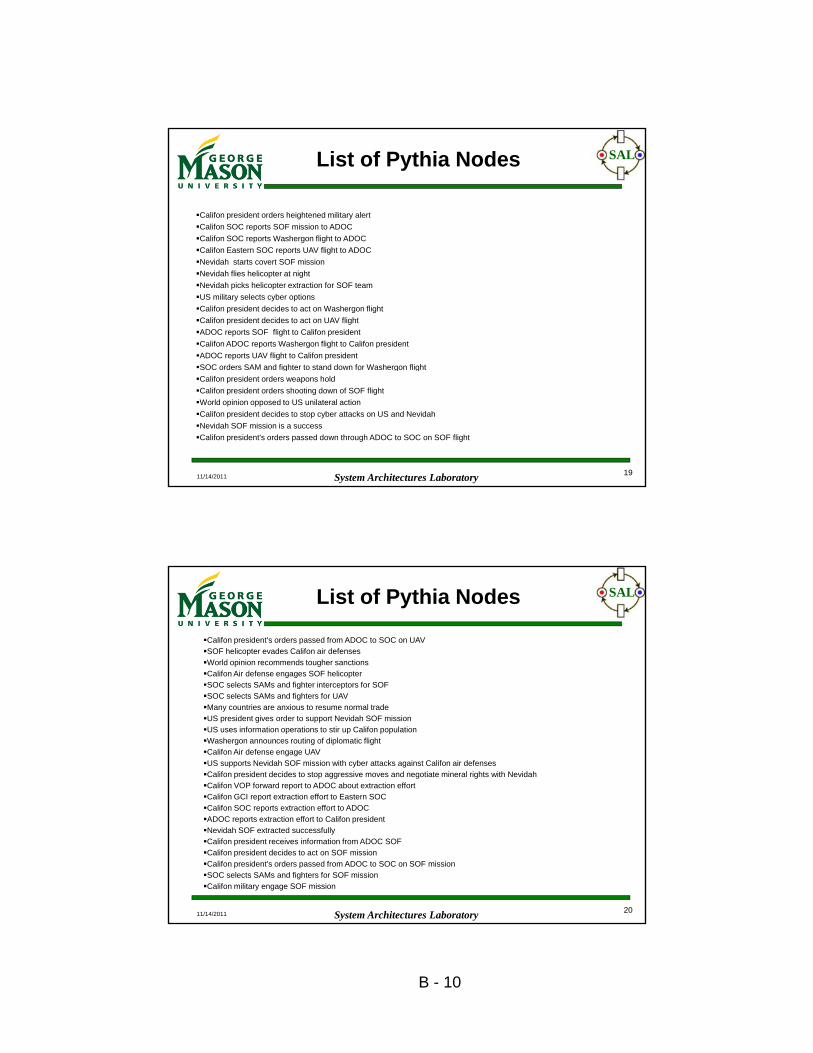
B - 10
SALList of Pythia Nodes
Califon president orders heightened military alert
Califon SOC reports SOF mission to ADOC
Califon SOC reports Washergon flight to ADOC
C lif E t SOC t UAV fli ht t ADOCCalifon Eastern SOC reports UAV flight to ADOC
Nevidah starts covert SOF mission
Nevidah flies helicopter at night
Nevidah picks helicopter extraction for SOF team
US military selects cyber options
Califon president decides to act on Washergon flight
Califon president decides to act on UAV flight
ADOC reports SOF flight to Califon president
Califon ADOC reports Washergon flight to Califon president
ADOC reports UAV flight to Califon president
SOC orders SAM and fighter to stand down for Washergon flight
System Architectures Laboratory11/14/2011 19
SOC orders SAM and fighter to stand down for Washergon flight
Califon president orders weapons hold
Califon president orders shooting down of SOF flight
World opinion opposed to US unilateral action
Califon president decides to stop cyber attacks on US and Nevidah
Nevidah SOF mission is a success
Califon president's orders passed down through ADOC to SOC on SOF flight
SALList of Pythia Nodes
Califon president's orders passed from ADOC to SOC on UAV
SOF helicopter evades Califon air defenses
World opinion recommends tougher sanctions
Califon Air defense engages SOF helicopter
SOC selects SAMs and fighter interceptors for SOFSOC selects SAMs and fighter interceptors for SOF
SOC selects SAMs and fighters for UAV
Many countries are anxious to resume normal trade
US president gives order to support Nevidah SOF mission
US uses information operations to stir up Califon population
Washergon announces routing of diplomatic flight
Califon Air defense engage UAV
US supports Nevidah SOF mission with cyber attacks against Califon air defenses
Califon president decides to stop aggressive moves and negotiate mineral rights with Nevidah
Califon VOP forward report to ADOC about extraction effort
Califon GCI report extraction effort to Eastern SOC
System Architectures Laboratory
Califon SOC reports extraction effort to ADOC
ADOC reports extraction effort to Califon president
Nevidah SOF extracted successfully
Califon president receives information from ADOC SOF
Califon president decides to act on SOF mission
Califon president's orders passed from ADOC to SOC on SOF mission
SOC selects SAMs and fighters for SOF mission
Califon military engage SOF mission
11/14/2011 20
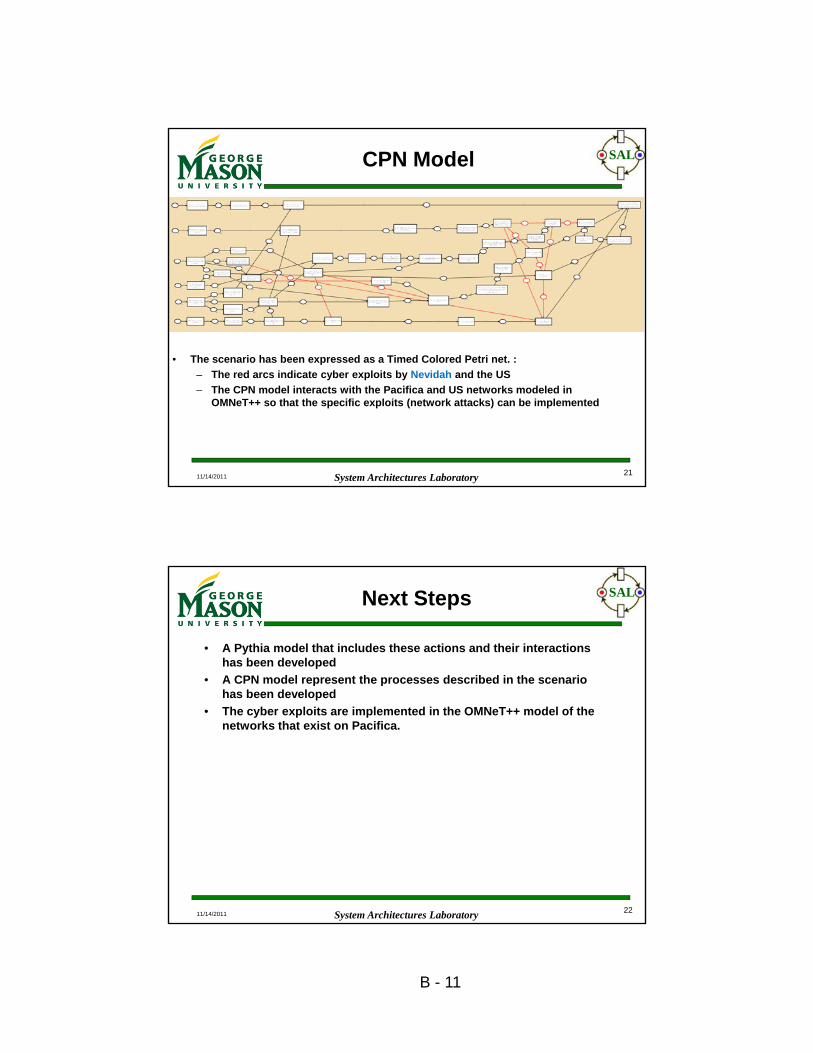
B - 11
SALCPN Model
• The scenario has been expressed as a Timed Colored Petri net. :
System Architectures Laboratory11/14/2011 21
– The red arcs indicate cyber exploits by Nevidah and the US
– The CPN model interacts with the Pacifica and US networks modeled in OMNeT++ so that the specific exploits (network attacks) can be implemented
SALNext Steps
• A Pythia model that includes these actions and their interactions has been developed
• A CPN model represent the processes described in the scenario p phas been developed
• The cyber exploits are implemented in the OMNeT++ model of the networks that exist on Pacifica.
System Architectures Laboratory11/14/2011 22