Embed Size (px)
Citation preview

Form ApprovedREPORT DOCUMENTATION PAGE J OMB No. 074-0188
Public reporting burden for this collection of information is estimated to average 1 hour per response, including the time for reviewing instructions, searching existing data sources, gathering andmaintaining the data needed, and completing and reviewing this collection of information. Send corilments regarding this burden estimate or any other aspect of this collection of information, includingsuggestions for reducing this burden to Washington Headquarters Services, Directorate for Information Operations and Reports, 1215 Jefferson Davis Highway, Suite 1204, Arlington, VA 22202-4302,and to the Office of Managtement and Budget, Paperwork Reduction Proiect (0704-0188), Washington, DC 20503
1. AGENCY USE ONLY (Leave blank) 2. REPORT 3. REPORT TYPE AND DATES COVEREDI DATE October 96 Technical Report
4. TITLE AND SUBTITLE 5. FUNDING NUMBERS
Photocatalytic Oxidation and Reduction Chemistry and a New Process for Treatment of Pink task # S161.3610Water and Related Contaminated Water.
6. AUTHOR(S)
D.M. Blake, E. Wolfrum, J. Boulter, M. Praire, S. Showalter, P. Rodacy, P. Leslie,& B. Strange
7. PERFORMING ORGANIZATION NAME(S) AND ADDRESS(ES) 8. PERFORMING ORGANIZATIONREPORT NUMBER
National Renewable Energy Laboratory Sandia National Laboratories1617 Cole Boulevard Albuquerque, NM DE96013073Golden, CO 80401-3393
9. SPONSORING / MONITORING AGENCY NAME(S) AND ADDRESS(ES) 10. SPONSORING / MONITORINGAGENCY REPORT NUMBER
National Renewable Energy laboratory1617 Cole Boulevard NREL/TP-430-21580Golden, CO 80401
11. SUPPLEMENTARY NOTESInformation can be found in NREL/TP-430-21580, National Renewable Energy laboratory, October 1996. This work was supportedin part by task # S161.3610.
12a. DISTRIBUTION / AVAILABILITY STATEMENT 12b. DISTRIBUTION CODENational Technical Information Service UC Catergory: 1414U.S. Department of Commerce ,1 15285 Port Royal RoadSpringfield, VA 22161
13. ABSTRACT (Maximum 200 Words)
This project was carried out at the National Renewable Energy Laboratory (NREL), Sandia National Laboratory (SNL), and by agroup at the University of Idaho (UI) working under subcontract to NREL. The initial focus was on photocatalytic oxidation andreduction chemistry that could use sunlight as the photon source. This work demonstrated the technical feasibility of thephotocatalytic processes; however, the process removed the hazardous components of pink water at such low efficiency that it wouldbe expensive to operate lamps in a treatment system. Technical success in removing trinitrotoluene (TNT) from water byphotocatalytic reduction chemistry led us to test that as a pretreatment step for a biological treatment process. The photocatalyticreduction of TNT did render the simulated pink water more amenable to mineralization by Phanerochaete chrysosporium. Thisresult led us to explore other chemistry for removal of TNT and related explosives from water.
Approved "-.' r<-. ?u:!clce•,•e;
14. SUBJECT TERMS .... 15. NUMBER OF PAGES
100Pink Water, TNT, Photocatalytic reduction, Phanerochaete chrysosporium, HMX, RDX 16. PRICE CODE N/A
17. SECURITY CLASSIFICATION 18. SECURITY 19. SECURITY CLASSIFICATION 20. LIMITATION OFOF REPORT CLASSIFICATION OF ABSTRACT ABSTRACT
unclass. OF THIS PAGE unclass. ULunclass. I _I
NSN 7540-01-280-5500 Standard Form 298 (Rev. 2-89)Prescribed by ANSI Std. Z39-18298-102
rTIO QUALITY INSPECTED 1

4-1 996October 1996 • NRELJTP-430-21580
i
Photocatalytic Oxidation andI Reduction Chemistry and a
New Process for Treatment ofI iPink Water and Related
Contaminated Wiater
IJDaniel M. BlakeEdward WolfrumJames BoulterNational Renewable Energy LaboratoryGolden, Colorado
Michael PrairieSteven ShowalterPhilip Rodacy'I Pam LeslieBertha StangeSandia National LaboratoriesAlbuquerque, New Mexico
$411 lRELNational Renewable Energy Laboratory1617 Cole BoulevardGolden, Colorado 80401-3393A national laboratory of the U.S. Department of EnergyManaged by Midwest Research Institutefor the U.S. Department of Energyunder Contract No. DE-AC36-83CH10093

* NREL/TP-430-21580 • UC Category: 1414 • DE96013073
...........• ..........
Photocatalytic Oxidation andReduction Chemistry and aNew Process for Treatment ofPink Water and R"elatedContaminated WaiIater
0 J Daniel M. BlakeEdward WolfrumJames BoulterNational Renewable Energy LaboratoryGolden, Colorado
Michael PrairieSteven ShowalterPhilip RodacyPam LeslieBertha StangeSandia National LaboratoriesAlbuquerque, New Mexico
National Renewable Energy Laboratory1617 Cole BoulevardGolden, Colorado 80401-3393A national laboratory ofthe U.S. Department of EnergyManaged by Midwest Research Institutefor the U.S. Department of Energyunder Contract No. DE-AC36-83CH10093
Prepared under Task No. S1613610
October 1996

NOTICE
This report was prepared as an account of work sponsored by an agency of the United States government.Neither the United States government nor any agency thereof, nor any of their employees, makes anywarranty, express or implied, or assumes any legal liability or responsibility for the accuracy, completeness,or usefulness of any information, apparatus, product, or process disclosed, or represents that its use wouldnot infringe privately owned rights. Reference herein to any specific commercial product, process, or serviceby trade name, trademark, manufacturer, or otherwise does not necessarily constitute or imply itsendorsement, recommendation, or favoring by the United States government or any agency thereof. The viewsand opinions of authors expressed herein do not necessarily state or reflect those of the United Statesgovernment or any agency thereof.
Available to DOE and DOE contractors from:Office of Scientific and Technical Information (OSTI)P.O. Box 62Oak Ridge, TN 37831
Prices available by calling (423) 576-8401
Available to the public from:National Technical Information Service (NTIS)U.S. Department of Commerce5285 Port Royal RoadSpringfield, VA 22161(703) 487-4650
0%0f*Printed on paper containing at least 50% wastepaper, including 20% postconsumer waste
W40

TABLE OF CONTENTS
Page
Sum m ary .............................................................................. iii
A cknowledgm ent ........................................................................ iv
1.0 Introduction .......................................................................... 1
1.1 Objective of W ork .............................................................. 1.1.2 General Background ............................................................ 1
2.0 Photocatalytic Oxidation and Reduction Processes and the Combinationof Photocatalytic Reduction with Biological Treatment ....................................... 4
2.1 Background ...................................................................... 42.2 M ethods ......................................................................... 5
2.2.1 Photocatalytic Process Under Oxidative Conditions .............................. 62.2.2 Photocatalytic Chemistry Under Reductive Conditions ............................... 8
2.3 Biotreatment after Pretreatment by Photocatalytic Reduction .............................. 142.4 Estimated Electrical Power Requirements for Photocatalytic Oxidation or Reduction of TNT .... 15
Figures ................................................................................ 18
3.0 New Process Chemistry for Removal of TNT and Other BE Compounds from Water .............. 36
4.0 Conclusions ........................................................................ 38
5.0 Recomm endations .................................................................... 39
6.0 R eferences .......................................................................... 40
7.0 Appendices .................................................................... A - 4/B-0
A. Report on Subcontract No. XCK-5-15163-01, "Combined Photocatalytic and BiologicalTreatment of Pink Water," University of Idaho, Moscow, ID, July 1996 ..................... A-1
B. Bibliography of work on treatment of pink water and related water contamination ............ B-1
iii
Acknowledgment
Funding for this project, No. 93-349-DOE, was provided by the Strategic Environmental Research andDevelop Program (SERDP).
iv

0
Summary
This project was carried out at the National Renewable Energy Laboratory (NREL), Sandia National Laboratory(SNL), and by a group at the University of Idaho (UI) working under subcontract to NREL. Project staff met withengineering and environmental compliance staff at Longhorn and Iowa Army Ammunition Plants to becomefamiliar with current pink water treatment technology and requirements. The initial focus was on photocatalyticoxidation and reduction chemistry that could use sunlight as the photon source. This work demonstrated thetechnical feasibility of the photocatalytic processes; however, the process removed the hazardous components of
* pink water at such low efficiency that it would be expensive to operate lamps in a treatment system. Technicalsuccess in removing trinitrotoluene (TNT) from water by photocatalytic reduction chemistry led us to test that asa pretreatment step for a biological treatment process. The photocatalytic reduction of TNT did render thesimulated pink water more amenable to mineralization by Phanerochaete chrysosporium. This result led us toexplore other chemistry for removal of TNT and related explosives from water.
The new process that was investigated in this project very effectively removed TNT from pink water. Theoperating cost is estimated to be about half that of conventional treatment using granular activated carbon (GAC).The capital costs are estimated to be about the same for the new process and GAC treatment. The new processis sufficiently novel to warrant initiating steps that would lead to a patent. Reporting in an open literaturedocument constitutes disclosure. For this reason the details of the new process are being withheld until the noveltyand potential for a patent application are determined. Patents resulting from this work will be submitted to theStrategic Environmental Research and Development Program (SERDP) personnel when issued. In this report ageneral description of the results of work on the new process are presented. The details will be made availableto parties willing to sign a non-disclosure agreement with NREL.
v

1.0 Introduction
1.1 Objective of Work
The objective of this project was to develop new photocatalytic or other innovative process chemistry for thetreatment of pink water and related contaminated water.
1.2 General Background
Pink water is the term applied to waste water from Load, Assemble, and Pack (LAP) operations at ArmyAmmunition Plants (AAPs) where 2,4,6-trinitrotoluene (TNT) in combination with other explosives is loaded intovarious munitions. 1,3,5-Trinitro-l,3,5-triazacyclohexane (RDX) and 1,3,5,7-tetranitro-1,3,5,7-tetrazacycloctane(HMX') are used with TNT in the composite explosives.The abreviation BE will be used to designate highexplosives individually or collectively.' Thechemical structures of the compounds of interest in this NO, N02\N,,NO,work are shown in Figure 1.1. Water from washing No o N
and condensed steam used to melt composite explosives _N 0 K )contain low levels of TNT (about 100 ppm), HMX N/N NO,2 NO NNO2
(about 10 ppm) and RDX (about 25 ppm). When exposed NO,to sunlight the water becomes colored owing to theformation of a number of products of photochemicalreactions of TNT. The photochemistry of TNT in waterhas been elucidated by a number of workers.2'3',-Pink water also arises from cutting and milling opera- Figure 1.1. Structure of HE Compounds Mosttions and during demilitarization of munitions being Commonly Found in Pink Water.taken out of service, in which the explosive is melted using steam. Contaminated ground water with componentslike those in pink water is found at AAPs where soil has been contaminated owing to past disposal practices orwhere waste disposal ponds have leaked into aquifers. Environmental contamination by these compounds is alsofound at depots and bases within the Department of Defense complex and at some Defense Program sitesoperated by the Department of Energy. Pink water is considered hazardous because of the toxicity of the originalexplosive compounds or the presence of other compounds that were by-products of the production process.Dinitrotoluene and trinitrobenzene are examples of such compounds.
The location of AAPs in the United States are shown on the map in Figure 1.2.' Most of the AAPs are in variousstages of shut down and environmental clean up activities. Pink water is produced at Iowa, Longhorn, andHolston.
The current state of the art for treating pink water at AAPs is adsorption on granulated activated carbon (GAC).The flow diagram for the treatment system in use at Iowa AAP is shown in Figure 1.3. The system as operatedmeets current discharge standards for TNT, HIX, and RDX of<1, <5, and <5 ppm, respectively. Iowa AAPcurrently produces about 18,000 gal/day of pink water and would produce about 100,000 gal/day at fullmobilization. The spent carbon is sent for regeneration and can be recycled about four times before it becomesunusable due to particle size reduction and fiagility.6 Experience with GAC regeneration and disposal at AAPswas surveyed by A- D. Little, Inc. for the Army.7 There is concern that the system at Iowa AAP will not be ableto meet lower discharge standards currently under discussion. The new limits would be 600 ppb TNT and 1 ppmfor HMX and RDX.6
* 1

1 Alabina2 Badgae3 Coaihnkak
4 24 .5 Gateway6 Hawthor2e7 Haycc
7 2 Holston9 ,~ 3001 2 2 210 Iowa263511 Joliet23 L 12 A it Plants12 Kni 6Loiin13 LakiCt 17 1o 17 Mcdlever14 ILoneStar1 9N9
23 Rivebaik24 Scrato25 St~onia26 Sunflower
29 Volunteer
Figure 1.2. Location of Army Ammunition Plants
The ability of GAG treatment to meet proposed or potential discharge standards having lower levels ofcontaminants has been investigated for the Army at a bench and pilot scale. The work concluded that GACwould have a problem meeting new discharge standards if they were to be set as low as 300 ppb for TNT and 30ppb for HMX and RDX as was being discussed for some locations.!
The requirement for regeneration and ultimate disposal of contaminated GAC, the associated costs, and potentialthat the carbon adsorption process might not treat pink water to meet future standards has resulted in a continuingsearch for new treatment processes.
Advanced oxidation processes have received the most attention among the chemical treatment methods. Thecommon feature of these processes is the involvement of hydroxyl radicals in oxidation. Ultraviolet (UV) lightin combination with ozone, UY-03 ,'-'' and hydrogen peroxide, UV-H 20 2 ,'2
.. ',,21, " have been studied at
laboratory and pilot plant scale. The Fenton reaction (Fe+2/H20 2) has also been investigated.16'17 Heterogeneousphotocatalytic oxidation has received some attention and will be discussed in Section 3 in connection with thedescription of one of the processes being investigated in this project. Other physical or chemical processes that"have been studied include use of advanced adsorption materials,`ý 9̀ surfactant precipitation,20 and photosensitizedreactions.2'
Biological treatment of pink water and water having related contaminants has been investigated by number ofgroups.`-2321" Anaerobic biodegradation has been studied at both laboratory and pilot scale. Of concern in the 0biotreatment processes is the general observation that only a small fraction of carbon-14 labeling incorporated
2

Figure 1.3. Overall Process Flow Diagram for Pink Water Treatment Unit at Iowa AAP
into TNT is released as carbon dioxide. This indicates that TNT is converted to other compounds that remainin the water or soil being treated. Failure to achieve mineralization and the potential that some of the by-productsof biological treatment may be hazardous has been a barrier to adoption of the technology.'s
Reduction chemisty for purposes of treating pink water has been investigated mainly in the context of biologicaltreatment under anaerobic conditions. However, there is an extensive body of work on reduction of nitro groupsin organic compounds for synthetic purposes.' Denitrification (removal of nitro groups) of unsymetrical isomersof TNT by reaction with sodium borohydride was investigated as a means of purifying or recycling wastematerial.27 A study of photochemical reactions of sodium borohydride with dinitrotoluenes and relatedcompounds was recently reported."8
0 3
2.0 Photocatalytic Oxidation and Reduction Processesand the Combination of Photocatalytic Reduction
with Biological Treatment
2.1 Background
Heterogeneous photocatalytic chemistry as applied to oxidation is considered to be an advanced oxidation processbecause as usually applied under aerobic conditions, hydroxyl radicals are believed to be formed. The generalreaction scheme for action of a photocatalyst in water is as follows:
Light, E>Band Gap
Semiconductor > Semiconductor(valence band hole, h+/conduction band electron, e-)
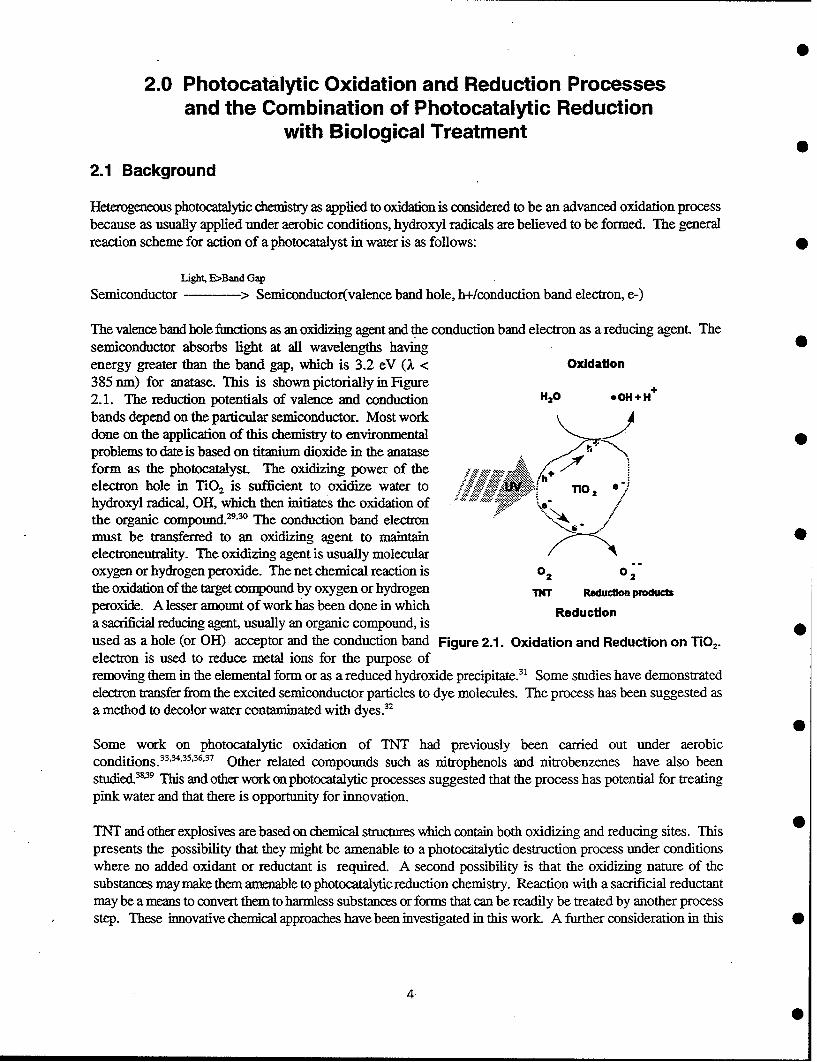
The valence band hole functions as an oxidizing agent and the conduction band electron as a reducing agent. Thesemiconductor absorbs light at all wavelengths havingenergy greater than the band gap, which is 3.2 eV (I < Oxidation385 nm) for anatase. This is shown pictorially in Figure +2.1. The reduction potentials of valence and conduction H2o *OH+H
bands depend on the particular semiconductor. Most workdone on the application of this chemistry to environmental -
problems to date is based on titanium dioxide in the anatase 7form as the photocatalyst. The oxidizing power of the .' k"7/9Felectron hole in TiO 2 is sufficient to oxidize water to . 1102hydroxyl radical, OH, which then initiates the oxidation of t * /the organic compound.29' 30 The conduction band electronmust be transferred to an oxidizing agent to maintainelectroneutrality. The oxidizing agent is usually molecularoxygen or hydrogen peroxide. The net chemical reaction is 02 02
the oxidation of the target compound by oxygen or hydrogen TNT Reucn• proucts
peroxide. A lesser amount of work has been done in which Reductiona sacrificial reducing agent, usually an organic compound, isused as a hole (or OH) acceptor and the conduction band Figure 2.1. Oxidation and Reduction on TiO2.electron is used to reduce metal ions for the purpose ofremoving them in the elemental form or as a reduced hydroxide precipitate.3 Some studies have demonstratedelection transfer from the excited semiconductor particles to dye molecules. The process has been suggested asa method to decolor water contaminated with dyes. 2
Some work on photocatalytic oxidation of TNT had previously been carried out under aerobicconditions. 3 3 5'3637 Other related compounds such as nitrophenols and nitrobenzenes have also beenstudied.2 9 This and other work on photocatalytic processes suggested that the process has potential for treatingpink water and that there is opportunity for innovation.
TNT and other explosives are based on chemical structures which contain both oxidizing and reducing sites. Thispresents the possibility that they might be amenable to a photocatalytic destruction process under conditionswhere no added oxidant or reductant is required. A second possibility is that the oxidizing nature of thesubstances may make them amenable to photocatalytic reduction chemistry. Reaction with a sacrificial reductantmay be a means to convert them to harmless substances or forms that can be readily be treated by another processstep. These innovative chemical approaches have been investigated in this work. A further consideration in this
4.

project is that a combination of a photocatalytic treatment operation with a biological treatment process mightbe more effective than either alone.
To these ends, the research reported here was done. Characterization of the photocatalytic chemistry underaerobic and anaerobic conditions and with various oxidizing and reducing agents and semiconductors was carriedout at NREL and SNL. Work on the combination of photocatalytic reduction chemistry and biotreatment wasdone under subcontract by a group at the University of Idaho that has extensive experience with biotreatment ofsoil and water contaminated with TNT and herbicides based on nitroaromatic compounds.
2.2 Methods
General methods and reagents. Synthetic pink water was prepared in the laboratory from deionized water andthe appropriate high explosive. It was prepared by dissolving the explosive material(s) in 18 MQ water withstirring over a period of days. The stock solutions were colorless and stored in amber glass bottles which werekept in dark cabinets until used. The concentrations of the high explosives approached their saturation limits inwater (lppm = lmg/L): TNT (90 ppm), RDX (40 ppm) and HMX (4 ppm). Actual pinkwater was obtainedfrom the Louisiana Army Ammunition Plant (LAAP), Thiokol Corporation, Shreveport, LA and from the IowaAAP (IAAP), Mason and Hanger-Silas Mason Co., Inc., Middletown, OR The sample from the LAAP contained63 ppm of TNT, 52 ppm RDX and a number of other components that may have resulted from photo-reactionsof TNT. The color of this solution is deep pink or orange. The IAAP sample contained approximately 45 ppm Cof dissolved organic carbon and approximately 210 ppm C of dissolved inorganic carbon. Three organic specieswere identified and quantitfied as HMX (-10 ppm), RDX (-30 ppm) and TNT (-80 ppm), which accounts forabout 32 ppm C of the dissolved organic carbon. Additionally, 2-amino-4,6-dinitrotoluene was detected in thesample but was not quantified. Degussa P25 and anatase from Tioxide were used in the photocatalysts.
Batch reactor. Most experiments performed at Sandia National Laboratories were performed in a 1.5 L batchphotocatalytic reactor assembly, shown schematically in Figure 2-2. In each experiment, 400 mL of the highexplosive (HE) mixtures were placed in the glass pot reactor and illuminated with an Oriel 1000 Watt Hg-Xeozone-free arc lamp. The pot was maintained at 20'-25°C through the use of a cooling jacket All externaloptics employed were constructed of quartz (however, the lamp bulb is composed of Pyrex to forestall ozonegeneration) to maximize transmittance. A Spectronics Spectroline band pass filter, 300-420 nm, was used torestrict the wavelengths passed to the near UV region. Actinometry measurements showed that about 5.2 wattsof incident light that is available for TiO2 photocatalysis (300-400 nm). The pot reactor was sealed gas-tight witha quartz lid and a Viton O-ring. Anaerobic reactions were carried out by vigorously sparging the reactor withnitrogen gas for 30 min before the reaction and then slowly during the reaction though a flitted glass tube. Asimilar procedure was employed for aerobic reactions using zero-air. All reactions were stirred using a magneticstirrer. Jn some experiments the initial pH was adjusted by addition of nitric acid or sodium hydroxide solutions.
A typical run was performed for 4-5 h and had samples removed for total organic carbon (TOC) (5mL), (HPLC)(2mL) and UV-Vis (2mL) analyses at predetermined times. TOC samples were covered with Paraflim andrefrigerated until analyzed- HPLC samples were sealed and refrigerated until analyzed. In order to maintain theUV-Vis spectra within the linear range of the spectrophotometer (2.0 absorbance units), all UV samples wereeither analyzed with a 1-mm-pathlength cell or diluted by a factor of four with deionized water. All of thesamples were withdrawn through a sealable sampling port- Each of the samples was filtered prior to analysisthrough a 02 pm Teflon syringe filter. Catalyst was recovered for analysis by filtration using nylon filters andwas allowed to air dry prior to solid state analysis.
Experiments requiring concentrated light were done using the Oriel 1000 watt lamp fitted with a 4" convex,quartz focussing lens and appropriate neutral density filters.
* 5

Recirculating reactor. A schematic diagram of the recirculating, batch, annular photoreactor reactor assembly,showing the major components, is presented in Figure 2-3. The assembly consists of three main components:a jacketed water-cooled reservoir, a magnetic-drive centrifugal pump, and an annular photoreactor. The threeparts are connected by 3/8" corrugated flexible Teflon tubing. The reservoir is a 1 L, water-jacketed, round-bottomed flask, modified to contain three ground-glass fittings at the top and one 1/2" (OD) glass tube protrudingfrom the bottom. The centrifugal pump has a magnetic drive with a plastic impeller. Two different pump modelswere used in the various reactor assemblies. Both had maximum flowrates of approximately 10 L per minute.This flow rate provides a residence time of approximately 1.5 s per pass in the annular reactor.
The annular reactor design is similar in size and design to those used by Turchi° and consists of six parts: twoidentical endpieces, machined out of Teflon by technicians at NREL, two glass pipes which constituted the innerand outer walls of the reactor, and two Teflon flow dispersion disks. The outer glass pipe is constructed from54 mm standard-wall Pyrex tubing. The inner glass pipe is constructed of 35 mm standard-wall Pyrex tubing.The dispersion disks are used to initiate turbulent flow and decrease any dead space of the reaction mixture andto guarantee a well-distributed flow through the reactor. A satisfactory design of the distributor holes wasdetermined by trial and error. Several different designs were tested and the flow distribution was visuallyexamined using a methylene blue solution in the reactor to improve contrast.
The reactor assembly is illuminated by placing a 1" diameter, 18" long fluorescent lamp (NEC 15W F15T8-BLB"Blacklight Blue") in the center of the annulus. Actinometry measurements on this lamp yielded 1.7 watts oflight available for photocatalysis (300-400 nm). The temperature was controlled at 25+10C by the circulationof water through the reservoir water jacket from a controlled temperature water bath (VWR scientific).
Samples were taken at intervals throughout the experiment Each sample (5.0 mL in volume) was drawn fromthe reactor reservoir and filtered through a 0.2-pm-pore-size nylon syringe filter. The first 2 mL of filtrate werediscarded and the remainder was split into two amber IHPLC vials and sealed with a crimped aluminum cap andseptum. Following the experiment, the catalyst was recovered by filtration using a 0.2-pm-pore-size Nalgenecellulose acetate filter for eventual analysis to determine the amount of carbon and nitrogen adsorbed on the usedcatalyst A fraction of the supernatant was also kept for use in other analyses, if required.
2.2.1 Analytical methods
Spectrophotometric methods. Ultraviolet-Visible spectroscopy (UV-Vis) was performed using an HP8452Aphotodiode array spectrometer. Scans were made between 190 and 820 nm using al-mm-path-length celldigitally zeroed against 18 MQ2 deionized water.
High performance liquid chromatography (HPLC). At NREL, analyses for parent HE compounds anddetection of intermediates were performed using a Hewlett Packard 1050 HPLC system with an online vacuumdegasser and gradient pump, autosampler, and single wavelength 240 nm detector, which was interfaced to a PC-based data collection system sampling at 5 Hz. The system was calibrated through a range of two orders ofmagnitude with six calibration standards analyzed in triplicate. A quantitation limit for TNT in water wasestablished to be below 20 ppb. The chromatography was performed on a 250- x 4-mm column packed with 5timn C18 Spherisorb ODS2 stationary phase. The mobile phase was a water/methanol (H1O/MeOH) gradientfrom 5% methanol (0 to 3 min) to 100% MeOH from 3 to 10 min and held at the final level for the final 10 minof elapsed time. Between each chromatographic run, the column was equilibrated with MeOH for 5 min. Theflow rate was 0.75 mL/min, the column was maintained at 27.5°C, and the sample volume was 25.0 pL. Allintermediates were reported in units of UV-Vis response unless they were specifically identified and could bequantitated.
0
60

At SNL, a Waters HPLC system with an online helium degasser, Waters 600E gradient pump, WISP 715autosampler, and a Waters UV-Vis 486 detector was interfaced with a PC data collection and control systemrunning Water's Millennium 2010 software, sampling at 80 Hz and data averaging to manageable data files of
* 5 Hz. The system was maintained at 1 ml Imin and ambient temperature. It was calibrated with multiple volumeinjections of two standards for each HE compound. The chromatography was performed on a 25-cm by 3.9-mmcolumn packed with 5 pim reverse-phase Spherisorb stationary phase. The mobile phase was a water/methanolgradient from 90/10% to 30170% during 40 min. The typical sample volume was 40 pL and the detector wasset at 231 nm. The detection limit was 150 ppb with no change in sensitivity range and 10 ppb with a changein sensitivity range.
Total organic carbon (TOC) analysis. At NREL, a Dohrmann DC-180 TOC analyzer measured total dissolvedorganic carbon using the UV/persulfate method. The instrument was calibrated as per manufacturerspecifications at 100 ppm C using sodium bicarbonate, NaHCO3, for inorganic carbon (IC) and potasiumhydrogen phthalate, KHP, for organic carbon (OC). The calibration was verified and corrected daily with a two
*• point curve (plus a blank) analyzed in triplicate. The total dissolved organic carbon (TDOC) was determined byanalyzing the total IC and the total dissolved carbon in a 150 pL sample and taking the difference.
At SNL, TOC was performed using a Shimadzu TOC-5000 with an ASI-5000 autosampler. The instrumentmeasures total carbon by passing the sample through a platinum oxidation catalyst and detection of resultant CO2with an infrared analyzer. The inorganic carbon was measured by the outgassing of an acidified solution. Theinstnment was calibrated as per manufacturer's instructions with three points and 1 blank of 18 Mr2 MilliporeUltrapure water. The ranges were two organic carbon ranges (10-50 ppm and 1-10 ppm) using the compoundsas above. The instrument was also calibrated for two inorganic carbon ranges (0-1 ppm and 1-10 ppm). All ofthese calibrations can be stored within the instrument. The instrument was calibrated a minimum of once a monthand standards were performed alongside experimental samples to ensure that the calibration was still valid.
Carbon, hydrogen, and nitrogen (CHN) analysis. CHN analysis of solid samples was performed on a Perkin-Elmer 2400 CHN Elemental Analyzer. Oxidative combustion is performed at 925 °C with a mixture of catalystsincluding silver tungstate on magnesium oxide, silver vanadate as well as chromium and nickel oxides. Thereduction analysis is performed at 640'C and employs a mix of Cuprox and a copper catalyst. The samples areplaced in a crimped foil holder and can be varied from 2.5 mg to 7.5 mg in size. Standards are performed priorto each analysis and use high-carbon-iron alloy for carbon standardization, sucrose for hydrogen and carboncalibration and acetoaniline for nitrogen calibration. All samples were performed as triplicates and amounts werereported as percentages.
Ion Chromatography. Data were collected using a Dionex 2000i/SP ion chromatography system fitted witha Dionex autosampler and attached through a Dionex Advanced Computer Interface to an IBM 386 PC runningDionex AI-450 Acquisition Software (rev. 3.32). Anions were eluted in an aqueous 1.8 mM Na2CO3/1.7 mMNaHCO 3 solution through a Dionex AS4A 4-mm column. Cations were eluted in an aqueous 20 mM methanesulfonic acid solution through a Dionex CS 12 4-mm column. Both solutions were He degassed and suppressedinline for complementary ions. A 0.5 mL sample was injected into the system and known standard solutions wereused to calibrate the instrument.
Carbon Dioxide Analysis. Off-gassing of carbon dioxide was measured via a Ba(OH)2 solution connected tothe outlet purge line of the pot reactor. This solution contained a two times excess of reagent based on the totalcarbon in the reaction system Background checks showed no appreciable CO 2 in the zero-air over the time periodof the pot reactions. Pot reactions were taken "off-lamp" and allowed to stir and purge for 30 min after the endof the reaction to fully sweep out the solution and head space. The barium carbonate precipitate was recoveredon ashless filtered paper and then washed with degassed deionized water. The sample was allowed to air dry for
* 7

a minimum of two days and ashed in a 500'C muffle furnace. The crucibles used were first zeroed at 500 0C.The samples were ignited for four hours total. They were removed and weighed after 2 h of heating and 4 h(cooling in a desiccator) with no significant difference in the two weights. This analysis was not performed forHMX reactions owing to the low level of carbon in the samples.
2.2.2 Photocatalytic Process Under Oxidative Conditions
2.2.2.1 Results
It is well known that TNT is light sensitive. Photochemistry may be initiated by irradiation with light that has anoverlap with the absorption spectrum shown in Figure 2.4. Photochemical degradation of TNT in water isillustrated in Figure 2.5 for a solution of 90 ppm TNT that was illuminated in a batch reactor in the absence ofany photocatalyst. Two types of data are shown in the figure. The left ordinate with the bottom abscissacorresponds to UV-Vis difference spectra obtained by subtracting the initial spectrum (t=0) from the spectrataken at later times. The dashed spectrum shows what the difference spectrum would look like if all of the TNTinitially present were destroyed, and the horizontal line at zero absorbance units is the difference spectrum fort=0. The spectra between these two extremes show the progress of the reaction. Difference spectra were usedbecause they highlight the formation of light-absorbing reaction intermediates. Any part of the spectrum that isgreater than zero results from these intermediates. As shown in Figure 2.5, the conversion of TNT is slow in theabsence of catalyst and significant intermediates was formed. This result was confirmed by the TOC data whichare plotted against the right ordinate and the top abscissa. There is some scatter in the TOC data but it is evident 0that the extent of mineralization (conversion of carbon content to CO) is very low during the five hours of lightexposure.
Photocatalytic destruction of TNT, HMX, and RDX individually and as components in actual pink water werecarried out in both the batch and recirculating reactor systems. Aerobic reactions were performed by spargingwith compressed air. A representative example of the photocatalytic oxidation of TNT in the batch reactor isshown in Figure 2.6. Complete destruction of TNT was achieved in five hours of irradiation in the batch reactorsystem. The TOC was reduced by only about 50%-60% under these conditions. A similar experiment was donein the recirculating reactor, Figure 2.7, with comparable results. Because pH can have a significant effect on TNTchemistry, experiments were done to test the effect of initial pH on photocatalytic oxidation. These results areshown in Figure 2.8. The final pH was usually in the range of three to four independent of the initial pH. When 0the pH was held constant at nine by the periodic addition of base there was a smaller decrease in the TOC anda larger number of detectable by-products were formed. Figure 2.9 provides information on the fate of thenitrogen under aerobic and anaerobic photocatalytic conditions. Nitrate, nitrite, and ammonium ion were found.
Analytical work was done on the aqueous, solid, and gas phases in order to identify the fate of the carbon andnitrogen in these reactions. This is summarized in Table 2-1. In this set of experiments about 40% of the carbonfrom the explosive TNT was converted to CO2 (i.e., mineralized) from solutions by oxidative photocatalysis.Oxidation of TNT resulted in a number of organic intermediates remaining in the solution after the 5 h reactiontime (about 38% of carbon by TOC analysis and seven intermediates as determined from HPLC analysis). Thecatalyst recovered from the aerobic reaction with TNT contains detectable amounts of carbon and nitrogen (about15% and 2% of the total material introduced, respectively). However, no color is evident by visual inspectionon the surface of the used catalyst. Intermediate products were not in general identified. An exception istrinitrobenrzene which was identified by comparison of HPLC retention times and UV-Vis spectra with those ofauthentic samples.
Similar data were obtained for HMX and RDX which are also shown in Table 2-1. The destruction of RDX,about 75% conversion, yielded predominantly CO2 and material adsorbed on the catalyst surface. In the case of •HMX, the extent of destruction was about 80% in a 5 h experiment.
8

Table 2-1. Mole Balance Data for Carbon and NitrogenUnder Aerobic Conditions.
TNT RDX HMX0, 02 02
Type of Carbon
Solution Carbon
HE Carbon 0% 30.6% 0%
Carbonate <1 <1 0
By-product(s) 37.8 0 17.8
Carbon on T10 2 14.8 27.2 1.5
Carbon Dioxide 40.1 44.1 ND*
Recovered Carbon 92.7 101.9 19.3
Type of Nitrogen
Solution Nitrogen
HE Nitrogen <1% 30.6% 0%
Ammonium 15.8 14.8 19.8
Nitrite <1 <1 0
Nitrate 12.4 14.1 16.3
By-product Nitrogen** 37.8 0 17.8
Nitrogen on TiO 2 2 0 0
Recovered Nitrogen 68.2 59.7 53.9*ND = not done"**The numbers for by-product nitrogen are assumed from
the percentage of by-product carbon. All other valuesare experimentally determined.
A number of experiments with mixtures of TNT and RDX were performed in the recirculating reactor assembly*using a hard quartz annulus and a lamp which emitted short wavelength UV (,-185 to 254nm) ilumination.In this configuration the reaction mixture, with TiO2 photocatalyst, was illuminated by the full lamp outputspectrum. Passing air through the space between the lamp and the inner reactor wall generates ozone. Themixture of oxygen and ozone was then bubbled through the reactor reservoir. The results of these experimentsare presented in Figure 2.10 for TNT, HMX, and RDX. TOC analyses of these experiments are shown inFigure 2.11. In all three compounds the removal of TOC was significantly slower than the disappearance of theexplosive.
The use of short-wavelength U-V illumination with no catalyst and an air atmosphere results in loss of thereactants at a rate comparable to that found with the use of photocatalyst. Data on removal of the explosives andthe corresponding TOC analysis is shown in Figures 2.12 and 2.13, respectively. The catalyst was found to havelittle effect and may have slightly reduced the rate of reaction by blocking the light available for direct photolysis.It is likely that the use of short-wavelength illumination results in direct photolysis not possible with near-UVlight.
3
9

2.2.2.2 Discussion
The photocatalytic oxidation of TNT, HMX, and RDX in both synthetic samples and in the form of pink waterfrom AAPs has been studied under a wide range of conditions. The results generally agree with those reportedby Schmelling and Gray,3 and Schmelling et al.,"- Kang and Kutal," and Diller, et alY However, Schmellingand Gray report significantly more rapid mineralization of TNT than we have been able to achieve. They report>90% mineralization of TNT within 120 min whereas the best we have been able to achieve is about 50%conversion to CO2 within 300 nin.
We carried out experiments under conditions that attempted to reproduce some of the earlier work. Analyticalmethods were chosen which allowed us to follow the disappearance of the parent HE compound, track theappearance of intermediate oxidation products and in some cases identify them, to follow total organic carboncontent of the aqueous phase, to analyze the titanium dioxide photocatalyst for adsorbed carbon and nitrogen,and to determine the amount of evolved carbon dioxide. This allowed mole balances to be determined, Table 2-1.
In general, under conditions in which the aqueous phase was saturated with oxygen by sparging with air duringthe experiment, the photocatalytic oxidation of TNT proceeds with formation of a number of intermediates.These were not identified but were followed by HPLC analysis and reported as total counts by the UV detectorof the HPLC unit. Depending on pH, the number of detectable major intermediates ranged from four to seven;the fewest were observed at the lowest pH. After four hours of irradiation the conversion of TNT was in therange 50%-60% and the TOC in solution remained at about 40%-50% of the initial level. There was about a 40%yield of carbon dioxide. This is consistent with the existence of intermediate products that are not mineralized.
Our results are in reasonable agreement with the work of Wang and Kutal who reported about 60% mineralizationof TNT during a 4 h reaction.' Their experimental system is similar to ours; they used a purged batch reactorand light of wavelength above 290 nm. They used oxygen instead of air, 0.1 wt% of catalyst, and used theDegussa P25 form of TiO2 rather than that from Tioxide, Ltd. We tested the effects of these three variables andhave observed no significant differences in either the rate of reaction, nor in the final TOC concentration. It isdifficult to make more detailed comparisons because of the lack of details of the lamp and reactor geometries.
Comparison with the results of Schmelling and Gray33 and Schnelling et al.,4'35 is less direct. They report about90% mineralization within about 120 min under the following conditions. They used a closed batch reactorsystem, saturated with oxygen, 0.025 wt % P25 catalyst, and irradiation with a 450 W medium pressure mercuryarc lamp with the output filtered to remove all but light between 340 and 390 run.
In an attempt to duplicate the work of Schmelling and Gray, we experimented with other variables: a saturatedoxygen atmosphere, the use of tap water for the HE solutions, lowered concentrations of TNT in solution (40-50 ppm), higher than normal incident light concentrations (use of a focusing lens and a small reactor), the useof P25 as the catalyst, and a band pass light filter. The results of these experiments were similar to results of ourprevious work. One observable difference was the appearance of a red color in the reaction solution that useda tap water/HE mixture. This red solution is reported at the beginning (after exposure to the lamp) of all of thereactions reported by Schmelling and Gray; however, we do not observe color in the solution until 2-3 h into thereaction Although TOC dropped during the reaction to one third to half of the initial concentration, Carbon inour solutions did not disappear to the degree achieved by Schmelling and Gray. We attempted to increase theTOC removal by varying other reaction conditions. In all of our reactions the pH started out slightly acidic (ca.pH 6.5) and became more strongly acidic (ca. pH 3.5) at the end of the reaction. Experiments tested how theinitial or reaction pH affected the final TOC concentrations. The reactions were started following adjustment toa pH value of 9, 7, 5, or 3 by addition of sodium hydroxide or nitric acid solution, Figure 2-8. In another test,the solution was held in the range of 8-10 by perodic addition of base throughout the. Color change in these S
10
reactions evident only towards the 3-4 h mark- We can generate this color by artificially raising the pH at thebeginning of the reaction (> 8 pH). Therefore there could be an effect of the initial p1L We have also performedexperiments where the pH is varied (to address this problem) and this has no major effect on the final TOCresults, but it does significantly influence the type and number of intermediates formed. In all experiments, therewas no significant impact on the TOC compared with our earlier results.
2.2.3 Photocatalytic Chemistry Under Reductive Conditions
2.2.3.1 Results
Reducing conditions have also been tested in order to evaluate the full range of photocatalytic capability ofirradiated TiO2. When a photocatalytic system is run under anaerobic conditions electron transfer from theconduction band of the irradiated semiconductor to a target compound can be enhanced since there is no oxygento scavenge electrons.31 ,32 Under these conditions electrons and holes must both be consumed by the HEcompound(s) in order for a sustained reaction to occur. Reduction of the HE can be forced by added reducingagents that would consume holes so that only electrons would be available to react with the HE compound(s).Because light absorption by the TiO2 photocatalyst generates both a hole and an electron, it was postulated thatif we could prevent electron scavenging by oxygen (by keeping a strictly anaerobic system), or by adding asacrificial reductants (to scavenge the photo-generated holes), we could direct the chemistry toward photo-reduction of the explosive compounds. Organic and inorganic reducing agents were screened for activity.
Organic reductants that prior work3' found to be effective in the photocatalytic reduction of metal ions were testedon TNT degredation in a batch reactor. Organic reductant (0.72 mM concentration, 2:1 molar ratio of addedorganic to TNT) was added to a nitrogen-purged TNT solution containing suspended TiO2. The results aresummarized in Figure 2.14, which also includes the case of the self-redox reaction (no added organic). Citric acidand disodium ethylenediaminetetraacetic acid (Na2EDTA) produce the greatest increase in the rate; RDX andhydrogen have no effect; and salicylic acid inhibits the reductive photocatalysis.
Mass balances were determined for the reactions of TNT, HMX and RDX under anaerobic conditions with noadded reducing agent. The results are summarized in Table 2-2. At the end of the anaerobic reaction of TNTthe catalyst was coated with a brown substance (60% deposited carbon and 45% nitrogen, where percentagesrefer to the fraction of the element initially present as TNT) or a 4/1 by mass ratio of carbon to nitrogen. Thisresult, when compared to a 2.3/1. ratio of carbon to nitrogen in the parent compound, suggests that this is notsimply adsorbed TNT, but rather some decomposition product. Analytical techniques have yet to positivelydetermine the nature of this coating, but early results point towards a polyaniline analogue produced through thereduction of nitro-groups to amines or diazo linkages.4' We have also found that the surface of this coating, asobserved with X-ray photoelectron spectroscopy (XPS), differs from the bulk, indicating that there is a changein the deposited species during the course of the reaction. The results for HMX and RDX also reveal that thereis little mineralization and significant depostion of material on the catalyst under anaerobic conditions when thereis no added reducing agent. Soluble nitrogen species were identified by ion chromatographic analysis,(Figure 2.9b).
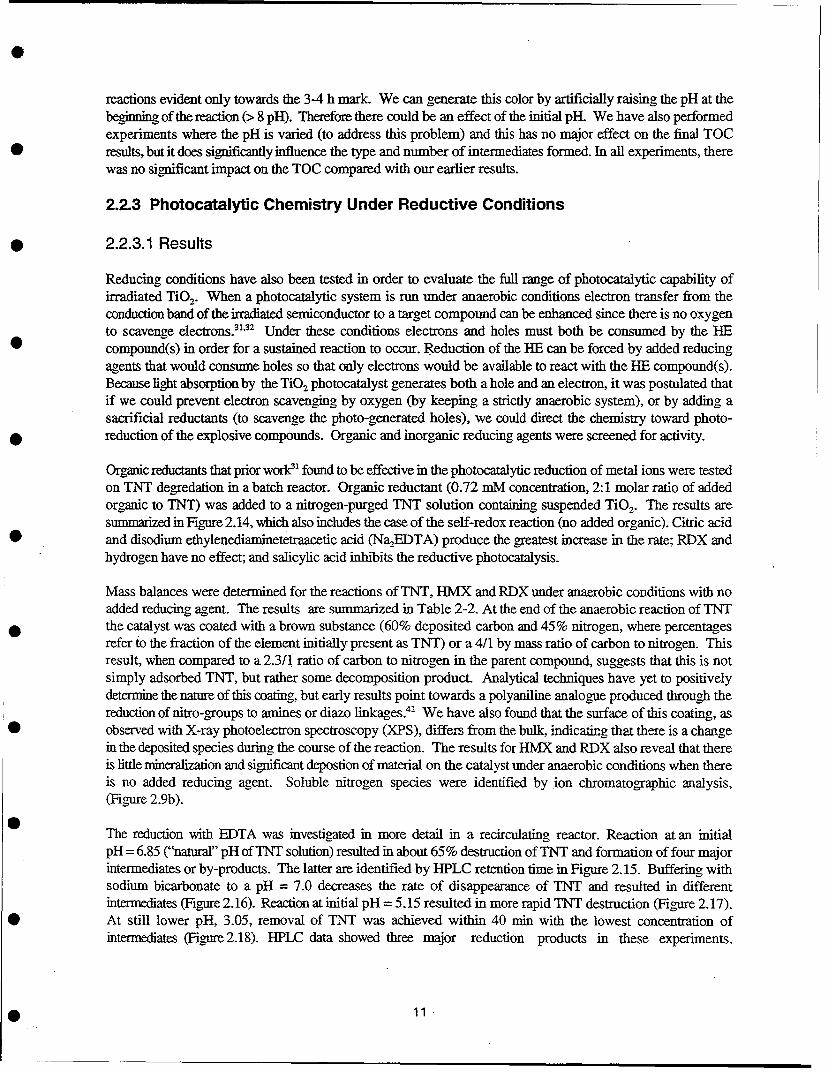
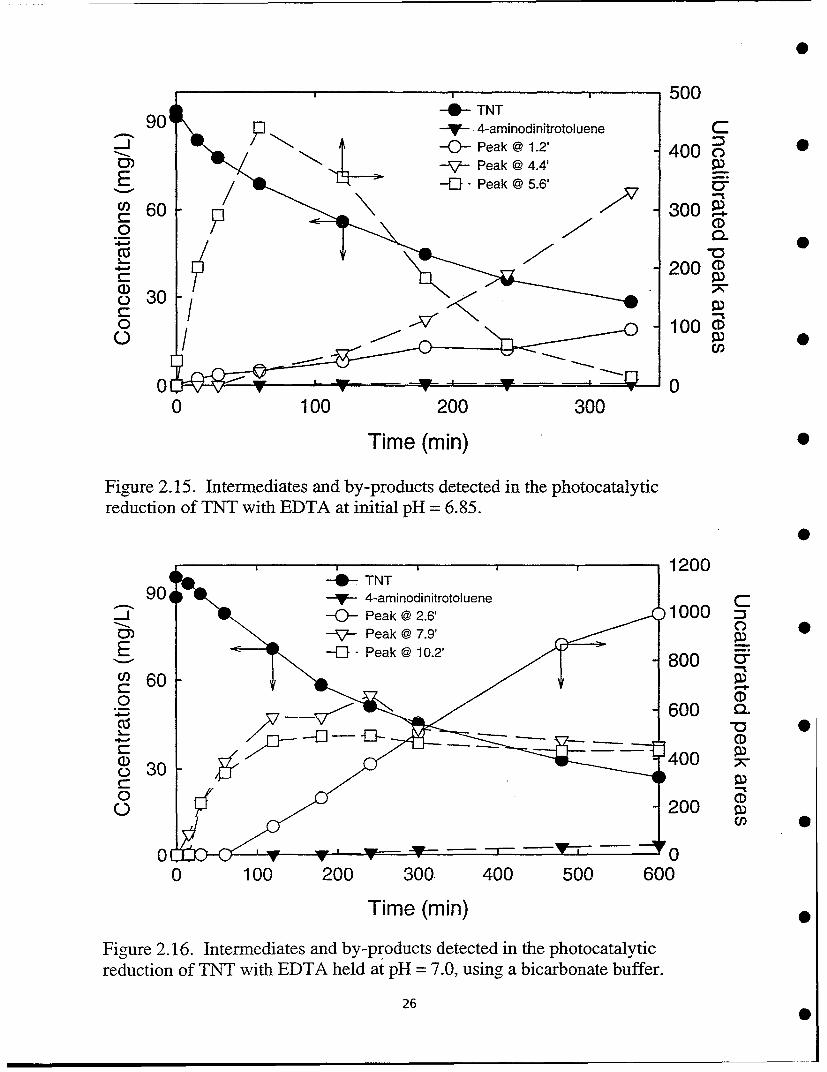
The reduction with EDTA was investigated in more detail in a recirculating reactor. Reaction at an initialpH = 6.85 ("natural" pH of TNT solution) resulted in about 65% destruction of TNT and formation of four majorintermediates or by-products. The latter are identified by HPLC retention time in Figure 2.15. Buffering withsodium bicarbonate to a pH = 7.0 decreases the rate of disappearance of TNT and resulted in differentintermediates (Figure 2.16). Reaction at initial pH = 5.15 resulted in more rapid TNT destruction (Figure 2.17).At still lower pH, 3.05, removal of TNT was achieved within 40 min with the lowest concentration ofintermediates (Figure 2.18). HPLC data showed three major reduction products in these experiments.
* ~11*

Table 2-2. Mole Balance Data Under AnaerobicConditions With No Added Reductant
TNT RDX HMXN2 N2 N2
Type of Carbon
Solution Carbon
HE Carbon <1% 44.5% 17.7
Carbonate <1 <1 <1
By-product(s) 32.9 45.3 28.0
Carbon on T1O 2 62.0 2.4 1.9
Carbon Dioxide 4.0 10.2 ND*
Recovered Carbon 98.9 102.8 47.6
Type of Nitrogen
Solution Nitrogen
HE Nitrogen <1 44.5 17.7
Ammonium 15.1 3.8 1.4
Nitrite 2.2 <1 0
Nitrate <1 <1 <1
By-product 32.9 45.3 28nitrogen**
Nitrogen on TiO2 42.7 0 <1
Recovered N 94.2 93.9 47.1*ND = not done* The numbers for by-product nitrogen are assumed from
the percentage of by-product carbon. All other valuesare experimentally determined.
experiments. These were identified by matching BPLC retention times, UV-Vis spectra, and HPLC-MS analyses.The three products were 2,4-dihydroxylamino-6-nitrotoluene, 2-hydroxylamino-4-amino-6-nitrotoluene, and2,4-diamino-6-nitrotoluene.42
Mass balance studies with carbon-14 labeled TNT, [U-ring, 14C]-TNT, were done on EDTA experiments todetermine how well transformation products could be recovered and detected. Results showed that most of theproducts were soluble but a significant amount remained on the reactor and had to be washed off with NaOH orwater (Figure 2.19). The solubility of reaction products when EDTA is used is in contrast to the degree to whichinsoluble material is deposited on the TiO2 when no reducing agent is present in the reaction mixture, which wasdescribed above. HPLC analysis of the soluble radioactivity showed the three products mentioned aboveaccounted for the majority of eluted radioactivity (Figure 2.20) but only about 55% of the injected radioactivitywas recovered in eluent. The hydroxylamine products, if formed, apparently have a propensity to bind to the
12S

S
HPLC column, or other products were formed which are not amenable to this type of analysis. Silylation and(GC/MS) did not reveal any other products and in fact was not succesful in determining the hydroxylamines. Theamount of soluble radioactivity decreased during the time of incubation in air (Figure 2.21) indicating
* polymerization or other reaction that produces insoluble products. '4C-labeled TNT was used to confirm that atacidic pH conditions most of the carbon was present as soluble compounds. At basic pH, azoxy coupling to givedimers occurred to a greater extent. The reaction of 4-amino-2,6-dinitrotoluene under photocatalytic conditionswas tested. This compound was reduced to 2,4-diamino-6-nitrotoluene, which was stable under the reactionconditions indicating that it is a practical end point of reduction (Figure 2.22).41
"Inorganic reductants and additional organic reductants were investigated in experiments at NREL in therecirculating annular reactor. The results of these tests are shown in Figure 2.23a. The data for EDTA underthese conditions is also included as a reference point for comparison with the results described above. The rateof TNT removal with formate was nearly the same as for EDTA. Glucose removed TNT at a rate similar to thatof the inorganic reductants. Sulfite and hypophosphite were active only when light and catalyst were present and
* dramatically increased the reductive degradation rate of TNT (Figure 2.23b). The experiment with sodiumborohydride (NaBH4), a strong reducing agent, is notable. TNT was rapidly removed upon addition of NaBH4,before the lamp was tamed on (Figure 2.23a). Subsequent illumination decreased TNT concentration only veryslight further, and did not discernibly decrease TOC.
Other experiments examined the light intensity dependence of the rate of photocatalytic conversion of TNT. Thepot reactor described above was used, and neutral density filters were inserted between the reactor and the lightsource to attenuate the incident light. In the absence of any organic reductant, the photocatalytic conversion rateof TNT shows linear behavior with respect to incident light intensity under both aerobic and anaerobic conditions(Figure 2.24a). When the hole scavenger EDTA is added under anaerobic conditions, not only does the rateincrease dramatically, but it exhibits half-order dependence on light intensity (Figure 2.24b). We believe this mayindicate that when the rate of the chemical reactions are slow, photo-generated holes and electrons are consumedby chemical reactions in proportion to their concentration, and that physical processes within the catalyst thatgovern the rate of recombination are not factors. When the chemistry is accelerated by adding hole scavengers,the competitive effect of exciton recombination becomes evident.
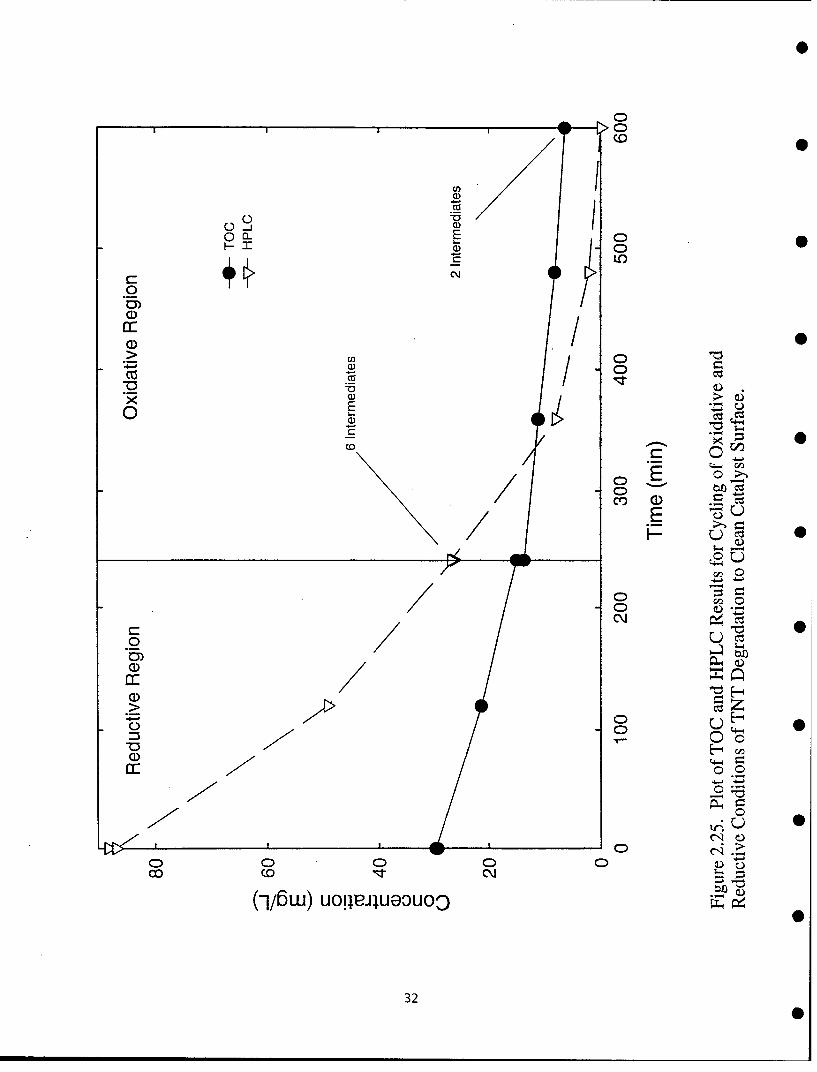
Experiments using an initial anaerobic photocatalytic step followed by oxidative conditions in TNT wastewatershow this to be an effective way to clean the catalyst that has been coated in the reductive reaction, whileproducing fewer intermediate species than direct oxidation of TNT, Figure 2.25. This procedure does have thedrawback of increasing the reaction time, but it may prove useful in decreasing the overall toxicity of the treatedwater.
2.2.3.2 Discussion
The initial rationale for testing the photocatalytic reaction of TNT under anaerobic conditions was based on theknowledge that the molecular structures of HE compounds are designed to include both oxidizing and reducingfunctionalities. HE compounds are designed to self destruct and the challenge is to bring this about under mildconditions. TNT is reactive under conditions in which no other oxidizer or reducing agent is present as shownin Figure 2.14 (curve for no added electron scavenger). Unfortunately, very little of the carbon content isconverted to CO2 under these conditions. The majority, about 62%, of the TNT is converted to forms which aredeposited on the catalyst surface and most of the balance is in the form of soluble by-products (Table 2-2).Subsequent photocatalytic reaction of the mixture under aerobic conditions can accomplish some cleaning of thecatalyst.
13

Table 2-3. Electrical power requirements for photocatalytic oxidation and reduction processesestimated from the results obtained in this project.
Time and power needed to reduce TNT kWh/1 000 gal ofby one decade pink water
Reactor and Conditions min Wh/L
Batch (1000 W; 0.4 L)
Reduction-EDTA 10 113 428
Reduction 230 417 1578 0
Oxidation 145 6014 22,868
Recirculating (15 W; 1 L)
Reduction-EDTA 50 12.5 47
Reduction 600 150 568
Oxidation 453 9583 362.76
Equation = (Electrical Power)*(Time to destroy one decade of TNT in brs) /(Volume of reaction solution, in liters), this is then convertedto kWh/1000 gaL A cost can be calculated by assuming a cost for electricity. 0
Table 2-4. Apparent Photoefficiency (mole TNT eliminated/mole photons supplied) for photocatalyticoxidation and reduction processes
Time needed toreduce TNT UV photons available Mol of TNT/ 0
Lamp and Conditions by one decade (min) (Ei) Mol of photons
Oriel (9.5098E-04 Ei/min;1.43E-04 mol TNT)
Reduction-EDTA 10 0.00950 0.01503
Reduction 230 0.21872 0.00065
Oxidation 145 0.13789 0.00103
Black (2.7441 E-04 Ei/min;3.56E-04 mot TNT)
Reduction-EDTA 50 0.01372 0.02594
Reduction 600 0.16464 0.00216
NREL (2.7441 E-04 Ei/min;3.56E-04 mol TNT)
Oxidation 450 0.12348 0.00288
Equation = (Flux in E/rain from actinometry)*(Time to degrade unit amount, 81 ppm, in minutes)/(Moles of TNT in unit amount,81ppm*volume of reactor)
16

0
requirements are based on the use of fluorescent black lamps that have the same electrical to near-UV light outputas the lamps used in this study (15:1.1 W) or on the Hg-Xe arc lamp (1000:4 W). Each decade of destruction,100 to 10 ppmn, 10 to I ppm, etc., would require the same amount of time to achieve under conditions which fitthe assumptions. There are a number of variables that are included to determine the power requirements forphotocatalysis. One method is to determine the electrical power required to create one decade of reduction (from100%-10%) in the target contaminant in one liter. This methodology provides the results summarized inTable 2-3.
SA second method is to determine the efficiency of the reaction by measuring the UV photons available expressedin Einsteins (Ei), from actinometry measurements, per molecule of compound degraded, and comparing this withthe concentration decrease of the target species per unit time (100-10% is 90 ppm-9 ppm, or 81 ppm of TNTdestroyed). This generates a unit-less efficiency, Table 2-4.
17

To Pov~erSupply
G. Figures
UV LAMP (irzFte
N
SAMPLES
Water *4
-44 Cooling Water
MAGNEflC sT1RRE
Figure 2.2. Batch photocatalytic reactor system.
Sample Port Sparging Port
Vent orReactor
Sparge
Inlet ~~Gas Release OtrTb
Innelet
Fr orSairg
Figureo2.3. Reciculatin htceia eco ytm
18oinCoolig ate Wate

LO
C,)
o~ CZ
0.0
D.O
U') 0
I,- U-)c
05 0
(nv) eo-eqjLsq
19\

40 , , 1 , , 20--0- TOC
-- Nitrate O
- -Nitrite30 --- Ammonium 15 o0
2 o
20 10
o 0F--10 5 (3
0--- ---- '0
0 50 100 150 200 250 300
Time (min)
Figure 2.9a. TOC and inorganic nitrogen species formed duringoxidative destruction of TNT in the batch reactor.
40 5
30-
20 3 CD
0
o 2 5
-0- Nitrate1--- Nitrite r-3- Ammonium
0 00 50 100 150 200 -250 300
Time (min)
Figure 2.9b. TOC and inorganic nitrogen species formed duringreductive destruction of TNT in the batch reactor.
22

* 100%1-0- TNT (HPLC)
-v- RDX (HPLC)
' 75% HMX (HPLC)
E
o 50%
0%
0 10 20 30 40 50 60
Time (min)Figure 2.10 HPLC of HE destruction using 180-254 nm ozone generatingspa lamp with TiO2 in the recirculating reactor.
100% -- TNT (TOC)
0) RDX (TOC)
' --- HMX (TOC)
'E 75%-
E
C) 50%LU
o- 25%
00
0 50 100 150 200 250 300
* Time (min)Figure 2.11 TOG of HE destruction using 180-254 nmn ozone generating,
spa lamnp with TiO in the recirculating reactor.
* 23

III I
100%-- TNT (HPLC)
-v- RDX (HPLC)C-E HMX (HPLC)
.• 75%CZ
E3-
LLU0%
6- 25%0%-
0 10 20 30 40 50 60
Time (min)
Figure 2.12 HPLC of HE destruction using 180-254 nm ozone generatingspa lamp without Ti0 2 in the recirculating reactor.
I0
100-0- TNT (TOC)-V- RDX (TOC)"-I- HMX (TOC).• 75
EL-
0 50%LU1I
--6 25%
0%10 50 100 150 200 250 300
Time (min)
Figure 2.13 TOC of HE destruction using 180-254 nm ozone generatingspa lamp without TiO2 in the recirculating reactor.
24

* 01o CM
C.7 w x"Ii.>
G* C-) iF C LJ
00
C) 0 0/o co"I c
(-1/w) U11eluGOU0 -o
2SI
500
90- TNT
90 -v--4-aminodinitrotoluene C-0-Peak @1.2' 4000-v-Peak @ 4.4'W
E- -Q-Peak @ 5.6'
~60 / 300~/0~
200 C(D0 300 100 C
C,,
0 00 100 200 300
Time (min)0
Fig~ure 2.15. Intermediates and by-products detected in the photocatalyticreduction of TNT with EDTA at initial pH = 6.85.
1200-- TNT
90 --. 4-aminodinitrotoluene C:2 -0 Peak @ 2.6' 100
0) -7--Peak @ 7.9'E ~-0-Peak @ 10.2'
~60 i0 C
0) _
o30
0 C
0 100 200 300 400 500 600
Time (min)
Figure 2.16. Intermediates and by-products detected in the photocatalyticreduction of TNT with EDTA held at p1H = 7.0, using, a bicarbonate buffer.
26

120 a7000
0) 90 -@TNTE y-4-aminodinitrotoluene 5000
U)-0 Peak @3.5'* CV- Peak @ 14.6' 40
o 60j Peak@ @27' CC15 Peks> 25
-C) Peks 25'3000 CD
0 CD
1000 WD
0 --- -0
0 100 200 300 400
Time (min)Figure 2.17. Intermediates and by-products dtce ntepooaayi
reduction of TNT with EDTA at an initial pH = 5.15.
120 .. ~....2,4diaminonitrotoluene 70-- TNT-u-4-aminodinitrotoluene -6000 C:
CY 90 0- 2,4-dihydroxylaminonitrotoluene0E -- 2-hydroxylamino-4-aminonitrotoluene -5000
-Q-4-hydroxylaminodinitrotoluene%4000 S
o CD* ~60/
/3000 CD
0
Ask CD000
0100 200 300
Time (min)Figure 2.18. Intermediates and by-products detected in the photocatalytic
reduction of TNT with EDTA at initial PH = 3.05.
27

,% -0 Na2SO,120 NaBH4
\ No scavenger"C EDTA
C\--A- NaH2PO2E 8-0% Glucose
\---NaHCO2
zH 40%60 -
0%0
S"------- --------.---"...-------.
0 50 100 150 200 250 300
Time (min)Figure 2.23a. Effect of hole scavengers upon the photocatalytic reductionof TNT in the recirculating .reactor.
100%
K-U
c 75% I -- U 0
CzEa) 50%
I I \-0- Na 2SO 3 , TiO2 , nUVZNa 2So 3, no TO, nUV
S25%!- I-\ -"E - No Na2SO3, n°TiO2, nUV
0-0-- Na 2SO3 , no TO 2, no nUV
0% '
0 50 100 150 200 250 300
Time (min)0
Figure 2.23b. Combined effects of sodium sulfite, TiO2, and UV illumination
on the photocatalytic reduction of TNT in the recirculating reactor.
30

S0.02
= E,.-0.02
z Aerobic
0 00O 0.01
S0.01 -
* " - - Anaerobic-No hole scavenger
,- 0.00
0.0 0.5 1.0
0 Relative Intensity
Figure 2.24a. First Order Rate Constant vs Relative Intensity for Anerobic andAerobic TNT Degradation (Rate constant from ln(c) = k t + b)
'- 0.20C
C: 0.150 EDTA
Sk =0.1761 .
00 0.10
Czrr70,,, 0.05 •
(* No EDTA
k 0.0104 1 + 0.0007-----------------------------------U----------
•- 0.000.0 0.5 1.0
* Relative Intensity
Figure 2.24b. First Order Rate Constant vs Relative Light Intensity for Anerobic TNTDegradation with and without EDTA Present (Rate constant from ln(c) = k t + b)
31
0D
0
0)0
ICI
_0
m /0)
c:) E0
C)C)ol
C) 1C)
0 L0
C -
(Cl)
4-~
0 0)
C\Jn
0.
C OZ11Z1
o Q0 It 0 0
(1I/5w) uoIJiliueOUoo ý
32

0 H OH
2e-2e-, 2He + 2e-, 2H+
H2 0 H2 0
0 H2 0 OH OH x
Figure 2.26. Simplified reaction scheme for reduction and coupling of thenitrogen functionality in nitroaromatic compounds.
35 , I , ,
W -e- 2 HoursCD --V- 6 Hoursa 3 -Fl- 6 Hour Control .7 7 v.
"• 25 "-•'"0 Hours --
* 25
200
O 15
S10
0 5_0
-B -- E
0 5 10 15 20 25 30
Time (days)
Figure 2.27. Evolution of 14C-CO 2 over time from aerobic biological
degradation of photocatalytic TNT degradation products by P. crysosporium.Graph shows four treatments: a non-inoculated control, no photocatalytictreatment (0 hours), and 2 and 6 hours of photocatalysis.
33

1.4
1.2
Before 1.0
0.8 >S 0 .6
0.4 0S 0 .2
1000 0.0
800
L 600
200
0 1.2
1.0
0.8After 0.6 >
- 0.
0.4
- 0.2
150 0.0
E 10 0
0 50
0 110 5 10 15 20 25 30 35 40
Time (min)
Figure 2.28. Chromatographic peaks (A21 0) with associated 14 C fractionation
(dpm) of photoreactor products from 2 hours of photocatalytic treatment of 0TNT before (top graph) and after (bottom graph) aerobic biological treatmentby P. crysosporium.
34

SI A- 1.4
6 Hr Photo. 1.2-1.00.8 r>0.6 -0 0.40.2
S 0.0800
E 600E 400
200
0 1.21.0
6 Hr Photo., 27 days P.c. 0.8- 0.6>
0.4"S0.2
200 L 0.0
150Eg100
* 500
- 0.8
6 Hr Photo., 27 days uninoculated 0.6 >
-0.4o
0.2* 0.0
150E0-100
50
00 5 10 15 20 25 30 35 40
Time (min)
Figure 2.29. Chromatographic peaks (A210) with associated 14 C fractionation
(dpm) of photoreactor products from 6 hours of photocatalytic treatment of
TNT before (top graph) and after (middle graph) aerobic biological treament
by P. chrysosporium. An abiotic control (bottom graph) is included for comparison.
35

3.0 New Process Chemistry for Removal of TNT and Other HECompounds from Water
A new process for the removal of TNT and other HE compounds from process water or contaminatedgroundwater has been identified in this project. The process is based on the use of novel reduction chemistry thatdoes not require light or other unusual conditions. The chemistry has been characterized sufficiently to bring theprocess to the proof-of-concept level of development. The process is sufficiently innovative to warrantmaintaining it as NREL Protected Information to allow for prosecution of patent. Therefore only a generaldescription of the performance of this process is included here.
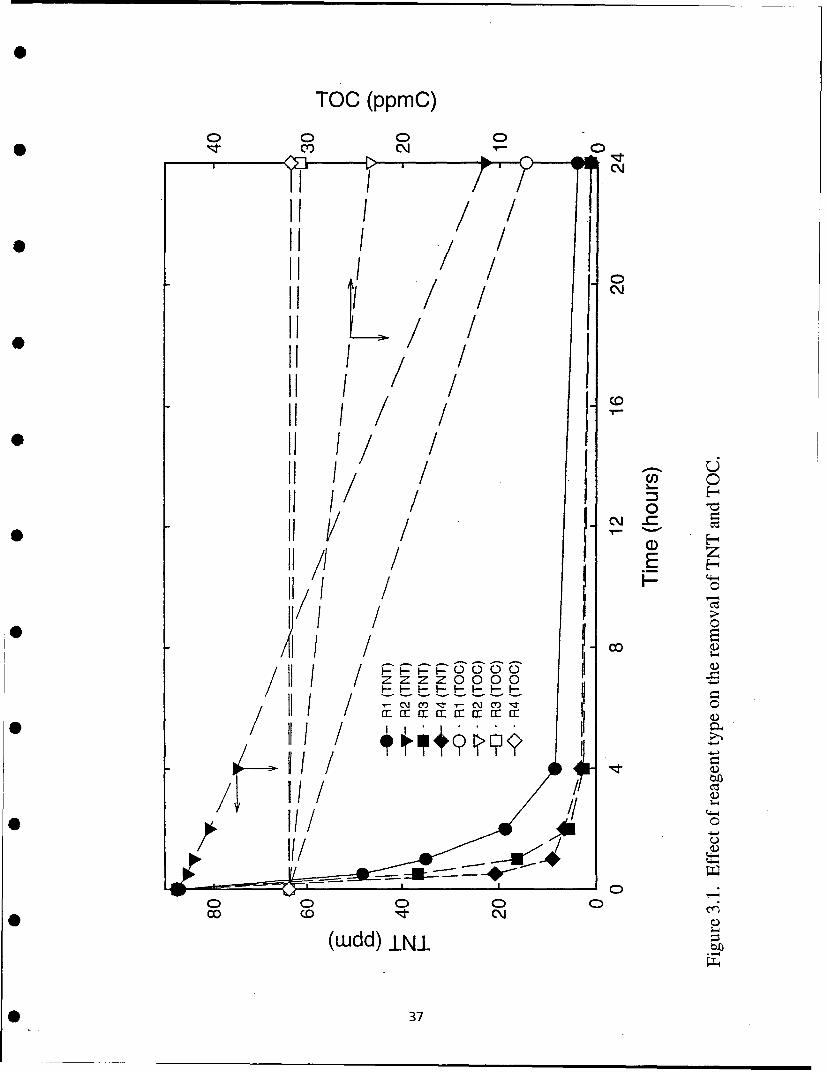
Figure 3.1 shows the removal of TNT from water by the process as a function of time using four variations ofthe reagents appropriate to the process. These reagents are indentified in the figure as R1 through R4. The TNTcontent is reduced below the detection limit, 20 ppb, by the process. The performance of the process is relativelyinsensitive to the pH and presence of ambient air but is accelerated by increasing temperature. Not allintermediates and by-products of the reaction chemistry have been identified. For this reason it is not known withcertainty if the treated water will be without hazard- Additional work will determine if hazardous products remainin the water. If so, there are a number of options for removing them with little alteration of the process.
An economic analysis based on the current level of understanding indicates that the process will be less expensiveto operate than the GAC systems now used to treat pink water at AAPs. The reductant is readily available in bulkquantities at low cost and neither it nor its reaction products are hazardous. The capital cost is expected to besimilar to that for those systems. This new process has the potential to be a major improvement over the GACsystem and will not require significant changes in process operations.
36
TOO (ppmC)
0o 0 0
C)J
~ / 0ii / /
0 Ii / /
Ill CD,
(wdd I' /I c'; -4
* 17

0
4.0 Conclusions
Photocatalytic treatment of pink water under oxidative conditions can mineralize TNT, HMX, and RDX butrequires long residence times which translates to large power consumption by the process.
Photocatalytic treatment of pink water under reducing conditions will convert TNT to other substances. The mosteffective reducing agents are organic compounds such as EDTA, citric acid, glucose, and sodium formate. Thepower requirement and the reducing agent would contribute significantly to the process cost. However, thepower required for the photocatalytic reduction process is significantly less than that for the oxidative process.
Biological treatment using Phanerochaete crysosporium following reductive treatment of pink water with EDTAresulted in partial mineralization of TNT. The degree of conversion of carbon content to CO2 in the biologicaltreatment step was dependent on the length of the photocatalytic pretreatment. The maximum extent was 32%which was achieved using a feed solution that had been exposed to 6 h of photocatalytic pretreatment.
This innovative new process for treating pink water is an effective method to reduce the level of TNT in pinkwater to below the detection limit (20 ppb). The rates of removal of HMX and RDX are lower than that for TNTunder the treatment conditions that have been developed to date. It is possible that different treatment conditionswill improve the rate of destruction of HMX and RDX. Parties interested in learning more about this process maycontact the authors of this report at NREL.
The annual operating costs determined at this early stage of development for the new process process is$179,000 for a 150 gpm flow of pink water. This is very favorable when compared to $323,500 estimated forthe carbon adsorption process. The capital costs are believed to be similar for the two processes.
38
5.0 Recommendations
*- The new process developed in this project has the potential to be a simple and low-cost method of treating pinkwater from LAP and demilitarization operations or for treatment of contaminated ground water. In order todevelop this potential it is necessary to address gaps in the current understanding of the process. The followingare recommended to provide a complete basis for assessing the process:
The nature and toxicity of the products from treatment of TNT in the new process must be determined.
The distribution of the organic and inorganic content of the treated water between solid and aqueous phases mustbe determined.
The amount of reagents assumed to be required, in order to estimate the cost of the process, was veryconservative. Actual reagent consumption must be determined for the optimum process.
The reactivity of HMX and RDX must be improved for the process to be practical for pink water treatment Thismay not be critical in the groundwater treatment application where HMX and RDX are not key factors.
39

6.0 References
1. Pal, Bimal C.; Ryon, Michael G. Database Assessment of Pollution Control in the Military Explosivesand Propellants Production Industry, Oak Ridge, TN: Oak Ridge National Laboratory, February 1986. 0AD-A165 853.
2. Burlinson, N.E.; Sitzmann, M.E.; Kaplan, L.A.; Kayser, E. "Photochemical Generation of the2,4,6-Trinitrobenzyl Anion." J. Org. Chem.; Vol. 44, No. 21, 1979, pp. 3695-3698.
3. Burlinson, Nicholas E.; Kaplan, Lloyd A.; Adams, Charles E. Photochemistry of TNT. Investigation ofthe "Pink Water" Problem. White Oak, Silver Spring, MD: Naval Ordnance Laboratory. 3 October 1973.AD 769 670.
4. Kaplan, Lloyd A.; Burlinson, Nicholas E.; Sitzmann, M.E. Photochemistry of TNT: Investigation of thePink Water Problem, Part Il. Silver Spring, MD: Naval Surface Weapons Center. 21 November 1975.
5. Mabey, W.R1; Tse, D.; Baraze, A.; Mill, T. "Photolysis of Nitroaromatics in Aquatic Systems. I. 2,4,6-Trinitrotoluene." Chemosphere, Vol. 12, No. 1, 1983, pp. 3-16.
6. Crowley, John, Iowa Army Ammunition Plant, Information Exchange Meeting, 27 September 1994.
7. Mahannah, J L. Survey of Generation and Management of Explosive-Laden Spent Carbon. Cambridge,MA: Arthur D. Little, Inc. November 1992. AD Little, Inc.
8. Hinshaw, Gary D.; Fanska, Cindy B.; Fiscus, Douglas E.; Sorensen, Scot A. Granular Activated Carbon(GAC) System Performance Capabilities and Optimization. Kansas City, MO: Midwest Research Institute,27 February 1987. MRI.
9. Andrews, Catherine C. Photooxidative Treatment of TNT Contaminated Wastewaters. Crane, IN: NavalWeapons Support Center. December 1979. ADA 084684.
10. Bowen, Richard C.; Balasco, Armand A.; Bryant, Michael; Cahill, Kevin; Marando, Michael. FinalFeasibility Study for Ground Water at Explosive Washout Lagoons (OU-3) at the Umatilla Depot Activity(UMDA). Aberdeen Proving Ground, MD 21010: US Army Environmental Center. 10 December 1993.USAEC.
11. Layne, William S.; Nicholson, Richard A.; Wahl, Richard M.; O'Brian, Patrick M. Ultraviolet-OzoneTreatment of Pink Water - A Pilot Plant Study. Middletown, Iowa: Mason & Hanger - Silas Mason Co., 0Inc. 15 September 1980. Mason & Hanger - Silas Mason Co., Inc.
12. Ho, Patience C. "Photooxidation of 2,4- Dinitrotoluene in Aqueous Solution in the Presence of HydrogenPeroxide." Environ. Sci. Technol.; Vol. 20, No. 3, 1986, pp. 260-267.
13. McCormick, N.G.; Peltonen, T.D.; Kaplan, A.M. Development of Design Parameters for an Explosive 0Contaminated Wastewater Treatment System. Crane, IN: Naval Weapons Support Cente. June 1985.AD-A159 416.
14. Noss, Charles I.; Chyrek, Ralph H. Tertiary Treatment of Effluent from Holston AAP Industrial LiquidWaste Treatment Facility IV. Ultraviolet Radiation and Hydrogen Peroxide Studies: TNT, RDX, HMX,TAX, and SEX. Frederick, MD: Fort Detrick. March 1984. AD-A141 135.
40 0

15. Roth, Milton; Murphy, Jr., Joseph M. Ultraviolet- Ozone and Ultraviolet-Oxidant Treatment of PinkWater. Dover, NJ: US Army Armament Research and Development Command, Large Caliber WeaponSystems Laboratory. November 1978. AD-E400 263.
16. DeBerry, David W.; Viehbeck Alfred; Meldrum, Dean. A Literature Survey: Basic Mechanisms ofExplosive Compounds in Wastewater. Aberdeen Proving Ground, MD: USATHAMA May 1984.AD-A141 703.
17. Lipczynska-Kochany, Eva. "Novel Method for a Photocatalytic Degradation of 4-Nitrophenol in0 Homogeneous Aqueous Solution." Environmental Technology; Vol. 12, 1991, pp. 87-92.
18. Jain, Kamlesh K.; Bryce, Armond J. "Feasibility of Munitions Wastewater Treatment by Adsorption-Oxidation." Carbon Adsorption Handbook. Edited by Paul N. Chesemisinoff and Fred Ellerbush. AnnArbor, MI: Ann Arbor Science Publisher, 1978, pp. 661-85.
19. Kulkarni, Ramchandra K. Pollutant Adsorbent Systems for 7NT, RDX, and HMX in Wastewater,Frederick, MD: US Army Medical Research and Development Command. October 1986. AD-Al 88 407.
20. Freeman, Donald J.; Colitti, Olin A. Removal of Explosives from LAP Wastewater (Pink Water) UsingSurfactant Technology. Dover, NJ: ARRADCOM, TSD. May 1982. AD Al 15086.
21. Simmons, Milagros S.; Zepp, Richard G. "Influence of Humic Substances on Photolysis ofNitroaromatic Compounds in Aqueous Systems." WaterRes.; Vol. 20, No. 7, 1986, pp. 899-904.
22. Hoffsonmmer, J.C.; Kaplan, L.A.; Glover, D.J.; Kubose, D.A.; Dickinson, C.; Goya, H.; Kayser, E.G.;Groves, C.L.; Sitzmann, MýE. Biodegradability of TNT: A Three-Year Pilot Plant Study. Silver Spring,MD: Naval Surface Weapons Center. 13 February 1978. AD A061 144.
23. McCormick, N.G.; Cornell, J.H.; Kaplan, A.M. "Biodegradation of hexahydro-l,3,5-Trinitro-1,3,5-Triazine." Applied and Environmental Microbiology; Vol. 42, No. 5, 1981, pp. 817-823.
24. Mondecar, M.; Bender, J.; Ross, J.; George, W.; Preslan, J. "Removal of 2,4,6-Trinitrotoluene fromContaminated Water with Microbial Mats." Applied Biotechnology for Site Remediation. Edited by RobertE. Hinchee, Daniel B. Anderson, and Gregory D. Sayles. Boca Raton, FL: Lewis Publishers, 1994, pp. 342-9.
25. Walker, John E.; Kaplan, David L. "Biological Degradation of Explosives and Chemical Agents."Biodegradation; Vol. 3, 1992, pp. 369-385.
26. Wade, Robert C. "Catalyzed Reductions of Organofunctional Groups With Sodium Borohydride." J.MoI. Catal.; Vol. 18, 1983, pp. 273-297.
27. Lamson, Davis W.; Ulrich, Peter; Hutchins, Robert 0. "Aromatic Denitration With Borohydride.Nucleophilic Displacement of Nitrite by Hydride." J. Org. Chem.; Vol. 38, No. 17, 1973, pp. 29 28 -29 3 0 .
28. Larson, Richard A.; Miller, Penney L.; Crowley, Thomas 0. "Borohydride Photoreduction ofNitroaromatic Compounds Related to Military Ordnance Constituents." Environ. ScL Technol.; Vol. 30,No. 4, 1996, pp. 1192-1197.
29. Webb, John D.; Blake, Daniel M.; Turchi, Craig C.; Magrini, Kimberly. "Kinetic and MechanisticOverview of TiO2-Photocatalyzed Oxidation Reactions in Aqueous Solutions." Solar Energy Mat.; Vol. 24,1991, pp. 584-93.
41
30. Fox, Marye Anne; Dulay, Maria T. "Heterogeneous Photocatalysis." Chem. Rev.; Vol. 93, 1993,pp. 341-357.
31. Prairie, Michael R.; Evans, Lindsey R.; Stange, Bertha M.; Martinez, Sheryl L. "An Investigation of theTiO 2 Photocatalysis for the Treatment of Water Contaminated with Metals and Organic Chemicals."Environ. ScL TechnoL; Vol. 27, 1993, pp. 1776-1782.
32. Vinodgopal, K.; Bedja, Idriss; Hotchandani, Surat; Kamat, Prashant V. "A Photocatalytic Approach forthe Reductive Decolorization of Textile Azo Dyes in Colloidal Semiconductor Suspensions." Langmuir,Vol. 10, 1994, pp. 1767-177 1.
33. Schmelling, D.C.; Gray, K.A. "Feasibility of Photocatalytic Degradation of TNT as a Single orIntegrated Treatment Process." Trace Metals in the Environment, Vol. 3, Photocatalytic Purification andTreatment of Water and Air, edited by David F. Ollis and H. Al-Ekabi. New York, NY: Elsevier, 1993,pp. 625-631.
34. Schmelling, Daniel C.; Gray, Kimberly A. "Photocatalytic Transformation and Mineralization of 2,4,6-Trinitrotoluene (TNT) in TiO2 Slurries." Water Res. Vol. 29, No. 12, 1995, pp. 2651-2662.
35. Schmelling, Daniel C.; Gray, Kimberly A. "Photocatalytic Transformations and Degradation of 2,4,6-Trinitrotoluene (TNT) in TiO2 Slurries." Crit. Issues Water Wastewater Treat., Proc. Natl. Conf. Environ.Eng. Edited by Joseph N. Ryan and Marc Edwards. New York, NY: American Society of Civil Engineers,1994, pp. 751-755.
36. Wang, Zhikai; Kutal, Charles. "Photocatalytic Mineralization of 2,4,6-Trinitrotoluene in AqueousSuspensions of Titanium Dioxide." Chemosphere ; Vol. 30, No. 6, (1995, pp. 1125-1136.
37. Diller, Ralf; Brandt, Matthias; Fornefett, Iris; Siebers, Ulrike; Balmemann, Deftef. "PhotocatalyticDegradation of Trinitrotoluene and Other Nitroaromatic Compounds." Chemosphere; Vol. 30, No. 12, 1995,pp. 2333-2341.
38. Augugliaro, Vincenzo; Palmisano, Leonardo; Schiavello, Mario; Sclafani, Antonino; Marchese,Leonardo; Martra, Gianmario; Miano, Fausto. "Photocatalytic Degradation of Nitrophenols in AqueousTitanium Dioxide Dispersion." Appl. Catal.; Vol. 69, No. 2, 1991, pp. 323-340.
39. Dieckmann, M.S.; Gray, K.A.; Kamat, P.V. "Photocatalyzed Degradation of Adsorbed NitrophenolicCompounds on Semiconductor Surfaces." Water Sci. Technol; Vol. 25, No. 3, 1992, pp. 277-279.
40. Turchi, Craig S. "Heterogeneous Photocatalytic Degradation of Organic Water Contaminants: Kineticsand Hydroxyl Radical Mechanisms," Ph.D. Thesis, Raleigh, NC: North Carolina State University, February1990.
41. Lund, Henning. "Cathodic Reduction of Nitro and Related Compounds," Organic Electrochemistry,edited by Henning Lund and Manuel Baizer. New York, NY: Marcel Dekker, Inc. 1991, pp. 401-432.
42. Hess, Thomas; Crawford, Ronald L.; Lewis, Thomas. "Combined Photocatalytic and BiologicalTreatment of Pink Water." Subcontract No. XCK-5-15163-01 Final Report. CITY, STATE: University ofIdaho, July 1996 (Included as Appendix A of this report).
42

7.0 Appendices
A. Report on Subcontract No. XCK-5-15163-01, "Combined Photocatalytic and Biological Treatmentof Pink Water," University of Idaho, Moscow, ID, July 1996.
FINAL REPORT0
SUBCONTRACT NO. XCK-5-15163-01
Combined Photocatalytic and Biological Treatment of Pinkwater
Principal InvestigatorThomas F. Hess, PhD
Department of Biological & Agricultural EngineeringUniversity of Idaho
Moscow, ID
Tom Lewis, PhD; Ron Crawford, PhD
Center for Hazardous Waste Research and RemediationUniversity of Idaho
Moscow, ID
Acknowledgment
Funding for this project was provided by the Strategic Environmental Research and Develop Program(SERDP).
A-1

2
Abstract
A recirculating batch, annular photoreactor in combination with cultures of the ligninolytic fungus,P. chrysosporium, was used to investigate degradation and ultimate mineralization of aqueoussolutions of 2,4,6-trinitrotoluene (TNT), a "pink water" constituent. The photocatalyticpretreatments of TNT were performed under anaerobic conditions with the addition of EDTA as areducing agent to promote TNT reduction. Follow-on biological treatment of the photoreactordegradation products was performed under aerobic conditions using mycelial preparations of P.chrysosporium. Radiotracer experiments showed up to 32 percent mineralization of the parent C-TNT, depending on length of phototreatment. Longer photocatalytic treatment of the TNT resultedin a greater extent of mineraliztion. An early reduction intermediate in the TNT degradationpathway was shown to be inhibitory to the fungal mineralization of the photoproducts, as shownby the radiotracer studies. The combined processes of TiO2 assisted photocatalysis and follow-onbiological mineralization have the potential for being an effective technology for the remediation ofpink water constituents.
INTRODUCTION
This report summarizes experimental work on Subcoritract No. XCK-5-15163-01 "CombinedPhotocatalytic and Biological Treatment of Pinkwater" related to photocatalysis and biologicaltreatment of 2,4,6-trinitrotoluene (TNT), a constituent of pinkwater.
METHODS AND MATERIALS
I. Photocatalytic Reactor System Description: All photocatalysis experiments for TNTdegradation were performed in a batch, recirculating annular photoreactor, similar in design toreactors used by NREL scientists in their research (Blake et al., 1995). A schematic of thephotocatalytic reactor system is shown in Figure 1. The reactor system consisted of a reservoirwith temperature-control bath, a magnetic-drive centrifugal pump, and an annular photoreactor.The three parts were connected with 3/8" corrugated flexible Teflon tubing.
Reservoir: The reservoir was a IL round-bottomed flask with three 24/40 ground glass-fittingsat the top and one 1/2" (OD) glass tube protruding from the bottom. One of the ground-glassfittings served as the return line from the annular reactor, one held a nitrogen sparging assembly,and the third held a sample-port/thermocouple assembly. The ground-glass fitting used ACE-THRED adapters for the inlet tube, gas sparger, and thermocouple.
Centrifugal Pump: The centrifugal pump was variable speed with magnetic drive and plasticimpeller. The pump had a maximum flow rate of 10 lpm providing a residence time ofapproximately 1.5 seconds per pass in the annular reactor.
Annular Reactor: The annular reactor design was similar in size to a reactor used by the groupat NREL in their research (Blake et al., 1995). The reactor consisted of six parts. Two identicalend pieces, machined out of Teflon, two glass pipes which constituted the inner and outer walls ofthe reactor, and two flow dispersion disks, also made out of Teflon. The two end pieces and twoglass tubes were held together by compression of the O-rings. The outer glass pipe wasconstructed from 54 mm standard-wall Pyrex tubing. Each pipe was 10-1/2" in length and theends lightly fire-polished. The inner glass pipe was constructed of 35 mm standard wall Pyrex orQuartz tubing 14" in length and lightly fire-polished. The choice of Pyrex or Quartz tubing wasdictated by the light source. A quartz tube is necessary only when using a UV (germicidal) lamp,since Pyrex is not transparent to UV light. The Pyrex sleeve was used with the near IUV(blacklight) lamp since Pyrex is transparent to these wavelengths.
3
The Teflon dispersion disks were used to prevent any "short-circuiting" of the reaction mixture andto guarantee a well-distributed flow through the reactor. The dispersion disks had an outerdiameter of 48 mm and an inner diameter of 35 mm. The inlet disk had 24, 2.25 mm diameter
* holes evenly distributed around the disk (on 150 centers) providing an evenly distributed streamflow. The outlet disk had 8, 3 mm diameter holes evenly distributed around the disk (on 45*centers). The disks were held by compression between the inner and outer glass tubes of thereactor.
Light Source: The reactor assembly was illuminated by placing a 1" diameter, 18" long low-pressure mercury arc lamp in the center of the annulus. The LTV lamp (General Electric 15WG15T8-BLB) emitted in a band between 300 nm and 400 run, with a maximum wavelength ofapproximately 346 nm.
II. Sampling method for the reactor: Solutions were mixed and stirred in the anaerobicchamber overnight prior to placement in the photoreactor. TNT, EDTA powder, andNa2EDTA-2H2 0 were all mixed and stirred thoroughly. The reactor system was assembled andchecked for any leaks by running water through it. TiO2 was added just before the reactor run.The light was allowed to warm up and the reaction samples were collected at periodic intervals oftime. A circulating bath was used to monitor any change in the reaction temperature (maintained at25* C) and a pH probe was used to check the drop in pH with reaction time.
In all the experiments, a standard procedure was followed for collecting the reactor samplesthrough the length of the photocatalytic reaction. All samples for HPLC analysis were collected induplicate. The samples for each time period were taken using a 5 ml-syringe out of which 2 ml ofthe sample was wasted, the next 2 ml collected in two different HPLC vials with the final 1 mlagain wasted. The samples were immediately taken for HPLC analysis avoiding instantaneousreaction within the vials leading to errors in analysis and compound identification.
M. Analytical techniques: The primary analytical techniques used in the experiments wereHigh Performance Liquid Chromatography (HPLC), Mass Spectrometry (MS), and thescintillation spectroscopy for the radiolabeled TNT experiments.
HPLC: The concentrations of TNT and its reduction products were determined by HPLC with aPhenomenex (Torrance, Calif.) Spherex 5-m C18 reverse-phase column (250 x 2 mm) and a 5 cmx 2 mm guard column. A Hewlett-Packard model 1090A instrument equipped with a diode arrayUV/VIS detector and a computerized data system was used for the analyses. The column was runwith a number of mobile phase programs based on the desired chromatographic separation ofdegradation intermediates. For example, the program employed early in the experimentation used10% acetonitrile and 90% 41M LiOH phosphate buffer (pH 4.0) for 2 min, and then theacetonitrile was increased to 70% over the next 15 min. The acetonitrile was then increased to100% over 1 min and maintained at that level for 2 min. The acetonitrile was then decreased backto 10% over 2 min. The solvent flow rate was 0.25 ml/min, and the column temperature was 42*C. Subsequent programs decreased the percent acetonitrile and increased the overall run length(see Conclusions and Discussion section). TNT and possible transformation products weredetected by use of the diode array UV/VIS detector, recording the A210 with continuous scanningof the absorption spectrum of each peak from 190 to 600 nm. Samples for HPLC were filteredthrough 0.2-m-pore-size syringe filters (diameter, 25 mm; Supor, Gelman Sciences, Ann Arbor,Mich.) before analysis by HPLC.
Mass Spectrometry: Mass spectrometry was performed with a Hewlett Packard model 1050HPLC with a 2.0 x 25 cm C 18 column (Spherex) and a 2.0 x 5 cm guard column (Phenomenex,Torrance, Calif.). Acetonitrile (A) and 15 mM ammonium acetate, pH 7.1, (B) were used as

4
0
solvents used as solvents with a flow rate of 0.3 ml/min. The gradient program was 99% B (0-5min) to 90% B (5-7 min) to 55% B (7-27 mrin, held 3 min), followed by return to startingconditions (32 min). Absorbance at 220 nm as well as scanning ion monitoring with a model5989A quadrupole mass spectrometer equipped with a model 59980B particle beam interfaceallowed detection of reduction compounds of interest. An injection volume of 50 P1 was used inorder to direct enough material to the mass spectrometer for these analyses.
IV. Sample holding for the HPLC measurements: Early in the experimentation it wasobserved that spontaneous reaction and precipitation of contents was occurring in HPLC samplevials when held overnight or under refrigeration. A procedure was developed where the HPLCsystem was coordinated with sampling such that samples were collected and analyzed within 30minutes. 0
V. Fungal growth media composition: Spores of P. chrysosporium were cultivated from3% malt extract, 0.3% yeast extract, 1.5% agar medium in tissue culture flasks incubated forapproximately 30 days. Suspensions of spores were made using sterile 0.2% Tween 80 andfiltered through sterile glass wool. Spore suspensions were stored at 4* C. Composition of oneliter of media for cultivating the mycelia of P. chrysosporium (modified from Bonnarme et al., 01991) was the following:
Mineral salts - 100 mlMn (0.1 M) solution - 1.8 mlGlucose - 50 mlDMS (pH 4.55) - 10 mlDiammonia Tartarate - 5 ml. 0
These ingredients were added to 830 ml of sterile water and inoculated using 3 ml of sporesuspension. The inoculated solution was placed in a shake flask and maintained in an incubator at150 rpm at 37* C.
VI. Fungal growth methods: A 500-ml portion of the above mentioned growth media wasplaced in a 2L shake flask and 1.5 ml of the fungal culture was aseptically added. The flask 0contents, with sterile cotton stopper, were maintained in an incubator at 37' C and 150 rpm. Theculture flasks were ready to be used as mycelia inoculatants 2-3 days after placement in theincubator.
VII. Fungal inoculation into photoreactor products: Fungal cultures retrieved from theincubator were allowed to cool for 30 min before inoculation into the photodegradation productssolutions. Equal numbers of fungal mycelial masses were added to each flask of photoreactordegradation products using a sterile pipette in a laminar flow hood. Inoculation occurredimmediately after opening the photoreactor, thus providing little time for any dissolved nitrogen toexchange to the atmosphere.
VIII. 14 C experiments- 40 CFR 796.310 Procedure: This experimental procedure wasused to quantitate 14C-CO 2 evolution and a 14C balance during mineralization of 14C-TNT by P.chrysosporium. All fungal cultures were made according to methods described above.
The CO2 evolution shake flask apparatus consisted of 1 ml of 1 N NaOH in an open container(CO2 trap) suspended over 100 ml of culture medium in a 250 ml Erlenmeyer flask. The NaOHcontainer was a 10 ml glass tube suspended by means of a hole in the rubber stopper with the glass •support rod attached to the container. The NaOH (with captured 14CO2) was removed from thetube at least daily and placed in scintillation vial for radioactivity counting. The tube was thenrinsed twice with 2 ml of deionized water and refilled with fresh base. The wash solution was alsotransferred to scintillation vials and 15 ml of the scintillation cocktail was added to these samples.All samples were quenched in the dark overnight before being counted. The fungal cultures were

5
sparged with 10 psi oxygen (for 1-2 minutes) at each time period after the samples were collected.All flasks were maintained at 37* C in an incubator between sampling periods.
In order to perform the final carbon balance on the inoculated photoproduct solutions, the flask0 contents were first filtered through a glass fritted filter. One ml each of the samples before and
after filtration were collected for radioactivity counts. The filtrate volume was noted in each caseand the remaining filtrate was then collected in a scintillation vial which was used for the fractioncollector for HPLC analysis. Duplicate wash samples were then collected for the counts afterwashes with 10 ml of M9 salts, 10 ml of cold trichloroacetic acid (TCA), and 10 ml ofethanol/ether mixture (1:1). Ten ml of hot TCA (brought to 700 C using a water bath) was then
* used for washing in a similar manner. The cells were then digested with 5 ml HCl and maintainedat 50* C oven in centrifuge tubes. The digested cells were centrifuged at 7000 rpm at 4° C for 15min and then decanted and centrifuged again. The final step involved the use of the tissuesolubilizer and was repeated until all brownish color was removed from the fungal mycelium.
IX. Chemicals: Standards of 2,4-diamino-6-nitrotoluene (DANT) and 4-amino-2,6-0 dinitrotoluene (ADNT) were purchased from SRI International (Menlo Park, Calif.). 2,4,6-
trinitrotoluene (TNT) was prepared from 2,4-dinitrotoluene (Eastman Organic Chemicals,Rochester, N.Y.) by nitration according to the procedure of Heertjes (1958)with slightmodification. [Phenyl-U- 14 C] labeled TNT was prepared by two-step nitration from toluene and
[ring-UL- 14 C]toluene (Sigma Chemical Company, St. Louis, Mo.). The low-temperature0, nitration was performed in acetonitrile solution using silver nitrate and fluorosulfonic acid,0 followed by a high temperature step with mixed acids (nitric acid-sulfuric acid-sulfur trioxide)
under optimized time and temperature conditions. The specific activity was 58.9 Ci/mmol and theradiochemical purity was >99% as verified by HPLC. All 14C-TNT and unlabeled TNT solutionswere made up and stirred in an anaerobic atmosphere overnight and added to the photoreactor thenext day.
X. 14C - fractionation from HPLC: The system used was a Beckman model 338 with1 10B pumps, 406 analog interface with pump control, 507 autosampler with a 100-1 sample loop,and a 167 detector with data analysis and system control provided by an IBM PS/2 with SystemGold software (Beckman Instruments, Inc., San Ramon, Calif.). This method was also used witha Hewlett Packard model 1090 equipped with a diode-array detector and ChemStation software
* (Hewlett Packard Co., Avondale, Penn.). Radioactivity in the eluent fractions was quantified bycollecting fractions on a Frac 100 fraction collector (Pharmacia, Uppsala, Sweden) loaded withvials containing 10 ml of Bio Safe II scintillation cocktail (Research Products International, MountProspect, Ill.), mixing, and counting in a Beckman LS 7000 scintillation counter. Disintegrationsper minute (dpm) were calculated from counts per minute using an efficiency correction curvemade by counting a set of quenched standards and plotting efficiency versus H numbers
* (Beckman). In cases where a Packard scintillation counter was used, this curve was generated bycounting a different set of standards and plotting efficiency versus SIS numbers.
RESULTS
I. ANALYTICAL METHODOLOGY DEVELOPMENT
Three experiments were conducted for analytical methodology development and achievement ofbaseline conditions for photocatalytic degradation of TNT similar to NREL experimentation.Experiments 1 and 2 tested two HPLC mobile phase systems while experiment 3 tested TNTphotocatalysis under anaerobic conditions.
6
Experiment 1 - The intent of this experiment was to test the experimental apparatus and comparetwo HPLC analysis methodologies, a methanol-water solvent system and an acetonitrile solventsystem. Analyses were carried out on a HP-1050 HPLC system with a 25 cm x 2 mm SpherexC18 column (Phenomenex) with a 5 cm x 2 mm guard column.
A one-liter quantity of 100 ppm TNT solution was treated in the photoreactor using anaerobic 0conditions (N2 purge) and in the presence of 0.3 g TiO2. Reactor startup and sampling wasidentical to the methodology outlined in the NREL Six Month Progress Report (Blake et al.,1995). Initial solution pH was 6.4 and initial temperature was 29° C. Approximately 10 minutesafter lamp ignition and startup of the reactor, a slight reddish-brown color to the reactor contentswas noted, similar to previous NREL results. Sampling continued, as outlined in the NRELreport, for five hours. Final solution pH was 4.95 and final temperature was 27° C. 0
Analyses of the samples were conducted using two different solvent systems, a methanol-watersolvent method (NREL method) and an acetonitrile-buffer solvent method (ACN method).Representative chromatograms from the NREL and ACN methods are shown in Figures 2 and 3,respectively. Both methods used a Spherex C18 column and 7 [11 injection volumes. As shownby the enclosed chromatograms of both methods, the separation of reaction products was superior 0with the acetonitrile solvent system.
Overall TNT degradation in this first experiment was similar to that seen in NREL experiments,approximately 81 percent. (Based on peak areas from representative chromatograms, data notshown). Formation of reaction intermediates occurred, however mass spectrometry on thecompounds was successful in identifying only one of the reduction compounds, an amino-nitrotoluene. The spectral analyses of two of the intermediates are shown in Figures 4 and 5.Both of these compounds were identified as amino-dinitrotoluene isomers with a mw of 197. Aninjection volume of 50 pl was used in order to direct enough material to the mass spectrometer forthese analyses. Even with such a high injection volume, other intermediates, at retention times of2.63 and 29.27 minutes, could not be identified due to low recovery amounts sent to the particlebeam.
Experiment 2. This experiment was conducted to quantitate TNT degradation and intermediateproduction. The HPLC analyses were done with a HP 1090 system, a Spherex C18 column and asolvent delivery methodology specific for TNT and amino-nitrotoluene quantitation (Table 1). TheHPLC method in Table 1 was used for the remainder of experimentation on the projects with onlyminor changes depending on run length and type of column used.
Initial and operating conditions for the experiment were similar to those of experiment 1. Samplingwas conducted for five hours during which the reactor contents remained at 23.5* C. Initial andfinal reaction pH were 6.85 and 4.42, respectively. Similar to the previous experiment, a reddish-brown product was formed that remained in solution at the end of the experiment after five hoursof phototreatment.
Overall TNT degradation was approximately 65 percent as shown in Figure 6. Four intermediateswere produced, only one of which was positively identified as 4-amino, 2,6-dinitrotoluene(ADNT). The other three intermediates were not identified, similar to the results in experiment 1.
Experiment 3 - The intent of this experiment was to create a totally anaerobic environment for thephotocatalytic reaction using a nitrogen gas purge and quenching of hydroxyl formation from thevalence band hole reaction using bicarbonate ion. A one-liter quantity of 100 ppm TNT solutionwas treated in the photoreactor in the presence of 0.3 g TiO2, phosphate buffer at pH 7 and theaddition of enough Na2CO 3 to produce 1 mM HCO3- at pH 7. Reactor startup and sampling wasidentical to the methodology outlined in the NREL Six Month Progress Report (Blake et al.,

7
1995). Initial solution pH was 7.04 and initial temperature was 270 C. After lamp ignition andstartup of the reactor, a pink color of the reactor contents was noted, similar to previousExperiments 1 and 2 results, only more intense. Sampling continued as per the previousexperiments except for a total of ten hours. Final solution pH was 6.98 and final temperature was
* 24* C.
Overall TNT destruction in this third experiment was approximately 70 percent after ten hours oftreatment, as shown in Figure 7. Four reaction intermediates were formed and quantified one ofwhich, eluting near TNT, was identified as ADNT (similar to Experiment 2). The remainingintermediates were not identified from this analysis. A chromatogram from HPLC analysis of thelast sample of experiment 3 (data which went to form Figure 7) is shown in Figure 8. Incomparison to a chromatogram from the last sample of experiment 2 (not buffered, no hydroxylradical quench) the experiment 3 chromatogram shows additional intermediate compoundproduction during photocatalysis. These differences were hypothesized to be do either to theanaerobic, buffered environment and/or the difference in reaction times between the twoexperiments, 5 and 10 hours for experiments 2 and 3, respectively.
II. PHOTOCATALYSIS OF TNT AND AMINO-DINITROTOLUENE (ADNT)AND QUALITATIVE PHOTOCATALYTIC PRODUCT IDENTIFICATIONEXPERIMENTS
Eight experiments were conducted in this section of research devoted to either quantitatingphotocatalysis of TNT and ADNT or qualitative breakdown product identification. Experiments 4,5, 10, 11 and 16 were conducted on photocatalytic TNT destruction in the presence ofethylenediaminetetraacetic acid (EDTA) as a catalyst hole scavenger. Experiments 6 and 7 wereconducted on photocatalytic ADNT destruction to imitate potential precedent biological degradationproducts that could be sent to a photocatalytic reactor in a combined biological/photocatalyticdegradation sequence. Experiment 17 was a repeat of experiments 10 and 11 examining photo-destruction products from a longer ten-hour photocatalytic treatment:
TNT Photocatalysis Degradation Product Identification Experiments
Experiment 4 - The intent of this experiment was to create a totally anaerobic environment for thephotocatalytic reaction requiring nitrogen gas purge and quenching of hydroxyl formation from thevalence band hole reaction. A one-liter quantity of 100 ppm TNT solution was treated in thephotoreactor in the presence of 0.3 g TiO2, phosphate buffer at pH 7, 107 mg Na 2CO 3 to produce1 mM HCO3- at pH 7 and 0.72 mM disodium EDTA. Reactor startup and sampling was identicalto the methodology outlined in the NREL Six Month Progress Report (Blake et al., 1995). Initialsolution pH was 7.26 and initial temperature was approximately 240 C. After lamp ignition andstartup of the reactor, a slight orange coior of the reactor contents was noted. Sampling continuedas per the previous experiments for a total of five hours. Final solution pH was 7.28 and finaltemperature was approximately 23* C.
Overall TNT destruction in this third experiment was approximately 96 percent after five hours of* treatment, as shown in Figure 9. Four reaction intermediates were formed and quantified. Two of
the intermediates, eluting at approximately 20 and 27 minutes, were identified as 4-amino,2,6-dinitrotoluene (ADNT) and 2,2',6,6'-tetranitro-4,4'azoxytoluene (TNAzT), respectively, based onUV-vis spectral analysis from the diode array. Spectral analyses and library match confirmationare shown in Figures 10 and 11. The remaining intermediates were not identified from thisanalysis, however spectral analysis of the intermediate eluting at 14.6 minutes was similar toADNT and the compound eluting at 3.5 minutes appeared to be a mixture of compounds.

8
Experiment 5 - Experiment 5 was to designed observe the "fast" anaerobic photocatalyticreaction at uncontrolled pH as compared to experiment 4, at pH 7. A one-liter quantity of 100 ppmTNT solution was treated in the photoreactor in the presence of 0.3 g TiO2 and 0.72 mM disodiumEDTA. Reactor startup and sampling was identical to the methodology outlined in the NREL SixMonth Progress Report (Blake et al., 1995). Initial solution pH was 5.15 and initial temperaturewas approximately 22* C. Sampling continued as per the previous experiments for a total of fivehours. Final solution pH was 8.02 and final temperature was approximately 210 C. Reactorcontents ultimately turned to a brown color, but at a slower rate than coloration during experiment4.
Overall TNT destruction in this experiment was approximately 97 percent after five hours oftreatment, as shown in Figure 12. At this pH regime, 90 percent TNT destruction was seen within30 minutes of lamp ignition. Similar to experiment 4, four major reaction intermediates wereformed and quantified, also shown in Figure 12. Two of the intermediates were identified, similarto experiment 4, as 4-amino,2,6-dinitrotoluene (ADNT) and 2,2',6,6'-tetranitro-4,4'azoxytoluene(TNAzT), eluting at 20 and 27 minutes, respectively. Spectral matches were conclusive for ADNTand inconclusive for TNAzT, due to noise. Additional intermediates formed, eluting near thepreviously identified TNAzT peak at 27.16 min., were lumped together and listed as compoundswith elution times >25 minutes (Figures 12 and 13). These compounds were thought to be azoxy-isomers, although their identification was not confirmed. The remaining intermediates were notidentified from this analysis, however spectral analysis of the intermediate eluting at 14.6 minuteswas similar to ADNT and the compound eluting at 3.5 minutes appeared to be a mixture ofcompounds. Additionally, the compounds eluting at 2.37 and 3.5 min. may have been EDTA andits reduction product, but were not confirmed.
Experiment 10. Because the acid-form of EDTA was used in experiment 9, pH values werelower than when using disodium EDTA. This presumably avoided the formation of azoxycompounds. Experiment 10 was a repeat of experiment 9 to further quantify the effects of acid-form EDTA use. A one-liter quantity of 100 ppm TNT solution was treated in the photoreactor inthe presence of 0.3 g TiO2 and 0.4 mM acid-form EDTA and 0.43 mM disodium EDTA. Reactorstartup and sampling was identical to the methodology outlined in the NREL Six Month ProgressReport (Blake et al., 1995). Initial solution pH was 3.2 and initial temperature was approximately27' C. Sampling continued as per the previous experiments for a total of five hours. Finalsolution pH was 6.7 and final temperature was approximately 26' C.
Results of experiment 10 are shown in Figure 14 Upon lamp ignition, TNT disappeared at a fastrate with no detectable concentration after 60 minutes. Both ADNT and 2,4-diamono-6-nitrotoluene (DANT) were detected as TNT degradation products, in addition to TNAzT. Theazoxytoluene did disappear by the end of the experiment, while the amino- compounds continuedto increase in peak size.
Problems with this experiment indicated that there may have been compounds precipitating out ofsample solution prior to analysis. Problems also arose with one of the HPLCs used for analysis.
Experiment 11. Experiment 11 was a repeat of experiment 10, to quantify the effects of acid-form EDTA use and correct sample holding time that gave problems in experiment 10. A one-literquantity of 100 ppm TNT solution was treated in the photoreactor in the presence of 0.3 g TiO2and 0.4 mM acid-form EDTA and 0.43 mM disodium EDTA. Reactor startup and sampling wasidentical to the methodology outlined in the NREL Six Month Progress Report (Blake et al.,1995). Initial solution pH was 3.05 and initial temperature was approximately 22.5* C. Samplingcontinued as per the previous experiments for a total of five hours. Final solution pH was 6.56and final temperature was not measured, but assumed equal to initial temperature ± 20.

90
Results of experiment 11 are shown in Figure 15. Upon lamp ignition, TNT disappeared at a fastrate with no detectable concentration after 40 minutes. Both ADNT and DANT were detected asTNT degradation products, in addition to their precursor, 4-hydroxylamino-2,6-dinitrotoluene(HADNT). Two unidentified products were formed with retention times of 4.91 and 5.46
* minutes. No azoxytoluenes were identified in this experiment. Both ADNT and DANT wereconfirmed by HPLC spectral analyses. The HADNT was confirmed by HPLC and mass spectralanalysis (Figures 16 and 17).
Experiment 16 - This experiment was conducted similar to experiments 10 and 11, except witha ten-hour duration. A one-liter quantity of 100 ppm TNT solution was treated in the photoreactor
* in the presence of 0.3 g TiO2 and 0.4 mM acid-form EDTA and 0.43 mM disodium EDTA.Reactor startup and sampling was identical to the methodology outlined in the NREL Six MonthProgress Report (Blake et al., 1995). Initial solution pH was 3.30 and initial temperature wasapproximately 16.20 C rising to a constant 250 C after one hour of treatment. Final solution pHwas 6.92. Results of the experiment are shown in Figure 18, with an ultimate TNT destruction ofgreater than 95 percent.
ADNT Photocatalytic Degradation Experiments
Experiment 6 - The intent of this experiment was to observe the photodegradation of a "model"biological product of TNT degradation, 4-amino-2,6-dinitrotoluene (ADNT). A one-liter quantityof 0.44mM ADNT solution was treated in the photoreactor in the presence of 0.3 g TiO2 and 0.72mM disodium EDTA. Reactor startup and sampling was identical to the methodology outlined inthe NREL Six Month Progress Report (Blake et al., 1995). Initial solution pH was 4.70 and initialtemperature was approximately 25* C. Sampling continued as per the previous experiments for atotal of five hours. Final solution pH was 8.07 and final temperature was approximately 25* C.Reactor contents turned to a light brown color after approximately 2 hours of reaction time.
Based on the results shown Figure 19, ADNT was degraded approximately 80 percent in fivehours. Two major degradation products appeared, one of which was identified as DANT; theother was not identified. Although not positively confirmed, the suspected EDTA chromatographicpeak declined throughout the experiment similar to that of ADNT, as in the previous experimentswith TNT.
Experiment 7 - This experiment was a repeat of experiment 6 using similar sampling andanalytical procedures. A 0.44mM ADNT solution was treated in the photoreactor in the presenceof 0.3 g TiO2 and 0.72 mM disodium EDTA. Initial pH was 4.51 and final pH was 7.76. Initialreactor temperature was approximately 290 C dropping to a constant 22* C after one hour ofreaction time. The results of this experiment are shown in Figure 20. Based on results in thefigure, approximately 88 percent of the original ADNT was degraded in five hours. Theunidentified degradation product (retention time of 17.04. min) from experiment 6 did not appear inthis experiment.
Partial Anaerobic Conditions Experiment
Experiment 17- The final experiment under this section was conducted under partial anaerobicconditions. The preparation of the initial TNT solution was not done under anaerobic conditions asin all previous experiments but rather in natural atmospheric conditions. In addition, theexperiment was not conducted with a continuous nitrogen gas purge, but rather, nitrogen waspurged initially into the reactor, the reactor was sealed and then the experiment was run withoutfurther attempts at keeping the contents anaerobic. This kind of scenario was thought to betterimitate true treatment process conditions and would result in overall cost savings by avoiding muchof the gas purge. A 0.44 mM TNT solution was treated in the photoreactor in the presence of 0.3g TiO2 and 0.72 mM disodium EDTA. Initial and ending solution pH was 3.40 and 5.59,
10
respectively and the reactor contents were held at 25* C throughout the experiment. As can be seenin Figure 21, TNT was degraded to greater than 95 percent in 60 minutes with appearance of fivephoto-treatment products, two unidentified and the remaining identified as ADNT, DANT andTNAzT. The azoxytoluene did disappear with time, similar to experiment 10.
III. PHOTOCATALYTIC DEGRADATION MECHANISM
Three experiments in this section of experimentation were intended to elucidate the photocatalyticdegradation mechanism similar to procedures of Glaze et al. (1993). Experiments 8 and 13 usedtetranitromethane (TNM) and periodate, respectively, as electron scavengers. Experiment 14 usedmethanol as a hydroxyl radical quencher.
Experiment 8 - The intent of this experiment was to identify the mechanism of TNT degradation.Because tetranitromethane (TNM) competes in the photocatalytic reaction for electrons, it washypothesized that its addition would effectively stop reductive TNT degradation. Once the TNMwas exhausted (completely reduced), the TNT would then reductively react as in previousexperiments. A one-liter quantity of 100 ppm TNT solution was treated in the photoreactor in thepresence of 0.3 g TiO2, 0.72 mM disodium EDTA and 5.1 mM TNM. Reactor startup andsampling was identical to the methodology outlined in the NREL Six Month Progress Report(Blake et al., 1995). Initial solution pH was 4.97 and initial temperature was approximately 190 C.The pH dropped to 3.3 during the first 30 minutes of the experiment and then increased toexperiment's end. Sampling continued as per the previous experiments for a total of five hours.Final solution pH was 4.76 and final temperature was approximately 20' C. Reactor contentsinitially were green, due to the TNM, but ultimately turned to a brown color, similar to previousanaerobic experiments.
TNT degradation was initially slowed in this experiment, presumably due to the presence of TNM(see Figure 22). Final TNT degradation amounted to only 75 percent, considerably less than the>95 percent as in previous experiments 10 and 11 without TNM. None of the major reductionproducts 4-hydroxylamino-2,6-dinitrotoluene (HADNT), 4-amino,2,6-dinitrotoluene (ADNT) nor2,4-diamino-6-nitrotoluene (DANT) were found on the chromatograms. Neither was 2,2',6,6'-tetranitro-4,4'azoxytoluene (TNAzT) found. Two unidentified products were formed withretention times of 4.91 and 5.46 minutes. While not conclusively identified in the chromatograms,TNM was thought to be one of the compounds that disappeared at 15 minutes of treatment (HPLCretention time of 18.7 or 28.5 minutes). As seen in Figure 22, TNT did not appreciably degradeuntil after the 15 minute sample, possibly indicating that TNM did successfully compete forelectrons, effectively stopping the TNT reduction reaction. The absence of typical TNT reductionproducts also leads to the hypothesis that TNT did not degrade reductively.
Experiment 13 - The intent of this experiment was to help identify the mechanism of TNTdegradation. Because periodate competes in the reaction for electrons, it was thought that itsaddition would effectively stop reductive TNT degradation. A one-liter quantity of 100 ppm TNTsolution was treated in the photoreactor in the presence of 0.3 g TiC)2, 0.72 mM disodium EDTAand 26.4 mM periodate (sodium form). Reactor startup and sampling was identical to themethodology outlined in the NREL Six Month Progress Report (Blake et al., 1995). Initialsolution pH was 4.55 and initial temperature was approximately 200 C. Intermediate pH was notavailable due to problems with the reactor pH probe. Sampling continued as per the previousexperiments for a total of five hours. Final solution pH was 8.90 and final temperature wasapproximately 22* C. Reactor contents initially were clear and remained so, unlike previousanaerobic experiments without an electron scavenger that turned a reddish-brown color during thecourse of the experiment.

11
Surprisingly, TNT disappearance was rapid, with TNT concentration dropping to zero by the180minute sample (Figure 23). No reduction products, however, either monoamino-nitrotoluene,diamino-nitrotoluene or azoxy-toluenes were detected throughout the experiment.
* Experiment 14. Experiment 14 was designed to quench any hydroxyl radical formation usingmethanol in a methanol:TNT molar ratio of 70:1. Experimental conditions were similar toexperiment 11, using 0.44 mmol TNT, 0.4 mmol Na2EDTA-H20 and 0.4 mmol acid form EDTAwith the addition of 30.8 mmol methanol. Beginning pH was 3.08 and ending pH was 6.20.Temperature was held constant at 15.5± 2.5 *C. Results are shown in Figures 24 and 25. Fromthe chromatogram in Figure 25, it can be seen that the results are similar to the experiment without
*0 methanol (experiment 11) with formation of ADNT and DANT and no azoxy- compounds.
IV. COMBINED PHOTOCATALYTIC AND BIOLOGICAL DEGRADATIONEXPERIMENTS
* The combined photocatalytic and biological degradation experiments comprised i) three preliminaryexperiments to identify a likely biological treatment organism and qualitative aspects ofphotoreactor treatment product degradation and ii) two large quantitative experiments using 14C-TNT in a precendent photocatalytic degradation step with follow-on biological mineralization of thephotodegradation products. The 14C-radiotracer experiments allowed quatitation of ultimate TNTmineralization in addition to an overall carbon balance in the system.
Biological Experiments 1 and 2. Based on the assumption that reaction intermediates fromthe above photocatalytic reduction degradation experiment were possibly large dimers or polymericcompounds, it was decided to use Phanerochaete chrysosporium as a likely biological agent forfollow-on photoreactor product degradation. Both experiments were conducted as simply presenceor absence of biological activity as seen by decoloration of the compounds.
Fresh hyphae, harvested from Phanerochaete previously grown up on a glucose/dimethyl succinicacid media (see Materials and Methods for fungal growth media and techniques descriptions), wereadded to varying amounts of the leftover fluid from experiment 3. Biological experiment 1 used aratio of hyphae:fluid as 5:1, on a volume to volume basis. The fluid was decolored, or bleachedwhite (the TiO2 showed white) within 3 days. The second biological experiment used a
* hyphae:fluid ratio of 1:5. A color change from reddish-brown to light brown was observed at 3days with no further decoloration up to 10 days. No analyses of the Phanerochaete-amended fluidwas done at this time, although it is possible that the first biological experiment was successful indegrading the polymeric materials left from anaerobic chemical photocatalysis.
Biological Experiment 3 - Phanerochaete chrysosporium was inoculated into varyingconcentrations of the final, unfiltered products from experiment 5. Aliquots containing 0, 20, 40,60, 70 and 83 percent photo-products were made, inoculated with fungal hyphae and allowed toreact. Samples were withdrawn at three day intervals and analyzed for breakdown products fromTNT degradation. Small concentrations of 4-amino-2,6-dinitrotoluene (ADNT) and 2,4-diamino-nitrotoluene (DANT) were detected in time 0 samples from higher photo-product concentrationaliquots with their complete disappearance three days later. Identification of possible azoxy-compounds was not made during these experiments as well as inconclusive identification of otherextraneous chromatographic peaks. Because the photo-products from experiment 5 wererefrigerated, it was thought they may have precipitated out of solution prior to the start of thisbiological experiment. The fungal inoculants did, however, appear to grow, increasing in size,and were not affected by the EDTA nor the TiO2 in the reactor effluent. Peroxidase may have beenexpressed by the organisms, indicative of their brown color at approximately three days growthtime.

12
Experiment 9 - The intent of this experiment was to quantitate the carbon fractions incorporatedinto TNT breakdown products for use in follow-on biological experiments. A one-liter quantity of98 ppm TNT solution (14C=28,600,00 dpm) was treated in the photoreactor in the presence of 0.3g TiO2 and 0.4 mM acid-form EDTA and 0.43 mM disodium EDTA. Reactor startup was identicalto the methodology outlined in the NREL Six Month Progress Report (Blake et al., 1995) butsampling was limited to initial and final samples only. The experiment was run for a total of 5.5hours. Temperature and pH profiles were not taken to avoid undue radioactive contamination, butassumed similar to previous anaerobic experiments.
Based on differences between initial and final samples, the overall 14C balance accounted for 94percent of total radiolabeled TNT in solution (Table 3, difference between original 28,592,000dpm applied and 26,882,712 dpm recovered). Table 3 shows relative minor amounts ofradioactivity associated with products 1) adsorbed on reactor glass (2073 dpm/ml removed in areactor rinse); 2) presumed 14C-C0 2 in carbosorb (945 dpm/ml); and 3) a nonquantitative amount(volume of sample unknown due to a simple "wipe" test) in the solids from the reactor (26677 dpmfrom inner tube and 21714 dpm from outer tube). Figure 26 shows the relative amounts ofradioactivity associated with each of the TNT breakdown products overlain with identifiedproducts from the chromatogram. Radioactivity was associated with TNT, ADNT and DANT inaddition to two other peaks thought to be diamino-nitrotoluene isomers. It is interesting to notethat no detectable amounts of azoxy- compounds were formed in this experiment, presumably dueto the low pH arising from use of acid-form EDTA. Additional loss of radioactivity waspresumably due to compounds retained by filtration as shown by information in Table 3 Fifteen to16 percent of final reactor contents were lost on filtration depending on filter type, Teflon vs.cellulose acetate. Additionally, between 7 and 11 percent of radioactivity was lost upon filtrationdue to either adsorption of soluble material to the filter or adsorption of material to TiO2 and lossupon filtration, respectively.
Experiment 12. Experiment 12 used reactor contents from experiment 9, photocatalysis of 14C-TNT. The experiment followed protocol similar to that of 40 CFR 796.310 Aerobic AquaticBiodegradation Shake Flask Protocol. Replicate 50 ml quantities of mixed reactor contents fromphotocatalysis of 14C-TNT were inoculated with Phanerochaete chrysosporium on 10/9/95 andincubated on a shake table. The experiment used one control and three concentrations of anexogenous nitrogen source, 0 mM NH4, 0.25 mM NH4, and 2.5 mM NH4 . Removal andcounting of the base solution contained within the flasks was done every two to three days for the21-day experiment, to quantitate the 14C-C0 2 evolved. Previous preliminary results from theexperiment showed that radioactive counts occurred within the first two days, presumably due toaerobic, biodegradative attack of the photocatalysis byproducts by the Phanerochaete. Furtherresults showed varying amounts of ultimate 14C-CO2 production (Figure 27), depending onsupplemental NH4 added. Previous research has shown that addition of the exogenous nitrogenwas necessary for expression of the peroxidase enzyme in Phanerochaere, although that was notthe case in this study, presumably enough nitrogen was supplied by the degradation products. Amass balance on 14C within the system, based on 1) evolved 14C-CO 2, 2) 14C bound to fungalhyphae and 3) MeCN extracted 14C from the TiO2 solids showed only 60-70 percent recovery oforiginal added radioactivity (Table 4).
The decline in soluble radioactive compounds with time is shown in Figure 28. Presumably, thephotocatalysis products contained within the reactor fluid either sorbed to the TiO2 solids withinthe matrix or the glass of the storage flask or a spontaneous reaction between molecular oxygenand amino- compounds occurred.
Further 14C analyses of the previous reactor contents before and after degradation byPhanaerochaete is shown in Figure 29. The top graph shows photocatalytic byproducts prior tobiological treatment for qualitative comparison. The first three sharp peaks represent reduction

13
products, only the last of which was identified as diamino-nitrotoluene (DANT). The bottom twographs show analysis of extracts of the fungal hyphae from experimental treatments of the funguswith 0.25 mM NH 4 or zero NH 4. The important feature of these graphs is the presence of theDANT peak with the 0.25 mM NH 4 and the absence of the peak with no NH4 added. ExogenousN-4 was previously thought necessary for fungal metabolism of xenobiotic compounds.
Experiment 15. Experiment 15 was a repeat of the previous experiment 9, photocatalysis of14C-TNT and experiment 12, treatment of photocatalytic TNT breakdown products usingPhanerochaete chrysosporium. The photocatalytic portion of the experiment was identical toprevious experiment 9. The biological portion of the experiment followed protocol similar to thatof 40 CFR 796.310 Aerobic Aquatic Biodegradation Shake Flask Protocol (1992). Replicate 50ml quantities of mixed reactor contents from photocatalysis of 14C-TNT at time 2 h and 6 h and inaddition to a flask with 100 mg/l 14C-TNT (no photocatalytic treatment) were inoculated withPhanerochaete chrysosporium and incubated on a shake table. An abiotic control was also run onthe reactor contents. Removal and counting of the base solution contained within the flasks wasdone every two days for the 27 day experiment, to quantitate the 14C-C0 2 evolved. Final resultsfrom the experiment showing accumulated percent 14C-C0 2 released are presented in Figure 30.Ultimately more 14C-CO2 was released from the phocatalytic treatment for six hours than from thattreated for two hours. This probably indicates that either longer reductive photocatalytic treatmentis necessary for follow-on oxidative biological treatment or the destruction of a biologically toxicintermediate occurs after two or more hours of photocatalytic treatment. Additionally, thecomparison of liquid and evolved 14C-CO2 counts for the 2 hr, 6 hr and TNT flasks is shown inFigure 31.
The overall carbon mass balance is shown in Table 5. All recoveries of radio-tracer were good andin all cases greater than 92 percent. As can be seen in the lower portion of Table 5, almost twice asmuch radio-labeled material was associated with the biomass of the fungi (numbers in the HC1digest and tissue solubilizer rows) in the 2 hr treatment as with the biomass in the six hourtreatment. This data agreed with the hypothesis that longer photocatalytic treatment produced morepolar products with less tendency to adsorb.
Chromatograms showing TNT reduction products, before and after biological treatment, withoverlain radioactive counts for the 2 h and 6 h sample are shown in Figures 32 and 33. Figure 33also shows a chromatogram and overlain radioactive counts for the uninoculated control.Distribution of photocatalytic products in both the 2 and 6 hour treatments were similar with theexception of two peaks between 20 and 25 minute retention being at higher concentration in the 2hr treatment. This was probably the toxic fraction of photoproducts that inhibited mineralization inthe 2 hr samples. Distribution of radiolabel was similar in both the 2 and 6 hr treatments afterfungal treatment.
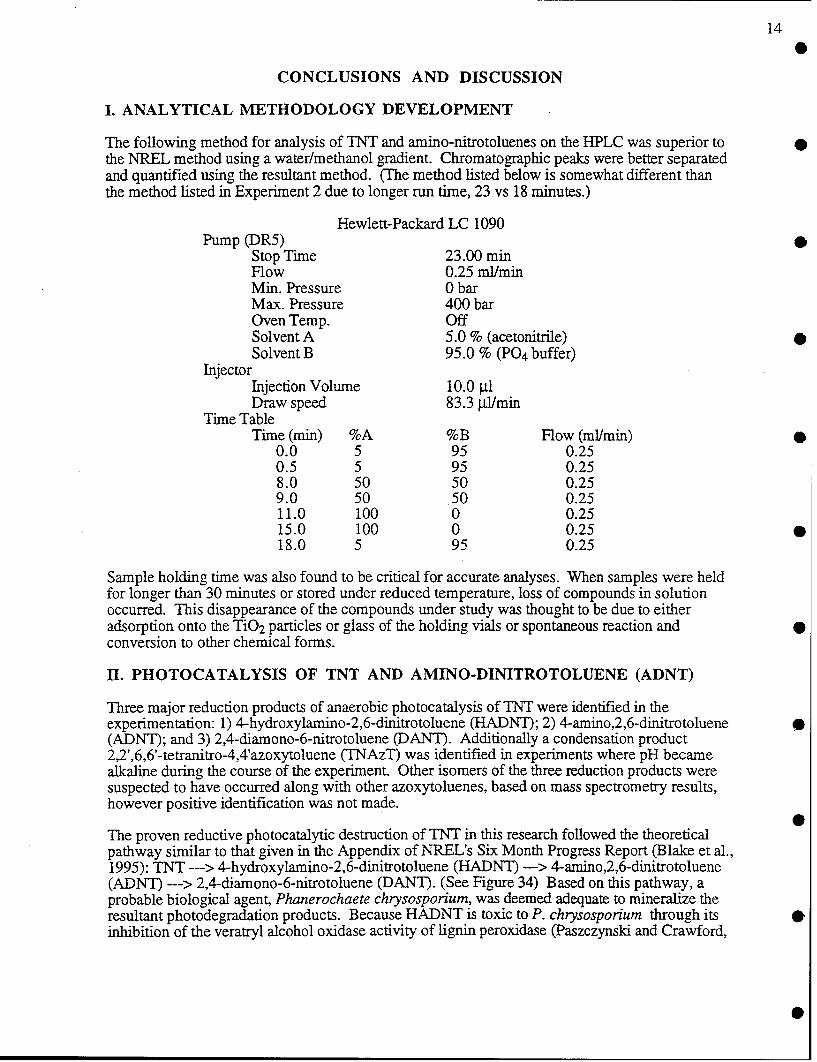
14
CONCLUSIONS AND DISCUSSION
I. ANALYTICAL METHODOLOGY DEVELOPMENT
The following method for analysis of TNT and amino-nitrotoluenes on the HPLC was superior tothe NREL method using a water/methanol gradient. Chromatographic peaks were better separatedand quantified using the resultant method. (The method listed below is somewhat different thanthe method listed in Experiment 2 due to longer run time, 23 vs 18 minutes.)
Hewlett-Packard LC 1090Pump (DR5)
Stop Time 23.00 minFlow 0.25 ml/minMin. Pressure 0 barMax. Pressure 400 barOven Temp. OffSolvent A 5.0 % (acetonitrile)Solvent B 95.0 % (P0 4 buffer)
InjectorInjection Volume 10.0 ptlDraw speed 83.3 .l/min
Time TableTime (min) %A %B Flow (ml/min)
0.0 5 95 0.250.5 5 95 0.258.0 50 50 0.259.0 50 50 0.2511.0 100 0 0.2515.0 100 0 0.2518.0 5 95 0.25
Sample holding time was also found to be critical for accurate analyses. When samples were heldfor longer than 30 minutes or stored under reduced temperature, loss of compounds in solutionoccurred. This disappearance of the compounds under study was thought to be due to eitheradsorption onto the TiO2 particles or glass of the holding vials or spontaneous reaction andconversion to other chemical forms.
II. PHOTOCATALYSIS OF TNT AND AMINO-DINITROTOLUENE (ADNT)
Three major reduction products of anaerobic photocatalysis of TNT were identified in theexperimentation: 1) 4-hydroxylamino-2,6-dinitrotoluene (HADNT); 2) 4-amino,2,6-dinitrotoluene(ADNT); and 3) 2,4-diamono-6-nitrotoluene (DANT). Additionally a condensation product2,2',6,6'-tetranitro-4,4'azoxytoluene (TNAzT) was identified in experiments where pH becamealkaline during the course of the experiment. Other isomers of the three reduction products weresuspected to have occurred along with other azoxytoluenes, based on mass spectrometry results,however positive identification was not made.
The proven reductive photocatalytic destruction of TNT in this research followed the theoreticalpathway similar to that given in the Appendix of NREL's Six Month Progress Report (Blake et al.,1995): TNT ---> 4-hydroxylamino-2,6-dinitrotoluene (HADNT) -- > 4-amino,2,6-dinitrotoluene(ADNT) ---> 2,4-diamono-6-nitrotoluene (DANT). (See Figure 34) Based on this pathway, aprobable biological agent, Phanerochaete chrysosporium, was deemed adequate to mineralize theresultant photodegradation products. Because HADNT is toxic to P. chrysosporium through itsinhibition of the veratryl alcohol oxidase activity of lignin peroxidase (Paszczynski and Crawford,
S

15
1995, Bumpus and Tartako, 1994, Michels and Gottschalk, 1994), it was also thought thatphotocatalysis of TNT had to proceed past HADNT and at least to ADNT to achieve adequatemineralization of the parent compound.
IV. COMBINED PHOTOCATALYTIC AND BIOLOGICAL DEGRADATION OFTNT
Based on results from this section of research the following conclusions were drawn:
1. Mineralization of TNT was possible using a combined photocatalytic and biologicaldegradation scheme, with P. chrysosporium as the biological agent. The maximum extentof observed mineralization of the original C-TNT was approximately 32 percent.
2. The length of photocatalysis affected the final extent of C-TNT mineralization in thecombined photocatalytic and biological degradation scheme. There was evidence from thevarying lengths of photocatalysis used, two and six hours, that longer treatment in thephotoreactor resulted in a greater extent of biological mineralization of the initial C-TNT, 23percent vs. 32 percent, respectively. Longer photo-treatment (six hours) also producedeffluent compounds that were more polar than the original influent compounds (TNT) orthan effluent compounds from shorter photo-treatment (two hours).
3. It was previously thought that preparations ofP. chrysosporium had requirements for anexogenous nitrogen source. This phenomenon was shown to be false in our research.Fungal preparations without additional nitrogen or with low nitrogen added (0.25 mMNH4) showed greater overall mineralization than did those with higher added nitrogen (2.5mM NH4).
Others have investigated the sole use of P. chrysosporium to mineralize TNT (Fernando et al.,1990; Spiker et al., 1992; Michels and Gottschalk, 1994). While they all obtained mineralization,the ultimate extent of TNT converted to CO2 was less than in the present research. TNT was alsoacknowledged to be toxic to P. chrysosporium at concentrations above 20 mg/l in aqueoussolution, further limiting ultimate mineralization using only the fungal preparations.
The greater extent of TNT mineralization in samples receiving longer photocatalysis was probablydue to either absence of any toxic intermediates in the degradation pathway or greater bioavailablityof the carbon in the degradation products. Based on our results, the occurrence of HADNT, toxicto P. chrysosporium, was avoided by longer photocatalytic treatment. Also, longer treatmentproduced more polar and soluble intermediate compounds that were more bioavailable for thefollow-on biological treatment, however an optimum length of photocatalytic treatment was notdetermined. In summary, the combined photocatalytic and biological treatment of aqueous TNTsolutions appears to be a viable remediation technology if the process is properly optimized.
RECOMMENDATIONS FOR FUTURE WORK
Recommendations for future research into photocatalytic and biological destruction of pink waterare the following:
1. Optimization of the combined photocatalytic and biological processes. While thecombined photocatalytic and biological scheme for TNT destruction was not optimized,experimental evidence showed that better treatment could be had based on photocatalyticprocess length. The use of central composite experimental designs together with responsesurface methodologies has been successfully used to optimize response in varioushazardous and non-hazardous waste treatment processes (Hess, et al., 1996; Watts et al.,

16
1994a). The overall combined photocatalytic and biological process should also beinvestigated for optimized configuration and resultant cost savings based on sequential vs.simultaneous treatment schemes.
2. Investigation of catalyst-coated solid support media. Many studies of photocatalytictreatment of waste streams are using TiO2-coated solid support media for ease of TiO2removal in a full-scale application (Glaze et al., 1993; Hofstadler et al., 1994). Previousresearch has shown that aqueous suspensions of TiO2 are hard to remove, increasing theoverall cost of a full-scale remediation process (Watts et al., 1994b).
3. Investigation of mixtures of explosives compounds for input into a combinedphotocatalytic and biological treatment scheme. It is likely that mixtures of nitroaromaticcompounds will behave differently during both photocatalysis and biological degradationthan does a single compound. Process optimization and resultant process costminimization should be studied.
REFERENCES
Bauer, R. 1994. Applicability of solar irradiation for photochemical wastewater treatment.Chemosphere. 29:1225-1233.
Blake, D.M. J.E. Boulter E.J. Wolfrum, Showalter, S.K., M.R. Prairie, B.M. Stange, P.J.Rodacy, P.K. Leslie. 1995. Solar detoxification of explosives in water: six months progressreport. National Renewable Energy Laboratory, Sandia National Laboratory.
Bonnarme, P. J. Perez and T.W. Jeffries. 1991. Regulation of ligninase production in white-rotfungi. in Leatham G.F. and M.E. Himmel, eds. Enzymes in Biomass Conversion. ACS,Washington, D.C.
Bumpus, J.A. and M. Tatarko. 1994. Biodegradation of 2,4,6-trinitrotoluene by Phanerochaetechrysosporium : identification of initial degradation products and the discovery of a TNTmetabolite that inhibits lignin peroxicases. Curt. Microbiol. 28:185-190.
CFR. 1992. Aerobic Aquatic Biodegradation Shake Flask Protocol. Code of Federal Regulations
40 796.310. U.S. Government Printing Office, Washington, DC.
Fernando, T., J.A. Bumpus and S.D. Aust. 1990. Biodegradation of TNT (2,4,6-trinitrotoluene)by Phanerochaete chrysosporium. Appl. Environ. Microbiol. 56:1666-1671.
Glaze, W.H. J.F. Kenneke and J.L. Ferry. 1993. Chlorinated byproducts from the TiO2-mediated 0
photodegradation of trichloroethylene and tetrachloroethylene in water. Environ. Sci. Technol.27:177-184.
Heertjes, P.M. 1958. Nitration with acids consisting of nitric acid and sulfur trioxide. Rec. Trav.Chim. 77:693-713. •
Hess, T.F., J. Chwirka and A. Noble. 1996. Use of response surface modeling in pilot testing fordesign. Environ. Technol. in press.
Hofstadler, K., R. Bauer, S. Novalic and G. Heisler. 1994. New reactor design for photocatalyticwastewater treatment with TiO2 immobilized on fused-silica glass fibers: photomineralization of 4- 0chlorophenol. Environ. Sci. Technol. 28:670-674.

17
Michels, J. and G. Gottschalk. 1994. Inhibition of the lignin peroxidase of Phanerochaetechrysosporium by hydroxylamino-dinitrotoluene, an early inntermediate in the degradation of2,4,6-trinitrotoluene. Appl. Environ. Microbiol. 60:187-194.
Michels, J. and G. Gottschalk. 1995. Pathway of 2,4,6-trinitrotoluene (TNT) degradation byPhanerochaete chrysosporium, in Biodegradation of Nitroaromatic Compounds, ed. J. Spain.Plenum Press, NY.
Paszczynski, A. and R.L. Crawford. 1995. Potential for bioremediation of xenobiotic compoundsby the white-rot fungus Phanerochaete chrysosporium. Biotechnol. Prog. 11:368-379.
Spiker, J.K. D.L. Crawford and R.L. Crawford. 1992. Influence of 2,4,6-trinitotoluene (TNT)concentration on the degradation of TNT in explosive-contaminated soils by the white rot fungusPhanerochaete chrysosporium. Appl. Environ. Microbiol. 58:3199-3202.
Stahl, J.D. and S.D. Aust. 1993. Metabolism and detoxification of TNT by Phanerochaetechrysosporium. Biochem. Biophys. Research Comm. 192:477-482.
Watts, R.J., S. Kong, M. Dippre and W.T. Barnes. 1994a. Oxidation of sorbedhexachlorobenzene in soils using catalyzed hydrogen peroxide. Jour. Hazard. Mater. 39:33-47.
Watts, R.J., S. Kong, M.P. Orr and G.C. Miller. 1994b. Titanium dioxide-mediatedphotocatalysis of a biorefractory chloroether in secondary wastewater effluent- Environ. Technol.15:469-475.

180
Hewlett-Packard LC 1090Pump (DR5)
Stop Time 35.00 minFlow 0.25 ml/minMin. Pressure 0 barMax. Pressure 400 barOven Temp. 420 CSolvent A 1.0 % (acetonitrile)Solvent B 99.0 % (water)
Time TableTime (min) %A %B Flow (ml/min)
0.0 1 99 0.253.0 1 99 0.2516.0 50 50 0.25 020.0 50 50 0.2526.0 0 0 0.2531.0 0 0 0.2533.0 1 99 0.25
Table 1. HPLC method used in experiment 1.
Hewlett-Packard LC 1090Pump (DR5)
Stop Time 18.00 minFlow 0.25 ml/minMin. Pressure 0 barMax. Pressure 340 barOven Temp. 420 CSolvent A 10.0 % (acetonitrile)Solvent B 90.0 % (LiOH/PO4 , pH 4.0)
InjectorInjection Volume 10.0 ý.lDraw speed 83.3 tl/min 0
Time TableTime (min) %A %B Flow (ml/min)
0.0 10 90 0.251.0 10 90 0.252.0 40 60 0.258.0 60 40 0.259.5 100 0 0.2510.5 100 0 0.2515.0 100 0 0.2516.5 10 90 0.25
0Table 2. HPLC method used in experiment 2.

* 19
14 C Source DPMOriginal 14C added 28,592,000
* Reactor contents after 5.5 h of photocatalysis 24,809,893Reactor rinse 2,072,818Total 14C recovered 26,882,712
Total recovery 94.02%
Table 3.14C balance from photocatalysis of 14C-TNT in experiment 9.
14C Source Percent Percent 14C Percent 14C Percent 14C Total14C-CO 2 in reactor bound to in MeCN percent 14 C
evolved liquid hyphae extraction recovered
Control 0.02±0 not done NA NA 0.02±0*
0 mM NH 4 19.86±2.40 24.19±3.41 16.86±0.75 6.63±3.38 67.54±5.16
0.25 mM NH4 6.65±0.97 20.60--1.69 19.34±1.94 16.16±1.62 62.75±2.34
2.5 mM NH4 3.66±0.69 21.29±0.26 19.30--3.02 18.03±3.87 62.27±6.46*recoverd as 14C-CO 2 only
Table 4. 14C( balance, experiment 12, from biological mineralization, by P. chrysosporium, ofproducts from photocatalysis of 14C-TNT. Data are averages ± standard error for 0, 0.25 and 2.5mM additions of NH4 to the fungal/photoproduct suspensions in addition to a noninoculatedcontrol.

20
14C source 0 h 2 h 6 Hr Controltreatment treatment treament
C0 2 evolved 13.7±2.5 22.7±1.3 31.8±0.8 2.2±0.1
Particulates in solute 17.7±4.1 2.0±0.6 2.1±0.4 21.4±2.1
Soluble 17.1±6.0 21.3±0.7 32.7±0.8 72.0±2.5
M9 Salts Wash 1.7±0.5 0.7±0.2 0.9±0.4 N/A
Cold TCA Wash 0.9+-0.5 0.2±0.0 0.4±0.2 N/A(carbohydrates)
Ether: Ethanol Wash 5.3±2.4 0.9±0.4 1.0±0.3 N/A(lipids)
Hot TCA Wash 0.8±0.3 0.2±0.0 0.4±0.1 N/A(nucleic acids)
Residue 1.1±0.1 0.2±0.1 0.2±0.2 N/A
HC1 digest 4.3±0.5 5.1±0.2 3.6+0.3 N/A(protein)
Tissue Solubilizer Digest 38.2±13.7 39.4±2.1 21.5±0.9 N/A(strongly sorbed, bound)
Total Recovery 100.7±11.6 92.7±2.1 94.6±1.6 95.6±3.5
Table 5. 14C balance showing average + standard error of samples from biologicalmineralization, by P. chrysosporium, of products from photocatalysis of 14C-TNT, experiment15. Data are from 0, 2, and 6 hours of precedent photocatalysis in addition to a noninoculatedcontrol. •

SVent orSample Port Reactor
Sparge
Solution Inlet Gas Release For Outer TubeSparge Indication
S/.• / Uv'.-Light
Coolng JcketCooling
Coolng Jcke • •k •Water t.Inner Tube
Cooling Water Outlet
Pump Argon or Air
Figure 1. Schematic of annular ring, photocatalytic reactor used in all experimentation.

T11 1~~ CIP Pr,,Zi 4qTAPPT
V0
qTr;wAl FT( F, M!OTANAI R#4r
PT A~' Tr unT .%*
2~ 0 1 ?41 A PP 40 , q?>
14 qFf 1 :Z121qq PH 7 7Q0
1 ;I ; r,4 14g401p fit( r r 7 97947
19 iAPA 77444qP [(ii 4A 7 479q4
17 C;, F g;4:L?77 fill p7c; 1A I ?I CI
I AA1 q?:t7?7Q ilit qC 14 RPQi4
Miull FPrTflPi inr~i
Figure 2. Chromatogramn of products from photocatalytic degradation of TNT using N7RELmethod in Experiment 1.

rTAPT
1'.Mk .W
W W .. , L4
*.'4 CAW.'
VW ~ y7
qT rmI T C,
OT AP; TYPr t.irnriTW ~9 CC I~ t4LIAR 5 pit r;47 I'? t 4Q7
;t Ql4 1 1 77*2r4 I(P Z7P 19
4 Zr :t7lIAq PR FI7q *QI?
7 Ari I 47r4PA AP I POCI t *72 Q 14
1 f ;?4 )iRqg:4 PHl CA4 4C4?
I) A LI 2A~i g ill 7r,1 I z
1; A7 -7~7124I Pg A~~ A 2 az
A A c; Q 17 1 LI7 14 pit 2Q4 1 A44Pf
I~ q R7 4;4r,71 tiP cli' 4P
2P r, 7 I Q7440 Pq ~77P q lzq
7; l7z 147ACC40 Pg '2q7 7 77Pql
4~ Q r 41:?707? gall 77z- 20 00710a
Figure 3. Chromatogram of products from photocatalytic degradation of TNT using ACNmethod, Experiment 1.

TIC ofTomphotol.dAbundance
70000-
60000-
50000
40000
30000
10000.
4 8 12 16 20Time (mlL)
Average of 12.507 to 12iM mlr rrom Tomphotol.d SUBTRACTED
Abundance
3000 +4
77 o09 It91000"6 e
.I .I " too*197
40 SO 80 100 120 140 10 180 200 220 •
Mas/Cah.rge
Figure 4. Chromatogram (top) and mass spectra (bottom) of an amino-nitrotoluene isomerformed during photocatalytic degradation of TNT in Experiment 1.
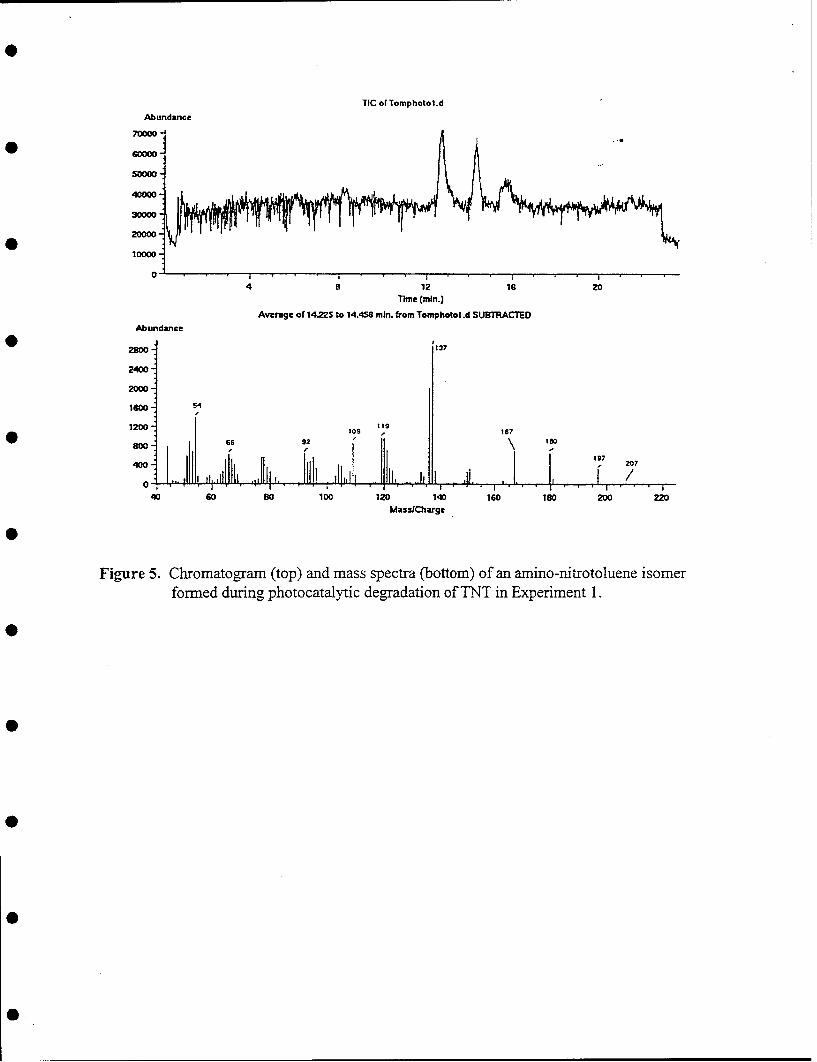
TIC of Tomphotol.d
Abundance
70000
600007
40000
30000•
20000-.
004 B 12 1i 20
Time (min.)
Average of 14.22S to 14.45r min. from Tomphotol.d SUBTRACTED
Abundance
2 -" 137
2400"
2000-
1600
1200 I is1200109 •167
SW66 92 l , 167
197400-_ , j 207
40 so 80 100 120 140 160 180 200 220Mass/Charge
Figure 5. Chromatogram (top) and mass spectra (bottom) of an amino-nitrotoluene isomerformed during photocatalytic degradation of TNT in Experiment 1.

100 1000
90 900
80 800
70 700
E 60 600
0 0)
250 500
C 0)00)u 40- -400C0C-)
30- -300
20- -200
10 100
0 00 0 15 30 60 120 180 240 330
Time (min)
-- TNT -N-ADNT -- RT 1.2 S -- RT4.4' 6 RT5.6'
Figure 6. Anaerobic photocatalytic degradation of TNT in experiment 2. Solid symbols representdata in mg/I, open symbols show data as peak area from chromatograms.
data i mg L0

100 1200
90
100080
70800
E 60-60C a)5,•50 600
o 40
00 .400
30
20.-200
10
0 0 15 30 60 120 180 240 300 480 600
Time (min)
TNT ADNT - RT26' B0RT7"9' -- RT10.2
Figure 7. Anaerobic photocatalytic degradation of TNT in the presence of HCO3- in experiment3. Solid symbols represent data in mg/l, open symbols show data as peak area fromchromatograms.

Sample Name : photo3-smpll Inj Volume 10 ul
Sequence File : C:\HPCHEM\I\SEQUENCE\TL42095.SAnalysis Method : C:\HPCHEM\I\METHODS\TAL.MTNT, 4A-2,6DNT, 2,4A-6NT reversed phase HPLC method
DADI A, Sig=210,4 Rer=450,4 of TLNAROM02-OI O1.D
niAU C
120-
100 U
80040- '
50 ¶ 1
5 10.... lIs ..... 25 30 Mid•
External Standard Report
Sorted by Retention TimeCalib. Data Modified Wednesday, April 19, 1995 1:51:30 AMMultiplier 1.000000RF Uncal. Peaks 0.000000
Signal 1: DADI A, Sig=210,4 Ref=450,4
RT Sig Type Area Ant/Area Amount Grp Name S[min] [mAU*sec] [mg/L)
----- I -- I--- I ---------- ----- I--------1--I-----------I2.583 1 BB 1271.49133 0.00000 0.00000 ?4.485 1 BV 163.04066 0.00000 0.00000 ?7.802 1 BV 515.74963 0.00000 0.00000 ?8.963 1 VV 1319.96631 0.00000 0.00000 ?
10.216 1 VB 375.41434 0.00000 0.00000 ?15.161 1 * not found * 2,4-DANT20.297 1 BB 264.28940 1.24508e-2 3.29062 4A, 2,6DNT21.489 1 BB 2383.32373 1.13362e-2 27.01776 TNT26.070 1 BB 134.58821 0.00000 0.00000 ?
Totals 30.30838
I Warnings or Errors :
Warning : Calibrated compound(s) not found
Figure 8. Chromatogram from anaerobic photocatalytic degradation of TNT in the presence of
HCO3" during Experiment 3.

100 350Q,
90
3000
80
70 2500
E 6020 0 C02000
S50 "5
a;: 1500 )C 40-C)0
S30 1000
20
500
10
0 = 0
0 0 15 30 60 120 180 240 300
Time (min)
- TNT -- 4-- ADNT E3 TNAzT
• RT 3.526' -- RT 14.62' -E RT >25'
Figure 9. Anaerobic photocatalytic degradation of TNT in the presence of HCO3" and EDTA inexperiment 4. Solid symbols represent data in mg/l, open symbols show data as peakarea from chromatograms.

Current Chromatogram (s)DAD1 A, Sg--21 0,4 Ref=450,4 of JW-PHOTO008.-0101 .D
)4
300
250
200 p.
qN
i0
0C4
1000
150 N
Target + Library Spectrum 15 20 25 30 ma
LJ DADI. 20.054 (72-7 mAUApx) Reft=19.962 & 20.1 Spectral DifferenceDAD1, 14.717(915 mAUApx) Ref=14.633 & 14.8 a u.,A'A., 14.717(915 mAUApx) Ref=14.633 & 14.803 of 1 .D - DAD1,2
mAU
7002-
60-
0
s0
40- -2-
30--4-
-6-
10-
0- -8
2O 5. 'W ' '• I200 250 300 350 400 450 500 550 n
Figure 10. Chromatogram (upper) from Experiment 4 showing the spectral match (lower left)
and spectral differences (lower right) for intermediate, RT = 20.049 min, identified
as 4-amino-2,6-dinitrotoluene (ADNT).

Current Chromatogram (sOAMI A', Skig1O,4"Ref.U. 4 50.4 of JW-PHOTO .&IOI.D - "
250
200
e9
,a
10
s Ui10
Ta et+draySecrm1 20 25 30 rig01,27.I 1 C at7ornAUApx) Re op27.080& 274o ectrsh Differ nceM AMd 19.=2 (188 dieAUApx) Ref=9.e & . 9.592(188rMAUAgriteredite RT=2719. 1.68of0 1.0 - DADi, 2
*70 .2
60
500
* 40
30 -
* 2,2' ,6,6'-tetranitro-4,4 '-azoxy toluene (TNAzT).
0

120 7000
100T 6000
5000
S80-
-- 4000
0
0
S60 i
I-c*00
CD 30000CC
040 4
2000
20---- 1000
0 -00 0 15 30 60 120 180 240 300 360
Time (min)
--a- TNT --e- A DNT -. a] TNAzT
6 RT 3.50' 0 RT 14.60' ---- RT >25'
Figure 12. Anaerobic photocatalytic degradation of TNT in the presence pf EDTA in experiment5. Solid symbols represent data in mg/I, open symbols show data as peak area fromchromatograms.

Acq. Method : TAL612.M Seq. Line : 2Acq. Operator : jWells Vial : 19Injection Date : 6/17/95 1:02:59 AM Inj : 1Sample Name : 6-15smpl-lod Inj Volume : 10 Al
Sequence File : C:\HPCHEM\I\SEQUENCE\JW6-15.SAnalysis Method : C:\HPCHEM\I\METHODS\TAL612.MTNT, 4A-2,6DNT, 2,4A-6NT reversed phase HPLC method
DAD1 A, Sg-210,4 Ref4W50.4 of JW6.1501 9-0201.D
160-
120
Soedb Rtnto Tm
100Mi.ID
807 %16
Si g n a! :
I. . . I- ID .... . II 0--
60-
40 0 0 A
20
- .40
5 20 is 20 2B 30 rain
External Standard Report
Sorted by Retention TimeCalib. Data Modified Wednesday, June 14, 1995 7:57:29 AMMultiplier 1. 1.000000RF Uncal. Peaks 0.000000
Signal 1: DAD A, Sig=210,4 Ref=45.0,4
RT Sig Type Area Amnt/Area Amount Grp Name(mini] (mAU*sec] f mg/Li]
------ 1--I ------ I ---------- I---------I--------1--I--------------2.371 1 BV 4472.12207 0.00000 0.00000 ?3.495 1 VB 1651.51758 0.00000 0.00000 ?
*9.221 1 BB 150.13554 0.00000 0.00000 ?14.604 1 BB 140.55016 0.00000 0.00000 ?15.424 1 *not found *2,4-DANT
16.403 1 BB 122.31805 0.00000 0.00000 ?20.060 1 BB 1389.71936 6.60070e-3 9.17312 4A, 2,6DNT21.183 1 BB 100.42084 3.25642e-2 3.27012 TNT25.035 1 BV 290.10065 0.00000 0.00000 ?25.385 1 VV 831.85468 0.00000 0.00000 ?
*25.852 1 VV 1370.25330 0.00000 0.00000 ?26.339 1 VV 547.01031 0.00000 0.00000 ?26.841 1 VV 845.85693 0.00000 0.00000 ?27.163 1 VV 1802.58618 -0.00000 0.00000 ?'27.454 1 VV 899.49219 0.00000 0.00000 ?28.278 1 VV 717.41400 0.00000 0.00000 ?28.927 1 VB 328.31653 0.00000 0.00000 ?
Figure 13. Chromatogram. from anaerobic photocatalytic degradation of TNT in the presence of
EDTA in Experiment 5.

8000
7000 7OO0
6000 t
5000
a)
4000-
a)
3000--
2000
1000-
0o
0 0 15 30 60 120 180 240 300
Time (min) 9
-TNT -- n- ADNT - DANT
--- x TNAzT A RT 23.17 -G-- RT 26.18'
Figure 14. Anaerobic photocatalytic degradation of TNT in the presence of EDTA inexperiment 10. All data are given as peak area from chromatograms.
I I 0

120 6000
100 / 5000
0/- 80 40000E
C
0W 0 - . 000
S40 2000
20- 1000
00- 00 0 20 40 60 120 180 240 300
Time (min)
A DANT *- -TNT A-I- ADNT
--s- HADNT -- 6- RT 4.91' -- •RT 5.46'
Figure 15. Anaerobic photocatalytic degradation of TNT in the presence of EDTA inexperiment 11. Solid symbols represent data in mg/I, open symbols show dataas peak area from chromatograms.
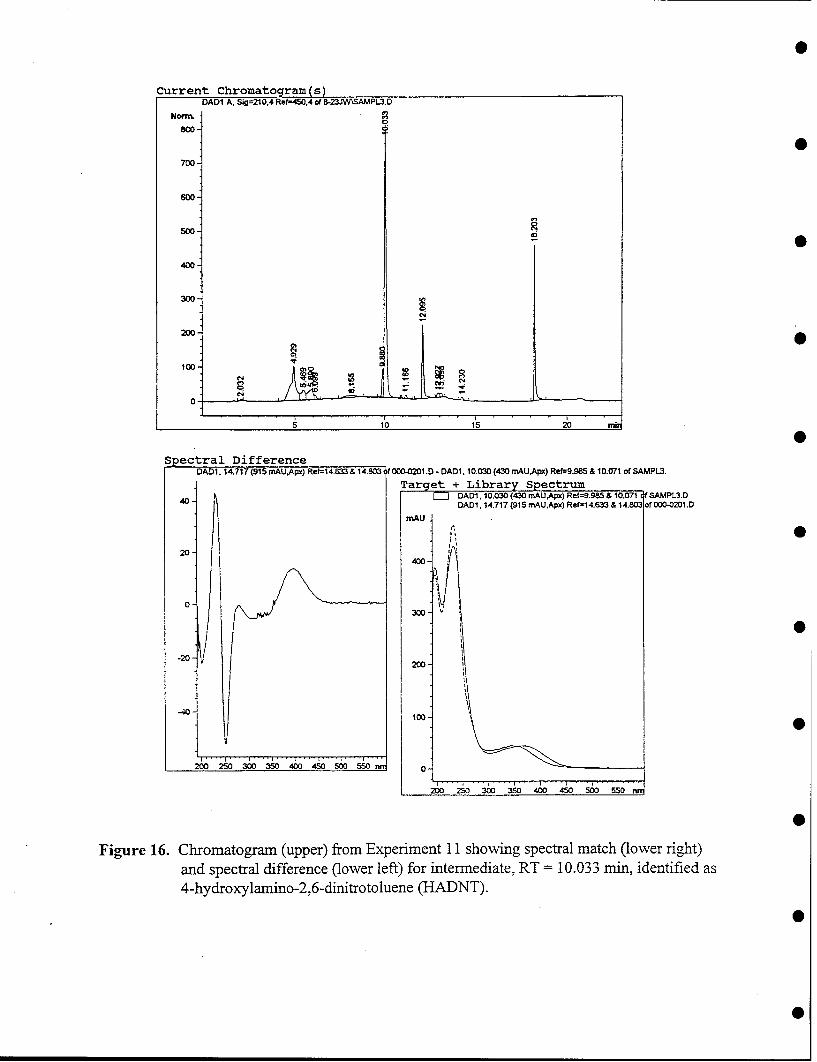
Current Chromatogram (s)DAD1 A, Sig=210,4 Reft-4.50,4 of 8-23JWVSAMPL3.D
Noim.
800"
700-
Soo
400-
300
200-
100- ••
510 is 20 gii
Spectral DifferenceDADi 14.717 (915 mAUApx) Refr-I 4.633 & 14.803 f 000-0201 .D - DAD1. 10.030 (430 mAUApx) Ref-9.985 & 10.071 of SAMPL3.
Target + Library Spectrum40- DADI. 10.030(430 mnAUApx) Refg.g5 & 10.071, SAMPL3.D
DAD1 *14.717(915 mAUApx) Ref-14.633 & 14.803 of 000-0201.D
mAU
20-I
0300
-20-200-
-4- t100
200 250 300 350 400 450 500 550 n.q
Figure 16. Chromatograrn (upper) from Experiment 11 showing spectral match (lower right)and spectral difference (lower left) for intermediate, RT = 10.033 min, identified as4-hydroxylamino-2,6-dinitrotoluene (HADNT).

zTIC of Tomphoto2W.d
Abundance
240000-
20000
80000
0' 40000
4 B 12 16 20Time (min.)
Average of 16.023 to 16.123 min. from Tomphoto2o".d SUBTRACTED
Abundance
137 160
12000- 77 ?67
10000 104120 197
* 6000-
4000-222000-. 227o ,., t .,,[ . ..t[.. . , . ,, T, ,, I [.1 . j ., •. . . !. . -
90 100 120 140 160 190 200
MasslCharge
Figure 17. Chromatogram (top) and mass spectra (bottom) of 4-hydroxylamino-2,6-dinitrotoluene (HADNT), an intermediate formed during anaerobic photocatalyticdegradation of TNT in the presence of EDTA, in Experiment 11.

100
90
80
70
E 60
SoCo 0
4-00 4
U 30-
20
10
00 100 200 300 400 500 600
Time (min)
i •j•TNT A__ ADNT .. k.DANTI0
Figure 18. Anaerobic photocatalytic degradtion of TNT the presence of EDTA inexperiment 16.

60 8000
17000
50
-- 6000
• 40S-5000
00 S30 4000 €
C 3000
0 200)
2000
101 1000
S>0 ,0
0 0 15 30 60 120 180 240 300
Time (min)
i ADNT +DA NT .. _RT 17.04'
Figure 19. Anaerobic photocatalytic degradation of ADNT in the presence of EDTA inexperiment 6. Solid symbols represent data in mg/i, open symbols show dataas peak area from chromatograms.

100 __2500
90
80 2000
70--,-. 70
E 60 15o0cc
50o ...
500
0 40- 1000.
030-
20 500
10
I0__0 0
0 15 30 60 120 180 240 300
Time (min)
_.TNT ADNT .RT 8.275' I
RT 11.585' -- C-- DANT .- RT 7.759'
Figure 21. Partially anaerobic photocatalysis of TNT in the presence of EDTA inexperiment 17. Only an initial nitrogen purge of the reactor contents wasdone.

120 14000
1012000* 100-
10000
s80
E*8000
60O
-- 60000
* C
o 40
4000
20-2O 2000
0 00 0 15 30 60 120 180 240 300
Time (min)
-4-- TNT --- RT 2.37 -- A-RT 18.69' ---- RT 28.54'
Figure 22. Anaerobic photocatalytic degradation of TNT in the presence of tetranitro-methane and EDTA in experiment 8. Solid symbols represent data in mg/l,open symbols show data as peak area from chromatograms.

Acq. Method : PROD2.M Seq. Line : 6Acq. Operator : JWells Vial : 10Injection Date : 1/8/96 9:30:43 PM Inj : 1Sample Name : samp6 Inj Volume : 10 Al
Sequence File : C: \HPCHEM\I\SEQUENCE\JWl-8. SAnalysis Method : C:\HPCHEM\l\METHODS\PROD2.MTNT, 4A-2,6DNT, 2,4A-6NT reversed phase HPLC method
DADI A, Sg=210,4 Ret-4S0,4 of JW1-M10-0601.D
mAU0 is
800-
700-
600
500-
400-
200 0
100-0
o 25 5 7.5 10 125 15 17.5 20
External Standard Report
Sorted by Retention TimeCalib. Data Modified Monday, January 08, 1996 7:01:55 PMMultiplier : 1.000000Uncalibrated Peaks : not reported
signal 1: DAD1 A, Sig=210,4 Ref=450,4
RT Sig Type Area Amt/Area Amount Grp Name(min] [mAU*sec] [mg/L]
I----- -- I----- I -------- I ------- I--------I-------------7.945 1 * not found * 2,6DA4-NT
11.880 1 * not found * 4A,2,6-DNT12.331 1 * not found * TNT
Totals 0.00000
1 Warnings or Errors
Warning : Calibrated compound(s) not found
Figure 23. Chromatogram from anaerobic photocatalytic degradation of TNT in the presence ofperiodate in Experiment 13.

100 2500
90
80 2000
770
. 60- 1500Co ,
.0~"C1 50-
40- 1000
0L, 30
20 -- 500
10-
0 0
0 0 15 30 60 120 180 240 300 360
Time (min)
•TNT * ADNT .x-- DANT
SHA DNT .- e- RT 7.24:Y -- B- RT 7.726'
Figure 24. Anaerobic photocatalytic degradation of TNT in the presence of methanol andEDTA in experiment 14. Solid symbols represent data in mg/i, open symbolsshow data as peak area from chromatograms.

Acq. Method : PROD2.M Seq. Line : 1Acq. Operator : wells Vial : 9Injection Date : 1/24/96 2:51:13 AM Inj : 1Sample Name : sample 10 Inj Volume : 10 Al
Sequence File : C:\HPCHEM\I\SEQUENCE\JWl-23.SAnalysis Method : C:\HPCHEM\I\METHODS\PROD2.MTNT, 4A-2,6DNT, 2,4A-6NT reversed phase HPLC method
DAD1 A, Sig210,4 Ref.450,4 of JW•-238BV09-101.D
mAU
175
125-
125
00
2.5 5 7.5 10 12.5 15 17.5 20
External Standard Report
Sorted by Retention TimeCalib. Data Modified : Tuesday, January 23, 1996 9:22:46 PMMultiplier : 1.000000RF Uncal. Peaks 0.000000
Signal 1: DAD1 A, Sig=210,4 Ref=450,4
RT Sig Type Area Amt/Area Amount Grp Name[min] [mAU*sec] (mg/L]
I---.----- I---- I -------- --- ------- -------------2.196 1 PV 120.77103 0.00000 0.00000 ?4.408 1 BV 182.77753 0.00000 0.00000 ?4.623 1 WV 80.90977 0.00000 0.00000 ?4.828 1 VV 51.15357 0.00000 0.00000 ?7.274 1 BV 237.92986 0.00000 0.00000 ?7.753 1 VV 831.02484 0.00000 0.00000 ?8.290 1 VV 1454.01855 6.08068e-3 8.84142 2,6DA4-NT
11.047 1 BB 224.28879 0.00000 0.00000 ?11.909 1 BV 211.89180 1.73433e-2 3.67490 4A,2,6-DNT12.137 1 VV 62.31731 0.00000 0.00000 ?12.293 1 VV 105.04922 4.47929e-2 4.70546 TNT12.440 1 VV 59.31694 0.00000 0.00000 ?12.637 1 WI 31.83701 0.00000 0.00000 ?18.048 1 PB 646.27380 0.00000 0.00000 ?
Totals : 17.22178
Figure 25. Chromatogram from anaerobic photocatalytic degradation of TNT in the presence of
methanol in Experiment 14.

0
1000 - 0.65- 0.60
900- - 0.55- 0.50
800- 4 - 0.45"- 0.40
700- - 0.35- 0.30
600 -- 0.25- 0.20
5 0 0.15'D 0.10
* 400- - 0.050.00
300 - -0.05- -0.10
0200- -0.15-- 0.20
100 -- 0.25-0.30
0 -0.35
0 5 10 15 20 25 30
Minutes
Figure 26. Chromatographic peaks (A210) and associated 14 C fractionation (dpm) from
photocatalytic degradation of TNT in the radiotracer study of Experiment 9.
0
0

200
18
16
04
0 14
"0 12
0
> 10-0)
'- 8
0~
4
2 0O)
0 2 4 6 8 10 12 14 16 18 20
Days
--- Control ---- 0 mM NH4 A 0.25 mM NH4 ----X---- 2.5 mM Nl-4
Figure 27. Evolution of 14C-CO2 over time from aerobic. biological degradation of photocatalyticTNT degradation products by P. chrysosporium in experiment 12. Graph shows fourtreatments: a non-inoculated control, and exogenous additions of 0, 0.25 and 2.5 mMNil,.

0
0
90
0480
70
0 60
o 8. 0
a) so-
6
U,) 40
Q4-.
4) 30-
20-
10
00
0 20 40 60 80
Days
Figure 28. Loss of soluble photoproducts from solution over time.

50 -0.550EtOAc Extract " 0.4
400 -0.30.2
300 - 0.1E 0.0 0
200 -
100
020-0.25mM NH -MeCN Extract 0.20
40.15
150 - - 0.10- 0.05
E 100 - 0.00 0
50-
075 0 mM NH 4-MeCN Extract -0.20
6- 0.10
45 - 0.05E __._L__ 0.00
- 30 - 7" <
15
00
0 5 10 15 20 25 30 35
Minutes
Figure 29. Chromatographic peaks (A210) with associated "4C fractionation (dpm) of
photoreactor products after photocatalytic treatment of TNT prior to biological
treatment (top graph) and after aerobic biological treatment by P.
chrysosporium in the presence of 0.25 mM NH4 (middle graph) and no NH4
(bottom graph), all in experiment 12.

* __ ____ ___ ____ ___ ____ __5
03
0-25
-a020
10
0
1 0 0 1 2 5 3
Days
2 .~hr .6hr .Control ~ 0hr
Figure 30. Evolution of '4C-C0 2 over time from aerobic biological degradation of photocatalyticTNT degradation products by P. chrysosporium in experiment 15. Graph shows fourtreatments: a non-inoculated control, rno photocatalytic treatment (0 hr) and 2 and 6hours of photocatalysis.

120
4- L100 C -- 020'~80 - C3 0!
" " • 60 - 0 0 D o Liquid Media
a.. 40 1SMpv. Avg. (LiquidO. I• 2OMediapr)
0 10 20 30
Days
100
80 -- C0220 M 60-4) 60 Liquid Media
. 4000 0M 20 0 - 3 per. Mov. Avg. (Liquid,
MeWdia)00.
0 10 20 30
Days
100
80
0 0 C060
I- 40 oLiquid Media
20 0 .... 3 per. Nbv. Avg. (Liquid'0 Miedia)
0 10 20 30
Days
Figure 31. Distribution of 14C radiotracer between evolved CO2 and that soluble in liquid
media during biological treatment of photoreactor contents by P. chrysosporiumin experiment 15. Graphs show (top to bottom): 0, 2 and 6 hours ofphotocatalytic treatment, respectively, prior to biological treatment.

- 1.4
- 1.2
Before - 1.0
- 0.8
- 0.6
-0.4E 0.2
1000 - -0.0
8000
600-400-
200-
0• 1.2
- 1.0
After - 0.8
- 0.6
- 0.4
E -0.2
-150 0.0
100
50-0-
0 5 10 15 20 25 30 35 40
Minutes
Figure 32. Chromatographic peaks (A,) with associated 14C fractionation (dpm) of
photoreactor products from 2 hours of photocatalytic treatment of TNT before
(top graph) and after (bottom graph) aerobic biological treatment by P.
chrysosporium in experiment 15.

- 1.4- 1.2- 1.0
Before - 0.8- 0.6
E -0.40. 2
- 800 - •- 0.0 <
600400 -200 -
0 . . 1.2- 1.0- 0.8
After -0.60.4
E 200 0.2"V 0.0 <
150
100 0
50-0 - 0.8
0.6
Control - 0.4
- 0.2•" -0. 0 <q
200 -0
150 -
100
50-
0-0 5 10 15 20 25 30 35 40
Minutes
Figure 33. Chromatographic peaks (A210) with associated '4C fractionation (dpm) ofphotoreactor products from 6 hours of photocatalytic treatment of TNT before(top graph) and after (middle graph) aerobic biological treatment by P.chrysosporium in experiment 15. An abiotic control (bottom graph) isincluded for comparison.

00
O2N N=NNO
HC CH,
CH3 CH3
N,2,2',6,6'-teu-anitro-NO
02 N NO., 02N NO, 4,4'-azoxytoluene4-hydroxylamino-
0* 2,6-dinitrotouene
NO, NHOH
2,4,6-ti-initrotoluene
CH, CH3
02N NO, 02 N N H.
0
NH, NH,
4-amino-2,6-dinitrotoluene 2,4-diamino-6-aitrotoluene
Figure 34. Proven pathway for anaerobic photocatailytic degradation of T.NTT
0

B. Bibliography of work on treatment of pink water and related water contamination.
Alif, Admin., and Boule Pierre. "Photochemistry and Environment Part XIV. Phototransformation ofNitrophenols Induced by Excitation of Nitrite and Nitrate Ions." J. Photochem. Photobiol. A: Chem. 59(1991): 357-67.
Andrews, Catherine C. Photooxidative Treatment of TNT Contaminated Wastewaters, WQEC/C 80-137.Naval Weapons Support Center, Crane, IN, December 1979. ADA 084684.
Augugliaro, V., M. J. Lopez-Munoz, L. Palmisano, and J. Soria. "Influence of pH on the DegradationKinetics of Nitrophenol Isomers in a Heterogeneous Photocatalytic System." Appl. Catal., A 101, no. 1(1993): 7-13.
Augugliaro, Vincenzo, Leonardo Palmisano, Mario Schiavello, Antonino Sclafani, Leonardo Marchese,Gianmario Martra, and Fausto Miano. "Photocatalytic Degradation of Nitrophenols in Aqueous Titanium
Dioxide Dispersion." Appl. Catal. 69, no. 2 (1991): 32340.
Botcher, Tod R1, and Charles A. Wight. "Explosive Thermal Decomposition of RDX ." J. Phys. Chem. 98(1994): 5441-4.
Bowen, Richard C., Armand A. Balasco, Michael Bryant, Kevin Cahill, and Michael Marando. FinalFeasibility Study for Ground Water at Explosive Washout Lagoons (OU-3) at the Umatilla DepotActivity (UMDA), SFIM-AEC-BC-CR-93137. US Army Environmental Center, Aberdeen ProvingGround, MD 21010, 10 December 1993. USAEC.
Burlinson, N. E., M. E. Sitzmann, L. A. Kaplan, and E. Kayser. "Photochemical Generation of the 2,4,6-Trinitrobenzyl Anion." J. Org. Chem. 44, no. 21 (1979): 3695-98.
Burlinson, Nicholas E., Lloyd A. Kaplan, and Charles E. Adams. Photochemistry of TNT: Investigation ofthe "Pink Water" Problem, NOLTR 73-172. Naval Ordnance Laboratory, White Oak, Silver Spring, MD,3 October 1973. AD 769 670.
Burrows, W. Dickinson, and Ernst E. Brueggemann. Tertiary Treatment of Effluent From Holston AAPIndustrial Liquid Waste Treatment Facility V. Degradation of Nitramines in Holston AAP Wastewatersby Ultraviolet Radiation, TR8602. Fort Detrick, Frederick, MD, September 1986. AD-A176 195.
Carrazza, J., E. Pregun, C. Chandler, and W. Helbert. Treatment of Wastewater (Red Water) Resulting FromTNT Purification, AD-P004 146. U. S. Army R&D Center, Dover, NJ, 1984. AD-P004 146.
Cho, Jeong-Guk, William T. Potter, and Kerry L. Sublette. "Porphyrin-Catalyzed Reduction ofNitroaromatics for the Treatment of Pink Water." Applied Biochem. and Biotechnol. 45/46 (1994):861-70.
Ciccone, Vincent J., Richard P. Schmitt, James M. Morgan, and George A. Garrigan. Economic Evaluationof Munitions Manufacturing Pink Wastewater Treatment Alternatives Using a Present Value- Unit CostMethodology, DRXTH-TE-CR-82126. USATHAMA, Aberdeen Proving Ground, MD, February 1982.AD A115218.
B-1

0
Davis-Hoover, Wendy. J. R. Simplot Ex-Situ Bioremediation Technology for Treatment of TNT-Contaminated Soils, EPA/540/R-95/529. U.S. Environmental Protection Agency, Cincinnati, OH,September 1995.
DeBerry, David W., Alfred Viehbeck, and Dean Meldrum. A Literature Survey: Basic Mechanisms ofExplosive Compounds in Wastewater, DRXTH-TE-CR-84279. USATHAMA, Aberdeen ProvingGround, MD, May 1984. AD-A141 703.
*- Dieckmann, M. S., K. A. Gray, and P. V. Kamat. "Photocatalyzed Degradation of Adsorbed NitrophenolicCompounds on Semiconductor Surfaces." Water Sci. Technol 25, no. 3 (1992): 277-9.
Diller, Ralf, Matthias Brandt, Iris Fomefett, Ulrike Siebers, and Detlef Bahnemann. "PhotocatalyticDegradation of Trinitrotoluene and Other Nitroaromatic Compounds." Chemosphere 30, no. 12 (1995):2333-41.
Doyle, Richard C., and Judith F. Kitchens. Composting of Soils/Sediments and Sludges Containing ToxicOrganics Including High Energy Explosives, DOE/CH-9208. Argonne National Laboratory, Argonne,IL, July, 1993. Argonne National Laboratory, Argonne, IL 60439.
Dunnivant, Frank M., Rene P. Schwarzenbach, and Donald L. Macalady. "Reduction of SubstitutedNitrobenzenes in Aqueous Solutions Containing Natural Organic Matter." Environ. Sci. Technol. 26, no.11 (1992): 2133-41.
Freeman, Donald J., and Olin A. Colitti. Removal of Explosives From LAP Wastewater (Pink Water) UsingSurfactant Technology, 820526050. ARRADCOM, TSD, Dover, NJ, May 1982. AD A115086.
Funk, Stephen B., Deborah J. Roberts, Don L. Crawford, and Ronald L. Crawford. "Initial-PhaseOptiminzation for Bioremediation of Munition Compound-Contaminated Soils." AppI. and Environ.Microbiol. 59, no. 7 (1993): 2171-77.
Gray, K. A., U. Stafford, M. S. Dieckmann, and P. Kamat. "Mechanistic Studies in Titanium DioxideSystems: Photocatalytic Degradation of Chloro- and Nitrophenols." Trace Met. Environ 3, no.Photocatalytic Purification and Treatment of Water and Air (1993): 455-72.
Haderlein, Stefan B., Kenneth W. Weissmahr, and Rene P. Schwarzenbach. "Specific Adsorption ofNitroaromatic Explosives and Pesticides to Clay Minerals." Environ. Sci. Technol. 30, no. 2 (1996): 612-22.
Heijman, Comelis G., Erwin Grieder, Shristof Holliger, and Rene P. Schwarzenbach. "Reduction ofNitroaromatic Compounds Coupled to Microbial Iron Reduction in Laboratory Aquifer Columns."Enivron. Sci. Technol. 29, no. 3 (1995): 775-83.
Heilmann, Harro M., Udo Wiesmann, and Michael K. Stenstrom. "Kinetics of the Alkaline Hydrolysis ofHigh Explosives RDX and HMX in Aqueous Solution and Adsorbed on Activated Carbon." Environ. Sci.Technol. 30, no. 5 (1996): 1485-92.
Higdem, Dane. Demonstration of the J. R. Simplot Ex Situ Bioremediation Technology for Treatment ofNitroaromatic Contaminants at the Weldon Spring Ordnance Works Site in Weldon Spring, MO, U.S.Environmental Protection Agency, Cincinnati, OH, March 1994. USEPA.
Hinshaw, Gary D., Cindy B. Fanska, Douglas E. Fiscus, and Scot A. Sorensen. Granular Activated Carbon(GA C) System Performance Capabilities and Optimization, AMXTH-TE-CR871 11. Midwest ResearchInstitute, Kansas City, MO, 27 February 1987. MRI.
Hoffsommer, J. C., L. A. Kaplan, D. J. Glover, D. A. Kubose, C. Dickinson, H Goya, E. G. Kayser,C. L. Groves, and M. E. Sitzmann. Biodegradability of TNT: A Three-Year Pilot Plant Study,NSWC/WOL TR 77-136. Naval Surface Weapons Center, Silver Spring, MD, 13 February 1978. ADA061 144.
Jain, Kamlesh K., and Armond J. Bryce. "Feasibility of Munitions Wastewater Treatment by Adsorption- 0Oxidation." Carbon Adsorption Handbook, Editors Chesemisinoff, and Ellerbush, 661-85.
Jenkins, T. F., Philip G. Thorne, and Marianne E. Walsh. Field Screening Method for TNT and RDX inGroundwater, SR94-14. U. S. Army CRREL, Hanover, NH, May 1994. U. S. Army, CRREL.
Jenkins, Thomas F., Richard P. Murrmann, and Daniel C. Leggett. "Mass Spectra of Isomers ofTrinitrotoluene." J. Chem. and Eng. Data 18, no. 4 (1973): 438.
Kaake, R. H., D. L. Crawford, and R. L. Crawford. "Optimization of an Anaerobic Bioremediation Processfor Soil Contaminated With the Nitroaromatic Herbicide Dinoseb (2-Sec-Butyl-4,6-Dinitrophenol)."Applied Biotechnology for Site Remediation, Editors Robert E. Hinchee, Daniel B. Anderson, and 0Gregory D. Sayles, 337-41. Boca Raton, FL: Lewis Publishers, 1994.
Kaplan, D. L., and A. M. Kaplan. "Thermophilic Biotransformations of 2,4,6-Trinitrotoluene UnderSimulated Composting Conditions." Applied and Environmental Microbiology 44, no. 3 (1982): 757-60.
Kaplan, Lloyd A., Nicholas E. Burlinson, and M. E. Sitzmann. Photochemistry of TNT: Investigation of thePink Water Problem, Part II, NSWC/WOL/TR 75-152. Naval Surface Weapons Center, Silver Spring,MD, 21 November 1975.
Klausen, Jorg, Serge P. Trober, Stefan B. Haderlein, and Rene P. Schwarzenbach. "Reduction of SubstitutedNitrobenzenes by Fe(II) in Aqueous Mineral Suspensions." Environ. Sci. Technol. 29, no. 9 (1995):2396-404.
Kulkarni, Ramchandra K. Pollutant Adsorbent Systems for TNT, RDX, and HMX in Wastewater, TR 8605.US Army Medical Research and Development Command, Frederick, MD, October 1986. AD-A188 407.
Lamson, Davis W., Peter Ulrich, and Robert 0. Hutchins. "Aromatic Denitration With Borohydride.Nucleophilic Displacement of Nitrite by Hydride." J. Org. Chem. 38, no. 17 (1973): 2928-30.
Larson, Richard A., Miller Penney L., and Thomas 0. Crowley. "Borohydride Photoreduction ofNitroaromatic Compounds Related to Military Ordnance Constituents." Environ. Sci. Technol. 30, no. 4(1996): 1192-7.
Layne, William S., Richard A. Nicholson, Richard M. Wahl, and Patrick M. O'Brian. Ultraviolet- OzoneTreatment of Pink Water - A Pilot Plant Study, 322. Mason & Hanger - Silas Mason Co., Inc.,Middletown, Iowa, 15 September 1980. Mason & Hanger - Silas Mason Co., Inc.

Lichtin, Norman N., Junchang Dong, and K. M. Vijayakumar. "Photopromoted Titanium Oxide-CatalyzedOxidative Decomposition of Organic Pollutants in Water and in the Vapor Phase." Water Pollut. Res.J. Can 27, no. 1 (1992): 203-10.
Lipczynska-Kochany, Eva. "Novel Method for a Photocatalytic Degradation of 4-Nitrophenol inHomogeneous Aqueous Solution." Environmental Technology 12 (1991): 87-92.
Low, G. K. C., S. R. McEvoy, and R. W. Matthews. "Formation of Nitrate and Ammonium Ions in TitaniumDioxide Mediated Photocatalytic Degredation of Organic Compounds Containing Nitrogen Atoms."Environ. Sci. Tech. 25 (1991): 460-467.
Low, Gary K. C., Stephen R. McEvoy, and R. W. Matthews. "Formation of Ammonium and Nitrate IonsFrom Photocatalytic Oxidation of Ring Nitrogenous Compounds Over Titanium Dioxide."Chemosphere 19, no. 10-11 (1989): 1611-21.
Low, Gary K. C., Stephen R_ McEvoy, and Ralph W. Matthews. "Formation of Nitrate and Ammonium Ionsin Titanium Dioxide Mediated Photocatalytic Degradation of Organic Compounds ContainingNitrogen Atoms." Environ. Sci. Technol 25, no. 3 (1991): 460-7.
Mabey, W. R., D. Tse, A. Baraze, and T. Mill. "Photolysis of Nitroaromatics in Aquatic Systems. I. 2,4,6-Trinitrotoluene." Chemosphere 12, no. 1 (1983): 3-16.
Mahannah, J. L. Survey of Generation and Management of Explosive-Laden Spent Carbon, CETHA-TS-CR-92024. Arthur D. Little, Inc., Cambridge, MA, November 1992. AD Little, Inc.
Matthews, R. W., and M. Abdullah. "Safeguarding the Environment: Organic Carbon Analysis in Water."Chem. Australia (1990): 85-89.
Matthews, R. W., M. Abdullal, and G. K. C. Low. "Photocatalytic Oxidation for Total Organic CarbonAnalysis." Anal. Chim. Acta 233 (1990): 171-79.
Matthews, Ralph W. "Kinetics of Photocatalytic Oxidation of Organic Solutes Over Titanium Dioxide."J.Catal. 111 (1988): 264-72.
McCormick, N. G., J. H. Cornell, and A. M. Kaplan. "Biodegradation of Hexahydro-1,3,5-Trinitro-1,3,5-Triazine." Applied and Environmental Microbiology 42, no. 5 (1981): 817-23.
McCormick, N. G., T. D. Peltonen, and A. M. Kaplan. Development of Design Parameters for an ExplosiveContaminated Wastewater Treatment System, WQEC/C 85-297. Naval Weapons Support Center, Crane,IN, June 1985. AD-A159 416.
McCormick, Neil G., Florence E. Feeherry, and Hillel S. Levinson. "Microbial Transformation of 2,4,6-Trinitrotoluene and Other Nitroaromatic Compounds." Applied and Environmental Microbiology 31, no.6 (1976): 949-58.
Miyares, Paul H., and Thomas F. Jenkins. Improved Salting Out Extraction-Preconcentration Method forthe Determination of Nitroaromatics and Nitramines in Water, SR91-18. U. S. Army, CRREL,Hanover, NH, October 1991. U. S. Army, CRREL.

0
Mondecar, M., J. Bender, J. Ross, W. George, and J. Preslan. "Removal of 2,4,6-Trinitrotoluene FromContaminated Water With Microbial Mats." Applied Biotechnology for Site Remediation, Editors RobertE. Hinchee, Daniel B. Anderson, and Gregory D. Sayles, 342-. Boca Raton, FL: Lewis Publishers, 1994.
Moza, P. N., K. Hustert, S. Pal, and P. Sukul. "Photocatalytic Decomposition of Pendimethalin andAlachlor." Chemosphere 25, no. 11 (1992): 1675-82.
Mueller, Wolfgang R., Glenn W. Bedell, Brian Baker, Saeed Shojaee, and Paul J. Jackson. Bioremediation ofTNT Wastes by Higher Plants.
Nay, Marshall W.Jr., Clifford W. Randall, and Paul H. King. "Biological Treatability of TrinitrotolueneManufacturing Wastewater." Water Pollution Control 46, no. 3 (March 1974): 485-97.
Noss, Charles I., and Ralph H. Chyrek. Tertiary Treatment of Effluent From Hoisten AAP Industrial LiquidWaste Treatment Facility IV. Ultraviolet Radiation and Hydrogen Peroxide Studies: TNT, RDX, HMX,TAX, and SEX, TR 8308. Fort Detrick, Frederick, MD, March 1984. AD-A141 135.
Okamoto, Yoshiyuki, and S. T. Attarwala. "Reactions of Trinitrotoluenes With Sodium Borohydride in aPhase Transfer Catalytic System." J. Org. Chem. 44, no. 18 (1979): 3269-7 1.
Pal, Bimal C., and Michael G. Ryon. Database Assessment of Pollution Control in the Military Explosivesand Propellants Production Industry, ORNL-6202. Oak Ridge National Laboratory, Oak Ridge, TN,February 1986. AD-A165 853.
Palmisano, L., V. Augugliaro, M. Schiavello, and A. Sclafani. "Influence of Acid-Base Properties onPhotocatalytic and Photochemical Processes." J. Mol. Catalysis 56 (1989): 284-95.
Patil, Sampatrao S., and Vijay M. Shinde. "Biodegradation Studies of Aniline and Nitrobenzene in AnilinePlant Waste Water by Gas Chromatography." ES & T22, no. 10 (1988): 1160-1165.
Pelizzetti, E., C. Minero, P. Piccinini, and M. Vincenti. "Phototransformations of Nitrogen ContainingOrganic Compounds Over Irradiated Semiconductor Metal Oxides. Nitrobenzene and Atrazine OverTitania and Zinc Oxide." Coord. Chem. Rev 125, no. 1-2 (1993): 183-93.
Pereira, W. E., D. L. Short, D. B. Manigold, and P. K. Roscio. "Isolation and Characterization of TNT and ItsMetabolites in Groundwater by Gas Chromatograph-Mass Spectrometer-Computer Techniques." Bull.Envrironm. Contain. Toxicol. 21 (1979): 554-62.
Prairie, M. R., L. R. Evans, B. M. Stange, and S. L. Martinez. "An Investigation of TiO2 Photocatalysis forthe Treatment of Water Contaminated With Metals and Organic Chemicals." Envir. Sci. Technol. 27,no. 9 (1993): 1776-82.
Roberts, D. J., R. H. Kaake, S. B. Funk, D. L. Crawford, and R. L. Crawford. "Anaerobic Remediation ofDinoseb From Contaminated Soil. An On-Site Demonstration." Applied Biochemistry andBiotechnology 39/40 (1993): 781-89.
Roberts, Deborah J., Farrukh Ahmad, and Suhasini Pendharkar. "Optimization of an Aerobic Polishing Stageto Complete the Anaerobic Treatment of Munitions-Contaminated Soils." Environ. Sci. Technol. 30, no. 6(1996): 2021-26. 0

0
Ronning, Mathew A., Ronald L. Atkins, and Carl A. Heller. "TNT Photolysis Quantum Yield."J. Photochem. 9 (1973): 403-5.
* Roth, Milton, and Joseph M. MurphyJr. Ultraviolet-Ozone and Ultraviolet-Oxidant Treatment of PinkWater, ARLCD-TR-78057. US Army Armament Research and Development Command, Large CaliberWeapon Systems Laboratory, Dover, NJ, Dover, NJ, November, 1978. AD-E400 263.
Schmelling, D. C., and K. A Gray. "Feasibility of Photocatalytic Degradation of TNT As a Single or0 Integrated Treatment Process." Trace Met. Environ 3, no. Photocatalytic Purification and Treatment of
Water and Air (1993): 625-31.
Schmelling, D. C., and K. A. Gray. "Feasibility of Photocatalytic Degradation of TNT As a Single orIntegrated Treatment Process ." Photocatalytic Purification and Treatment of Water, Eds. D. Ollis, andH. AI-Ekabi, 625pages. Holland: Elsevier Science Publishers.
Schmelling, Daniel C., and Kimberly A. Gray. "Photocatalytic Transformation and Mineralization of 2,4,6-Trinitrotoluene (TNT) in TiO2 Slurries." Water Res. 29, no. 12 (1995): 2651-62.
Schmelling, Daniel C., and Kimberly A. Gray. "Photocatalytic Transformations and Degradation of 2,4,6-Trinitrotoluene (TNT) in TiO2 Slurries." Crit. Issues Water Wastewater Treat., Proc. Natl. Conf.Environ. Eng.Joseph N. Ryan, and Marc Edwards, 751-5, New York, NY: American Society of CivilEngineers, 1994.
Schwarzenbach, Rene P., Ruth Stierli, Klaus Lanz, and J. Zeyer. "Quinone and Iron Porphyrin MediatedReduction of Nitroaromatic Compounds in Homogeneous Aqueous Solution." Environ. Sci. Technol. 24,
* no. 10 (1990): 1566-74.
Schwarzenbach, Rene P., Ruth Stierli, Klaus Lanz, and Josef Zeyer. "Quinone and Iron Porphyrin MediatedReduction of Nitroaromatic Compounds in Homogeneous Aqueous Solution." Environ. Sci. Technol. 24,no. 10 (1990): 1566-74.
0 Sierka, Raymond A. An Ultrasound Catalyzed Ozone Oxidation Process Feasibility Study for theDestruction of TNT and Other Explosives in Aqueous Solution, DRXTH-TE-CR-82175. USATHAMA,Aberdeen Proving Ground, MD, October 1982. AD A124 989.
Simmons, Milagros S., and Richard G. Zepp. "Influence of Humic Substances on Photolysis of NitroaromaticCompounds in Aqueous Systems." Wat. Res. 20, no. 7 (1986): 899-904.
Smith, John G. Water Quality Criteria for Nitroglycerin, DE86 013971. Oak Ridge National Laboratory,Oak Ridge, TN, July 1986. ORNL.
Smith, L. L., J. Carrazza, and K. Wong. "Biological Treatment for Waste Streams From Propellants andExplosives." J. Hazardous Materials 5 (1982): 277-96.
Smith, L. L., J. Carrazza, and K. Wong. "Treatment of Wastewaters Containing Propellants and Explosives."J. Hazardous Materials 7 (1983): 303-16.
* Stahl, J. D., and S. D. Aust. "Metabolism and Detoxification of TNT by Phanerochaete Chrysosporium."Biochem. and Biophys. Res. Comm. 192, no. 2 (1993): 477-82.
0

Stevens, Todd 0., Ronald L. Crawford, and Donald L. Crawford. "Selection and Isolation of BacteriaCapable of Degrading Dinoseb (2-Sec-Butyl-4,6-Dinitrophenol)." Biodegradation 2 (1991): 1-13.
Suhnel, J., and K. Gustav. "Theory of Proton-Transfer Reactions. On the Solvent Dependence of the KineticIsotope Effect." Chem. Phys. 33 (1984): 391-97.
T-Raissi, A., and N. Z. Muradov. "Flow Reactor Studies of Titanium Dioxide Photocatalytic Treatmentof Airborne Nitroglycerin." Trace Met. Environ 3, no. Photocatalytic Purification and Treatment of Waterand Air (1993): 435-54.
Triegel, Elly K., Joseph R. Kolmer, and Douglas W. Ouanian. Solidification and Thermal Degradation ofTNT Waste Sludges Using Asphalt Encapsulation, EPA/6007D-86/195. US Environmental ProtectionAgency, Cincinnati, OH, August 1986. NTIS.
Tsang, Wing, and John T. Herron. "Chemical Kinetic Data Base for Propellant Combustion. 1. ReactionsInvolving NO, N2 1HNO2 , HCN, and N20." J. Phys. Chem. Ref Data 20, no. 4 (1991): 609.
Wade, Robert C. "Catalyzed Reductions of Organofunctional Groups With Sodium Borohydride." J. Mol.Catal. 18 (1983): 273-97.
Walker, John E., and David L. Kaplan. "Biological Degradation of Explosives and Chemical Agents."Biodegradation 3 (1992): 369-85.
Walsh, Marianne E. Environmental Transformation and Products of Nitroaromatics and Nitramines.Literature Review and Recommendations for Analytical Method Development, SR90-2. U. S. ArmyCold Regions Research and Engineering Laboratory, Hanover, NH, February, 1990. U. S. Army, CRREL.
Wang, Zhikai, and Charles Kutal. "Photocatalytic Mineralization of 2,4,6-Trinitrotoluene in AqueousSuspensions of Titanium Dioxide." Chemosphere 30, no. 6 (1995): 1125-36.
Wentz, John A., John E. Spessard, Judy Hessling, and Mike Mahannah Janet Resch. Technology Evaluationfor Treatment of Red Water, 92-01435. USATHAMA, Aberdeen Proving Ground, MD, April 1990. AD-A244 873.
Wirth, Peter K. Explosives Waste Disposal Sites: A DOD-Wide Problem. Case Study: Milan ArmyAmmunition Plant O-Line Settling Ponds, USATHAMA, Aberdeen Proving Ground, MID, August 1984.AD-P004 854.
Woodward, Richard E. Evaluation of Composting Implementation: A Literature Review, TCN 89363.USATHAMA, Aberdeen Proving Ground, MD, July 1990. AD-A243 908.
Yinon, Jehuda, and Shmuel Zitrin. Modem Methods and Applications in Analysis of Explosives. New York,NY: John Wiley & Sons, 1993.

Form ApprovedREPORT DOCUMENTATION PAGE OMB NO. 0704-0188
Public reporting burden for this collection of information is estimated to average I hour per response, including the time for reviewing instructions, searching existing data sources,
gand raintaining the data needed, and completing and reviewing the collection of information. Send comments regarding this burden estimate or any other aspect of thisction of information, including suggestions for reducing this burden, to Washington Headquarters Services, Directorate for Information Operations and Reports, 1215 JeffersonDavis Highway, Suite 1204, Artinqton, VA 22202-4302, and to the Office of Management and Bud et Paperwork Reduction Project (0704-0188), Washinqton, DC 20503.
1. AGENCY USE ONLY (Leave 2. REPORT DATE 3. REPORT TYPE AND DATES COVEREDblank) October 1996 Technical Report
4. TITLE AND SUBTITLE 5. FUNDING NUMBERSPhotocatalytic Oxidation and Reduction Chemistry and a New Process for Treatment of PinkWater and Related Contaminated Water task# S161.36106. AUTHOR(S)
Daniel M. Blake, Edward Wolfrum, and James Boulter, NRELMichael Prairie, Steven Showalter, Philip Rodacy, Pam Leslie, and Bertha Stange, Sandia
7. PERFORMING ORGANIZATION NAME(S) AND ADDRESS(ES) 8. PERFORMINGNational Renewable Energy Laboratory, 1617 Cole Boulevard, Golden, Colorado 80401 ORGANIZATION REPORTSandia National Laboratories, Albuquerque, New Mexico NUMBER DE96013073
9. SPONSORING/MONITORING AGENCY NAME(S) AND ADDRESS(ES) 10.SPONSORING/MONITORING
Natonal Renewable Energy Laboratory AGENCY REPORT NUMBER1617 Cole BoulevardGolden, Colorado 80401 NREL/TP-430-211580
11. SUPPLEMENTARY NOTES
12a. DISTRIBUTION/AVAILABILITY STATEMENT 12b. DISTRIBUTION CODE
National Technical Information Service UC Category: 1414U.S. Department of Commerce5285 Port Royal RoadSpringfield, VA 22161
13. ABSTRACT (Maximum 200 words) Photocatalytic treatment of pink water under oxidative conditions can mineralize TNT, HMX,and RDX but requires long residence times and a large power consumption. Photocatalytic treatment under reducing conditions,using EDTA, citric acid, glucose, and sodium formate, converts TNT to other substances. Power costs are significantly less than forthe oxidative process. Biological treatment using Phanerochaete crysosporium following EDTA reduction of pink water partiallymineralized TNT. The degree of conversion of carbon to CO 2 depended on the duration of the photocatalytic pretreatment. Sixhours of pretreatment produced 32% mineralization. This innovative new process for treating pink water is an effective method forreducing the level of TNT below the detection limit of 20 ppb. HMX and RDX are removed at a somewhat lower rate. Partiesinterested in learning more about this process may contact the authors of this report at NREL. Annual operating costs are estimatedat $179,000 for a 150 gpm flow of pink water. The currently used carbon adsorption process costs $323,500. Capital costs arebelieved to be similar for both processes.
14. SUBJECT TERMS 15. NUMBER OF PAGES
Pink water TNT HMX RDX Phanerochaete crysosporiumPhotocatalytic reduction 16. PRICE CODE
17. SECURITY 18. SECURITY 19. SECURITY 20. LIMITATION OFCLASSIFICATION CLASSIFICATION CLASSIFICATION ABSTRACT
OF REPORT OF THIS PAGE OF ABSTRACT
NSN 7540-01-280-5500 Standard Form 298 (Rev. 2-89)Prescribed by ANSI Std. Z39-18
298-102


![Stange d ay 2_5_sj+©helsekonferansen-2012[1]](https://img.pdfslide.us/doc/110x75/5571b7b1d8b42ac0228b48ff/stange-d-ay-25sjhelsekonferansen-20121-55849462ebd6d.jpg)