Embed Size (px)
Citation preview
Remember: Derivative=Slope of the Tangent Line
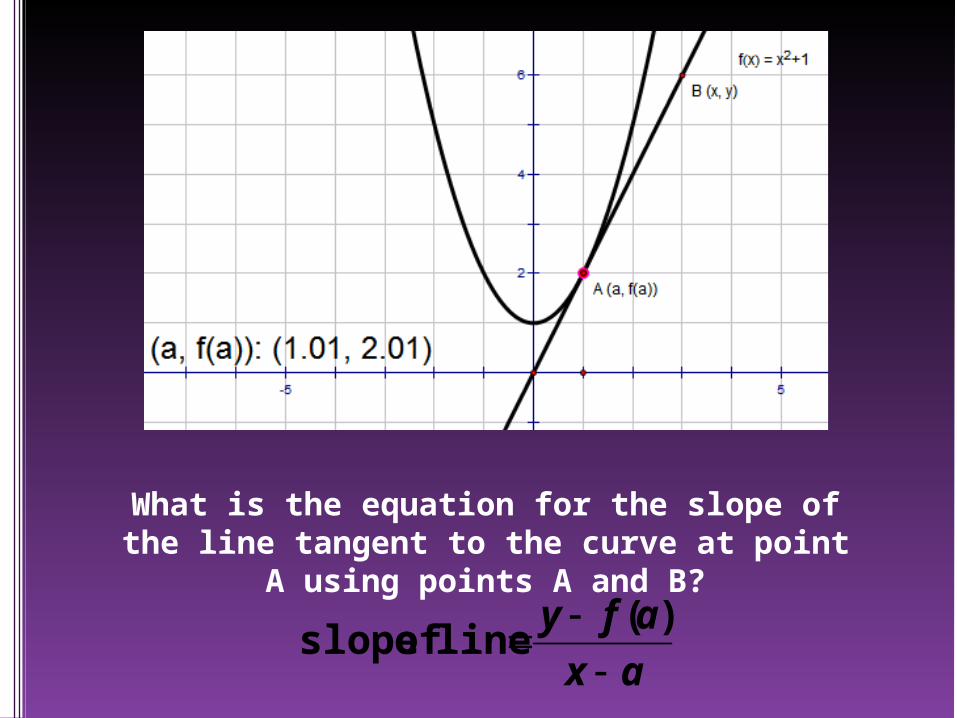
What is the equation for the slope of the line tangent to the curve at point A
using points A and B?
axafy
)(
line of slope
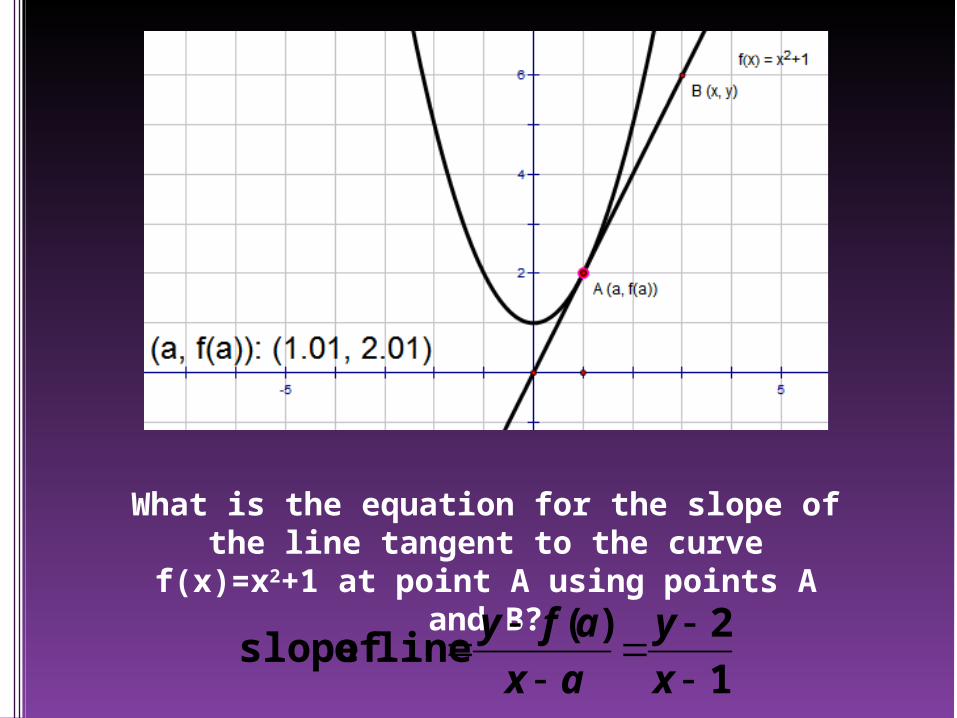
What is the equation for the slope of the line tangent to the curve f(x)=x2+1
at point A using points A and B?
12)(
line of slope
xy
axafy
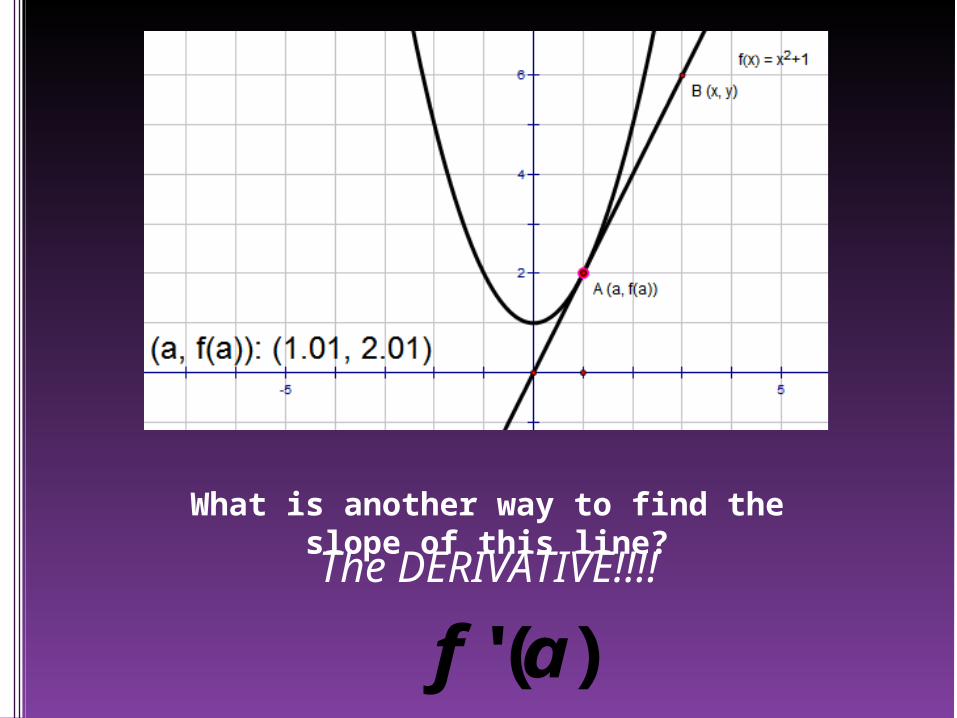
What is another way to find the slope of this line?
The DERIVATIVE!!!!
)(' af
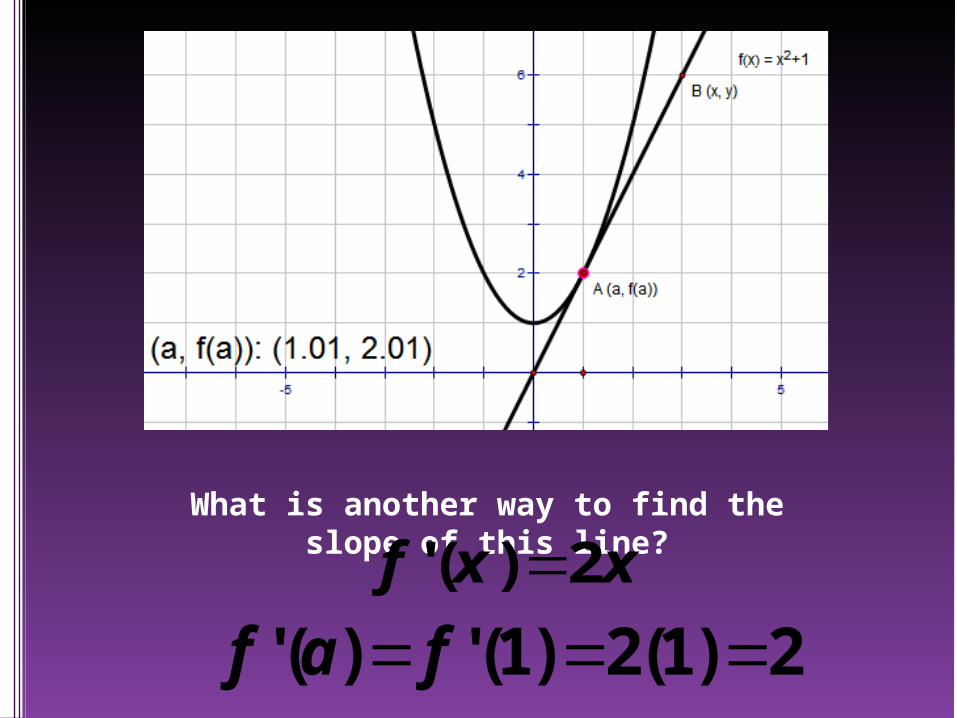
What is another way to find the slope of this line?xxf 2)('
2)1(2)1(')(' faf
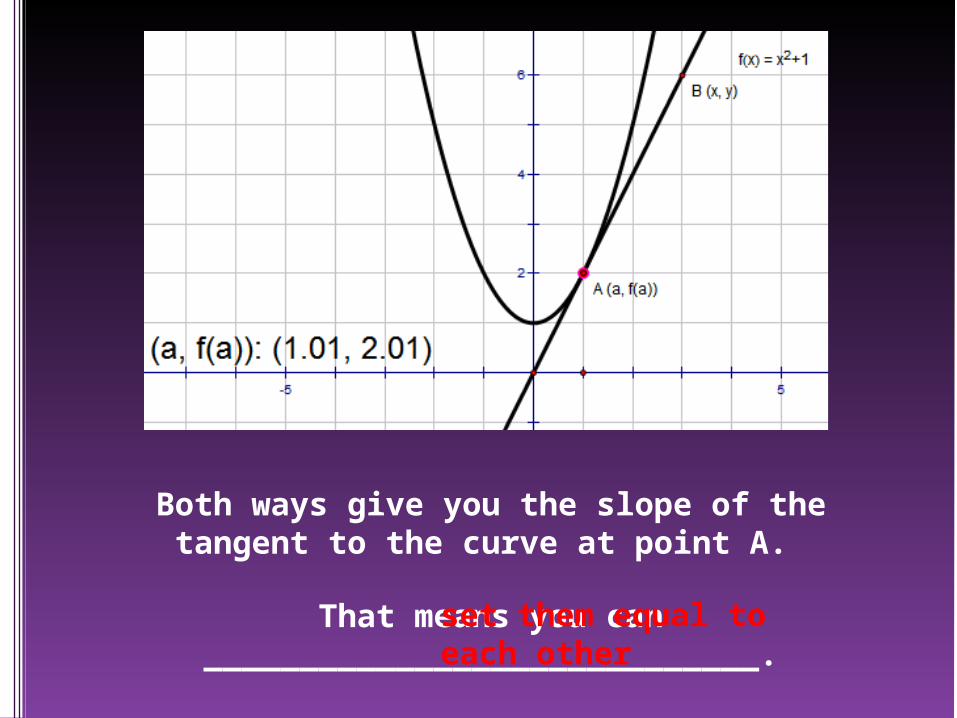
Both ways give you the slope of the tangent to the curve at point A.
That means you can _____________________________.set them equal to each other
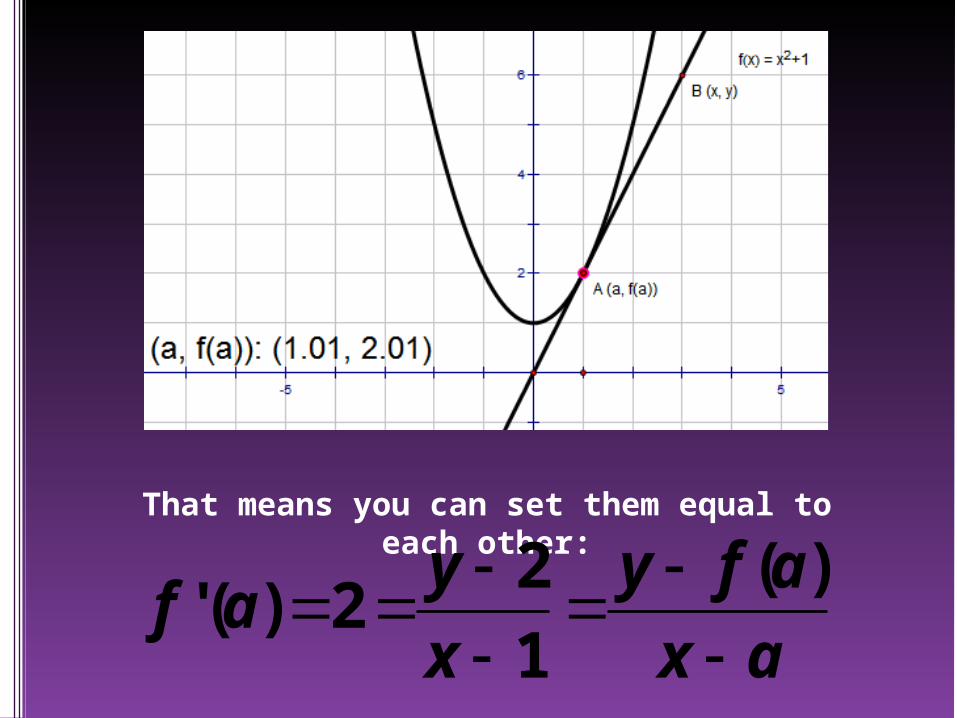
That means you can set them equal to each other:
axafy
xy
af
)(
12
2)('
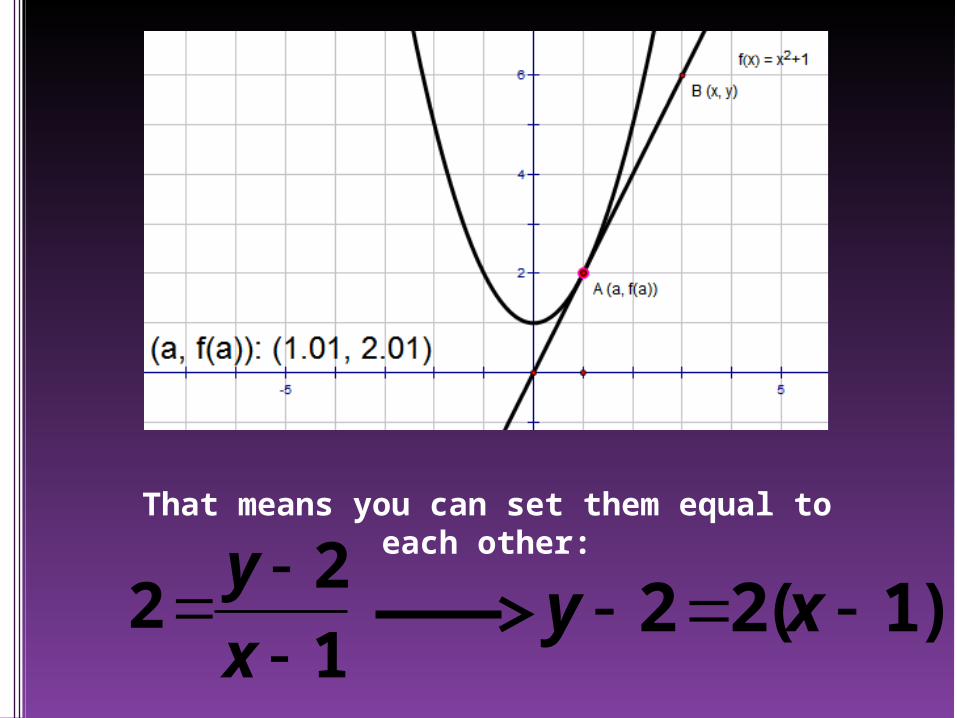
That means you can set them equal to each other:
12
2
xy
)1(22 xy
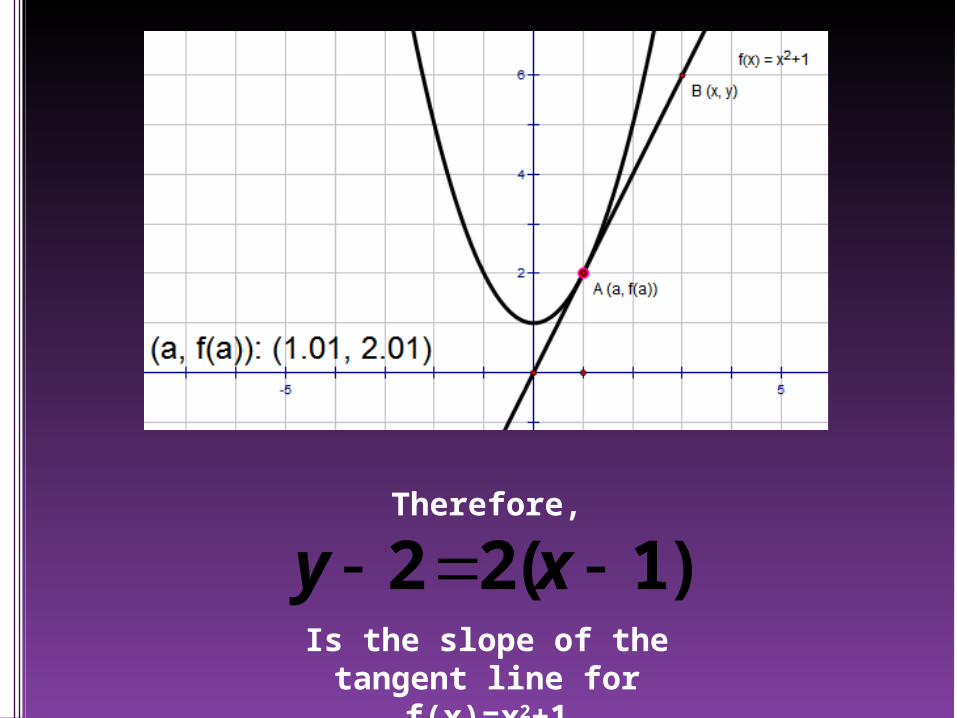
Therefore,
)1(22 xyIs the slope of the
tangent line for f(x)=x2+1
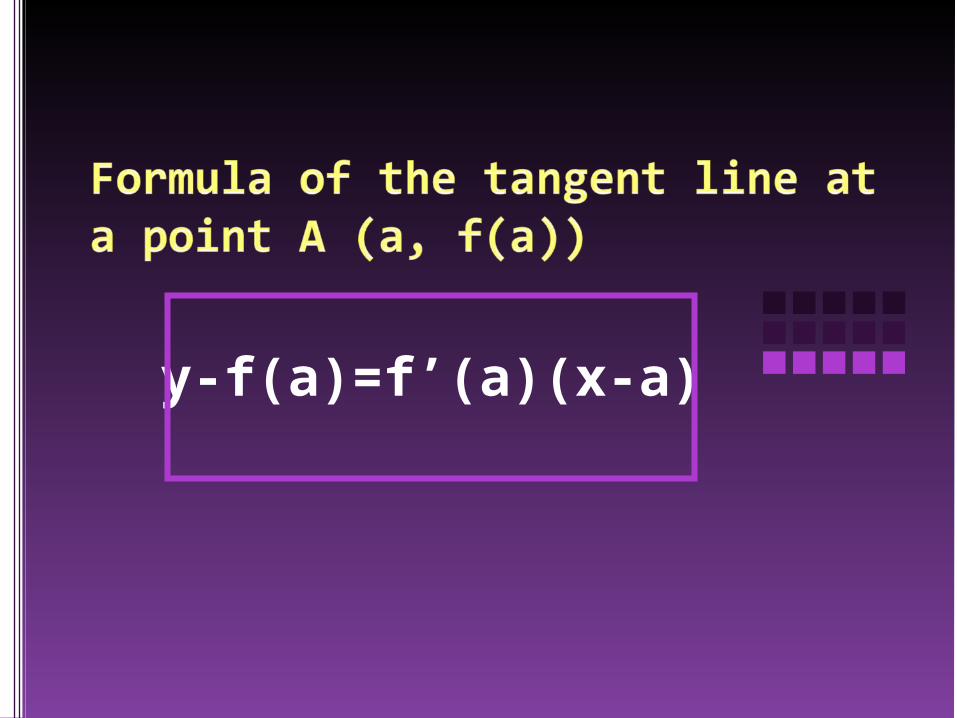
y-f(a)=f’(a)(x-a)
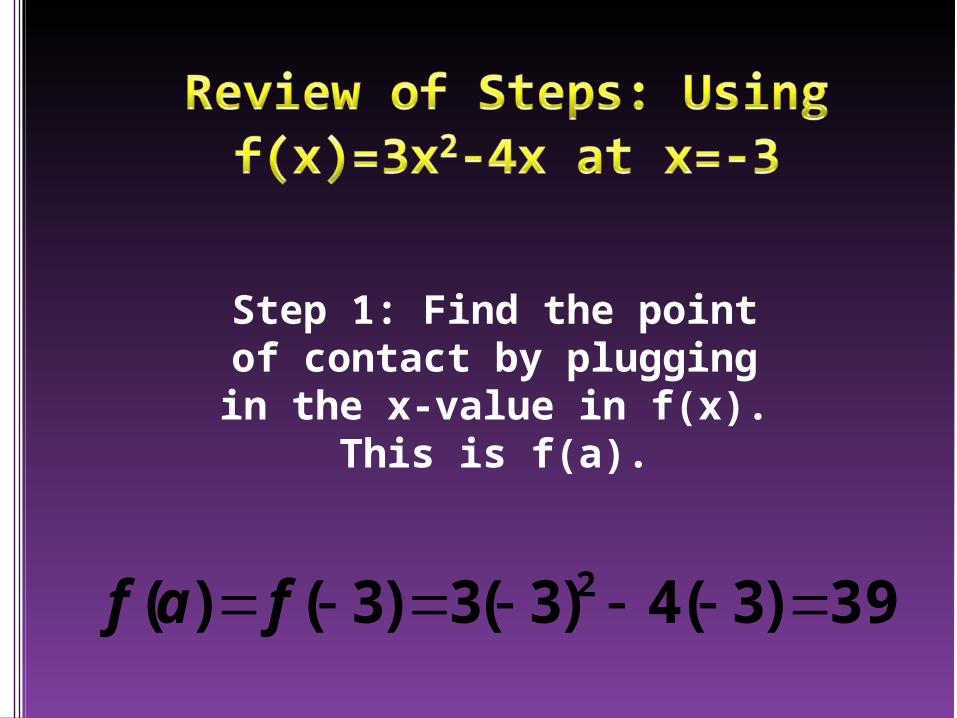
Step 1: Find the point of contact by plugging in
the x-value in f(x). This is f(a).
39)3(4)3(3)3()( 2 faf
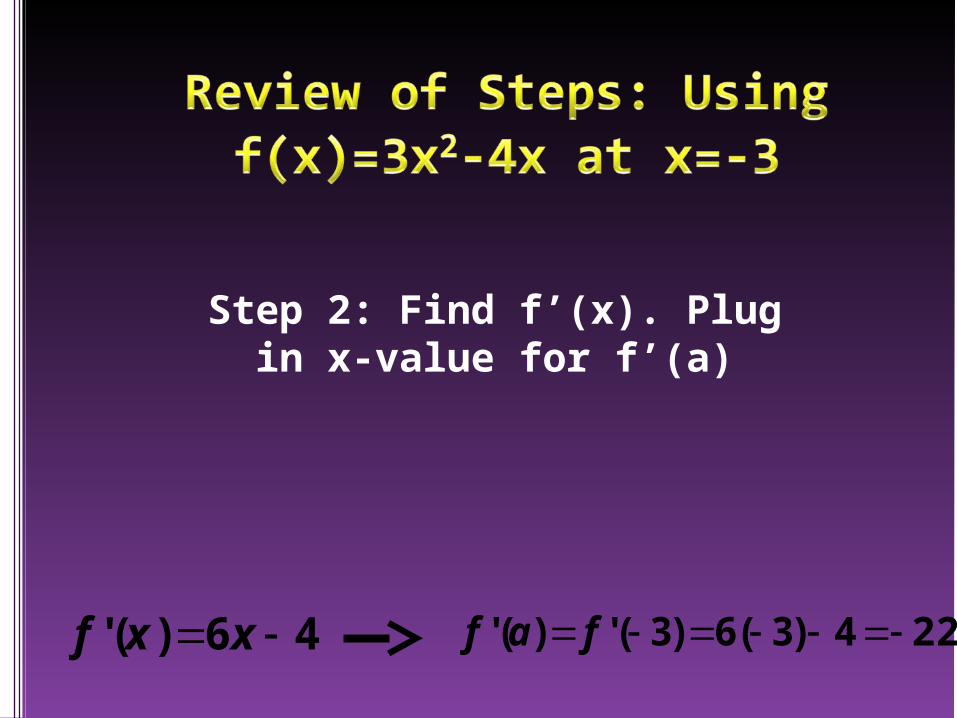
Step 2: Find f’(x). Plug in x-value for f’(a)
46)(' xxf 224)3(6)3(')(' faf
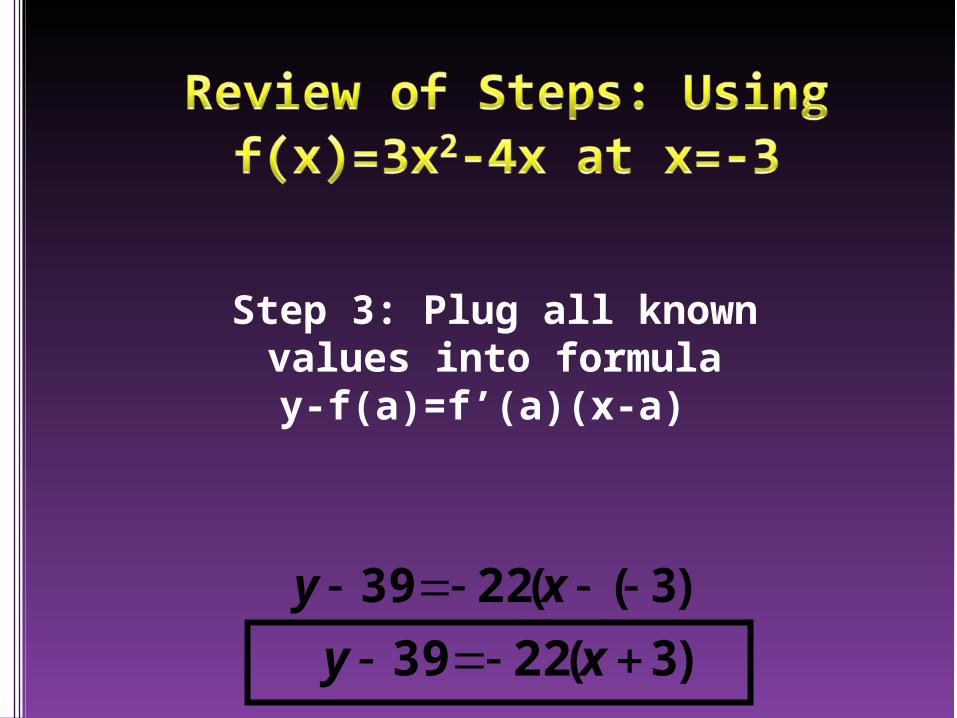
Step 3: Plug all known values into formula
y-f(a)=f’(a)(x-a)
))3((2239 xy
)3(2239 xy
Find the equation of the tangent to y=x3+2x at:x=2
x=-1
x=-2
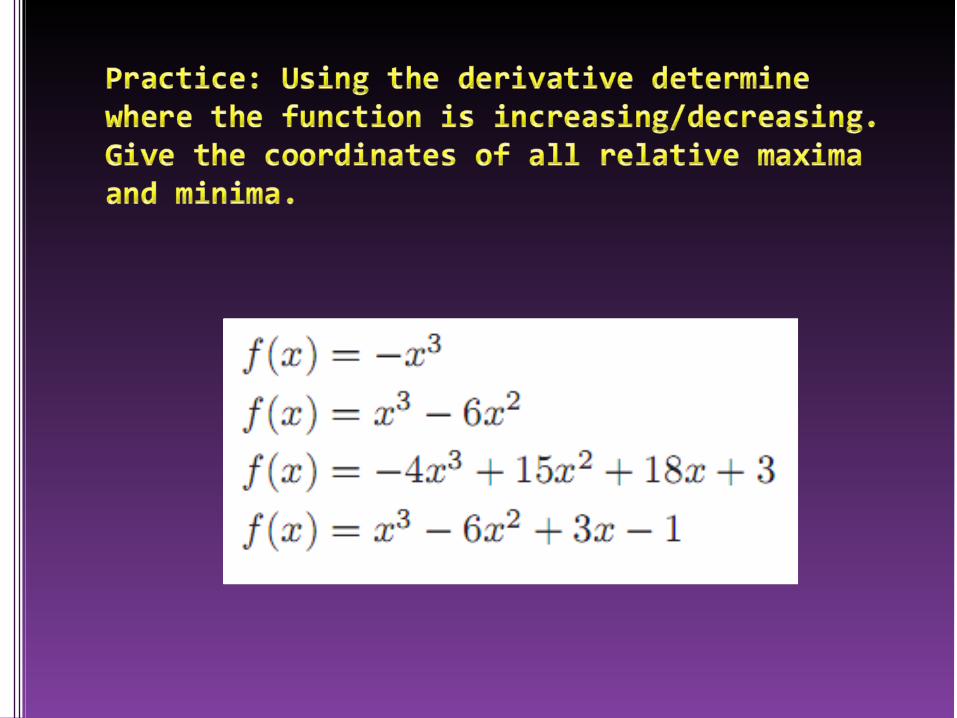
f’(x)=0
Step 1: Find the derivative, f’(x)
Step 2: Set derivative equal to zero and solve, f’(x)=0
Step 3: Plug solutions into original formula to find y-
value, (solution, y-value) is the coordinates.
Note: If it asks for the equation then you will write y=y value found when you
plugged in the solutions for f’(x)=0
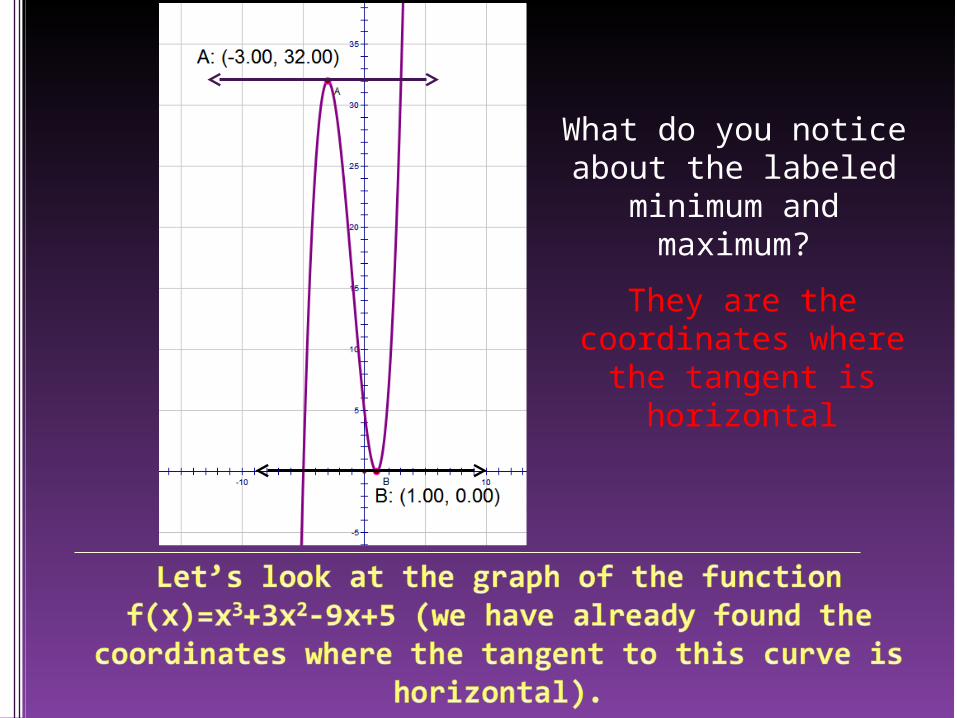
What do you notice about the labeled
minimum and maximum?
They are the coordinates where
the tangent is horizontal
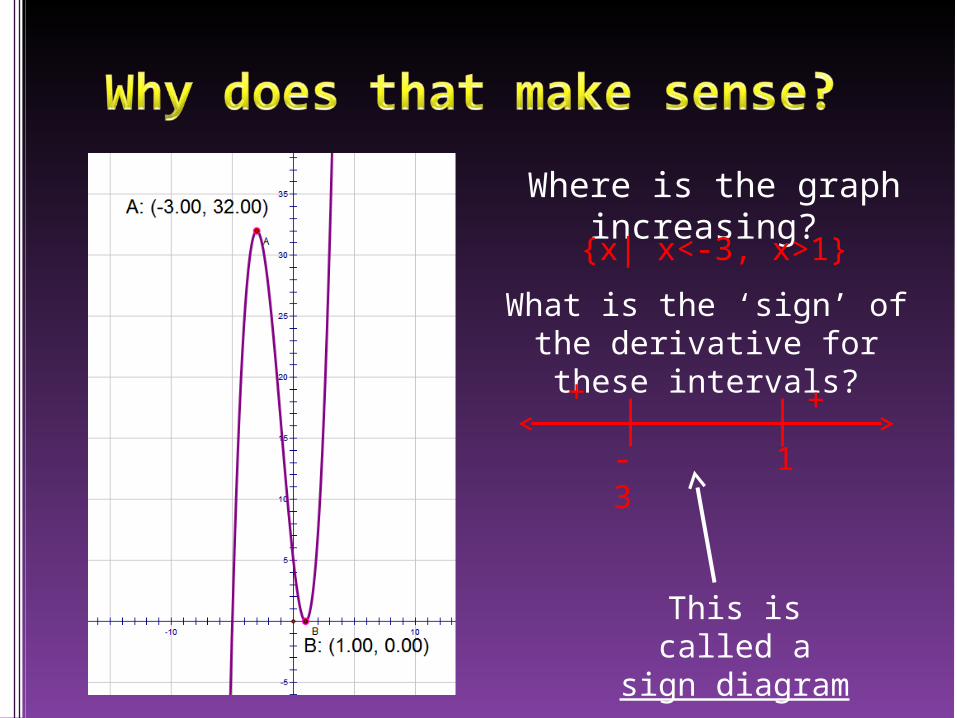
Where is the graph increasing?
{x| x<-3, x>1}
What is the ‘sign’ of the derivative for these
intervals?
-3 1
+ +
This is called a sign diagram
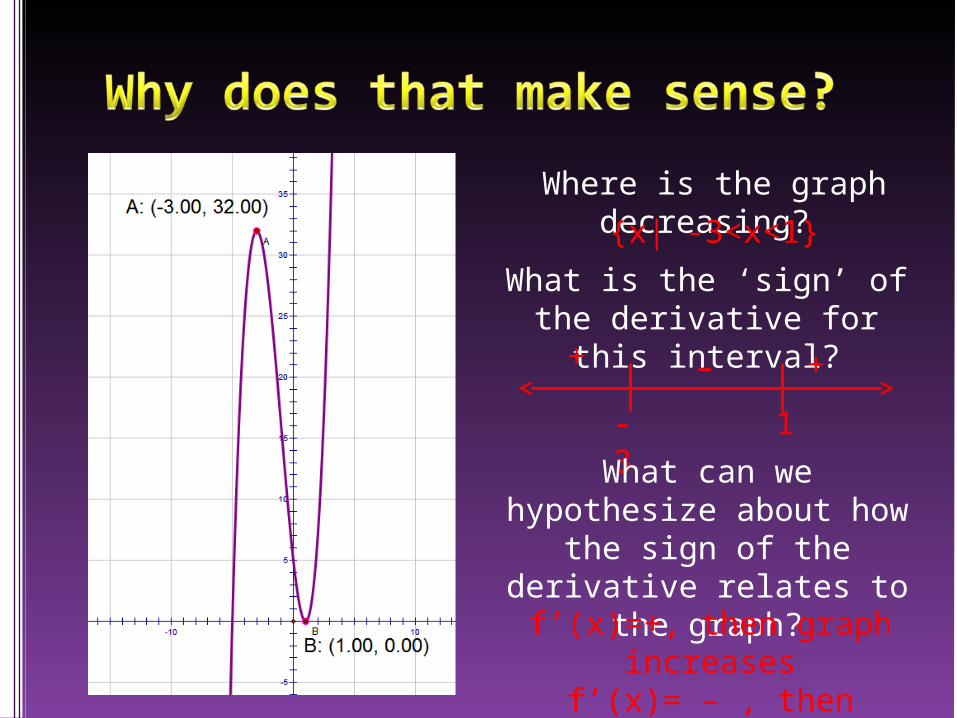
Where is the graph decreasing?
{x| -3<x<1}
What is the ‘sign’ of the derivative for this
interval?
-3 1
+ + –
What can we hypothesize about how
the sign of the derivative relates to the graph?f’(x)=+, then graph
increasesf’(x)= – , then graph
decreases
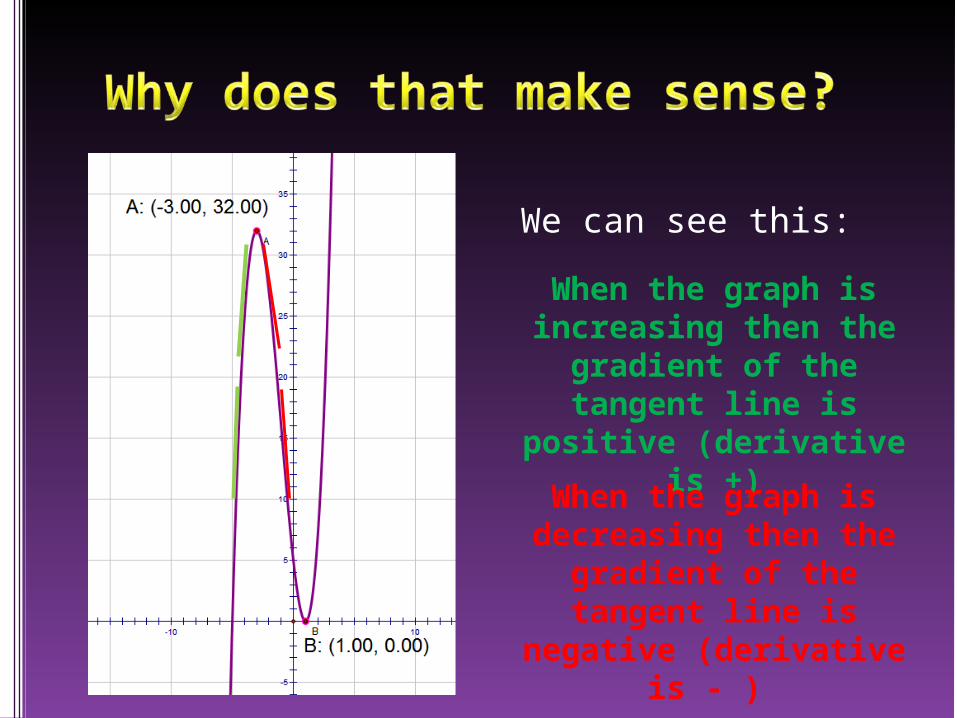
We can see this:
When the graph is increasing then the
gradient of the tangent line is positive
(derivative is +)
When the graph is decreasing then the
gradient of the tangent line is
negative (derivative is - )

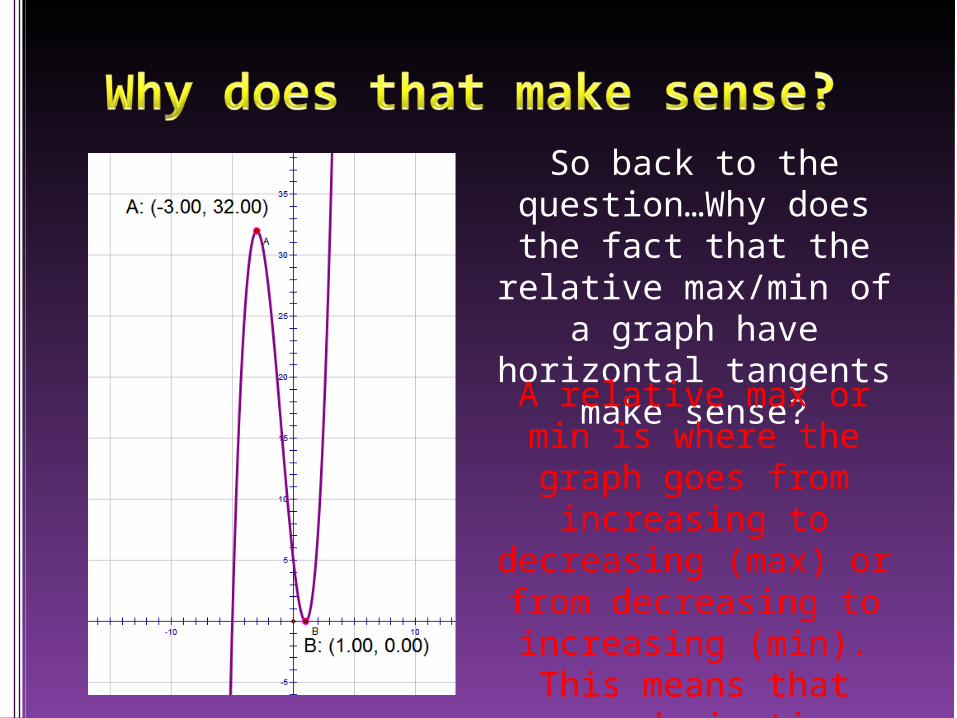
So back to the question…Why does
the fact that the relative max/min of a graph have horizontal tangents make sense?A relative max or min
is where the graph goes from increasing to decreasing (max)
or from decreasing to increasing (min). This
means that your derivative needs to
change signs.
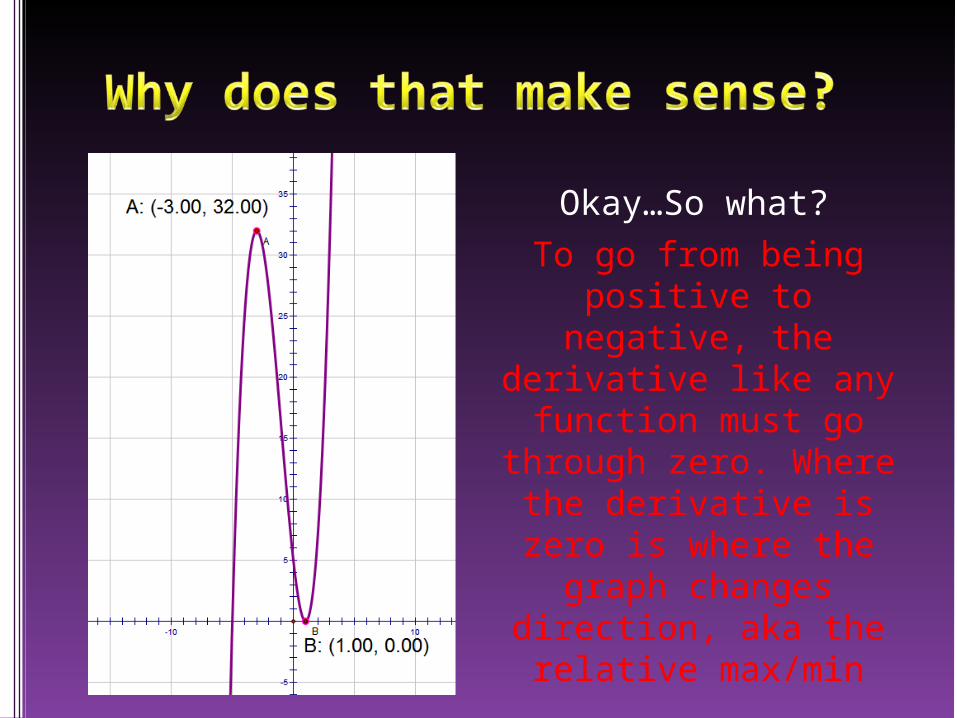
Okay…So what?
To go from being positive to negative,
the derivative like any function must go
through zero. Where the derivative is zero is where the graph
changes direction, aka the relative max/min
Take a look at f(x)=x3. What is the coordinates of the point on
the function where the derivative is equal to 0? Find the graph in
your calculator, is this coordinate a relative maximum or a relative
minimum?NO – the graph only flattened out then continued in the same
direction
This is called a HORIZONTAL INFLECTION
It is necessary to make a sign diagram to determine whether
the coordinate where f’(x)=0 is a relative maximum, minimum, or
a horizontal inflection.
Anywhere that f’(x)=0 is called a stationary point; a stationary point
could be a relative minimum, a relative maximum, or a horizontal inflection
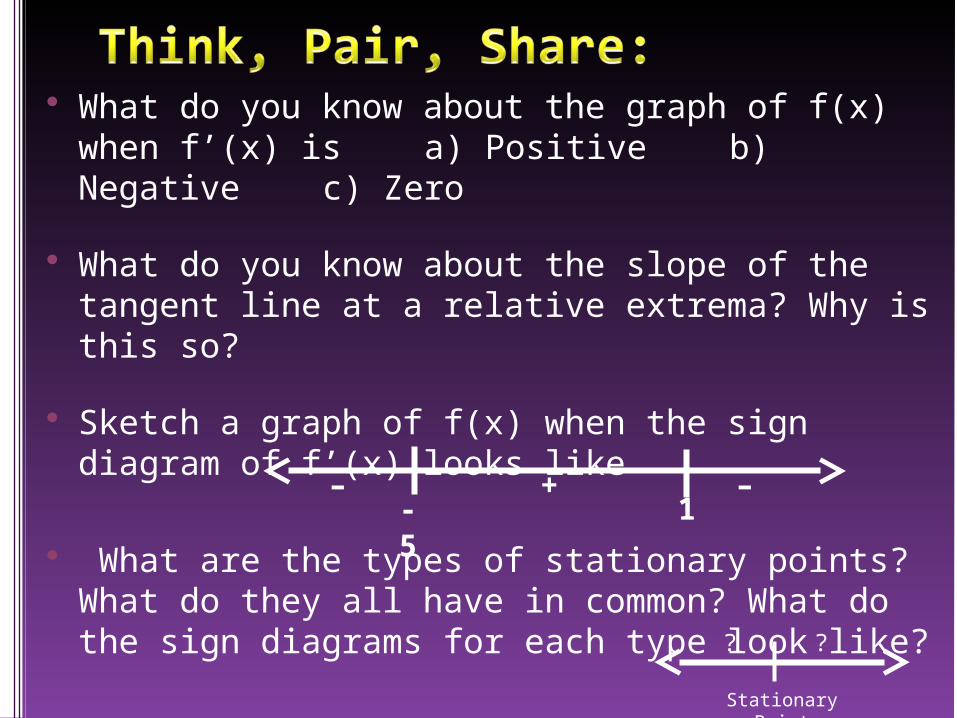
What do you know about the graph of f(x) when f’(x) is a) Positive b) Negative
c) Zero
What do you know about the slope of the tangent line at a relative extrema? Why is this so?
Sketch a graph of f(x) when the sign diagram of f’(x) looks like
What are the types of stationary points? What do they all have in common? What do the sign diagrams for each type look like?
-5
1
– – +
Stationary Point
? ?