Embed Size (px)
DESCRIPTION
Harrisonburg & Rockingham County Real Estate Market Report
Citation preview

An analysis of real estate activity through September 30, 2012 provided courtesy of Scott P. Rogers, Funkhouser Real Estate Group
Harrisonburg & Rockingham County Real Estate Market Report
Views from Crossroads Farm . . . . . . . . . . . . . . . . . . . . . . . . . . . . . . . . . . . . . . . . . . . . . . . . http://80462.scottprogers.com
OCTOBER 2012

October 9, 2012
logo.indd 1 7/28/2008 3:10:30 PM
Report courtesy of Scott P. Rogers, Associate Broker, Funkhouser Real Estate Group, based on information from the Harrisonburg-Rockingham Association of REALTORS (R) or its MLS, for the period 01/01/2000 through 09/30/2012.
Executive Summary
Pace of Home Sales: September67 homes sold in September 2012, showing a 15% decline from September 2011 when 79 homes sold -- though a 22% increase from September 2010 when 55 homes sold. Home Values: SeptemberMedian sales prices increased 11% and average sales prices increased 19% when comparing September 2012 to September 2011. Days on Market: SeptemberHomes sold in an average of 207 days in September 2012, a 8% decline from 224 days in September 2011 though a 13% increase from the 184 day average in September 2010.
The summary below is based on residential sales in Harrisonburg and Rockingham County as reflected in the HRAR MLS.
Pace of Home Sales: Year to Date638 homes sold in the first nine months of 2012. This is a 6% increase from 2011 when 601 homes had sold, and a 9% increase as compared to 2010 when 587 homes sold. Home Values: Year to DateMedian sales prices increased 1.3% and average sales prices increased 0.8% when comparing 2012 YTD values to 2011 YTD. Days on Market: Year to DateThe length of time on the market for homes selling in 2012 (221 days) increased 5% since 2011 when the average was 211 days on the market.
Buyer Activity98 buyers committed to buy in September 2012, compared to 67 in September 2011 -- which is a significant 46% increase.
Single Family Home Sales489 single family homes sold thus far in 2012, compared to a total of 622 in 2011. The median sales price has increased to $195,000. Townhouse Sales149 townhouses sold thus far in 2012, compared to a 2011 total of 169 townhomes. The median townhome sales price has declined to $140,000 in 2012 from $144,000 in 2011.
Foreclosures194 trustee deeds have been recorded thus far in 2012 compared to 638 home sales reported through the HRAR MLS.
InventoryInventory levels decreased during September 2012 to 698 residential properties currently for sale, down from 706 one month ago, and down from 846 one year ago.
SupplyAll price ranges still show an excess of housing supply, with 9 months under $200k, 10 months between $200k and $300k, 11 months between 300k and $400k, and 41 months above $400k. Price Per Square FootMedian price per square foot of single family homes has decreased to $102/sf in the 3rd quarter of 2012, as compared to $106/sf in the 2nd quarter of 2012.
Lot Sales41 lots of less than an acre sold thus far in 2012, compared to a 2011 total of 60 lots. Median lot sales prices have risen to $56,000 from $54,500 during 2011.
Land Sales36 parcels of land greater than an acre sold thus far in 2012 compared to 49 land sales during all of 2011. The median price per acre has decreased to $12,861 in 2012.
October 9, 2012
logo.indd 1 7/28/2008 3:10:30 PM
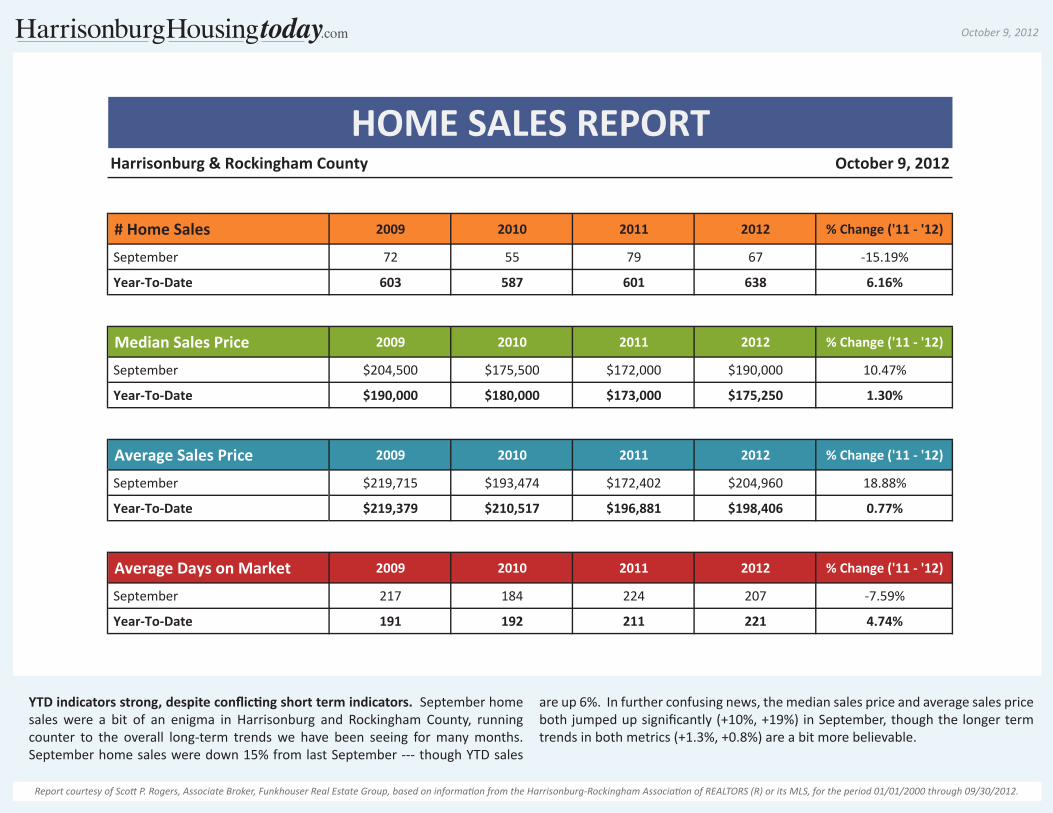
YTD indicators strong, despite conflicting short term indicators. September home sales were a bit of an enigma in Harrisonburg and Rockingham County, running counter to the overall long-term trends we have been seeing for many months. September home sales were down 15% from last September --- though YTD sales
are up 6%. In further confusing news, the median sales price and average sales price both jumped up significantly (+10%, +19%) in September, though the longer term trends in both metrics (+1.3%, +0.8%) are a bit more believable.
Harrisonburg & Rockingham County October 9, 2012
# Home Sales 2009 2010 2011 2012 % Change ('11 - '12)
September 72 55 79 67 -15.19%
Year-To-Date 603 587 601 638 6.16%
Median Sales Price 2009 2010 2011 2012 % Change ('11 - '12)
September $204,500 $175,500 $172,000 $190,000 10.47%
Year-To-Date $190,000 $180,000 $173,000 $175,250 1.30%
Average Sales Price 2009 2010 2011 2012 % Change ('11 - '12)
September $219,715 $193,474 $172,402 $204,960 18.88%
Year-To-Date $219,379 $210,517 $196,881 $198,406 0.77%
Average Days on Market 2009 2010 2011 2012 % Change ('11 - '12)
September 217 184 224 207 -7.59%
Year-To-Date 191 192 211 221 4.74%
HOME SALES REPORT
Report courtesy of Scott P. Rogers, Associate Broker, Funkhouser Real Estate Group, based on information from the Harrisonburg-Rockingham Association of REALTORS (R) or its MLS, for the period 01/01/2000 through 09/30/2012.

October 9, 2012
logo.indd 1 7/28/2008 3:10:30 PM
Sales stronger in the City, Prices stronger in the County. The data tables above explores overall sales trends of properties in the City of Harrisonburg as compared to Rockingham County. Don’t mind the drastic swings when only comparing one month of data, as the sample size is quite small -- pay more attention to the YTD
changes in the metrics noted above. For example, the County has seen an increase (+7.42%) in year-to-date median sales price over the past year, while the City has seen a decline (-1.81%) in the same metric. The rate of increase in sales, however, is stronger in the City (+7.69%) as compared to the County (+5.34%).
# Home Sales 2011 2012 % Change 2011 2012 % Change
September 27 21 -22.22% 52 46 -11.54%
Year-To-Date 208 224 7.69% 393 414 5.34%
Median Sales Price 2011 2012 % Change 2011 2012 % Change
September $165,500 $175,000 5.74% $175,500 $210,450 19.91%
Year-To-Date $165,750 $162,750 -1.81% $179,000 $192,283 7.42%
Average Days on Market 2011 2012 % Change 2011 2012 % Change
September 253 205 -18.97% 209 207 -0.96%
Year-To-Date 224 229 2.23% 203 216 6.40%
HOME SALES REPORT :: BY AREACity of Harrisonburg
City of Harrisonburg
City of Harrisonburg
Rockingham County
Rockingham County
Rockingham County
Report courtesy of Scott P. Rogers, Associate Broker, Funkhouser Real Estate Group, based on information from the Harrisonburg-Rockingham Association of REALTORS (R) or its MLS, for the period 01/01/2000 through 09/30/2012.

October 9, 2012
logo.indd 1 7/28/2008 3:10:30 PM
Perhaps August borrowed some September buyers? September home sales were surprisingly slow this year (67) as compared to last September (79) -- though it may have been a result of the strong month of sales seen in August (92). When comparing August+September sales figures this year there were 159 sales --- as
compared to 158 sales in the same two months last year. Over all, the pace of home sales in our local market is still increasing, though September was a surprisingly low month of sales given the strong performance of so many other months during 2012.
37
53
57
51
75
86
95
77
71
62
84
69
45
5349
83
71
117
52
62
55
49
58
64
4038
61
78
68
81
7779 79
5658
79
39
46
66
7377
84
9492
67
0
25
50
75
100
125
JAN FEB MAR APR MAY JUN JUL AUG SEP OCT NOV DEC
Sing
le F
amily
, Tow
nhom
e &
Con
do S
ales
Harrisonburg & Rockingham County
Month-By-Month Home Sales History 2009
2010
2011
2012
September 201267 Home Sales
Report courtesy of Scott P. Rogers, Associate Broker, Funkhouser Real Estate Group, based on information from the Harrisonburg-Rockingham Association of REALTORS (R) or its MLS, for the period 01/01/2000 through 09/30/2012.
October 9, 2012
logo.indd 1 7/28/2008 3:10:30 PM
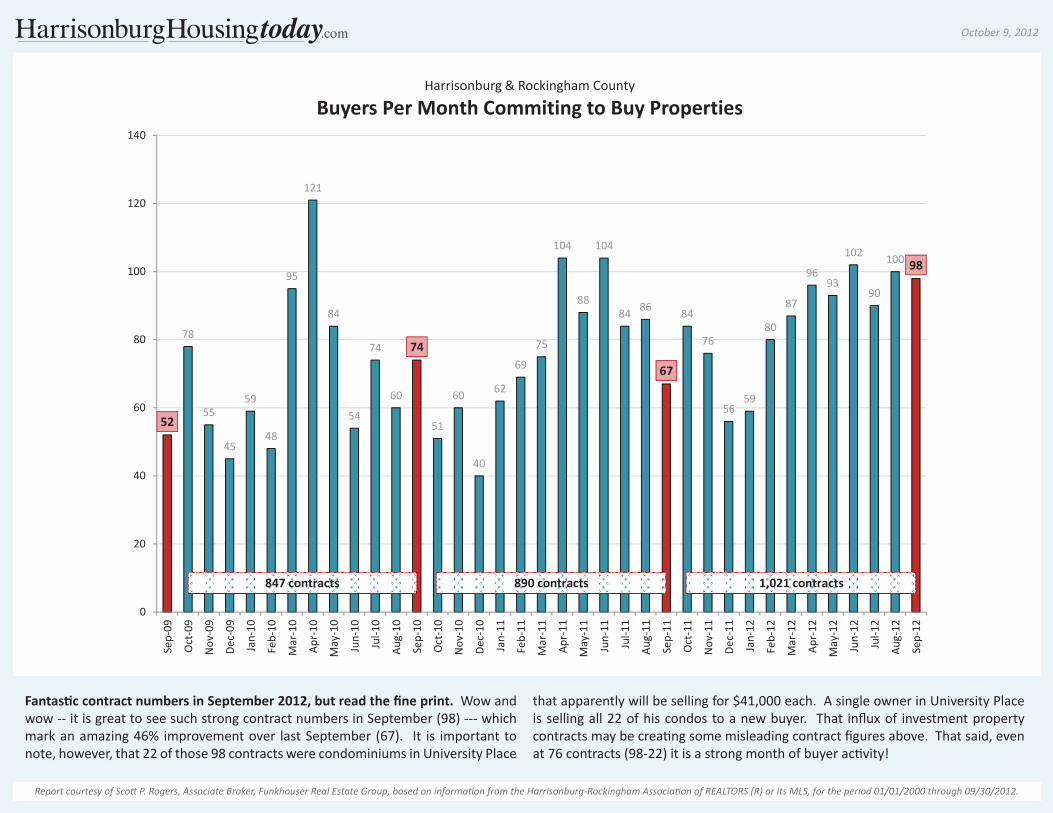
Fantastic contract numbers in September 2012, but read the fine print. Wow and wow -- it is great to see such strong contract numbers in September (98) --- which mark an amazing 46% improvement over last September (67). It is important to note, however, that 22 of those 98 contracts were condominiums in University Place
that apparently will be selling for $41,000 each. A single owner in University Place is selling all 22 of his condos to a new buyer. That influx of investment property contracts may be creating some misleading contract figures above. That said, even at 76 contracts (98-22) it is a strong month of buyer activity!
52
78
55
45
59
48
95
121
84
54
74
60
74
51
60
40
62
69
75
104
88
104
84 86
67
84
76
5659
80
87
9693
102
90
100 98
0
20
40
60
80
100
120
140
Sep-
09
Oct
-09
Nov
-09
Dec-
09
Jan-
10
Feb-
10
Mar
-10
Apr-
10
May
-10
Jun-
10
Jul-1
0
Aug-
10
Sep-
10
Oct
-10
Nov
-10
Dec-
10
Jan-
11
Feb-
11
Mar
-11
Apr-
11
May
-11
Jun-
11
Jul-1
1
Aug-
11
Sep-
11
Oct
-11
Nov
-11
Dec-
11
Jan-
12
Feb-
12
Mar
-12
Apr-
12
May
-12
Jun-
12
Jul-1
2
Aug-
12
Sep-
12
Harrisonburg & Rockingham County
Buyers Per Month Commiting to Buy Properties
847 contracts 890 contracts 1,021 contracts
Report courtesy of Scott P. Rogers, Associate Broker, Funkhouser Real Estate Group, based on information from the Harrisonburg-Rockingham Association of REALTORS (R) or its MLS, for the period 01/01/2000 through 09/30/2012.

October 9, 2012
logo.indd 1 7/28/2008 3:10:30 PM
September 2012 is not a good team player. This graph shows the month by month cumulative count of residential sales in Harrisonburg and Rockingham County. Last year’s home sales (794) exceeded 2010 home sales (758), and this year is off to a good start with stronger year-to-date sales (571) as compared to 2011 (522) during
the same time period. September of this year was not a good contributor to the overall increase in sales that we are experiencing in 2012. March, May, July and August have shown the biggest gains this yer as compared to last year.
45 40 39
98 78 85
147 139 151
230 217 224
301 285 301
418366 385
470443
479
532 522571
587 601638636 657
694715
758794
0
100
200
300
400
500
600
700
800
900
2010 2011 2012
Harrisonburg & Rockingham County
Monthly Cumulative Residential Sales
DEC
NOV
OCT
SEP
AUG
JUL
JUN
MAY
APR
MAR
FEB
JAN
Report courtesy of Scott P. Rogers, Associate Broker, Funkhouser Real Estate Group, based on information from the Harrisonburg-Rockingham Association of REALTORS (R) or its MLS, for the period 01/01/2000 through 09/30/2012.
October 9, 2012
logo.indd 1 7/28/2008 3:10:30 PM
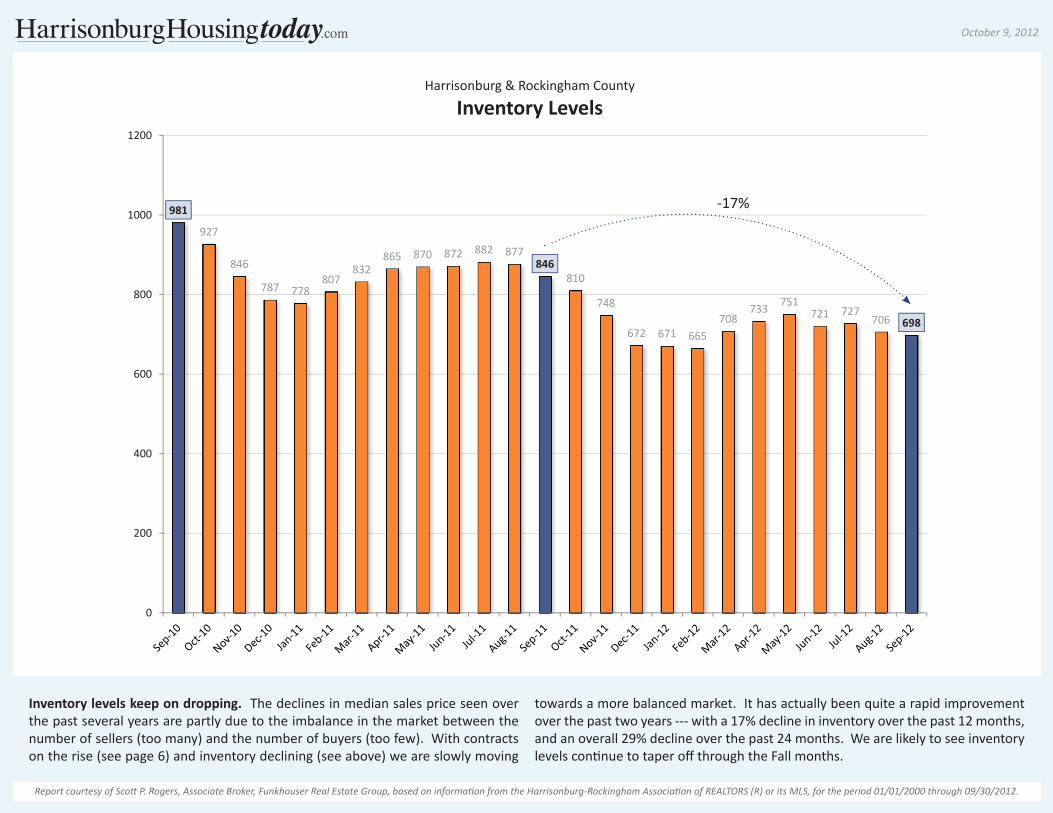
Inventory levels keep on dropping. The declines in median sales price seen over the past several years are partly due to the imbalance in the market between the number of sellers (too many) and the number of buyers (too few). With contracts on the rise (see page 6) and inventory declining (see above) we are slowly moving
towards a more balanced market. It has actually been quite a rapid improvement over the past two years --- with a 17% decline in inventory over the past 12 months, and an overall 29% decline over the past 24 months. We are likely to see inventory levels continue to taper off through the Fall months.
981
927
846
787 778807
832865 870 872 882 877
846810
748
672 671 665708
733 751721 727
706 698
0
200
400
600
800
1000
1200
Harrisonburg & Rockingham County
Inventory Levels
Report courtesy of Scott P. Rogers, Associate Broker, Funkhouser Real Estate Group, based on information from the Harrisonburg-Rockingham Association of REALTORS (R) or its MLS, for the period 01/01/2000 through 09/30/2012.
-17%

October 9, 2012
logo.indd 1 7/28/2008 3:10:30 PM
Home prices steadying. This graph provides an overall indicator of the state of our housing market, showing both the number of homes being sold each year since 2000 (yellow bars) as well as changes in the median sales price during the same time period (blue line). After five years of declines in home sales (2005-2010) the
pace finally picked up in 2011 with a 4% year-over-year increase. With stronger YTD sales in 2012 (+6.2%) we will likely see further improvement in the pace of home sales this year, and it seems quite possible that home values (as measured by median price) will level off this year, as they have increased slightly so far this year.
829
1,071
1,153
1,324
1,507
1,669
1,438
1,248
936
816758
791
638
$116
,000
$122
,900
$122
,588
$127
,700 $1
49,0
00 $169
,900
$192
,983
$195
,100
$195
,500
$186
,000
$180
,000
$174
,900
$175
,250
$0
$50,000
$100,000
$150,000
$200,000
$250,000
0
200
400
600
800
1,000
1,200
1,400
1,600
1,800
2000 2001 2002 2003 2004 2005 2006 2007 2008 2009 2010 2011 2012
Harrisonburg & Rockingham County
Home Sales & Price TrendsSingle Family Homes & Townhomes
+14%
+11%-14%
-13%
-25%
+15%
+8%
+29%
+6%-0.3% +4%
+17%
+14%
+14%
+1% +0.2%
-13%
-5%
-7%
-3%
+4%
-3%
Report courtesy of Scott P. Rogers, Associate Broker, Funkhouser Real Estate Group, based on information from the Harrisonburg-Rockingham Association of REALTORS (R) or its MLS, for the period 01/01/2000 through 09/30/2012.

October 9, 2012
logo.indd 1 7/28/2008 3:10:30 PM
Increasing sales pace; stable sales prices. This graph shows a rolling 12 months of the number of home sales in the Harrisonburg and Rockingham County area, as well as the median price of the homes that sold during these time frames. Each data point is showing one year’s worth of home sales, which eliminates the volatility
of evaluating sales figures on a month-by-month basis. After steady increases in the annualized pace of home sales over the past 13 months, September sales did mark a slight decline. Median sales prices, however, continue to stabilize around $175,000 --- where they have been for over a year now.
775
775 81
7
817
825
825
817 84
9
845 87
6
833
818
802
789
763
758
753
738
750
745
742
706 731
748 772
779
779
794
793
801
806
801
810
813
830
843
831
$189
,950
$189
,250
$187
,225
$186
,000
$186
,000
$185
,000
$185
,000
$185
,000
$184
,000
$183
,000
$183
,950
$181
,700
$178
,750
$178
,500
$179
,900
$180
,000
$180
,000
$180
,000
$179
,800
$175
,575
$175
,825
$174
,250
$175
,000
$175
,650
$176
,650
$175
,800
$175
,000
$174
,900
$174
,900
$174
,900
$173
,000
$175
,000
$175
,950
$175
,000
$175
,000
$175
,000
$175
,000
$110,000
$130,000
$150,000
$170,000
$190,000
$210,000
0
500
1,000
1,500
2,000
Oct-09 Oct-10 Oct-11 Oct-12
Harrisonburg & Rockingham County
Time-Adjusted Home Sales Trends :: All Homes# Home Sales, Median Sales Price in each 12 Month Period
Annualized Home Sales
Annualized Median Sales Prices
Report courtesy of Scott P. Rogers, Associate Broker, Funkhouser Real Estate Group, based on information from the Harrisonburg-Rockingham Association of REALTORS (R) or its MLS, for the period 01/01/2000 through 09/30/2012.
Growth!
Stability!

October 9, 2012
logo.indd 1 7/28/2008 3:10:30 PM
Prices of single family homes increase. The single family home market in Harrisonburg and Rockingham County seems to be recovering quite nicely compared to the overall market. Last year, the pace of home sales in the single family home
market increased by 12% -- nearing 2008 sales levels with 622 sales. Single family homes are performing well again in 2012, and median prices are currently showing an increase from $185,500 (last year) to $195,500 for the first nine months of 2012.
674
868 851880
1,024 1,025
909
798
654
563 555
622
489
$122
,850
$133
,239
$136
,000
$147
,000 $1
70,0
00
$210
,000
$226
,800
$223
,575
$215
,000
$204
,500
$199
,600
$185
,500
$195
,000
-$25,000
$25,000
$75,000
$125,000
$175,000
$225,000
$275,000
0
200
400
600
800
1,000
1,200
2000 2001 2002 2003 2004 2005 2006 2007 2008 2009 2010 2011 2012
Harrisonburg & Rockingham County
Home Sales & Price TrendsSingle Family Homes
+16%
n/a-11%
-12%
-18%
+3%-2%
+29%
+9%+2%
+8%
+16%
+24%
+8%
-1%-4%
-14%
-5%
-1%
-2%
+12%
-7%
Report courtesy of Scott P. Rogers, Associate Broker, Funkhouser Real Estate Group, based on information from the Harrisonburg-Rockingham Association of REALTORS (R) or its MLS, for the period 01/01/2000 through 09/30/2012.
October 9, 2012
logo.indd 1 7/28/2008 3:10:30 PM
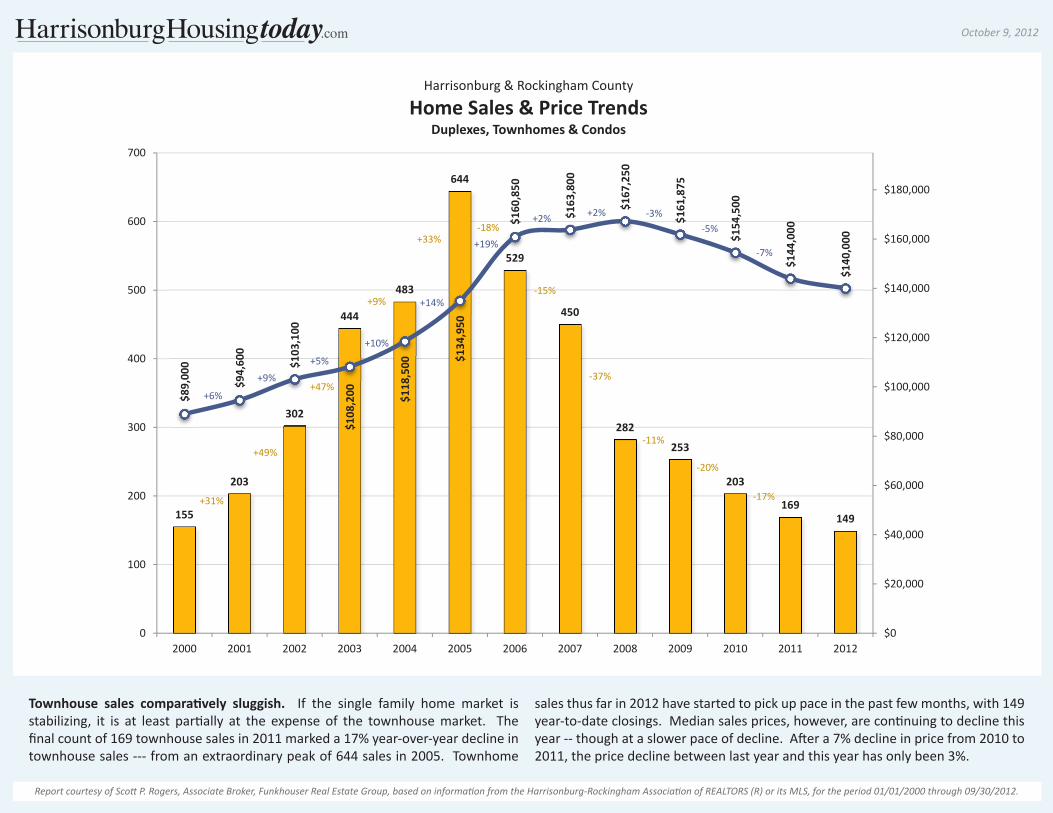
Townhouse sales comparatively sluggish. If the single family home market is stabilizing, it is at least partially at the expense of the townhouse market. The final count of 169 townhouse sales in 2011 marked a 17% year-over-year decline in townhouse sales --- from an extraordinary peak of 644 sales in 2005. Townhome
sales thus far in 2012 have started to pick up pace in the past few months, with 149 year-to-date closings. Median sales prices, however, are continuing to decline this year -- though at a slower pace of decline. After a 7% decline in price from 2010 to 2011, the price decline between last year and this year has only been 3%.
155
203
302
444
483
644
529
450
282
253
203
169149
$89,
000
$94,
600
$103
,100
$108
,200 $1
18,5
00 $134
,950
$160
,850
$163
,800
$167
,250
$161
,875
$154
,500
$144
,000
$140
,000
$0
$20,000
$40,000
$60,000
$80,000
$100,000
$120,000
$140,000
$160,000
$180,000
0
100
200
300
400
500
600
700
2000 2001 2002 2003 2004 2005 2006 2007 2008 2009 2010 2011 2012
Harrisonburg & Rockingham County
Home Sales & Price TrendsDuplexes, Townhomes & Condos
+9%
+33%-18%
-15%
-37%+47%
+49%
+31%
+6%
+9%+5%
+10%
+14%
+19%
+2% +2%
-11%
-3%
-20%
-5%
-17%
-7%
Report courtesy of Scott P. Rogers, Associate Broker, Funkhouser Real Estate Group, based on information from the Harrisonburg-Rockingham Association of REALTORS (R) or its MLS, for the period 01/01/2000 through 09/30/2012.

October 9, 2012
logo.indd 1 7/28/2008 3:10:30 PM
Foreclosures up from last year. The graph above is a comparison of two imprecise measures -- but the comparison can still be helpful. The blue bars show the number of home sales recorded in the HRAR MLS -- this does not include private sales (without a Realtor), nor new home sales directly from a builder. The red bars
show the number of Trustee Deeds. Some foreclosed properties then show up in blue when they are listed as REO properties. The foreclosure rate has increased somewhat in 2012, as there were 3.5 times as many home sales as foreclosures during 2011 and only 3.3 times as many home sales as foreclosures thus far in 2012.
829
1,071
1,153
1,324
1,507
1,669
1,438
1,248
936
816758
791
638
5691 63 75 70 86 93 97 118
177
270223 194
0
200
400
600
800
1,000
1,200
1,400
1,600
1,800
2000 2001 2002 2003 2004 2005 2006 2007 2008 2009 2010 2011 2012
Harrisonburg & Rockingham County
Home Sales vs. Trustee SalesHome Sales per HRAR MLS Recorded Trustee Deeds
Report courtesy of Scott P. Rogers, Associate Broker, Funkhouser Real Estate Group, based on information from the Harrisonburg-Rockingham Association of REALTORS (R) or its MLS, for the period 01/01/2000 through 09/30/2012.
3.3X3.5X
October 9, 2012
logo.indd 1 7/28/2008 3:10:30 PM
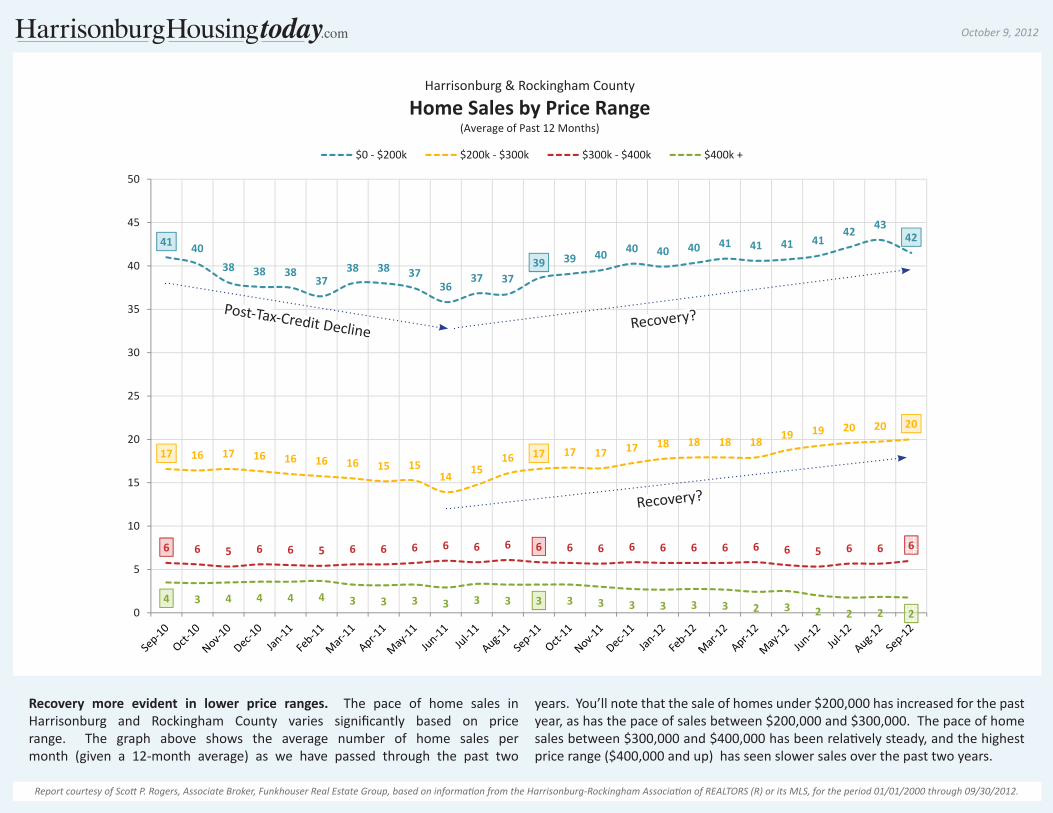
Recovery more evident in lower price ranges. The pace of home sales in Harrisonburg and Rockingham County varies significantly based on price range. The graph above shows the average number of home sales per month (given a 12-month average) as we have passed through the past two
years. You’ll note that the sale of homes under $200,000 has increased for the past year, as has the pace of sales between $200,000 and $300,000. The pace of home sales between $300,000 and $400,000 has been relatively steady, and the highest price range ($400,000 and up) has seen slower sales over the past two years.
41 4038 38 38
3738 38 37
3637 37
39 39 40 40 40 40 41 41 41 4142 43
42
17 16 17 16 16 16 16 15 1514 15
16 17 17 17 17 18 18 18 18 19 19 20 20 20
6 6 5 6 6 5 6 6 6 6 6 6 6 6 6 6 6 6 6 6 6 5 6 6 6
4 3 4 4 4 4 3 3 3 3 3 3 3 3 3 3 3 3 3 2 3 2 2 2 20
5
10
15
20
25
30
35
40
45
50
Harrisonburg & Rockingham County
Home Sales by Price Range (Average of Past 12 Months)
$0 - $200k $200k - $300k $300k - $400k $400k +
Report courtesy of Scott P. Rogers, Associate Broker, Funkhouser Real Estate Group, based on information from the Harrisonburg-Rockingham Association of REALTORS (R) or its MLS, for the period 01/01/2000 through 09/30/2012.
Post-Tax-Credit Decline Recovery?
Recovery?

October 9, 2012
logo.indd 1 7/28/2008 3:10:30 PM
Big drop in inventory in lowest price segment. Inventory levels have declined across the board over the past two years, but the changes have been quite different based on list prices. The most significant change has been in homes under $200,000 -- just 12 months ago there were 444 such properties for sale, and today there are only
355 for sale -- this marks an 20% decline in inventory. These declines in inventory over the past two years are definitely making a difference in helping to return us to greater balance in the local housing market.
478
448426
414 416
443 447457 452 451 454 451 444
433
399
339 343328
350 353 360 353370
357 355
296283
259
218208 208 216
230 232 232 236 229 221203
189 180 185 194206 214 222
209 201 199 207
111 10589 85 89 86 88 97 105 103 106 112
101 9989 81 77 79 77
87 91 84 77 756496 91
72 70 65 7081 81 81 86 86 85 80 75 71 72 66 64
75 79 78 75 79 75 72
0
50
100
150
200
250
300
350
400
450
500
550
Harrisonburg & Rockingham County
Inventory Levels by Price Range$0 - $200k $200k - $300k $300k - $400k $400k +
Report courtesy of Scott P. Rogers, Associate Broker, Funkhouser Real Estate Group, based on information from the Harrisonburg-Rockingham Association of REALTORS (R) or its MLS, for the period 01/01/2000 through 09/30/2012.
-20%

October 9, 2012
logo.indd 1 7/28/2008 3:10:30 PM
Housing supply spikes in high price ranges. With so many homes on the market (lots of sellers) and so few home sales (not so many buyers), there are very high levels of supply in our local real estate market. The graph above illustrates that it would take 41 months to sell all of the homes currently for sale over $400K if the
same number of buyers bought each month as have been buying (on average) over the past 12 months. Many experts consider a six months supply of housing to be a balance between buyers and sellers in the market, and it is remarkable to note that we are finally starting to approach that balance in the under $200K market.
12 11 11 11 1112 12 12 12 13 12 12 12 11
108 9 8 9 9 9 9 9 8 9
18 1716
13 13 13 1415 15
17 1614
1312 11
10 10 11 11 12 1211 10 10 10
19 1917
1516 16 16
1718
1718 18
17 1716
14 13 14 1315
17 16
14 13
11
27
27
2120
1819
25 26 25
29
26 2625
23 24
2625
23
28
3331
38
45
41 41
0
5
10
15
20
25
30
35
40
45
50
Harrisonburg & Rockingham County
Months of Housing Supply by Price Range$0 - $200k $200k - $300k $300k - $400k $400k +
Report courtesy of Scott P. Rogers, Associate Broker, Funkhouser Real Estate Group, based on information from the Harrisonburg-Rockingham Association of REALTORS (R) or its MLS, for the period 01/01/2000 through 09/30/2012.

October 9, 2012
logo.indd 1 7/28/2008 3:10:30 PM
Buyers experiencing slightly less flexibility on pricing. This graph shows the average list price to sales price ratio (red line) over the past 12+ years as compared to the overall pace of home sales. At the peak of the housing boom (2004-2006) sellers were able to obtain an average of 99% of their asking price --- up from an average
of 97.4% in 2000 before home sales started escalating. Last year may have offered the most flexibility for buyers --- with homes selling at an average of 94.7% of their asing prices --- this metric now shows an improvement to 95.3% of the asking price for home sales during the first nine months of 2012.
829
1,0711,153
1,324
1,507
1,669
1,438
1,248
936
816758 791
638
97.4%97.7% 97.8%
98.1%
99.1% 99.1% 98.9%
98.0%
96.9%96.2%
95.7%
94.7%95.3%
84.0%
86.0%
88.0%
90.0%
92.0%
94.0%
96.0%
98.0%
100.0%
102.0%
0
250
500
750
1,000
1,250
1,500
1,750
2,000
2,250
2000 2001 2002 2003 2004 2005 2006 2007 2008 2009 2010 2011 2012
Harrisonburg & Rockingham County
List Price to Sales Price Ratiowithin the context of Home Sales Pace
Report courtesy of Scott P. Rogers, Associate Broker, Funkhouser Real Estate Group, based on information from the Harrisonburg-Rockingham Association of REALTORS (R) or its MLS, for the period 01/01/2000 through 09/30/2012.

October 9, 2012
logo.indd 1 7/28/2008 3:10:30 PM
Price per square foot showing possible signs of stability. In addition to monitoring home values by overall median sales prices in our market, it can be insightful to examine the median price per square foot of homes that are selling. The graph above shows the median price per square foot of all single family homes sold over
the past 10+ years. The value trend captured by this graph is quite similar to the trend shown in the single family home median sales price during the same time, which validates that assumed set of changes in home values. Of late, however, the price per square foot has shown signs of stabilization.
$76
$73
$73
$73 $7
6$7
7$7
4 $78
$79
$80 $8
2 $84
$83 $8
6$8
7 $92
$90 $9
6 $99
$105
$105
$113 $1
19 $123 $1
26 $130
$131
$125 $1
29$1
28$1
27$1
26$1
25$1
26$1
21$1
15$1
16 $120
$117
$116
$107
$120
$108
$115
$101 $1
03$1
03$1
02$1
00 $106
$102
$0.00
$25.00
$50.00
$75.00
$100.00
$125.00
$150.00
2000-Q1 2001-Q1 2002-Q1 2003-Q1 2004-Q1 2005-Q1 2006-Q1 2007-Q1 2008-Q1 2009-Q1 2010-Q1 2011-Q1 2012-Q1
Harrisonburg & Rockingham County
Median Price Per Square Foot TrendsSingle Family Homes
Report courtesy of Scott P. Rogers, Associate Broker, Funkhouser Real Estate Group, based on information from the Harrisonburg-Rockingham Association of REALTORS (R) or its MLS, for the period 01/01/2000 through 09/30/2012.
October 9, 2012
logo.indd 1 7/28/2008 3:10:30 PM
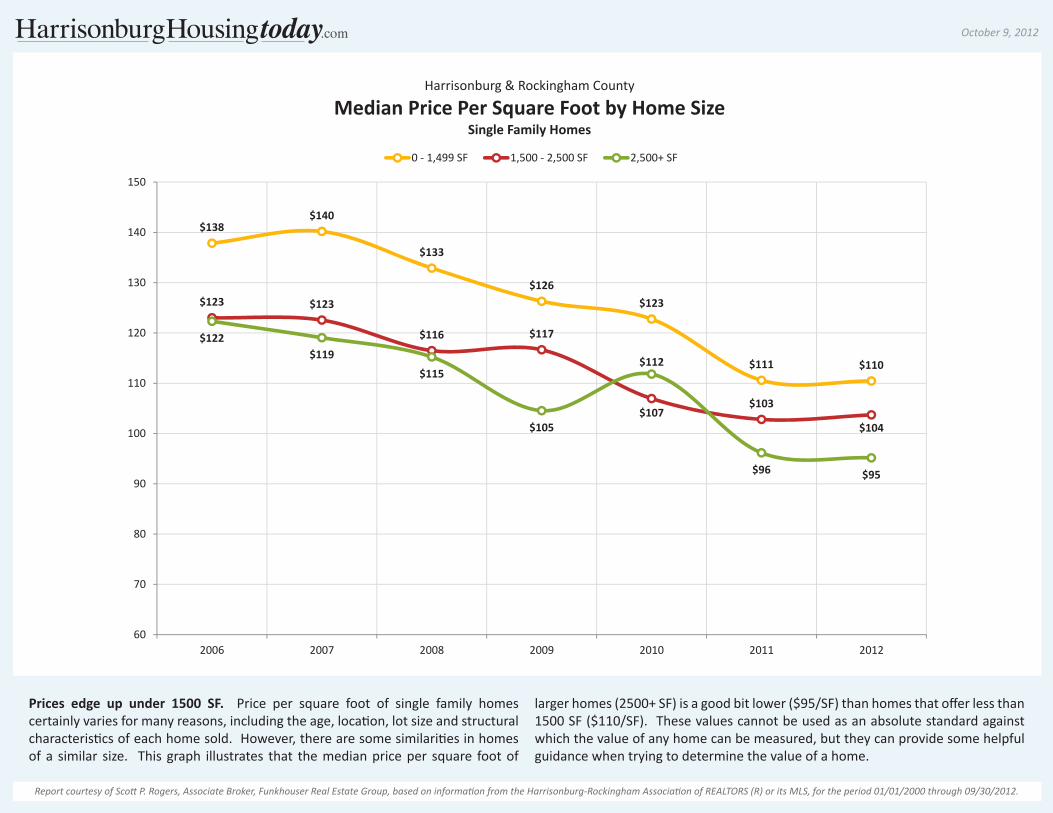
Prices edge up under 1500 SF. Price per square foot of single family homes certainly varies for many reasons, including the age, location, lot size and structural characteristics of each home sold. However, there are some similarities in homes of a similar size. This graph illustrates that the median price per square foot of
larger homes (2500+ SF) is a good bit lower ($95/SF) than homes that offer less than 1500 SF ($110/SF). These values cannot be used as an absolute standard against which the value of any home can be measured, but they can provide some helpful guidance when trying to determine the value of a home.
$138$140
$133
$126$123
$111 $110
$123 $123
$116 $117
$107$103
$104
$122$119
$115
$105
$112
$96 $95
60
70
80
90
100
110
120
130
140
150
2006 2007 2008 2009 2010 2011 2012
Harrisonburg & Rockingham County
Median Price Per Square Foot by Home SizeSingle Family Homes
0 - 1,499 SF 1,500 - 2,500 SF 2,500+ SF
Report courtesy of Scott P. Rogers, Associate Broker, Funkhouser Real Estate Group, based on information from the Harrisonburg-Rockingham Association of REALTORS (R) or its MLS, for the period 01/01/2000 through 09/30/2012.

October 9, 2012
logo.indd 1 7/28/2008 3:10:30 PM
Lot sales (< 1 acre) stabilizing? While the pace of sales of lots that are smaller than an acre have plummeted since 2004 (-85% between 2004 and 2010), they may have finally stabilized in 2011. In 2009, there were 58 lot sales of less than an acre, in
2010 that increased to 63 sales, and 2011 finished out with 60 sales. The median sales price of these lots under one acre may also be stabilizing between $55,000 and $60,000.
165
201
261247
408
304
111
8574
58 63 60
41
$26,
000
$30,
500
$32,
208
$36,
900
$42,
000
$54,
500
$99,
900
$76,
500
$58,
300
$59,
900
$55,
000
$54,
500
$56,
000
$0
$20,000
$40,000
$60,000
$80,000
$100,000
$120,000
0
50
100
150
200
250
300
350
400
450
2000 2001 2002 2003 2004 2005 2006 2007 2008 2009 2010 2011 2012
Harrisonburg & Rockingham County
Lot Sales & Median Pricesless than 1 acre
Report courtesy of Scott P. Rogers, Associate Broker, Funkhouser Real Estate Group, based on information from the Harrisonburg-Rockingham Association of REALTORS (R) or its MLS, for the period 01/01/2000 through 09/30/2012.
Stability?

October 9, 2012
logo.indd 1 7/28/2008 3:10:30 PM
Many (many) lots for sale. Despite the fact that only 60 lots (of less than an acre) sold in all of 2011, there are a remarkable 287 lots currently for sale. Some sanity exists in this listing market, however, as the median list price of lots for sale ($60,000) is only slightly higher than the 2012 YTD median sales price of $56,000. Given last
year’s 60 lot sales, if no other lots were listed for sale, it would take roughly 4.75 years to sell all of the lots currently listed for sale. As you can see above, almost half of the lots currently listed for sale are priced above $60,000 --- thus many sellers have offering prices higher than recent (2011, 2012) median sales prices.
$0 - $40k26 listings
9%
$40k - $60k121 listings
42%$60k - $80k76 listings
26%
$80k - $100k44 listings
15%
$100k +20 listings
7%
Harrisonburg & Rockingham County
Price Distribution of Active Lot Inventoryless than 1 acre
287 Active Lot Listings; Median List Price: $60,000
Report courtesy of Scott P. Rogers, Associate Broker, Funkhouser Real Estate Group, based on information from the Harrisonburg-Rockingham Association of REALTORS (R) or its MLS, for the period 01/01/2000 through 09/30/2012.

October 9, 2012
logo.indd 1 7/28/2008 3:10:30 PM
Larger lot sales slow again (slightly) in 2012. Parcels of land larger than one acre in Harrisonburg or Rockingham County sold quite quickly in 2011 as compared to both 2009 and 2010. During all of 2010, only 27 such land sales were recorded in the HRAR MLS, but there were a total of 49 such sales during 2011. This increase in
the pace of sales is very likely causing the increase in median price per acre that was experienced between 2010 and 2011. This year, however we are seeing a slightly slower pace (36) of sales, and the median price per acre has fallen back down to $12,861.
58
42
87
76
107
168
7783
53
42
27
49
36
$8,2
34
$8,2
45
$8,3
33 $9,5
35
$12,
003
$17,
713
$15,
000
$24,
184
$21,
250
$15,
424
$14,
552 $1
6,35
5
$12,
861
$0
$5,000
$10,000
$15,000
$20,000
$25,000
$30,000
0
20
40
60
80
100
120
140
160
180
2000 2001 2002 2003 2004 2005 2006 2007 2008 2009 2010 2011 2012
Harrisonburg & Rockingham County
Land Sales & Median Price Per Acre1 acre or more
Report courtesy of Scott P. Rogers, Associate Broker, Funkhouser Real Estate Group, based on information from the Harrisonburg-Rockingham Association of REALTORS (R) or its MLS, for the period 01/01/2000 through 09/30/2012.

October 9, 2012
logo.indd 1 7/28/2008 3:10:30 PM
High (really high) levels of lot inventory. Despite the fact that only 49 parcels of land (of one acre or more) sold in all of 2011, there are a remarkable 264 parcels of land currently for sale. Furthermore, despite the fact that the median sales price of land is hovering around $15,000 per acre, the median list price of the 264 parcels
for sale is currently $21,398 per acre. Given last year’s 49 land sales, if no other land is listed for sale, it would take over five years to sell all of the parcels of land currently listed for sale. As you can see above, the vast majority of land listed for sale is listed at median prices per acre well above the median sales price per acre.
$0 - $10k49 listings
19%
$10k - $20k79 listings
30%
$20k - $30k34 listings
13%
$30k - $40k29 listings
11%
$40k - $50k16 listings
6%
$50k - $100k29 listings
11%
$100k +28 listings
11%
Harrisonburg & Rockingham County
Price/Acre Distribution of Active Land Inventory1 acre or more
264 Active Land Listing; Median List Price: $21,398 / Acre
Report courtesy of Scott P. Rogers, Associate Broker, Funkhouser Real Estate Group, based on information from the Harrisonburg-Rockingham Association of REALTORS (R) or its MLS, for the period 01/01/2000 through 09/30/2012.

October 9, 2012
logo.indd 1 7/28/2008 3:10:30 PM
New home sales stabilizing, prices steady. New home builders finally saw an increase in the pace of new home sales during 2011 -- after a steady decline since 2005. This small increase (42 to 45), however, still leaves plenty of room for improvement -- though it appears that we may see a further increase in 2012.
The median price per square foot is also showing signs of steadying, with only a very small decline between 2010 and 2011 (and 2012). As the inventory of re-sale homes slims down, the sales of new homes should continue to increase.
Report courtesy of Scott P. Rogers, Associate Broker, Funkhouser Real Estate Group, based on information from the Harrisonburg-Rockingham Association of REALTORS (R) or its MLS, for the period 01/01/2000 through 09/30/2012.
89
138 137
121
140
186
158
139
109
84
4145
36
$87 $9
4 $99 $1
05 $114
$133
$150
$146
$144
$137
$130
$129
$129
0
50
100
150
200
0
20
40
60
80
100
120
140
160
180
200
2000 2001 2002 2003 2004 2005 2006 2007 2008 2009 2010 2011 2012
Harrisonburg & Rockingham County
New Construction Single Family Home Sales TrendsNumber of Sales, Median Price Per Square Foot

October 9, 2012
logo.indd 1 7/28/2008 3:10:30 PM
Days on market relatively low amongst many homes that actually slow. Despite high inventory levels, and low numbers of buyers in the market, the homes that are actually selling are selling rather quickly. In fact, nearly 1 out of 3 homes (32%) that sells closes less than 90 days after being listed for sale. Include with that those
that close in the next 90 days and we find that an amazing 61% of homes that sell have closed within six months of first coming on the market. This is not, however accounting for the many homes that never sell -- that linger on the market, or are eventually taken off the market.
0 - 3 months, 265, 32%
3 - 6 months, 244, 29%
6 - 9 months, 113, 14%
9 - 12 months, 76, 9%
1 - 2 years, 100, 12%
> 2 years, 33, 4%
Harrisonburg & Rockingham CountyDays on Market Analysis
Residential Listings Sold in the Past 12 Months
Average Days On Market: 215
Report courtesy of Scott P. Rogers, Associate Broker, Funkhouser Real Estate Group, based on information from the Harrisonburg-Rockingham Association of REALTORS (R) or its MLS, for the period 01/01/2000 through 09/30/2012.
0 - 3 months, 229, 33%
3 - 6 months, 183, 26%
6 - 9 months, 101, 14%
9 - 12 months, 35, 5%
1 - 2 years, 89, 13%
> 2 years, 61, 9%
Harrisonburg & Rockingham CountyDays on Market Analysis
Active Listings
Average Days On Market: 253
October 9, 2012
logo.indd 1 7/28/2008 3:10:30 PM
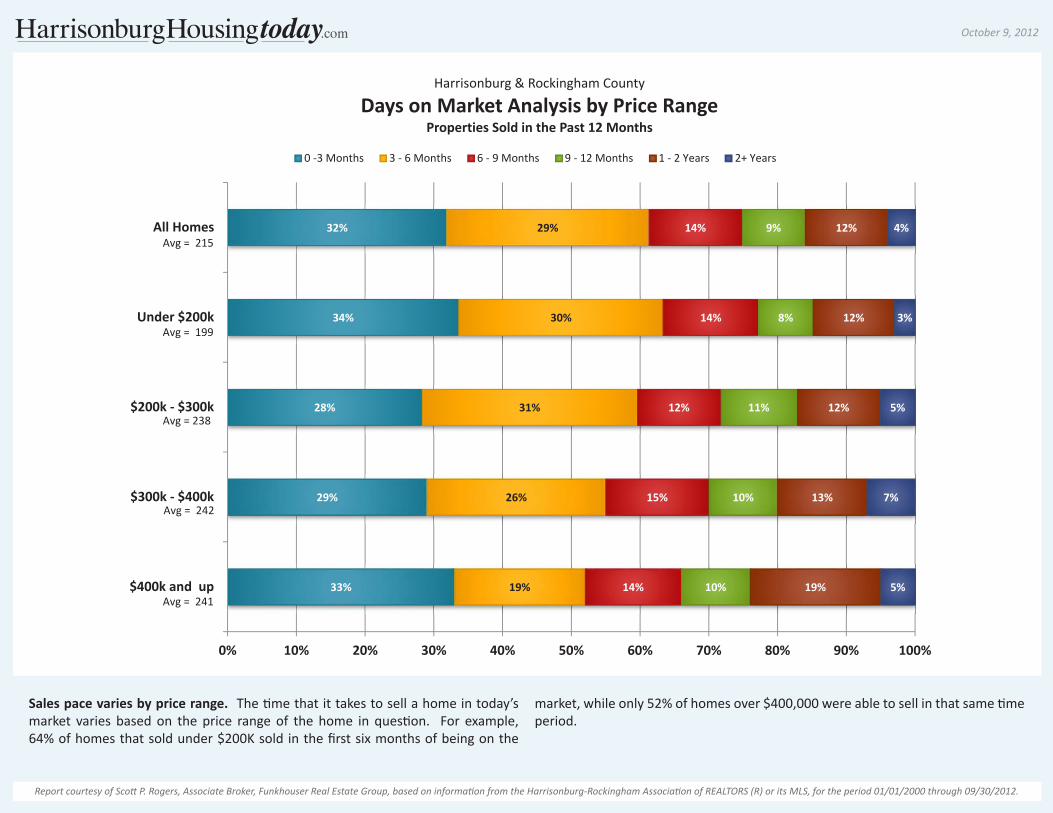
Sales pace varies by price range. The time that it takes to sell a home in today’s market varies based on the price range of the home in question. For example, 64% of homes that sold under $200K sold in the first six months of being on the
market, while only 52% of homes over $400,000 were able to sell in that same time period.
33%
29%
28%
34%
32%
19%
26%
31%
30%
29%
14%
15%
12%
14%
14%
10%
10%
11%
8%
9%
19%
13%
12%
12%
12%
5%
7%
5%
3%
4%
0% 10% 20% 30% 40% 50% 60% 70% 80% 90% 100%
$400k and up
$300k - $400k
$200k - $300k
Under $200k
All Homes
Harrisonburg & Rockingham County
Days on Market Analysis by Price RangeProperties Sold in the Past 12 Months
0 -3 Months 3 - 6 Months 6 - 9 Months 9 - 12 Months 1 - 2 Years 2+ Years
Avg = 215
Avg = 199
Avg = 238
Avg = 242
Avg = 241
Report courtesy of Scott P. Rogers, Associate Broker, Funkhouser Real Estate Group, based on information from the Harrisonburg-Rockingham Association of REALTORS (R) or its MLS, for the period 01/01/2000 through 09/30/2012.

October 9, 2012
logo.indd 1 7/28/2008 3:10:30 PM
Mortgage rates down; unemployment levels down. As shown in the top graph above, home buyers continue to find amazingly low interest rates on 30-year fixed rate mortgages. After a brief spike in August 2012, average interest rates are now
back to their pattern of breaking all-time historic lows, with a current average of 3.4%. The second graph above illustrates trends in the local unemployment rate -- which dropped again in August, down to 5.9%.
5.06
%
4.95
%
4.88
%
4.93
%
5.03
%
4.99
%
4.97
%
5.10
%
4.89
%
4.74
%
4.56
%
4.43
%
4.35
%
4.23
%
4.30
% 4.71
%
4.76
%
4.95
%
4.86
%
4.78
%
4.60
%
4.51
%
4.55
%
4.22
%
4.01
%
4.10
%
3.98
%
3.95
%
3.98
%
3.95
%
3.99
%
3.88
%
3.75
%
3.66
%
3.49
%
3.59
%
3.40
%
3.00%
3.50%
4.00%
4.50%
5.00%
5.50%
6.00%
Sep-09 Sep-10 Sep-11 Sep-12
Average 30-Year Fixed Mortgage Interest RateSource: Freddie Mac
Report courtesy of Scott P. Rogers, Associate Broker, Funkhouser Real Estate Group, based on information from the Harrisonburg-Rockingham Association of REALTORS (R) or its MLS, for the period 01/01/2000 through 09/30/2012.
6.5%
6.1%
6.1%
6.1%
6.0%
6.4%
6.1% 6.2%
5.4%
5.8%
6.3%
6.1%
6.1%
6.1%
5.6%
5.3%
5.7%
5.6%
6.0%
5.8%
5.3%
5.9%
6.3% 6.
5%
5.9%
4.00%
4.50%
5.00%
5.50%
6.00%
6.50%
7.00%
Aug-10 Aug-11 Aug-12
Harrisonburg-Rockingham MSA
Unemployment RateNot Seasonally Adjusted
October 9, 2012
logo.indd 1 7/28/2008 3:10:30 PM
Report courtesy of Scott P. Rogers, Associate Broker, Funkhouser Real Estate Group, based on information from the Harrisonburg-Rockingham Association of REALTORS (R) or its MLS, for the period 01/01/2000 through 09/30/2012.
Scott P. Rogers, an Associate Broker with Funkhouser Real Estate Group, has built a successful real estate career around providing valuable market data, insight and analysis to buyers, sellers, investors and developers. From first time home buyers to sellers of luxury homes and builder/developers, Scott provides exceptional and comprehensive service before, during and after the real estate transaction.
Scott earned a B.A. and M.Ed. from James Madison University, providing him formal education in graphic design, management and counseling -- all of which he leverages on a daily basis to the benefit of his clients. Scott’s graphic design and web development background allows him to create and leverage high caliber technology and marketing solutions.
In 2007, Scott began providing in depth analysis and insight into the local real estate market via his real estate blog, at HarrisonburgHousingToday.com.
In both 2010 and 2011, Scott was recognized by the Harrisonburg / Rockingham Association of Realtors as being in the top 1% of all area Realtors.
Local Online Real Estate Resources . . . .
Central Shenandoah Valley Property Searchhttp://www.ScottPRogers.com
Monthly Real Estate Market Reportshttp://www.HarrisonburgHousingMarket.com
Ongoing Housing Market Analysis & Commentaryhttp://www.HarrisonburgHousingToday.com
Comprehensive Data on Harrisonburg Townhouse Communitieshttp://www.HarrisonburgTownhouses.com
New Home Communitieshttp://www.HarrisonburgNewHomes.com
Trustee Sales in Harrisonburg & Rockingham Countyhttp://www.HarrisonburgForeclosures.com
Bank Owned Properties in Harrisonburg & Rockinghamhttp://www.HarrisonburgREO.com
Potential Short Sales in Harrisonburg & Rockingham Countyhttp://www.HarrisonburgShortSales.com
Owner Financed Properties in Harrisonburg & Rockingham Countyhttp://www.HarrisonburgOwnerFinancing.com
Lease/Purchase Properties in Harrisonburg & Rockingham Countyhttp://www.HarrisonburgLeasePurchase.com
Property Transfers in Harrisonburg & Rockingham Countyhttp://www.HarrisonburgPropertyTransfers.com
For more information, or with questions, contact:
SCOTT P. ROGERS, Associate Broker540-578-0102 (mobile)[email protected]
Scott P. Rogers, Associate Broker