Embed Size (px)
DESCRIPTION
Pacific Union, Real Estate, Luxury, magazine, Quarterly report
Citation preview
Quarterly Real Estate ReportQ2 2013
A Member of Real Living
Is This Real Estate Run Sustainable? 4
The Rise of the All-Cash Offer 6
Contra Costa County 8
East Bay 12
Marin County 16
Napa County 20
San Francisco 24
Sonoma County 32
Sonoma Valley 36
Tahoe/Truckee 40
Table of Contents
Is This Real Estate Run Sustainable?The past months have brought significant attention to the rocketing Bay Area housing market, which
inevitably leads to “bubble” commentary and comparisons to the 2007 bust. However, we believe this run is
for real, although velocity may start to slow.
We are enjoying an exceptionally healthy job market, driven by both our intellectual capital – from our world-
class universities to our thought- and technology-leading corporations – and the geodemographics of the
people who live in the San Francisco Bay Area.
May unemployment figures showed our Bay Area counties continuing to drop well below the national
average of 7.6 percent. Marin had the lowest rate at 4.5 percent, followed by San Francisco (5.2 percent),
Napa (5.3 percent), Sonoma (6.1 percent), Contra Costa (6.7 percent), Alameda (6.8 percent), and our
Tahoe/Truckee region at just over 7 percent.
Personal liquidity is on the rise due to stock-market gains, bonuses based on improved company
performance, increased valuation of restricted stocks and options, and the 2012 resurgence in IPOs. This
new cash in the pockets of would-be homebuyers enabled more of them to compete for limited housing
inventory even as prices continued to creep upward.
The combination of our improving Bay Area economy, dropping unemployment rate, and more-flush buyers
continues to fuel the housing market’s ferocious recovery.
To be sure, market corrections may be looming, and “cheap money” – short-term interest rates in the 2 to 3
percent range – will soon be gone.
But while growth will likely be slower than in the past 12 months, momentum is still positive. We feel that the
very strong demand for Bay Area housing will continue for the foreseeable future as a result of the strong job
markets and local consumer confidence.
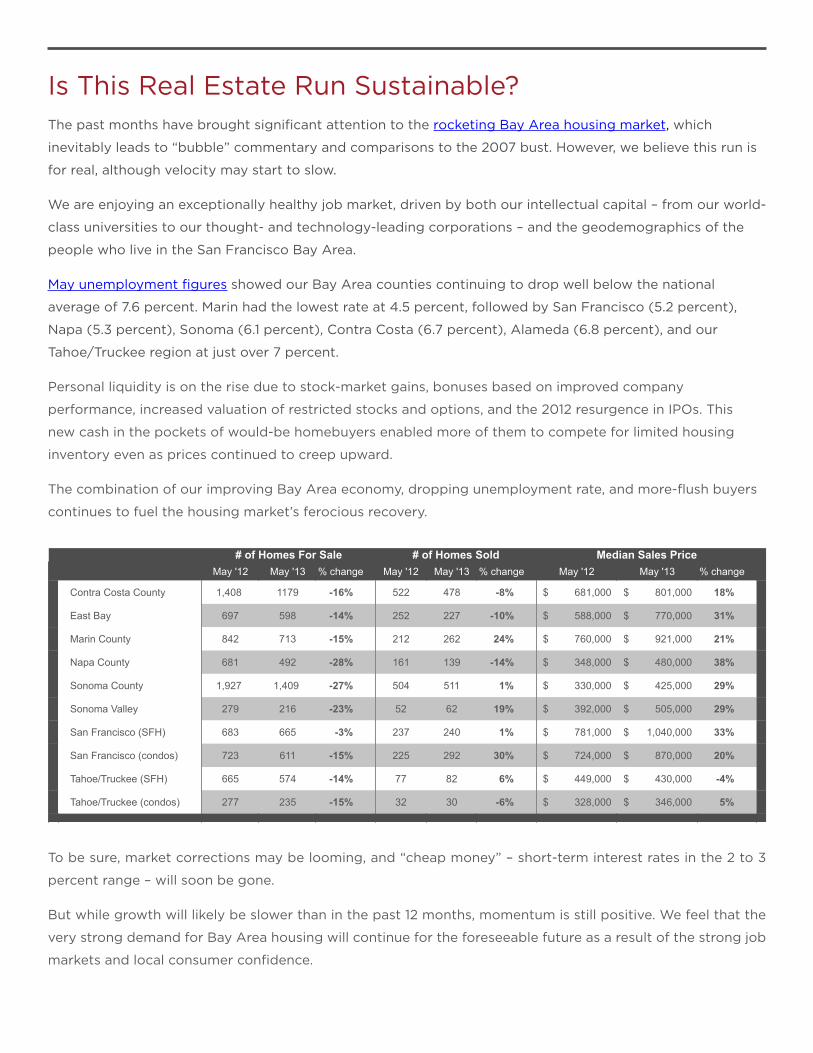
May '12 May '13 % change May '12 May '13 % change May '12 May '13 % change
Contra Costa County 1,408 1179 -16% 522 478 -8% 681,000$ 801,000$ 18%
East Bay 697 598 -14% 252 227 -10% 588,000$ 770,000$ 31%
Marin County 842 713 -15% 212 262 24% 760,000$ 921,000$ 21%
Napa County 681 492 -28% 161 139 -14% 348,000$ 480,000$ 38%
Sonoma County 1,927 1,409 -27% 504 511 1% 330,000$ 425,000$ 29%
Sonoma Valley 279 216 -23% 52 62 19% 392,000$ 505,000$ 29%
San Francisco (SFH) 683 665 -3% 237 240 1% 781,000$ 1,040,000$ 33%
San Francisco (condos) 723 611 -15% 225 292 30% 724,000$ 870,000$ 20%
Tahoe/Truckee (SFH) 665 574 -14% 77 82 6% 449,000$ 430,000$ -4%
Tahoe/Truckee (condos) 277 235 -15% 32 30 -6% 328,000$ 346,000$ 5%
# of Homes For Sale # of Homes Sold Median Sales Price
However, two factors will drive us toward more balanced supply and demand in our market: the extraordinary
increase in median pricing throughout the Bay Area over the next 12 to 18 months, and the additional listing
inventory (especially coming from middle markets and move-up buyers) expected as a result of those price
gains. This will also help stabilize price appreciation.
Other than cyclical trends, we do not expect to see relaxation in housing demand in the short or long run. In
fact, our long-term outlook is very optimistic from an investment perspective, as the Bay Area is undersupplied
in housing starts to satisfy projected demand in 2020.
Another dynamic that will impact real estate in the coming year is the expansion of employment opportunities
in our four western Bay Area counties to Alameda, Contra Costa, Sonoma, and Napa counties. Continued job
growth, and desirable jobs at that, will have a positive impact on the Wine Country and Tahoe regions as well.
We continue to weigh the impact of rising interest rates on demand, as borrowers can afford “less home,”
versus the benefits of real estate as a hedge for homeowners against inflation. These are variables we have
not wrestled with since pre-2007. That said, it’s still an amazing time to be a buyer, and we are more optimistic
today than at any time in the past six years.
Finally, we’re happy to announce that our mortgage affiliate is helping enable the new-home dream by
creating additional product options. We’ve developed an exciting bridge-financing program for move-
up buyers and are working on an equity product that may prove quite strategic in a rising interest rate
environment. For more information, please email Sheila O’Neill or call 707-501-8856.
Mark A. McLaughlin, CEO, Pacific Union
Please remember to seek out local news, trend analysis, and expert advice for your real estate decisions.
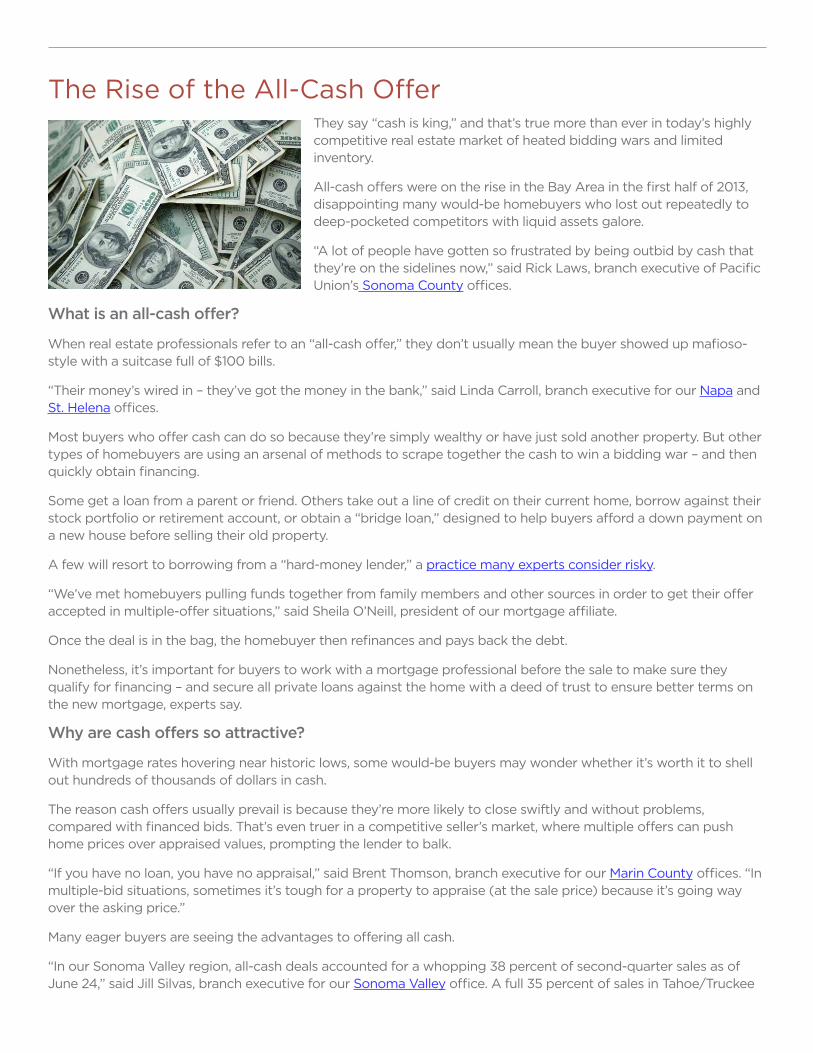
The Rise of the All-Cash OfferThey say “cash is king,” and that’s true more than ever in today’s highly competitive real estate market of heated bidding wars and limited inventory.
All-cash offers were on the rise in the Bay Area in the first half of 2013, disappointing many would-be homebuyers who lost out repeatedly to deep-pocketed competitors with liquid assets galore.
“A lot of people have gotten so frustrated by being outbid by cash that they’re on the sidelines now,” said Rick Laws, branch executive of Pacific Union’s Sonoma County offices.
What is an all-cash offer?
When real estate professionals refer to an “all-cash offer,” they don’t usually mean the buyer showed up mafioso-style with a suitcase full of $100 bills.
“Their money’s wired in – they’ve got the money in the bank,” said Linda Carroll, branch executive for our Napa and St. Helena offices.
Most buyers who offer cash can do so because they’re simply wealthy or have just sold another property. But other types of homebuyers are using an arsenal of methods to scrape together the cash to win a bidding war – and then quickly obtain financing.
Some get a loan from a parent or friend. Others take out a line of credit on their current home, borrow against their stock portfolio or retirement account, or obtain a “bridge loan,” designed to help buyers afford a down payment on a new house before selling their old property.
A few will resort to borrowing from a “hard-money lender,” a practice many experts consider risky.
“We’ve met homebuyers pulling funds together from family members and other sources in order to get their offer accepted in multiple-offer situations,” said Sheila O’Neill, president of our mortgage affiliate.
Once the deal is in the bag, the homebuyer then refinances and pays back the debt.
Nonetheless, it’s important for buyers to work with a mortgage professional before the sale to make sure they qualify for financing – and secure all private loans against the home with a deed of trust to ensure better terms on the new mortgage, experts say.
Why are cash offers so attractive?
With mortgage rates hovering near historic lows, some would-be buyers may wonder whether it’s worth it to shell out hundreds of thousands of dollars in cash.
The reason cash offers usually prevail is because they’re more likely to close swiftly and without problems, compared with financed bids. That’s even truer in a competitive seller’s market, where multiple offers can push home prices over appraised values, prompting the lender to balk.
“If you have no loan, you have no appraisal,” said Brent Thomson, branch executive for our Marin County offices. “In multiple-bid situations, sometimes it’s tough for a property to appraise (at the sale price) because it’s going way over the asking price.”
Many eager buyers are seeing the advantages to offering all cash.
“In our Sonoma Valley region, all-cash deals accounted for a whopping 38 percent of second-quarter sales as of June 24,” said Jill Silvas, branch executive for our Sonoma Valley office. A full 35 percent of sales in Tahoe/Truckee
were all cash as of June 25, followed by our Sonoma County region, where cash deals comprised 29 percent of transactions that closed between April 1 and June 27.
When cash doesn’t win
Of course, sometimes a seller has reason to choose a financed offer over an all-cash bid.
Sonoma County, for example, has seen somewhat of a backlash against investors who snap up properties to flip them or rent them out at a profit, Laws said.
“I see an increasing number of people who don’t want to sell their home to an investor,” he noted. “They would rather sell to somebody who is going to live in their home and is a member of the community.”
And in second-home markets like our Tahoe/Truckee region, buyers are often highly qualified for a mortgage. That means financed offers can win out if they come in more than a couple of thousand dollars above a cash bid.
“People are very solid if they’re financing up here,” said Sally Gardner, branch executive for our Tahoe/Truckee offices. “If an all-cash offer is within $1,000 or $2,000 of a financed offer, the seller’s taking the cash offer. If it’s more than a $3,000 to $5,000 difference, I don’t think it really matters.”
How to compete
So how can buyers unable to offer cash compete?
Many are waiving contingencies (including the appraisal contingency), writing “love letters” that describe why they want the home, or offering to let the owners stay put for several months rent-free.
And of course, finding the right real estate professional to represent you is always a shrewd move. In some cases they are privy to off-market sales, which can keep competition to a minimum, or may be able to plead your case with a seller’s agent.
“You have to get a really savvy agent who has good communication with other agents in the marketplace,” Laws said. “Find out what the seller wants, and try to structure your offer to give it to them.”
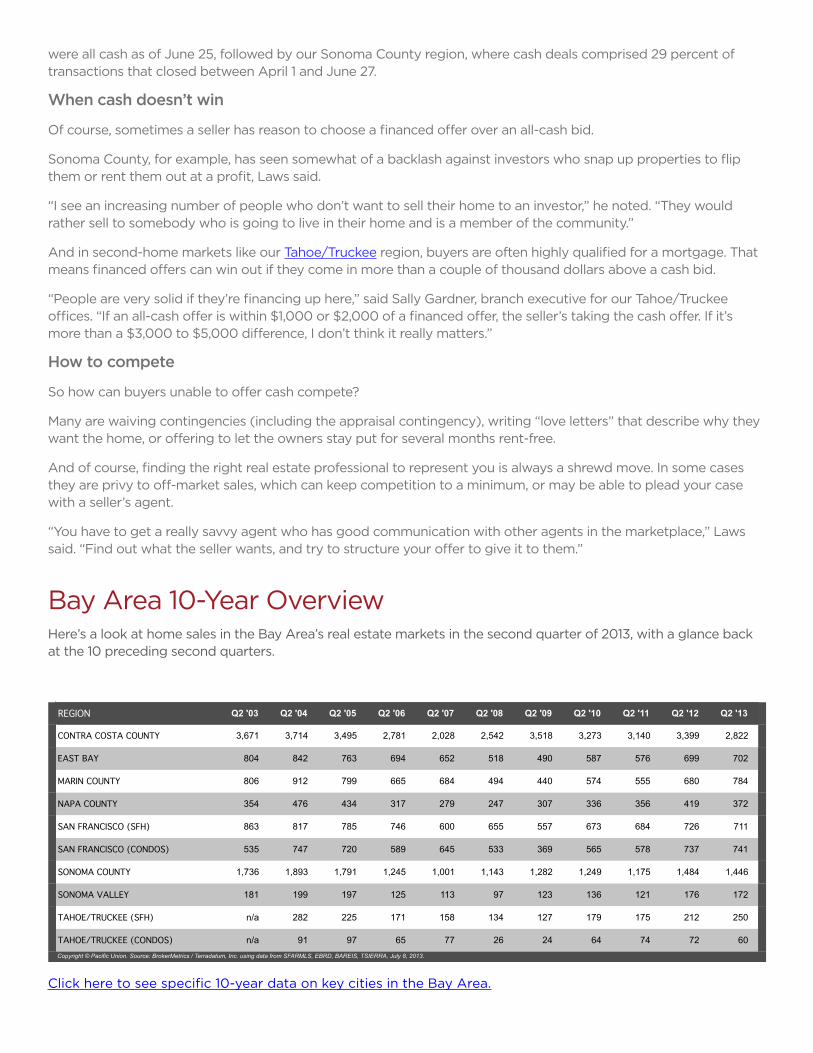
Bay Area 10-Year OverviewHere’s a look at home sales in the Bay Area’s real estate markets in the second quarter of 2013, with a glance back at the 10 preceding second quarters.
Click here to see specific 10-year data on key cities in the Bay Area.
REGION Q2 '03 Q2 '04 Q2 '05 Q2 '06 Q2 '07 Q2 '08 Q2 '09 Q2 '10 Q2 '11 Q2 '12 Q2 '13
CONTRA COSTA COUNTY 3,671 3,714 3,495 2,781 2,028 2,542 3,518 3,273 3,140 3,399 2,822
EAST BAY 804 842 763 694 652 518 490 587 576 699 702
MARIN COUNTY 806 912 799 665 684 494 440 574 555 680 784
NAPA COUNTY 354 476 434 317 279 247 307 336 356 419 372
SAN FRANCISCO (SFH) 863 817 785 746 600 655 557 673 684 726 711
SAN FRANCISCO (CONDOS) 535 747 720 589 645 533 369 565 578 737 741
SONOMA COUNTY 1,736 1,893 1,791 1,245 1,001 1,143 1,282 1,249 1,175 1,484 1,446
SONOMA VALLEY 181 199 197 125 113 97 123 136 121 176 172
TAHOE/TRUCKEE (SFH) n/a 282 225 171 158 134 127 179 175 212 250
TAHOE/TRUCKEE (CONDOS) n/a 91 97 65 77 26 24 64 74 72 60Copyright © Pacific Union. Source: BrokerMetrics / Terradatum, Inc. using data from SFARMLS, EBRD, BAREIS, TSIERRA, July 8, 2013.
Ellen AndersonSenior Vice President, Contra Costa [email protected] Sycamore Valley Road West | Danville, CA 94526
Contra Costa CountyQuarterly Real Estate ReportQ2 2013
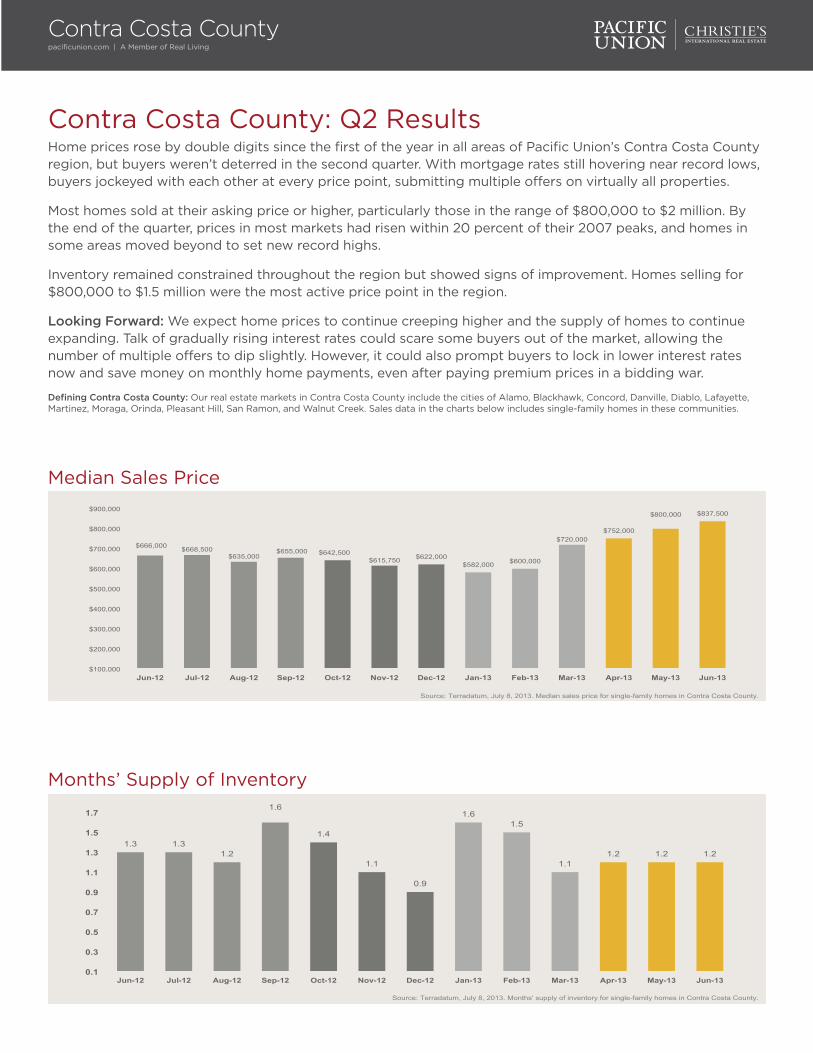
Contra Costa County: Q2 ResultsHome prices rose by double digits since the first of the year in all areas of Pacific Union’s Contra Costa County region, but buyers weren’t deterred in the second quarter. With mortgage rates still hovering near record lows, buyers jockeyed with each other at every price point, submitting multiple offers on virtually all properties.
Most homes sold at their asking price or higher, particularly those in the range of $800,000 to $2 million. By the end of the quarter, prices in most markets had risen within 20 percent of their 2007 peaks, and homes in some areas moved beyond to set new record highs.
Inventory remained constrained throughout the region but showed signs of improvement. Homes selling for $800,000 to $1.5 million were the most active price point in the region.
Looking Forward: We expect home prices to continue creeping higher and the supply of homes to continue expanding. Talk of gradually rising interest rates could scare some buyers out of the market, allowing the number of multiple offers to dip slightly. However, it could also prompt buyers to lock in lower interest rates now and save money on monthly home payments, even after paying premium prices in a bidding war.
Defining Contra Costa County: Our real estate markets in Contra Costa County include the cities of Alamo, Blackhawk, Concord, Danville, Diablo, Lafayette, Martinez, Moraga, Orinda, Pleasant Hill, San Ramon, and Walnut Creek. Sales data in the charts below includes single-family homes in these communities.
Contra Costa Countypacificunion.com | A Member of Real Living
Median Sales Price
Months’ Supply of Inventory
$666,000 $668,500 $635,000
$655,000 $642,500 $615,750 $622,000
$582,000 $600,000
$720,000 $752,000
$800,000 $837,500
$100,000
$200,000
$300,000
$400,000
$500,000
$600,000
$700,000
$800,000
$900,000
Jun-12 Jul-12 Aug-12 Sep-12 Oct-12 Nov-12 Dec-12 Jan-13 Feb-13 Mar-13 Apr-13 May-13 Jun-13
Source: Terradatum, July 8, 2013. Median sales price for single-family homes in Contra Costa County.
1.3 1.3 1.2
1.6
1.4
1.1
0.9
1.6 1.5
1.1 1.2 1.2 1.2
0.1
0.3
0.5
0.7
0.9
1.1
1.3
1.5
1.7
Jun-12 Jul-12 Aug-12 Sep-12 Oct-12 Nov-12 Dec-12 Jan-13 Feb-13 Mar-13 Apr-13 May-13 Jun-13
Source: Terradatum, July 8, 2013. Months' supply of inventory for single-family homes in Contra Costa County.
Contra Costa Countypacificunion.com | A Member of Real Living
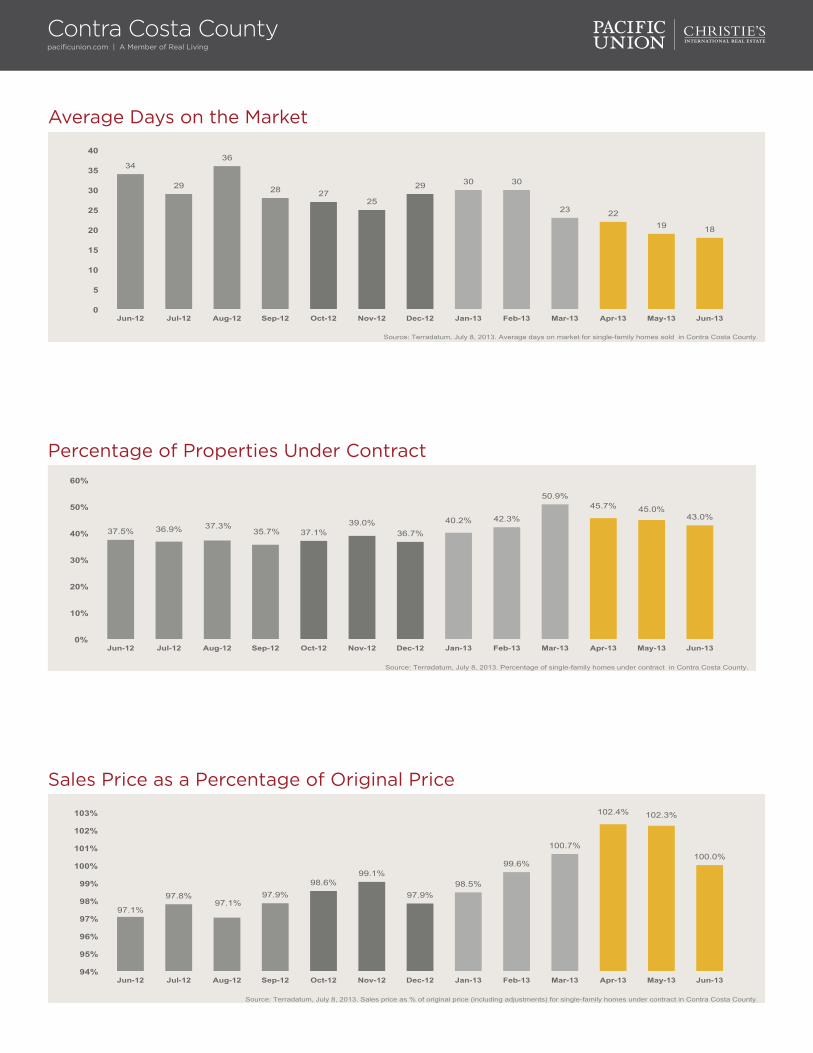
Average Days on the Market
34
29
36
28 27 25
29 30 30
23 22 19 18
0
5
10
15
20
25
30
35
40
Jun-12 Jul-12 Aug-12 Sep-12 Oct-12 Nov-12 Dec-12 Jan-13 Feb-13 Mar-13 Apr-13 May-13 Jun-13
Source: Terradatum, July 8, 2013. Average days on market for single-family homes sold in Contra Costa County.
Sales Price as a Percentage of Original Price
97.1%
97.8% 97.1%
97.9% 98.6%
99.1%
97.9% 98.5%
99.6%
100.7%
102.4% 102.3%
100.0%
94%
95%
96%
97%
98%
99%
100%
101%
102%
103%
Jun-12 Jul-12 Aug-12 Sep-12 Oct-12 Nov-12 Dec-12 Jan-13 Feb-13 Mar-13 Apr-13 May-13 Jun-13
Source: Terradatum, July 8, 2013. Sales price as % of original price (including adjustments) for single-family homes under contract in Contra Costa County.
Percentage of Properties Under Contract
37.5% 36.9% 37.3% 35.7% 37.1%
39.0% 36.7%
40.2% 42.3%
50.9% 45.7% 45.0%
43.0%
0%
10%
20%
30%
40%
50%
60%
Jun-12 Jul-12 Aug-12 Sep-12 Oct-12 Nov-12 Dec-12 Jan-13 Feb-13 Mar-13 Apr-13 May-13 Jun-13
Source: Terradatum, July 8, 2013. Percentage of single-family homes under contract in Contra Costa County.
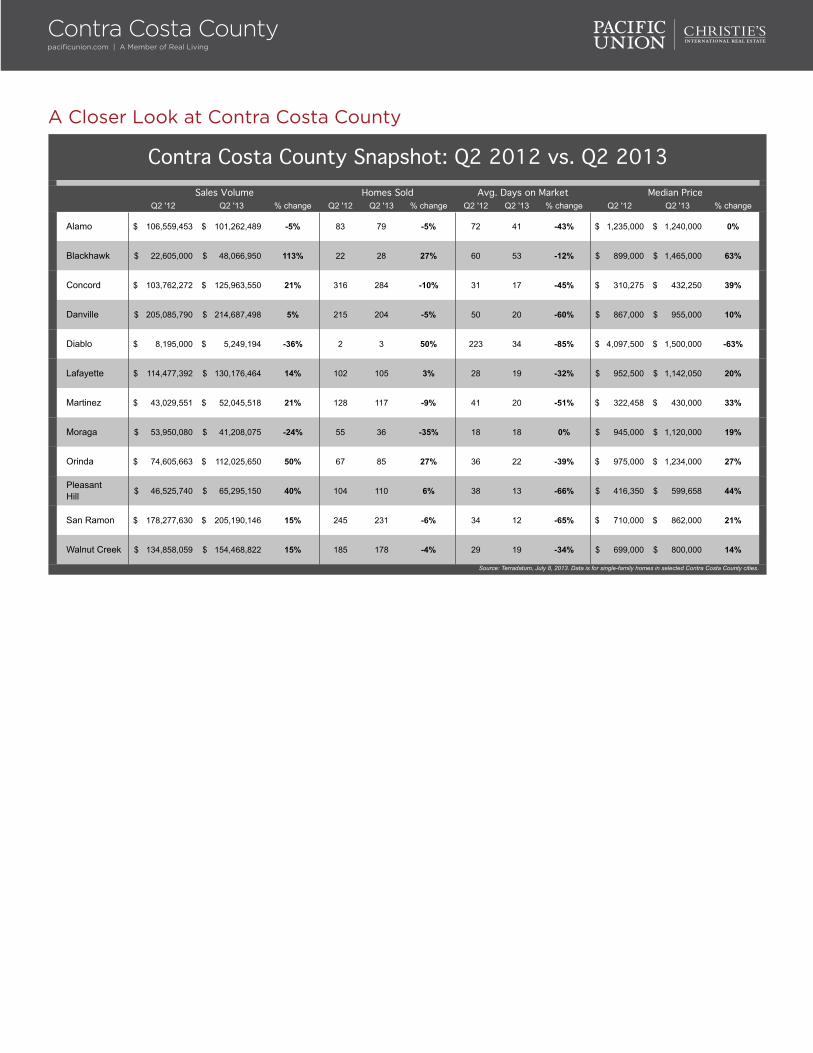
A Closer Look at Contra Costa County
Q2 '12 Q2 '13 % change Q2 '12 Q2 '13 % change Q2 '12 Q2 '13 % change Q2 '12 Q2 '13 % change
Alamo 106,559,453$ 101,262,489$ -5% 83 79 -5% 72 41 -43% 1,235,000$ 1,240,000$ 0%
Blackhawk 22,605,000$ 48,066,950$ 113% 22 28 27% 60 53 -12% 899,000$ 1,465,000$ 63%
Concord 103,762,272$ 125,963,550$ 21% 316 284 -10% 31 17 -45% 310,275$ 432,250$ 39%
Danville 205,085,790$ 214,687,498$ 5% 215 204 -5% 50 20 -60% 867,000$ 955,000$ 10%
Diablo 8,195,000$ 5,249,194$ -36% 2 3 50% 223 34 -85% 4,097,500$ 1,500,000$ -63%
Lafayette 114,477,392$ 130,176,464$ 14% 102 105 3% 28 19 -32% 952,500$ 1,142,050$ 20%
Martinez 43,029,551$ 52,045,518$ 21% 128 117 -9% 41 20 -51% 322,458$ 430,000$ 33%
Moraga 53,950,080$ 41,208,075$ -24% 55 36 -35% 18 18 0% 945,000$ 1,120,000$ 19%
Orinda 74,605,663$ 112,025,650$ 50% 67 85 27% 36 22 -39% 975,000$ 1,234,000$ 27%
PleasantHill 46,525,740$ 65,295,150$ 40% 104 110 6% 38 13 -66% 416,350$ 599,658$ 44%
San Ramon 178,277,630$ 205,190,146$ 15% 245 231 -6% 34 12 -65% 710,000$ 862,000$ 21%
Walnut Creek 134,858,059$ 154,468,822$ 15% 185 178 -4% 29 19 -34% 699,000$ 800,000$ 14%
Source: Terradatum, July 8, 2013. Data is for single-family homes in selected Contra Costa County cities.
Contra Costa County Snapshot: Q2 2012 vs. Q2 2013Sales Volume Homes Sold Avg. Days on Market Median Price
Contra Costa Countypacificunion.com | A Member of Real Living
Pam HoffmanSenior Vice President, Managing Broker, East Bay [email protected] Mountain Boulevard | Oakland, CA 94611
East BayQuarterly Real Estate ReportQ2 2013
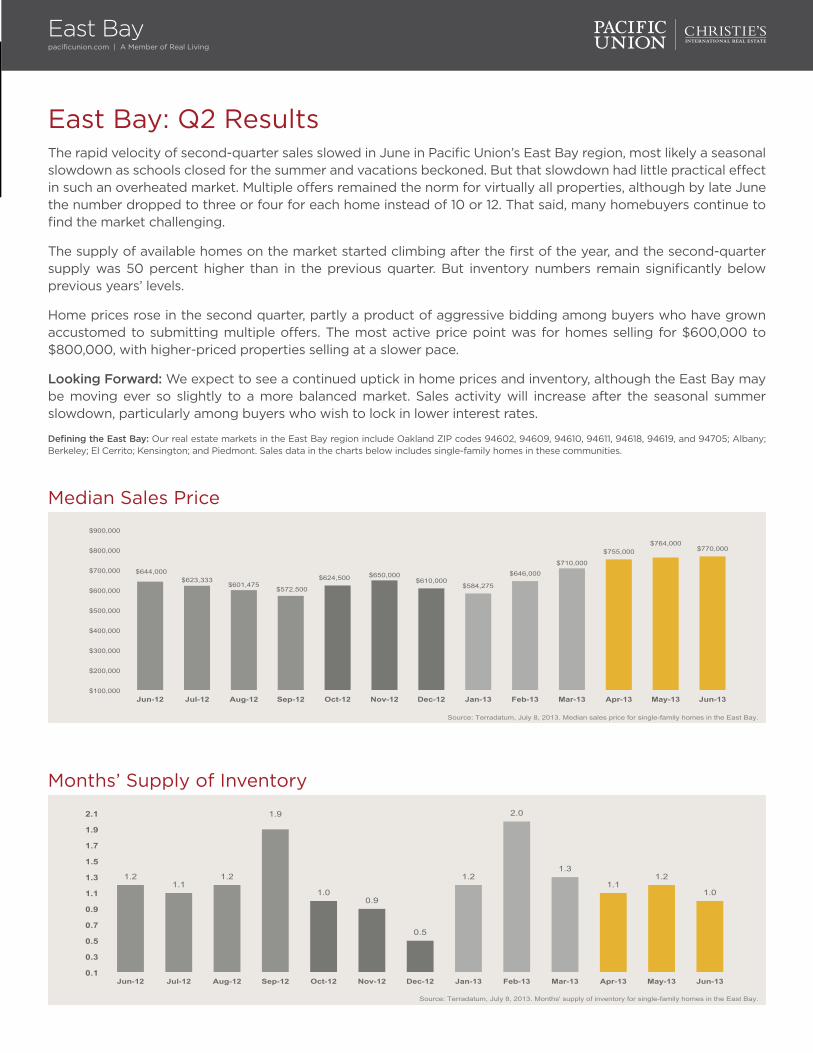
East Bay: Q2 ResultsThe rapid velocity of second-quarter sales slowed in June in Pacific Union’s East Bay region, most likely a seasonal slowdown as schools closed for the summer and vacations beckoned. But that slowdown had little practical effect in such an overheated market. Multiple offers remained the norm for virtually all properties, although by late June the number dropped to three or four for each home instead of 10 or 12. That said, many homebuyers continue to find the market challenging.
The supply of available homes on the market started climbing after the first of the year, and the second-quarter supply was 50 percent higher than in the previous quarter. But inventory numbers remain significantly below previous years’ levels.
Home prices rose in the second quarter, partly a product of aggressive bidding among buyers who have grown accustomed to submitting multiple offers. The most active price point was for homes selling for $600,000 to $800,000, with higher-priced properties selling at a slower pace.
Looking Forward: We expect to see a continued uptick in home prices and inventory, although the East Bay may be moving ever so slightly to a more balanced market. Sales activity will increase after the seasonal summer slowdown, particularly among buyers who wish to lock in lower interest rates.
Defining the East Bay: Our real estate markets in the East Bay region include Oakland ZIP codes 94602, 94609, 94610, 94611, 94618, 94619, and 94705; Albany; Berkeley; El Cerrito; Kensington; and Piedmont. Sales data in the charts below includes single-family homes in these communities.
East Baypacificunion.com | A Member of Real Living
Median Sales Price
Months’ Supply of Inventory
$644,000 $623,333
$601,475 $572,500
$624,500 $650,000 $610,000
$584,275
$646,000
$710,000
$755,000 $764,000
$770,000
$100,000
$200,000
$300,000
$400,000
$500,000
$600,000
$700,000
$800,000
$900,000
Jun-12 Jul-12 Aug-12 Sep-12 Oct-12 Nov-12 Dec-12 Jan-13 Feb-13 Mar-13 Apr-13 May-13 Jun-13
Source: Terradatum, July 8, 2013. Median sales price for single-family homes in the East Bay.
1.2 1.1
1.2
1.9
1.0 0.9
0.5
1.2
2.0
1.3
1.1 1.2
1.0
0.1
0.3
0.5
0.7
0.9
1.1
1.3
1.5
1.7
1.9
2.1
Jun-12 Jul-12 Aug-12 Sep-12 Oct-12 Nov-12 Dec-12 Jan-13 Feb-13 Mar-13 Apr-13 May-13 Jun-13
Source: Terradatum, July 8, 2013. Months' supply of inventory for single-family homes in the East Bay.
East Baypacificunion.com | A Member of Real Living
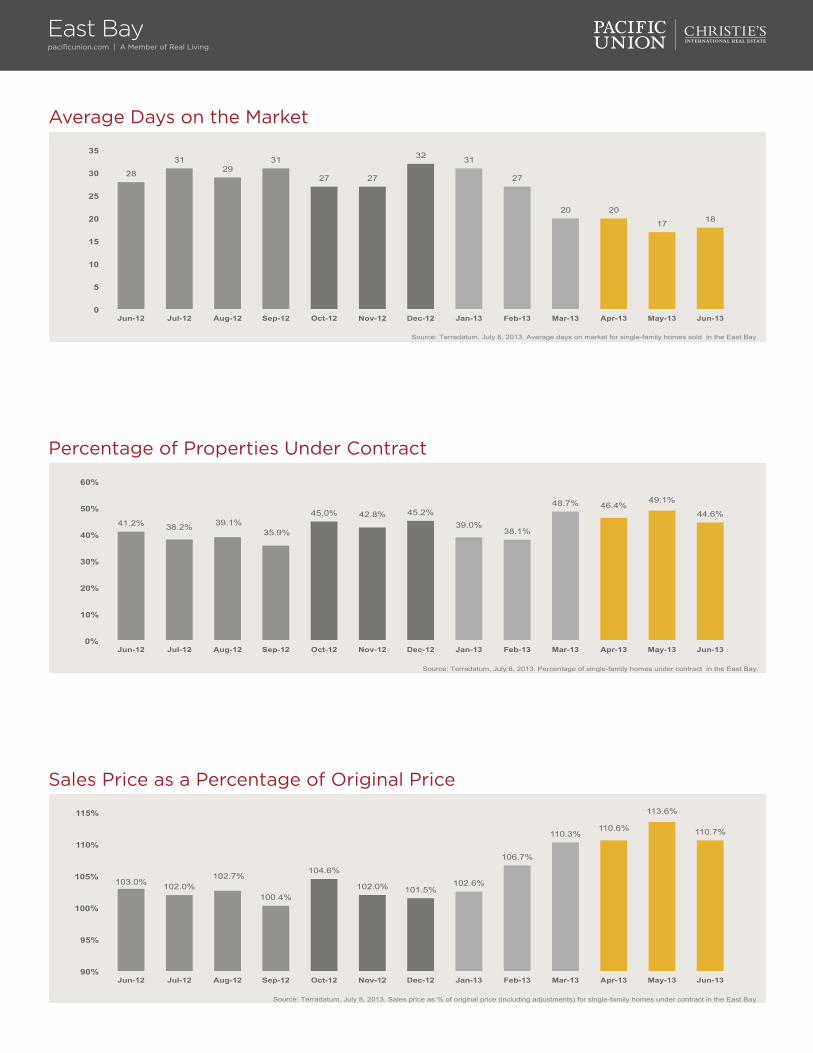
Average Days on the Market
28
31 29
31
27 27
32 31
27
20 20
17 18
0
5
10
15
20
25
30
35
Jun-12 Jul-12 Aug-12 Sep-12 Oct-12 Nov-12 Dec-12 Jan-13 Feb-13 Mar-13 Apr-13 May-13 Jun-13
Source: Terradatum, July 8, 2013. Average days on market for single-family homes sold in the East Bay.
Sales Price as a Percentage of Original Price
103.0% 102.0% 102.7%
100.4%
104.6%
102.0% 101.5% 102.6%
106.7%
110.3% 110.6%
113.6%
110.7%
90%
95%
100%
105%
110%
115%
Jun-12 Jul-12 Aug-12 Sep-12 Oct-12 Nov-12 Dec-12 Jan-13 Feb-13 Mar-13 Apr-13 May-13 Jun-13
Source: Terradatum, July 8, 2013. Sales price as % of original price (including adjustments) for single-family homes under contract in the East Bay.
Percentage of Properties Under Contract
41.2% 38.2% 39.1% 35.9%
45.0% 42.8% 45.2% 39.0%
38.1%
48.7% 46.4% 49.1%
44.6%
0%
10%
20%
30%
40%
50%
60%
Jun-12 Jul-12 Aug-12 Sep-12 Oct-12 Nov-12 Dec-12 Jan-13 Feb-13 Mar-13 Apr-13 May-13 Jun-13
Source: Terradatum, July 8, 2013. Percentage of single-family homes under contract in the East Bay.
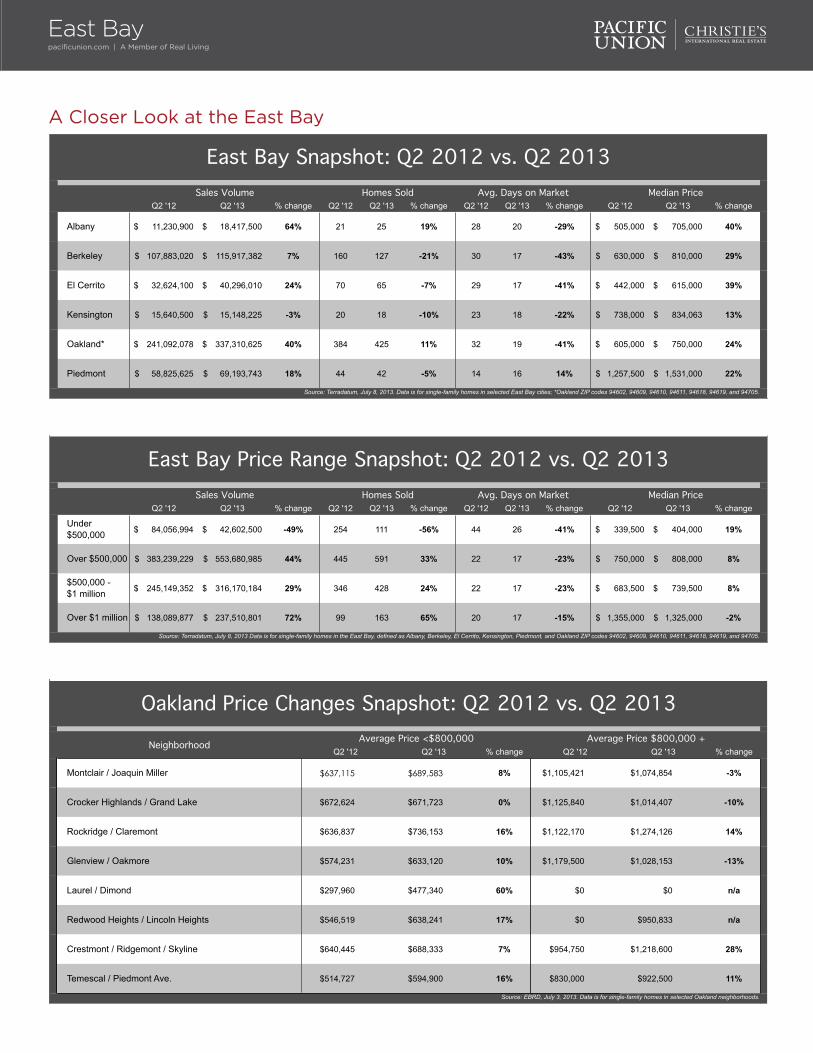
A Closer Look at the East Bay
Q2 '12 Q2 '13 % change Q2 '12 Q2 '13 % change Q2 '12 Q2 '13 % change Q2 '12 Q2 '13 % change
Albany 11,230,900$ 18,417,500$ 64% 21 25 19% 28 20 -29% 505,000$ 705,000$ 40%
Berkeley 107,883,020$ 115,917,382$ 7% 160 127 -21% 30 17 -43% 630,000$ 810,000$ 29%
El Cerrito 32,624,100$ 40,296,010$ 24% 70 65 -7% 29 17 -41% 442,000$ 615,000$ 39%
Kensington 15,640,500$ 15,148,225$ -3% 20 18 -10% 23 18 -22% 738,000$ 834,063$ 13%
Oakland* 241,092,078$ 337,310,625$ 40% 384 425 11% 32 19 -41% 605,000$ 750,000$ 24%
Piedmont 58,825,625$ 69,193,743$ 18% 44 42 -5% 14 16 14% 1,257,500$ 1,531,000$ 22%
East Bay Snapshot: Q2 2012 vs. Q2 2013
Source: Terradatum, July 8, 2013. Data is for single-family homes in selected East Bay cities; *Oakland ZIP codes 94602, 94609, 94610, 94611, 94618, 94619, and 94705.
Sales Volume Homes Sold Avg. Days on Market Median Price
Q2 '12 Q2 '13 % change Q2 '12 Q2 '13 % change Q2 '12 Q2 '13 % change Q2 '12 Q2 '13 % change
Under $500,000 84,056,994$ 42,602,500$ -49% 254 111 -56% 44 26 -41% 339,500$ 404,000$ 19%
Over $500,000 383,239,229$ 553,680,985$ 44% 445 591 33% 22 17 -23% 750,000$ 808,000$ 8%
$500,000 - $1 million 245,149,352$ 316,170,184$ 29% 346 428 24% 22 17 -23% 683,500$ 739,500$ 8%
Over $1 million 138,089,877$ 237,510,801$ 72% 99 163 65% 20 17 -15% 1,355,000$ 1,325,000$ -2%
Source: Terradatum, July 8, 2013 Data is for single-family homes in the East Bay, defined as Albany, Berkeley, El Cerrito, Kensington, Piedmont, and Oakland ZIP codes 94602, 94609, 94610, 94611, 94618, 94619, and 94705.
East Bay Price Range Snapshot: Q2 2012 vs. Q2 2013Sales Volume Homes Sold Avg. Days on Market Median Price
Q2 '12 Q2 '13 % change Q2 '12 Q2 '13 % change
Montclair / Joaquin Miller $637,115 $689,583 8% $1,105,421 $1,074,854 -3%
Crocker Highlands / Grand Lake $672,624 $671,723 0% $1,125,840 $1,014,407 -10%
Rockridge / Claremont $636,837 $736,153 16% $1,122,170 $1,274,126 14%
Glenview / Oakmore $574,231 $633,120 10% $1,179,500 $1,028,153 -13%
Laurel / Dimond $297,960 $477,340 60% $0 $0 n/a
Redwood Heights / Lincoln Heights $546,519 $638,241 17% $0 $950,833 n/a
Crestmont / Ridgemont / Skyline $640,445 $688,333 7% $954,750 $1,218,600 28%
Temescal / Piedmont Ave. $514,727 $594,900 16% $830,000 $922,500 11%
Oakland Price Changes Snapshot: Q2 2012 vs. Q2 2013
Neighborhood Average Price <$800,000 Average Price $800,000 +
Source: EBRD, July 3, 2013. Data is for single-family homes in selected Oakland neighborhoods.
East Baypacificunion.com | A Member of Real Living
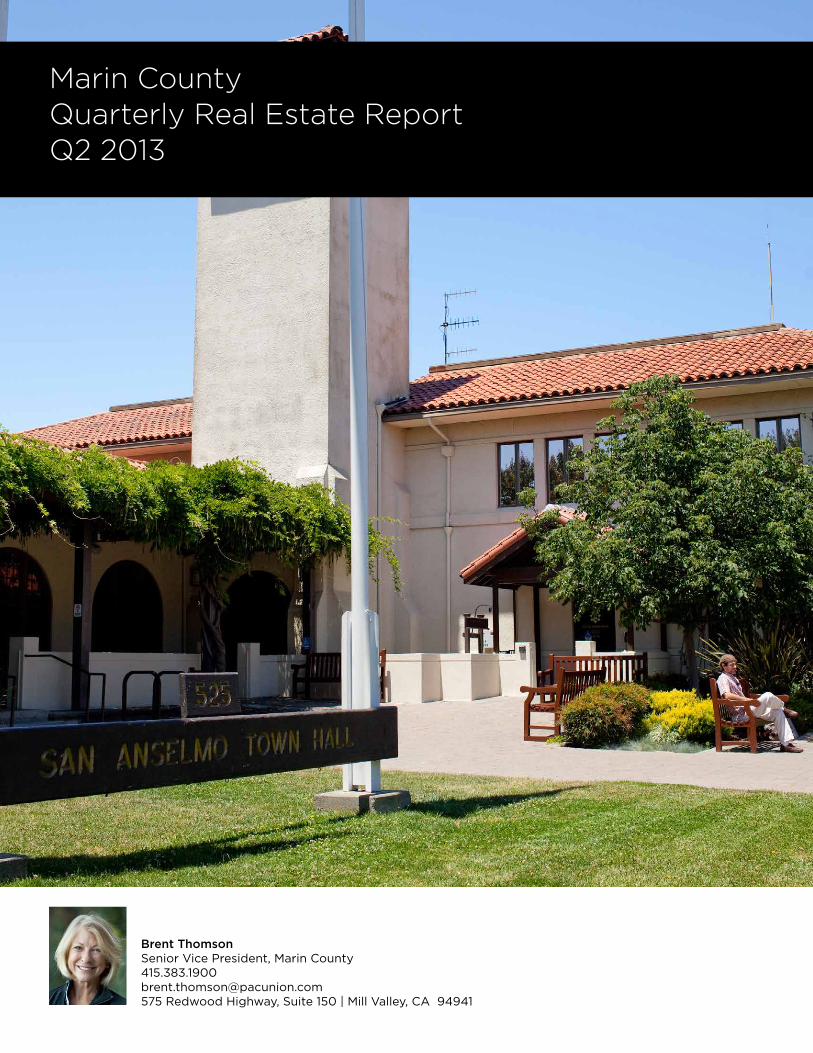
Brent ThomsonSenior Vice President, Marin [email protected] Redwood Highway, Suite 150 | Mill Valley, CA 94941
Marin CountyQuarterly Real Estate ReportQ2 2013
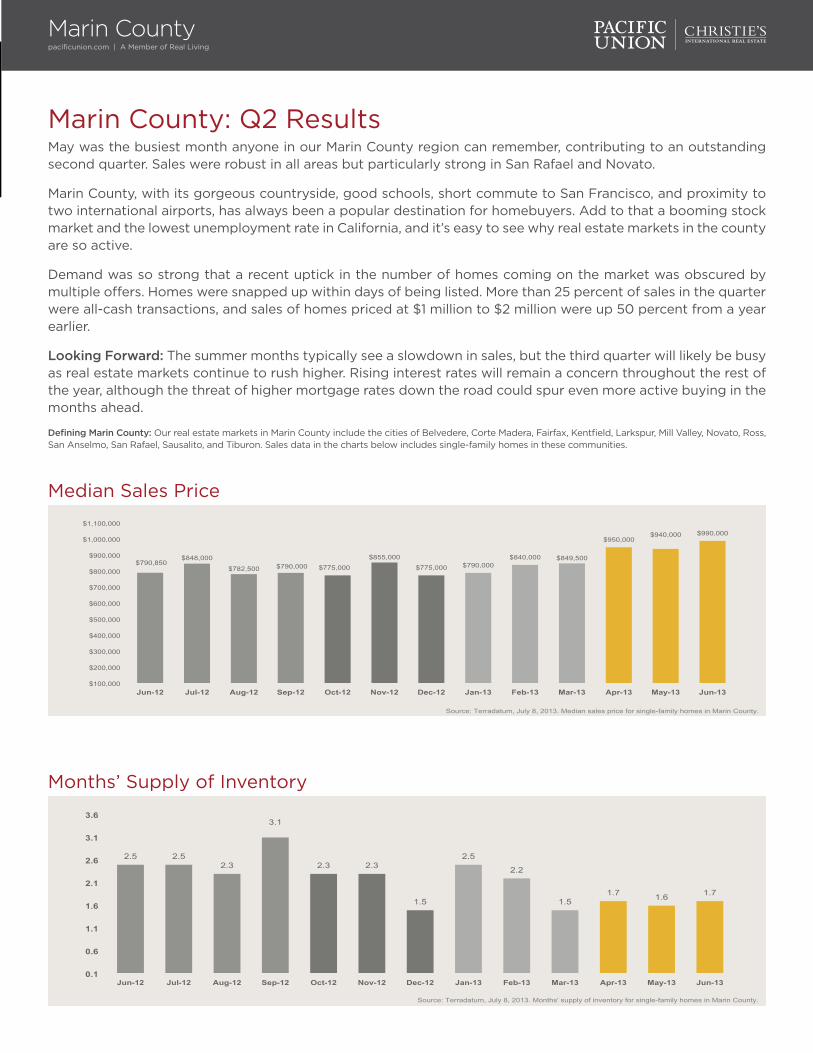
Marin County: Q2 ResultsMay was the busiest month anyone in our Marin County region can remember, contributing to an outstanding second quarter. Sales were robust in all areas but particularly strong in San Rafael and Novato.
Marin County, with its gorgeous countryside, good schools, short commute to San Francisco, and proximity to two international airports, has always been a popular destination for homebuyers. Add to that a booming stock market and the lowest unemployment rate in California, and it’s easy to see why real estate markets in the county are so active.
Demand was so strong that a recent uptick in the number of homes coming on the market was obscured by multiple offers. Homes were snapped up within days of being listed. More than 25 percent of sales in the quarter were all-cash transactions, and sales of homes priced at $1 million to $2 million were up 50 percent from a year earlier.
Looking Forward: The summer months typically see a slowdown in sales, but the third quarter will likely be busy as real estate markets continue to rush higher. Rising interest rates will remain a concern throughout the rest of the year, although the threat of higher mortgage rates down the road could spur even more active buying in the months ahead.
Defining Marin County: Our real estate markets in Marin County include the cities of Belvedere, Corte Madera, Fairfax, Kentfield, Larkspur, Mill Valley, Novato, Ross, San Anselmo, San Rafael, Sausalito, and Tiburon. Sales data in the charts below includes single-family homes in these communities.
Marin Countypacificunion.com | A Member of Real Living
Median Sales Price
Months’ Supply of Inventory
$790,850 $848,000
$782,500 $790,000 $775,000
$855,000
$775,000 $790,000 $840,000 $849,500
$950,000 $940,000 $990,000
$100,000
$200,000
$300,000
$400,000
$500,000
$600,000
$700,000
$800,000
$900,000
$1,000,000
$1,100,000
Jun-12 Jul-12 Aug-12 Sep-12 Oct-12 Nov-12 Dec-12 Jan-13 Feb-13 Mar-13 Apr-13 May-13 Jun-13
Source: Terradatum, July 8, 2013. Median sales price for single-family homes in Marin County.
2.5 2.5 2.3
3.1
2.3 2.3
1.5
2.5
2.2
1.5 1.7 1.6 1.7
0.1
0.6
1.1
1.6
2.1
2.6
3.1
3.6
Jun-12 Jul-12 Aug-12 Sep-12 Oct-12 Nov-12 Dec-12 Jan-13 Feb-13 Mar-13 Apr-13 May-13 Jun-13
Source: Terradatum, July 8, 2013. Months' supply of inventory for single-family homes in Marin County.
Marin Countypacificunion.com | A Member of Real Living
Average Days on the Market
Percentage of Properties Under Contract
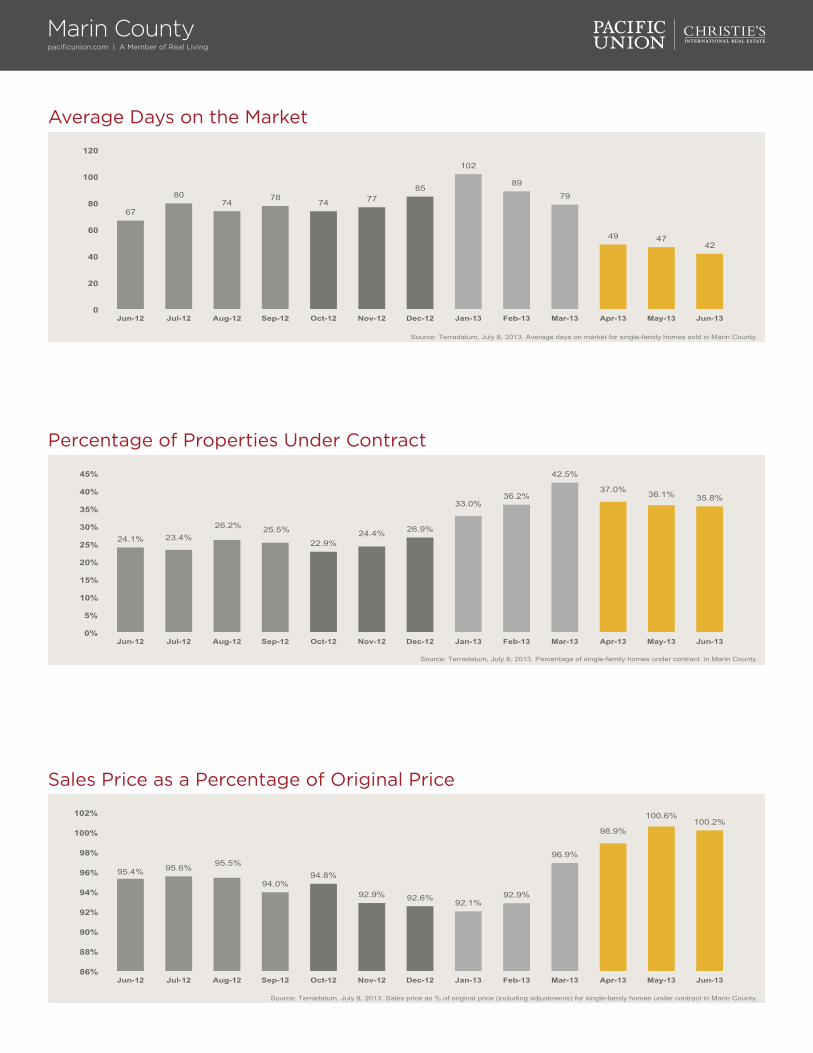
67
80 74
78 74 77
85
102
89
79
49 47 42
0
20
40
60
80
100
120
Jun-12 Jul-12 Aug-12 Sep-12 Oct-12 Nov-12 Dec-12 Jan-13 Feb-13 Mar-13 Apr-13 May-13 Jun-13
Source: Terradatum, July 8, 2013. Average days on market for single-family homes sold in Marin County.
24.1% 23.4% 26.2% 25.5%
22.9% 24.4% 26.9%
33.0% 36.2%
42.5%
37.0% 36.1% 35.8%
0%
5%
10%
15%
20%
25%
30%
35%
40%
45%
Jun-12 Jul-12 Aug-12 Sep-12 Oct-12 Nov-12 Dec-12 Jan-13 Feb-13 Mar-13 Apr-13 May-13 Jun-13
Source: Terradatum, July 8, 2013. Percentage of single-family homes under contract in Marin County.
Sales Price as a Percentage of Original Price
95.4% 95.6% 95.5%
94.0% 94.8%
92.9% 92.6% 92.1% 92.9%
96.9%
98.9%
100.6% 100.2%
86%
88%
90%
92%
94%
96%
98%
100%
102%
Jun-12 Jul-12 Aug-12 Sep-12 Oct-12 Nov-12 Dec-12 Jan-13 Feb-13 Mar-13 Apr-13 May-13 Jun-13
Source: Terradatum, July 8, 2013. Sales price as % of original price (including adjustments) for single-family homes under contract in Marin County.
A Closer Look at Marin County
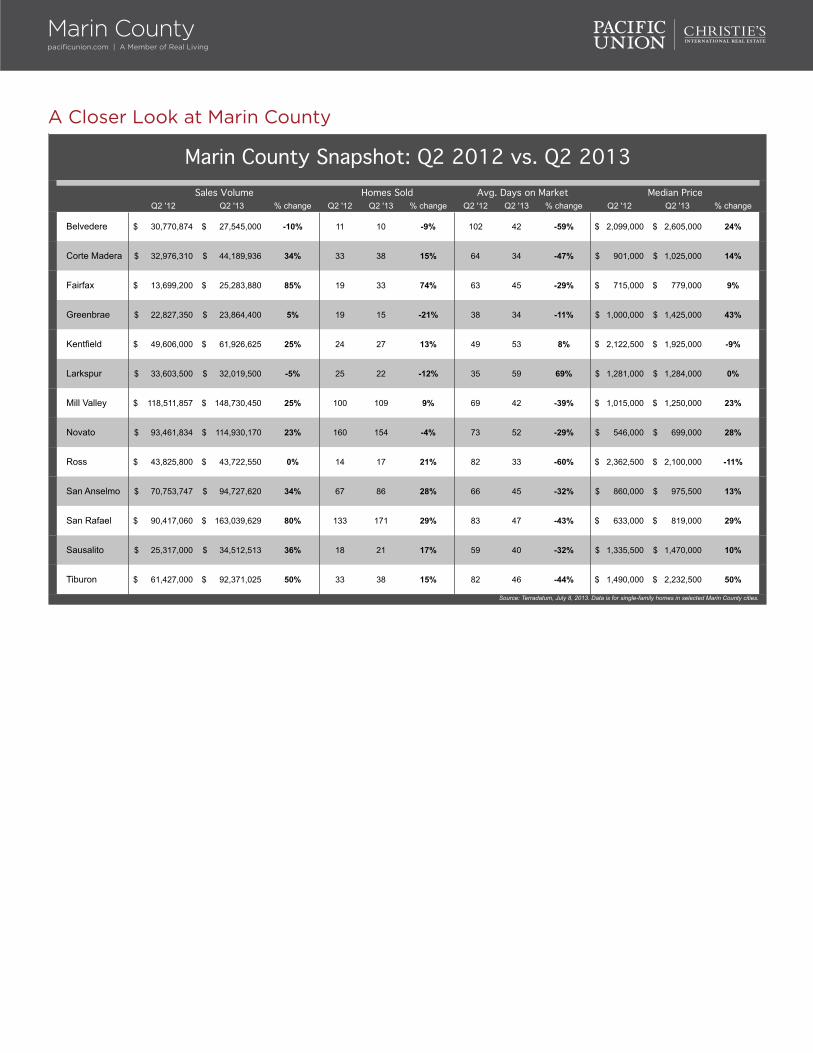
Q2 '12 Q2 '13 % change Q2 '12 Q2 '13 % change Q2 '12 Q2 '13 % change Q2 '12 Q2 '13 % change
Belvedere 30,770,874$ 27,545,000$ -10% 11 10 -9% 102 42 -59% 2,099,000$ 2,605,000$ 24%
Corte Madera 32,976,310$ 44,189,936$ 34% 33 38 15% 64 34 -47% 901,000$ 1,025,000$ 14%
Fairfax 13,699,200$ 25,283,880$ 85% 19 33 74% 63 45 -29% 715,000$ 779,000$ 9%
Greenbrae 22,827,350$ 23,864,400$ 5% 19 15 -21% 38 34 -11% 1,000,000$ 1,425,000$ 43%
Kentfield 49,606,000$ 61,926,625$ 25% 24 27 13% 49 53 8% 2,122,500$ 1,925,000$ -9%
Larkspur 33,603,500$ 32,019,500$ -5% 25 22 -12% 35 59 69% 1,281,000$ 1,284,000$ 0%
Mill Valley 118,511,857$ 148,730,450$ 25% 100 109 9% 69 42 -39% 1,015,000$ 1,250,000$ 23%
Novato 93,461,834$ 114,930,170$ 23% 160 154 -4% 73 52 -29% 546,000$ 699,000$ 28%
Ross 43,825,800$ 43,722,550$ 0% 14 17 21% 82 33 -60% 2,362,500$ 2,100,000$ -11%
San Anselmo 70,753,747$ 94,727,620$ 34% 67 86 28% 66 45 -32% 860,000$ 975,500$ 13%
San Rafael 90,417,060$ 163,039,629$ 80% 133 171 29% 83 47 -43% 633,000$ 819,000$ 29%
Sausalito 25,317,000$ 34,512,513$ 36% 18 21 17% 59 40 -32% 1,335,500$ 1,470,000$ 10%
Tiburon 61,427,000$ 92,371,025$ 50% 33 38 15% 82 46 -44% 1,490,000$ 2,232,500$ 50%
Source: Terradatum, July 8, 2013. Data is for single-family homes in selected Marin County cities.
Marin County Snapshot: Q2 2012 vs. Q2 2013Sales Volume Homes Sold Avg. Days on Market Median Price
Marin Countypacificunion.com | A Member of Real Living
Linda CarrollBranch Executive, Napa [email protected] Main Street | Napa, CA 94559
Napa CountyQuarterly Real Estate ReportQ2 2013
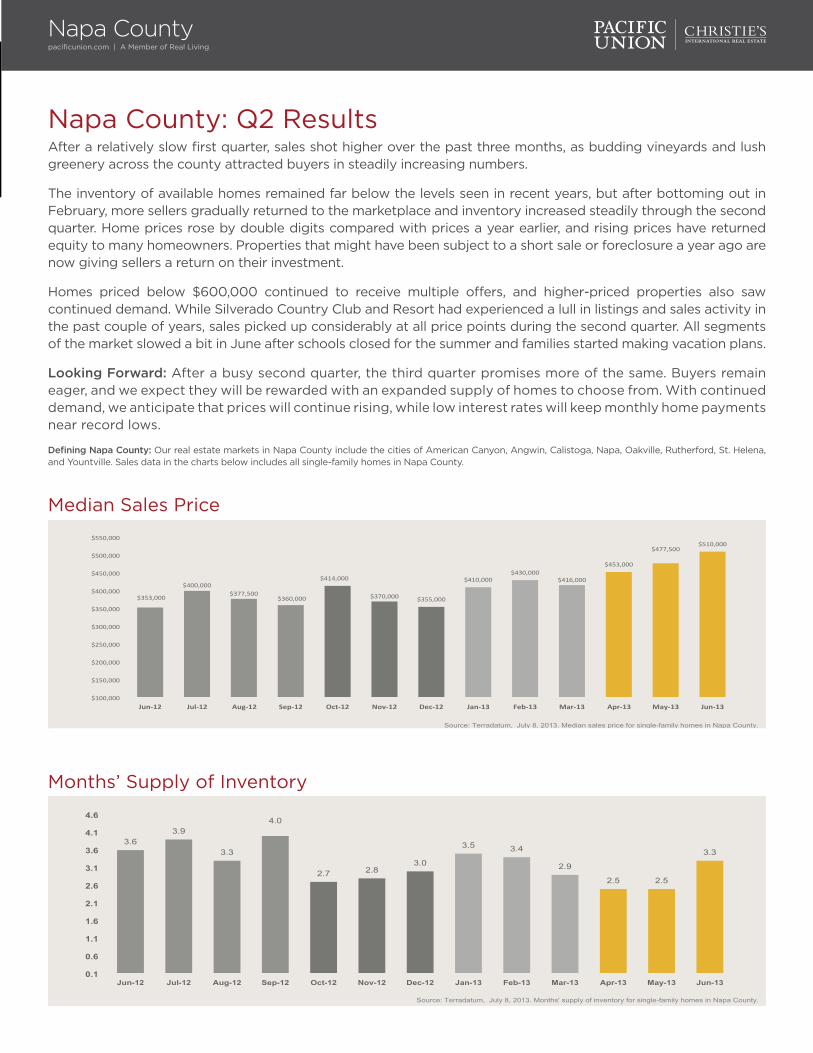
Napa County: Q2 ResultsAfter a relatively slow first quarter, sales shot higher over the past three months, as budding vineyards and lush greenery across the county attracted buyers in steadily increasing numbers.
The inventory of available homes remained far below the levels seen in recent years, but after bottoming out in February, more sellers gradually returned to the marketplace and inventory increased steadily through the second quarter. Home prices rose by double digits compared with prices a year earlier, and rising prices have returned equity to many homeowners. Properties that might have been subject to a short sale or foreclosure a year ago are now giving sellers a return on their investment.
Homes priced below $600,000 continued to receive multiple offers, and higher-priced properties also saw continued demand. While Silverado Country Club and Resort had experienced a lull in listings and sales activity in the past couple of years, sales picked up considerably at all price points during the second quarter. All segments of the market slowed a bit in June after schools closed for the summer and families started making vacation plans.
Looking Forward: After a busy second quarter, the third quarter promises more of the same. Buyers remain eager, and we expect they will be rewarded with an expanded supply of homes to choose from. With continued demand, we anticipate that prices will continue rising, while low interest rates will keep monthly home payments near record lows.
Defining Napa County: Our real estate markets in Napa County include the cities of American Canyon, Angwin, Calistoga, Napa, Oakville, Rutherford, St. Helena, and Yountville. Sales data in the charts below includes all single-family homes in Napa County.
Napa Countypacificunion.com | A Member of Real Living
Median Sales Price
Months’ Supply of Inventory
$353,000
$400,000 $377,500
$360,000
$414,000
$370,000 $355,000
$410,000 $430,000
$416,000
$453,000
$477,500 $510,000
$100,000
$150,000
$200,000
$250,000
$300,000
$350,000
$400,000
$450,000
$500,000
$550,000
Jun-‐12 Jul-‐12 Aug-‐12 Sep-‐12 Oct-‐12 Nov-‐12 Dec-‐12 Jan-‐13 Feb-‐13 Mar-‐13 Apr-‐13 May-‐13 Jun-‐13
Source: Terradatum, July 8, 2013. Median sales price for single-family homes in Napa County.
3.6 3.9
3.3
4.0
2.7 2.8 3.0
3.5 3.4
2.9
2.5 2.5
3.3
0.1
0.6
1.1
1.6
2.1
2.6
3.1
3.6
4.1
4.6
Jun-12 Jul-12 Aug-12 Sep-12 Oct-12 Nov-12 Dec-12 Jan-13 Feb-13 Mar-13 Apr-13 May-13 Jun-13
Source: Terradatum, July 8, 2013. Months' supply of inventory for single-family homes in Napa County.
Napa Countypacificunion.com | A Member of Real Living
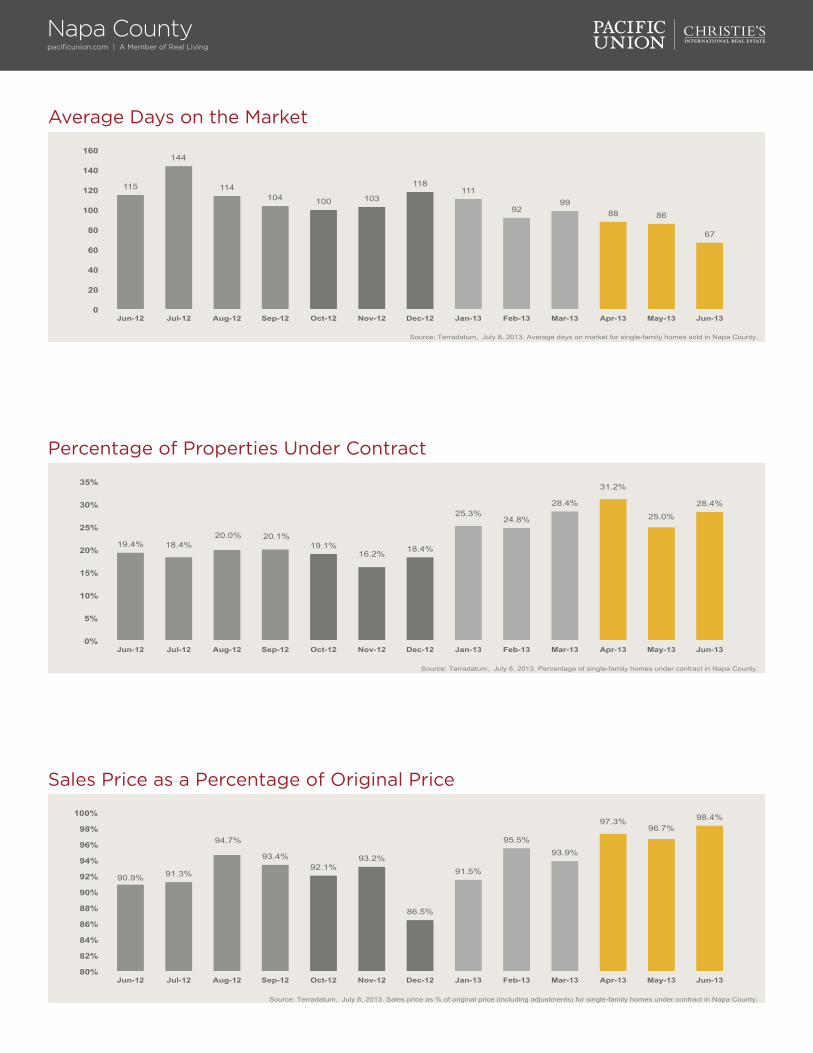
Average Days on the Market
Percentage of Properties Under Contract
115
144
114 104 100 103
118 111
92 99
88 86
67
0
20
40
60
80
100
120
140
160
Jun-12 Jul-12 Aug-12 Sep-12 Oct-12 Nov-12 Dec-12 Jan-13 Feb-13 Mar-13 Apr-13 May-13 Jun-13
Source: Terradatum, July 8, 2013. Average days on market for single-family homes sold in Napa County.
19.4% 18.4% 20.0% 20.1%
19.1% 16.2% 18.4%
25.3% 24.8%
28.4%
31.2%
25.0%
28.4%
0%
5%
10%
15%
20%
25%
30%
35%
Jun-12 Jul-12 Aug-12 Sep-12 Oct-12 Nov-12 Dec-12 Jan-13 Feb-13 Mar-13 Apr-13 May-13 Jun-13
Source: Terradatum, July 8, 2013. Percentage of single-family homes under contract in Napa County.
Sales Price as a Percentage of Original Price
90.9% 91.3%
94.7%
93.4% 92.1%
93.2%
86.5%
91.5%
95.5% 93.9%
97.3% 96.7%
98.4%
80%
82%
84%
86%
88%
90%
92%
94%
96%
98%
100%
Jun-12 Jul-12 Aug-12 Sep-12 Oct-12 Nov-12 Dec-12 Jan-13 Feb-13 Mar-13 Apr-13 May-13 Jun-13
Source: Terradatum, July 8, 2013. Sales price as % of original price (including adjustments) for single-family homes under contract in Napa County.
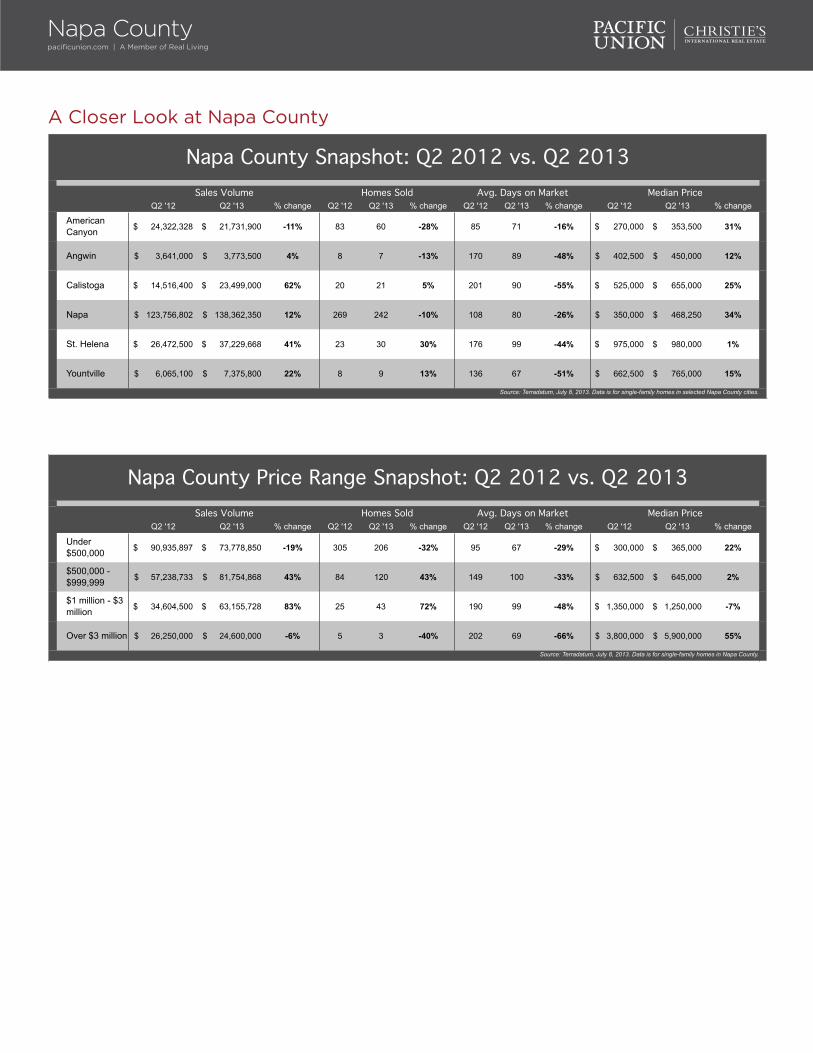
A Closer Look at Napa County
Q2 '12 Q2 '13 % change Q2 '12 Q2 '13 % change Q2 '12 Q2 '13 % change Q2 '12 Q2 '13 % change
American Canyon 24,322,328$ 21,731,900$ -11% 83 60 -28% 85 71 -16% 270,000$ 353,500$ 31%
Angwin 3,641,000$ 3,773,500$ 4% 8 7 -13% 170 89 -48% 402,500$ 450,000$ 12%
Calistoga 14,516,400$ 23,499,000$ 62% 20 21 5% 201 90 -55% 525,000$ 655,000$ 25%
Napa 123,756,802$ 138,362,350$ 12% 269 242 -10% 108 80 -26% 350,000$ 468,250$ 34%
St. Helena 26,472,500$ 37,229,668$ 41% 23 30 30% 176 99 -44% 975,000$ 980,000$ 1%
Yountville 6,065,100$ 7,375,800$ 22% 8 9 13% 136 67 -51% 662,500$ 765,000$ 15%
Source: Terradatum, July 8, 2013. Data is for single-family homes in selected Napa County cities.
Napa County Snapshot: Q2 2012 vs. Q2 2013Sales Volume Homes Sold Avg. Days on Market Median Price
Q2 '12 Q2 '13 % change Q2 '12 Q2 '13 % change Q2 '12 Q2 '13 % change Q2 '12 Q2 '13 % change
Under $500,000 90,935,897$ 73,778,850$ -19% 305 206 -32% 95 67 -29% 300,000$ 365,000$ 22%
$500,000 - $999,999 57,238,733$ 81,754,868$ 43% 84 120 43% 149 100 -33% 632,500$ 645,000$ 2%
$1 million - $3 million 34,604,500$ 63,155,728$ 83% 25 43 72% 190 99 -48% 1,350,000$ 1,250,000$ -7%
Over $3 million 26,250,000$ 24,600,000$ -6% 5 3 -40% 202 69 -66% 3,800,000$ 5,900,000$ 55%
Median Price
Source: Terradatum, July 8, 2013. Data is for single-family homes in Napa County.
Napa County Price Range Snapshot: Q2 2012 vs. Q2 2013Sales Volume Homes Sold Avg. Days on Market
Napa Countypacificunion.com | A Member of Real Living
Patrick BarberPresident, San Francisco [email protected] Letterman Drive, Building C, Suite 500 | San Francisco, CA 94129
San FranciscoQuarterly Real Estate ReportQ2 2013
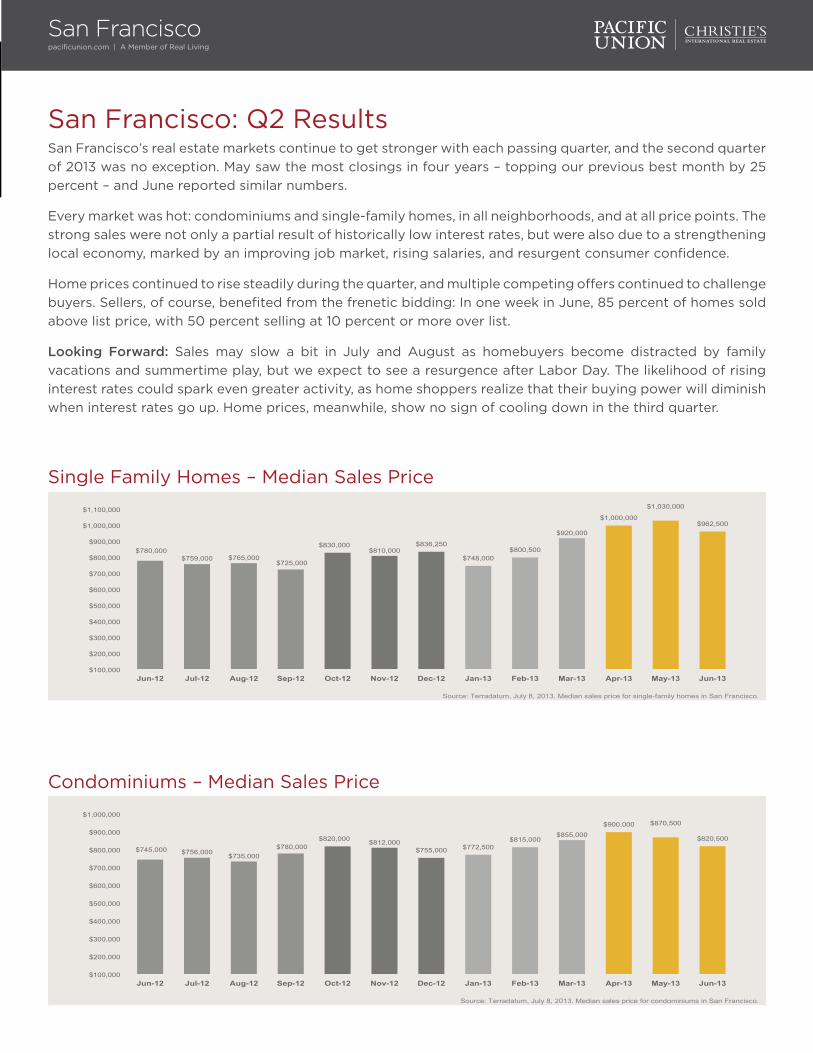
San Francisco: Q2 ResultsSan Francisco’s real estate markets continue to get stronger with each passing quarter, and the second quarter of 2013 was no exception. May saw the most closings in four years – topping our previous best month by 25 percent – and June reported similar numbers.
Every market was hot: condominiums and single-family homes, in all neighborhoods, and at all price points. The strong sales were not only a partial result of historically low interest rates, but were also due to a strengthening local economy, marked by an improving job market, rising salaries, and resurgent consumer confidence.
Home prices continued to rise steadily during the quarter, and multiple competing offers continued to challenge buyers. Sellers, of course, benefited from the frenetic bidding: In one week in June, 85 percent of homes sold above list price, with 50 percent selling at 10 percent or more over list.
Looking Forward: Sales may slow a bit in July and August as homebuyers become distracted by family vacations and summertime play, but we expect to see a resurgence after Labor Day. The likelihood of rising interest rates could spark even greater activity, as home shoppers realize that their buying power will diminish when interest rates go up. Home prices, meanwhile, show no sign of cooling down in the third quarter.
San Franciscopacificunion.com | A Member of Real Living
Single Family Homes – Median Sales Price
Condominiums – Median Sales Price
$780,000 $759,000 $765,000
$725,000
$830,000 $810,000
$836,250
$748,000 $800,500
$920,000
$1,000,000
$1,030,000
$962,500
$100,000
$200,000
$300,000
$400,000
$500,000
$600,000
$700,000
$800,000
$900,000
$1,000,000
$1,100,000
Jun-12 Jul-12 Aug-12 Sep-12 Oct-12 Nov-12 Dec-12 Jan-13 Feb-13 Mar-13 Apr-13 May-13 Jun-13
Source: Terradatum, July 8, 2013. Median sales price for single-family homes in San Francisco.
$745,000 $756,000 $735,000 $780,000
$820,000 $812,000 $755,000 $772,500
$815,000 $855,000
$900,000 $870,500
$820,500
$100,000
$200,000
$300,000
$400,000
$500,000
$600,000
$700,000
$800,000
$900,000
$1,000,000
Jun-12 Jul-12 Aug-12 Sep-12 Oct-12 Nov-12 Dec-12 Jan-13 Feb-13 Mar-13 Apr-13 May-13 Jun-13
Source: Terradatum, July 8, 2013. Median sales price for condominiums in San Francisco.
San Franciscopacificunion.com | A Member of Real Living
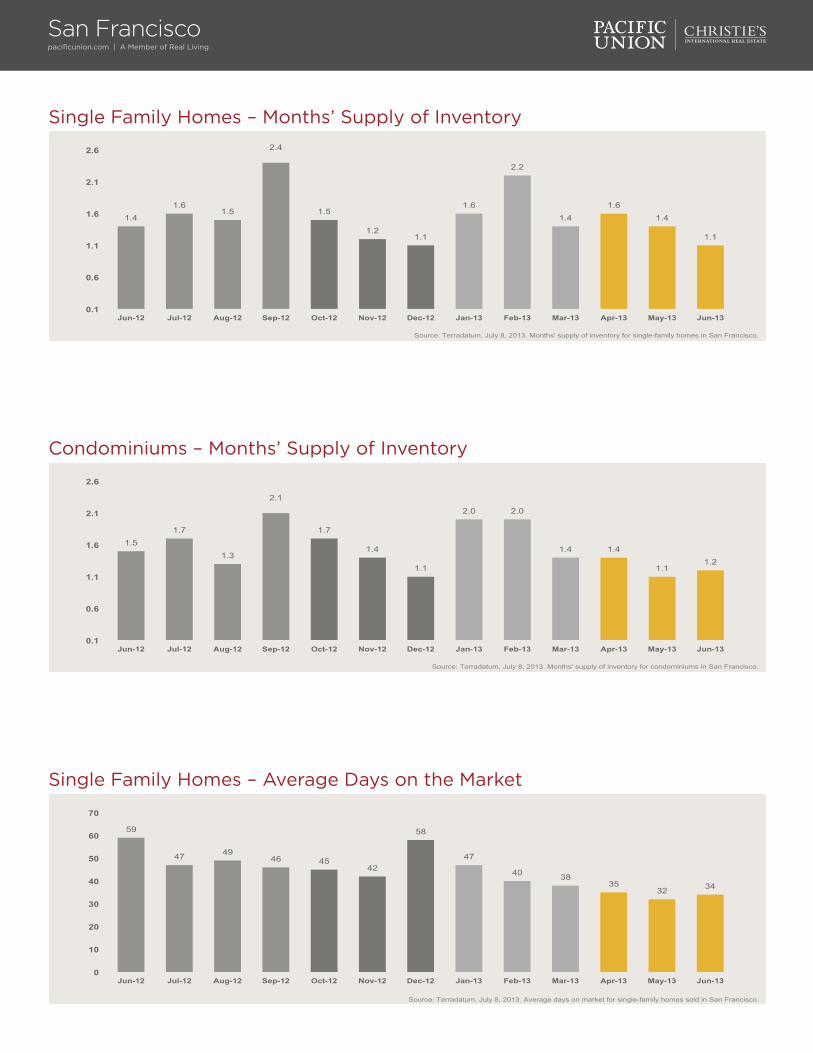
Single Family Homes – Months’ Supply of Inventory
1.4 1.6
1.5
2.4
1.5
1.2 1.1
1.6
2.2
1.4 1.6
1.4
1.1
0.1
0.6
1.1
1.6
2.1
2.6
Jun-12 Jul-12 Aug-12 Sep-12 Oct-12 Nov-12 Dec-12 Jan-13 Feb-13 Mar-13 Apr-13 May-13 Jun-13
Source: Terradatum, July 8, 2013. Months' supply of inventory for single-family homes in San Francisco.
Single Family Homes – Average Days on the Market
59
47 49 46 45
42
58
47
40 38 35
32 34
0
10
20
30
40
50
60
70
Jun-12 Jul-12 Aug-12 Sep-12 Oct-12 Nov-12 Dec-12 Jan-13 Feb-13 Mar-13 Apr-13 May-13 Jun-13
Source: Terradatum, July 8, 2013. Average days on market for single-family homes sold in San Francisco.
Condominiums – Months’ Supply of Inventory
1.5 1.7
1.3
2.1
1.7
1.4
1.1
2.0 2.0
1.4 1.4
1.1 1.2
0.1
0.6
1.1
1.6
2.1
2.6
Jun-12 Jul-12 Aug-12 Sep-12 Oct-12 Nov-12 Dec-12 Jan-13 Feb-13 Mar-13 Apr-13 May-13 Jun-13
Source: Terradatum, July 8, 2013. Months' supply of inventory for condominiums in San Francisco.
San Franciscopacificunion.com | A Member of Real Living
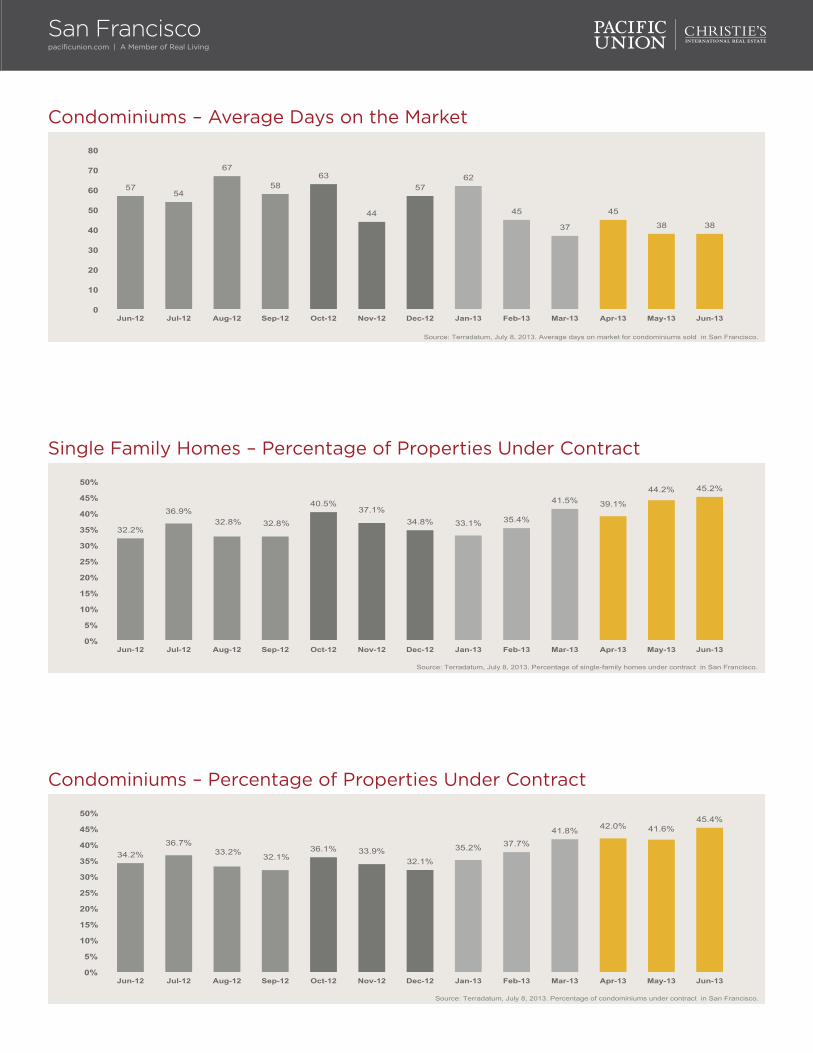
Condominiums – Average Days on the Market
57 54
67
58 63
44
57 62
45
37
45
38 38
0
10
20
30
40
50
60
70
80
Jun-12 Jul-12 Aug-12 Sep-12 Oct-12 Nov-12 Dec-12 Jan-13 Feb-13 Mar-13 Apr-13 May-13 Jun-13
Source: Terradatum, July 8, 2013. Average days on market for condominiums sold in San Francisco.
Condominiums – Percentage of Properties Under Contract
34.2% 36.7%
33.2% 32.1% 36.1% 33.9%
32.1%
35.2% 37.7%
41.8% 42.0% 41.6% 45.4%
0%
5%
10%
15%
20%
25%
30%
35%
40%
45%
50%
Jun-12 Jul-12 Aug-12 Sep-12 Oct-12 Nov-12 Dec-12 Jan-13 Feb-13 Mar-13 Apr-13 May-13 Jun-13
Source: Terradatum, July 8, 2013. Percentage of condominiums under contract in San Francisco.
Single Family Homes – Percentage of Properties Under Contract
32.2%
36.9% 32.8% 32.8%
40.5% 37.1%
34.8% 33.1% 35.4%
41.5% 39.1%
44.2% 45.2%
0%
5%
10%
15%
20%
25%
30%
35%
40%
45%
50%
Jun-12 Jul-12 Aug-12 Sep-12 Oct-12 Nov-12 Dec-12 Jan-13 Feb-13 Mar-13 Apr-13 May-13 Jun-13
Source: Terradatum, July 8, 2013. Percentage of single-family homes under contract in San Francisco.
San Franciscopacificunion.com | A Member of Real Living
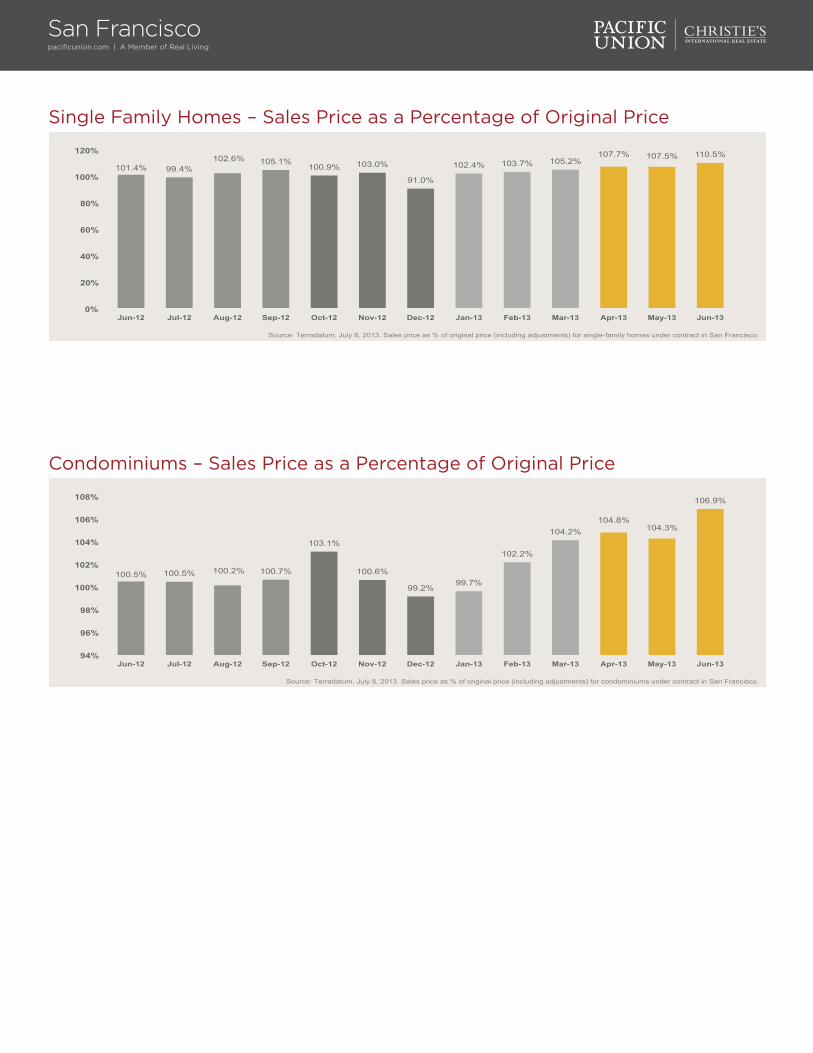
Single Family Homes – Sales Price as a Percentage of Original Price
101.4% 99.4% 102.6% 105.1%
100.9% 103.0%
91.0%
102.4% 103.7% 105.2% 107.7% 107.5% 110.5%
0%
20%
40%
60%
80%
100%
120%
Jun-12 Jul-12 Aug-12 Sep-12 Oct-12 Nov-12 Dec-12 Jan-13 Feb-13 Mar-13 Apr-13 May-13 Jun-13
Source: Terradatum, July 8, 2013. Sales price as % of original price (including adjustments) for single-family homes under contract in San Francisco.
Condominiums – Sales Price as a Percentage of Original Price
100.5% 100.5% 100.2% 100.7%
103.1%
100.6%
99.2% 99.7%
102.2%
104.2% 104.8%
104.3%
106.9%
94%
96%
98%
100%
102%
104%
106%
108%
Jun-12 Jul-12 Aug-12 Sep-12 Oct-12 Nov-12 Dec-12 Jan-13 Feb-13 Mar-13 Apr-13 May-13 Jun-13
Source: Terradatum, July 8, 2013. Sales price as % of original price (including adjustments) for condominiums under contract in San Francisco.
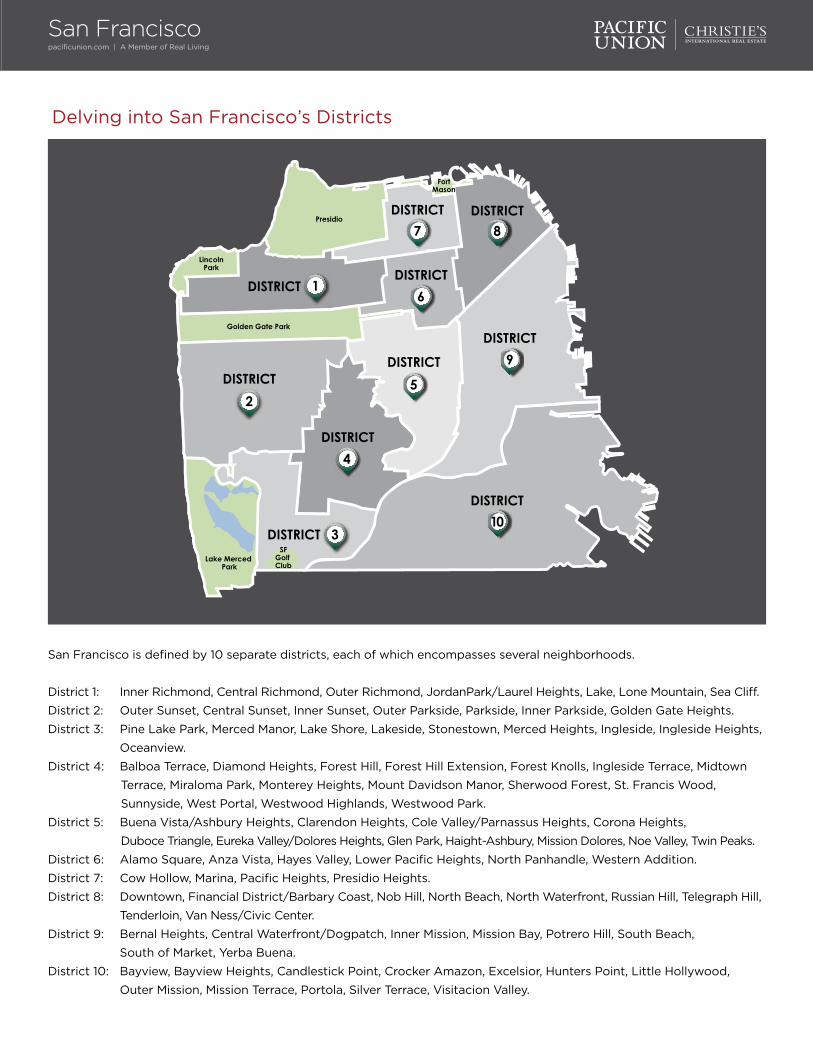
Delving into San Francisco’s Districts
San Francisco is defined by 10 separate districts, each of which encompasses several neighborhoods.
District 1: Inner Richmond, Central Richmond, Outer Richmond, JordanPark/Laurel Heights, Lake, Lone Mountain, Sea Cliff.
District 2: Outer Sunset, Central Sunset, Inner Sunset, Outer Parkside, Parkside, Inner Parkside, Golden Gate Heights.
District 3: Pine Lake Park, Merced Manor, Lake Shore, Lakeside, Stonestown, Merced Heights, Ingleside, Ingleside Heights,
Oceanview.
District 4: Balboa Terrace, Diamond Heights, Forest Hill, Forest Hill Extension, Forest Knolls, Ingleside Terrace, Midtown
Terrace, Miraloma Park, Monterey Heights, Mount Davidson Manor, Sherwood Forest, St. Francis Wood,
Sunnyside, West Portal, Westwood Highlands, Westwood Park.
District 5: Buena Vista/Ashbury Heights, Clarendon Heights, Cole Valley/Parnassus Heights, Corona Heights,
Duboce Triangle, Eureka Valley/Dolores Heights, Glen Park, Haight-Ashbury, Mission Dolores, Noe Valley, Twin Peaks.
District 6: Alamo Square, Anza Vista, Hayes Valley, Lower Pacific Heights, North Panhandle, Western Addition.
District 7: Cow Hollow, Marina, Pacific Heights, Presidio Heights.
District 8: Downtown, Financial District/Barbary Coast, Nob Hill, North Beach, North Waterfront, Russian Hill, Telegraph Hill,
Tenderloin, Van Ness/Civic Center.
District 9: Bernal Heights, Central Waterfront/Dogpatch, Inner Mission, Mission Bay, Potrero Hill, South Beach,
South of Market, Yerba Buena.
District 10: Bayview, Bayview Heights, Candlestick Point, Crocker Amazon, Excelsior, Hunters Point, Little Hollywood,
Outer Mission, Mission Terrace, Portola, Silver Terrace, Visitacion Valley.
San Franciscopacificunion.com | A Member of Real Living
San Franciscopacificunion.com | A Member of Real Living
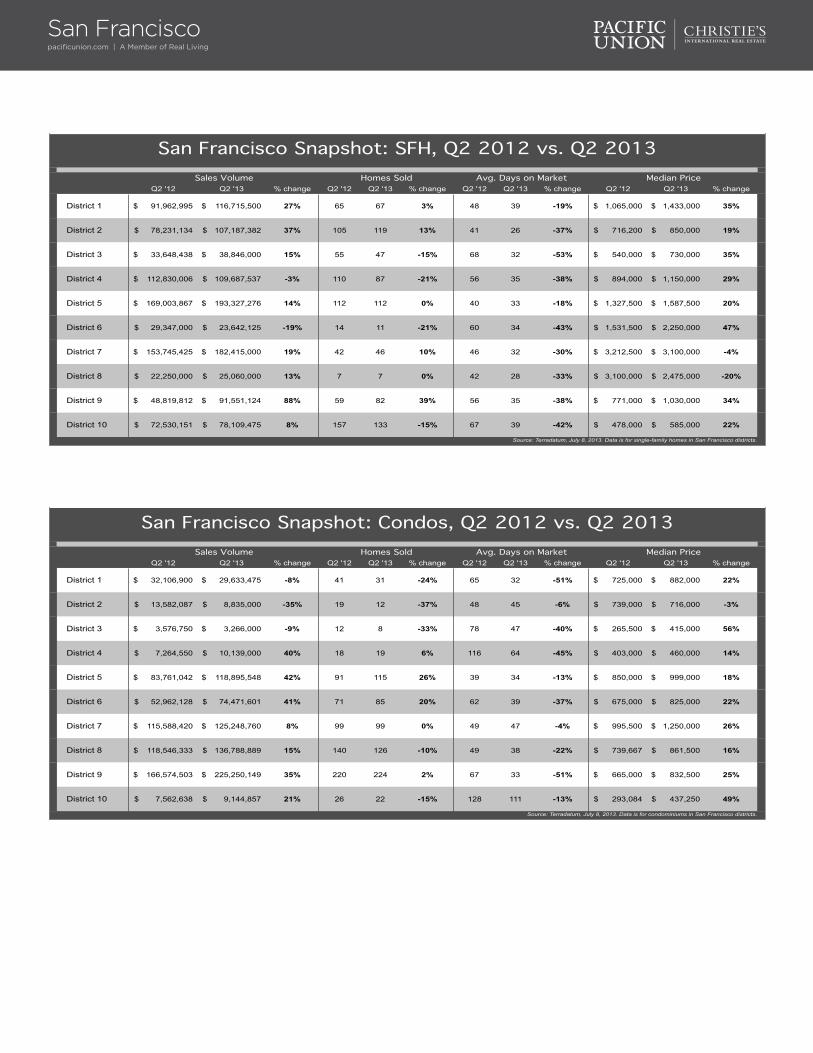
Q2 '12 Q2 '13 % change Q2 '12 Q2 '13 % change Q2 '12 Q2 '13 % change Q2 '12 Q2 '13 % change
District 1 91,962,995$ 116,715,500$ 27% 65 67 3% 48 39 -19% 1,065,000$ 1,433,000$ 35%
District 2 78,231,134$ 107,187,382$ 37% 105 119 13% 41 26 -37% 716,200$ 850,000$ 19%
District 3 33,648,438$ 38,846,000$ 15% 55 47 -15% 68 32 -53% 540,000$ 730,000$ 35%
District 4 112,830,006$ 109,687,537$ -3% 110 87 -21% 56 35 -38% 894,000$ 1,150,000$ 29%
District 5 169,003,867$ 193,327,276$ 14% 112 112 0% 40 33 -18% 1,327,500$ 1,587,500$ 20%
District 6 29,347,000$ 23,642,125$ -19% 14 11 -21% 60 34 -43% 1,531,500$ 2,250,000$ 47%
District 7 153,745,425$ 182,415,000$ 19% 42 46 10% 46 32 -30% 3,212,500$ 3,100,000$ -4%
District 8 22,250,000$ 25,060,000$ 13% 7 7 0% 42 28 -33% 3,100,000$ 2,475,000$ -20%
District 9 48,819,812$ 91,551,124$ 88% 59 82 39% 56 35 -38% 771,000$ 1,030,000$ 34%
District 10 72,530,151$ 78,109,475$ 8% 157 133 -15% 67 39 -42% 478,000$ 585,000$ 22%
Source: Terradatum, July 8, 2013. Data is for single-family homes in San Francisco districts.
San Francisco Snapshot: SFH, Q2 2012 vs. Q2 2013Sales Volume Homes Sold Avg. Days on Market Median Price
Q2 '12 Q2 '13 % change Q2 '12 Q2 '13 % change Q2 '12 Q2 '13 % change Q2 '12 Q2 '13 % change
District 1 32,106,900$ 29,633,475$ -8% 41 31 -24% 65 32 -51% 725,000$ 882,000$ 22%
District 2 13,582,087$ 8,835,000$ -35% 19 12 -37% 48 45 -6% 739,000$ 716,000$ -3%
District 3 3,576,750$ 3,266,000$ -9% 12 8 -33% 78 47 -40% 265,500$ 415,000$ 56%
District 4 7,264,550$ 10,139,000$ 40% 18 19 6% 116 64 -45% 403,000$ 460,000$ 14%
District 5 83,761,042$ 118,895,548$ 42% 91 115 26% 39 34 -13% 850,000$ 999,000$ 18%
District 6 52,962,128$ 74,471,601$ 41% 71 85 20% 62 39 -37% 675,000$ 825,000$ 22%
District 7 115,588,420$ 125,248,760$ 8% 99 99 0% 49 47 -4% 995,500$ 1,250,000$ 26%
District 8 118,546,333$ 136,788,889$ 15% 140 126 -10% 49 38 -22% 739,667$ 861,500$ 16%
District 9 166,574,503$ 225,250,149$ 35% 220 224 2% 67 33 -51% 665,000$ 832,500$ 25%
District 10 7,562,638$ 9,144,857$ 21% 26 22 -15% 128 111 -13% 293,084$ 437,250$ 49%
Source: Terradatum, July 8, 2013. Data is for condominiums in San Francisco districts.
San Francisco Snapshot: Condos, Q2 2012 vs. Q2 2013Sales Volume Homes Sold Avg. Days on Market Median Price
San Franciscopacificunion.com | A Member of Real Living
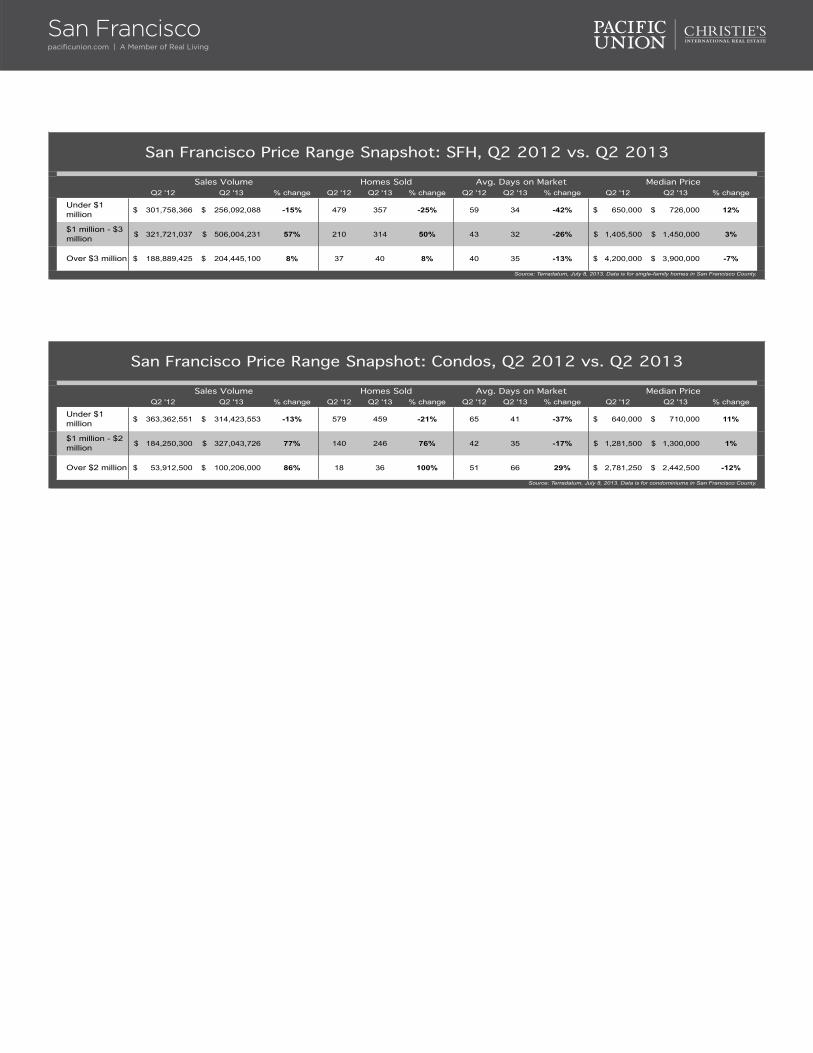
Q2 '12 Q2 '13 % change Q2 '12 Q2 '13 % change Q2 '12 Q2 '13 % change Q2 '12 Q2 '13 % change
Under $1 million 301,758,366$ 256,092,088$ -15% 479 357 -25% 59 34 -42% 650,000$ 726,000$ 12%
$1 million - $3 million 321,721,037$ 506,004,231$ 57% 210 314 50% 43 32 -26% 1,405,500$ 1,450,000$ 3%
Over $3 million 188,889,425$ 204,445,100$ 8% 37 40 8% 40 35 -13% 4,200,000$ 3,900,000$ -7%
San Francisco Price Range Snapshot: SFH, Q2 2012 vs. Q2 2013
Source: Terradatum, July 8, 2013. Data is for single-family homes in San Francisco County.
Sales Volume Homes Sold Avg. Days on Market Median Price
Q2 '12 Q2 '13 % change Q2 '12 Q2 '13 % change Q2 '12 Q2 '13 % change Q2 '12 Q2 '13 % change
Under $1 million 363,362,551$ 314,423,553$ -13% 579 459 -21% 65 41 -37% 640,000$ 710,000$ 11%
$1 million - $2 million 184,250,300$ 327,043,726$ 77% 140 246 76% 42 35 -17% 1,281,500$ 1,300,000$ 1%
Over $2 million 53,912,500$ 100,206,000$ 86% 18 36 100% 51 66 29% 2,781,250$ 2,442,500$ -12%
Source: Terradatum, July 8, 2013. Data is for condominiums in San Francisco County.
San Francisco Price Range Snapshot: Condos, Q2 2012 vs. Q2 2013
Sales Volume Homes Sold Avg. Days on Market Median Price
Rick LawsSenior Vice President, Sonoma [email protected] Mendocino Avenue, Suite 210 | Santa Rosa, CA 95403
Sonoma CountyQuarterly Real Estate ReportQ2 2013
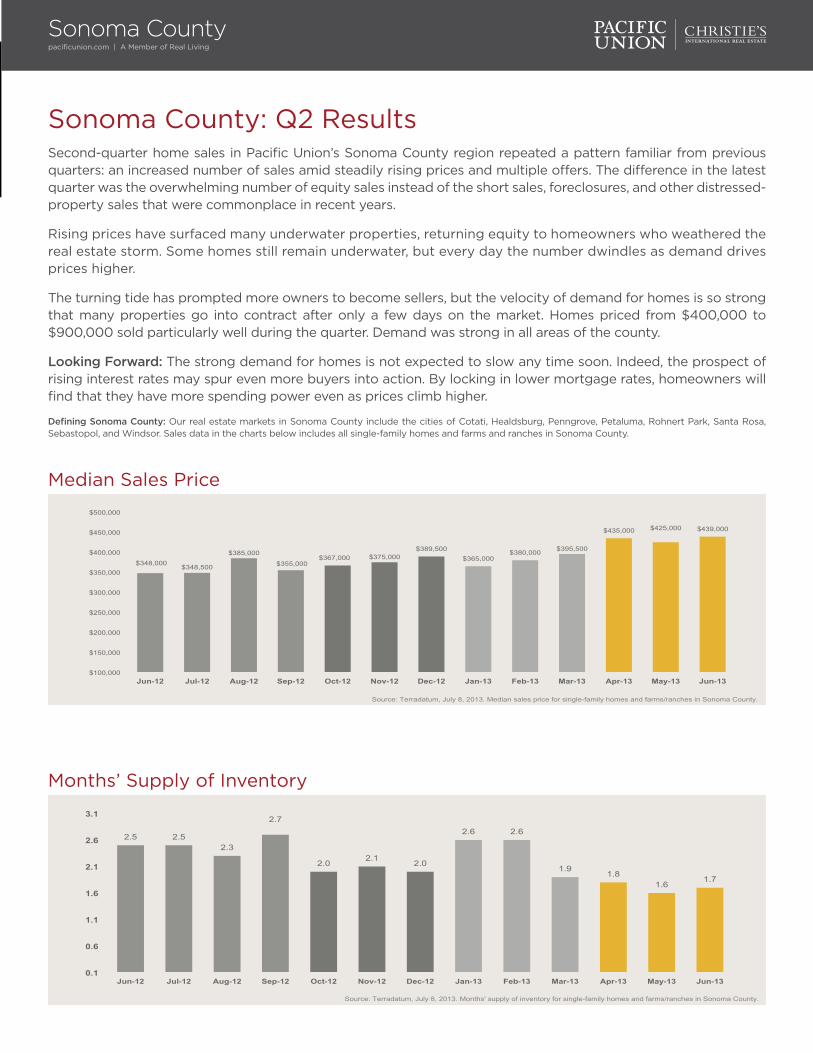
Sonoma County: Q2 ResultsSecond-quarter home sales in Pacific Union’s Sonoma County region repeated a pattern familiar from previous quarters: an increased number of sales amid steadily rising prices and multiple offers. The difference in the latest quarter was the overwhelming number of equity sales instead of the short sales, foreclosures, and other distressed-property sales that were commonplace in recent years.
Rising prices have surfaced many underwater properties, returning equity to homeowners who weathered the real estate storm. Some homes still remain underwater, but every day the number dwindles as demand drives prices higher.
The turning tide has prompted more owners to become sellers, but the velocity of demand for homes is so strong that many properties go into contract after only a few days on the market. Homes priced from $400,000 to $900,000 sold particularly well during the quarter. Demand was strong in all areas of the county.
Looking Forward: The strong demand for homes is not expected to slow any time soon. Indeed, the prospect of rising interest rates may spur even more buyers into action. By locking in lower mortgage rates, homeowners will find that they have more spending power even as prices climb higher.
Defining Sonoma County: Our real estate markets in Sonoma County include the cities of Cotati, Healdsburg, Penngrove, Petaluma, Rohnert Park, Santa Rosa, Sebastopol, and Windsor. Sales data in the charts below includes all single-family homes and farms and ranches in Sonoma County.
Sonoma Countypacificunion.com | A Member of Real Living
Median Sales Price
Months’ Supply of Inventory
$348,000 $348,500
$385,000
$355,000 $367,000 $375,000
$389,500 $365,000
$380,000 $395,500
$435,000 $425,000 $439,000
$100,000
$150,000
$200,000
$250,000
$300,000
$350,000
$400,000
$450,000
$500,000
Jun-12 Jul-12 Aug-12 Sep-12 Oct-12 Nov-12 Dec-12 Jan-13 Feb-13 Mar-13 Apr-13 May-13 Jun-13
Source: Terradatum, July 8, 2013. Median sales price for single-family homes and farms/ranches in Sonoma County.
2.5 2.5 2.3
2.7
2.0 2.1
2.0
2.6 2.6
1.9 1.8
1.6 1.7
0.1
0.6
1.1
1.6
2.1
2.6
3.1
Jun-12 Jul-12 Aug-12 Sep-12 Oct-12 Nov-12 Dec-12 Jan-13 Feb-13 Mar-13 Apr-13 May-13 Jun-13
Source: Terradatum, July 8, 2013. Months' supply of inventory for single-family homes and farms/ranches in Sonoma County.
Sonoma Countypacificunion.com | A Member of Real Living
Average Days on the Market
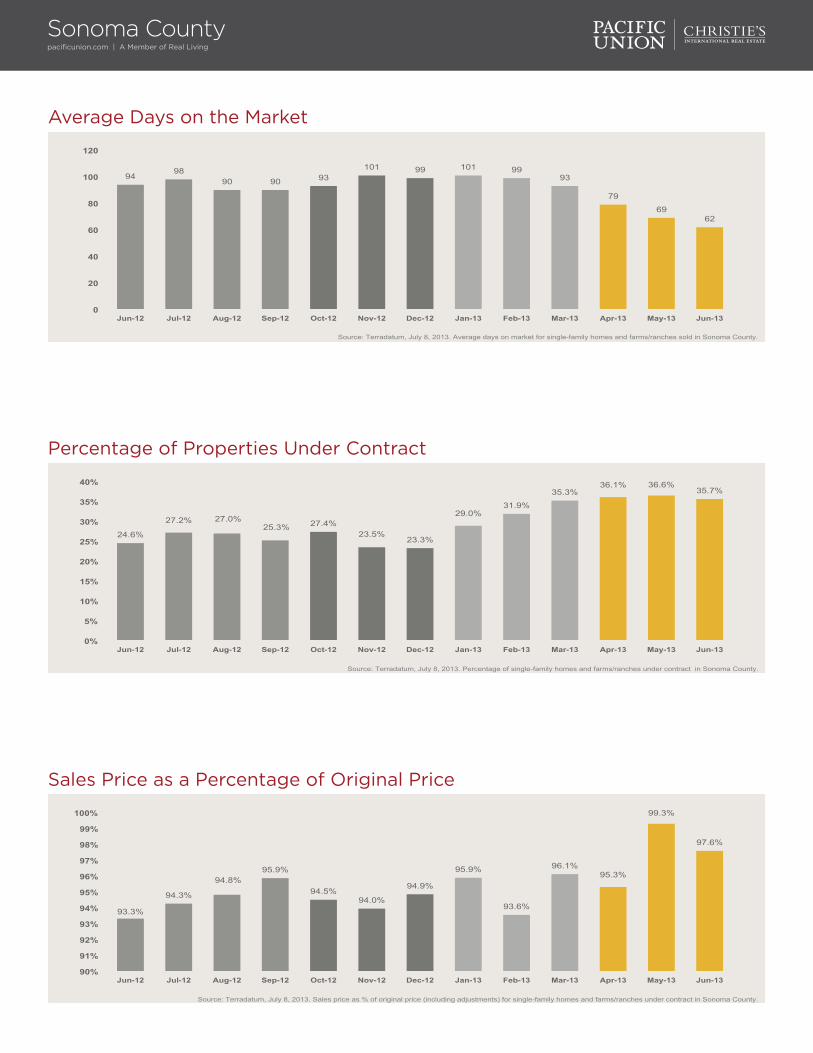
94 98
90 90 93 101 99 101 99
93
79
69 62
0
20
40
60
80
100
120
Jun-12 Jul-12 Aug-12 Sep-12 Oct-12 Nov-12 Dec-12 Jan-13 Feb-13 Mar-13 Apr-13 May-13 Jun-13
Source: Terradatum, July 8, 2013. Average days on market for single-family homes and farms/ranches sold in Sonoma County.
Sales Price as a Percentage of Original Price
93.3%
94.3%
94.8% 95.9%
94.5% 94.0%
94.9%
95.9%
93.6%
96.1% 95.3%
99.3%
97.6%
90%
91%
92%
93%
94%
95%
96%
97%
98%
99%
100%
Jun-12 Jul-12 Aug-12 Sep-12 Oct-12 Nov-12 Dec-12 Jan-13 Feb-13 Mar-13 Apr-13 May-13 Jun-13
Source: Terradatum, July 8, 2013. Sales price as % of original price (including adjustments) for single-family homes and farms/ranches under contract in Sonoma County.
Percentage of Properties Under Contract
24.6%
27.2% 27.0% 25.3% 27.4%
23.5% 23.3%
29.0% 31.9%
35.3% 36.1% 36.6%
35.7%
0%
5%
10%
15%
20%
25%
30%
35%
40%
Jun-12 Jul-12 Aug-12 Sep-12 Oct-12 Nov-12 Dec-12 Jan-13 Feb-13 Mar-13 Apr-13 May-13 Jun-13
Source: Terradatum, July 8, 2013. Percentage of single-family homes and farms/ranches under contract in Sonoma County.
A Closer Look at Sonoma County
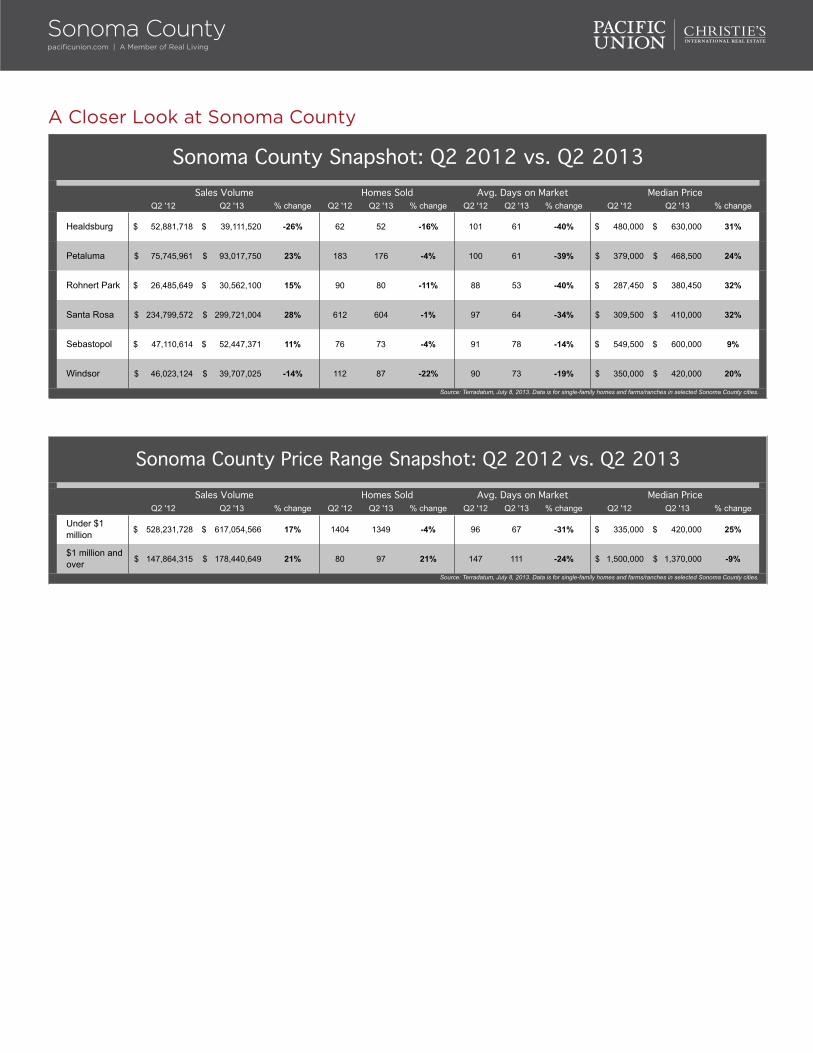
Q2 '12 Q2 '13 % change Q2 '12 Q2 '13 % change Q2 '12 Q2 '13 % change Q2 '12 Q2 '13 % change
Healdsburg 52,881,718$ 39,111,520$ -26% 62 52 -16% 101 61 -40% 480,000$ 630,000$ 31%
Petaluma 75,745,961$ 93,017,750$ 23% 183 176 -4% 100 61 -39% 379,000$ 468,500$ 24%
Rohnert Park 26,485,649$ 30,562,100$ 15% 90 80 -11% 88 53 -40% 287,450$ 380,450$ 32%
Santa Rosa 234,799,572$ 299,721,004$ 28% 612 604 -1% 97 64 -34% 309,500$ 410,000$ 32%
Sebastopol 47,110,614$ 52,447,371$ 11% 76 73 -4% 91 78 -14% 549,500$ 600,000$ 9%
Windsor 46,023,124$ 39,707,025$ -14% 112 87 -22% 90 73 -19% 350,000$ 420,000$ 20%
Source: Terradatum, July 8, 2013. Data is for single-family homes and farms/ranches in selected Sonoma County cities.
Sonoma County Snapshot: Q2 2012 vs. Q2 2013Sales Volume Homes Sold Avg. Days on Market Median Price
Q2 '12 Q2 '13 % change Q2 '12 Q2 '13 % change Q2 '12 Q2 '13 % change Q2 '12 Q2 '13 % change
Under $1 million 528,231,728$ 617,054,566$ 17% 1404 1349 -4% 96 67 -31% 335,000$ 420,000$ 25%
$1 million and over 147,864,315$ 178,440,649$ 21% 80 97 21% 147 111 -24% 1,500,000$ 1,370,000$ -9%
Source: Terradatum, July 8, 2013. Data is for single-family homes and farms/ranches in selected Sonoma County cities.
Sonoma County Price Range Snapshot: Q2 2012 vs. Q2 2013Sales Volume Homes Sold Avg. Days on Market Median Price
Sonoma Countypacificunion.com | A Member of Real Living
Jill SilvasBranch Executive, Sonoma [email protected] Broadway Street | Sonoma, CA 95476
Sonoma ValleyQuarterly Real Estate ReportQ2 2013
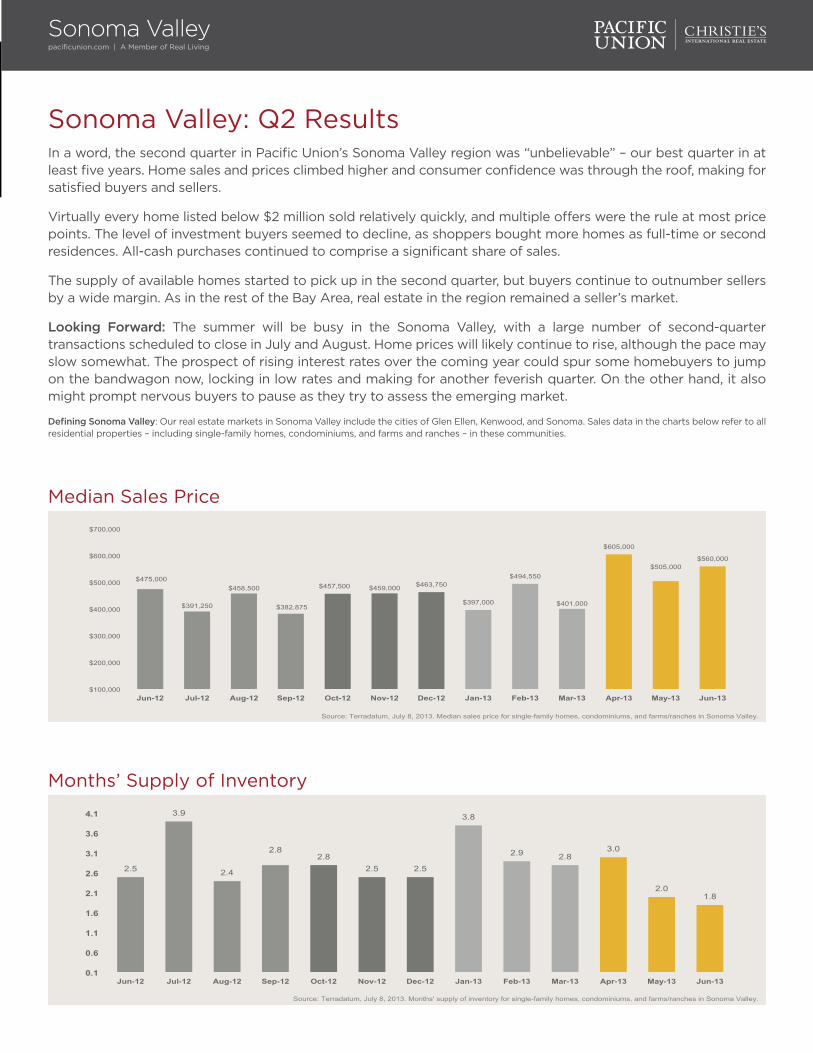
Sonoma Valley: Q2 ResultsIn a word, the second quarter in Pacific Union’s Sonoma Valley region was “unbelievable” – our best quarter in at least five years. Home sales and prices climbed higher and consumer confidence was through the roof, making for satisfied buyers and sellers.
Virtually every home listed below $2 million sold relatively quickly, and multiple offers were the rule at most price points. The level of investment buyers seemed to decline, as shoppers bought more homes as full-time or second residences. All-cash purchases continued to comprise a significant share of sales.
The supply of available homes started to pick up in the second quarter, but buyers continue to outnumber sellers by a wide margin. As in the rest of the Bay Area, real estate in the region remained a seller’s market.
Looking Forward: The summer will be busy in the Sonoma Valley, with a large number of second-quarter transactions scheduled to close in July and August. Home prices will likely continue to rise, although the pace may slow somewhat. The prospect of rising interest rates over the coming year could spur some homebuyers to jump on the bandwagon now, locking in low rates and making for another feverish quarter. On the other hand, it also might prompt nervous buyers to pause as they try to assess the emerging market.
Defining Sonoma Valley: Our real estate markets in Sonoma Valley include the cities of Glen Ellen, Kenwood, and Sonoma. Sales data in the charts below refer to all residential properties – including single-family homes, condominiums, and farms and ranches – in these communities.
Sonoma Valleypacificunion.com | A Member of Real Living
Median Sales Price
Months’ Supply of Inventory
$475,000
$391,250
$458,500
$382,875
$457,500 $459,000 $463,750
$397,000
$494,550
$401,000
$605,000
$505,000 $560,000
$100,000
$200,000
$300,000
$400,000
$500,000
$600,000
$700,000
Jun-12 Jul-12 Aug-12 Sep-12 Oct-12 Nov-12 Dec-12 Jan-13 Feb-13 Mar-13 Apr-13 May-13 Jun-13
Source: Terradatum, July 8, 2013. Median sales price for single-family homes, condominiums, and farms/ranches in Sonoma Valley.
2.5
3.9
2.4
2.8 2.8
2.5 2.5
3.8
2.9 2.8 3.0
2.0 1.8
0.1
0.6
1.1
1.6
2.1
2.6
3.1
3.6
4.1
Jun-12 Jul-12 Aug-12 Sep-12 Oct-12 Nov-12 Dec-12 Jan-13 Feb-13 Mar-13 Apr-13 May-13 Jun-13
Source: Terradatum, July 8, 2013. Months' supply of inventory for single-family homes, condominiums, and farms/ranches in Sonoma Valley.
Sonoma Valleypacificunion.com | A Member of Real Living
Average Days on the Market
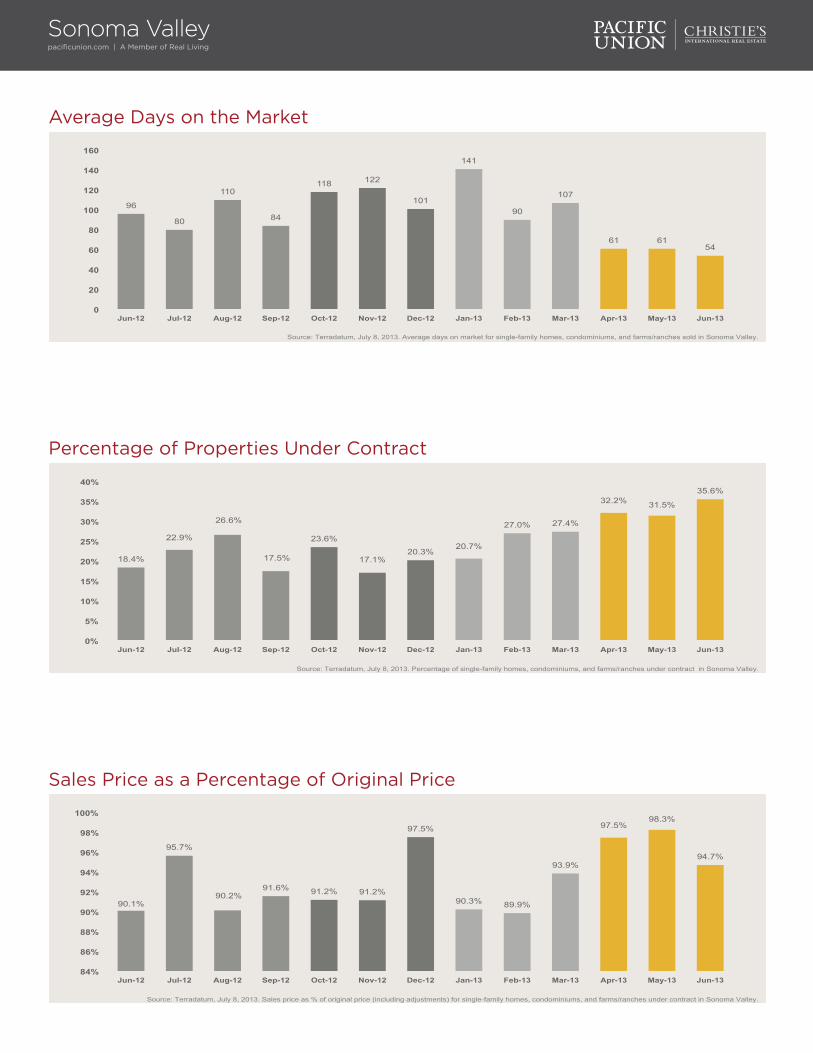
96
80
110
84
118 122
101
141
90
107
61 61 54
0
20
40
60
80
100
120
140
160
Jun-12 Jul-12 Aug-12 Sep-12 Oct-12 Nov-12 Dec-12 Jan-13 Feb-13 Mar-13 Apr-13 May-13 Jun-13
Source: Terradatum, July 8, 2013. Average days on market for single-family homes, condominiums, and farms/ranches sold in Sonoma Valley.
Sales Price as a Percentage of Original Price
90.1%
95.7%
90.2% 91.6% 91.2% 91.2%
97.5%
90.3% 89.9%
93.9%
97.5% 98.3%
94.7%
84%
86%
88%
90%
92%
94%
96%
98%
100%
Jun-12 Jul-12 Aug-12 Sep-12 Oct-12 Nov-12 Dec-12 Jan-13 Feb-13 Mar-13 Apr-13 May-13 Jun-13
Source: Terradatum, July 8, 2013. Sales price as % of original price (including adjustments) for single-family homes, condominiums, and farms/ranches under contract in Sonoma Valley.
Percentage of Properties Under Contract
18.4%
22.9%
26.6%
17.5%
23.6%
17.1% 20.3%
20.7%
27.0% 27.4%
32.2% 31.5%
35.6%
0%
5%
10%
15%
20%
25%
30%
35%
40%
Jun-12 Jul-12 Aug-12 Sep-12 Oct-12 Nov-12 Dec-12 Jan-13 Feb-13 Mar-13 Apr-13 May-13 Jun-13
Source: Terradatum, July 8, 2013. Percentage of single-family homes, condominiums, and farms/ranches under contract in Sonoma Valley.
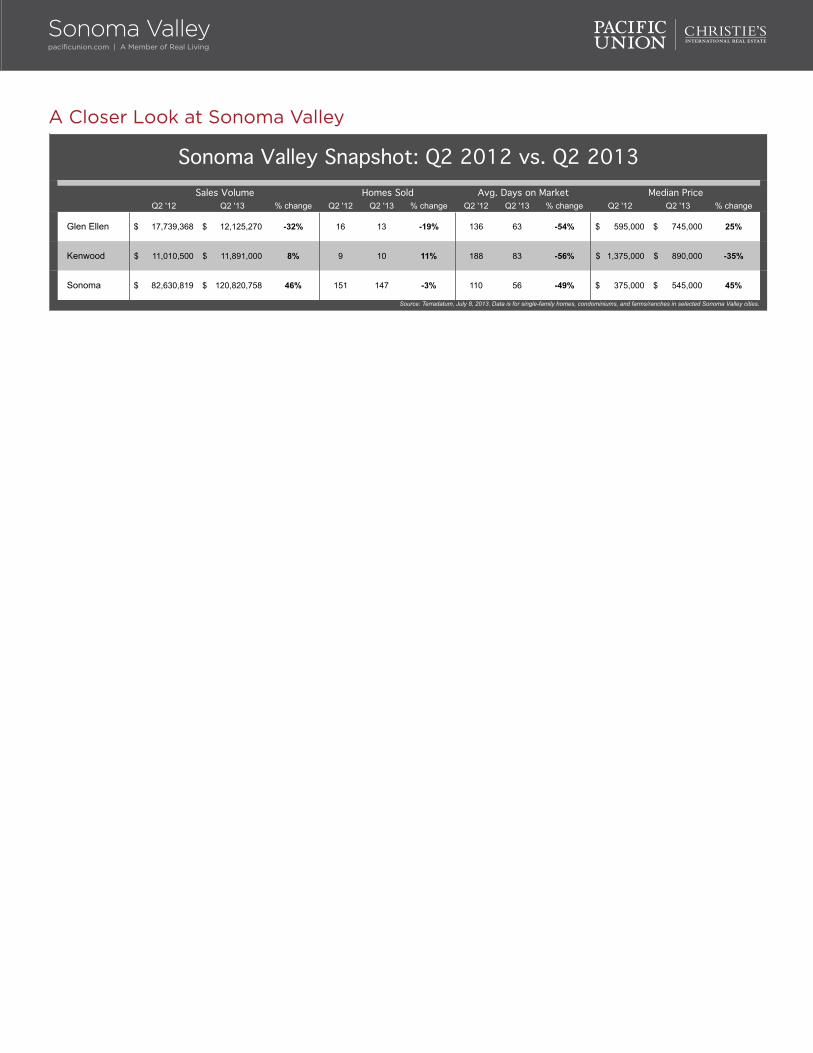
A Closer Look at Sonoma Valley
Q2 '12 Q2 '13 % change Q2 '12 Q2 '13 % change Q2 '12 Q2 '13 % change Q2 '12 Q2 '13 % change
Glen Ellen 17,739,368$ 12,125,270$ -32% 16 13 -19% 136 63 -54% 595,000$ 745,000$ 25%
Kenwood 11,010,500$ 11,891,000$ 8% 9 10 11% 188 83 -56% 1,375,000$ 890,000$ -35%
Sonoma 82,630,819$ 120,820,758$ 46% 151 147 -3% 110 56 -49% 375,000$ 545,000$ 45%
Source: Terradatum, July 8, 2013. Data is for single-family homes, condominiums, and farms/ranches in selected Sonoma Valley cities.
Sonoma Valley Snapshot: Q2 2012 vs. Q2 2013Sales Volume Homes Sold Avg. Days on Market Median Price
Sonoma Valleypacificunion.com | A Member of Real Living
Sally GardnerBranch Executive, Tahoe/TruckeeTahoe City 530.581.1882 | Truckee [email protected]
Tahoe/TruckeeQuarterly Real Estate ReportQ2 2013
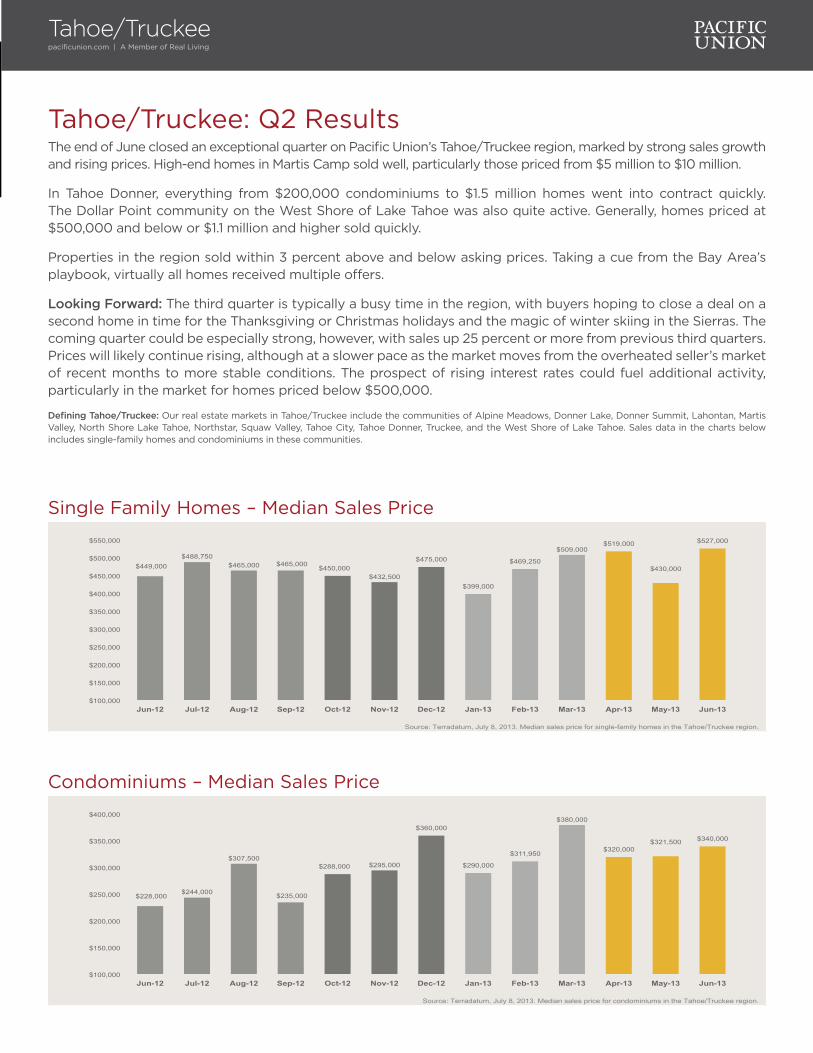
Tahoe/Truckee: Q2 ResultsThe end of June closed an exceptional quarter on Pacific Union’s Tahoe/Truckee region, marked by strong sales growth and rising prices. High-end homes in Martis Camp sold well, particularly those priced from $5 million to $10 million.
In Tahoe Donner, everything from $200,000 condominiums to $1.5 million homes went into contract quickly. The Dollar Point community on the West Shore of Lake Tahoe was also quite active. Generally, homes priced at $500,000 and below or $1.1 million and higher sold quickly.
Properties in the region sold within 3 percent above and below asking prices. Taking a cue from the Bay Area’s playbook, virtually all homes received multiple offers.
Looking Forward: The third quarter is typically a busy time in the region, with buyers hoping to close a deal on a second home in time for the Thanksgiving or Christmas holidays and the magic of winter skiing in the Sierras. The coming quarter could be especially strong, however, with sales up 25 percent or more from previous third quarters. Prices will likely continue rising, although at a slower pace as the market moves from the overheated seller’s market of recent months to more stable conditions. The prospect of rising interest rates could fuel additional activity, particularly in the market for homes priced below $500,000.
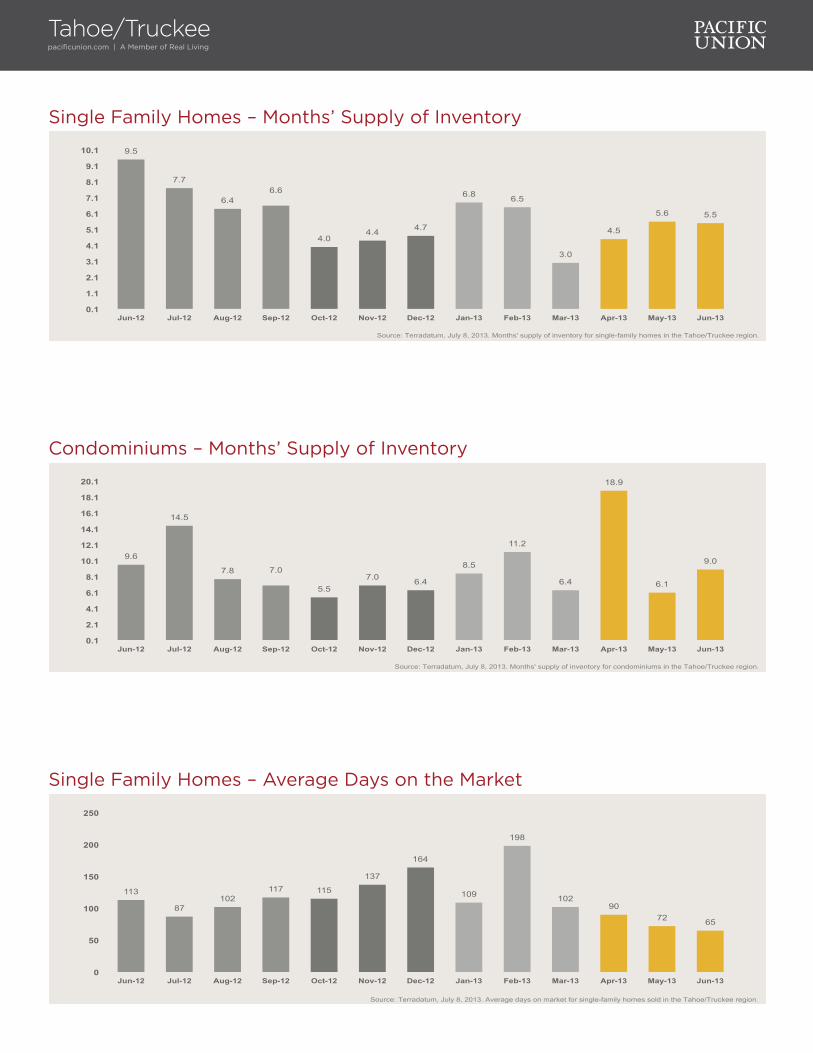
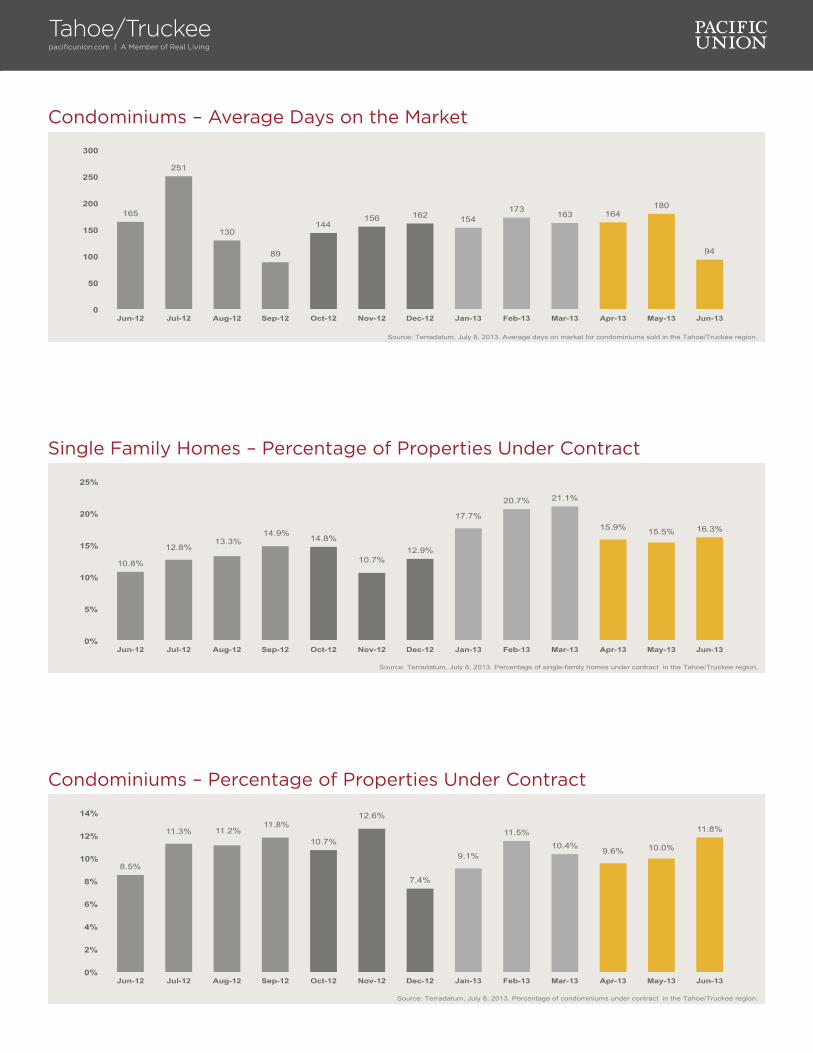
Defining Tahoe/Truckee: Our real estate markets in Tahoe/Truckee include the communities of Alpine Meadows, Donner Lake, Donner Summit, Lahontan, Martis Valley, North Shore Lake Tahoe, Northstar, Squaw Valley, Tahoe City, Tahoe Donner, Truckee, and the West Shore of Lake Tahoe. Sales data in the charts below includes single-family homes and condominiums in these communities.
Tahoe/Truckeepacificunion.com | A Member of Real Living
Single Family Homes – Median Sales Price
Condominiums – Median Sales Price
$449,000 $488,750
$465,000 $465,000 $450,000
$432,500
$475,000
$399,000
$469,250
$509,000 $519,000
$430,000
$527,000
$100,000
$150,000
$200,000
$250,000
$300,000
$350,000
$400,000
$450,000
$500,000
$550,000
Jun-12 Jul-12 Aug-12 Sep-12 Oct-12 Nov-12 Dec-12 Jan-13 Feb-13 Mar-13 Apr-13 May-13 Jun-13
Source: Terradatum, July 8, 2013. Median sales price for single-family homes in the Tahoe/Truckee region.
$228,000 $244,000
$307,500
$235,000
$288,000 $295,000
$360,000
$290,000
$311,950
$380,000
$320,000 $321,500 $340,000
$100,000
$150,000
$200,000
$250,000
$300,000
$350,000
$400,000
Jun-12 Jul-12 Aug-12 Sep-12 Oct-12 Nov-12 Dec-12 Jan-13 Feb-13 Mar-13 Apr-13 May-13 Jun-13
Source: Terradatum, July 8, 2013. Median sales price for condominiums in the Tahoe/Truckee region.
Tahoe/Truckeepacificunion.com | A Member of Real Living
Single Family Homes – Months’ Supply of Inventory
9.5
7.7
6.4 6.6
4.0 4.4 4.7
6.8 6.5
3.0
4.5
5.6 5.5
0.1
1.1
2.1
3.1
4.1
5.1
6.1
7.1
8.1
9.1
10.1
Jun-12 Jul-12 Aug-12 Sep-12 Oct-12 Nov-12 Dec-12 Jan-13 Feb-13 Mar-13 Apr-13 May-13 Jun-13
Source: Terradatum, July 8, 2013. Months' supply of inventory for single-family homes in the Tahoe/Truckee region.
Single Family Homes – Average Days on the Market
113
87 102
117 115
137
164
109
198
102 90
72 65
0
50
100
150
200
250
Jun-12 Jul-12 Aug-12 Sep-12 Oct-12 Nov-12 Dec-12 Jan-13 Feb-13 Mar-13 Apr-13 May-13 Jun-13
Source: Terradatum, July 8, 2013. Average days on market for single-family homes sold in the Tahoe/Truckee region.
Condominiums – Months’ Supply of Inventory
9.6
14.5
7.8 7.0
5.5 7.0 6.4
8.5
11.2
6.4
18.9
6.1
9.0
0.1
2.1
4.1
6.1
8.1
10.1
12.1
14.1
16.1
18.1
20.1
Jun-12 Jul-12 Aug-12 Sep-12 Oct-12 Nov-12 Dec-12 Jan-13 Feb-13 Mar-13 Apr-13 May-13 Jun-13
Source: Terradatum, July 8, 2013. Months' supply of inventory for condominiums in the Tahoe/Truckee region.
Tahoe/Truckeepacificunion.com | A Member of Real Living
Condominiums – Average Days on the Market
165
251
130
89
144 156 162 154
173 163 164
180
94
0
50
100
150
200
250
300
Jun-12 Jul-12 Aug-12 Sep-12 Oct-12 Nov-12 Dec-12 Jan-13 Feb-13 Mar-13 Apr-13 May-13 Jun-13
Source: Terradatum, July 8, 2013. Average days on market for condominiums sold in the Tahoe/Truckee region.
Condominiums – Percentage of Properties Under Contract
8.5%
11.3% 11.2% 11.8%
10.7%
12.6%
7.4%
9.1%
11.5%
10.4% 9.6% 10.0%
11.8%
0%
2%
4%
6%
8%
10%
12%
14%
Jun-12 Jul-12 Aug-12 Sep-12 Oct-12 Nov-12 Dec-12 Jan-13 Feb-13 Mar-13 Apr-13 May-13 Jun-13
Source: Terradatum, July 8, 2013. Percentage of condominiums under contract in the Tahoe/Truckee region.
Single Family Homes – Percentage of Properties Under Contract
10.8%
12.8% 13.3%
14.9% 14.8%
10.7% 12.9%
17.7%
20.7% 21.1%
15.9% 15.5% 16.3%
0%
5%
10%
15%
20%
25%
Jun-12 Jul-12 Aug-12 Sep-12 Oct-12 Nov-12 Dec-12 Jan-13 Feb-13 Mar-13 Apr-13 May-13 Jun-13
Source: Terradatum, July 8, 2013. Percentage of single-family homes under contract in the Tahoe/Truckee region.
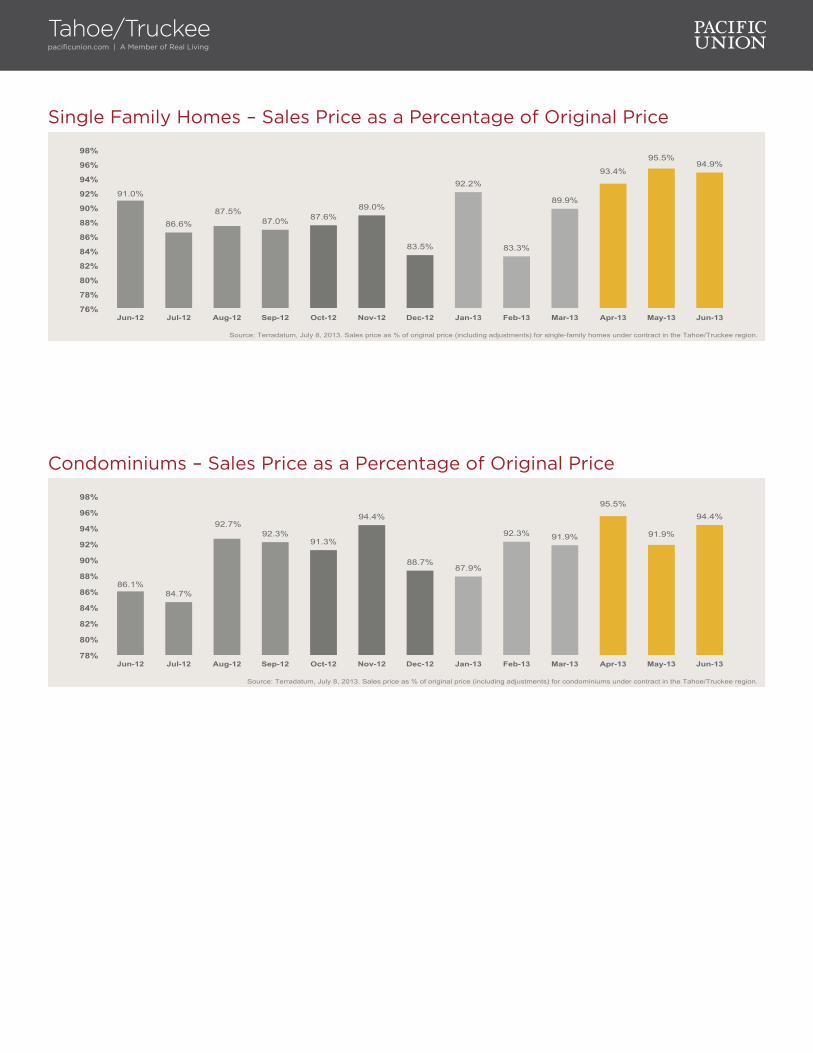
Single Family Homes – Sales Price as a Percentage of Original Price
91.0%
86.6% 87.5%
87.0% 87.6% 89.0%
83.5%
92.2%
83.3%
89.9%
93.4%
95.5% 94.9%
76%
78%
80%
82%
84%
86%
88%
90%
92%
94%
96%
98%
Jun-12 Jul-12 Aug-12 Sep-12 Oct-12 Nov-12 Dec-12 Jan-13 Feb-13 Mar-13 Apr-13 May-13 Jun-13
Source: Terradatum, July 8, 2013. Sales price as % of original price (including adjustments) for single-family homes under contract in the Tahoe/Truckee region.
Condominiums – Sales Price as a Percentage of Original Price
86.1% 84.7%
92.7% 92.3%
91.3%
94.4%
88.7% 87.9%
92.3% 91.9%
95.5%
91.9%
94.4%
78%
80%
82%
84%
86%
88%
90%
92%
94%
96%
98%
Jun-12 Jul-12 Aug-12 Sep-12 Oct-12 Nov-12 Dec-12 Jan-13 Feb-13 Mar-13 Apr-13 May-13 Jun-13
Source: Terradatum, July 8, 2013. Sales price as % of original price (including adjustments) for condominiums under contract in the Tahoe/Truckee region.
Tahoe/Truckeepacificunion.com | A Member of Real Living
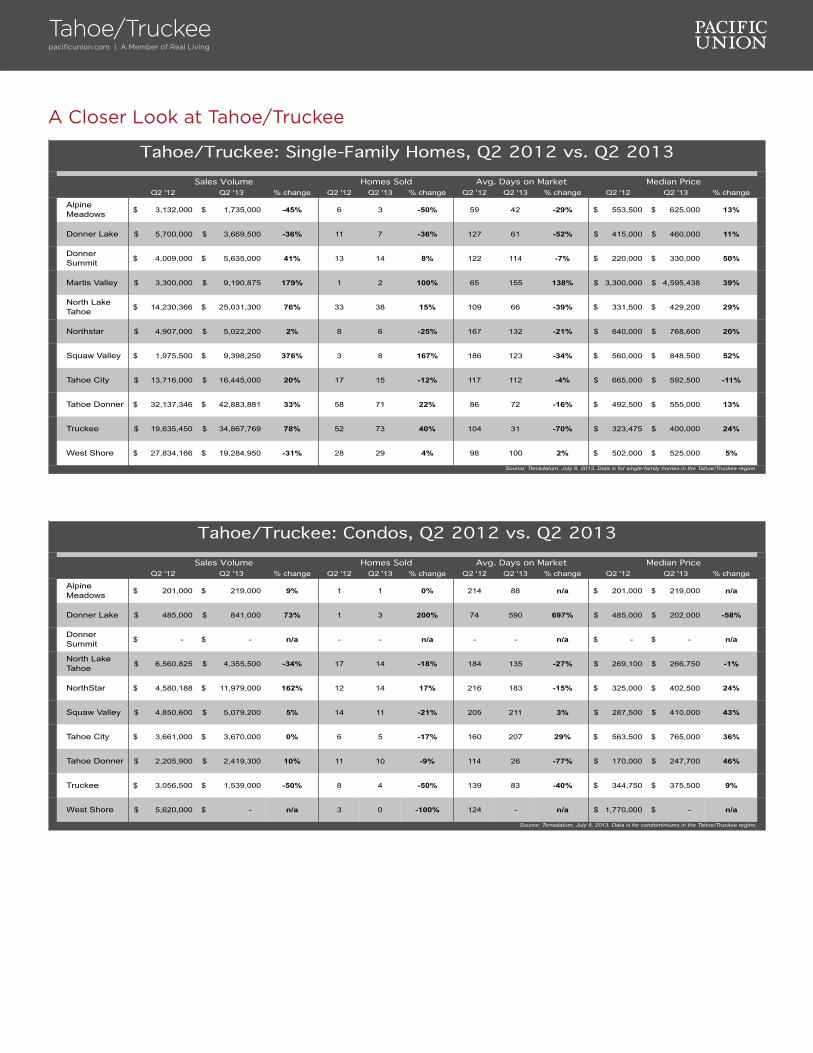
A Closer Look at Tahoe/Truckee
Q2 '12 Q2 '13 % change Q2 '12 Q2 '13 % change Q2 '12 Q2 '13 % change Q2 '12 Q2 '13 % change
Alpine Meadows 3,132,000$ 1,735,000$ -45% 6 3 -50% 59 42 -29% 553,500$ 625,000$ 13%
Donner Lake 5,700,000$ 3,669,500$ -36% 11 7 -36% 127 61 -52% 415,000$ 460,000$ 11%
Donner Summit 4,009,000$ 5,635,000$ 41% 13 14 8% 122 114 -7% 220,000$ 330,000$ 50%
Martis Valley 3,300,000$ 9,190,875$ 179% 1 2 100% 65 155 138% 3,300,000$ 4,595,438$ 39%
North Lake Tahoe 14,230,366$ 25,031,300$ 76% 33 38 15% 109 66 -39% 331,500$ 429,200$ 29%
Northstar 4,907,000$ 5,022,200$ 2% 8 6 -25% 167 132 -21% 640,000$ 768,600$ 20%
Squaw Valley 1,975,500$ 9,398,250$ 376% 3 8 167% 186 123 -34% 560,000$ 848,500$ 52%
Tahoe City 13,716,000$ 16,445,000$ 20% 17 15 -12% 117 112 -4% 665,000$ 592,500$ -11%
Tahoe Donner 32,137,346$ 42,883,881$ 33% 58 71 22% 86 72 -16% 492,500$ 555,000$ 13%
Truckee 19,635,450$ 34,867,769$ 78% 52 73 40% 104 31 -70% 323,475$ 400,000$ 24%
West Shore 27,834,166$ 19,284,950$ -31% 28 29 4% 98 100 2% 502,000$ 525,000$ 5%
Source: Terradatum, July 8, 2013. Data is for single-family homes in the Tahoe/Truckee region.
Tahoe/Truckee: Single-Family Homes, Q2 2012 vs. Q2 2013Sales Volume Homes Sold Avg. Days on Market Median Price
Q2 '12 Q2 '13 % change Q2 '12 Q2 '13 % change Q2 '12 Q2 '13 % change Q2 '12 Q2 '13 % change
Alpine Meadows 201,000$ 219,000$ 9% 1 1 0% 214 88 n/a 201,000$ 219,000$ n/a
Donner Lake 485,000$ 841,000$ 73% 1 3 200% 74 590 697% 485,000$ 202,000$ -58%
Donner Summit -$ -$ n/a - - n/a - - n/a -$ -$ n/a
North Lake Tahoe 6,560,825$ 4,355,500$ -34% 17 14 -18% 184 135 -27% 269,100$ 266,750$ -1%
NorthStar 4,580,188$ 11,979,000$ 162% 12 14 17% 216 183 -15% 325,000$ 402,500$ 24%
Squaw Valley 4,850,600$ 5,079,200$ 5% 14 11 -21% 205 211 3% 287,500$ 410,000$ 43%
Tahoe City 3,661,000$ 3,670,000$ 0% 6 5 -17% 160 207 29% 563,500$ 765,000$ 36%
Tahoe Donner 2,205,900$ 2,419,300$ 10% 11 10 -9% 114 26 -77% 170,000$ 247,700$ 46%
Truckee 3,056,500$ 1,539,000$ -50% 8 4 -50% 139 83 -40% 344,750$ 375,500$ 9%
West Shore 5,620,000$ -$ n/a 3 0 -100% 124 - n/a 1,770,000$ -$ n/a
Tahoe/Truckee: Condos, Q2 2012 vs. Q2 2013
Source: Terradatum, July 8, 2013. Data is for condominiums in the Tahoe/Truckee region.
Sales Volume Homes Sold Avg. Days on Market Median Price
Tahoe/Truckeepacificunion.com | A Member of Real Living

www.pacificunion.com
Follow Pacific Union