Embed Size (px)
DESCRIPTION
Pacific Union Real Estate Q1 2015 Quarterly Report
Citation preview
Quarterly Real Estate ReportQ1 2015

Pacific Union Offers Bay Area Buyers and Sellers an Enhanced Mobile Experience 4
Wages and Jobs to Grow in 2015, IPO Activity Starts Slow 6
Contra Costa County 8
East Bay 12
Marin County 16
Napa County 20
San Francisco 24
Silicon Valley 32
Sonoma County 38
Sonoma Valley 42
Lake Tahoe/Truckee 46
Table of Contents
Mark A. McLaughlin, CEO, Pacific Union
Please remember to seek out local news, trend analysis, and expert advice for your real estate decisions.
Pacific Union Offers Bay Area Buyers and Sellers an Enhanced Mobile Experience
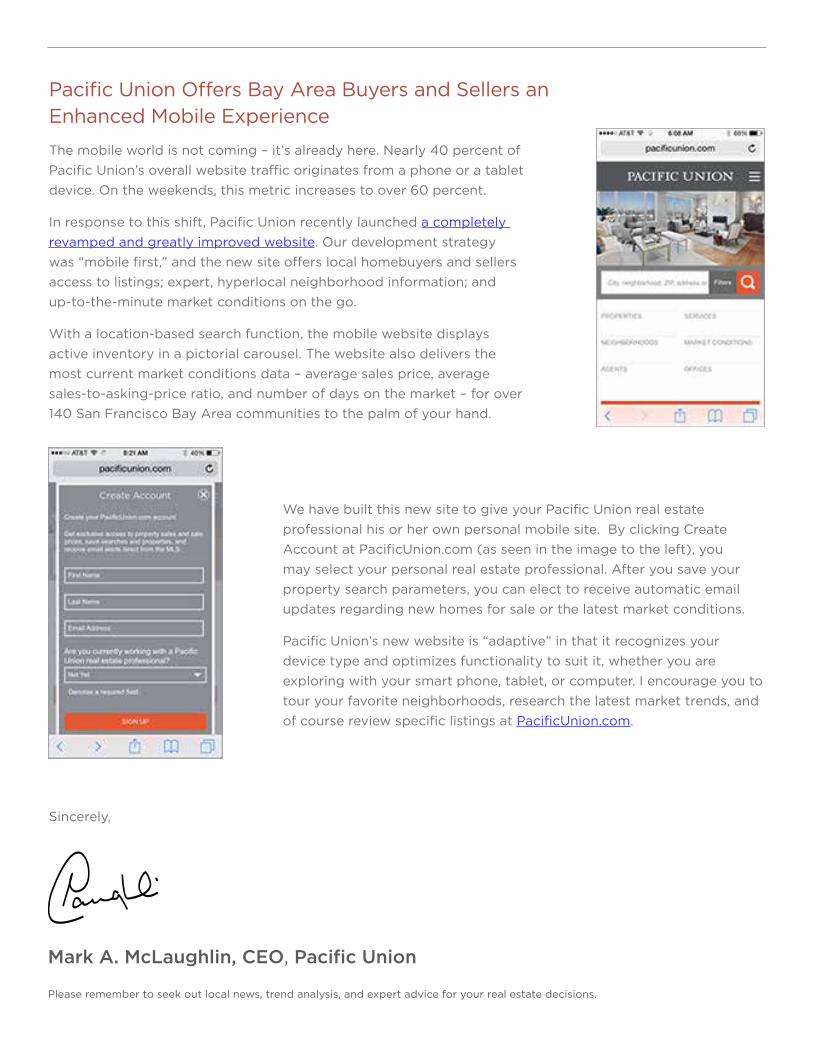
The mobile world is not coming – it’s already here. Nearly 40 percent of Pacific Union’s overall website traffic originates from a phone or a tablet device. On the weekends, this metric increases to over 60 percent.
In response to this shift, Pacific Union recently launched a completely revamped and greatly improved website. Our development strategy was “mobile first,” and the new site offers local homebuyers and sellers access to listings; expert, hyperlocal neighborhood information; and up-to-the-minute market conditions on the go.
With a location-based search function, the mobile website displays active inventory in a pictorial carousel. The website also delivers the most current market conditions data – average sales price, average sales-to-asking-price ratio, and number of days on the market – for over 140 San Francisco Bay Area communities to the palm of your hand.
We have built this new site to give your Pacific Union real estate professional his or her own personal mobile site. By clicking Create Account at PacificUnion.com (as seen in the image to the left), you may select your personal real estate professional. After you save your property search parameters, you can elect to receive automatic email updates regarding new homes for sale or the latest market conditions.
Pacific Union’s new website is “adaptive” in that it recognizes your device type and optimizes functionality to suit it, whether you are exploring with your smart phone, tablet, or computer. I encourage you to tour your favorite neighborhoods, research the latest market trends, and of course review specific listings at PacificUnion.com.
Sincerely,
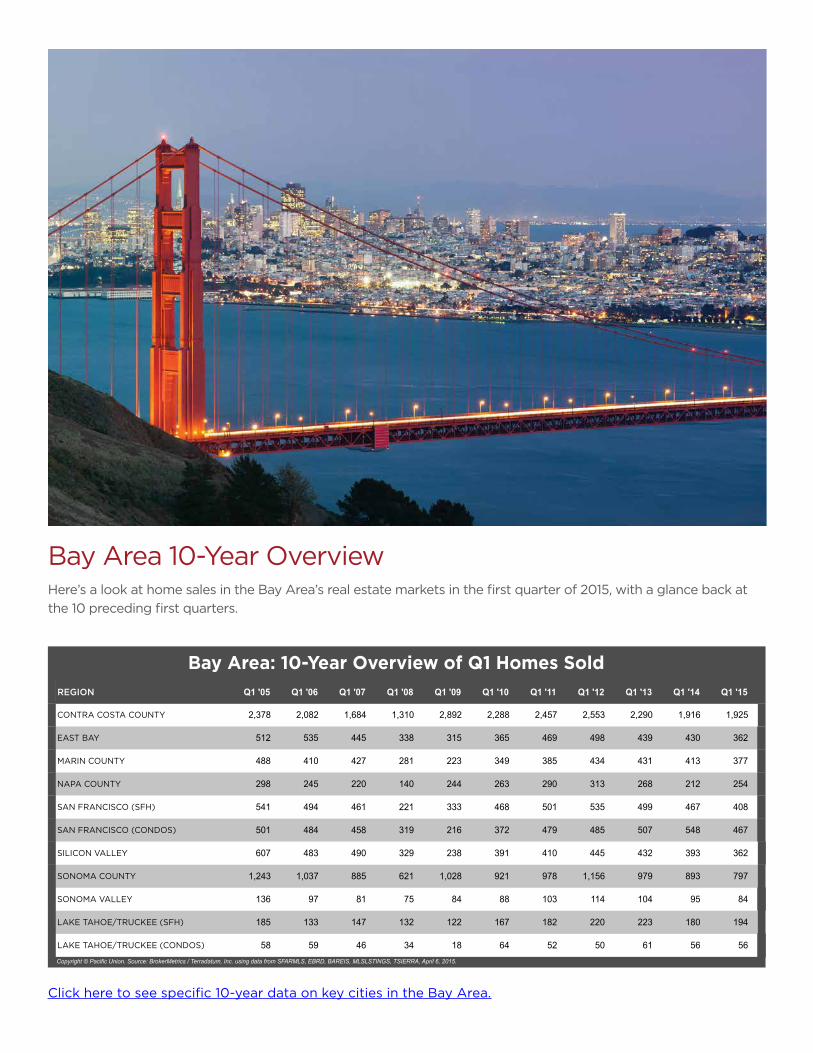
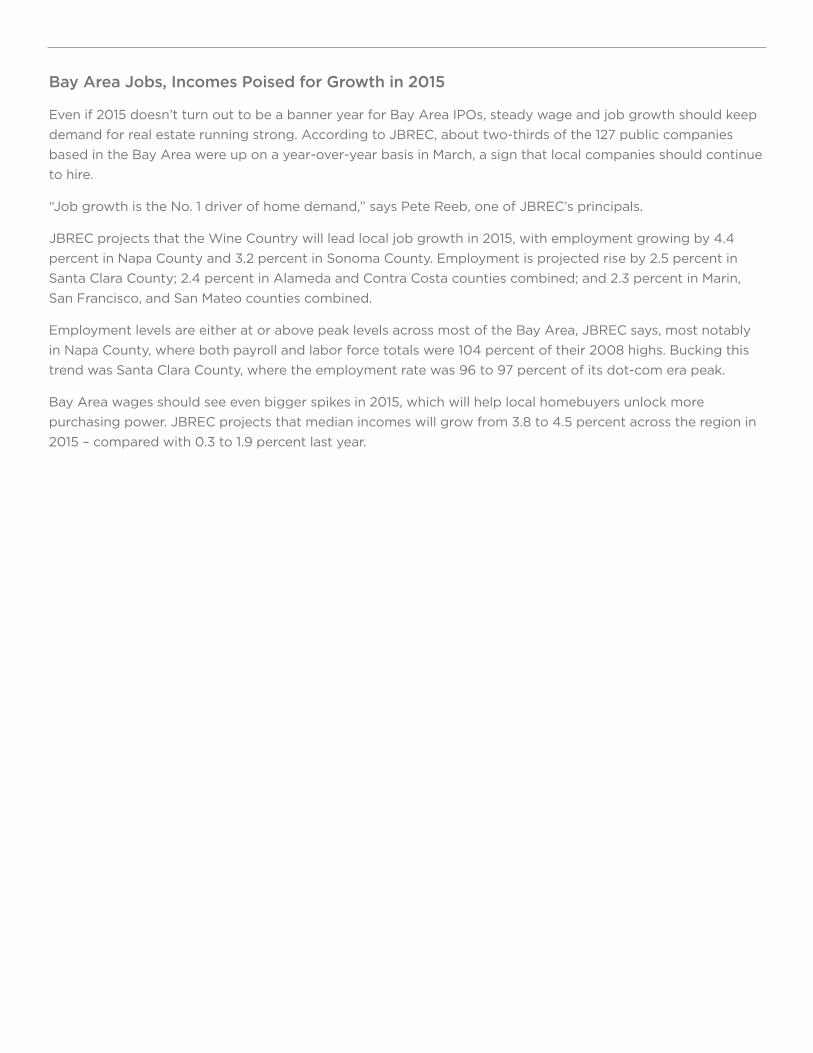
Bay Area 10-Year OverviewHere’s a look at home sales in the Bay Area’s real estate markets in the first quarter of 2015, with a glance back at the 10 preceding first quarters.
Click here to see specific 10-year data on key cities in the Bay Area.
REGION Q1 '05 Q1 '06 Q1 '07 Q1 '08 Q1 '09 Q1 '10 Q1 '11 Q1 '12 Q1 '13 Q1 '14 Q1 '15
CONTRA COSTA COUNTY 2,378 2,082 1,684 1,310 2,892 2,288 2,457 2,553 2,290 1,916 1,925
EAST BAY 512 535 445 338 315 365 469 498 439 430 362
MARIN COUNTY 488 410 427 281 223 349 385 434 431 413 377
NAPA COUNTY 298 245 220 140 244 263 290 313 268 212 254
SAN FRANCISCO (SFH) 541 494 461 221 333 468 501 535 499 467 408
SAN FRANCISCO (CONDOS) 501 484 458 319 216 372 479 485 507 548 467
SILICON VALLEY 607 483 490 329 238 391 410 445 432 393 362
SONOMA COUNTY 1,243 1,037 885 621 1,028 921 978 1,156 979 893 797
SONOMA VALLEY 136 97 81 75 84 88 103 114 104 95 84
LAKE TAHOE/TRUCKEE (SFH) 185 133 147 132 122 167 182 220 223 180 194
LAKE TAHOE/TRUCKEE (CONDOS) 58 59 46 34 18 64 52 50 61 56 56Copyright © Pacific Union. Source: BrokerMetrics / Terradatum, Inc. using data from SFARMLS, EBRD, BAREIS, MLSLSTINGS, TSIERRA, April 6, 2015.
Bay Area: 10-Year Overview of Q1 Homes Sold
Wages and Jobs to Grow in 2015, IPO Activity Starts Slow
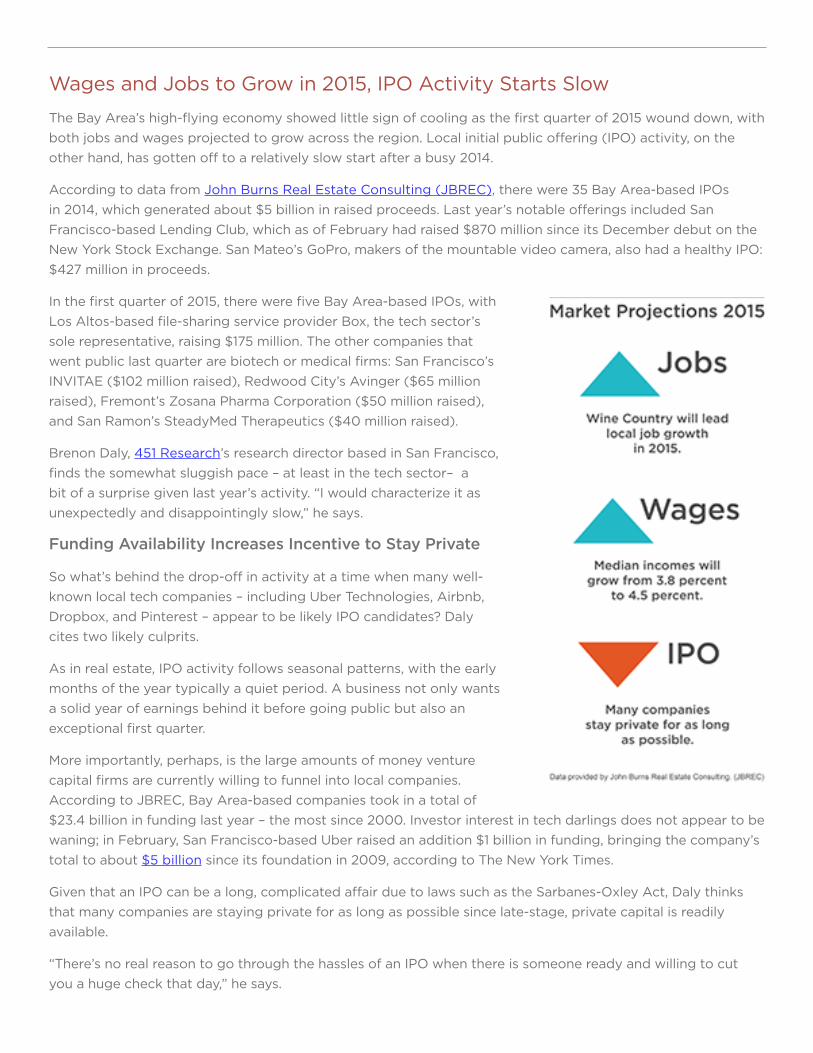
The Bay Area’s high-flying economy showed little sign of cooling as the first quarter of 2015 wound down, with both jobs and wages projected to grow across the region. Local initial public offering (IPO) activity, on the other hand, has gotten off to a relatively slow start after a busy 2014.
According to data from John Burns Real Estate Consulting (JBREC), there were 35 Bay Area-based IPOs in 2014, which generated about $5 billion in raised proceeds. Last year’s notable offerings included San Francisco-based Lending Club, which as of February had raised $870 million since its December debut on the New York Stock Exchange. San Mateo’s GoPro, makers of the mountable video camera, also had a healthy IPO: $427 million in proceeds.
In the first quarter of 2015, there were five Bay Area-based IPOs, with Los Altos-based file-sharing service provider Box, the tech sector’s sole representative, raising $175 million. The other companies that went public last quarter are biotech or medical firms: San Francisco’s INVITAE ($102 million raised), Redwood City’s Avinger ($65 million raised), Fremont’s Zosana Pharma Corporation ($50 million raised), and San Ramon’s SteadyMed Therapeutics ($40 million raised).
Brenon Daly, 451 Research’s research director based in San Francisco, finds the somewhat sluggish pace – at least in the tech sector– a bit of a surprise given last year’s activity. “I would characterize it as unexpectedly and disappointingly slow,” he says.
Funding Availability Increases Incentive to Stay Private
So what’s behind the drop-off in activity at a time when many well-known local tech companies – including Uber Technologies, Airbnb, Dropbox, and Pinterest – appear to be likely IPO candidates? Daly cites two likely culprits.
As in real estate, IPO activity follows seasonal patterns, with the early months of the year typically a quiet period. A business not only wants a solid year of earnings behind it before going public but also an exceptional first quarter.
More importantly, perhaps, is the large amounts of money venture capital firms are currently willing to funnel into local companies. According to JBREC, Bay Area-based companies took in a total of $23.4 billion in funding last year – the most since 2000. Investor interest in tech darlings does not appear to be waning; in February, San Francisco-based Uber raised an addition $1 billion in funding, bringing the company’s total to about $5 billion since its foundation in 2009, according to The New York Times.
Given that an IPO can be a long, complicated affair due to laws such as the Sarbanes-Oxley Act, Daly thinks that many companies are staying private for as long as possible since late-stage, private capital is readily available.
“There’s no real reason to go through the hassles of an IPO when there is someone ready and willing to cut you a huge check that day,” he says.
Bay Area Jobs, Incomes Poised for Growth in 2015
Even if 2015 doesn’t turn out to be a banner year for Bay Area IPOs, steady wage and job growth should keep demand for real estate running strong. According to JBREC, about two-thirds of the 127 public companies based in the Bay Area were up on a year-over-year basis in March, a sign that local companies should continue to hire.
“Job growth is the No. 1 driver of home demand,” says Pete Reeb, one of JBREC’s principals.
JBREC projects that the Wine Country will lead local job growth in 2015, with employment growing by 4.4 percent in Napa County and 3.2 percent in Sonoma County. Employment is projected rise by 2.5 percent in Santa Clara County; 2.4 percent in Alameda and Contra Costa counties combined; and 2.3 percent in Marin, San Francisco, and San Mateo counties combined.
Employment levels are either at or above peak levels across most of the Bay Area, JBREC says, most notably in Napa County, where both payroll and labor force totals were 104 percent of their 2008 highs. Bucking this trend was Santa Clara County, where the employment rate was 96 to 97 percent of its dot-com era peak.
Bay Area wages should see even bigger spikes in 2015, which will help local homebuyers unlock more purchasing power. JBREC projects that median incomes will grow from 3.8 to 4.5 percent across the region in 2015 – compared with 0.3 to 1.9 percent last year.
Ellen AndersonSenior Vice President, Contra Costa [email protected] Sycamore Valley Road West | Danville, CA 94526
Contra Costa CountyQuarterly Real Estate ReportQ1 2015
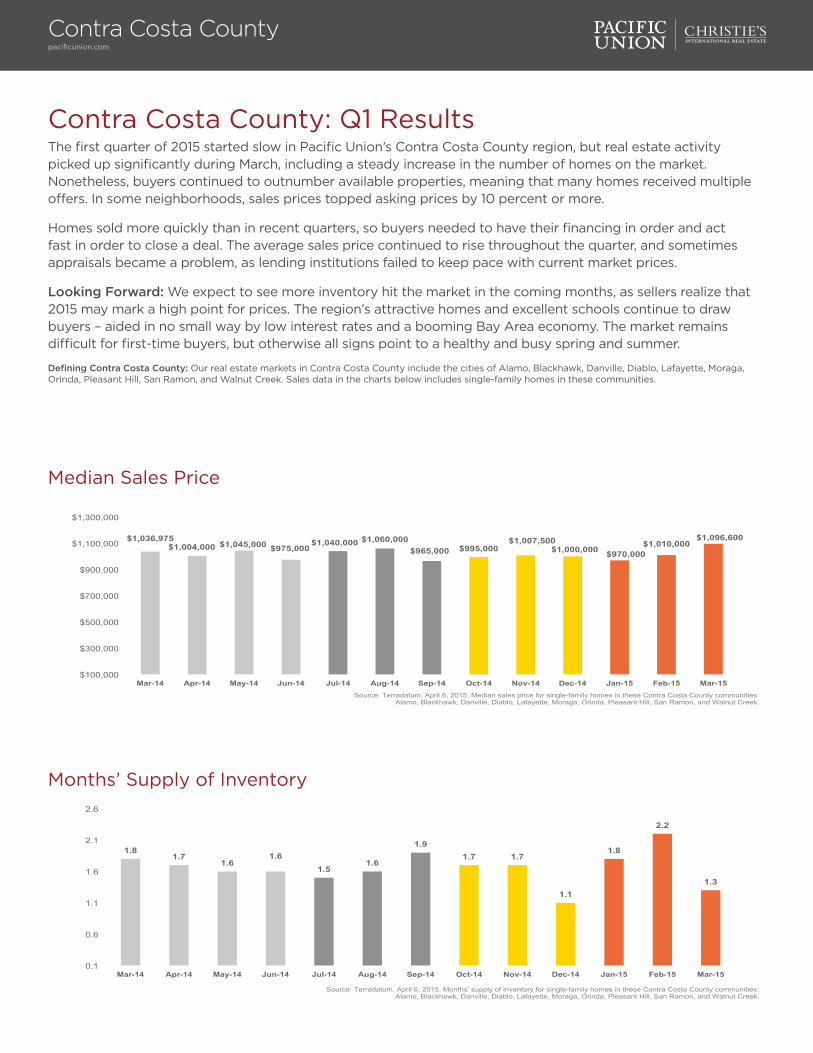
Contra Costa County: Q1 ResultsThe first quarter of 2015 started slow in Pacific Union’s Contra Costa County region, but real estate activity picked up significantly during March, including a steady increase in the number of homes on the market. Nonetheless, buyers continued to outnumber available properties, meaning that many homes received multiple offers. In some neighborhoods, sales prices topped asking prices by 10 percent or more.
Homes sold more quickly than in recent quarters, so buyers needed to have their financing in order and act fast in order to close a deal. The average sales price continued to rise throughout the quarter, and sometimes appraisals became a problem, as lending institutions failed to keep pace with current market prices.
Looking Forward: We expect to see more inventory hit the market in the coming months, as sellers realize that 2015 may mark a high point for prices. The region’s attractive homes and excellent schools continue to draw buyers – aided in no small way by low interest rates and a booming Bay Area economy. The market remains difficult for first-time buyers, but otherwise all signs point to a healthy and busy spring and summer.
Defining Contra Costa County: Our real estate markets in Contra Costa County include the cities of Alamo, Blackhawk, Danville, Diablo, Lafayette, Moraga, Orinda, Pleasant Hill, San Ramon, and Walnut Creek. Sales data in the charts below includes single-family homes in these communities.
Contra Costa Countypacificunion.com
Median Sales Price
Months’ Supply of Inventory
$1,036,975 $1,004,000 $1,045,000 $975,000
$1,040,000 $1,060,000 $965,000 $995,000
$1,007,500 $1,000,000 $970,000
$1,010,000 $1,096,600
$100,000
$300,000
$500,000
$700,000
$900,000
$1,100,000
$1,300,000
Mar-14 Apr-14 May-14 Jun-14 Jul-14 Aug-14 Sep-14 Oct-14 Nov-14 Dec-14 Jan-15 Feb-15 Mar-15 Source: Terradatum, April 6, 2015. Median sales price for single-family homes in these Contra Costa County communities:
Alamo, Blackhawk, Danville, Diablo, Lafayette, Moraga, Orinda, Pleasant Hill, San Ramon, and Walnut Creek.
1.8 1.7
1.6 1.6
1.5 1.6
1.9 1.7 1.7
1.1
1.8
2.2
1.3
0.1
0.6
1.1
1.6
2.1
2.6
Mar-14 Apr-14 May-14 Jun-14 Jul-14 Aug-14 Sep-14 Oct-14 Nov-14 Dec-14 Jan-15 Feb-15 Mar-15
Source: Terradatum, April 6, 2015. Months' supply of inventory for single-family homes in these Contra Costa County communities: Alamo, Blackhawk, Danville, Diablo, Lafayette, Moraga, Orinda, Pleasant Hill, San Ramon, and Walnut Creek.
Contra Costa Countypacificunion.com
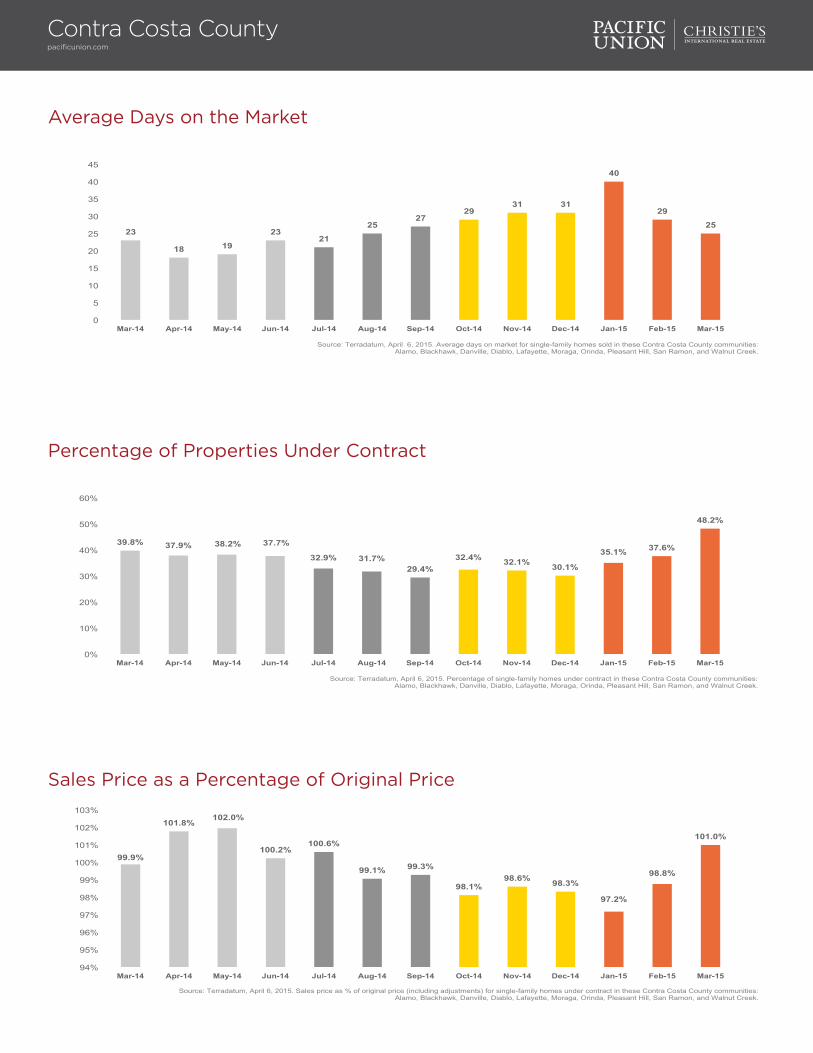
Average Days on the Market
23
18 19
23 21
25 27
29 31 31
40
29
25
0
5
10
15
20
25
30
35
40
45
Mar-14 Apr-14 May-14 Jun-14 Jul-14 Aug-14 Sep-14 Oct-14 Nov-14 Dec-14 Jan-15 Feb-15 Mar-15
Source: Terradatum, April 6, 2015. Average days on market for single-family homes sold in these Contra Costa County communities: Alamo, Blackhawk, Danville, Diablo, Lafayette, Moraga, Orinda, Pleasant Hill, San Ramon, and Walnut Creek.
Sales Price as a Percentage of Original Price
99.9%
101.8% 102.0%
100.2% 100.6%
99.1% 99.3%
98.1% 98.6% 98.3%
97.2%
98.8%
101.0%
94%
95%
96%
97%
98%
99%
100%
101%
102%
103%
Mar-14 Apr-14 May-14 Jun-14 Jul-14 Aug-14 Sep-14 Oct-14 Nov-14 Dec-14 Jan-15 Feb-15 Mar-15
Source: Terradatum, April 6, 2015. Sales price as % of original price (including adjustments) for single-family homes under contract in these Contra Costa County communities: Alamo, Blackhawk, Danville, Diablo, Lafayette, Moraga, Orinda, Pleasant Hill, San Ramon, and Walnut Creek.
Percentage of Properties Under Contract
39.8% 37.9% 38.2% 37.7%
32.9% 31.7% 29.4%
32.4% 32.1% 30.1%
35.1% 37.6%
48.2%
0%
10%
20%
30%
40%
50%
60%
Mar-14 Apr-14 May-14 Jun-14 Jul-14 Aug-14 Sep-14 Oct-14 Nov-14 Dec-14 Jan-15 Feb-15 Mar-15
Source: Terradatum, April 6, 2015. Percentage of single-family homes under contract in these Contra Costa County communities: Alamo, Blackhawk, Danville, Diablo, Lafayette, Moraga, Orinda, Pleasant Hill, San Ramon, and Walnut Creek.
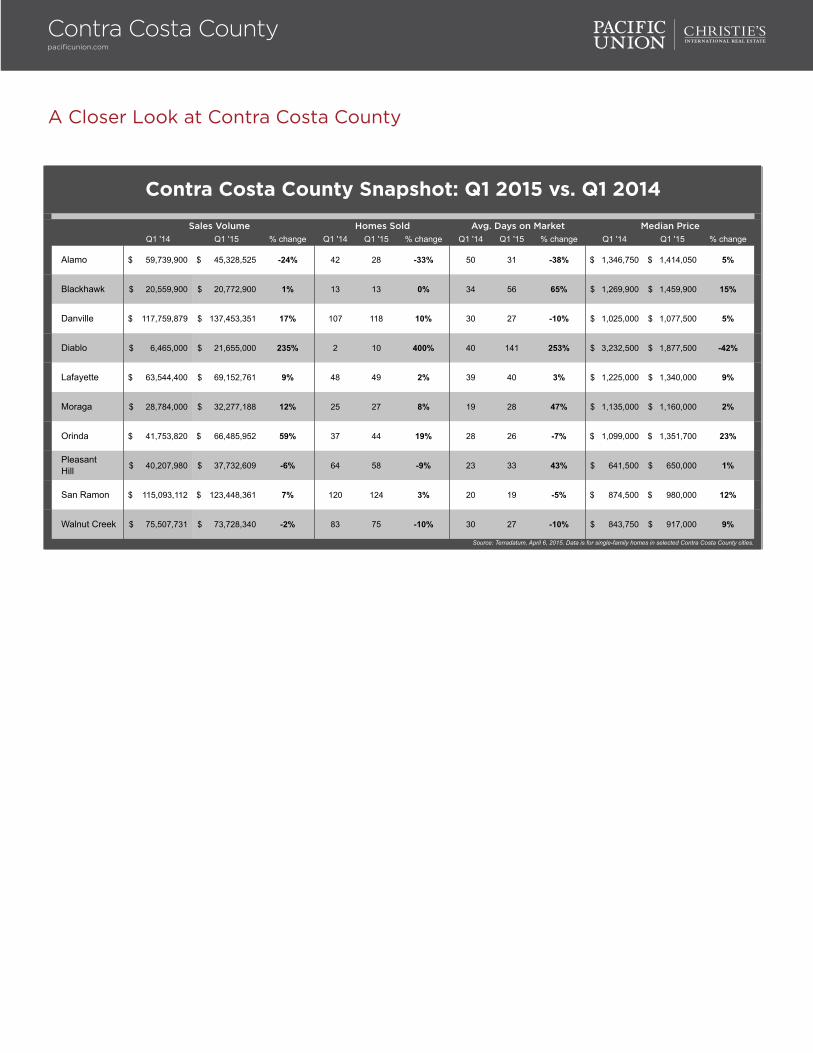
A Closer Look at Contra Costa County
Q1 '14 Q1 '15 % change Q1 '14 Q1 '15 % change Q1 '14 Q1 '15 % change Q1 '14 Q1 '15 % change
Alamo 59,739,900$ 45,328,525$ -24% 42 28 -33% 50 31 -38% 1,346,750$ 1,414,050$ 5%
Blackhawk 20,559,900$ 20,772,900$ 1% 13 13 0% 34 56 65% 1,269,900$ 1,459,900$ 15%
Danville 117,759,879$ 137,453,351$ 17% 107 118 10% 30 27 -10% 1,025,000$ 1,077,500$ 5%
Diablo 6,465,000$ 21,655,000$ 235% 2 10 400% 40 141 253% 3,232,500$ 1,877,500$ -42%
Lafayette 63,544,400$ 69,152,761$ 9% 48 49 2% 39 40 3% 1,225,000$ 1,340,000$ 9%
Moraga 28,784,000$ 32,277,188$ 12% 25 27 8% 19 28 47% 1,135,000$ 1,160,000$ 2%
Orinda 41,753,820$ 66,485,952$ 59% 37 44 19% 28 26 -7% 1,099,000$ 1,351,700$ 23%
PleasantHill 40,207,980$ 37,732,609$ -6% 64 58 -9% 23 33 43% 641,500$ 650,000$ 1%
San Ramon 115,093,112$ 123,448,361$ 7% 120 124 3% 20 19 -5% 874,500$ 980,000$ 12%
Walnut Creek 75,507,731$ 73,728,340$ -2% 83 75 -10% 30 27 -10% 843,750$ 917,000$ 9%
Source: Terradatum, April 6, 2015. Data is for single-family homes in selected Contra Costa County cities.
Contra Costa County Snapshot: Q1 2015 vs. Q1 2014
Sales Volume Homes Sold Avg. Days on Market Median Price
Contra Costa Countypacificunion.com
Pam HoffmanSenior Vice President, Managing Broker, East Bay [email protected] Mountain Boulevard | Oakland, CA 94611
East BayQuarterly Real Estate ReportQ1 2015
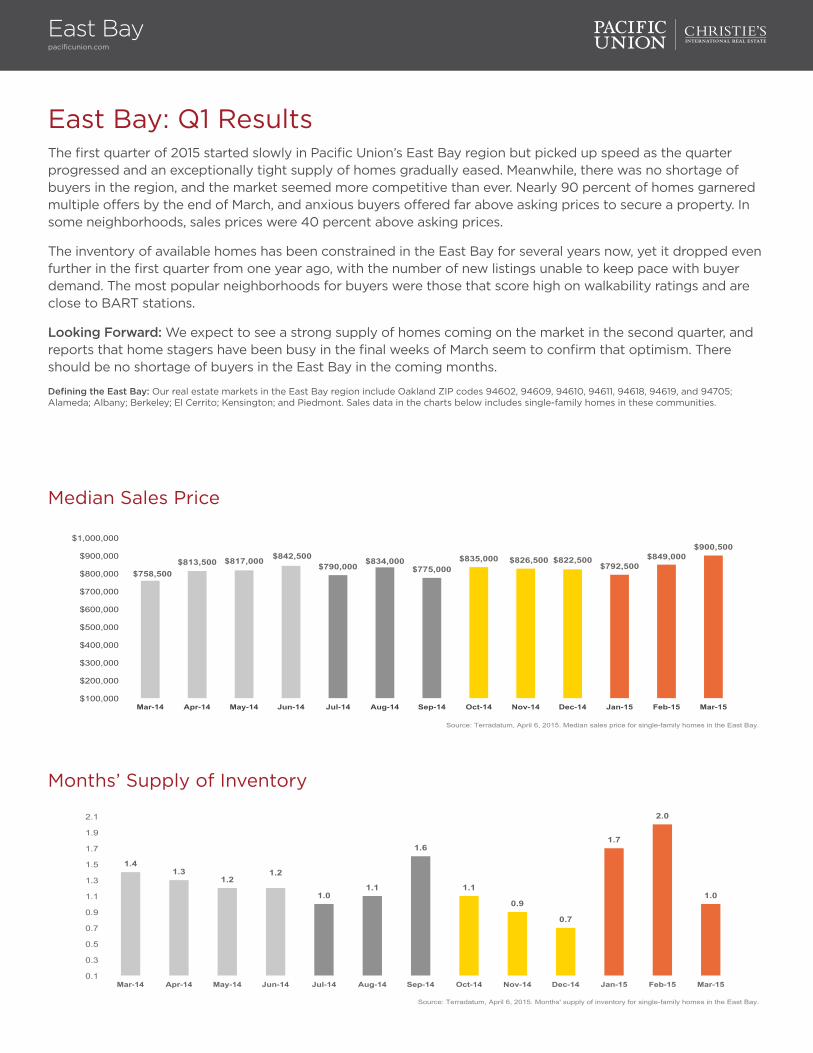
East Bay: Q1 ResultsThe first quarter of 2015 started slowly in Pacific Union’s East Bay region but picked up speed as the quarter progressed and an exceptionally tight supply of homes gradually eased. Meanwhile, there was no shortage of buyers in the region, and the market seemed more competitive than ever. Nearly 90 percent of homes garnered multiple offers by the end of March, and anxious buyers offered far above asking prices to secure a property. In some neighborhoods, sales prices were 40 percent above asking prices.
The inventory of available homes has been constrained in the East Bay for several years now, yet it dropped even further in the first quarter from one year ago, with the number of new listings unable to keep pace with buyer demand. The most popular neighborhoods for buyers were those that score high on walkability ratings and are close to BART stations.
Looking Forward: We expect to see a strong supply of homes coming on the market in the second quarter, and reports that home stagers have been busy in the final weeks of March seem to confirm that optimism. There should be no shortage of buyers in the East Bay in the coming months.
Defining the East Bay: Our real estate markets in the East Bay region include Oakland ZIP codes 94602, 94609, 94610, 94611, 94618, 94619, and 94705; Alameda; Albany; Berkeley; El Cerrito; Kensington; and Piedmont. Sales data in the charts below includes single-family homes in these communities.
East Baypacificunion.com
Median Sales Price
Months’ Supply of Inventory
$758,500 $813,500 $817,000 $842,500
$790,000 $834,000
$775,000 $835,000 $826,500 $822,500
$792,500 $849,000
$900,500
$100,000
$200,000
$300,000
$400,000
$500,000
$600,000
$700,000
$800,000
$900,000
$1,000,000
Mar-14 Apr-14 May-14 Jun-14 Jul-14 Aug-14 Sep-14 Oct-14 Nov-14 Dec-14 Jan-15 Feb-15 Mar-15
Source: Terradatum, April 6, 2015. Median sales price for single-family homes in the East Bay.
1.4 1.3
1.2 1.2
1.0 1.1
1.6
1.1
0.9
0.7
1.7
2.0
1.0
0.1
0.3
0.5
0.7
0.9
1.1
1.3
1.5
1.7
1.9
2.1
Mar-14 Apr-14 May-14 Jun-14 Jul-14 Aug-14 Sep-14 Oct-14 Nov-14 Dec-14 Jan-15 Feb-15 Mar-15
Source: Terradatum, April 6, 2015. Months' supply of inventory for single-family homes in the East Bay.
East Baypacificunion.com
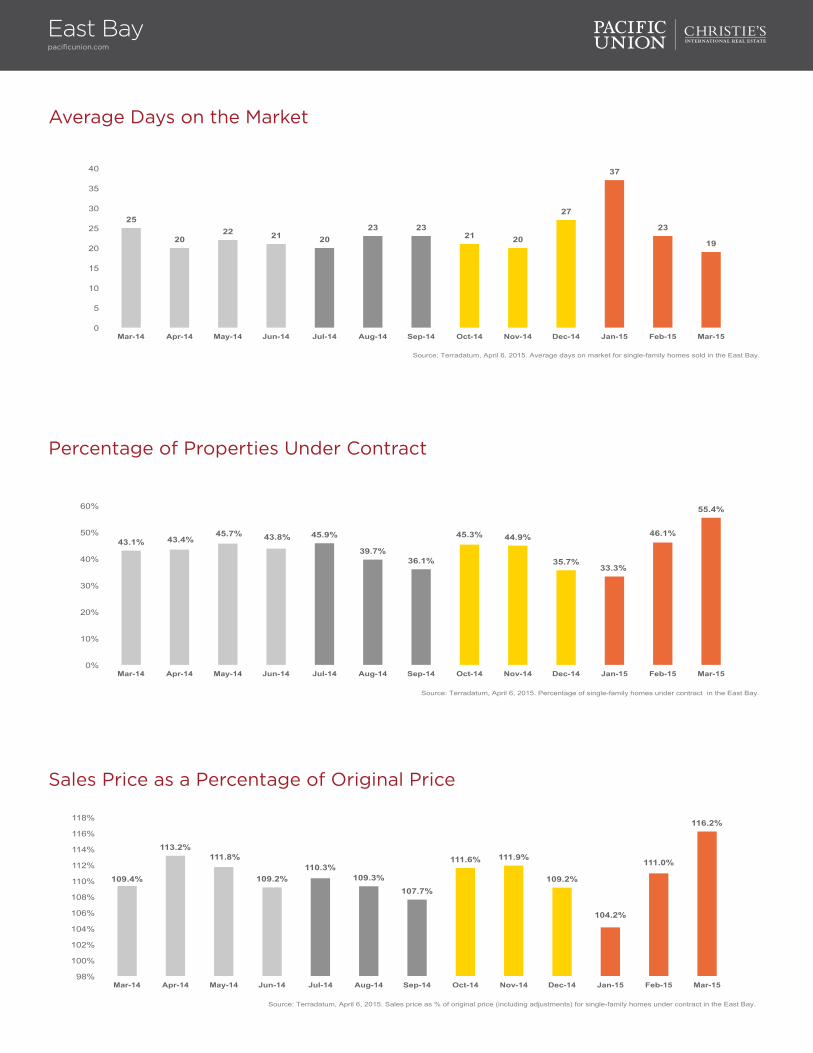
Average Days on the Market
25
20 22 21 20
23 23 21 20
27
37
23
19
0
5
10
15
20
25
30
35
40
Mar-14 Apr-14 May-14 Jun-14 Jul-14 Aug-14 Sep-14 Oct-14 Nov-14 Dec-14 Jan-15 Feb-15 Mar-15
Source: Terradatum, April 6, 2015. Average days on market for single-family homes sold in the East Bay.
Sales Price as a Percentage of Original Price
109.4%
113.2% 111.8%
109.2% 110.3%
109.3% 107.7%
111.6% 111.9%
109.2%
104.2%
111.0%
116.2%
98%
100%
102%
104%
106%
108%
110%
112%
114%
116%
118%
Mar-14 Apr-14 May-14 Jun-14 Jul-14 Aug-14 Sep-14 Oct-14 Nov-14 Dec-14 Jan-15 Feb-15 Mar-15
Source: Terradatum, April 6, 2015. Sales price as % of original price (including adjustments) for single-family homes under contract in the East Bay.
Percentage of Properties Under Contract
43.1% 43.4% 45.7% 43.8% 45.9%
39.7% 36.1%
45.3% 44.9%
35.7% 33.3%
46.1%
55.4%
0%
10%
20%
30%
40%
50%
60%
Mar-14 Apr-14 May-14 Jun-14 Jul-14 Aug-14 Sep-14 Oct-14 Nov-14 Dec-14 Jan-15 Feb-15 Mar-15
Source: Terradatum, April 6, 2015. Percentage of single-family homes under contract in the East Bay.
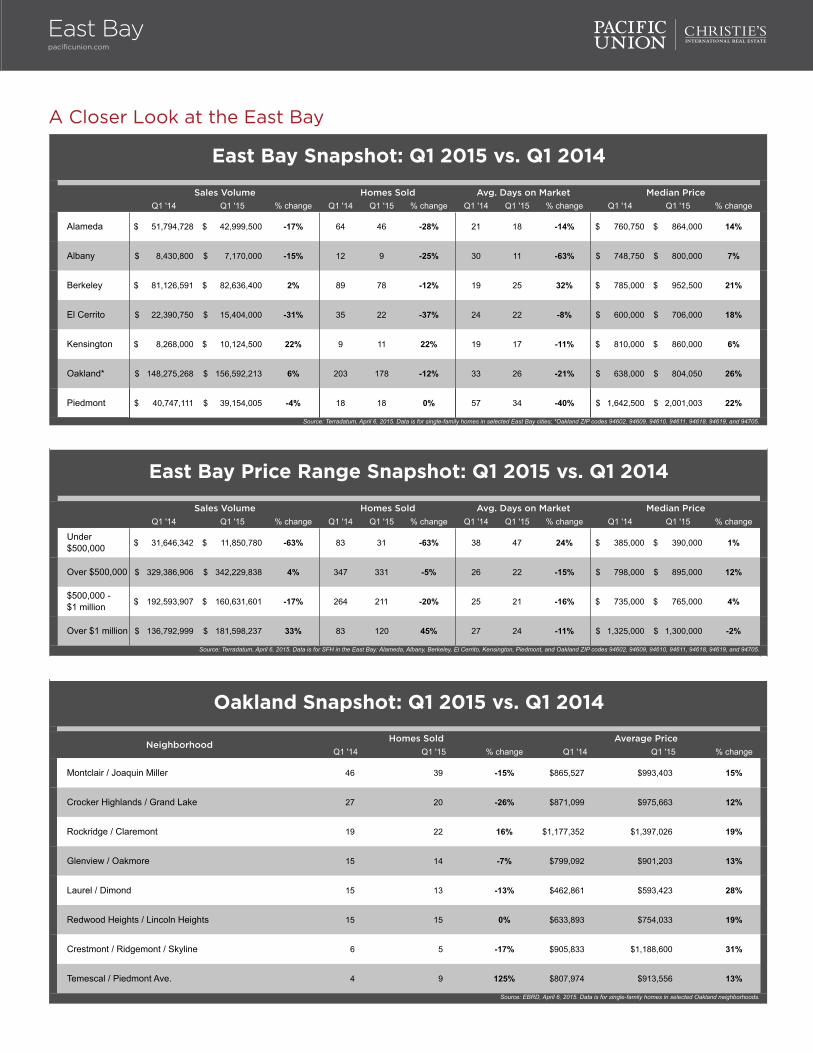
A Closer Look at the East Bay
Q1 '14 Q1 '15 % change Q1 '14 Q1 '15 % change Q1 '14 Q1 '15 % change Q1 '14 Q1 '15 % change
Alameda 51,794,728$ 42,999,500$ -17% 64 46 -28% 21 18 -14% 760,750$ 864,000$ 14%
Albany 8,430,800$ 7,170,000$ -15% 12 9 -25% 30 11 -63% 748,750$ 800,000$ 7%
Berkeley 81,126,591$ 82,636,400$ 2% 89 78 -12% 19 25 32% 785,000$ 952,500$ 21%
El Cerrito 22,390,750$ 15,404,000$ -31% 35 22 -37% 24 22 -8% 600,000$ 706,000$ 18%
Kensington 8,268,000$ 10,124,500$ 22% 9 11 22% 19 17 -11% 810,000$ 860,000$ 6%
Oakland* 148,275,268$ 156,592,213$ 6% 203 178 -12% 33 26 -21% 638,000$ 804,050$ 26%
Piedmont 40,747,111$ 39,154,005$ -4% 18 18 0% 57 34 -40% 1,642,500$ 2,001,003$ 22%
East Bay Snapshot: Q1 2015 vs. Q1 2014
Source: Terradatum, April 6, 2015. Data is for single-family homes in selected East Bay cities; *Oakland ZIP codes 94602, 94609, 94610, 94611, 94618, 94619, and 94705.
Sales Volume Homes Sold Avg. Days on Market Median Price
Q1 '14 Q1 '15 % change Q1 '14 Q1 '15 % change Q1 '14 Q1 '15 % change Q1 '14 Q1 '15 % change
Under $500,000 31,646,342$ 11,850,780$ -63% 83 31 -63% 38 47 24% 385,000$ 390,000$ 1%
Over $500,000 329,386,906$ 342,229,838$ 4% 347 331 -5% 26 22 -15% 798,000$ 895,000$ 12%
$500,000 - $1 million 192,593,907$ 160,631,601$ -17% 264 211 -20% 25 21 -16% 735,000$ 765,000$ 4%
Over $1 million 136,792,999$ 181,598,237$ 33% 83 120 45% 27 24 -11% 1,325,000$ 1,300,000$ -2%
Source: Terradatum, April 6, 2015. Data is for SFH in the East Bay: Alameda, Albany, Berkeley, El Cerrito, Kensington, Piedmont, and Oakland ZIP codes 94602, 94609, 94610, 94611, 94618, 94619, and 94705.
East Bay Price Range Snapshot: Q1 2015 vs. Q1 2014
Sales Volume Homes Sold Avg. Days on Market Median Price
Q1 '14 Q1 '15 % change Q1 '14 Q1 '15 % change
Montclair / Joaquin Miller 46 39 -15% $865,527 $993,403 15%
Crocker Highlands / Grand Lake 27 20 -26% $871,099 $975,663 12%
Rockridge / Claremont 19 22 16% $1,177,352 $1,397,026 19%
Glenview / Oakmore 15 14 -7% $799,092 $901,203 13%
Laurel / Dimond 15 13 -13% $462,861 $593,423 28%
Redwood Heights / Lincoln Heights 15 15 0% $633,893 $754,033 19%
Crestmont / Ridgemont / Skyline 6 5 -17% $905,833 $1,188,600 31%
Temescal / Piedmont Ave. 4 9 125% $807,974 $913,556 13%
Oakland Snapshot: Q1 2015 vs. Q1 2014
NeighborhoodHomes Sold Average Price
Source: EBRD, April 6, 2015. Data is for single-family homes in selected Oakland neighborhoods.
East Baypacificunion.com
Brent ThomsonPresident, Marin [email protected] Redwood Highway, Suite 150 | Mill Valley, CA 94941
Marin CountyQuarterly Real Estate ReportQ1 2015
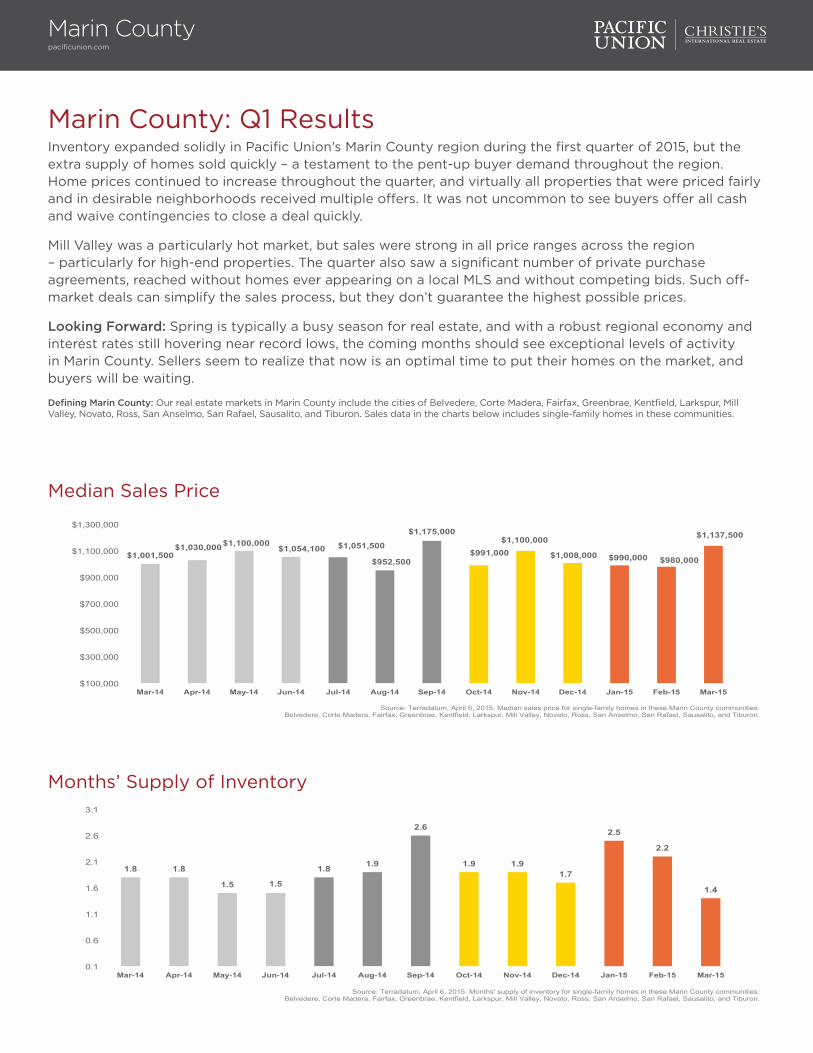
Marin County: Q1 ResultsInventory expanded solidly in Pacific Union’s Marin County region during the first quarter of 2015, but the extra supply of homes sold quickly – a testament to the pent-up buyer demand throughout the region. Home prices continued to increase throughout the quarter, and virtually all properties that were priced fairly and in desirable neighborhoods received multiple offers. It was not uncommon to see buyers offer all cash and waive contingencies to close a deal quickly.
Mill Valley was a particularly hot market, but sales were strong in all price ranges across the region – particularly for high-end properties. The quarter also saw a significant number of private purchase agreements, reached without homes ever appearing on a local MLS and without competing bids. Such off-market deals can simplify the sales process, but they don’t guarantee the highest possible prices.
Looking Forward: Spring is typically a busy season for real estate, and with a robust regional economy and interest rates still hovering near record lows, the coming months should see exceptional levels of activity in Marin County. Sellers seem to realize that now is an optimal time to put their homes on the market, and buyers will be waiting.
Defining Marin County: Our real estate markets in Marin County include the cities of Belvedere, Corte Madera, Fairfax, Greenbrae, Kentfield, Larkspur, Mill Valley, Novato, Ross, San Anselmo, San Rafael, Sausalito, and Tiburon. Sales data in the charts below includes single-family homes in these communities.
Marin Countypacificunion.com
Median Sales Price
Months’ Supply of Inventory
$1,001,500 $1,030,000 $1,100,000
$1,054,100 $1,051,500
$952,500
$1,175,000
$991,000 $1,100,000
$1,008,000 $990,000 $980,000
$1,137,500
$100,000
$300,000
$500,000
$700,000
$900,000
$1,100,000
$1,300,000
Mar-14 Apr-14 May-14 Jun-14 Jul-14 Aug-14 Sep-14 Oct-14 Nov-14 Dec-14 Jan-15 Feb-15 Mar-15
Source: Terradatum, April 6, 2015. Median sales price for single-family homes in these Marin County communities: Belvedere, Corte Madera, Fairfax, Greenbrae, Kentfield, Larkspur, Mill Valley, Novato, Ross, San Anselmo, San Rafael, Sausalito, and Tiburon.
1.8 1.8
1.5 1.5
1.8 1.9
2.6
1.9 1.9 1.7
2.5
2.2
1.4
0.1
0.6
1.1
1.6
2.1
2.6
3.1
Mar-14 Apr-14 May-14 Jun-14 Jul-14 Aug-14 Sep-14 Oct-14 Nov-14 Dec-14 Jan-15 Feb-15 Mar-15
Source: Terradatum, April 6, 2015. Months' supply of inventory for single-family homes in these Marin County communities: Belvedere, Corte Madera, Fairfax, Greenbrae, Kentfield, Larkspur, Mill Valley, Novato, Ross, San Anselmo, San Rafael, Sausalito, and Tiburon.
Marin Countypacificunion.com
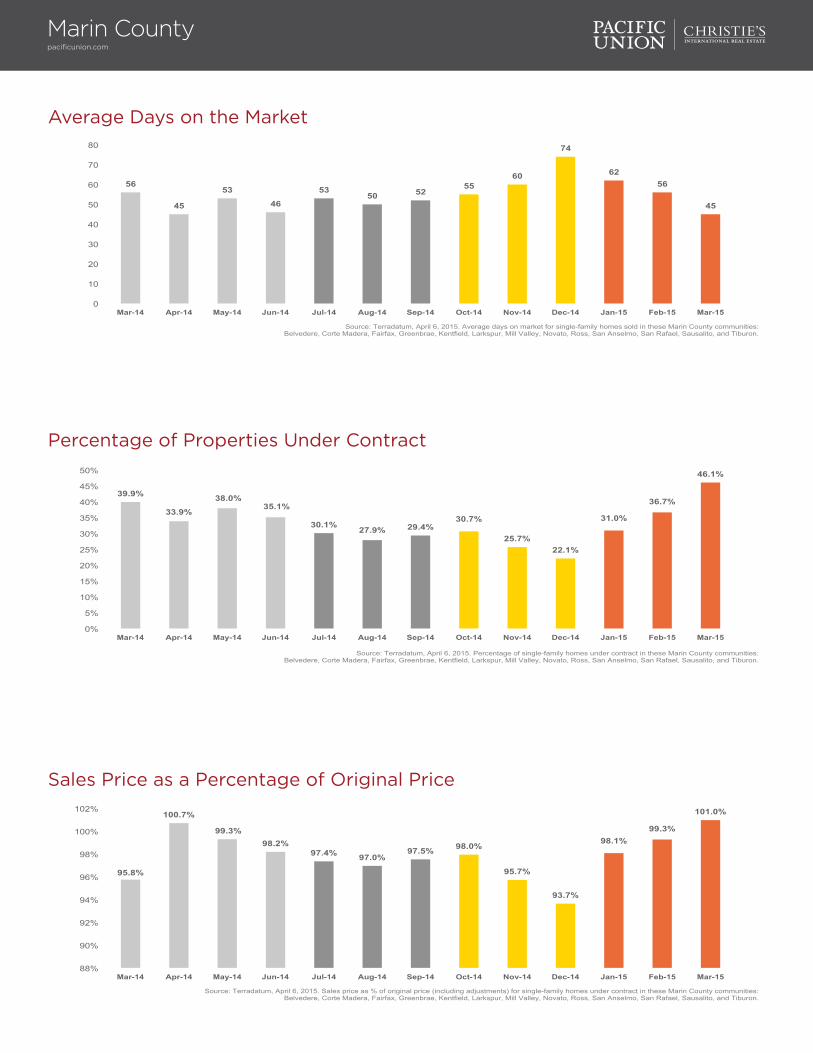
Average Days on the Market
Percentage of Properties Under Contract
56
45
53
46
53 50 52
55 60
74
62 56
45
0
10
20
30
40
50
60
70
80
Mar-14 Apr-14 May-14 Jun-14 Jul-14 Aug-14 Sep-14 Oct-14 Nov-14 Dec-14 Jan-15 Feb-15 Mar-15
Source: Terradatum, April 6, 2015. Average days on market for single-family homes sold in these Marin County communities: Belvedere, Corte Madera, Fairfax, Greenbrae, Kentfield, Larkspur, Mill Valley, Novato, Ross, San Anselmo, San Rafael, Sausalito, and Tiburon.
39.9%
33.9%
38.0% 35.1%
30.1% 27.9% 29.4% 30.7%
25.7% 22.1%
31.0%
36.7%
46.1%
0%
5%
10%
15%
20%
25%
30%
35%
40%
45%
50%
Mar-14 Apr-14 May-14 Jun-14 Jul-14 Aug-14 Sep-14 Oct-14 Nov-14 Dec-14 Jan-15 Feb-15 Mar-15
Source: Terradatum, April 6, 2015. Percentage of single-family homes under contract in these Marin County communities: Belvedere, Corte Madera, Fairfax, Greenbrae, Kentfield, Larkspur, Mill Valley, Novato, Ross, San Anselmo, San Rafael, Sausalito, and Tiburon.
Sales Price as a Percentage of Original Price
95.8%
100.7%
99.3% 98.2%
97.4% 97.0% 97.5% 98.0%
95.7%
93.7%
98.1% 99.3%
101.0%
88%
90%
92%
94%
96%
98%
100%
102%
Mar-14 Apr-14 May-14 Jun-14 Jul-14 Aug-14 Sep-14 Oct-14 Nov-14 Dec-14 Jan-15 Feb-15 Mar-15
Source: Terradatum, April 6, 2015. Sales price as % of original price (including adjustments) for single-family homes under contract in these Marin County communities: Belvedere, Corte Madera, Fairfax, Greenbrae, Kentfield, Larkspur, Mill Valley, Novato, Ross, San Anselmo, San Rafael, Sausalito, and Tiburon.
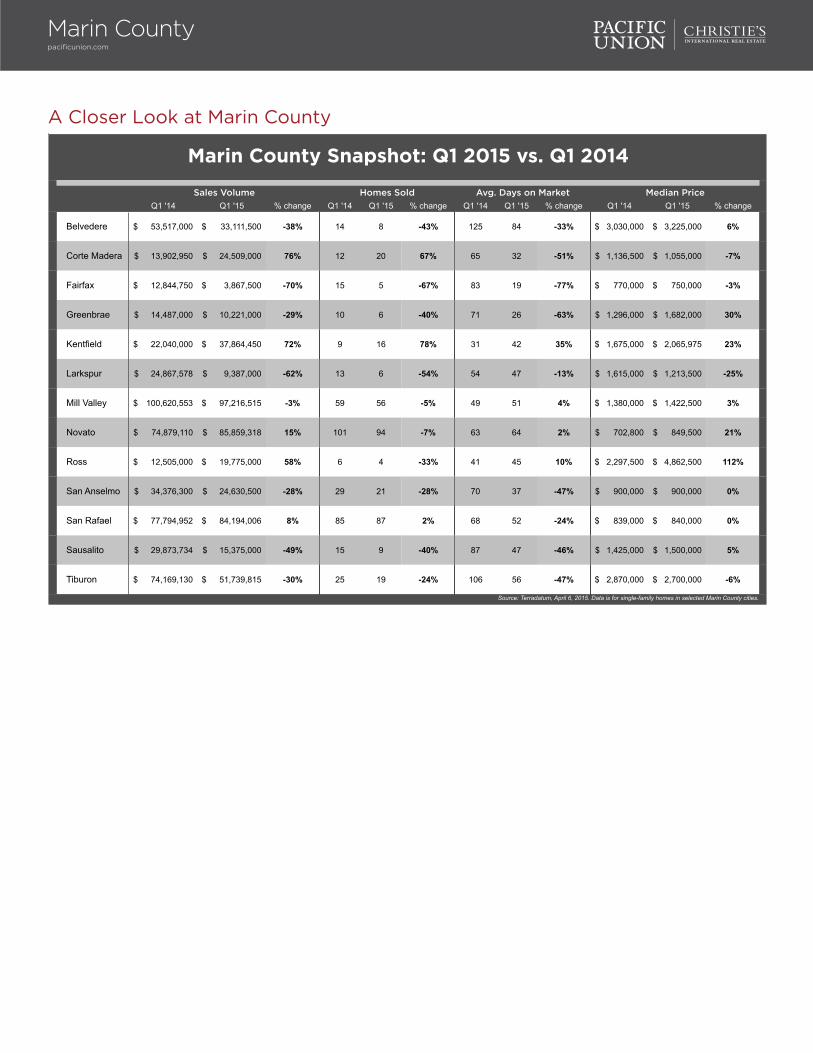
A Closer Look at Marin County
Q1 '14 Q1 '15 % change Q1 '14 Q1 '15 % change Q1 '14 Q1 '15 % change Q1 '14 Q1 '15 % change
Belvedere 53,517,000$ 33,111,500$ -38% 14 8 -43% 125 84 -33% 3,030,000$ 3,225,000$ 6%
Corte Madera 13,902,950$ 24,509,000$ 76% 12 20 67% 65 32 -51% 1,136,500$ 1,055,000$ -7%
Fairfax 12,844,750$ 3,867,500$ -70% 15 5 -67% 83 19 -77% 770,000$ 750,000$ -3%
Greenbrae 14,487,000$ 10,221,000$ -29% 10 6 -40% 71 26 -63% 1,296,000$ 1,682,000$ 30%
Kentfield 22,040,000$ 37,864,450$ 72% 9 16 78% 31 42 35% 1,675,000$ 2,065,975$ 23%
Larkspur 24,867,578$ 9,387,000$ -62% 13 6 -54% 54 47 -13% 1,615,000$ 1,213,500$ -25%
Mill Valley 100,620,553$ 97,216,515$ -3% 59 56 -5% 49 51 4% 1,380,000$ 1,422,500$ 3%
Novato 74,879,110$ 85,859,318$ 15% 101 94 -7% 63 64 2% 702,800$ 849,500$ 21%
Ross 12,505,000$ 19,775,000$ 58% 6 4 -33% 41 45 10% 2,297,500$ 4,862,500$ 112%
San Anselmo 34,376,300$ 24,630,500$ -28% 29 21 -28% 70 37 -47% 900,000$ 900,000$ 0%
San Rafael 77,794,952$ 84,194,006$ 8% 85 87 2% 68 52 -24% 839,000$ 840,000$ 0%
Sausalito 29,873,734$ 15,375,000$ -49% 15 9 -40% 87 47 -46% 1,425,000$ 1,500,000$ 5%
Tiburon 74,169,130$ 51,739,815$ -30% 25 19 -24% 106 56 -47% 2,870,000$ 2,700,000$ -6%
Source: Terradatum, April 6, 2015. Data is for single-family homes in selected Marin County cities.
Marin County Snapshot: Q1 2015 vs. Q1 2014
Sales Volume Homes Sold Avg. Days on Market Median Price
Marin Countypacificunion.com
Linda CarrollRegional Executive, Napa [email protected] Main Street | Napa, CA 94559
Napa CountyQuarterly Real Estate ReportQ1 2015
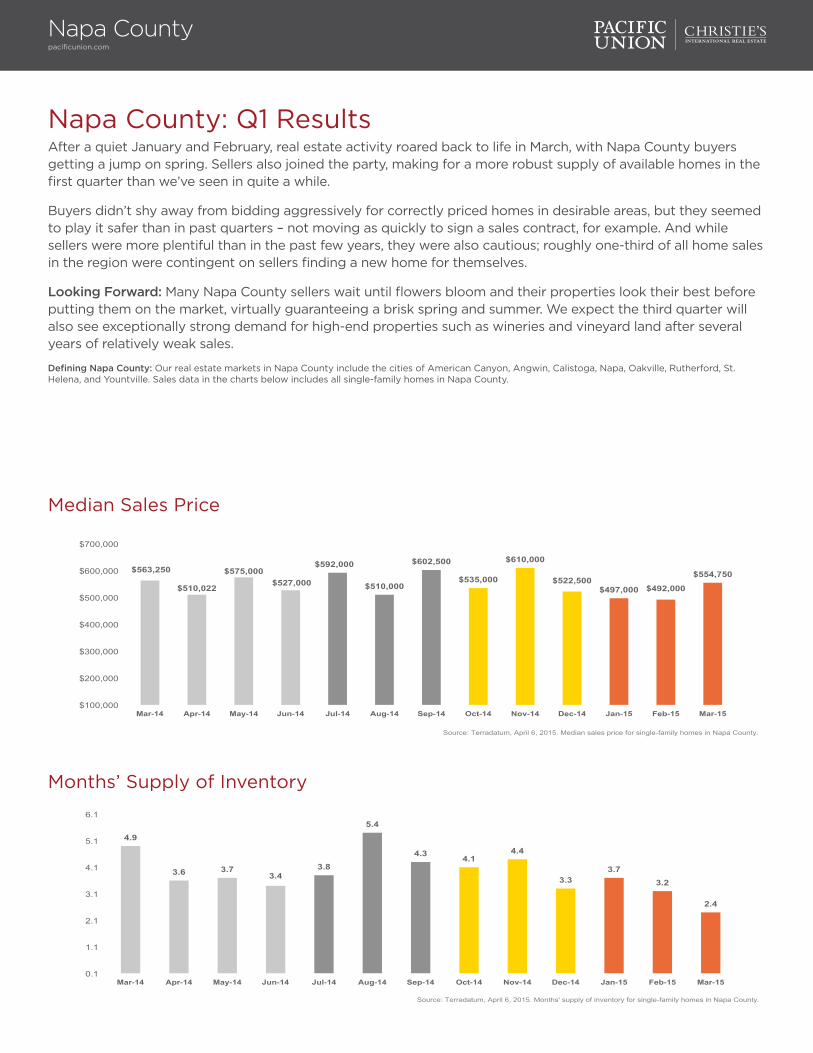
Napa County: Q1 ResultsAfter a quiet January and February, real estate activity roared back to life in March, with Napa County buyers getting a jump on spring. Sellers also joined the party, making for a more robust supply of available homes in the first quarter than we’ve seen in quite a while.
Buyers didn’t shy away from bidding aggressively for correctly priced homes in desirable areas, but they seemed to play it safer than in past quarters – not moving as quickly to sign a sales contract, for example. And while sellers were more plentiful than in the past few years, they were also cautious; roughly one-third of all home sales in the region were contingent on sellers finding a new home for themselves.
Looking Forward: Many Napa County sellers wait until flowers bloom and their properties look their best before putting them on the market, virtually guaranteeing a brisk spring and summer. We expect the third quarter will also see exceptionally strong demand for high-end properties such as wineries and vineyard land after several years of relatively weak sales.
Defining Napa County: Our real estate markets in Napa County include the cities of American Canyon, Angwin, Calistoga, Napa, Oakville, Rutherford, St. Helena, and Yountville. Sales data in the charts below includes all single-family homes in Napa County.
Napa Countypacificunion.com
Median Sales Price
Months’ Supply of Inventory
$563,250
$510,022
$575,000 $527,000
$592,000
$510,000
$602,500
$535,000
$610,000
$522,500 $497,000 $492,000
$554,750
$100,000
$200,000
$300,000
$400,000
$500,000
$600,000
$700,000
Mar-14 Apr-14 May-14 Jun-14 Jul-14 Aug-14 Sep-14 Oct-14 Nov-14 Dec-14 Jan-15 Feb-15 Mar-15
Source: Terradatum, April 6, 2015. Median sales price for single-family homes in Napa County.
4.9
3.6 3.7 3.4
3.8
5.4
4.3 4.1 4.4
3.3 3.7
3.2
2.4
0.1
1.1
2.1
3.1
4.1
5.1
6.1
Mar-14 Apr-14 May-14 Jun-14 Jul-14 Aug-14 Sep-14 Oct-14 Nov-14 Dec-14 Jan-15 Feb-15 Mar-15
Source: Terradatum, April 6, 2015. Months' supply of inventory for single-family homes in Napa County.
Napa Countypacificunion.com
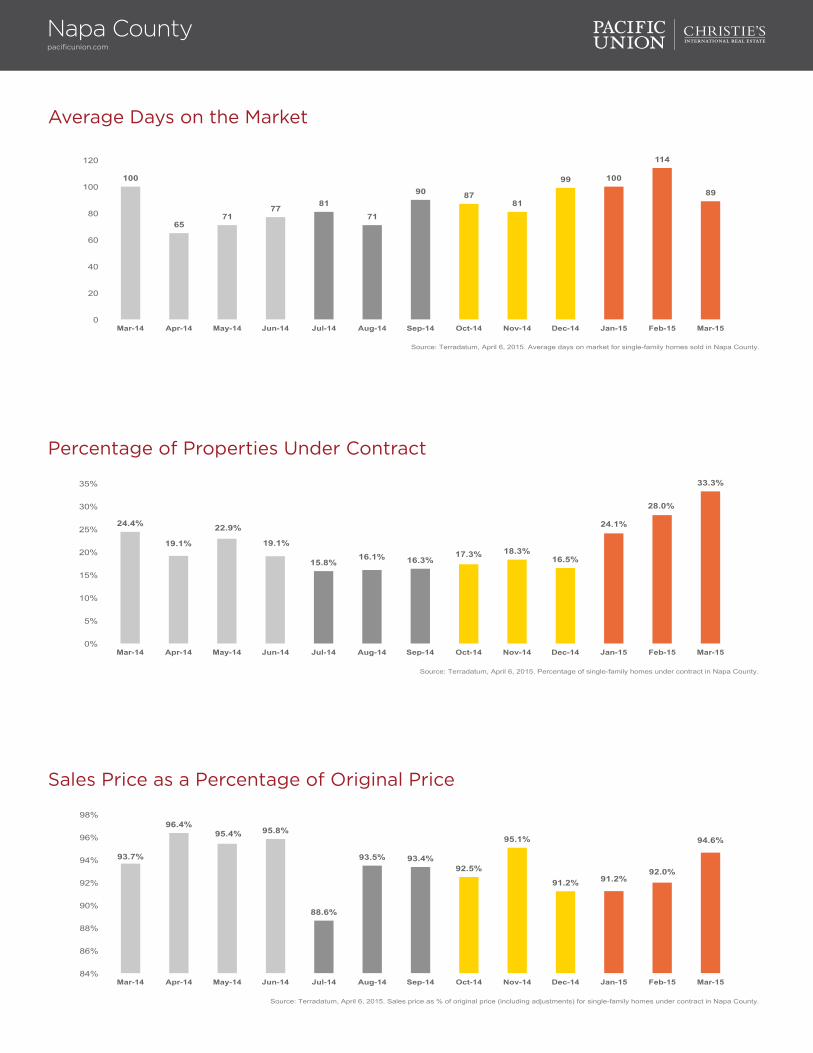
Average Days on the Market
Percentage of Properties Under Contract
100
65 71
77 81 71
90 87 81
99 100
114
89
0
20
40
60
80
100
120
Mar-14 Apr-14 May-14 Jun-14 Jul-14 Aug-14 Sep-14 Oct-14 Nov-14 Dec-14 Jan-15 Feb-15 Mar-15
Source: Terradatum, April 6, 2015. Average days on market for single-family homes sold in Napa County.
24.4%
19.1%
22.9%
19.1%
15.8% 16.1% 16.3%
17.3% 18.3% 16.5%
24.1%
28.0%
33.3%
0%
5%
10%
15%
20%
25%
30%
35%
Mar-14 Apr-14 May-14 Jun-14 Jul-14 Aug-14 Sep-14 Oct-14 Nov-14 Dec-14 Jan-15 Feb-15 Mar-15
Source: Terradatum, April 6, 2015. Percentage of single-family homes under contract in Napa County.
Sales Price as a Percentage of Original Price
93.7%
96.4% 95.4% 95.8%
88.6%
93.5% 93.4% 92.5%
95.1%
91.2% 91.2% 92.0%
94.6%
84%
86%
88%
90%
92%
94%
96%
98%
Mar-14 Apr-14 May-14 Jun-14 Jul-14 Aug-14 Sep-14 Oct-14 Nov-14 Dec-14 Jan-15 Feb-15 Mar-15
Source: Terradatum, April 6, 2015. Sales price as % of original price (including adjustments) for single-family homes under contract in Napa County.
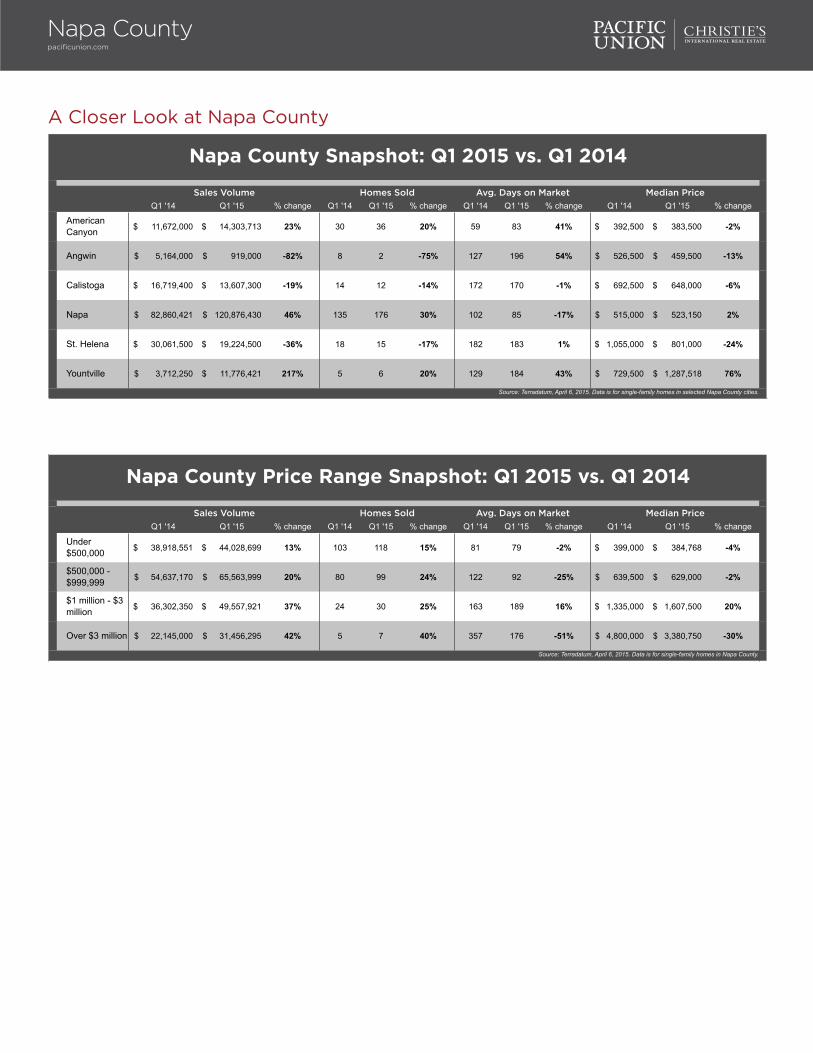
A Closer Look at Napa County
Q1 '14 Q1 '15 % change Q1 '14 Q1 '15 % change Q1 '14 Q1 '15 % change Q1 '14 Q1 '15 % change
American Canyon 11,672,000$ 14,303,713$ 23% 30 36 20% 59 83 41% 392,500$ 383,500$ -2%
Angwin 5,164,000$ 919,000$ -82% 8 2 -75% 127 196 54% 526,500$ 459,500$ -13%
Calistoga 16,719,400$ 13,607,300$ -19% 14 12 -14% 172 170 -1% 692,500$ 648,000$ -6%
Napa 82,860,421$ 120,876,430$ 46% 135 176 30% 102 85 -17% 515,000$ 523,150$ 2%
St. Helena 30,061,500$ 19,224,500$ -36% 18 15 -17% 182 183 1% 1,055,000$ 801,000$ -24%
Yountville 3,712,250$ 11,776,421$ 217% 5 6 20% 129 184 43% 729,500$ 1,287,518$ 76%
Source: Terradatum, April 6, 2015. Data is for single-family homes in selected Napa County cities.
Napa County Snapshot: Q1 2015 vs. Q1 2014
Sales Volume Homes Sold Avg. Days on Market Median Price
Q1 '14 Q1 '15 % change Q1 '14 Q1 '15 % change Q1 '14 Q1 '15 % change Q1 '14 Q1 '15 % change
Under $500,000 38,918,551$ 44,028,699$ 13% 103 118 15% 81 79 -2% 399,000$ 384,768$ -4%
$500,000 - $999,999 54,637,170$ 65,563,999$ 20% 80 99 24% 122 92 -25% 639,500$ 629,000$ -2%
$1 million - $3 million 36,302,350$ 49,557,921$ 37% 24 30 25% 163 189 16% 1,335,000$ 1,607,500$ 20%
Over $3 million 22,145,000$ 31,456,295$ 42% 5 7 40% 357 176 -51% 4,800,000$ 3,380,750$ -30%
Median Price
Source: Terradatum, April 6, 2015. Data is for single-family homes in Napa County.
Napa County Price Range Snapshot: Q1 2015 vs. Q1 2014
Sales Volume Homes Sold Avg. Days on Market
Napa Countypacificunion.com

Patrick [email protected] Van Ness Avenue | San Francisco, CA 94109
San FranciscoQuarterly Real Estate ReportQ1 2015
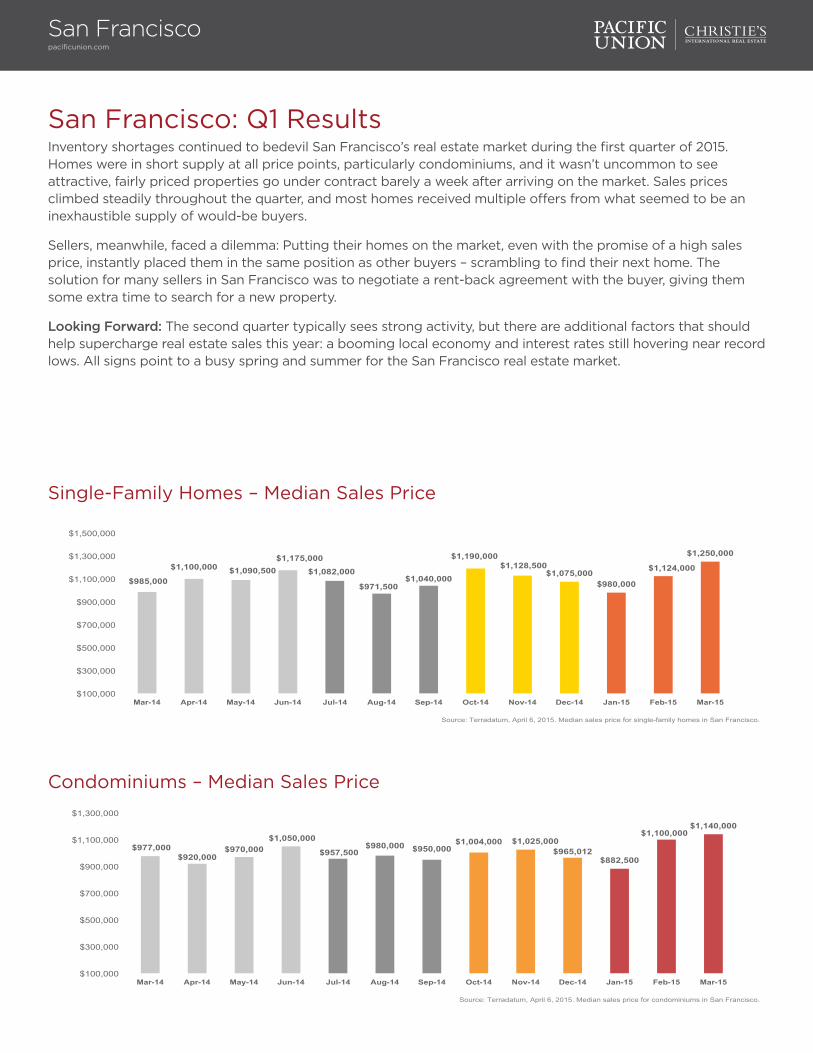
San Francisco: Q1 ResultsInventory shortages continued to bedevil San Francisco’s real estate market during the first quarter of 2015. Homes were in short supply at all price points, particularly condominiums, and it wasn’t uncommon to see attractive, fairly priced properties go under contract barely a week after arriving on the market. Sales prices climbed steadily throughout the quarter, and most homes received multiple offers from what seemed to be an inexhaustible supply of would-be buyers.
Sellers, meanwhile, faced a dilemma: Putting their homes on the market, even with the promise of a high sales price, instantly placed them in the same position as other buyers – scrambling to find their next home. The solution for many sellers in San Francisco was to negotiate a rent-back agreement with the buyer, giving them some extra time to search for a new property.
Looking Forward: The second quarter typically sees strong activity, but there are additional factors that should help supercharge real estate sales this year: a booming local economy and interest rates still hovering near record lows. All signs point to a busy spring and summer for the San Francisco real estate market.
San Franciscopacificunion.com
Single-Family Homes – Median Sales Price
Condominiums – Median Sales Price
$985,000
$1,100,000 $1,090,500 $1,175,000
$1,082,000
$971,500 $1,040,000
$1,190,000 $1,128,500
$1,075,000 $980,000
$1,124,000
$1,250,000
$100,000
$300,000
$500,000
$700,000
$900,000
$1,100,000
$1,300,000
$1,500,000
Mar-14 Apr-14 May-14 Jun-14 Jul-14 Aug-14 Sep-14 Oct-14 Nov-14 Dec-14 Jan-15 Feb-15 Mar-15
Source: Terradatum, April 6, 2015. Median sales price for single-family homes in San Francisco.
$977,000 $920,000
$970,000 $1,050,000
$957,500 $980,000 $950,000
$1,004,000 $1,025,000 $965,012
$882,500
$1,100,000 $1,140,000
$100,000
$300,000
$500,000
$700,000
$900,000
$1,100,000
$1,300,000
Mar-14 Apr-14 May-14 Jun-14 Jul-14 Aug-14 Sep-14 Oct-14 Nov-14 Dec-14 Jan-15 Feb-15 Mar-15
Source: Terradatum, April 6, 2015. Median sales price for condominiums in San Francisco.
San Franciscopacificunion.com
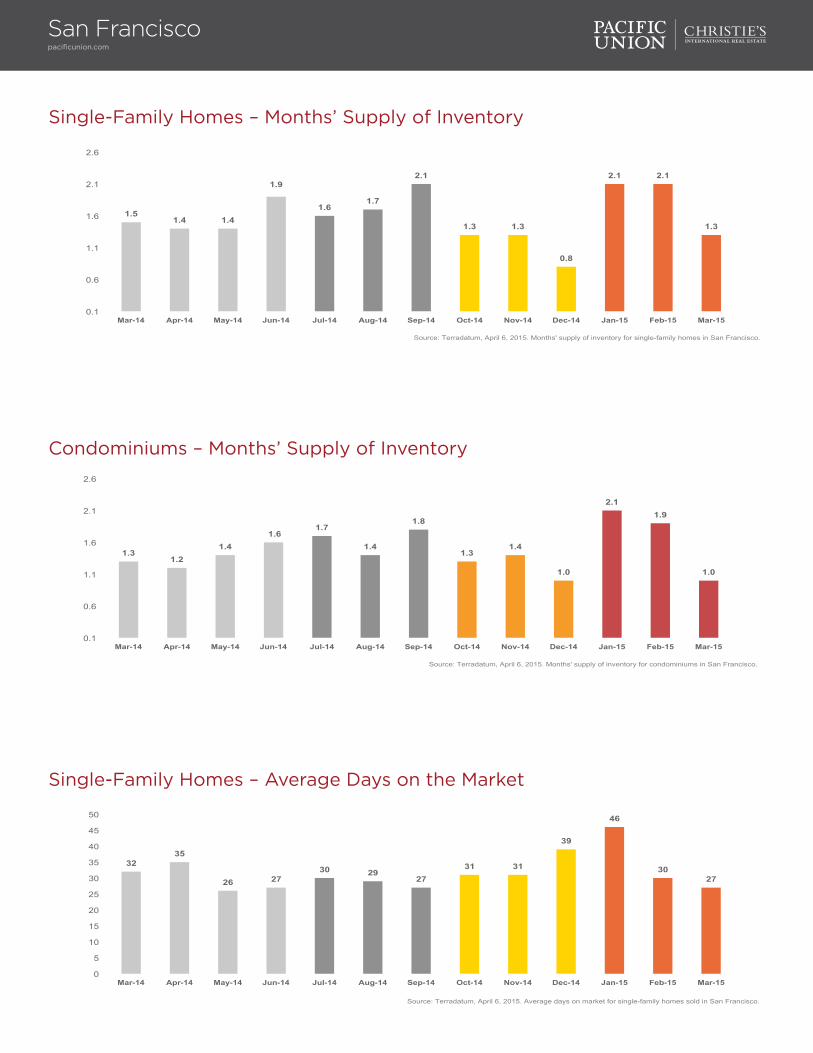
Single-Family Homes – Months’ Supply of Inventory
1.5 1.4 1.4
1.9
1.6 1.7
2.1
1.3 1.3
0.8
2.1 2.1
1.3
0.1
0.6
1.1
1.6
2.1
2.6
Mar-14 Apr-14 May-14 Jun-14 Jul-14 Aug-14 Sep-14 Oct-14 Nov-14 Dec-14 Jan-15 Feb-15 Mar-15
Source: Terradatum, April 6, 2015. Months' supply of inventory for single-family homes in San Francisco.
Single-Family Homes – Average Days on the Market
32 35
26 27 30 29
27 31 31
39
46
30 27
0
5
10
15
20
25
30
35
40
45
50
Mar-14 Apr-14 May-14 Jun-14 Jul-14 Aug-14 Sep-14 Oct-14 Nov-14 Dec-14 Jan-15 Feb-15 Mar-15
Source: Terradatum, April 6, 2015. Average days on market for single-family homes sold in San Francisco.
Condominiums – Months’ Supply of Inventory
1.3 1.2
1.4 1.6
1.7
1.4
1.8
1.3 1.4
1.0
2.1 1.9
1.0
0.1
0.6
1.1
1.6
2.1
2.6
Mar-14 Apr-14 May-14 Jun-14 Jul-14 Aug-14 Sep-14 Oct-14 Nov-14 Dec-14 Jan-15 Feb-15 Mar-15
Source: Terradatum, April 6, 2015. Months' supply of inventory for condominiums in San Francisco.
San Franciscopacificunion.com
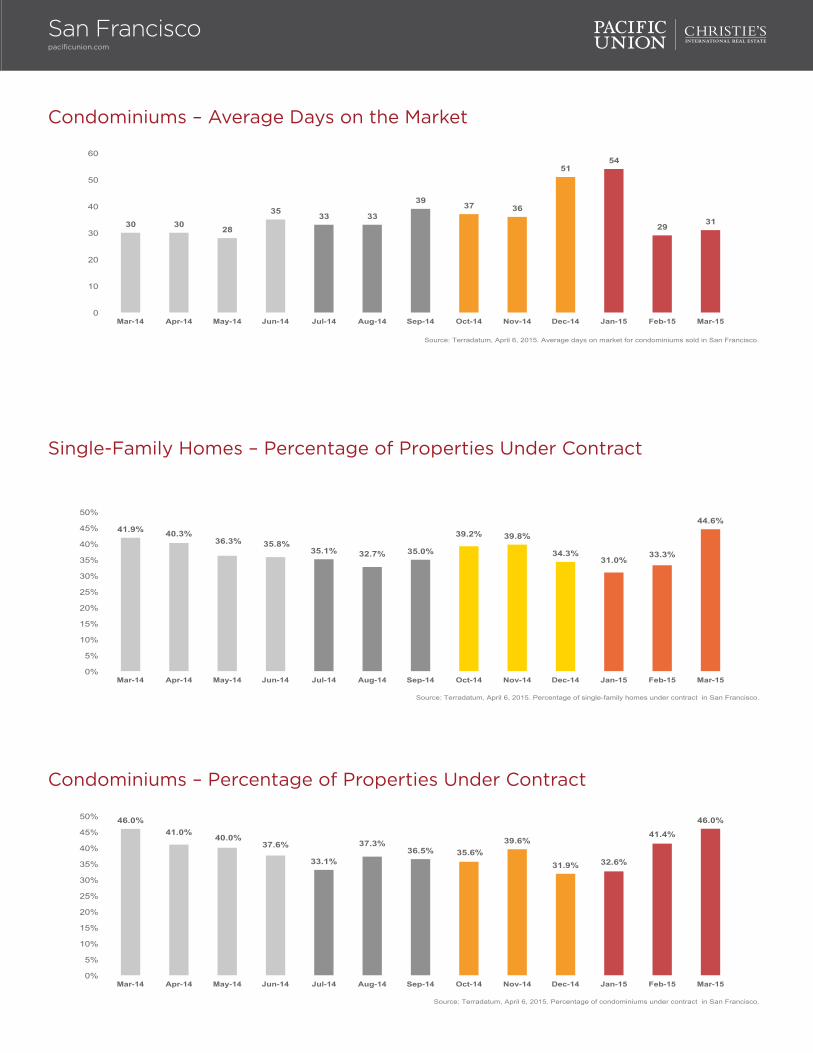
Condominiums – Average Days on the Market
30 30 28
35 33 33
39 37 36
51 54
29 31
0
10
20
30
40
50
60
Mar-14 Apr-14 May-14 Jun-14 Jul-14 Aug-14 Sep-14 Oct-14 Nov-14 Dec-14 Jan-15 Feb-15 Mar-15
Source: Terradatum, April 6, 2015. Average days on market for condominiums sold in San Francisco.
Condominiums – Percentage of Properties Under Contract
46.0% 41.0%
40.0% 37.6%
33.1%
37.3% 36.5% 35.6%
39.6%
31.9% 32.6%
41.4%
46.0%
0%
5%
10%
15%
20%
25%
30%
35%
40%
45%
50%
Mar-14 Apr-14 May-14 Jun-14 Jul-14 Aug-14 Sep-14 Oct-14 Nov-14 Dec-14 Jan-15 Feb-15 Mar-15
Source: Terradatum, April 6, 2015. Percentage of condominiums under contract in San Francisco.
Single-Family Homes – Percentage of Properties Under Contract
41.9% 40.3% 36.3% 35.8%
35.1% 32.7% 35.0%
39.2% 39.8%
34.3% 31.0%
33.3%
44.6%
0%
5%
10%
15%
20%
25%
30%
35%
40%
45%
50%
Mar-14 Apr-14 May-14 Jun-14 Jul-14 Aug-14 Sep-14 Oct-14 Nov-14 Dec-14 Jan-15 Feb-15 Mar-15
Source: Terradatum, April 6, 2015. Percentage of single-family homes under contract in San Francisco.
San Franciscopacificunion.com
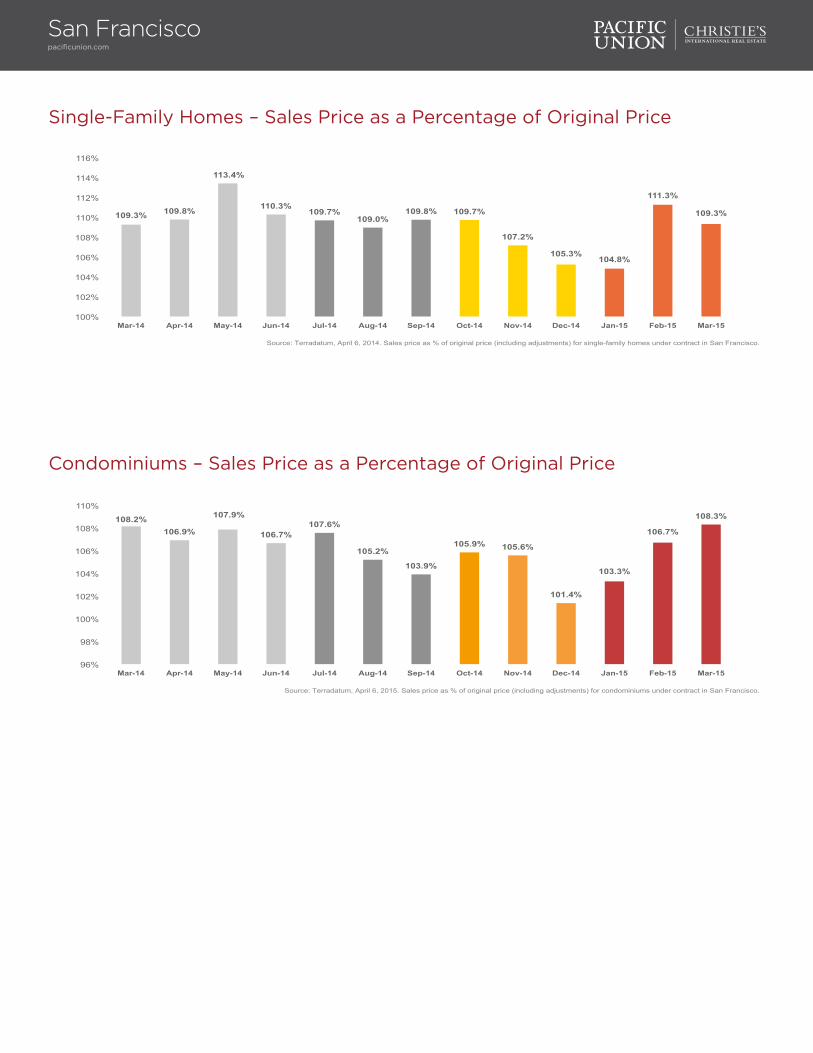
Single-Family Homes – Sales Price as a Percentage of Original Price
109.3% 109.8%
113.4%
110.3% 109.7%
109.0% 109.8% 109.7%
107.2%
105.3% 104.8%
111.3%
109.3%
100%
102%
104%
106%
108%
110%
112%
114%
116%
Mar-14 Apr-14 May-14 Jun-14 Jul-14 Aug-14 Sep-14 Oct-14 Nov-14 Dec-14 Jan-15 Feb-15 Mar-15
Source: Terradatum, April 6, 2014. Sales price as % of original price (including adjustments) for single-family homes under contract in San Francisco.
Condominiums – Sales Price as a Percentage of Original Price
108.2% 106.9%
107.9%
106.7% 107.6%
105.2%
103.9%
105.9% 105.6%
101.4%
103.3%
106.7%
108.3%
96%
98%
100%
102%
104%
106%
108%
110%
Mar-14 Apr-14 May-14 Jun-14 Jul-14 Aug-14 Sep-14 Oct-14 Nov-14 Dec-14 Jan-15 Feb-15 Mar-15
Source: Terradatum, April 6, 2015. Sales price as % of original price (including adjustments) for condominiums under contract in San Francisco.
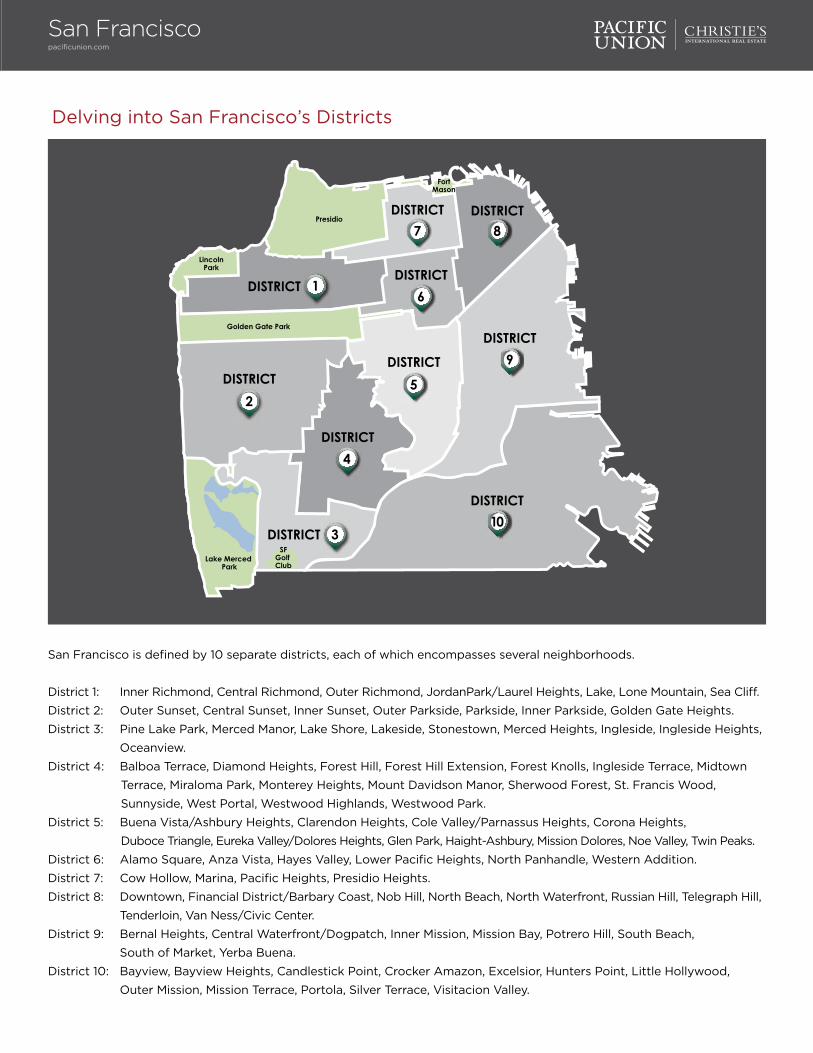
Delving into San Francisco’s Districts
San Francisco is defined by 10 separate districts, each of which encompasses several neighborhoods.
District 1: Inner Richmond, Central Richmond, Outer Richmond, JordanPark/Laurel Heights, Lake, Lone Mountain, Sea Cliff.
District 2: Outer Sunset, Central Sunset, Inner Sunset, Outer Parkside, Parkside, Inner Parkside, Golden Gate Heights.
District 3: Pine Lake Park, Merced Manor, Lake Shore, Lakeside, Stonestown, Merced Heights, Ingleside, Ingleside Heights,
Oceanview.
District 4: Balboa Terrace, Diamond Heights, Forest Hill, Forest Hill Extension, Forest Knolls, Ingleside Terrace, Midtown
Terrace, Miraloma Park, Monterey Heights, Mount Davidson Manor, Sherwood Forest, St. Francis Wood,
Sunnyside, West Portal, Westwood Highlands, Westwood Park.
District 5: Buena Vista/Ashbury Heights, Clarendon Heights, Cole Valley/Parnassus Heights, Corona Heights,
Duboce Triangle, Eureka Valley/Dolores Heights, Glen Park, Haight-Ashbury, Mission Dolores, Noe Valley, Twin Peaks.
District 6: Alamo Square, Anza Vista, Hayes Valley, Lower Pacific Heights, North Panhandle, Western Addition.
District 7: Cow Hollow, Marina, Pacific Heights, Presidio Heights.
District 8: Downtown, Financial District/Barbary Coast, Nob Hill, North Beach, North Waterfront, Russian Hill, Telegraph Hill,
Tenderloin, Van Ness/Civic Center.
District 9: Bernal Heights, Central Waterfront/Dogpatch, Inner Mission, Mission Bay, Potrero Hill, South Beach,
South of Market, Yerba Buena.
District 10: Bayview, Bayview Heights, Candlestick Point, Crocker Amazon, Excelsior, Hunters Point, Little Hollywood,
Outer Mission, Mission Terrace, Portola, Silver Terrace, Visitacion Valley.
San Franciscopacificunion.com
San Franciscopacificunion.com
Q1 '14 Q1 '15 % change Q1 '14 Q1 '15 % change Q1 '14 Q1 '15 % change Q1 '14 Q1 '15 % change
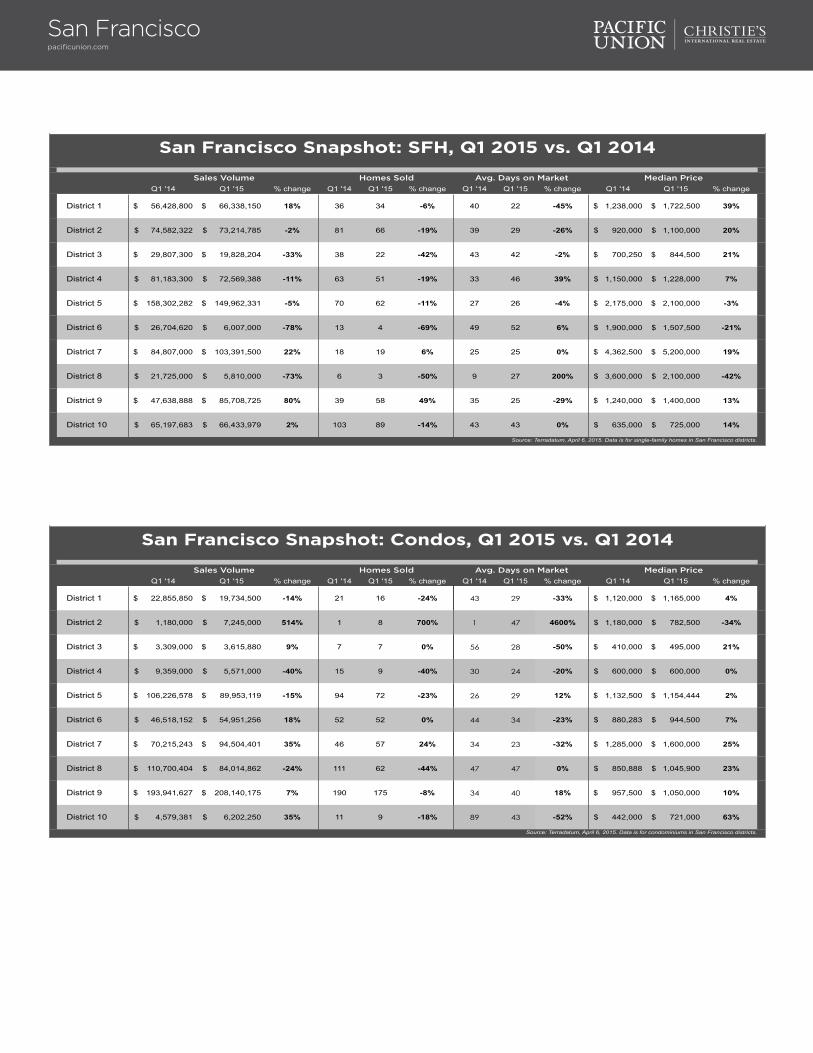
District 1 56,428,800$ 66,338,150$ 18% 36 34 -6% 40 22 -45% 1,238,000$ 1,722,500$ 39%
District 2 74,582,322$ 73,214,785$ -2% 81 66 -19% 39 29 -26% 920,000$ 1,100,000$ 20%
District 3 29,807,300$ 19,828,204$ -33% 38 22 -42% 43 42 -2% 700,250$ 844,500$ 21%
District 4 81,183,300$ 72,569,388$ -11% 63 51 -19% 33 46 39% 1,150,000$ 1,228,000$ 7%
District 5 158,302,282$ 149,962,331$ -5% 70 62 -11% 27 26 -4% 2,175,000$ 2,100,000$ -3%
District 6 26,704,620$ 6,007,000$ -78% 13 4 -69% 49 52 6% 1,900,000$ 1,507,500$ -21%
District 7 84,807,000$ 103,391,500$ 22% 18 19 6% 25 25 0% 4,362,500$ 5,200,000$ 19%
District 8 21,725,000$ 5,810,000$ -73% 6 3 -50% 9 27 200% 3,600,000$ 2,100,000$ -42%
District 9 47,638,888$ 85,708,725$ 80% 39 58 49% 35 25 -29% 1,240,000$ 1,400,000$ 13%
District 10 65,197,683$ 66,433,979$ 2% 103 89 -14% 43 43 0% 635,000$ 725,000$ 14%
Source: Terradatum, April 6, 2015. Data is for single-family homes in San Francisco districts.
San Francisco Snapshot: SFH, Q1 2015 vs. Q1 2014
Sales Volume Homes Sold Avg. Days on Market Median Price
Q1 '14 Q1 '15 % change Q1 '14 Q1 '15 % change Q1 '14 Q1 '15 % change Q1 '14 Q1 '15 % change
District 1 22,855,850$ 19,734,500$ -14% 21 16 -24% 43 29 -33% 1,120,000$ 1,165,000$ 4%
District 2 1,180,000$ 7,245,000$ 514% 1 8 700% 1 47 4600% 1,180,000$ 782,500$ -34%
District 3 3,309,000$ 3,615,880$ 9% 7 7 0% 56 28 -50% 410,000$ 495,000$ 21%
District 4 9,359,000$ 5,571,000$ -40% 15 9 -40% 30 24 -20% 600,000$ 600,000$ 0%
District 5 106,226,578$ 89,953,119$ -15% 94 72 -23% 26 29 12% 1,132,500$ 1,154,444$ 2%
District 6 46,518,152$ 54,951,256$ 18% 52 52 0% 44 34 -23% 880,283$ 944,500$ 7%
District 7 70,215,243$ 94,504,401$ 35% 46 57 24% 34 23 -32% 1,285,000$ 1,600,000$ 25%
District 8 110,700,404$ 84,014,862$ -24% 111 62 -44% 47 47 0% 850,888$ 1,045,900$ 23%
District 9 193,941,627$ 208,140,175$ 7% 190 175 -8% 34 40 18% 957,500$ 1,050,000$ 10%
District 10 4,579,381$ 6,202,250$ 35% 11 9 -18% 89 43 -52% 442,000$ 721,000$ 63%
Source: Terradatum, April 6, 2015. Data is for condominiums in San Francisco districts.
San Francisco Snapshot: Condos, Q1 2015 vs. Q1 2014
Sales Volume Homes Sold Avg. Days on Market Median Price
San Franciscopacificunion.com
Q1 '14 Q1 '15 % change Q1 '14 Q1 '15 % change Q1 '14 Q4 '15 % change Q1 '14 Q4 '15 % change
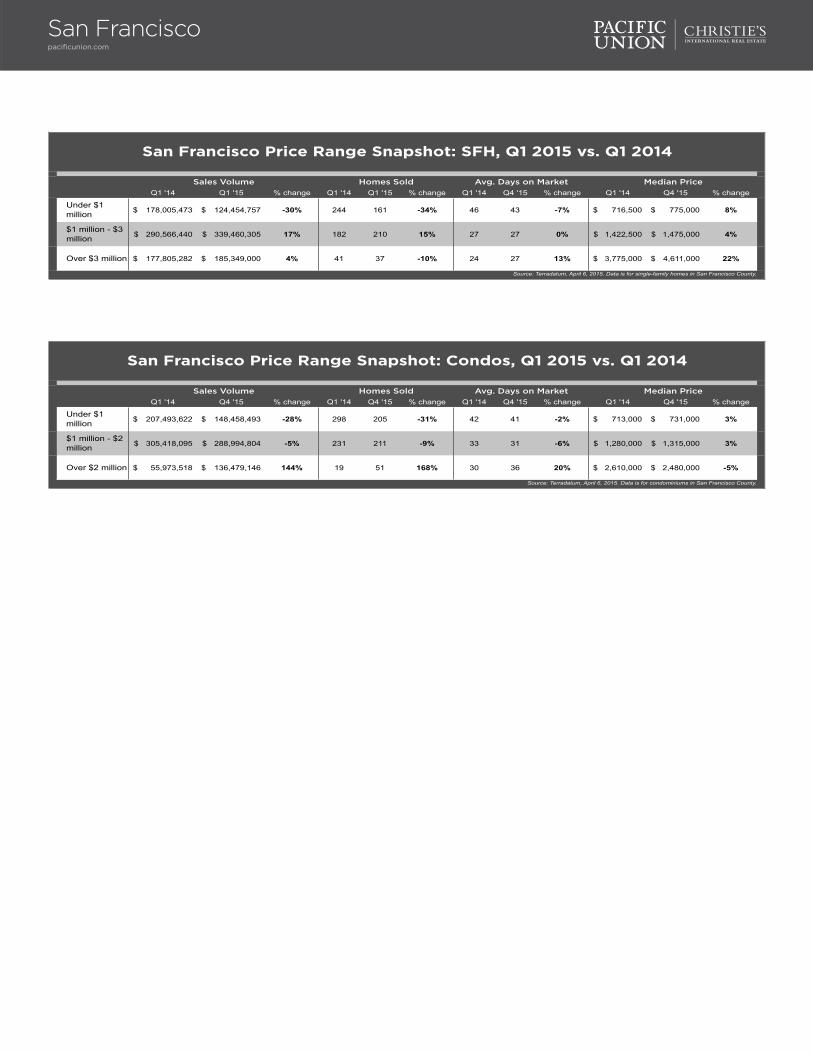
Under $1 million 178,005,473$ 124,454,757$ -30% 244 161 -34% 46 43 -7% 716,500$ 775,000$ 8%
$1 million - $3 million 290,566,440$ 339,460,305$ 17% 182 210 15% 27 27 0% 1,422,500$ 1,475,000$ 4%
Over $3 million 177,805,282$ 185,349,000$ 4% 41 37 -10% 24 27 13% 3,775,000$ 4,611,000$ 22%
San Francisco Price Range Snapshot: SFH, Q1 2015 vs. Q1 2014
Source: Terradatum, April 6, 2015. Data is for single-family homes in San Francisco County.
Sales Volume Homes Sold Avg. Days on Market Median Price
Q1 '14 Q4 '15 % change Q1 '14 Q4 '15 % change Q1 '14 Q4 '15 % change Q1 '14 Q4 '15 % change
Under $1 million 207,493,622$ 148,458,493$ -28% 298 205 -31% 42 41 -2% 713,000$ 731,000$ 3%
$1 million - $2 million 305,418,095$ 288,994,804$ -5% 231 211 -9% 33 31 -6% 1,280,000$ 1,315,000$ 3%
Over $2 million 55,973,518$ 136,479,146$ 144% 19 51 168% 30 36 20% 2,610,000$ 2,480,000$ -5%
Source: Terradatum, April 6, 2015. Data is for condominiums in San Francisco County.
San Francisco Price Range Snapshot: Condos, Q1 2015 vs. Q1 2014
Sales Volume Homes Sold Avg. Days on Market Median Price
David BarcaVice President, Silicon [email protected] El Camino Real, Suite 220 | Menlo Park CA 94025
Silicon ValleyQuarterly Real Estate ReportQ1 2015
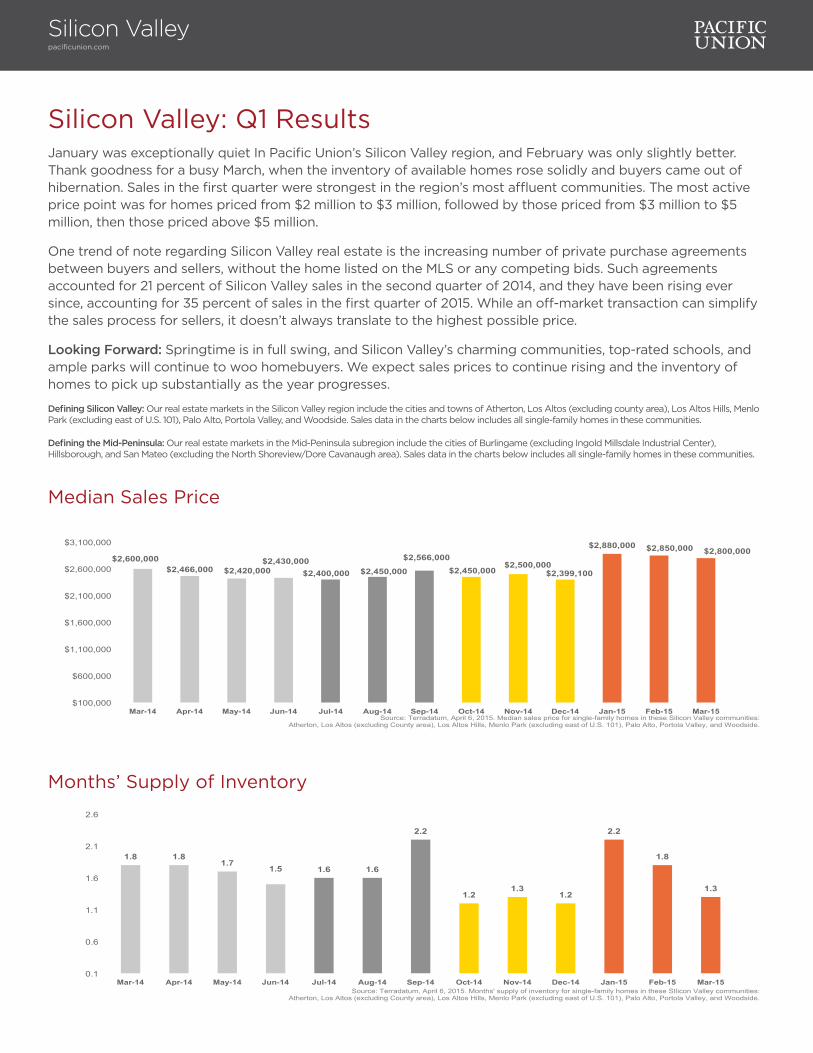
Silicon Valley: Q1 ResultsJanuary was exceptionally quiet In Pacific Union’s Silicon Valley region, and February was only slightly better. Thank goodness for a busy March, when the inventory of available homes rose solidly and buyers came out of hibernation. Sales in the first quarter were strongest in the region’s most affluent communities. The most active price point was for homes priced from $2 million to $3 million, followed by those priced from $3 million to $5 million, then those priced above $5 million.
One trend of note regarding Silicon Valley real estate is the increasing number of private purchase agreements between buyers and sellers, without the home listed on the MLS or any competing bids. Such agreements accounted for 21 percent of Silicon Valley sales in the second quarter of 2014, and they have been rising ever since, accounting for 35 percent of sales in the first quarter of 2015. While an off-market transaction can simplify the sales process for sellers, it doesn’t always translate to the highest possible price.
Looking Forward: Springtime is in full swing, and Silicon Valley’s charming communities, top-rated schools, and ample parks will continue to woo homebuyers. We expect sales prices to continue rising and the inventory of homes to pick up substantially as the year progresses.
Defining Silicon Valley: Our real estate markets in the Silicon Valley region include the cities and towns of Atherton, Los Altos (excluding county area), Los Altos Hills, Menlo Park (excluding east of U.S. 101), Palo Alto, Portola Valley, and Woodside. Sales data in the charts below includes all single-family homes in these communities.
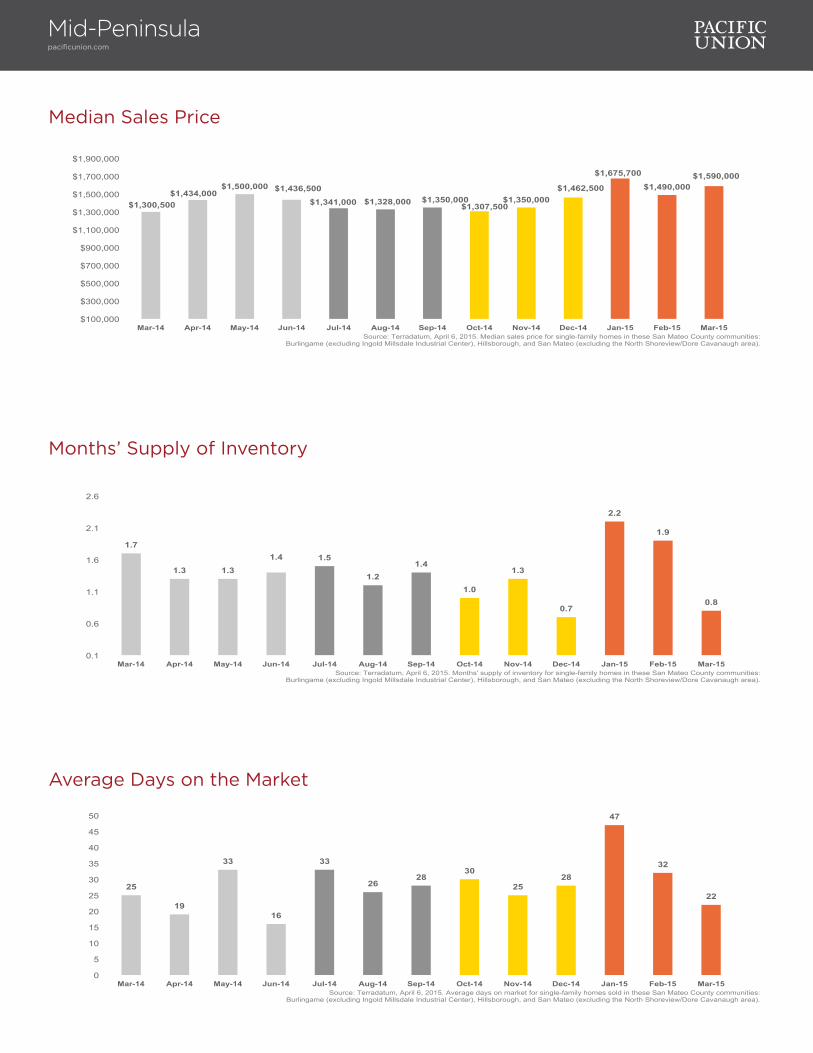
Defining the Mid-Peninsula: Our real estate markets in the Mid-Peninsula subregion include the cities of Burlingame (excluding Ingold Millsdale Industrial Center), Hillsborough, and San Mateo (excluding the North Shoreview/Dore Cavanaugh area). Sales data in the charts below includes all single-family homes in these communities.
Silicon Valleypacificunion.com
Median Sales Price
Months’ Supply of Inventory
$2,600,000 $2,466,000 $2,420,000
$2,430,000 $2,400,000 $2,450,000
$2,566,000 $2,450,000
$2,500,000 $2,399,100
$2,880,000 $2,850,000 $2,800,000
$100,000
$600,000
$1,100,000
$1,600,000
$2,100,000
$2,600,000
$3,100,000
Mar-14 Apr-14 May-14 Jun-14 Jul-14 Aug-14 Sep-14 Oct-14 Nov-14 Dec-14 Jan-15 Feb-15 Mar-15 Source: Terradatum, April 6, 2015. Median sales price for single-family homes in these Silicon Valley communities:
Atherton, Los Altos (excluding County area), Los Altos Hills, Menlo Park (excluding east of U.S. 101), Palo Alto, Portola Valley, and Woodside.
1.8 1.8 1.7
1.5 1.6 1.6
2.2
1.2 1.3
1.2
2.2
1.8
1.3
0.1
0.6
1.1
1.6
2.1
2.6
Mar-14 Apr-14 May-14 Jun-14 Jul-14 Aug-14 Sep-14 Oct-14 Nov-14 Dec-14 Jan-15 Feb-15 Mar-15 Source: Terradatum, April 6, 2015. Months' supply of inventory for single-family homes in these SIlicon Valley communities:
Atherton, Los Altos (excluding County area), Los Altos Hills, Menlo Park (excluding east of U.S. 101), Palo Alto, Portola Valley, and Woodside.
Silicon Valleypacificunion.com
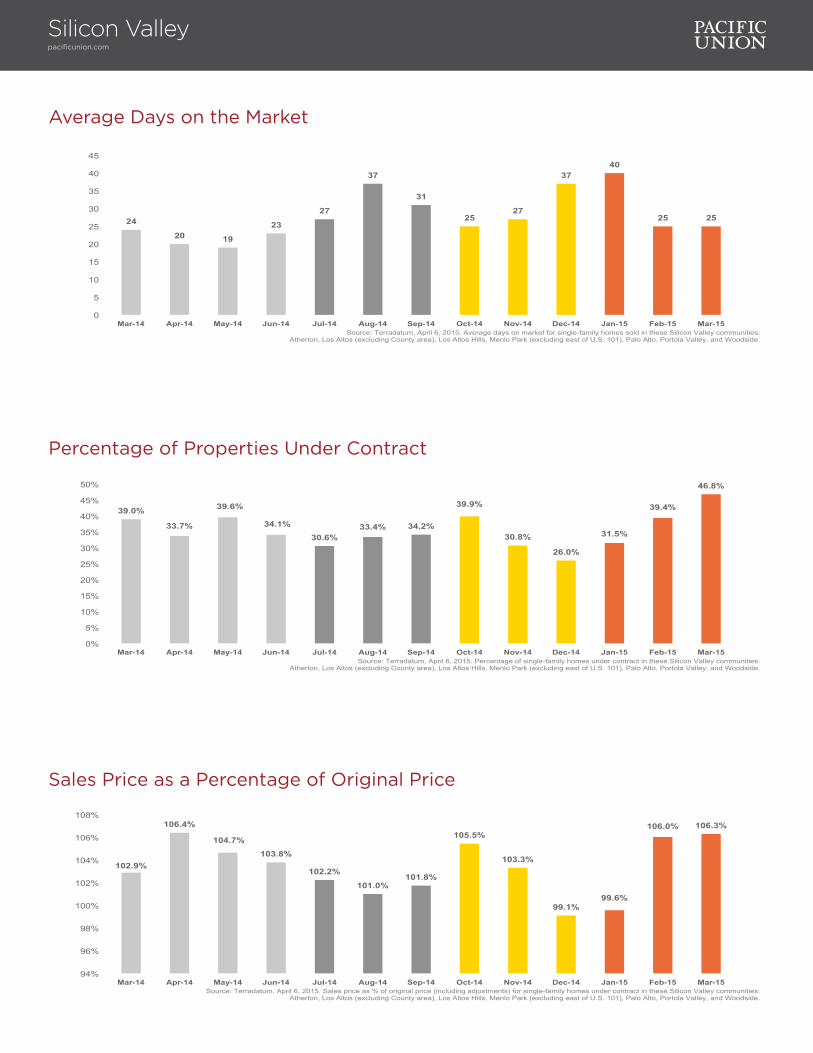
Average Days on the Market
24
20 19
23
27
37
31
25 27
37 40
25 25
0
5
10
15
20
25
30
35
40
45
Mar-14 Apr-14 May-14 Jun-14 Jul-14 Aug-14 Sep-14 Oct-14 Nov-14 Dec-14 Jan-15 Feb-15 Mar-15 Source: Terradatum, April 6, 2015. Average days on market for single-family homes sold in these Silicon Valley communities:
Atherton, Los Altos (excluding County area), Los Altos Hills, Menlo Park (excluding east of U.S. 101), Palo Alto, Portola Valley, and Woodside.
Sales Price as a Percentage of Original Price
102.9%
106.4%
104.7%
103.8%
102.2%
101.0% 101.8%
105.5%
103.3%
99.1% 99.6%
106.0% 106.3%
94%
96%
98%
100%
102%
104%
106%
108%
Mar-14 Apr-14 May-14 Jun-14 Jul-14 Aug-14 Sep-14 Oct-14 Nov-14 Dec-14 Jan-15 Feb-15 Mar-15 Source: Terradatum, April 6, 2015. Sales price as % of original price (including adjustments) for single-family homes under contract in these Silicon Valley communities:
Atherton, Los Altos (excluding County area), Los Altos Hills, Menlo Park (excluding east of U.S. 101), Palo Alto, Portola Valley, and Woodside.
Percentage of Properties Under Contract
39.0%
33.7%
39.6%
34.1%
30.6% 33.4% 34.2%
39.9%
30.8%
26.0%
31.5%
39.4%
46.8%
0%
5%
10%
15%
20%
25%
30%
35%
40%
45%
50%
Mar-14 Apr-14 May-14 Jun-14 Jul-14 Aug-14 Sep-14 Oct-14 Nov-14 Dec-14 Jan-15 Feb-15 Mar-15 Source: Terradatum, April 6, 2015. Percentage of single-family homes under contract in these Silicon Valley communities:
Atherton, Los Altos (excluding County area), Los Altos Hills, Menlo Park (excluding east of U.S. 101), Palo Alto, Portola Valley, and Woodside.
Silicon Valleypacificunion.com
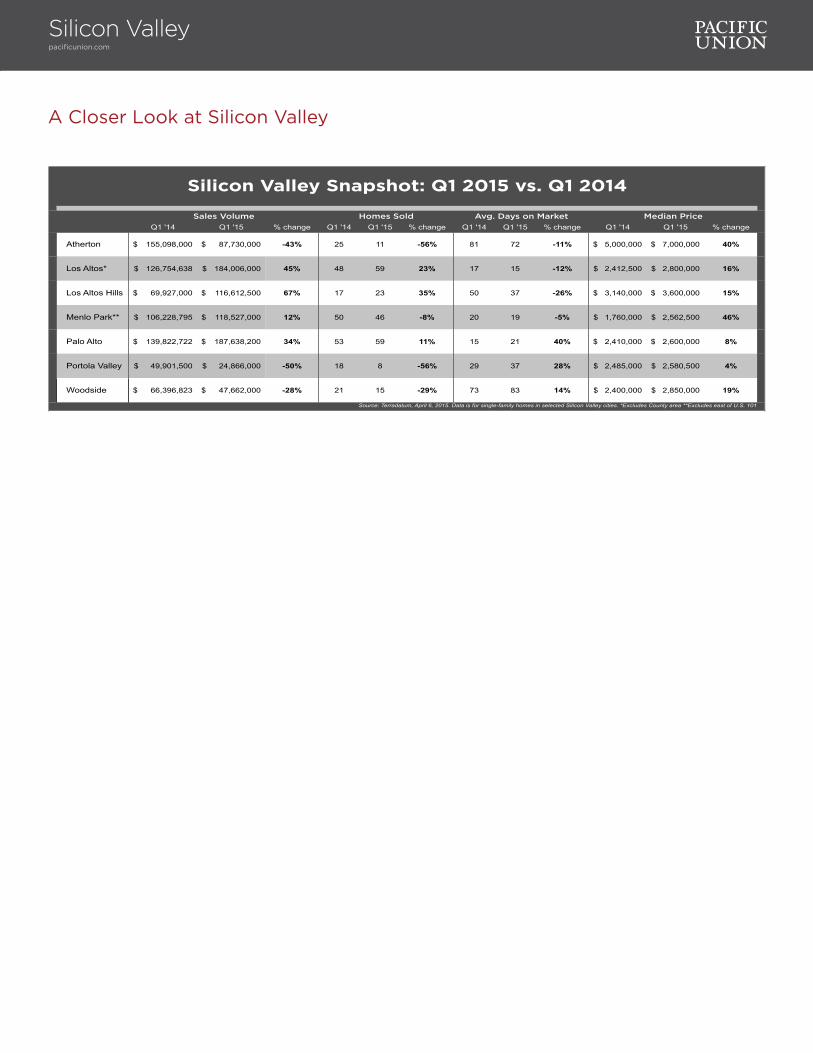
A Closer Look at Silicon Valley
Q1 '14 Q1 '15 % change Q1 '14 Q1 '15 % change Q1 '14 Q1 '15 % change Q1 '14 Q1 '15 % change
Atherton 155,098,000$ 87,730,000$ -43% 25 11 -56% 81 72 -11% 5,000,000$ 7,000,000$ 40%
Los Altos* 126,754,638$ 184,006,000$ 45% 48 59 23% 17 15 -12% 2,412,500$ 2,800,000$ 16%
Los Altos Hills 69,927,000$ 116,612,500$ 67% 17 23 35% 50 37 -26% 3,140,000$ 3,600,000$ 15%
Menlo Park** 106,228,795$ 118,527,000$ 12% 50 46 -8% 20 19 -5% 1,760,000$ 2,562,500$ 46%
Palo Alto 139,822,722$ 187,638,200$ 34% 53 59 11% 15 21 40% 2,410,000$ 2,600,000$ 8%
Portola Valley 49,901,500$ 24,866,000$ -50% 18 8 -56% 29 37 28% 2,485,000$ 2,580,500$ 4%
Woodside 66,396,823$ 47,662,000$ -28% 21 15 -29% 73 83 14% 2,400,000$ 2,850,000$ 19%
Source: Terradatum, April 6, 2015. Data is for single-family homes in selected Silicon Valley cities. *Excludes County area **Excludes east of U.S. 101
Silicon Valley Snapshot: Q1 2015 vs. Q1 2014
Sales Volume Homes Sold Avg. Days on Market Median Price
Mid-Peninsulapacificunion.com
Median Sales Price
$1,300,500 $1,434,000
$1,500,000 $1,436,500
$1,341,000 $1,328,000 $1,350,000 $1,307,500
$1,350,000 $1,462,500
$1,675,700
$1,490,000 $1,590,000
$100,000
$300,000
$500,000
$700,000
$900,000
$1,100,000
$1,300,000
$1,500,000
$1,700,000
$1,900,000
Mar-14 Apr-14 May-14 Jun-14 Jul-14 Aug-14 Sep-14 Oct-14 Nov-14 Dec-14 Jan-15 Feb-15 Mar-15 Source: Terradatum, April 6, 2015. Median sales price for single-family homes in these San Mateo County communities:
Burlingame (excluding Ingold Millsdale Industrial Center), Hillsborough, and San Mateo (excluding the North Shoreview/Dore Cavanaugh area).
Average Days on the Market
25
19
33
16
33
26 28
30
25 28
47
32
22
0
5
10
15
20
25
30
35
40
45
50
Mar-14 Apr-14 May-14 Jun-14 Jul-14 Aug-14 Sep-14 Oct-14 Nov-14 Dec-14 Jan-15 Feb-15 Mar-15 Source: Terradatum, April 6, 2015. Average days on market for single-family homes sold in these San Mateo County communities:
Burlingame (excluding Ingold Millsdale Industrial Center), Hillsborough, and San Mateo (excluding the North Shoreview/Dore Cavanaugh area).
Months’ Supply of Inventory
1.7
1.3 1.3 1.4 1.5
1.2 1.4
1.0
1.3
0.7
2.2
1.9
0.8
0.1
0.6
1.1
1.6
2.1
2.6
Mar-14 Apr-14 May-14 Jun-14 Jul-14 Aug-14 Sep-14 Oct-14 Nov-14 Dec-14 Jan-15 Feb-15 Mar-15 Source: Terradatum, April 6, 2015. Months' supply of inventory for single-family homes in these San Mateo County communities:
Burlingame (excluding Ingold Millsdale Industrial Center), Hillsborough, and San Mateo (excluding the North Shoreview/Dore Cavanaugh area).
Mid-Peninsulapacificunion.com
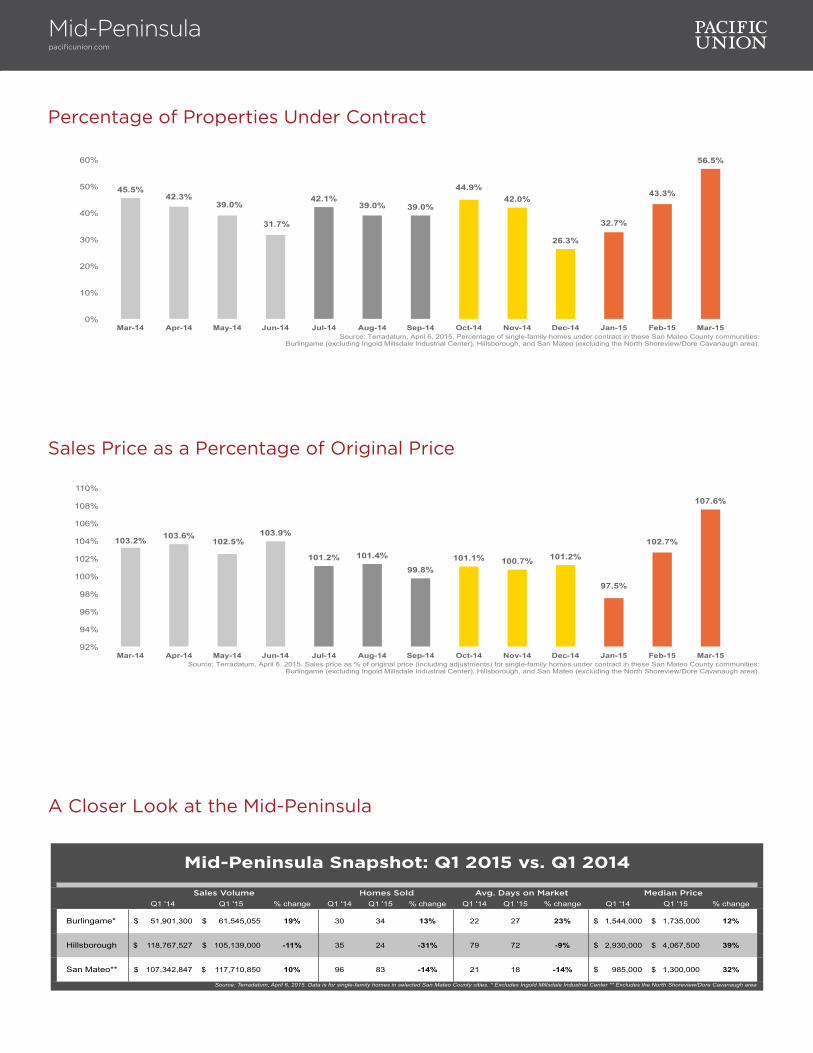
Percentage of Properties Under Contract
45.5% 42.3%
39.0%
31.7%
42.1% 39.0% 39.0%
44.9% 42.0%
26.3%
32.7%
43.3%
56.5%
0%
10%
20%
30%
40%
50%
60%
Mar-14 Apr-14 May-14 Jun-14 Jul-14 Aug-14 Sep-14 Oct-14 Nov-14 Dec-14 Jan-15 Feb-15 Mar-15 Source: Terradatum, April 6, 2015. Percentage of single-family homes under contract in these San Mateo County communities:
Burlingame (excluding Ingold Millsdale Industrial Center), Hillsborough, and San Mateo (excluding the North Shoreview/Dore Cavanaugh area).
A Closer Look at the Mid-Peninsula
Q1 '14 Q1 '15 % change Q1 '14 Q1 '15 % change Q1 '14 Q1 '15 % change Q1 '14 Q1 '15 % change
Burlingame* 51,901,300$ 61,545,055$ 19% 30 34 13% 22 27 23% 1,544,000$ 1,735,000$ 12%
Hillsborough 118,767,527$ 105,139,000$ -11% 35 24 -31% 79 72 -9% 2,930,000$ 4,067,500$ 39%
San Mateo** 107,342,847$ 117,710,850$ 10% 96 83 -14% 21 18 -14% 985,000$ 1,300,000$ 32%
Source: Terradatum, April 6, 2015. Data is for single-family homes in selected San Mateo County cities. * Excludes Ingold Millsdale Industrial Center ** Excludes the North Shoreview/Dore Cavanaugh area
Mid-Peninsula Snapshot: Q1 2015 vs. Q1 2014
Sales Volume Homes Sold Avg. Days on Market Median Price
Sales Price as a Percentage of Original Price
103.2% 103.6% 102.5%
103.9%
101.2% 101.4%
99.8% 101.1% 100.7% 101.2%
97.5%
102.7%
107.6%
92%
94%
96%
98%
100%
102%
104%
106%
108%
110%
Mar-14 Apr-14 May-14 Jun-14 Jul-14 Aug-14 Sep-14 Oct-14 Nov-14 Dec-14 Jan-15 Feb-15 Mar-15 Source: Terradatum, April 6, 2015. Sales price as % of original price (including adjustments) for single-family homes under contract in these San Mateo County communities:
Burlingame (excluding Ingold Millsdale Industrial Center), Hillsborough, and San Mateo (excluding the North Shoreview/Dore Cavanaugh area).
Rick LawsSenior Vice President, Sonoma [email protected] Mendocino Avenue, Suite 210 | Santa Rosa, CA 95403
Sonoma CountyQuarterly Real Estate ReportQ1 2015
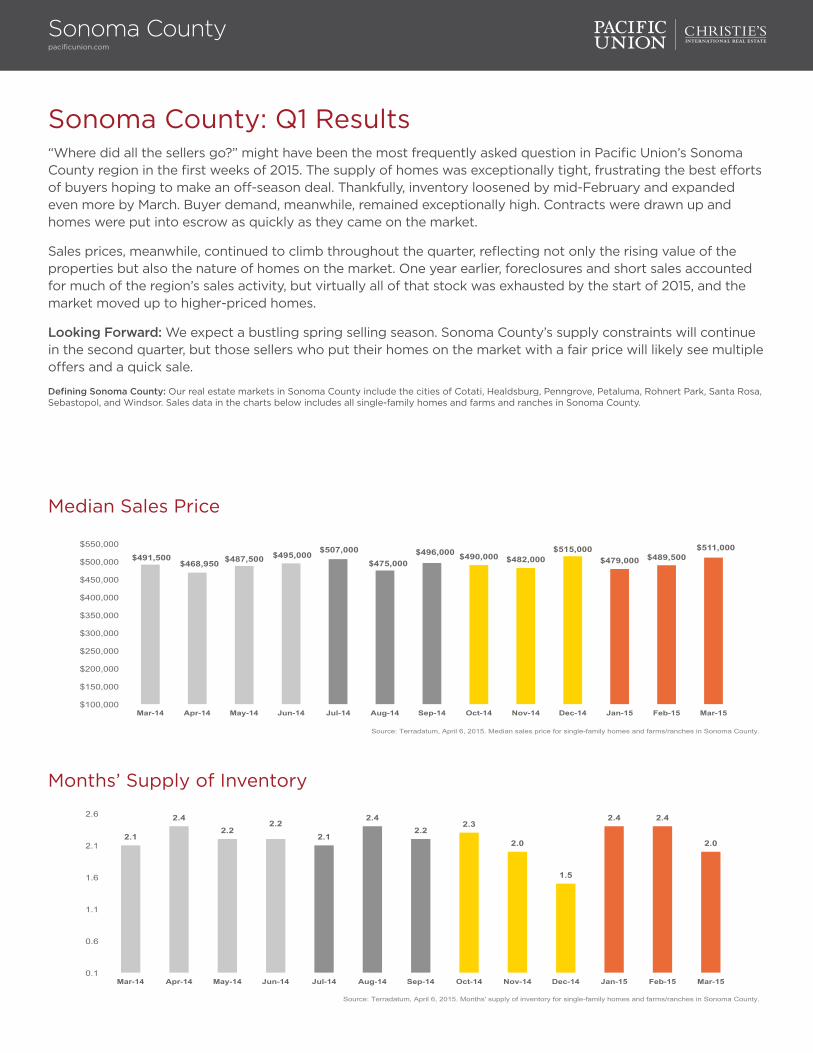
Sonoma County: Q1 Results“Where did all the sellers go?” might have been the most frequently asked question in Pacific Union’s Sonoma County region in the first weeks of 2015. The supply of homes was exceptionally tight, frustrating the best efforts of buyers hoping to make an off-season deal. Thankfully, inventory loosened by mid-February and expanded even more by March. Buyer demand, meanwhile, remained exceptionally high. Contracts were drawn up and homes were put into escrow as quickly as they came on the market.
Sales prices, meanwhile, continued to climb throughout the quarter, reflecting not only the rising value of the properties but also the nature of homes on the market. One year earlier, foreclosures and short sales accounted for much of the region’s sales activity, but virtually all of that stock was exhausted by the start of 2015, and the market moved up to higher-priced homes.
Looking Forward: We expect a bustling spring selling season. Sonoma County’s supply constraints will continue in the second quarter, but those sellers who put their homes on the market with a fair price will likely see multiple offers and a quick sale.
Defining Sonoma County: Our real estate markets in Sonoma County include the cities of Cotati, Healdsburg, Penngrove, Petaluma, Rohnert Park, Santa Rosa, Sebastopol, and Windsor. Sales data in the charts below includes all single-family homes and farms and ranches in Sonoma County.
Sonoma Countypacificunion.com
Median Sales Price
Months’ Supply of Inventory
$491,500 $468,950 $487,500 $495,000 $507,000
$475,000 $496,000 $490,000 $482,000
$515,000 $479,000 $489,500
$511,000
$100,000
$150,000
$200,000
$250,000
$300,000
$350,000
$400,000
$450,000
$500,000
$550,000
Mar-14 Apr-14 May-14 Jun-14 Jul-14 Aug-14 Sep-14 Oct-14 Nov-14 Dec-14 Jan-15 Feb-15 Mar-15
Source: Terradatum, April 6, 2015. Median sales price for single-family homes and farms/ranches in Sonoma County.
2.1
2.4 2.2
2.2 2.1
2.4 2.2
2.3
2.0
1.5
2.4 2.4
2.0
0.1
0.6
1.1
1.6
2.1
2.6
Mar-14 Apr-14 May-14 Jun-14 Jul-14 Aug-14 Sep-14 Oct-14 Nov-14 Dec-14 Jan-15 Feb-15 Mar-15
Source: Terradatum, April 6, 2015. Months' supply of inventory for single-family homes and farms/ranches in Sonoma County.
Sonoma Countypacificunion.com
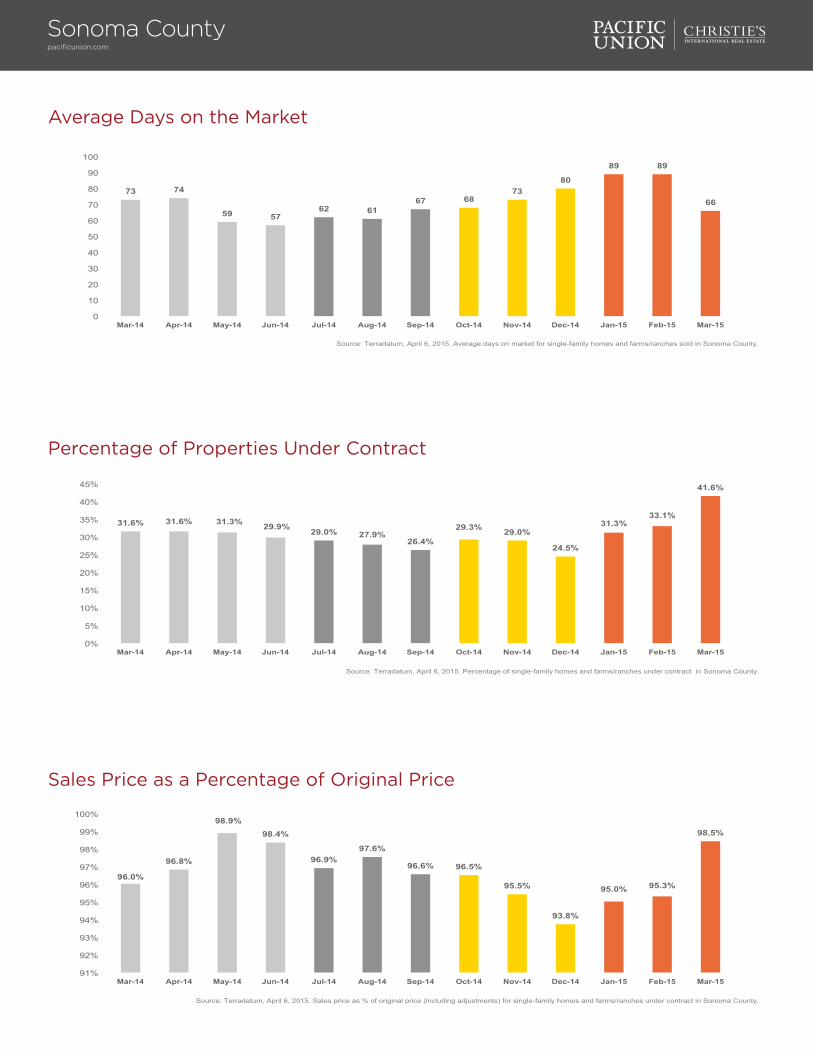
Average Days on the Market
73 74
59 57 62 61
67 68 73
80
89 89
66
0
10
20
30
40
50
60
70
80
90
100
Mar-14 Apr-14 May-14 Jun-14 Jul-14 Aug-14 Sep-14 Oct-14 Nov-14 Dec-14 Jan-15 Feb-15 Mar-15
Source: Terradatum, April 6, 2015. Average days on market for single-family homes and farms/ranches sold in Sonoma County.
Sales Price as a Percentage of Original Price
96.0%
96.8%
98.9% 98.4%
96.9% 97.6%
96.6% 96.5%
95.5%
93.8%
95.0% 95.3%
98.5%
91%
92%
93%
94%
95%
96%
97%
98%
99%
100%
Mar-14 Apr-14 May-14 Jun-14 Jul-14 Aug-14 Sep-14 Oct-14 Nov-14 Dec-14 Jan-15 Feb-15 Mar-15
Source: Terradatum, April 6, 2015. Sales price as % of original price (including adjustments) for single-family homes and farms/ranches under contract in Sonoma County.
Percentage of Properties Under Contract
31.6% 31.6% 31.3% 29.9% 29.0% 27.9% 26.4%
29.3% 29.0%
24.5%
31.3% 33.1%
41.6%
0%
5%
10%
15%
20%
25%
30%
35%
40%
45%
Mar-14 Apr-14 May-14 Jun-14 Jul-14 Aug-14 Sep-14 Oct-14 Nov-14 Dec-14 Jan-15 Feb-15 Mar-15
Source: Terradatum, April 6, 2015. Percentage of single-family homes and farms/ranches under contract in Sonoma County.
A Closer Look at Sonoma County
Q1 '14 Q1 '15 % change Q1 '14 Q1 '15 % change Q1 '14 Q1 '15 % change Q1 '14 Q1 '15 % change
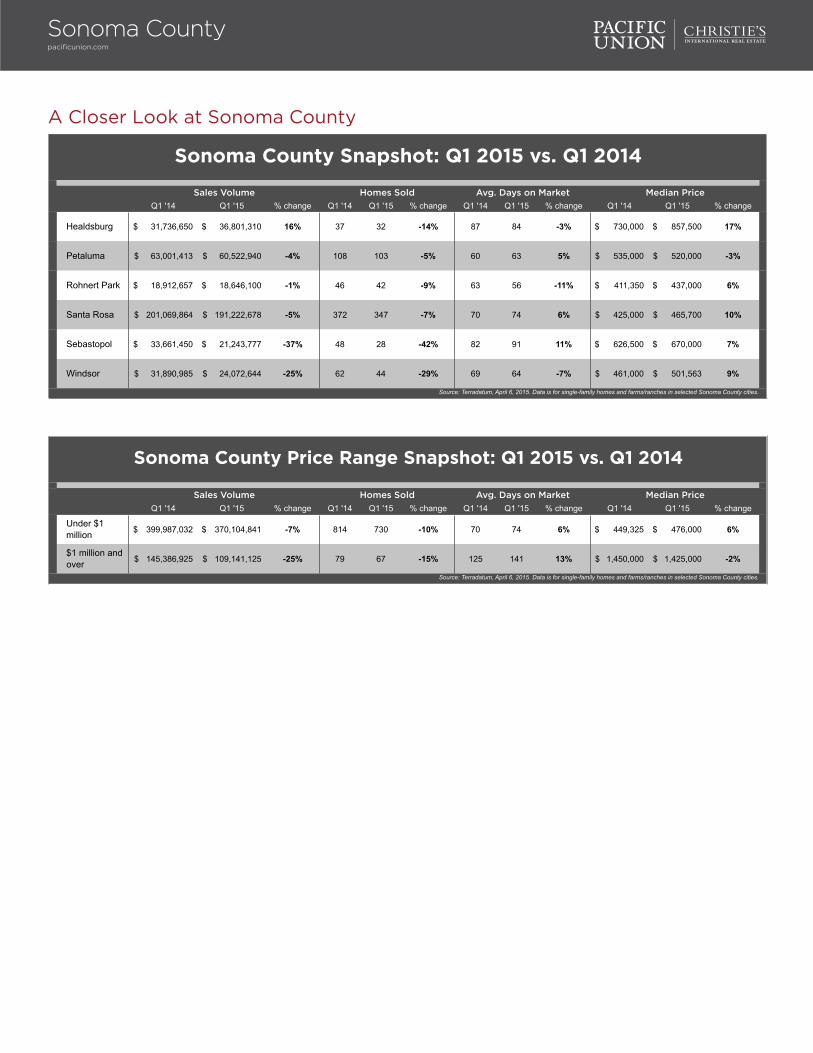
Healdsburg 31,736,650$ 36,801,310$ 16% 37 32 -14% 87 84 -3% 730,000$ 857,500$ 17%
Petaluma 63,001,413$ 60,522,940$ -4% 108 103 -5% 60 63 5% 535,000$ 520,000$ -3%
Rohnert Park 18,912,657$ 18,646,100$ -1% 46 42 -9% 63 56 -11% 411,350$ 437,000$ 6%
Santa Rosa 201,069,864$ 191,222,678$ -5% 372 347 -7% 70 74 6% 425,000$ 465,700$ 10%
Sebastopol 33,661,450$ 21,243,777$ -37% 48 28 -42% 82 91 11% 626,500$ 670,000$ 7%
Windsor 31,890,985$ 24,072,644$ -25% 62 44 -29% 69 64 -7% 461,000$ 501,563$ 9%
Source: Terradatum, April 6, 2015. Data is for single-family homes and farms/ranches in selected Sonoma County cities.
Sonoma County Snapshot: Q1 2015 vs. Q1 2014
Sales Volume Homes Sold Avg. Days on Market Median Price
Q1 '14 Q1 '15 % change Q1 '14 Q1 '15 % change Q1 '14 Q1 '15 % change Q1 '14 Q1 '15 % change
Under $1 million 399,987,032$ 370,104,841$ -7% 814 730 -10% 70 74 6% 449,325$ 476,000$ 6%
$1 million and over 145,386,925$ 109,141,125$ -25% 79 67 -15% 125 141 13% 1,450,000$ 1,425,000$ -2%
Source: Terradatum, April 6, 2015. Data is for single-family homes and farms/ranches in selected Sonoma County cities.
Sonoma County Price Range Snapshot: Q1 2015 vs. Q1 2014
Sales Volume Homes Sold Avg. Days on Market Median Price
Sonoma Countypacificunion.com
Jill SilvasRegional Executive, Sonoma [email protected] West Napa Street, Suite 200 | Sonoma, CA 95476
Sonoma ValleyQuarterly Real Estate ReportQ1 2015
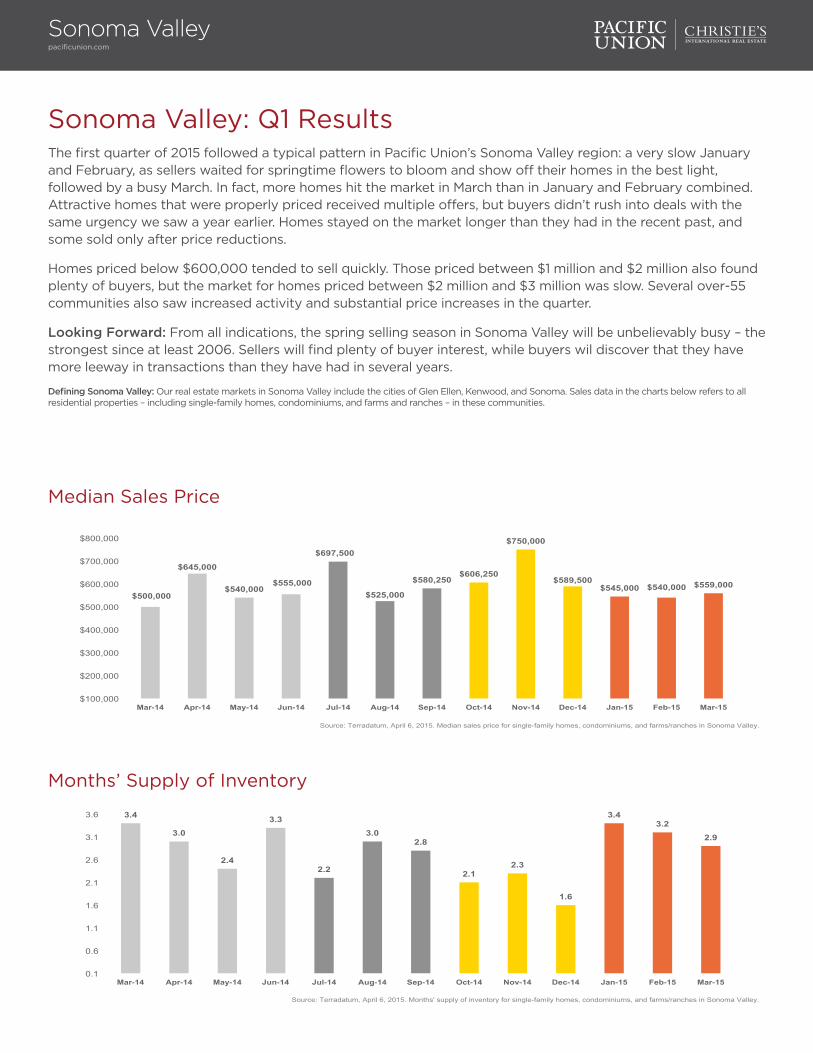
Sonoma Valley: Q1 ResultsThe first quarter of 2015 followed a typical pattern in Pacific Union’s Sonoma Valley region: a very slow January and February, as sellers waited for springtime flowers to bloom and show off their homes in the best light, followed by a busy March. In fact, more homes hit the market in March than in January and February combined. Attractive homes that were properly priced received multiple offers, but buyers didn’t rush into deals with the same urgency we saw a year earlier. Homes stayed on the market longer than they had in the recent past, and some sold only after price reductions.
Homes priced below $600,000 tended to sell quickly. Those priced between $1 million and $2 million also found plenty of buyers, but the market for homes priced between $2 million and $3 million was slow. Several over-55 communities also saw increased activity and substantial price increases in the quarter.
Looking Forward: From all indications, the spring selling season in Sonoma Valley will be unbelievably busy – the strongest since at least 2006. Sellers will find plenty of buyer interest, while buyers wil discover that they have more leeway in transactions than they have had in several years.
Defining Sonoma Valley: Our real estate markets in Sonoma Valley include the cities of Glen Ellen, Kenwood, and Sonoma. Sales data in the charts below refers to all residential properties – including single-family homes, condominiums, and farms and ranches – in these communities.
Sonoma Valleypacificunion.com
Median Sales Price
Months’ Supply of Inventory
$500,000
$645,000
$540,000 $555,000
$697,500
$525,000
$580,250 $606,250
$750,000
$589,500 $545,000 $540,000 $559,000
$100,000
$200,000
$300,000
$400,000
$500,000
$600,000
$700,000
$800,000
Mar-14 Apr-14 May-14 Jun-14 Jul-14 Aug-14 Sep-14 Oct-14 Nov-14 Dec-14 Jan-15 Feb-15 Mar-15
Source: Terradatum, April 6, 2015. Median sales price for single-family homes, condominiums, and farms/ranches in Sonoma Valley.
3.4
3.0
2.4
3.3
2.2
3.0 2.8
2.1 2.3
1.6
3.4 3.2
2.9
0.1
0.6
1.1
1.6
2.1
2.6
3.1
3.6
Mar-14 Apr-14 May-14 Jun-14 Jul-14 Aug-14 Sep-14 Oct-14 Nov-14 Dec-14 Jan-15 Feb-15 Mar-15
Source: Terradatum, April 6, 2015. Months' supply of inventory for single-family homes, condominiums, and farms/ranches in Sonoma Valley.
Sonoma Valleypacificunion.com
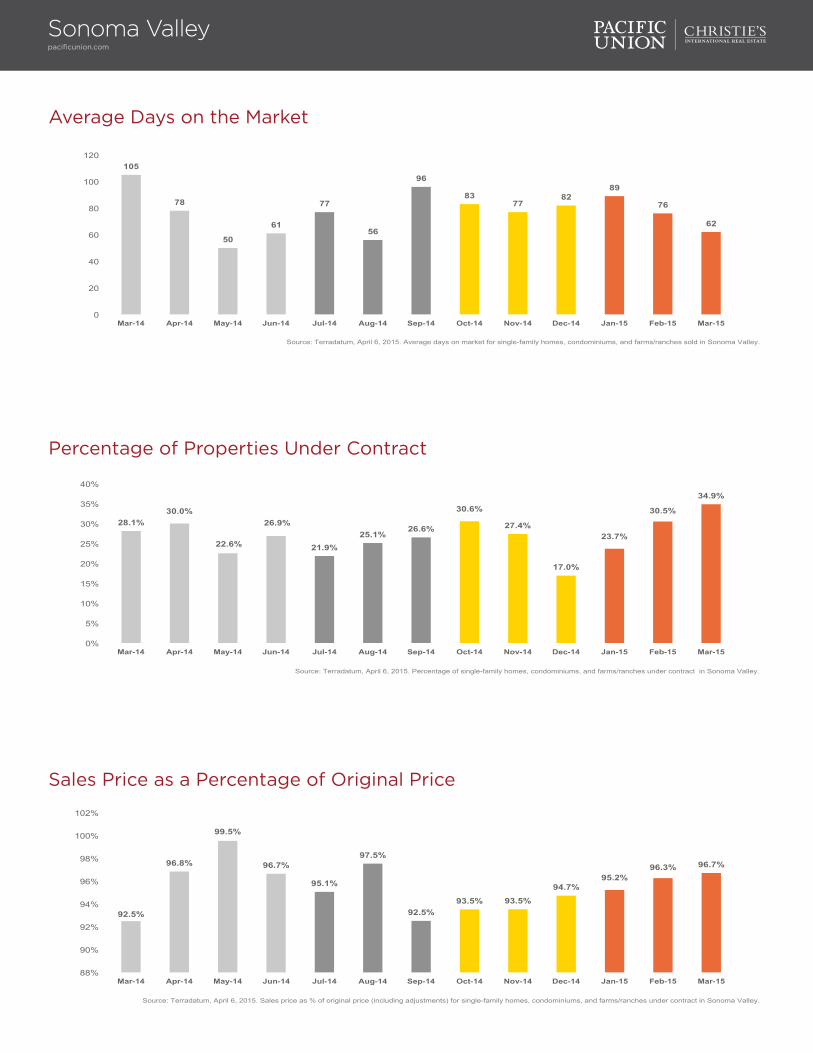
Average Days on the Market
105
78
50
61
77
56
96
83 77
82 89
76
62
0
20
40
60
80
100
120
Mar-14 Apr-14 May-14 Jun-14 Jul-14 Aug-14 Sep-14 Oct-14 Nov-14 Dec-14 Jan-15 Feb-15 Mar-15
Source: Terradatum, April 6, 2015. Average days on market for single-family homes, condominiums, and farms/ranches sold in Sonoma Valley.
Sales Price as a Percentage of Original Price
92.5%
96.8%
99.5%
96.7%
95.1%
97.5%
92.5% 93.5% 93.5%
94.7% 95.2%
96.3% 96.7%
88%
90%
92%
94%
96%
98%
100%
102%
Mar-14 Apr-14 May-14 Jun-14 Jul-14 Aug-14 Sep-14 Oct-14 Nov-14 Dec-14 Jan-15 Feb-15 Mar-15
Source: Terradatum, April 6, 2015. Sales price as % of original price (including adjustments) for single-family homes, condominiums, and farms/ranches under contract in Sonoma Valley.
Percentage of Properties Under Contract
28.1% 30.0%
22.6%
26.9%
21.9% 25.1%
26.6%
30.6%
27.4%
17.0%
23.7%
30.5%
34.9%
0%
5%
10%
15%
20%
25%
30%
35%
40%
Mar-14 Apr-14 May-14 Jun-14 Jul-14 Aug-14 Sep-14 Oct-14 Nov-14 Dec-14 Jan-15 Feb-15 Mar-15
Source: Terradatum, April 6, 2015. Percentage of single-family homes, condominiums, and farms/ranches under contract in Sonoma Valley.
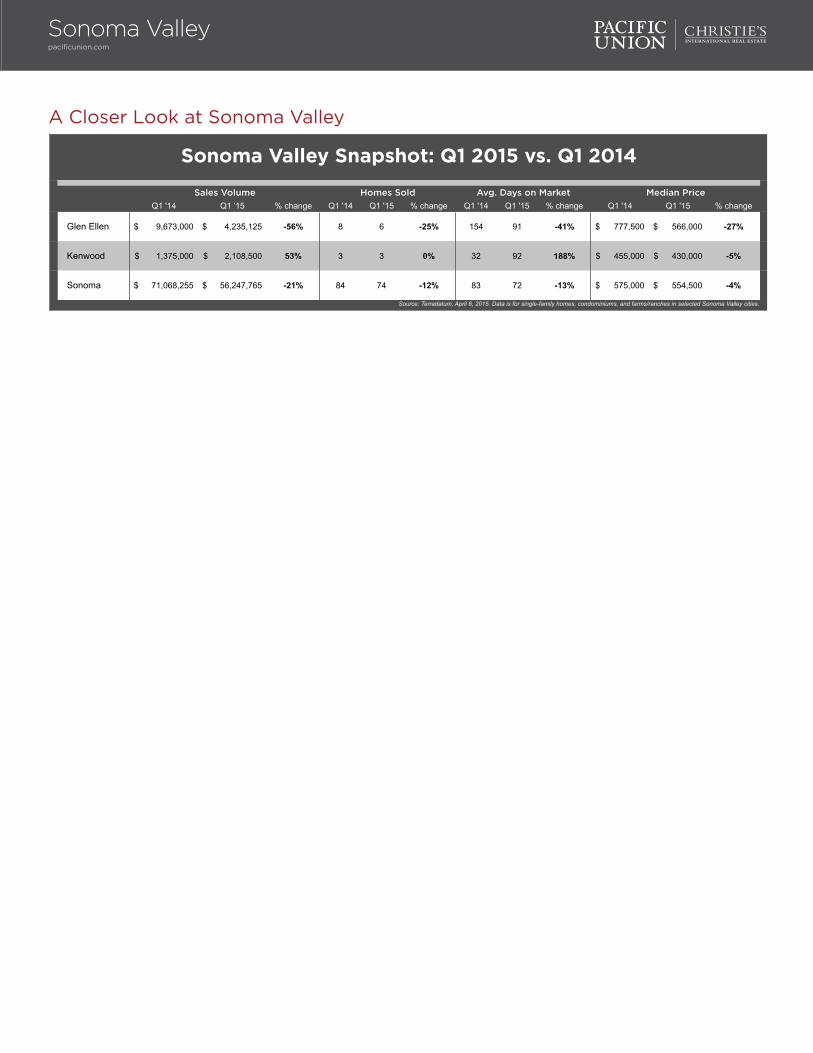
A Closer Look at Sonoma Valley
Q1 '14 Q1 '15 % change Q1 '14 Q1 '15 % change Q1 '14 Q1 '15 % change Q1 '14 Q1 '15 % change
Glen Ellen 9,673,000$ 4,235,125$ -56% 8 6 -25% 154 91 -41% 777,500$ 566,000$ -27%
Kenwood 1,375,000$ 2,108,500$ 53% 3 3 0% 32 92 188% 455,000$ 430,000$ -5%
Sonoma 71,068,255$ 56,247,765$ -21% 84 74 -12% 83 72 -13% 575,000$ 554,500$ -4%
Source: Terradatum, April 6, 2015. Data is for single-family homes, condominiums, and farms/ranches in selected Sonoma Valley cities.
Sonoma Valley Snapshot: Q1 2015 vs. Q1 2014
Sales Volume Homes Sold Avg. Days on Market Median Price
Sonoma Valleypacificunion.com

Sally GardnerRegional Executive, Tahoe/TruckeeTahoe City 530.581.1882 | Truckee 530.587.7098 | Squaw Valley [email protected]
Lake Tahoe/TruckeeQuarterly Real Estate ReportQ1 2015
Lake Tahoe/Truckee: Q1 ResultsHomebuyers typically fall in love with the Lake Tahoe/Truckee region after spending a few days at the region’s world-class winter resorts. But when a dearth of snow keeps skiers away, real estate activity slows down. That, in a nutshell, explains the first quarter of 2015. But there was also an upside to having little or no snow on the ground: Buyers didn’t have to wait until spring to fully inspect properties, and many sellers were flexible in pricing and eager to make a deal.
Homes that were priced fairly and in sought-after neighborhoods saw the most activity during the quarter, and the strongest sales were for those priced less than $1 million. The inventory of available homes and condominiums remained strong, giving buyers a wide selection to choose from.
Looking Forward: Droughts are cyclical in California, and snow will return to the Sierra Nevadas. In the meantime, the spring and summer months in the Lake Tahoe/Truckee region offer Bay Area residents unrivaled outdoor activities. Buyers looking for vacation homes will find an ample supply, along with receptive sellers. Altogether, we expect a busy spring and summer season. Looking ahead, recently announced plans to build a gondola line connecting the Squaw Valley and Alpine Meadows resorts will be welcomed by residents and winter visitors alike.
Defining Lake Tahoe/Truckee: Our real estate markets in Tahoe/Truckee include the communities of Alpine Meadows, Donner Lake, Donner Summit, Lahontan, Martis Valley, North Shore Lake Tahoe, Northstar, Squaw Valley, Tahoe City, Tahoe Donner, Truckee, and the West Shore of Lake Tahoe. Sales data in the charts below includes single-family homes and condominiums in these communities.
Lake Tahoe/Truckeepacificunion.com
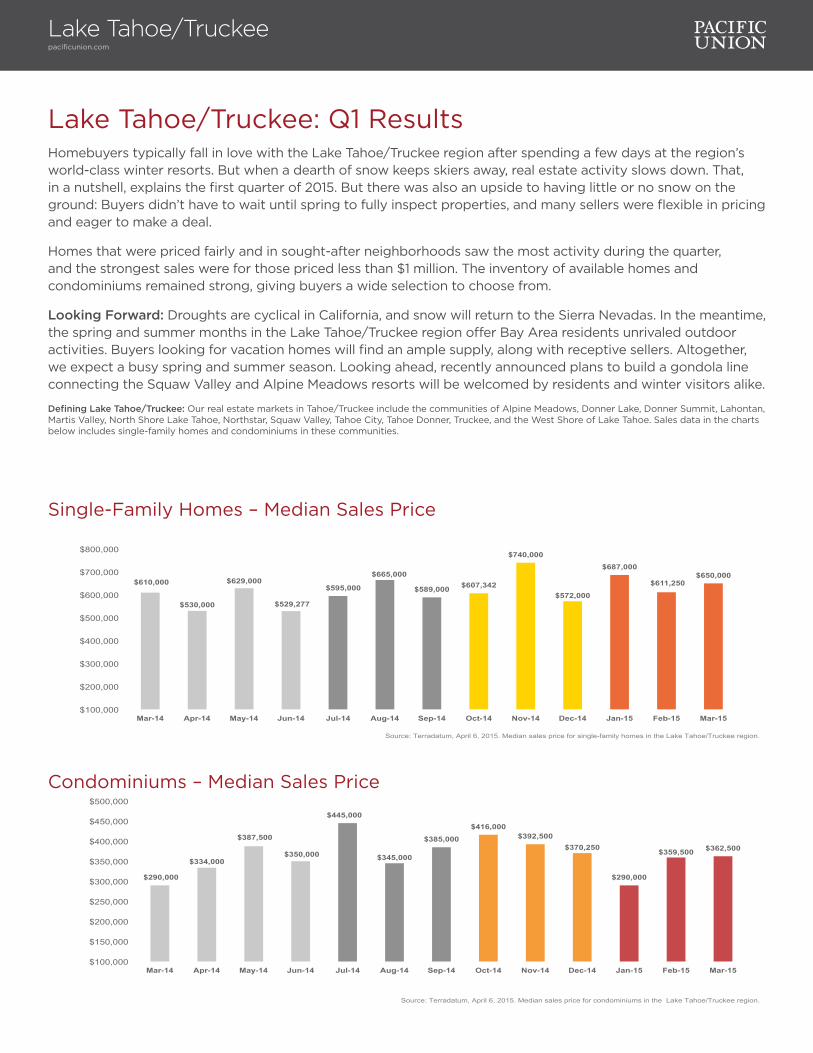
Single-Family Homes – Median Sales Price
Condominiums – Median Sales Price
$610,000
$530,000
$629,000
$529,277
$595,000
$665,000
$589,000 $607,342
$740,000
$572,000
$687,000
$611,250 $650,000
$100,000
$200,000
$300,000
$400,000
$500,000
$600,000
$700,000
$800,000
Mar-14 Apr-14 May-14 Jun-14 Jul-14 Aug-14 Sep-14 Oct-14 Nov-14 Dec-14 Jan-15 Feb-15 Mar-15
Source: Terradatum, April 6, 2015. Median sales price for single-family homes in the Lake Tahoe/Truckee region.
$290,000
$334,000
$387,500
$350,000
$445,000
$345,000
$385,000
$416,000 $392,500
$370,250
$290,000
$359,500 $362,500
$100,000
$150,000
$200,000
$250,000
$300,000
$350,000
$400,000
$450,000
$500,000
Mar-14 Apr-14 May-14 Jun-14 Jul-14 Aug-14 Sep-14 Oct-14 Nov-14 Dec-14 Jan-15 Feb-15 Mar-15
Source: Terradatum, April 6, 2015. Median sales price for condominiums in the Lake Tahoe/Truckee region.
Lake Tahoe/Truckeepacificunion.com
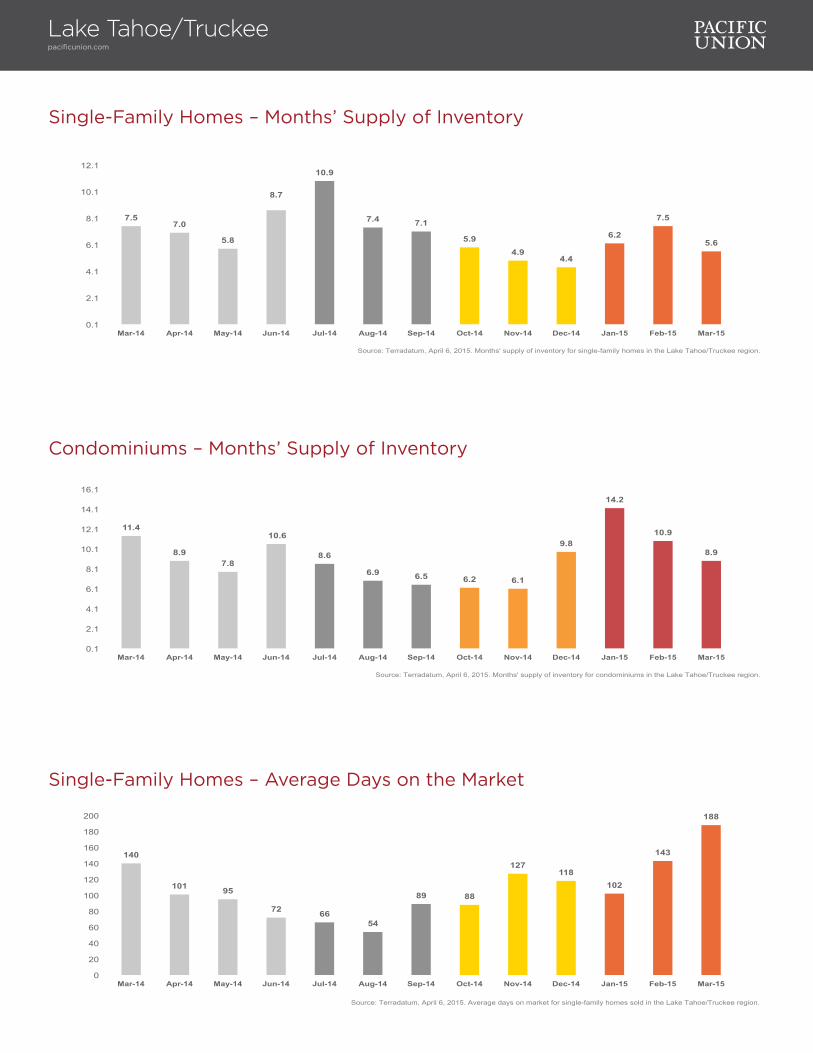
Single-Family Homes – Months’ Supply of Inventory
7.5 7.0
5.8
8.7
10.9
7.4 7.1
5.9 4.9
4.4
6.2
7.5
5.6
0.1
2.1
4.1
6.1
8.1
10.1
12.1
Mar-14 Apr-14 May-14 Jun-14 Jul-14 Aug-14 Sep-14 Oct-14 Nov-14 Dec-14 Jan-15 Feb-15 Mar-15
Source: Terradatum, April 6, 2015. Months' supply of inventory for single-family homes in the Lake Tahoe/Truckee region.
Single-Family Homes – Average Days on the Market
140
101 95
72 66 54
89 88
127 118
102
143
188
0
20
40
60
80
100
120
140
160
180
200
Mar-14 Apr-14 May-14 Jun-14 Jul-14 Aug-14 Sep-14 Oct-14 Nov-14 Dec-14 Jan-15 Feb-15 Mar-15
Source: Terradatum, April 6, 2015. Average days on market for single-family homes sold in the Lake Tahoe/Truckee region.
Condominiums – Months’ Supply of Inventory
11.4
8.9 7.8
10.6
8.6
6.9 6.5 6.2 6.1
9.8
14.2
10.9
8.9
0.1
2.1
4.1
6.1
8.1
10.1
12.1
14.1
16.1
Mar-14 Apr-14 May-14 Jun-14 Jul-14 Aug-14 Sep-14 Oct-14 Nov-14 Dec-14 Jan-15 Feb-15 Mar-15
Source: Terradatum, April 6, 2015. Months' supply of inventory for condominiums in the Lake Tahoe/Truckee region.
Lake Tahoe/Truckeepacificunion.com
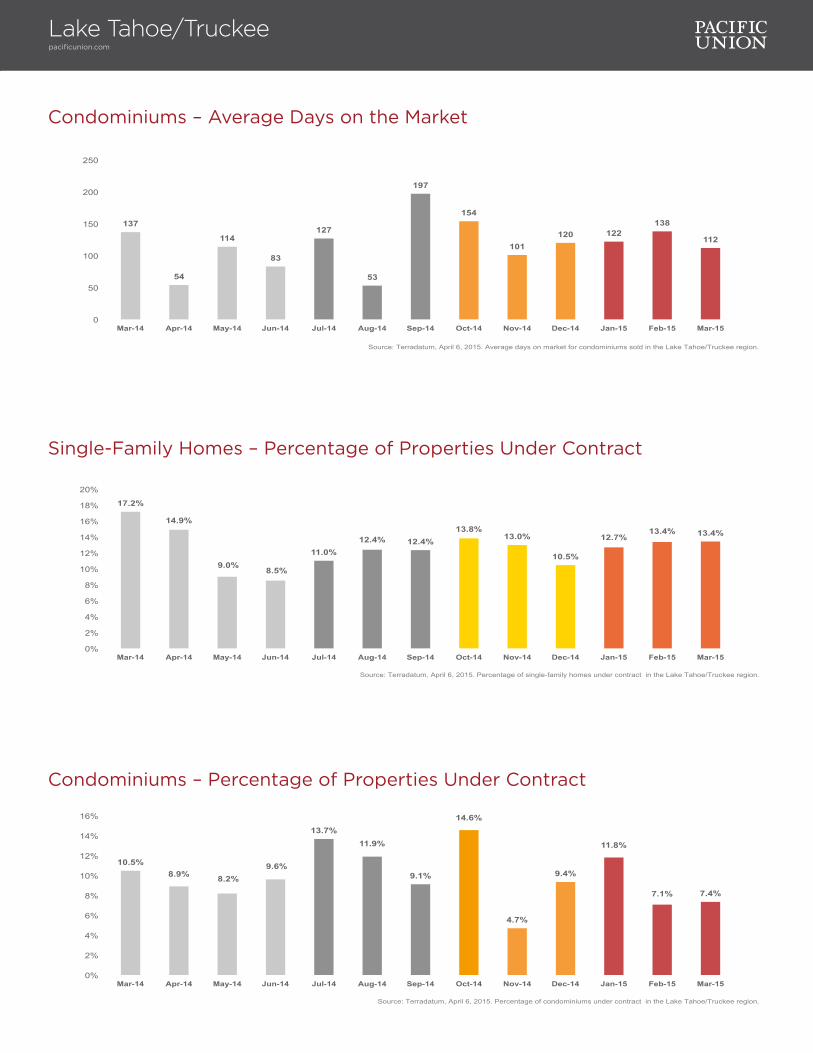
Condominiums – Average Days on the Market
137
54
114
83
127
53
197
154
101 120 122
138
112
0
50
100
150
200
250
Mar-14 Apr-14 May-14 Jun-14 Jul-14 Aug-14 Sep-14 Oct-14 Nov-14 Dec-14 Jan-15 Feb-15 Mar-15
Source: Terradatum, April 6, 2015. Average days on market for condominiums sold in the Lake Tahoe/Truckee region.
Condominiums – Percentage of Properties Under Contract
10.5% 8.9% 8.2%
9.6%
13.7% 11.9%
9.1%
14.6%
4.7%
9.4%
11.8%
7.1% 7.4%
0%
2%
4%
6%
8%
10%
12%
14%
16%
Mar-14 Apr-14 May-14 Jun-14 Jul-14 Aug-14 Sep-14 Oct-14 Nov-14 Dec-14 Jan-15 Feb-15 Mar-15
Source: Terradatum, April 6, 2015. Percentage of condominiums under contract in the Lake Tahoe/Truckee region.
Single-Family Homes – Percentage of Properties Under Contract
17.2%
14.9%
9.0% 8.5%
11.0% 12.4% 12.4%
13.8% 13.0%
10.5%
12.7% 13.4% 13.4%
0%
2%
4%
6%
8%
10%
12%
14%
16%
18%
20%
Mar-14 Apr-14 May-14 Jun-14 Jul-14 Aug-14 Sep-14 Oct-14 Nov-14 Dec-14 Jan-15 Feb-15 Mar-15
Source: Terradatum, April 6, 2015. Percentage of single-family homes under contract in the Lake Tahoe/Truckee region.
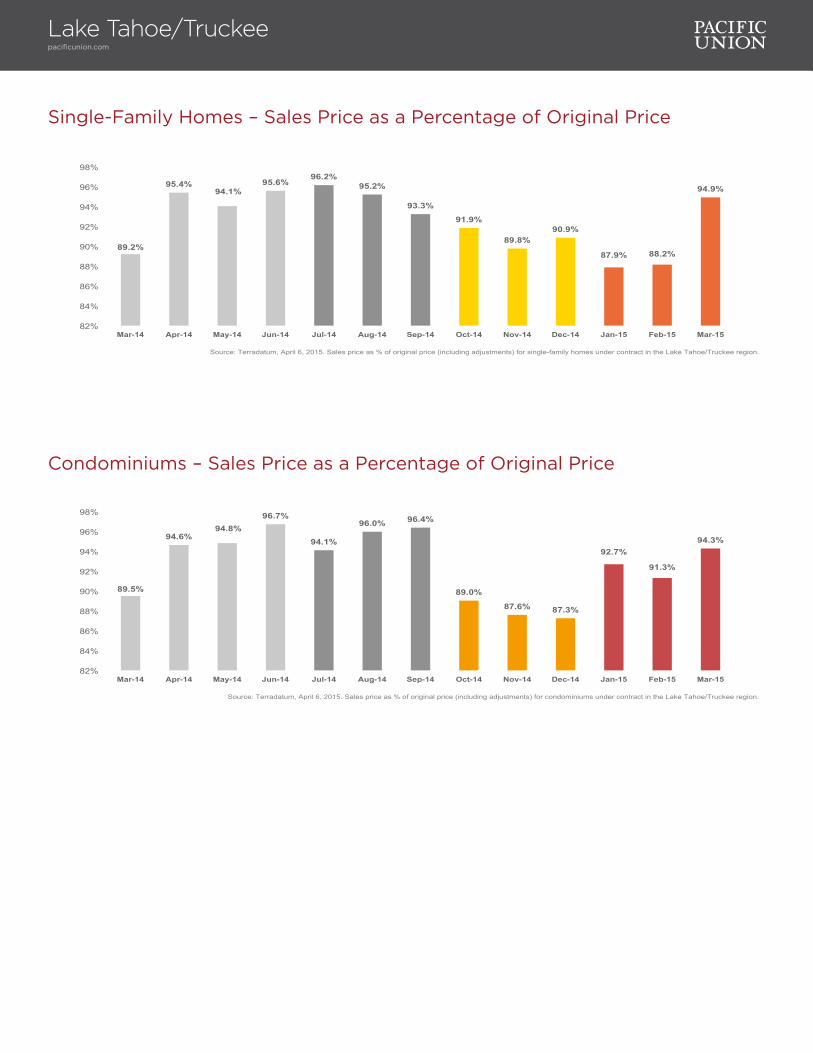
Single-Family Homes – Sales Price as a Percentage of Original Price
89.2%
95.4% 94.1%
95.6% 96.2%
95.2%
93.3%
91.9%
89.8% 90.9%
87.9% 88.2%
94.9%
82%
84%
86%
88%
90%
92%
94%
96%
98%
Mar-14 Apr-14 May-14 Jun-14 Jul-14 Aug-14 Sep-14 Oct-14 Nov-14 Dec-14 Jan-15 Feb-15 Mar-15
Source: Terradatum, April 6, 2015. Sales price as % of original price (including adjustments) for single-family homes under contract in the Lake Tahoe/Truckee region.
Condominiums – Sales Price as a Percentage of Original Price
89.5%
94.6% 94.8%
96.7%
94.1%
96.0% 96.4%
89.0%
87.6% 87.3%
92.7%
91.3%
94.3%
82%
84%
86%
88%
90%
92%
94%
96%
98%
Mar-14 Apr-14 May-14 Jun-14 Jul-14 Aug-14 Sep-14 Oct-14 Nov-14 Dec-14 Jan-15 Feb-15 Mar-15
Source: Terradatum, April 6, 2015. Sales price as % of original price (including adjustments) for condominiums under contract in the Lake Tahoe/Truckee region.
Lake Tahoe/Truckeepacificunion.com
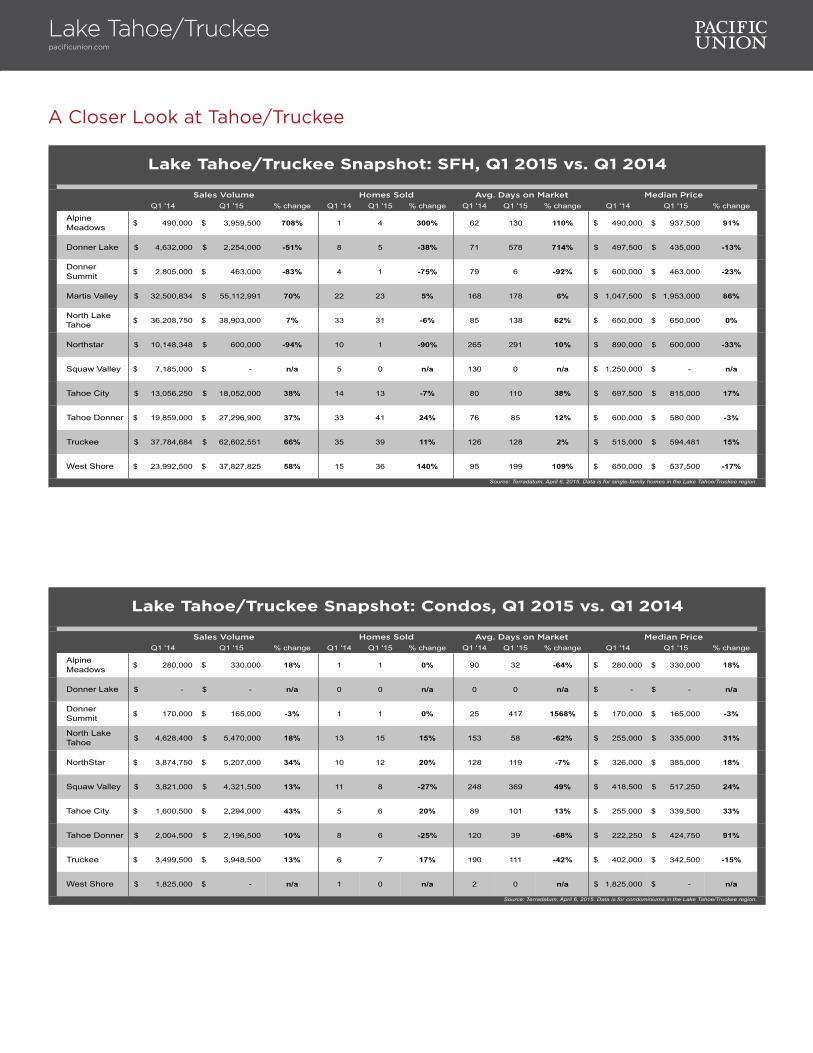
A Closer Look at Tahoe/Truckee
Q1 '14 Q1 '15 % change Q1 '14 Q1 '15 % change Q1 '14 Q1 '15 % change Q1 '14 Q1 '15 % change
Alpine Meadows 490,000$ 3,959,500$ 708% 1 4 300% 62 130 110% 490,000$ 937,500$ 91%
Donner Lake 4,632,000$ 2,254,000$ -51% 8 5 -38% 71 578 714% 497,500$ 435,000$ -13%
Donner Summit 2,805,000$ 463,000$ -83% 4 1 -75% 79 6 -92% 600,000$ 463,000$ -23%
Martis Valley 32,500,834$ 55,112,991$ 70% 22 23 5% 168 178 6% 1,047,500$ 1,953,000$ 86%
North Lake Tahoe 36,208,750$ 38,903,000$ 7% 33 31 -6% 85 138 62% 650,000$ 650,000$ 0%
Northstar 10,148,348$ 600,000$ -94% 10 1 -90% 265 291 10% 890,000$ 600,000$ -33%
Squaw Valley 7,185,000$ -$ n/a 5 0 n/a 130 0 n/a 1,250,000$ -$ n/a
Tahoe City 13,056,250$ 18,052,000$ 38% 14 13 -7% 80 110 38% 697,500$ 815,000$ 17%
Tahoe Donner 19,859,000$ 27,296,900$ 37% 33 41 24% 76 85 12% 600,000$ 580,000$ -3%
Truckee 37,784,684$ 62,602,551$ 66% 35 39 11% 126 128 2% 515,000$ 594,481$ 15%
West Shore 23,992,500$ 37,827,825$ 58% 15 36 140% 95 199 109% 650,000$ 537,500$ -17%
Source: Terradatum, April 6, 2015. Data is for single-family homes in the Lake Tahoe/Truckee region.
Lake Tahoe/Truckee Snapshot: SFH, Q1 2015 vs. Q1 2014
Sales Volume Homes Sold Avg. Days on Market Median Price
Q1 '14 Q1 '15 % change Q1 '14 Q1 '15 % change Q1 '14 Q1 '15 % change Q1 '14 Q1 '15 % change
Alpine Meadows 280,000$ 330,000$ 18% 1 1 0% 90 32 -64% 280,000$ 330,000$ 18%
Donner Lake -$ -$ n/a 0 0 n/a 0 0 n/a -$ -$ n/a
Donner Summit 170,000$ 165,000$ -3% 1 1 0% 25 417 1568% 170,000$ 165,000$ -3%
North Lake Tahoe 4,628,400$ 5,470,000$ 18% 13 15 15% 153 58 -62% 255,000$ 335,000$ 31%
NorthStar 3,874,750$ 5,207,000$ 34% 10 12 20% 128 119 -7% 326,000$ 385,000$ 18%
Squaw Valley 3,821,000$ 4,321,500$ 13% 11 8 -27% 248 369 49% 418,500$ 517,250$ 24%
Tahoe City 1,600,500$ 2,294,000$ 43% 5 6 20% 89 101 13% 255,000$ 339,500$ 33%
Tahoe Donner 2,004,500$ 2,196,500$ 10% 8 6 -25% 120 39 -68% 222,250$ 424,750$ 91%
Truckee 3,499,500$ 3,948,500$ 13% 6 7 17% 190 111 -42% 402,000$ 342,500$ -15%
West Shore 1,825,000$ -$ n/a 1 0 n/a 2 0 n/a 1,825,000$ -$ n/a
Lake Tahoe/Truckee Snapshot: Condos, Q1 2015 vs. Q1 2014
Source: Terradatum, April 6, 2015. Data is for condominiums in the Lake Tahoe/Truckee region.
Sales Volume Homes Sold Avg. Days on Market Median Price
Lake Tahoe/Truckeepacificunion.com