Embed Size (px)
Citation preview
Propagating waves controlDictyostelium discoideummorphogenesis
Dirk Dormann, Bakhtier Vasiev, Cornelis J. Weijer*
Department of Anatomy and Physiology, University of Dundee, Dundee, DD1 4HN, UK
Revision received 16 January 1998; accepted 13 February 1998
Abstract
The morphogenesis ofDictyosteliumresults from the coordinated movement of starving cells to form a multicellularaggregate (mound) which transforms into a motile slug and finally a fruiting body. Cells differentiate in the mound andsort out to form an organised pattern in the slug and fruiting body. During aggregation, cell movement is controlled bypropagating waves of the chemo-attractant cAMP. We show that mounds are also organised by propagating waves. Theirgeometry changes from target or single armed spirals during aggregation to multi-armed spiral waves in the mound. Somemounds develop transiently into rings in which multiple propagating wave fronts can still be seen. We model cell sorting inthe mound stage assuming cell type specific differences in cell movement speed and excitability. This sorting feeds back onthe wave geometry to generate twisted scroll waves in the slug. Slime mould morphogenesis can be understood in terms ofwave propagation directing chemotactic cell movement. 1998 Elsevier Science B.V. All rights reserved
Keywords:Cell movement; Wave propagation; Chemotaxis; Morphogenesis; Spiral waves
1. Introduction
A major goal in the study of development of eukar-yotic organisms is to understand the mechanisms ofmorphogenesis, i.e. how does a complex organismdevelop from a single cell, the fertilised egg andwhat determines its final shape. Mechanisms respon-sible for the development of multicellular organismsinvolve spatiotemporal control of cell proliferation,cell death and cell differentiation as well as differen-tial cell movement. These processes have to be pre-cisely controlled in space and time and furthermorethey have to be stable against external perturbations.
This control involves extensive cell-cell signalling viaextracellular factors. They interact in characteristicpositive and negative feedback circuits to result inthe spatiotemporal regulation of different cellular pro-cesses.
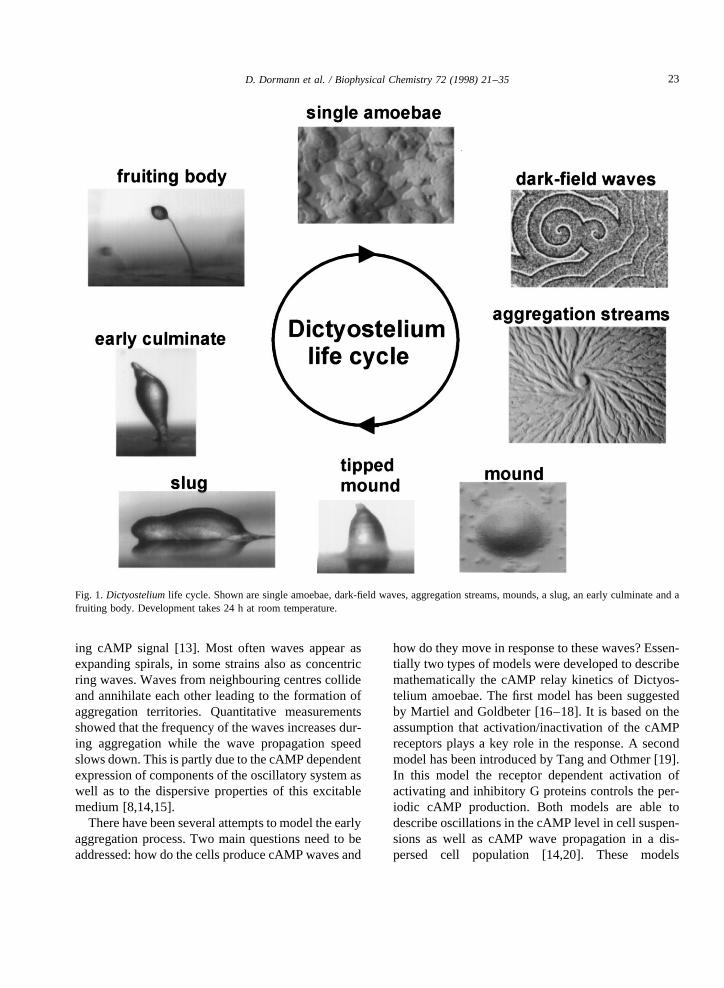
We have focused on the study of the morpho-genesis of a very simple organism, the cellular slimemould Dictyostelium discoideum. Slime moulds arepositioned between uni- and multi-cellular life in theevolutionary tree.Dictyosteliumundergoes a multi-cellular development (Fig. 1) which shows many ofthe characteristic features of the development ofhigher organisms, such as cell differentiation and dif-ferential chemotactic cell movement to put the cells inthe right place.
Slime moulds live as single amoebae in the soilwhere they feed on bacteria and divide by binary fis-
Biophysical Chemistry 72 (1998) 21–35
0301-4622/98/$19.00 1998 Elsevier Science B.V. All rights reservedPII S0301-4622(98)00120-3
* Corresponding author. Tel.: +44 1382 345191; fax: +44 1382345514; e-mail: [email protected]
sion. Starvation induces the activation of a develop-mental program in which the cells aggregate chemo-tactically to form a multicellular mass of 104–105
cells. Since multicellular development occurs in theabsence of food there is little cell division, thus sim-plifying the analysis of morphogenesis [1,2]. In theaggregate (mound) the cells start to differentiate intoa number of different cell types, i.e. several prestalktypes which will form the stalk and the basal disk,upper and lower cup of the fruiting body as well asprespore cells which will differentiate into spores.Differentiation occurs at random positions in the lateaggregate [3] and the prestalk cells sort out chemo-tactically to form the tip of the ‘tipped’ mound [4].The mound erects and extends up in the air to form thestanding slug which falls over and migrates away. Theslug has a distinct polarity with a tip at the anterior endwhich guides its movement. The slug is photo- andthermotactic which allows it to move up towards thesoil surface. There it transforms into a small fruitingbody (up to 4 mm high) consisting of a stalk support-ing a spore mass. The spores disperse and under sui-table conditions they germinate to release amoebaeand the whole cycle can start all over again. In thisarticle we will give an overview of the mechanismsthat control aggregation, mound and slug formationand show that these processes can be viewed as pat-tern formation in a biological excitable system.
2. Aggregation
The principles that govern aggregation are nowrelatively well understood at the cellular level. Aggre-gation of individualDictyosteliumamoebae into mul-ticellular aggregates occurs by chemotaxis to 3′,5′-cyclic adenosine monophosphate (cAMP). The cellsin the aggregation centre periodically synthesise andrelease cAMP in the extracellular medium. Here itdiffuses to neighbouring cells which detect this signalvia highly specific and very sensitive cAMP receptors.These receptors are transmembrane proteins with anextracellular cAMP binding domain and an intracel-lular effector domain. Binding of cAMP to the recep-tor triggers two competing processes, excitation andadaptation (reviewed in Ref. [5]). The excitationpathway leads to the activation of the enzyme adeny-late cyclase, which produces cAMP. It involves at
least one heterotrimeric G protein, a cytosolic pro-tein called cytosolic regulator of adenylate cyclase(CRAC) as well as a MAP kinase [5]. This intracel-lular cAMP is secreted to the outside where it can bindto the receptors of the same cell generating an auto-catalytic feedback, but it also diffuses away to activateneighbouring cells. The adaptation pathway involvesthe desensitisation of the receptor, resulting in a ter-mination of the autocatalytic relay response. It hasbeen shown that desensitisation is accompanied byreceptor and G protein phosphorylation on severalserine residues in its cytoplasmic tail. However ithas also been shown that this phosphorylation is notessential for desensitisation and the precise molecularmechanism is still unknown [5,6]. Moreover, the cellssecrete an enzyme cAMP phosphodiesterase whichdegrades cAMP [7]. The fall in the extracellular con-centration of cAMP leads to the dephosphorylationand resensitisation of the receptor. The adaptationprocess is responsible for the outward propagationof cAMP waves, since cells which have just relayedthe signal are refractory to further stimulation bycAMP. cAMP also causes a chemotactic reaction inthe direction of higher cAMP concentrations. Thecells move up the gradient as long as the cAMPlevel is rising but stop to move as soon as the concen-tration starts to decrease. This mechanism is respon-sible for the periodic movement of the cells towardsthe aggregation centre guided by the propagatedcAMP waves. Superimposed on this system there isa complex feedback of the cAMP oscillations on theexpression of various components of the signallingsystem. cAMP pulses induce the synthesis of cAMPreceptors, adenylate cyclase and phosphodiesteraseresulting in an increase in excitability during aggrega-tion [8,9].
During early aggregation the cAMP waves can beseen as optical density waves using low-power dark-field optics [10–12]. These optical density waves arecorrelated to shape changes which cells undergo uponstimulation with cAMP. Chemotactically movingcells are elongated and appear brighter than non-mov-ing cells resulting in the appearance of dark and lightbands in fields of aggregating cells (Figs. 1 and 2).
By correlating the cAMP signal via isotope dilu-tion-fluorography with the dark-field waves, it wasclearly demonstrated that the optical density wavesobserved during aggregation represent the propagat-
22 D. Dormann et al. / Biophysical Chemistry 72 (1998) 21–35
ing cAMP signal [13]. Most often waves appear asexpanding spirals, in some strains also as concentricring waves. Waves from neighbouring centres collideand annihilate each other leading to the formation ofaggregation territories. Quantitative measurementsshowed that the frequency of the waves increases dur-ing aggregation while the wave propagation speedslows down. This is partly due to the cAMP dependentexpression of components of the oscillatory system aswell as to the dispersive properties of this excitablemedium [8,14,15].
There have been several attempts to model the earlyaggregation process. Two main questions need to beaddressed: how do the cells produce cAMP waves and
how do they move in response to these waves? Essen-tially two types of models were developed to describemathematically the cAMP relay kinetics of Dictyos-telium amoebae. The first model has been suggestedby Martiel and Goldbeter [16–18]. It is based on theassumption that activation/inactivation of the cAMPreceptors plays a key role in the response. A secondmodel has been introduced by Tang and Othmer [19].In this model the receptor dependent activation ofactivating and inhibitory G proteins controls the per-iodic cAMP production. Both models are able todescribe oscillations in the cAMP level in cell suspen-sions as well as cAMP wave propagation in a dis-persed cell population [14,20]. These models
Fig. 1.Dictyosteliumlife cycle. Shown are single amoebae, dark-field waves, aggregation streams, mounds, a slug, an early culminate and afruiting body. Development takes 24 h at room temperature.
23D. Dormann et al. / Biophysical Chemistry 72 (1998) 21–35
basically describe excitable and/or oscillatory mediaand are very similar to the prototype FitzHugh–Nagumo system:
∂g=∂t =DDg−r(kgg(g−0:05)(g−1) +krr)
∂r=∂t = (g− r)=t (1)
The first equation describes the excitation of themedium, defined by the variable (g), over time. Thisvariable is linked to the extra cellular cAMP concen-tration. The second equation defines the recovery pro-cess of the medium (r) and could be thought todescribe the desensitisation of the cAMP receptors.D is the diffusion coefficient for cAMP;t is a timescaling factor for the variablesr and g; kg and kr,define the rate of production and hydrolysis ofcAMP by one cell. The effect of cell density on theexcitability of the medium is accounted for by thefactor r, which scales the excitability of the medium(rate of production of cAMP).
cAMP waves not only propagate through the cell
population but also coordinate cell movement. cAMPorients the direction of otherwise randomly movingcells. There is strong evidence that the cells detect thegradient of cAMP over their length [21–23]. How-ever, there is also evidence that cells use the temporalderivative of cAMP and only move up the gradient aslong as the cAMP level is rising [24,25]. This allowscells to move chemotactically on the wave front ratherthan on the wave back. A number of mathematicalmodels have been proposed for chemotactic cellmovement. The best known one is the Keller–Segelmodel [26] describing a cell flux,J as a function ofcell density,r, and concentration of cAMP,g.
J = −D(g)=r +x(g)r=g (2)
The first term on the right hand side describes randomcell movement (the velocity can depend on the levelof cAMP) and the second term the directed motion ofthe cells along the cAMP gradient. There exist also anumber of models where chemotactic cell motion isdescribed in an axiomatic way as rules for motion of
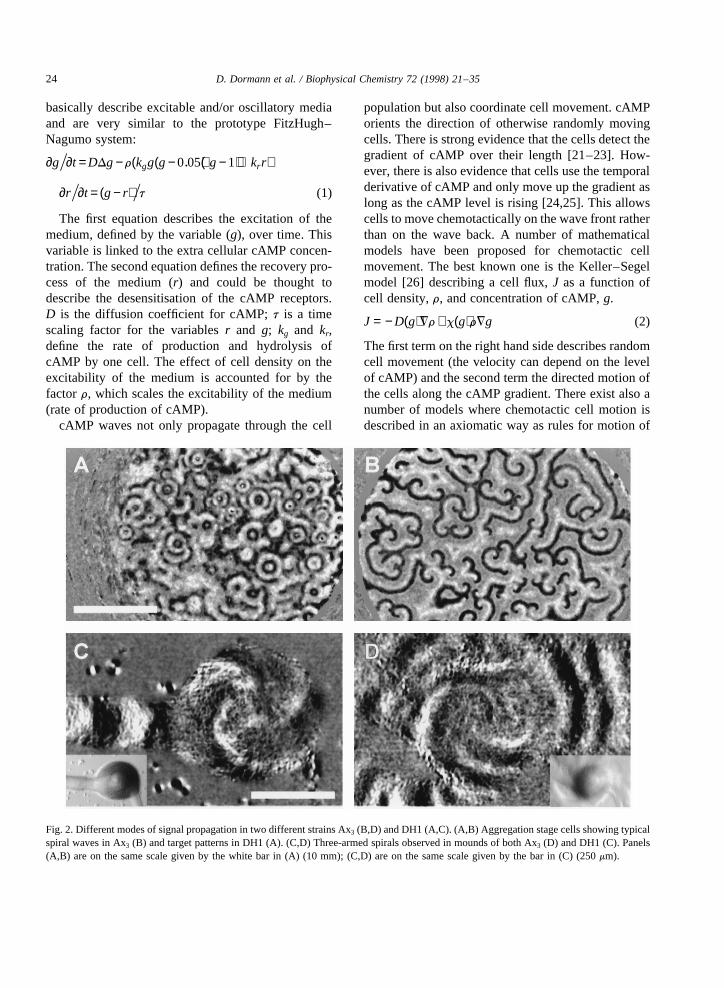
Fig. 2. Different modes of signal propagation in two different strains Ax3 (B,D) and DH1 (A,C). (A,B) Aggregation stage cells showing typicalspiral waves in Ax3 (B) and target patterns in DH1 (A). (C,D) Three-armed spirals observed in mounds of both Ax3 (D) and DH1 (C). Panels(A,B) are on the same scale given by the white bar in (A) (10 mm); (C,D) are on the same scale given by the bar in (C) (250mm).
24 D. Dormann et al. / Biophysical Chemistry 72 (1998) 21–35
units (cells) in a concentration field of cAMP [27–30].
Much effort has been directed towards understand-ing the physical principles leading to the formation ofstreaming patterns by amoebae responding chemotac-tically to propagating cAMP waves. It has been shownanalytically and numerically that streams form due toa streaming instability caused by a coupling betweenthe velocity of signal propagation and density of cells[30–34]. This is presumably related to the angularinstability as discussed by Shaffer and Nanjundiah[35,36]. Local accumulation of cells will, due to thedependence of the rate of cAMP accumulation on celldensity, result in a speeding up of the wave propaga-tion. This local deformation of the wave front willlead to the attraction of even more cells to this regionand finally to the formation of bifurcating aggregationstreams [30,32,34], in which the cells move towardsthe aggregation centre. There they pile on top of eachother to form a 3D hemispherical structure, themound. In the streams the cells are elongated andconnected by rather characteristic end to end contacts.The movement of individual cells however is stillperiodic, but somewhat faster than that of isolatedcells, possibly suggesting a cooperative effect ontheir movement [37].
3. Wave propagation and cell movement inmounds
Special image processing techniques allowed us tovisualise propagating optical density waves in thelater stages of Dictyostelium development. We canvisualise optical density waves in aggregation streamsand mounds [38,39]. Continuous measurements of theoptical density waves from late aggregation until tipformation over a period of 3 h demonstrated that therewas a clear evolution in the dynamics of the waves[39]. Initially the waves propagate fast at low fre-quency but in the course of aggregation the wavefrequency increased, while the wave propagationspeed decreased. Although we can observe a contin-uous succession of optical waves from aggregation tothe mound stage it is not proven that the waves in themound are caused by chemotaxis to propagatingcAMP signals. Periodic microinjection of pulses ofcAMP into the extracellular space in mounds initiated
optical density waves which propagated from theelectrode tip outwards and which interacted withendogenous waves (Rietdorf, Siegert and Weijer,unpublished data). These observations clearly showthat optical density waves in mounds can be inducedby cAMP oscillations and furthermore that inducedwaves annihilate endogenous waves upon collision,showing a common propagation mechanism.
In the mound stage the geometry of the waves canbe very variable. The pattern of wave propagationseems to be a characteristic of the strain used. Wehave found a variety of different wave propagationpatterns in mounds. Some strains predominantlyshow concentric ring waves [38]. These waves canoriginate from one centre in the mound. In somecases we found that the mound behaves as a veryexcitable medium in which target waves arise simul-taneously from a number of different centres, the loca-tion of which may change in time and space duringdevelopment. The waves generated by these centrescompete and interact during the development ofthe mound and finally one centre seems to becomedominant. We also observed simple spiral waves inmounds. In some strains the geometry of the spiralscan be more complicated and result in the formationof multi-armed spirals [38,39].
We have observed single and multi-armed spirals inthe strains Ax2 and Ax3. The strains that produce spir-als in mounds are also strains that produce spiralsduring aggregation. The diverse geometry of the sig-nals leads to a variety of complex cell motion patterns.Since cell movement is always opposite to the direc-tion of signal propagation [10,39] cell movement inmounds organised by concentric waves is directedtowards the organising centre and slow, while in thecase of spiral waves, cell movement is rotational andfast.
More recently we have started to investigateanother strain, DH1. This is an uracil auxotrophderived from Ax3 in which the pyr5,6 gene codingfor UMP synthase has been disrupted [40,41]. Thisstrain has been used extensively as a parent strain togenerate mutants in essential signal transduction com-ponents such as cAMP receptors and cAMP phospho-diesterase. It is supposed to be wildtype when grownin the presence of uracil. We found that this strainshowed a number of interesting features during aggre-gation and mound formation. During the early stages
25D. Dormann et al. / Biophysical Chemistry 72 (1998) 21–35
of aggregation it always produced target pattern typewaves. This is different from the strain Ax3 fromwhich it was derived, which always produces spiralwaves during early aggregation (Fig. 2A,B). In the
mound stage this strain just as Ax3 and another axenicmutant Ax2 produces multi-armed spiral waves (Fig.2C,D). This shows that during the development ofDictyosteliumcells the kinetics of the relay reaction
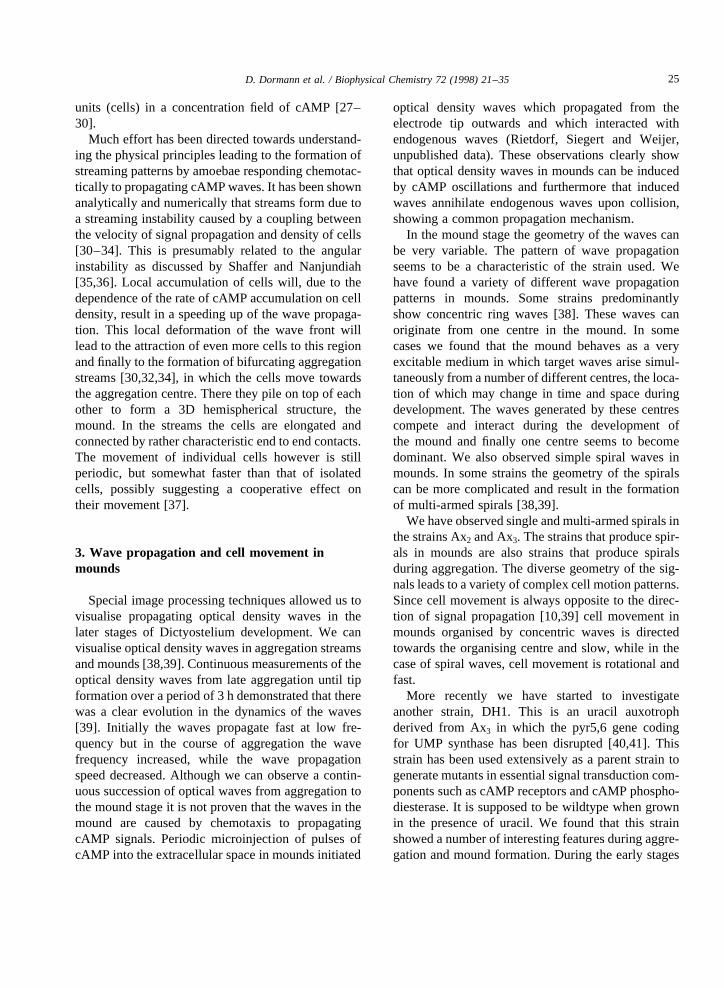
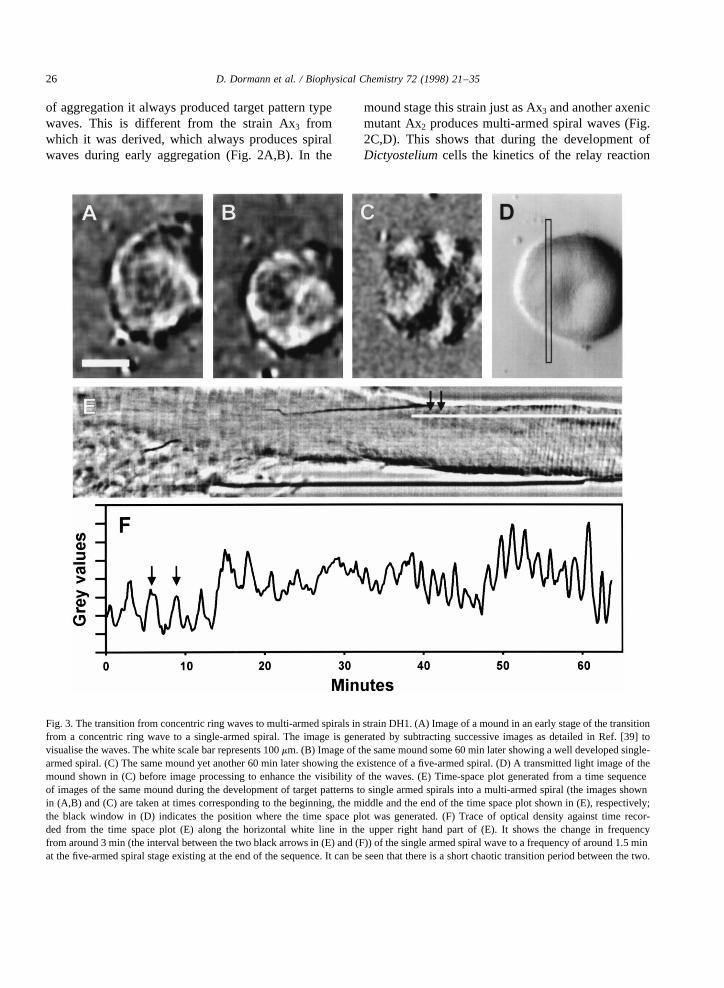
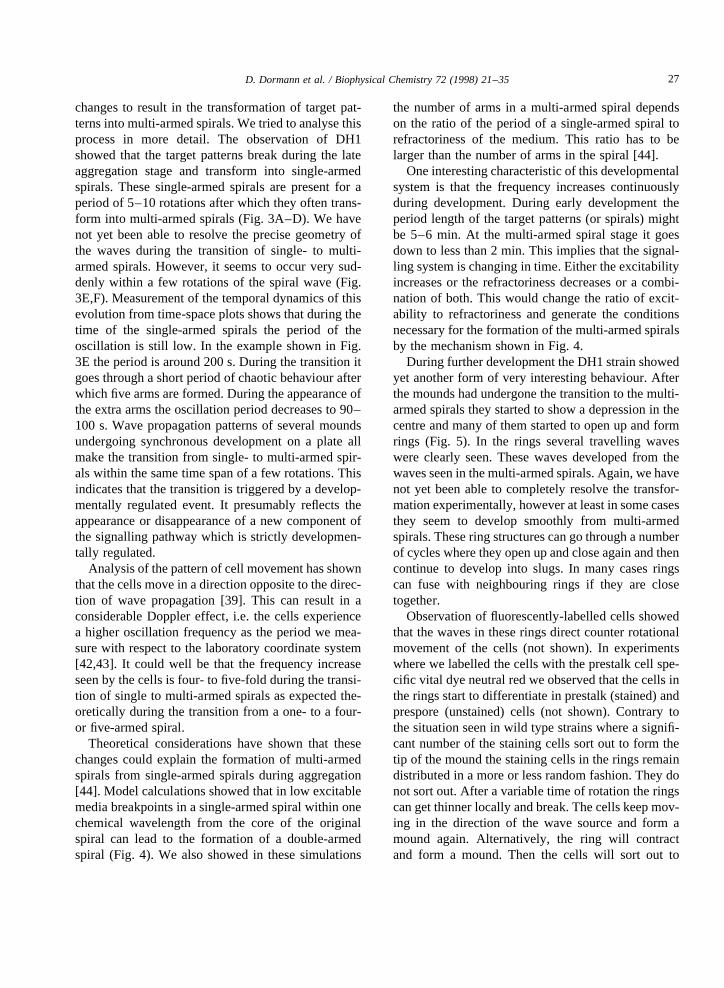
Fig. 3. The transition from concentric ring waves to multi-armed spirals in strain DH1. (A) Image of a mound in an early stage of the transitionfrom a concentric ring wave to a single-armed spiral. The image is generated by subtracting successive images as detailed in Ref. [39] tovisualise the waves. The white scale bar represents 100mm. (B) Image of the same mound some 60 min later showing a well developed single-armed spiral. (C) The same mound yet another 60 min later showing the existence of a five-armed spiral. (D) A transmitted light image of themound shown in (C) before image processing to enhance the visibility of the waves. (E) Time-space plot generated from a time sequenceof images of the same mound during the development of target patterns to single armed spirals into a multi-armed spiral (the images shownin (A,B) and (C) are taken at times corresponding to the beginning, the middle and the end of the time space plot shown in (E), respectively;the black window in (D) indicates the position where the time space plot was generated. (F) Trace of optical density against time recor-ded from the time space plot (E) along the horizontal white line in the upper right hand part of (E). It shows the change in frequencyfrom around 3 min (the interval between the two black arrows in (E) and (F)) of the single armed spiral wave to a frequency of around 1.5 minat the five-armed spiral stage existing at the end of the sequence. It can be seen that there is a short chaotic transition period between the two.
26 D. Dormann et al. / Biophysical Chemistry 72 (1998) 21–35
changes to result in the transformation of target pat-terns into multi-armed spirals. We tried to analyse thisprocess in more detail. The observation of DH1showed that the target patterns break during the lateaggregation stage and transform into single-armedspirals. These single-armed spirals are present for aperiod of 5–10 rotations after which they often trans-form into multi-armed spirals (Fig. 3A–D). We havenot yet been able to resolve the precise geometry ofthe waves during the transition of single- to multi-armed spirals. However, it seems to occur very sud-denly within a few rotations of the spiral wave (Fig.3E,F). Measurement of the temporal dynamics of thisevolution from time-space plots shows that during thetime of the single-armed spirals the period of theoscillation is still low. In the example shown in Fig.3E the period is around 200 s. During the transition itgoes through a short period of chaotic behaviour afterwhich five arms are formed. During the appearance ofthe extra arms the oscillation period decreases to 90–100 s. Wave propagation patterns of several moundsundergoing synchronous development on a plate allmake the transition from single- to multi-armed spir-als within the same time span of a few rotations. Thisindicates that the transition is triggered by a develop-mentally regulated event. It presumably reflects theappearance or disappearance of a new component ofthe signalling pathway which is strictly developmen-tally regulated.
Analysis of the pattern of cell movement has shownthat the cells move in a direction opposite to the direc-tion of wave propagation [39]. This can result in aconsiderable Doppler effect, i.e. the cells experiencea higher oscillation frequency as the period we mea-sure with respect to the laboratory coordinate system[42,43]. It could well be that the frequency increaseseen by the cells is four- to five-fold during the transi-tion of single to multi-armed spirals as expected the-oretically during the transition from a one- to a four-or five-armed spiral.
Theoretical considerations have shown that thesechanges could explain the formation of multi-armedspirals from single-armed spirals during aggregation[44]. Model calculations showed that in low excitablemedia breakpoints in a single-armed spiral within onechemical wavelength from the core of the originalspiral can lead to the formation of a double-armedspiral (Fig. 4). We also showed in these simulations
the number of arms in a multi-armed spiral dependson the ratio of the period of a single-armed spiral torefractoriness of the medium. This ratio has to belarger than the number of arms in the spiral [44].
One interesting characteristic of this developmentalsystem is that the frequency increases continuouslyduring development. During early development theperiod length of the target patterns (or spirals) mightbe 5–6 min. At the multi-armed spiral stage it goesdown to less than 2 min. This implies that the signal-ling system is changing in time. Either the excitabilityincreases or the refractoriness decreases or a combi-nation of both. This would change the ratio of excit-ability to refractoriness and generate the conditionsnecessary for the formation of the multi-armed spiralsby the mechanism shown in Fig. 4.
During further development the DH1 strain showedyet another form of very interesting behaviour. Afterthe mounds had undergone the transition to the multi-armed spirals they started to show a depression in thecentre and many of them started to open up and formrings (Fig. 5). In the rings several travelling waveswere clearly seen. These waves developed from thewaves seen in the multi-armed spirals. Again, we havenot yet been able to completely resolve the transfor-mation experimentally, however at least in some casesthey seem to develop smoothly from multi-armedspirals. These ring structures can go through a numberof cycles where they open up and close again and thencontinue to develop into slugs. In many cases ringscan fuse with neighbouring rings if they are closetogether.
Observation of fluorescently-labelled cells showedthat the waves in these rings direct counter rotationalmovement of the cells (not shown). In experimentswhere we labelled the cells with the prestalk cell spe-cific vital dye neutral red we observed that the cells inthe rings start to differentiate in prestalk (stained) andprespore (unstained) cells (not shown). Contrary tothe situation seen in wild type strains where a signifi-cant number of the staining cells sort out to form thetip of the mound the staining cells in the rings remaindistributed in a more or less random fashion. They donot sort out. After a variable time of rotation the ringscan get thinner locally and break. The cells keep mov-ing in the direction of the wave source and form amound again. Alternatively, the ring will contractand form a mound. Then the cells will sort out to
27D. Dormann et al. / Biophysical Chemistry 72 (1998) 21–35
form a tip and the structure continues to form aslug, which will migrate away and form a fruitingbody. It can easily be understood why the cells donot sort out in the rings. The waves rotate aroundwithout the presence of a localised source. There-ore the cells cannot use this information to sort out.It re-mains however an open question why therings are formed in the first place. This is the ques-tion of cause and effect. Do the cells not sort outbecause the signals are such that they will form aring or do they form a ring as the result of an inability
of the cells to sort and as a result the signals can onlyform a ring.
4. A model for mound formation
Observation of cells moving in mounds promptedtheoretical investigations where the cell movement isconsidered as a flow of a viscous compressible liquid.This approach has been successfully used in a hydro-dynamic model describing the whole process of
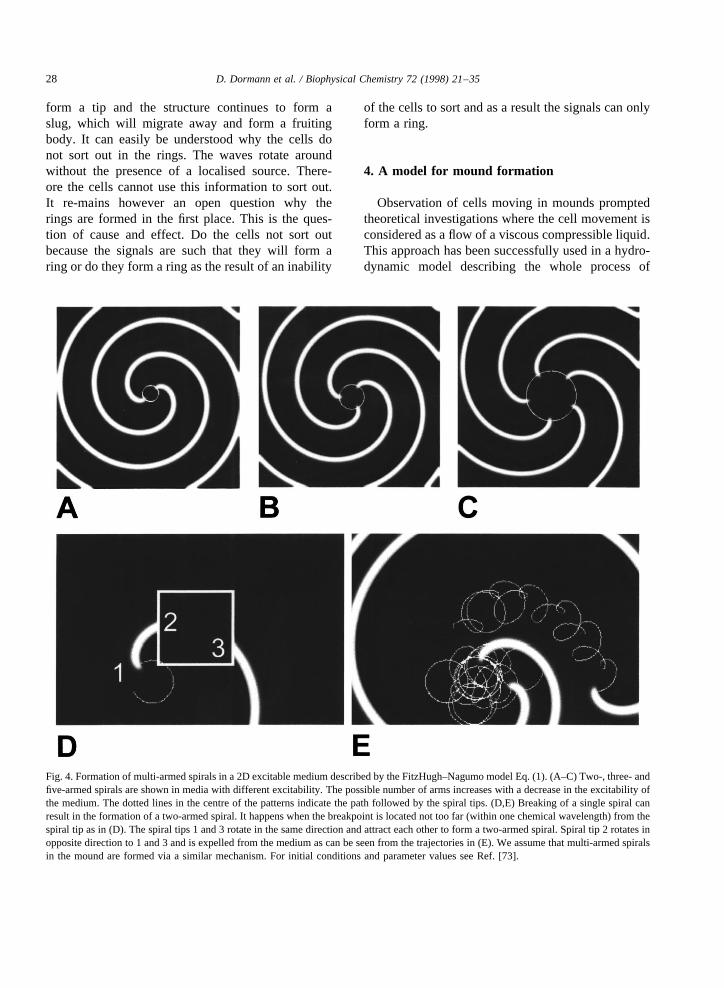
Fig. 4. Formation of multi-armed spirals in a 2D excitable medium described by the FitzHugh–Nagumo model Eq. (1). (A–C) Two-, three- andfive-armed spirals are shown in media with different excitability. The possible number of arms increases with a decrease in the excitability ofthe medium. The dotted lines in the centre of the patterns indicate the path followed by the spiral tips. (D,E) Breaking of a single spiral canresult in the formation of a two-armed spiral. It happens when the breakpoint is located not too far (within one chemical wavelength) from thespiral tip as in (D). The spiral tips 1 and 3 rotate in the same direction and attract each other to form a two-armed spiral. Spiral tip 2 rotates inopposite direction to 1 and 3 and is expelled from the medium as can be seen from the trajectories in (E). We assume that multi-armed spiralsin the mound are formed via a similar mechanism. For initial conditions and parameter values see Ref. [73].
28 D. Dormann et al. / Biophysical Chemistry 72 (1998) 21–35
aggregation until mound formation (Fig. 6). In thismodel cell velocity has been defined by the Navier–Stokes equation:
r[∂V=∂t + (V=)V] =
Fch +Ffr +hDV +y=(=V) +Fad−=p (3)
The left hand side of the equation describes the accel-eration of cells under the influence of various forcesdescribed on the right hand side of the equation.V isthe velocity of the cells.Fch is the chemotactic forcewhich is active on the front of cAMP waves,Ffr is afriction force responsible for slowing down cellmovement, The third and fourth terms on the righthand side describe cell-cell friction:h andz are visc-osity coefficients.Fad takes into account cell-cell and
cell-substrate adhesion forces,p is the pressurebetween the cells caused by the chemotactic accumu-lation of the cells (see Ref. [45] for details).
The evolution of the shape of the aggregate into amound in this model has been obtained by solving anequation for the cell density field, i.e. by the equationfor the conservation of mass:
∂r=∂t =DrDr −=(rV) (4)
The first term on the right hand side of the equationdescribes the random motion of the cells, while thesecond term describes coordinated chemotacticmovement. Aggregation patterns found as solutionsof Eq. (3), Eq. (4) in combination with the FitzHugh–Nagumo system Eq. (1) to describe the excitablecAMP kinetics are shown in Fig. 6.
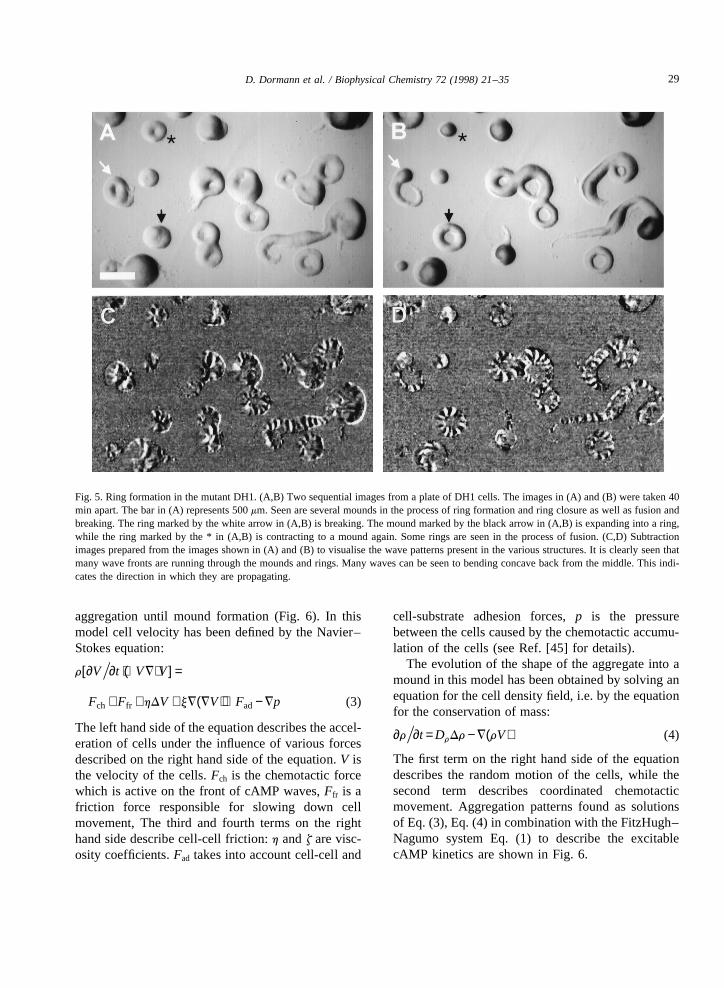
Fig. 5. Ring formation in the mutant DH1. (A,B) Two sequential images from a plate of DH1 cells. The images in (A) and (B) were taken 40min apart. The bar in (A) represents 500mm. Seen are several mounds in the process of ring formation and ring closure as well as fusion andbreaking. The ring marked by the white arrow in (A,B) is breaking. The mound marked by the black arrow in (A,B) is expanding into a ring,while the ring marked by the * in (A,B) is contracting to a mound again. Some rings are seen in the process of fusion. (C,D) Subtractionimages prepared from the images shown in (A) and (B) to visualise the wave patterns present in the various structures. It is clearly seen thatmany wave fronts are running through the mounds and rings. Many waves can be seen to bending concave back from the middle. This indi-cates the direction in which they are propagating.
29D. Dormann et al. / Biophysical Chemistry 72 (1998) 21–35

Fig. 6. Simulation of aggregation and mound formation using Eqs. (1) and (3). Cell density is shown as a yellow iso-surface (r = 0.5) and thecAMP spiral is mapped on this surface (red). The initial density of cells was zero everywhere in 3D-space except for the bottom plane (A). Thecell density in each grid of this plane was represented by a random number varying between 0 and 1 so that average density in this plane wasequal to 0.5. In response to cAMP spiral wave cells move and form aggregation streams (B,C) and then mound (D) which represents a stablesolution of the system. See Ref. [45] for details of the calculations.
Fig. 7. Wave propagation, cell movement and differentiation in slugs. (A) Photograph of a neutral red stained slug (side view). The darkstained region on the left hand side is the prestalk region. The arrows indicate the direction of cell movement. (B) Model for waves in the slug.The arrows indicate direction of cAMP wave propagation. (C) Photograph of a slug showing expression of the prestalk specific gene ecmB(blue region in slug), note the expression in the slug centre and at the prestalk-prespore boundary. (D) Average cAMP levels in the simulationafter integration over ten periods of wave rotation. Note the close correspondence between average cAMP in the model (D) and cell typedifferentiation (A,C).
30 D. Dormann et al. / Biophysical Chemistry 72 (1998) 21–35
This model, although rather qualitative, showssome remarkable similarities with the formation andappearance of aggregates observed in real life (Fig. 1,Fig. 5). Furthermore it is able to describe some mutantphenotypes frequently observed [45].
5. Wave propagation in slugs
Up to the mound stage cAMP wave propagationcan be seen as optical density wave using dark-fieldoptics and digital image processing techniques[11,38]. It seems likely that periodic signals also con-trol later development but it has not yet been firmlyestablished that these signals are cAMP. In slugs ofDictyostelium discoideumwe have not yet been ableto observe propagating dark-field waves. During slugmigration and culmination an extracellular slimesheath, which is secreted continuously, surroundsthe slug. This gives the slug some mechanical stabilitybut also impedes the observation of optical densitywaves. To find out whether periodic cAMP signalscontrol slug migration and culmination, we investi-gated single cell behaviour and cell movement in mul-ticellular structures, assuming that periodic signalsshould cause periodic cell movement. It was shown,that cells in the prespore zone of slugs go throughperiodic velocity and shape changes typical for che-motactically moving cells [46,47]. Further investiga-tions showed, that there is a characteristic pattern ofcell movement inD. discoideumslugs: cells in theprestalk zone show vigorous rotational movementaround the central core of the tip, while cells in theprespore zone move straight forward in the directionof slug migration (Fig. 7A) [48]. From these observa-tions the geometry of the propagating signal wasdeduced: a 3D scroll wave (spiral wave) causes rota-tional cell movement in the tip while planar wavefronts guide the straightforward movement observedin the prespore zone (Fig. 7B). We have observedoptical density waves in slugs of the related speciesDictyostelium mucoroides[49]. This species synthe-sises a stalk continuously during migration and formslong thin slugs which facilitate the visualisation ofwaves. Optical density waves are visible in the thinback region of the prespore zone of the slug (33). Thisspecies also uses cAMP as a chemo-attractant duringthe early stages and most likely also during later
stages of development [50]. Based on these data weproposed that the periodic signal in slugs was mostlikely cAMP. Recently experiments have beenreported that show that an adenylate cyclase nullmutants that overexpresses the catalytic subunit ofthe cAMP dependent protein kinase can aggregate athigh cell densities and continue development to formmounds and slugs [51]. This seems to indicate thateither slugs can form in the absence of cAMP wavesor that there is another adenylate cyclase that takesover its role during development. Alternatively itmight imply that adenylate cyclase is absolutelyrequired for slug formation but controls slug forma-tion normally. Since there is a lot of evidence thatcAMP is involved in later morphogenesis both inthe control of cell movement (cell sorting [52]) andin the control of differentiation [9] we still assume thatcAMP normally controls cell movement not only inmounds but also in slugs.
Computer simulations showed that the conversionof a scroll into a series of planar waves occurs, if thereis a substantial difference in excitability between theprestalk and prespore cell population [53]. This maybe due to a difference in excitability between prestalkand prespore cells as possibly indicated by the celltype specific differences in the number and type ofcAMP receptors adenylate cyclase and phosphodies-terase [54–57]. In the extreme case it might be causedby relaying of signal by prestalk and anterior-like cellsonly. This would imply that 100% of the cells in theprestalk zone relay the signal while in the presporezone only the 15% randomly scattered anterior-likecells would relay the signal. This would give a goodexplanation for the existence of anterior-like cells[58].
During the slug stage there is a further specificationof cell types. pstA cells are formed in the anteriorouter part of the prestalk zone. pstO cells are foundat the boundary between prestalk and prespore cells,while pstB cells, which will form the stalk, are foundin the central core of the prestalk zone. The presporecells are located in the back two-thirds of the slug[59]. Prespore genes need cAMP for their inductionand stabilisation. Expression of the prestalk specificecmB gene by the pstB cells is inhibited by high con-centrations of extra cellular cAMP while ecmAexpression by pstA cells requires high concentrationsof cAMP [60–62]. Computer simulations using the
31D. Dormann et al. / Biophysical Chemistry 72 (1998) 21–35
Martiel–Goldbeter model for cAMP oscillationsshowed, that the core of the scroll wave in the prestalkzone is a region of low average extracellular cAMP,exactly the condition which facilitates the expressionof the stalk specific ecmB gene in the central core ofthe prestalk zone (Fig. 7C) [58]. Despite the complexmode of wave propagation it gives rise to a relativelysimple spatial pattern of average cAMP, which can beread out by the cells in different positions in the slugto keep the differentiation state of the cells in the slugstable (Fig. 7D).
These simulations suggest that the wave propaga-tion pattern is not only responsible for the control ofcell movement but also might be involved in the dif-ferentiation of the prestalk cell types [58].
6. Tip formation, cell differentiation and sorting
One of the most interesting but also most compli-cated phases of development is slug formation. Dur-ing aggregation the cell density increases dramaticallyand cells start to move up on top of each other in thethird dimension. In the mound cells begin to differ-entiate in prestalk and prespore cells at random posi-tions. The prestalk cells then sort towards the top ofthe mound to form a tip [63]. The mound then con-tracts at the base while extending up in the air to forma standing slug. Slug formation can be seen as a two-step process, i.e. sorting of prestalk cells to form a tipfollowed by a tip induced contraction and elongationof the mound to form a standing slug (Fig. 1).
Cell sorting most likely results from differentialchemotactic cell movement towards cAMP. Experi-ments showed that prestalk cells preferentially sorttowards an artificial cAMP source [64]. Furthermoremutants which overexpress cAMP phosphodiesteraseare blocked at the mound stage of development anddefective in cell sorting [52]. The difference in effec-tive movement speed towards a cAMP source couldbe caused by cell type specific differences in themotive force generated by prestalk and presporecells. Differences in motive force could result fromdifferences in the cytoskeleton or cell-cell adhesion,i.e. prespore cells being more adhesive than prestalkcells. There is experimental evidence for both types ofmechanisms: isolated pstA cells, which will sort to thetop of the aggregate, are able to move faster to an
artificial cAMP source than isolated prespore cells[63]. Furthermore several mutants with defects incomponents of the cytoskeleton are arrested at themound stage [65,66]. Using a cold sensitive myosinmutant it has been shown, that there are two stages indevelopment where myosin II is absolutely requiredfor morphogenesis, at the mound stage during tip for-mation and during culmination [67]. Secondly, inmulticellular tissues cell-cell interactions are likelyto play an important role in the control of cell move-ment. It is known that prespore cells are more adhe-sive than prestalk cells [68]. Prestalk cells maytherefore move more efficiently in a multicellu-lar aggregate consisting of prespore and prestalkcells. We therefore suspect that cell sorting involvesall these mechanisms, i.e. differential chemotaxistowards cAMP, cell type specific differences in thegeneration of motive force as well as cell type specificdifferences in cell-cell interactions and cell-substrateinteractions.
Cell sorting will feedback on the signalling patternsin the tipped mound since prestalk and prespore cellsdiffer in their excitability. Many experiments suggestthat prestalk cells are more excitable than other cellsin the mound. Prestalk cells express higher amounts ofthe enzymes involved in the synthesis and degradationof cAMP, adenylate cyclase and phosphodiesterase[69–71] and they express a specific subset of lowaffinity cAR2 receptors, which allows them to relayhigh amplitude cAMP signals, while the expression ofthe high affinity cAR3 receptor becomes restricted toprespore cells [54,72].
Taken together cell sorting should affect the signal-ling system in the following way: the collection of fastoscillating prestalk cells in the tip leads to anincreased excitability. This causes a loss of spiralarms and the formation of a simple scroll wave inthe tip [44]. The removal of the highly excitable pre-stalk cells from the body of the mound results in adecrease in local excitability and the conversion of thescroll wave in the tip to a twisted scroll wave in themound [53,58]. This leads to a twisted rotational cellmovement in the mound. As a result the mound con-tracts and extends up into the air.
We are now testing this possibility by an extensionof the model from mound formation by incorporationof different cell types (fluids) with different chemo-tactic and relay properties. We consider the mound to
32 D. Dormann et al. / Biophysical Chemistry 72 (1998) 21–35
be a drop of liquid consisting of two kinds of fluidsand use a two-field description of this drop to modelcell sorting. The velocity of the liquid,V defined inEq. (3), is assumed to have two components corre-sponding to velocities of prestalk,V1, and prespore,V2, cells:
V = (r1V1 +r2V2)=(r1 +r2) (5)
Since the liquid is incompressible:r1 + r2 = 1 in themound. The chemotactic force,Fch, in Eq. (3) is alsoassumed to consist of two components correspondingto chemotactic forcing of prestalk and prespore cells.
Fch= (r1J1(∂g=∂t) +r2J2(∂g=∂t))=g (6)
The difference in cAMP signalling between prestalkand prespore cells is also taken into account by twodifferent sets of parameters for the FitzHugh–Nagumo model. To find the velocities of prestalkand prespore cells we put Eq. (5) and Eq. (6) forvelocity and chemotactic force into Eq. (3), put coef-ficient r1 + r2 to the last term in Eq. (3) and byseparating terms consistingr1 and r2 we get twoequations forV1 andV2:
∂Vi=∂t =Vi=(Viri)=ri − (Vi=)V +Fi +hD(Viri)=ri −=p
(7)
where i= 1,2The two equations each coupled with the equation
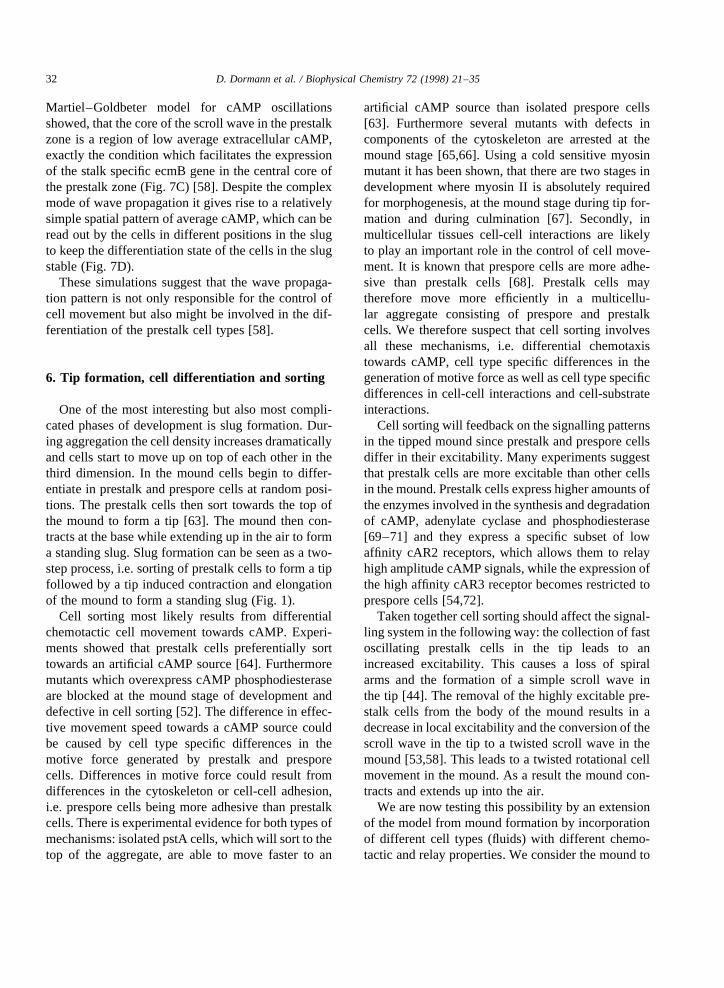
of conservation of mass (used to define the densities ofboth fluids) give the evolution of the cell density fieldsover time. Our preliminary computations show thatstarting from a random distribution of cell types inthe mound one can obtain spatially separated patternsof cell types as well as tip formation. In response toscroll waves rotating along the vertical axe of hemi-spherical mound the liquid begins to rotate in theopposite direction. The faster moving fluid (prestalkcells) accumulates in the centre and top of the mound.Since the faster fluid is more excitable their separationleads to the mound becoming inhomogeneous withrespect to its excitability. This in turn results in achange of the cAMP wave shape. Since the densityof the excitable cells is higher on the top of the moundthe velocity of wave propagation is higher than in thebase of the mound and the scroll becomes twisted. Asa consequence the cells experience a vertical chemo-tactic force which results in the further collection offaster moving cells on the top. Finally all the fastercells collect at the top of the mound and form a tip,exactly as it happens in real mounds (Fig. 8). It seemslikely that the model will be able to describe slugmigration as resulting from scroll wave propagationand chemotactic cell movement. This is now underinvestigation. To investigate culmination it will benecessary to include further signalling centres aswell as final stalk differentiation.
Fig. 8. Simulation of cell sorting and tip formation. To describe cell movement we used Eq. (3), (4), (5), (6) and (7) and to describe cAMPsignalling we used the FitzHugh–Nagumo Eq. (1). A sequence of images is shown depicting sorting of highly excitable fast moving prestalkcells (yellow) from less excitable slow moving prespore cells (light green (transparent)) as well as the cAMP signal (pink). A scroll wave wasinitiated in the mound with an initially random distribution of prestalk and prespore cells. In the course of time the cells sort which results in atwisting of the scroll wave. The period of the scroll wave decreases from 3.8 to 2.1 time units.
33D. Dormann et al. / Biophysical Chemistry 72 (1998) 21–35
7. Conclusions
It is now becoming clear that periodic signals notonly control aggregation but also all later stages ofmorphogenesis. Multicellular mounds are organisedby either concentric ring waves emanating from oneor more centres or by spiral waves with up to ten arms.These signals are most likely used to regulate theprocess of cell sorting, in which the most excitablecells move on top of the aggregate. This sorting pro-cess leads to a highly excitable tip and a less excitablemain body. This spatial separation feeds back on thesignal geometry. We propose that the cells in the tipare organised by a rotating scroll wave of cAMP withthe core of the scroll wave coinciding with the longaxis of the tip. The scroll wave converts into a twistedscroll wave and planar waves in the body of themound. This pattern of wave propagation leads to arotational movement of the prestalk cells in the tipand a periodic upward movement of the cells in thebase of the mound. Furthermore it results in a con-traction of the tip and an elongation of the moundinto a standing slug which becomes unstable and top-ples over. The slug now moves away, while the move-ment of the cells is still being controlled by a scrollwave in the tip and twisted scroll or planar waves inthe prespore zone. This pattern of cAMP wave propa-gation is also used to stabilise prestalk cell typespecific gene expression and to initiate stalk differen-tiation.
Dictyosteliumis possibly the first organism whosemorphogenesis is beginning to be understood at thecellular level. During early development morphogen-esis is based on wave propagation in a 2D excitablemedium which becomes 3D by chemotactic aggrega-tion of the cells. More complexity is brought into thesystem as the cells differentiate into several types withdifferent excitable and chemotactic properties. Due tothese additional levels of regulation and feedbackcomplicated wave forms such as multi-armed spirals,twisted scroll waves etc. arise.
Acknowledgements
We like to thank Till Bretschneider for performingthe calculations on the wave propagation in slugs. Welike to thank Florian Siegert and Jens Rietdorf for
discussion and the BBSRC and Deutsche Forschungs-gemeinschaft for financial support.
References
[1] G. Weeks, C.J. Weijer, FEMS Microbiol. Lett. 124 (1994)123.
[2] W.F. Loomis, R. Cann, in: W.F. Loomis (Ed.), The Devel-opment ofDictyostelium discoideum, Acedemic Press, NewYork, 1982, p. 451.
[3] J. Williams, Curr. Opin. Genet. Dev. 5 (1995) 426.[4] D. Traynor, M. Tasaka, I. Takeuchi, J. Williams,
Development 120 (1994) 591.[5] C.A. Parent, P.N. Devreotes, Annu. Rev. Biochem. 65 (1996)
411.[6] M.Y. Chen, R.H. Insall, P.N. Devreotes, Trends Genet. 12
(1996) 52.[7] R. Kessin, Microbiol. Rev. 52 (1988) 29.[8] G. Gerisch, Annu. Rev. Biochem. 56 (1987) 853.[9] R.A. Firtel, Curr. Opin. Genet. Dev. 6 (1996) 545.
[10] F. Alcantara, M. Monk, J. Gen. Microbiol. 85 (1974) 321.[11] J.D. Gross, M.J. Peacey, D.J. Trevan, J. Cell Sci. 22 (1976)
645.[12] F. Siegert, C. Weijer, J. Cell Sci. 93 (1989) 325.[13] K.J. Tomchik, P.N. Devreotes, Science 212 (1981) 443.[14] J.J. Tyson, J.D. Murray, Development 106 (1989) 421.[15] P. Foerster, S. Muller, B. Hess, Development 109 (1990) 11.[16] A. Goldbeter, Biochemical Oscillations and Cellular
Rhythms. The Molecular Bases of Periodic and ChaoticBehaviour, Cambridge Universities Press, Cambridge, 1996.
[17] J.-L. Martiel, A. Goldbeter, Biophys. J. 52 (1987) 807.[18] J.L. Martiel, A. Goldbeter, Lect. Notes Biomath. 71 (1987)
244.[19] Y.H. Tang, H.G. Othmer, Math. Biosci. 120 (1994) 25.[20] Y.H. Tang, H.G. Othmer, Phil. Trans. R. Soc. Lond. B 349
(1995) 179.[21] J.M. Mato, A. Losada, V. Nanjundiah, T.M. Konijn, Proc.
Natl. Acad. Sci. USA 72 (1975) 4991.[22] G. Gerisch, Biol. Cellulaire 32 (1978) 61.[23] M.J. Caterina, P.N. Devreotes, FASEB J. 5 (1991) 3078.[24] D. Wessels, D. Shutt, E. Voss, D.R. Soll, Mol. Biol. Cell 7
(1996) 1349.[25] D. Wessels, J. Murray, D.R. Soll, Cell Motil. Cytoskel. 23
(1992) 145.[26] E.F. Keller, L.A. Segel, J. Theor. Biol. 26 (1970) 399.[27] B. Novak, F.F. Seelig, J. Theor. Biol. 56 (1976) 301.[28] S.A. Mackay, J. Cell Sci. 33 (1978) 1.[29] O.O. Vasieva, B.N. Vasiev, V.A. Karpov, A.N. Zaikin, J.
Theor. Biol. 171 (1994) 361.[30] C. van Oss, A.V. Panfilov, P. Hogeweg, F. Siegert, C.J. Wei-
jer, J. Theor. Biol. 181 (1996) 203.[31] H. Levine, W. Reynolds, Phys. Rev. Lett. 66 (1991) 2400.[32] B.N. Vasiev, P. Hogeweg, A.V. Panfilov, Phys. Rev. Lett. 73
(1994) 3173.[33] T. Hofer, P.K. Maini, Phys. Rev. E 56 (1997) 2074.
34 D. Dormann et al. / Biophysical Chemistry 72 (1998) 21–35
[34] T. Hofer, J.A. Sherratt, P.K. Maini, Proc. R. Soc. Lond. Ser.B Biol Sci. 259 (1995) 249.
[35] B.M. Shaffer, Arn. Naturalist 91 (1957) 19.[36] V. Nanjundiah, J. Theor. Biol. 42 (1973) 63.[37] N.J. Savill, P. Hogeweg, J Theor. Biol. 184 (1997) 229.[38] F. Siegert, C.J. Weijer, Curr. Biol. 5 (1995) 937.[39] J. Rietdorf, F. Siegert, C.J. Weijer, Dev. Biol. 177 (1996) 427.[40] M. Jacquet, R. Guilbaud, H. Garreau, Mol. Gen. Genet. 211
(1988) 441.[41] M.J. Caterina, J.L.S. Milne, P.N. Devreotes, J. Biol. Chem.
269 (1994) 1523.[42] G. Gerisch, Naturwiss 58 (1971) 430.[43] J. Rietdorf, F. Siegert, S. Dharmawardhane, R.A. Firtel, C.J.
Weijert, Dev. Biol. 181 (1997) 79.[44] B.N. Vasiev, F. Siegert, C.J. Weijer Phys. Rev. Lett. 78
(1997) 2489.[45] B. Vasiev, F. Siegert, C.J. Weijer, J. Theor. Biol. 184 (1997)
441.[46] A.J. Durston, F. Vork, C. Weinberger, in: J.G. Vassileva-
Popova, E.V. Jensen (Eds.), Biophysical and BiochemicalInformation Transfer in Recognition, Plenum Press, NewYork, 1979, p. 693.
[47] F. Siegert, C.J. Weijer, Physica D 49 (1991) 224.[48] F. Siegert, C.J. Weijer, Proc. Natl. Acad. Sci. USA 89 (1992)
6433.[49] D. Dormann, C. Weijer, F. Siegert, J. Cell Sci. 110 (1997)
1831.[50] P. Schaap, M. Wang, Dev. Biol. 105 (1984) 470.[51] B. Wang, A. Kuspa, Science 277 (1997) 251.[52] D. Traynor, R.H. Kessin, J.G. Williams, Proc. Natl. Acad.
Sci. USA 89 (1992) 8303.[53] O. Steinbock, F. Siegert, S.C. Muller, C.J. Weijer, Proc. Natl.
Acad. Sci. USA 90 (1993) 7332.[54] Y.M. Yu, C.L. Saxe, Dev. Biol. 173 (1996) 353.
[55] G.T. Ginsburg, A.R. Kimmel, Genes Dev. 11 (1997) 2112.[56] L. Wu, J. Franke, R.L. Blanton, G.J. Podgorski, R.H. Kessin,
Dev. Biol. 167 (1995) 1.[57] A.L. Hall, J. Franke, M. Faure, R.H. Kessin, Dev. Biol. 157
(1993) 73.[58] T. Bretschneider, F. Siegert, C.J. Weijer, Proc. Natl. Acad.
Sci. USA 92 (1995) 4387.[59] K.A. Jermyn, K.T. Duffy, J.G. Williams, Nature 340 (1989)
144.[60] M. Berks, R.R. Kay, Development 110 (1990) 977.[61] N.A. Hopper, C. Anjard, C.D. Reymond, J.G. Williams,
Development 119 (1993) 147.[62] R.D.M. Soede, N.A. Hopper, J.G. Williams, P. Schaap, Dev.
Biol. 177 (1996) 152.[63] A. Early, T. Abe, J. Williams, Cell 83 (1995) 91.[64] S. Matsukuma, A.J. Durston, J. Embryol. Exp. Morphol. 50
(1979) 243.[65] A. De Lozanne, J.A. Spudich, Science 236 (1987) 1086.[66] F. Rivero, B. Koppel, B. Peracino, S. Bozzaro, F. Siegert, C.J.
Weijer, M. Schleicher, R. Albrecht, A.A. Noegel, J. Cell Sci.109 (1996) 2679.
[67] M.L. Springer, B. Patterson, J.A. Spudich, Development 120(1994) 2651.
[68] C.H. Siu. R.K. Kamboj, Dev. Genet. 11 (1990) 377.[69] S.S. Brown, C.L. Rutherford, Differentiation 16 (1980) 173.[70] M. Pahlic, C.L. Rutherford, J. Biol. Chem. 254 (1979) 9703.[71] C. Rutherford, S. Brown, D. Armant, Adv. Cycl. Nucl. Res.
14 (1981) 705.[72] C.L. Saxe III, Y.M. Yu, C. Jones, A. Bauman, C. Haynes,
Dev. Biol. 174 (1996) 202.[73] B. Vasiev, F. Siegert, C. Weijer, Phys. Rev. Lett. 78 (1997)
2489.
35D. Dormann et al. / Biophysical Chemistry 72 (1998) 21–35