Embed Size (px)
Citation preview

3756 Research Article
IntroductionCalcium (Ca2+) is ubiquitous in the environment of free-livingcells as well as in cells in the tissues of plants and animals (Petersenet al., 2005; Case et al., 2007). The soluble concentration of Ca2+
reaches 20–40 mM near osteoporotic fragments in the human bodyand 40 mM in endosteal niches of bone marrow (Silver et al.,1988). The soluble Ca2+ concentration is approximately 1.1–1.3mM in the extracellular fluids of tissues (Breitweiser, 2008) and2.5 mM in blood (Bronner, 1997). Evidence suggests that freeextracellular Ca2+ might play a role as a chemoattractant in additionto cell-type-specific chemoattractants in a variety of developmentalprocesses, including embryonic development (Adams et al., 2006;Chattopadhyay et al., 2007; Reitz et al., 1977), wound healing(Menon et al., 1985; Morris and Chan, 2007), angiogenesis (Aguirreet al., 2010), the immune response (Olszak et al., 2000) and tissuemaintenance (Quarles et al., 1997). For example, mammaliangonadotropin-releasing hormone (GnRH) neurons undergochemotaxis in Ca2+ gradients generated in vitro, which has led tothe hypothesis that Ca2+ gradients in combination with gradients ofthe monocyte chemoattractant protein (MCP-1) regulate GnRHneuron migration during development (Chattopadhyay et al., 2007;Bandyopadhyay et al., 2007). It has also been shown thathematopoietic stem cells from antenatal mice deficient in thecalcium receptor (CaR) fail to migrate from the liver to theendosteal niche of bone marrow (Adams et al., 2006), which, asnoted, contains high concentrations of soluble Ca2+ (Silver et al.,1988). Morris and coworkers (Morris and Chan, 2007)demonstrated that keratinocytes undergo chemotaxis in a Ca2+
gradient in vitro and proposed that, in vivo, calcium and epidermalgrowth factor (EGF) might function together to promote woundhealing, both presumably through chemotaxis. Osteoblasts havebeen shown to undergo chemotaxis in Ca2+ gradients in vitro aswell as in platelet-derived growth factor (PDGF) gradients in vitro(Sugimoto et al., 1993; Godwin and Soltoff, 1997), and monocyteshave been shown to undergo chemotaxis in Ca2+ as well as inchemokine gradients in vitro (Olszak et al., 2000). In addition,macrophages and macrophage-derived foam cells, which areinvolved in generating atherosclerotic lesions (Shi et al., 1996),
and prostate and breast cancer cells also undergo chemotaxis inspatial gradients of Ca2+ in vitro (Liao et al., 2006; Saidak et al.,2009). Finally, Brokaw (Brokaw, 1974) demonstrated that brackenfern spermatozoids undergo chemotaxis in combinatorial gradientsof Ca2+ and bimalate. Together, these observations suggest thatchemotaxis in spatial gradients of Ca2+ might be a generalphenomenon conserved throughout the eukaryotic world in cellsthat have, during evolution, acquired chemotaxis to morespecialized cell-type-specific attractants.
In Dictyostelium discoideum, a model system that has beenhighly effective in elucidating the underlying molecularmechanisms regulating animal cell chemotaxis (Van Haastert et al.,2007; Kay et al., 2008; Janetopoulos and Firtel, 2008; Kolsch etal., 2008; Iglesias and Devreotes, 2008; King and Insall, 2009; Jinet al., 2009), some interesting relationships have been reportedbetween the extracellular cAMP signal and the extracellularconcentration of Ca2+. During D. discoideum aggregation, cellsmove in a directed fashion into an aggregation center throughchemotaxis in gradients of extracellular cAMP that increase anddecrease in the front and back, respectively, of relayed cAMPwaves (Shaffer, 1966; Gerisch et al., 1966; Gerisch et al., 1975).In relaying a cAMP wave, precocious cells in a starved populationrelease pulses of the chemoattractant cAMP that stimulate adjacentcells to release, in turn, a pulse of cAMP (Gerisch et al., 1975;Devreotes and Steck, 1979). Through the activity of extracellularphosphodiesterase, cAMP is then degraded (Chang, 1968; Riedeland Gerisch, 1971; Dinauer et al., 1980), which results in a cAMPsignal that is relayed outwardly through the cell population as anon-dissipating, symmetrical wave (Tomchik and Devreotes, 1981;Soll et al., 2002). The spatial and temporal gradients of cAMP inthe front and back of each relayed wave, which pass across cellson average every 7 minutes, are then assessed by each cell in theaggregating population, resulting in directed movement towardsthe aggregation center in the front of each wave of cAMP (Soll etal., 2002).
When aggregation-competent cells in buffer are challengedglobally by the rapid addition of cAMP, they in turn release cAMP,which is believed to represent the fundamental component of the
Ca2+ chemotaxis in Dictyostelium discoideumAmanda Scherer*, Spencer Kuhl*, Deborah Wessels, Daniel F. Lusche, Brent Raisley and David R. Soll‡
The W. M. Keck Dynamic Image Analysis Facility, Department of Biology, The University of Iowa, Iowa City, IA 52242, USA*These authors contributed equally to this work‡Author for correspondence ([email protected])
Accepted 14 July 2010Journal of Cell Science 123, 3756-3767 © 2010. Published by The Company of Biologists Ltddoi:10.1242/jcs.068619
SummaryUsing a newly developed microfluidic chamber, we have demonstrated in vitro that Ca2+ functions as a chemoattractant of aggregation-competent Dictyostelium discoideum amoebae, that parallel spatial gradients of cAMP and Ca2+ are more effective than either alone,and that cAMP functions as a stronger chemoattractant than Ca2+. Effective Ca2+ gradients are extremely steep compared with effectivecAMP gradients. This presents a paradox because there is no indication to date that steep Ca2+ gradients are generated in aggregationterritories. However, given that Ca2+ chemotaxis is co-acquired with cAMP chemotaxis during development, we speculate on the rolethat Ca2+ chemotaxis might have and the possibility that steep, transient Ca2+ gradients are generated during natural aggregation in theinterstitial regions between cells.
Key words: Chemotactic synergy, Microfluidic chamber, Parallel chemoattractant gradients, Calcium
Jour
nal o
f Cel
l Sci
ence

relay system (Devreotes and Steck, 1979). Challenging cellssuspended in buffer with a global cAMP signal also causes the rapiduptake of Ca2+, followed by release, causing fluctuations in theextracellular concentration of Ca2+ (Bumann et al., 1984; Wick et al.,1978; Bohme et al., 1987; Milne and Coukell, 1988; Moniakis et al.,1999). Moreover, suspended populations of aggregation-competentcells spontaneously and synchronously release pulses of cAMP,generating cAMP oscillations in the supporting medium that areaccompanied by parallel Ca2+ ‘oscillations’ (Bumann et al., 1986;Bohme et al., 1987). Finally, it was recently demonstrated that 10mM Ca2+ in the supporting medium enhances basic cell motility,most notably causing a dramatic increase in velocity, in the presenceof a spatial gradient of cAMP (Lusche et al., 2009; Soll et al., 2009).
Given the role of extracellular Ca2+ in enhancing cell motility,the effects that cAMP has on Ca2+ concentration in the extracellularmedium and, most importantly, the growing list of examples ofeukaryotic cells that have been demonstrated to undergo chemotaxisup Ca2+ gradients as well as gradients of cell-type-specificattractants, we tested whether Ca2+ functioned as a chemoattractantof aggregation-competent D. discoideum amoebae. Because of itslow molecular weight and, therefore, high diffusion constant, wecould not utilize standard spatial gradient chambers, such as thosedeveloped by Zigmond and others (Zigmond, 1977; Shutt et al.,1998) or Boyden chambers (Boyden, 1962), because of theinstability and ambiguity of the gradients generated. We thereforedeveloped a microfluidic chamber that allowed us to test thebehavior of single cells in stable Ca2+, cAMP and combinatorialgradients. Our results demonstrate that aggregation-competent D.discoideum amoebae are capable of undergoing chemotaxis inCa2+ gradients, that Ca2+ chemotaxis appears to be acquired atapproximately the same time as cAMP chemotaxis is acquired inthe developmental program, that an optimum cAMP gradient ismore effective than an optimum Ca2+ gradient in directingchemotaxis, that parallel gradients of cAMP and Ca2+ are more
3757Calcium, a Dictyostelium chemoattractant
effective than either alone, and that in opposing Ca2+ and cAMPgradients, chemotaxis occurs preferentially up the cAMP gradient,but with reduced efficiency. However, we also found that thesteepness of an effective Ca2+ gradient was far higher than that ofan effective cAMP gradient, Moreover, the concentration changein the supporting medium in a suspension culture in response to aglobal cAMP signal (Bumann et al., 1984), and the changes inCa2+ concentration during the Ca2+ oscillations accompanyingcAMP oscillations in suspension cultures (Bumann et al., 1986),could not account for the steep Ca2+ gradients we found to beeffective in vitro. We therefore have discovered a Ca2+ chemotaxissystem acquired when cells acquire the cAMP chemotaxis systemin D. discoideum, but are limited to speculating on the possibilitythat steep gradients form and on the role that Ca2+ chemotaxismight play during aggregation.
ResultsThe microfluidic chamberA microfluidic chamber (Fig. 1A–D) was designed in collaborationwith Translume (Ann Arbor, MI) that could generate stable spatialgradients of both low and high molecular weight molecules(unpublished results from this laboratory). Fluid flow was initiatedthrough two reservoir pumps (Fig. 1A, a and b), and the fluidsfrom the two flowed side by side into a square tube. To generate agradient, one reservoir was filled with buffer alone and the otherwith buffer plus chemoattractant. The two fluids were pumpedthrough ports a and b, respectively, meeting at an interface (Fig.1B) where the adjacent fluids were directed through a single squarechannel containing a sequence of chevrons etched into the ceilingof the square tube (Fig. 1C); these chevrons acted as micromixersmediating rapid and controlled mixing in a short path perpendicularto flow (Kaplan et al., 2004; Golden et al., 2007). Cells wereinjected through an injection port onto the floor of the square tubeof the chamber in the area of observation (Fig. 1D) downstream of
Fig. 1. Customized microfluidic chambermanufactured by Translume from optically clear,fused silica according to our specifications.(A)Diagram of microfluidic chamber. The channel isa square tube with sides of 300m and a length of 28mm, shown in blue Two programmable pumps controlthe flow rates from reservoirs a and b. (B)Theinterface of solutions a and b can be visualized byexcitation of fluorescein (released by reservoir a) atthe intersection of the inlet ports with the channel.(C)As solutions a and b flow through the chamber,they encounter a series of chevron micromixers. Thegradient is generated perpendicular to the direction offlow. (D)The area of observation in the channel isadjacent to the cell injection port; the latter is wherethe cell suspension is introduced into the channel.Efflux occurs through tubing connected to the outletport. (E–H) Gradient steepness is controlled by theflow rate of the pumps and plotted at different flowrates from data obtained when reservoir a containedfluorescein. The steepness of the concentrationgradient of this fluorophore across the width of thechamber was determined using 2D-DIAS software(Soll, 1995) and provided in each plot in nM/m.(I)The stability of the gradient was demonstrated bymeasuring fluorescence in images of the channel at 1,10 and 20 minutes.
Jour
nal o
f Cel
l Sci
ence
the chevrons, and imaged with an inverted microscope. The seriesof chevrons machined into the silica glass ceiling of the squaretube (Fig. 1C) created controlled, flow-based eddies for mixing. Astable chemotactic gradient was thus generated perpendicular tothe direction of flow in the area of observation, which lackedchevrons (Fig. 1D). The shapes and stability of the gradients weredemonstrated by fluorophores with molecular weights rangingfrom 332 to 10,000 Da, with the dyes fluorescein (332 Da), AlexaFluor 488, (570 Da), and Alexa Fluor 488 conjugated to dextran(10,000 Da). As demonstrated in Fig. 1E–H for fluorescein, thesteepness of near-linear gradients of fluorescein could be controlledby flow rate. Gradients across the cells became stable within 10seconds and remained stable thereafter, as shown in Fig. 1I. Theflow rate generated a stable gradient of fluorescein with a steepnessof 0.833 nM/m over a 10 minute period. Gradient steepness couldbe changed or the gradient reversed in less than 30 seconds (datanot shown). The gradients of the three tested fluorescent moleculesgave similarly near-linear gradients (data not shown), suggestingthat diffusion was not a major factor in determining the shape ofthe gradient in this chamber, at least in the tested molecular weightrange and rate of flow employed. Because no fluorescent moleculeswere available in the molecular weight range of Ca2+ (40 Da), wecould only assume that the shape of the gradient was linear, but
3758 Journal of Cell Science 123 (21)
diffusion due to the low molecular weight of Ca2+ might occur andcause a nonlinear gradient.
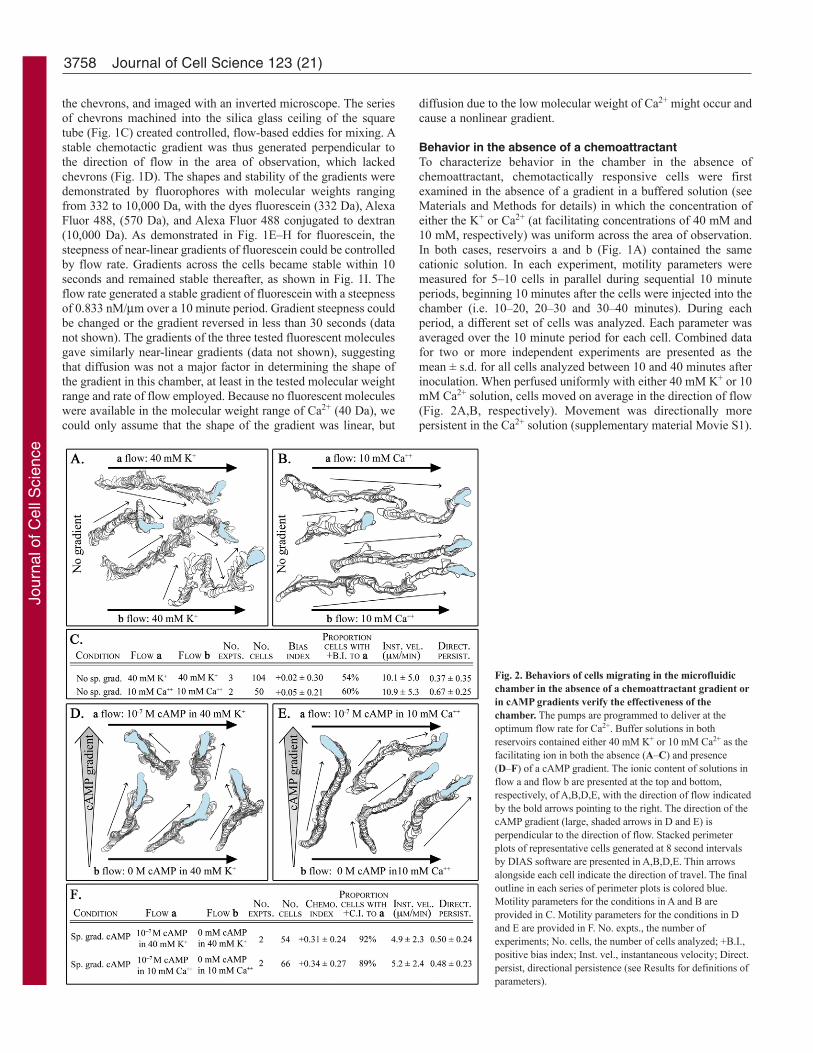
Behavior in the absence of a chemoattractantTo characterize behavior in the chamber in the absence ofchemoattractant, chemotactically responsive cells were firstexamined in the absence of a gradient in a buffered solution (seeMaterials and Methods for details) in which the concentration ofeither the K+ or Ca2+ (at facilitating concentrations of 40 mM and10 mM, respectively) was uniform across the area of observation.In both cases, reservoirs a and b (Fig. 1A) contained the samecationic solution. In each experiment, motility parameters weremeasured for 5–10 cells in parallel during sequential 10 minuteperiods, beginning 10 minutes after the cells were injected into thechamber (i.e. 10–20, 20–30 and 30–40 minutes). During eachperiod, a different set of cells was analyzed. Each parameter wasaveraged over the 10 minute period for each cell. Combined datafor two or more independent experiments are presented as themean ± s.d. for all cells analyzed between 10 and 40 minutes afterinoculation. When perfused uniformly with either 40 mM K+ or 10mM Ca2+ solution, cells moved on average in the direction of flow(Fig. 2A,B, respectively). Movement was directionally morepersistent in the Ca2+ solution (supplementary material Movie S1).
Fig. 2. Behaviors of cells migrating in the microfluidicchamber in the absence of a chemoattractant gradient orin cAMP gradients verify the effectiveness of thechamber. The pumps are programmed to deliver at theoptimum flow rate for Ca2+. Buffer solutions in bothreservoirs contained either 40 mM K+ or 10 mM Ca2+ as thefacilitating ion in both the absence (A–C) and presence(D–F) of a cAMP gradient. The ionic content of solutions inflow a and flow b are presented at the top and bottom,respectively, of A,B,D,E, with the direction of flow indicatedby the bold arrows pointing to the right. The direction of thecAMP gradient (large, shaded arrows in D and E) isperpendicular to the direction of flow. Stacked perimeterplots of representative cells generated at 8 second intervalsby DIAS software are presented in A,B,D,E. Thin arrowsalongside each cell indicate the direction of travel. The finaloutline in each series of perimeter plots is colored blue.Motility parameters for the conditions in A and B areprovided in C. Motility parameters for the conditions in Dand E are provided in F. No. expts., the number ofexperiments; No. cells, the number of cells analyzed; +B.I.,positive bias index; Inst. vel., instantaneous velocity; Direct.persist, directional persistence (see Results for definitions ofparameters).
Jour
nal o
f Cel
l Sci
ence
The majority of cells were firmly attached to the substratum (i.e.did not peel off from the surface during the experiment) andpolarized on average in the general direction of flow. Cellulartranslocation occurred through pseudopod extension. In order toverify that in the absence of chemoattractant, there was no biastowards the left or right of the chamber, a ‘bias index’ (BI) wascomputed as the net distance traveled towards the a-flow side (Fig.1A) divided by the total distance traveled. The a-side was pickedarbitrarily. Unbiased movement would result in an average BIclose to 0.00 (+0.14 to –0.14); biased movement towards the a-flow side would result in a BI of between +0.15 and +1.00; andbiased movement towards the b-flow side would result in anaverage BI of between –0.15 and –1.00. Unbiased movementwould result in approximately 50% (41–59%) of cells with apositive BI (i.e. in the direction of the a-flow side); biasedmovement toward the a-flow side would result in a value ofapproximately 60–100%; and biased movement toward the b-flowside would result in a value of 0–40%.
The average BI in uniform 40 mM K+ or uniform 10 mM Ca2+
was +0.02±0.30 and +0.05±0.21, respectively (Fig. 2C). Thepercentage of cells with a positive BI was 54 and 60%, respectively.The average instantaneous velocity was relatively high in bothcationic solutions, but the average directional persistence parameterwas higher in 10 mM Ca2+ than in 40 mM K+ (Fig. 2C), which hadbeen suggested by the respective cell tracks in Fig. 2A and 2B,respectively. These results demonstrated strong flow-directedtranslocation, but no bias towards either side of the microfluidicchamber in the absence of a chemoattractant gradient. These resultsalso suggested that Ca2+ was more effective in facilitating persistentflow-directed translocation than K+, which is consistent withobservations by Fache and coworkers (Fache et al., 2005).
Behavior in a cAMP gradientTo demonstrate the efficacy of the microfluidic chamber forchemotaxis, a gradient of the known chemoattractant cAMP wasgenerated either in a uniform solution of 40 mM K+ or in a uniformsolution of 10 mM Ca2+ at a flow rate of 13 l/minute. As describedlater in this report, this flow rate was empirically ascertained togenerate an optimum Ca2+ gradient, not an optimum cAMPgradient, and was used here for comparative reasons. Theconcentration of cAMP in flow a was 0.1 M, and flow b containedbuffer alone. The steepness of the gradient was approximately 0.33nM/m, a change of 3.3% per 10 m, which was close to the valueof 0.1 nM/m that Song and coworkers (Song et al., 2006) foundto be optimal, and close to the value of less than 5% per 10 mreported by Fuller and coworkers (Fuller et al., 2010) to be optimalthrough different concentration ranges.
Chemotaxis was assessed by two parameters: the chemotacticindex (CI) and the percentage of cells moving up the concentrationgradient (positive chemotaxis). The CI was computed as the netmovement towards the source of cAMP (i.e. the side of the chamberwith flow from the reservoir containing chemoattractant) dividedby the total distance moved. If cells did not undergo chemotaxis,the CI would be approximately 0.00 (i.e. +0.14 to –0.14) and thepercentage of cells undergoing positive chemotaxis approximately50% (41–59%); if cells underwent positive chemotaxis, the CIwould be between +0.15 and +1.00, and positive chemotaxis 60–100%; and if cells underwent negative chemotaxis, the CI wouldbe between –0.15 and –1.00, and positive chemotaxis 0–40% (Soll,1995). Motility parameters were computed as described for cellsin uniform K+ and Ca2+ solutions.
3759Calcium, a Dictyostelium chemoattractant
In a cAMP gradient generated in a uniform 40 mM K+ solution,the majority of cells moved up the cAMP gradient in the directionof increasing concentration (Fig. 2D), with an average CI of+0.31±0.24 and positive chemotaxis of 92% (Fig. 2F). In a cAMPgradient generated in a uniform 10 mM Ca2+ solution, the majorityof cells also moved in the direction of the cAMP gradient (Fig. 2E)with a similar average CI of +0.34±0.27 and a similar positivechemotaxis of 89% (Fig. 2F). In cAMP gradients in both 40 mMK+ and 10 mM Ca2+ solutions, cells moved on average in thegeneral direction of the increasing cAMP gradient, but at an anglebetween that of the gradient and that of flow (Fig. 2D,E), indicatingthat the direction of cellular translocation was affected by boththe mechanical forces of flow and the cAMP gradient. Theinstantaneous velocities achieved in cAMP gradients (Fig. 2F)were lower than those achieved in the absence of cAMP, when thesame flow rate was used in a homogeneous Ca2+ solution (Fig.2C).
To assess the effectiveness of the chamber for a cAMP gradientwith a more optimum steepness (Song et al., 2006; Fuller et al.,2010), the flow rate from each reservoir was halved to 7 l/minute,which resulted in a stable gradient with a steepness ofapproximately 0.19 nM/m, a decrease of approximately one third.These experiments were performed in a uniform 10 mM Ca2+
solution. The CI under these conditions for the first 20 minuteswas +0.46±0.03 (n45). The cells moved so persistently andefficiently up the cAMP gradient that they rapidly accumulated atthe a-flow side of the chamber wall and, therefore, could not bemonitored after 20 minutes. These results validated the effectivenessof the chamber we developed for assessing chemotaxis.
Chemotaxis in a Ca2+ gradientTo test for Ca2+ chemotaxis, aggregation-competent cells weretreated with stable spatial gradients of Ca2+, employing aconcentration of 10 mM, the optimum concentration for facilitatingpolarity and motility (Lusche et al., 2009), in reservoir a. Reservoirb contained buffer alone (i.e. lacking added Ca2+). Theconcentration in the source channel was in the millimolar range, inagreement with the concentration found necessary in the sourcereservoir of Boyden chambers to elicit chemotaxis of a variety ofanimal cells. Reported concentrations included 5 mM forosteoblasts (Godwin and Soltoff, 1997), 3.5 mM for neurons(Chattopadhyay et al., 2007), 4.5 mM for monocytes (Olszak et al.,2000) and 3–10 mM for bone-marrow-derived Flk-1+ CD34+progenitor cells (Aguirre et al., 2010). Preliminary qualitativeanalyses of chemotaxis based on the orientation of cellulartranslocation suggested that flow rates of 13–15 l/minute perreservoir resulted in optimum movement in the direction ofincreasing Ca2+. This established an estimated gradient of 33M/m, a change of 3.3% per 10 m, based on the assumption (aspreviously discussed) that the Ca2+ gradient was linear.
Cells in a Ca2+ gradient moved on average in the direction ofincreasing Ca2+, and did so at an angle between the direction of thegradient and the direction of flow (Fig. 3A; supplementary materialMovie S2), as was the case for cAMP chemotaxis under similarflow conditions (Fig. 2D,E). The average CI for the pooled cells(n112) of six experiments was +0.20±0.22, and the proportion ofcells with a positive CI was 84% (Fig. 3D). When the gradient wasgenerated in the microfluidic chamber in the reverse direction (i.e.10 mM Ca2+ solution in reservoir b and buffer alone in reservoira), the direction of translocation reversed (Fig. 3B), again excludingthe possibility of directional bias owing to a chamber artifact. The
Jour
nal o
f Cel
l Sci
ence

translocation of these cells in a Ca2+ gradient over a 10 minuteperiod is presented in Fig. 3C. These results demonstrate that Ca2+
functions as a chemoattractant for aggregation-competent D.discoideum amoebae. It should be noted, however, that even in anoptimum Ca2+ gradient, the average CI, a reflection of chemotacticefficiency, appeared to be lower than in an optimum or evensuboptimum gradient of cAMP (+0.20±0.22 versus +0.34±0.27 or+0.31±0.24, respectively) and the percentage of cells undergoingpositive chemotaxis was slightly lower (84 versus 92 or 89%,respectively).
A dose-response analysis was performed in which the Ca2+
concentration in the a-flow channel (the Ca2+ source for thegradient) was varied, but the flow rate was maintained at 15l/minute. The concentration that gave a 100% response was 10mM; a 50% response was obtained at 1 mM and a 10% response,estimated from the curve (Fig. 3E), at 20 M. The estimatedsteepness of the gradient, based on the assumption that the gradientswere linear, was 33 M/m for maximum response, 3.3 M/mfor 50% response and approximately 66 nM/m for a 10% response.Surprisingly, if the steepness of the Ca2+ gradient was dampenedby generating a gradient in which flow a contained 10 mM Ca2+
and flow b contained 1 mM Ca2+, the average CI was close to 0.0and the positive chemotaxis close to 50%. If diffusion were not afactor, this would amount to only a 10% decrease in steepness incomparison to a gradient generated with 0 mM Ca2+ in flow b. Theresult could be explained if diffusion represented an effector ofsteepness at a flow rate of 15 l/minute. Diffusion from flow apartially countered by diffusion from flow b would result in asigmoidal gradient. Lowering the flow rate to 7 l/minute, but
3760 Journal of Cell Science 123 (21)
maintaining 10 mM Ca2+ in flow a and buffer alone in flow b, hadan effect on chemotaxis similar to adding 1 mM Ca2+ to flow b. Ata flow rate of 7 l/minute, the CI was close to zero and at 11l/minute it was close to 0.09. At 13 l/minute, the CI reached amaximum greater than +0.20, which was maintained through aflow rate of 15 l/minute. The change in steepness between flowrates of 7 and 15 l/minute, based on the assumption that gradientsof Ca2+ are linear and diffusion is not a factor, would have resultedin a decrease in steepness of 28%, which should have only a minoreffect on chemotactic efficiency. Halving the flow rate, however,could have had a dramatic effect on Ca2+ diffusion which, in turn,would have had a dramatic effect on the shape of the gradient.
Reversing the gradient during Ca2+ chemotaxisBecause the microfluidic chamber we developed allowed rapidreversal of a spatial gradient, we tested the effects of changing thedirection of a Ca2+ gradient on cellular behavior. Cells undergoingchemotaxis in a spatial gradient of Ca2+ changed direction within1 minute of gradient reversal, as demonstrated in the tracks of thetwo representative cells in Fig. 4A,B. Difference pictures of cellswere generated during reversal, in which the perimeter image of acell at each time point was superimposed upon the perimeter imagethat had been generated 10 seconds earlier (Soll, 1995). The regionsin the later image not overlapping the earlier image were considered‘expansion zones’ and color-coded green, and the regions in theearlier image not overlapping the later image considered‘contraction zones’ and color-coded red (Fig. 4C). Expansion zoneshave been shown to correlate with the position of extending newlateral pseudopods (Soll, 1995) or expansion of a portion of a prior
Fig. 3. Cells undergo chemotaxis in a Ca2+ gradient.(A)Perimeter tracks of representative cells undergoingchemotaxis in a gradient of Ca2+ increasing from bottom totop. (B)Perimeter tracks of representative cells undergoingchemotaxis in a gradient of Ca2+ increasing from top tobottom. (C)Raw images of cells, viewed throughbrightfield microscopy, undergoing chemotaxis up a Ca2+
gradient. (D)Motility and chemotaxis parameters of cellsundergoing chemotaxis in a Ca2+ gradient. The direction ofthe gradients was perpendicular to the direction of flow. Agradient of Ca2+ (A) was generated by filling reservoir awith 10 mM Ca2+ in TB, and reservoir b with TB alone.The contents of the reservoirs are reversed in B. The pumpsare programmed to deliver at the optimum flow rate forCa2+. The large shaded arrows in A–C indicate thedirections of the Ca2+ gradients. See Fig. 2 for additionaldetails. (E) Dose–response curve for Ca2+ chemotaxis inwhich the CI was used to measure the response. Small dotson the x-axis indicate that the concentration approaches 0 asit tends to infinity.
Jour
nal o
f Cel
l Sci
ence

anterior pseudopod at an angle to the direction of prior translocation,a process that has been referred to as ‘splitting’ (Andrew andInsall, 2007). For simplicity, we will refer to both types of expansionas ‘lateral pseudopod formation’. During the period immediatelyfollowing gradient reversal, cells extended lateral pseudopods bothin the new direction of increasing Ca2+ concentration and in thatof decreasing Ca2+ concentration, and then moved in the directionof the lateral pseudopod that had extended in the direction ofincreasing concentration (Fig. 4C). By tracking the position of theuropod of each cell, which possessed a visible cluster of tail fibersunder the microscopic conditions employed (Heid et al., 2005)(not shown here), it was clear that the uropod retained its integrityand followed the direction of the lateral pseudopod that extendedin the correct direction, a turn similar to that described for cellsturning in the absence of attractant (Soll et al., 2009). Fiveadditional cells experiencing gradient reversal exhibited similarpseudopod dynamics to the one represented in Fig. 4C (data notshown).
Responses to a global Ca2+ signal and temporal Ca2+
gradientsWhen cAMP, at a concentration equal to that at the peak of anatural wave, is rapidly added to D. discoideum cells translocatingin buffer, they ‘cringe’ (Futrelle et al., 1982; Futrelle, 1982; Wesselset al., 1989). In the first 30 seconds, the cringe includes a dramaticdecrease in velocity, rounding up, blebbing, the relocalization ofmyosin from the cytoplasm to cortex and a spike in F-actinconcentration (Hall et al., 1988; Yumura and Fukui, 1985; Condeeliset al., 1990; Wessels et al., 1989; Postma et al., 2003). When 10mM Ca2+ solution was added to cells translocating in 40 mM K+
solution, there was a similar immediate decrease in velocity from11.9±1.9 m/min to 6.8±1.0 m/min (n20), but cells did notround up. Instead, they became highly active in lateral pseudopodformation. This response shared at least one aspect of a cAMPcringe, a dramatic decrease in velocity, but differed otherwise.
D. discoideum cells can also be challenged in a perfusionchamber with temporal waves of cAMP at 7 minute intervals,which roughly mimic the temporal dynamics of an average naturalcAMP wave in the absence of established spatial gradients ofcAMP. Under these conditions, cells undergo behavioral and
3761Calcium, a Dictyostelium chemoattractant
morphological changes in the increasing temporal gradient in thefront of each wave, and decreasing temporal gradient in the back,similar to the changes in the front and back of natural waves(Varnum et al., 1985; Wessels et al., 1992). When challenged withsimilar temporal gradients of Ca2+ at 7 minute intervals, with peakconcentrations of 20 mM and troughs below 0.20 mM, similarbehavioral changes did not occur (data not shown), providing noindication that D. discoideum amoebae could assess temporalwaves of Ca2+ as they do temporal waves of cAMP.
Parallel gradients of cAMP and Ca2+
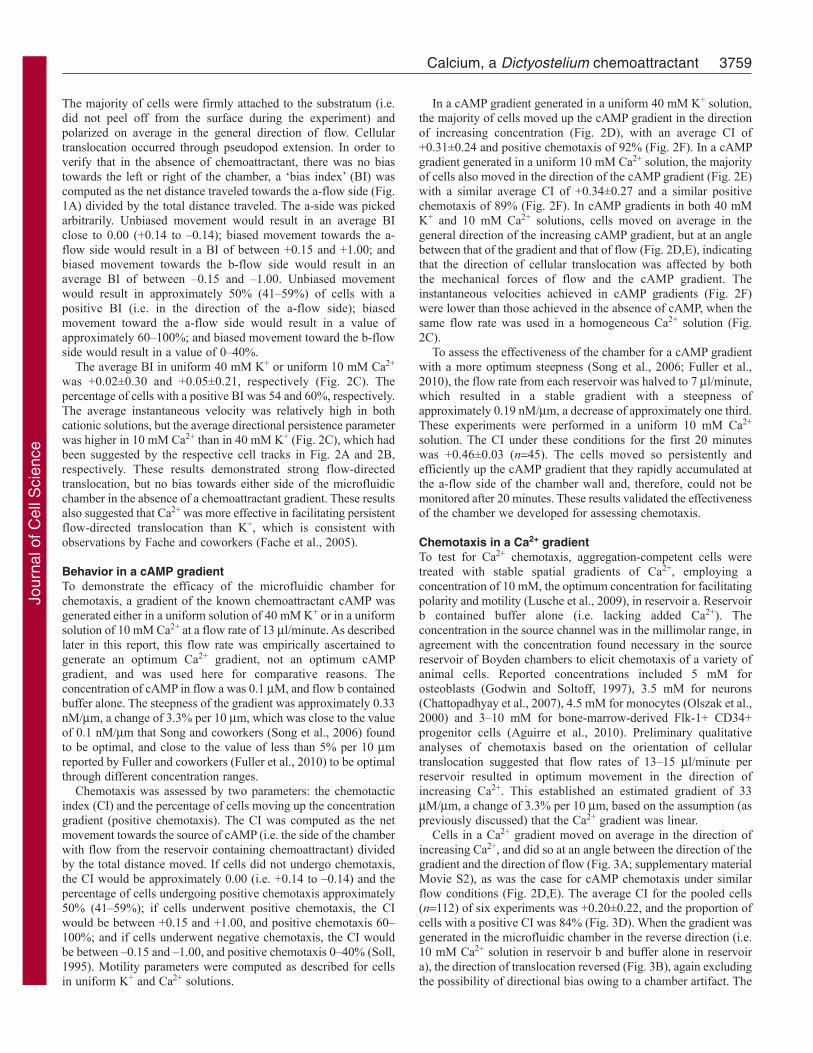
We next analyzed the behavior of cells in parallel gradients ofcAMP and Ca2+, generated simultaneously in the same direction.The flow conditions we used were optimum for generating themost efficient Ca2+ gradient. In parallel spatial gradients of cAMPand Ca2+, in which a solution of 10 mM Ca2+ plus 0.1 M cAMPflowed from reservoir a and buffer alone from reservoir b, cellsmoved up the parallel gradients of Ca2+ and cAMP in a highlypersistent and directional manner (Fig. 5). The CI for cells analyzedbetween 10 and 40 minutes after inoculation was +0.42±0.28 (Fig.5C), which was higher than that for cells in a cAMP gradient aloneunder similar flow conditions, which averaged +0.34±0.27 (Fig.2F), and higher than that for cells in a Ca2+ gradient alone, whichaveraged +0.20±0.22 (Fig. 3D). The CI in parallel gradients wason average 24% higher than the CI in a cAMP gradient alone, and110% higher than a Ca2+ gradient alone; the differences werereproducible. The differences in the mean CI for cells in parallelgradients versus that of cells in either a cAMP gradient alone or aCa2+ gradient alone were significant, with P-values of 4�10–2 and6�10–6, respectively. The percentage of cells undergoing positivechemotaxis in parallel gradients (90%), however, was similar tothat of cells in a cAMP gradient alone (89%) or a Ca2+ gradientalone (84%), indicating that parallel gradients caused a greaterincrease in chemotactic efficiency than in positive chemotaxis.Similar results were obtained when the Ca2+ gradient alone or theparallel Ca2+ plus cAMP gradients were generated in TBsupplemented with 40 mM K+ (data not shown). The CI in a Ca2+
gradient, a cAMP gradient and combined gradients exhibited ahierarchy of Ca2+ + cAMP>cAMP>Ca2+, as was the case withgradients generated in TB alone.
Fig. 4. Cells undergoing chemotaxis in a spatialgradient of Ca2+ change direction upon gradientreversal through lateral pseudopod extension.(A,B)The behavior of representative cells upongradient reversal at 11 minutes (vertical dashedline). The average CI is presented for each cellfollowing the initial and reversed gradient.(C)Difference pictures of the cell in A before andafter reversal. Green areas are expansion zones andred areas are contraction zones. Arrows denotedirection of translocation. Green arrows denotedirection of gradients.
Jour
nal o
f Cel
l Sci
ence
Opposing gradients of cAMP and Ca2+
We next tested the response of cells to opposing gradients ofcAMP and Ca2+. Because it appeared that even under conditionsoptimum for a Ca2+gradient, but not for a cAMP gradient, thelatter elicited a higher average CI, we predicted that cells inopposing cAMP and Ca2+ gradients would on average chemotaxtowards cAMP, but less efficiently. That was the result obtained.Cell behavior was analyzed in the chamber in which the a-channel contained 0.1 M cAMP solution and the b-channelcontained 10 mM Ca2+ solution. The majority of cells in opposinggradients underwent chemotaxis up the cAMP gradient, but at areduced positive chemotaxis of 77%. The efficiency of chemotaxiswas also reduced, as indicated by a CI of +0.19±0.24 (Fig. 5C),roughly two thirds the value obtained in a cAMP gradient alone(Fig. 2F).
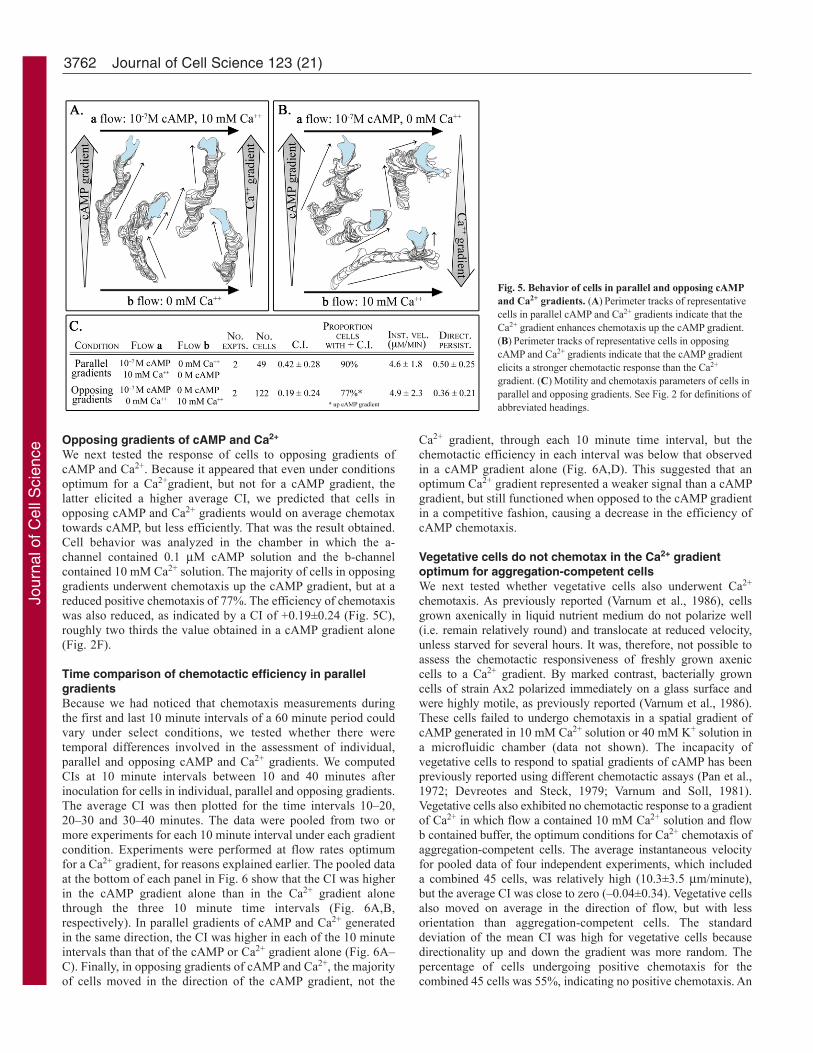
Time comparison of chemotactic efficiency in parallelgradientsBecause we had noticed that chemotaxis measurements duringthe first and last 10 minute intervals of a 60 minute period couldvary under select conditions, we tested whether there weretemporal differences involved in the assessment of individual,parallel and opposing cAMP and Ca2+ gradients. We computedCIs at 10 minute intervals between 10 and 40 minutes afterinoculation for cells in individual, parallel and opposing gradients.The average CI was then plotted for the time intervals 10–20,20–30 and 30–40 minutes. The data were pooled from two ormore experiments for each 10 minute interval under each gradientcondition. Experiments were performed at flow rates optimumfor a Ca2+ gradient, for reasons explained earlier. The pooled dataat the bottom of each panel in Fig. 6 show that the CI was higherin the cAMP gradient alone than in the Ca2+ gradient alonethrough the three 10 minute time intervals (Fig. 6A,B,respectively). In parallel gradients of cAMP and Ca2+ generatedin the same direction, the CI was higher in each of the 10 minuteintervals than that of the cAMP or Ca2+ gradient alone (Fig. 6A–C). Finally, in opposing gradients of cAMP and Ca2+, the majorityof cells moved in the direction of the cAMP gradient, not the
3762 Journal of Cell Science 123 (21)
Ca2+ gradient, through each 10 minute time interval, but thechemotactic efficiency in each interval was below that observedin a cAMP gradient alone (Fig. 6A,D). This suggested that anoptimum Ca2+ gradient represented a weaker signal than a cAMPgradient, but still functioned when opposed to the cAMP gradientin a competitive fashion, causing a decrease in the efficiency ofcAMP chemotaxis.
Vegetative cells do not chemotax in the Ca2+ gradientoptimum for aggregation-competent cellsWe next tested whether vegetative cells also underwent Ca2+
chemotaxis. As previously reported (Varnum et al., 1986), cellsgrown axenically in liquid nutrient medium do not polarize well(i.e. remain relatively round) and translocate at reduced velocity,unless starved for several hours. It was, therefore, not possible toassess the chemotactic responsiveness of freshly grown axeniccells to a Ca2+ gradient. By marked contrast, bacterially growncells of strain Ax2 polarized immediately on a glass surface andwere highly motile, as previously reported (Varnum et al., 1986).These cells failed to undergo chemotaxis in a spatial gradient ofcAMP generated in 10 mM Ca2+ solution or 40 mM K+ solution ina microfluidic chamber (data not shown). The incapacity ofvegetative cells to respond to spatial gradients of cAMP has beenpreviously reported using different chemotactic assays (Pan et al.,1972; Devreotes and Steck, 1979; Varnum and Soll, 1981).Vegetative cells also exhibited no chemotactic response to a gradientof Ca2+ in which flow a contained 10 mM Ca2+ solution and flowb contained buffer, the optimum conditions for Ca2+ chemotaxis ofaggregation-competent cells. The average instantaneous velocityfor pooled data of four independent experiments, which includeda combined 45 cells, was relatively high (10.3±3.5 m/minute),but the average CI was close to zero (–0.04±0.34). Vegetative cellsalso moved on average in the direction of flow, but with lessorientation than aggregation-competent cells. The standarddeviation of the mean CI was high for vegetative cells becausedirectionality up and down the gradient was more random. Thepercentage of cells undergoing positive chemotaxis for thecombined 45 cells was 55%, indicating no positive chemotaxis. An
Fig. 5. Behavior of cells in parallel and opposing cAMPand Ca2+ gradients. (A)Perimeter tracks of representativecells in parallel cAMP and Ca2+ gradients indicate that theCa2+ gradient enhances chemotaxis up the cAMP gradient.(B)Perimeter tracks of representative cells in opposingcAMP and Ca2+ gradients indicate that the cAMP gradientelicits a stronger chemotactic response than the Ca2+
gradient. (C)Motility and chemotaxis parameters of cells inparallel and opposing gradients. See Fig. 2 for definitions ofabbreviated headings.
Jour
nal o
f Cel
l Sci
ence
analysis of cells in a Ca2+ gradient generated in TB supplementedwith 40 mM K+ also resulted in a CI close to 0.0 (data not shown).These results indicate that although vegetative cells grown in thepresence of bacteria are highly motile, they do not exhibit achemotactic response to the Ca2+ gradient effective for aggregation-competent cells. This does not rule out the possibility that a gradientof different steepness would be effective, although qualitativeexperiments performed at lower and higher Ca2+ concentrations inflow a failed to reveal chemotaxis (data not shown).
DiscussionCa2+ facilitation of cell motilityThe extracellular concentration of Ca2+ has been shown to facilitatemotility in cells from bacteria to vertebrates. For instance, thenonflagellated marine cyanobacterium Synechococcus requires aminimum extracellular Ca2+ concentration of 2 mM (Pitta et al.,1997), and flagellated sea urchin sperm require an extracellularCa2+ concentration of 9 mM (Young and Nelson, 1974) to attainmaximum velocity. These facilitating concentrations are close tothe concentration of soluble Ca2+ in seawater, which isapproximately 10 mM (Goldberg et al., 1971). It might thereforebe no coincidence that the extracellular concentration of Ca2+
necessary to attain optimum motility of D. discoideum amoebae invitro is 10 mM (Lusche et al., 2009). Amoebae are found at highdensities in soil (Raper, 1935), in which the soluble concentrationof Ca2+ ranges from 3 to 12 mM (Bangerth, 1979; McLaughlin andWimmer, 1999), and in manure (Gilbert et al., 2009), in which the
3763Calcium, a Dictyostelium chemoattractant
Ca2+ concentration is usually far higher than 10 mM (Sager, 2007;Qian et al., 2005). Maeda (Maeda, 1970) demonstrated over 40years ago that D. discoideum amoebae aggregate relatively normallyin very high concentrations of Ca2+ (approaching 100 mM). In avariety of niches in the vertebrate body, the concentration of solubleCa2+ has also been found to be, as previously noted, in themillimolar range (Menon et al., 1985; Silver et al., 1988; Adamset al., 2006; Breitwieser, 2008; Olzsak et al., 2000). Consistentwith these findings, there is evidence that extracellularconcentrations of Ca2+ between 1 and 10 mM are optimum forvertebrate cell motility (Nemeth, 1995; Dvorak et al., 2004; Morrisand Chan, 2007).
Ca2+ chemotaxis in generalIn addition to facilitating basic cell motility, it has been shown thatspatial gradients of extracellular Ca2+ induce chemotaxis of asurprisingly wide variety of cell types in vitro. Brokaw (Brokaw,1974) demonstrated that bracken fern spermatozoids undergochemotaxis up combinatorial gradients of Ca2+ and bimalate. Ca2+
alone has been demonstrated as a chemoattractant for an ever-increasing number of cell types, including gonadotropin-releasinghormone (GnRH) neurons (Chattopadhyay et al., 2007),hematopoietic stem cells (Lapidot and Kollet, 2002; Adams et al.,2006), keratinocytes (Menon et al., 1985), osteoblasts (Godwinand Soltoff, 1977) and monocytes (Olszak et al., 2000). However,chemotaxis has been demonstrated in most of these cases in vitro,primarily using Boyden chambers (Boyden, 1962), without
Fig. 6. Comparison of chemotacticindices for cells migrating in themicrofluidic chamber. (A)Cells migratedin the presence of a cAMP gradient inuniform 10 mM Ca2+, (B) in a Ca2+
gradient only, (C) in a parallel gradient ofcAMP and Ca2+, and (D) in opposingcAMP and Ca2+ gradients. Solutions inflow a and flow b are indicated at the topof each panel and the large, shaded arrowsindicate the direction(s) of the respectivegradients. The average CI is plotted foreach gradient condition at 10–20 minutes,20–30 minutes, and 30–40 minutes afterinoculation of cells in the chamber. The CIof individual cells over the entire 10–40minute time period is plotted in the bargraph at the bottom of each panel. Valuesfor average CI (Avg. C.I.), percentage ofcells with positive CI (%+C.I.), andpercentage of cells with a CI greater than+0.50 (%C.I. > +0.50) are given for thegradient condition in each panel.
Jour
nal o
f Cel
l Sci
ence

quantitative comparisons to cell-type-specific attractants andwithout testing parallel or opposing gradients. Here, we haveperformed such an analysis and demonstrated that aggregation-competent D. discoideum amoebae undergo positive chemotaxisup spatial gradients of Ca2+ generated in a microfluidic chamberthat have been estimated to be relatively steep in comparison toeffective cAMP gradients in the same chamber; that chemotaxis inan optimum Ca2+ gradient is not as efficient as that in a cAMPgradient; that a parallel spatial gradient of Ca2+ enhanceschemotaxis up a spatial gradient of cAMP; and that Ca2+ chemotaxisappears to be acquired during the preaggregation period of thedevelopmental program, when cAMP chemotaxis is acquired(Klein, 1988).
The microfluidic chamber and flow-induced motilityIn order to test for Ca2+ chemotaxis in D. discoideum amoebae, wedeveloped with Translume, a chamber with a number of assets.The chamber was built of fused silica glass, which provides a highlevel of optical clarity and can be reutilized indefinitely. It can beused at most natural and physiological temperatures, and withvarying rates of flow. It provides stable gradients that form within10 seconds and that can be changed or reversed within 30 seconds.Using the response of D. discoideum cells to cAMP to verify theefficacy of the chamber, we demonstrated that the proportion ofcells in the area of observation undergoing positive chemotaxisapproached 100% in most experiments. In both cAMP and Ca2+
gradients, we have consistently obtained 85–100% of the entirecell population undergoing chemotaxis. Using available fluorescentmolecules through a range of molecular weights (332, 570 and10,000 Da), we demonstrated that, at least in this range, thegenerated gradients were nearly linear. By extrapolation, we haveassumed that the same was true for Ca2+, which has a molecularweight of 40 Da. However, because low molecular weightfluorescent molecules were unattainable, this remains anassumption. Diffusion could play a role in the gradients generatedin the chamber for very low molecular weight molecules like Ca2+.In such cases, the gradients might not be linear across the area ofobservation in the chamber. The results of experiments in whichsteepness was flattened by adding 10 mM Ca2+ to flow a and 1mM Ca2+ to flow b, combined with the data obtained fromexperiments in which flow rate was reduced, suggest that diffusionindeed influences the shape of optimum Ca2+ gradients.
The one drawback to our chamber is the rate of flow necessaryto establish a gradient of a low molecular weight molecule such asCa2+. Shear has been shown to induce D. discoideum motility inthe direction of flow (Decave et al., 2002a; Decave et al., 2002b;Decave et al., 2003; Fache et al., 2005), which appears to involvestretch-activated calcium channels (Lombardi et al., 2008). Wefound that the high flow rates necessary for generating a Ca2+
gradient in our chamber similarly caused flow-directed motility.When subjected either to a cAMP or Ca2+ gradient at these highflow rates, the flow signal, combined with the chemotactic gradientcaused movement in a direction between the flow vector and thegradient vector. This did not, however, hamper our capacity toassess the chemotactic responsiveness of cells to cAMP and Ca2+
gradients.
The steepness of the Ca2+ gradientWe found the effective concentration of Ca2+ in the source flow (aflow) to be extremely high compared with the effectiveconcentration of cAMP. As noted, we estimated the optimum Ca2+
3764 Journal of Cell Science 123 (21)
gradient in the microfluidic chamber, assuming linearity, to beapproximately 33 M/m, which is 105 times that of an effectivecAMP gradient in the same chamber. This apparently largedifference is consistent with the difference in the binding constantsof the cAMP receptor of D. discoideum and the Ca2+ receptorsanalyzed in animal cells. The binding constant of the cAMPreceptor is 25±8 nM (Johnson et al., 1992), whereas that of themost carefully analyzed animal cell Ca2+-sensing receptor is 4.2–18.6 mM (Huang et al., 2007), again a difference of approximately105. Because of this difference, the concentration differential ofCa2+ that actually binds along the length of a cell might be similarto that for cAMP in gradients differing in steepness by 105.
Chemotaxis in parallel cAMP and Ca2+ gradientsThree lines of evidence suggested that, on average, cells undergochemotaxis more robustly up a cAMP gradient than up an optimumCa2+ gradient. First, when analyzed over time, cells in cAMPgradients attained higher average chemotactic indices than cells inCa2+ gradients, even when both gradients were generated at a flowrate found to be optimum for Ca2+ chemotaxis, not for cAMPchemotaxis. Second, when chemotaxis was analyzed in optimalcAMP gradients, chemotactic efficiency was significantly higherthan that achieved in optimum Ca2+ gradients. Third, whenopposing cAMP and Ca2+ gradients were generated at flow ratesoptimum for the latter, the majority (77%) of cells still made netprogress in the direction of increasing cAMP, not in the directionof increasing Ca2+, but the mean CI, which reflects the efficiencyof chemotaxis, was far below that of cells in a cAMP gradientalone. The results suggested that cells still responded to theopposing, but less effective Ca2+ signal, which decreased theefficiency of chemotaxis in the more effective cAMP gradient.Perhaps most relevant to the possible role that Ca2+ might play inaggregation territories, we found that in parallel cAMP and Ca2+
gradients generated in the same direction, the average CIs werehigher than in a cAMP gradient alone or in a Ca2+ gradient alone,suggesting additivity.
Speculation on the establishment of steep Ca2+ gradientsand the role of Ca2+ chemotaxisOur data indicate that the capacity to undergo chemotaxis inapparently steep gradients of Ca2+ is acquired during earlydevelopment, in association with the acquisition of cAMPchemotaxis. But how plausible is it that steep gradients aregenerated in naturally aggregating cell population and, if generated,what role would Ca2+ chemotaxis play, given that cAMP has beenconsidered (for a host of reasons) the lone player? In relation tosteepness, we have assumed that the Ca2+ gradient generated invitro is linear. This assumption is made on the basis of gradientsmeasured with fluorescent molecules in the 300–10,000 Da range,where diffusion does not appear to be an issue. But, as noted, wecould not measure gradients of low molecular weight due to theunavailability of markers, and therefore could only assume thatlow molecular weight molecules also form linear gradients. Severalobservations suggest that diffusion by Ca2+ might change the shapeof an effective gradient. But, even if that were the case, there is noobservation that would suggest that cAMP can induce the releaseof a high-enough concentration of Ca2+ to result in the steepgradients found to be effective in vitro. The absence of supportingdata, however, does not disprove the existence of such gradients.For instance, if Ca2+ were released in a pulse at a very highconcentration from a localized portion of the cell, such as the
Jour
nal o
f Cel
l Sci
ence

3765Calcium, a Dictyostelium chemoattractant
uropod, a suggestion put forward by Parent and coworkers forcAMP (Kriebel et al., 2008; Garcia et al., 2009), a steep, highlytransient gradient of Ca2+ might form in the interstitial area betweentwo closely associated cells. Until a method is devised for obtaininga measurement, or ‘snapshot’, of the spatial distribution of Ca2+ ina natural population of aggregating cells, such as achieved for thedistribution of cAMP using an isotope dilution–fluorographytechnique (Tomchik and Devreotes, 1981), we can only speculateon the existence of such Ca2+ gradients.
If we speculate that such gradients do exist, what role mightthey play? Given that we found that cells do not assess theincreasing and decreasing temporal gradients of Ca2+ in the frontand back of simulated temporal waves of Ca2+ generated in vitro,as cells do in simulated temporal waves of cAMP (Varnum et al.,1985), we do not believe that cells generate or respond to wavesof Ca2+. But, if transient Ca2+ gradients are formed between cells,they might possibly function to fine-tune some aspect of cAMPchemotaxis, such as enhancing orientation when cells are in theprocess of contacting end to end to form streams (Alcantara andMonk, 1974; Bonner, 1941; Shaffer, 1957; Dormann et al., 2001;Siegert and Weijer, 1991), or they might function to attract straycells into already established streams. Ca2+ gradients might alsofunction in the cell dynamics of three dimensional aggregates, forwhich we know very little about. Until we know the spatial andtemporal dynamics of Ca2+ in a naturally aggregating territory, wecan only speculate. Therefore, we have discovered a very real Ca2+
chemotaxis system that is acquired during development at thesame time as the dominant cAMP chemotaxis system, but we arestill in search of a function.
Materials and MethodsMicrofluidic chamberWe have developed a custom, hybrid micromixer-diffusion microfluidic chamber(unpublished results from this laboratory) in conjunction with Translume (AnnArbor, MI; Fig. 1A) according to the following specifications. The chamber wasmachined from optically clear, fused silica in order to maintain true rectilinear cross-sectioning of chamber walls with deeper troughs and also to optimize imaging. Themajor portion of the device was composed of a 300 m � 300 m � 28 mm channel(Fig. 1A). Flow of solutions a and b into the chamber from reservoirs a and b,respectively, was driven by programmable pumps (Fig. 1A). Channels from the aand b reservoir inlet ports merged at a T-intersection (Fig. 1B), where the a-flow andb-flow solutions subsequently encountered a series of 20 herringbone- or chevron-shaped troughs (Fig. 1C) machined into the fused silica glass substrate at a depth of100 m. The two solutions were mixed owing to controlled flow-based eddiesgenerated by the flow of solution into and out of these chevrons, resulting in a stablegradient (Fig. 1I) across the 300 m channel perpendicular to the flow direction. Cellsuspensions were introduced into the viewing area (Fig. 1D) through the cell injectionport (Fig. 1A). The complete volume of the microfluidic device could be flushedwithin 30 seconds at a rate of 30 l/minute, allowing for rapid changes in gradientprofiles.
Empirical analysis of gradients generated in the microfluidic chamberThe relationship between molecular weight, flow rate and gradient shape in themicrofluidic chamber was empirically tested by quantifying the pixel intensitygradients generated by three different fluorophores: unconjugated fluorescein,unconjugated Alexa Fluor 488 and Alexa Fluor 488 conjugated to dextran, withmolecular weights of 332, 570 and 10,000 Da, respectively. Reservoir syringe a wasfilled with a 1 M solution of fluorophore in double distilled water, and reservoirsyringe b with water only. The reservoirs were connected to the chamber and thepumps simultaneously turned on. A gradient for each fluorophore was generated atmultiple flow rates of 2–60 l/minute in each pump (Fig. 1E–H).
Imaging was performed on a Nikon Eclipse TE2000-U microscope equipped witha mercury lamp and the appropriate filters. Images of each fluorophore gradient foreach flow rate were captured with a color CCD camera. The pixel intensity gradientswere then measured and plotted using the line profile feature of the software program2D-DIAS (Soll, 1995). Stability was analyzed by comparing gradients over time(Fig. 1I) and averaging the intensity over 20 m on each side of the line profileperpendicular to the flow.
Strain maintenance, growth and developmentIn order to maintain genotypic and phenotypic homogeneity, frozen stocks ofDictyostelium discoideum strain Ax2 were reconstituted every 2 weeks as describedelsewhere in detail (Varnum et al., 1986). Development was initiated according tomethods previously described (Soll, 1979; Varnum et al., 1986; Wessels et al., 2006).In brief, cells at the low log phase of growth (2�106 cells/ml) in HL-5 broth(http://dictybase.org) were washed free of nutrient medium, re-suspended in bufferedsalt solution (BSS; 20 mM KCl, 2.5 mM MgCl2, 20 mM KH2PO4, 5 mM Na2HPO4,pH 6.4) and distributed as a smooth carpet on filter pads (Sussman, 1987; Soll, 1979;Varnum et al., 1986; Wessels et al., 2006) saturated with BSS. Under these conditions,aggregation typically occurred at 6 hours and represented the stage at which velocityand chemotactic efficiency were maximal (Varnum et al., 1986). For experimentalpurposes, all cells used in assays involving Ca2+ were washed and incubated for 90minutes in TB containing 10 mM CaCl2. The major cation in BSS is 40 mM K+,which has been shown to be the prime facilitator of polarity and motility in thissolution; 10 mM Ca2+ has been shown to be the prime facilitator in TB + Ca2+
solution (Lusche et al., 2009). BSS is therefore be referred to as ‘40 mM K+ solution’and TB + 10 mM CaCl2 as ‘10 mM Ca2+ solution’. For analysis of the chemotacticresponse of vegetative cells, amoebae were grown for 24–48 hours to a density of5�106 cells/ml in 20 ml of SM broth (http://dictybase.org) in association withfreshly diluted Klebsiella aerogenes (Sussman, 1987).
Cell response to uniform solutions of 40 mM K+ or 10 mM Ca2+
To analyze the behavior of aggregation-competent amoebae in the absence of agradient of attractant, both reservoir pumps a and b of the microfluidic chamber werepre-filled with either 40 mM K+ solution or 10 mM Ca2+ solution. The tubing andinlet ports were filled with the same solution (i.e. 40 mM K+ or 10 mM Ca2+). Thetubing from each reservoir syringe was then connected to its respective inlet port viaa Luer lock. The pumps were turned on and the chamber primed by flushing with40 mM K+ or 10 mM Ca2+ solution. The exit tubing was then clamped shut and 300l of a cell suspension at a density of 5�106 cells/ml was inoculated into the cellinjection port (Fig. 1D). The port was capped shut and cells were allowed to adhereto the surface for 10 minutes. The clamp was then removed from the exit tube, thepumps simultaneously turned on to generate flow a and flow b, and image acquisitionstarted.
Cell response to a cAMP gradient within the microfluidic chamberThe microfluidic chamber was primed as described above except that reservoir a wasfilled with the facilitating cation solution (40 mM K+ or 10 mM Ca2+) plus 0.1 McAMP, and reservoir b with the appropriate cation solution alone. Cells wereinoculated into the injection port, allowed to adhere, and the flow initiated.
Cell response to Ca2+ gradients and combination gradientsThe microfluidic chamber was primed and operated as described above except thatto generate a Ca2+ gradient, one reservoir was filled with a solution containing TBplus 1, 5 or 10 mM Ca2+ and the other reservoir with TB alone. To generate parallelCa2+ and cAMP gradients, reservoir a was filled with a solution of TB containing 10mM Ca2+ plus 0.1 M cAMP, and reservoir b with TB alone. Finally, to generateopposing Ca2+ and cAMP gradients, reservoir a was filled with TB containing 0.1M cAMP, and reservoir b with TB containing 10 mM Ca2+. Cell inoculation andflow were as described above.
Cell response to a rapid shift in Ca2+ concentrationCell response to a rapid shift from 40 mM K+ solution to 40 mM K+ containing 10mM Ca2+ was measured in the Sykes–Moore perfusion chamber (Bellco Glass,Vineland, NJ). The chamber is described in detail elsewhere (Varnum et al., 1985;Varnum et al., 1986). In brief, aggregation-competent amoebae were inoculated intothe chamber at a low density (10–20 cells/mm2) and allowed to adhere to the surfaceof the bottom coverslip for 5 minutes. One inlet port of the chamber was connectedto a pump-driven reservoir containing the 40 mM K+ solution and the other inlet portto a pump-driven reservoir containing 40 mM K+ plus 10 mM Ca2+. Followinginsertion of the outlet tube, the pump connected to the reservoir containing 40 mMK+ solution was turned on and this buffer solution perfused at a rate of 4 ml/minutefor 10 minutes. The solution was then immediately switched to 40 mM K+ containing10 mM Ca2+. This procedure allowed for a rapid turnover of solutions within thechamber. Images were acquired and analyzed as described below.
Cell response to temporal waves of Ca2+
Methods for treating cells with temporal waves have been described in detailelsewhere (Varnum et al., 1985). Briefly, aggregation-competent amoebae wereinoculated into the Sykes–Moore perfusion chamber as described above and thentreated with a series of increasing and decreasing temporal gradients of calcium inTB at a periodicity of 7 minutes using the NE-1000 Multiphase ProgrammableSyringe Pump (New Era Pump Systems, Wantagh, NY) (Geiger et al., 2003). Theconcentration of calcium ranged from 0.2 mM at the trough of each wave to 20 mMat each peak. Images were acquired and analyzed as described below.
Jour
nal o
f Cel
l Sci
ence

3766 Journal of Cell Science 123 (21)
Analysis of vegetative cellsCells were grown in HL-5 to a density of 2�106 cells/ml or in the presence of K.aerogenes and harvested at a density of 5�106 cells/ml. Bacterially grown cells wererepeatedly pelleted and washed in 10 mM Ca2+ solution at low centrifugation speedsuntil the great majority of bacteria were removed. The microfluidic chamber wasprimed and operated as described above for a Ca2+ gradient.
Image acquisition and 2-D DIAS analysisCells were imaged in the chamber with a phase contrast 10� objective. Movies wereacquired with iStop Motion image acquisition software on a Macintosh computer ata rate of 15 frames/minute through a Hitachi CCD camera connected to an analog-to-digital converter (Wessels et al., 2006). Cells were automatically outlined usingthe grayscale threshold algorithm in 2D-DIAS (Soll, 1995; Soll and Voss, 1998).Velocity, persistence, CI and BI were calculated from the position of the cell centroidas described in Results and elsewhere in detail (Soll, 1995; Soll and Voss, 1998). Allcells within the image field were outlined and included in the analysis.
We are indebted to Translume (Ann Arbor, MI) for their participationin developing the microfluidic chamber and to Kristin Wood and RithuSrikantha for help in image analysis. We acknowledge funding fromthe Developmental Studies Hybridoma Bank, a national resource underthe auspices of NIH.
Supplementary material available online athttp://jcs.biologists.org/cgi/content/full/123/21/3756/DC1
ReferencesAdams, G. B., Chabner, K. T., Alley, I. R., Olson, D. P., Szczepiorkowski, Z. M.,
Poznansky, M. C., Kos, C. H., Pollak, M. R., Brown, E. M. and Scadden, D. T.(2006). Stem cell engraftment at the endosteal niche is specified by the calcium-sensingreceptor. Nature 439, 599-603.
Aguirre, A., Gonzalez, A., Planell, J. and Engel, E. (2010). Extracellular calciummodulates in vitro bone marrow-derived Flk-1+ CD34+ progenitor cell chemotaxis anddifferentiation through a calcium-sensing receptor. Biochem. Biophys. Res. Commun.393, 156-161.
Alcantara, F. and Monk, M. (1974). Signal propagation during aggregation in the slimemould Dictyostelium discoideum. J. Gen. Microbiol. 85, 321-334.
Andrew, N. and Insall, R. (2007). Chemotaxis in shallow gradients is mediatedindependently of PtdIns 3-kinase by biased choices between random protrusions. Nat.Cell Biol. 9, 193-200.
Bandyopadhyay, S., Jeong, K. H., Hansen, J. T., Vassilev, P. M., Brown, E. M. andChattopadhyay, N. (2007). Calcium-sensing receptor stimulates secretion of aninterferon-gamma-induced monokine (CXCL10) and monocyte chemoattractant protein-3 in immortalized GnRH neurons. J. Neurosci. Res. 85, 882-895.
Bangerth, F. (1979). Calcium-related physiological disorders of plants. Annu. Rev.Phytopathol. 17, 97-122.
Bohme, R., Bumann, J., Aeckerle, S. and Malchow, D. (1987). A high-affinity plasmamembrane Ca2+-ATPase in Dictyostelium discoideum: its relation to cAMP-inducedCa2+ fluxes. Biochim. Biophys. Acta 904, 125-130.
Bonner, J. T. (1949). The demonstration of acrasin in the later stages of the developmentof the slime mold Dictyostelium discoideum. J. Exp. Zool. 110, 259-271.
Boyden, S. (1962). The chemotactic effect of mixtures of antibody and antigen onpolymorphonuclear leucocytes. J. Exp. Med. 115, 453-466.
Breitwieser, G. E. (2008). Extracellular calcium as an integrator of tissue function. Int. J.Biochem. Cell Biol. 40, 1467-1480.
Brokaw, C. J. (1974). Calcium and flagellar response during the chemotaxis of brackenspermatozoids. J. Cell Physiol. 83, 151-158.
Bronner, F. (1997). Adaptation and nutritional needs. Am. J. Clin. Nutr. 65, 1570.Bumann, J., Wurster, B. and Malchow, D. (1984). Attractant-induced changes and
oscillations of the extracellular Ca++ concentration in suspensions of differentiatingDictyostelium cells. J. Cell Biol. 98, 173-178.
Bumann, J., Malchow, D. and Wurster, B. (1986). Oscillations of Ca++ concentrationduring the cell differentiation of Dictyostelium discoideum. Differentiation 31, 85-91.
Case, R. M., Eisner, D., Gurney, A., Jones, O., Muallem, S. and Verkhratsky, A.(2007). Evolution of calcium homeostasis: from birth of the first cell to an omnipresentsignalling system. Cell Calcium 42, 345-350.
Chang, Y. Y. (1968). Cyclic 3�,5�-adenosine monophosphate phosphodiesterase producedby the slime mold Dictyostelium discoideum. Science 161, 57-59.
Chattopadhyay, N., Jeong, K. H., Yano, S., Huang, S., Pang, J. L., Ren, X., Terwilliger,E., Kaiser, U. B., Vassilev, P. M., Pollak, M. R. et al. (2007). Calcium receptorstimulates chemotaxis and secretion of MCP-1 in GnRH neurons in vitro: potentialimpact on reduced GnRH neuron population in CaR-null mice. Am. J. Physiol.Endocrinol. Metab. 292, E523-E532.
Condeelis, J., Bresnick, A., Demma, M., Dharmawardhane, S., Eddy, R., Hall, A. L.,Sauterer, R. and Warren, V. (1990). Mechanisms of amoeboid chemotaxis: anevaluation of the cortical expansion model. Dev. Genet. 11, 333-340.
Decave, E., Garrivier, D., Brechet, Y., Bruckert, F. and Fourcade, B. (2002a). Peelingprocess in living cell movement under shear flow. Phys. Rev. Lett. 89, 108101.
Decave, E., Garrivier, D., Brechet, Y., Fourcade, B. and Bruckert, F. (2002b). Shearflow-induced detachment kinetics of Dictyostelium discoideum cells from solid substrate.Biophys. J. 82, 2383-2395.
Decave, E., Rieu, D., Dalous, J., Fache, S., Brechet, Y., Fourcade, B., Satre, M. andBruckert, F. (2003). Shear flow-induced motility of Dictyostelium discoideum cells onsolid substrate. J. Cell Sci. 116, 4331-4343.
Devreotes, P. N. and Steck, T. L. (1979). Cyclic 3�,5� AMP relay in Dictyosteliumdiscoideum. II. Requirements for the initiation and termination of the response. J. Cell.Biol. 80, 300-309.
Dinauer, M. C., MacKay, S. A. and Devreotes, P. N. (1980). Cyclic 3�,5�-AMP relay inDictyostelium discoideum III. The relationship of cAMP synthesis and secretion duringthe cAMP signaling response. J. Cell Biol. 86, 537-544.
Dormann, D., Kim, J. Y., Devreotes, P. N. and Weijer, C. J. (2001). cAMP receptoraffinity controls wave dynamics, geometry and morphogenesis in Dictyostelium. J.Cell. Sci. 114, 2513-2523.
Dvorak, M. M., Siddiqua, A., Ward, D. T., Carter, D. H., Dallas, S. L., Nemeth, E. F.and Riccardi, D. (2004). Physiological changes in extracellular calcium concentrationdirectly control osteoblast function in the absence of calciotropic hormones. Proc. Natl.Acad. Sci. USA 101, 5140-5145.
Fache, S., Dalous, J., Engelund, M., Hansen, C., Chamaraux, F., Fourcade, B., Satre,M., Devreotes, P. and Bruckert, F. (2005). Calcium mobilization stimulatesDictyostelium discoideum shear-flow-induced cell motility. J. Cell Sci. 118, 3445-3457.
Fuller, D., Chen, W., Adler, M., Groisman, A., Levine, H., Rappel, W. J. and Loomis,W. F. (2010). External and internal constraints on eukaryotic chemotaxis. Proc. Natl.Acad. Sci. USA 107, 9656-9659.
Futrelle, R. P. (1982). Dictyostelium chemotactic response to spatial and temporal gradients.Theories of the limits of chemotactic sensitivity and of pseudochemotaxis. J. Cell.Biochem. 18, 197-212.
Futrelle, R. P., Traut, J. and McKee, W. G. (1982). Cell behavior in Dictyosteliumdiscoideum: preaggregation response to localized cyclic AMP pulses. J. Cell Biol. 92,807-821.
Garcia, G. L., Rericha, E. C., Heger, C. D., Goldsmith, P. K. and Parent, C. A. (2009).The group migration of Dictyostelium cells is regulated by extracellular chemoattractantdegradation. Mol. Biol. Cell 20, 3295-3304.
Geiger, J., Wessels, D. and Soll, D. R. (2003). Human polymorphonuclear leukocytesrespond to waves of chemoattractant, like Dictyostelium. Cell Motil. Cytoskeleton 56,27-44.
Gerisch, G., Normann, I. and Beug, H. (1966). [Rhythm of cell orientation and velocityof movement in the chemotactic reaction system of Dictyostelium discoideum].Naturwissenschaften 53, 618.
Gerisch, G., Hulser, D., Malchow, D. and Wick, U. (1975). Cell communication byperiodic cyclic-AMP pulses. Philos. Trans. R. Soc. Lond. B. Biol. Sci. 272, 181-192.
Gilbert, O., Queller, D. and Strassman, J. (2009). Discovery of a large clonal patch ofa social amoeba:implicatins for social evolution. Mol. Ecol. 18, 1273-1281.
Godwin, S. L. and Soltoff, S. P. (1997). Extracellular calcium and platelet-derived growthfactor promote receptor-mediated chemotaxis in osteoblasts through different signalingpathways. J. Biol. Chem. 272, 11307-11312.
Goldberg, E., Broecker, W., Gross, M. and Turekian, K. (1971). Marine chemistry. InRadioactivity in the Marine Environment, pp 137-146. Washington: National Academyof Sciences.
Golden, J. P., Floyd-Smith, T. M., Mott, D. R. and Ligler, F. S. (2007). Target deliveryin a microfluidic immunosensor. Biosens. Bioelectron. 22, 2763-2767.
Hall, A. L., Schlein, A. and Condeelis, J. (1988). Relationship of pseudopod extensionto chemotactic hormone-induced actin polymerization in amoeboid cells. J. CellBiochem. 37, 285-299.
Heid, P. J., Geiger, J., Wessels, D., Voss, E. and Soll, D. R. (2005). Computer-assistedanalysis of filopod formation and the role of myosin II heavy chain phosphorylation inDictyostelium. J. Cell Sci. 118, 2225-2237.
Huang, Y., Zhou, Y., Yang, W., Butters, R., Lee, H. W., Li, S., Castiblanco, A., Brown,E. M. and Yang, J. J. (2007). Identification and dissection of Ca(2+)-binding sites inthe extracellular domain of Ca(2+)-sensing receptor. J. Biol. Chem. 282, 19000-19010.
Iglesias, P. A. and Devreotes, P. N. (2008). Navigating through models of chemotaxis.Curr. Opin. Cell Biol. 20, 35-40.
Janetopoulos, C. and Firtel, R. A. (2008). Directional sensing during chemotaxis. FEBSLett. 582, 2075-2085.
Jin, T., Xu, X., Fang, J., Isik, N., Yan, J., Brzostowski, J. A. and Hereld, D. (2009).How human leukocytes track down and destroy pathogens: lessons learned from themodel organism Dictyostelium discoideum. Immunol. Res. 43, 118-127.
Johnson, R. L., Van Haastert, P. J., Kimmel, A. R., Saxe, C. L., 3rd, Jastorff, B. andDevreotes, P. N. (1992). The cyclic nucleotide specificity of three cAMP receptors inDictyostelium. J. Biol. Chem. 267, 4600-4607.
Kaplan, C., Mott, D. and Oran, E. (2004). Towards the design of efficient micromixers.In 42nd AIAA Aerospace Sciences Meeting and Exhibit. Nevada. 2004-931.
Kay, R. R., Langridge, P., Traynor, D. and Hoeller, O. (2008). Changing directions inthe study of chemotaxis. Nat. Rev. Mol. Cell Biol. 9, 455-463.
King, J. S. and Insall, R. H. (2009). Chemotaxis: finding the way forward withDictyostelium. Trends Cell Biol. 19, 523-530.
Klein, P. S., Sun, T. J., Saxe, C. L., 3rd, Kimmel, A. R., Johnson, R. L. and Devreotes,P. N. (1988). A chemoattractant receptor controls development in Dictyosteliumdiscoideum. Science 241, 1467-1472.
Kolsch, V., Charest, P. G. and Firtel, R. A. (2008). The regulation of cell motility andchemotaxis by phospholipid signaling. J. Cell Sci. 121, 551-559.
Kriebel, P. W., Barr, V. A., Rericha, E. C., Zhang, G. and Parent, C. A. (2008).Collective cell migration requires vesicular trafficking for chemoattractant delivery atthe trailing edge. J. Cell Biol. 183, 949-961.
Jour
nal o
f Cel
l Sci
ence
3767Calcium, a Dictyostelium chemoattractant
Lapidot, T. and Kollet, O. (2002). The essential roles of the chemokine SDF-1 and itsreceptor CXCR4 in human stem cell homing and repopulation of transplanted immune-deficient NOD/SCID and NOD/SCID/B2m(null) mice. Leukemia 16, 1992-2003.
Liao, J., Schneider, A., Datta, N. S. and McCauley, L. K. (2006). Extracellular calciumas a candidate mediator of prostate cancer skeletal metastasis. Cancer Res. 66, 9065-9073.
Lombardi, M. L., Knecht, D. A. and Lee, J. (2008). Mechano-chemical signalingmaintains the rapid movement of Dictyostelium cells. Exp. Cell Res. 314, 1850-1859.
Lusche, D. F., Wessels, D. and Soll, D. R. (2009). The effects of extracellular calcium onmotility, pseudopod and uropod formation, chemotaxis, and the cortical localization ofmyosin II in Dictyostelium discoideum. Cell. Motil. Cytoskeleton 66, 567-587.
Maeda, Y. (1970). Influence of ionic conditions on cell differentiation and morphogenesisof the cellular slime molds. Dev. Growth Differ. 3, 217-227.
McLaughlin, S. B. and Wimmer, R. (1999). Tansley Review No. 104. Calcium Physiologyand Terrestrial Ecosystem Processes. Cambridge: Cambridge University Press.
Menon, G. K., Grayson, S. and Elias, P. M. (1985). Ionic calcium reservoirs inmammalian epidermis: ultrastructural localization by ion-capture cytochemistry. J.Invest. Dermatol. 84, 508-512.
Milne, J. L. and Coukell, M. B. (1988). Isolation and characterization of a plasmamembrane calcium pump from Dictyostelium discoideum. Biochem. J. 249, 223-230.
Moniakis, J., Coukell, M. B. and Janiec, A. (1999). Involvement of the Ca2+-ATPasePAT1 and the contractile vacuole in calcium regulation in Dictyostelium discoideum. J.Cell Sci. 112, 405-414.
Morris, V. L. and Chan, B. M. (2007). Interaction of epidermal growth factor, Ca2+, andmatrix metalloproteinase-9 in primary keratinocyte migration. Wound Repair Regen.15, 907-915.
Nemeth, E. (1995). Ca2+ receptor-dependent regulation of cellular functions. News Physiol.Sci. 10, 1-5.
Olszak, I. T., Poznansky, M. C., Evans, R. H., Olson, D., Kos, C., Pollak, M. R.,Brown, E. M. and Scadden, D. T. (2000). Extracellular calcium elicits a chemokineticresponse from monocytes in vitro and in vivo. J. Clin. Invest. 105, 1299-1305.
Pan, P., Hall, E. M. and Bonner, J. T. (1972). Folic acid as second chemotactic substancein the cellular slime moulds. Nat. New Biol. 237, 181-182.
Petersen, O., Michalak, M. and Verkhratsky, A. (2005). Calcium signalling: past,present and future. Cell Calcium 38, 161-169.
Pitta, T. P., Sherwood, E. E., Kobel, A. M. and Berg, H. C. (1997). Calcium is requiredfor swimming by the nonflagellated cyanobacterium Synechococcus strain WH8113. J.Bacteriol. 179, 2524-2528.
Postma, M., Roelofs, J., Goedhart, J., Gadella, T. W., Visser, A. J. and Van Haastert,P. J. (2003). Uniform cAMP stimulation of Dictyostelium cells induces localizedpatches of signal transduction and pseudopodia. Mol. Biol. Cell 14, 5019-5027.
Qian, P., Schoenau, J. J., King, T. and Japp, M. (2005). Effect of repeated manureapplication on potassium, calcium and magnesium in soil and cereal crops inSakatchewan. Can. J. Soil Sci. 85, 397-403.
Quarles, L. D., Hartle, J. E., 2nd, Siddhanti, S. R., Guo, R. and Hinson, T. K. (1997).A distinct cation-sensing mechanism in MC3T3-E1 osteoblasts functionally related tothe calcium receptor. J. Bone Miner. Res. 12, 393-402.
Raper, K. B. (1935). Dictyostelium discoideum, a new species of slime mold fromdecaying forest leaves. J. Agr. Res. 50, 135-147.
Reitz, R. E., Daane, T. A., Woods, J. R. and Weinstein, R. L. (1977). Calcium,magnesium, phosphorus, and parathyroid hormone interrelationships in pregnancy andnewborn infants. Obstet. Gynecol. 50, 701-705.
Riedel, V. and Gerisch, G. (1971). Regulation of extracellular cyclic-AMP-phosphodiesterase activity during development of Dictyostelium discoideum. Biochem.Biophys. Res. Comm. 42, 119-124.
Sager, M. (2007). Trace and nutrient elements in manure, dung and compost samples inAustria. Soil Biol. Biochem. 39, 1383-1390.
Saidak, Z., Boudot, C., Abdoune, R., Petit, L., Brazier, M., Mentaverri, R. andKamel, S. (2009). Extracellular calcium promotes the migration of breast cancer cellsthrough the activation of the calcium sensing receptor. Exp. Cell Res. 315, 2072-2080.
Siegert, F. and Weijer, C. J. (1991). Analysis of optical density wave propagation andcell movement in the cellular slime mould Dictyostelium discoideum. Physica D 49,224-232.
Shaffer, B. M. (1957). Aspects of aggregation in cellular slime moulds 1. Orientation andchemotaxis. Am. Nat. 91, 19-35.
Shaffer, B. M. (1966). Inhibition of aggregation of the slime mould Dictyosteliumdiscoideum by a factor diffusing from Escherichia coli. J. Cell Sci. 1, 391-400.
Shi, H., Severs, N. J. and Robenek, H. (1996). Effects of calcium on the migration andrecruitment of macrophages and macrophage-derived foam cells. FASEB J. 10, 491-501.
Shutt, D. C., Jenkins, L. M., Carolan, E. J., Stapleton, J., Daniels, K. J., Kennedy, R.C. and Soll, D. R. (1998). T cell syncytia induced by HIV release. T cellchemoattractants: demonstration with a newly developed single cell chemotaxis chamber.J. Cell Sci. 111, 99-109.
Silver, I. A., Murrills, R. J. and Etherington, D. J. (1988). Microelectrode studies onthe acid microenvironment beneath adherent macrophages and osteoclasts. Exp. CellRes. 175, 266-276.
Soll, D. R. (1979). Timers in developing systems. Science 203, 841-849.Soll, D. R. (1995). The use of computers in understanding how animal cells crawl. Int.
Rev. Cytol. 163, 43-104.Soll, D. and Voss, E. (1998). Two and three dimensional computer systems for analyzing
how cells crawl. In Motion Analysis of Living Cells (ed. D. Soll and D. Wessels), pp.25-52. New York, NY: John Wiley Incorporated.
Soll, D. R., Wessels, D., Heid, P. J. and Zhang, H. (2002). A contextual framework forcharacterizing motility and chemotaxis mutants in Dictyostelium discoideum. J. MuscleRes. Cell Motil. 23, 659-672.
Soll, D. R., Wessels, D., Kuhl, S. and Lusche, D. F. (2009). How a cell crawls and therole of cortical myosin II. Eukaryot. Cell 8, 1381-1396.
Song, L., Nadkarni, S. M., Bodeker, H. U., Beta, C., Bae, A., Franck, C., Rappel, W.J., Loomis, W. F. and Bodenschatz, E. (2006). Dictyostelium discoideum chemotaxis:threshold for directed motion. Eur. J. Cell Biol. 85, 981-989.
Sugimoto, T., Kanatani, M., Kano, J., Kaji, H., Tsukamoto, T., Yamaguchi, T., Fukase,M. and Chihara, K. (1993). Effects of high calcium concentration on the functions andinteractions of osteoblastic cells and monocytes and on the formation of osteoclast-likecells. J. Bone Miner. Res. 8, 1445-1452.
Sussman, M. (1987). Cultivation and synchronous morphogenesis of Dictyostelium undercontrolled experimental conditions. Methods Cell Biol. 28, 9-29.
Tomchik, K. J. and Devreotes, P. N. (1981). Adenosine 3�,5�-monophosphate waves inDictyostelium discoideum: A demonstration by isotope dilution-fluorography technique.Science 212, 443-446.
Van Haastert, P. J. and Veltman, D. M. (2007). Chemotaxis: navigating by multiplesignaling pathways. Sci. STKE 2007, pe40.
Varnum, B. and Soll, D. R. (1981). Chemoresponsiveness to cAMP and folic acid duringgrowth, development, and dedifferentiation in Dictyostelium discoideum. Differentiation18, 151-160.
Varnum, B., Edwards, K. B. and Soll, D. R. (1985). Dictyostelium amebae alter motilitydifferently in response to increasing versus decreasing temporal gradients of cAMP. J.Cell Biol. 101, 1-5.
Varnum, B., Edwards, K. B. and Soll, D. R. (1986). The developmental regulation ofsingle-cell motility in Dictyostelium discoideum. Dev. Biol. 113, 218-227.
Wessels, D., Murray, J. and Soll, D. R. (1992). Behavior of Dictyostelium amoebae isregulated primarily by the temporal dynamic of the natural cAMP wave. Cell Motil.Cytoskeleton 23, 145-156.
Wessels, D., Schroeder, N. A., Voss, E., Hall, A. L., Condeelis, J. and Soll, D. R. (1989).cAMP-mediated inhibition of intracellular particle movement and actin reorganizationin Dictyostelium. J. Cell Biol. 109, 2841-2851.
Wessels, D., Kuhl, S. and Soll, D. R. (2006). Application of 2D and 3D DIAS to motionanalysis of live cells in transmission and confocal microscopy imaging. Methods Mol.Biol. 346, 261-279.
Wick, U., Malchow, D. and Gerisch, G. (1978). Cyclic-AMP stimulated calcium influxinto aggregating cells of Dictyostelium discoideum. Cell Biol. Int. Rep. 2, 71-79.
Young, L. G. and Nelson, L. (1974). Calcium ions and control of the motility of seaurchin spermatozoa. J. Reprod. Fertil. 41, 371-378.
Yumura, S. and Fukui, Y. (1985). Reversible cyclic AMP-dependent change in distributionof myosin thick filaments in Dictyostelium. Nature 314, 194-196.
Zigmond, S. H. (1977). Ability of polymorphonuclear leukocytes to orient in gradients ofchemotactic factors. J. Cell Biol. 75, 606-616.
Jour
nal o
f Cel
l Sci
ence


![ello - mimuw.edu.plpdemb/pliki/tello_presentation.pdfduction Chemotaxis to signals y higher (taxis (taxis).-discoideum [1971]-angiogenesis A. on)-particles [1995], [1994]-Morphogenesis](https://img.pdfslide.us/doc/110x75/5c9f293288c993552d8d0190/ello-mimuwedupl-pdembplikitello-chemotaxis-to-signals-y-higher-taxis-taxis-discoideum.jpg)