Embed Size (px)
Citation preview

Harcourt, Inc. items and derived items copyright © 2001 by Harcourt, Inc.
A Lecture Presentation in PowerPoint to Accompany
Principles of EconomicsSecond Edition
by
N. Gregory Mankiw
Prepared by Mark P. Karscig, Department of Economics & Finance, Central Missouri State University.
Ten Principles of Economics
Chapter 1
Copyright © 2001 by Harcourt, Inc.
All rights reserved. Requests for permission to make copies of any part of thework should be mailed to:
Permissions Department, Harcourt College Publishers,6277 Sea Harbor Drive, Orlando, Florida 32887-6777.

Harcourt, Inc. items and derived items copyright © 2001 by Harcourt, Inc.
Economy. . .
. . . The word economy comes from a Greek word for “one who manages a household.”
Harcourt, Inc. items and derived items copyright © 2001 by Harcourt, Inc.
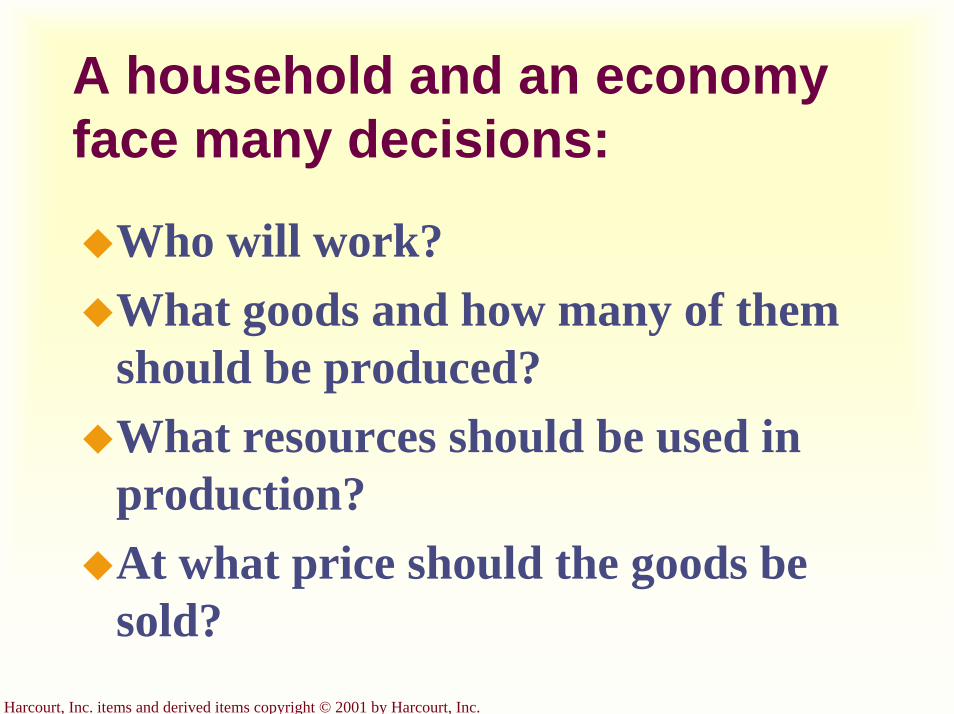
A household and an economy face many decisions:
Who will work?What goods and how many of them should be produced?What resources should be used in production?At what price should the goods be sold?

Harcourt, Inc. items and derived items copyright © 2001 by Harcourt, Inc.
Society and Scarce Resources:
The management of society’s resources is important because resources are scarce.

Harcourt, Inc. items and derived items copyright © 2001 by Harcourt, Inc.
Scarcity . . .
. . . means that society has limited resources and therefore cannot produce all the goods and services people wish to have.
Harcourt, Inc. items and derived items copyright © 2001 by Harcourt, Inc.
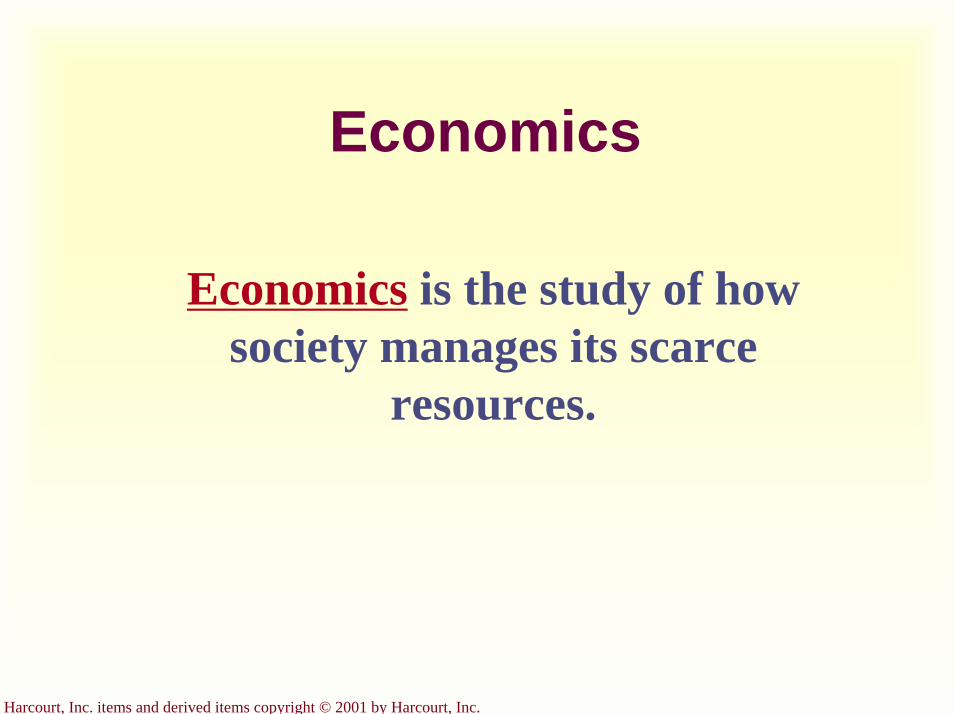
Economics
Economics is the study of how society manages its scarce
resources.
Harcourt, Inc. items and derived items copyright © 2001 by Harcourt, Inc.
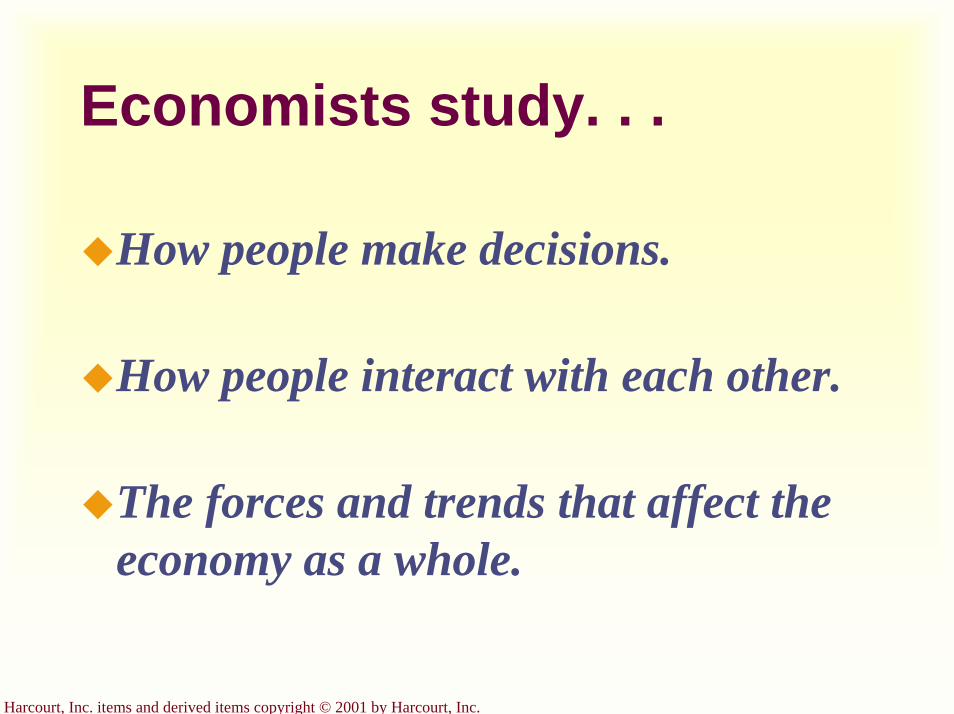
Economists study. . .
How people make decisions.
How people interact with each other.
The forces and trends that affect the economy as a whole.
Harcourt, Inc. items and derived items copyright © 2001 by Harcourt, Inc.
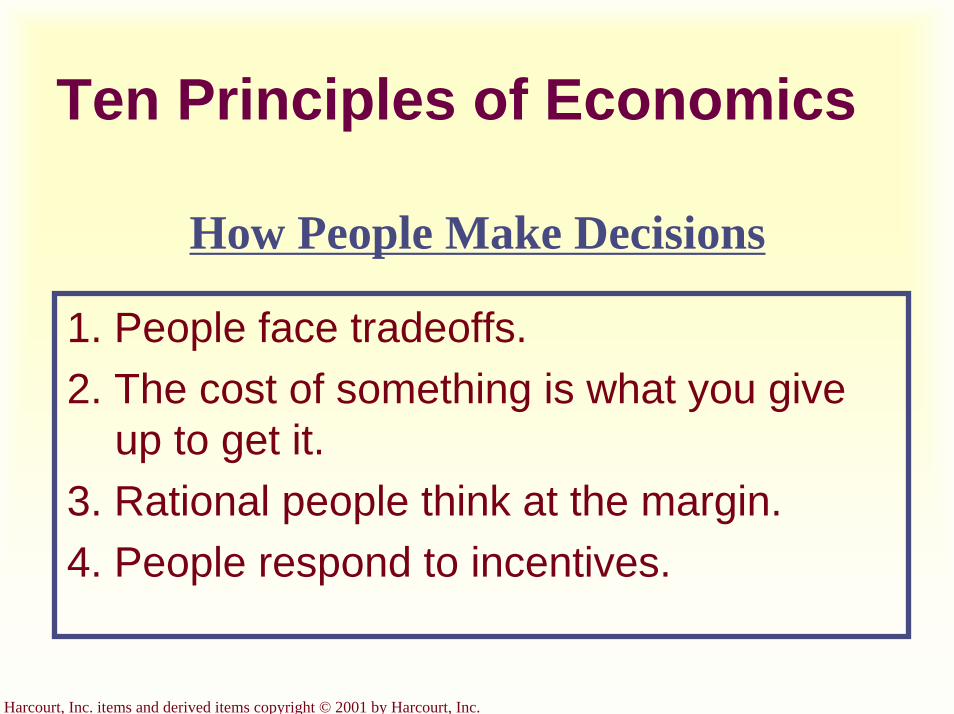
Ten Principles of Economics
How People Make Decisions
1. People face tradeoffs.2. The cost of something is what you give
up to get it.3. Rational people think at the margin.4. People respond to incentives.
Harcourt, Inc. items and derived items copyright © 2001 by Harcourt, Inc.
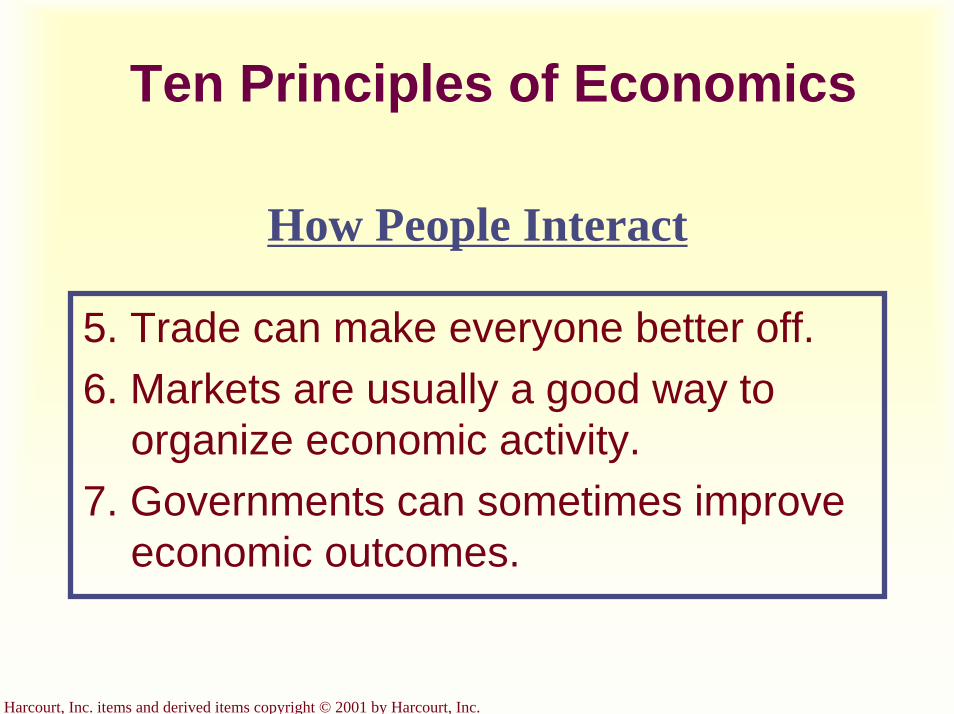
Ten Principles of Economics
How People Interact
5. Trade can make everyone better off.6. Markets are usually a good way to
organize economic activity.7. Governments can sometimes improve
economic outcomes.
Harcourt, Inc. items and derived items copyright © 2001 by Harcourt, Inc.
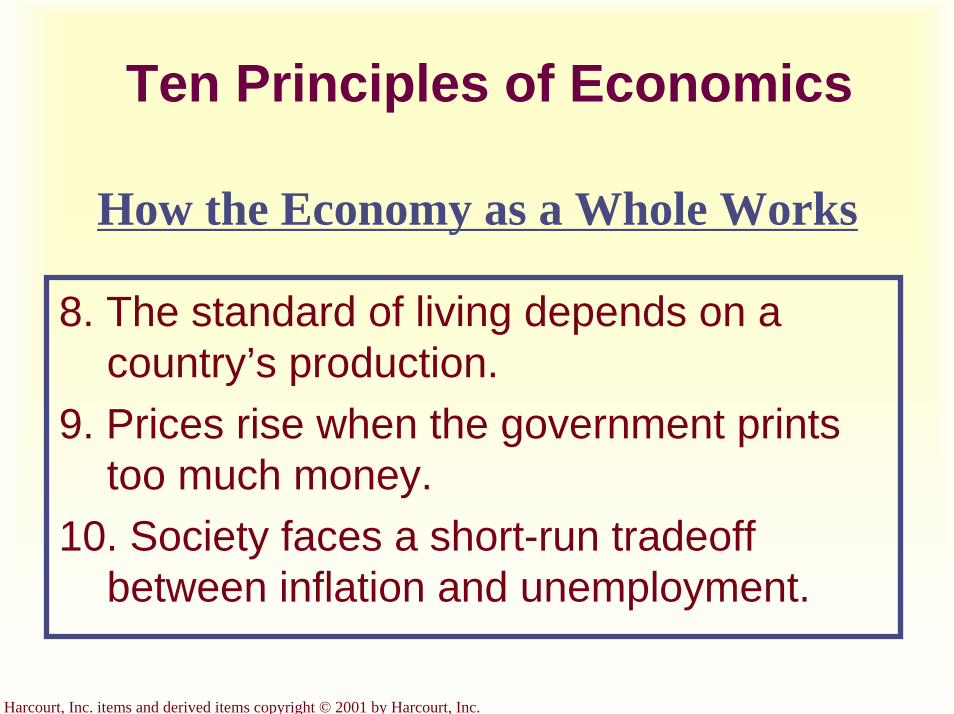
Ten Principles of Economics
How the Economy as a Whole Works
8. The standard of living depends on a country’s production.
9. Prices rise when the government prints too much money.
10. Society faces a short-run tradeoff between inflation and unemployment.

Harcourt, Inc. items and derived items copyright © 2001 by Harcourt, Inc.
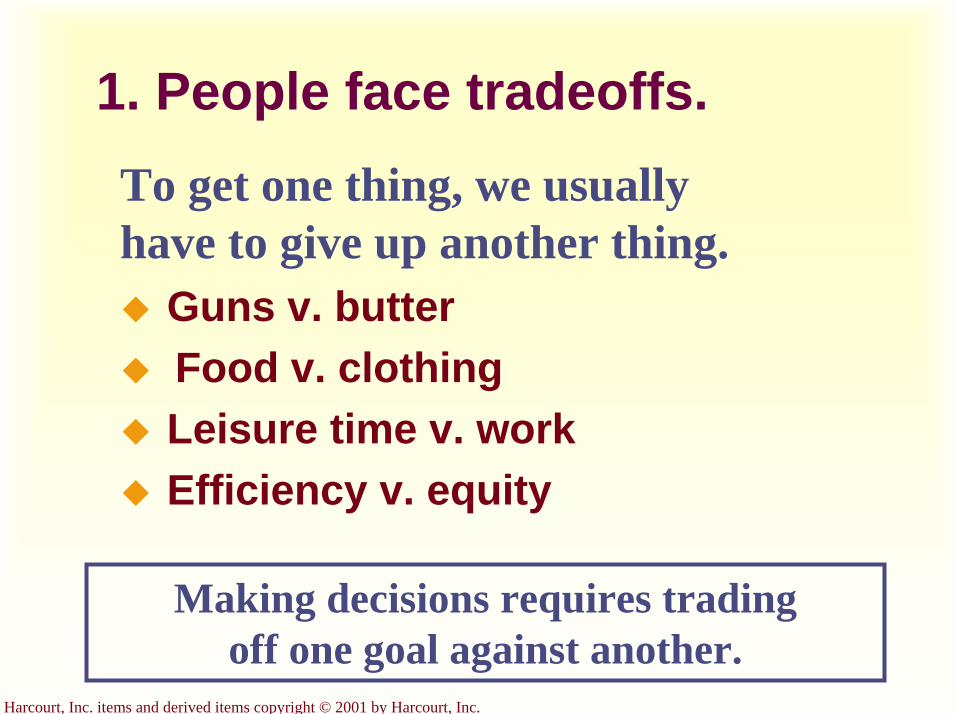
1. People face tradeoffs.
“There is no such thing as a free lunch!”
Harcourt, Inc. items and derived items copyright © 2001 by Harcourt, Inc.
1. People face tradeoffs.To get one thing, we usually have to give up another thing.
Guns v. butterFood v. clothingLeisure time v. workEfficiency v. equity
Making decisions requires trading off one goal against another.

Harcourt, Inc. items and derived items copyright © 2001 by Harcourt, Inc.
1. People face tradeoffs.
Efficiency v. Equity
Efficiency means society gets the most that it can from its scarce resources.Equity means the benefits of those resources are distributed fairly among the members of society.

Harcourt, Inc. items and derived items copyright © 2001 by Harcourt, Inc.
2. The cost of something is what you give up to get it.
Decisions require comparing costs and benefits of alternatives.
Whether to go to college or to work?Whether to study or go out on a date?Whether to go to class or sleep in?
Harcourt, Inc. items and derived items copyright © 2001 by Harcourt, Inc.
2. The cost of something is what you give up to get it.
The opportunity cost of an item is what you give up to
obtain that item.
Harcourt, Inc. items and derived items copyright © 2001 by Harcourt, Inc.
3. Rational people think at the margin.
Marginal changes are small, incremental adjustments to an existing plan of action.
People make decisions by comparing costs and benefits at the margin.

Harcourt, Inc. items and derived items copyright © 2001 by Harcourt, Inc.
4. People respond to incentives.
Marginal changes in costs or benefits motivate people to respond.The decision to choose one alternative over another occurs when that alternative’s marginal benefits exceed its marginal costs!
Harcourt, Inc. items and derived items copyright © 2001 by Harcourt, Inc.
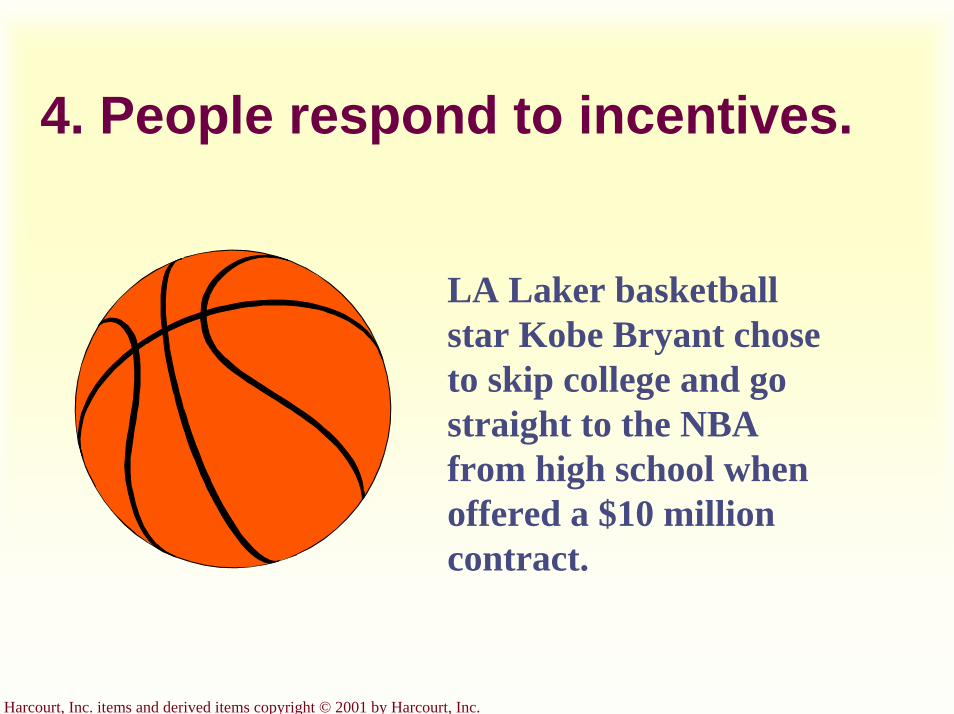
4. People respond to incentives.
LA Laker basketball star Kobe Bryant chose to skip college and go straight to the NBA from high school when offered a $10 million contract.

Harcourt, Inc. items and derived items copyright © 2001 by Harcourt, Inc.
5. Trade can make everyone better off.
People gain from their ability to trade with one another.Competition results in gains from trading.Trade allows people to specialize in what they do best.

Harcourt, Inc. items and derived items copyright © 2001 by Harcourt, Inc.
6. Markets are usually a good way to organize economic
activity.
In a market economy, households decide what to buy and who to work for.Firms decide who to hire and what to produce.

Harcourt, Inc. items and derived items copyright © 2001 by Harcourt, Inc.
6. Markets are usually a good way to organize economic
activity.
Adam Smith made the observation that households
and firms interacting in markets act as if guided by an
“invisible hand.”
Harcourt, Inc. items and derived items copyright © 2001 by Harcourt, Inc.
6. Markets are usually a good way to organize economic
activity.Because households and firms look at prices when deciding what to buy and sell, they unknowingly take into account the social costs of their actions.As a result, prices guide decision makers to reach outcomes that tend to maximize the welfare of society as a whole.

Harcourt, Inc. items and derived items copyright © 2001 by Harcourt, Inc.
7. Governments can sometimes improve market
outcomes.
When the market fails (breaks down) government can intervene to
promote efficiency and equity.

Harcourt, Inc. items and derived items copyright © 2001 by Harcourt, Inc.
7. Governments can sometimes improve market
outcomes.
Market failure occurs when the market fails to allocate
resources efficiently.
Harcourt, Inc. items and derived items copyright © 2001 by Harcourt, Inc.
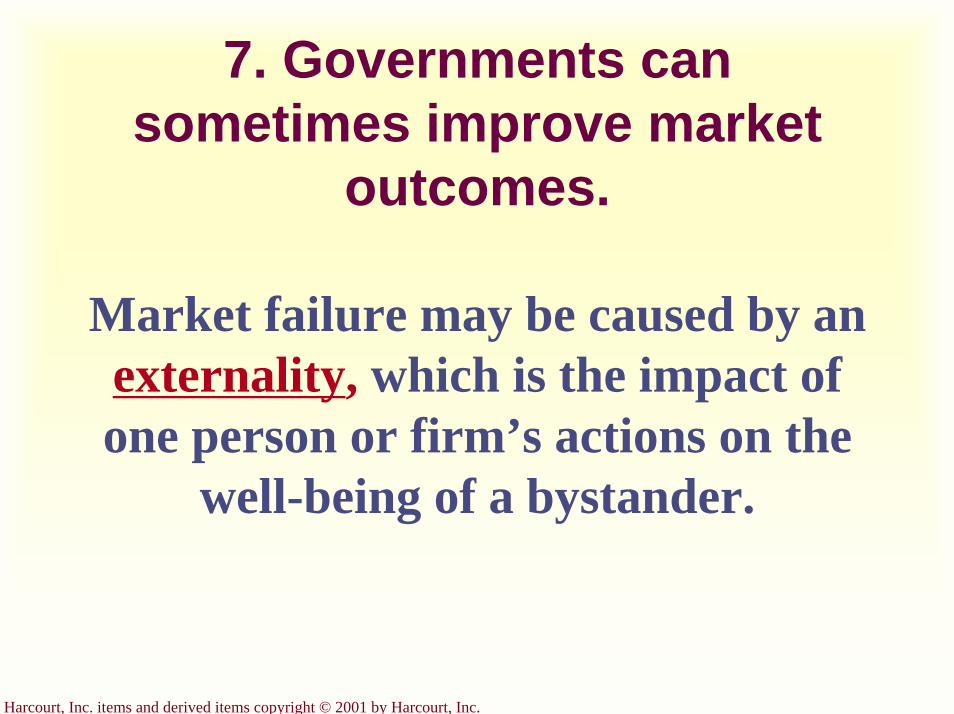
7. Governments can sometimes improve market
outcomes.
Market failure may be caused by anexternality, which is the impact of one person or firm’s actions on the
well-being of a bystander.
Harcourt, Inc. items and derived items copyright © 2001 by Harcourt, Inc.
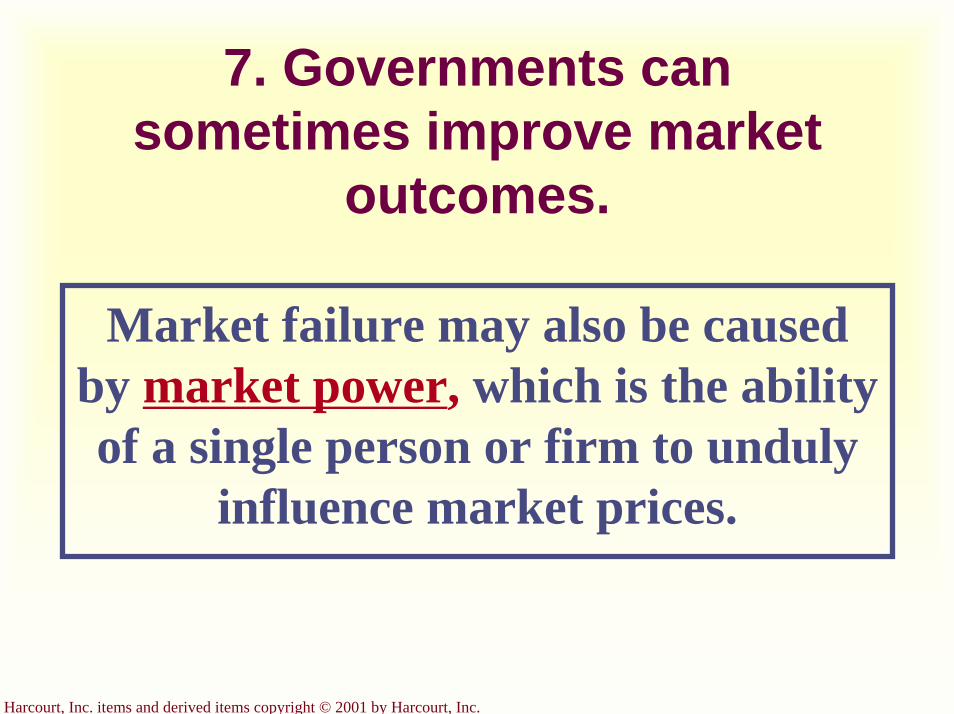
7. Governments can sometimes improve market
outcomes.
Market failure may also be caused by market power, which is the ability of a single person or firm to unduly
influence market prices.
Harcourt, Inc. items and derived items copyright © 2001 by Harcourt, Inc.
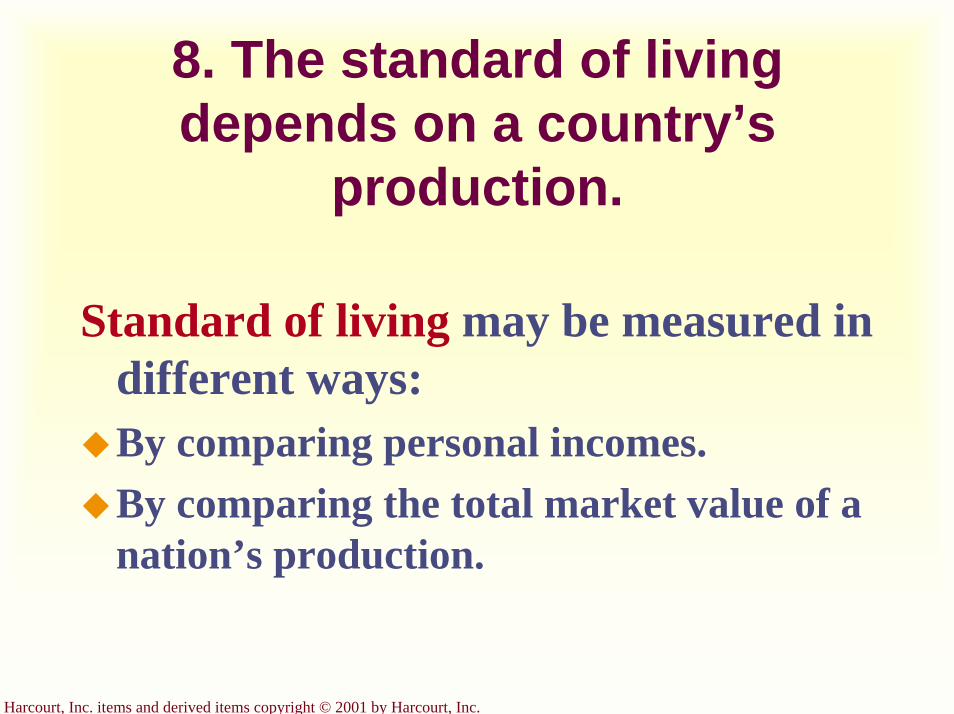
8. The standard of living depends on a country’s
production.
Standard of living may be measured in different ways:By comparing personal incomes.By comparing the total market value of a nation’s production.

Harcourt, Inc. items and derived items copyright © 2001 by Harcourt, Inc.
8. The standard of living depends on a country’s
production.
Almost all variations in living standards are explained by
differences in countries’productivities.

Harcourt, Inc. items and derived items copyright © 2001 by Harcourt, Inc.
8. The standard of living depends on a country’s
production.
Productivity is the amount of goods and services produced from each
hour of a worker’s time.
Higher productivity Higher standard of living
Harcourt, Inc. items and derived items copyright © 2001 by Harcourt, Inc.
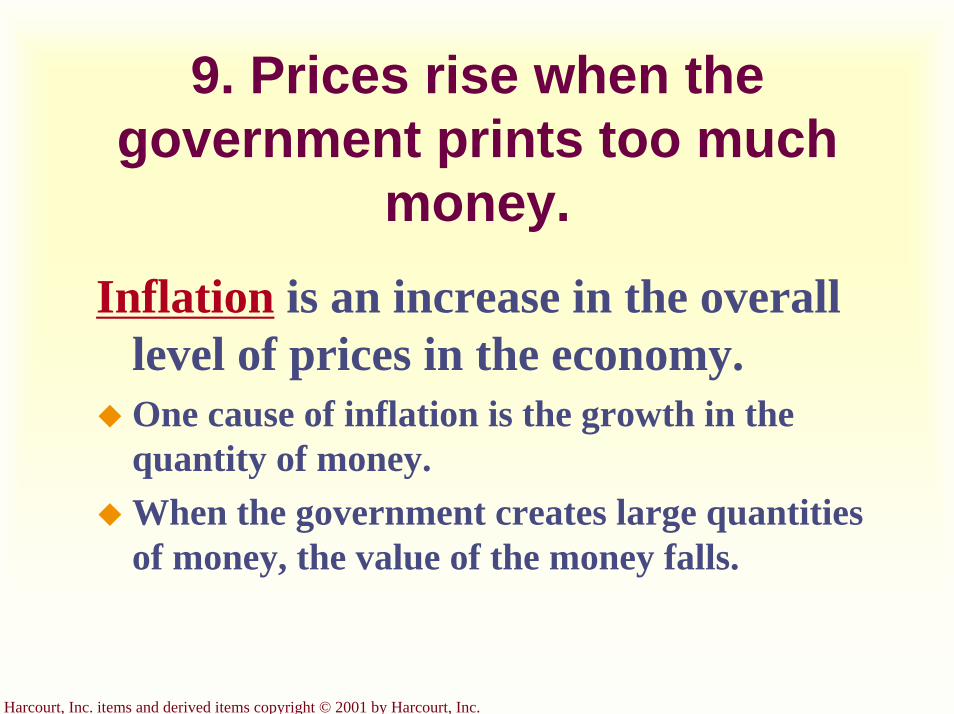
9. Prices rise when the government prints too much
money.Inflation is an increase in the overall
level of prices in the economy.One cause of inflation is the growth in the quantity of money.When the government creates large quantities of money, the value of the money falls.
Harcourt, Inc. items and derived items copyright © 2001 by Harcourt, Inc.
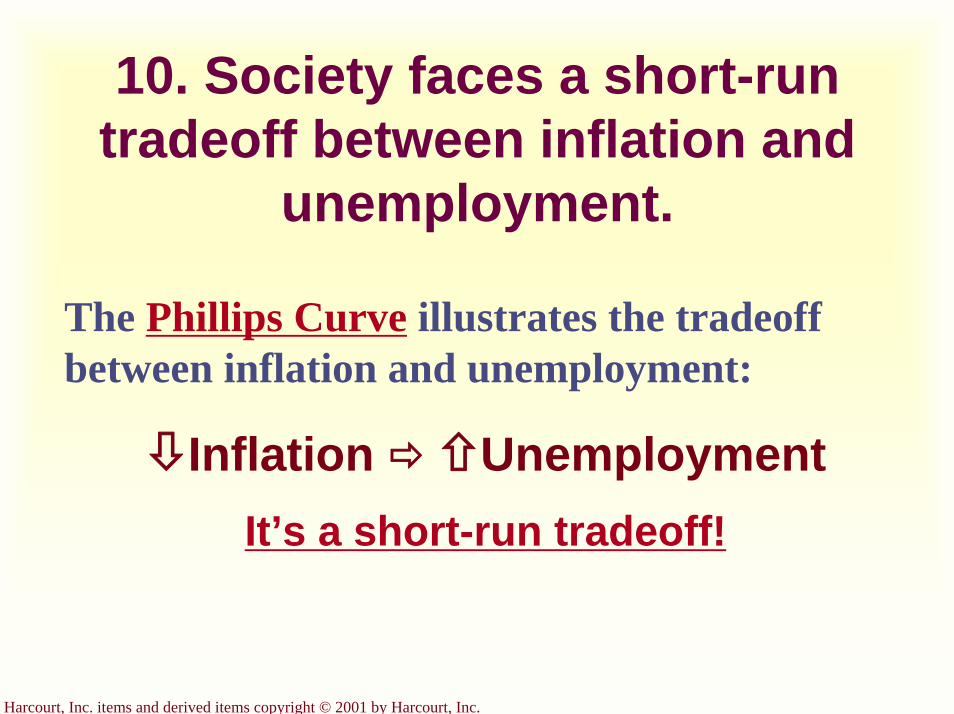
10. Society faces a short-run tradeoff between inflation and
unemployment.
The Phillips Curve illustrates the tradeoff between inflation and unemployment:
Inflation UnemploymentIt’s a short-run tradeoff!
Harcourt, Inc. items and derived items copyright © 2001 by Harcourt, Inc.
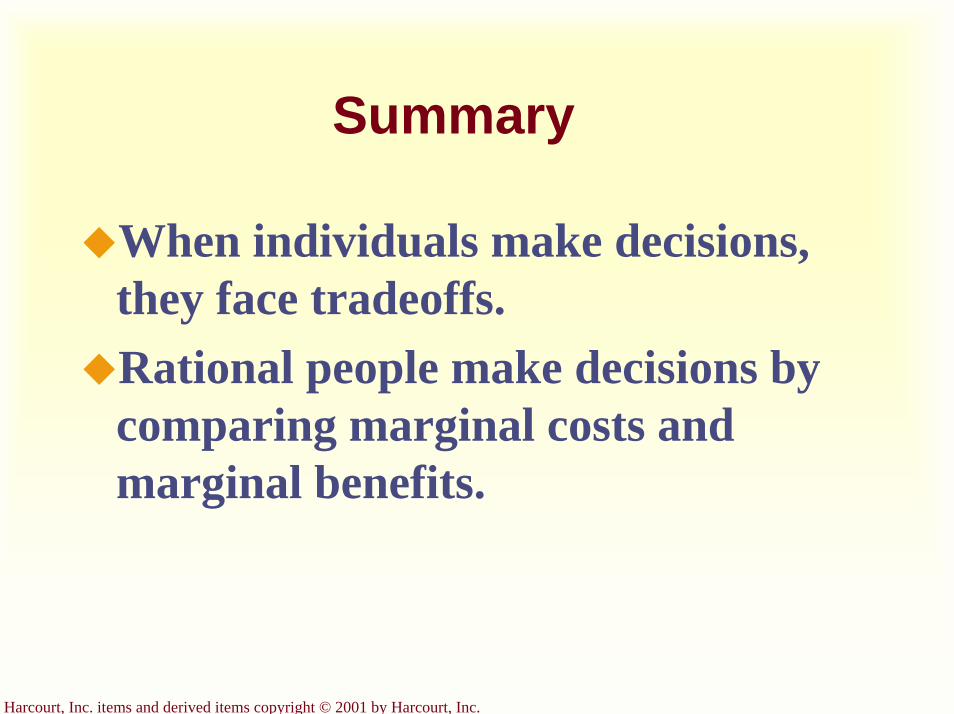
Summary
When individuals make decisions, they face tradeoffs.Rational people make decisions by comparing marginal costs and marginal benefits.
Harcourt, Inc. items and derived items copyright © 2001 by Harcourt, Inc.
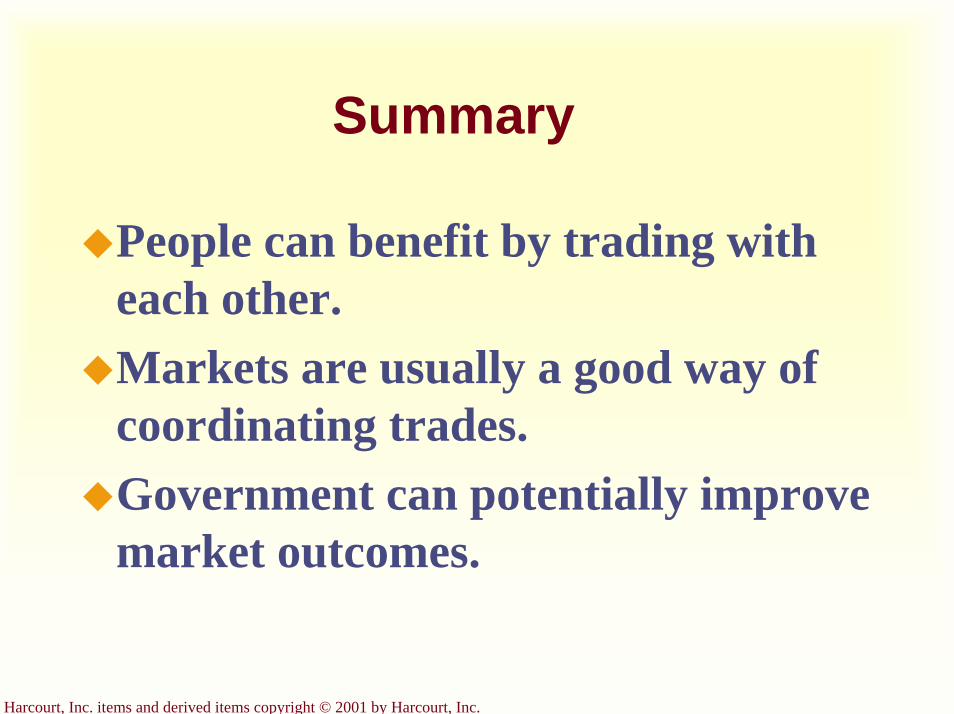
Summary
People can benefit by trading with each other.Markets are usually a good way of coordinating trades.Government can potentially improve market outcomes.
Harcourt, Inc. items and derived items copyright © 2001 by Harcourt, Inc.
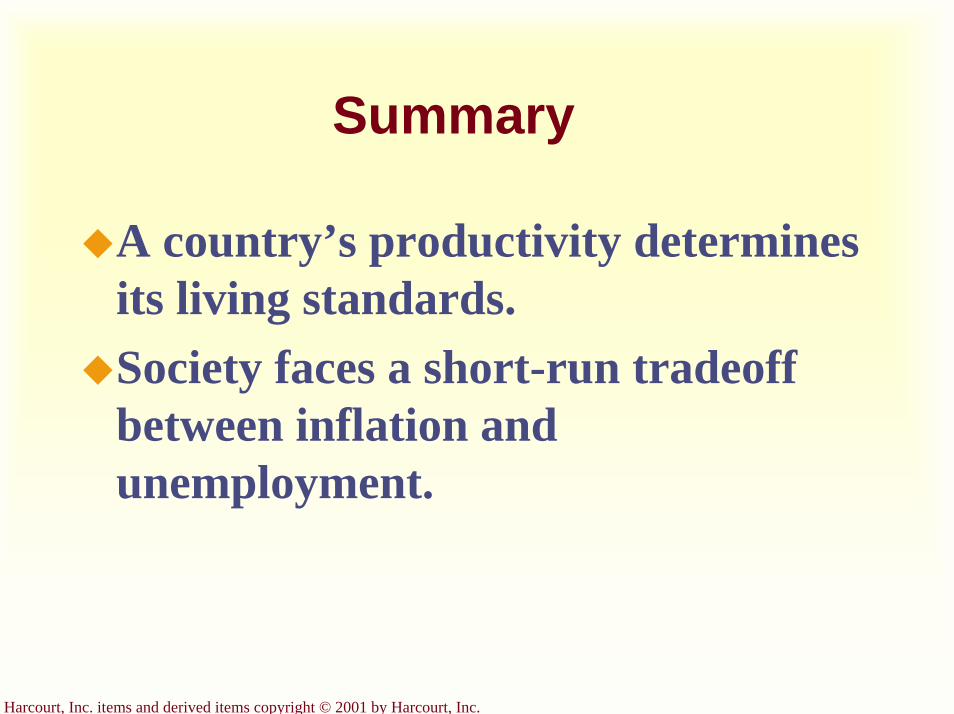
Summary
A country’s productivity determines its living standards.Society faces a short-run tradeoff between inflation and unemployment.

Thinking Like an Economist
Chapter 2
Copyright © 2001 by Harcourt, Inc.
All rights reserved. Requests for permission to make copies of any part of thework should be mailed to:
Permissions Department, Harcourt College Publishers,6277 Sea Harbor Drive, Orlando, Florida 32887-6777.

Harcourt, Inc. items and derived items copyright © 2001 by Harcourt, Inc.
Every field of study has its own terminology
Mathematics
axiomsintegrals
vector spacesPsychology
egoid
cognitive dissonanceLaw
torts
venues
Promissory estoppel
Harcourt, Inc. items and derived items copyright © 2001 by Harcourt, Inc.
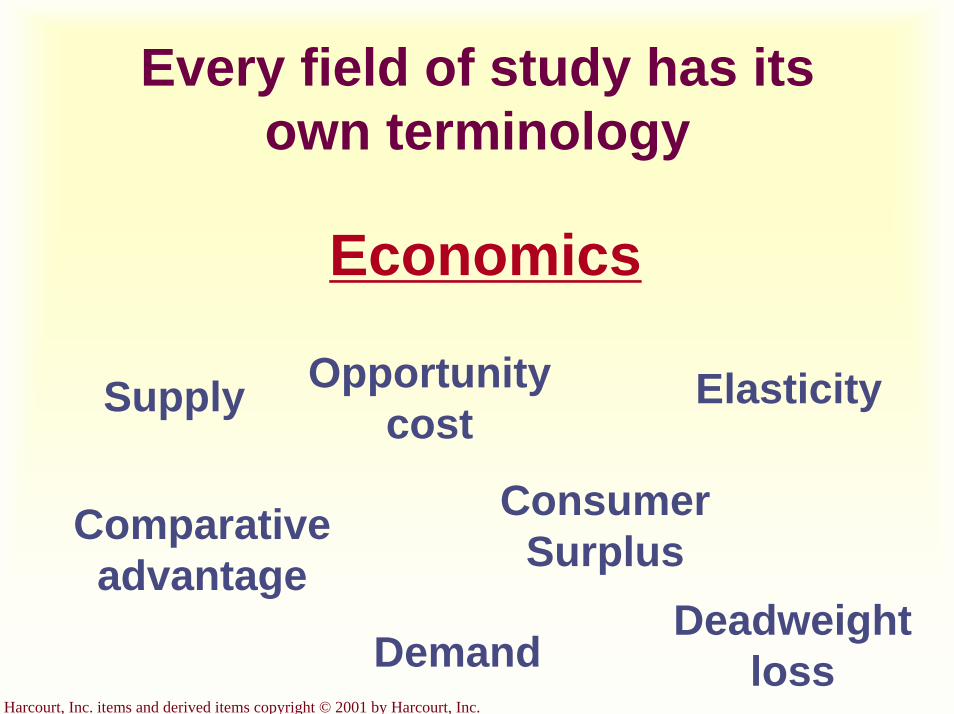
Every field of study has its own terminology
Economics
Opportunity cost
ElasticitySupply
Consumer SurplusComparative
advantageDeadweight
lossDemand
Harcourt, Inc. items and derived items copyright © 2001 by Harcourt, Inc.
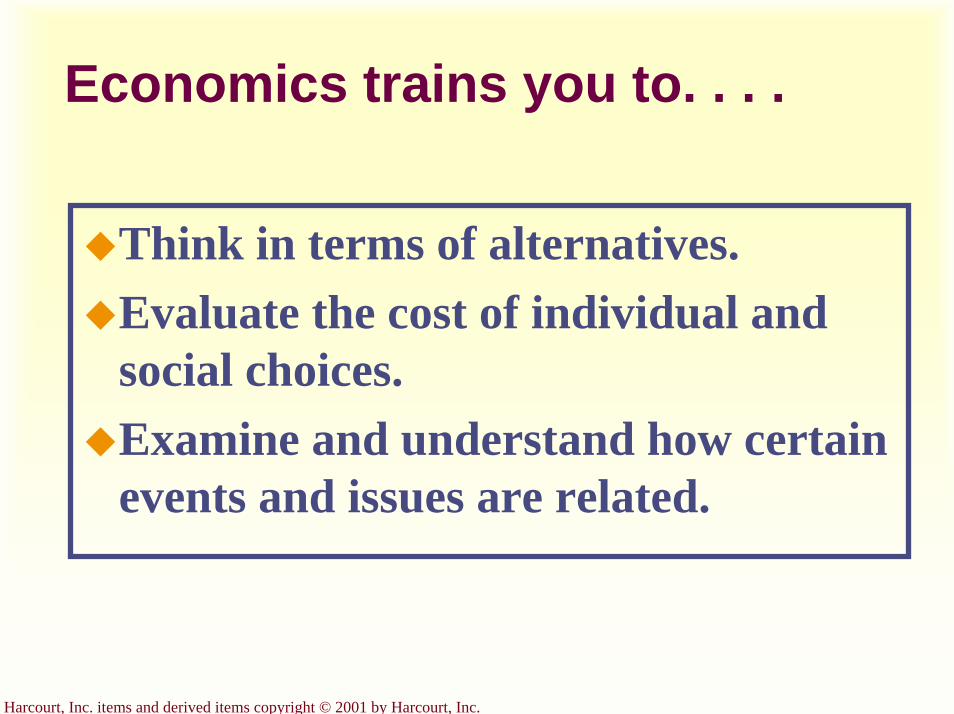
Economics trains you to. . . .
Think in terms of alternatives.Evaluate the cost of individual and social choices.Examine and understand how certain events and issues are related.
Harcourt, Inc. items and derived items copyright © 2001 by Harcourt, Inc.
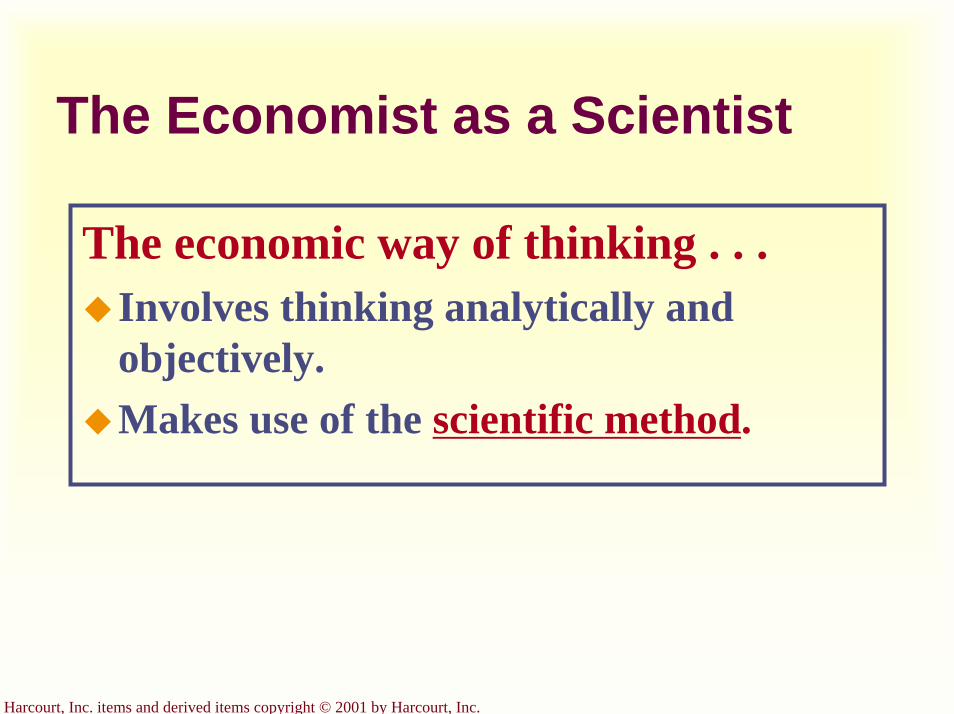
The Economist as a Scientist
The economic way of thinking . . .Involves thinking analytically andobjectively.Makes use of the scientific method.
Harcourt, Inc. items and derived items copyright © 2001 by Harcourt, Inc.
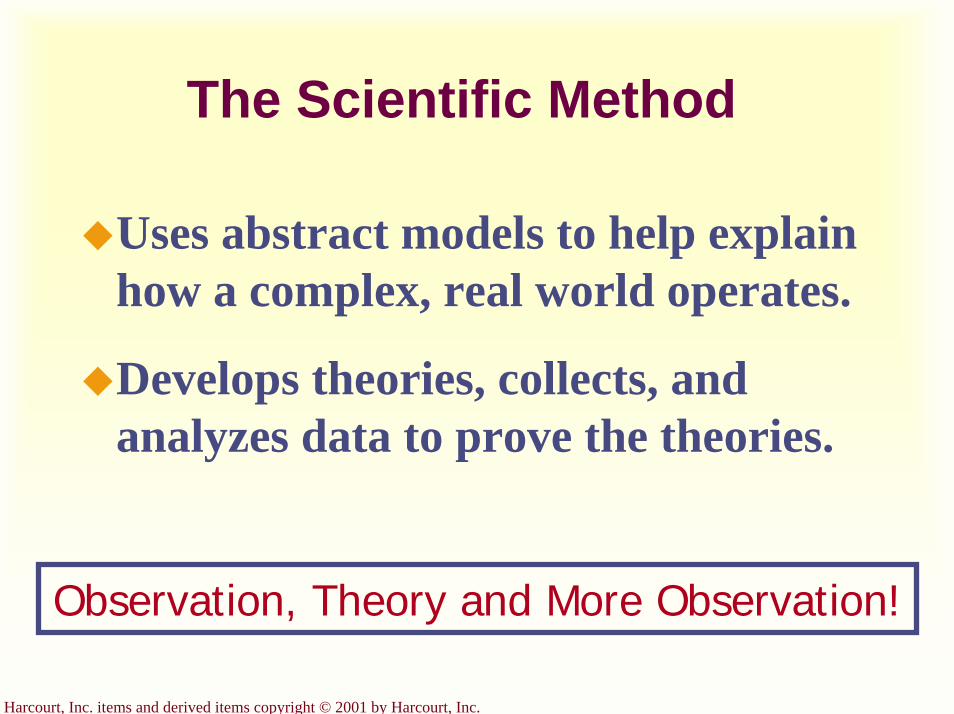
The Scientific Method
Uses abstract models to help explain how a complex, real world operates.
Develops theories, collects, and analyzes data to prove the theories.
Observation, Theory and More Observation!
Harcourt, Inc. items and derived items copyright © 2001 by Harcourt, Inc.
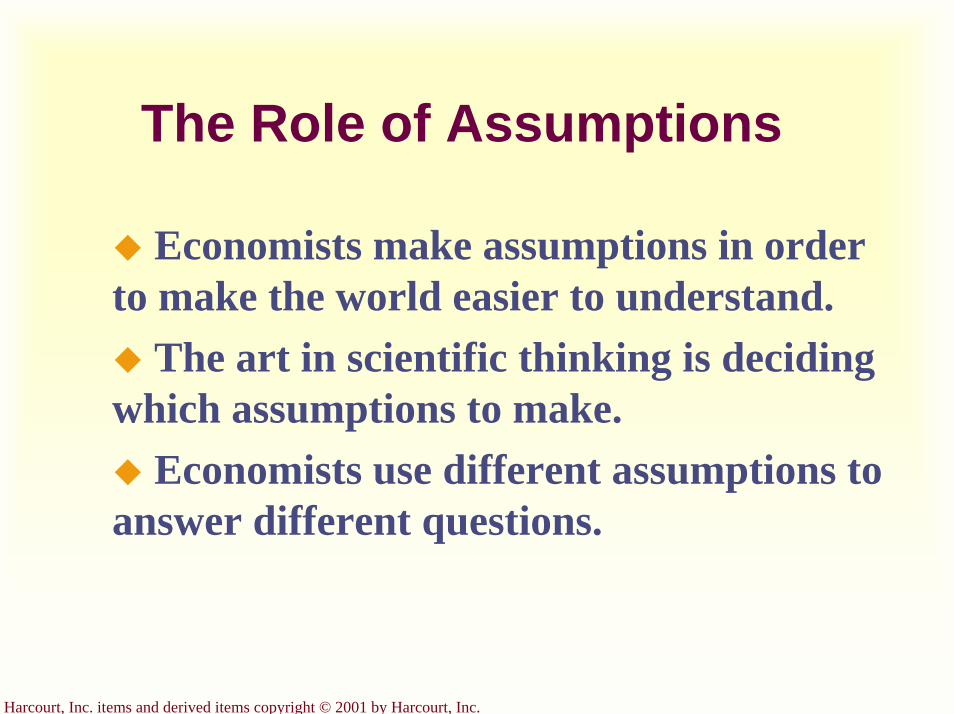
The Role of Assumptions
Economists make assumptions in order to make the world easier to understand.
The art in scientific thinking is deciding which assumptions to make.
Economists use different assumptions to answer different questions.
Harcourt, Inc. items and derived items copyright © 2001 by Harcourt, Inc.
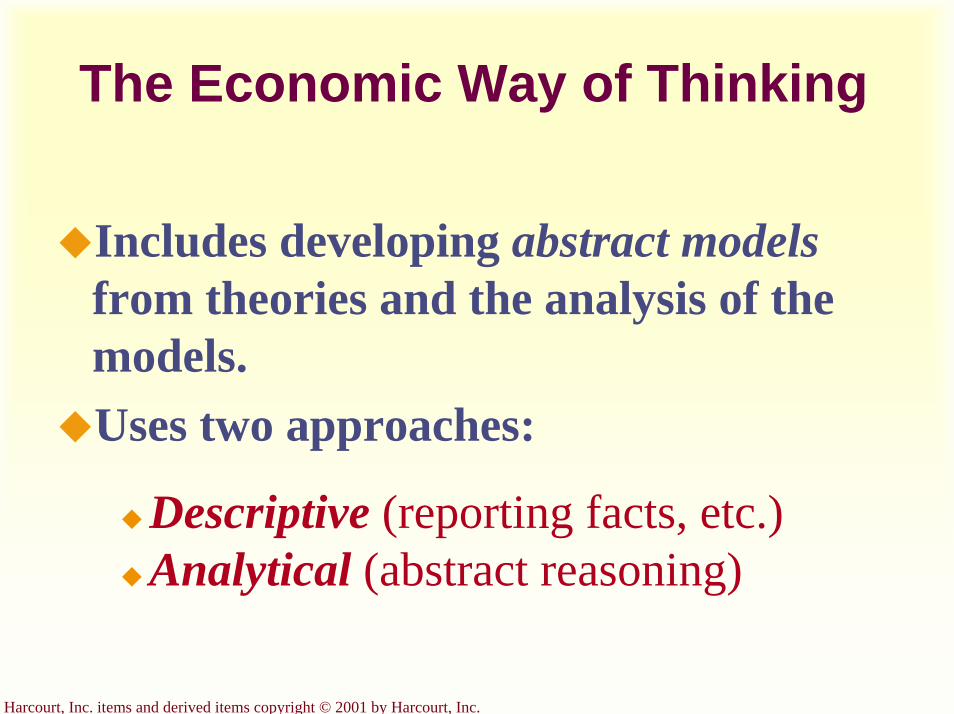
The Economic Way of Thinking
Includes developing abstract modelsfrom theories and the analysis of the models.Uses two approaches:
Descriptive (reporting facts, etc.)Analytical (abstract reasoning)
Harcourt, Inc. items and derived items copyright © 2001 by Harcourt, Inc.
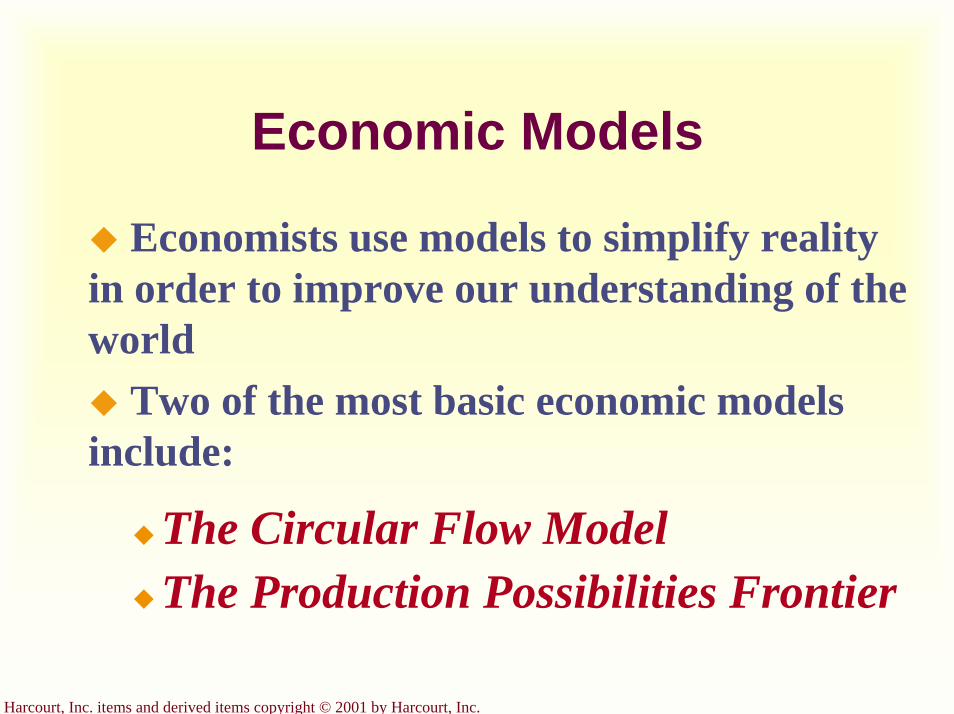
Economic Models
Economists use models to simplify reality in order to improve our understanding of the world
Two of the most basic economic models include:
The Circular Flow ModelThe Production Possibilities Frontier

Harcourt, Inc. items and derived items copyright © 2001 by Harcourt, Inc.
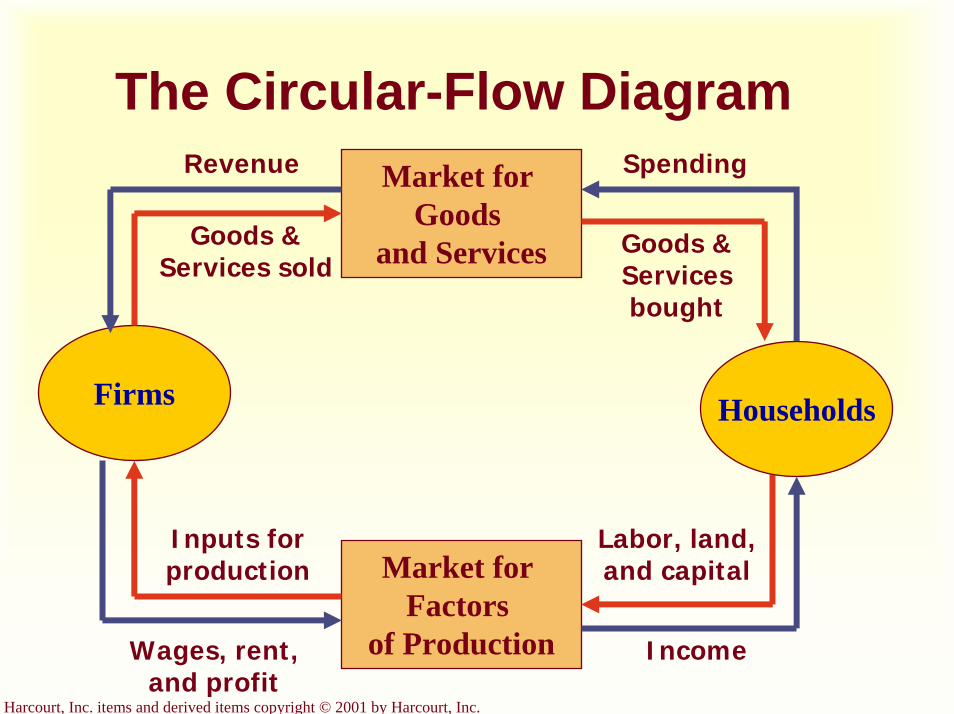
The Circular-Flow Model
The circular-flow model is a simple way to visually show the
economic transactions that occur between households and firms in
the economy.

Harcourt, Inc. items and derived items copyright © 2001 by Harcourt, Inc.
The Circular-Flow Diagram
Firms Households
Market for Factors
of Production
Market for Goods
and Services
SpendingRevenue
Wages, rent, and profit
Income
Goods & Services sold
Goods & Services bought
Labor, land, and capital
Inputs for production
Harcourt, Inc. items and derived items copyright © 2001 by Harcourt, Inc.
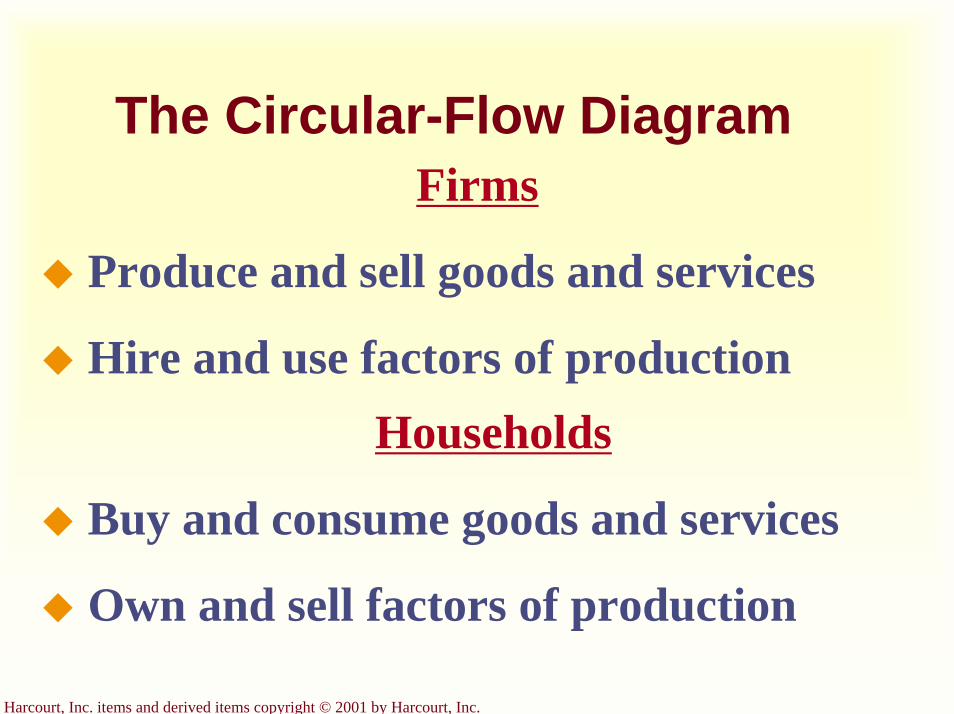
The Circular-Flow DiagramFirms
Produce and sell goods and services
Hire and use factors of productionHouseholds
Buy and consume goods and services
Own and sell factors of production
Harcourt, Inc. items and derived items copyright © 2001 by Harcourt, Inc.
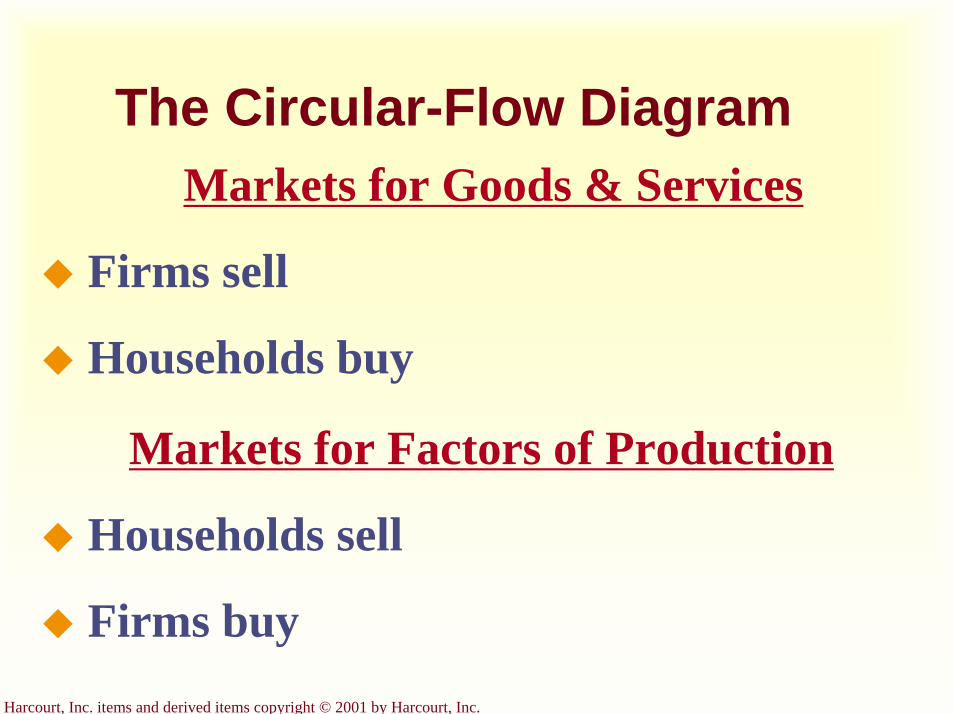
The Circular-Flow DiagramMarkets for Goods & Services
Firms sell
Households buy
Markets for Factors of Production
Households sell
Firms buy
Harcourt, Inc. items and derived items copyright © 2001 by Harcourt, Inc.
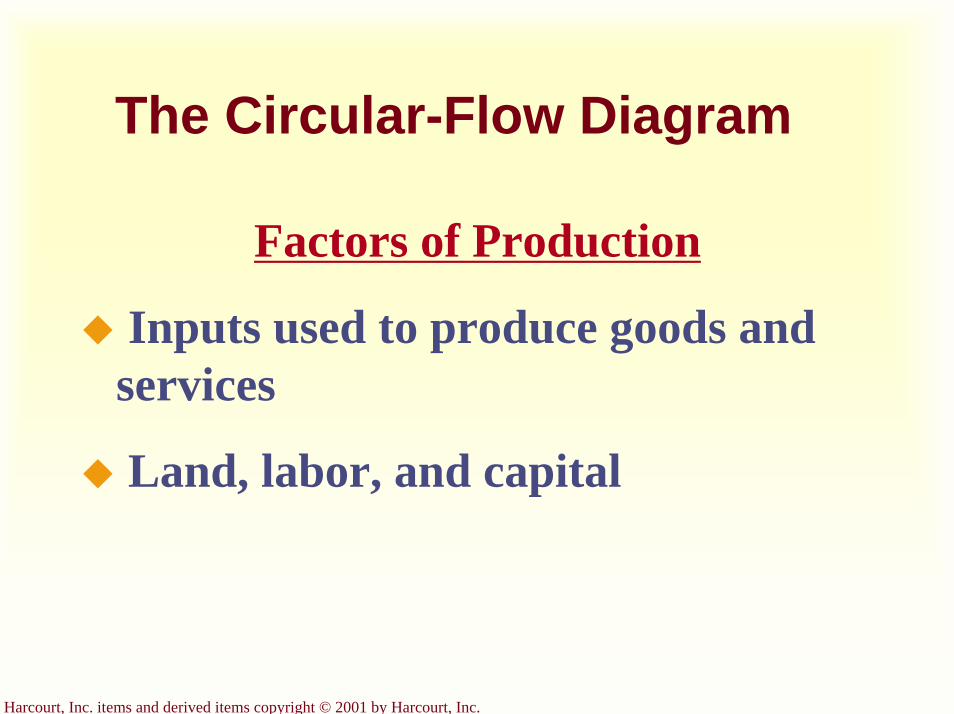
The Circular-Flow Diagram
Factors of Production
Inputs used to produce goods and services
Land, labor, and capital
Harcourt, Inc. items and derived items copyright © 2001 by Harcourt, Inc.
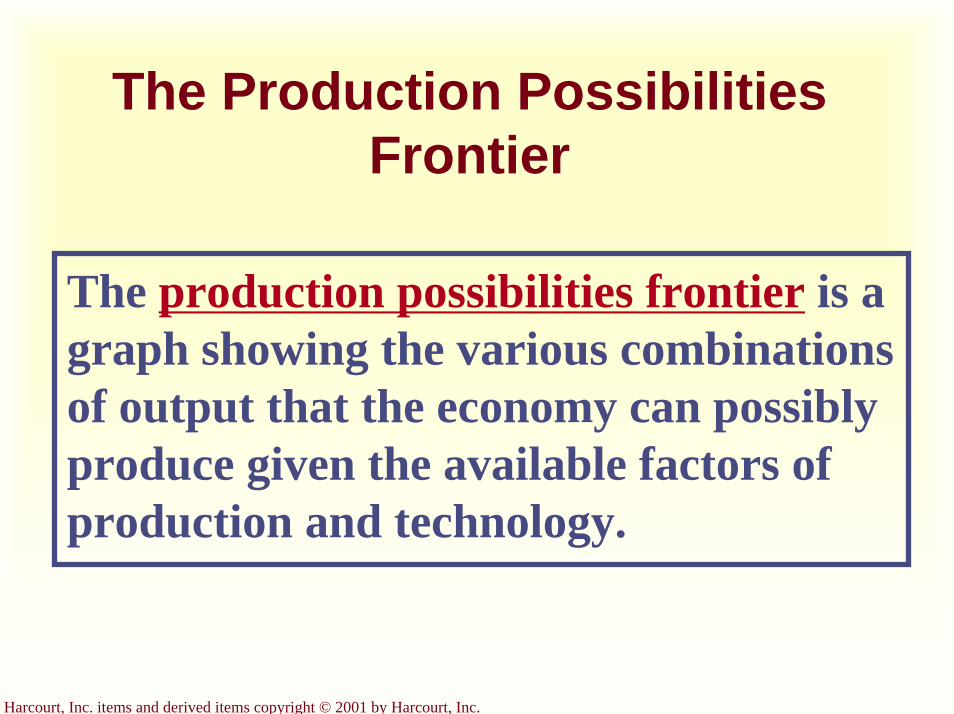
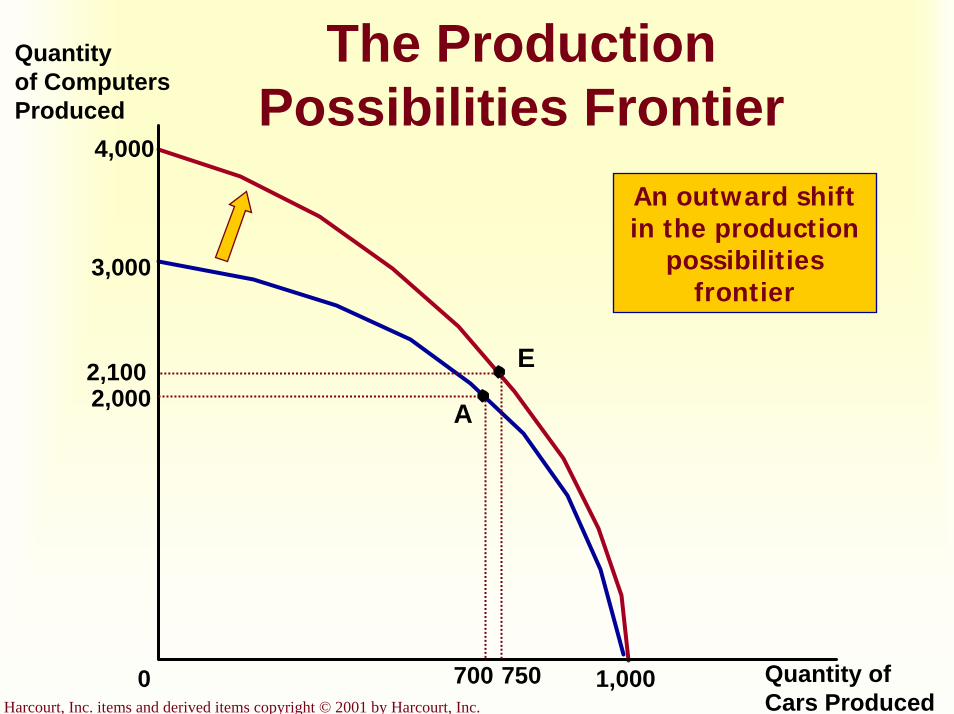
The Production Possibilities Frontier
The production possibilities frontier is a graph showing the various combinations of output that the economy can possibly produce given the available factors of production and technology.
Harcourt, Inc. items and derived items copyright © 2001 by Harcourt, Inc.
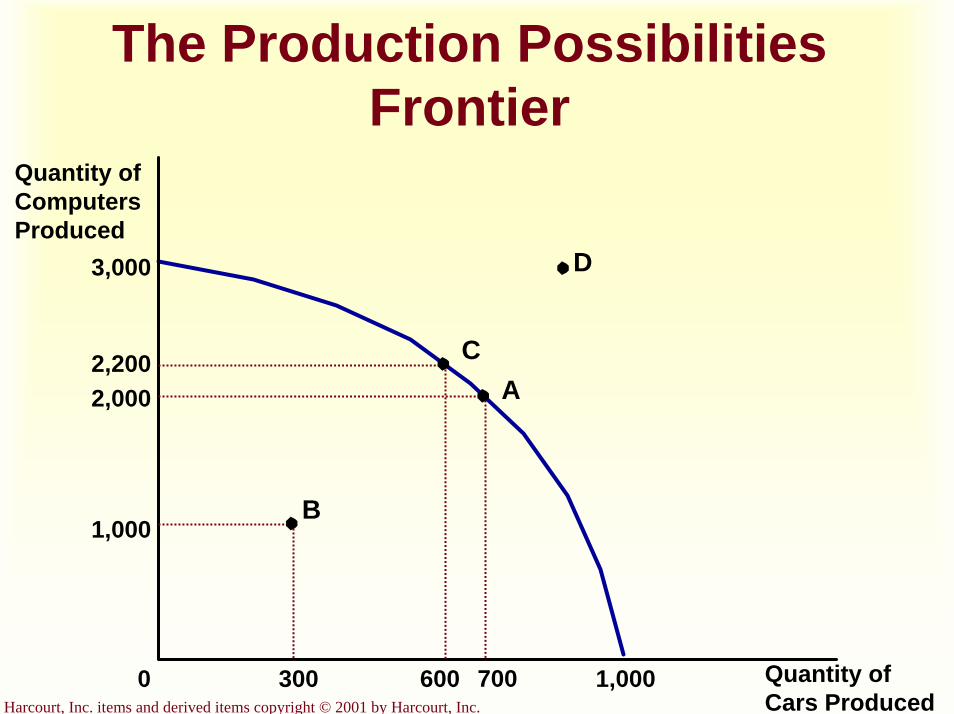
The Production Possibilities Frontier
Quantity ofComputersProduced
Quantity ofCars Produced
3,000
0 1,000
2,000
700
1,000
300
A
B
2,200
600
C
D
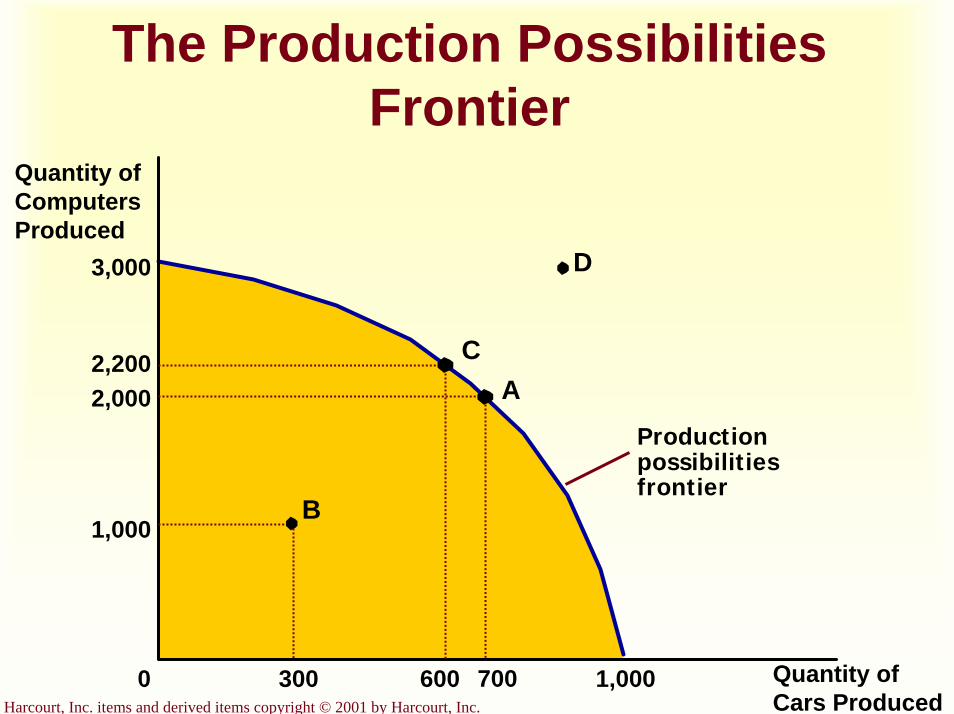
Harcourt, Inc. items and derived items copyright © 2001 by Harcourt, Inc.
The Production Possibilities Frontier
Quantity ofComputersProduced
Quantity ofCars Produced
3,000
1,000
2,0002,200
A
7006003000 1,000
B
C
D
Productionpossibilitiesfrontier

Harcourt, Inc. items and derived items copyright © 2001 by Harcourt, Inc.
Concepts Illustrated by the Production Possibilities Frontier
EfficiencyTradeoffsOpportunity CostEconomic Growth
Harcourt, Inc. items and derived items copyright © 2001 by Harcourt, Inc.
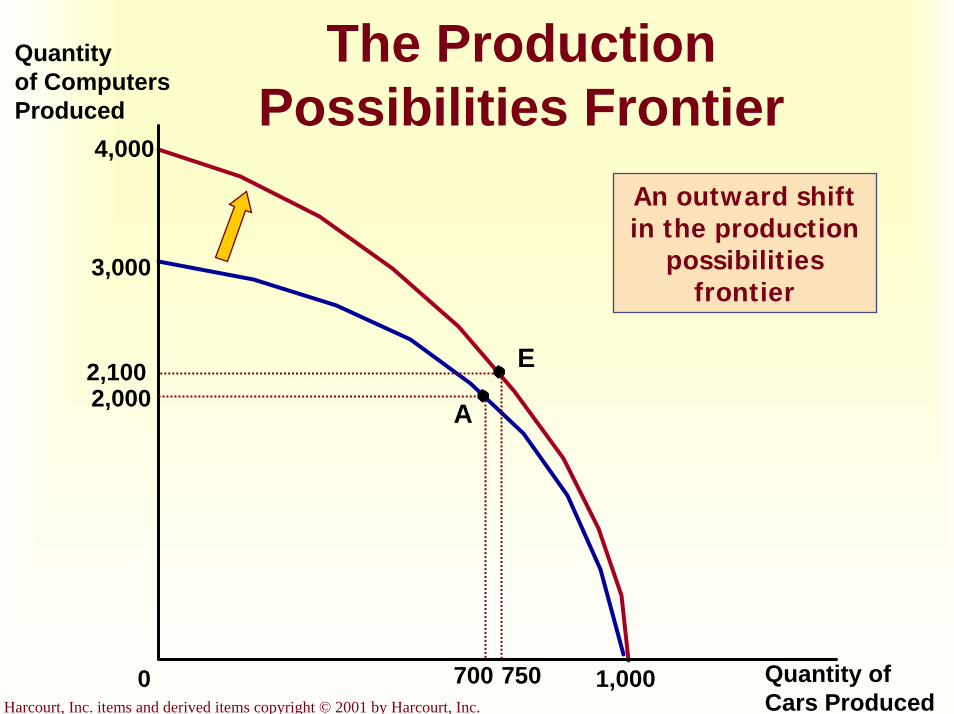
4,000
The Production Possibilities Frontier
Quantity of ComputersProduced
Quantity ofCars Produced
3,000
2,000 A
7000 1,000
E2,100
750
An outward shift in the production
possibilities frontier
Harcourt, Inc. items and derived items copyright © 2001 by Harcourt, Inc.
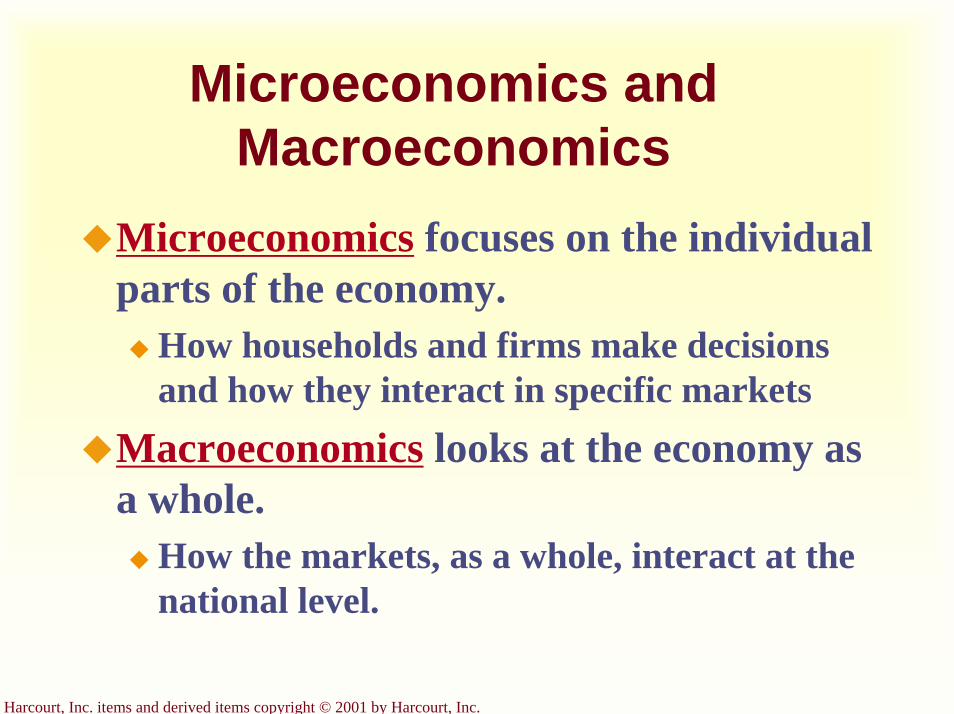
Microeconomics and Macroeconomics
Microeconomics focuses on the individual parts of the economy.
How households and firms make decisions and how they interact in specific markets
Macroeconomics looks at the economy as a whole.
How the markets, as a whole, interact at the national level.
Harcourt, Inc. items and derived items copyright © 2001 by Harcourt, Inc.
Two Roles of Economists
When they are trying to explain the world, they are scientists.When they are trying to change the world, they are policymakers.
Harcourt, Inc. items and derived items copyright © 2001 by Harcourt, Inc.
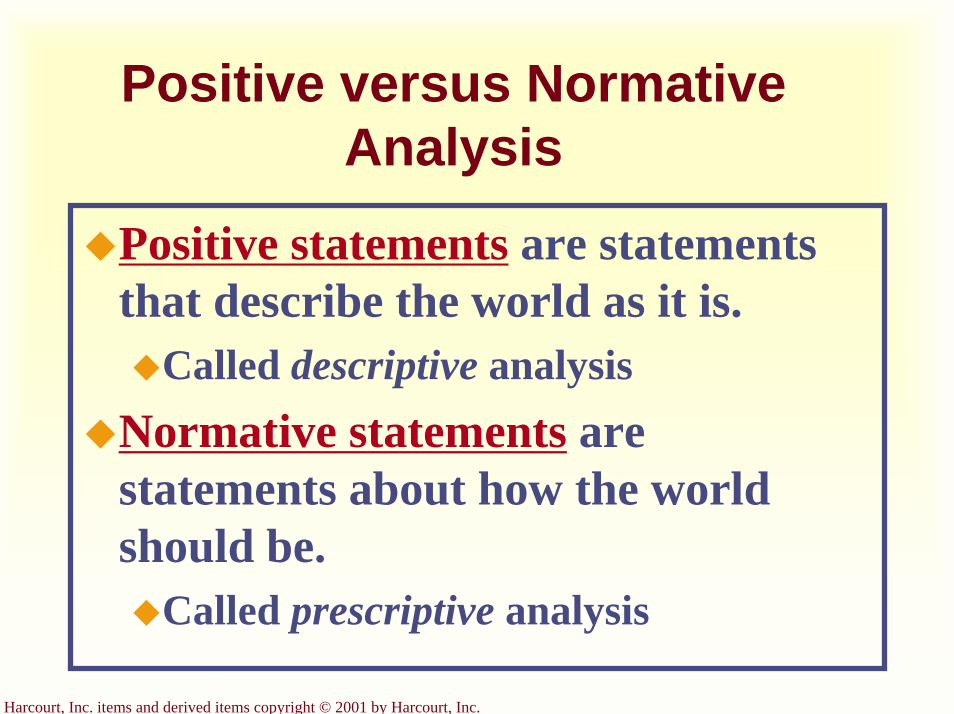
Positive versus Normative Analysis
Positive statements are statements that describe the world as it is.
Called descriptive analysisNormative statements are statements about how the world should be.
Called prescriptive analysis

Harcourt, Inc. items and derived items copyright © 2001 by Harcourt, Inc.
Positive or Normative Statements? ?
An increase in the minimum wage will cause a decrease in employment
among the least-skilled.
?

Harcourt, Inc. items and derived items copyright © 2001 by Harcourt, Inc.
Positive or Normative Statements?
?Higher federal budget deficits will
cause interest rates to increase.
? ?

Harcourt, Inc. items and derived items copyright © 2001 by Harcourt, Inc.
? ?Positive or Normative
Statements?
The income gains from a higher minimum wage are worth more than any slight reductions in employment.
? ?

Harcourt, Inc. items and derived items copyright © 2001 by Harcourt, Inc.
??Positive or Normative
Statements?
State governments should be allowed to collect from tobacco companies the costs of treating smoking-related
illnesses among the poor.
?
Harcourt, Inc. items and derived items copyright © 2001 by Harcourt, Inc.
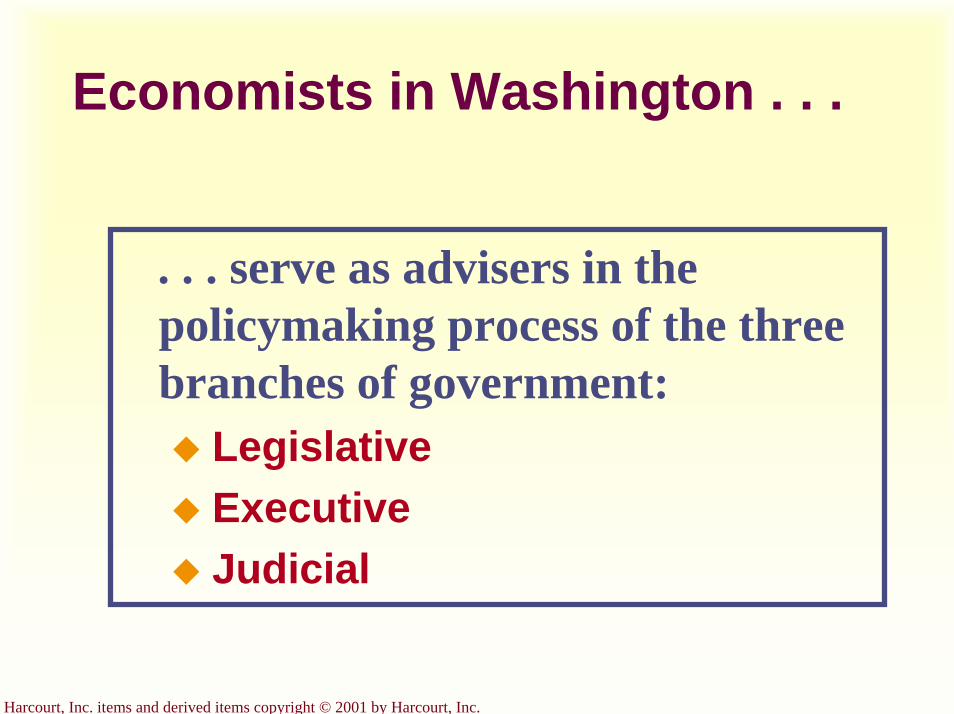
Economists in Washington . . .
. . . serve as advisers in the policymaking process of the three branches of government:
LegislativeExecutiveJudicial
Harcourt, Inc. items and derived items copyright © 2001 by Harcourt, Inc.
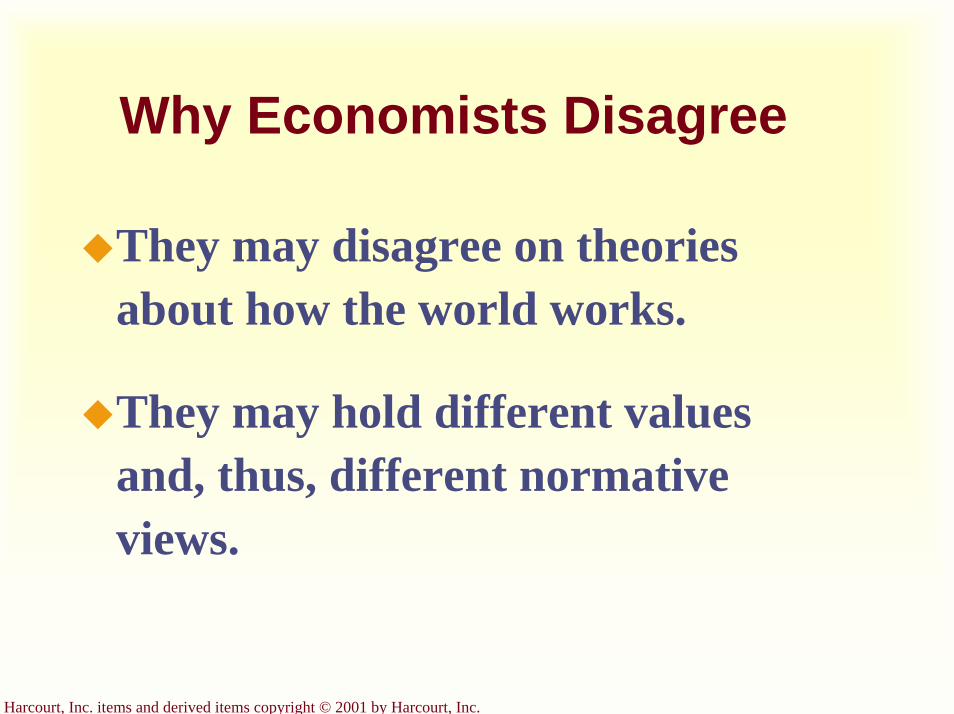
Why Economists Disagree
They may disagree on theories about how the world works.
They may hold different values and, thus, different normative views.
Harcourt, Inc. items and derived items copyright © 2001 by Harcourt, Inc.
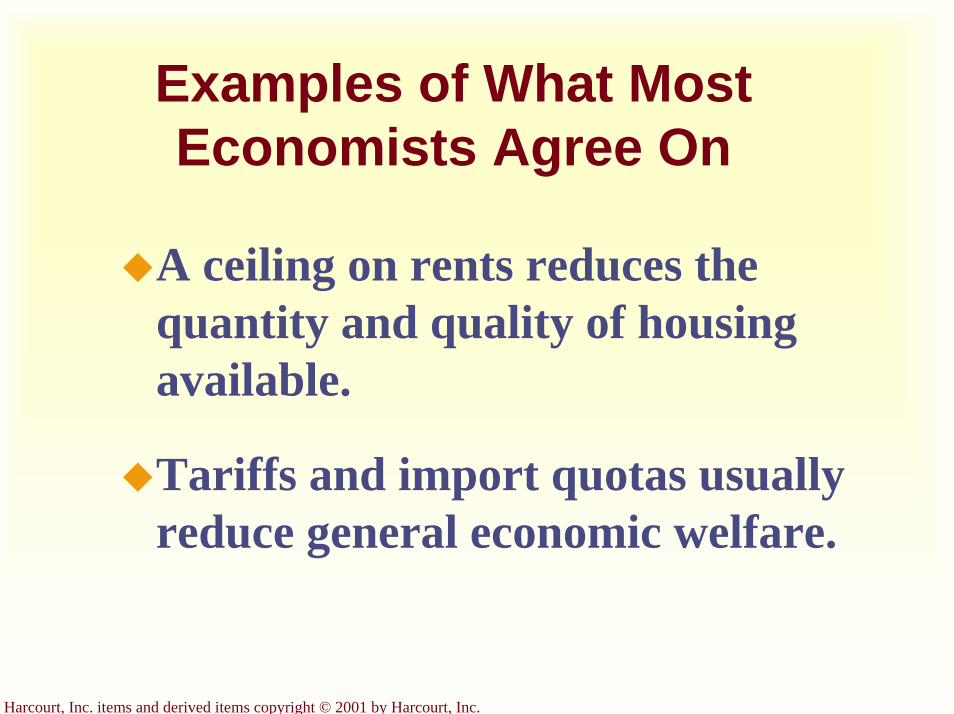
Examples of What Most Economists Agree On
A ceiling on rents reduces the quantity and quality of housing available.
Tariffs and import quotas usually reduce general economic welfare.
Harcourt, Inc. items and derived items copyright © 2001 by Harcourt, Inc.
Summary
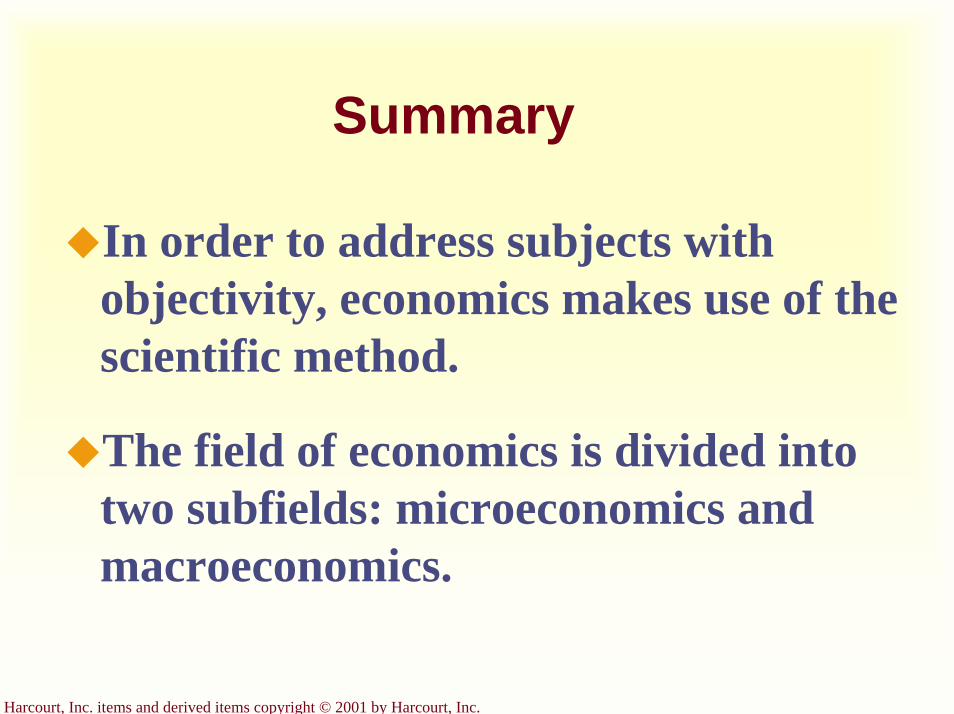
In order to address subjects with objectivity, economics makes use of the scientific method.
The field of economics is divided into two subfields: microeconomics and macroeconomics.
Harcourt, Inc. items and derived items copyright © 2001 by Harcourt, Inc.
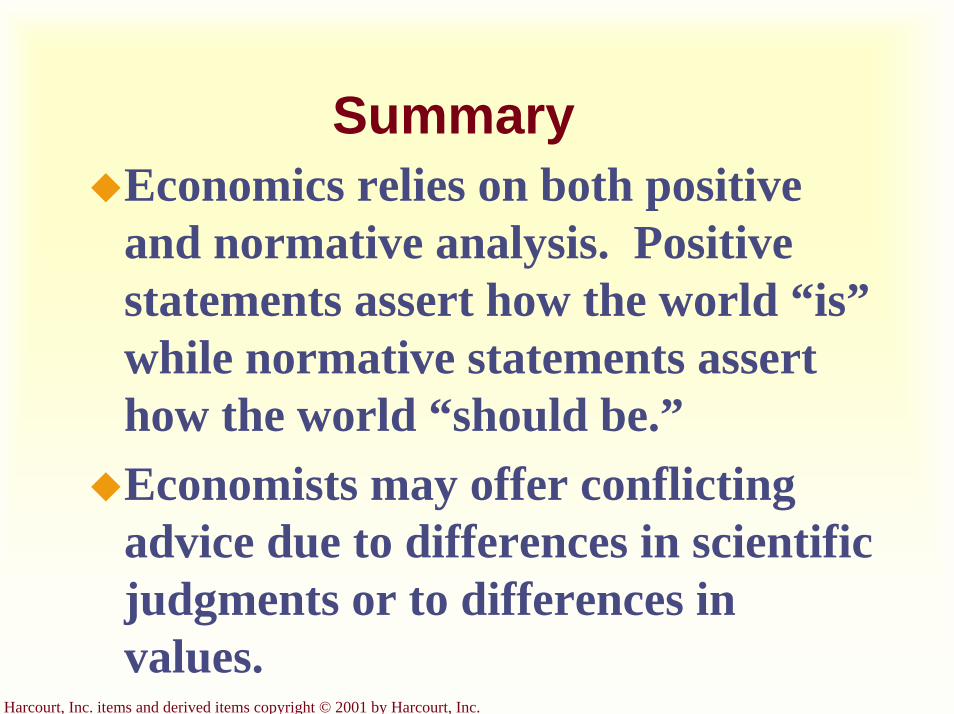
SummaryEconomics relies on both positive and normative analysis. Positive statements assert how the world “is”while normative statements assert how the world “should be.”Economists may offer conflicting advice due to differences in scientific judgments or to differences in values.

Harcourt, Inc. items and derived items copyright © 2001 by Harcourt, Inc.
Graphical Review
Harcourt, Inc. items and derived items copyright © 2001 by Harcourt, Inc.
The Circular-Flow Diagram
Firms Households
Market for Factors
of Production
Market for Goods
and Services
SpendingRevenue
Wages, rent, and profit
Income
Labor, land, and capital
Inputs for production
Goods & Services sold
Goods & Services bought

Harcourt, Inc. items and derived items copyright © 2001 by Harcourt, Inc.
The Production Possibilities Frontier
Quantity ofComputersProduced
Quantity ofCars Produced
3,000
0 1,000
2,000
700
1,000
300
A
B
2,200
600
C
D

Harcourt, Inc. items and derived items copyright © 2001 by Harcourt, Inc.
The Production Possibilities Frontier
Quantity ofComputersProduced
Quantity ofCars Produced
3,000
1,000
2,0002,200
A
7006003000 1,000
B
C
D
Productionpossibilitiesfrontier
Harcourt, Inc. items and derived items copyright © 2001 by Harcourt, Inc.
The Production Possibilities Frontier
4,000
Quantity of ComputersProduced
Quantity ofCars Produced
3,000
2,000 A
7000 1,000
E2,100
750
An outward shift in the production
possibilities frontier
Interdependence and the Gains from Trade
Chapter 3
Copyright © 2001 by Harcourt, Inc.
All rights reserved. Requests for permission to make copies of any part of thework should be mailed to:
Permissions Department, Harcourt College Publishers,6277 Sea Harbor Drive, Orlando, Florida 32887-6777.
Harcourt, Inc. items and derived items copyright © 2001 by Harcourt, Inc.
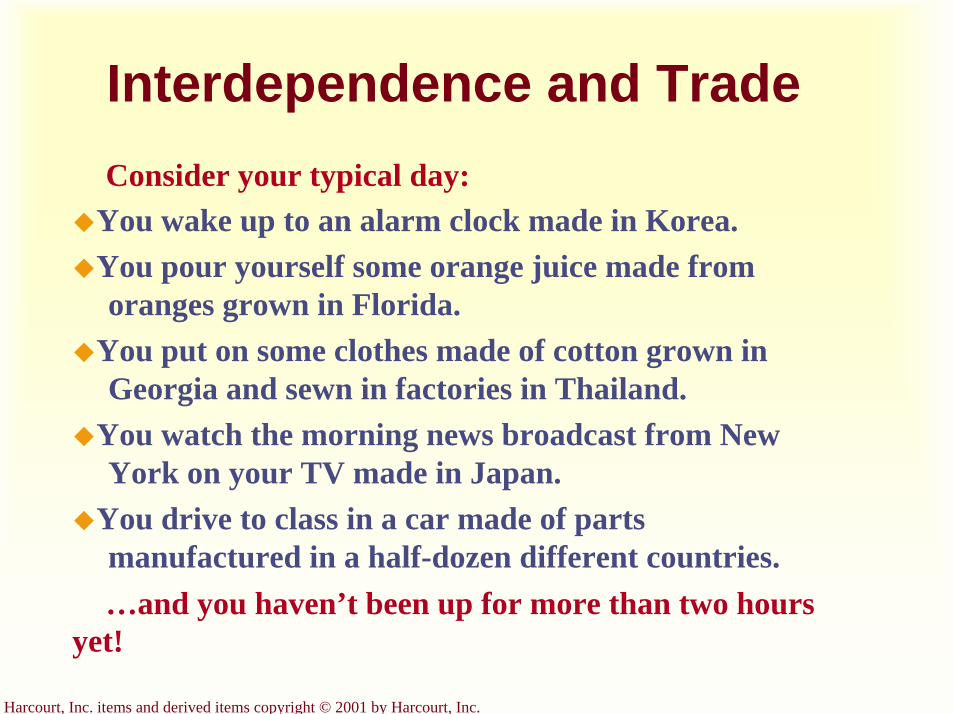
Interdependence and TradeConsider your typical day:
You wake up to an alarm clock made in Korea.You pour yourself some orange juice made from oranges grown in Florida.
You put on some clothes made of cotton grown in Georgia and sewn in factories in Thailand.
You watch the morning news broadcast from New York on your TV made in Japan.
You drive to class in a car made of parts manufactured in a half-dozen different countries.…and you haven’t been up for more than two hours
yet!
Harcourt, Inc. items and derived items copyright © 2001 by Harcourt, Inc.
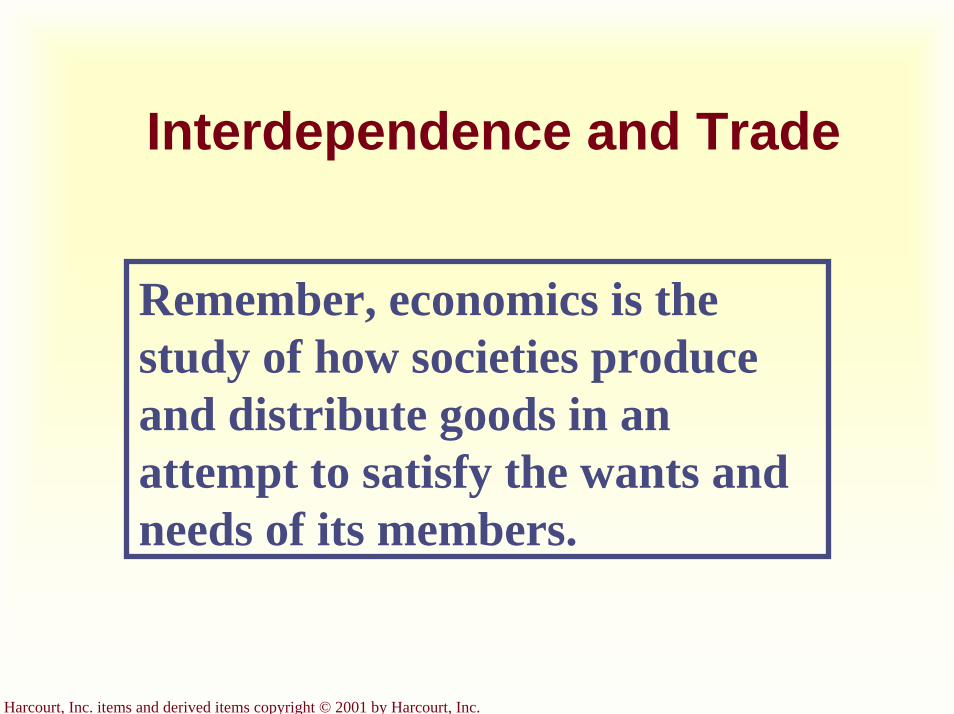
Interdependence and Trade
Remember, economics is the study of how societies produce and distribute goods in an attempt to satisfy the wants and needs of its members.

Harcourt, Inc. items and derived items copyright © 2001 by Harcourt, Inc.
How do we satisfy our wants and needs in a global economy?
We can be economically self-sufficient.We can specialize and
trade with others, leading to economic
interdependence.
Harcourt, Inc. items and derived items copyright © 2001 by Harcourt, Inc.
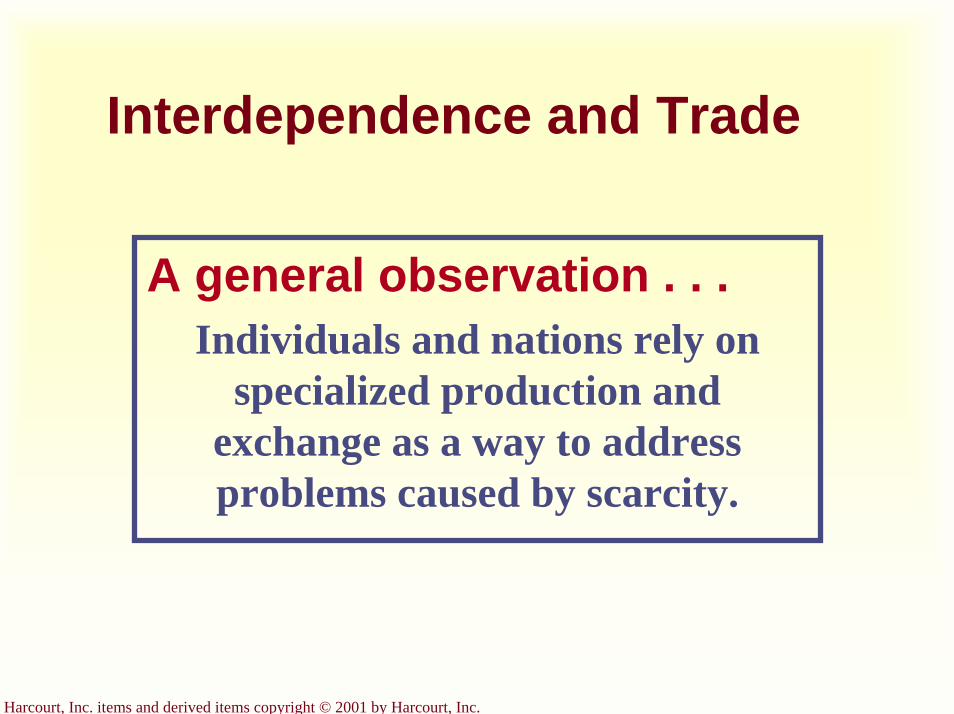
Interdependence and Trade
A general observation . . .Individuals and nations rely on
specialized production and exchange as a way to address problems caused by scarcity.
Harcourt, Inc. items and derived items copyright © 2001 by Harcourt, Inc.
Interdependence and Trade
But, this gives rise to two questions:Why is interdependence the norm?What determines production and trade?
Harcourt, Inc. items and derived items copyright © 2001 by Harcourt, Inc.
Why is interdependence the norm?
Interdependence occurs because people are better off when they specialize and trade with others.
Harcourt, Inc. items and derived items copyright © 2001 by Harcourt, Inc.
What determines the pattern of production and trade?
Patterns of production and trade are based upon differences in
opportunity costs.
Harcourt, Inc. items and derived items copyright © 2001 by Harcourt, Inc.
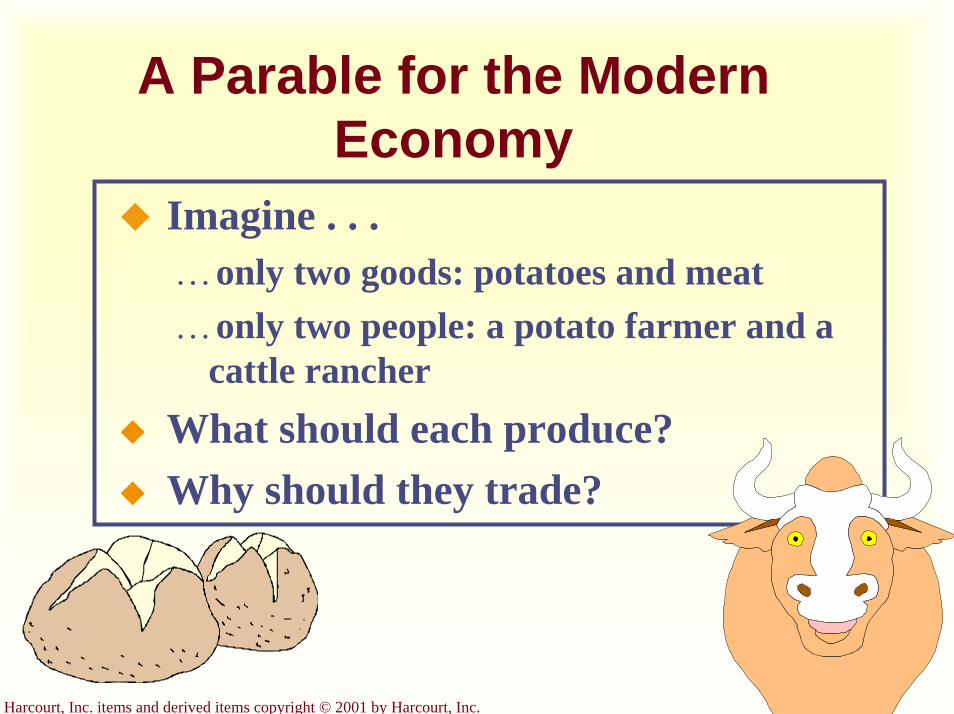
A Parable for the Modern Economy
Imagine . . .…only two goods: potatoes and meat…only two people: a potato farmer and a
cattle rancherWhat should each produce?Why should they trade?
Harcourt, Inc. items and derived items copyright © 2001 by Harcourt, Inc.
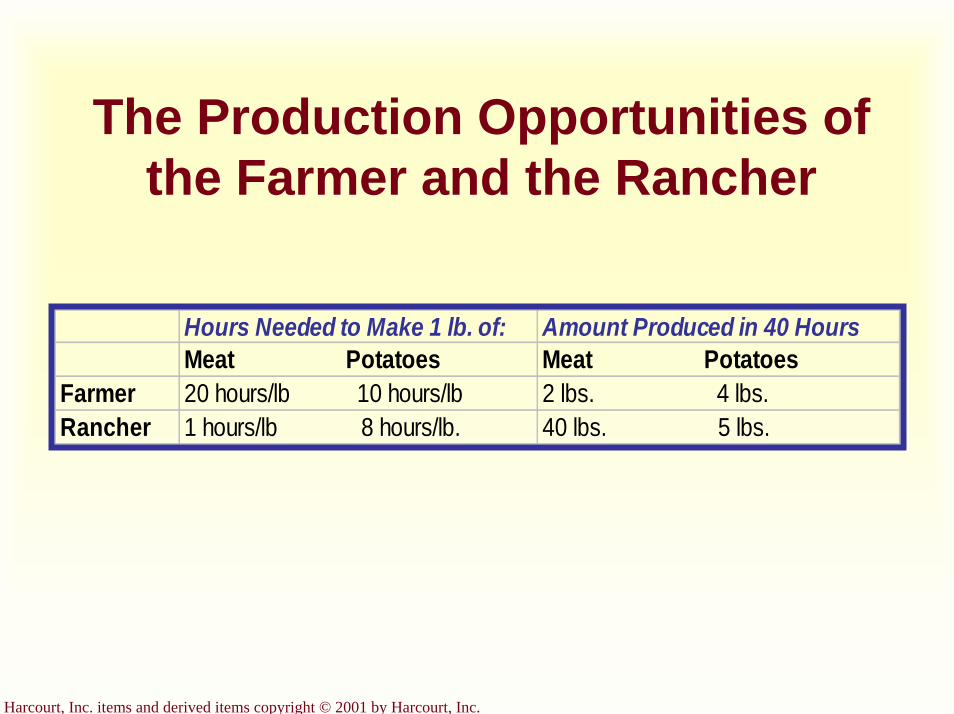
The Production Opportunities of the Farmer and the Rancher
Hours Needed to Make 1 lb. of: Amount Produced in 40 HoursMeat Potatoes Meat Potatoes
Farmer 20 hours/lb 10 hours/lb 2 lbs. 4 lbs.Rancher 1 hours/lb 8 hours/lb. 40 lbs. 5 lbs.
Harcourt, Inc. items and derived items copyright © 2001 by Harcourt, Inc.
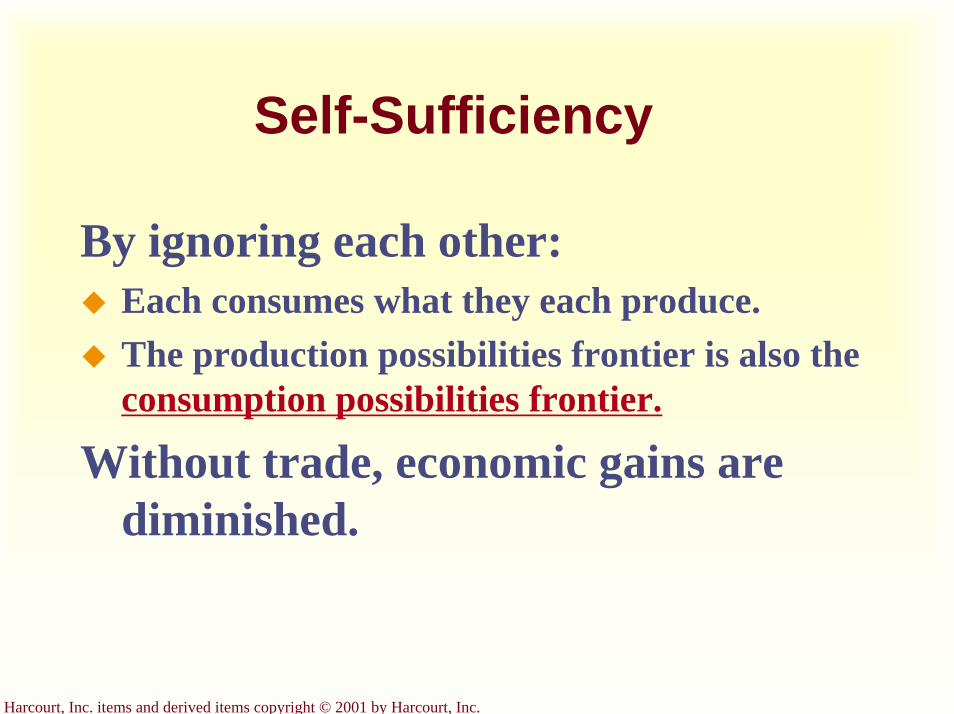
Self-Sufficiency
By ignoring each other:Each consumes what they each produce.The production possibilities frontier is also theconsumption possibilities frontier.
Without trade, economic gains are diminished.
Harcourt, Inc. items and derived items copyright © 2001 by Harcourt, Inc.
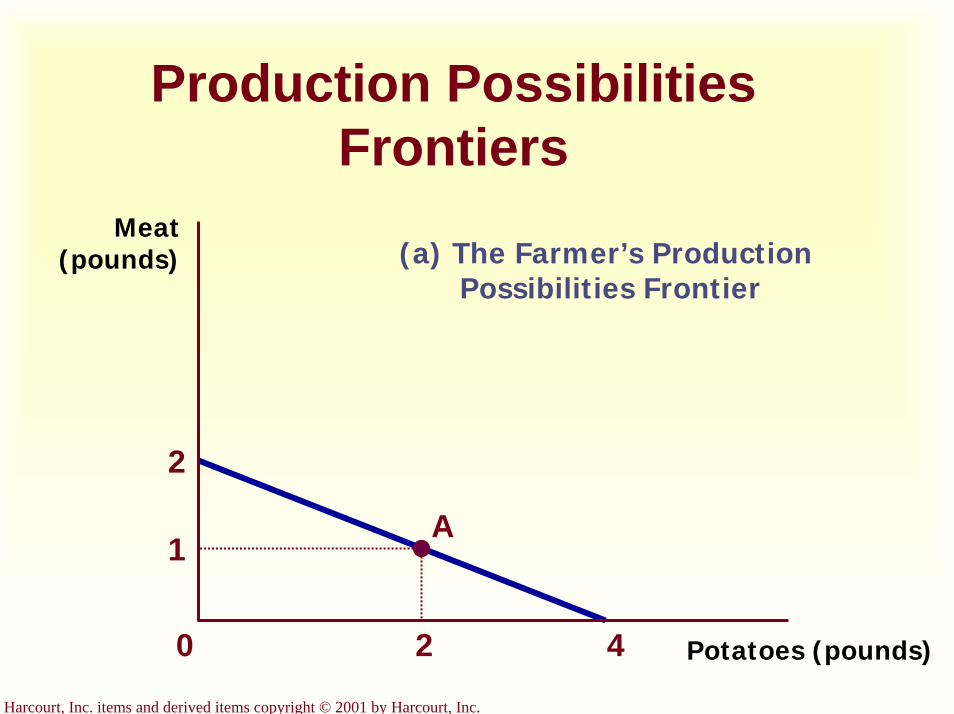
Production Possibilities Frontiers
Meat (pounds) (a) The Farmer’s Production
Possibilities Frontier
2
1
2
A
0 4 Potatoes (pounds)

Harcourt, Inc. items and derived items copyright © 2001 by Harcourt, Inc.
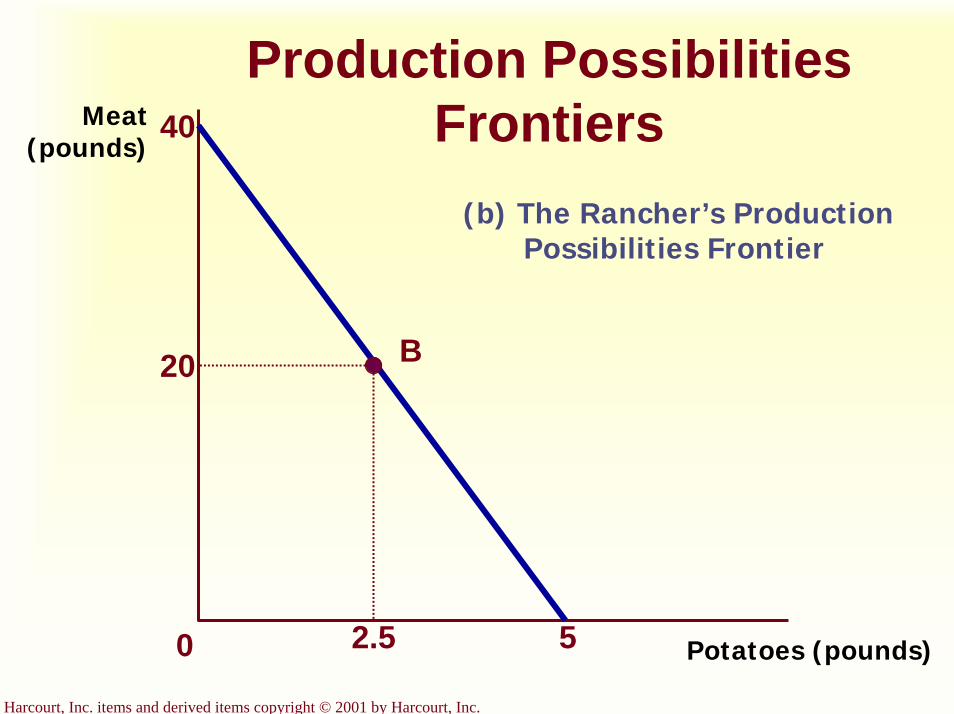
Production Possibilities Frontiers
Potatoes (pounds)
Meat (pounds)
5
40
20
2.5
(b) The Rancher’s ProductionPossibilities Frontier
0
B
Harcourt, Inc. items and derived items copyright © 2001 by Harcourt, Inc.
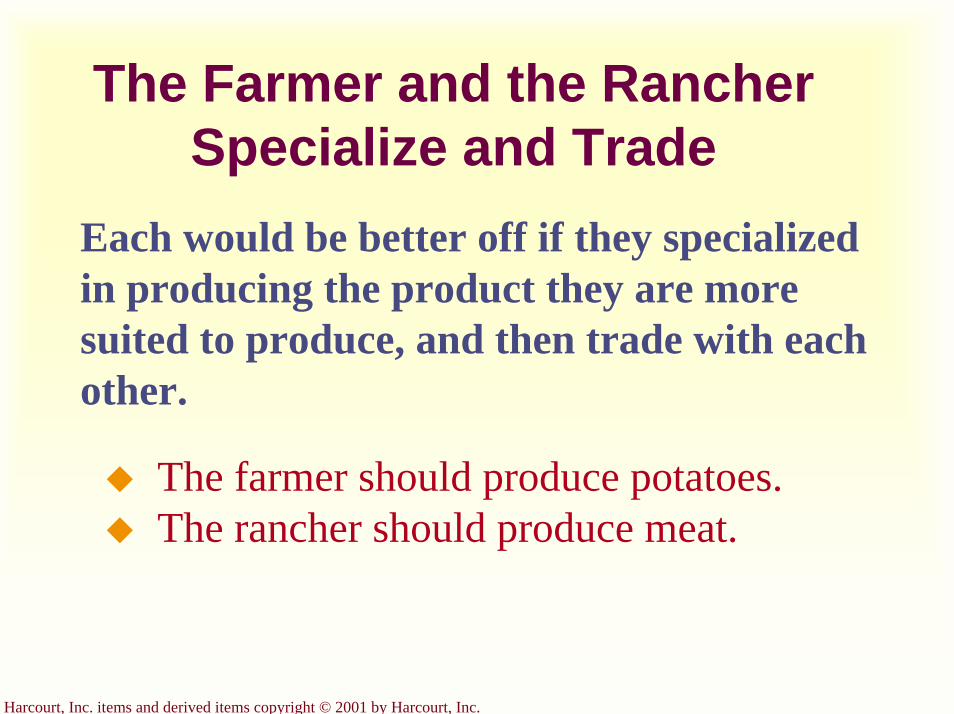
The Farmer and the Rancher Specialize and Trade
Each would be better off if they specializedin producing the product they are more suited to produce, and then trade with each other.
The farmer should produce potatoes. The rancher should produce meat.
Harcourt, Inc. items and derived items copyright © 2001 by Harcourt, Inc.
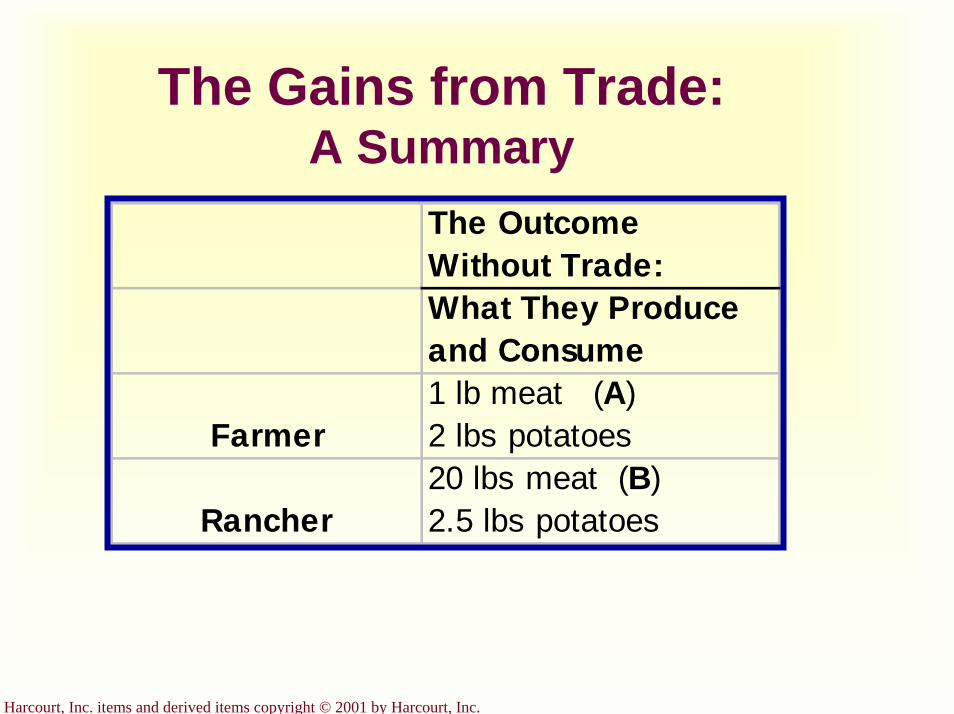
The Gains from Trade: A Summary
The OutcomeWithout Trade:What They Produceand Consume
Farmer1 lb meat (A)2 lbs potatoes
Rancher20 lbs meat (B)2.5 lbs potatoes
Harcourt, Inc. items and derived items copyright © 2001 by Harcourt, Inc.
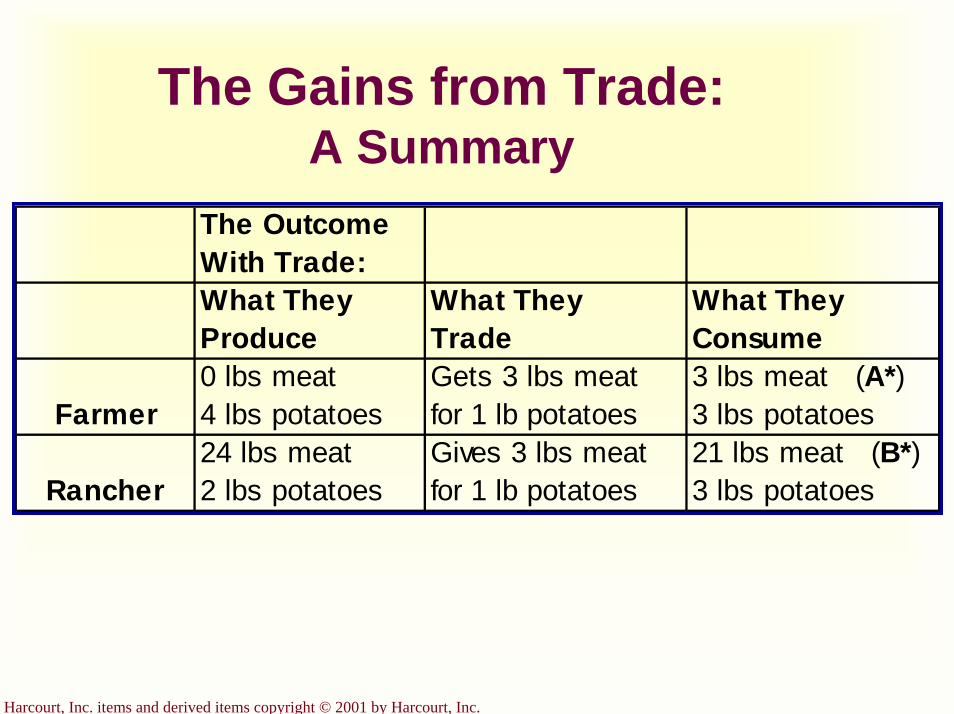
The Gains from Trade: A Summary
The OutcomeWith Trade:What TheyProduce
What TheyTrade
What TheyConsume
Farmer0 lbs meat 4 lbs potatoes
Gets 3 lbs meatfor 1 lb potatoes
3 lbs meat (A*)3 lbs potatoes
Rancher24 lbs meat 2 lbs potatoes
Gives 3 lbs meatfor 1 lb potatoes
21 lbs meat (B*)3 lbs potatoes

Harcourt, Inc. items and derived items copyright © 2001 by Harcourt, Inc.
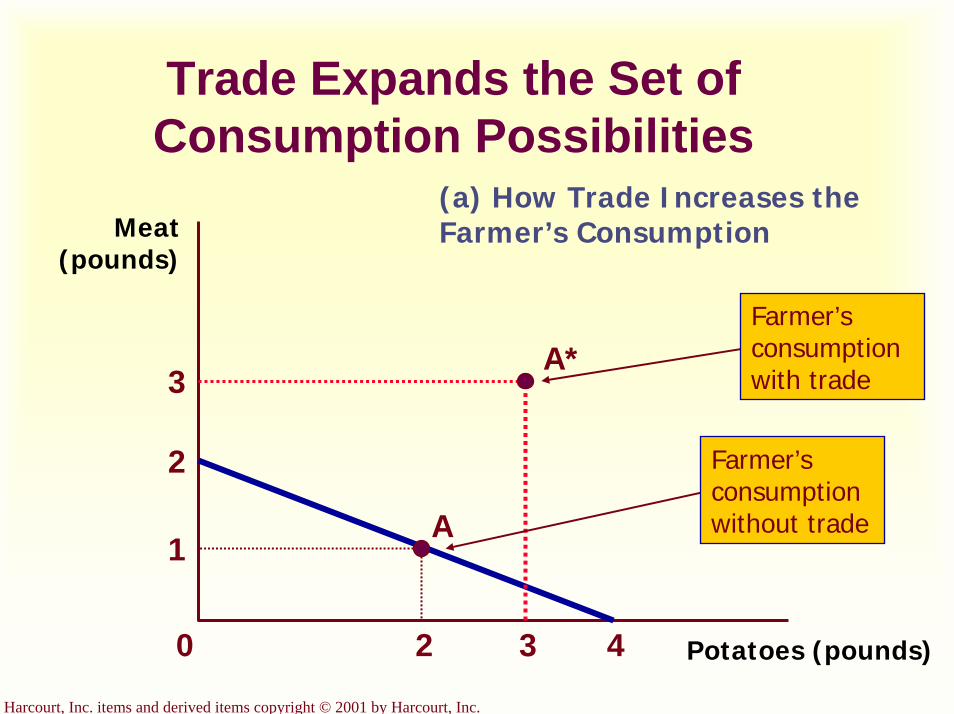
Trade Expands the Set of Consumption Possibilities
(a) How Trade Increases the Farmer’s ConsumptionMeat
(pounds)
Potatoes (pounds)42
2
1
0
A
3
3
A*
Farmer’s consumption without trade
Farmer’s consumption with trade

Harcourt, Inc. items and derived items copyright © 2001 by Harcourt, Inc.
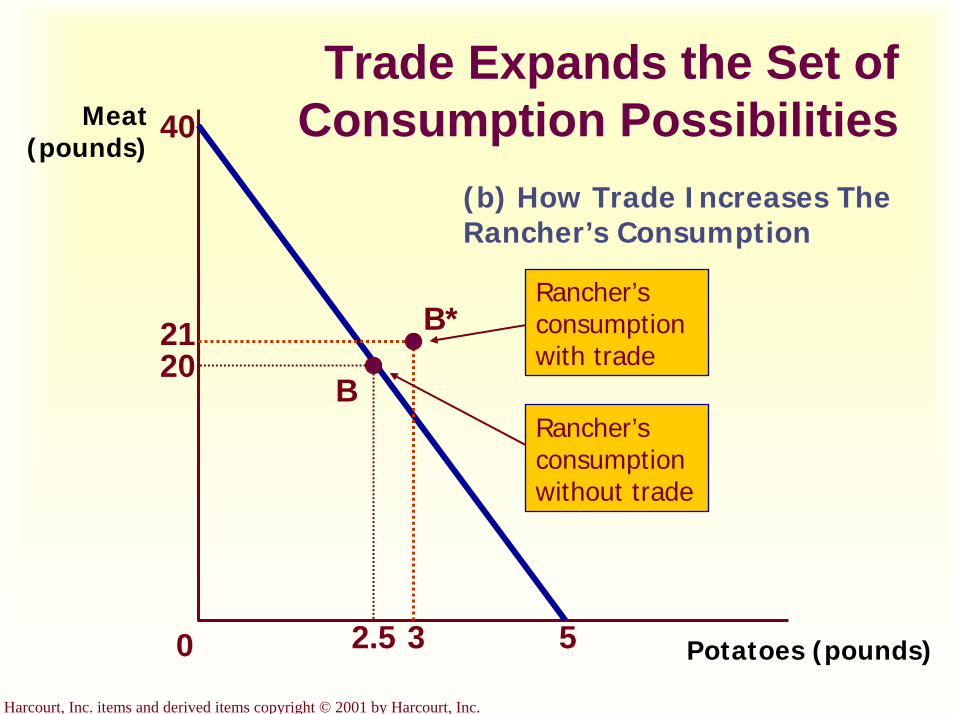
Trade Expands the Set of Consumption Possibilities
Potatoes (pounds)
Meat (pounds)
52.5
40
20
(b) How Trade Increases The Rancher’s Consumption
0
B
21
3
B*
Rancher’s consumption without trade
Rancher’s consumption with trade
Harcourt, Inc. items and derived items copyright © 2001 by Harcourt, Inc.
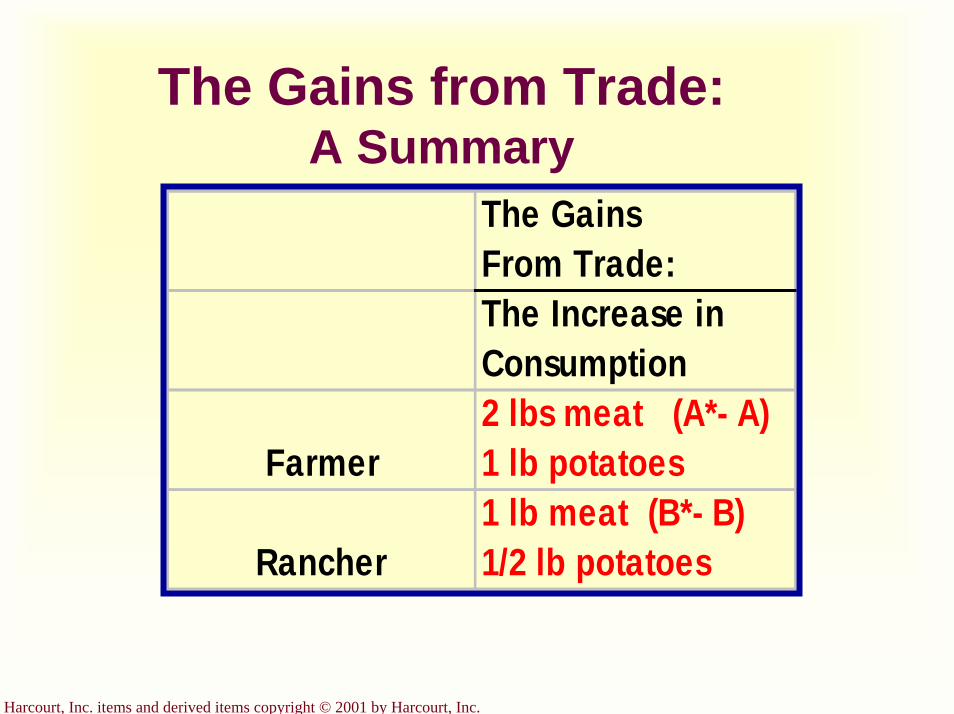
The Gains from Trade: A Summary
The GainsFrom Trade:The Increase in Consumption
Farmer2 lbs meat (A*- A)1 lb potatoes
Rancher1 lb meat (B*- B)1/2 lb potatoes
Harcourt, Inc. items and derived items copyright © 2001 by Harcourt, Inc.
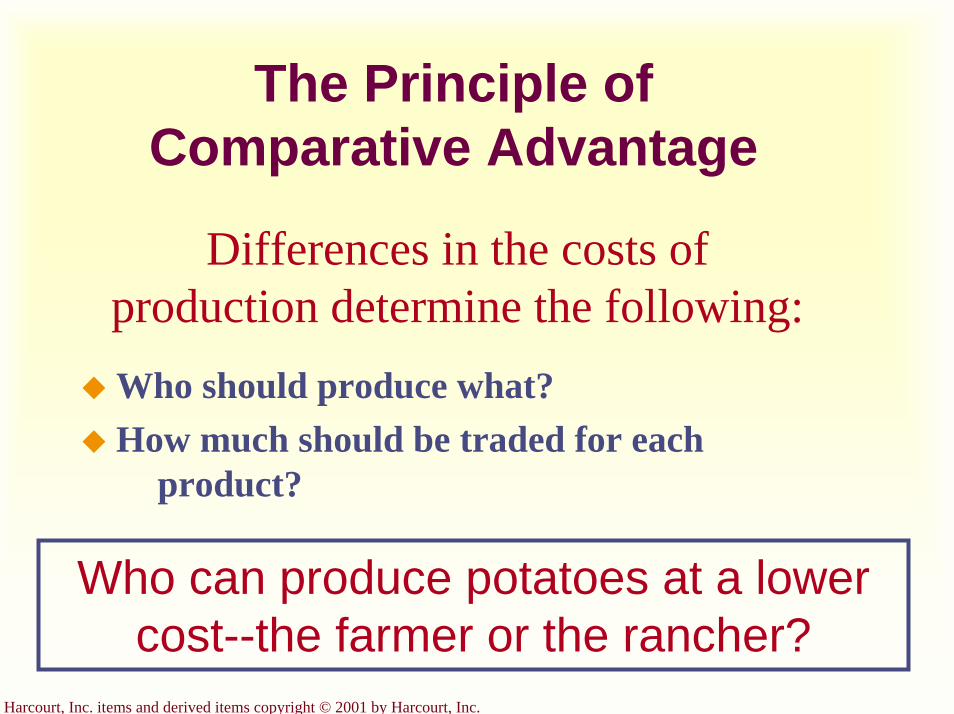
The Principle of Comparative Advantage
Differences in the costs of production determine the following:Who should produce what?How much should be traded for each
product?
Who can produce potatoes at a lower cost--the farmer or the rancher?
Harcourt, Inc. items and derived items copyright © 2001 by Harcourt, Inc.
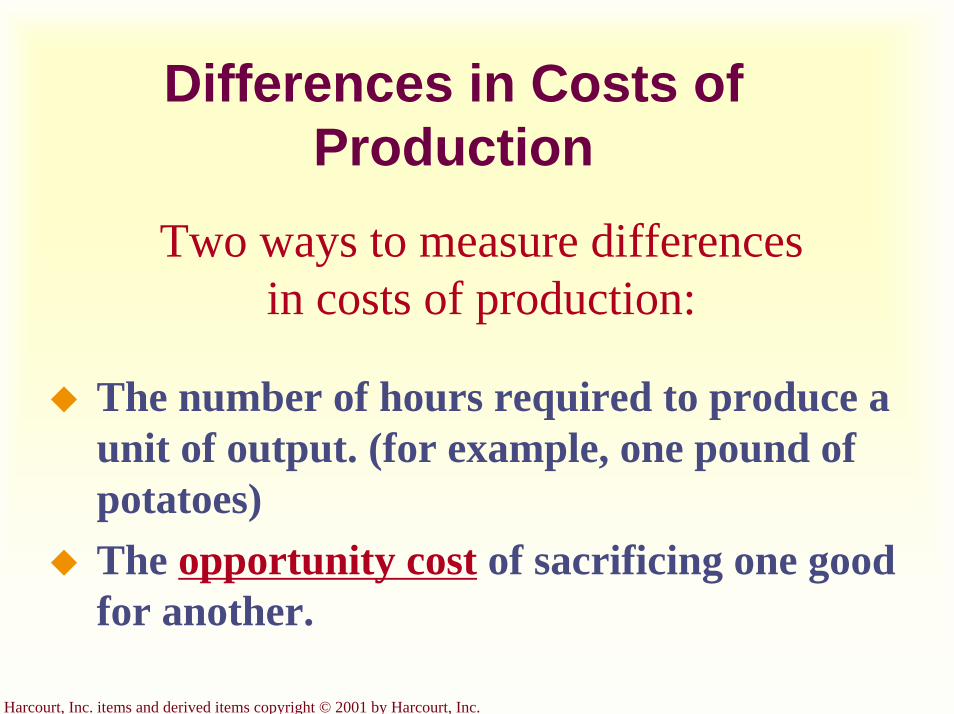
Differences in Costs of Production
Two ways to measure differences in costs of production:
The number of hours required to produce a unit of output. (for example, one pound of potatoes)The opportunity cost of sacrificing one good for another.
Harcourt, Inc. items and derived items copyright © 2001 by Harcourt, Inc.
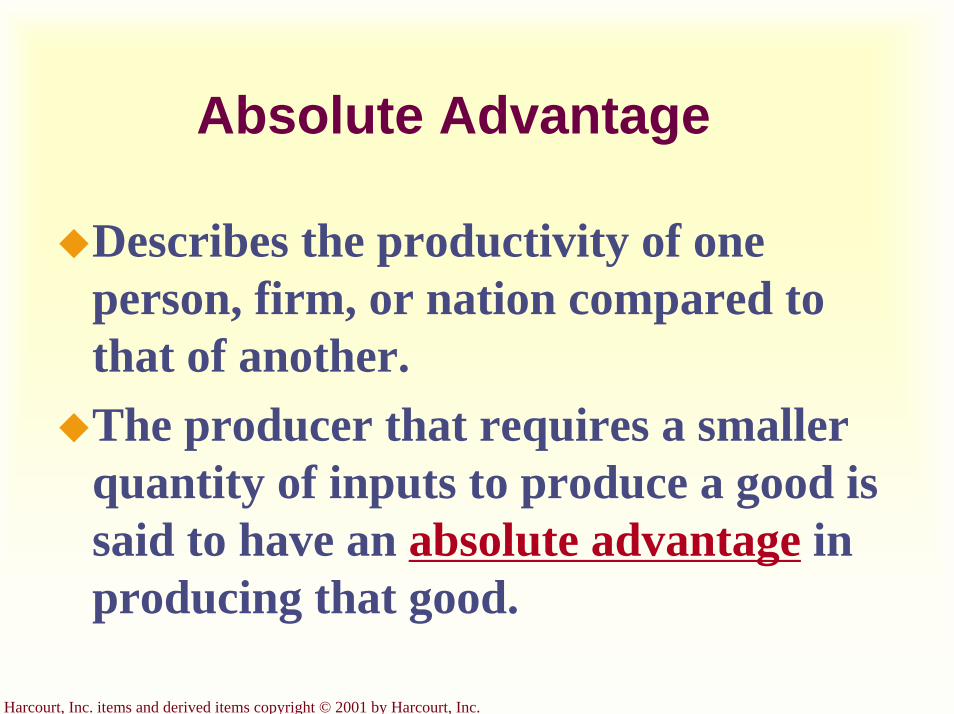
Absolute Advantage
Describes the productivity of one person, firm, or nation compared to that of another.The producer that requires a smaller quantity of inputs to produce a good is said to have an absolute advantage in producing that good.
Harcourt, Inc. items and derived items copyright © 2001 by Harcourt, Inc.
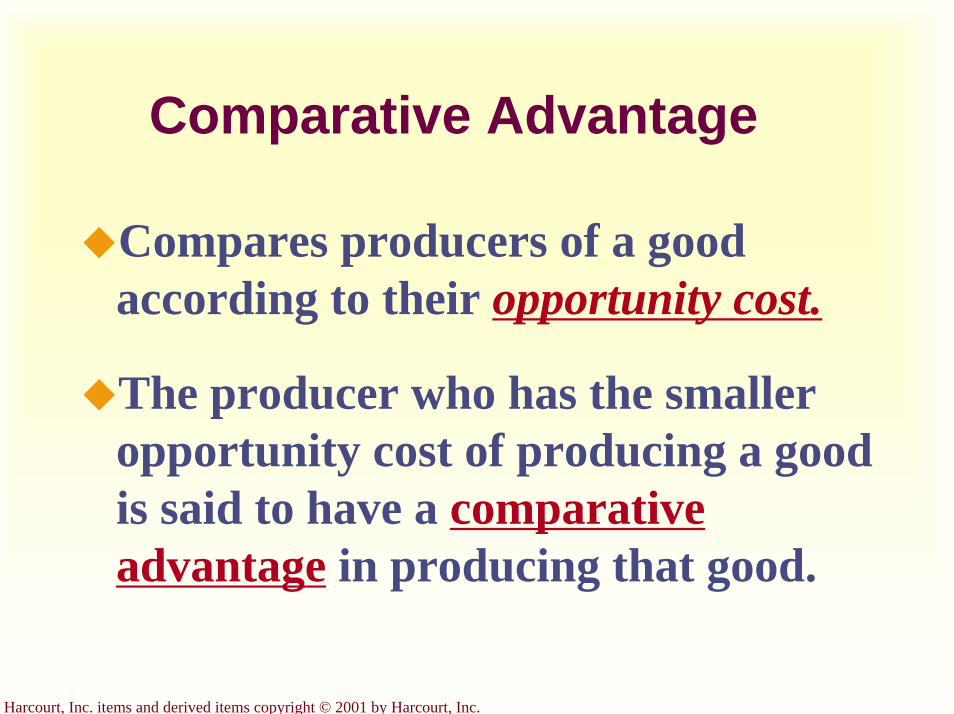
Comparative Advantage
Compares producers of a good according to their opportunity cost.
The producer who has the smaller opportunity cost of producing a good is said to have a comparative advantage in producing that good.
Harcourt, Inc. items and derived items copyright © 2001 by Harcourt, Inc.
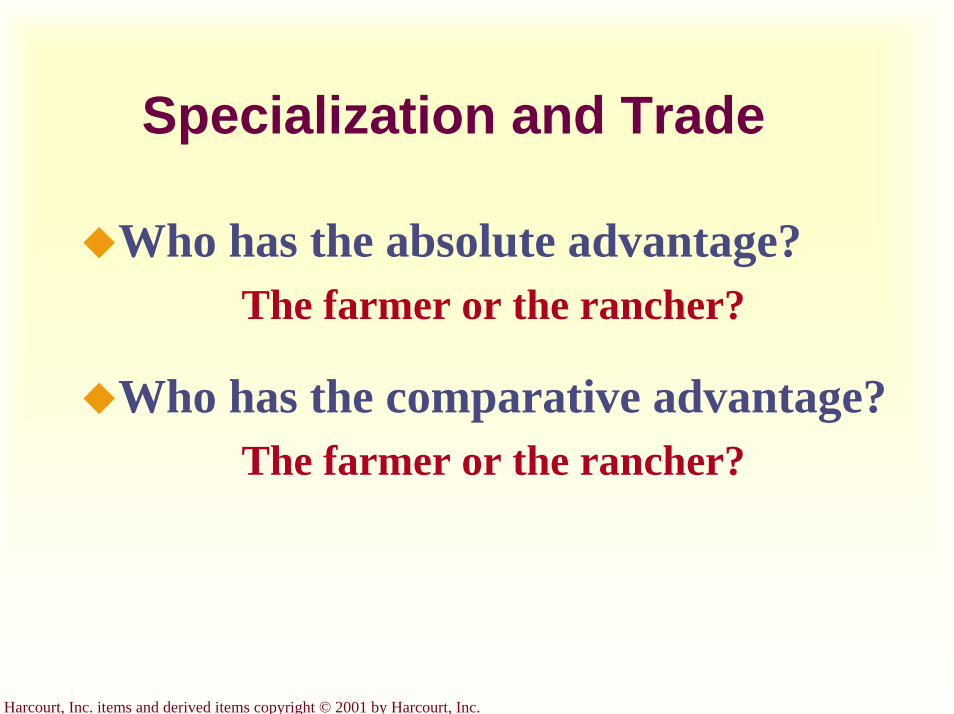
Specialization and Trade
Who has the absolute advantage?The farmer or the rancher?
Who has the comparative advantage?The farmer or the rancher?
Harcourt, Inc. items and derived items copyright © 2001 by Harcourt, Inc.
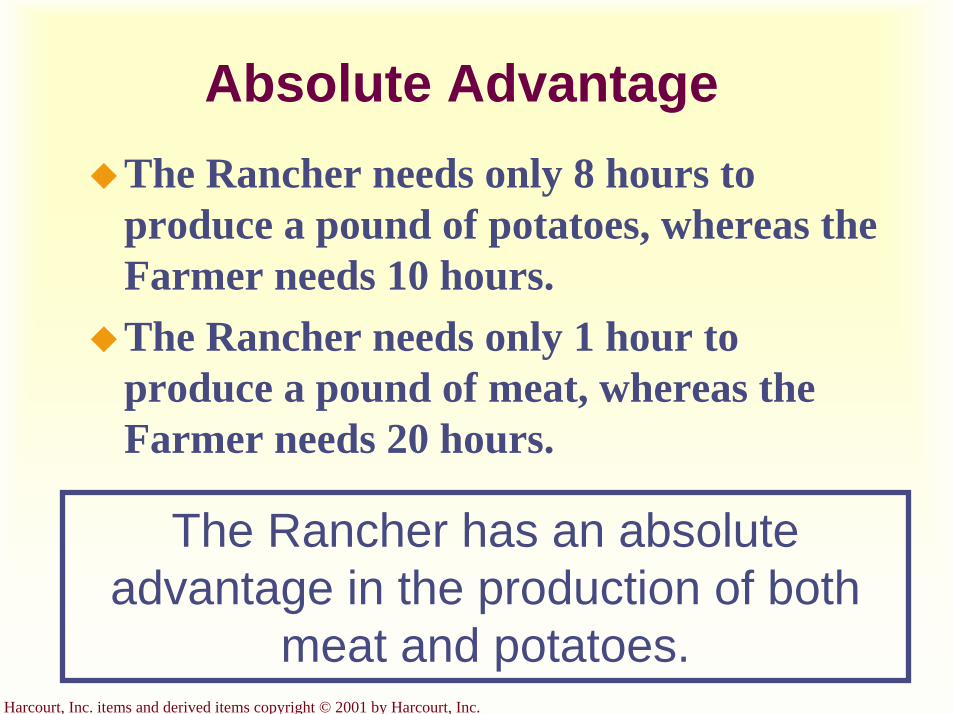
Absolute AdvantageThe Rancher needs only 8 hours to produce a pound of potatoes, whereas the Farmer needs 10 hours.The Rancher needs only 1 hour to produce a pound of meat, whereas the Farmer needs 20 hours.
The Rancher has an absolute advantage in the production of both
meat and potatoes.
Harcourt, Inc. items and derived items copyright © 2001 by Harcourt, Inc.
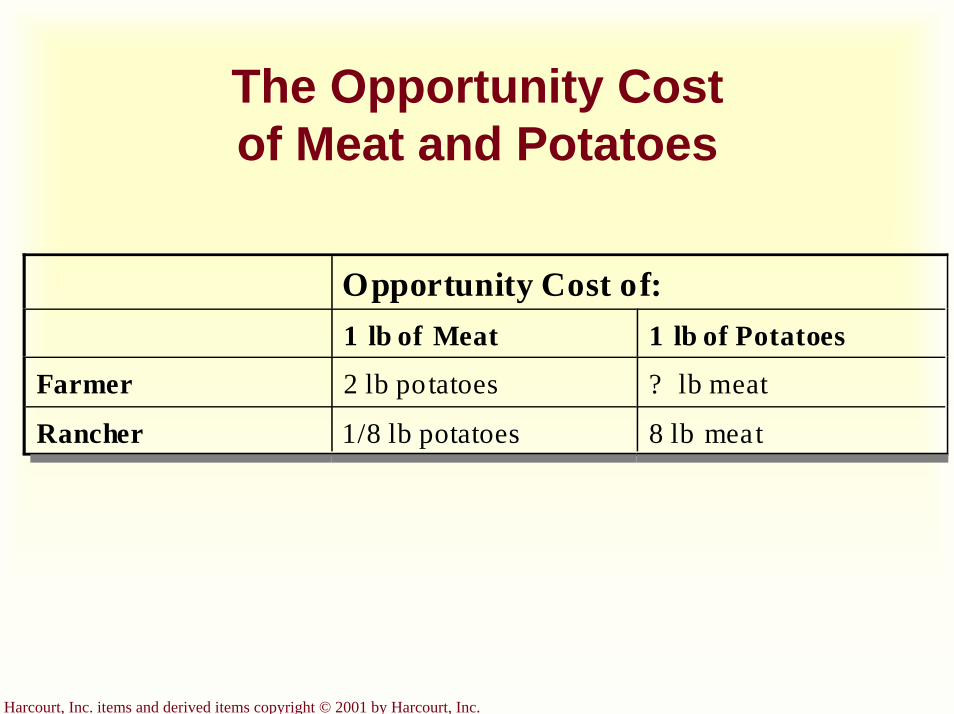
The Opportunity Cost of Meat and Potatoes
Opportunity Cost of:1 lb of Meat 1 lb of Potatoes
Farmer 2 lb potatoes ? lb meat
Rancher 1/8 lb potatoes 8 lb meat
Harcourt, Inc. items and derived items copyright © 2001 by Harcourt, Inc.
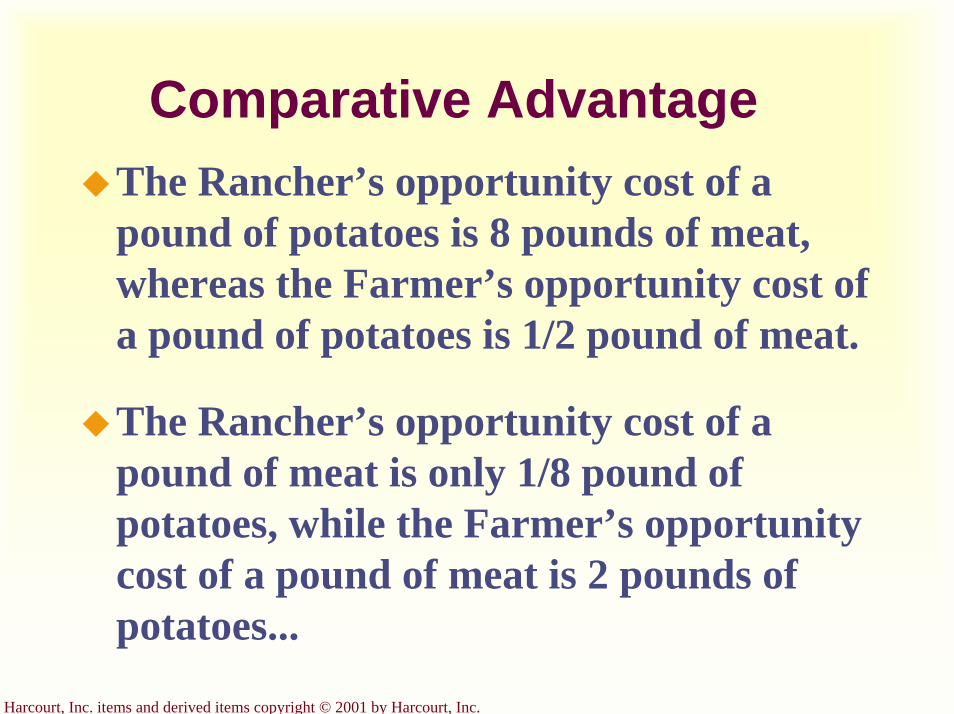
Comparative AdvantageThe Rancher’s opportunity cost of a pound of potatoes is 8 pounds of meat, whereas the Farmer’s opportunity cost of a pound of potatoes is 1/2 pound of meat.
The Rancher’s opportunity cost of a pound of meat is only 1/8 pound of potatoes, while the Farmer’s opportunity cost of a pound of meat is 2 pounds of potatoes...
Harcourt, Inc. items and derived items copyright © 2001 by Harcourt, Inc.
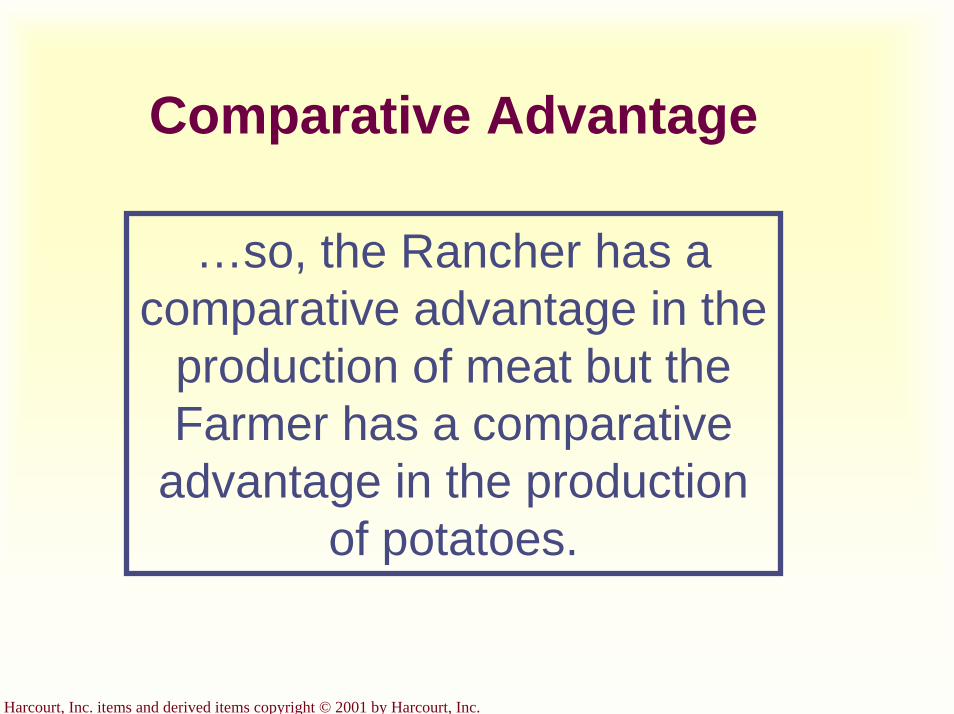
Comparative Advantage
…so, the Rancher has a comparative advantage in the
production of meat but the Farmer has a comparative
advantage in the production of potatoes.
Harcourt, Inc. items and derived items copyright © 2001 by Harcourt, Inc.
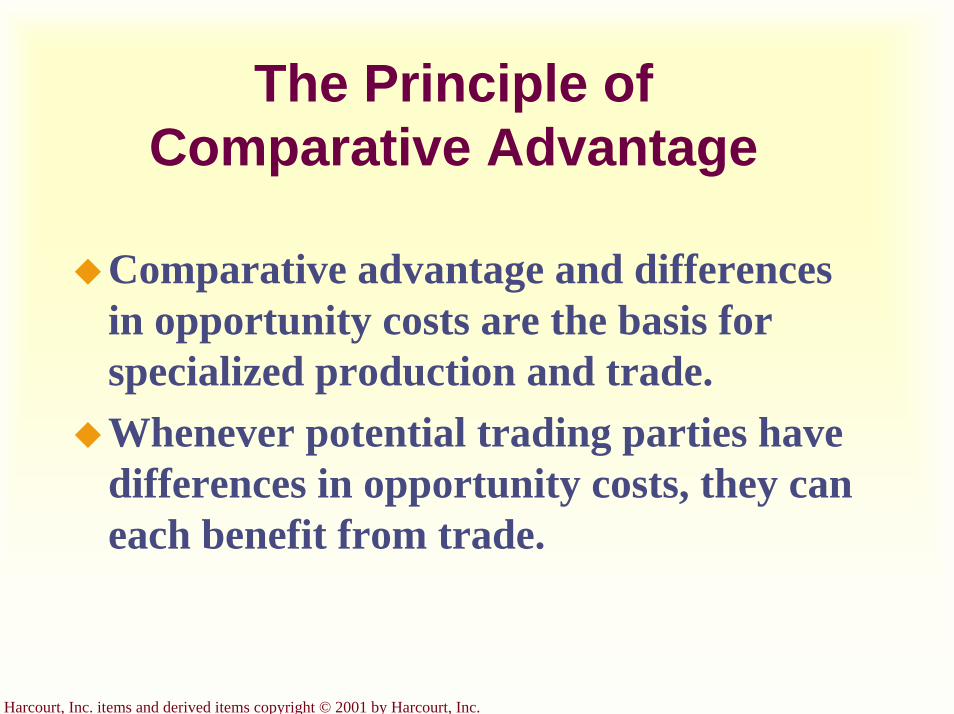
The Principle of Comparative Advantage
Comparative advantage and differences in opportunity costs are the basis for specialized production and trade.Whenever potential trading parties have differences in opportunity costs, they can each benefit from trade.
Harcourt, Inc. items and derived items copyright © 2001 by Harcourt, Inc.
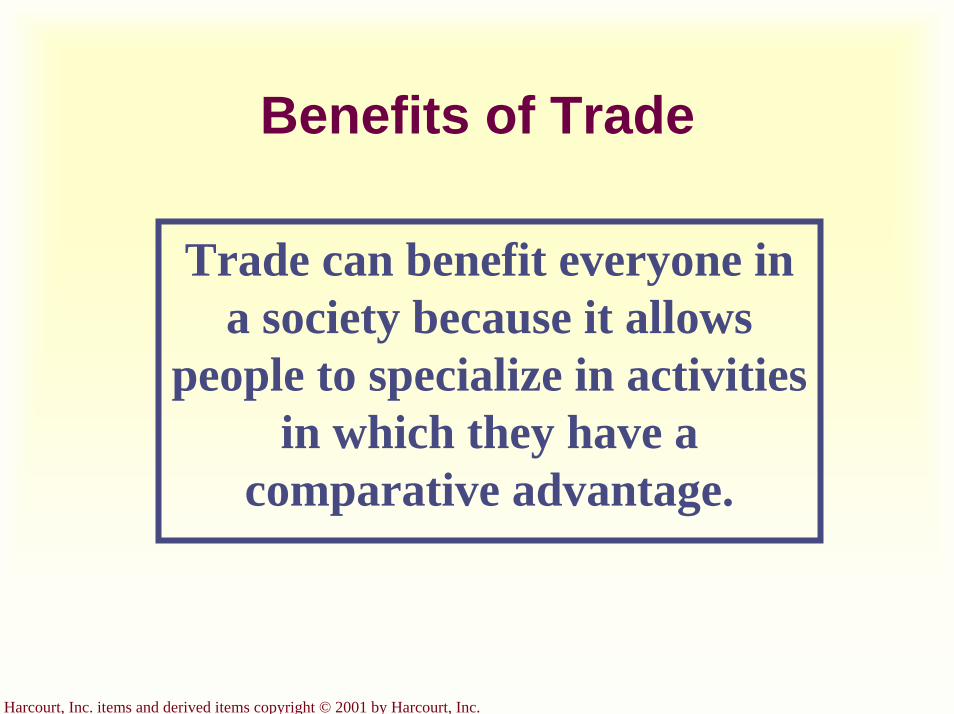
Benefits of Trade
Trade can benefit everyone in a society because it allows
people to specialize in activities in which they have a
comparative advantage.
Harcourt, Inc. items and derived items copyright © 2001 by Harcourt, Inc.
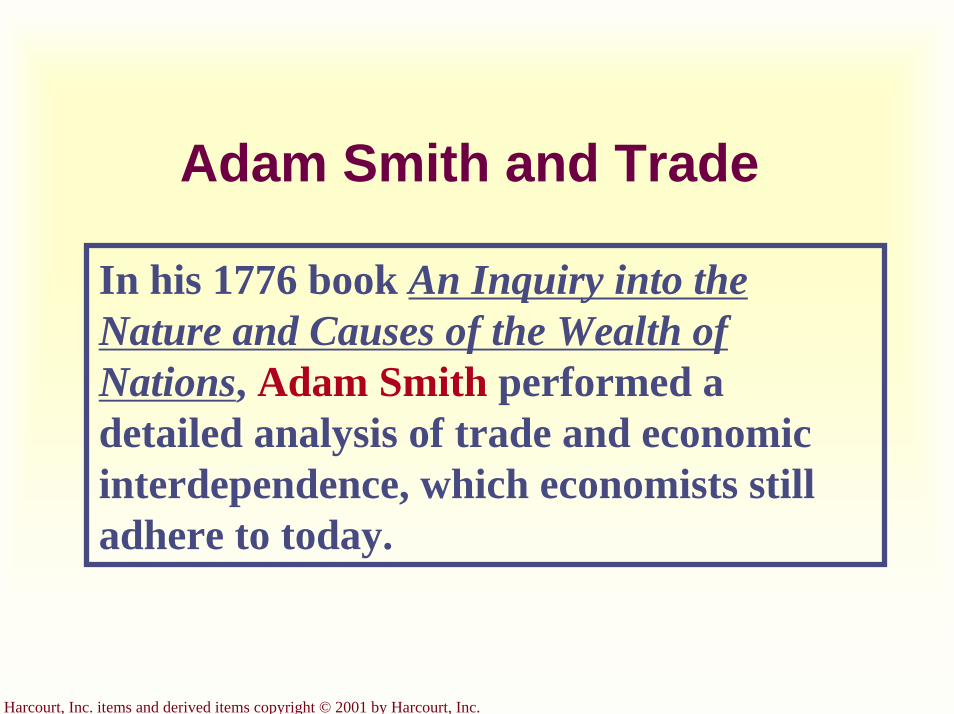
Adam Smith and Trade
In his 1776 book An Inquiry into the Nature and Causes of the Wealth of Nations, Adam Smith performed a detailed analysis of trade and economic interdependence, which economists still adhere to today.
Harcourt, Inc. items and derived items copyright © 2001 by Harcourt, Inc.
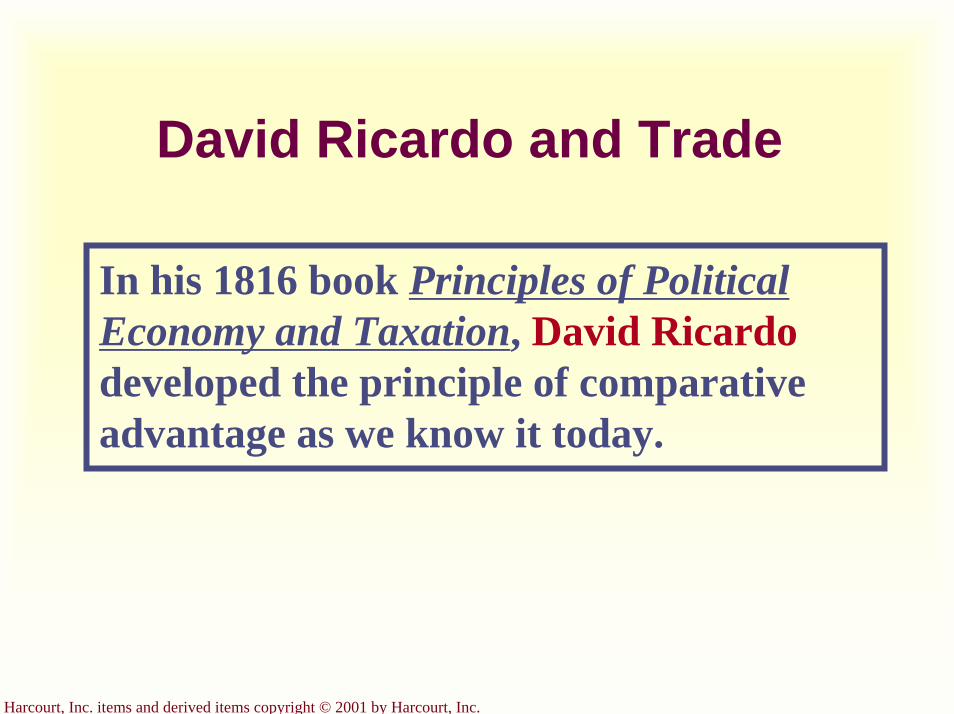
David Ricardo and Trade
In his 1816 book Principles of Political Economy and Taxation, David Ricardodeveloped the principle of comparative advantage as we know it today.

Harcourt, Inc. items and derived items copyright © 2001 by Harcourt, Inc.
Should Tiger Woods Mow His Own Lawn?
?? ?
Harcourt, Inc. items and derived items copyright © 2001 by Harcourt, Inc.
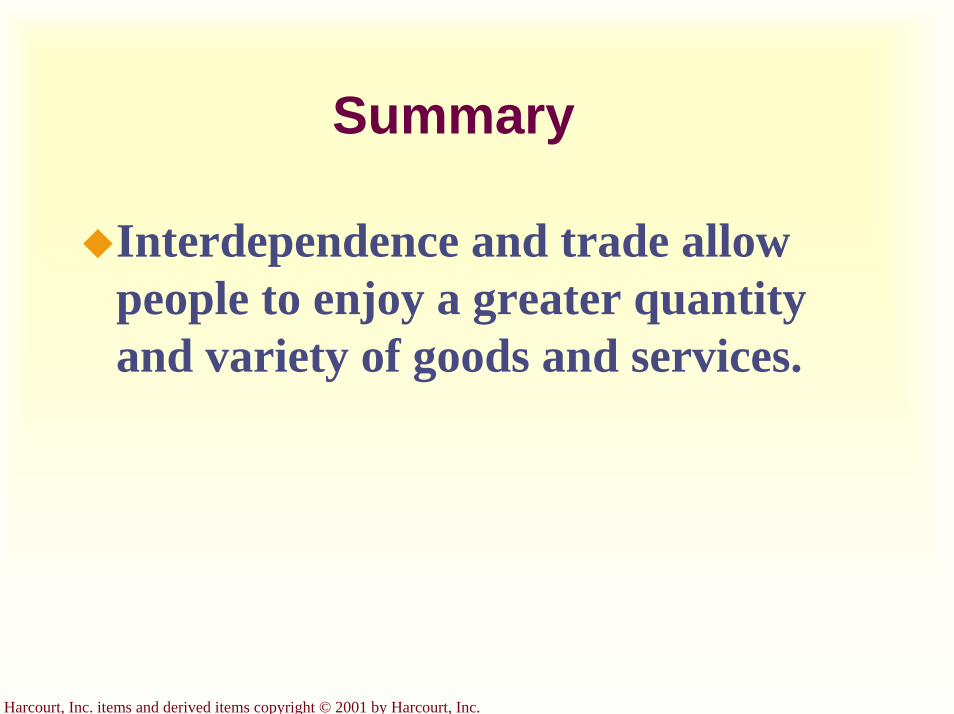
Summary
Interdependence and trade allow people to enjoy a greater quantity and variety of goods and services.
Harcourt, Inc. items and derived items copyright © 2001 by Harcourt, Inc.
Summary
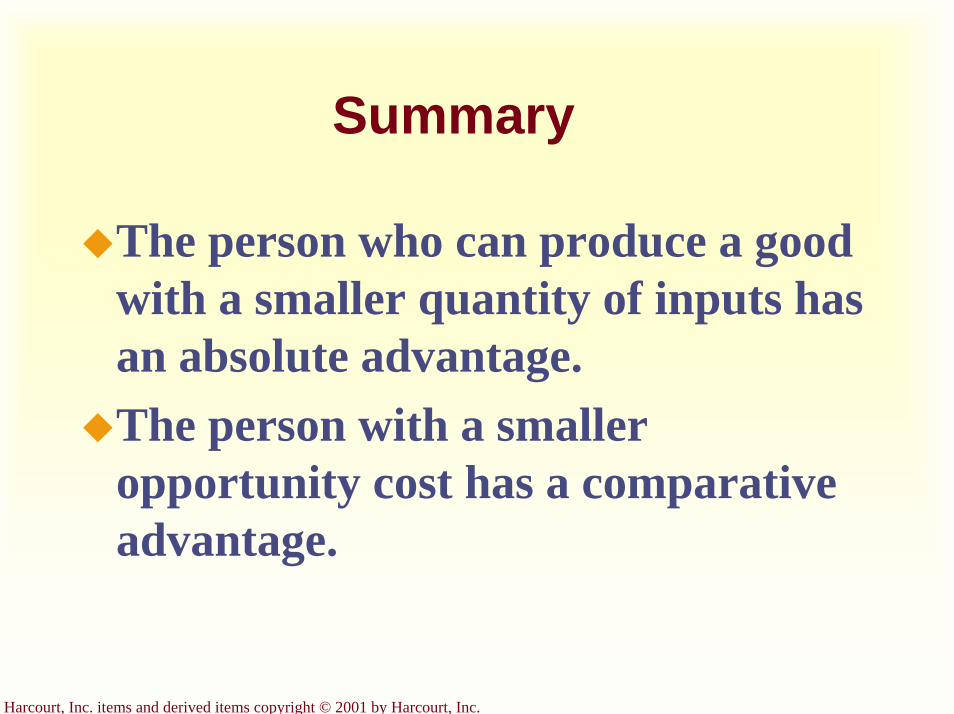
The person who can produce a good with a smaller quantity of inputs has an absolute advantage. The person with a smaller opportunity cost has a comparative advantage.
Harcourt, Inc. items and derived items copyright © 2001 by Harcourt, Inc.
Summary
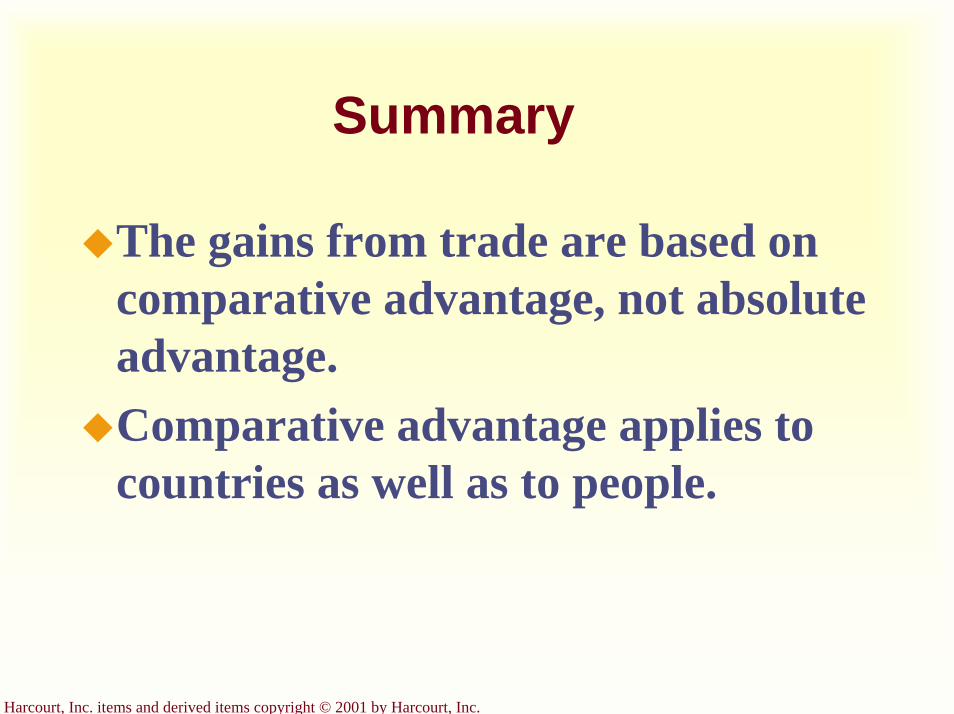
The gains from trade are based on comparative advantage, not absolute advantage. Comparative advantage applies to countries as well as to people.

Harcourt, Inc. items and derived items copyright © 2001 by Harcourt, Inc.
Graphical Review

Harcourt, Inc. items and derived items copyright © 2001 by Harcourt, Inc.
Production Possibilities Frontiers
Potatoes (pounds)
Meat (pounds)
4
2
1
2
(a) The Farmer’s ProductionPossibilities Frontier
0
A
Harcourt, Inc. items and derived items copyright © 2001 by Harcourt, Inc.
Production Possibilities Frontiers
Potatoes (pounds)
Meat (pounds)
5
40
20
2.5
(b) The Rancher’s ProductionPossibilities Frontier
0
B
Harcourt, Inc. items and derived items copyright © 2001 by Harcourt, Inc.
Trade Expands the Set of Consumption Possibilities
Potatoes (pounds)
Meat (pounds)
42
2
1
(a) How Trade Increases the Farmer’s Consumption
0
A
3
3
A*
Farmer’s consumption without trade
Farmer’s consumption with trade
Harcourt, Inc. items and derived items copyright © 2001 by Harcourt, Inc.
Trade Expands the Set of Consumption Possibilities
Potatoes (pounds)
Meat (pounds)
52.5
40
20
(b) How Trade Increases The Rancher’s Consumption
0
B
21
3
B*
Rancher’s consumption without trade
Rancher’s consumption with trade
The Market Forces of Supply and Demand
Chapter 4
Copyright © 2001 by Harcourt, Inc.
All rights reserved. Requests for permission to make copies of any part of thework should be mailed to:
Permissions Department, Harcourt College Publishers,6277 Sea Harbor Drive, Orlando, Florida 32887-6777.
Harcourt, Inc. items and derived items copyright © 2001 by Harcourt, Inc.
The Market Forces of Supply and Demand
Supply and demand are the two words that economists use most often.Supply and demand are the forces that make market economies work.Modern microeconomics is about supply, demand, and market equilibrium.

Harcourt, Inc. items and derived items copyright © 2001 by Harcourt, Inc.
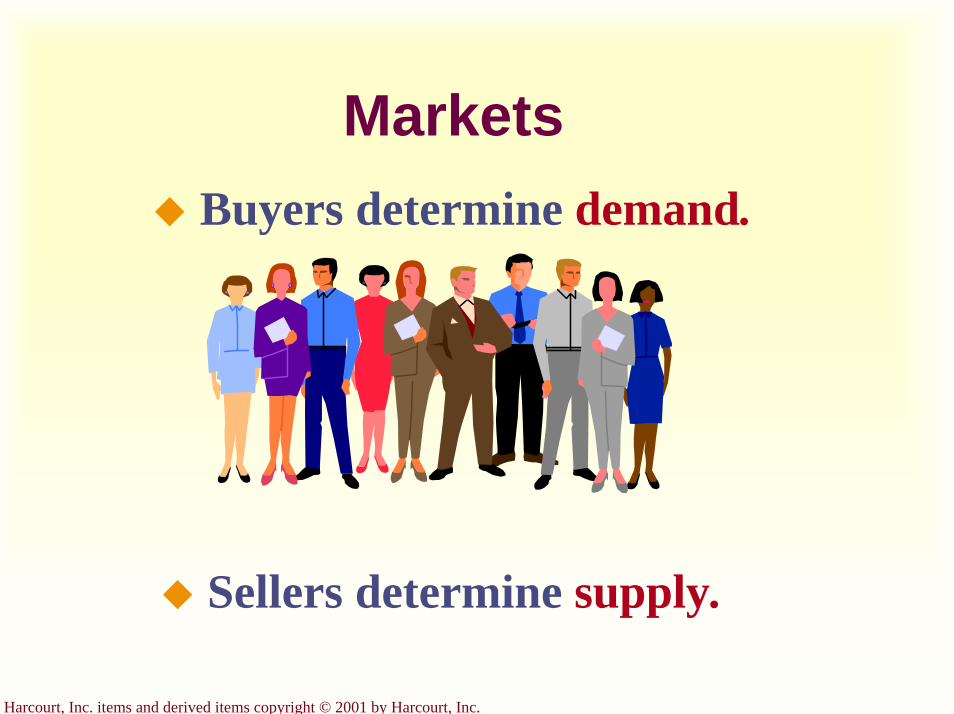
Markets
A market is a group of buyers and sellers of a particular good or service. The terms supply and demand refer to the behavior of people . . . as they interact with one another in markets.
Harcourt, Inc. items and derived items copyright © 2001 by Harcourt, Inc.
Markets Buyers determine demand.
Sellers determine supply.
Harcourt, Inc. items and derived items copyright © 2001 by Harcourt, Inc.
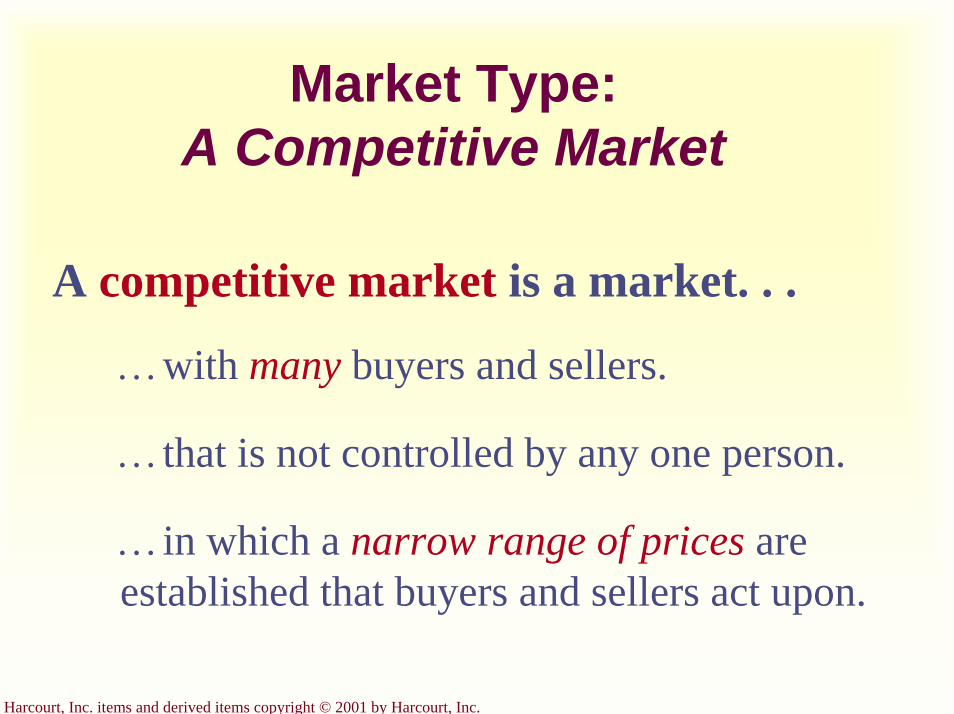
Market Type: A Competitive Market
A competitive market is a market. . .
…with many buyers and sellers.
…that is not controlled by any one person.
…in which a narrow range of prices are established that buyers and sellers act upon.
Harcourt, Inc. items and derived items copyright © 2001 by Harcourt, Inc.
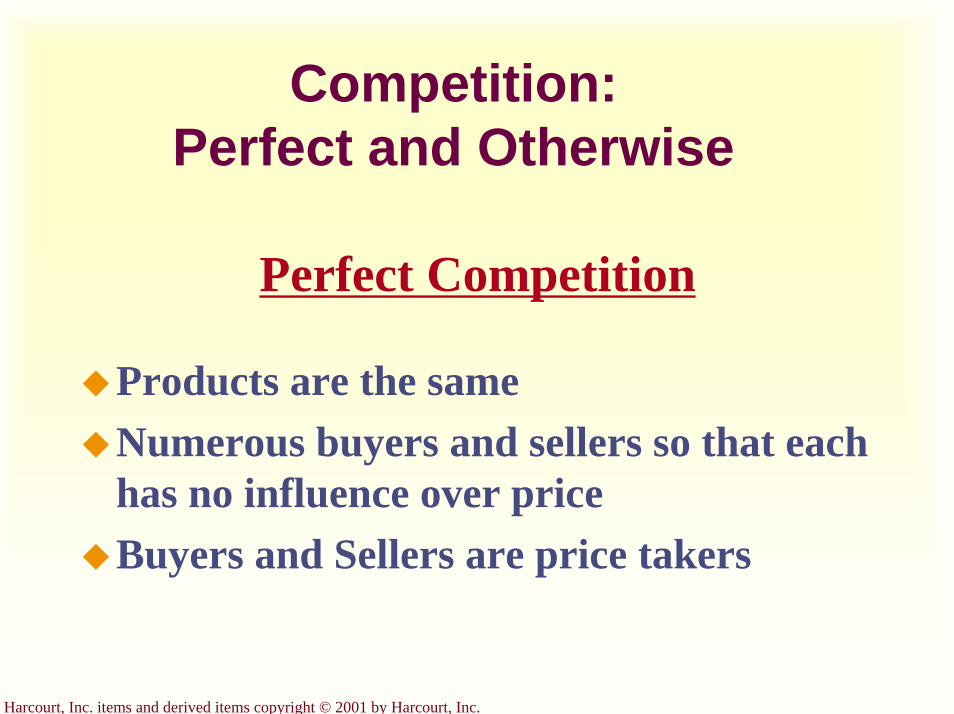
Competition: Perfect and Otherwise
Perfect Competition
Products are the sameNumerous buyers and sellers so that each has no influence over priceBuyers and Sellers are price takers
Harcourt, Inc. items and derived items copyright © 2001 by Harcourt, Inc.
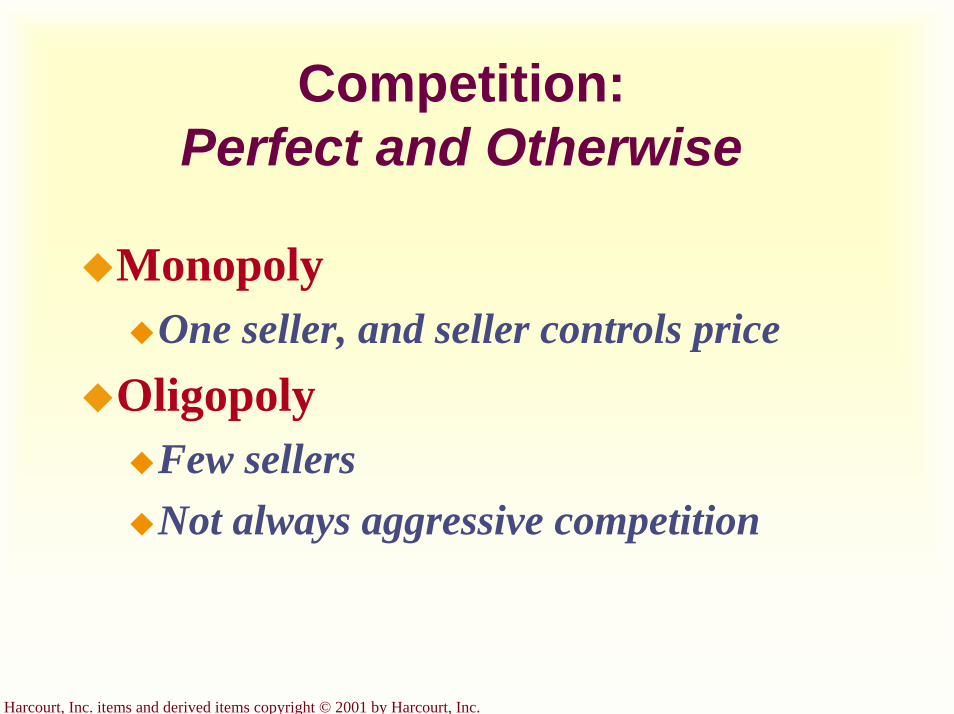
Competition: Perfect and Otherwise
MonopolyOne seller, and seller controls price
OligopolyFew sellersNot always aggressive competition
Harcourt, Inc. items and derived items copyright © 2001 by Harcourt, Inc.
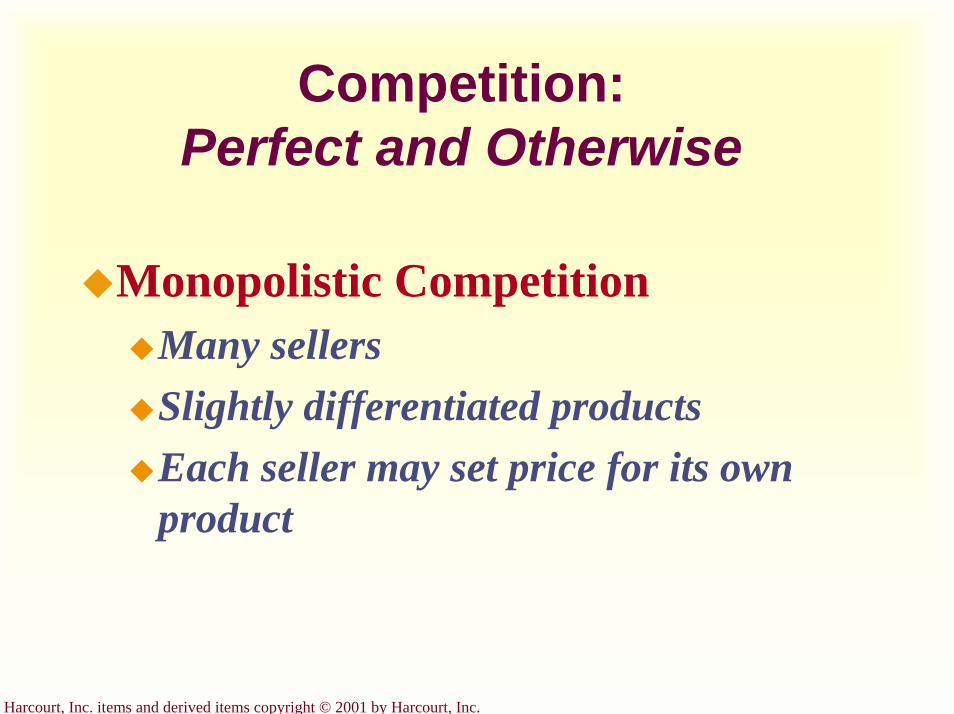
Competition: Perfect and Otherwise
Monopolistic CompetitionMany sellersSlightly differentiated productsEach seller may set price for its own product
Harcourt, Inc. items and derived items copyright © 2001 by Harcourt, Inc.
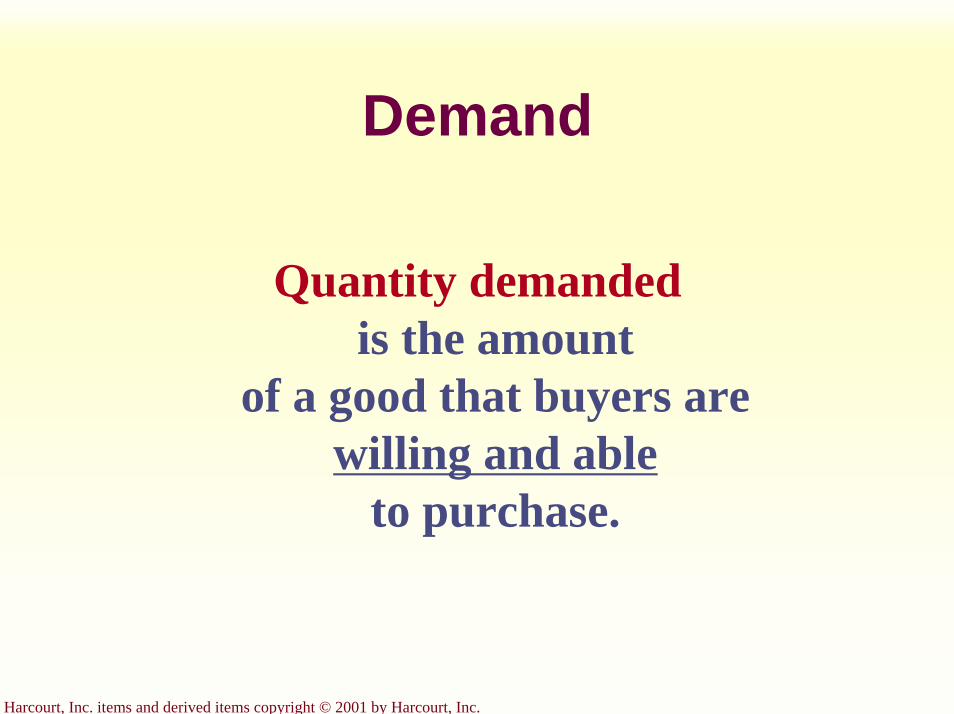
Demand
Quantity demandedis the amount
of a good that buyers are willing and able
to purchase.
Harcourt, Inc. items and derived items copyright © 2001 by Harcourt, Inc.
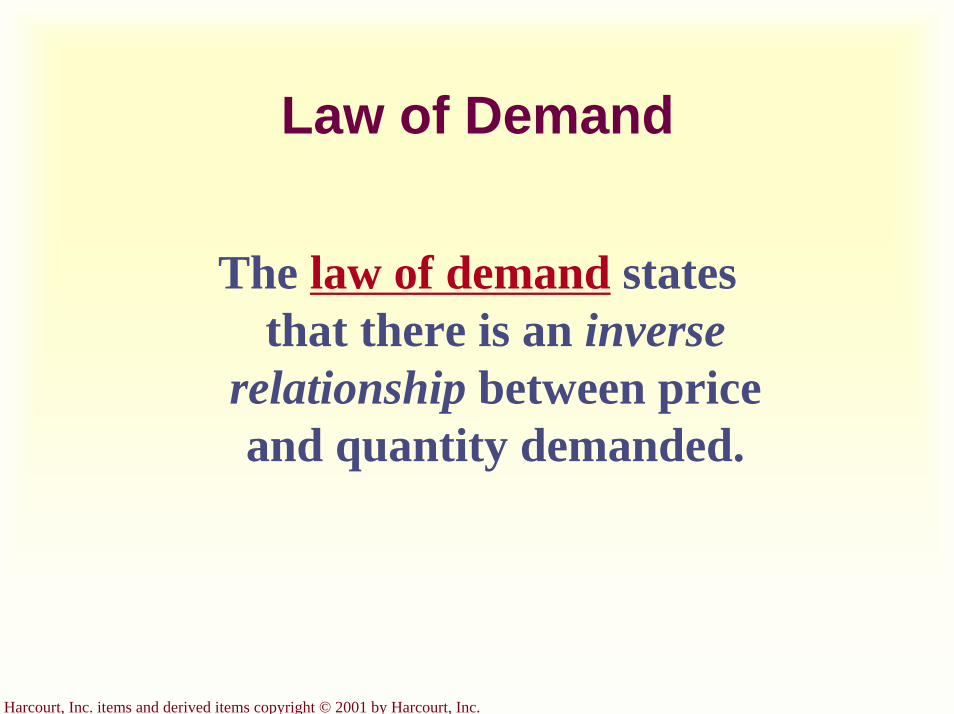
Law of Demand
The law of demand states that there is an inverse
relationship between price and quantity demanded.
Harcourt, Inc. items and derived items copyright © 2001 by Harcourt, Inc.
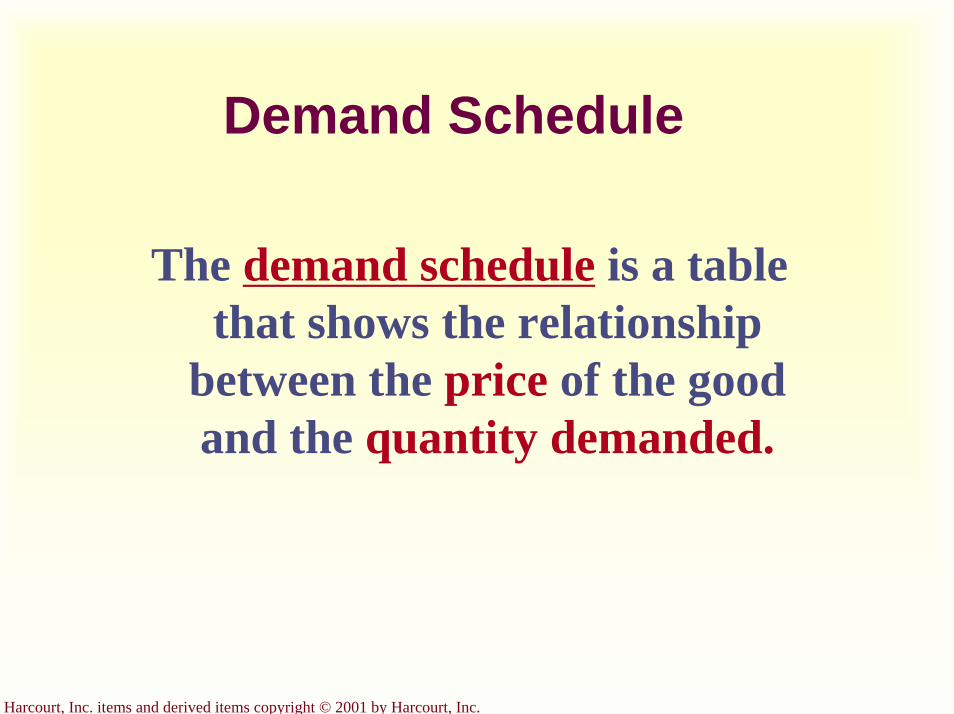
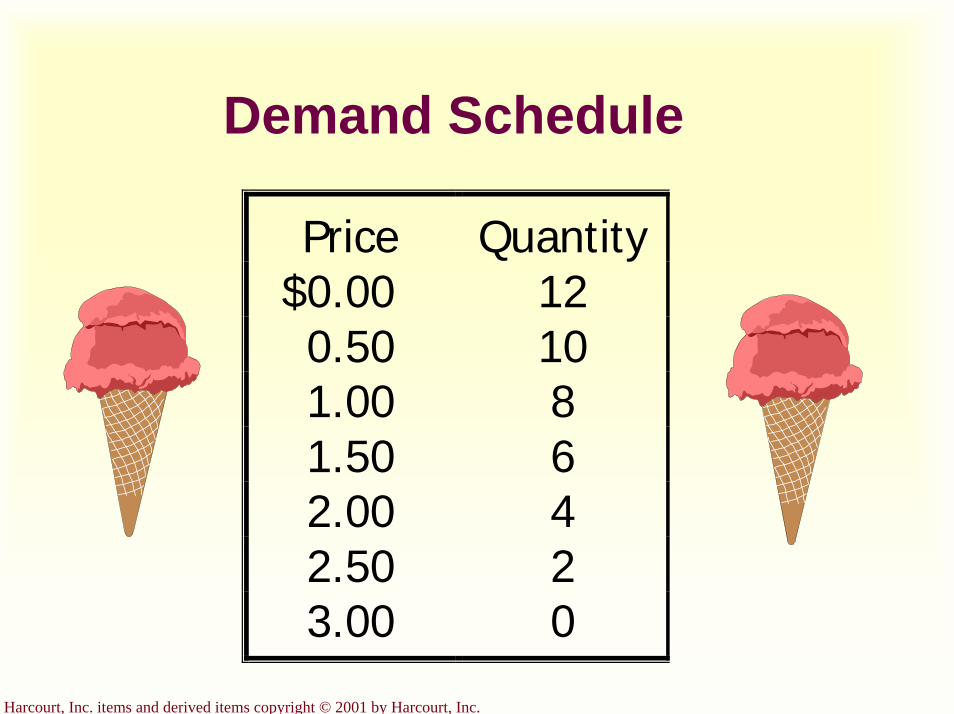
Demand Schedule
The demand schedule is a table that shows the relationship
between the price of the good and the quantity demanded.
Harcourt, Inc. items and derived items copyright © 2001 by Harcourt, Inc.
Demand Schedule
Price Quantity$0.00 120.50 101.00 81.50 62.00 42.50 23.00 0
Harcourt, Inc. items and derived items copyright © 2001 by Harcourt, Inc.
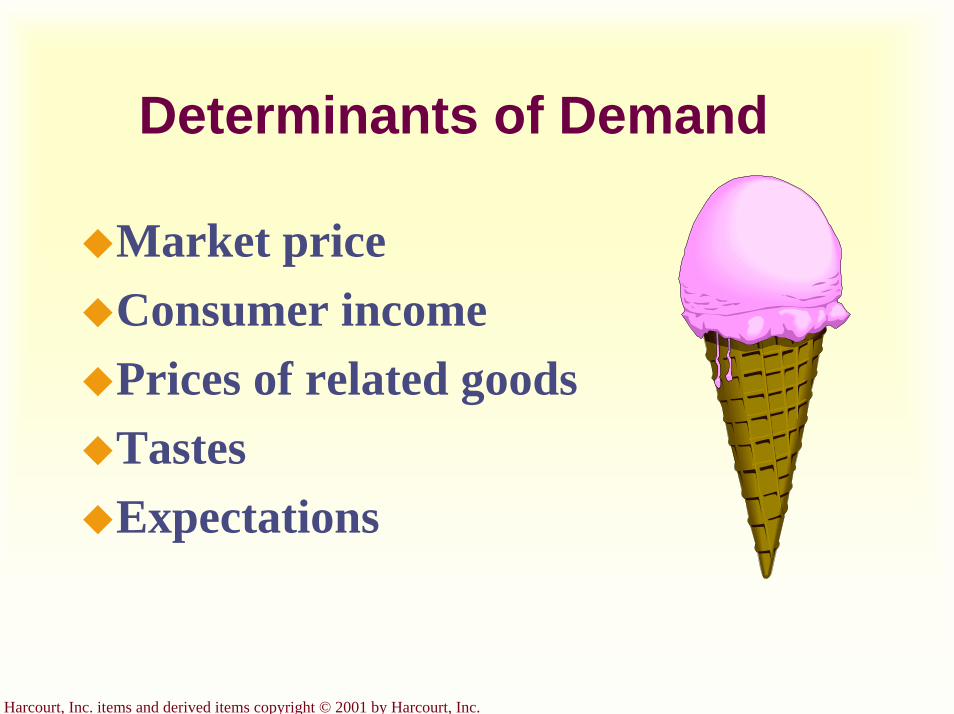
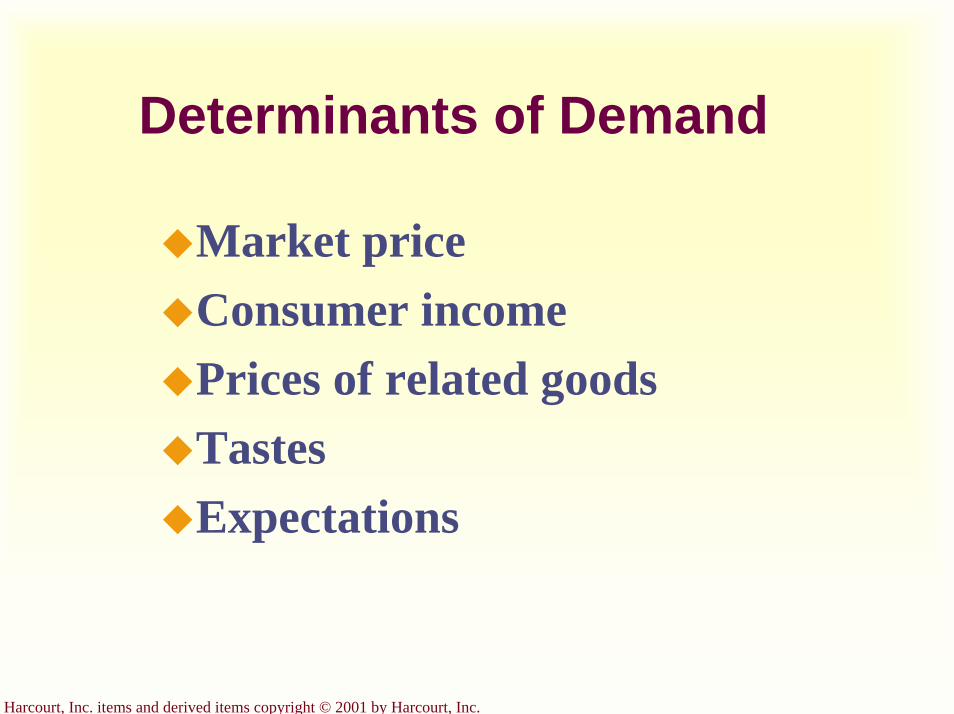
Determinants of Demand
Market priceConsumer incomePrices of related goodsTastesExpectations
Harcourt, Inc. items and derived items copyright © 2001 by Harcourt, Inc.
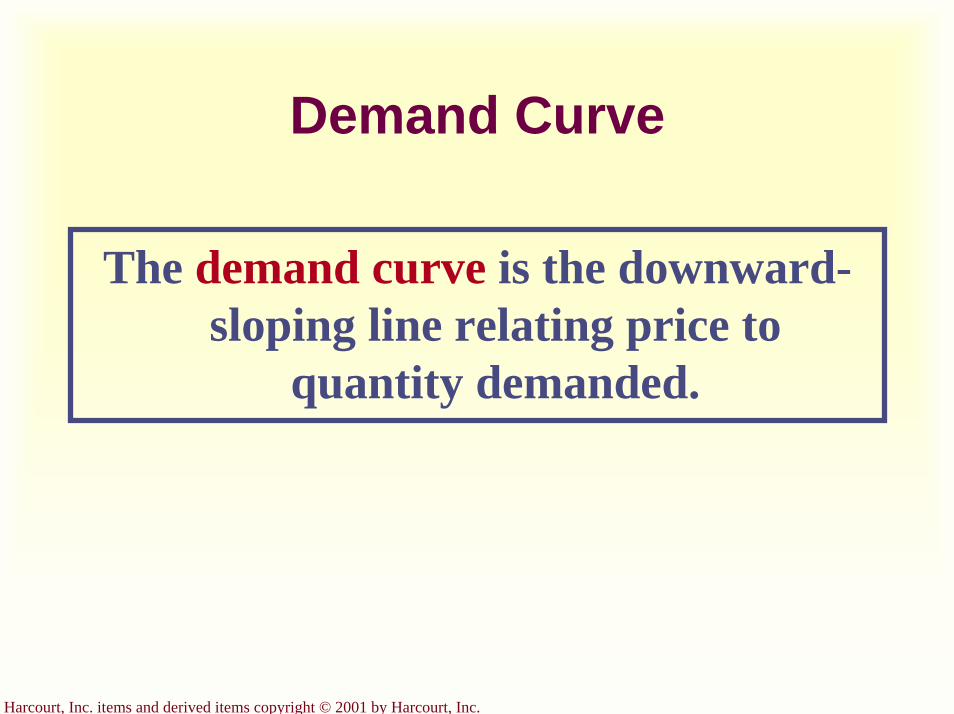
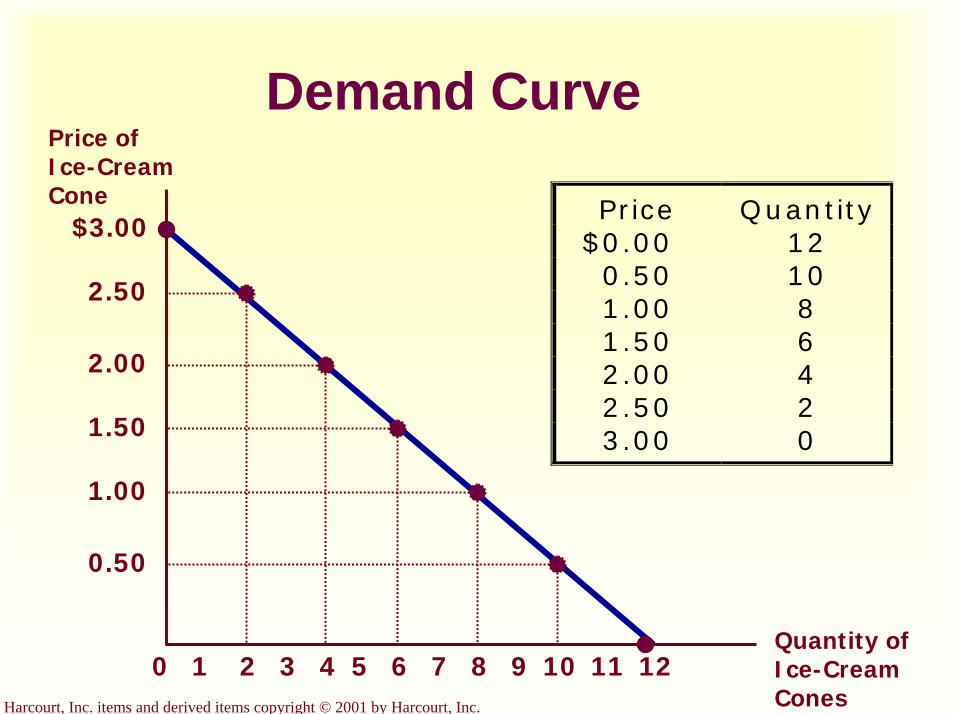
Demand Curve
The demand curve is the downward-sloping line relating price to
quantity demanded.
Harcourt, Inc. items and derived items copyright © 2001 by Harcourt, Inc.
Demand Curve
$3.00
2.50
2.00
1.50
1.00
0.50
21 3 4 5 6 7 8 9 10 1211
Price of Ice-Cream Cone
0
P r ic e Q u a n t ity$ 0 .0 0 1 2
0 .5 0 1 01 .0 0 81 .5 0 62 .0 0 42 .5 0 23 .0 0 0
Quantity of Ice-Cream Cones

Harcourt, Inc. items and derived items copyright © 2001 by Harcourt, Inc.
Ceteris ParibusCeteris paribus is a Latin phrase that
means all variables other than the ones being studied are assumed to be
constant. Literally, ceteris paribusmeans “other things being equal.”
The demand curve slopes downward because, ceteris paribus, lower prices
imply a greater quantity demanded!
Harcourt, Inc. items and derived items copyright © 2001 by Harcourt, Inc.
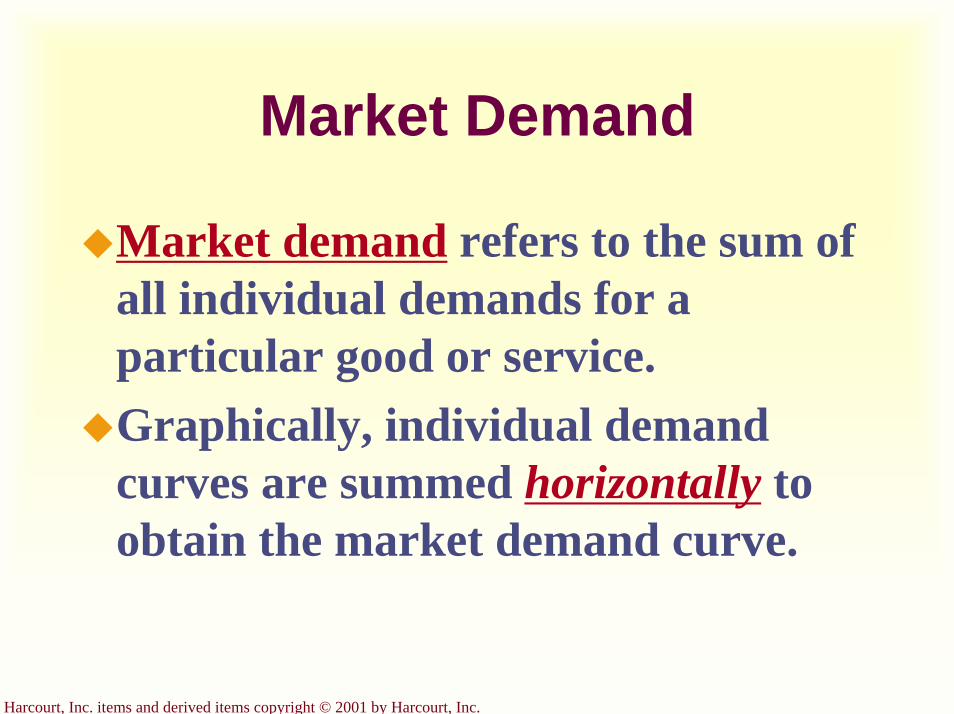
Market Demand
Market demand refers to the sum of all individual demands for a particular good or service.Graphically, individual demand curves are summed horizontally to obtain the market demand curve.
Harcourt, Inc. items and derived items copyright © 2001 by Harcourt, Inc.
Determinants of Demand
Market priceConsumer incomePrices of related goodsTastesExpectations
Harcourt, Inc. items and derived items copyright © 2001 by Harcourt, Inc.
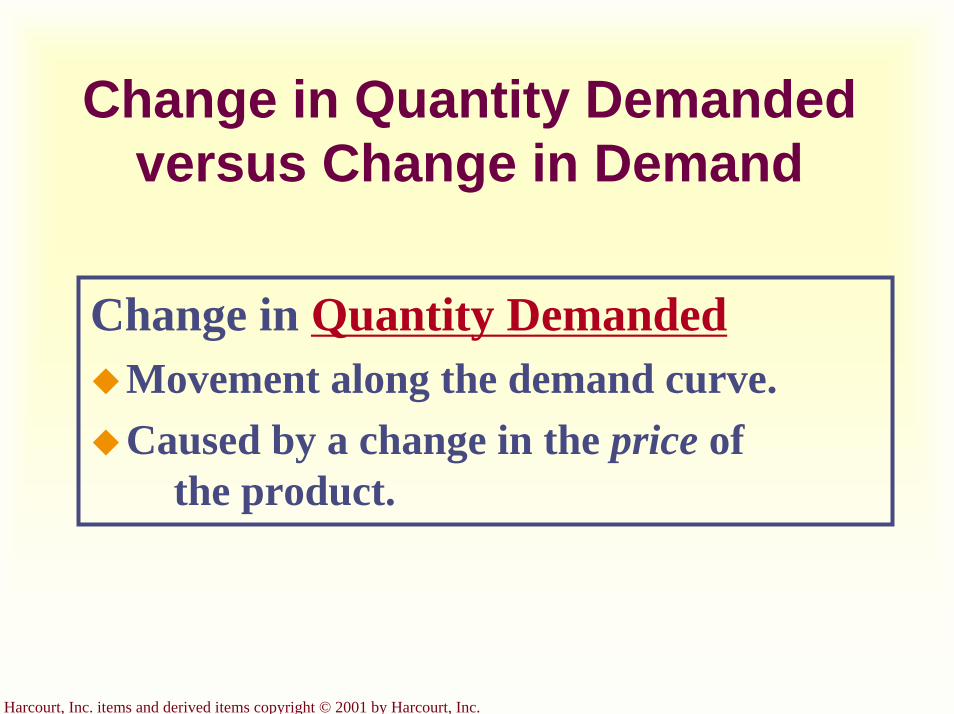
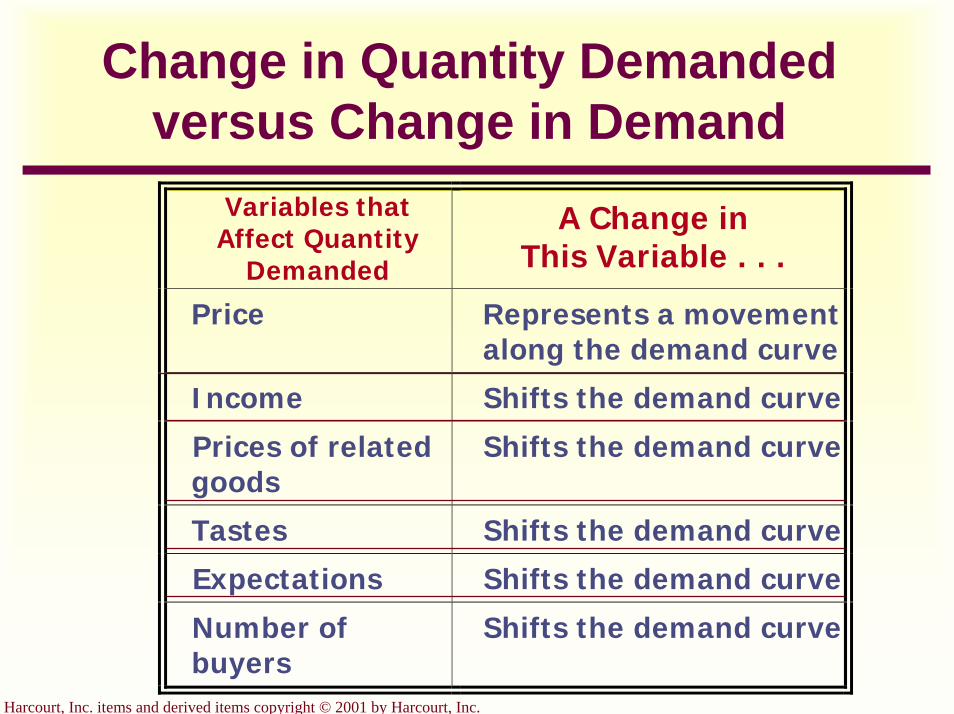
Change in Quantity Demanded versus Change in Demand
Change in Quantity DemandedMovement along the demand curve.Caused by a change in the price of
the product.
Harcourt, Inc. items and derived items copyright © 2001 by Harcourt, Inc.
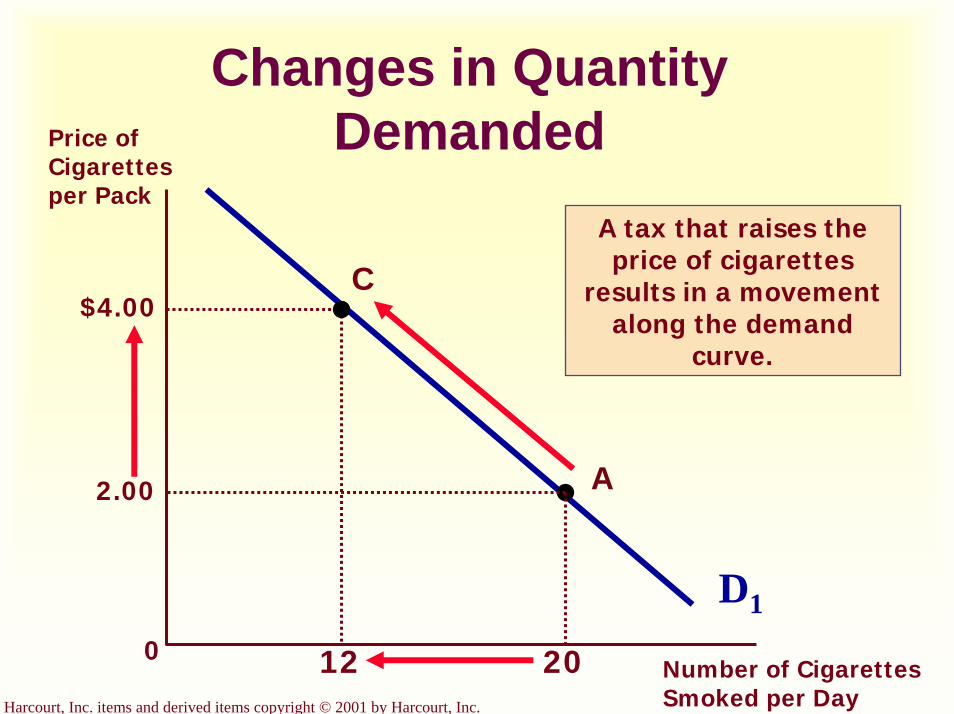
Changes in Quantity DemandedPrice of
Cigarettes per Pack
D1
0Number of Cigarettes Smoked per Day
A tax that raises the price of cigarettes
results in a movement along the demand
curve.
A
C
20
2.00
$4.00
12
Harcourt, Inc. items and derived items copyright © 2001 by Harcourt, Inc.
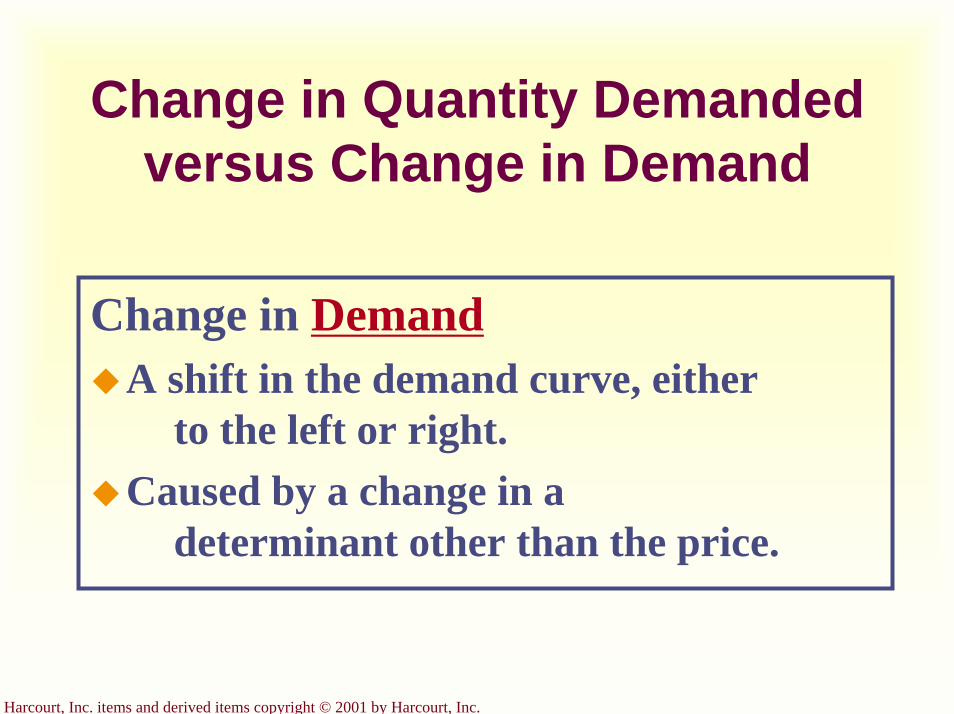
Change in Quantity Demanded versus Change in Demand
Change in DemandA shift in the demand curve, either
to the left or right.Caused by a change in a
determinant other than the price.
Harcourt, Inc. items and derived items copyright © 2001 by Harcourt, Inc.
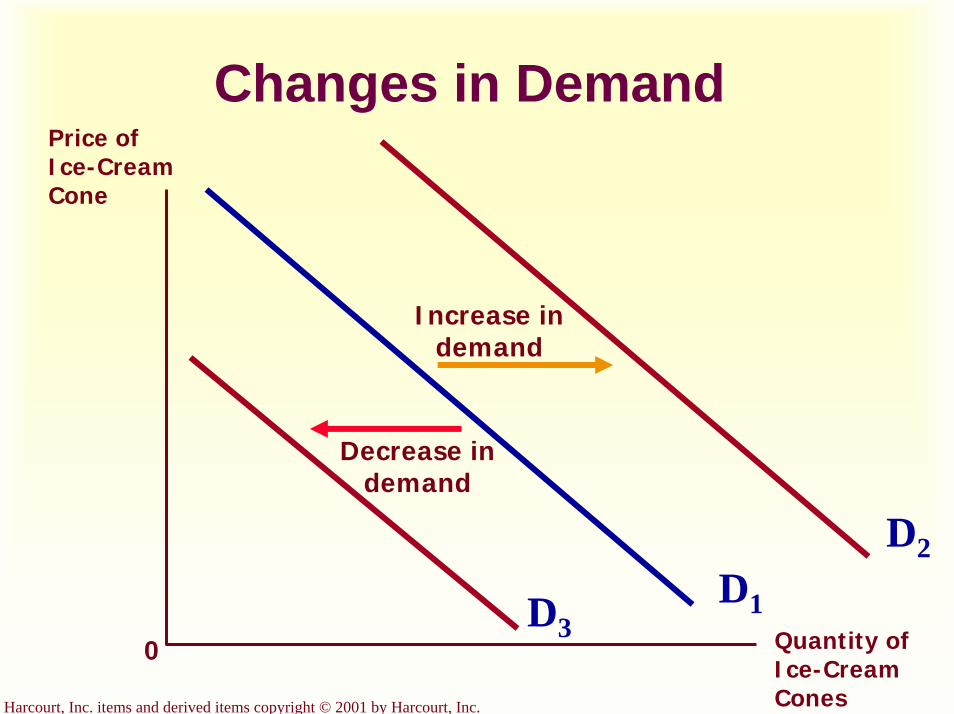
Changes in DemandPrice of Ice-Cream Cone
0
D1Quantity of Ice-Cream Cones
D3
Increase in demand
Decrease in demand
D2
Harcourt, Inc. items and derived items copyright © 2001 by Harcourt, Inc.
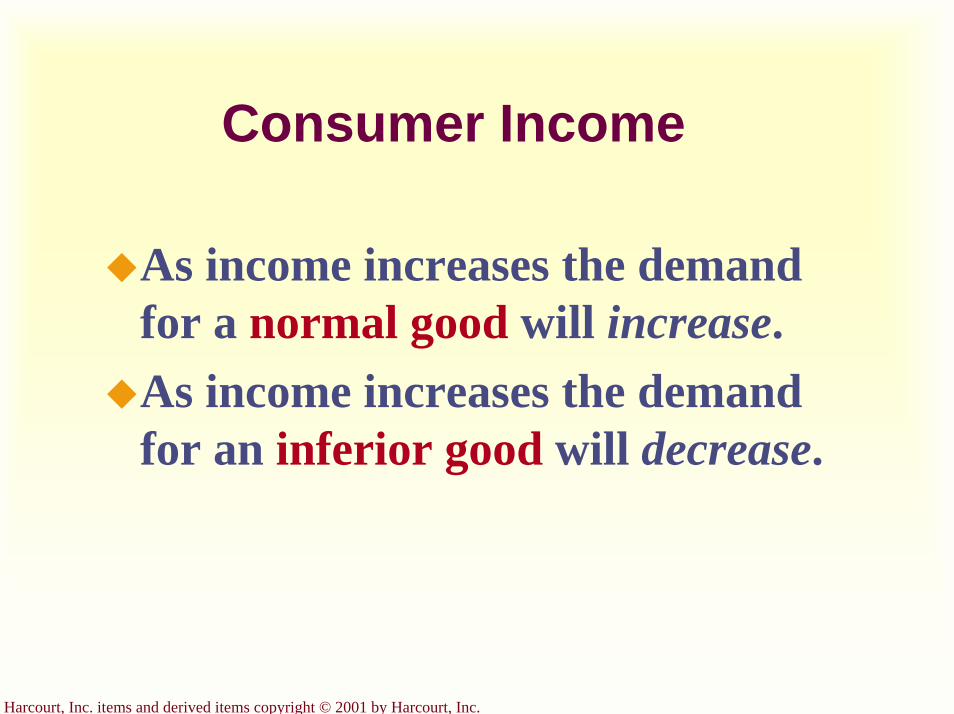
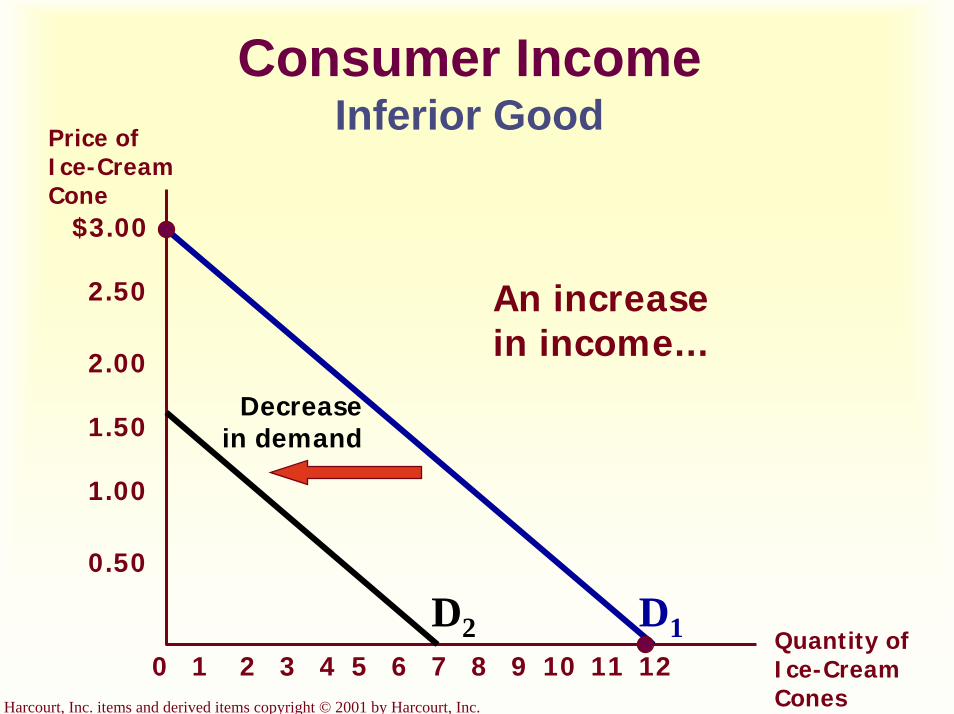
Consumer Income
As income increases the demand for a normal good will increase.As income increases the demand for an inferior good will decrease.
Harcourt, Inc. items and derived items copyright © 2001 by Harcourt, Inc.
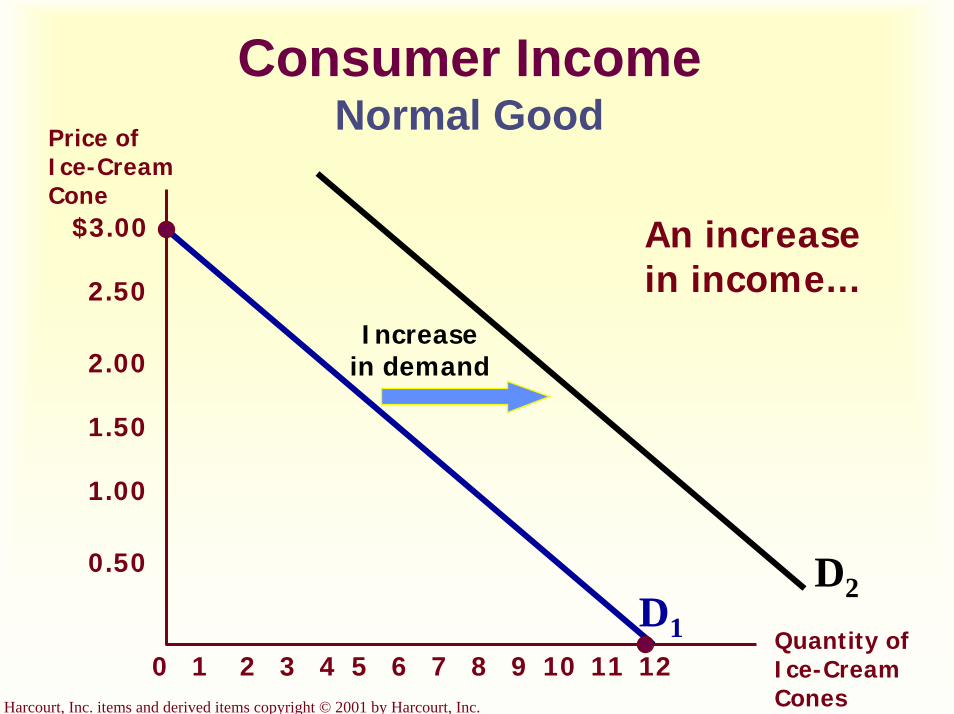
Consumer IncomeNormal Good
$3.00
2.50
2.00
1.50
1.00
0.50
21 3 4 5 6 7 8 9 10 1211
Price of Ice-Cream Cone
Quantity of Ice-Cream Cones
Increasein demand
An increase in income...
D1
D2
0
Harcourt, Inc. items and derived items copyright © 2001 by Harcourt, Inc.
Consumer IncomeInferior Good
$3.00
2.50
2.00
1.50
1.00
0.50
21 3 4 5 6 7 8 9 10 1211
Price of Ice-Cream Cone
Quantity of Ice-Cream Cones
0
Decreasein demand
An increase in income...
D1D2
Harcourt, Inc. items and derived items copyright © 2001 by Harcourt, Inc.
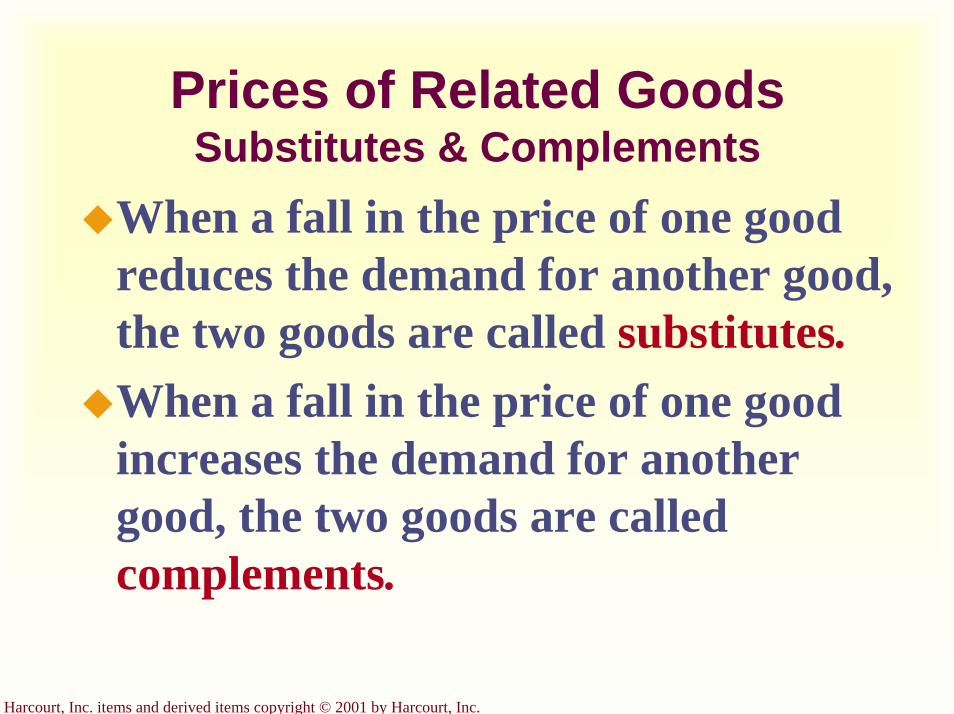
Prices of Related GoodsSubstitutes & Complements
When a fall in the price of one good reduces the demand for another good, the two goods are called substitutes.When a fall in the price of one good increases the demand for another good, the two goods are called complements.
Harcourt, Inc. items and derived items copyright © 2001 by Harcourt, Inc.
Change in Quantity Demanded versus Change in Demand
Variables that Affect Quantity
Demanded
A Change in This Variable . . .
Price Represents a movementalong the demand curve
Income Shifts the demand curve
Prices of relatedgoods
Shifts the demand curve
Tastes Shifts the demand curve
Expectations Shifts the demand curve
Number ofbuyers
Shifts the demand curve
Harcourt, Inc. items and derived items copyright © 2001 by Harcourt, Inc.
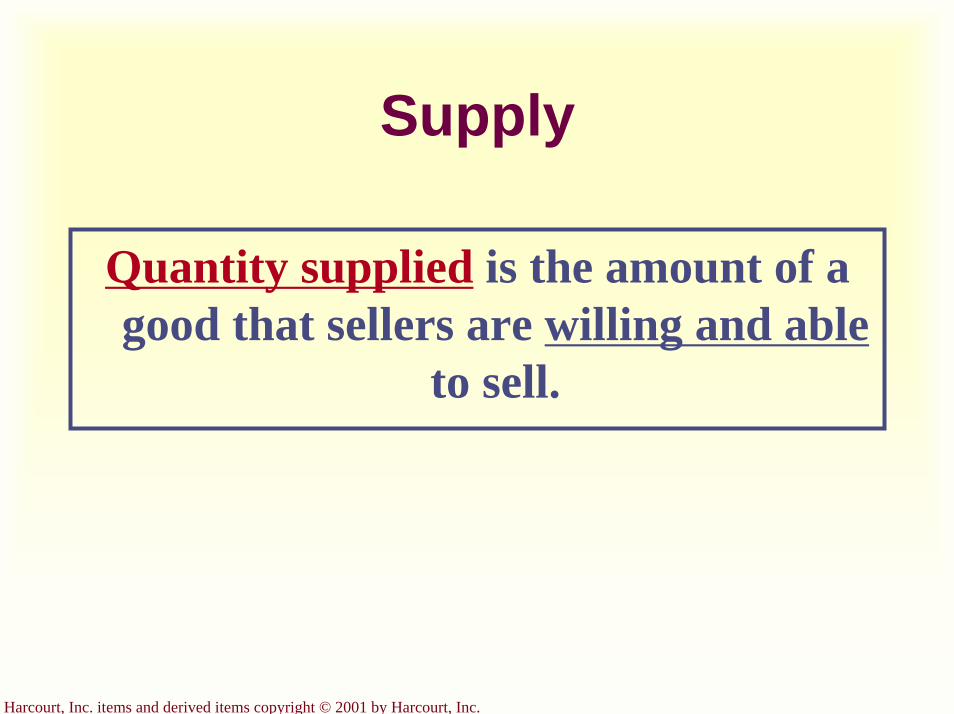
Supply
Quantity supplied is the amount of a good that sellers are willing and able
to sell.
Harcourt, Inc. items and derived items copyright © 2001 by Harcourt, Inc.
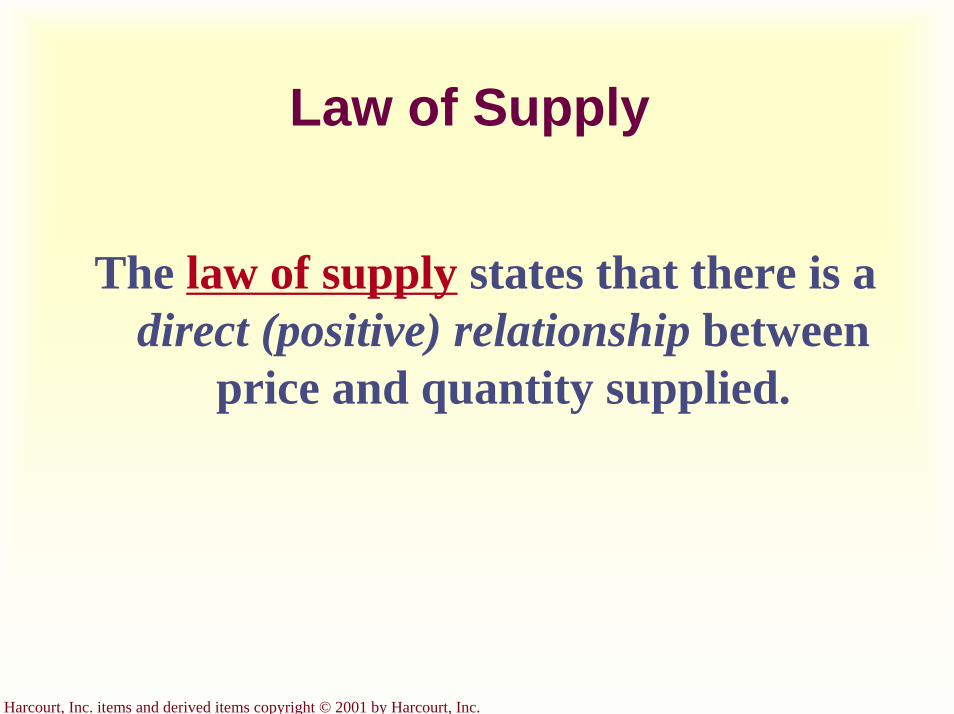
Law of Supply
The law of supply states that there is a direct (positive) relationship between
price and quantity supplied.
Harcourt, Inc. items and derived items copyright © 2001 by Harcourt, Inc.
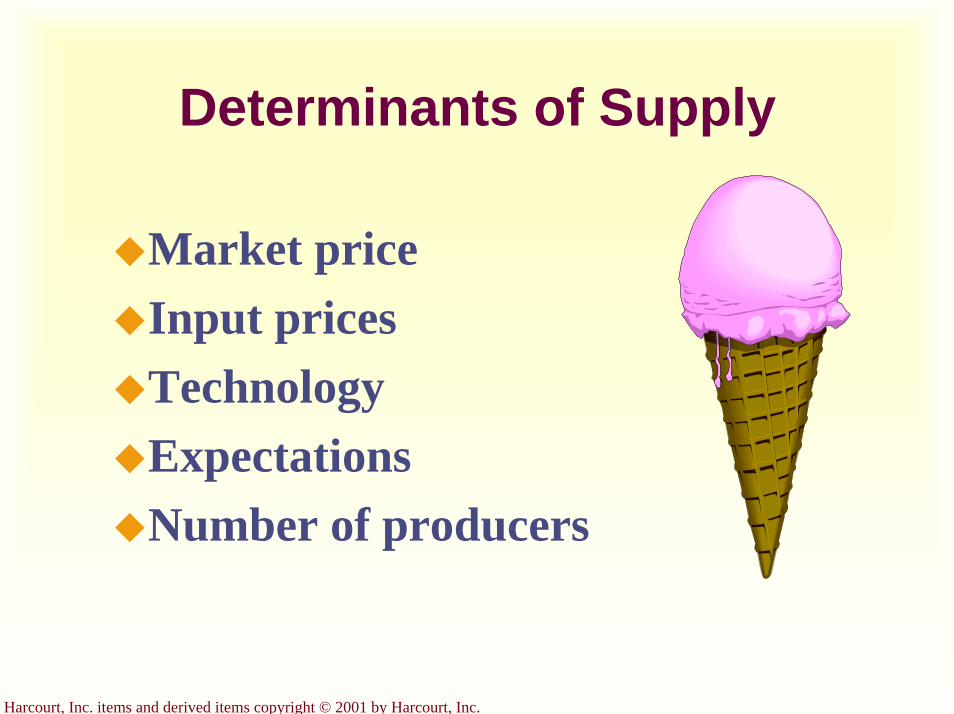
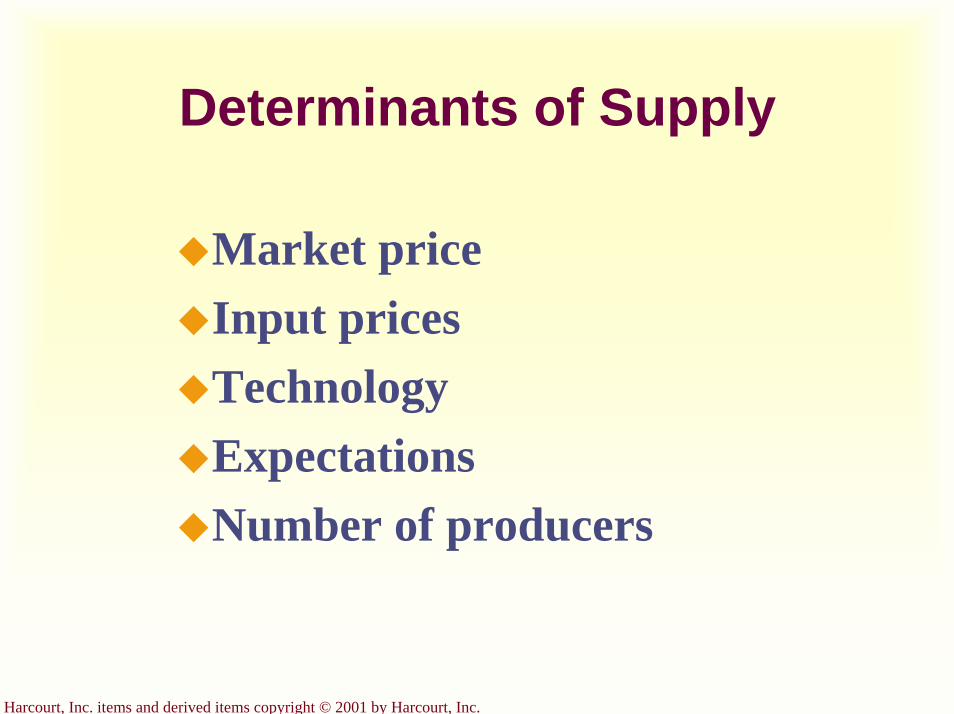
Determinants of Supply
Market priceInput pricesTechnologyExpectations Number of producers
Harcourt, Inc. items and derived items copyright © 2001 by Harcourt, Inc.
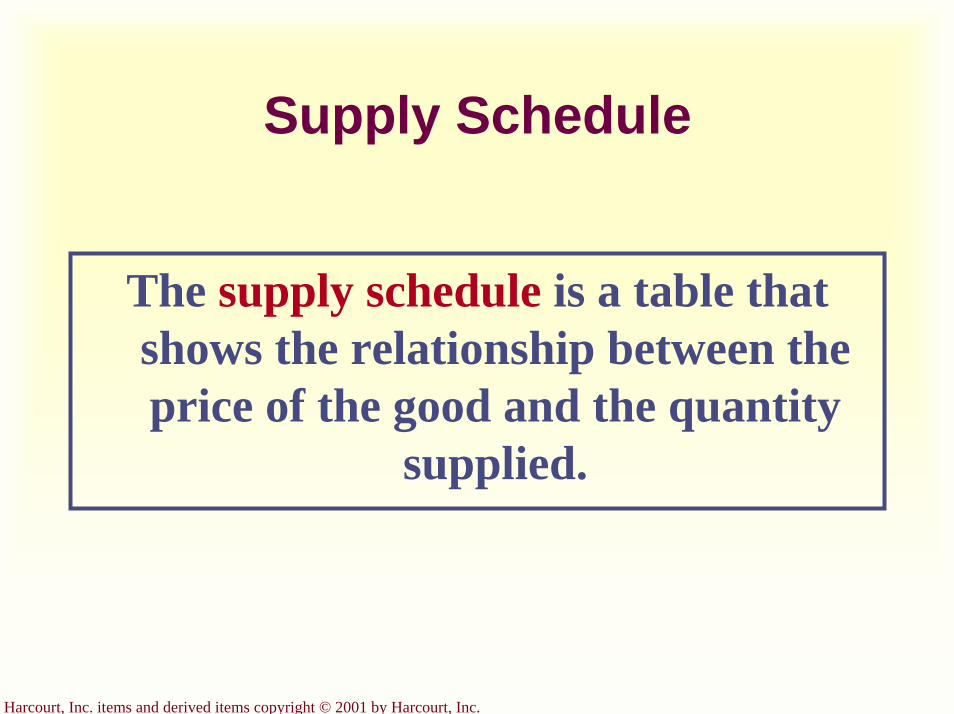
Supply Schedule
The supply schedule is a table that shows the relationship between the price of the good and the quantity
supplied.
Harcourt, Inc. items and derived items copyright © 2001 by Harcourt, Inc.
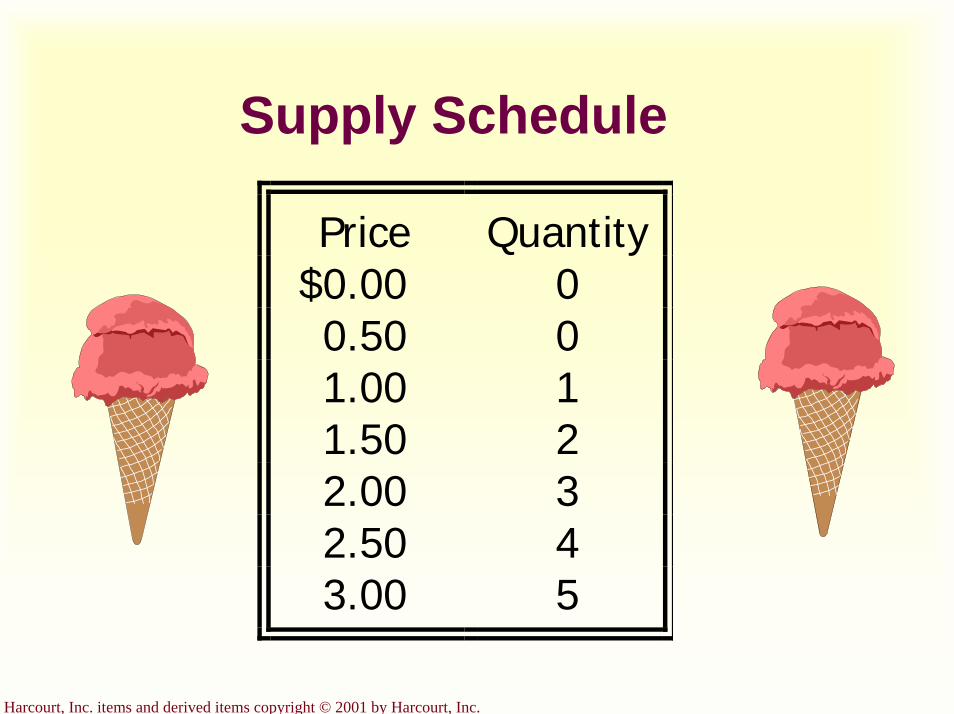
Supply Schedule
Price Quantity$0.00 00.50 01.00 11.50 22.00 32.50 43.00 5
Harcourt, Inc. items and derived items copyright © 2001 by Harcourt, Inc.
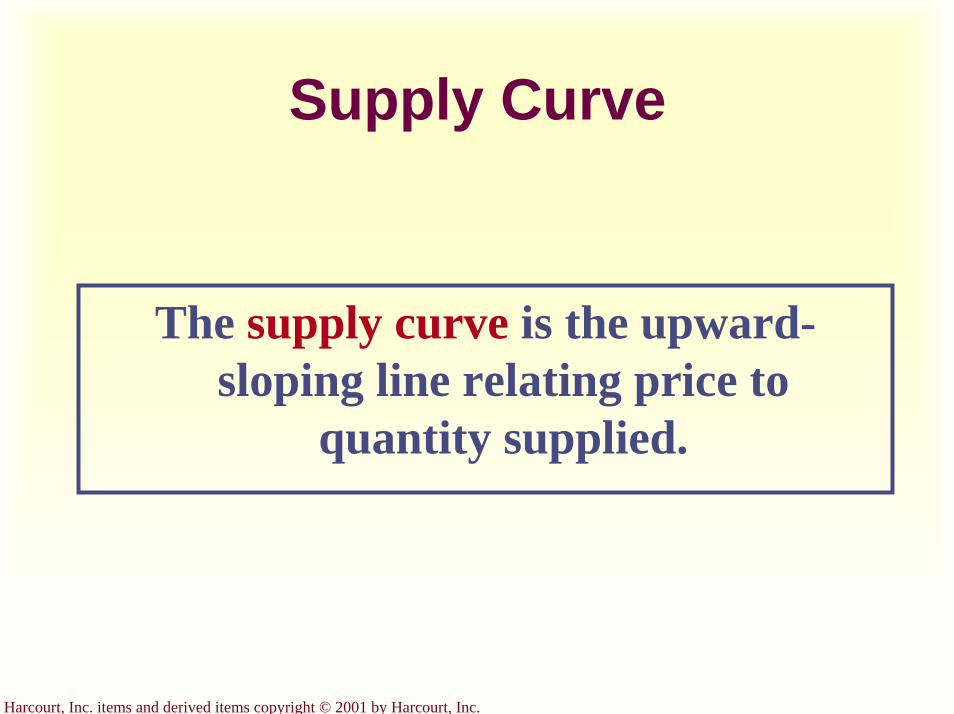
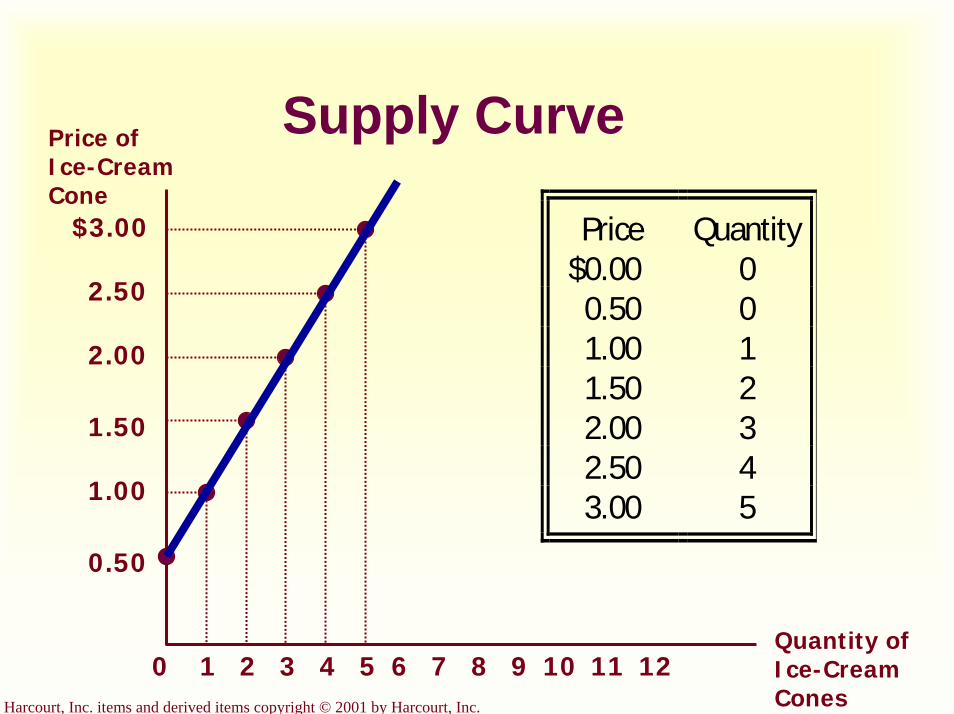
Supply Curve
The supply curve is the upward-sloping line relating price to
quantity supplied.
Harcourt, Inc. items and derived items copyright © 2001 by Harcourt, Inc.
Supply Curve
$3.00
2.50
2.00
1.50
1.00
0.50
21 3 4 5 6 7 8 9 10 11
Price of Ice-Cream Cone
0Quantity of Ice-Cream Cones
Price Quantity$0.00 00.50 01.00 11.50 22.00 32.50 43.00 5
12
Harcourt, Inc. items and derived items copyright © 2001 by Harcourt, Inc.
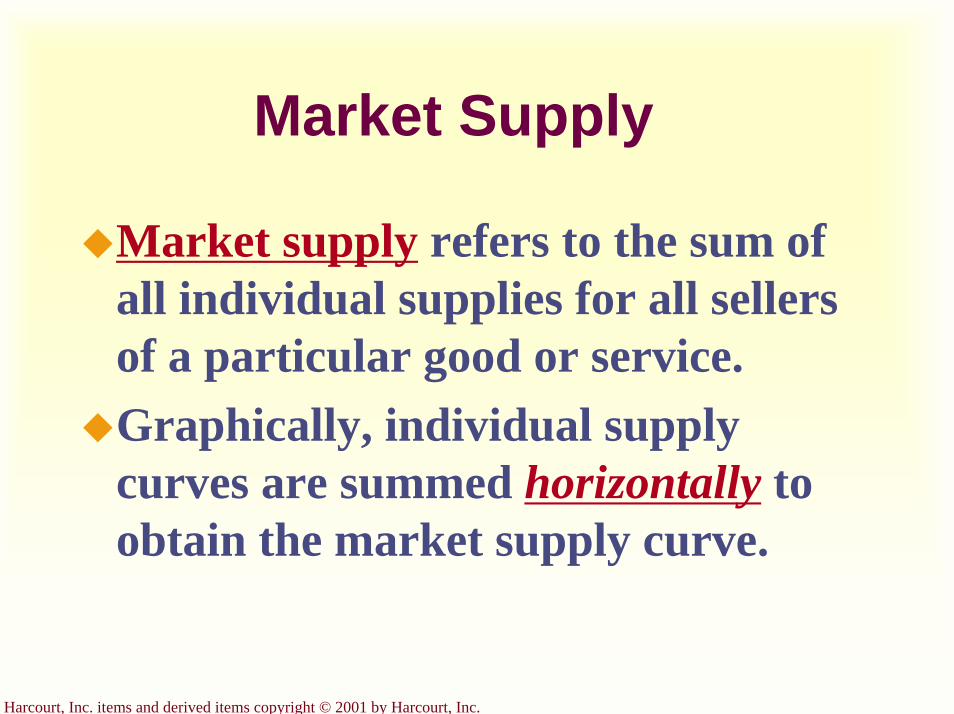
Market Supply
Market supply refers to the sum of all individual supplies for all sellers of a particular good or service.Graphically, individual supply curves are summed horizontally to obtain the market supply curve.
Harcourt, Inc. items and derived items copyright © 2001 by Harcourt, Inc.
Determinants of Supply
Market priceInput pricesTechnologyExpectations Number of producers
Harcourt, Inc. items and derived items copyright © 2001 by Harcourt, Inc.
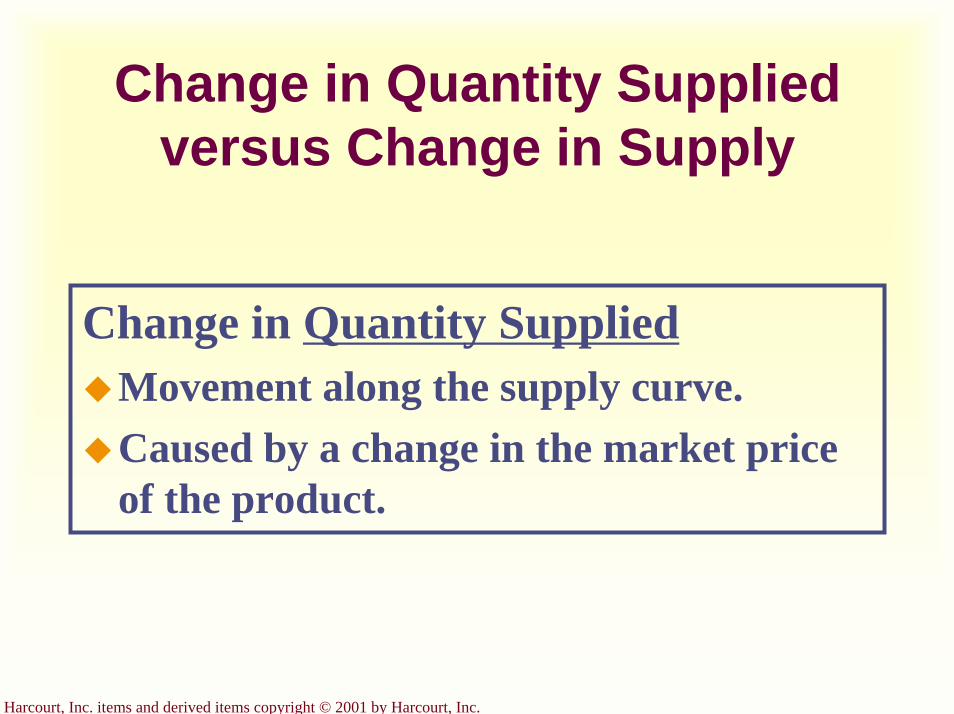
Change in Quantity Supplied versus Change in Supply
Change in Quantity SuppliedMovement along the supply curve.Caused by a change in the market price of the product.
Harcourt, Inc. items and derived items copyright © 2001 by Harcourt, Inc.
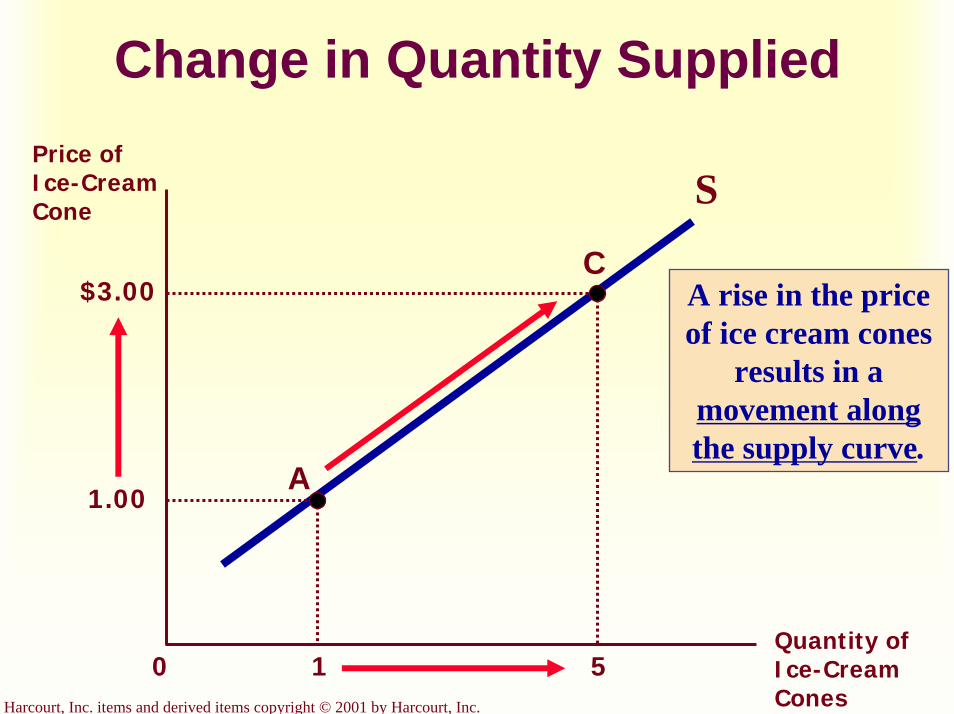
Change in Quantity Supplied
1 50
Price of Ice-Cream Cone
S
1.00
Quantity of Ice-Cream Cones
A
C$3.00 A rise in the price
of ice cream cones results in a
movement along the supply curve.
Harcourt, Inc. items and derived items copyright © 2001 by Harcourt, Inc.
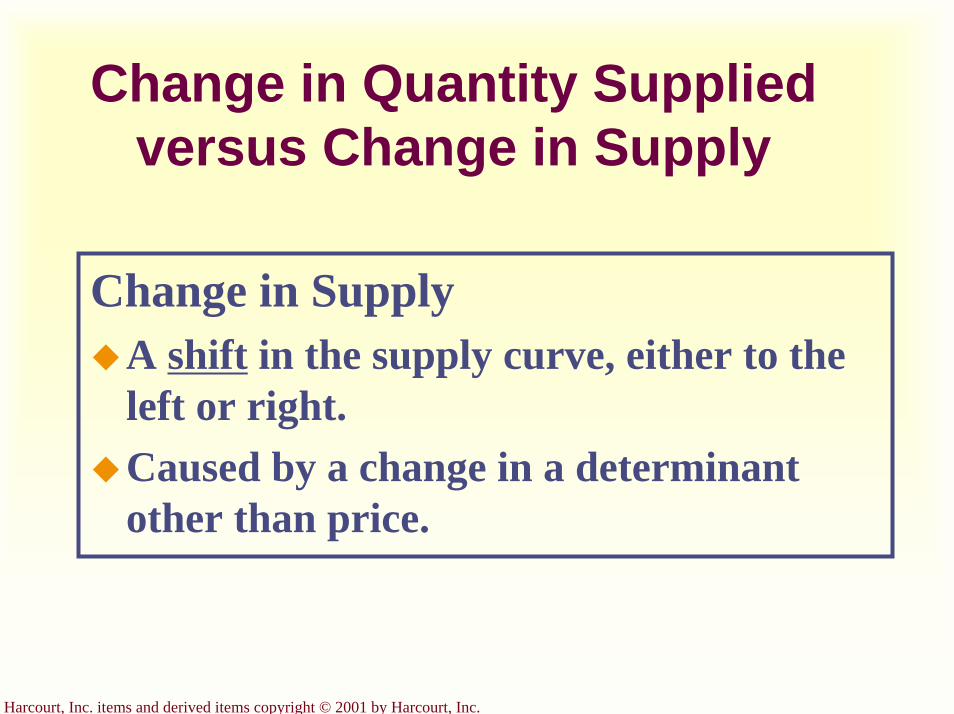
Change in Quantity Supplied versus Change in Supply
Change in SupplyA shift in the supply curve, either to the left or right.Caused by a change in a determinant other than price.
Harcourt, Inc. items and derived items copyright © 2001 by Harcourt, Inc.
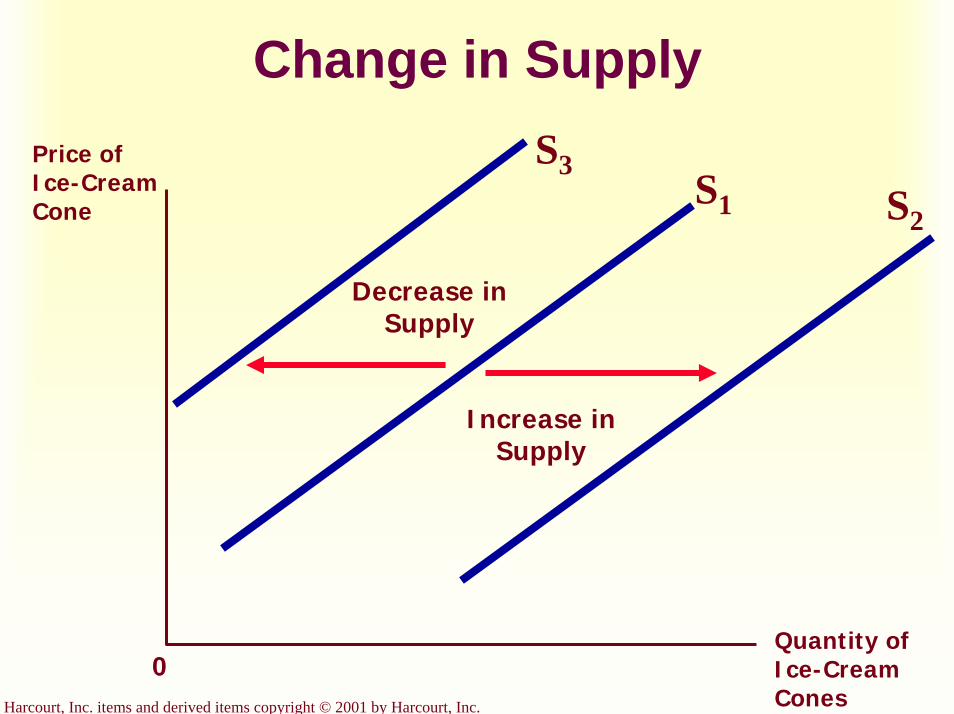
Change in SupplyPrice of Ice-Cream Cone
Quantity of Ice-Cream Cones
0
S1 S2
S3
Increase in Supply
Decrease in Supply
Harcourt, Inc. items and derived items copyright © 2001 by Harcourt, Inc.
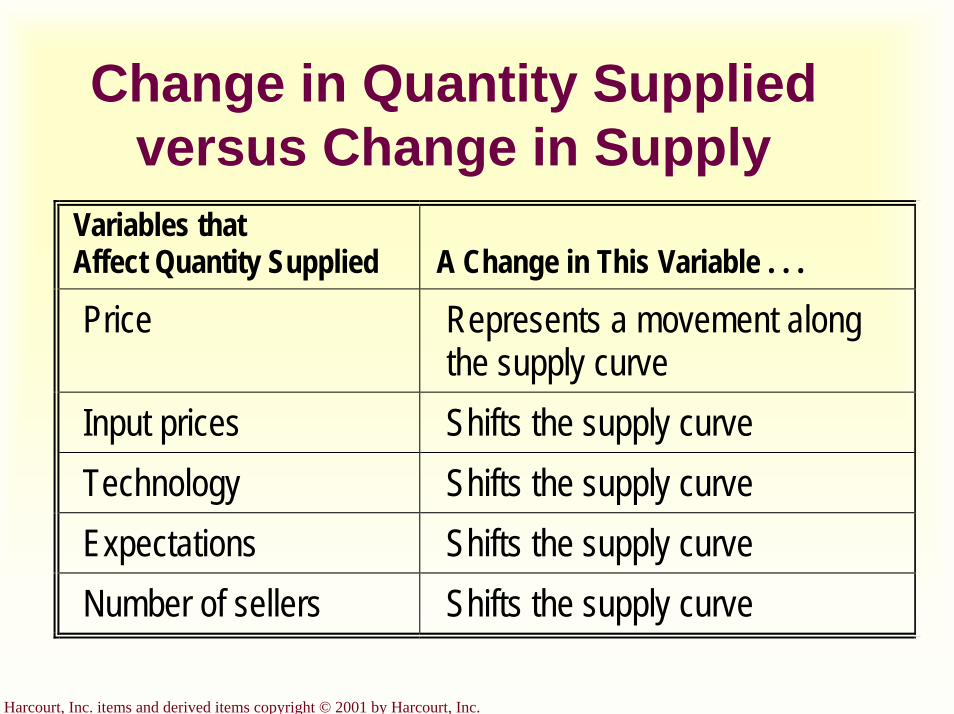
Change in Quantity Supplied versus Change in Supply
Variables that Affect Quantity Supplied
A Change in This Variable . . .
Price Represents a movement along the supply curve
Input prices Shifts the supply curve Technology Shifts the supply curve Expectations Shifts the supply curve Number of sellers Shifts the supply curve
Harcourt, Inc. items and derived items copyright © 2001 by Harcourt, Inc.
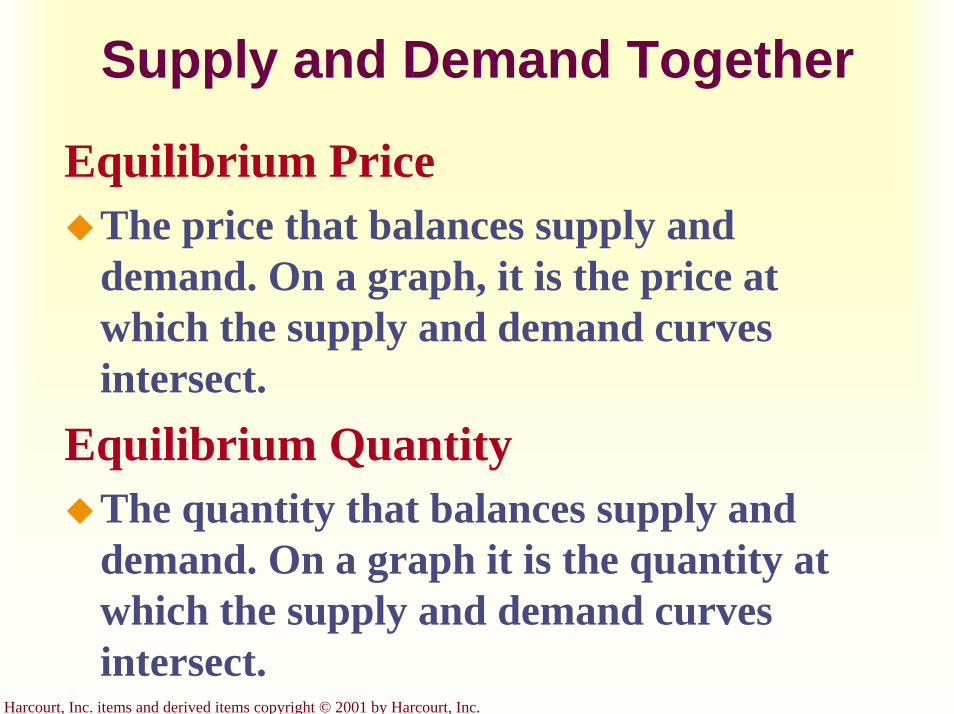
Supply and Demand Together
Equilibrium PriceThe price that balances supply and demand. On a graph, it is the price at which the supply and demand curves intersect.
Equilibrium QuantityThe quantity that balances supply and demand. On a graph it is the quantity at which the supply and demand curves intersect.
Harcourt, Inc. items and derived items copyright © 2001 by Harcourt, Inc.
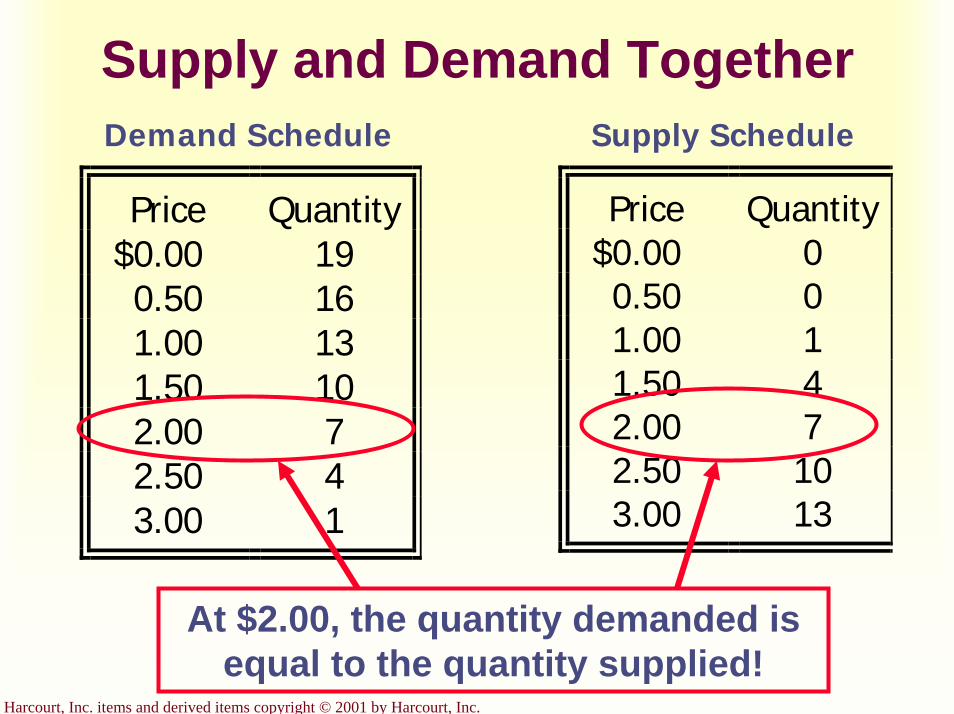
Supply and Demand TogetherDemand Schedule Supply Schedule
Price Quantity$0.00 00.50 01.00 11.50 42.00 72.50 103.00 13
Price Quantity$0.00 190.50 161.00 131.50 102.00 72.50 43.00 1
At $2.00, the quantity demanded is equal to the quantity supplied!
Harcourt, Inc. items and derived items copyright © 2001 by Harcourt, Inc.
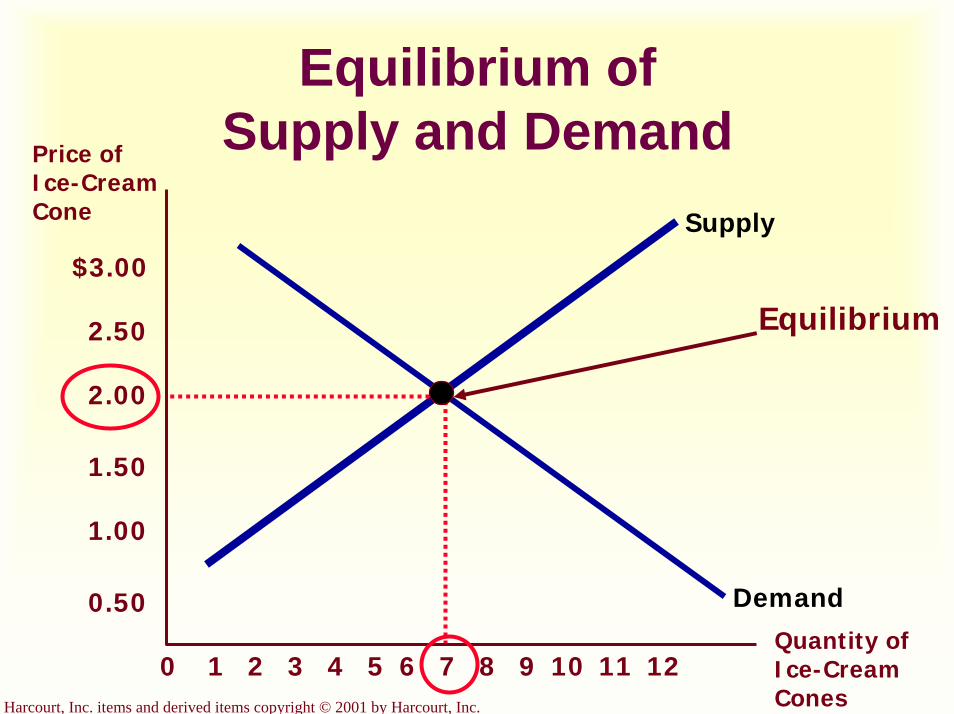
Equilibrium of Supply and Demand
Supply
Demand
Price of Ice-Cream Cone
$3.00
QuantiIce-Cream Cones
21 3 4 5 6 7 8 9 10 12110
2.50
2.00
1.50
1.00
0.50ty of
Equilibrium
Harcourt, Inc. items and derived items copyright © 2001 by Harcourt, Inc.
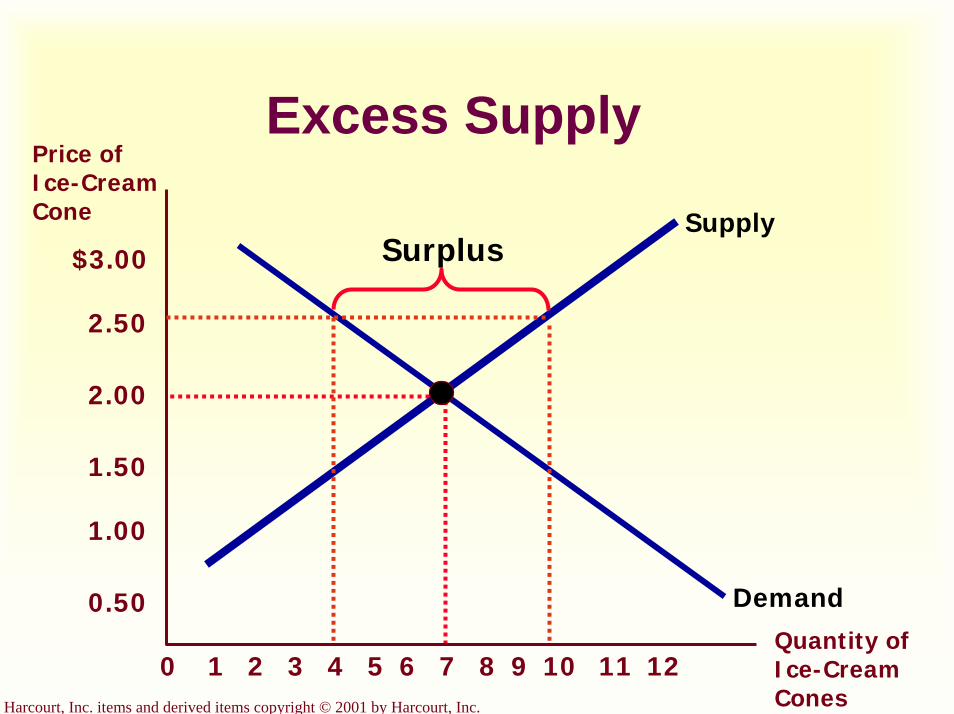
Excess SupplyPrice of Ice-Cream Cone
21 3 4 5 6 7 8 9 10 12110Quantity of Ice-Cream Cones
Supply
Demand
Surplus$3.00
2.50
2.00
1.50
1.00
0.50
Harcourt, Inc. items and derived items copyright © 2001 by Harcourt, Inc.
Surplus
When the price is above the equilibrium price, the quantity supplied exceeds the quantity demanded. There is excess supplyor a surplus. Suppliers will lower the price to increase sales, thereby moving toward equilibrium.
Harcourt, Inc. items and derived items copyright © 2001 by Harcourt, Inc.
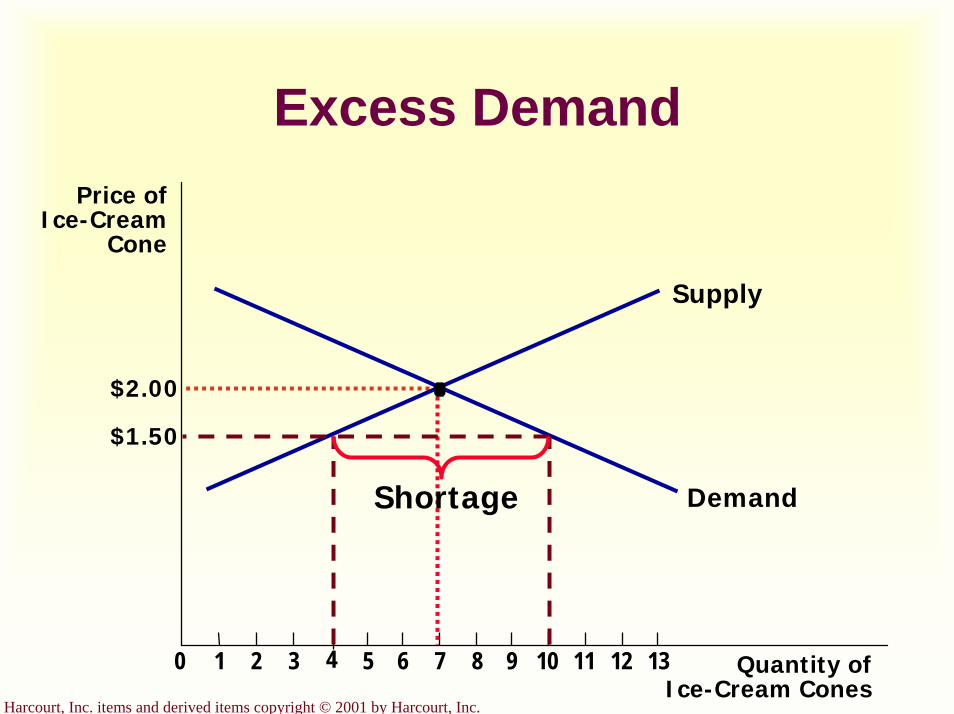
Excess Demand
Quantity ofIce-Cream Cones
Price ofIce-Cream
Cone
$2.00
0 1 2 3 4 5 6 7 8 9 10 11 12 13
Supply
Demand
$1.50
Shortage
Harcourt, Inc. items and derived items copyright © 2001 by Harcourt, Inc.
Shortage
When the price is below the equilibrium price, the quantity demanded exceeds the quantity supplied. There is excess demandor a shortage. Suppliers will raise the price due to too many buyers chasing too few goods, thereby moving toward equilibrium.
Harcourt, Inc. items and derived items copyright © 2001 by Harcourt, Inc.
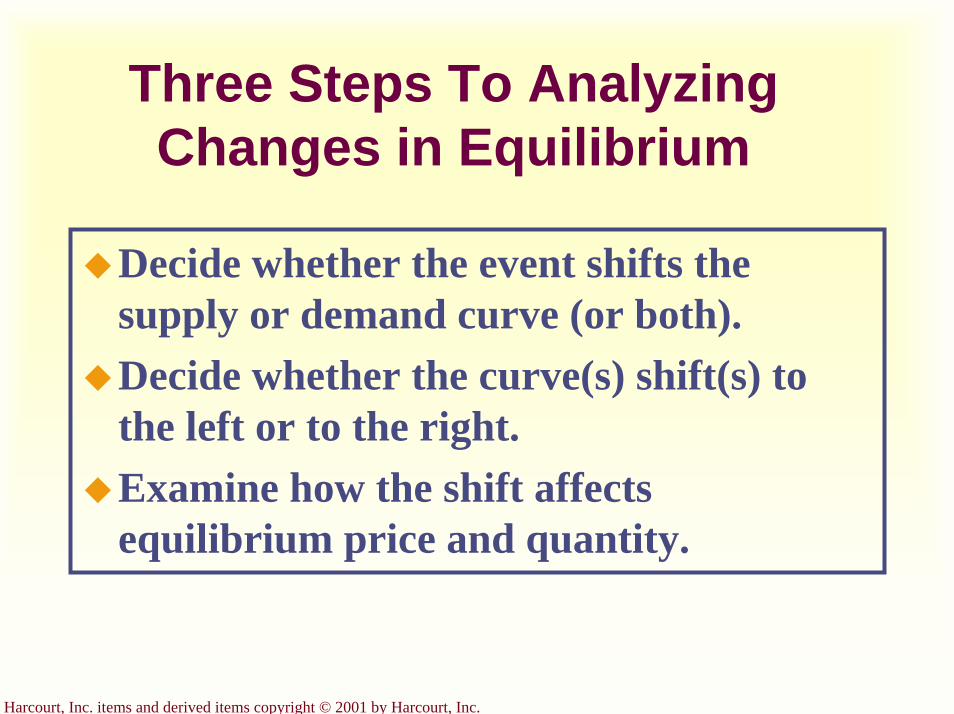
Three Steps To Analyzing Changes in Equilibrium
Decide whether the event shifts the supply or demand curve (or both).Decide whether the curve(s) shift(s) to the left or to the right.Examine how the shift affects equilibrium price and quantity.
Harcourt, Inc. items and derived items copyright © 2001 by Harcourt, Inc.
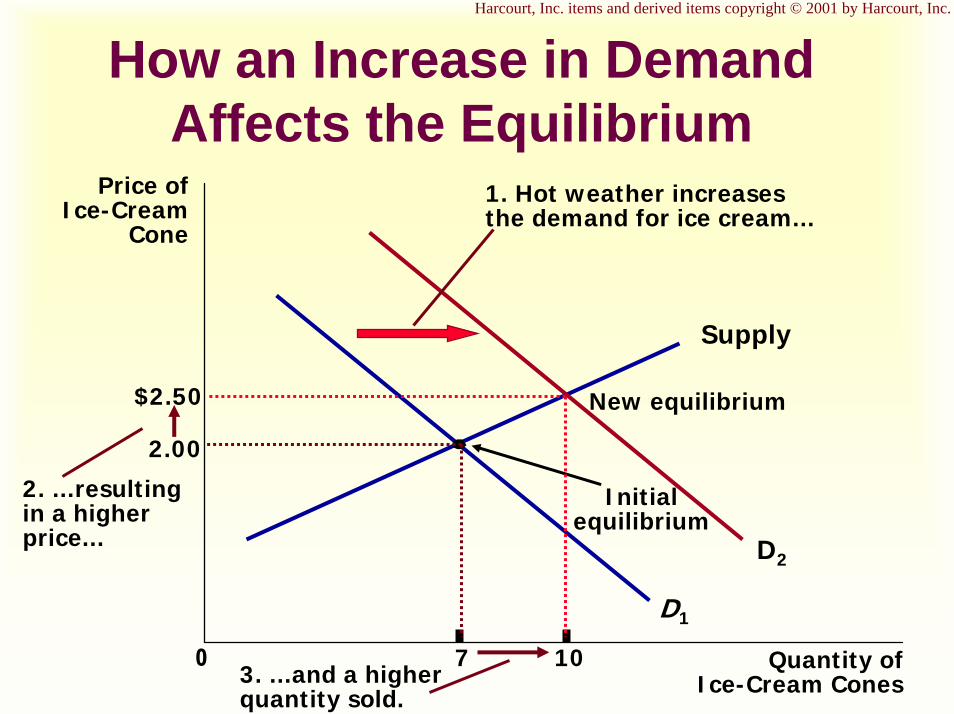
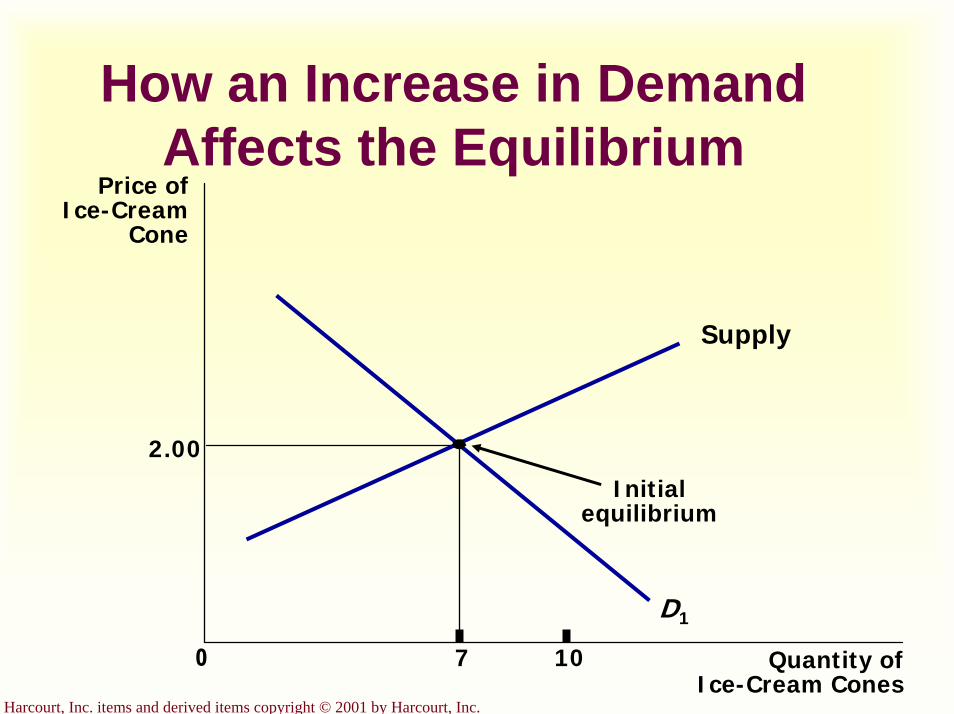
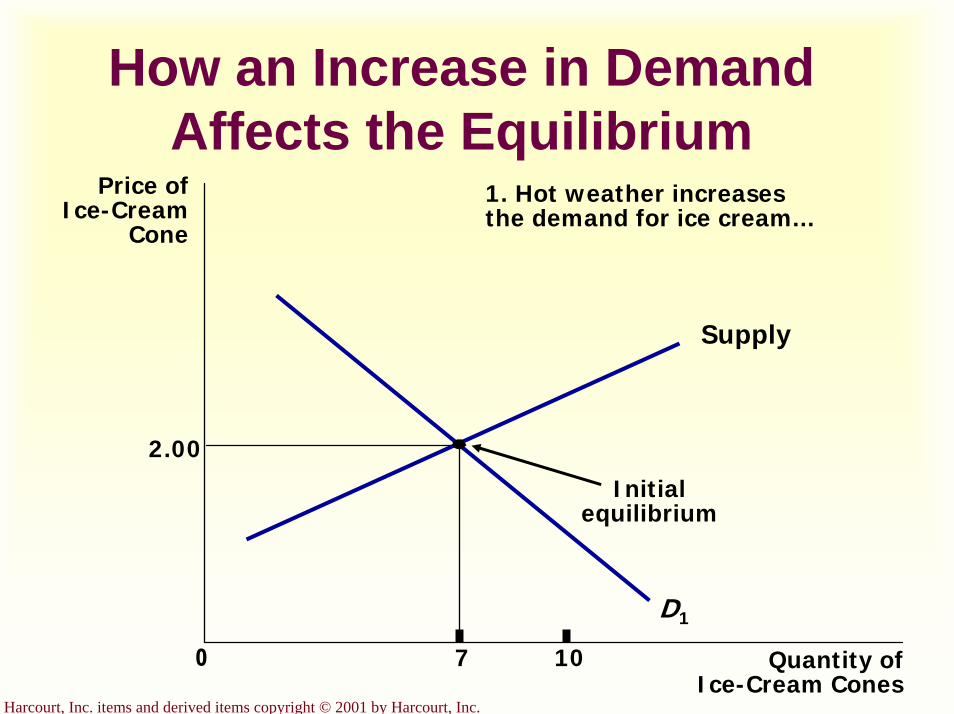
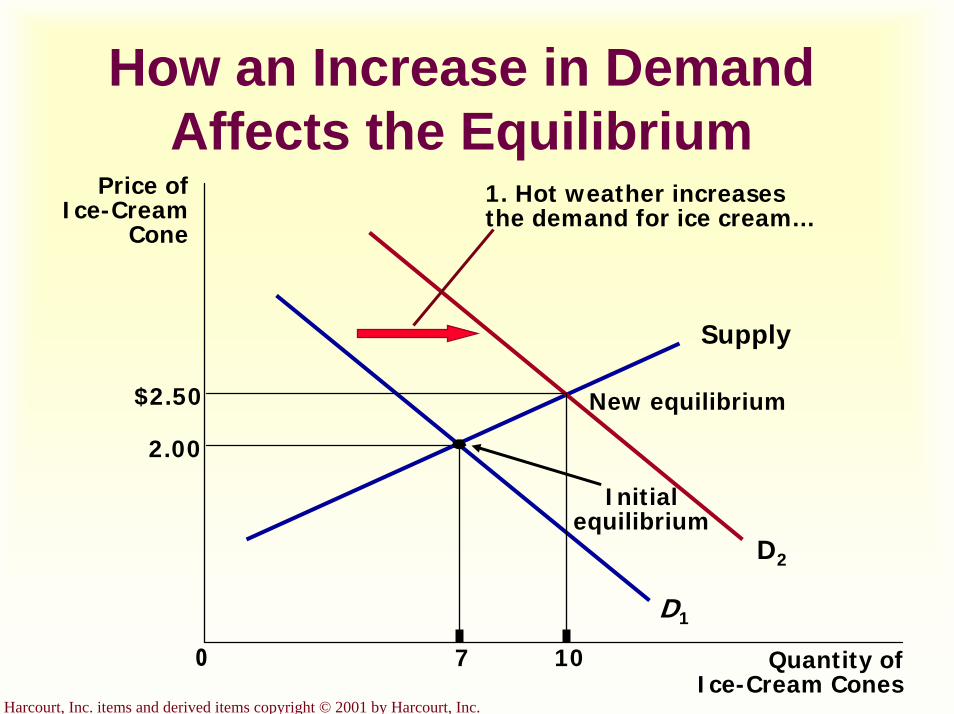
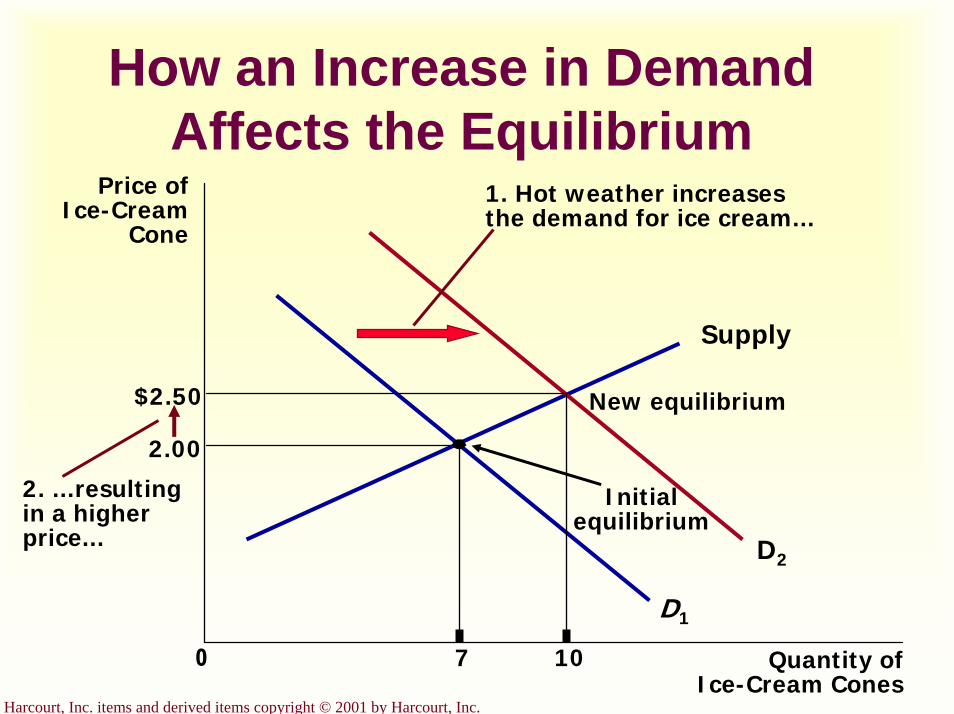
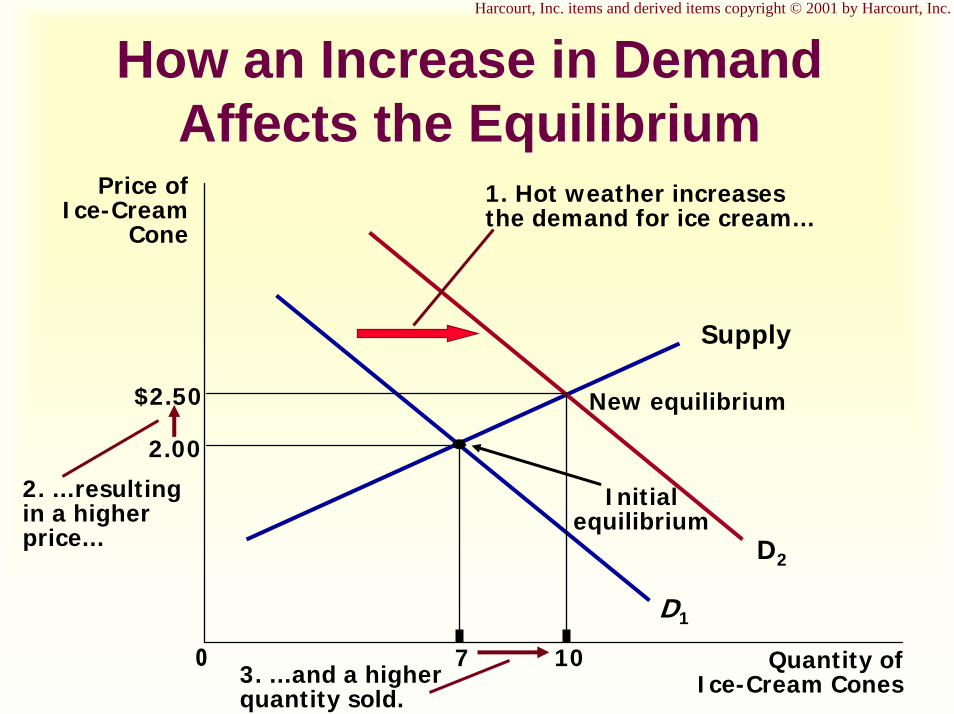
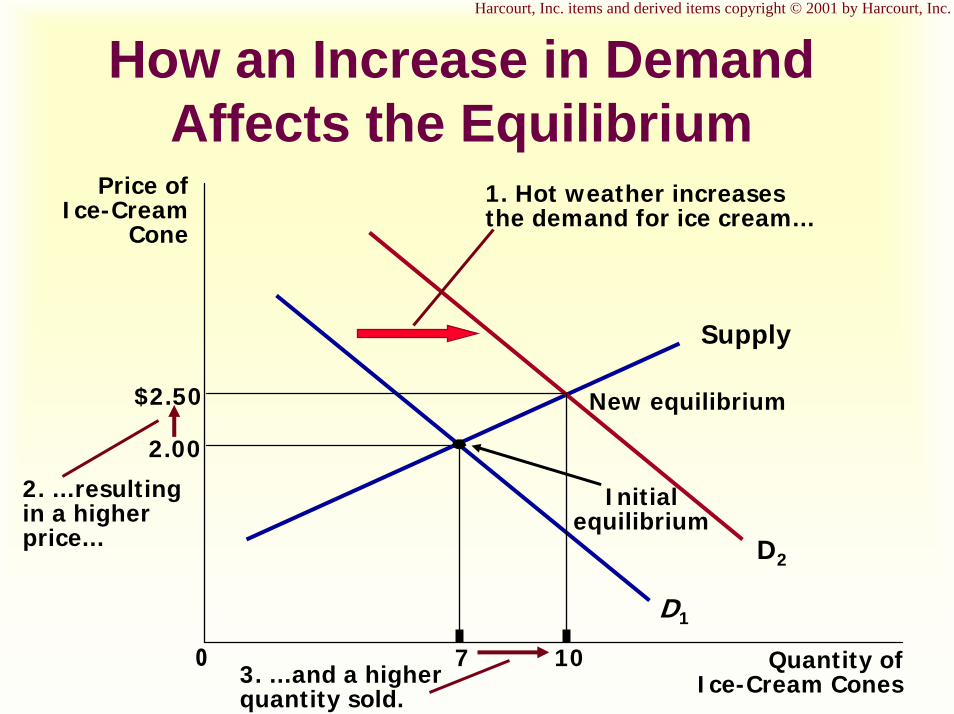
How an Increase in Demand Affects the Equilibrium
Price ofIce-Cream
Cone
2.00
0 7 Quantity ofIce-Cream Cones
Supply
Initialequilibrium
D1
1. Hot weather increasesthe demand for ice cream...
D2
2. ...resultingin a higherprice...
$2.50
103. ...and a higherquantity sold.
New equilibrium
Harcourt, Inc. items and derived items copyright © 2001 by Harcourt, Inc.
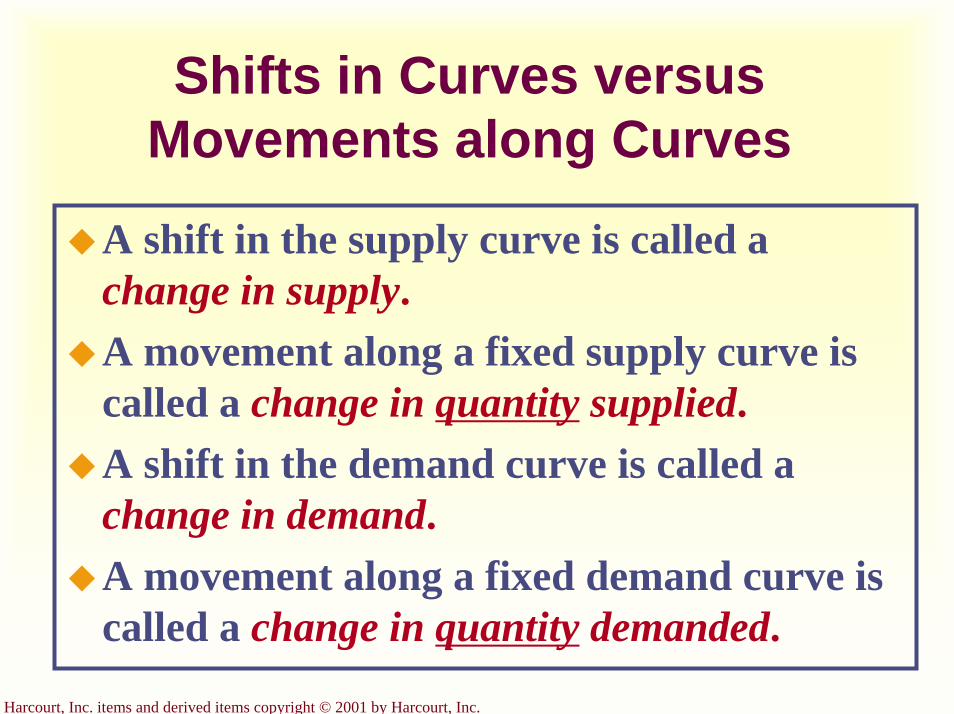
Shifts in Curves versus Movements along Curves
A shift in the supply curve is called achange in supply.A movement along a fixed supply curve is called a change in quantity supplied.A shift in the demand curve is called achange in demand.A movement along a fixed demand curve is called a change in quantity demanded.
Harcourt, Inc. items and derived items copyright © 2001 by Harcourt, Inc.
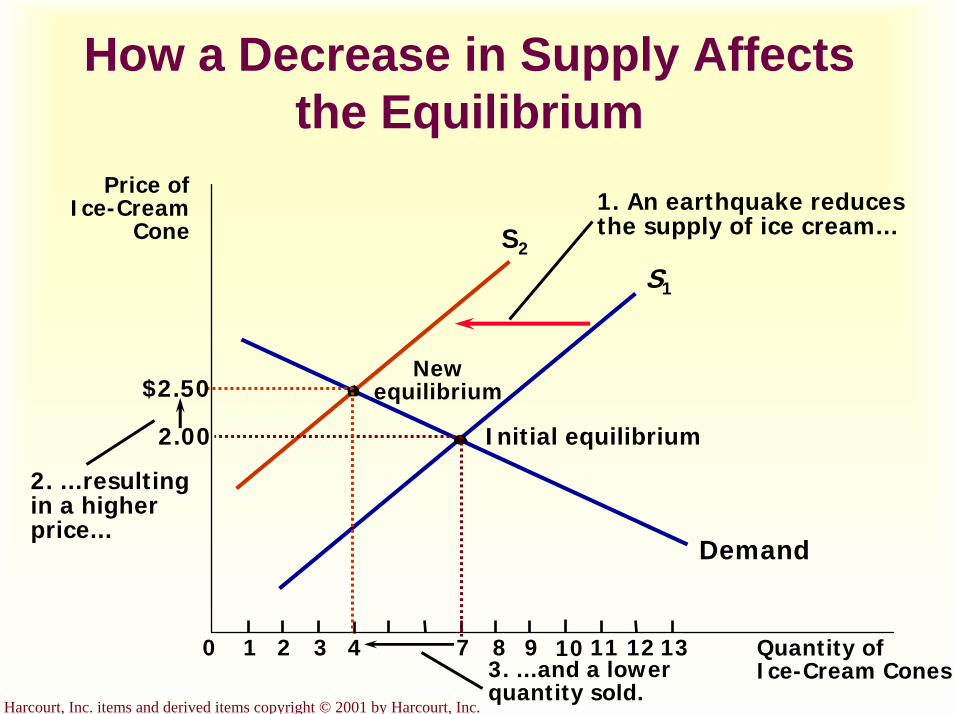
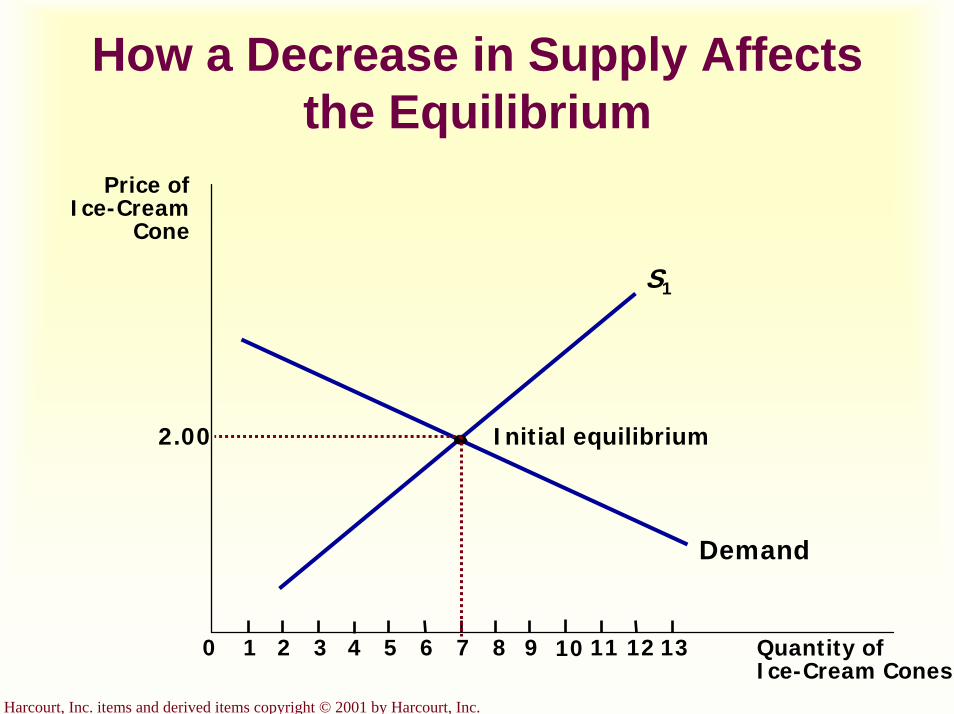
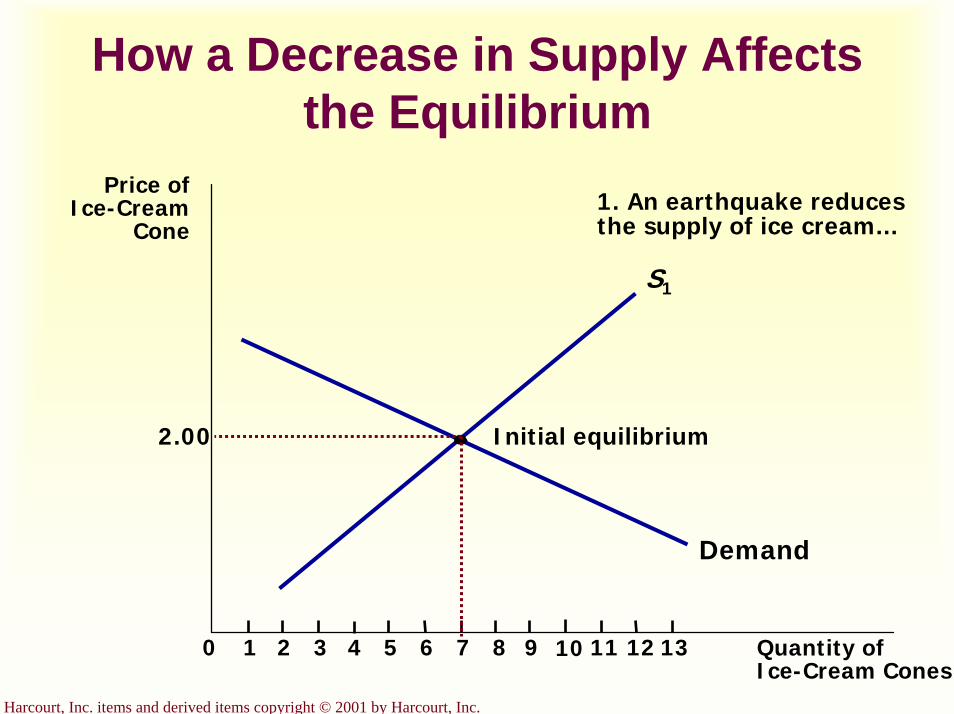
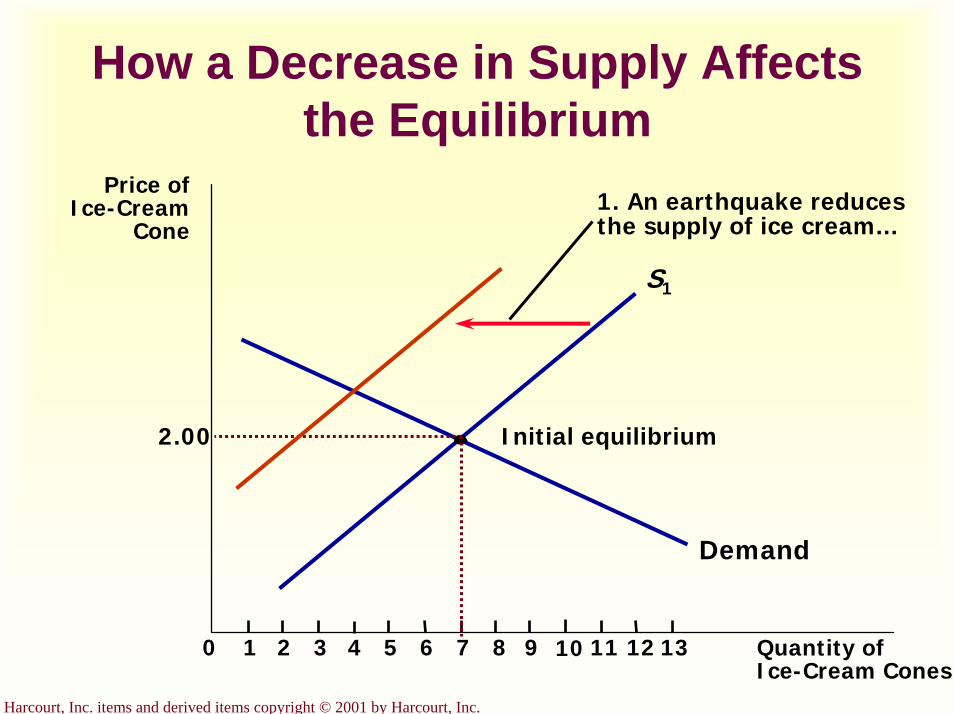
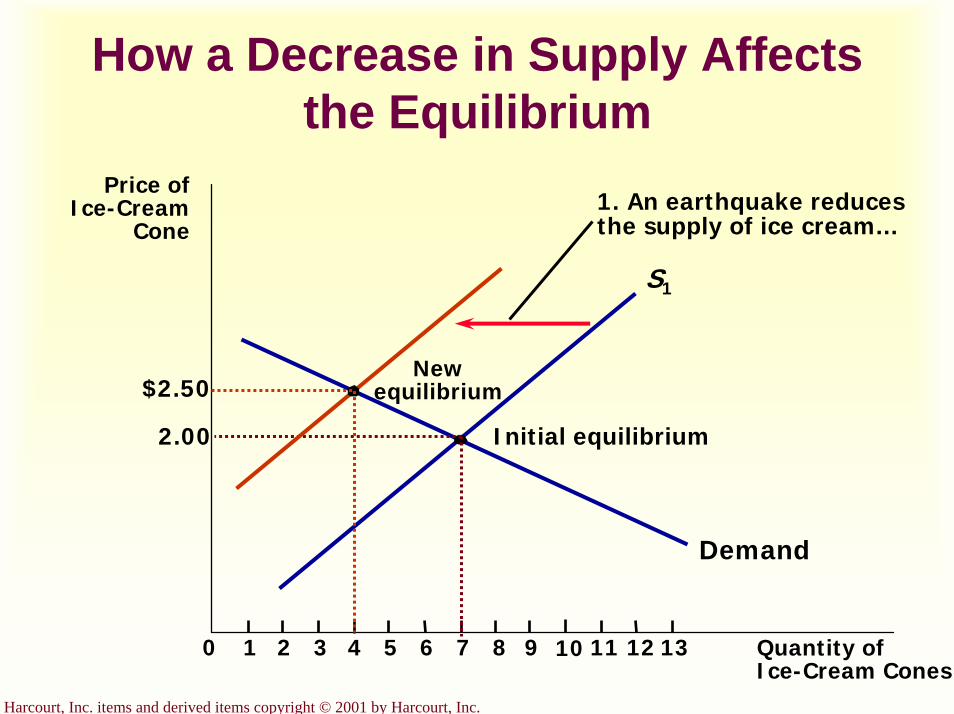
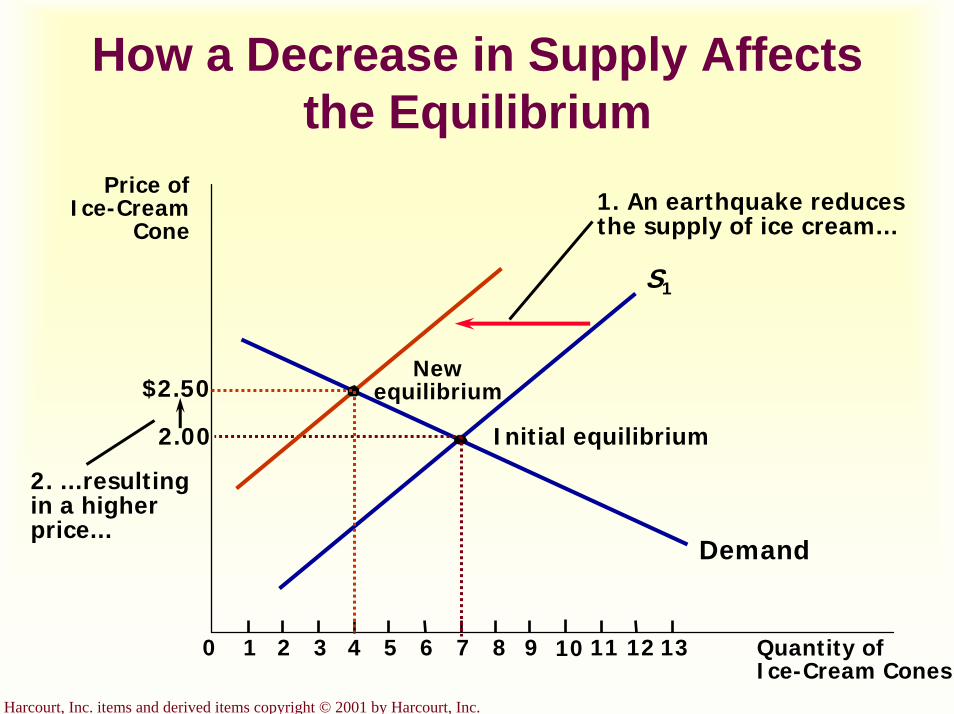
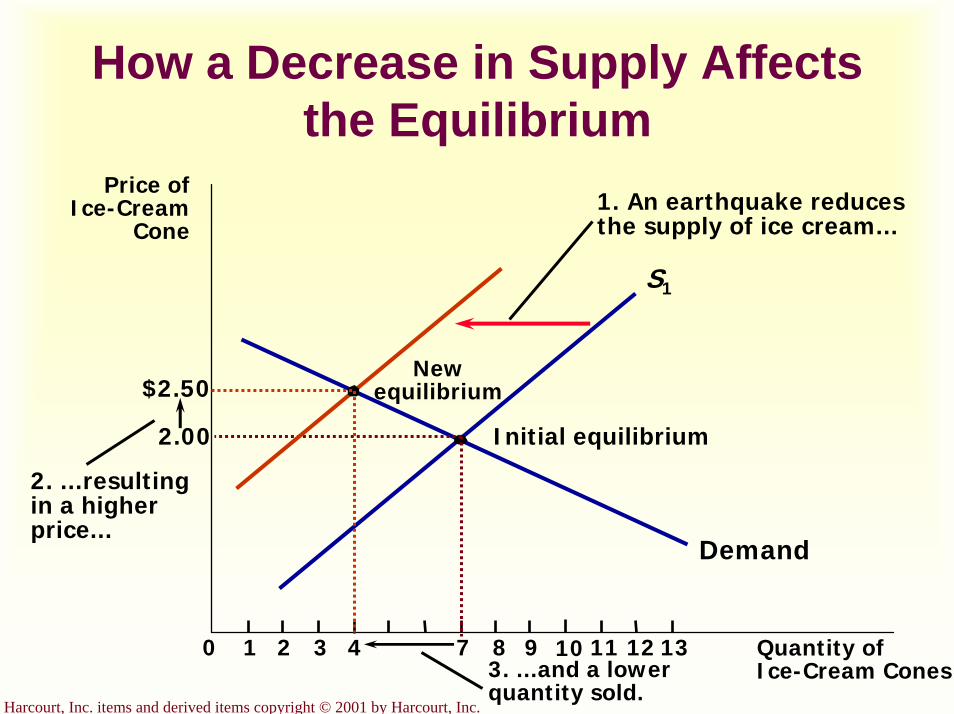
How a Decrease in Supply Affects the Equilibrium
S2
Price ofIce-Cream
Cone
2.00
0 1 2 3 4 7 8 9 11 12 Quantity ofIce-Cream Cones
13
Demand
Initial equilibrium
S1
10
1. An earthquake reducesthe supply of ice cream...
Newequilibrium
2. ...resultingin a higherprice...
$2.50
3. ...and a lowerquantity sold.
Harcourt, Inc. items and derived items copyright © 2001 by Harcourt, Inc.
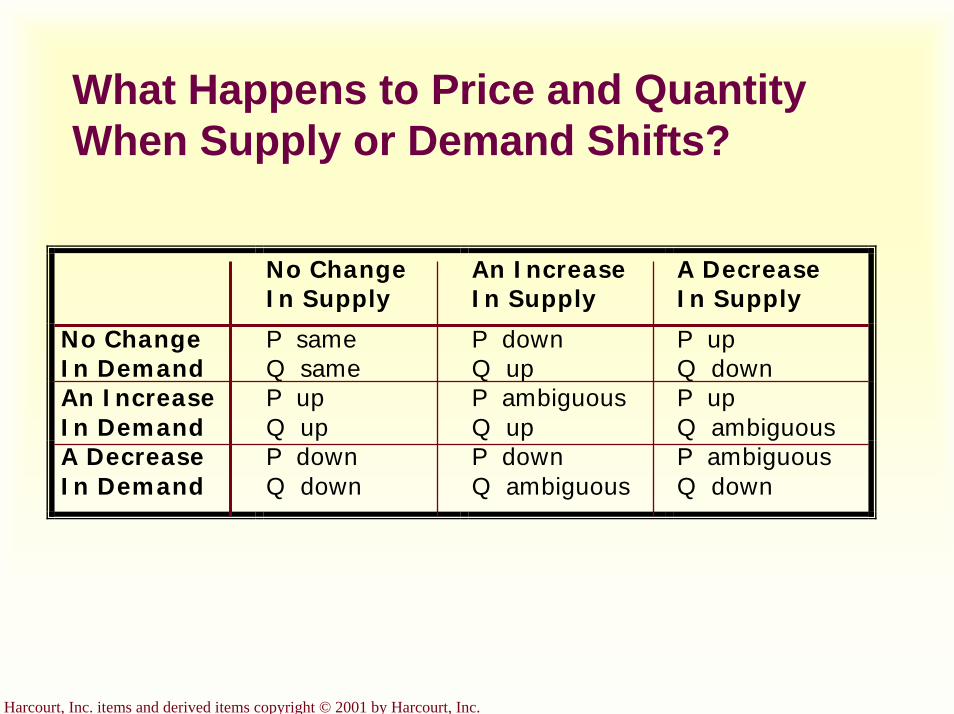
What Happens to Price and Quantity When Supply or Demand Shifts?
No Change In Supply
An Increase In Supply
A Decrease In Supply
No Change In Demand
P same Q same
P down Q up
P up Q down
An Increase In Demand
P up Q up
P ambiguous Q up
P up Q ambiguous
A Decrease In Demand
P down Q down
P down Q ambiguous
P ambiguous Q down
Harcourt, Inc. items and derived items copyright © 2001 by Harcourt, Inc.
Summary
Economists use the model of supply and demand to analyze competitive markets.The demand curve shows how the quantity of a good depends upon the price.
Harcourt, Inc. items and derived items copyright © 2001 by Harcourt, Inc.
SummaryAccording to the law of demand, as the price of a good rises, the quantity demanded falls.In addition to price, other determinants of quantity demanded include income, tastes, expectations, and the prices of complements and substitutes.
Harcourt, Inc. items and derived items copyright © 2001 by Harcourt, Inc.
Summary
The supply curve shows how the quantity of a good supplied depends upon the price.According to the law of supply, as the price of a good rises, the quantity supplied rises.
Harcourt, Inc. items and derived items copyright © 2001 by Harcourt, Inc.
Summary
In addition to price, other determinants of quantity supplied include input prices, technology, and expectations.Market equilibrium is determined by the intersection of the supply and demand curves.
Harcourt, Inc. items and derived items copyright © 2001 by Harcourt, Inc.
Summary
Supply and demand together determine the prices of the economy’s goods and services.In market economies, prices are the signals that guide the allocation of resources.

Harcourt, Inc. items and derived items copyright © 2001 by Harcourt, Inc.
Graphical Review
Harcourt, Inc. items and derived items copyright © 2001 by Harcourt, Inc.
How an Increase in Demand Affects the Equilibrium
Price ofIce-Cream
Cone
2.00
0 7 10 Quantity ofIce-Cream Cones
Supply
Initialequilibrium
D1
Harcourt, Inc. items and derived items copyright © 2001 by Harcourt, Inc.
How an Increase in Demand Affects the Equilibrium
Price ofIce-Cream
Cone
2.00
0 7 10 Quantity ofIce-Cream Cones
Supply
Initialequilibrium
D1
1. Hot weather increasesthe demand for ice cream...
Harcourt, Inc. items and derived items copyright © 2001 by Harcourt, Inc.
How an Increase in Demand Affects the Equilibrium
Price ofIce-Cream
Cone
2.00
0 7 10 Quantity ofIce-Cream Cones
Supply
Initialequilibrium
D1
1. Hot weather increasesthe demand for ice cream...
D2
New equilibrium$2.50
Harcourt, Inc. items and derived items copyright © 2001 by Harcourt, Inc.
How an Increase in Demand Affects the Equilibrium
Price ofIce-Cream
Cone
2.00
0 7 10 Quantity ofIce-Cream Cones
Supply
Initialequilibrium
D1
1. Hot weather increasesthe demand for ice cream...
D2
New equilibrium
2. ...resultingin a higherprice...
$2.50
3. ...and a higherquantity sold.
Harcourt, Inc. items and derived items copyright © 2001 by Harcourt, Inc.
How a Decrease in Supply Affects the Equilibrium
Price ofIce-Cream
Cone
2.00
0 1 2 3 4 5 6 7 8 9 11 12 Quantity ofIce-Cream Cones
13
Demand
Initial equilibrium
S1
10
Harcourt, Inc. items and derived items copyright © 2001 by Harcourt, Inc.
How a Decrease in Supply Affects the Equilibrium
Price ofIce-Cream
Cone
2.00
0 1 2 3 4 5 6 7 8 9 11 12 Quantity ofIce-Cream Cones
13
Demand
Initial equilibrium
S1
10
1. An earthquake reducesthe supply of ice cream...
Harcourt, Inc. items and derived items copyright © 2001 by Harcourt, Inc.
How a Decrease in Supply Affects the Equilibrium
Price ofIce-Cream
Cone
2.00
0 1 2 3 4 5 6 7 8 9 11 12 Quantity ofIce-Cream Cones
13
Demand
Initial equilibrium
S1
10
1. An earthquake reducesthe supply of ice cream...
Harcourt, Inc. items and derived items copyright © 2001 by Harcourt, Inc.
How a Decrease in Supply Affects the Equilibrium
Price ofIce-Cream
Cone
2.00
0 1 2 3 4 5 6 7 8 9 11 12 Quantity ofIce-Cream Cones
13
Demand
Initial equilibrium
S1
10
1. An earthquake reducesthe supply of ice cream...
Newequilibrium$2.50
2. ...resultingin a higherprice...
Harcourt, Inc. items and derived items copyright © 2001 by Harcourt, Inc.
How a Decrease in Supply Affects the Equilibrium
Price ofIce-Cream
Cone
2.00
0 1 2 3 4 7 8 9 11 12 Quantity ofIce-Cream Cones
13
Demand
Initial equilibrium
S1
10
1. An earthquake reducesthe supply of ice cream...
Newequilibrium$2.50
2. ...resultingin a higherprice...
3. ...and a lowerquantity sold.
Elasticity and Its Application
Chapter 5
Copyright © 2001 by Harcourt, Inc.
All rights reserved. Requests for permission to make copies of any part of thework should be mailed to:
Permissions Department, Harcourt College Publishers,6277 Sea Harbor Drive, Orlando, Florida 32887-6777.

Harcourt, Inc. items and derived items copyright © 2001 by Harcourt, Inc.
Elasticity . . .
… is a measure of how much buyers and sellers respond to changes in market conditions
… allows us to analyze supply and demand with greater precision.
Harcourt, Inc. items and derived items copyright © 2001 by Harcourt, Inc.
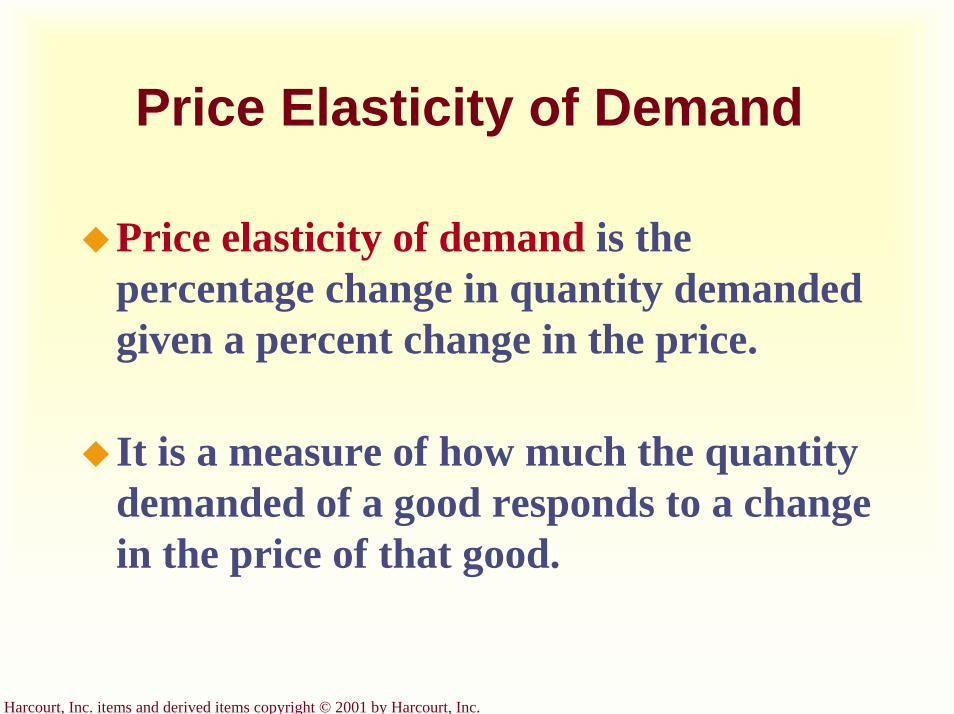
Price Elasticity of Demand
Price elasticity of demand is the percentage change in quantity demanded given a percent change in the price.
It is a measure of how much the quantity demanded of a good responds to a change in the price of that good.
Harcourt, Inc. items and derived items copyright © 2001 by Harcourt, Inc.
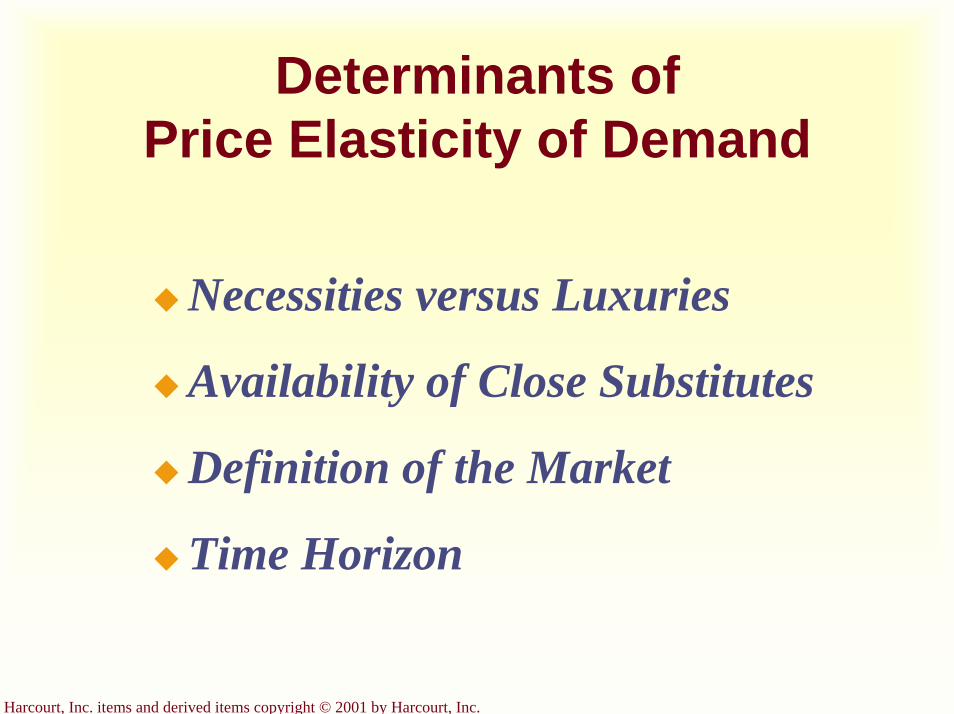
Determinants of Price Elasticity of Demand
Necessities versus Luxuries
Availability of Close Substitutes
Definition of the Market
Time Horizon
Harcourt, Inc. items and derived items copyright © 2001 by Harcourt, Inc.
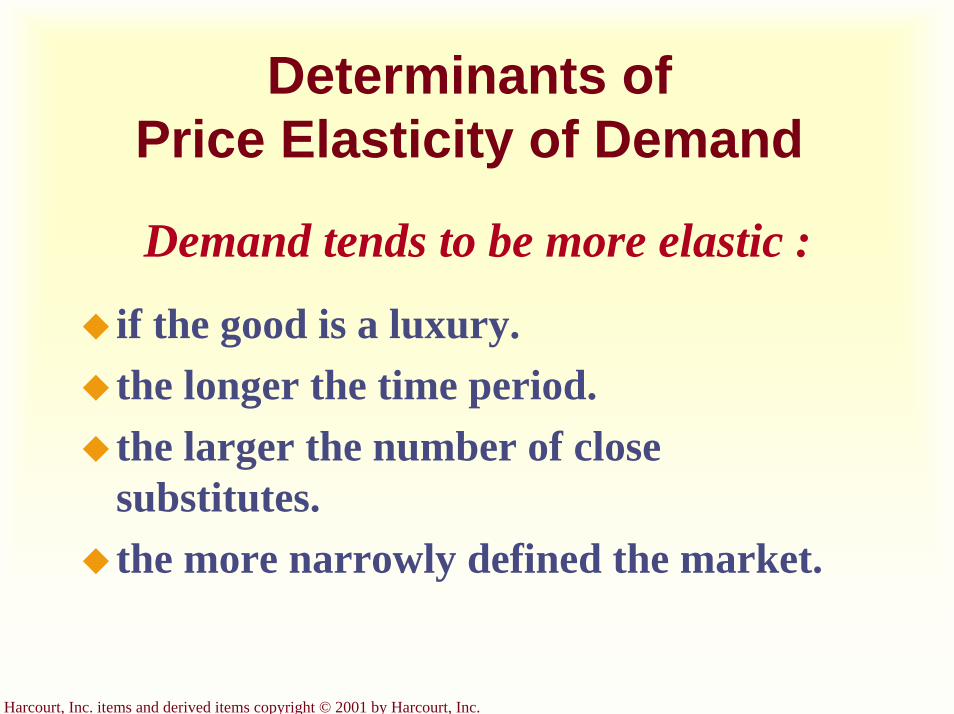
Determinants of Price Elasticity of Demand
Demand tends to be more elastic :
if the good is a luxury.the longer the time period.the larger the number of close substitutes.the more narrowly defined the market.
Harcourt, Inc. items and derived items copyright © 2001 by Harcourt, Inc.
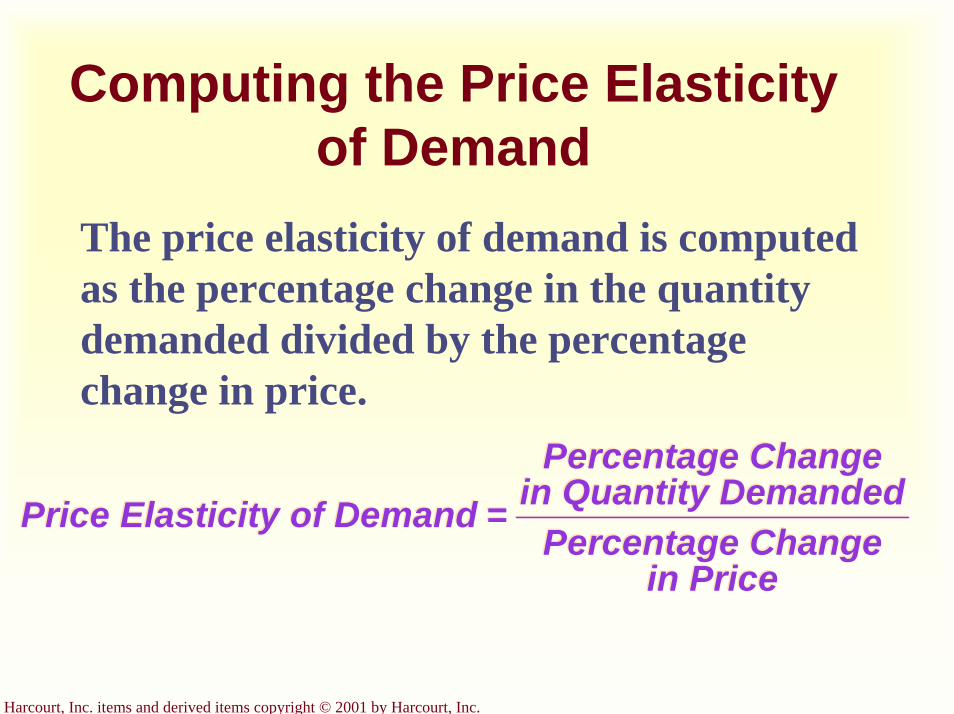
Computing the Price Elasticity of Demand
The price elasticity of demand is computed as the percentage change in the quantity demanded divided by the percentage change in price.
Price Elasticity of Demand =Percentage Change
in Quantity DemandedPercentage Change
in Price
Price Elasticity of Demand =Percentage Change
in Quantity DemandedPercentage Change
in Price
Harcourt, Inc. items and derived items copyright © 2001 by Harcourt, Inc.
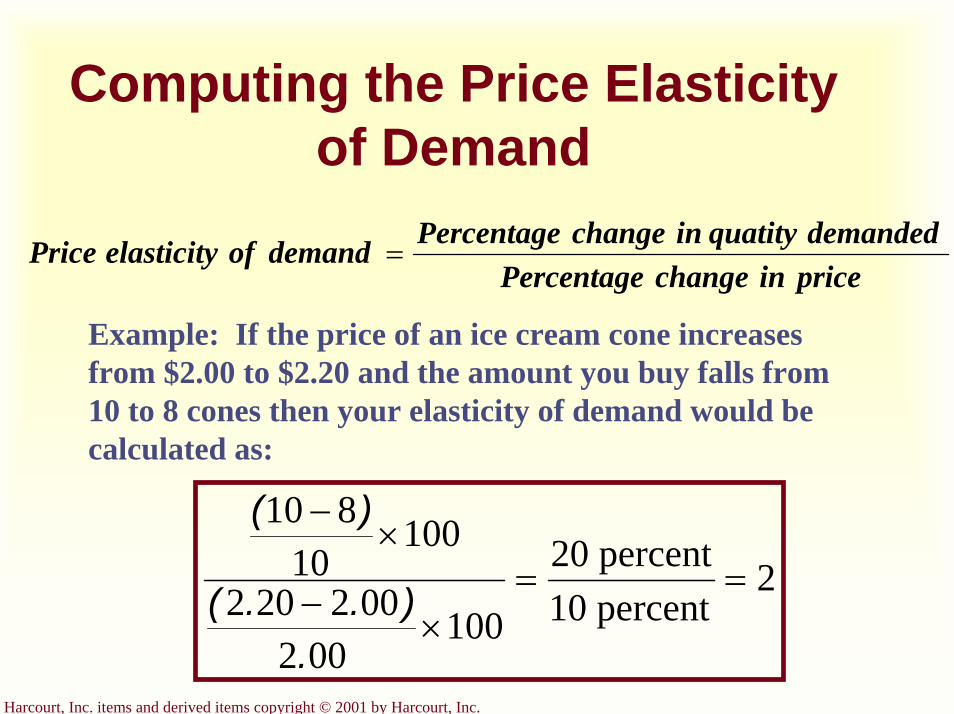
Computing the Price Elasticity of Demand
price inchange Percentagedemandedquatity inchange Percentagedemand of elasticityPrice =
Example: If the price of an ice cream cone increases from $2.00 to $2.20 and the amount you buy falls from 10 to 8 cones then your elasticity of demand would be calculated as:
2percent10percent20
100002
002202
10010
810
==×
−
×−
.)..(
)(
Harcourt, Inc. items and derived items copyright © 2001 by Harcourt, Inc.
Computing the Price Elasticity of Demand Using the Midpoint
Formula
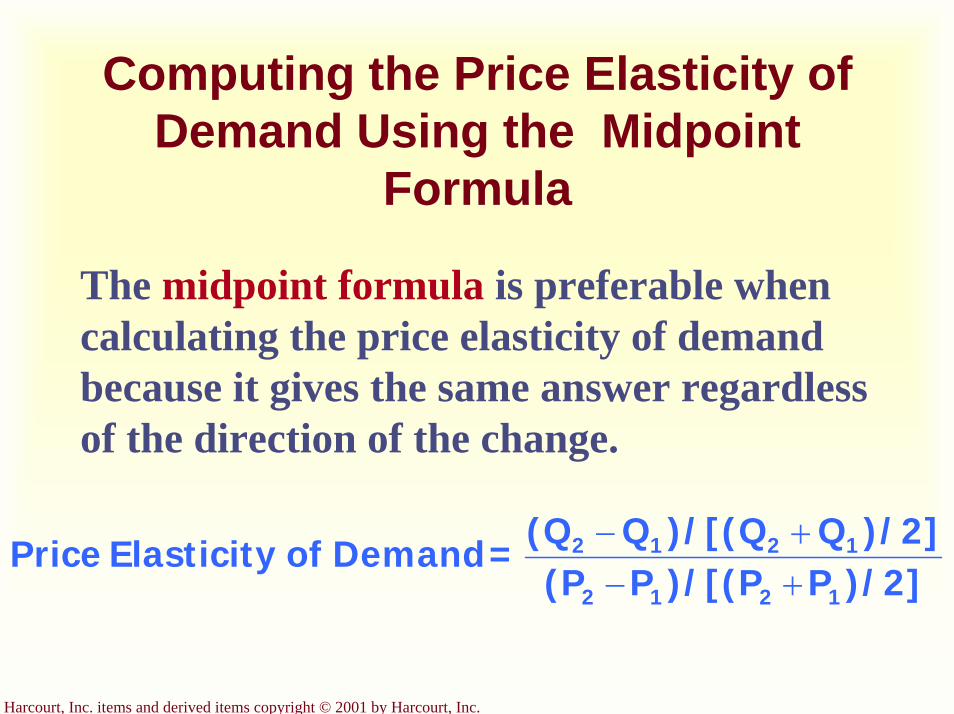
The midpoint formula is preferable when calculating the price elasticity of demand because it gives the same answer regardless of the direction of the change.
)/2]P)/[(PP(P)/2]Q)/[(QQ(Q=Demand of Elasticity Price
1212
1212
+−+−
Harcourt, Inc. items and derived items copyright © 2001 by Harcourt, Inc.
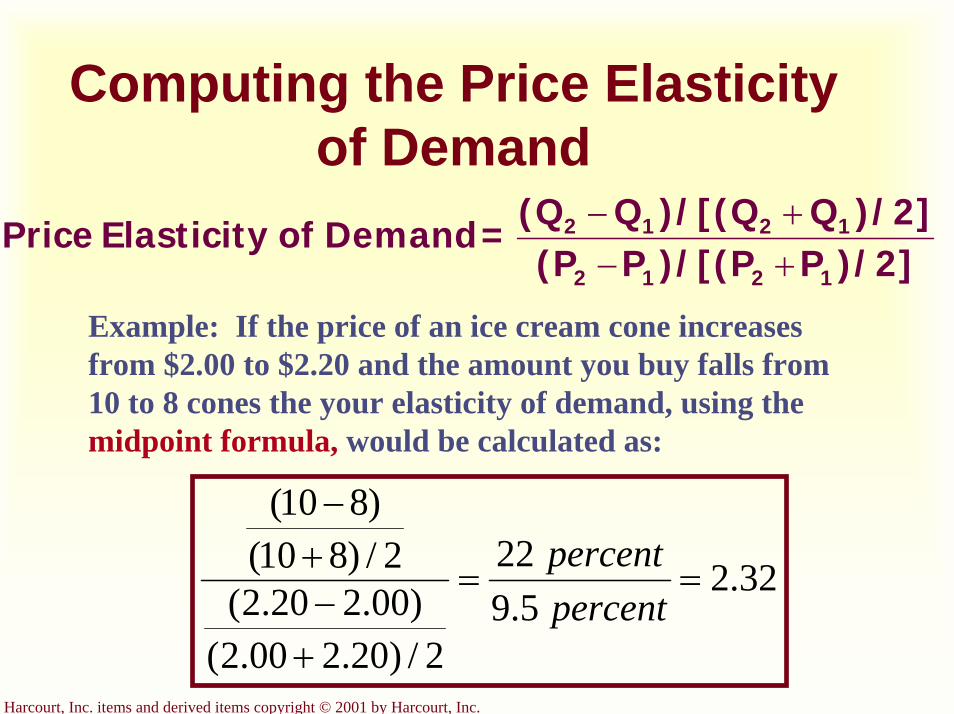
Computing the Price Elasticity of Demand
)/2]P)/[(PP(P)/2]Q)/[(QQ(Q=Demand of Elasticity Price
1212
1212
+−+−
Example: If the price of an ice cream cone increases from $2.00 to $2.20 and the amount you buy falls from 10 to 8 cones the your elasticity of demand, using the midpoint formula, would be calculated as:
32.25.9
22
2/)20.200.2()00.220.2(
2/)810()810(
==
+−+−
percentpercent
Harcourt, Inc. items and derived items copyright © 2001 by Harcourt, Inc.
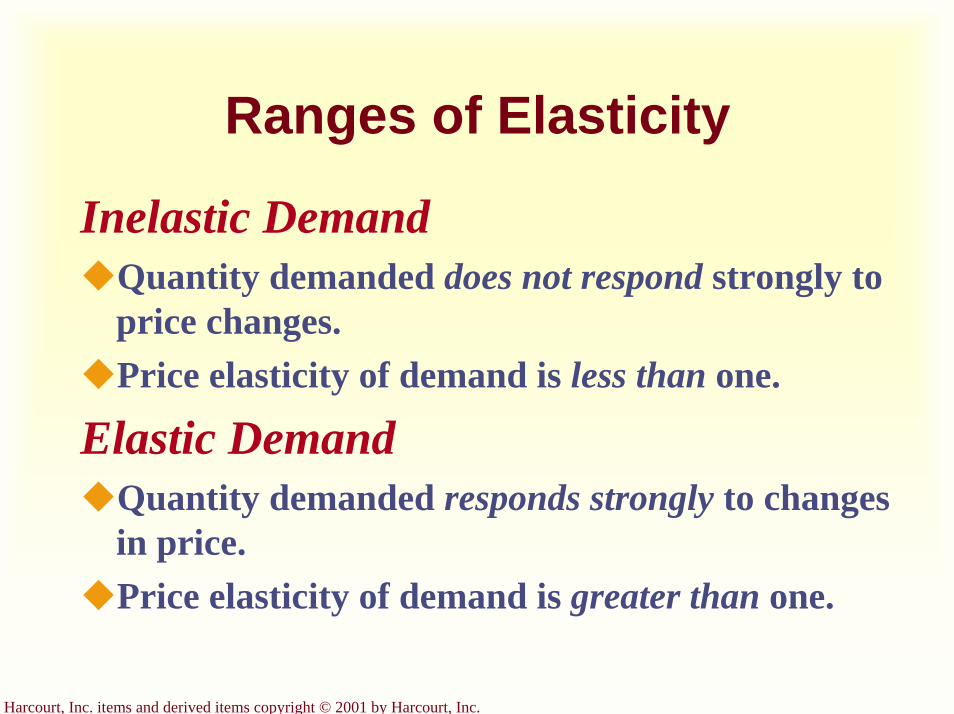
Ranges of Elasticity
Inelastic DemandQuantity demanded does not respond strongly to price changes.Price elasticity of demand is less than one.
Elastic DemandQuantity demanded responds strongly to changes in price.Price elasticity of demand is greater than one.

Harcourt, Inc. items and derived items copyright © 2001 by Harcourt, Inc.
Computing the Price Elasticity of Demand
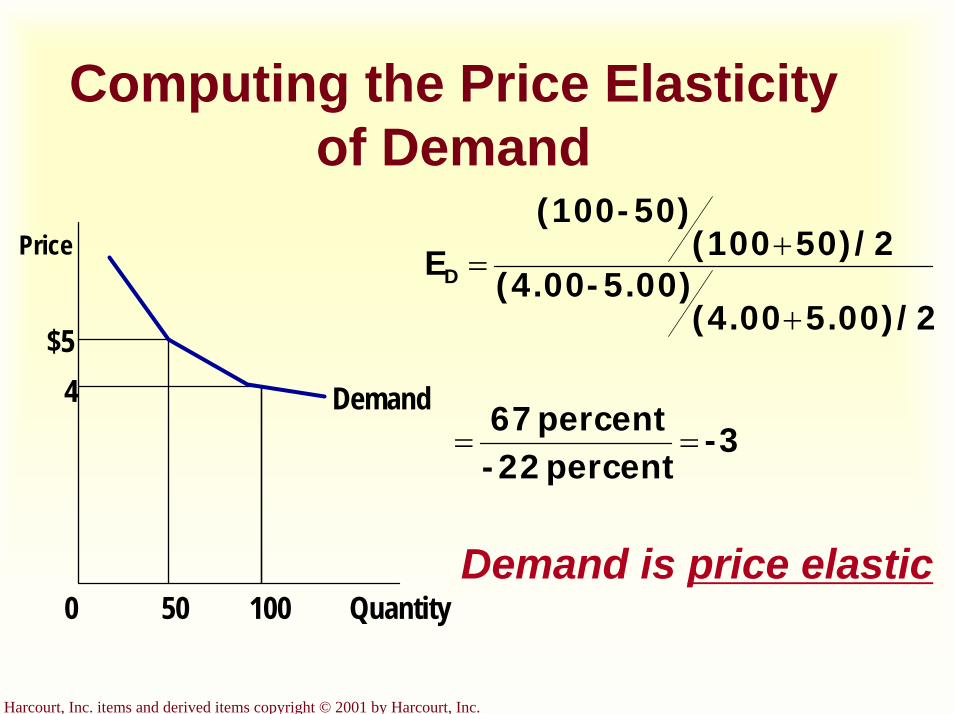
Demand is price elastic
$54 Demand
Quantity1000
Price
50
-3percent 22-percent 67
5.00)/2(4.005.00)-(4.00
50)/2(10050)-(100
ED
==
+
+=
Harcourt, Inc. items and derived items copyright © 2001 by Harcourt, Inc.
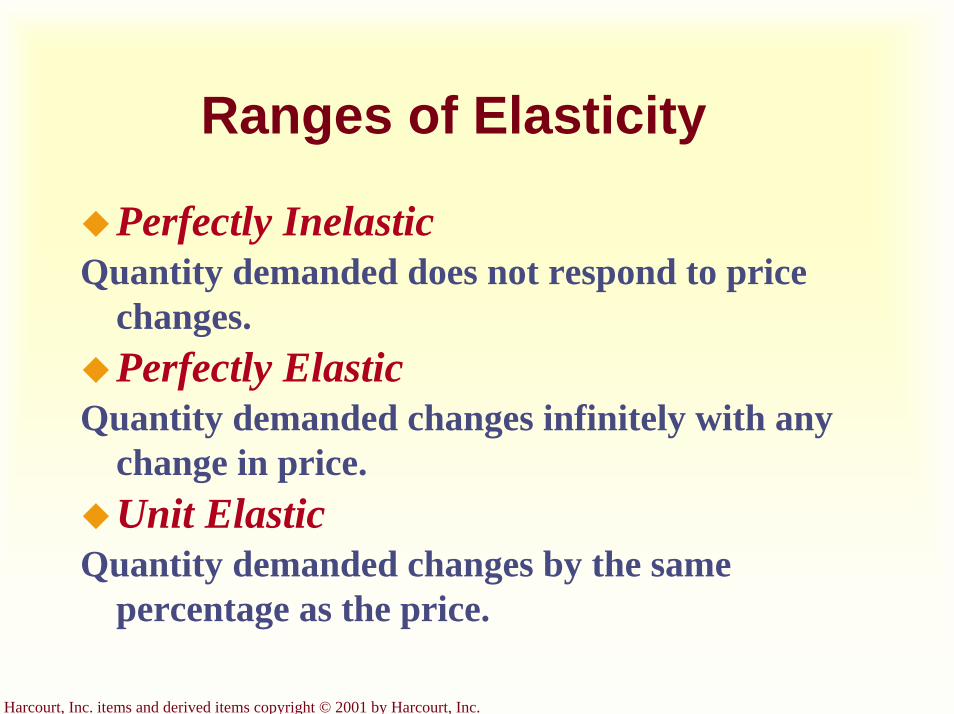
Ranges of Elasticity
Perfectly InelasticQuantity demanded does not respond to price
changes.Perfectly Elastic
Quantity demanded changes infinitely with any change in price.Unit Elastic
Quantity demanded changes by the same percentage as the price.
Harcourt, Inc. items and derived items copyright © 2001 by Harcourt, Inc.
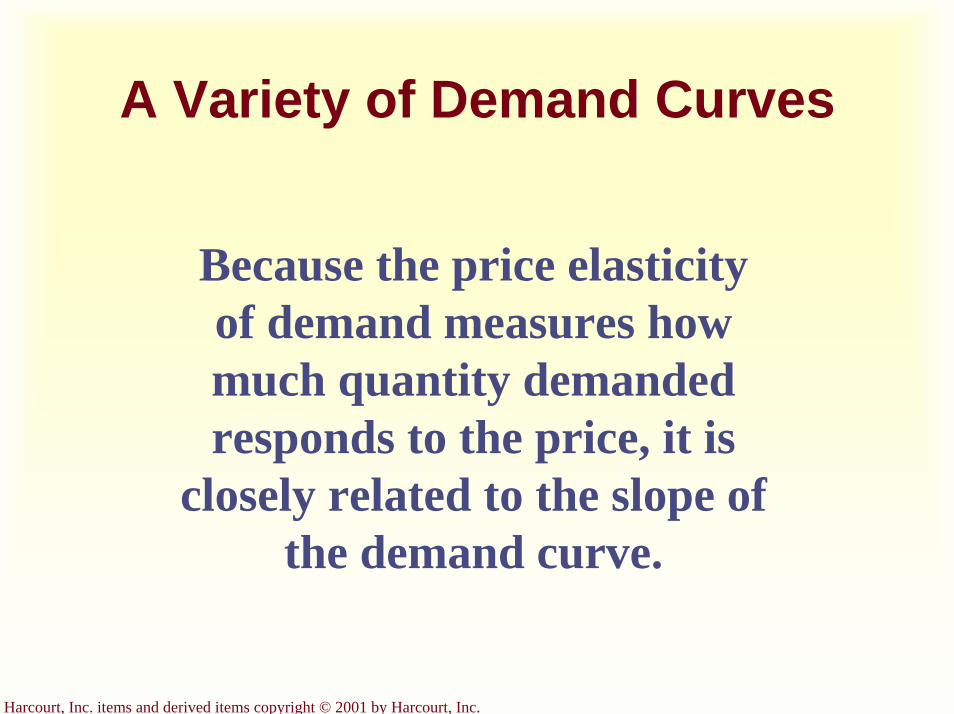
A Variety of Demand Curves
Because the price elasticity of demand measures how much quantity demanded responds to the price, it is
closely related to the slope of the demand curve.
Harcourt, Inc. items and derived items copyright © 2001 by Harcourt, Inc.
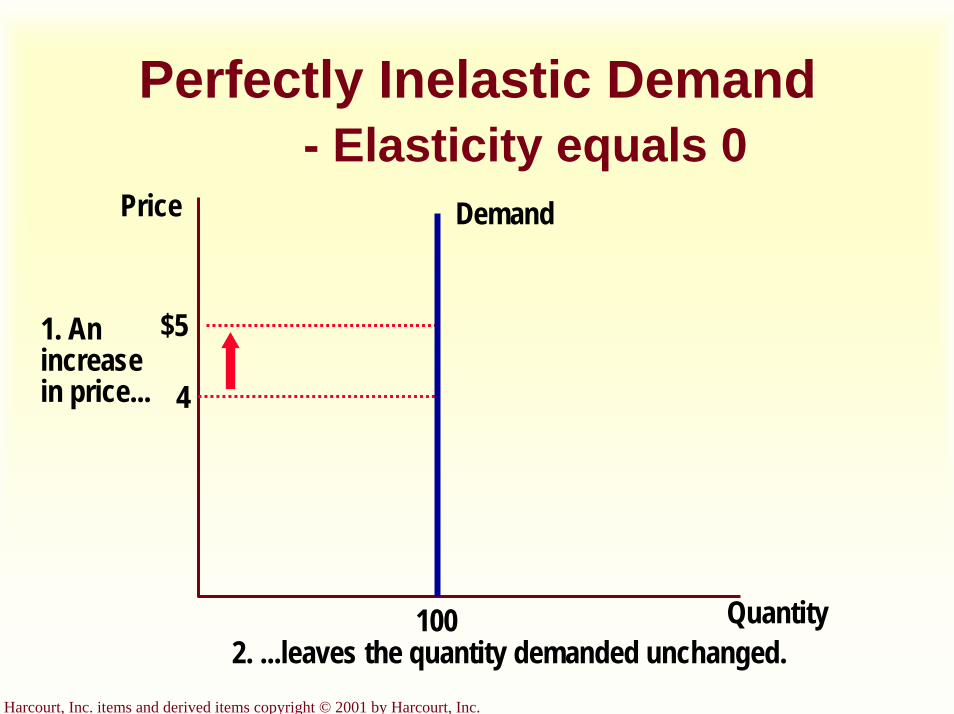
Perfectly Inelastic Demand- Elasticity equals 0
Quantity
Price
4
$5
Demand
1002. ...leaves the quantity demanded unchanged.
1. Anincreasein price...

Harcourt, Inc. items and derived items copyright © 2001 by Harcourt, Inc.
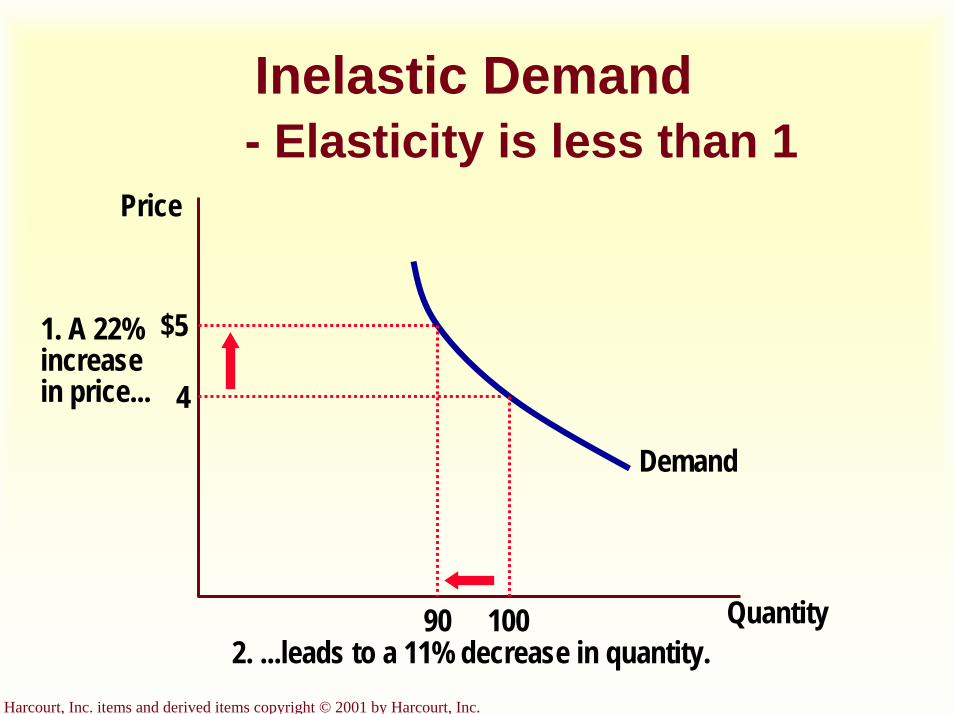
Inelastic Demand- Elasticity is less than 1
Quantity
Price
4
$51. A 22%increasein price...
Demand
100902. ...leads to a 11% decrease in quantity.

Harcourt, Inc. items and derived items copyright © 2001 by Harcourt, Inc.
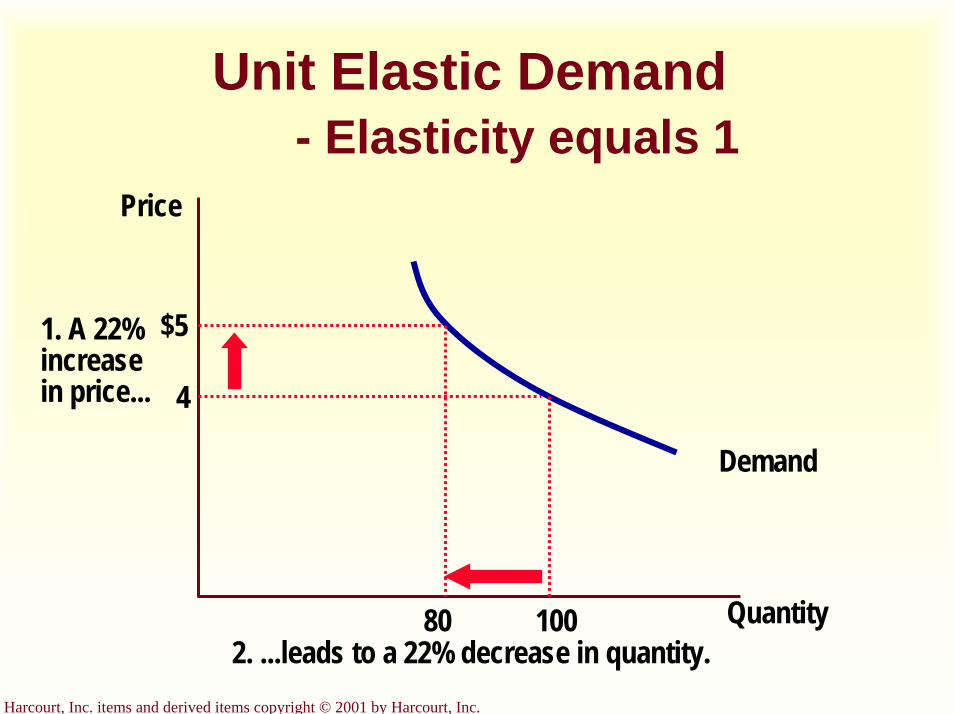
Unit Elastic Demand- Elasticity equals 1
Quantity
Price
4
$51. A 22%increasein price...
Demand
100802. ...leads to a 22% decrease in quantity.
Harcourt, Inc. items and derived items copyright © 2001 by Harcourt, Inc.
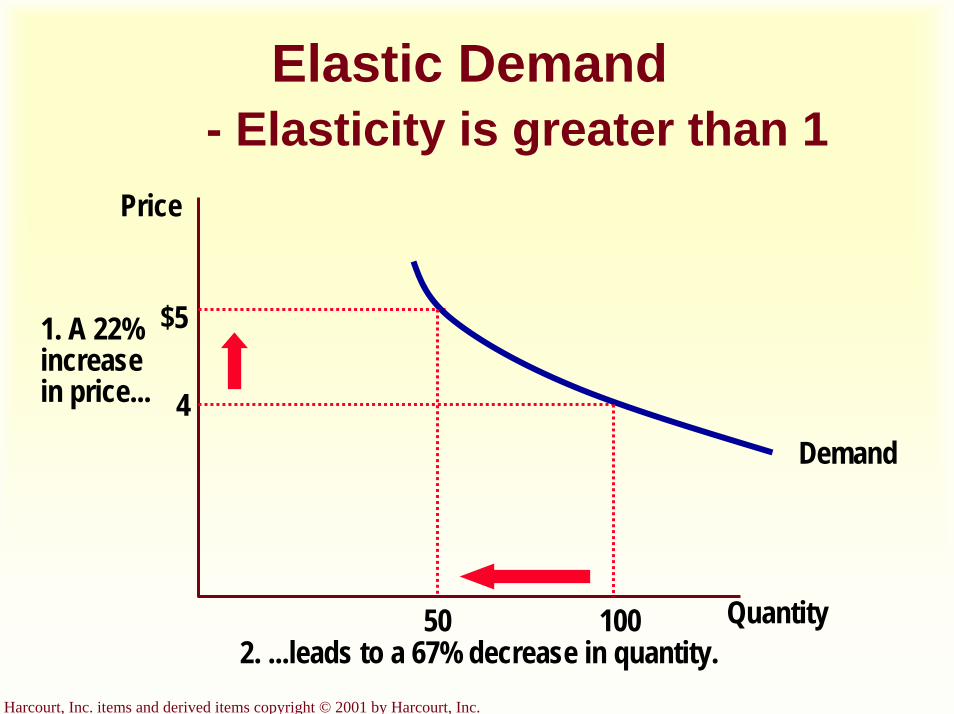
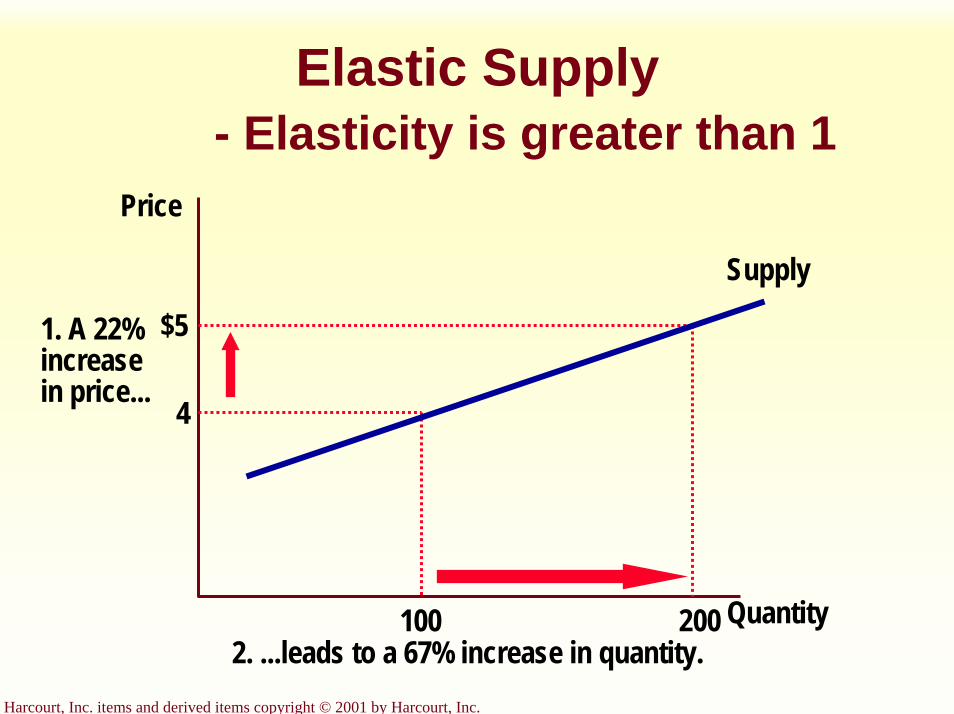
Elastic Demand- Elasticity is greater than 1
Quantity
Price
4
$51. A 22%increasein price...
Demand
100502. ...leads to a 67% decrease in quantity.

Harcourt, Inc. items and derived items copyright © 2001 by Harcourt, Inc.
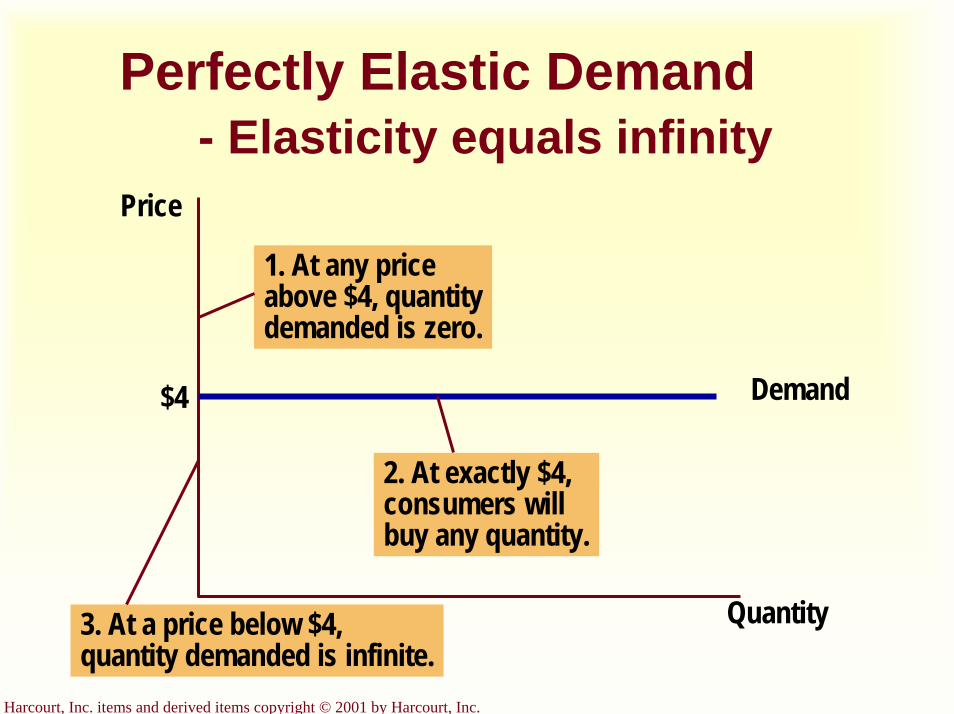
Perfectly Elastic Demand- Elasticity equals infinity
Quantity
Price
Demand$4
1. At any priceabove $4, quantitydemanded is zero.
2. At exactly $4,consumers willbuy any quantity.
3. At a price below $4,quantity demanded is infinite.
Harcourt, Inc. items and derived items copyright © 2001 by Harcourt, Inc.
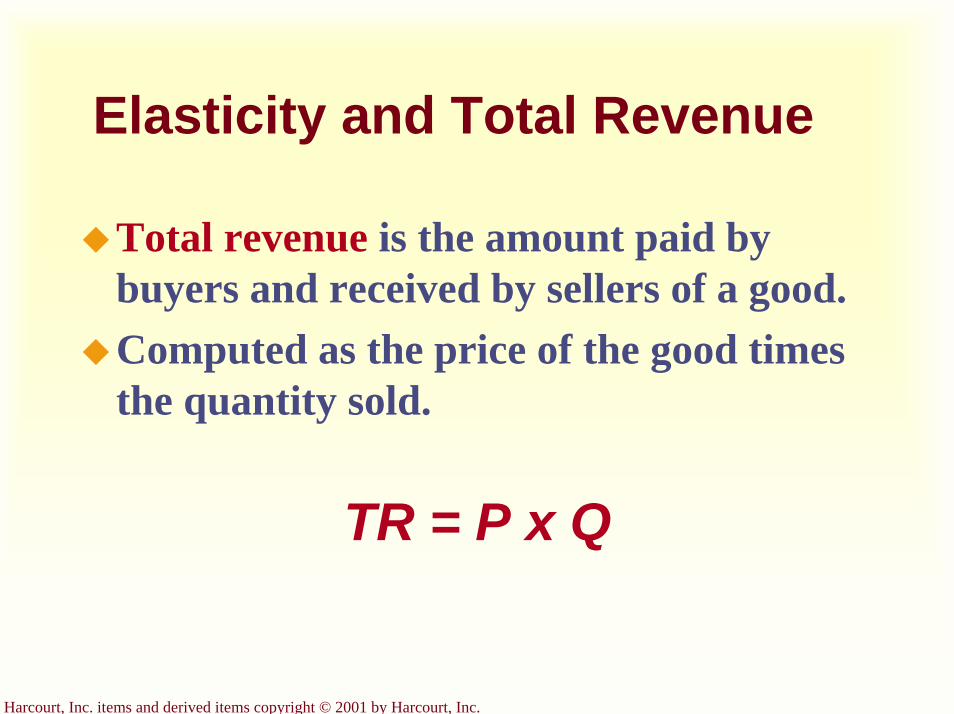
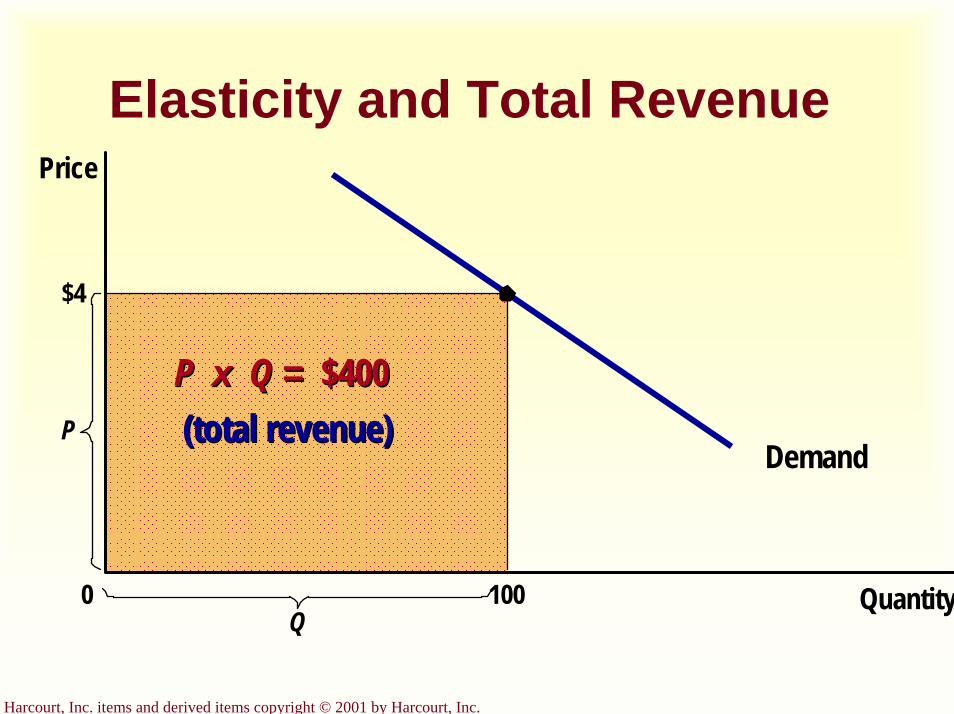
Elasticity and Total Revenue
Total revenue is the amount paid by buyers and received by sellers of a good.Computed as the price of the good times the quantity sold.
TR = P x Q
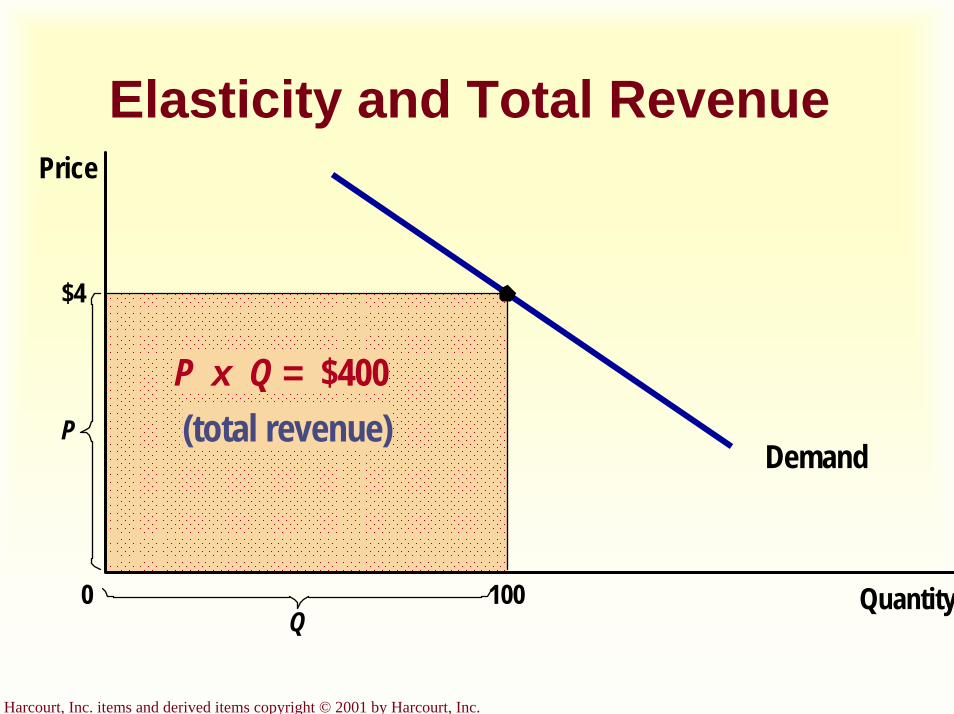
Harcourt, Inc. items and derived items copyright © 2001 by Harcourt, Inc.
Elasticity and Total Revenue
$4
Demand
Quantity
P
0
Price
P x Q = $400(total revenue)
100Q
Harcourt, Inc. items and derived items copyright © 2001 by Harcourt, Inc.
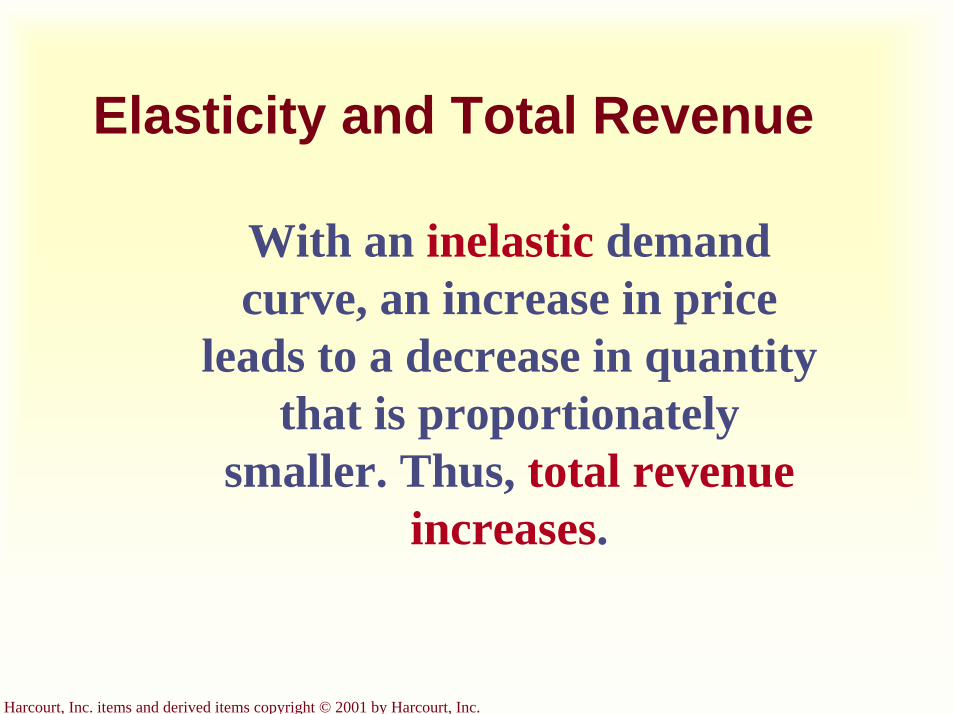
Elasticity and Total Revenue
With an inelastic demand curve, an increase in price
leads to a decrease in quantity that is proportionately
smaller. Thus, total revenue increases.
Harcourt, Inc. items and derived items copyright © 2001 by Harcourt, Inc.
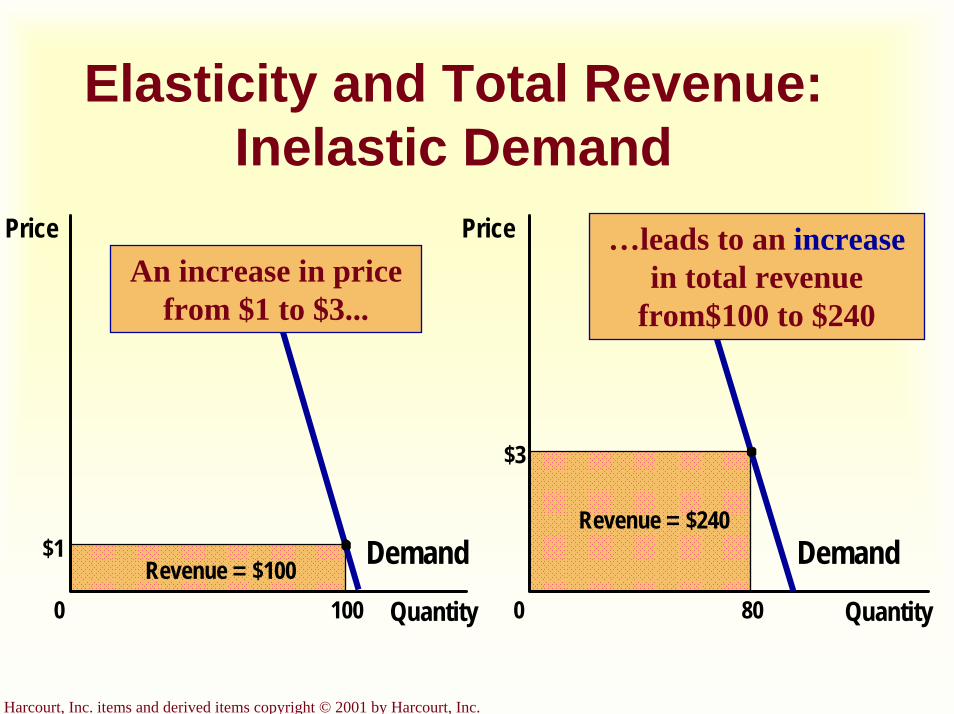
Elasticity and Total Revenue: Inelastic Demand
$3
Quantity0
Price
80
Revenue = $240 Demand$1 Demand
Quantity0Revenue = $100
100
PriceAn increase in price
from $1 to $3...
…leads to an increasein total revenue
from$100 to $240
Harcourt, Inc. items and derived items copyright © 2001 by Harcourt, Inc.
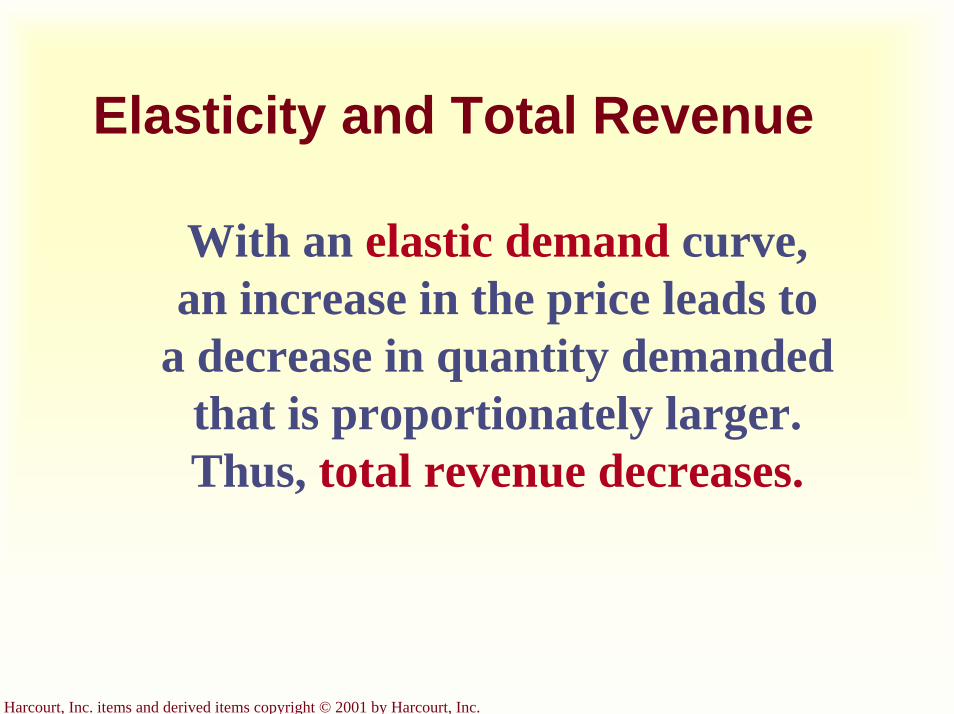
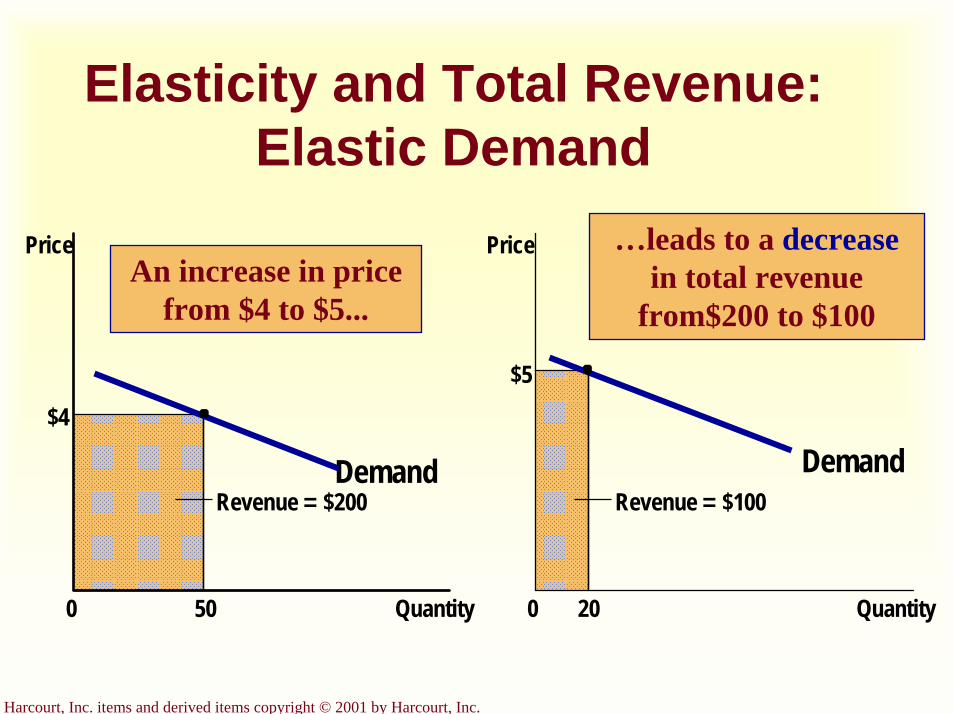
Elasticity and Total Revenue
With an elastic demand curve, an increase in the price leads to
a decrease in quantity demanded that is proportionately larger. Thus, total revenue decreases.

Harcourt, Inc. items and derived items copyright © 2001 by Harcourt, Inc.
Elasticity and Total Revenue: Elastic Demand
Demand
Quantity0
Price
$4
50
Demand
Quantity0
Price
Revenue = $100
$5
20
…leads to a decreasein total revenue
from$200 to $100
Revenue = $200
An increase in price from $4 to $5...
Harcourt, Inc. items and derived items copyright © 2001 by Harcourt, Inc.
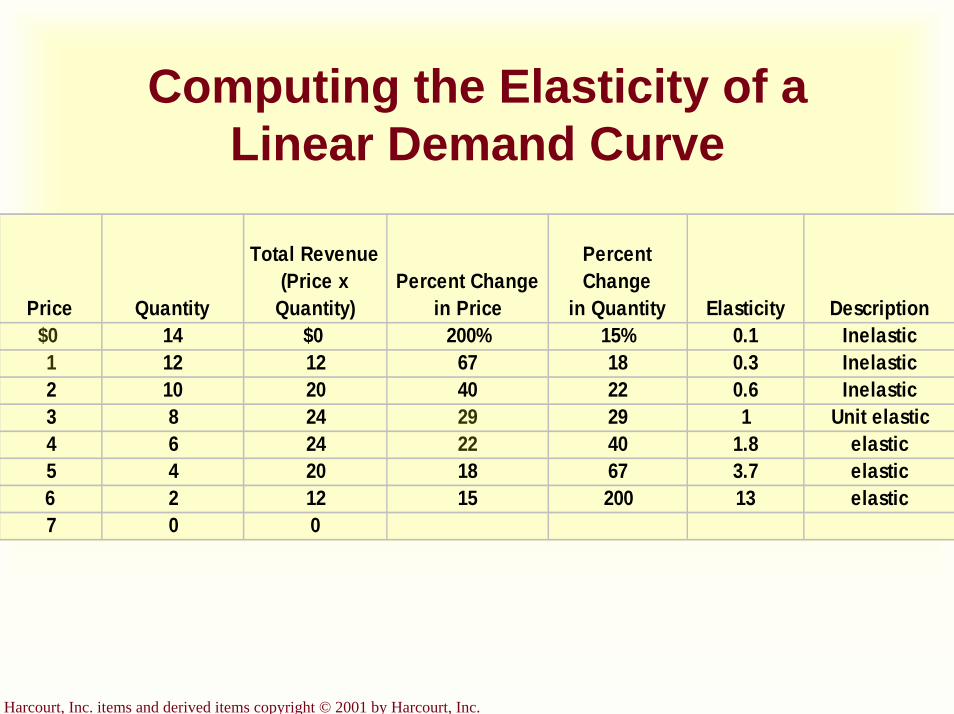
Computing the Elasticity of a Linear Demand Curve
Price Quantity
Total Revenue(Price x
Quantity)Percent Change
in Price
Percent Change
in Quantity Elasticity Description$0 14 $0 200% 15% 0.1 Inelastic1 12 12 67 18 0.3 Inelastic2 10 20 40 22 0.6 Inelastic3 8 24 29 29 1 Unit elastic4 6 24 22 40 1.8 elastic5 4 20 18 67 3.7 elastic6 2 12 15 200 13 elastic7 0 0
Harcourt, Inc. items and derived items copyright © 2001 by Harcourt, Inc.
Income Elasticity of Demand
Income elasticity of demand measures how much the quantity demanded of a good responds to a change in consumers’income. It is computed as the percentage change in the quantity demanded divided by the percentage change in income.
Harcourt, Inc. items and derived items copyright © 2001 by Harcourt, Inc.
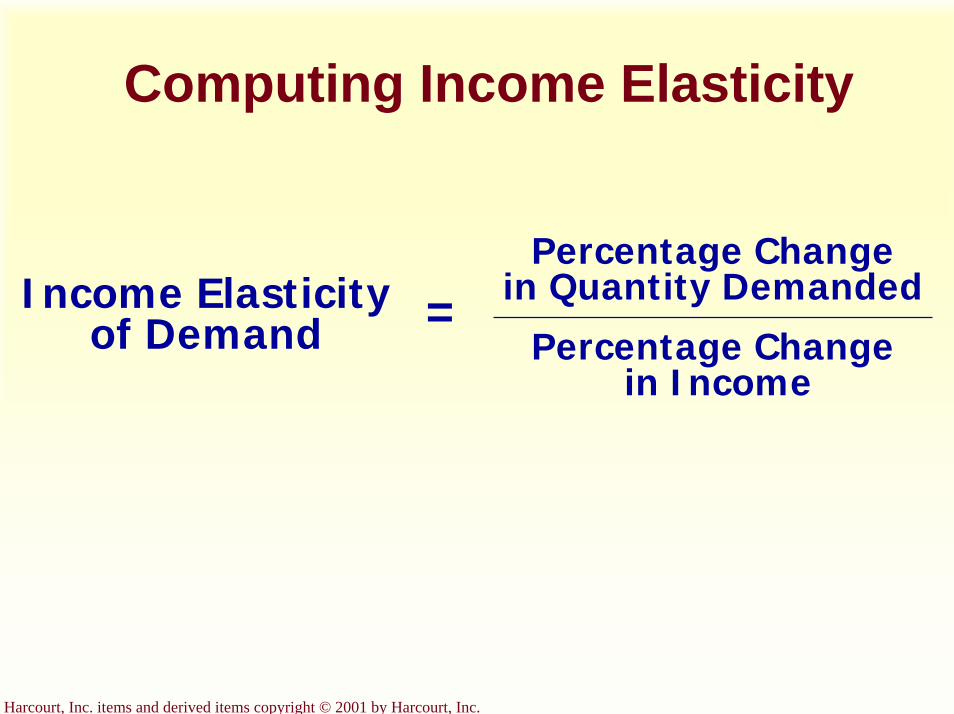
Computing Income Elasticity
Income Elasticityof Demand
Percentage Change in Quantity Demanded
Percentage Changein Income
=
Harcourt, Inc. items and derived items copyright © 2001 by Harcourt, Inc.
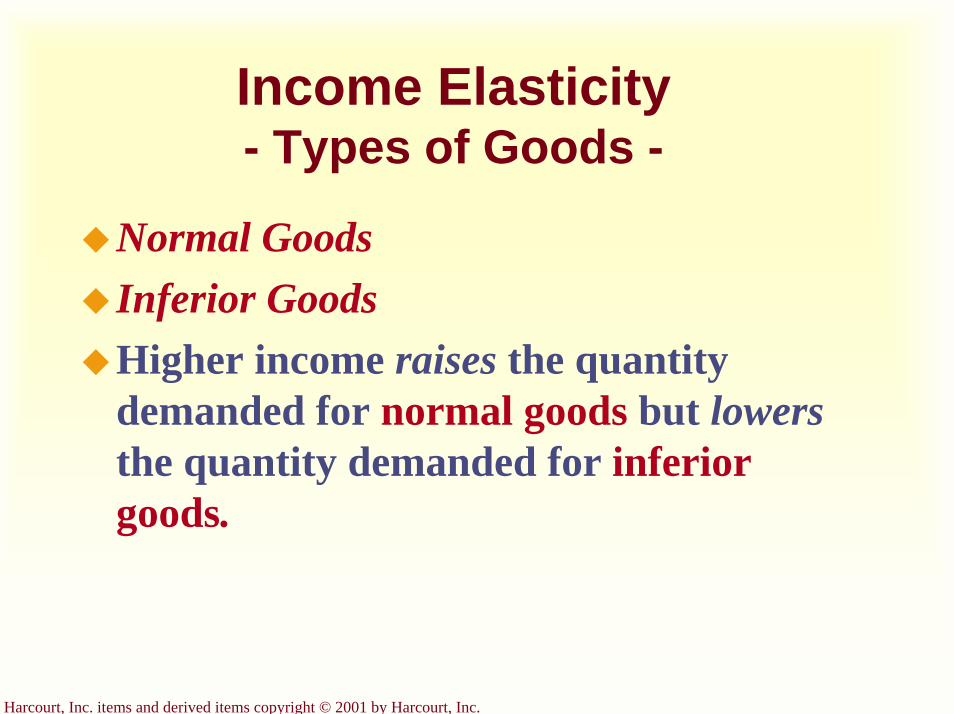
Income Elasticity- Types of Goods -
Normal GoodsInferior GoodsHigher income raises the quantity demanded for normal goods but lowers the quantity demanded for inferior goods.

Harcourt, Inc. items and derived items copyright © 2001 by Harcourt, Inc.
Income Elasticity- Types of Goods -
Goods consumers regard as necessities tend to be income inelasticExamples include food, fuel, clothing, utilities, and medical services.Goods consumers regard as luxuries tend to be income elastic.Examples include sports cars, furs, and expensive foods.
Harcourt, Inc. items and derived items copyright © 2001 by Harcourt, Inc.
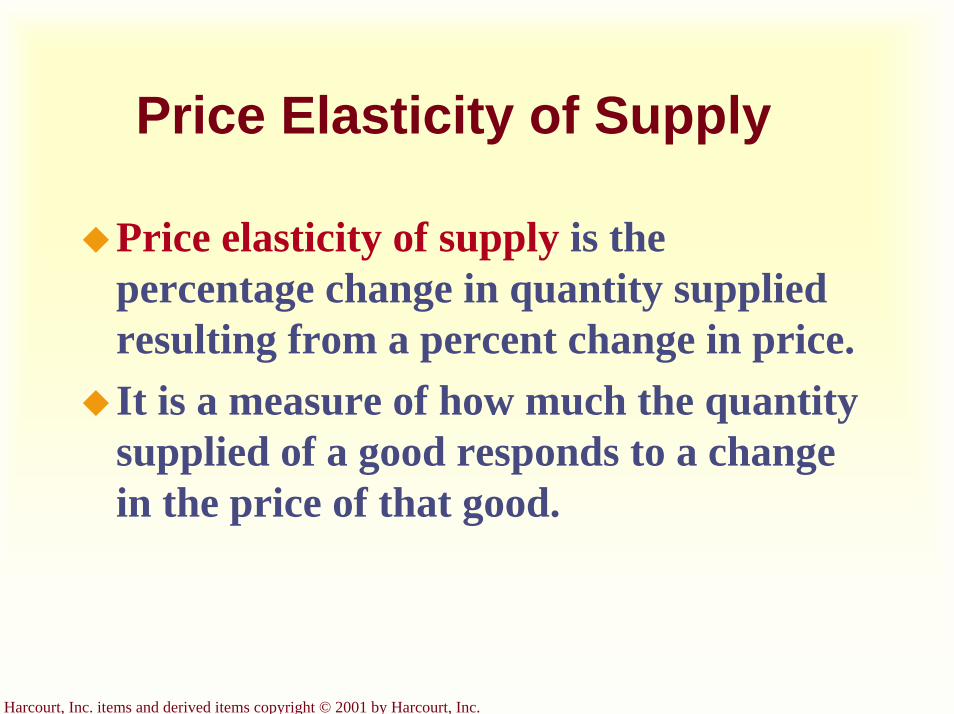
Price Elasticity of Supply
Price elasticity of supply is the percentage change in quantity supplied resulting from a percent change in price.It is a measure of how much the quantity supplied of a good responds to a change in the price of that good.
Harcourt, Inc. items and derived items copyright © 2001 by Harcourt, Inc.
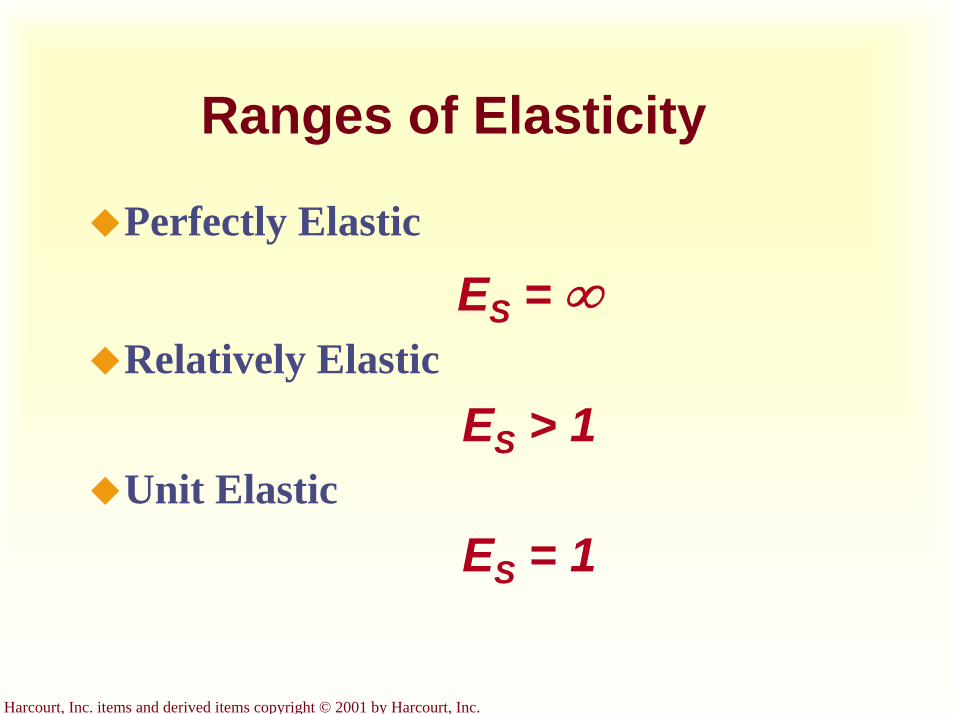
Ranges of Elasticity
Perfectly Elastic
ES = ∞Relatively Elastic
ES > 1Unit Elastic
ES = 1
Harcourt, Inc. items and derived items copyright © 2001 by Harcourt, Inc.
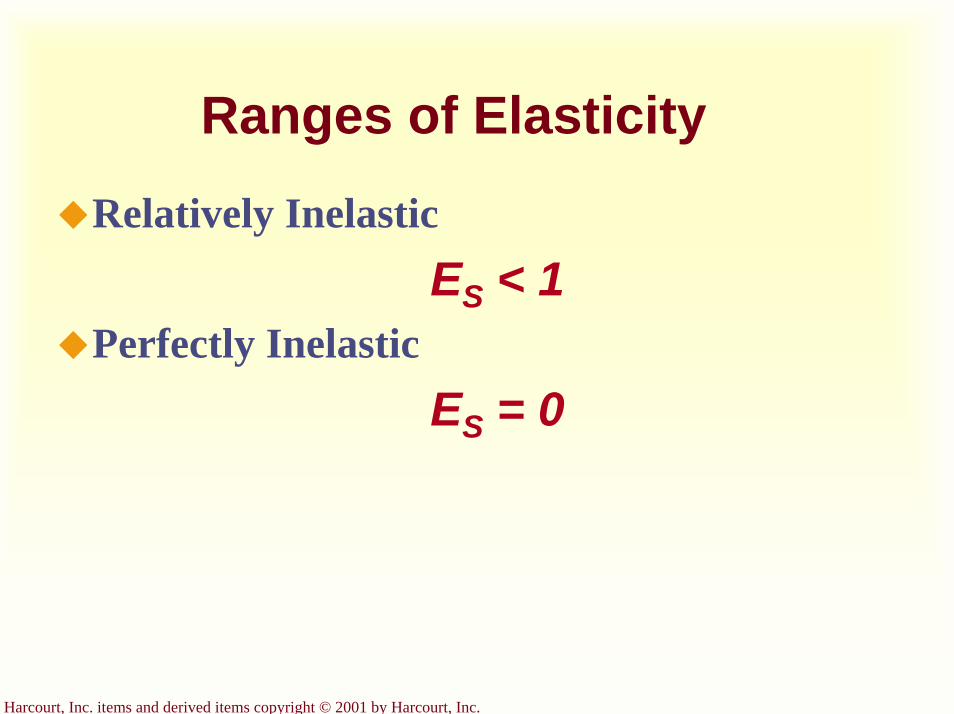
Ranges of Elasticity
Relatively InelasticES < 1
Perfectly InelasticES = 0
Harcourt, Inc. items and derived items copyright © 2001 by Harcourt, Inc.
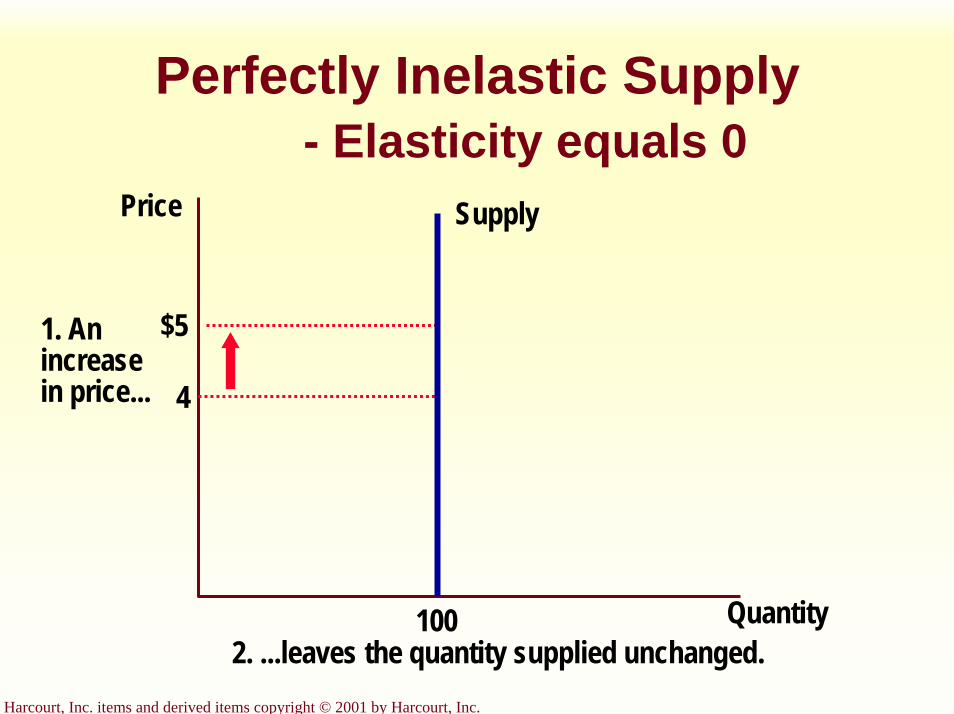
Perfectly Inelastic Supply- Elasticity equals 0
Quantity
Price
4
$5
Supply
1002. ...leaves the quantity supplied unchanged.
1. Anincreasein price...

Harcourt, Inc. items and derived items copyright © 2001 by Harcourt, Inc.
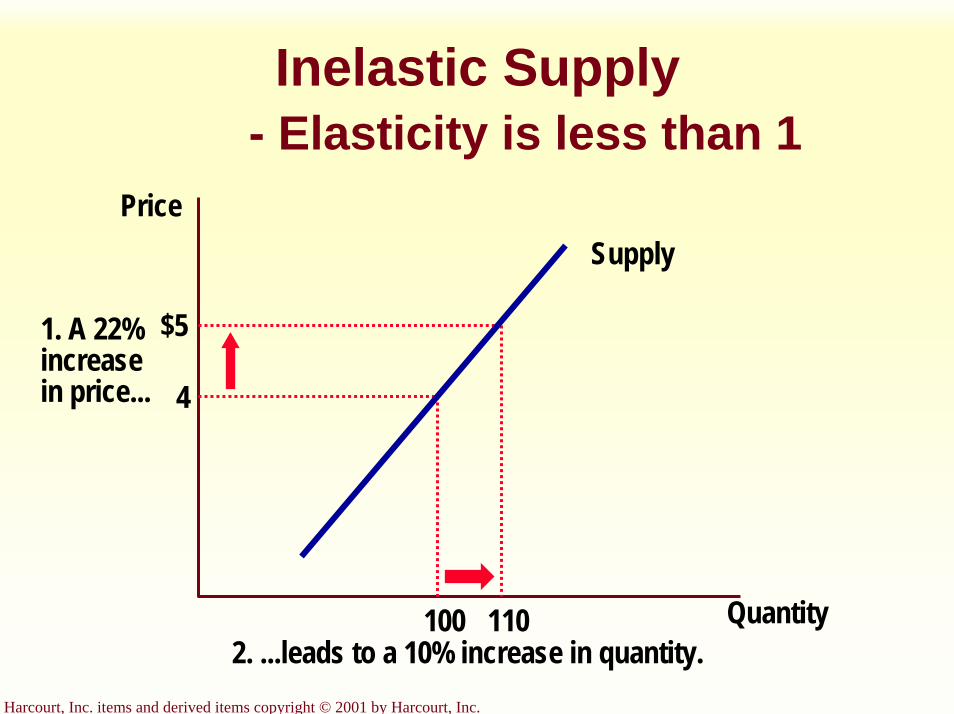
Inelastic Supply- Elasticity is less than 1
Quantity
Price
4
$51. A 22%increasein price...
110100
Supply
2. ...leads to a 10% increase in quantity.

Harcourt, Inc. items and derived items copyright © 2001 by Harcourt, Inc.
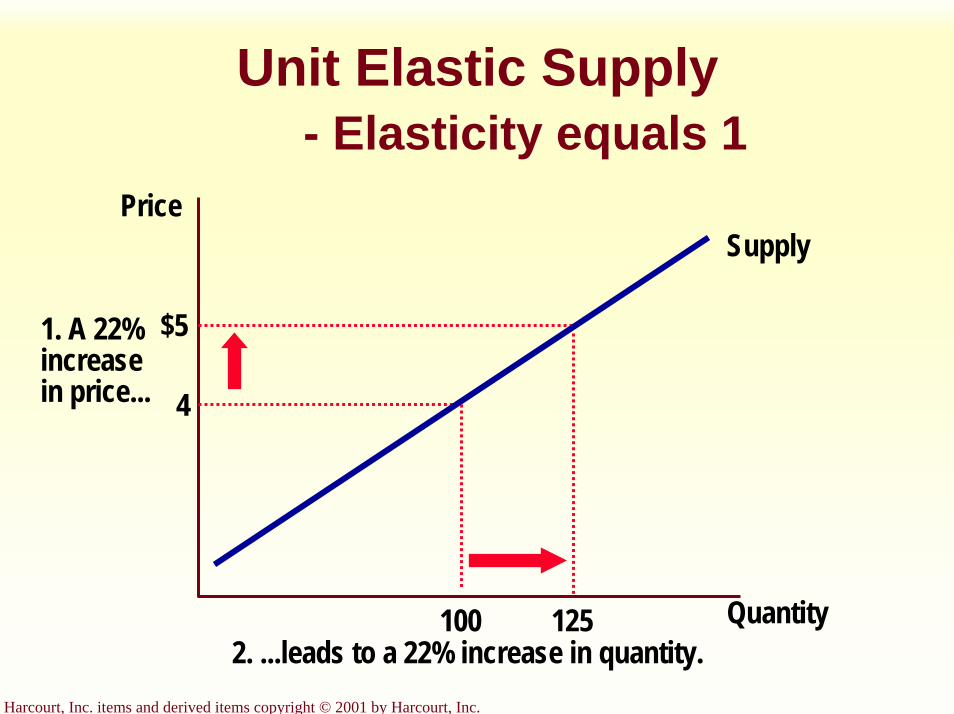
Unit Elastic Supply- Elasticity equals 1
Quantity
Price
4
$51. A 22%increasein price...
125100
Supply
2. ...leads to a 22% increase in quantity.

Harcourt, Inc. items and derived items copyright © 2001 by Harcourt, Inc.
Elastic Supply- Elasticity is greater than 1
Quantity
Price
4
$51. A 22%increasein price...
200100
Supply
2. ...leads to a 67% increase in quantity.

Harcourt, Inc. items and derived items copyright © 2001 by Harcourt, Inc.
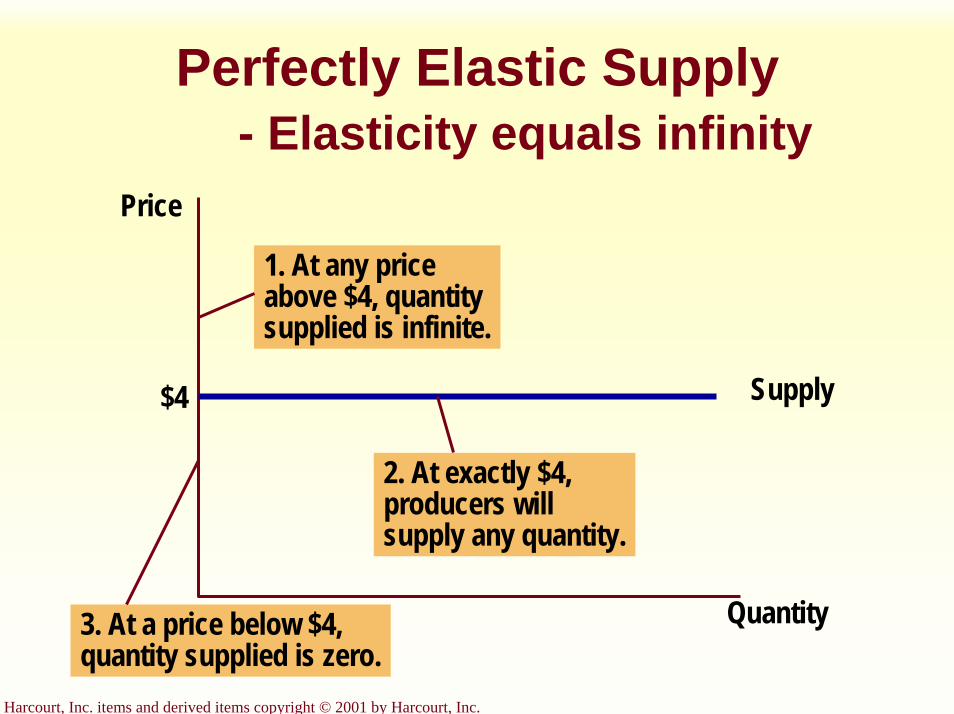
Perfectly Elastic Supply- Elasticity equals infinity
Quantity
Price
Supply$4
1. At any priceabove $4, quantitysupplied is infinite.
2. At exactly $4,producers willsupply any quantity.
3. At a price below $4,quantity supplied is zero.
Harcourt, Inc. items and derived items copyright © 2001 by Harcourt, Inc.
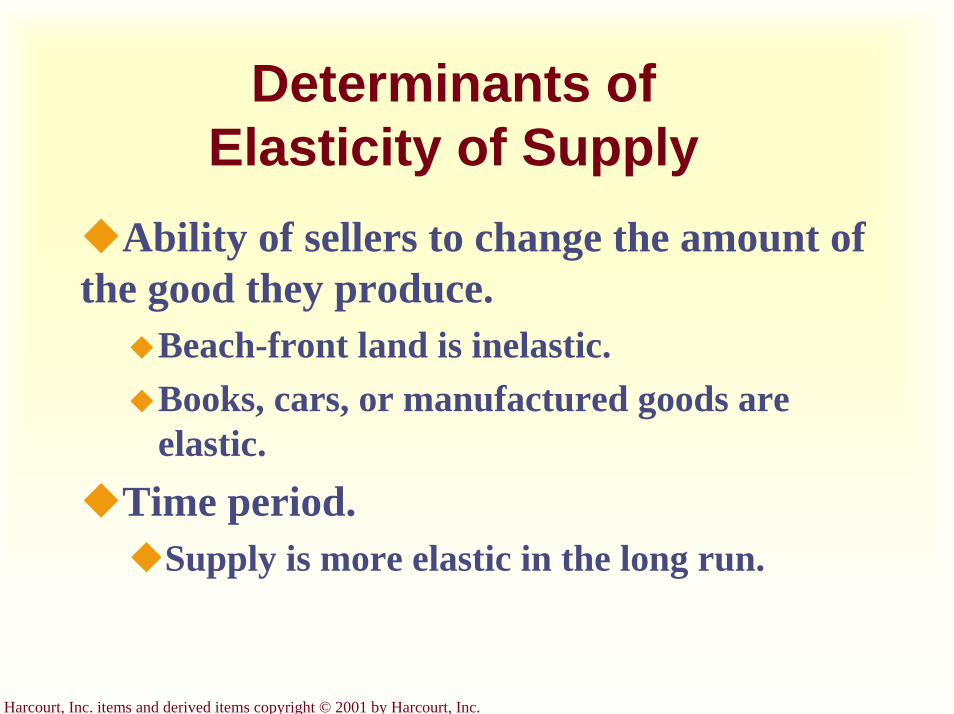
Determinants of Elasticity of Supply
Ability of sellers to change the amount of the good they produce.
Beach-front land is inelastic.Books, cars, or manufactured goods are elastic.
Time period. Supply is more elastic in the long run.
Harcourt, Inc. items and derived items copyright © 2001 by Harcourt, Inc.
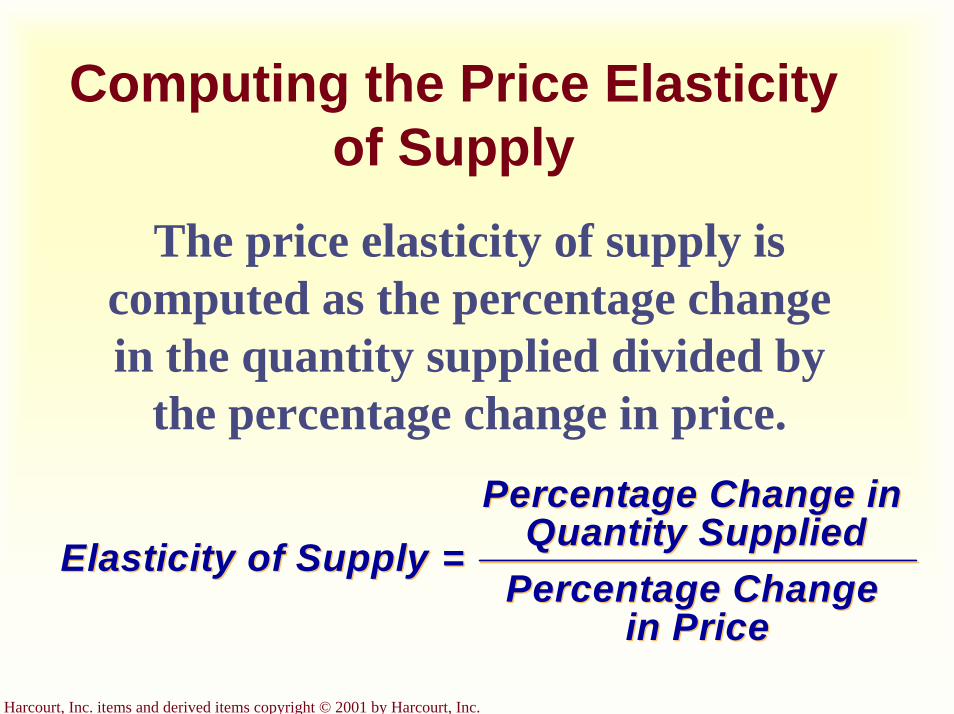
Computing the Price Elasticity of Supply
The price elasticity of supply is computed as the percentage change in the quantity supplied divided by
the percentage change in price.
Elasticity of Supply =Percentage Change in
Quantity SuppliedPercentage Change
in Price
Elasticity of Supply =Percentage Change in
Quantity SuppliedPercentage Change
in Price

Harcourt, Inc. items and derived items copyright © 2001 by Harcourt, Inc.
Application of Elasticity
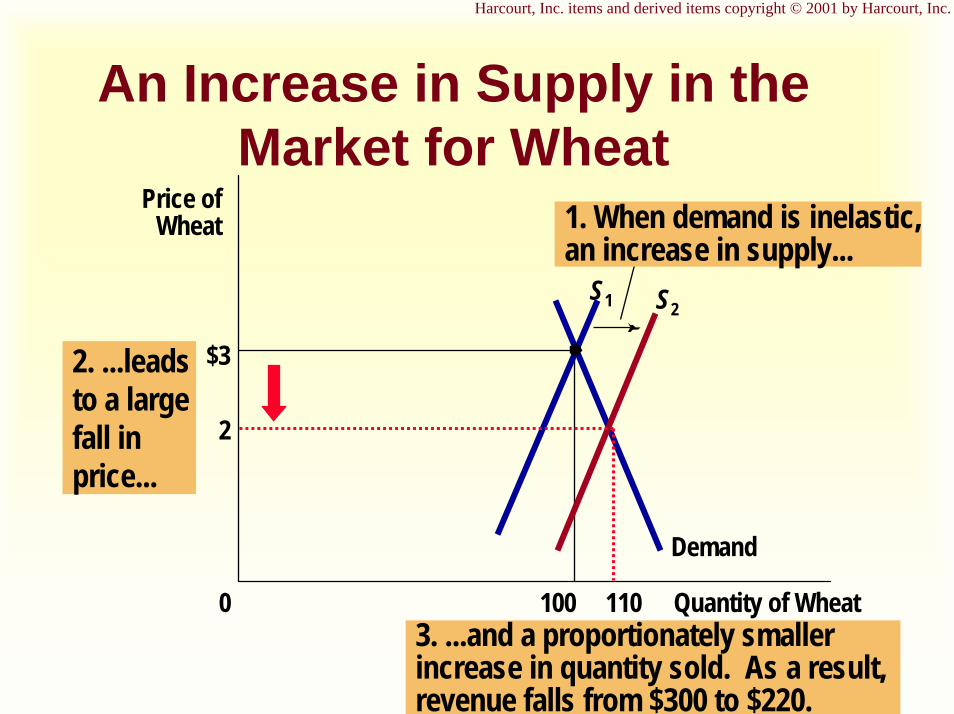
Can good news for farming be bad news for farmers?
What happens to wheat farmers and the market for wheat when university agronomists discover a new wheat hybridthat is more productive than existing varieties?
Harcourt, Inc. items and derived items copyright © 2001 by Harcourt, Inc.
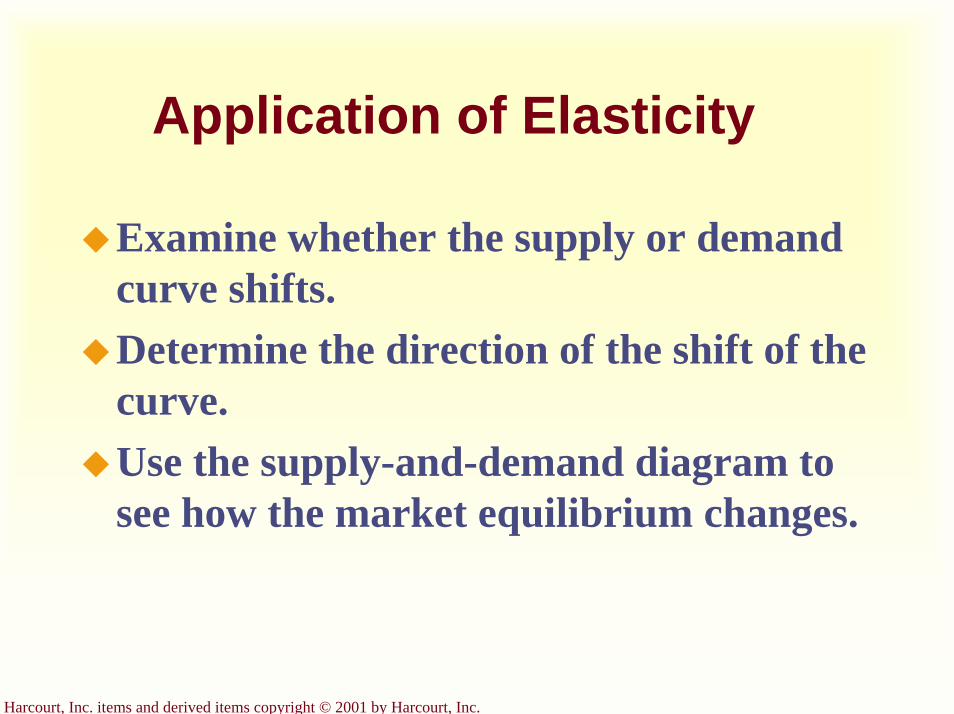
Application of Elasticity
Examine whether the supply or demand curve shifts.Determine the direction of the shift of the curve.Use the supply-and-demand diagram to see how the market equilibrium changes.

Harcourt, Inc. items and derived items copyright © 2001 by Harcourt, Inc.
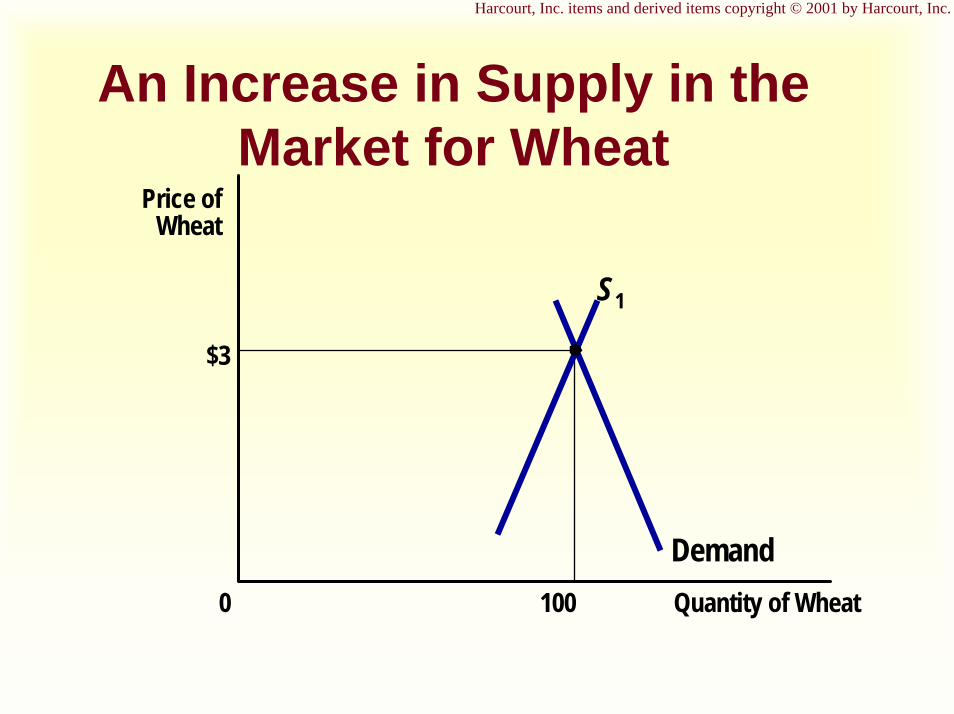
An Increase in Supply in the Market for Wheat
$3
Quantity of Wheat1000
Price ofWheat
Demand
S1
Harcourt, Inc. items and derived items copyright © 2001 by Harcourt, Inc.
3. ...and a proportionately smallerincrease in quantity sold. As a result,revenue falls from $300 to $220.
An Increase in Supply in the Market for Wheat
$3
Quantity of Wheat1000
Price ofWheat 1. When demand is inelastic,
an increase in supply...
Demand
S1 S2
2
110
2. ...leadsto a large fall in price...
Harcourt, Inc. items and derived items copyright © 2001 by Harcourt, Inc.
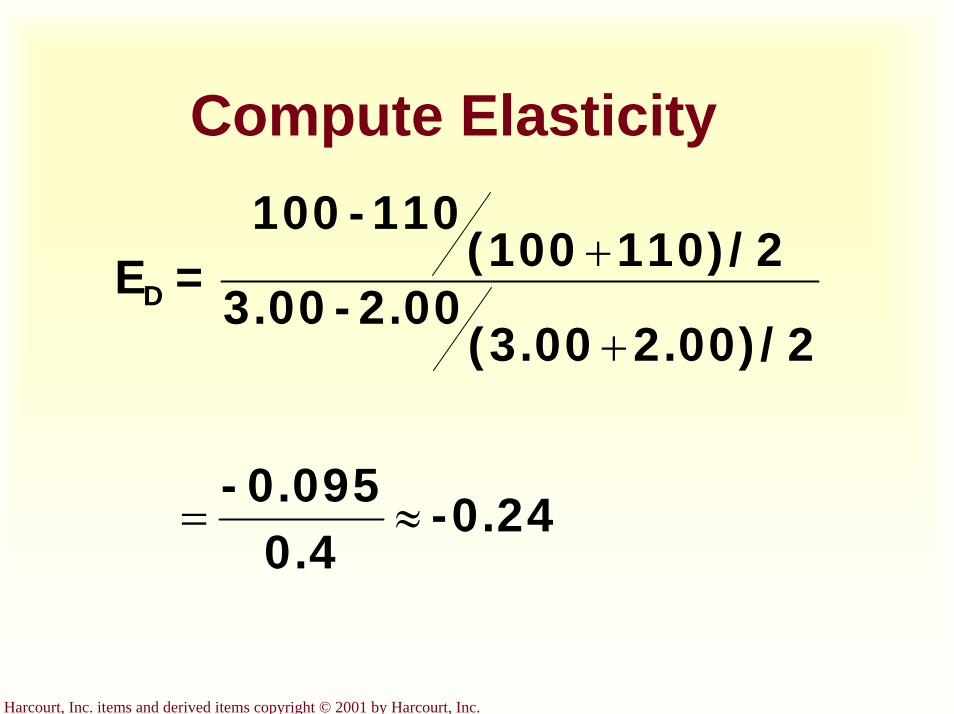
Compute Elasticity
-0.240.4
0.095-
2.00)/2(3.002.00-3.00
110)/2(100110-100
=ED
≈=
+
+
Harcourt, Inc. items and derived items copyright © 2001 by Harcourt, Inc.
Compute Elasticity
-0.240.4
0.095-
2.00)/2(3.002.00-3.00
110)/2(100110-100
=ED
≈=
+
+
Demand is inelastic
Harcourt, Inc. items and derived items copyright © 2001 by Harcourt, Inc.
Summary
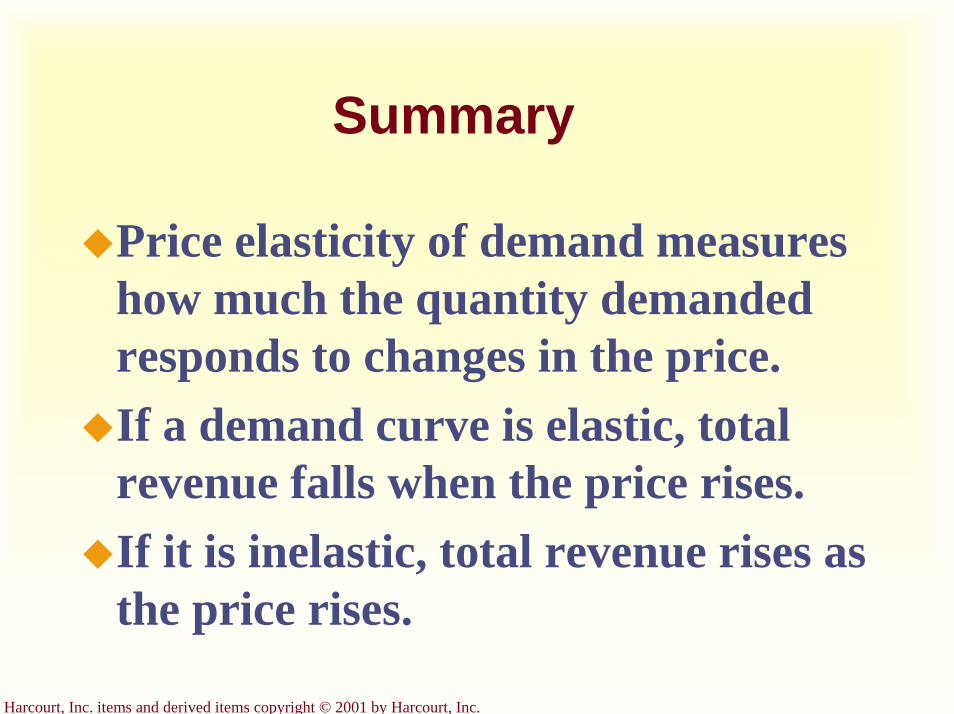
Price elasticity of demand measures how much the quantity demanded responds to changes in the price. If a demand curve is elastic, total revenue falls when the price rises. If it is inelastic, total revenue rises as the price rises.
Harcourt, Inc. items and derived items copyright © 2001 by Harcourt, Inc.
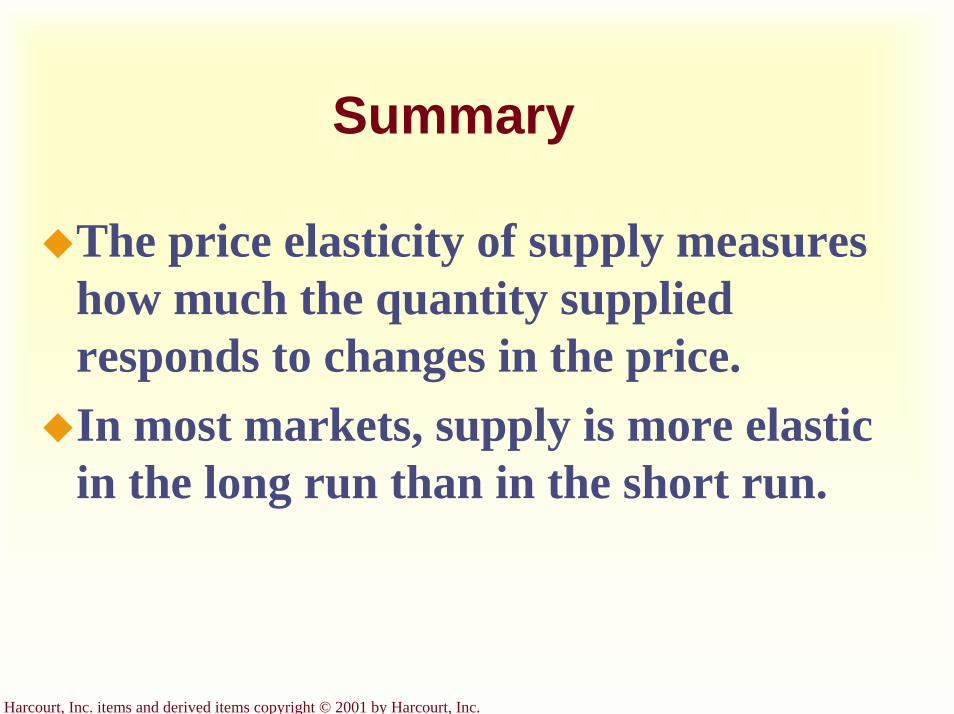
Summary
The price elasticity of supply measures how much the quantity supplied responds to changes in the price. In most markets, supply is more elastic in the long run than in the short run.

Harcourt, Inc. items and derived items copyright © 2001 by Harcourt, Inc.
Graphical Review
Harcourt, Inc. items and derived items copyright © 2001 by Harcourt, Inc.
Computing the Price Elasticity of Demand
Demand is price elastic
$54 Demand
Quantity1000
Price
50
-3percent 22-percent 67
5.00)/2(4.005.00)-(4.00
50)/2(10050)-(100
ED
==
+
+=

Harcourt, Inc. items and derived items copyright © 2001 by Harcourt, Inc.
Perfectly Inelastic Demand- Elasticity equals 0
Quantity
Price
4
$5
Demand
1002. ...leaves the quantity demanded unchanged.
1. Anincreasein price...
Harcourt, Inc. items and derived items copyright © 2001 by Harcourt, Inc.
Inelastic Demand- Elasticity is less than 1
Quantity
Price
4
$51. A 22%increasein price...
Demand
100902. ...leads to a 11% decrease in quantity.
Harcourt, Inc. items and derived items copyright © 2001 by Harcourt, Inc.
Unit Elastic Demand- Elasticity equals 1
Quantity
Price
4
$51. A 22%increasein price...
Demand
100802. ...leads to a 22% decrease in quantity.

Harcourt, Inc. items and derived items copyright © 2001 by Harcourt, Inc.
Elastic Demand- Elasticity is greater than 1
Quantity
Price
4
$51. A 22%increasein price...
Demand
100502. ...leads to a 67% decrease in quantity.
Harcourt, Inc. items and derived items copyright © 2001 by Harcourt, Inc.
Perfectly Elastic Demand- Elasticity equals infinity
Quantity
Price
Demand$4
1. At any priceabove $4, quantitydemanded is zero.
2. At exactly $4,consumers willbuy any quantity.
3. At a price below $4,quantity demanded is infinite.
Harcourt, Inc. items and derived items copyright © 2001 by Harcourt, Inc.
Elasticity and Total Revenue
$4
Demand
Quantity
P
0
Price
P P xx Q Q == $400$400(total revenue)(total revenue)
100Q

Harcourt, Inc. items and derived items copyright © 2001 by Harcourt, Inc.
Elasticity and Total Revenue: Inelastic Demand
$3
Quantity0
Price
80
Revenue = $240 Demand$1 Demand
Quantity0Revenue = $100
100
PriceAn increase in price
from $1 to $3...
…leads to an increasein total revenue
from$100 to $240
Harcourt, Inc. items and derived items copyright © 2001 by Harcourt, Inc.
Elasticity and Total Revenue: Elastic Demand
Demand
Quantity0
Price
$4
50
Demand
Quantity0
Price
Revenue = $100
$5
20
Revenue = $200
An increase in price from $4 to $5...
…leads to a decreasein total revenue
from$200 to $100

Harcourt, Inc. items and derived items copyright © 2001 by Harcourt, Inc.
Perfectly Inelastic Supply- Elasticity equals 0
Quantity
Price
4
$5
Supply
1002. ...leaves the quantity supplied unchanged.
1. Anincreasein price...
Harcourt, Inc. items and derived items copyright © 2001 by Harcourt, Inc.
Inelastic Supply- Elasticity is less than 1
Quantity
Price
4
$51. A 22%increasein price...
110100
Supply
2. ...leads to a 10% increase in quantity.
Harcourt, Inc. items and derived items copyright © 2001 by Harcourt, Inc.
Unit Elastic Supply- Elasticity equals 1
Quantity
Price
4
$51. A 22%increasein price...
125100
Supply
2. ...leads to a 22% increase in quantity.
Harcourt, Inc. items and derived items copyright © 2001 by Harcourt, Inc.
Elastic Supply- Elasticity is greater than 1
Quantity
Price
4
$51. A 22%increasein price...
200100
Supply
2. ...leads to a 67% increase in quantity.
Harcourt, Inc. items and derived items copyright © 2001 by Harcourt, Inc.
Perfectly Elastic Supply- Elasticity equals infinity
Quantity
Price
Supply$4
1. At any priceabove $4, quantitysupplied is infinite.
2. At exactly $4,producers willsupply any quantity.
3. At a price below $4,quantity supplied is zero.
Harcourt, Inc. items and derived items copyright © 2001 by Harcourt, Inc.
An Increase in Supply in the Market for Wheat
$3
Quantity of Wheat1000
Price ofWheat
Demand
S1

Harcourt, Inc. items and derived items copyright © 2001 by Harcourt, Inc.
An Increase in Supply in the Market for Wheat
3. ...and a proportionately smallerincrease in quantity sold. As a result,revenue falls from $300 to $220.
$3
Quantity of Wheat1000
Price ofWheat 1. When demand is inelastic,
an increase in supply...
Demand
S1 S2
2
110
2. ...leadsto a large fall in price...
Supply, Demand and Government Policies
Chapter 6
Copyright © 2001 by Harcourt, Inc.
All rights reserved. Requests for permission to make copies of any part of thework should be mailed to:
Permissions Department, Harcourt College Publishers,6277 Sea Harbor Drive, Orlando, Florida 32887-6777.
Harcourt, Inc. items and derived items copyright © 2001 by Harcourt, Inc.
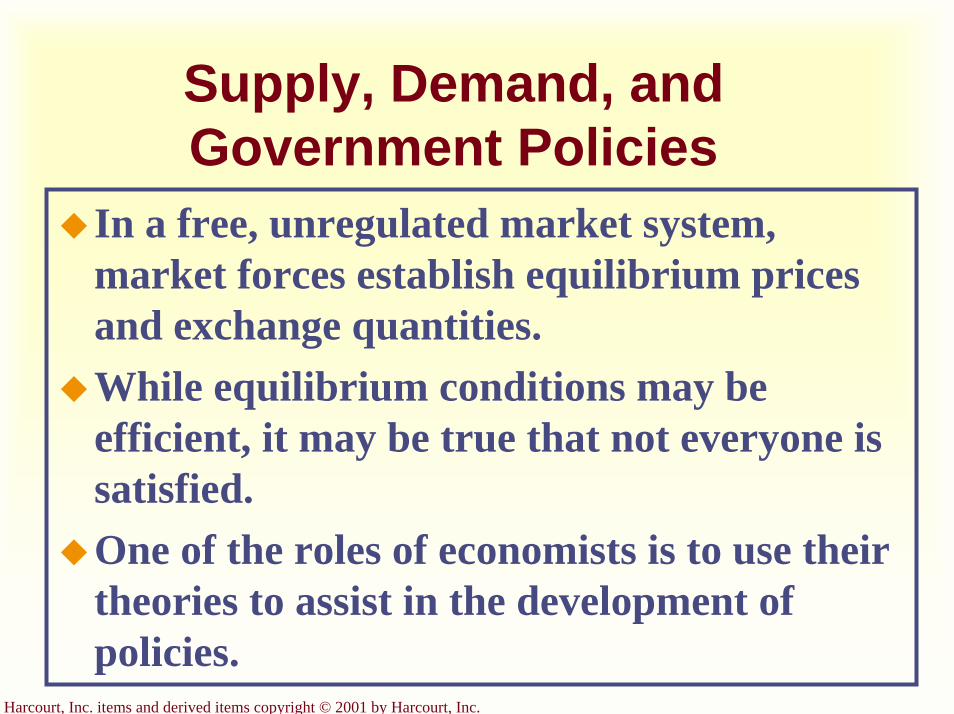
Supply, Demand, and Government Policies
In a free, unregulated market system, market forces establish equilibrium prices and exchange quantities.While equilibrium conditions may be efficient, it may be true that not everyone is satisfied. One of the roles of economists is to use their theories to assist in the development of policies.
Harcourt, Inc. items and derived items copyright © 2001 by Harcourt, Inc.
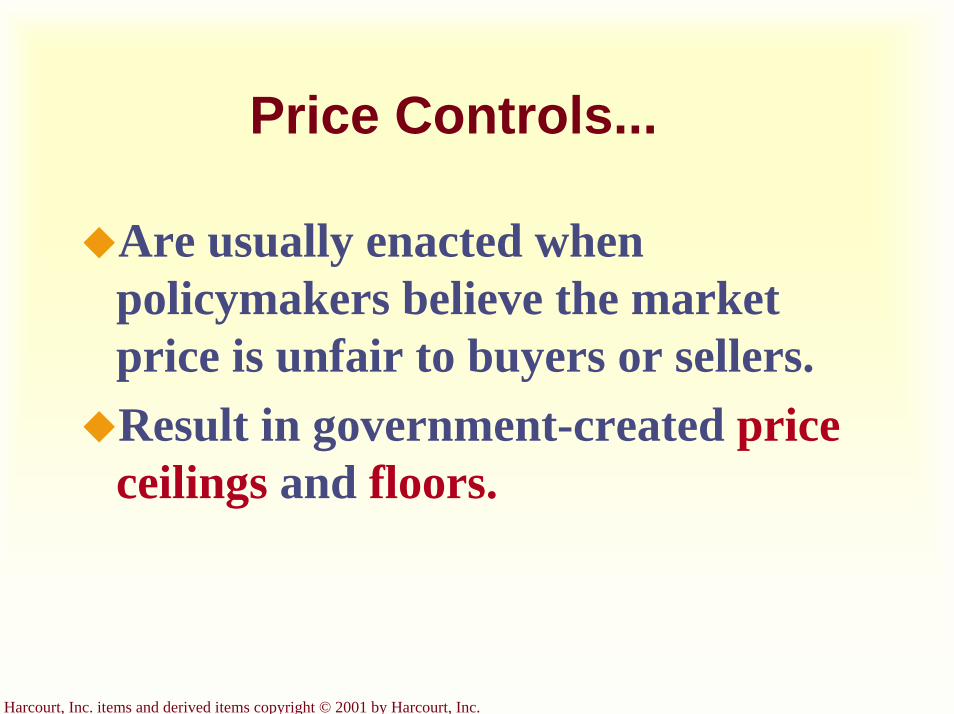
Price Controls...
Are usually enacted when policymakers believe the market price is unfair to buyers or sellers. Result in government-created price ceilings and floors.
Harcourt, Inc. items and derived items copyright © 2001 by Harcourt, Inc.
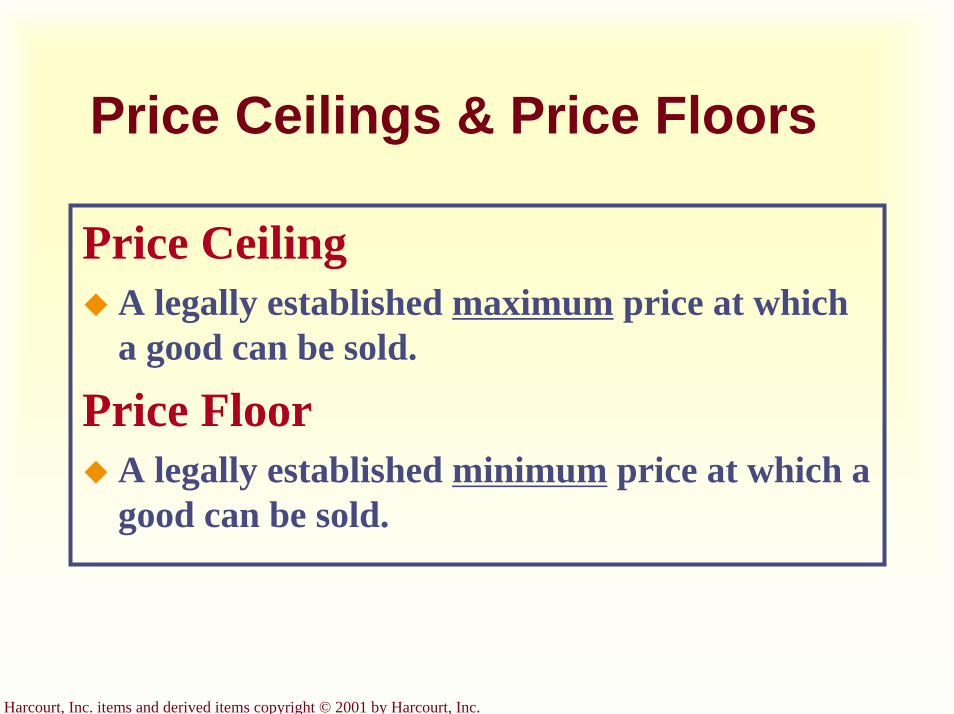
Price Ceilings & Price Floors
Price CeilingA legally established maximum price at which a good can be sold.
Price FloorA legally established minimum price at which a good can be sold.
Harcourt, Inc. items and derived items copyright © 2001 by Harcourt, Inc.
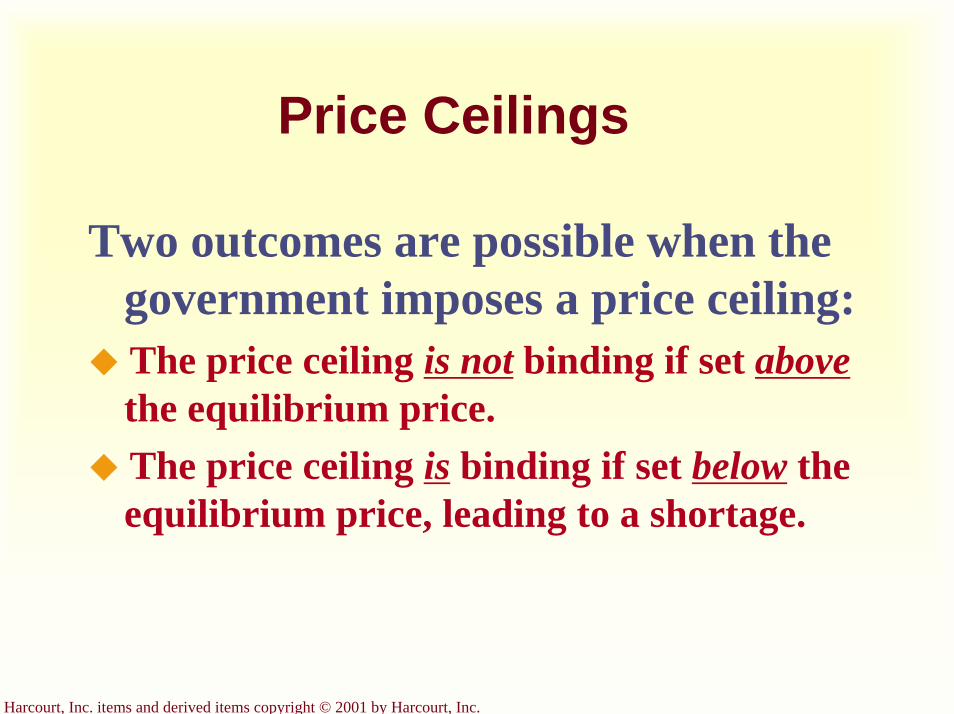
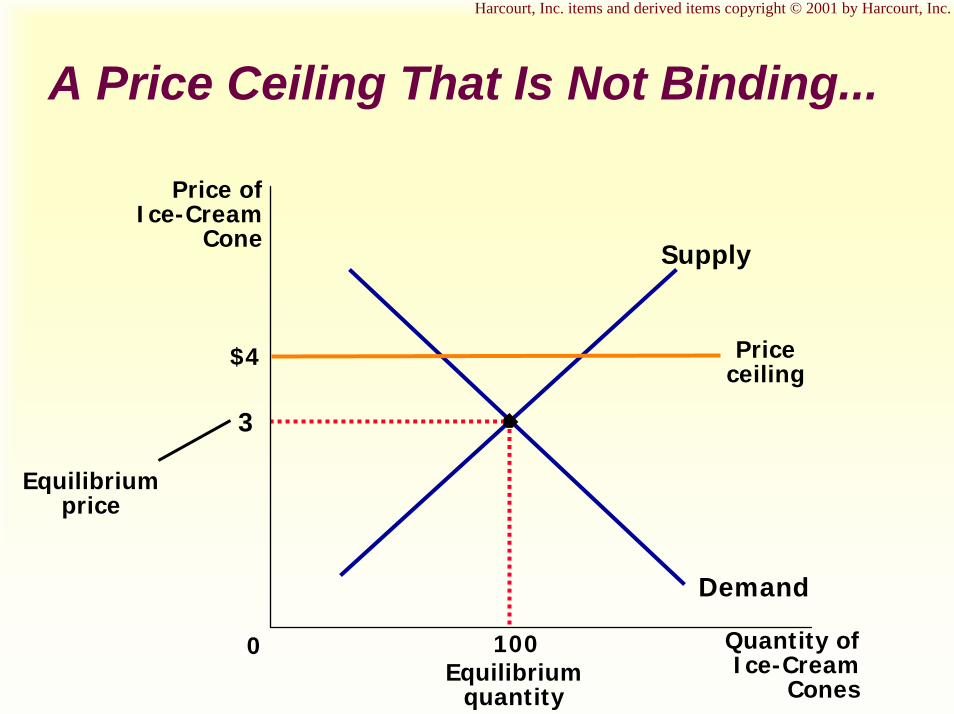
Price Ceilings
Two outcomes are possible when the government imposes a price ceiling:The price ceiling is not binding if set abovethe equilibrium price.The price ceiling is binding if set below the equilibrium price, leading to a shortage.
Harcourt, Inc. items and derived items copyright © 2001 by Harcourt, Inc.
A Price Ceiling That Is Not Binding...
$4
3
Quantity ofIce-Cream
Cones
0
Price ofIce-Cream
Cone
Demand
Supply
Priceceiling
Equilibriumprice
100Equilibrium
quantity

Harcourt, Inc. items and derived items copyright © 2001 by Harcourt, Inc.
A Price Ceiling That Is Binding...
$3
Quantity ofIce-Cream
Cones
0
Price ofIce-Cream
Cone
2
Demand
Supply
Equilibriumprice
Priceceiling
Shortage
125Quantity
demanded
75Quantitysupplied
Harcourt, Inc. items and derived items copyright © 2001 by Harcourt, Inc.
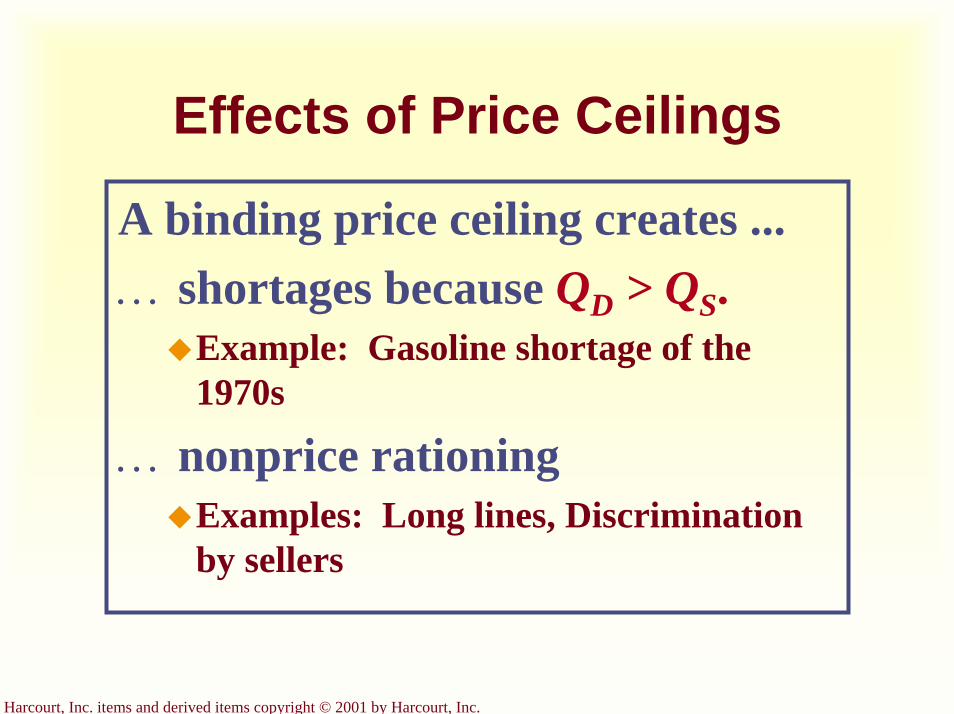
Effects of Price Ceilings
A binding price ceiling creates ...… shortages because QD > QS.
Example: Gasoline shortage of the 1970s
… nonprice rationingExamples: Long lines, Discrimination by sellers
Harcourt, Inc. items and derived items copyright © 2001 by Harcourt, Inc.
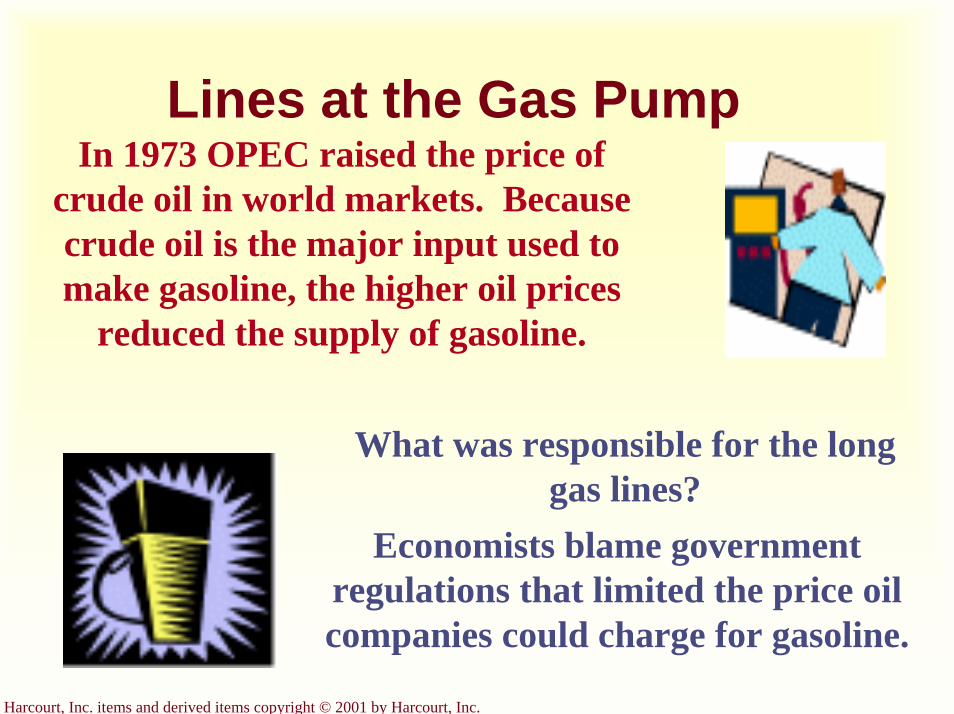
Lines at the Gas PumpIn 1973 OPEC raised the price of
crude oil in world markets. Because crude oil is the major input used to make gasoline, the higher oil prices
reduced the supply of gasoline.
What was responsible for the long gas lines?
Economists blame government regulations that limited the price oil companies could charge for gasoline.

Harcourt, Inc. items and derived items copyright © 2001 by Harcourt, Inc.
The Price Ceiling on Gasoline Is Not Binding...
$4
P1
Quantity ofGasoline
0
Price ofGasoline
Q1
Demand
Supply
Priceceiling
1. Initially, the price ceiling is not binding...

Harcourt, Inc. items and derived items copyright © 2001 by Harcourt, Inc.
The Price Ceiling on Gasoline Is Binding...
P1
Quantity ofGasoline
0
Price ofGasoline
Q1
Demand
S1
Priceceiling
S2 2. …but when supply falls...
P2
3. …the price ceiling becomes binding...4. …resulting
in a shortage.
Harcourt, Inc. items and derived items copyright © 2001 by Harcourt, Inc.
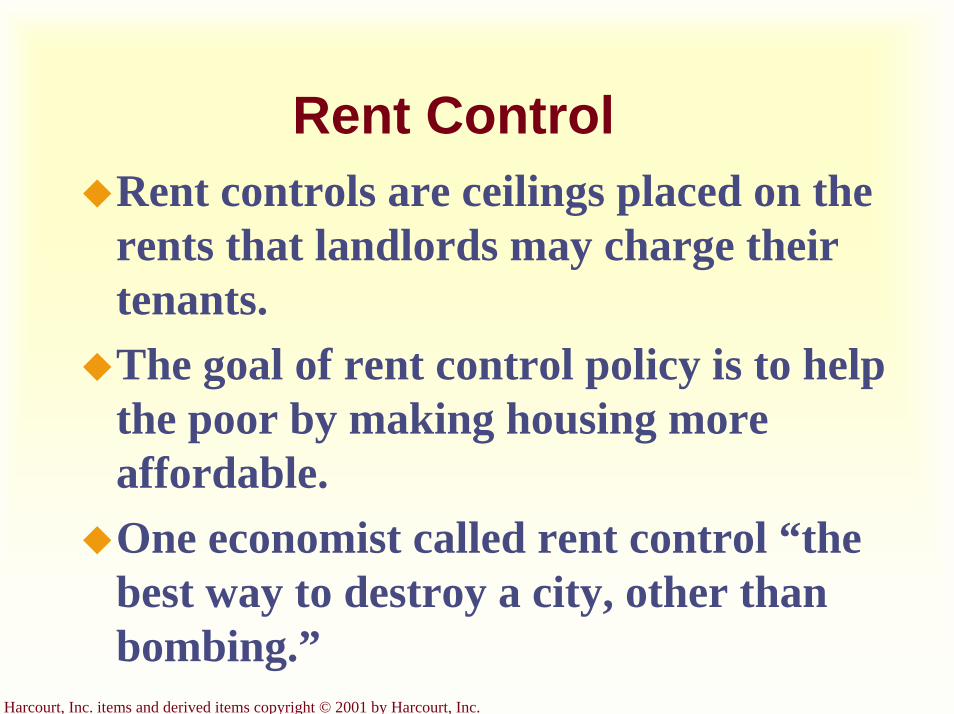
Rent ControlRent controls are ceilings placed on the rents that landlords may charge their tenants.The goal of rent control policy is to help the poor by making housing more affordable.One economist called rent control “the best way to destroy a city, other than bombing.”

Harcourt, Inc. items and derived items copyright © 2001 by Harcourt, Inc.
Rent Control in the Short Run...
Quantity ofApartments
0
Rental Price of
Apartment
Demand
Supply
Controlled rent
Shortage
Supply and demand for apartments
are relatively inelastic

Harcourt, Inc. items and derived items copyright © 2001 by Harcourt, Inc.
Rent Control in the Long Run...
Quantity ofApartments
0
Rental Price of
Apartment
Demand
Supply
Controlled rent
Shortage
Because the supply and demand for
apartments are more elastic...
…rent control causes a large
shortage
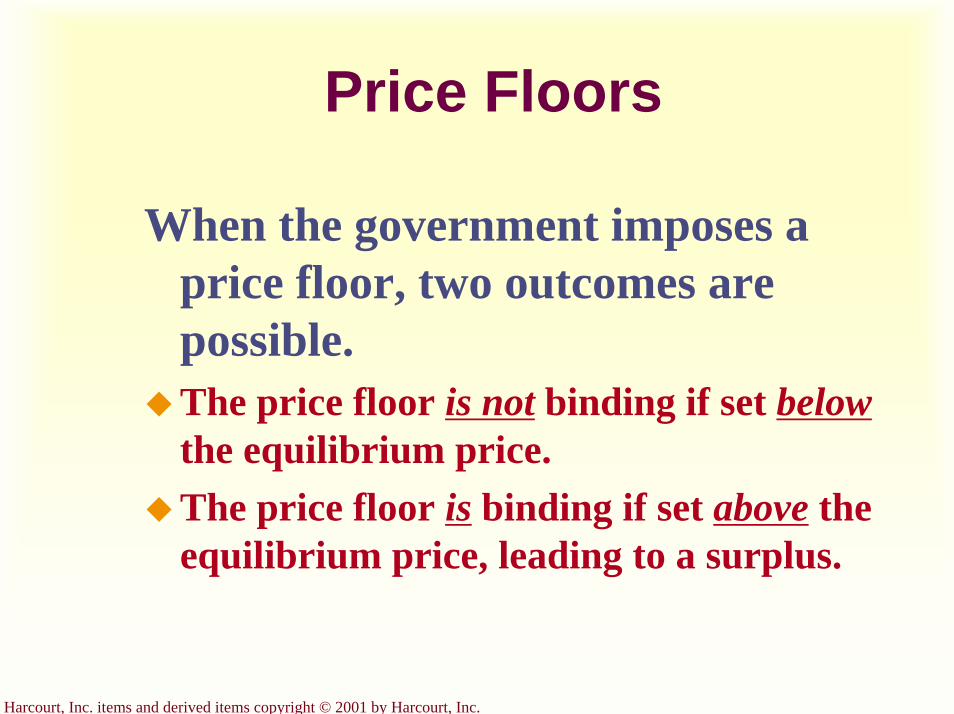
Harcourt, Inc. items and derived items copyright © 2001 by Harcourt, Inc.
Price Floors
When the government imposes a price floor, two outcomes are possible.The price floor is not binding if set belowthe equilibrium price.The price floor is binding if set above the equilibrium price, leading to a surplus.
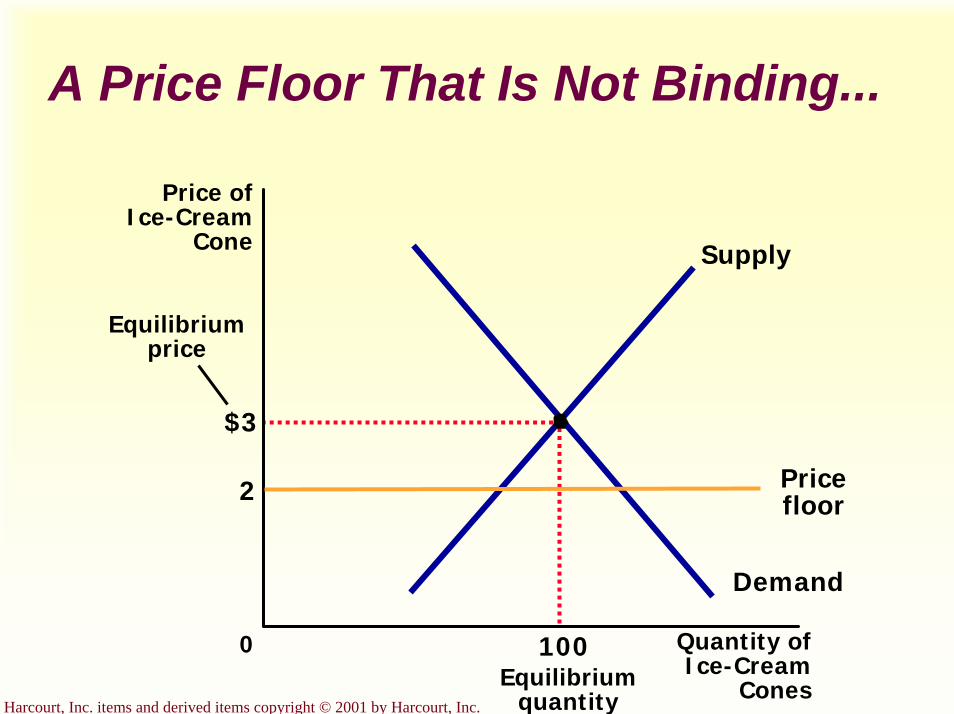
Harcourt, Inc. items and derived items copyright © 2001 by Harcourt, Inc.
A Price Floor That Is Not Binding...
$3
Quantity ofIce-Cream
Cones
0
Price ofIce-Cream
Cone
100Equilibrium
quantity
Equilibriumprice
Demand
Supply
Pricefloor2

Harcourt, Inc. items and derived items copyright © 2001 by Harcourt, Inc.
A Price Floor That Is Binding...
$3
Quantity ofIce-Cream
Cones
0
Price ofIce-Cream
Cone
Equilibriumprice
Demand
Supply
Price floor$4
120Quantitysupplied
80Quantity
demanded
Surplus
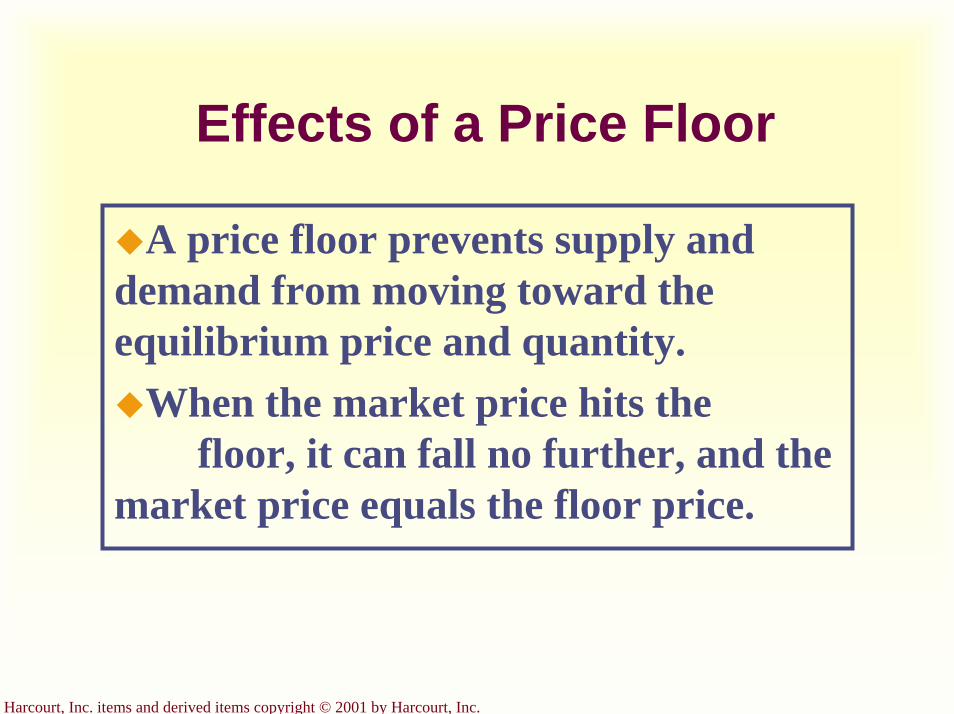
Harcourt, Inc. items and derived items copyright © 2001 by Harcourt, Inc.
Effects of a Price Floor
A price floor prevents supply and demand from moving toward the equilibrium price and quantity.
When the market price hits the floor, it can fall no further, and the
market price equals the floor price.
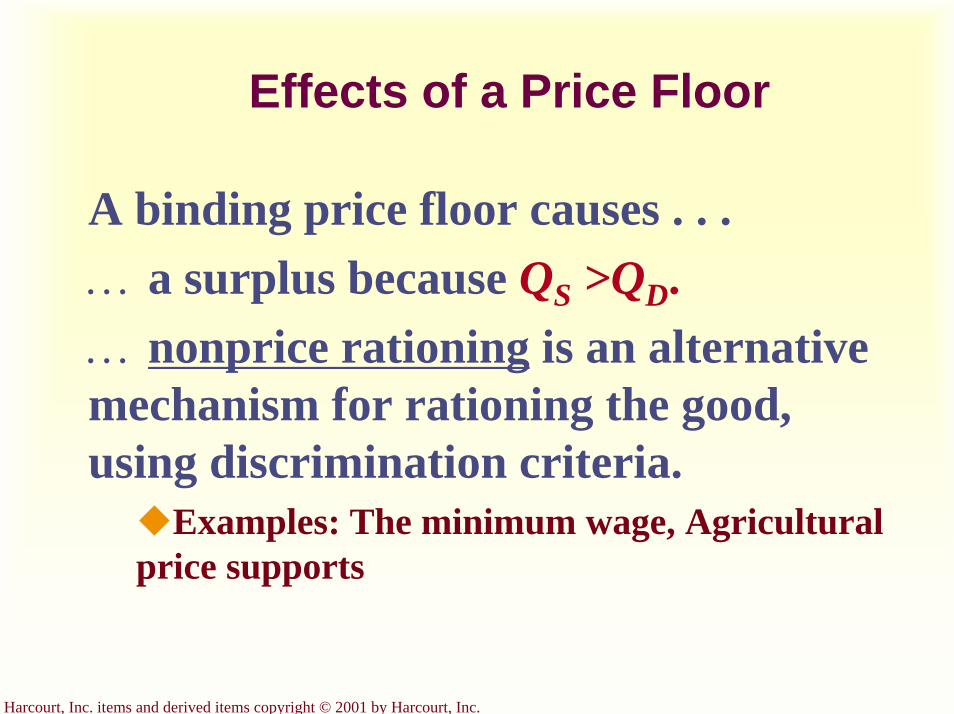
Harcourt, Inc. items and derived items copyright © 2001 by Harcourt, Inc.
Effects of a Price Floor
A binding price floor causes . . .… a surplus because QS >QD.… nonprice rationing is an alternative mechanism for rationing the good, using discrimination criteria.
Examples: The minimum wage, Agricultural price supports
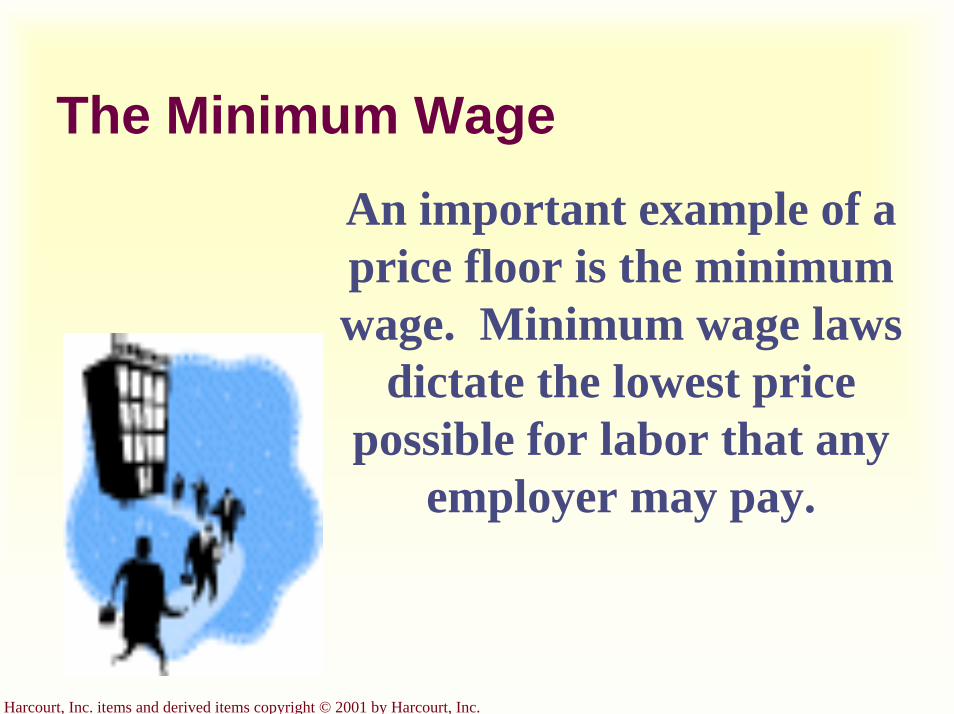
Harcourt, Inc. items and derived items copyright © 2001 by Harcourt, Inc.
The Minimum WageAn important example of a price floor is the minimum wage. Minimum wage laws
dictate the lowest price possible for labor that any
employer may pay.
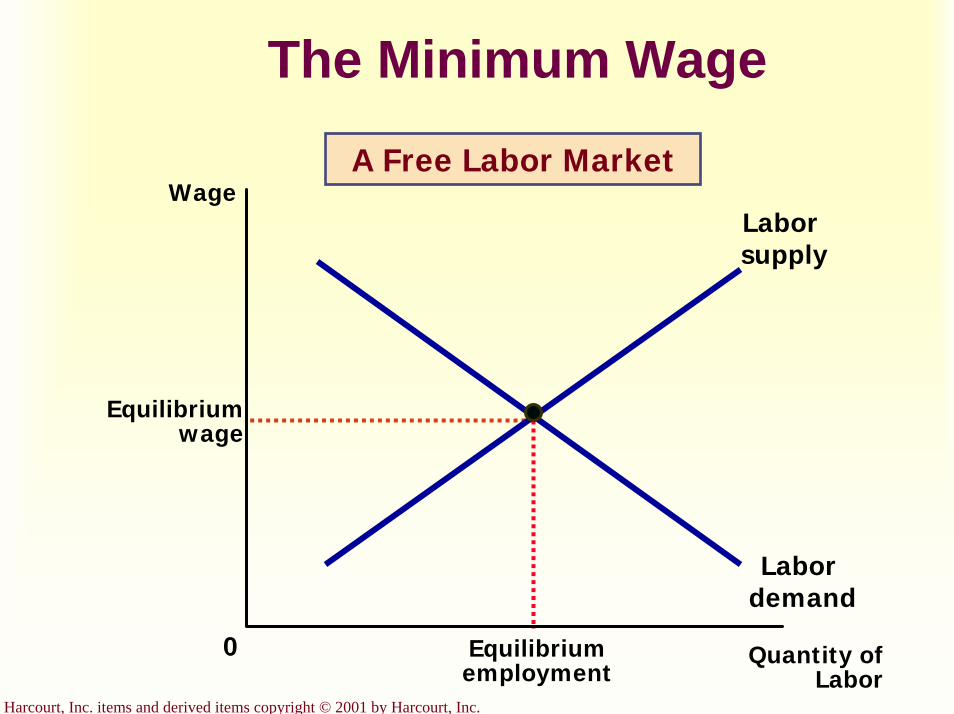
Harcourt, Inc. items and derived items copyright © 2001 by Harcourt, Inc.
The Minimum Wage
Quantity ofLabor
0
Wage
Equilibriumwage
Labor demand
Laborsupply
A Free Labor Market
Equilibriumemployment
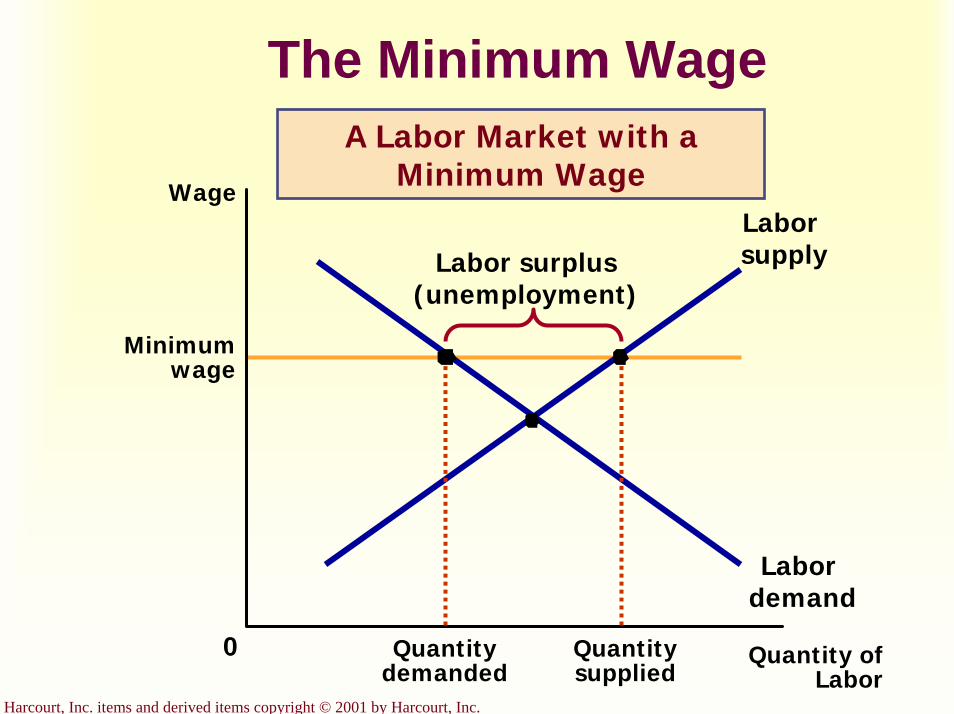
Harcourt, Inc. items and derived items copyright © 2001 by Harcourt, Inc.
The Minimum Wage
Minimumwage
Quantity ofLabor
0
Wage
Labor demand
Laborsupply
Quantitysupplied
Quantitydemanded
Labor surplus(unemployment)
A Labor Market with a Minimum Wage
Harcourt, Inc. items and derived items copyright © 2001 by Harcourt, Inc.
Taxes
Governments levy taxes to raise revenue for public
projects.

Harcourt, Inc. items and derived items copyright © 2001 by Harcourt, Inc.
What are some potential impacts of taxes?
Taxes discourage market activity.When a good is taxed, the quantity sold is smaller. Buyers and sellers share the tax burden.
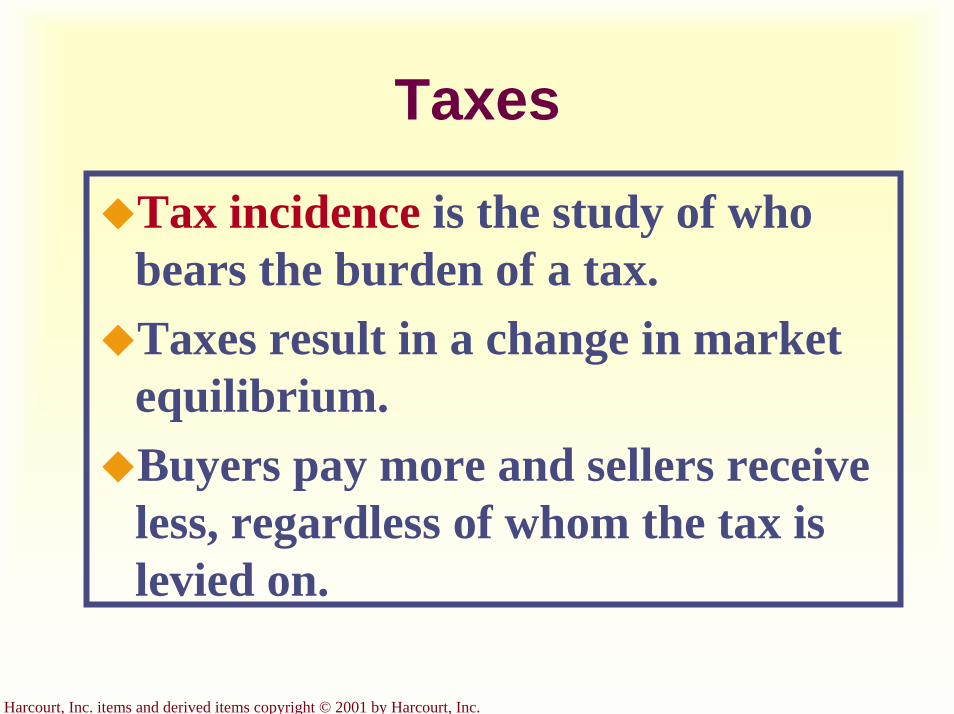
Harcourt, Inc. items and derived items copyright © 2001 by Harcourt, Inc.
Taxes
Tax incidence is the study of who bears the burden of a tax. Taxes result in a change in market equilibrium.Buyers pay more and sellers receive less, regardless of whom the tax is levied on.
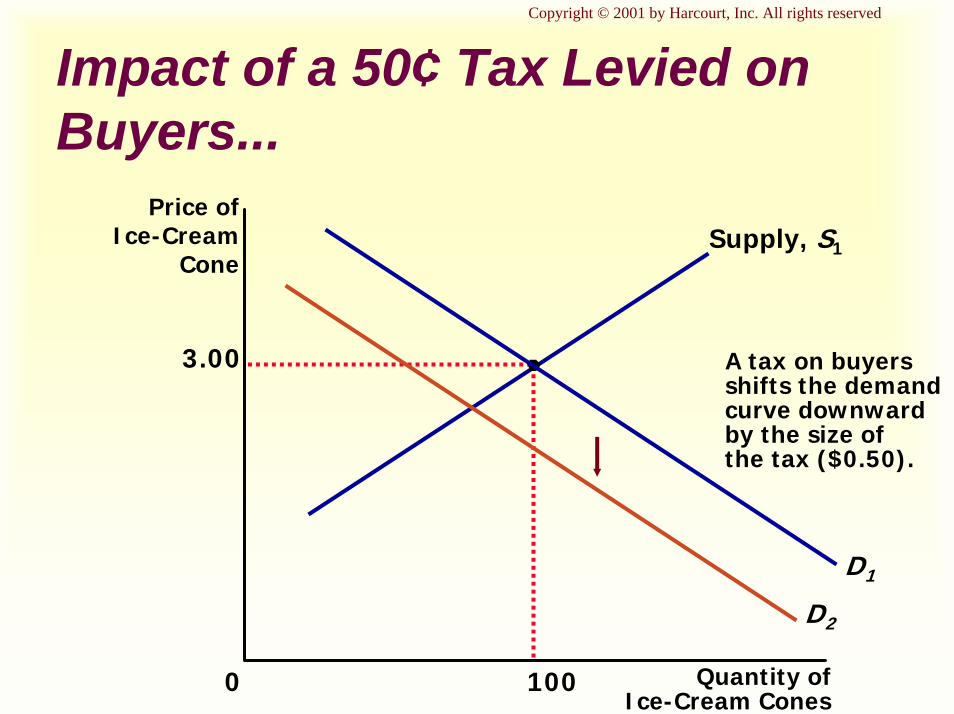
Copyright © 2001 by Harcourt, Inc. All rights reserved
Impact of a 50¢ Tax Levied on Buyers...
3.00
Quantity ofIce-Cream Cones
0
Price ofIce-Cream
Cone
100
D1
Supply, S1
A tax on buyersshifts the demandcurve downwardby the size ofthe tax ($0.50).
D2
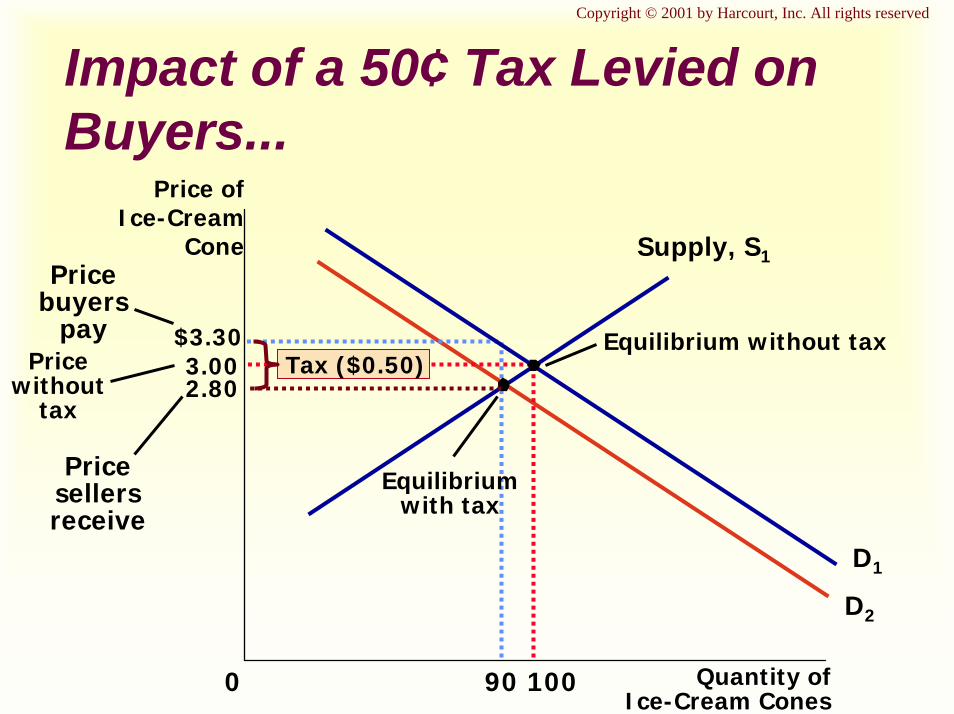
Copyright © 2001 by Harcourt, Inc. All rights reserved
Impact of a 50¢ Tax Levied on Buyers...
3.00
Quantity ofIce-Cream Cones
0
Price ofIce-Cream
Cone
10090
$3.30
Pricebuyers
pay
D1
D2
Equilibriumwith tax
Supply, S1
Equilibrium without tax
2.80
Pricesellersreceive
Pricewithout
tax
Tax ($0.50)
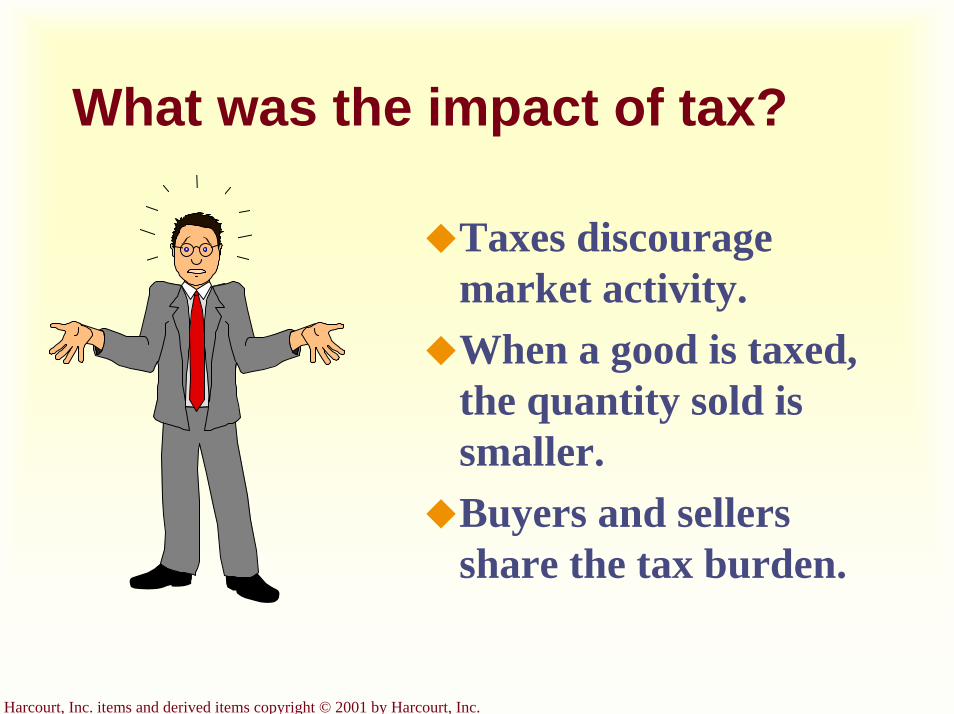
Harcourt, Inc. items and derived items copyright © 2001 by Harcourt, Inc.
What was the impact of tax?
Taxes discourage market activity.When a good is taxed, the quantity sold is smaller. Buyers and sellers share the tax burden.
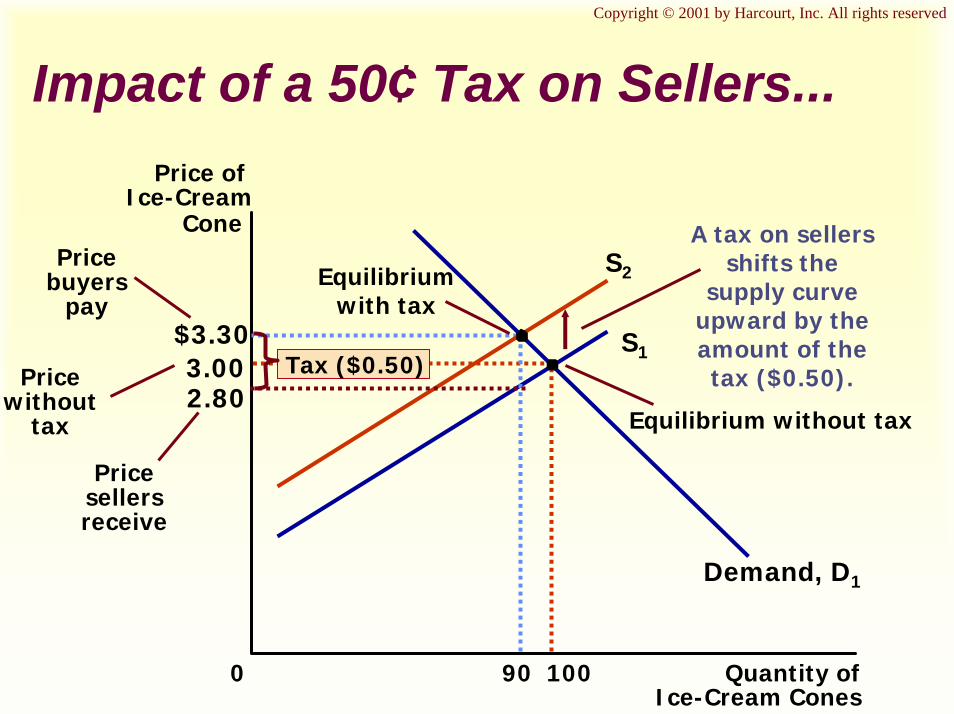
Copyright © 2001 by Harcourt, Inc. All rights reserved
Impact of a 50¢ Tax on Sellers...
3.00
Quantity ofIce-Cream Cones
0
Price ofIce-Cream
Cone
10090
S1
S2
Demand, D1
Price without
tax2.80
Price sellers receive
$3.30
Price buyers
pay
Equilibrium without tax
A tax on sellers shifts the
supply curve upward by the amount of the tax ($0.50).Tax ($0.50)
Equilibriumwith tax

Harcourt, Inc. items and derived items copyright © 2001 by Harcourt, Inc.
A Payroll Tax
Quantity ofLabor
0
Wage
Wage without tax
Labor demand
Laborsupply
Tax wedge
Wage firms pay
Wage workers receive
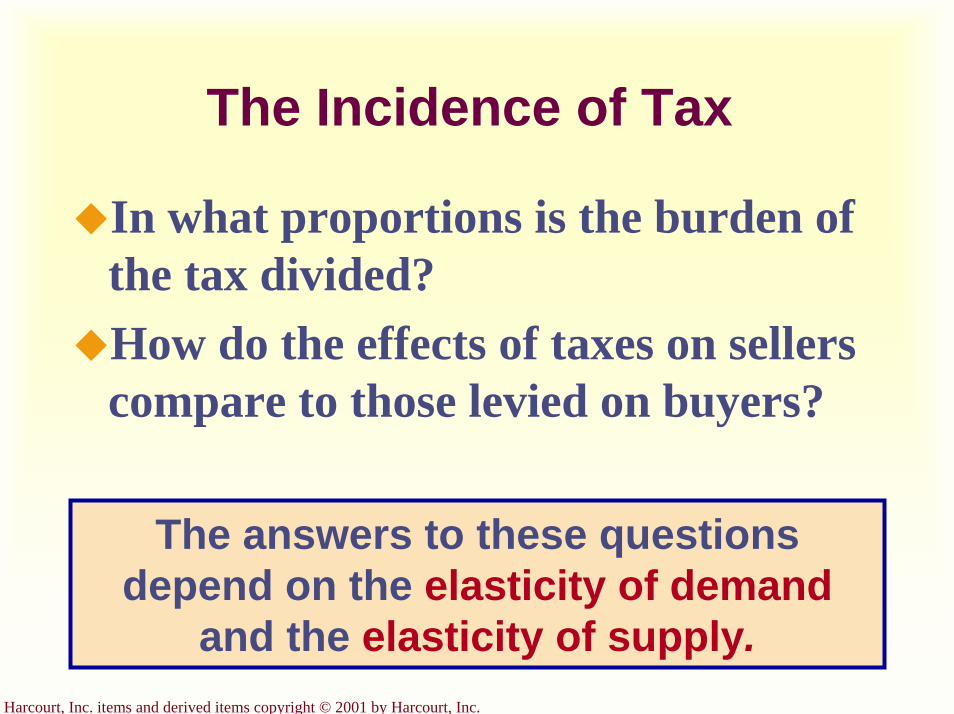
Harcourt, Inc. items and derived items copyright © 2001 by Harcourt, Inc.
The Incidence of Tax
In what proportions is the burden of the tax divided?How do the effects of taxes on sellers compare to those levied on buyers?
The answers to these questions depend on the elasticity of demand
and the elasticity of supply.

Harcourt, Inc. items and derived items copyright © 2001 by Harcourt, Inc.
Elastic Supply, Inelastic Demand...
Quantity0
Price
Demand
Supply
Tax
1. When supply is moreelastic than demand...
2. ...theincidence of thetax falls moreheavily onconsumers...
3. ...than onproducers.
Price without tax
Price buyers pay
Price sellers receive
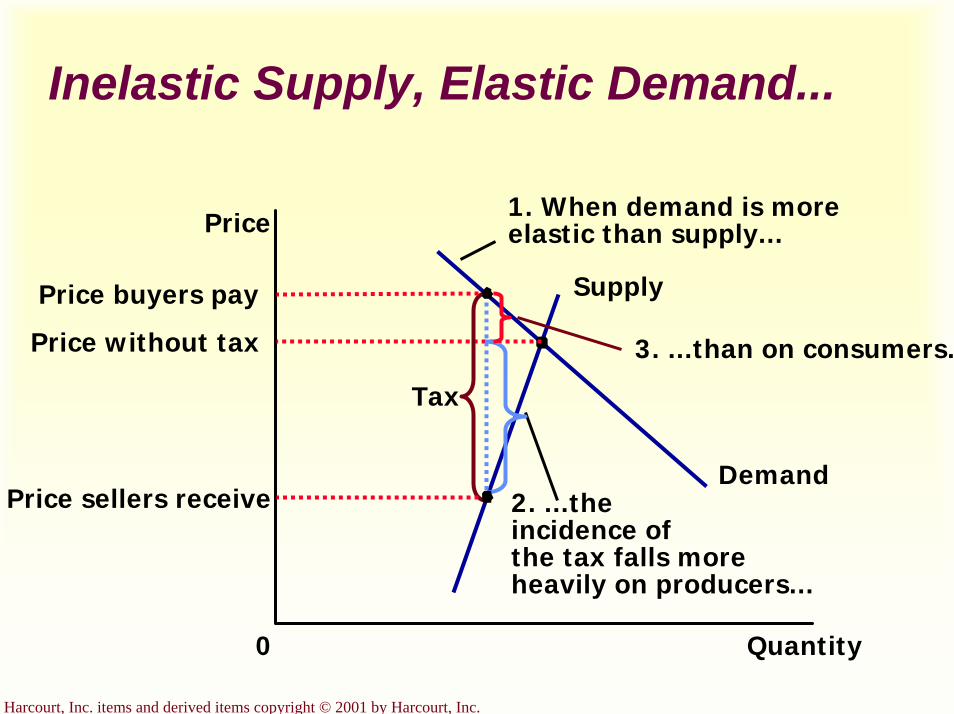
Harcourt, Inc. items and derived items copyright © 2001 by Harcourt, Inc.
Inelastic Supply, Elastic Demand...
Quantity0
Price
Demand
Supply
Price without tax
Tax
1. When demand is moreelastic than supply...
2. ...theincidence of the tax falls more heavily on producers...
3. ...than on consumers.
Price buyers pay
Price sellers receive
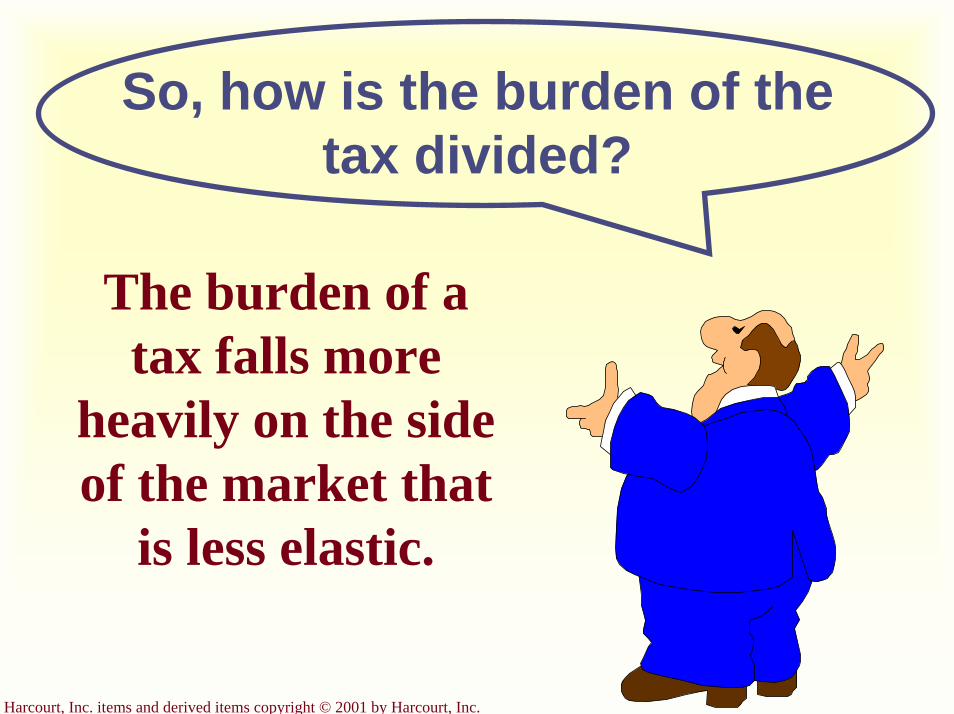
Harcourt, Inc. items and derived items copyright © 2001 by Harcourt, Inc.
So, how is the burden of the tax divided?
The burden of a tax falls more
heavily on the side of the market that
is less elastic.
Harcourt, Inc. items and derived items copyright © 2001 by Harcourt, Inc.
SummaryPrice controls include price ceilings and price floors.A price ceiling is a legal maximum on the price of a good or service. An example is rent control.A price floor is a legal minimum on the price of a good or a service. An example is the minimum wage.
Harcourt, Inc. items and derived items copyright © 2001 by Harcourt, Inc.
SummaryTaxes are used to raise revenue for public purposes.When the government levies a tax on a good, the equilibrium quantity of the good falls.A tax on a good places a wedge between the price paid by buyers and the price received by sellers.
Harcourt, Inc. items and derived items copyright © 2001 by Harcourt, Inc.
SummaryThe incidence of a tax refers to who bears the burden of a tax.The incidence of a tax does not depend on whether the tax is levied on buyers or sellers.The incidence of the tax depends on the price elasticities of supply and demand.

Harcourt, Inc. items and derived items copyright © 2001 by Harcourt, Inc.
Graphical Review

Harcourt, Inc. items and derived items copyright © 2001 by Harcourt, Inc.
A Price Ceiling That Is Not Binding...
$4
3
Quantity ofIce-Cream
Cones
0
Price ofIce-Cream
Cone
Demand
Supply
Priceceiling
Equilibriumprice
100Equilibrium
quantity
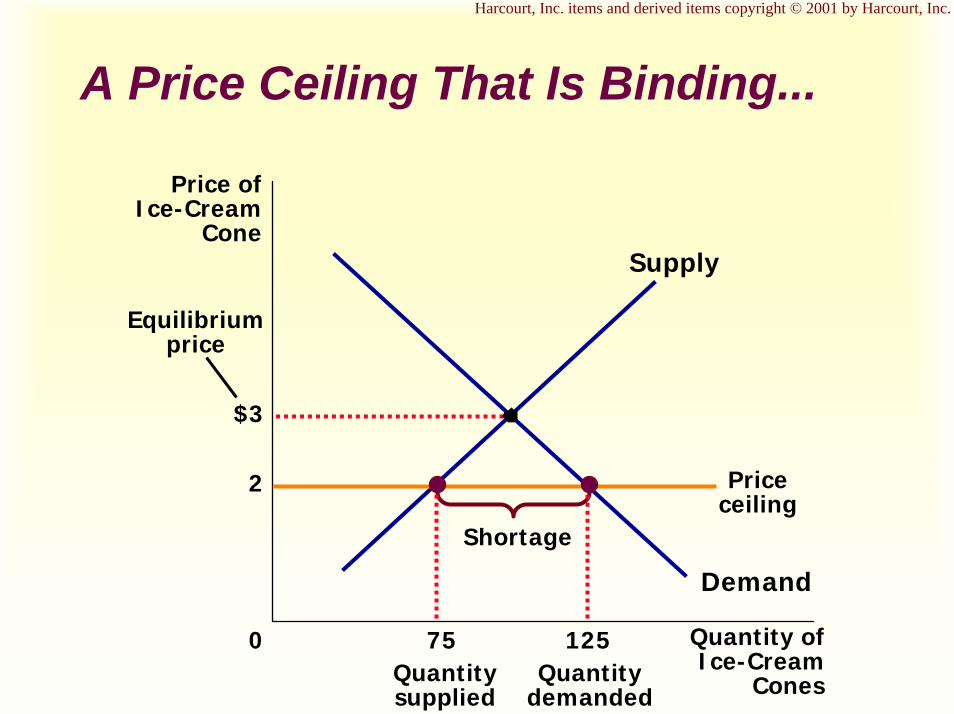
Harcourt, Inc. items and derived items copyright © 2001 by Harcourt, Inc.
A Price Ceiling That Is Binding...
$3
Quantity ofIce-Cream
Cones
0
Price ofIce-Cream
Cone
2
Demand
Supply
Equilibriumprice
Priceceiling
Shortage
125Quantity
demanded
75Quantitysupplied
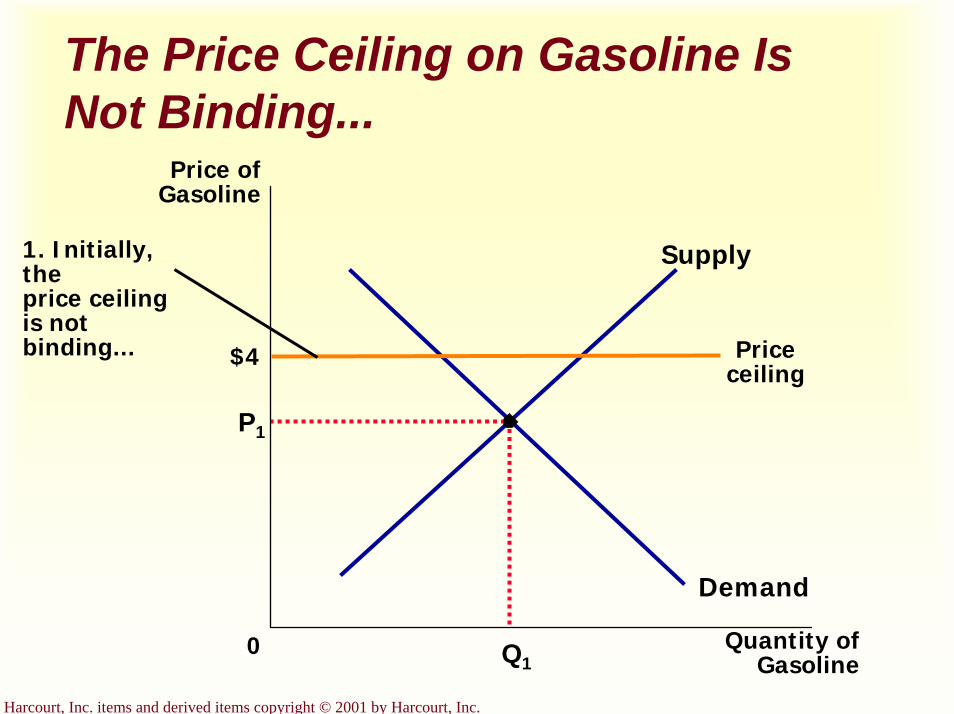
Harcourt, Inc. items and derived items copyright © 2001 by Harcourt, Inc.
The Price Ceiling on Gasoline Is Not Binding...
$4
P1
Quantity ofGasoline
0
Price ofGasoline
Q1
Demand
Supply
Priceceiling
1. Initially, the price ceiling is not binding...
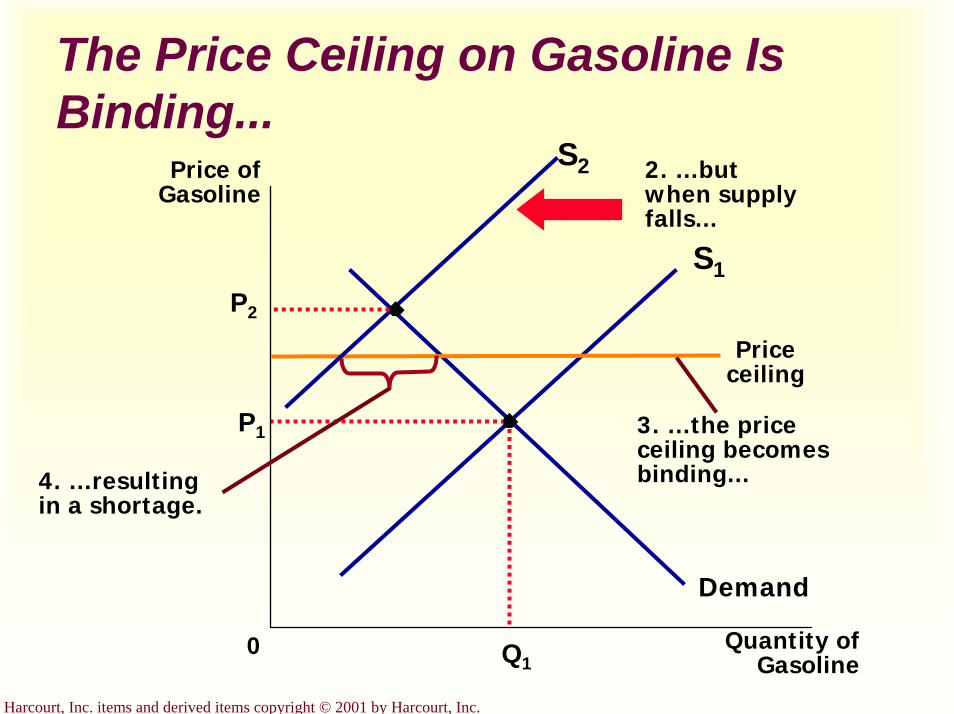
Harcourt, Inc. items and derived items copyright © 2001 by Harcourt, Inc.
The Price Ceiling on Gasoline Is Binding...
P1
Quantity ofGasoline
0
Price ofGasoline
Q1
Demand
S1
Priceceiling
S2 2. …but when supply falls...
P2
3. …the price ceiling becomes binding...4. …resulting
in a shortage.
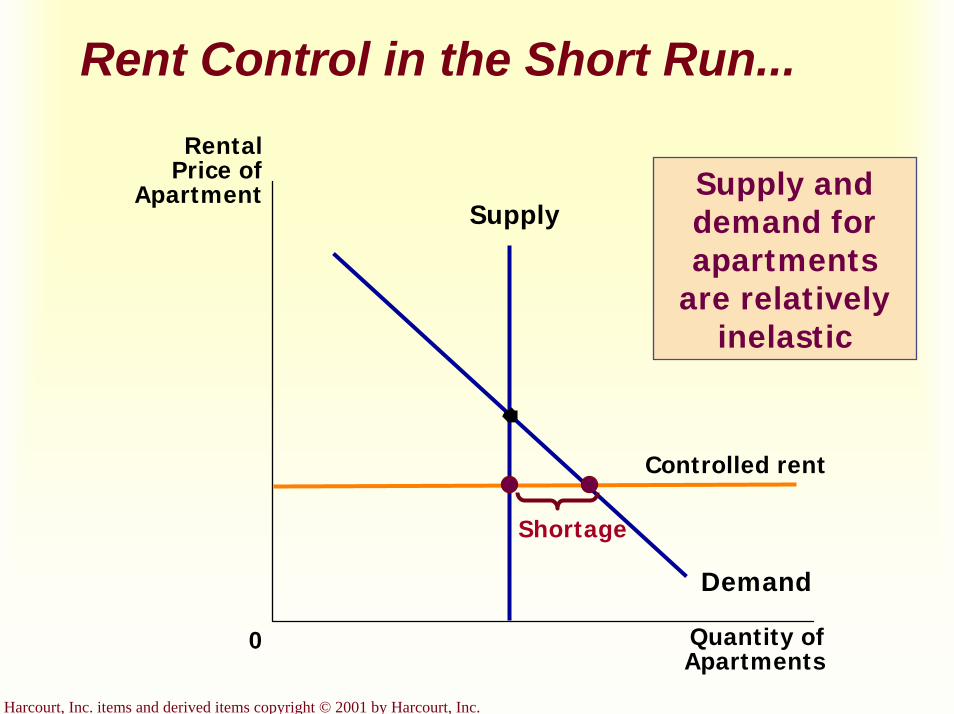
Harcourt, Inc. items and derived items copyright © 2001 by Harcourt, Inc.
Rent Control in the Short Run...
Quantity ofApartments
0
Rental Price of
Apartment
Demand
Supply
Controlled rent
Shortage
Supply and demand for apartments
are relatively inelastic
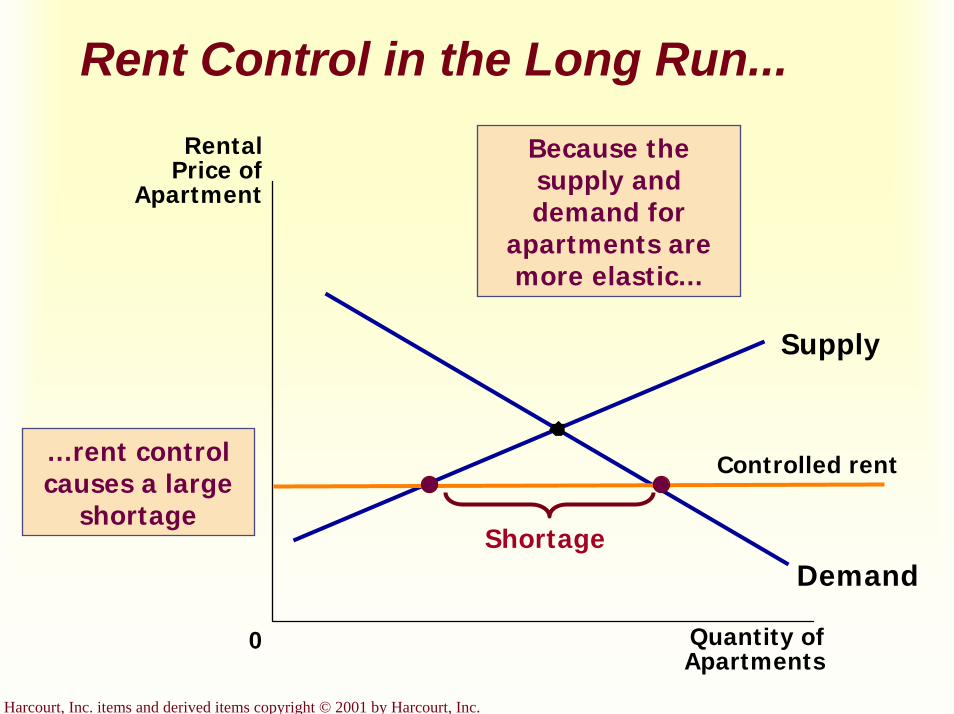
Harcourt, Inc. items and derived items copyright © 2001 by Harcourt, Inc.
Rent Control in the Long Run...
Quantity ofApartments
0
Rental Price of
Apartment
Demand
Supply
Controlled rent
Shortage
Because the supply and demand for
apartments are more elastic...
…rent control causes a large
shortage

Harcourt, Inc. items and derived items copyright © 2001 by Harcourt, Inc.
A Price Floor That Is Not Binding...
$3
Quantity ofIce-Cream
Cones
0
Price ofIce-Cream
Cone
100Equilibrium
quantity
Equilibriumprice
Demand
Supply
Pricefloor2
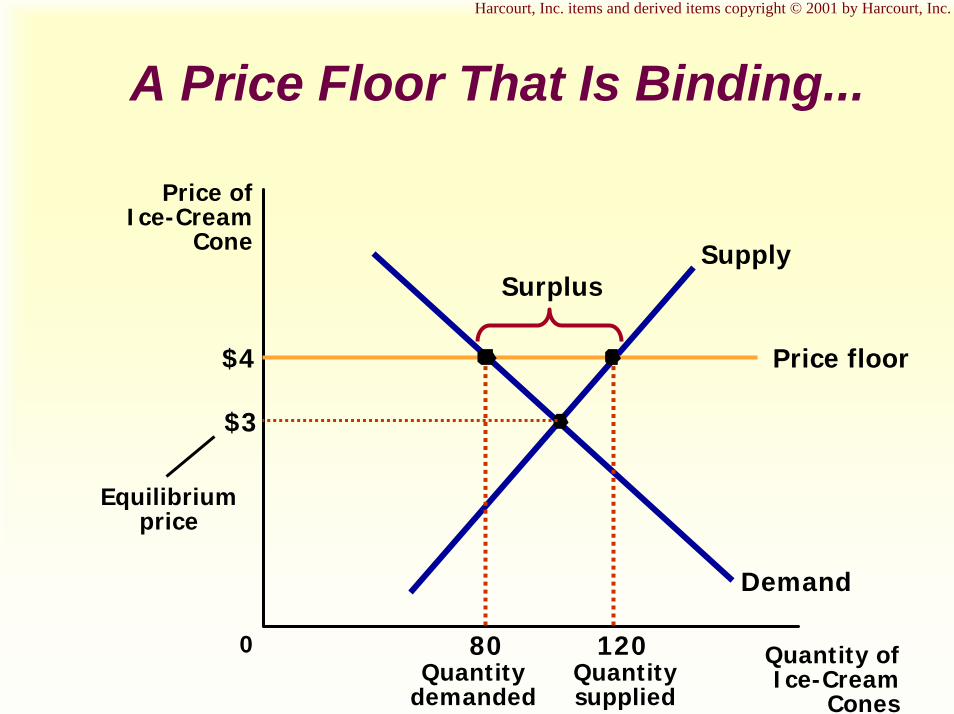
Harcourt, Inc. items and derived items copyright © 2001 by Harcourt, Inc.
A Price Floor That Is Binding...
$3
Quantity ofIce-Cream
Cones
0
Price ofIce-Cream
Cone
Equilibriumprice
Demand
Supply
Price floor$4
120Quantitysupplied
80Quantity
demanded
Surplus
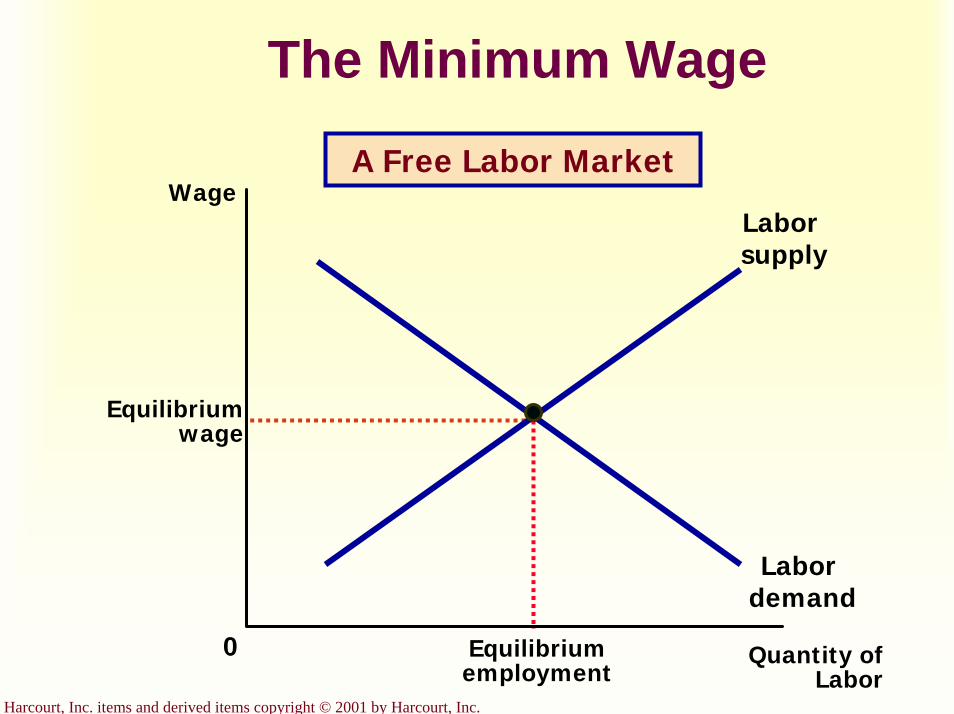
Harcourt, Inc. items and derived items copyright © 2001 by Harcourt, Inc.
The Minimum Wage
Quantity ofLabor
0
Wage
Equilibriumwage
Labor demand
Laborsupply
A Free Labor Market
Equilibriumemployment
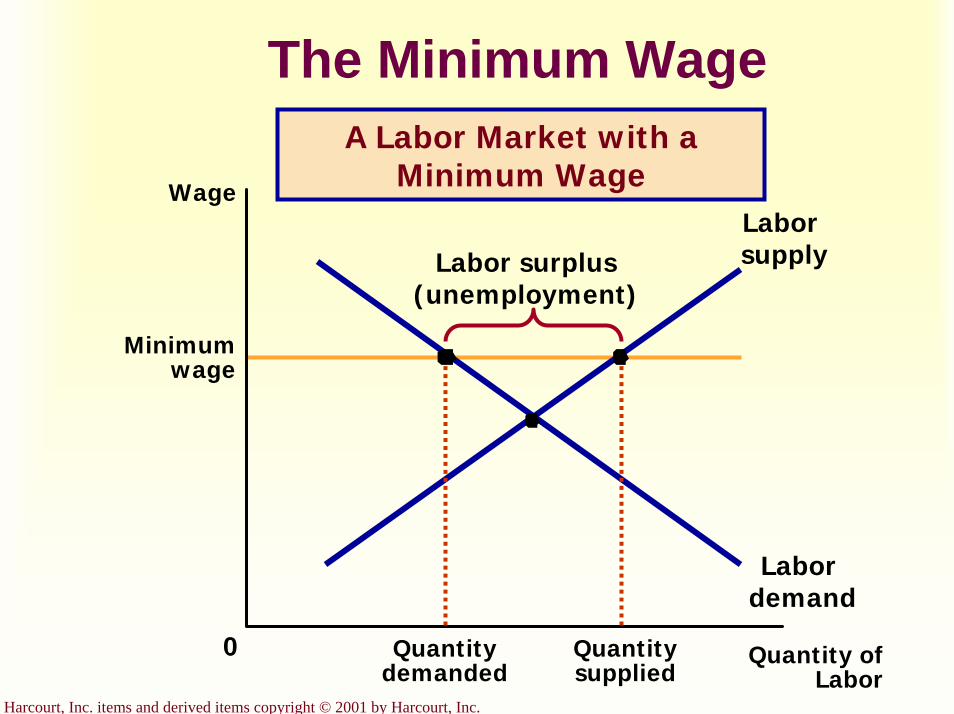
Harcourt, Inc. items and derived items copyright © 2001 by Harcourt, Inc.
The Minimum Wage
Minimumwage
Quantity ofLabor
0
Wage
Labor demand
Laborsupply
Quantitysupplied
Quantitydemanded
Labor surplus(unemployment)
A Labor Market with a Minimum Wage
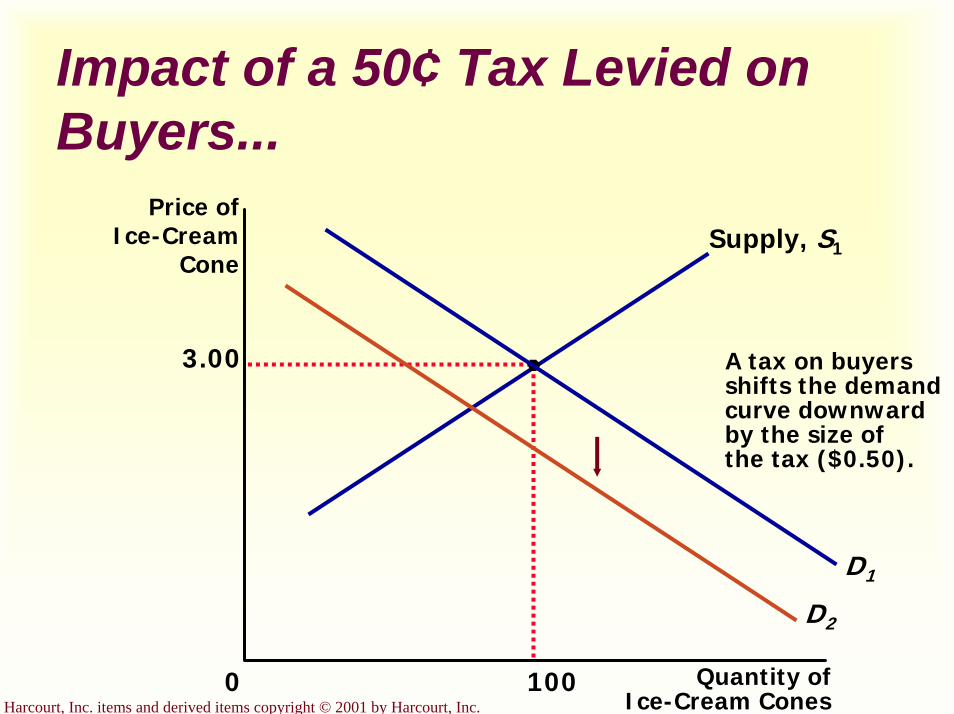
Harcourt, Inc. items and derived items copyright © 2001 by Harcourt, Inc.
Impact of a 50¢ Tax Levied on Buyers...
3.00
Quantity ofIce-Cream Cones
0
Price ofIce-Cream
Cone
100
D1
Supply, S1
A tax on buyersshifts the demandcurve downwardby the size ofthe tax ($0.50).
D2
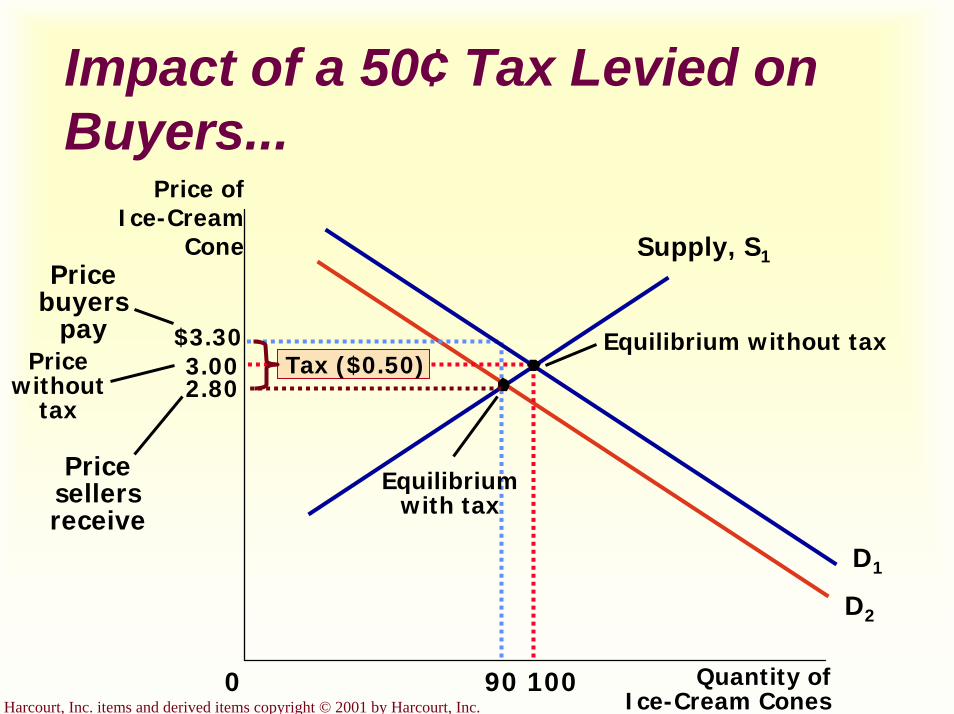
Harcourt, Inc. items and derived items copyright © 2001 by Harcourt, Inc.
Impact of a 50¢ Tax Levied on Buyers...
3.00
Quantity ofIce-Cream Cones
0
Price ofIce-Cream
Cone
10090
$3.30
Pricebuyers
pay
D1
D2
Equilibriumwith tax
Supply, S1
Equilibrium without tax
2.80
Pricesellersreceive
Pricewithout
tax
Tax ($0.50)
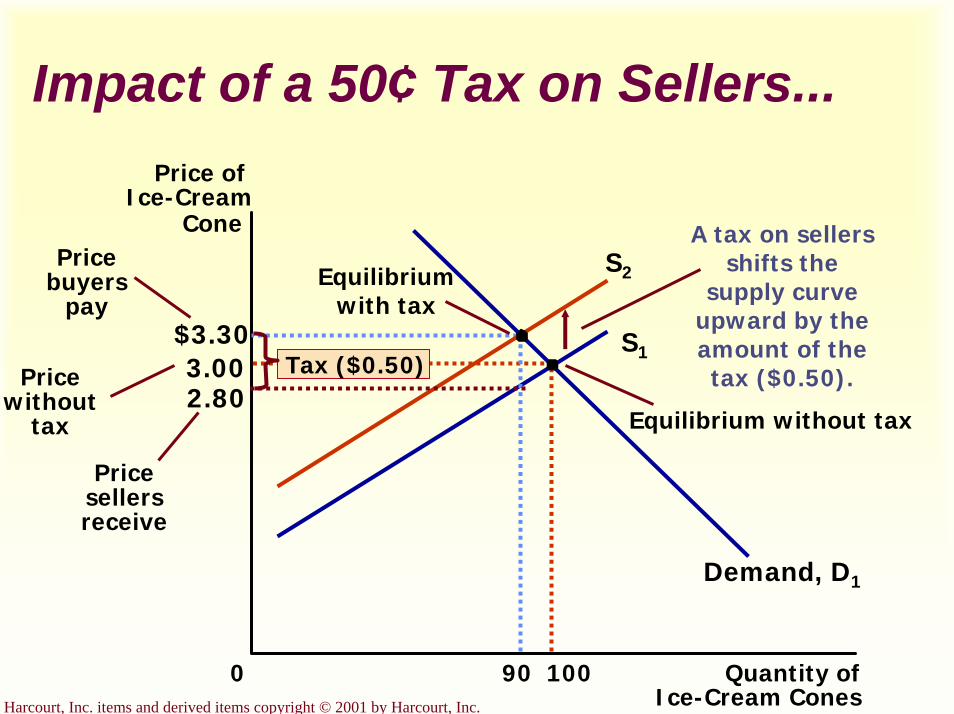
Harcourt, Inc. items and derived items copyright © 2001 by Harcourt, Inc.
Impact of a 50¢ Tax on Sellers...
3.00
Quantity ofIce-Cream Cones
0
Price ofIce-Cream
Cone
10090
S1
S2
Demand, D1
Price without
tax2.80
Price sellers receive
$3.30
Price buyers
pay
Equilibrium without tax
A tax on sellers shifts the
supply curve upward by the amount of the tax ($0.50).Tax ($0.50)
Equilibriumwith tax
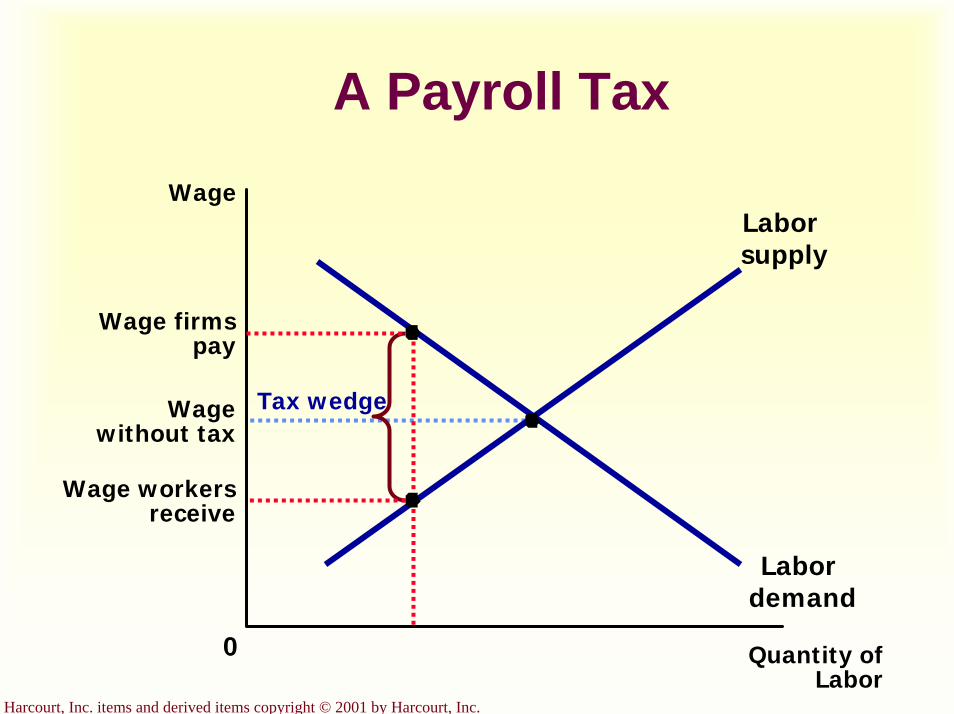
Harcourt, Inc. items and derived items copyright © 2001 by Harcourt, Inc.
A Payroll Tax
Quantity ofLabor
0
Wage
Wage without tax
Labor demand
Laborsupply
Tax wedge
Wage firms pay
Wage workers receive
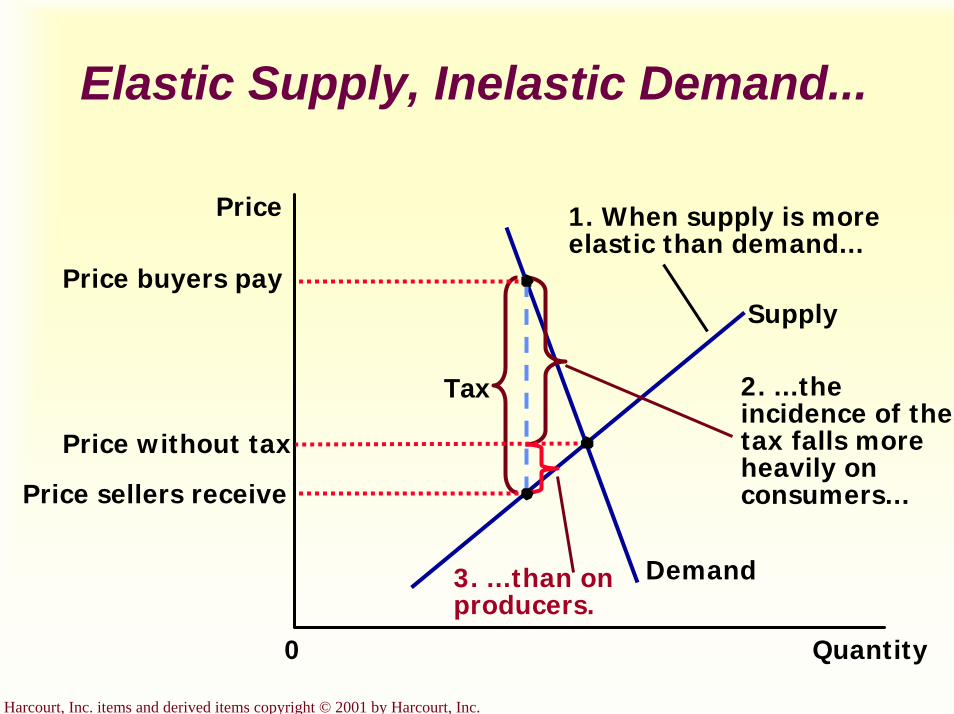
Harcourt, Inc. items and derived items copyright © 2001 by Harcourt, Inc.
Elastic Supply, Inelastic Demand...
Quantity0
Price
Demand
Supply
Tax
1. When supply is moreelastic than demand...
2. ...theincidence of thetax falls moreheavily onconsumers...
3. ...than onproducers.
Price without tax
Price buyers pay
Price sellers receive

Harcourt, Inc. items and derived items copyright © 2001 by Harcourt, Inc.
Inelastic Supply, Elastic Demand...
Quantity0
Price
Demand
Supply
Price without tax
Tax
1. When demand is moreelastic than supply...
2. ...theincidence of the tax falls more heavily on producers...
3. ...than on consumers.
Price buyers pay
Price sellers receive
Consumers, Producers, and the Efficiency of Markets
Chapter 7
Copyright © 2001 by Harcourt, Inc.
All rights reserved. Requests for permission to make copies of any part of thework should be mailed to:
Permissions Department, Harcourt College Publishers,6277 Sea Harbor Drive, Orlando, Florida 32887-6777.
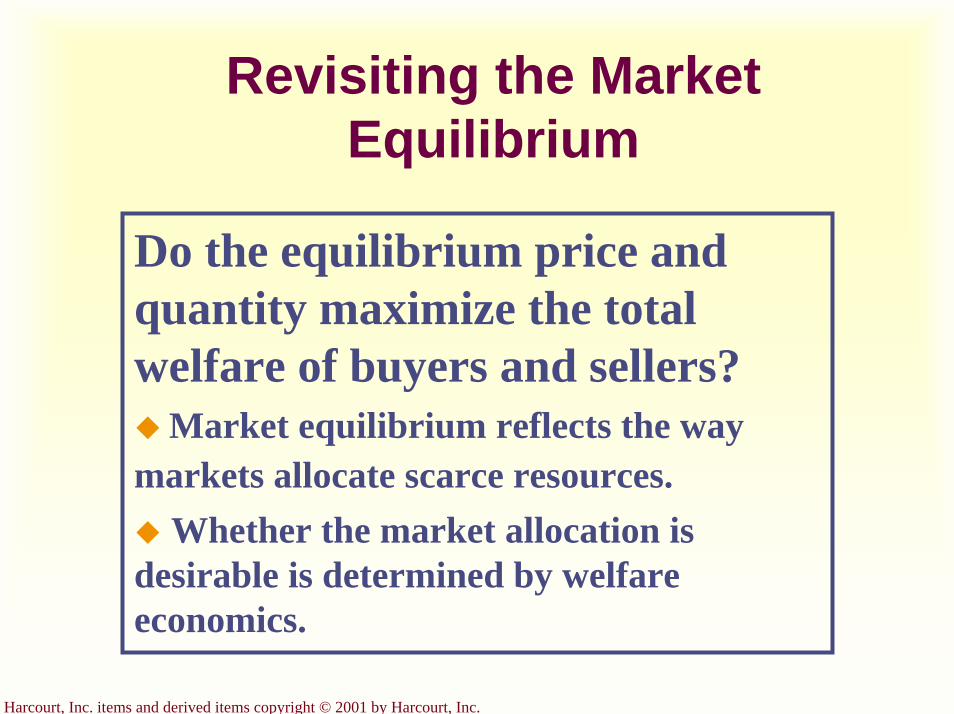
Harcourt, Inc. items and derived items copyright © 2001 by Harcourt, Inc.
Revisiting the Market Equilibrium
Do the equilibrium price and quantity maximize the total welfare of buyers and sellers?
Market equilibrium reflects the way markets allocate scarce resources.
Whether the market allocation is desirable is determined by welfare economics.
Harcourt, Inc. items and derived items copyright © 2001 by Harcourt, Inc.
Welfare Economics
Welfare economics is the study of how the allocation of resources affects economic well-being.Buyers and sellers receive benefits from taking part in the market. The equilibrium in a market maximizes the total welfare of buyers and sellers.
Harcourt, Inc. items and derived items copyright © 2001 by Harcourt, Inc.
Welfare Economics
Equilibrium in the market results in maximum benefits, and therefore maximum total welfare for both the consumers and the producers of the product.
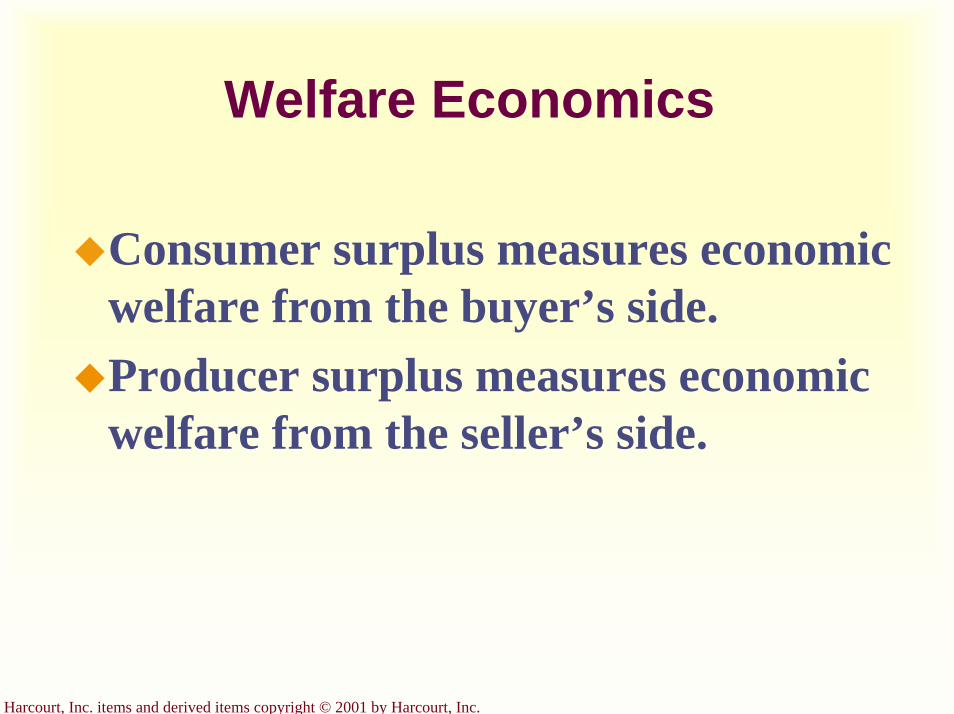
Harcourt, Inc. items and derived items copyright © 2001 by Harcourt, Inc.
Welfare Economics
Consumer surplus measures economic welfare from the buyer’s side.Producer surplus measures economic welfare from the seller’s side.

Harcourt, Inc. items and derived items copyright © 2001 by Harcourt, Inc.
Consumer Surplus
Willingness to pay is the maximum price that a buyer is willing and able to pay for a good.It measures how much the buyer values the good or service.

Harcourt, Inc. items and derived items copyright © 2001 by Harcourt, Inc.
Consumer Surplus
Consumer surplus is the amount a buyer is willing to pay for a
good minus the amount the buyer actually pays for it.
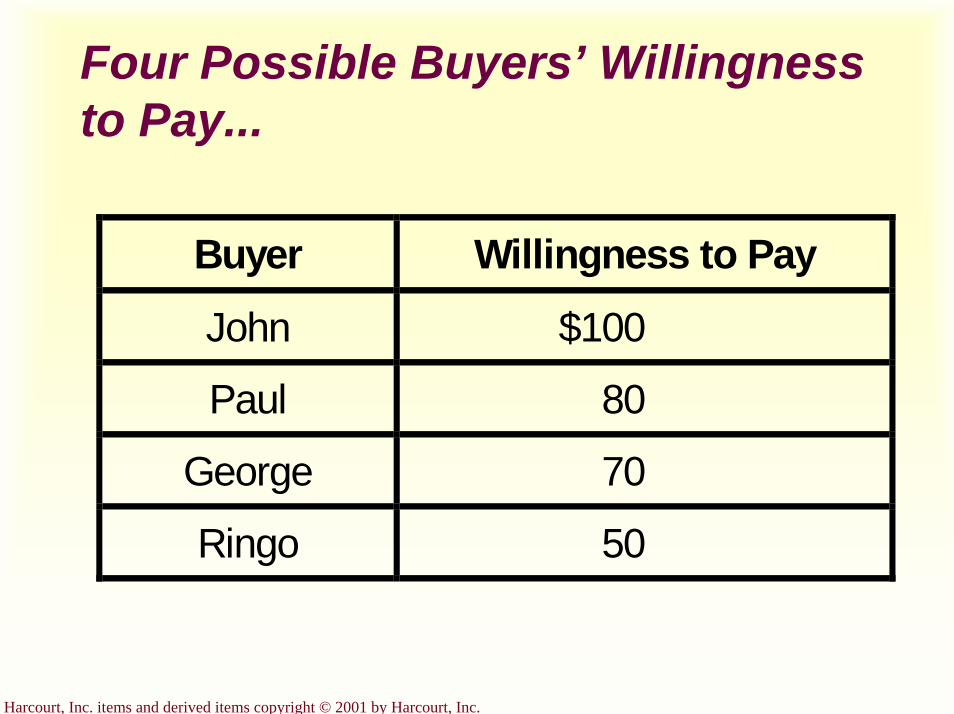
Harcourt, Inc. items and derived items copyright © 2001 by Harcourt, Inc.
Four Possible Buyers’ Willingness to Pay...
Buyer Willingness to Pay
John $100
Paul 80
George 70
Ringo 50
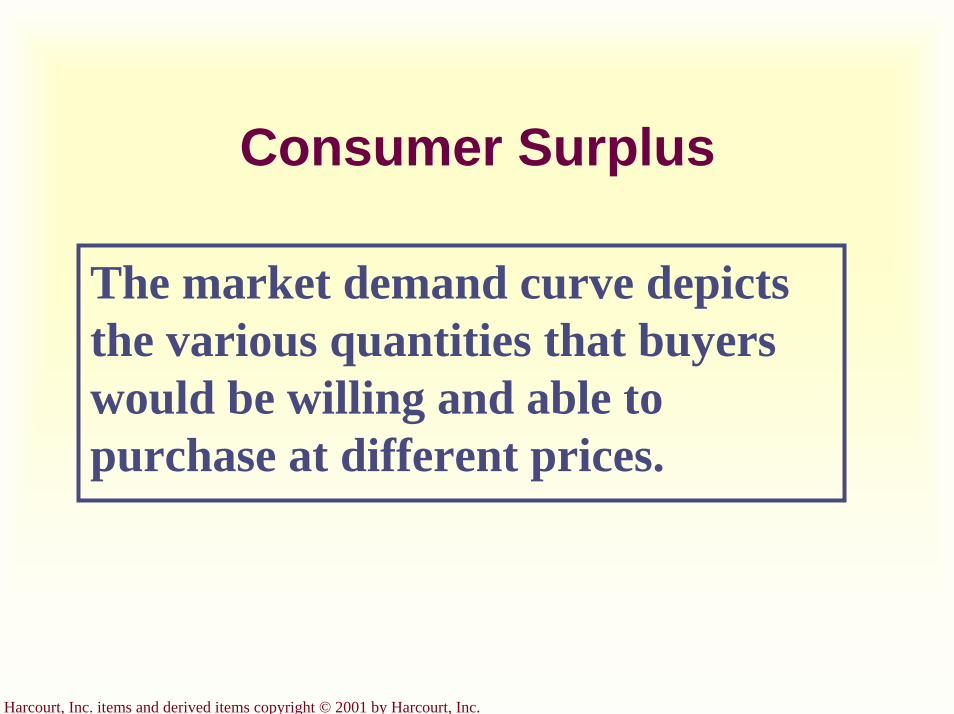
Harcourt, Inc. items and derived items copyright © 2001 by Harcourt, Inc.
Consumer Surplus
The market demand curve depicts the various quantities that buyers would be willing and able to purchase at different prices.
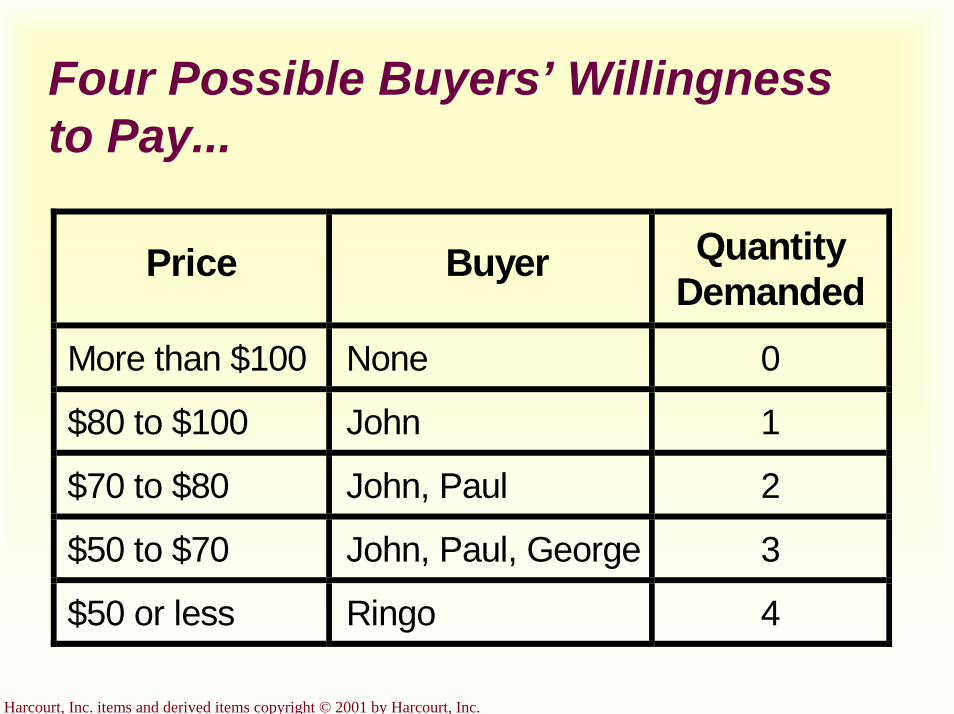
Harcourt, Inc. items and derived items copyright © 2001 by Harcourt, Inc.
Four Possible Buyers’ Willingness to Pay...
Price Buyer QuantityDemanded
More than $100 None 0
$80 to $100 John 1
$70 to $80 John, Paul 2
$50 to $70 John, Paul, George 3
$50 or less Ringo 4

Harcourt, Inc. items and derived items copyright © 2001 by Harcourt, Inc.
Measuring Consumer Surplus with the Demand Curve...
Price ofAlbum
50
7080
0
$100
1 2 3 4 Quantity ofAlbums
John’s willingness to pay
Paul’s willingness to pay
George’s willingness to pay
Ringo’s willingness to pay
Demand
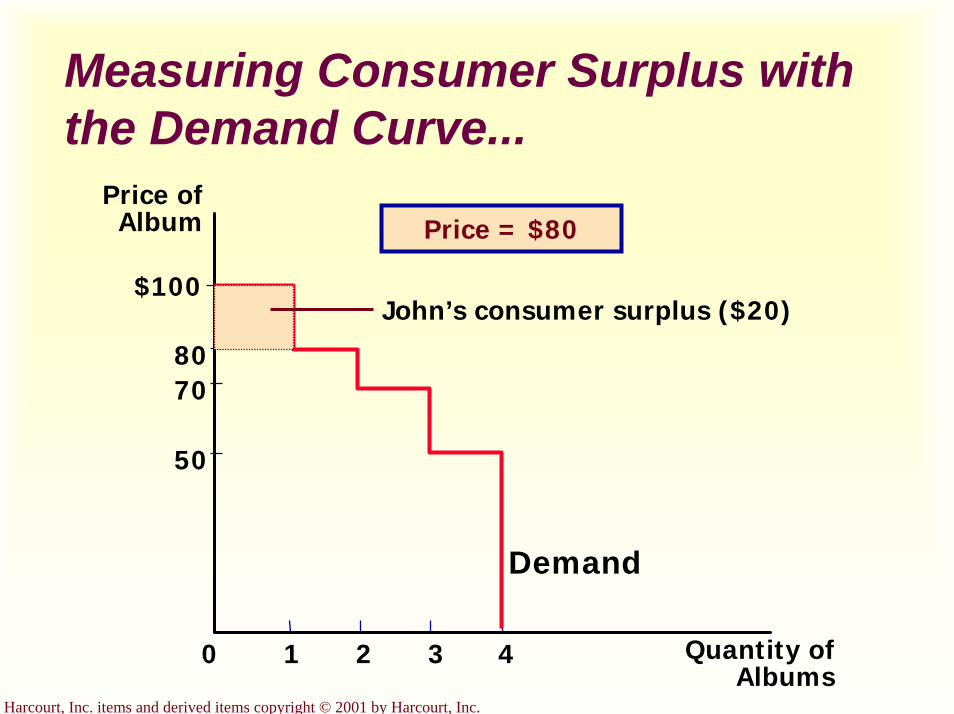
Harcourt, Inc. items and derived items copyright © 2001 by Harcourt, Inc.
Measuring Consumer Surplus with the Demand Curve...
Price ofAlbum
50
7080
0
$100
1 2 3 4 Quantity ofAlbums
Demand
John’s consumer surplus ($20)
Price = $80
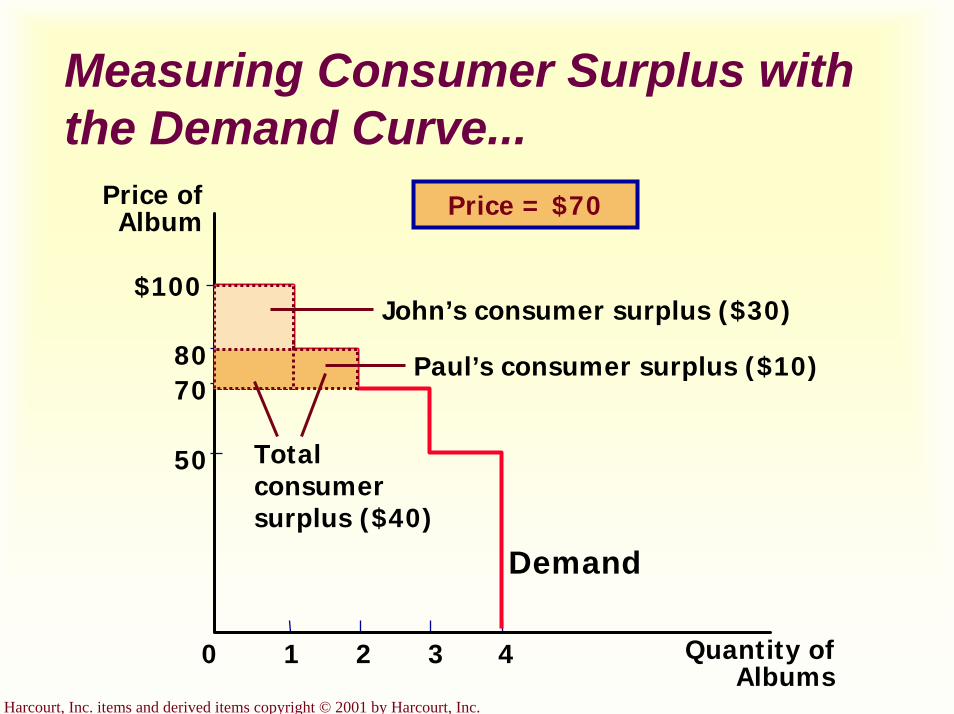
Harcourt, Inc. items and derived items copyright © 2001 by Harcourt, Inc.
Measuring Consumer Surplus with the Demand Curve...
Price ofAlbum
50
7080
0
$100
1 2 3 4 Quantity ofAlbums
Demand
John’s consumer surplus ($30)
Total consumer surplus ($40)
Price = $70
Paul’s consumer surplus ($10)
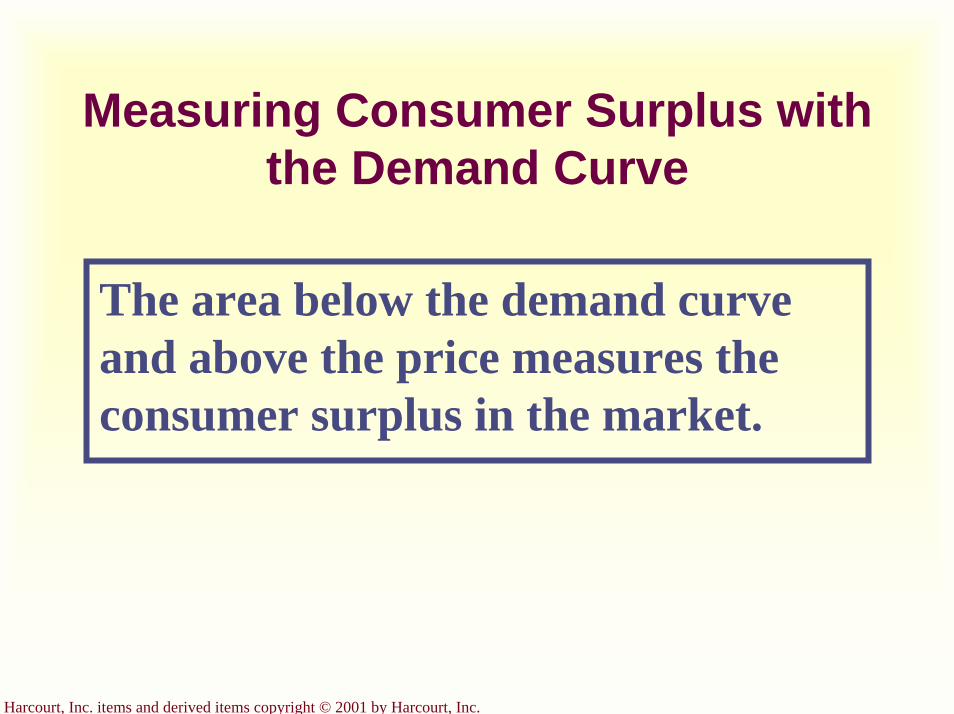
Harcourt, Inc. items and derived items copyright © 2001 by Harcourt, Inc.
Measuring Consumer Surplus with the Demand Curve
The area below the demand curve and above the price measures the consumer surplus in the market.
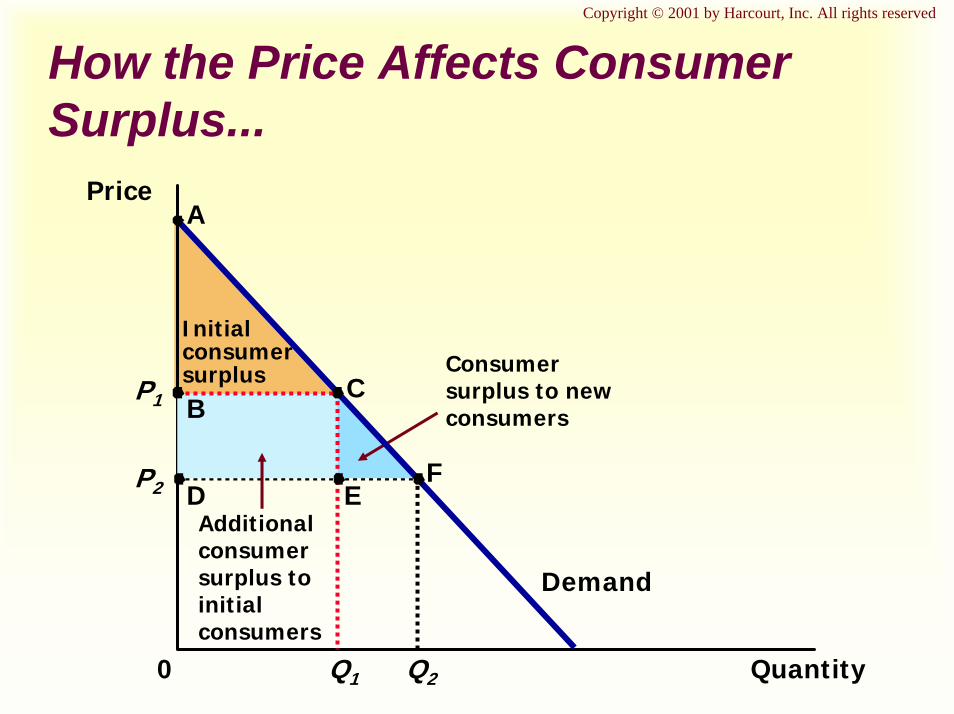
Copyright © 2001 by Harcourt, Inc. All rights reserved
How the Price Affects Consumer Surplus...
Q2
P2
Quantity
Price
0
Demand
Initialconsumersurplus
Additional consumer surplus to initial consumers
Consumer surplus to new consumers
Q1
P1
D EF
BC
A
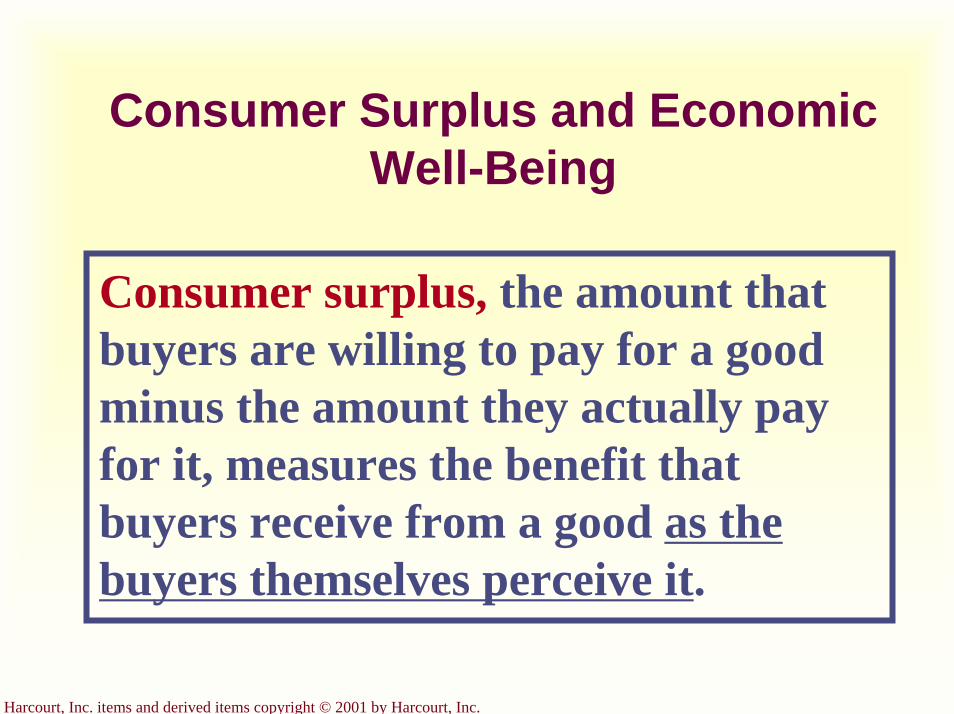
Harcourt, Inc. items and derived items copyright © 2001 by Harcourt, Inc.
Consumer Surplus and Economic Well-Being
Consumer surplus, the amount that buyers are willing to pay for a good minus the amount they actually pay for it, measures the benefit that buyers receive from a good as the buyers themselves perceive it.
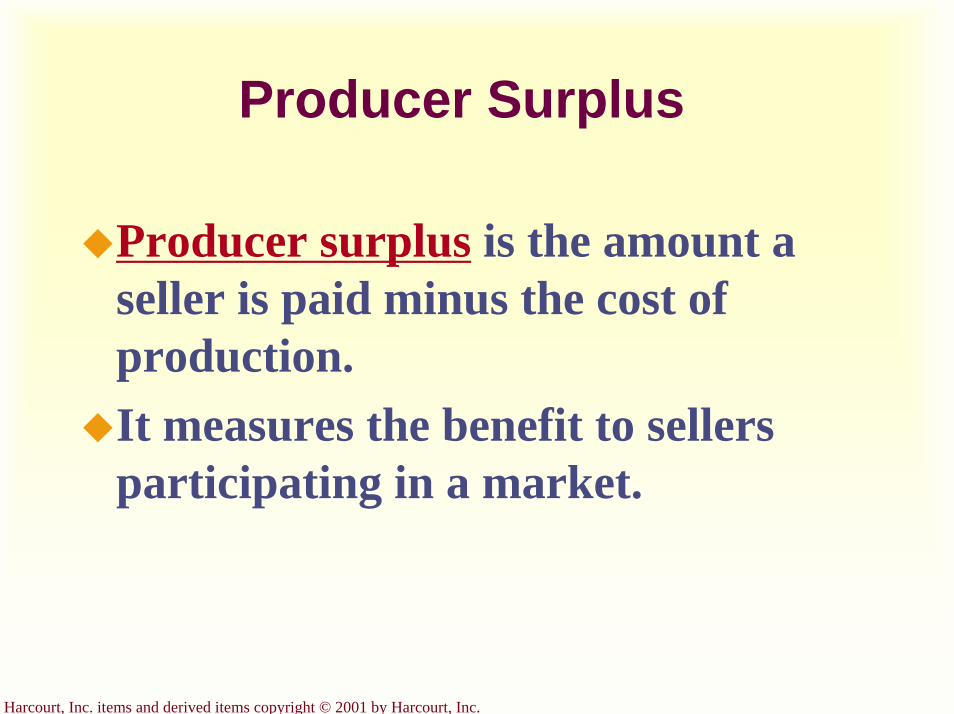
Harcourt, Inc. items and derived items copyright © 2001 by Harcourt, Inc.
Producer Surplus
Producer surplus is the amount a seller is paid minus the cost of production. It measures the benefit to sellers participating in a market.
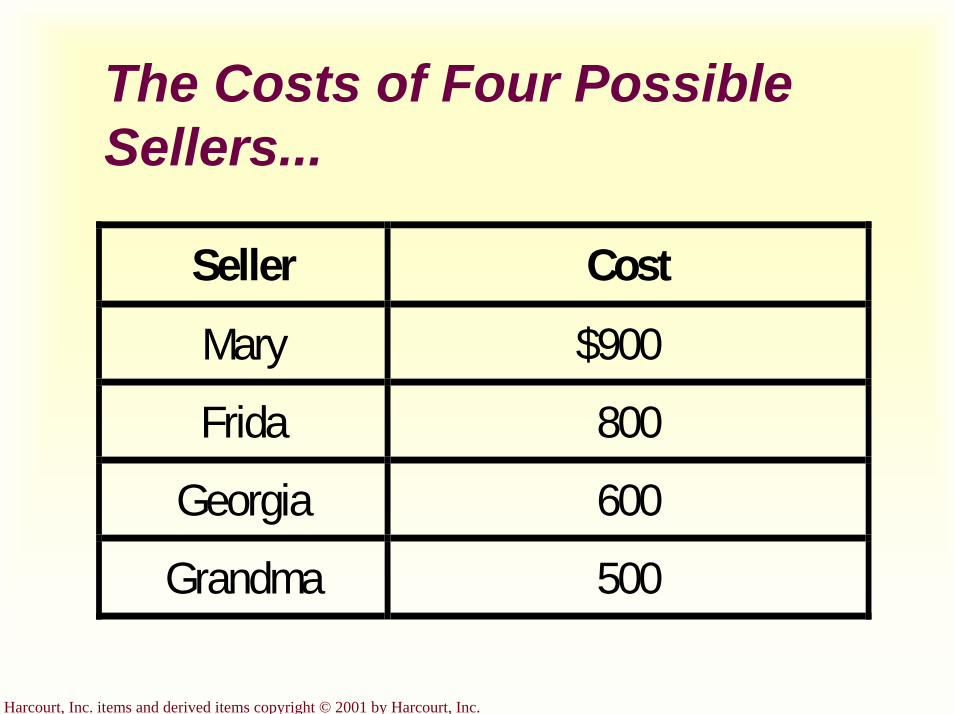
Harcourt, Inc. items and derived items copyright © 2001 by Harcourt, Inc.
The Costs of Four Possible Sellers...
Seller Cost
Mary $900
Frida 800
Georgia 600
Grandma 500
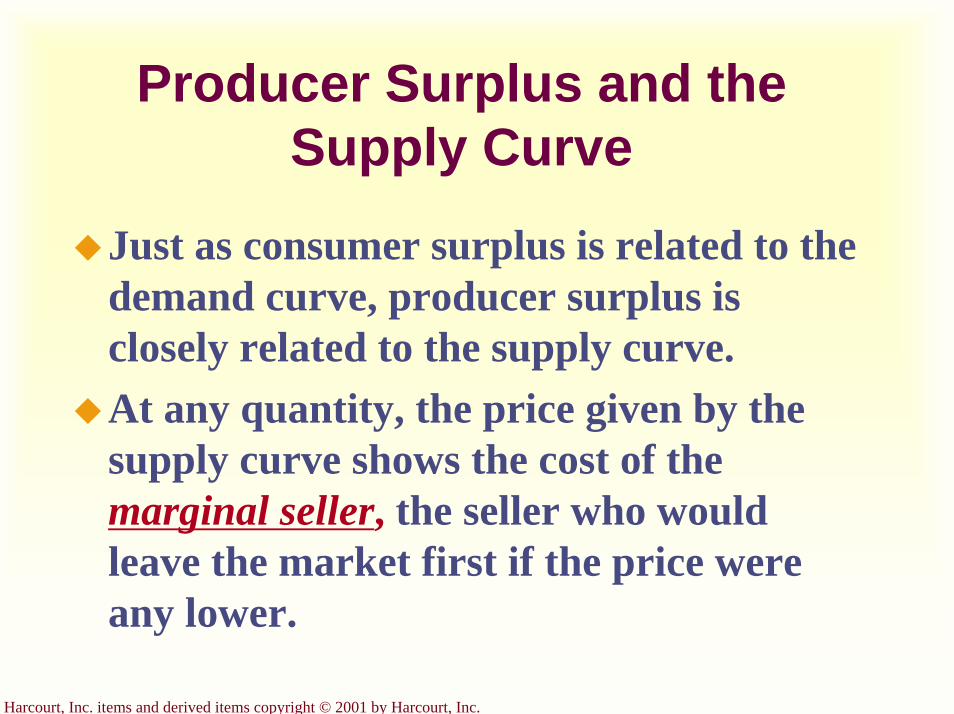
Harcourt, Inc. items and derived items copyright © 2001 by Harcourt, Inc.
Producer Surplus and the Supply Curve
Just as consumer surplus is related to the demand curve, producer surplus is closely related to the supply curve.At any quantity, the price given by the supply curve shows the cost of the marginal seller, the seller who would leave the market first if the price were any lower.
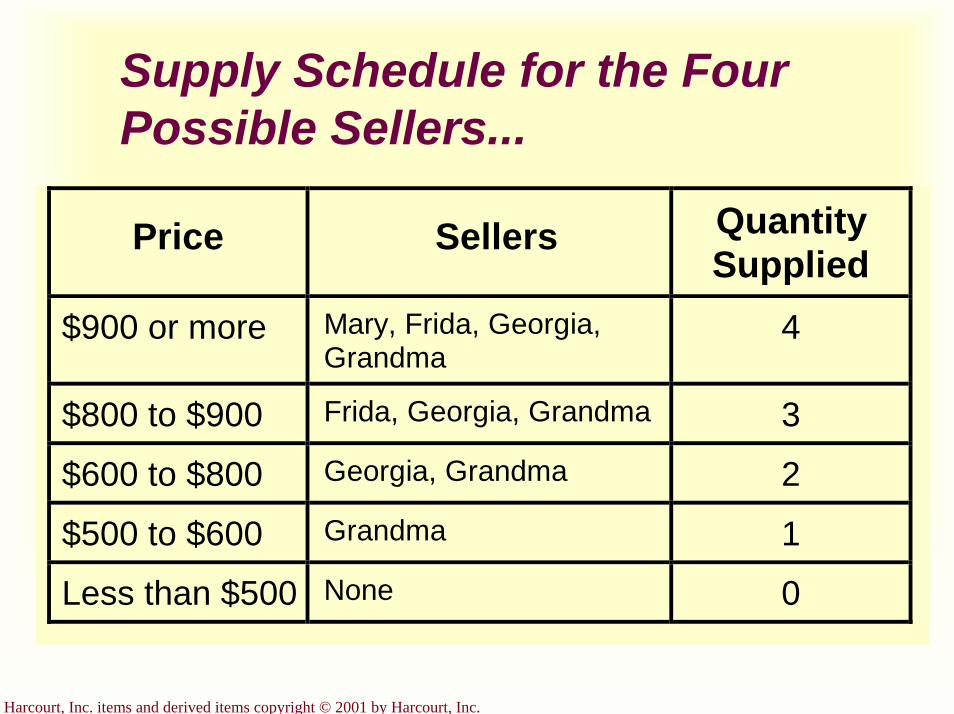
Harcourt, Inc. items and derived items copyright © 2001 by Harcourt, Inc.
Supply Schedule for the Four Possible Sellers...
Price Sellers QuantitySupplied
$900 or more Mary, Frida, Georgia,Grandma
4
$800 to $900 Frida, Georgia, Grandma 3
$600 to $800 Georgia, Grandma 2
$500 to $600 Grandma 1
Less than $500 None 0
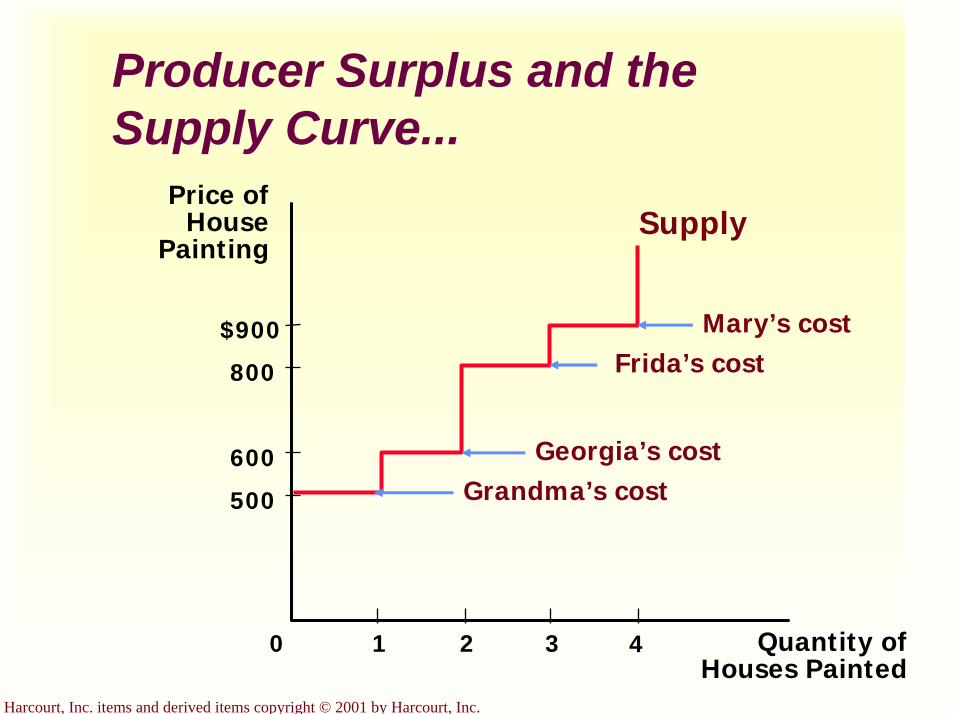
Harcourt, Inc. items and derived items copyright © 2001 by Harcourt, Inc.
Producer Surplus and the Supply Curve...
Quantity ofHouses Painted
Price ofHouse
Painting
500
800
$900
0
600
1 2 3 4
Grandma’s costGeorgia’s cost
Frida’s costMary’s cost
Supply
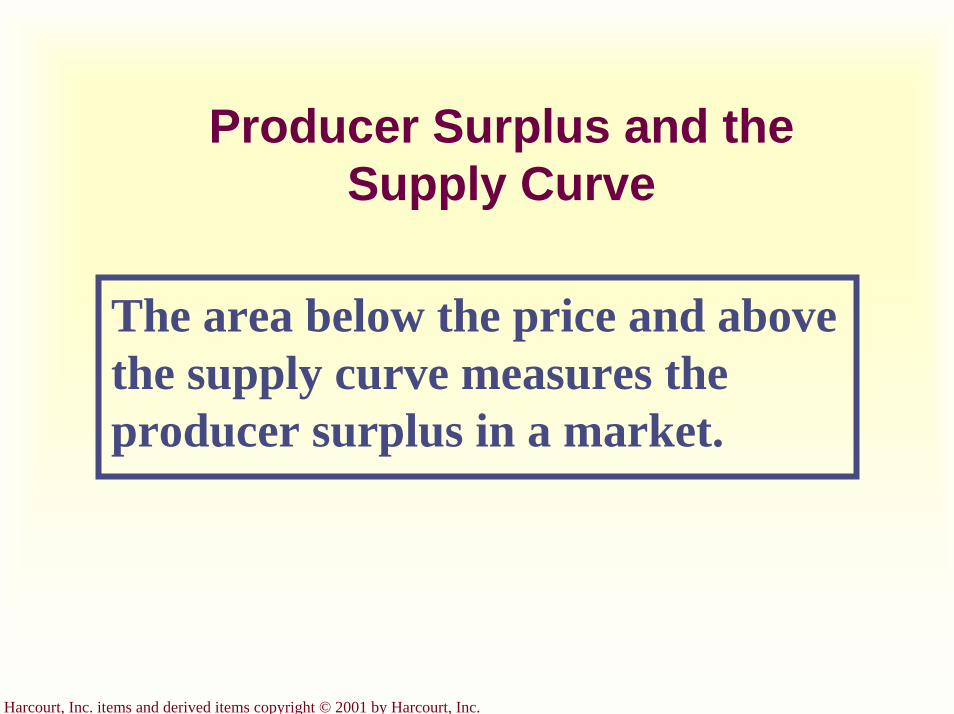
Harcourt, Inc. items and derived items copyright © 2001 by Harcourt, Inc.
Producer Surplus and the Supply Curve
The area below the price and above the supply curve measures the producer surplus in a market.
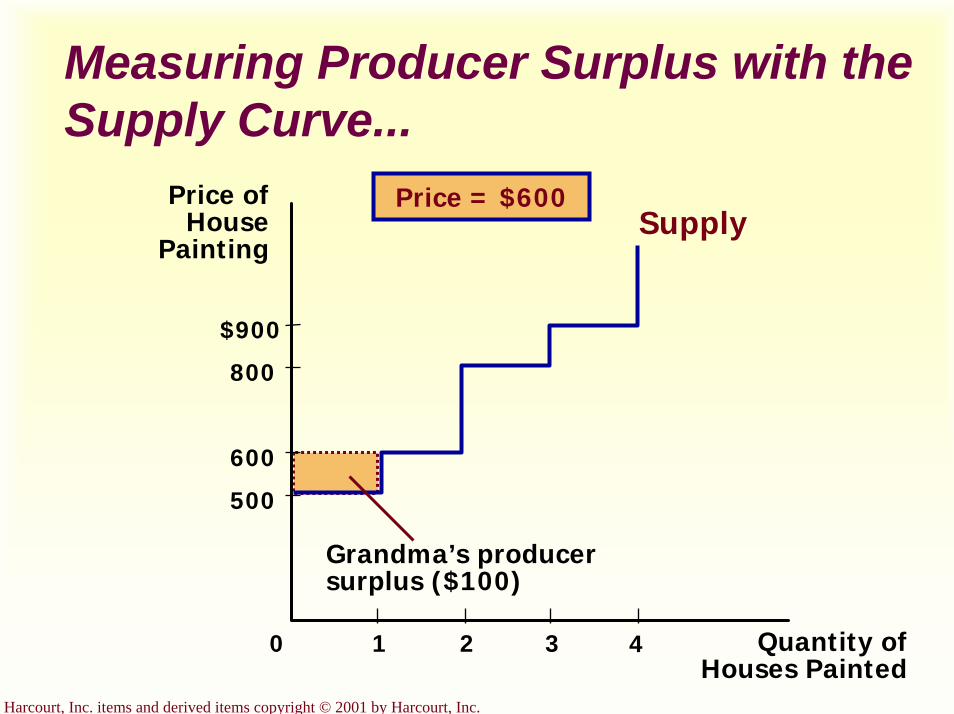
Harcourt, Inc. items and derived items copyright © 2001 by Harcourt, Inc.
Measuring Producer Surplus with the Supply Curve...
Quantity ofHouses Painted
Price ofHouse
Painting
500
800
$900
0
600
1 2 3 4
Supply
Grandma’s producersurplus ($100)
Price = $600

Harcourt, Inc. items and derived items copyright © 2001 by Harcourt, Inc.
Measuring Producer Surplus with the Supply Curve...
Quantity ofHouses Painted
Price ofHouse
Painting
500
800
$900
0
600
1 2 3 4
Supply
Grandma’s producersurplus ($300)
Price = $800
Georgia’s producersurplus ($200)
Totalproducersurplus ($500)

Harcourt, Inc. items and derived items copyright © 2001 by Harcourt, Inc.
How Price Affects Producer Surplus...
P2
Q2 Quantity
Price
0
Supply
Q1
P1
A
BCInitial
Producersurplus
Additional producersurplus to initialproducers
D EF
Producer surplusto new producers
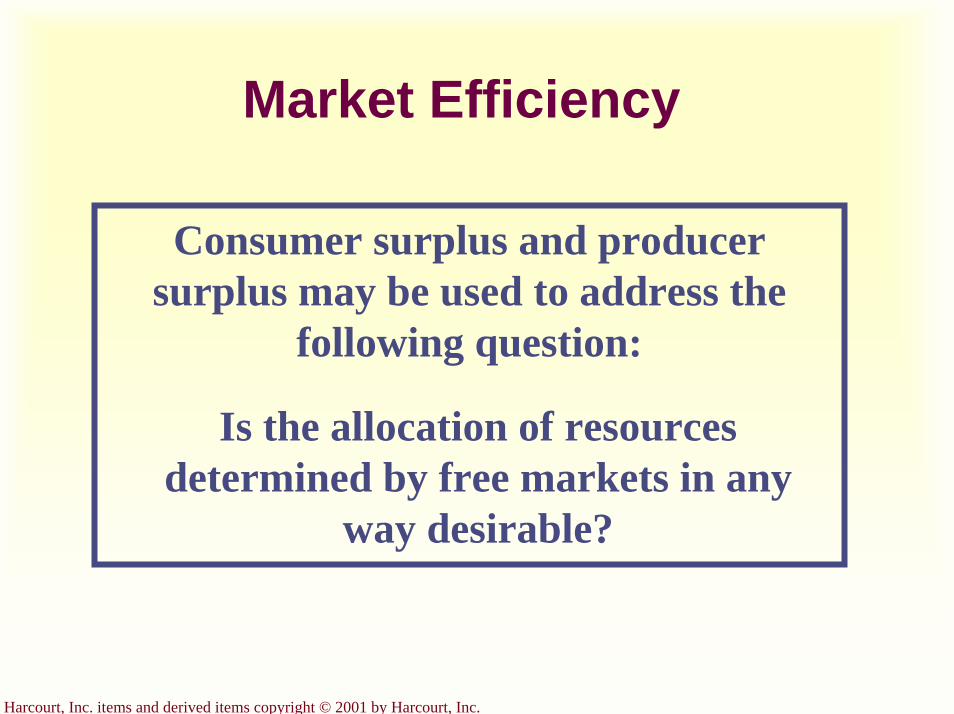
Harcourt, Inc. items and derived items copyright © 2001 by Harcourt, Inc.
Market Efficiency
Consumer surplus and producer surplus may be used to address the
following question:
Is the allocation of resources determined by free markets in any
way desirable?
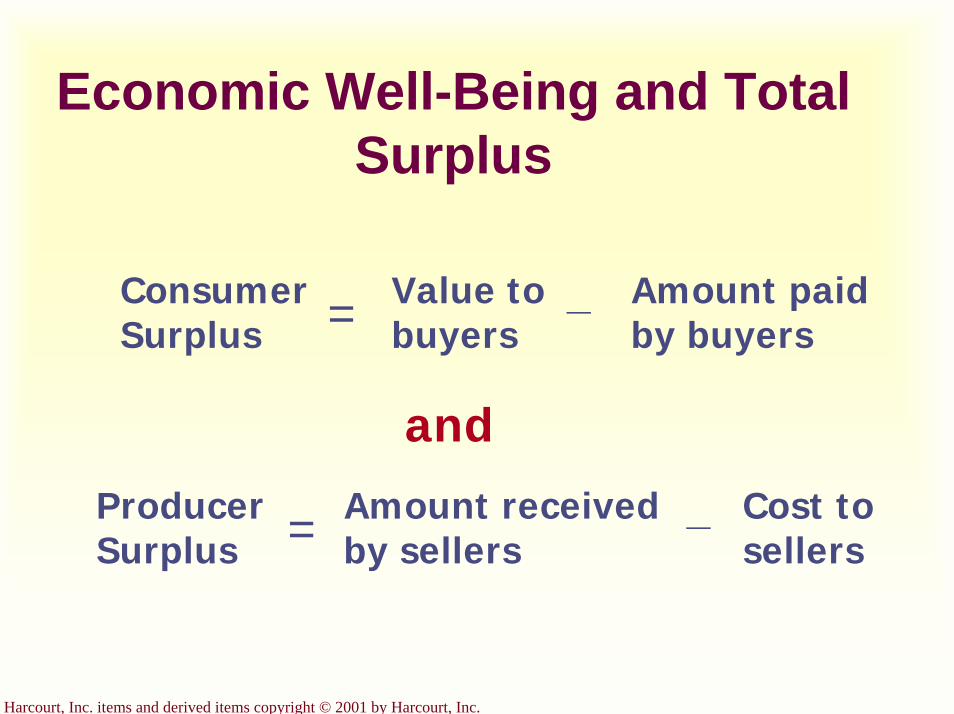
Harcourt, Inc. items and derived items copyright © 2001 by Harcourt, Inc.
Economic Well-Being and Total Surplus
Consumer Surplus = Value to
buyers_ Amount paid
by buyers
and
Producer Surplus = Amount received
by sellers_ Cost to
sellers
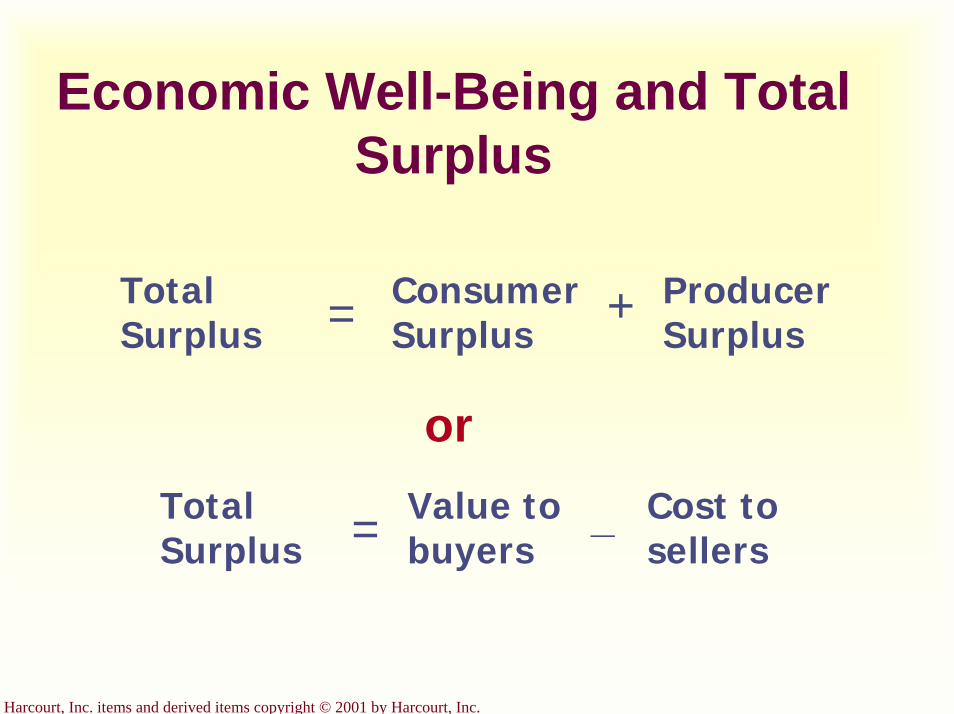
Harcourt, Inc. items and derived items copyright © 2001 by Harcourt, Inc.
Economic Well-Being and Total Surplus
Total Surplus = Consumer
SurplusProducer Surplus
+
or
Total Surplus = Value to
buyers_ Cost to
sellers
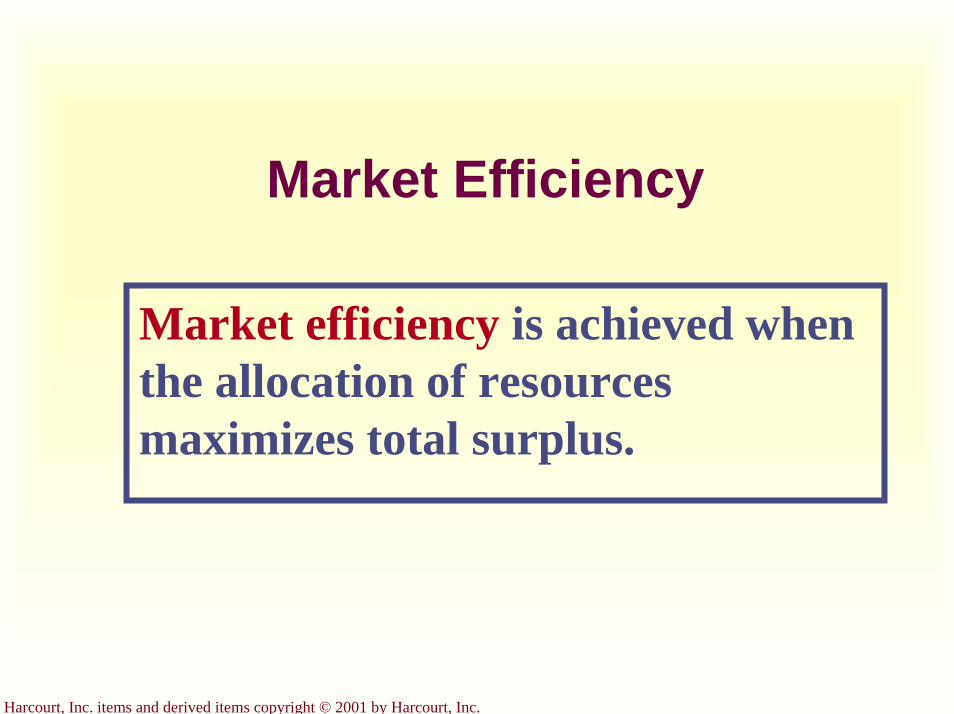
Harcourt, Inc. items and derived items copyright © 2001 by Harcourt, Inc.
Market Efficiency
Market efficiency is achieved when the allocation of resources maximizes total surplus.
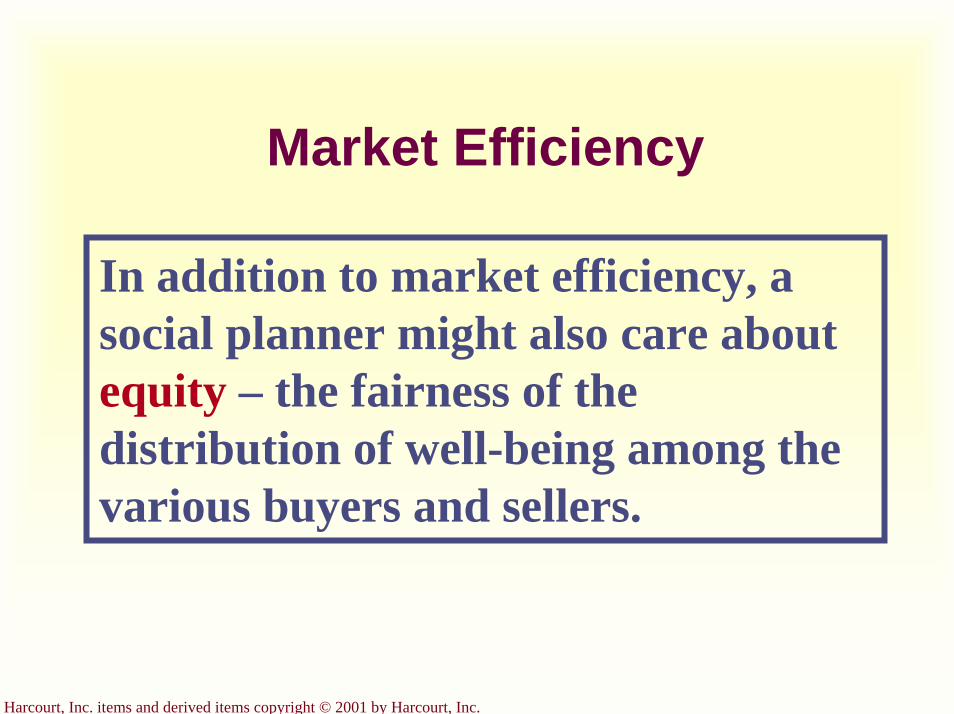
Harcourt, Inc. items and derived items copyright © 2001 by Harcourt, Inc.
Market Efficiency
In addition to market efficiency, a social planner might also care aboutequity – the fairness of the distribution of well-being among the various buyers and sellers.

Harcourt, Inc. items and derived items copyright © 2001 by Harcourt, Inc.
Evaluating the Market Equilibrium...
Price
Equilibriumprice
0 QuantityEquilibriumquantity
A
Supply
C
B Demand
D
E
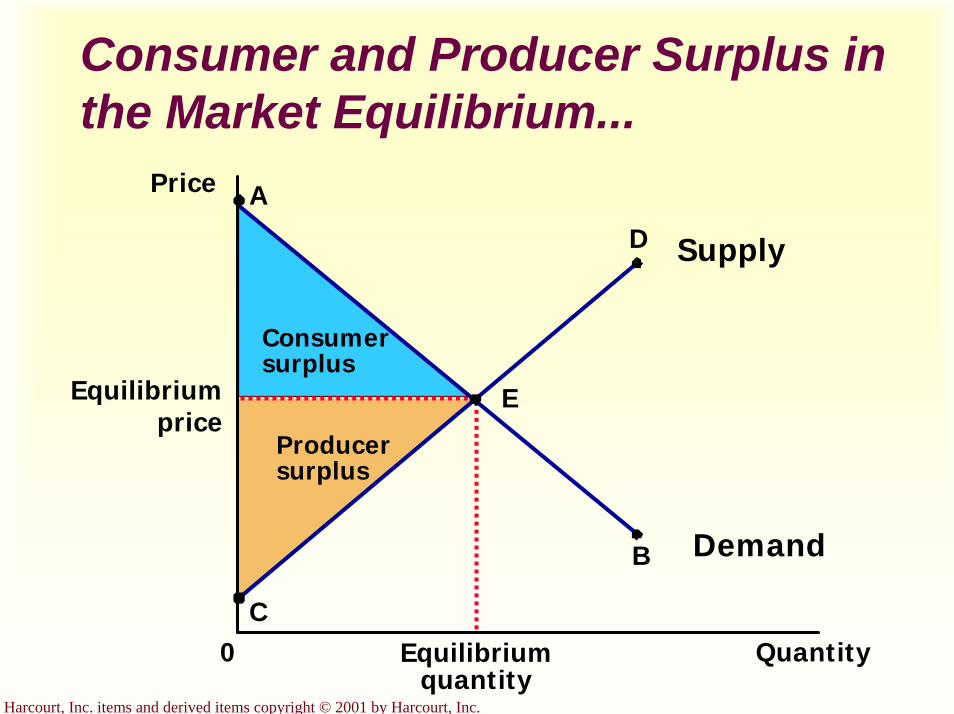
Harcourt, Inc. items and derived items copyright © 2001 by Harcourt, Inc.
Consumer and Producer Surplus in the Market Equilibrium...
Price
Equilibriumprice
0 QuantityEquilibriumquantity
A
Supply
C
B Demand
D
E
Producersurplus
Consumersurplus

Harcourt, Inc. items and derived items copyright © 2001 by Harcourt, Inc.
Three Insights Concerning Market Outcomes
Free markets allocate the supply of goods to the buyers who value them most highly.Free markets allocate the demand for goods to the sellers who can produce them at least cost.Free markets produce the quantity of goods that maximizes the sum of consumer and producer surplus.
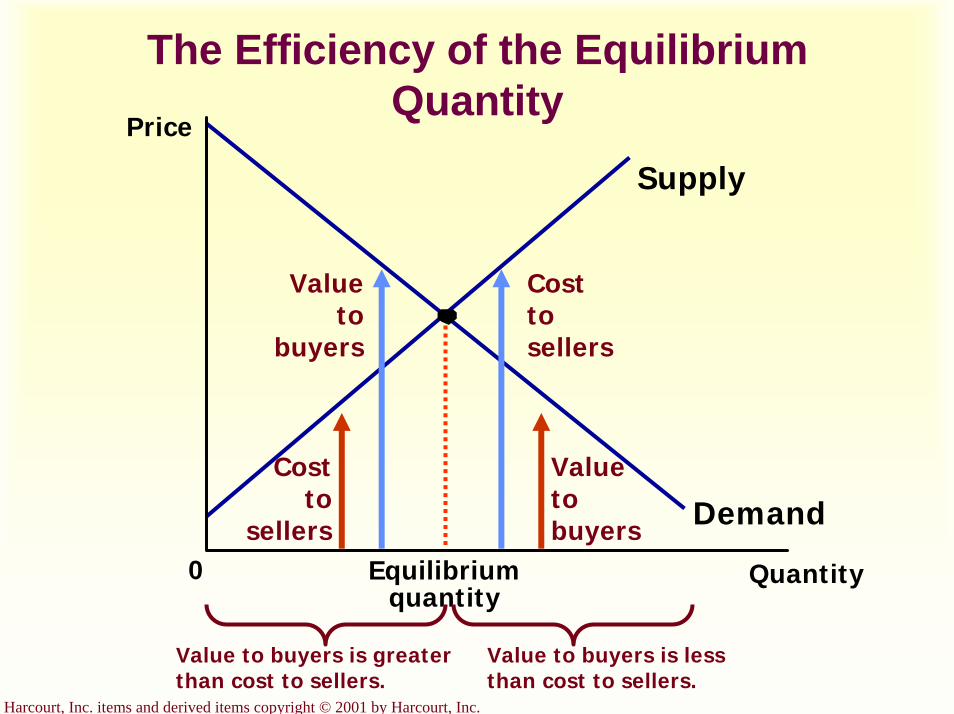
Harcourt, Inc. items and derived items copyright © 2001 by Harcourt, Inc.
Price
0 QuantityEquilibriumquantity
Supply
Demand
Cost to sellers
Value to buyers
Value to
buyers
Cost to
sellers
Value to buyers is greater than cost to sellers.
Value to buyers is less than cost to sellers.
The Efficiency of the Equilibrium Quantity
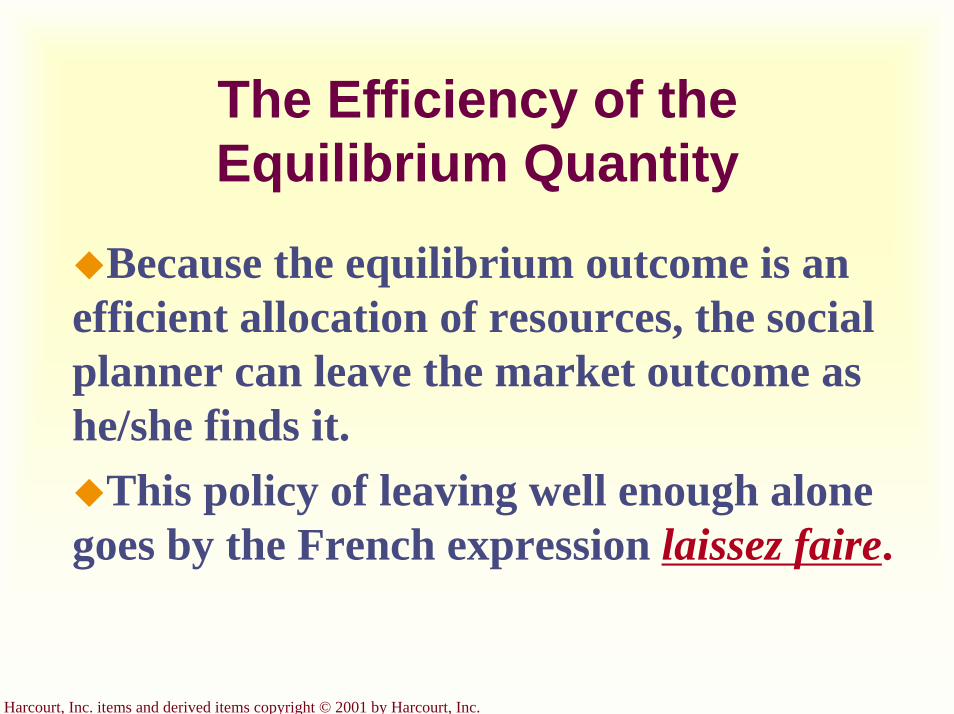
Harcourt, Inc. items and derived items copyright © 2001 by Harcourt, Inc.
The Efficiency of the Equilibrium Quantity
Because the equilibrium outcome is an efficient allocation of resources, the social planner can leave the market outcome as he/she finds it.
This policy of leaving well enough alone goes by the French expression laissez faire.
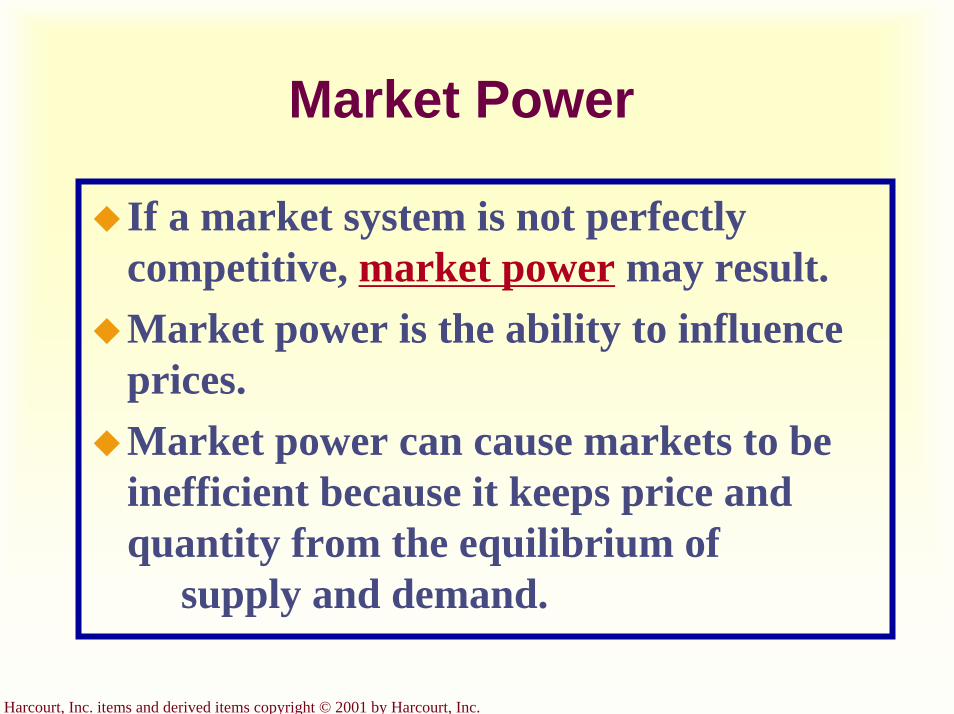
Harcourt, Inc. items and derived items copyright © 2001 by Harcourt, Inc.
Market Power
If a market system is not perfectly competitive, market power may result.Market power is the ability to influence prices.Market power can cause markets to be inefficient because it keeps price and quantity from the equilibrium of
supply and demand.
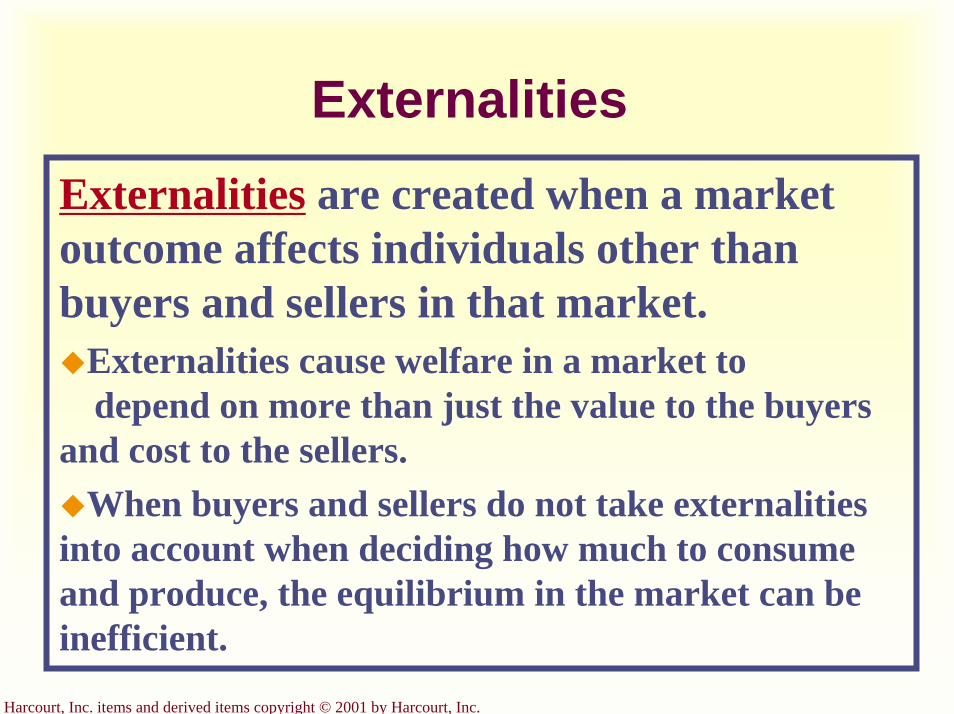
Harcourt, Inc. items and derived items copyright © 2001 by Harcourt, Inc.
ExternalitiesExternalities are created when a market outcome affects individuals other than buyers and sellers in that market.
Externalities cause welfare in a market todepend on more than just the value to the buyers
and cost to the sellers.When buyers and sellers do not take externalities
into account when deciding how much to consume and produce, the equilibrium in the market can be inefficient.
Harcourt, Inc. items and derived items copyright © 2001 by Harcourt, Inc.
Summary
Consumer surplus measures the benefit buyers get from participating in a market.Consumer surplus can be computed by finding the area below the demand curve and above the price.
Harcourt, Inc. items and derived items copyright © 2001 by Harcourt, Inc.
Summary
Producer surplus measures the benefit sellers get from participating in a market.Producer surplus can be computed by finding the area below the price and above the supply curve.
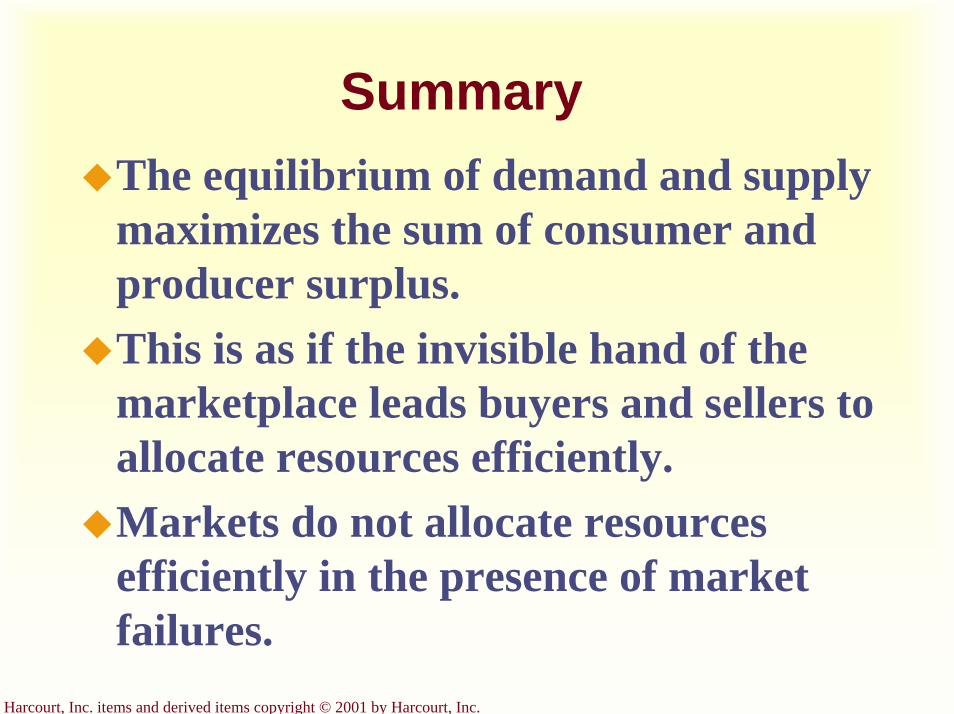
Harcourt, Inc. items and derived items copyright © 2001 by Harcourt, Inc.
SummaryThe equilibrium of demand and supply maximizes the sum of consumer and producer surplus.This is as if the invisible hand of the marketplace leads buyers and sellers to allocate resources efficiently.Markets do not allocate resources efficiently in the presence of market failures.
Harcourt, Inc. items and derived items copyright © 2001 by Harcourt, Inc.
SummaryAn allocation of resources that maximizes the sum of consumer and producer surplus is said to be efficient.Policymakers are often concerned with the efficiency, as well as the equity, of economic outcomes.

Harcourt, Inc. items and derived items copyright © 2001 by Harcourt, Inc.
Graphical Review
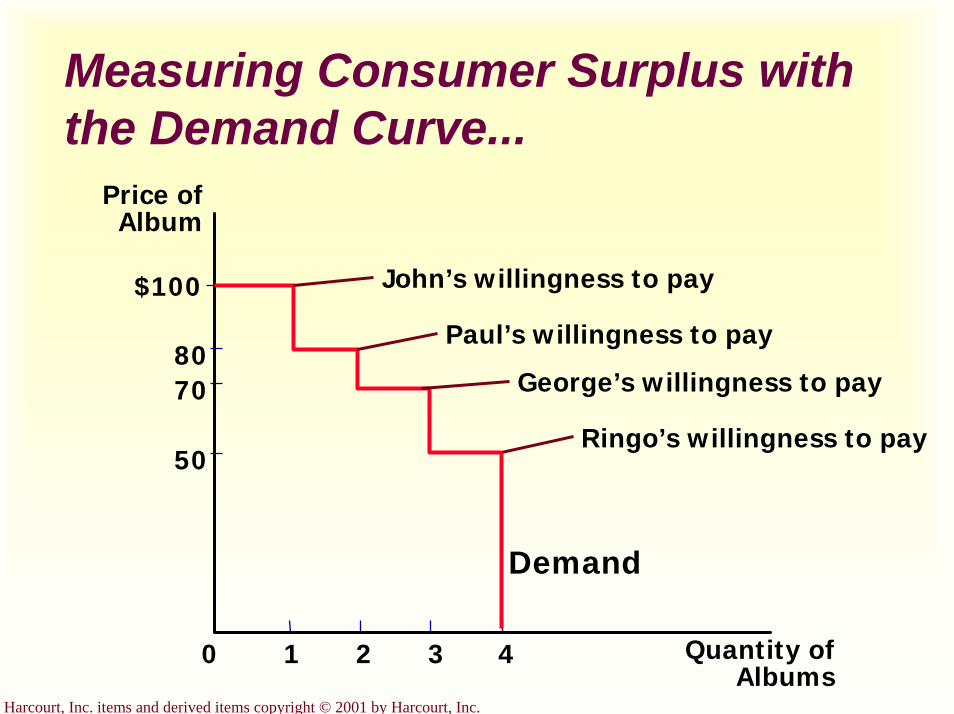
Harcourt, Inc. items and derived items copyright © 2001 by Harcourt, Inc.
Measuring Consumer Surplus with the Demand Curve...
Price ofAlbum
50
7080
0
$100
1 2 3 4 Quantity ofAlbums
John’s willingness to pay
Paul’s willingness to pay
George’s willingness to pay
Ringo’s willingness to pay
Demand

Harcourt, Inc. items and derived items copyright © 2001 by Harcourt, Inc.
Measuring Consumer Surplus with the Demand Curve...
Price ofAlbum
50
7080
0
$100
1 2 3 4 Quantity ofAlbums
Demand
John’s consumer surplus ($20)
Price = $80

Harcourt, Inc. items and derived items copyright © 2001 by Harcourt, Inc.
Measuring Consumer Surplus with the Demand Curve...
Price ofAlbum
50
7080
0
$100
1 2 3 4 Quantity ofAlbums
Demand
John’s consumer surplus ($30)
Total consumer surplus ($40)
Price = $70
Paul’s consumer surplus ($10)

How the Price Affects Consumer Surplus...
Q2
P2
Quantity
Price
0
Demand
Copyright © 2001 by Harcourt, Inc. All rights reserved
Initialconsumersurplus
Additional consumer surplus to initial consumers
Consumer surplus to new consumers
Q1
P1 BC
A
D EF

Harcourt, Inc. items and derived items copyright © 2001 by Harcourt, Inc.
Producer Surplus and the Supply Curve...
Quantity ofHouses Painted
Price ofHouse
Painting
500
800
$900
0
600
1 2 3 4
Grandma’s costGeorgia’s cost
Frida’s costMary’s cost
Supply

Harcourt, Inc. items and derived items copyright © 2001 by Harcourt, Inc.
Measuring Producer Surplus with the Supply Curve...
Quantity ofHouses Painted
Price ofHouse
Painting
500
800
$900
0
600
1 2 3 4
Supply
Grandma’s producersurplus ($100)
Price = $600
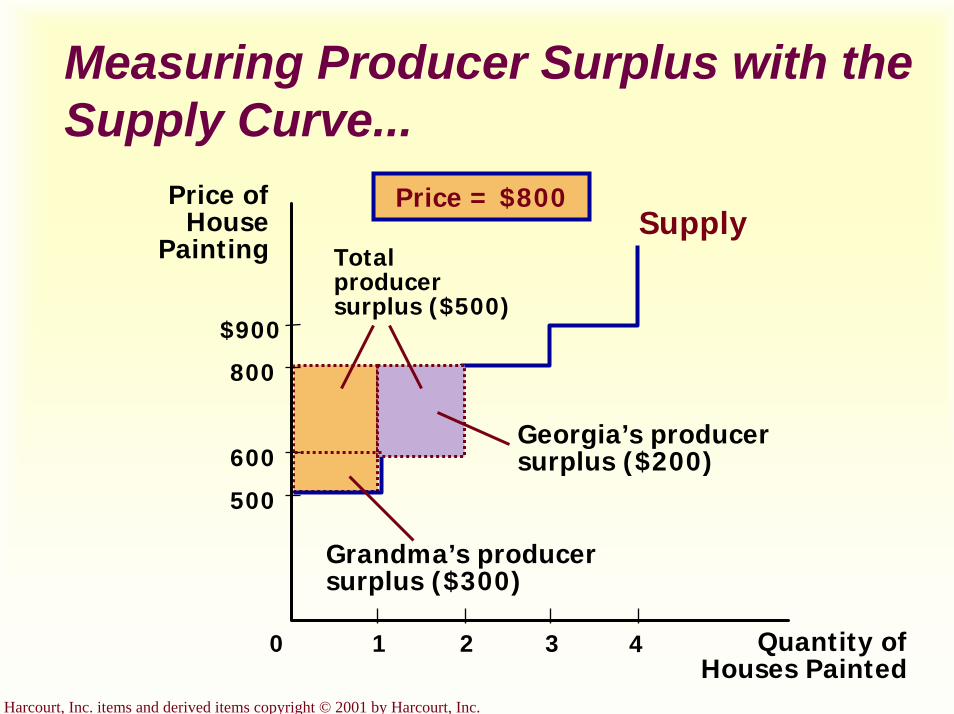
Harcourt, Inc. items and derived items copyright © 2001 by Harcourt, Inc.
Measuring Producer Surplus with the Supply Curve...
Quantity ofHouses Painted
Price ofHouse
Painting
500
800
$900
0
600
1 2 3 4
Supply
Grandma’s producersurplus ($300)
Price = $800
Georgia’s producersurplus ($200)
Totalproducersurplus ($500)
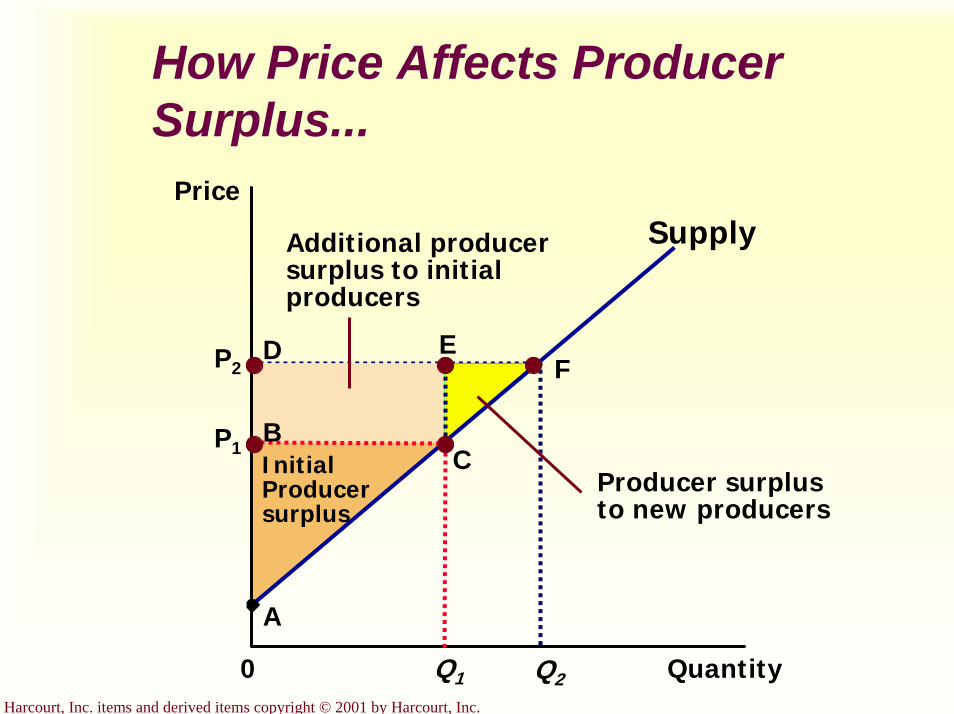
Harcourt, Inc. items and derived items copyright © 2001 by Harcourt, Inc.
How Price Affects Producer Surplus...
P2
Q2 Quantity
Price
0
Supply
Q1
P1
A
BCInitial
Producersurplus
Additional producersurplus to initialproducers
D EF
Producer surplusto new producers
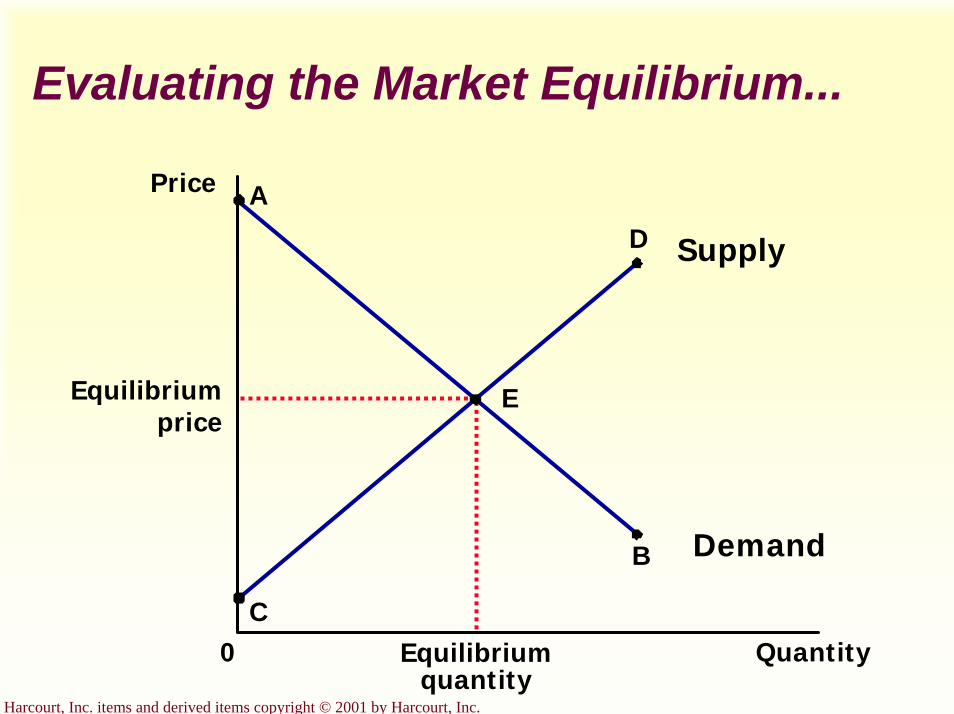
Harcourt, Inc. items and derived items copyright © 2001 by Harcourt, Inc.
Evaluating the Market Equilibrium...
Price
Equilibriumprice
0 QuantityEquilibriumquantity
A
Supply
C
B Demand
D
E

Harcourt, Inc. items and derived items copyright © 2001 by Harcourt, Inc.
Consumer and Producer Surplus in the Market Equilibrium...
Price
Equilibriumprice
0 QuantityEquilibriumquantity
A
Supply
C
B Demand
D
E
Producersurplus
Consumersurplus

Harcourt, Inc. items and derived items copyright © 2001 by Harcourt, Inc.
Price
0 QuantityEquilibriumquantity
Supply
Demand
Cost to sellers
Value to buyers
Value to
buyers
Cost to
sellers
Value to buyers is greater than cost to sellers.
Value to buyers is less than cost to sellers.
The Efficiency of the Equilibrium Quantity
Application:The Costs of Taxation
Chapter 8
Copyright © 2001 by Harcourt, Inc.
All rights reserved. Requests for permission to make copies of any part of thework should be mailed to:
Permissions Department, Harcourt College Publishers,6277 Sea Harbor Drive, Orlando, Florida 32887-6777.

Harcourt, Inc. items and derived items copyright © 2001 by Harcourt, Inc.
The Costs of Taxation
How do taxes affect the economic well-being of market participants?
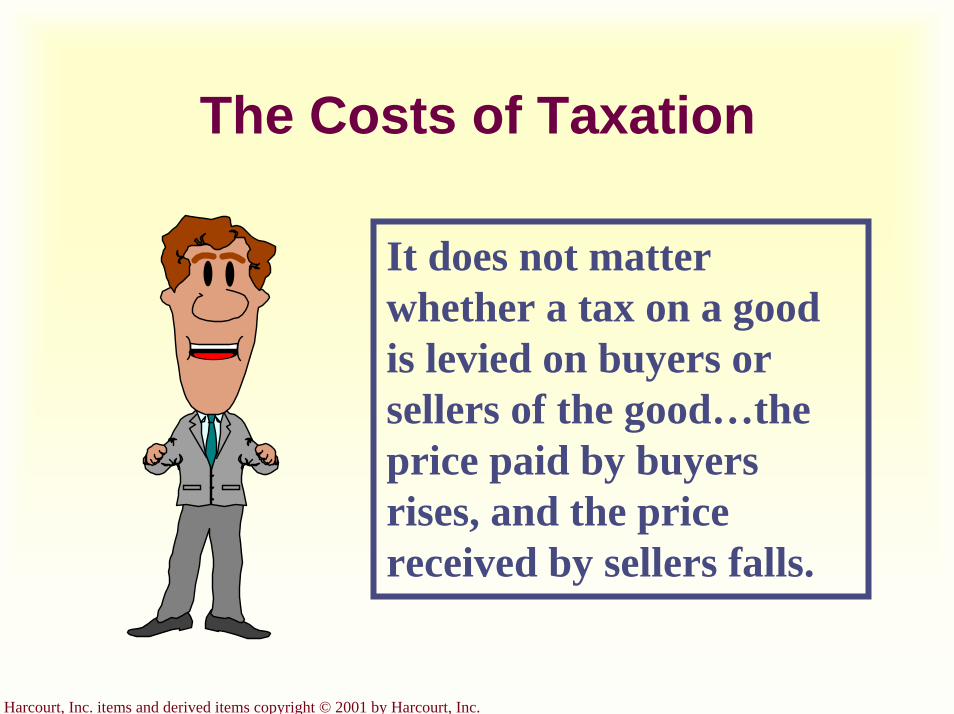
Harcourt, Inc. items and derived items copyright © 2001 by Harcourt, Inc.
The Costs of Taxation
It does not matter whether a tax on a good is levied on buyers or sellers of the good…the price paid by buyers rises, and the price received by sellers falls.

Harcourt, Inc. items and derived items copyright © 2001 by Harcourt, Inc.
The Effects of a Tax...Price
0 QuantityQuantity without tax
Supply
Demand
Price without tax
Price buyers pay
Quantity with tax
Size of tax
Price sellers receive
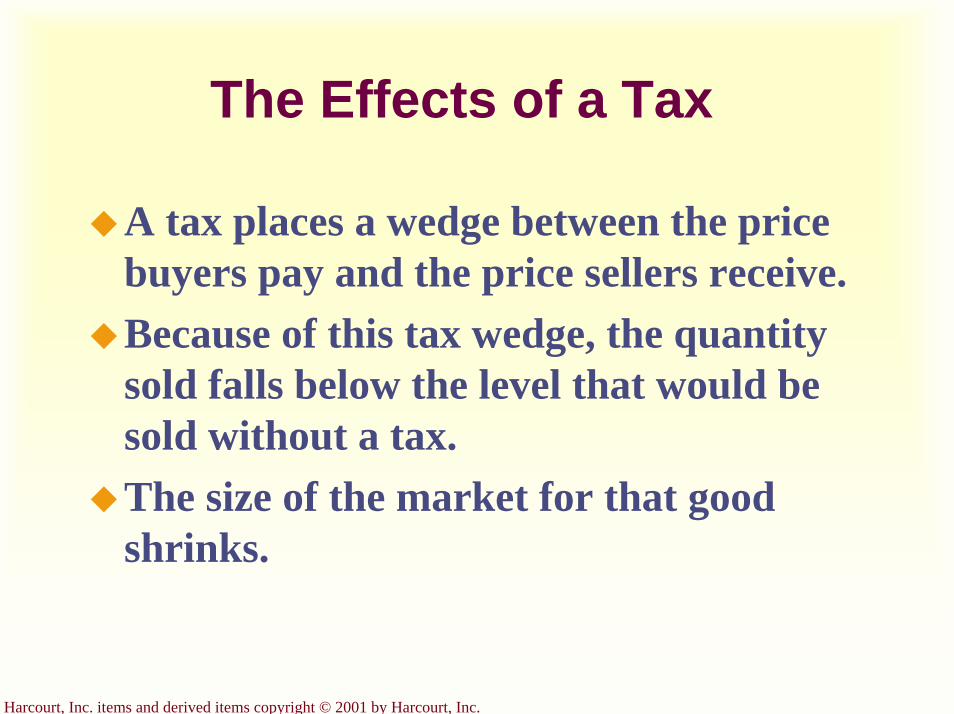
Harcourt, Inc. items and derived items copyright © 2001 by Harcourt, Inc.
The Effects of a Tax
A tax places a wedge between the price buyers pay and the price sellers receive. Because of this tax wedge, the quantity sold falls below the level that would be sold without a tax.The size of the market for that good shrinks.
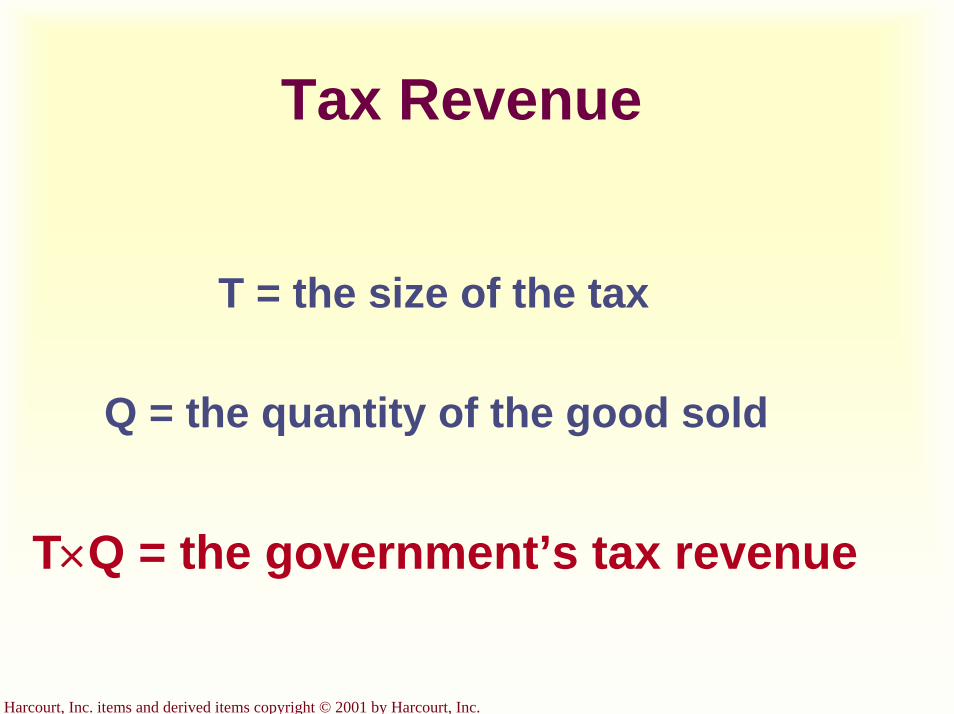
Harcourt, Inc. items and derived items copyright © 2001 by Harcourt, Inc.
Tax Revenue
T = the size of the tax
Q = the quantity of the good sold
T×Q = the government’s tax revenue

Harcourt, Inc. items and derived items copyright © 2001 by Harcourt, Inc.
Tax Revenue...Price
0 QuantityQuantity without tax
Supply
Demand
Price buyers pay
Price sellers receive
Quantity with tax
Size of tax (T)
Quantity sold (Q)
Tax Revenue (T x Q)
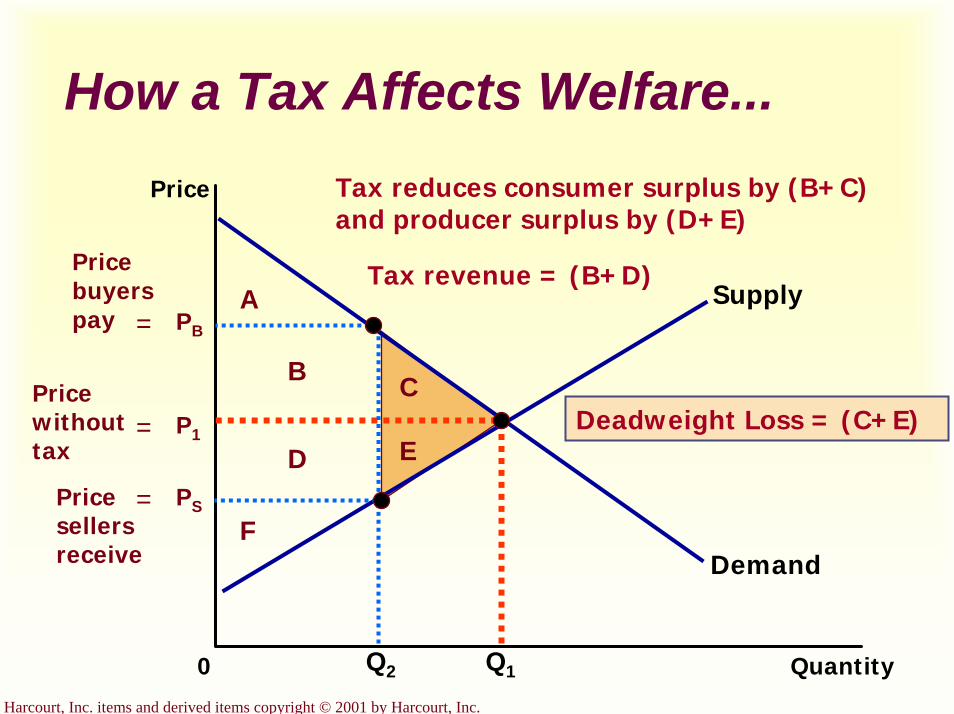
Harcourt, Inc. items and derived items copyright © 2001 by Harcourt, Inc.
How a Tax Affects Welfare...
Quantity0
Price
Demand
Supply
Q1
A
B C
F
D E
Q2
Tax reduces consumer surplus by (B+C) and producer surplus by (D+E)
Tax revenue = (B+D)
Deadweight Loss = (C+E)
Price buyerspay = PB
P1
Price without tax
=
PSPrice sellers receive
=
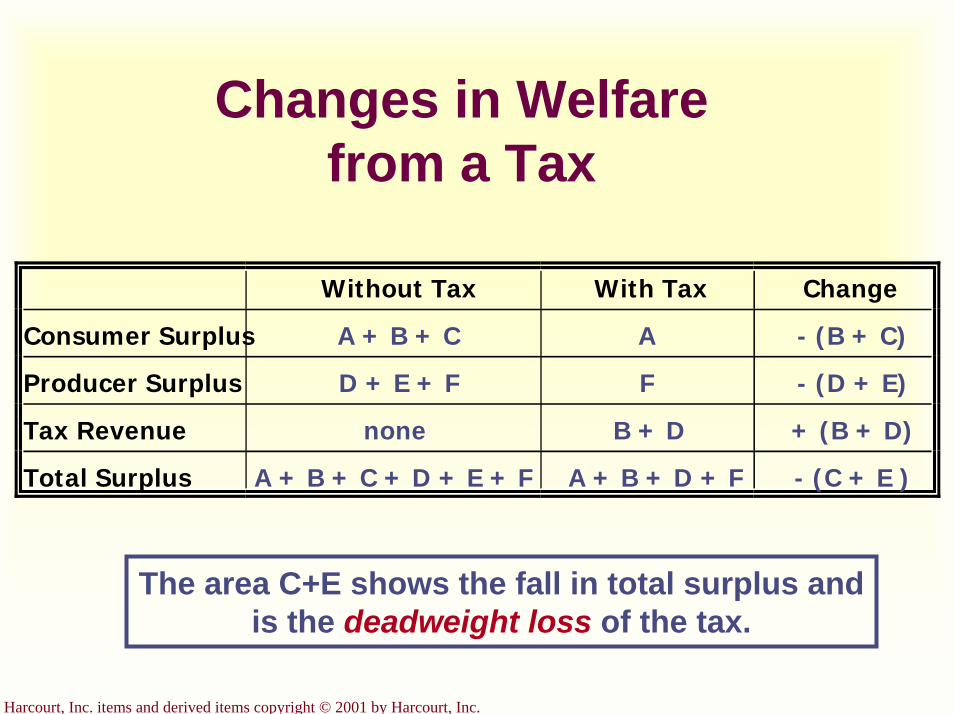
Harcourt, Inc. items and derived items copyright © 2001 by Harcourt, Inc.
Changes in Welfare from a Tax
Without Tax With Tax Change
Consumer Surplus A + B + C A - (B + C)
Producer Surplus D + E + F F - (D + E)
Tax Revenue none B + D + (B + D)
Total Surplus A + B + C + D + E + F A + B + D + F - (C + E )
The area C+E shows the fall in total surplus and is the deadweight loss of the tax.
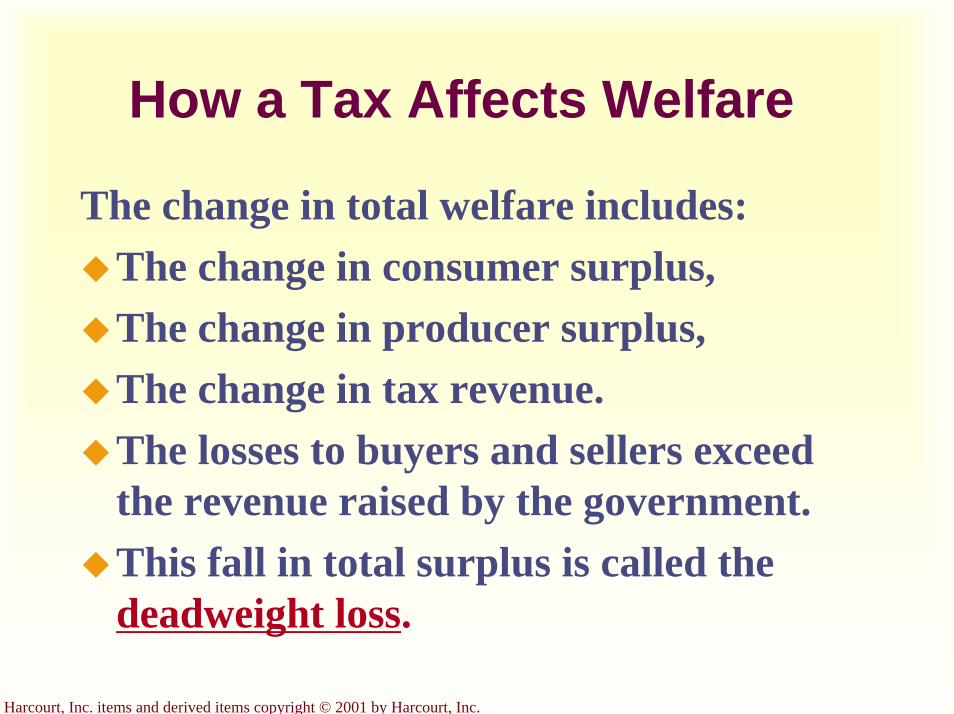
Harcourt, Inc. items and derived items copyright © 2001 by Harcourt, Inc.
How a Tax Affects Welfare
The change in total welfare includes:The change in consumer surplus,The change in producer surplus,The change in tax revenue.The losses to buyers and sellers exceed the revenue raised by the government.This fall in total surplus is called the deadweight loss.
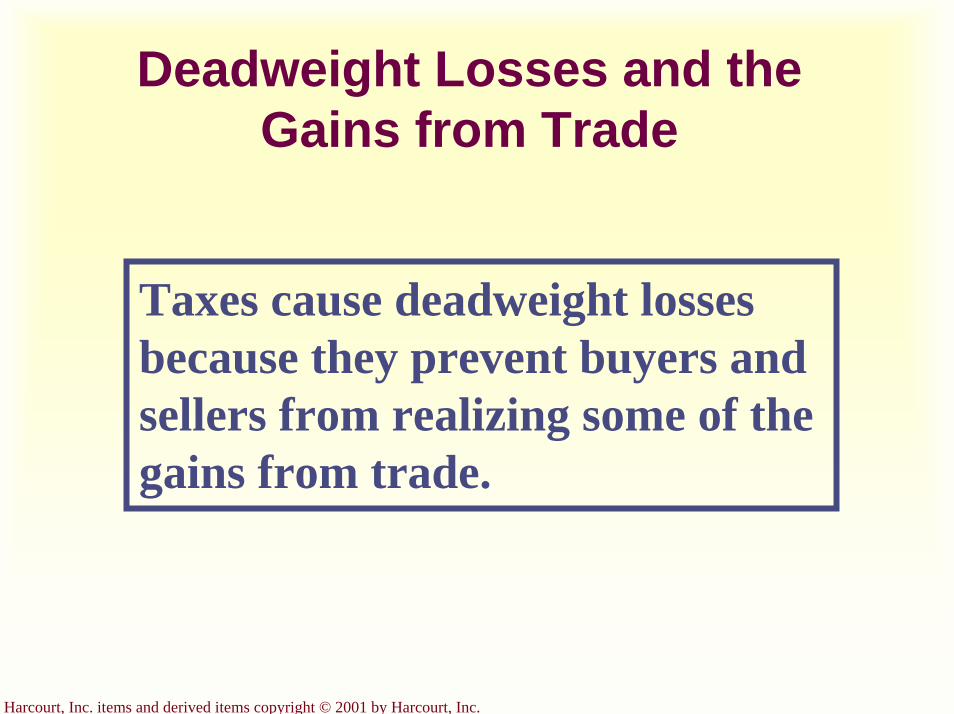
Harcourt, Inc. items and derived items copyright © 2001 by Harcourt, Inc.
Deadweight Losses and the Gains from Trade
Taxes cause deadweight losses because they prevent buyers and sellers from realizing some of the gains from trade.
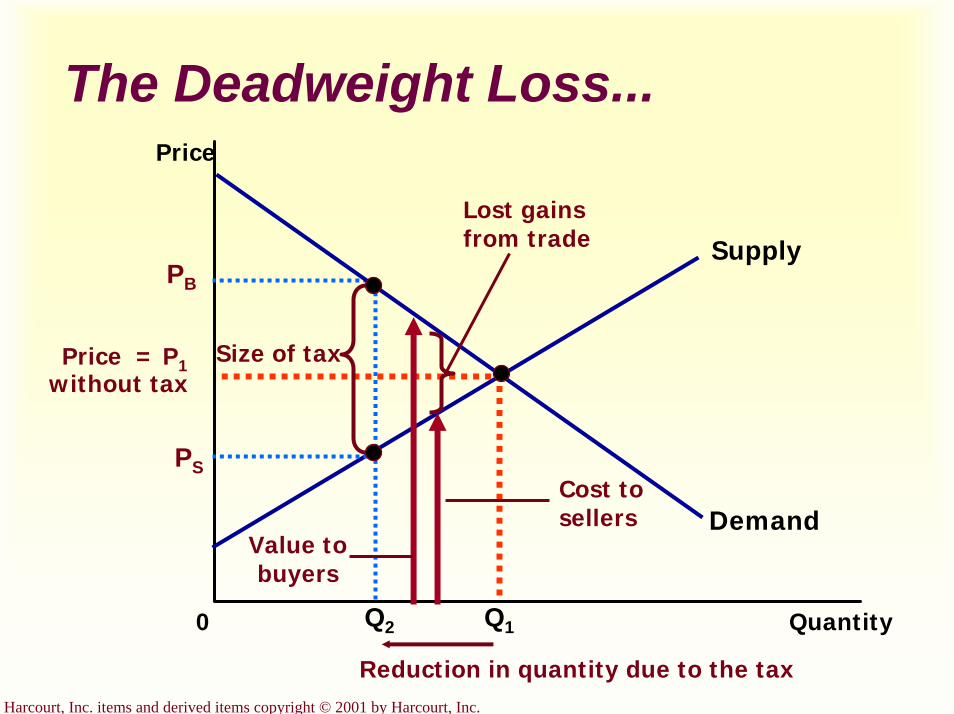
Harcourt, Inc. items and derived items copyright © 2001 by Harcourt, Inc.
The Deadweight Loss...
Quantity0
Price
Demand
Supply
Q1
PB
Price = P1without tax
PS
Q2
Size of tax
Lost gains from trade
Cost to sellers
Value to buyers
Reduction in quantity due to the tax
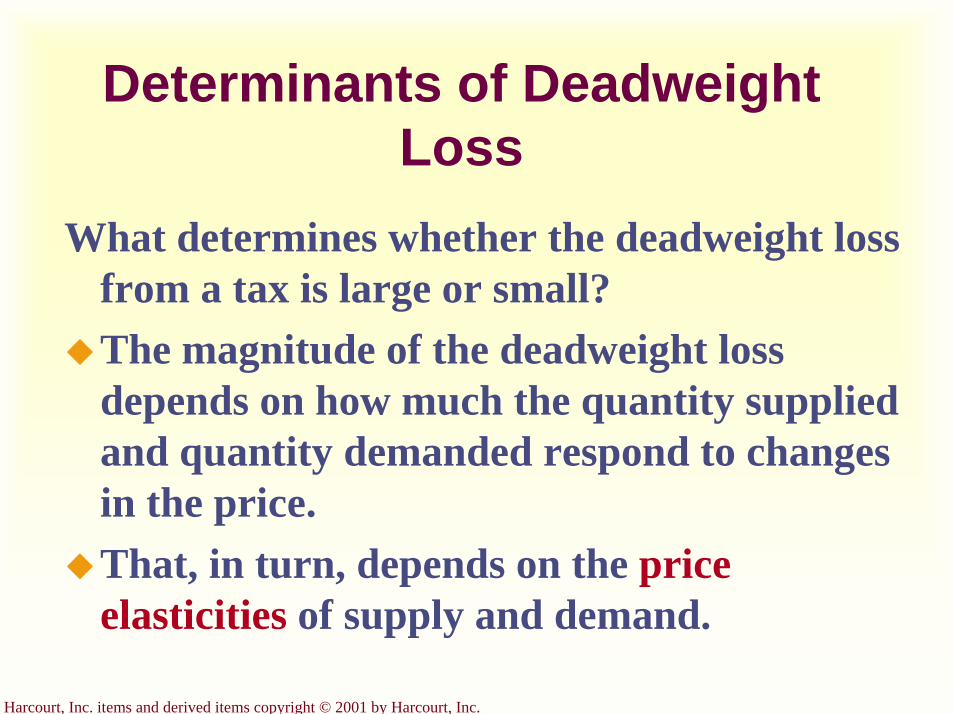
Harcourt, Inc. items and derived items copyright © 2001 by Harcourt, Inc.
Determinants of Deadweight Loss
What determines whether the deadweight loss from a tax is large or small?The magnitude of the deadweight loss depends on how much the quantity supplied and quantity demanded respond to changes in the price. That, in turn, depends on the price elasticities of supply and demand.

Harcourt, Inc. items and derived items copyright © 2001 by Harcourt, Inc.
Tax Distortions and Elasticities...
(a) Inelastic Supply
Quantity
Price
Demand
Supply
0
When supply isrelatively inelastic,the deadweight loss of a tax is small.
Size of tax

Harcourt, Inc. items and derived items copyright © 2001 by Harcourt, Inc.
Tax Distortions and Elasticities...
(b) Elastic Supply
Quantity
Price
Demand
Supply
Size of tax
When supply isrelatively elastic,the deadweight loss of a tax is large.
0

Harcourt, Inc. items and derived items copyright © 2001 by Harcourt, Inc.
Tax Distortions and Elasticities...
Quantity
Price
Demand
Supply
0
When demand isrelatively inelastic,the deadweight loss of a tax is small.
(c) Inelastic Demand
Size of tax
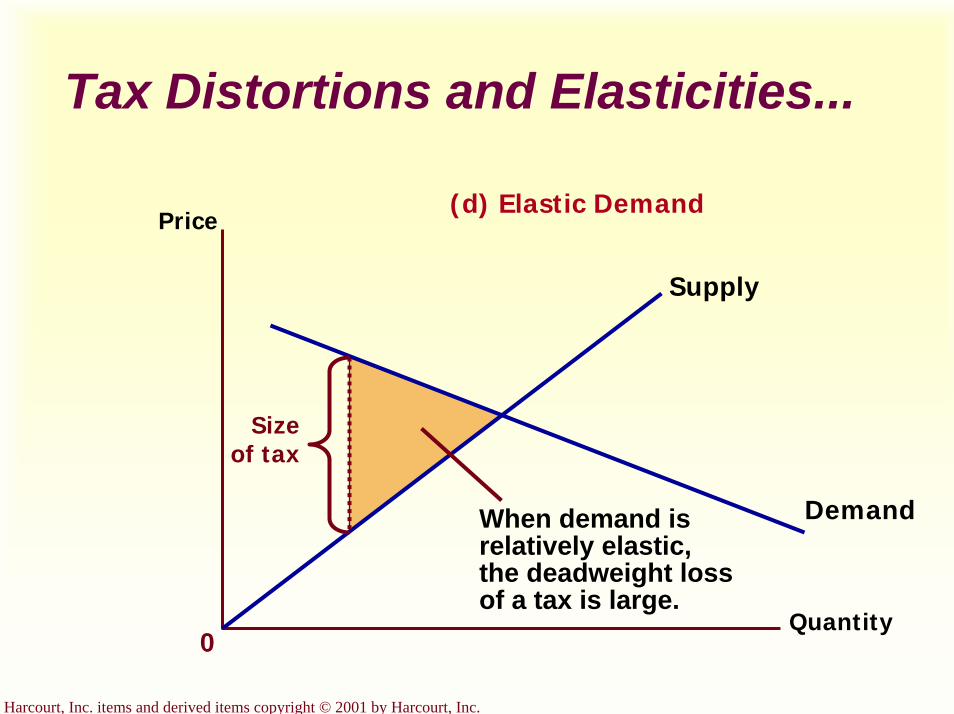
Harcourt, Inc. items and derived items copyright © 2001 by Harcourt, Inc.
Tax Distortions and Elasticities...
Quantity
Price
Demand
Supply
0
Size of tax
When demand isrelatively elastic,the deadweight loss of a tax is large.
(d) Elastic Demand
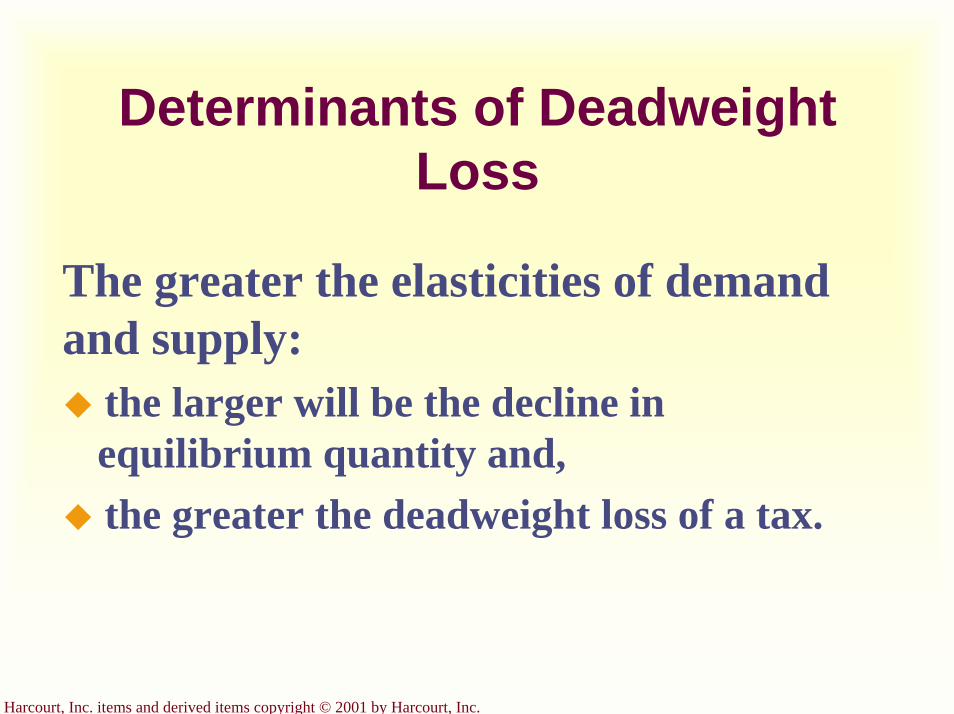
Harcourt, Inc. items and derived items copyright © 2001 by Harcourt, Inc.
Determinants of Deadweight Loss
The greater the elasticities of demand and supply:
the larger will be the decline in equilibrium quantity and,the greater the deadweight loss of a tax.
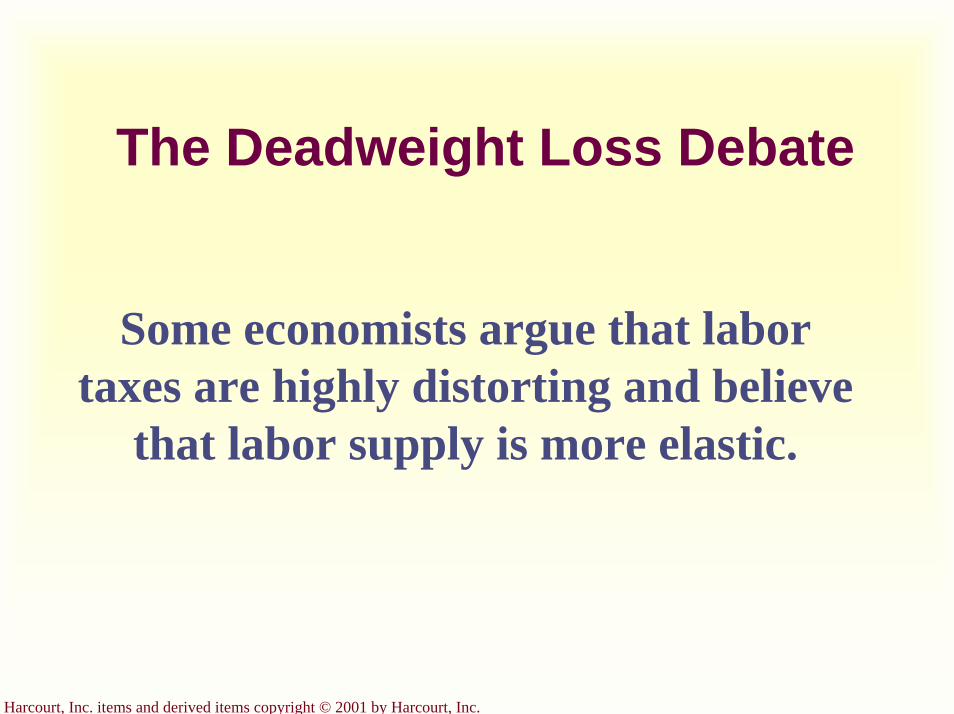
Harcourt, Inc. items and derived items copyright © 2001 by Harcourt, Inc.
The Deadweight Loss Debate
Some economists argue that labor taxes are highly distorting and believe
that labor supply is more elastic.
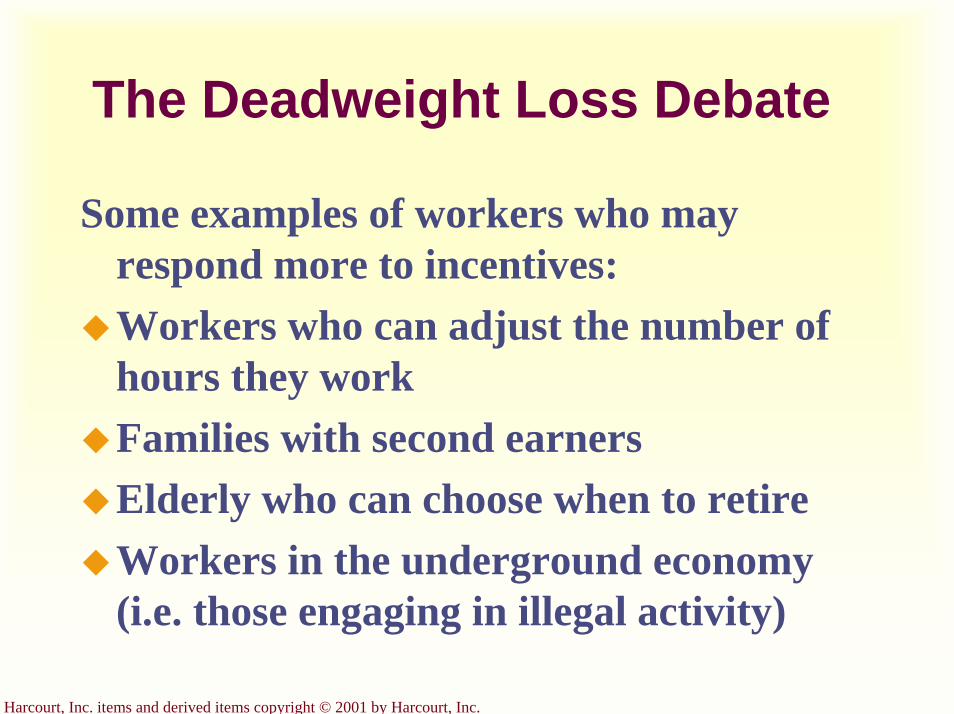
Harcourt, Inc. items and derived items copyright © 2001 by Harcourt, Inc.
The Deadweight Loss Debate
Some examples of workers who may respond more to incentives:Workers who can adjust the number of hours they workFamilies with second earnersElderly who can choose when to retireWorkers in the underground economy (i.e. those engaging in illegal activity)
Harcourt, Inc. items and derived items copyright © 2001 by Harcourt, Inc.
Deadweight Loss and Tax Revenue as Taxes Vary
With each increase in the tax rate, the deadweight loss of the
tax rises even more rapidly than the size of the tax.
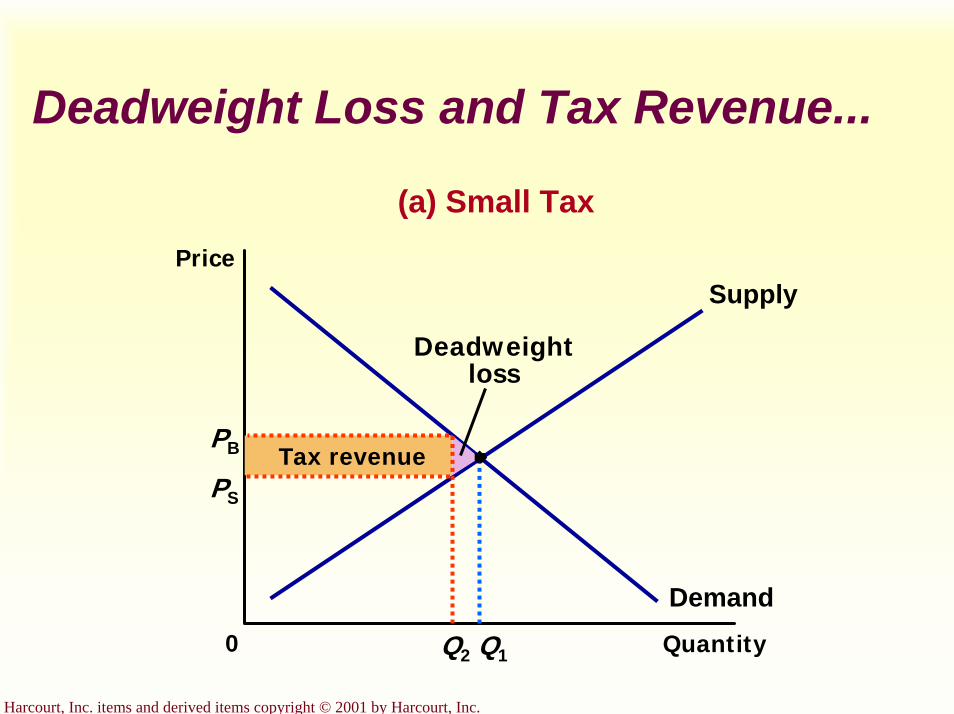
Harcourt, Inc. items and derived items copyright © 2001 by Harcourt, Inc.
Deadweight Loss and Tax Revenue...
(a) Small Tax
PB
QuantityQ20
Price
Q1
Demand
Supply
Tax revenuePS
Deadweightloss

Harcourt, Inc. items and derived items copyright © 2001 by Harcourt, Inc.
Deadweight Loss and Tax Revenue...
(b) Medium Tax
Demand
Supply
Taxrevenue
PB
QuantityQ20
Price
Q1
PS
Deadweightloss

Harcourt, Inc. items and derived items copyright © 2001 by Harcourt, Inc.
Deadweight Loss and Tax Revenue...
(c) Large Tax
Tax
reve
nu
e
PB
QuantityQ20
Price
Q1
Demand
Supply
PS
Deadweightloss
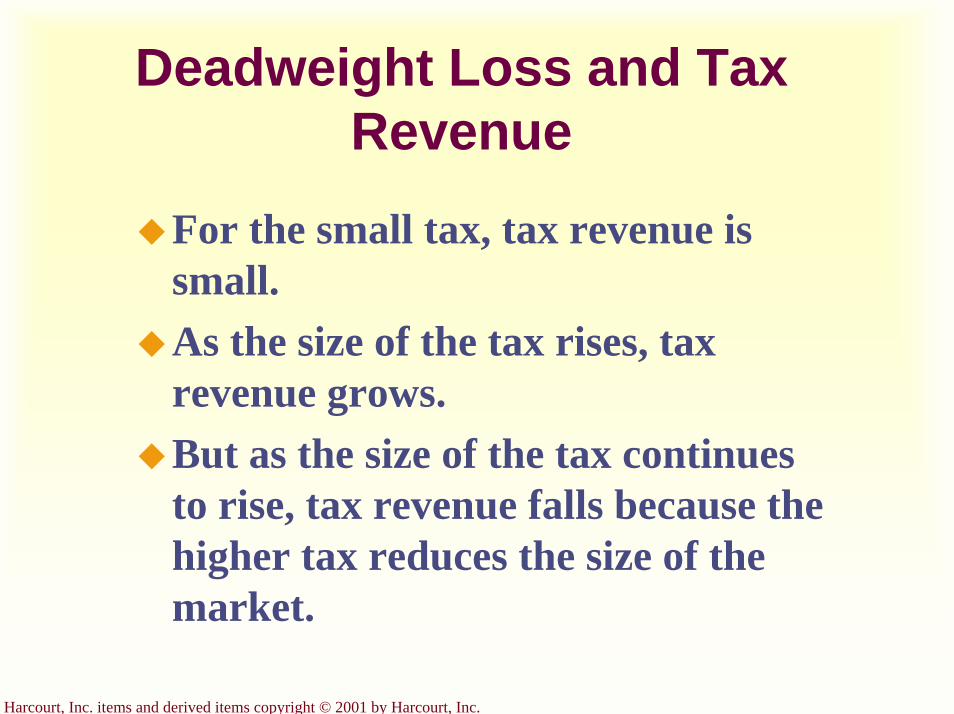
Harcourt, Inc. items and derived items copyright © 2001 by Harcourt, Inc.
Deadweight Loss and Tax Revenue
For the small tax, tax revenue is small.As the size of the tax rises, tax revenue grows.But as the size of the tax continues to rise, tax revenue falls because the higher tax reduces the size of the market.
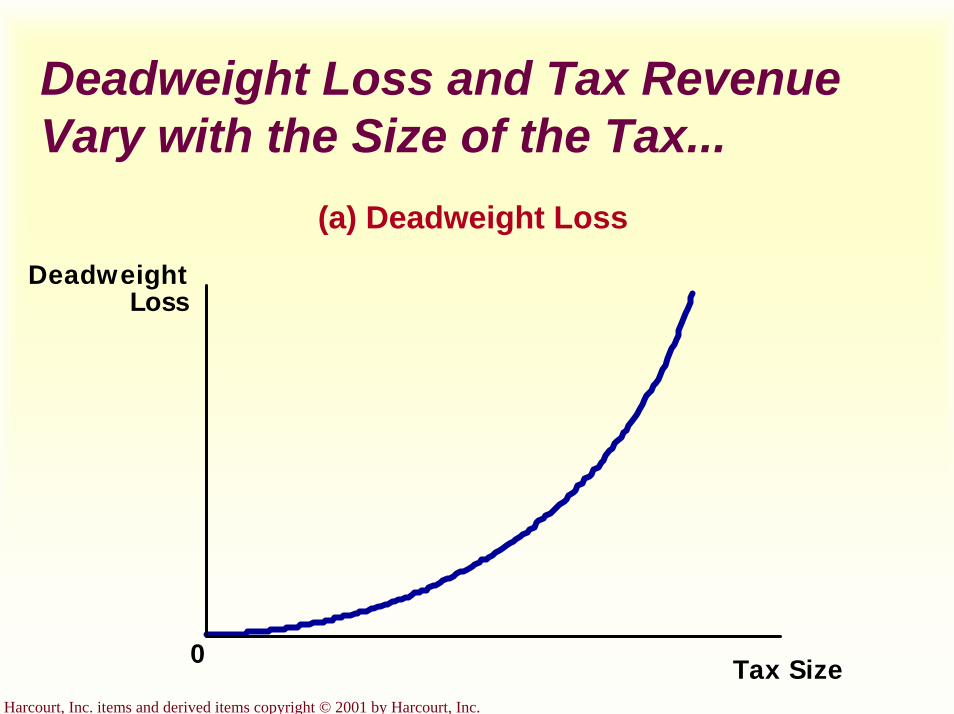
Harcourt, Inc. items and derived items copyright © 2001 by Harcourt, Inc.
Deadweight Loss and Tax Revenue Vary with the Size of the Tax...
(a) Deadweight Loss
DeadweightLoss
0 Tax Size

Harcourt, Inc. items and derived items copyright © 2001 by Harcourt, Inc.
Deadweight Loss and Tax Revenue Vary with the Size of the Tax...
(b) Revenue (the Laffer curve)TaxRevenue
0 Tax Size
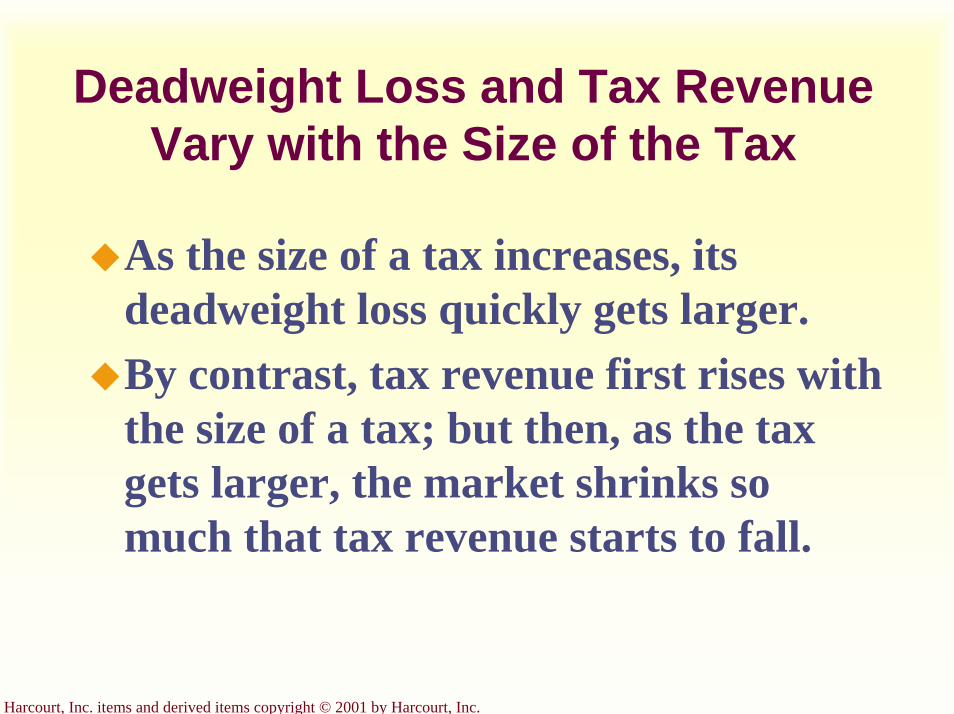
Harcourt, Inc. items and derived items copyright © 2001 by Harcourt, Inc.
Deadweight Loss and Tax Revenue Vary with the Size of the Tax
As the size of a tax increases, its deadweight loss quickly gets larger.By contrast, tax revenue first rises with the size of a tax; but then, as the tax gets larger, the market shrinks so much that tax revenue starts to fall.
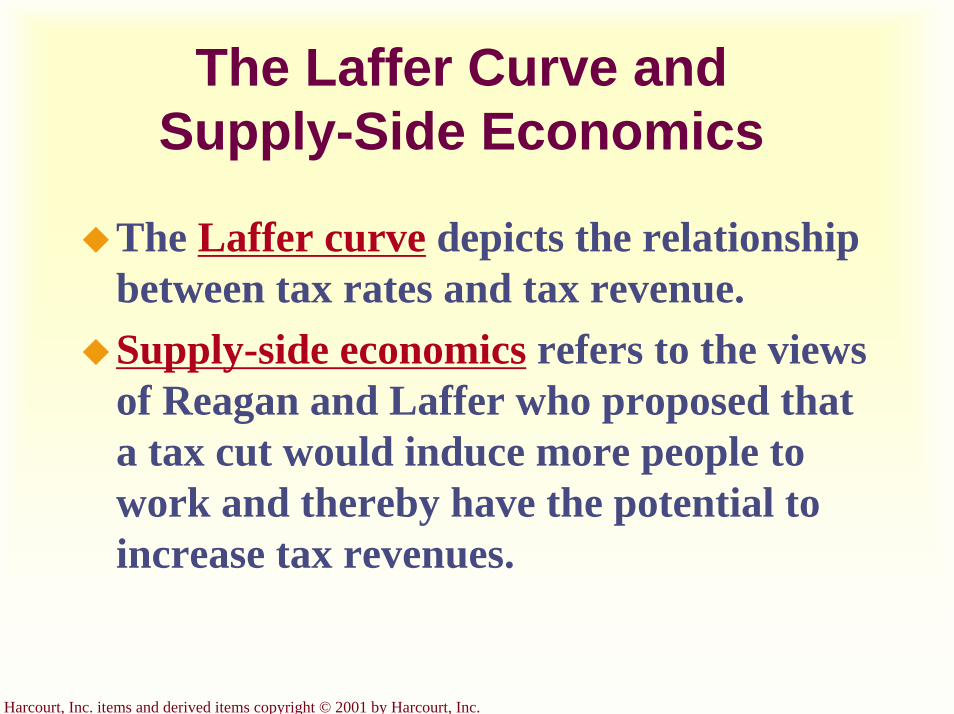
Harcourt, Inc. items and derived items copyright © 2001 by Harcourt, Inc.
The Laffer Curve and Supply-Side Economics
The Laffer curve depicts the relationship between tax rates and tax revenue.Supply-side economics refers to the views of Reagan and Laffer who proposed that a tax cut would induce more people to work and thereby have the potential to increase tax revenues.
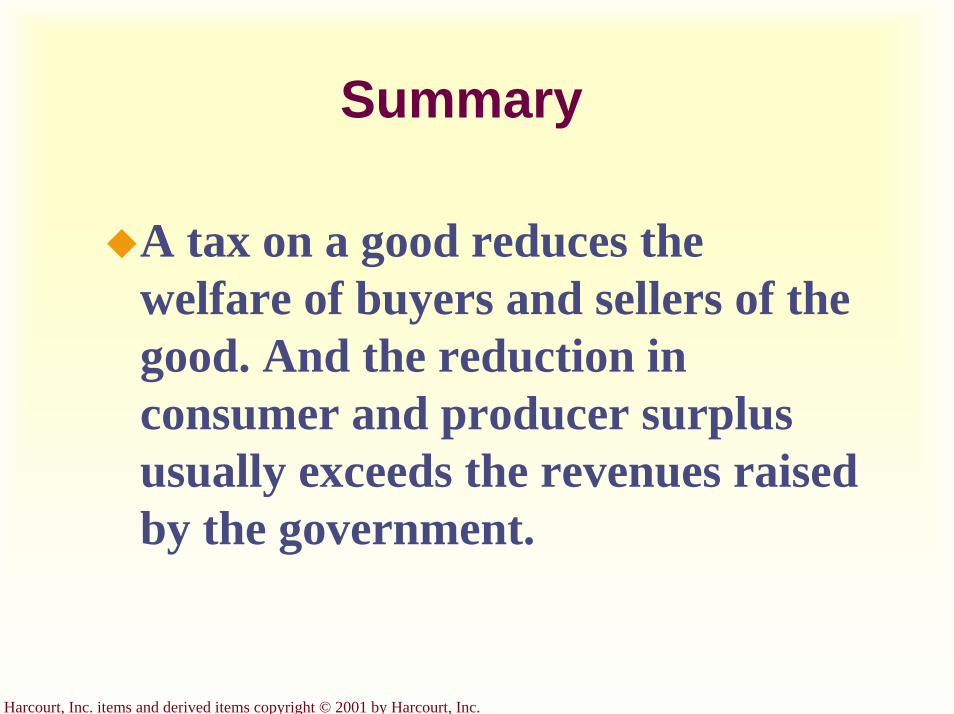
Harcourt, Inc. items and derived items copyright © 2001 by Harcourt, Inc.
Summary
A tax on a good reduces the welfare of buyers and sellers of the good. And the reduction in consumer and producer surplus usually exceeds the revenues raised by the government.
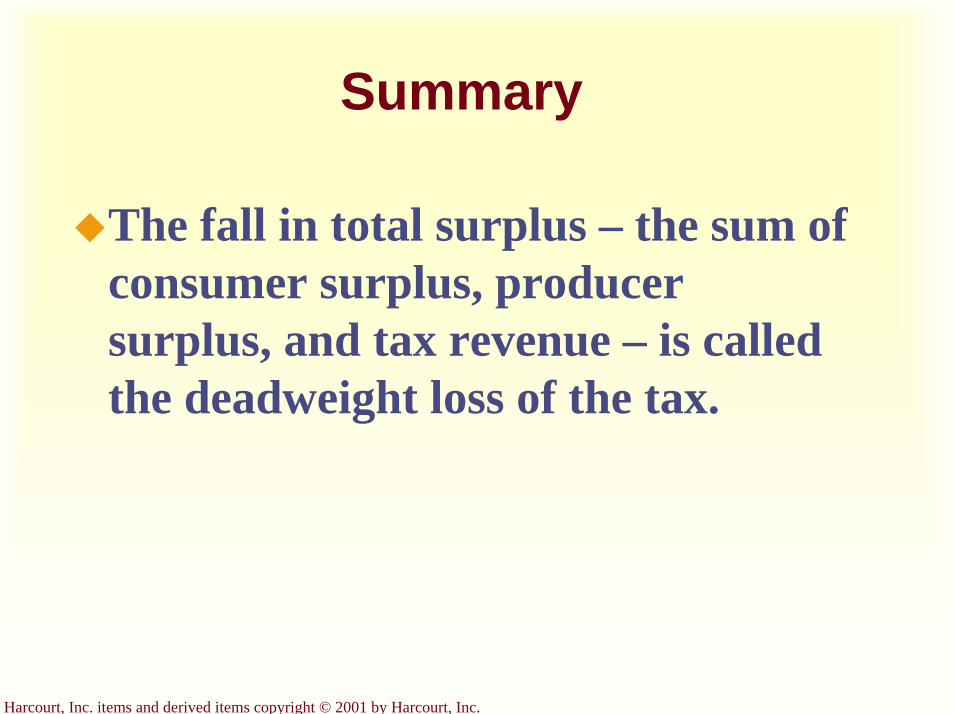
Harcourt, Inc. items and derived items copyright © 2001 by Harcourt, Inc.
Summary
The fall in total surplus – the sum of consumer surplus, producer surplus, and tax revenue – is called the deadweight loss of the tax.
Harcourt, Inc. items and derived items copyright © 2001 by Harcourt, Inc.
SummaryTaxes have a deadweight loss because they cause buyers to consume less and sellers to produce less.This change in behavior shrinks the size of the market below the level that maximizes total surplus.
Harcourt, Inc. items and derived items copyright © 2001 by Harcourt, Inc.
SummaryAs a tax grows larger, it distorts incentives more, and its deadweight loss grows larger.Tax revenue first rises with the size of a tax.Eventually, however, a larger tax reduces tax revenue because it reduces the size of the market.

Harcourt, Inc. items and derived items copyright © 2001 by Harcourt, Inc.
Graphical Review
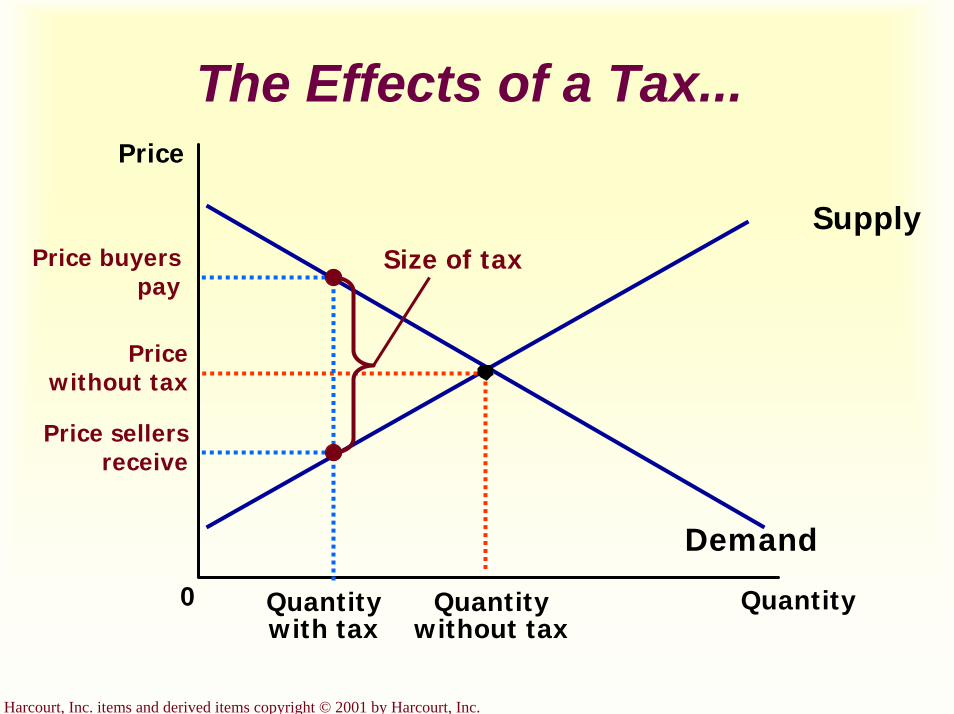
Harcourt, Inc. items and derived items copyright © 2001 by Harcourt, Inc.
The Effects of a Tax...Price
0 QuantityQuantity without tax
Supply
Demand
Price without tax
Price buyers pay
Quantity with tax
Size of tax
Price sellers receive
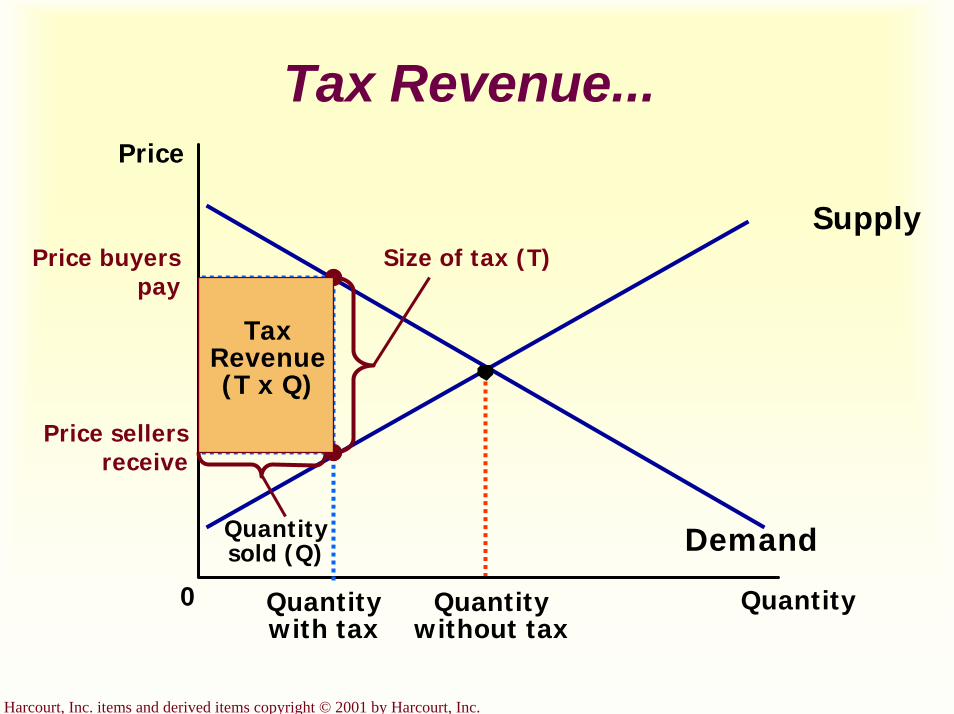
Harcourt, Inc. items and derived items copyright © 2001 by Harcourt, Inc.
Tax Revenue...Price
0 QuantityQuantity without tax
Supply
Demand
Price buyers pay
Price sellers receive
Quantity with tax
Size of tax (T)
Quantity sold (Q)
Tax Revenue (T x Q)

Harcourt, Inc. items and derived items copyright © 2001 by Harcourt, Inc.
How a Tax Affects Welfare...
Quantity0
Price
Demand
Supply
Q1
A
B C
F
D E
Q2
Tax reduces consumer surplus by (B+C) and producer surplus by (D+E)
Tax revenue = (B+D)
Deadweight Loss = (C+E)
Price buyerspay = PB
P1
Price without tax
=
PSPrice sellers receive
=

Harcourt, Inc. items and derived items copyright © 2001 by Harcourt, Inc.
The Deadweight Loss...
Quantity0
Price
Demand
Supply
Q1
PB
Price = P1without tax
PS
Q2
Size of tax
Lost gains from trade
Cost to sellers
Value to buyers
Reduction in quantity due to the tax
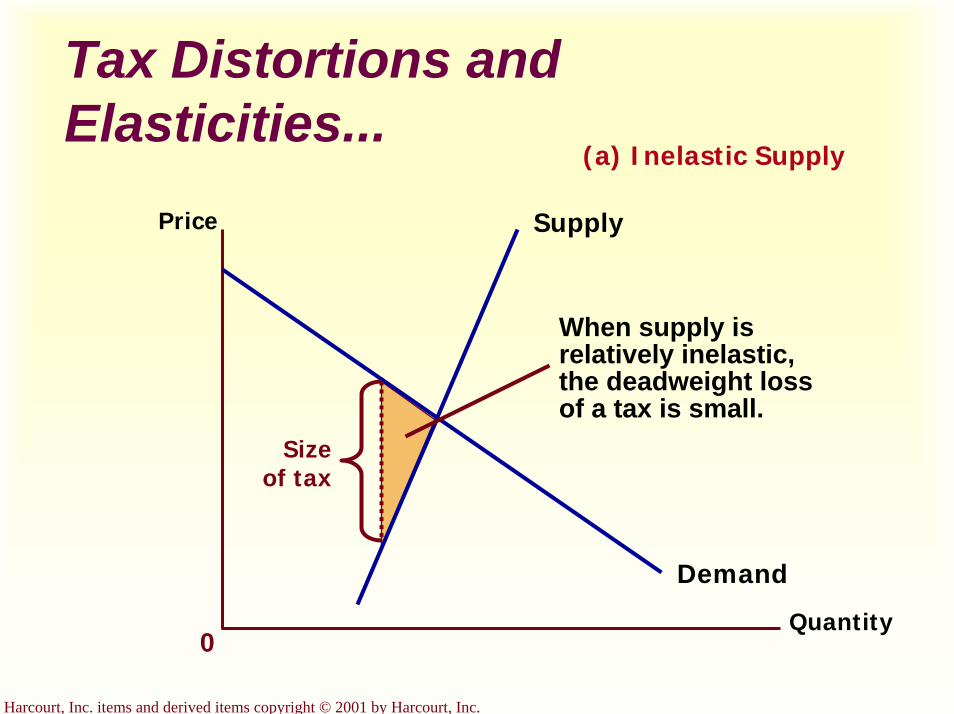
Harcourt, Inc. items and derived items copyright © 2001 by Harcourt, Inc.
Tax Distortions and Elasticities...
(a) Inelastic Supply
Quantity
Price
Demand
Supply
0
When supply isrelatively inelastic,the deadweight loss of a tax is small.
Size of tax
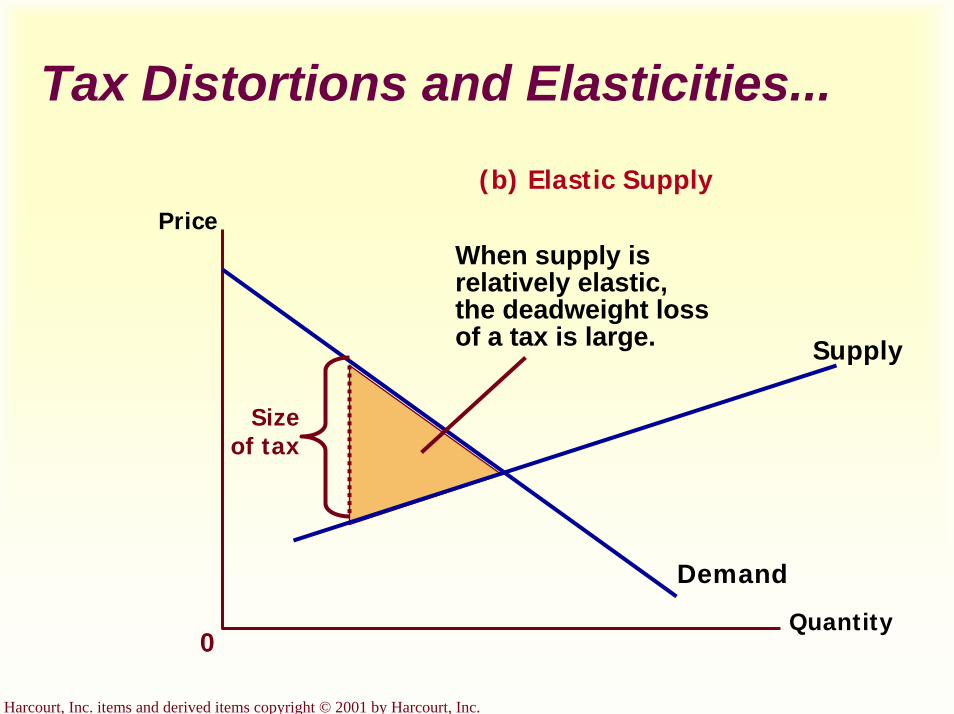
Harcourt, Inc. items and derived items copyright © 2001 by Harcourt, Inc.
Tax Distortions and Elasticities...
(b) Elastic Supply
Quantity
Price
Demand
Supply
Size of tax
When supply isrelatively elastic,the deadweight loss of a tax is large.
0
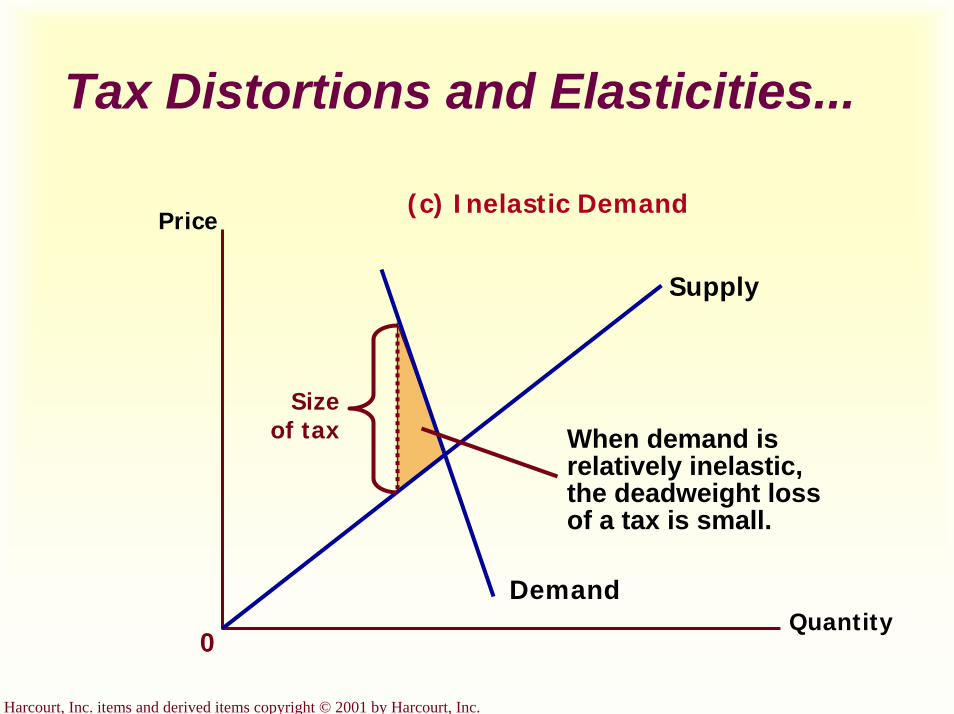
Harcourt, Inc. items and derived items copyright © 2001 by Harcourt, Inc.
Tax Distortions and Elasticities...
Quantity
Price
Demand
Supply
0
When demand isrelatively inelastic,the deadweight loss of a tax is small.
(c) Inelastic Demand
Size of tax

Harcourt, Inc. items and derived items copyright © 2001 by Harcourt, Inc.
Tax Distortions and Elasticities...
Quantity
Price
Demand
Supply
0
Size of tax
When demand isrelatively elastic,the deadweight loss of a tax is large.
(d) Elastic Demand

Harcourt, Inc. items and derived items copyright © 2001 by Harcourt, Inc.
Deadweight Loss and Tax Revenue...
(a) Small Tax
PB
QuantityQ20
Price
Q1
Demand
Supply
Tax revenuePS
Deadweightloss
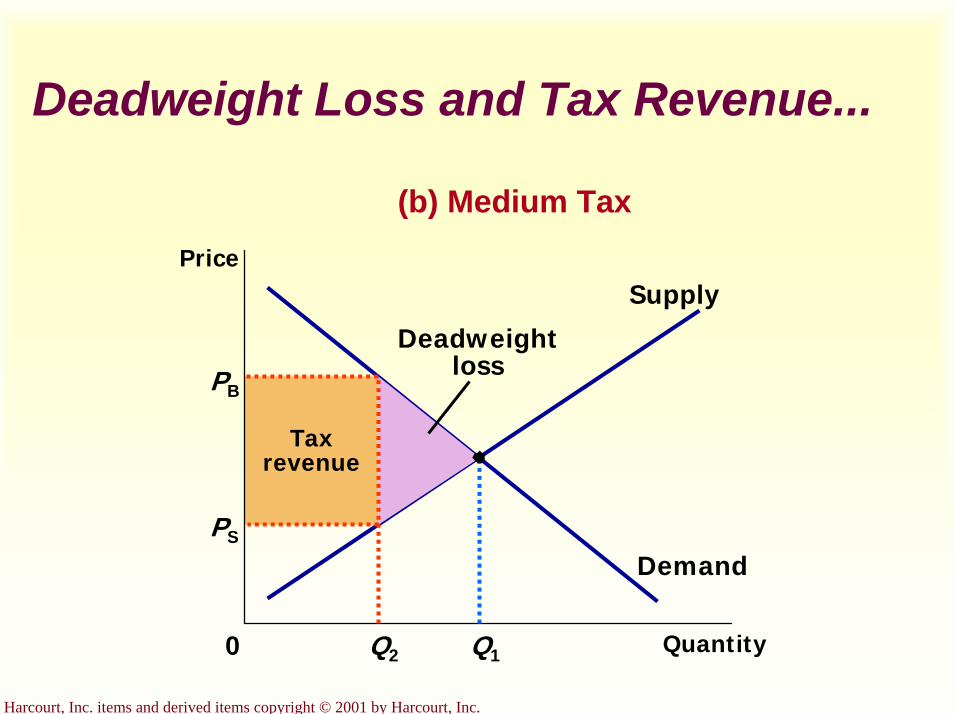
Harcourt, Inc. items and derived items copyright © 2001 by Harcourt, Inc.
Deadweight Loss and Tax Revenue...
(b) Medium Tax
Demand
Supply
Taxrevenue
PB
QuantityQ20
Price
Q1
PS
Deadweightloss
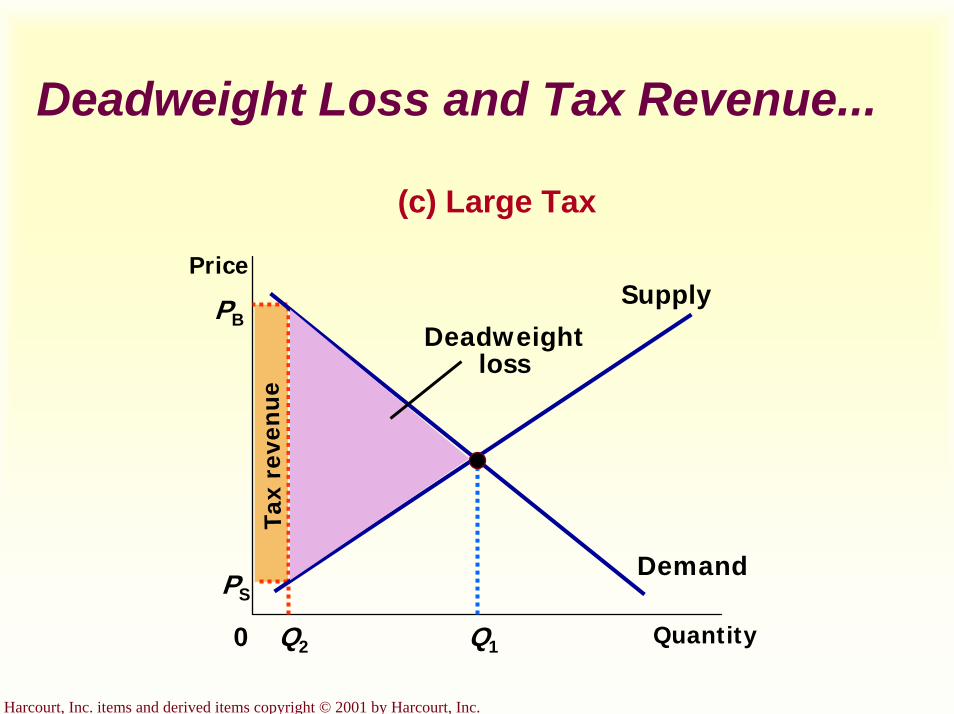
Harcourt, Inc. items and derived items copyright © 2001 by Harcourt, Inc.
Deadweight Loss and Tax Revenue...
(c) Large Tax
Tax
reve
nu
e
PB
QuantityQ20
Price
Q1
Demand
Supply
PS
Deadweightloss

Harcourt, Inc. items and derived items copyright © 2001 by Harcourt, Inc.
Deadweight Loss and Tax Revenue Vary with the Size of the Tax...
(a) Deadweight Loss
DeadweightLoss
0 Tax Size
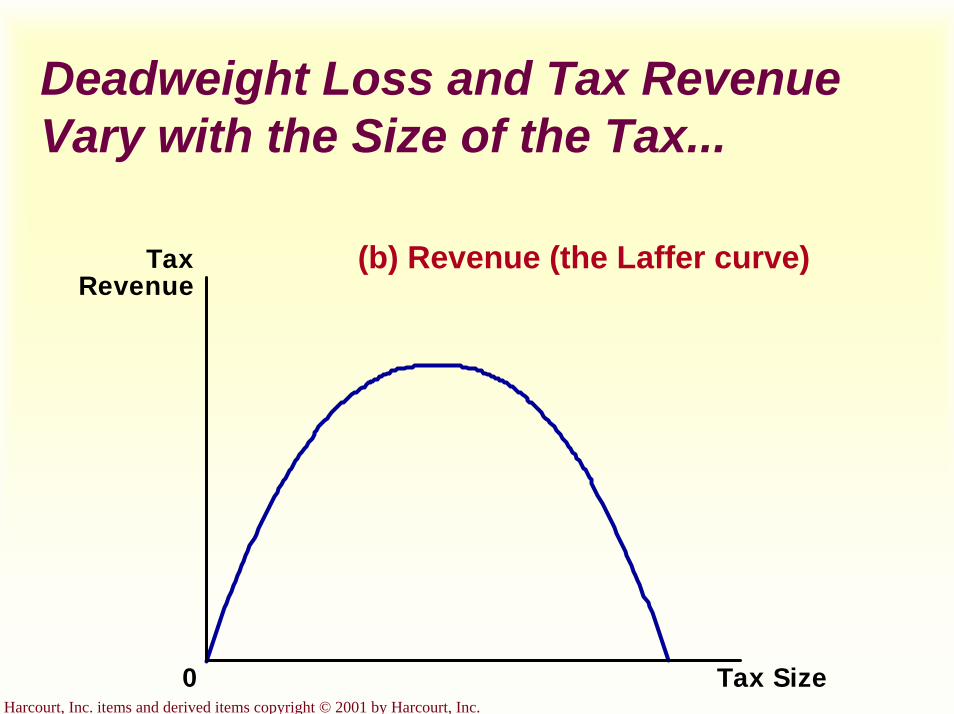
Harcourt, Inc. items and derived items copyright © 2001 by Harcourt, Inc.
Deadweight Loss and Tax Revenue Vary with the Size of the Tax...
(b) Revenue (the Laffer curve)TaxRevenue
0 Tax Size

Harcourt, Inc. items and derived items copyright © 2001 by Harcourt, Inc.
Application:International Trade
Chapter 9
Copyright © 2001 by Harcourt, Inc.
All rights reserved. Requests for permission to make copies of any part of thework should be mailed to:
Permissions Department, Harcourt College Publishers,6277 Sea Harbor Drive, Orlando, Florida 32887-6777.
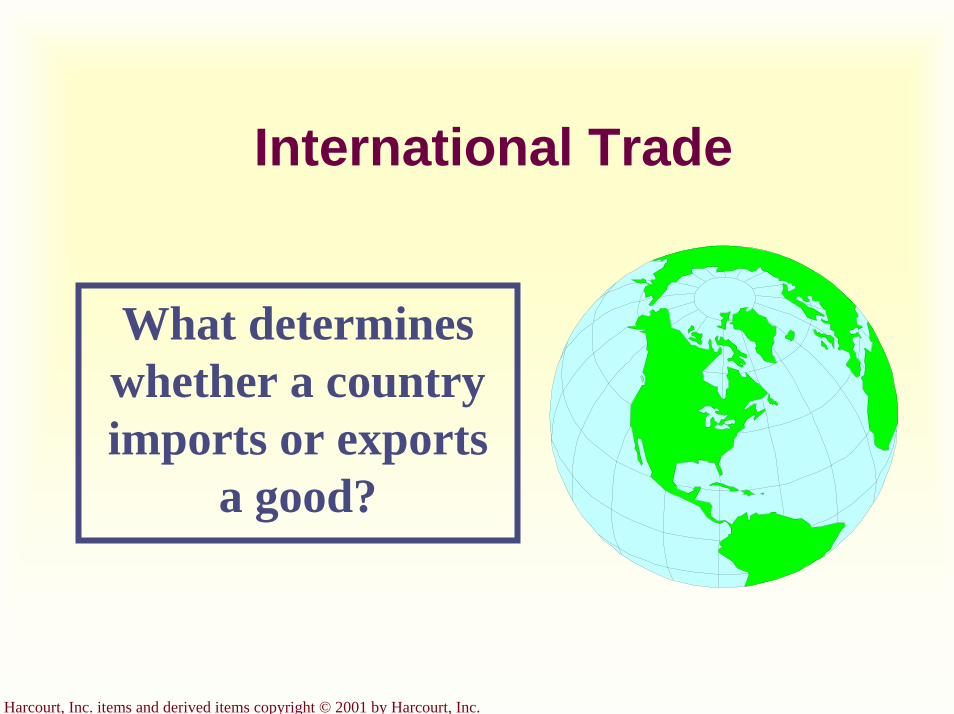
Harcourt, Inc. items and derived items copyright © 2001 by Harcourt, Inc.
International Trade
What determines whether a country imports or exports
a good?
Harcourt, Inc. items and derived items copyright © 2001 by Harcourt, Inc.
International Trade
Who gains and who loses from free
trade among countries?
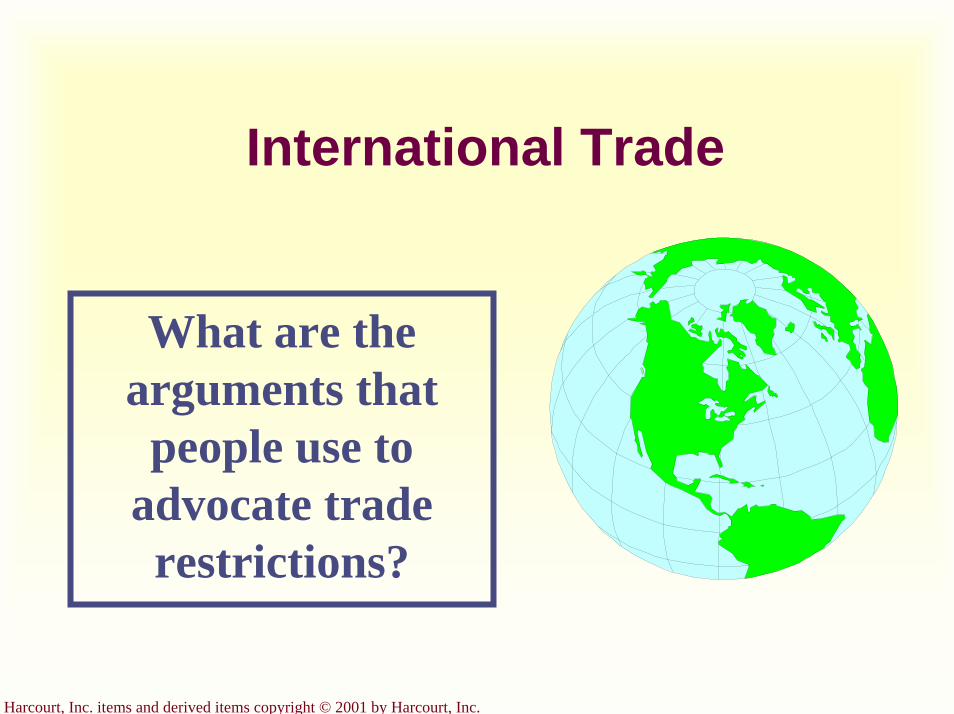
Harcourt, Inc. items and derived items copyright © 2001 by Harcourt, Inc.
International Trade
What are the arguments that
people use to advocate trade restrictions?
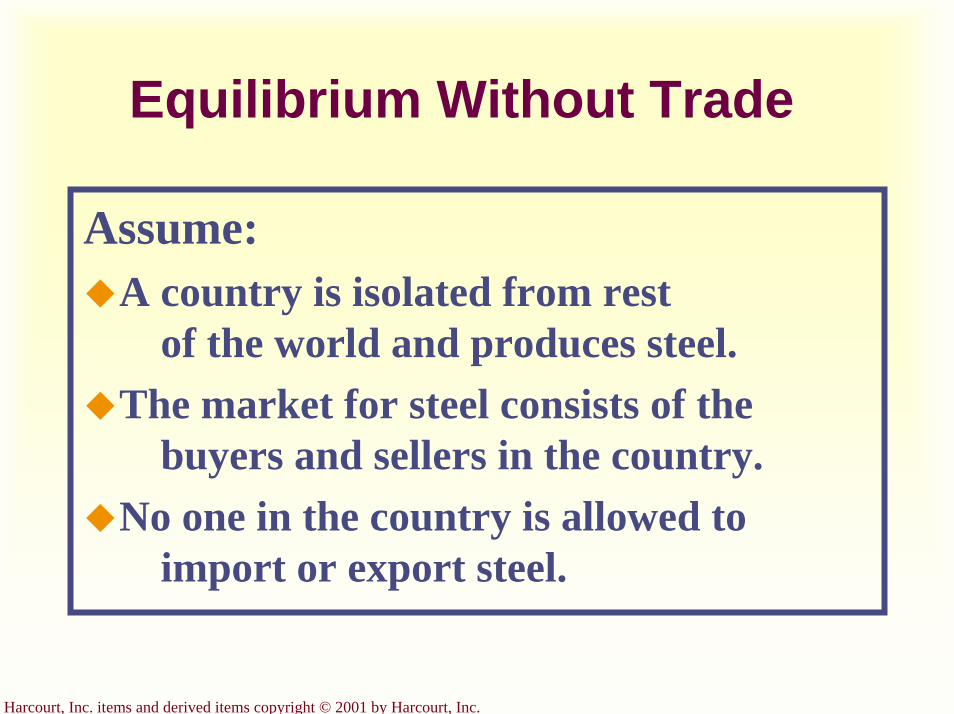
Harcourt, Inc. items and derived items copyright © 2001 by Harcourt, Inc.
Equilibrium Without Trade
Assume:A country is isolated from rest
of the world and produces steel.The market for steel consists of the
buyers and sellers in the country. No one in the country is allowed to
import or export steel.
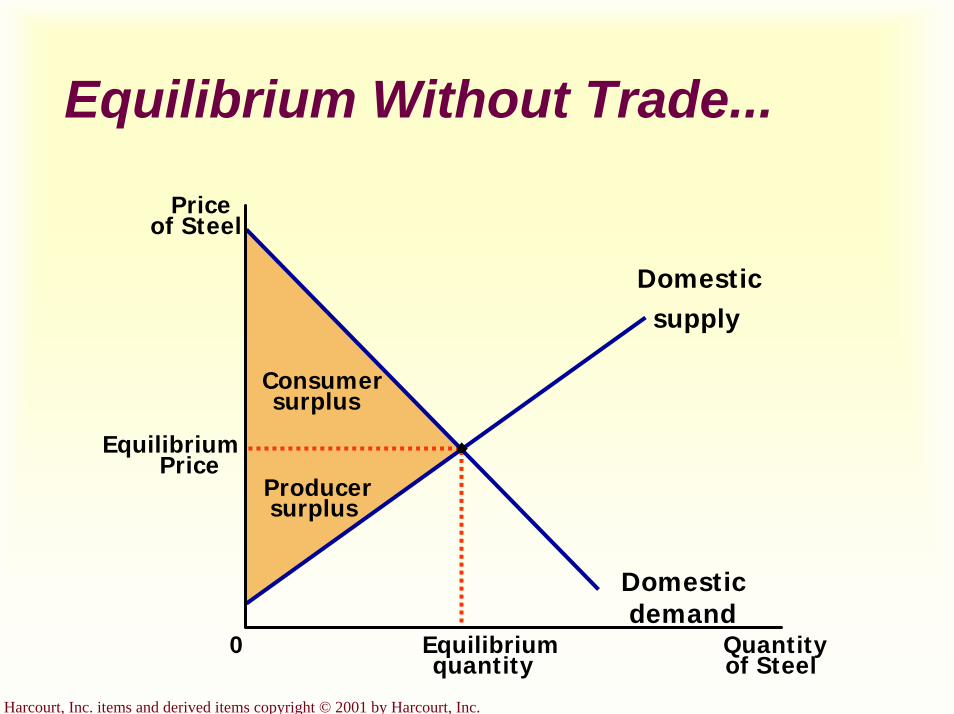
Harcourt, Inc. items and derived items copyright © 2001 by Harcourt, Inc.
Equilibrium Without Trade...
Priceof Steel
EquilibriumPrice
0 Quantityof Steel
Equilibriumquantity
Domesticsupply
Domesticdemand
Producersurplus
Consumersurplus
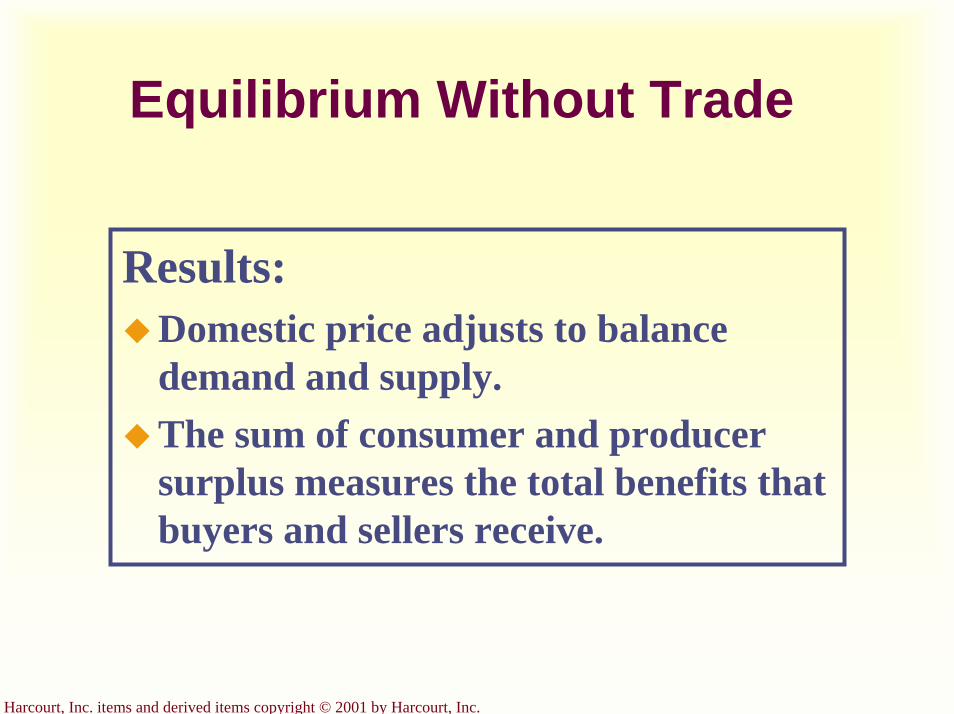
Harcourt, Inc. items and derived items copyright © 2001 by Harcourt, Inc.
Equilibrium Without Trade
Results:Domestic price adjusts to balance demand and supply.The sum of consumer and producer surplus measures the total benefits that buyers and sellers receive.
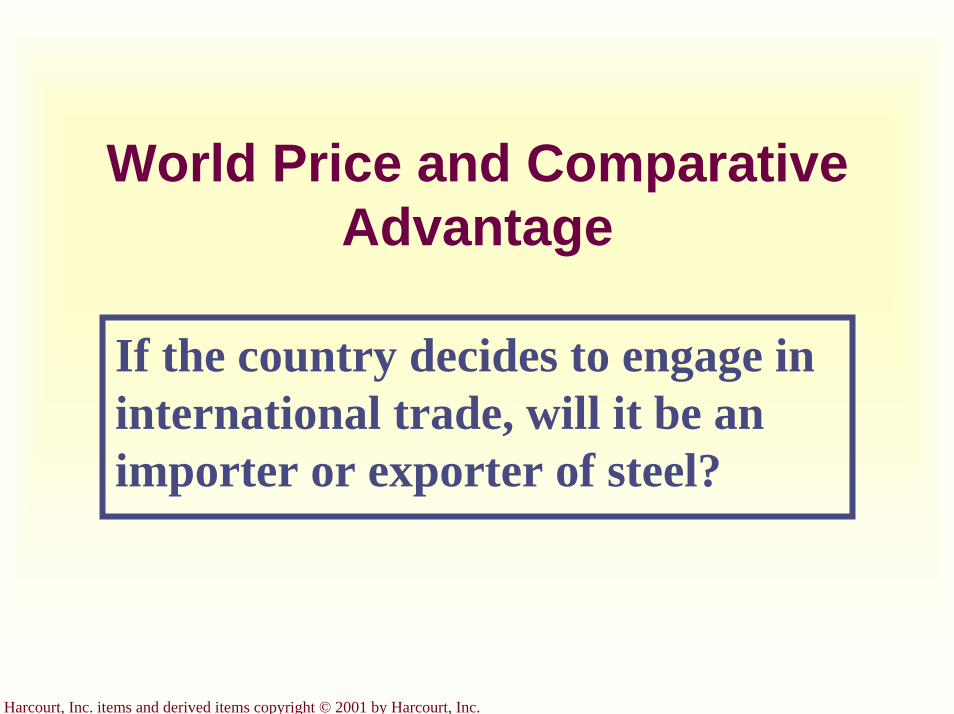
Harcourt, Inc. items and derived items copyright © 2001 by Harcourt, Inc.
World Price and Comparative Advantage
If the country decides to engage in international trade, will it be an importer or exporter of steel?
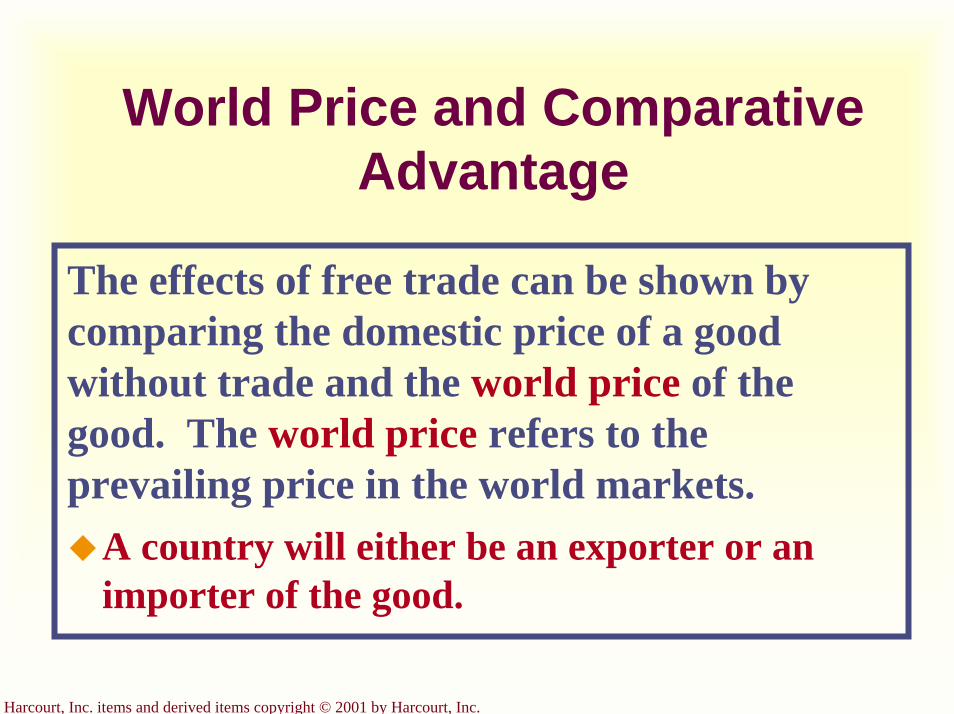
Harcourt, Inc. items and derived items copyright © 2001 by Harcourt, Inc.
World Price and Comparative Advantage
The effects of free trade can be shown by comparing the domestic price of a good without trade and the world price of the good. The world price refers to the prevailing price in the world markets.
A country will either be an exporter or an importer of the good.
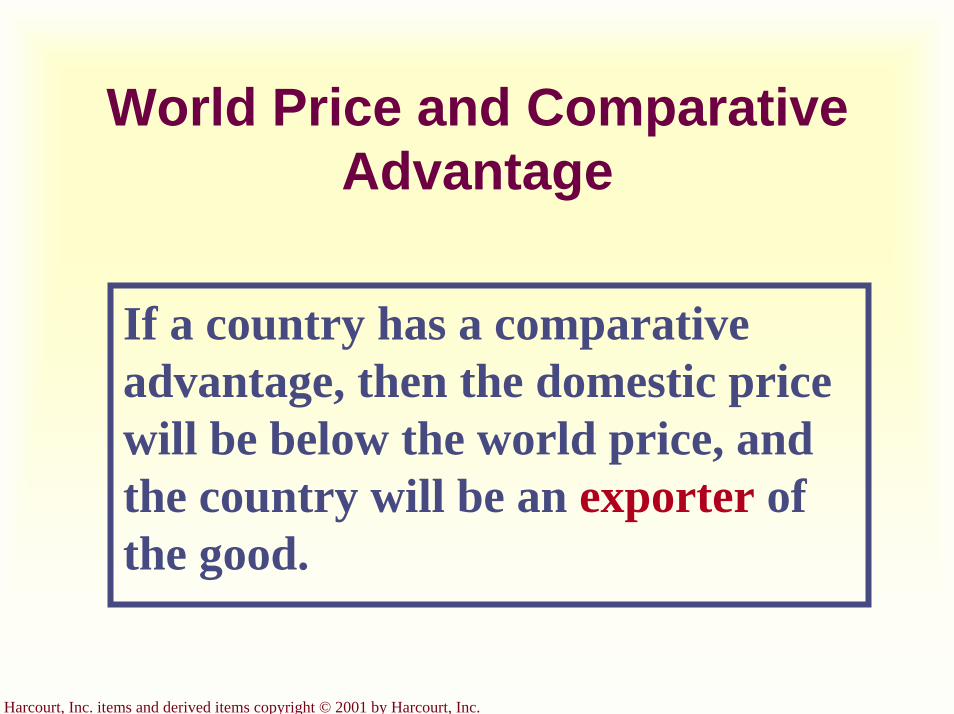
Harcourt, Inc. items and derived items copyright © 2001 by Harcourt, Inc.
World Price and Comparative Advantage
If a country has a comparative advantage, then the domestic price will be below the world price, and the country will be an exporter of the good.
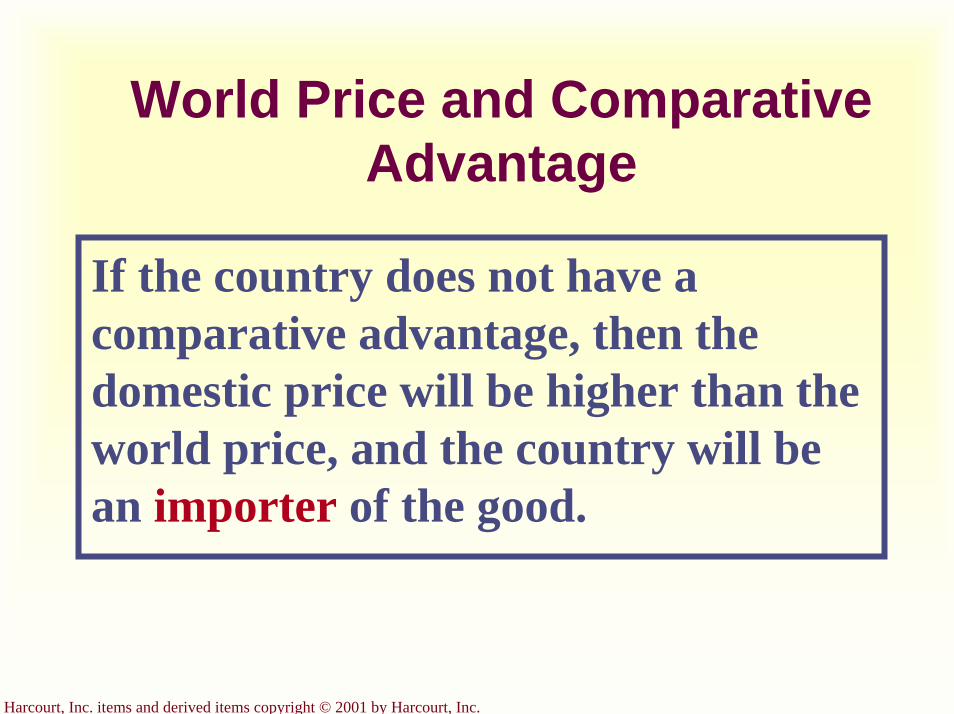
Harcourt, Inc. items and derived items copyright © 2001 by Harcourt, Inc.
World Price and Comparative Advantage
If the country does not have a comparative advantage, then the domestic price will be higher than the world price, and the country will be an importer of the good.
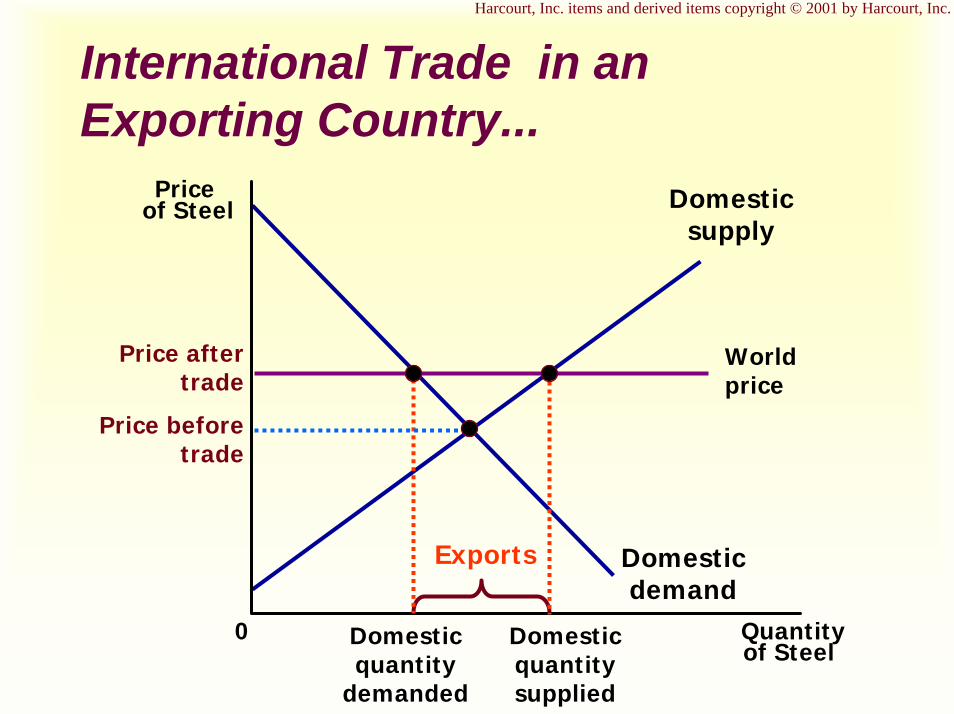
Harcourt, Inc. items and derived items copyright © 2001 by Harcourt, Inc.
International Trade in an Exporting Country...
Priceof Steel
0 Quantityof Steel
Domesticdemand
Domesticsupply
Worldprice
Price after trade
Exports
Domesticquantity
demanded
Domesticquantity supplied
Price before trade
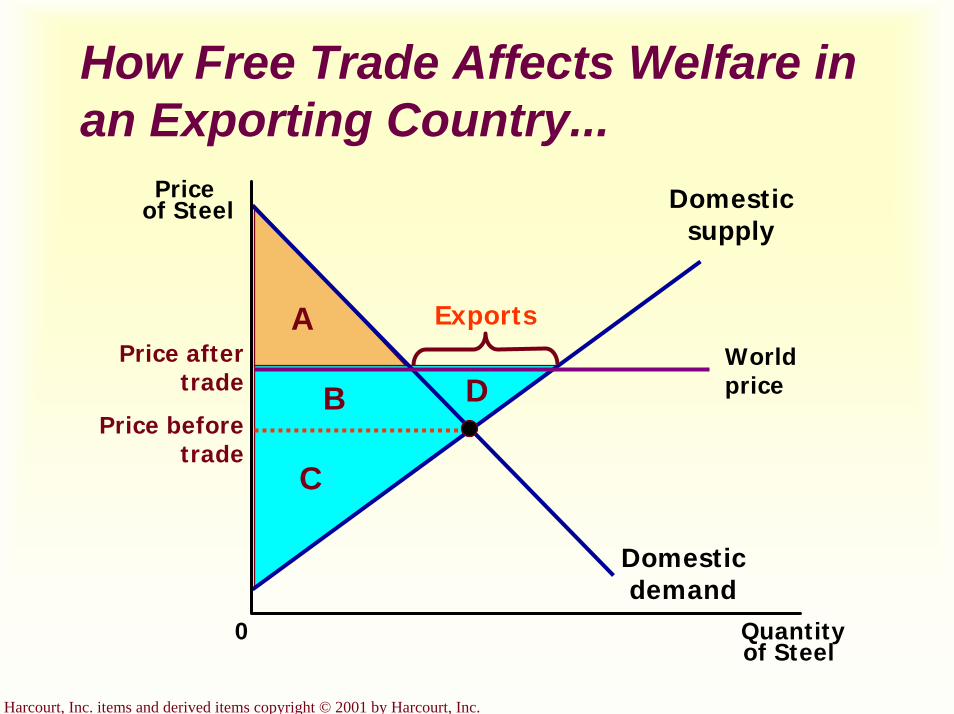
Harcourt, Inc. items and derived items copyright © 2001 by Harcourt, Inc.
How Free Trade Affects Welfare in an Exporting Country...
Priceof Steel
0 Quantityof Steel
Worldprice
Domesticdemand
Domesticsupply
A
B
C
D
ExportsPrice after
trade
Price before trade
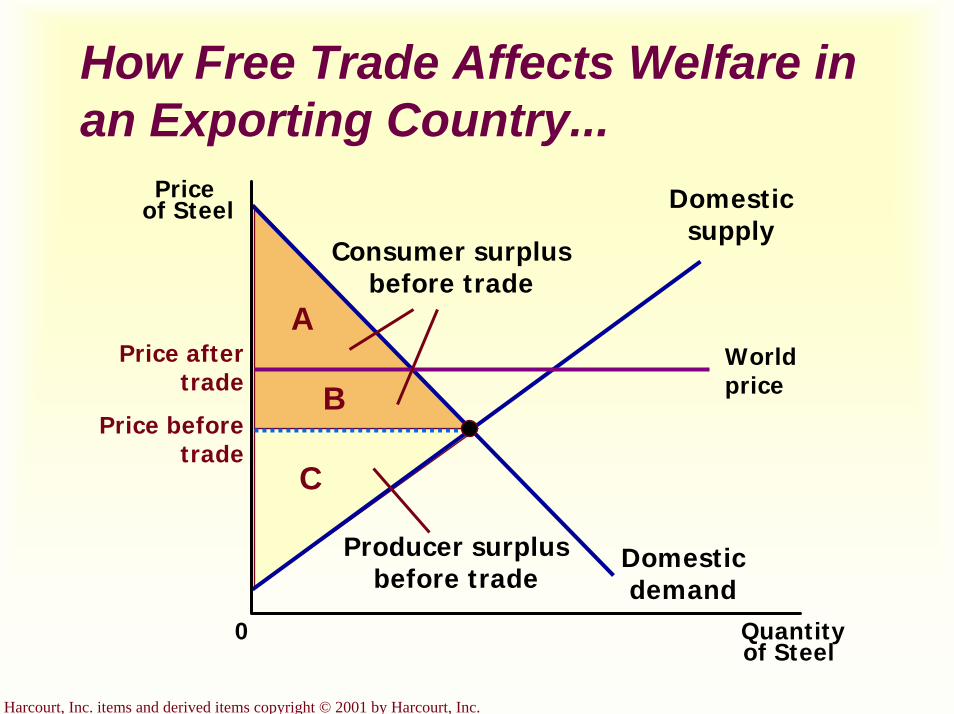
Harcourt, Inc. items and derived items copyright © 2001 by Harcourt, Inc.
How Free Trade Affects Welfare in an Exporting Country...
Priceof Steel
0 Quantityof Steel
Worldprice
Domesticdemand
Domesticsupply
A
Consumer surplusbefore trade
B
C
Producer surplusbefore trade
Price after trade
Price before trade
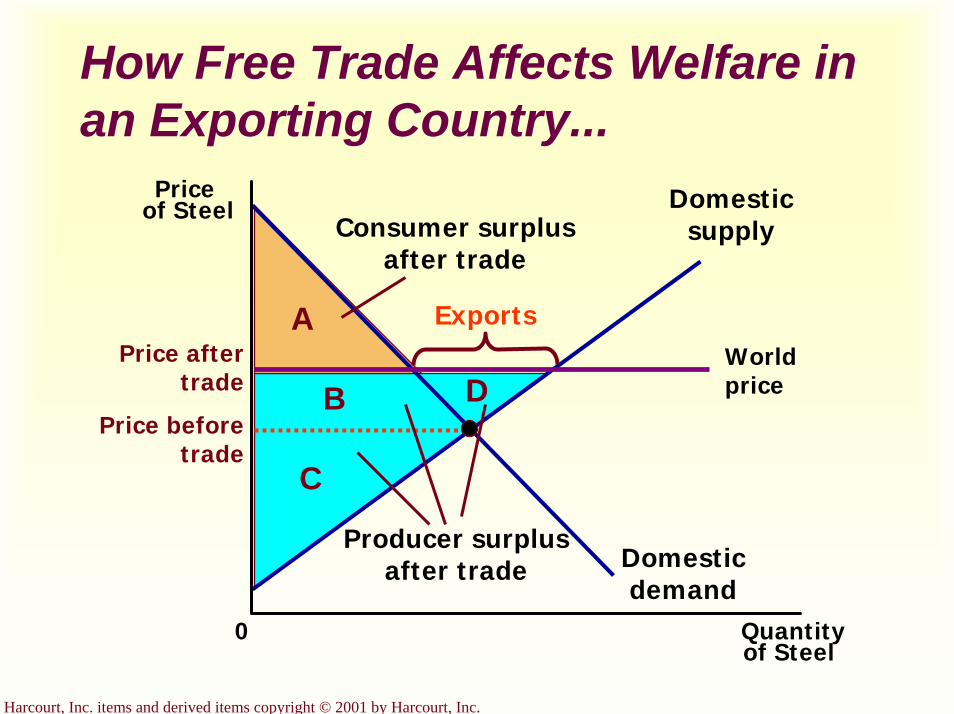
Harcourt, Inc. items and derived items copyright © 2001 by Harcourt, Inc.
How Free Trade Affects Welfare in an Exporting Country...
Priceof Steel
0 Quantityof Steel
Worldprice
Domesticdemand
Domesticsupply
A
Consumer surplusafter trade
C
B
Producer surplusafter trade
D
ExportsPrice after
trade
Price before trade
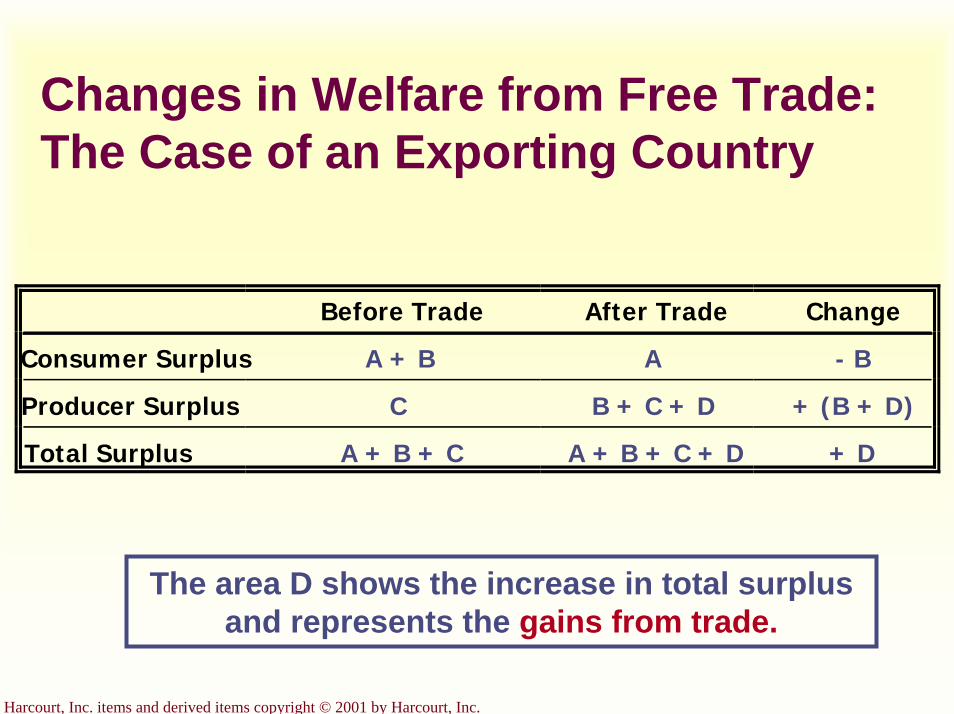
Harcourt, Inc. items and derived items copyright © 2001 by Harcourt, Inc.
Changes in Welfare from Free Trade: The Case of an Exporting Country
Before Trade After Trade Change
Consumer Surplus A + B A - B
Producer Surplus C B + C + D + (B + D)
Total Surplus A + B + C A + B + C + D + D
The area D shows the increase in total surplus and represents the gains from trade.
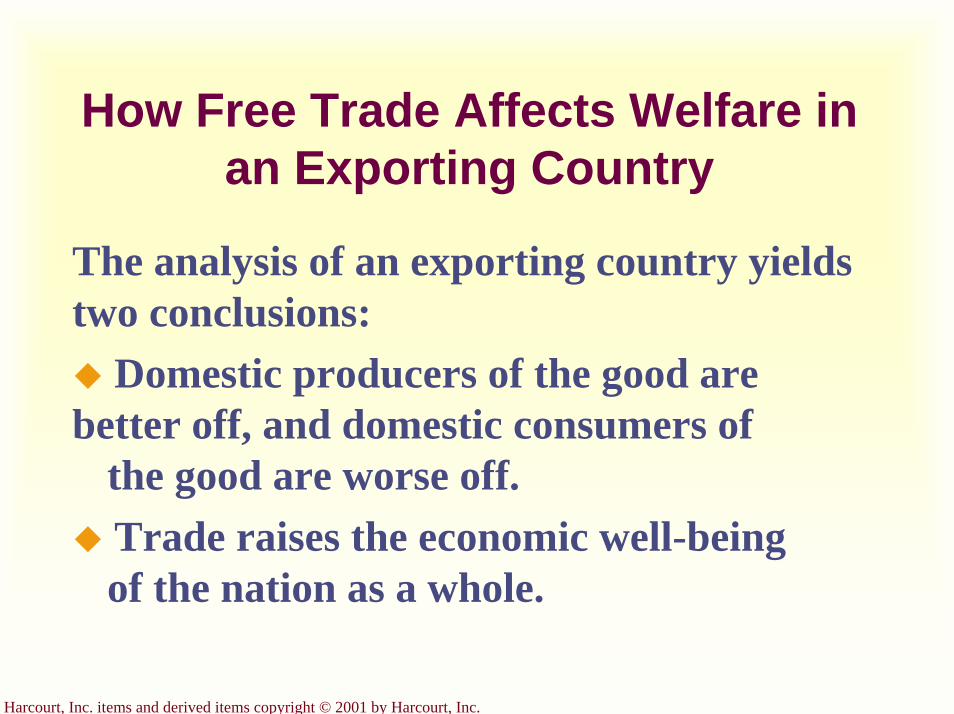
Harcourt, Inc. items and derived items copyright © 2001 by Harcourt, Inc.
How Free Trade Affects Welfare in an Exporting Country
The analysis of an exporting country yields two conclusions:
Domestic producers of the good are better off, and domestic consumers of
the good are worse off.Trade raises the economic well-being of the nation as a whole.
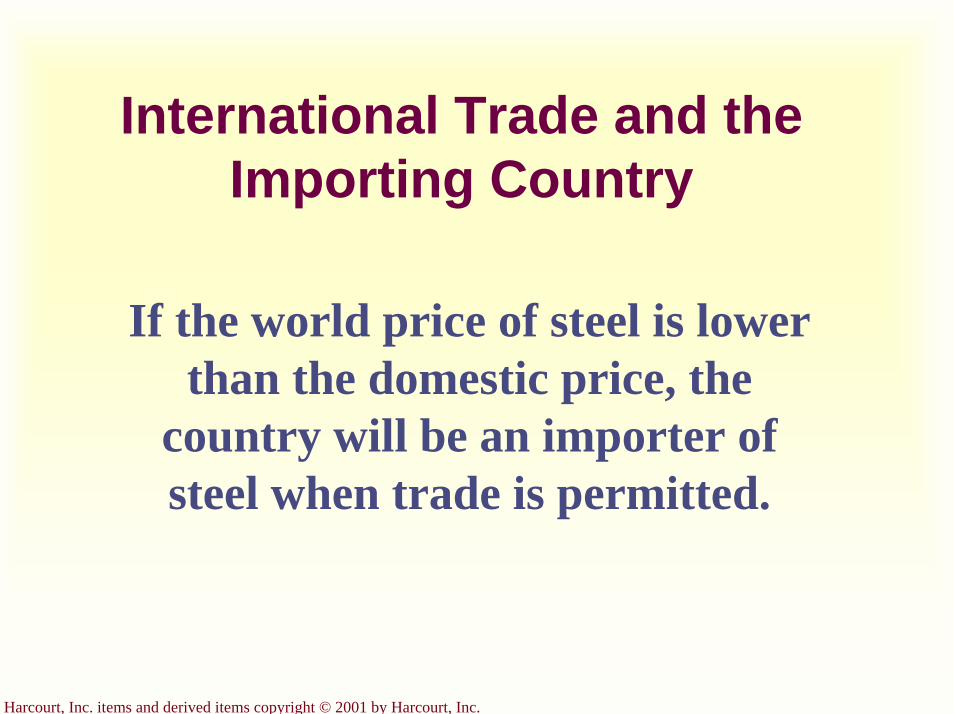
Harcourt, Inc. items and derived items copyright © 2001 by Harcourt, Inc.
International Trade and the Importing Country
If the world price of steel is lower than the domestic price, the
country will be an importer of steel when trade is permitted.
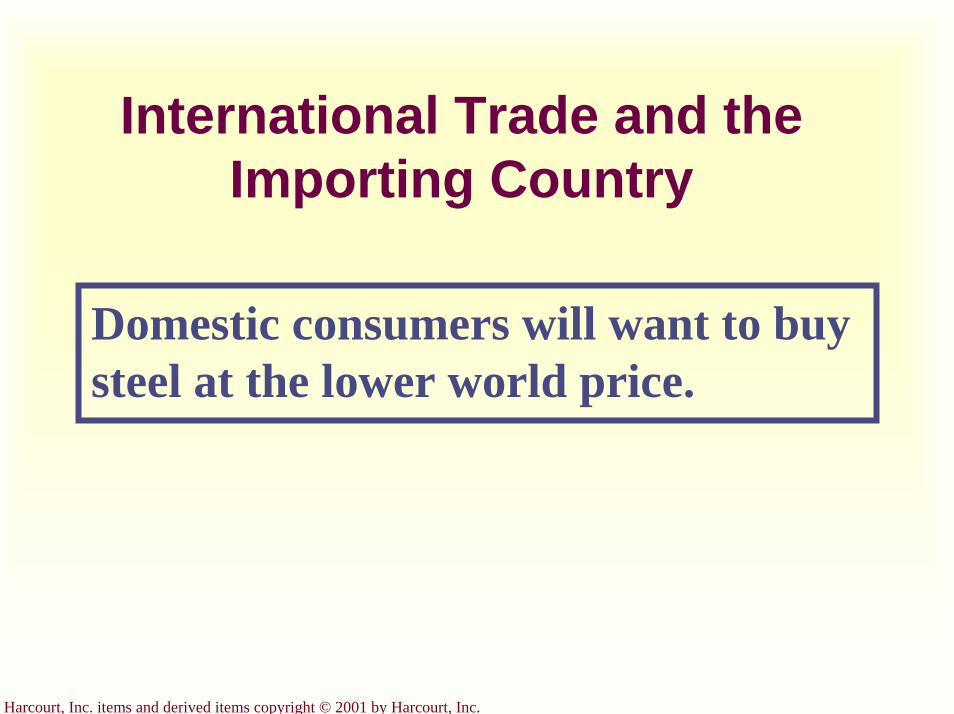
Harcourt, Inc. items and derived items copyright © 2001 by Harcourt, Inc.
International Trade and the Importing Country
Domestic consumers will want to buy steel at the lower world price.
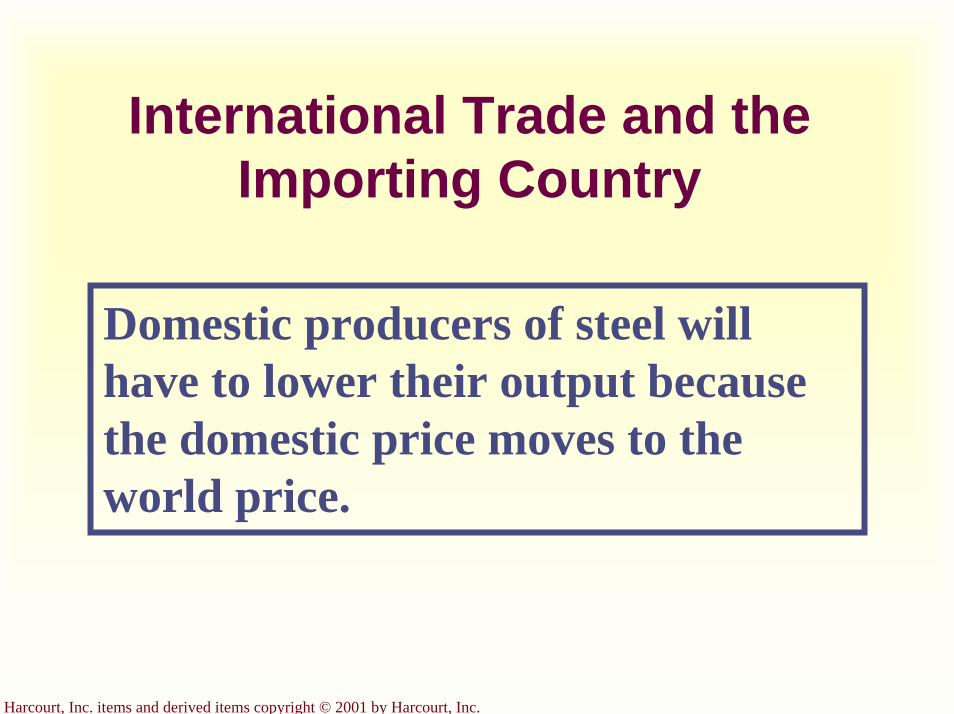
Harcourt, Inc. items and derived items copyright © 2001 by Harcourt, Inc.
International Trade and the Importing Country
Domestic producers of steel will have to lower their output because the domestic price moves to the world price.
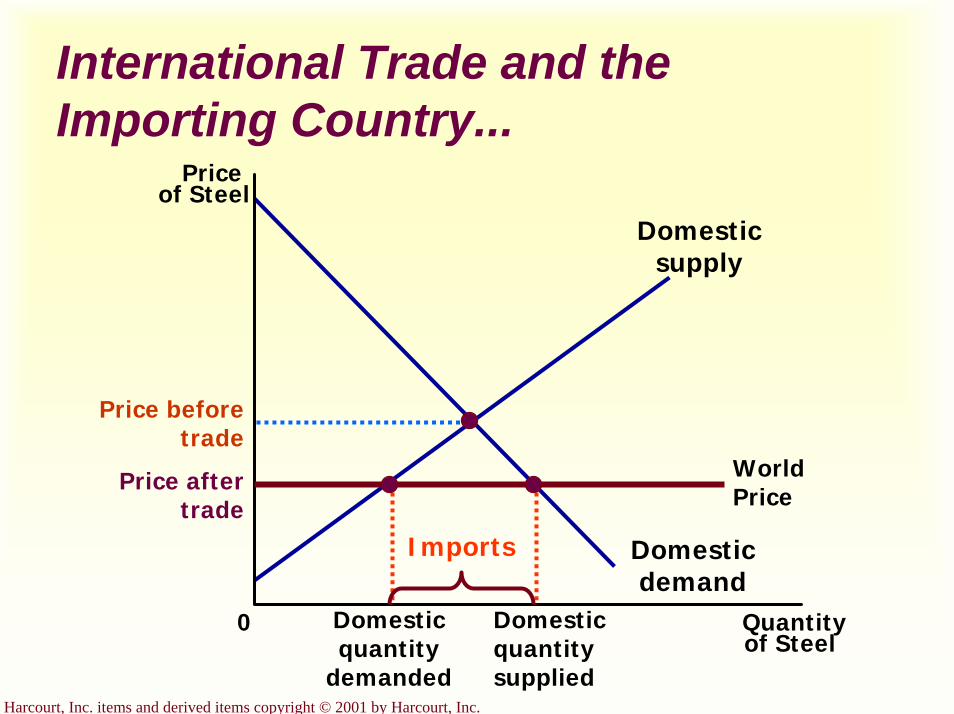
Harcourt, Inc. items and derived items copyright © 2001 by Harcourt, Inc.
International Trade and the Importing Country...
Priceof Steel
0 Quantityof Steel
Domesticsupply
Domestic demand
World Price
Price after trade
Domesticquantity
demanded
Domesticquantitysupplied
Price before trade
Imports
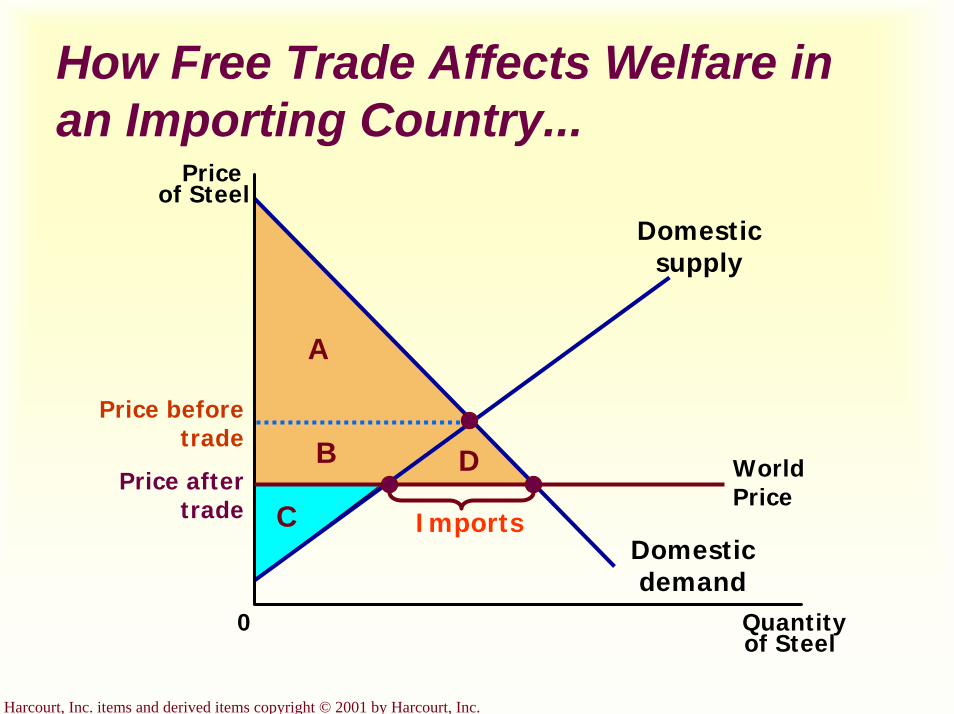
Harcourt, Inc. items and derived items copyright © 2001 by Harcourt, Inc.
How Free Trade Affects Welfare in an Importing Country...
Priceof Steel
0 Quantityof Steel
Domesticsupply
World Price
Domestic demand
Price before trade
Price after trade
A
B
C
D
Imports
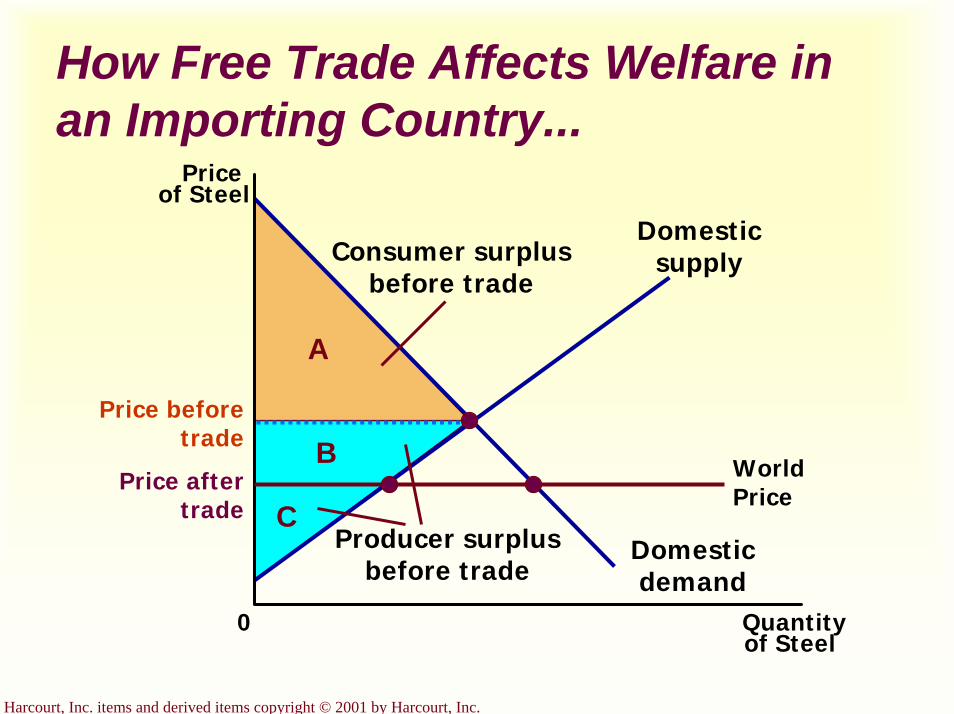
Harcourt, Inc. items and derived items copyright © 2001 by Harcourt, Inc.
How Free Trade Affects Welfare in an Importing Country...
Priceof Steel
0 Quantityof Steel
Domesticsupply
World Price
Domestic demand
Price before trade
Price after trade
A
Consumer surplusbefore trade
C
B
Producer surplusbefore trade
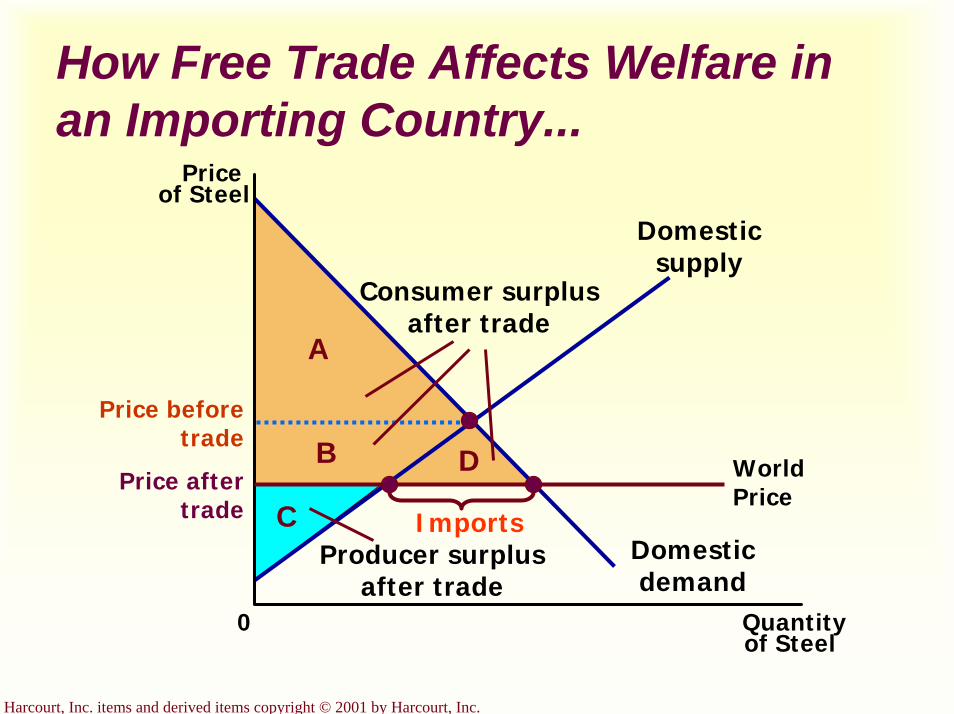
Harcourt, Inc. items and derived items copyright © 2001 by Harcourt, Inc.
How Free Trade Affects Welfare in an Importing Country...
Priceof Steel
0 Quantityof Steel
Domesticsupply
World Price
Domestic demand
Price before trade
Price after trade
A
Consumer surplusafter trade
B D
CProducer surplus
after trade
Imports
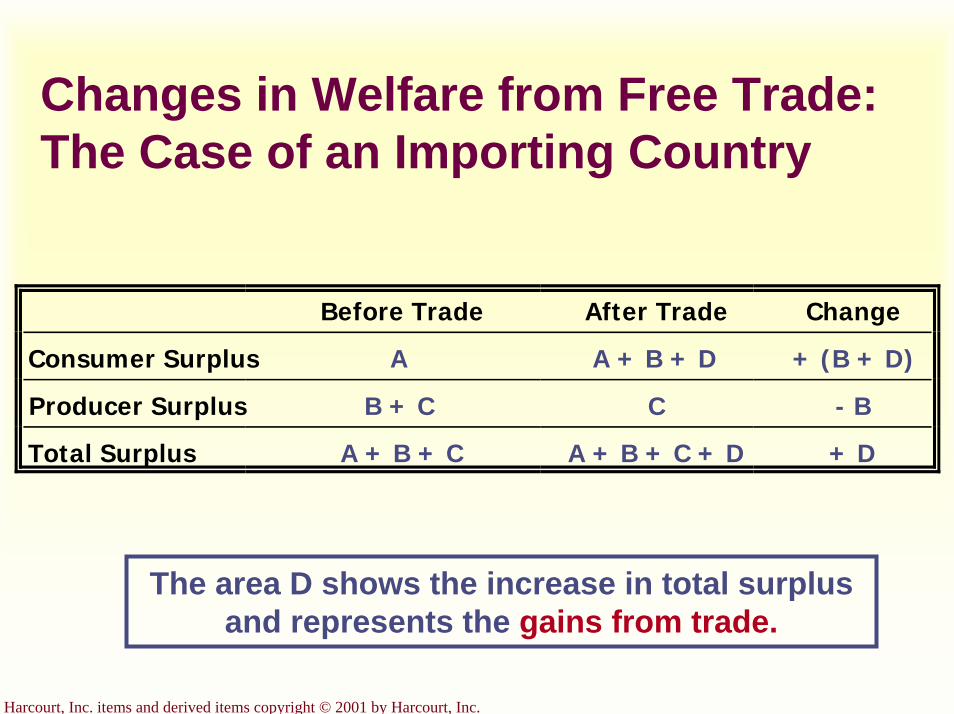
Harcourt, Inc. items and derived items copyright © 2001 by Harcourt, Inc.
Changes in Welfare from Free Trade: The Case of an Importing Country
Before Trade After Trade Change
Consumer Surplus A A + B + D + (B + D)
Producer Surplus B + C C - B
Total Surplus A + B + C A + B + C + D + D
The area D shows the increase in total surplus and represents the gains from trade.
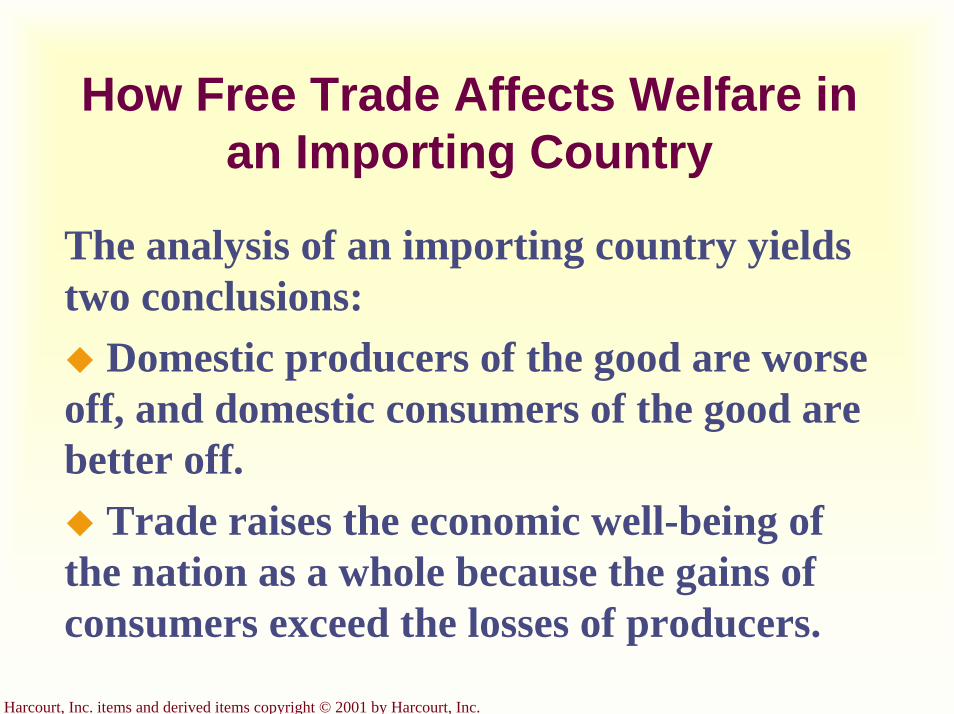
Harcourt, Inc. items and derived items copyright © 2001 by Harcourt, Inc.
How Free Trade Affects Welfare in an Importing Country
The analysis of an importing country yields two conclusions:
Domestic producers of the good are worse off, and domestic consumers of the good are better off.
Trade raises the economic well-being of the nation as a whole because the gains of consumers exceed the losses of producers.
Harcourt, Inc. items and derived items copyright © 2001 by Harcourt, Inc.
The Gains and Losses from Free International Trade
The gains of the winners exceed the losses of the losers.The net change in total surplus is positive.
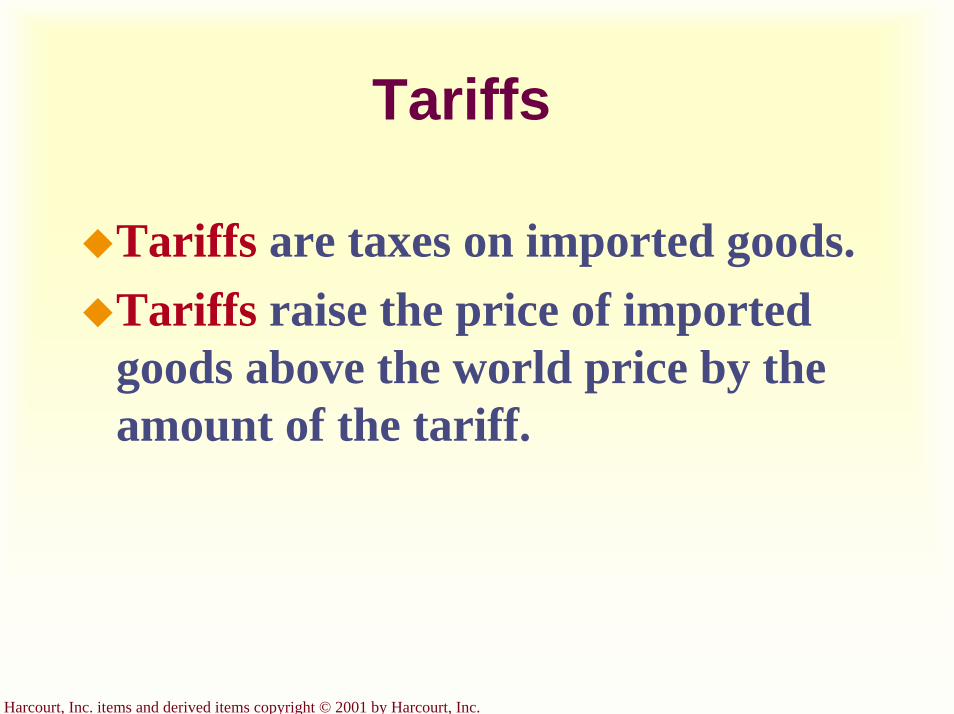
Harcourt, Inc. items and derived items copyright © 2001 by Harcourt, Inc.
Tariffs
Tariffs are taxes on imported goods.Tariffs raise the price of imported goods above the world price by the amount of the tariff.
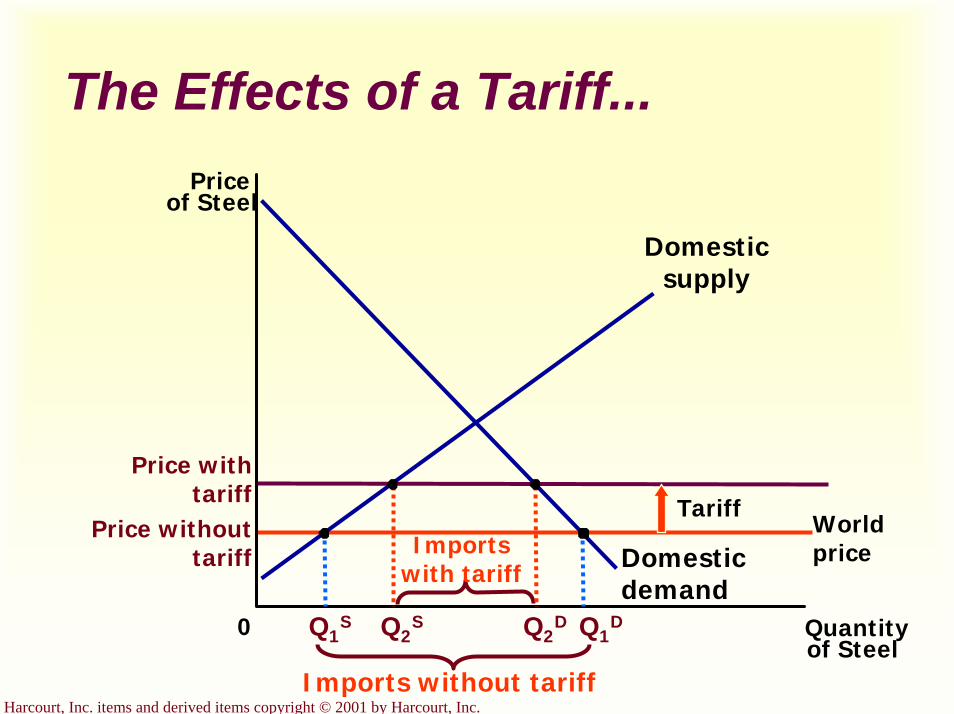
Harcourt, Inc. items and derived items copyright © 2001 by Harcourt, Inc.
The Effects of a Tariff...
Price with tariff
World price
Price without tariff
Priceof Steel
0 Quantityof Steel
Domestic supply
Domestic demand
Tariff
Q1S Q1
D
Imports without tariff
Imports with tariff
Q2DQ2
S

Harcourt, Inc. items and derived items copyright © 2001 by Harcourt, Inc.
The Effects of a Tariff...Price
of Steel
0 Quantityof Steel
Domestic supply
Domestic demand
World price
Q1S Q1
D
Price without tariff
Imports without tariff
Consumer surplusbefore tariff
Producer surplusbefore tariff
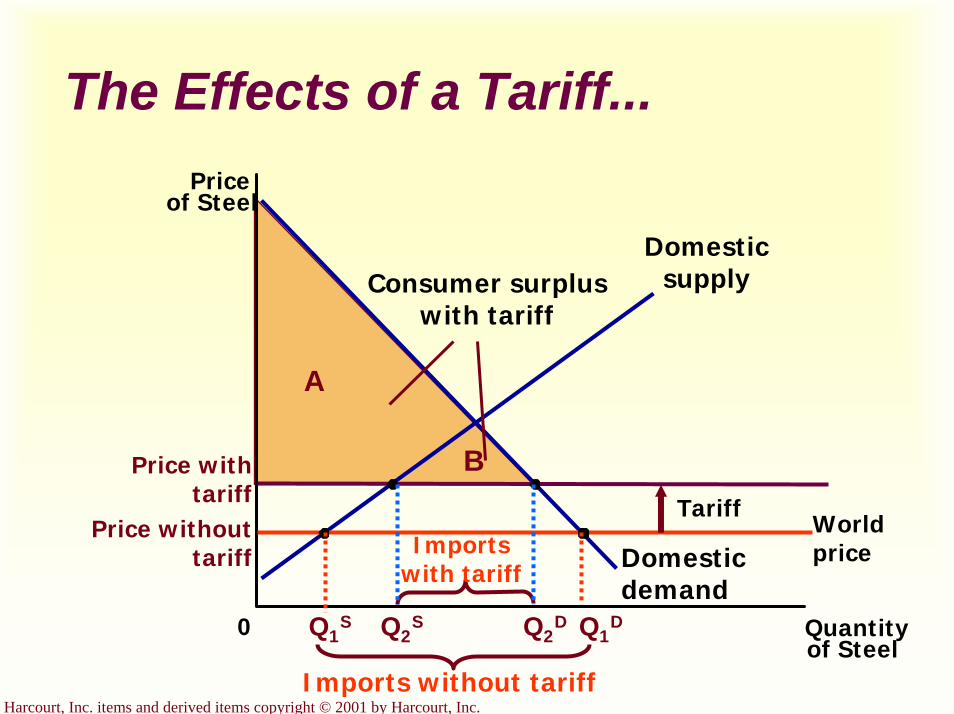
Harcourt, Inc. items and derived items copyright © 2001 by Harcourt, Inc.
The Effects of a Tariff...Price
of Steel
0 Quantityof Steel
Domestic supply
Domestic demand
TariffWorld price
Q1S Q2
S Q2D Q1
D
Price without tariff
Price with tariff
Imports without tariff
Imports with tariff
A
Consumer surpluswith tariff
B

Harcourt, Inc. items and derived items copyright © 2001 by Harcourt, Inc.
The Effects of a Tariff...Price
of Steel
0 Quantityof Steel
Domestic supply
Domestic demand
TariffWorld price
Q1S Q2
S Q2D Q1
D
Imports without tariff
Imports with tariff
CG
Producer surplusbefore tariff
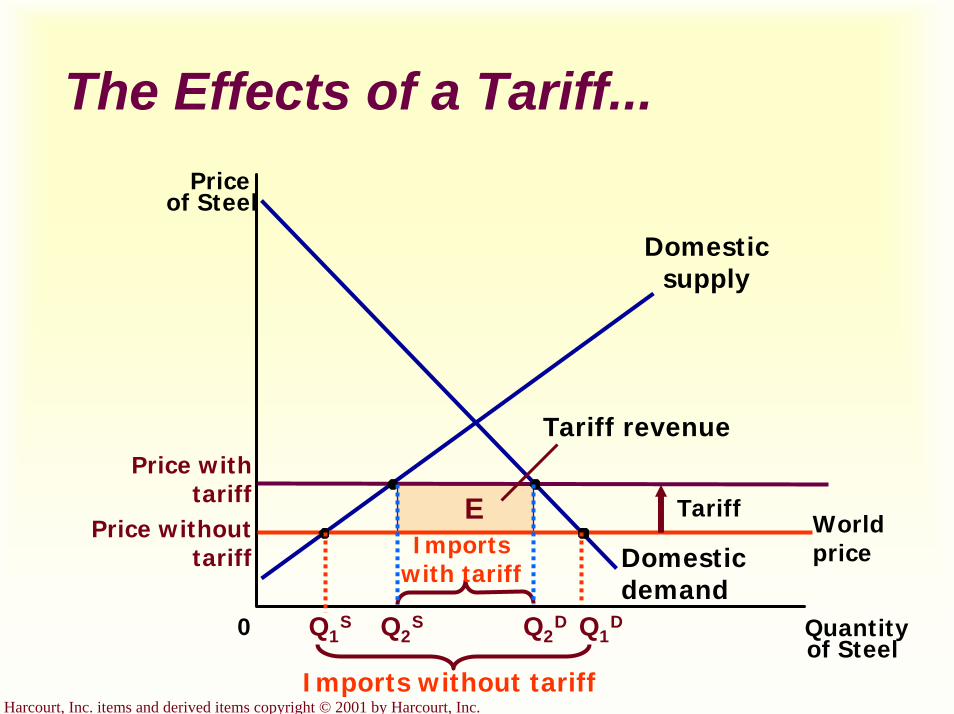
Harcourt, Inc. items and derived items copyright © 2001 by Harcourt, Inc.
The Effects of a Tariff...Price
of Steel
0 Quantityof Steel
Domestic supply
Domestic demand
TariffWorld price
Q1S Q2
S Q2D Q1
D
Imports without tariff
Imports with tariff
E
Tariff revenuePrice with
tariffPrice without
tariff
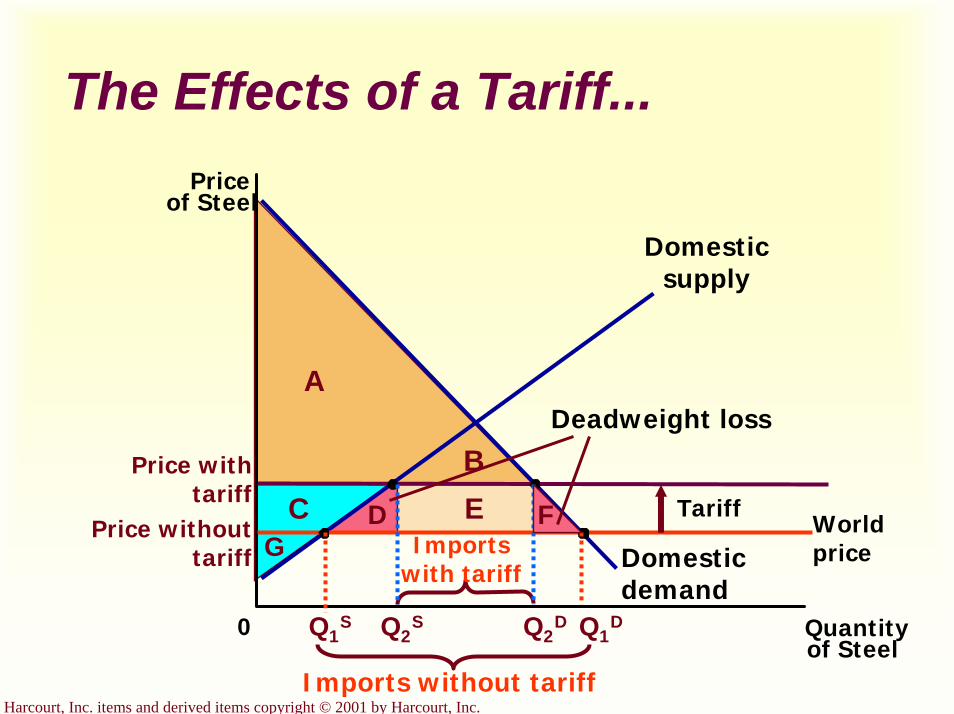
Harcourt, Inc. items and derived items copyright © 2001 by Harcourt, Inc.
The Effects of a Tariff...Price
of Steel
0 Quantityof Steel
Domestic supply
Domestic demand
TariffWorld price
Q1S Q2
S Q2D Q1
D
Price without tariff
Price with tariff
Imports without tariff
Imports with tariff
A
B
C EG
D F
Deadweight loss
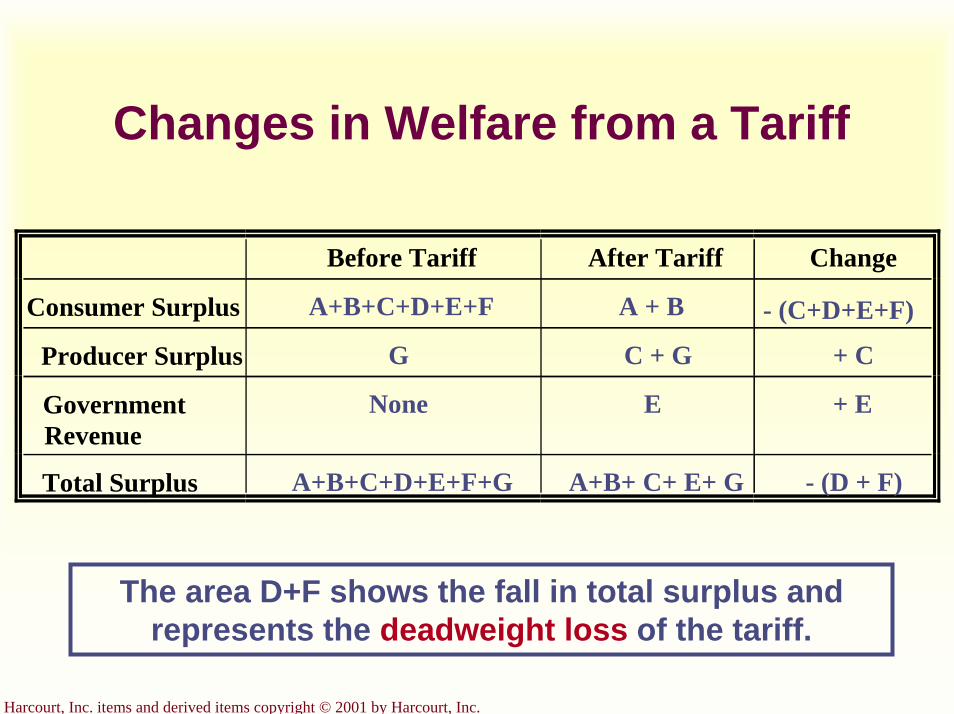
Harcourt, Inc. items and derived items copyright © 2001 by Harcourt, Inc.
Changes in Welfare from a Tariff
Before Tariff After Tariff Change
Consumer Surplus A+B+C+D+E+F A + B - (C+D+E+F)
Producer Surplus G C + G + C
GovernmentRevenue
None E + E
Total Surplus A+B+C+D+E+F+G A+B+ C+ E+ G - (D + F)
The area D+F shows the fall in total surplus and represents the deadweight loss of the tariff.
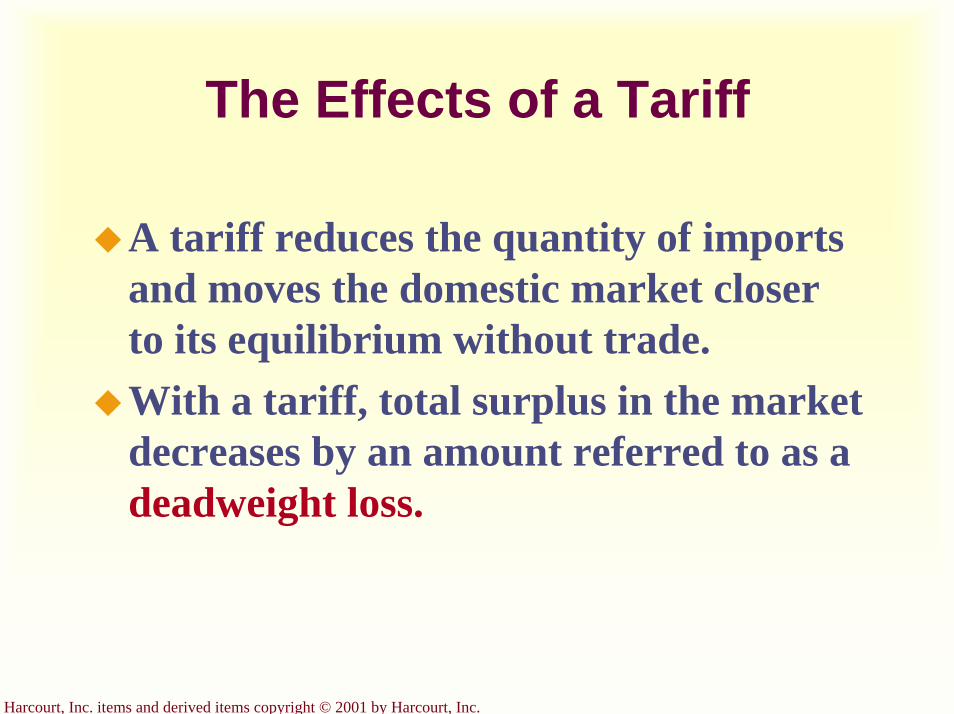
Harcourt, Inc. items and derived items copyright © 2001 by Harcourt, Inc.
The Effects of a Tariff
A tariff reduces the quantity of imports and moves the domestic market closer to its equilibrium without trade.With a tariff, total surplus in the market decreases by an amount referred to as a deadweight loss.
Harcourt, Inc. items and derived items copyright © 2001 by Harcourt, Inc.
The Effects of an Import Quota
An import quota is a limit on the quantity of imports.
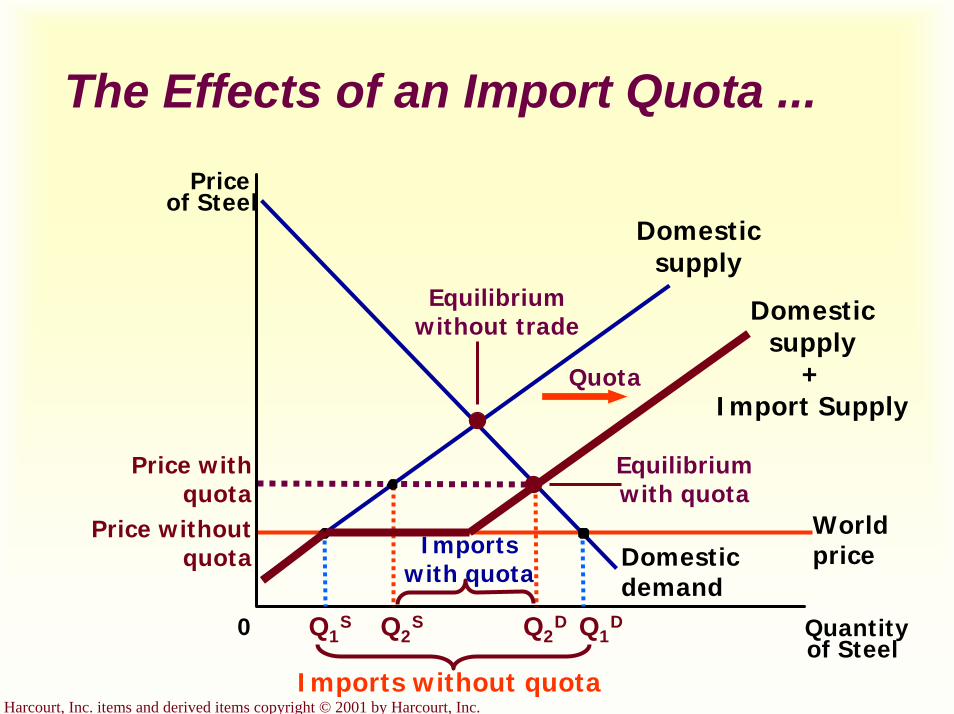
Harcourt, Inc. items and derived items copyright © 2001 by Harcourt, Inc.
The Effects of an Import Quota ...
Price with quota
World price
Price without quota
Priceof Steel
0 Quantityof Steel
Domestic supply
Domestic demand
Q1S Q2
S Q2D
Imports without quota
Imports with quota
Domestic supply
+Import Supply
Quota
Equilibrium with quota
Equilibrium without trade
Q1D
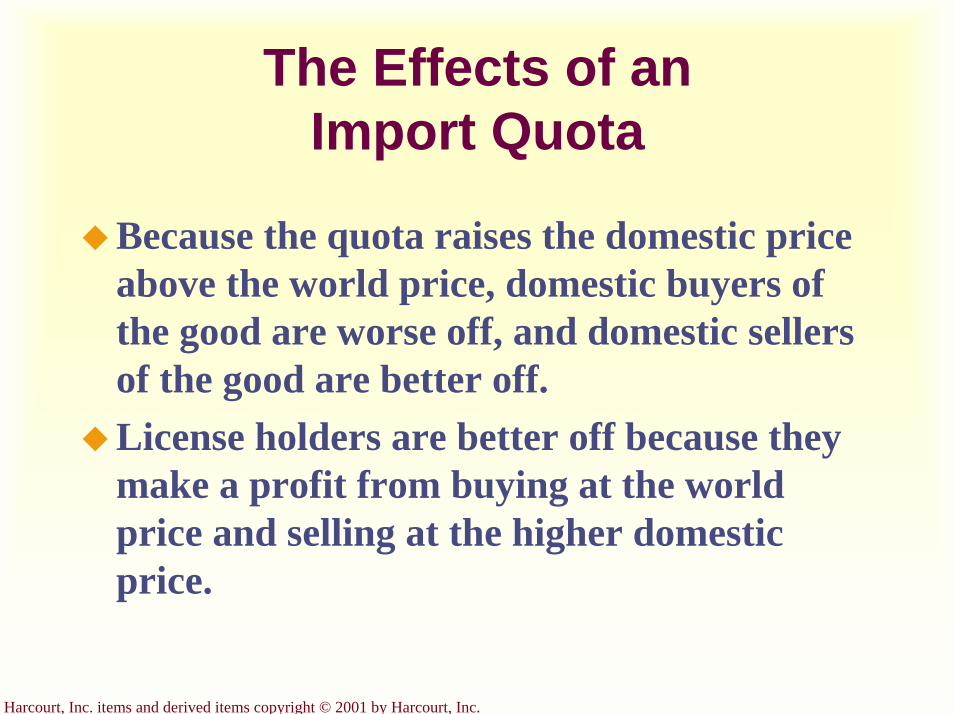
Harcourt, Inc. items and derived items copyright © 2001 by Harcourt, Inc.
The Effects of an Import Quota
Because the quota raises the domestic price above the world price, domestic buyers of the good are worse off, and domestic sellers of the good are better off.License holders are better off because they make a profit from buying at the world price and selling at the higher domestic price.
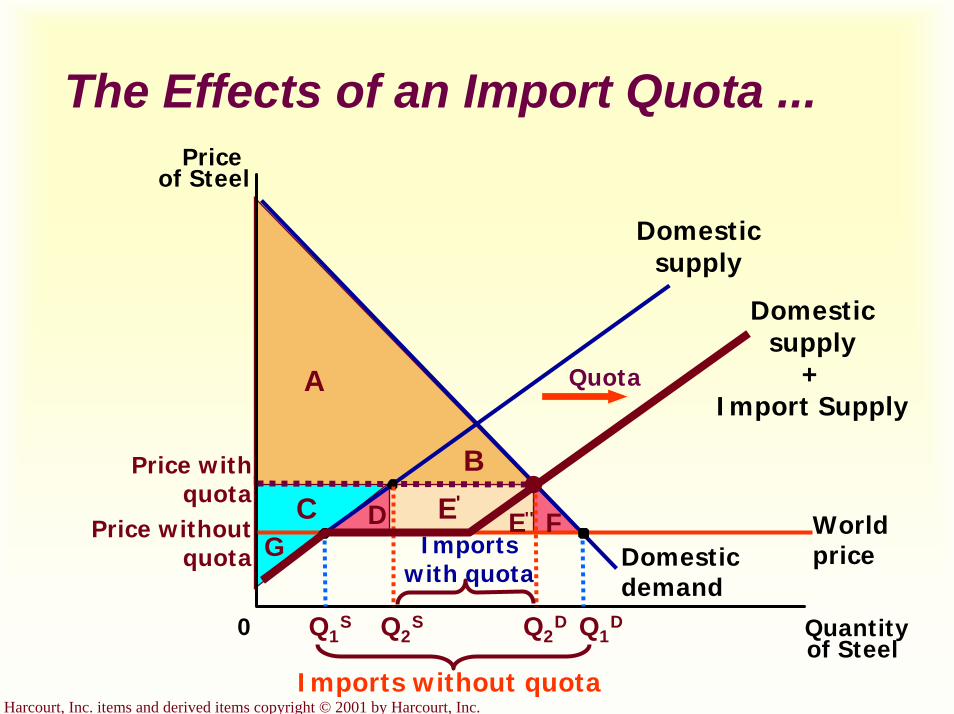
Harcourt, Inc. items and derived items copyright © 2001 by Harcourt, Inc.
The Effects of an Import Quota ...Price
of Steel
0 Quantityof Steel
Domestic supply
Domestic demand
World price
Q1S Q2
S Q2D Q1
D
Price without quota
Price with quota
Imports without quota
Imports with quota
Domestic supply
+Import Supply
QuotaA
B
C E'E'' F
GD
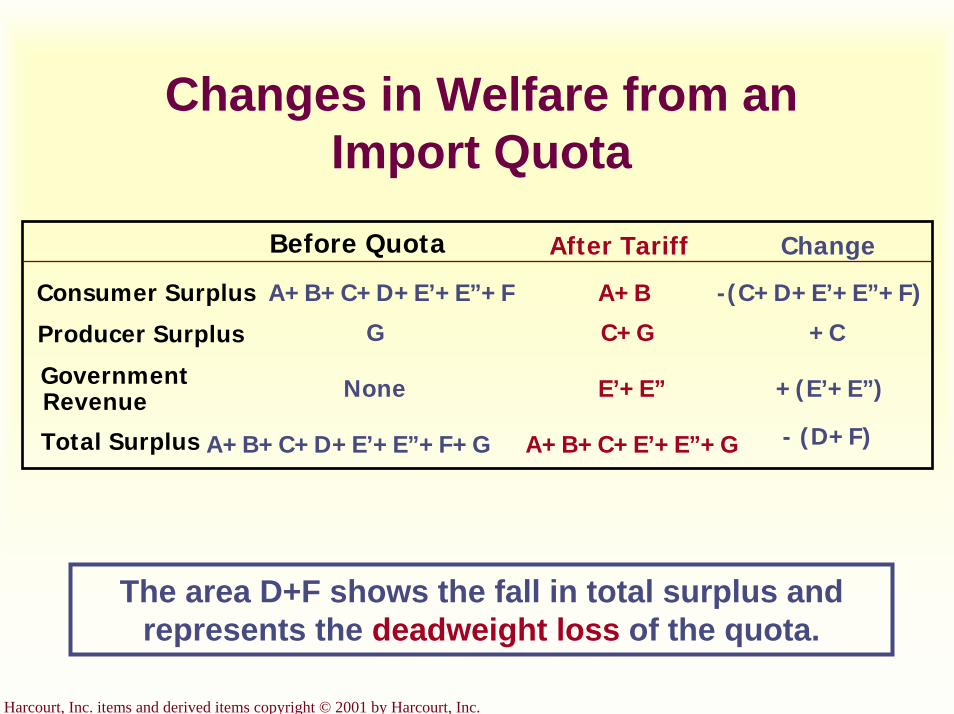
Harcourt, Inc. items and derived items copyright © 2001 by Harcourt, Inc.
Changes in Welfare from an Import Quota
A+B+C+D+E’+E”+F+G A+B+C+E’+E”+G
Before Quota After Tariff Change
Consumer Surplus
Producer Surplus
GovernmentRevenue
Total Surplus
A+B+C+D+E’+E”+F A+B -(C+D+E’+E”+F)
G C+G +C
None E’+E” +(E’+E”)
- (D+F)
The area D+F shows the fall in total surplus and represents the deadweight loss of the quota.
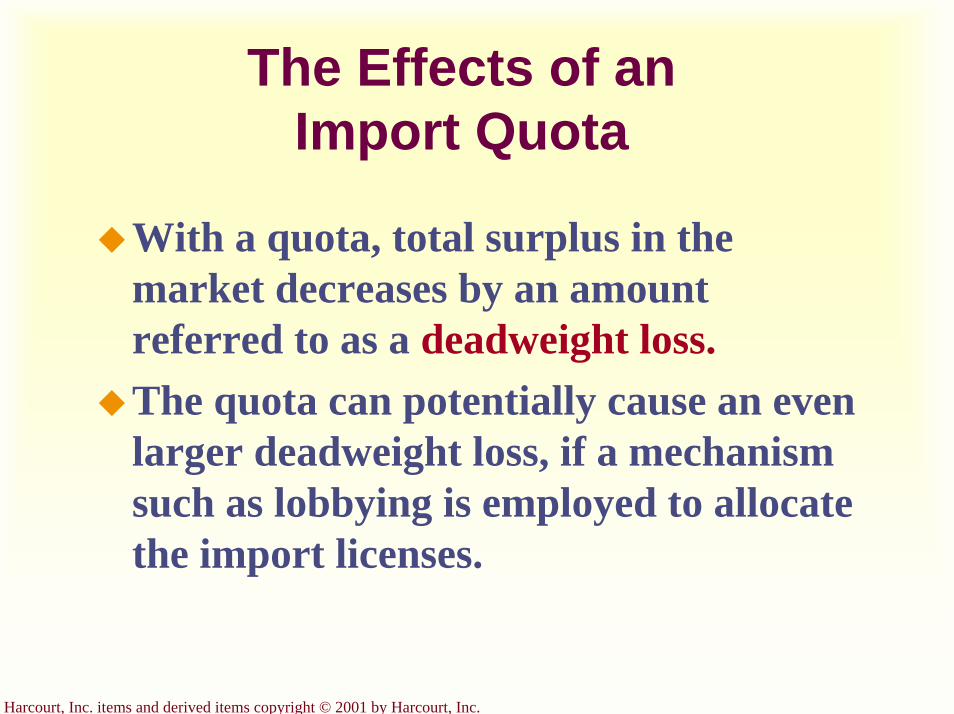
Harcourt, Inc. items and derived items copyright © 2001 by Harcourt, Inc.
The Effects of an Import Quota
With a quota, total surplus in the market decreases by an amount referred to as a deadweight loss.The quota can potentially cause an even larger deadweight loss, if a mechanism such as lobbying is employed to allocate the import licenses.
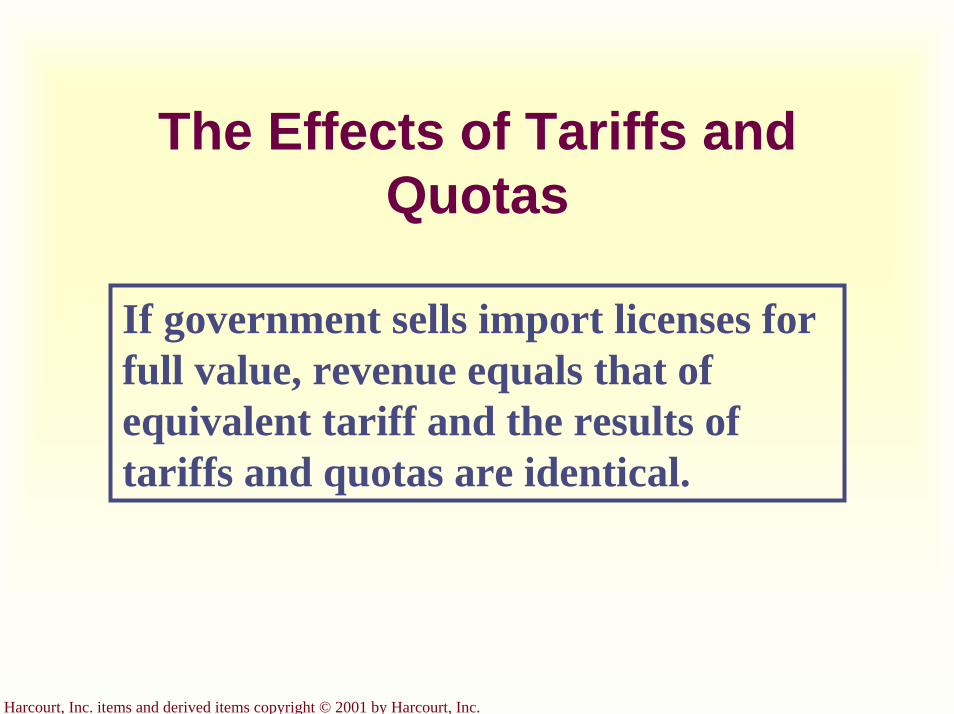
Harcourt, Inc. items and derived items copyright © 2001 by Harcourt, Inc.
The Effects of Tariffs and Quotas
If government sells import licenses for full value, revenue equals that of equivalent tariff and the results of tariffs and quotas are identical.
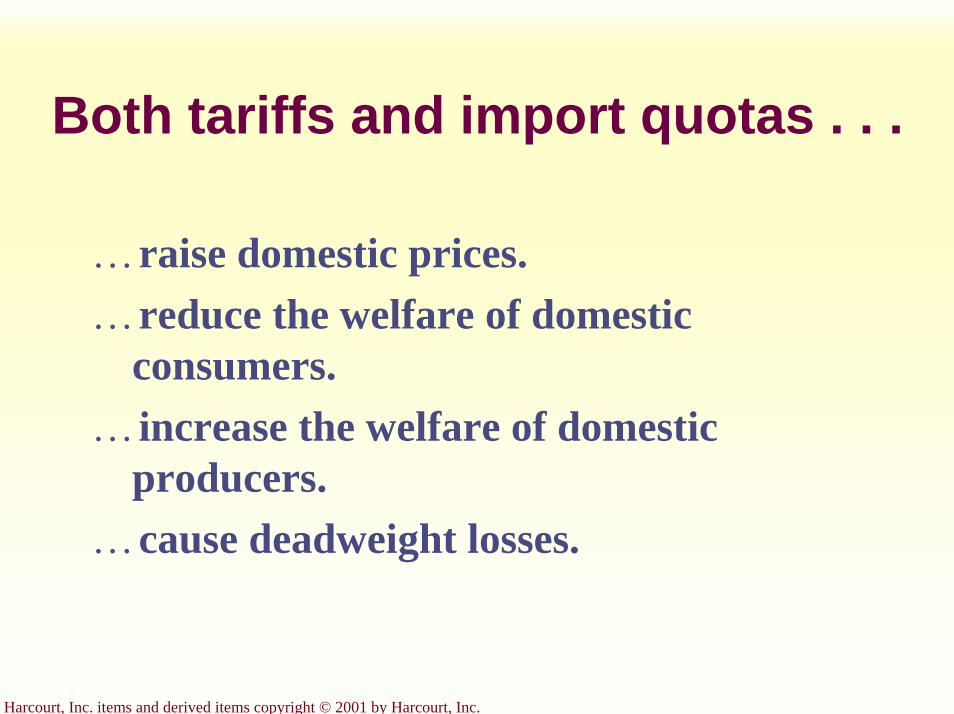
Harcourt, Inc. items and derived items copyright © 2001 by Harcourt, Inc.
Both tariffs and import quotas . . .
…raise domestic prices.…reduce the welfare of domestic
consumers.…increase the welfare of domestic
producers.…cause deadweight losses.
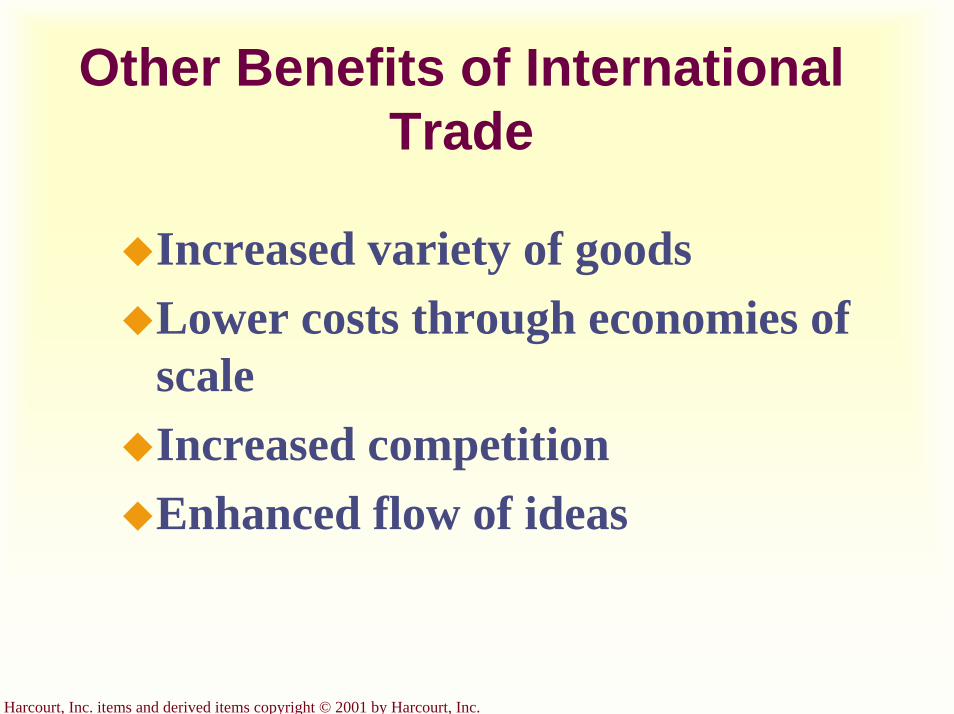
Harcourt, Inc. items and derived items copyright © 2001 by Harcourt, Inc.
Other Benefits of International Trade
Increased variety of goodsLower costs through economies of scaleIncreased competitionEnhanced flow of ideas
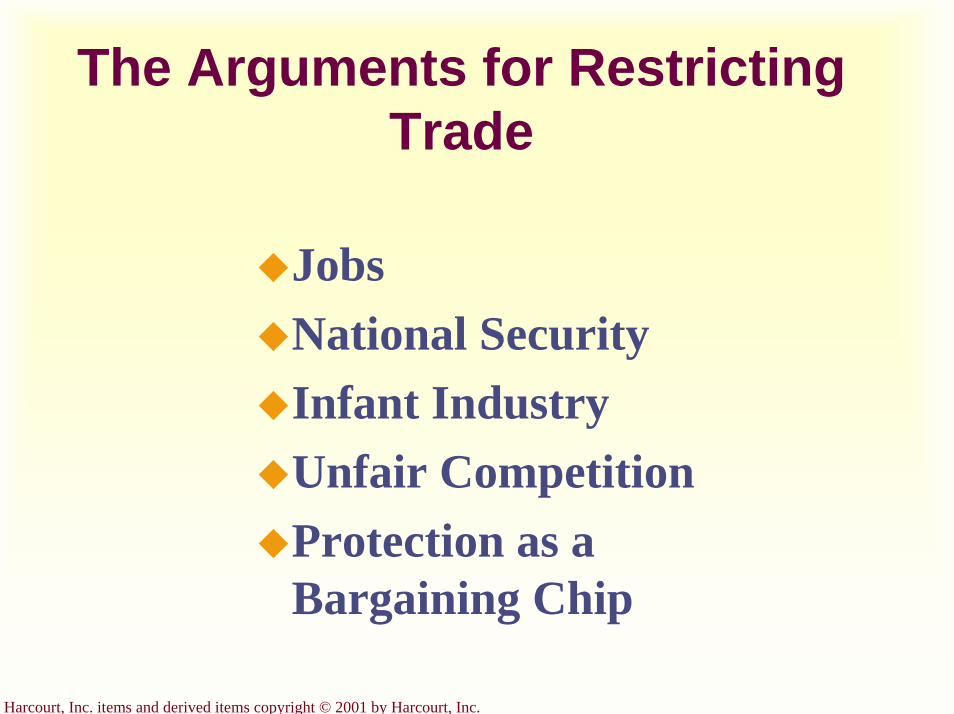
Harcourt, Inc. items and derived items copyright © 2001 by Harcourt, Inc.
The Arguments for Restricting Trade
Jobs National Security Infant IndustryUnfair CompetitionProtection as a Bargaining Chip
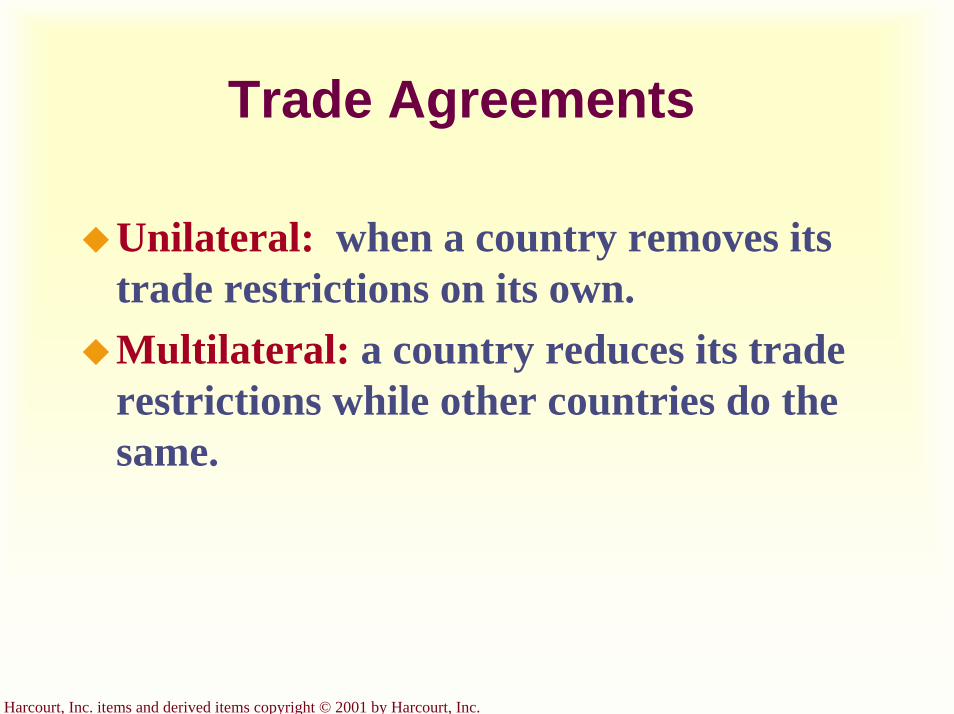
Harcourt, Inc. items and derived items copyright © 2001 by Harcourt, Inc.
Trade Agreements
Unilateral: when a country removes its trade restrictions on its own.Multilateral: a country reduces its trade restrictions while other countries do the same.
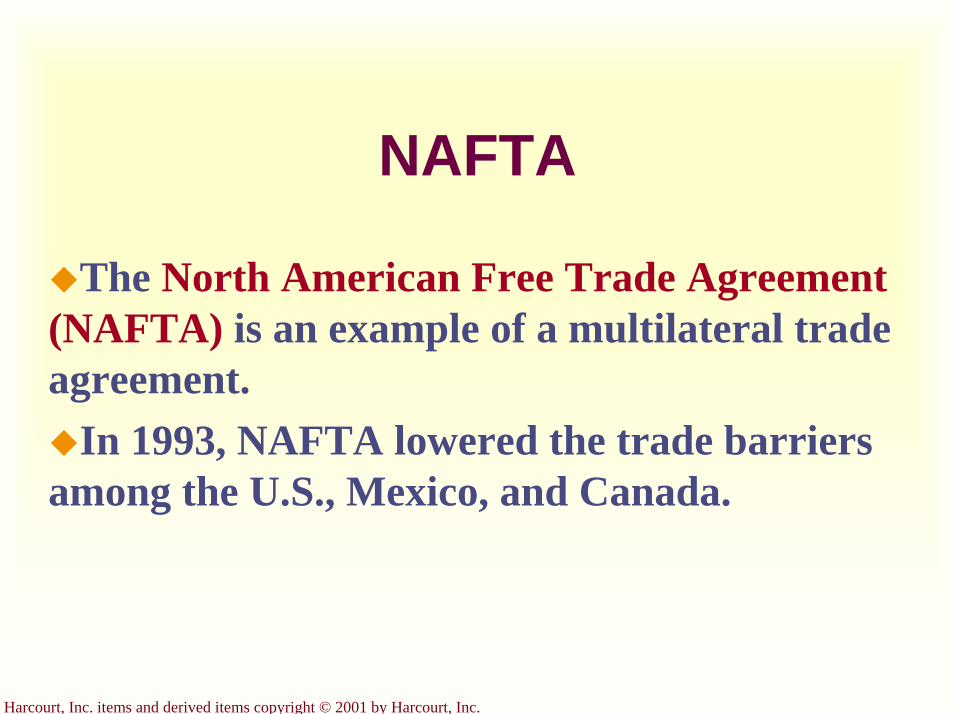
Harcourt, Inc. items and derived items copyright © 2001 by Harcourt, Inc.
NAFTA
The North American Free Trade Agreement (NAFTA) is an example of a multilateral trade agreement.
In 1993, NAFTA lowered the trade barriers among the U.S., Mexico, and Canada.
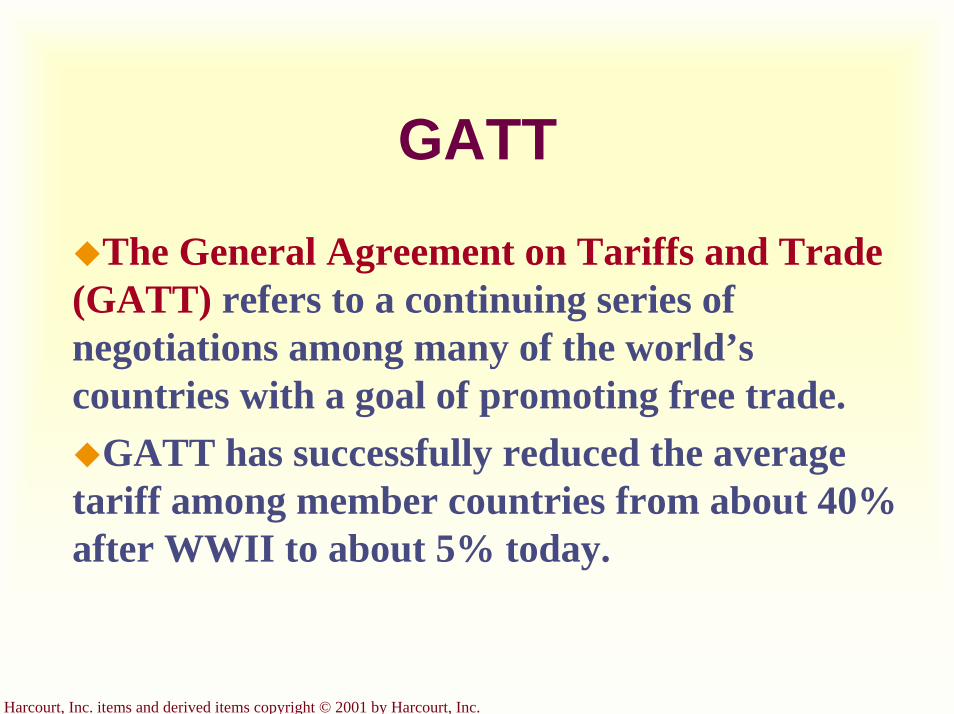
Harcourt, Inc. items and derived items copyright © 2001 by Harcourt, Inc.
GATT
The General Agreement on Tariffs and Trade (GATT) refers to a continuing series of negotiations among many of the world’s countries with a goal of promoting free trade.
GATT has successfully reduced the average tariff among member countries from about 40% after WWII to about 5% today.
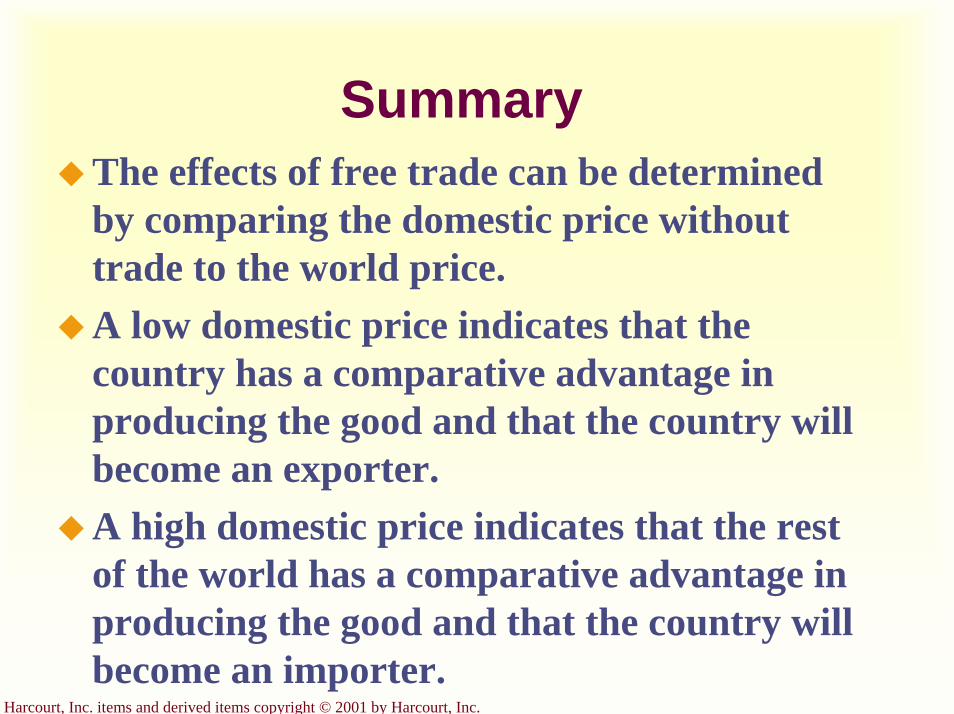
Harcourt, Inc. items and derived items copyright © 2001 by Harcourt, Inc.
SummaryThe effects of free trade can be determined by comparing the domestic price without trade to the world price.A low domestic price indicates that the country has a comparative advantage in producing the good and that the country will become an exporter.A high domestic price indicates that the rest of the world has a comparative advantage in producing the good and that the country will become an importer.
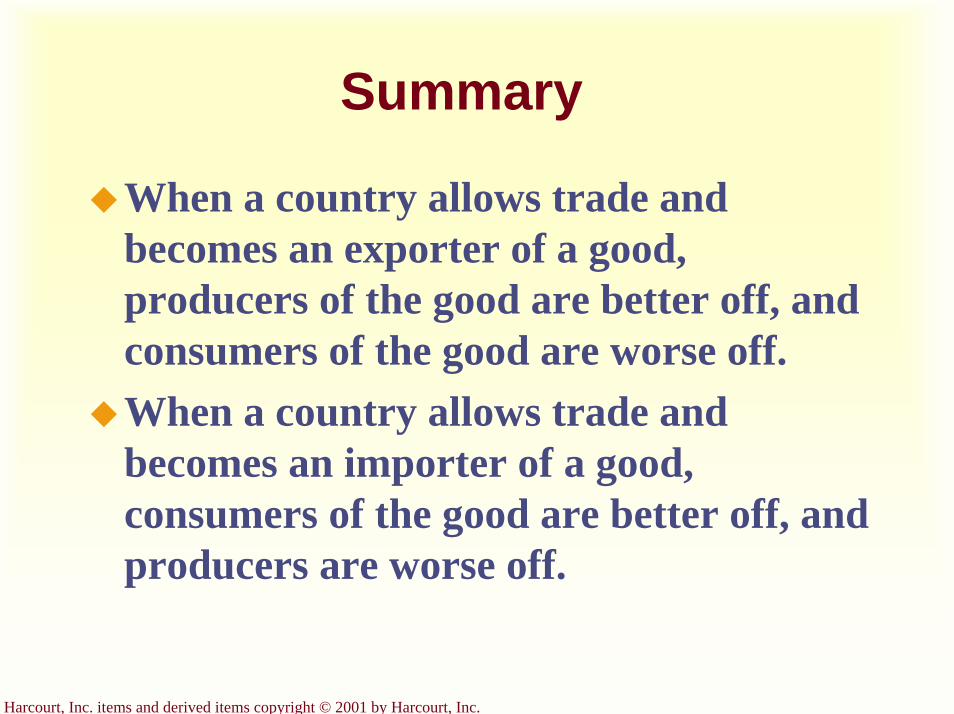
Harcourt, Inc. items and derived items copyright © 2001 by Harcourt, Inc.
Summary
When a country allows trade and becomes an exporter of a good, producers of the good are better off, and consumers of the good are worse off.When a country allows trade and becomes an importer of a good, consumers of the good are better off, and producers are worse off.
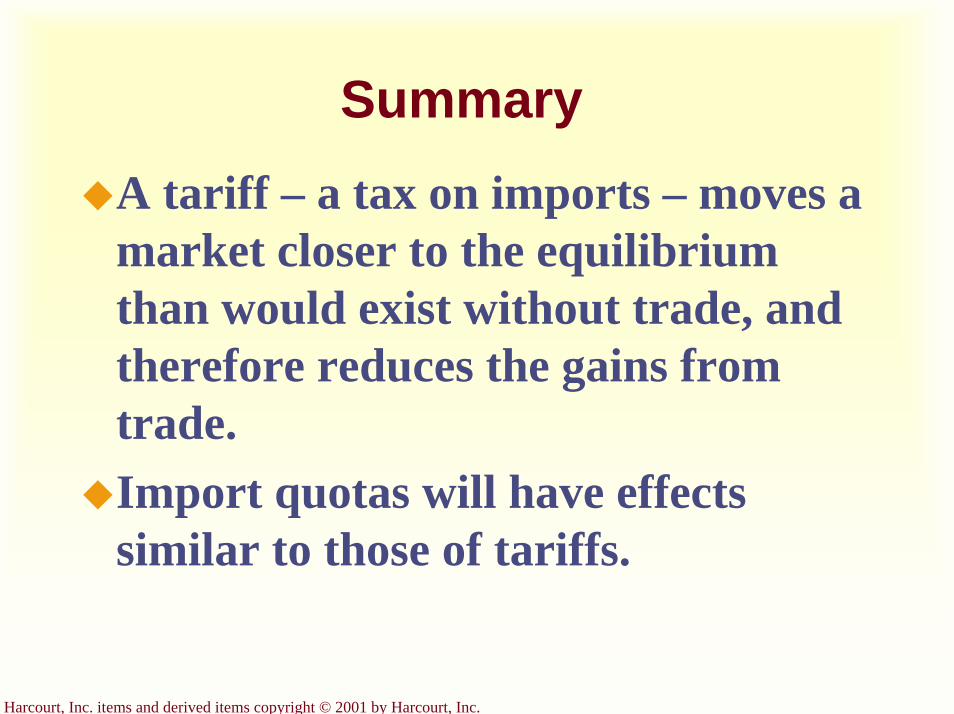
Harcourt, Inc. items and derived items copyright © 2001 by Harcourt, Inc.
SummaryA tariff – a tax on imports – moves a market closer to the equilibrium than would exist without trade, and therefore reduces the gains from trade.Import quotas will have effects similar to those of tariffs.
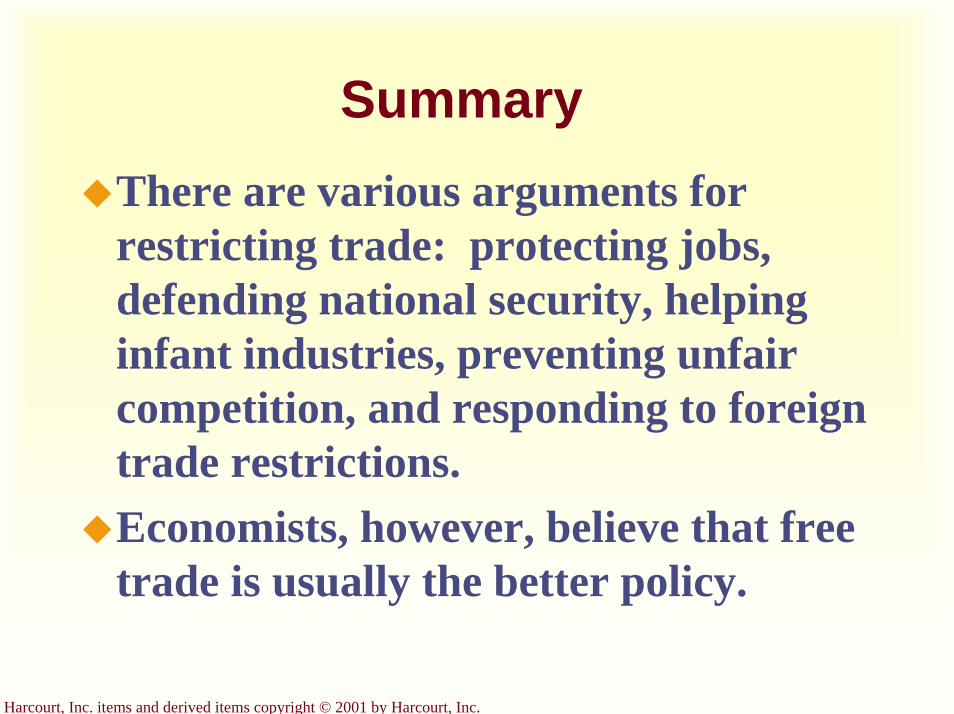
Harcourt, Inc. items and derived items copyright © 2001 by Harcourt, Inc.
SummaryThere are various arguments for restricting trade: protecting jobs, defending national security, helping infant industries, preventing unfair competition, and responding to foreign trade restrictions.Economists, however, believe that free trade is usually the better policy.

Harcourt, Inc. items and derived items copyright © 2001 by Harcourt, Inc.
Graphical Review

Harcourt, Inc. items and derived items copyright © 2001 by Harcourt, Inc.
Equilibrium Without Trade...
Priceof Steel
EquilibriumPrice
0 Quantityof Steel
Equilibriumquantity
Domesticsupply
Domesticdemand
Producersurplus
Consumersurplus

Harcourt, Inc. items and derived items copyright © 2001 by Harcourt, Inc.
International Trade in an Exporting Country...
Priceof Steel
0 Quantityof Steel
Domesticdemand
Domesticsupply
Worldprice
Price after trade
Exports
Domesticquantity
demanded
Domesticquantity supplied
Price before trade
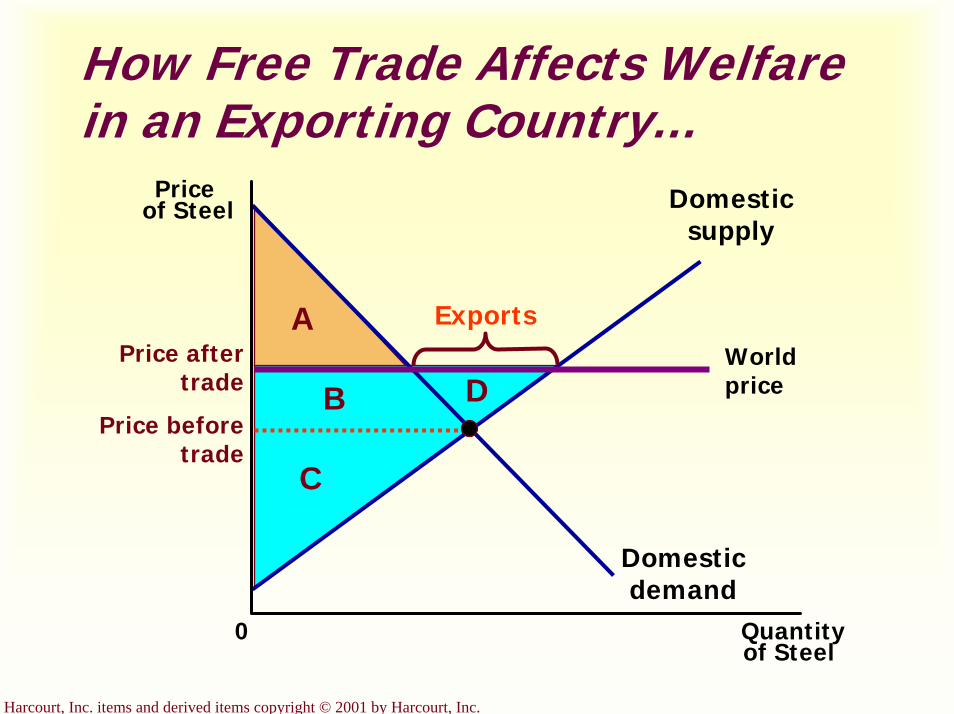
Harcourt, Inc. items and derived items copyright © 2001 by Harcourt, Inc.
How Free Trade Affects Welfare in an Exporting Country...
Priceof Steel
0 Quantityof Steel
Worldprice
Domesticdemand
Domesticsupply
Price after trade
Price before trade
A
B
C
D
Exports
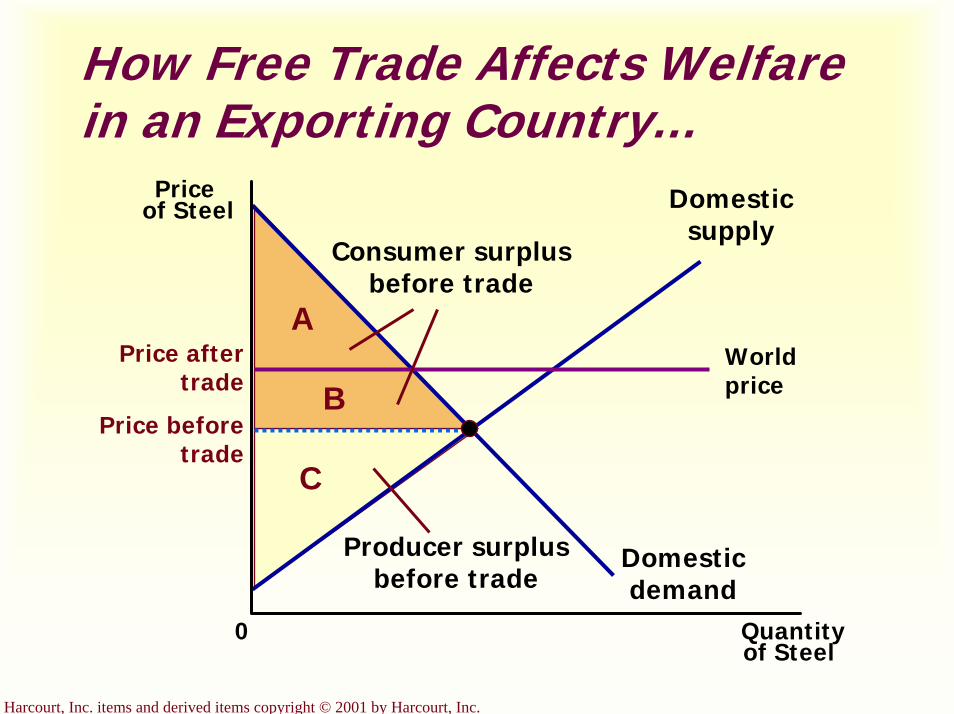
Harcourt, Inc. items and derived items copyright © 2001 by Harcourt, Inc.
How Free Trade Affects Welfare in an Exporting Country...
Priceof Steel
0 Quantityof Steel
Worldprice
Domesticdemand
Domesticsupply
Price after trade
Price before trade
A
Consumer surplusbefore trade
B
C
Producer surplusbefore trade
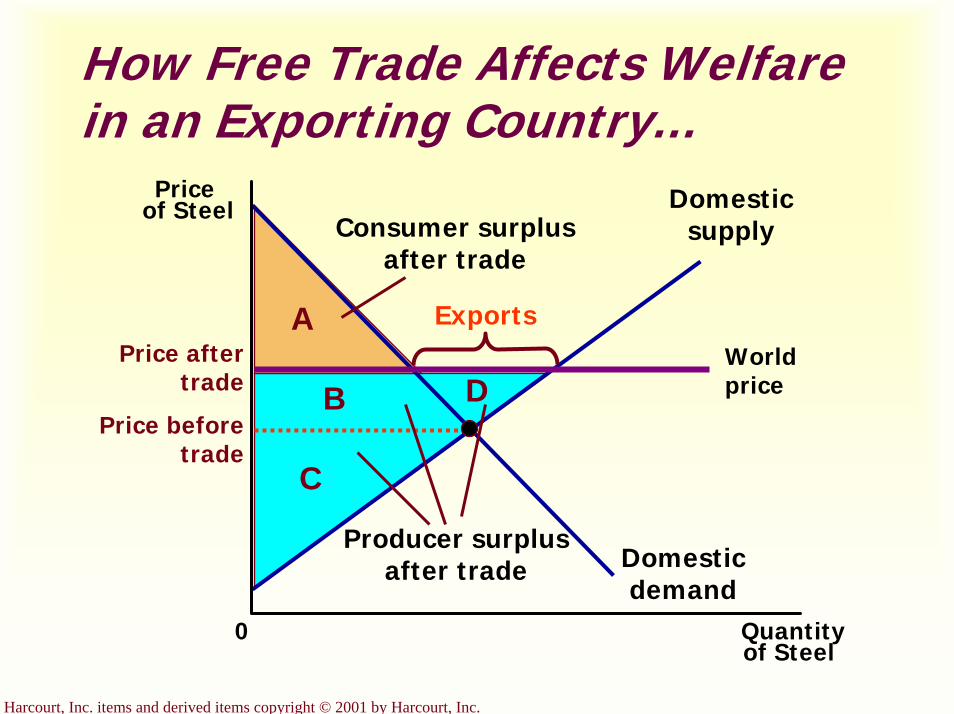
Harcourt, Inc. items and derived items copyright © 2001 by Harcourt, Inc.
How Free Trade Affects Welfare in an Exporting Country...
Priceof Steel
0 Quantityof Steel
Worldprice
Domesticdemand
Domesticsupply
Price after trade
Price before trade
A
Consumer surplusafter trade
C
B
Producer surplusafter trade
D
Exports
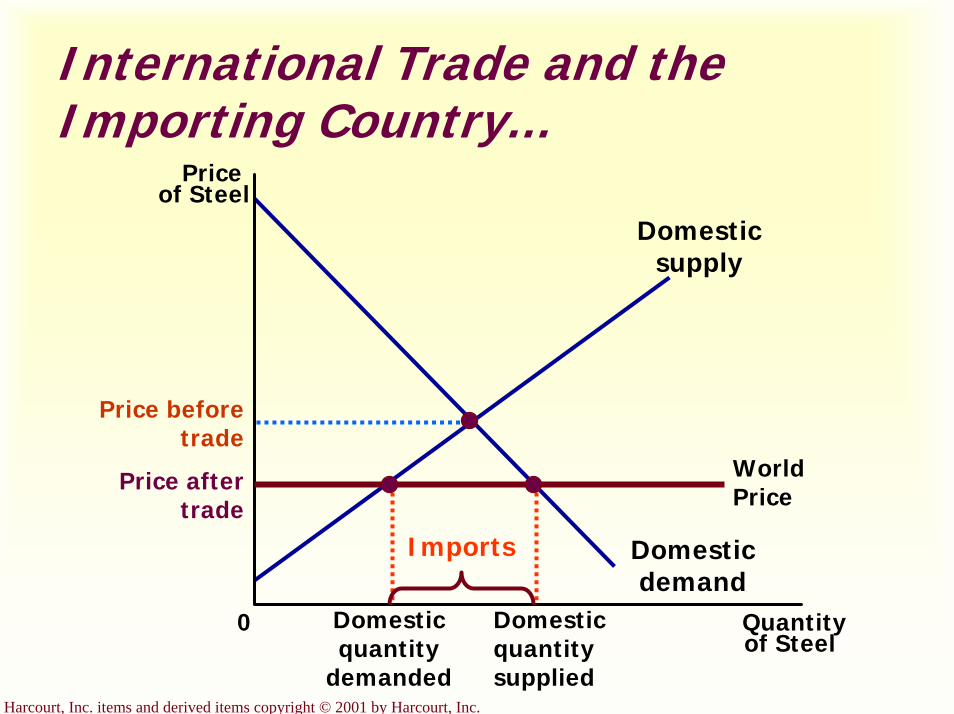
Harcourt, Inc. items and derived items copyright © 2001 by Harcourt, Inc.
International Trade and the Importing Country...
Priceof Steel
0 Quantityof Steel
Domesticsupply
Domestic demand
World Price
Price after trade
Domesticquantity
demanded
Domesticquantitysupplied
Price before trade
Imports
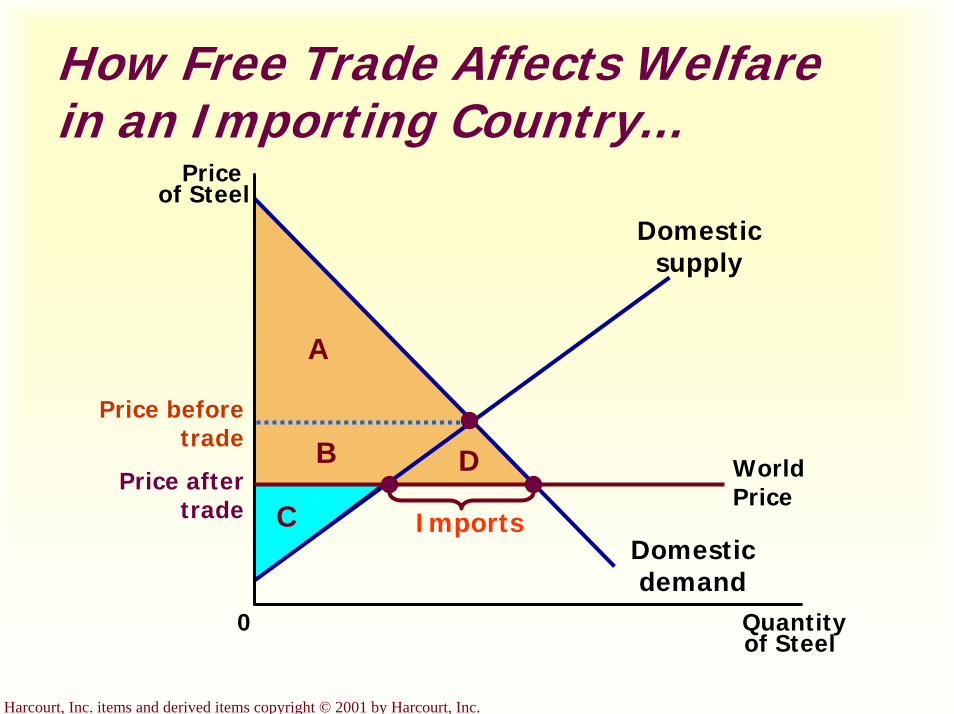
Harcourt, Inc. items and derived items copyright © 2001 by Harcourt, Inc.
How Free Trade Affects Welfare in an Importing Country...
Priceof Steel
0 Quantityof Steel
Domesticsupply
World Price
Domestic demand
Price after trade
Price before trade
A
B
C
D
Imports
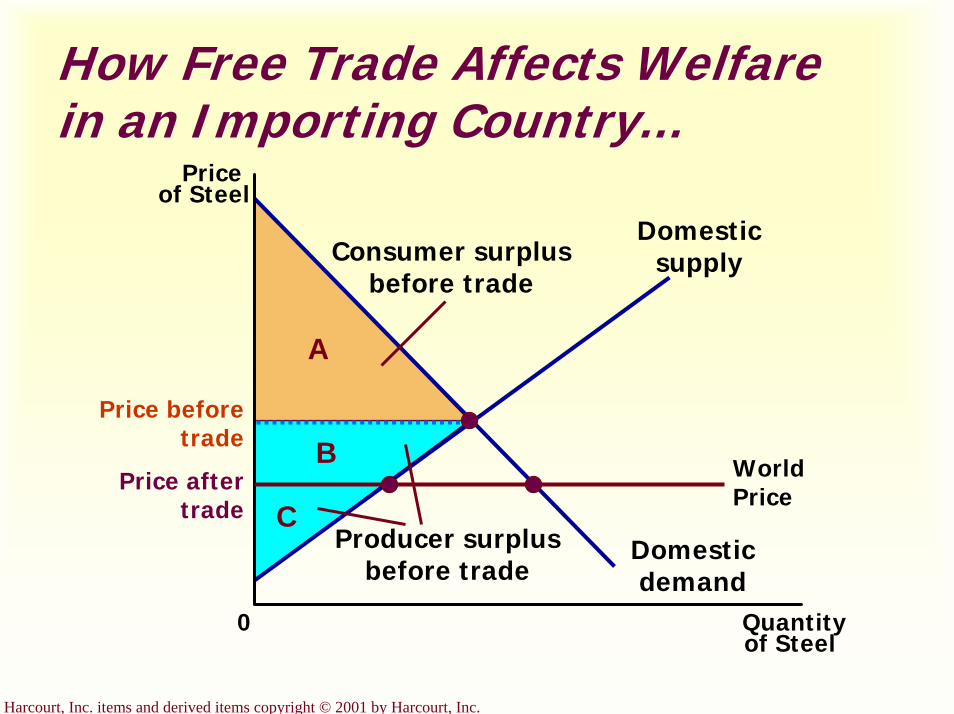
Harcourt, Inc. items and derived items copyright © 2001 by Harcourt, Inc.
How Free Trade Affects Welfare in an Importing Country...
Priceof Steel
0 Quantityof Steel
Domesticsupply
World Price
Domestic demand
Price after trade
Price before trade
A
Consumer surplusbefore trade
C
B
Producer surplusbefore trade

Harcourt, Inc. items and derived items copyright © 2001 by Harcourt, Inc.
How Free Trade Affects Welfare in an Importing Country...
Priceof Steel
0 Quantityof Steel
Domesticsupply
World Price
Domestic demand
Price after trade
Price before trade
A
Consumer surplusafter trade
B D
CProducer surplus
after trade
Imports
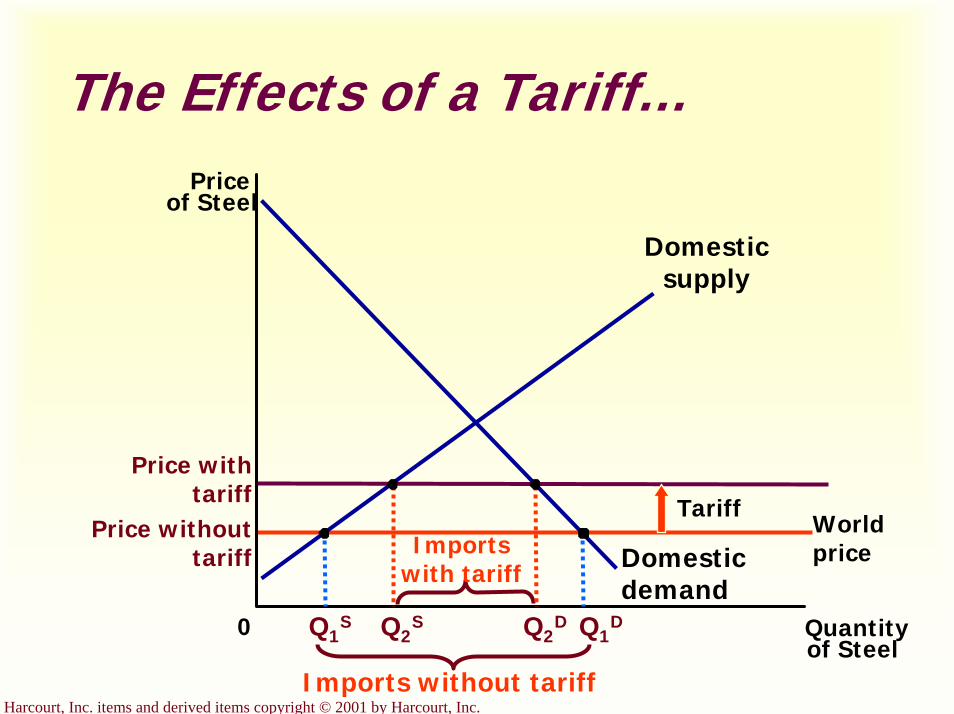
Harcourt, Inc. items and derived items copyright © 2001 by Harcourt, Inc.
The Effects of a Tariff...
Price with tariff
World price
Price without tariff
Priceof Steel
0 Quantityof Steel
Domestic supply
Domestic demand
Tariff
Q1S Q1
D
Imports without tariff
Imports with tariff
Q2DQ2
S
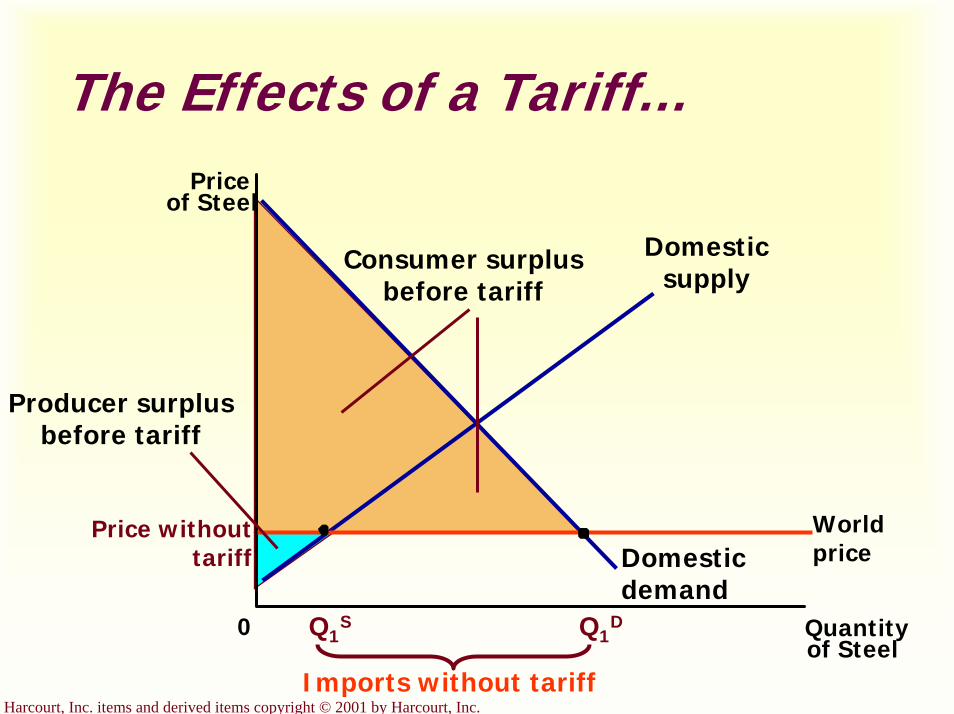
Harcourt, Inc. items and derived items copyright © 2001 by Harcourt, Inc.
The Effects of a Tariff...Price
of Steel
0 Quantityof Steel
Domestic supply
Domestic demand
World price
Q1S Q1
D
Price without tariff
Imports without tariff
Consumer surplusbefore tariff
Producer surplusbefore tariff
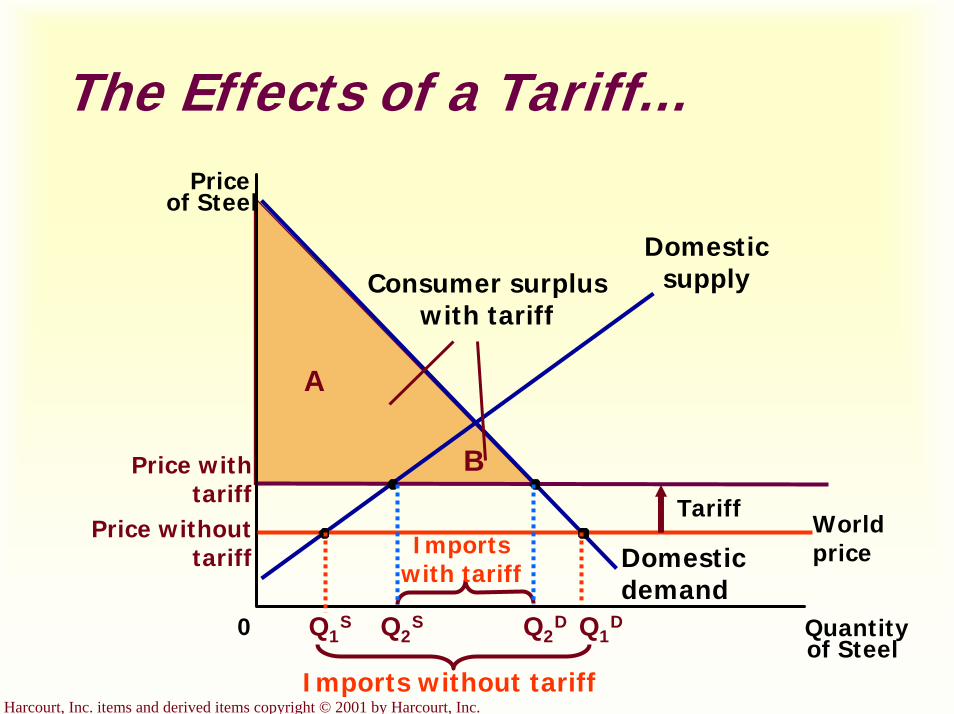
Harcourt, Inc. items and derived items copyright © 2001 by Harcourt, Inc.
The Effects of a Tariff...Price
of Steel
0 Quantityof Steel
Domestic supply
Domestic demand
TariffWorld price
Q1S Q2
S Q2D Q1
D
Price without tariff
Price with tariff
Imports without tariff
Imports with tariff
A
Consumer surpluswith tariff
B
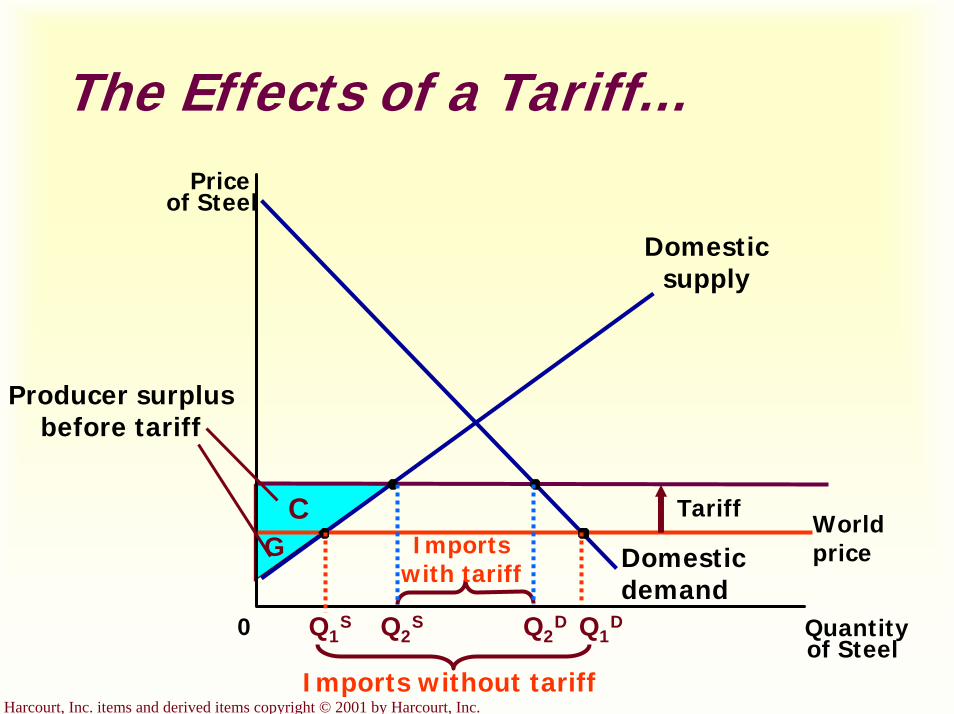
Harcourt, Inc. items and derived items copyright © 2001 by Harcourt, Inc.
The Effects of a Tariff...Price
of Steel
0 Quantityof Steel
Domestic supply
Domestic demand
TariffWorld price
Q1S Q2
S Q2D Q1
D
Imports without tariff
Imports with tariff
CG
Producer surplusbefore tariff
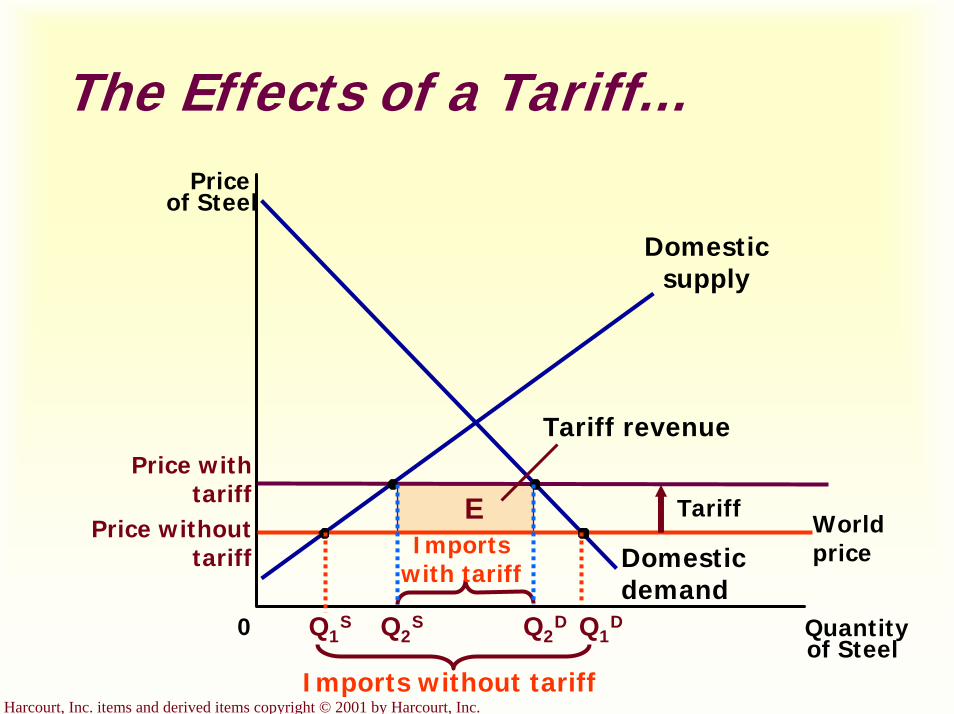
Harcourt, Inc. items and derived items copyright © 2001 by Harcourt, Inc.
The Effects of a Tariff...Price
of Steel
0 Quantityof Steel
Domestic supply
Domestic demand
TariffWorld price
Q1S Q2
S Q2D Q1
D
Imports without tariff
Imports with tariff
E
Tariff revenuePrice with
tariffPrice without
tariff
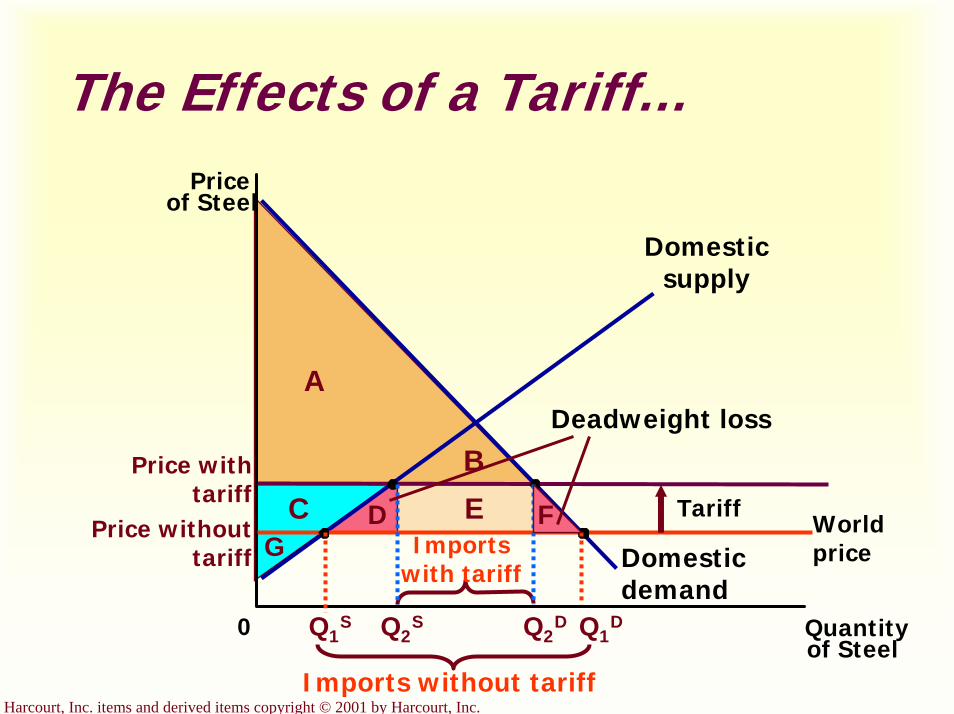
Harcourt, Inc. items and derived items copyright © 2001 by Harcourt, Inc.
The Effects of a Tariff...Price
of Steel
0 Quantityof Steel
Domestic supply
Domestic demand
TariffWorld price
Q1S Q2
S Q2D Q1
D
Price without tariff
Price with tariff
Imports without tariff
Imports with tariff
A
B
C EG
D F
Deadweight loss
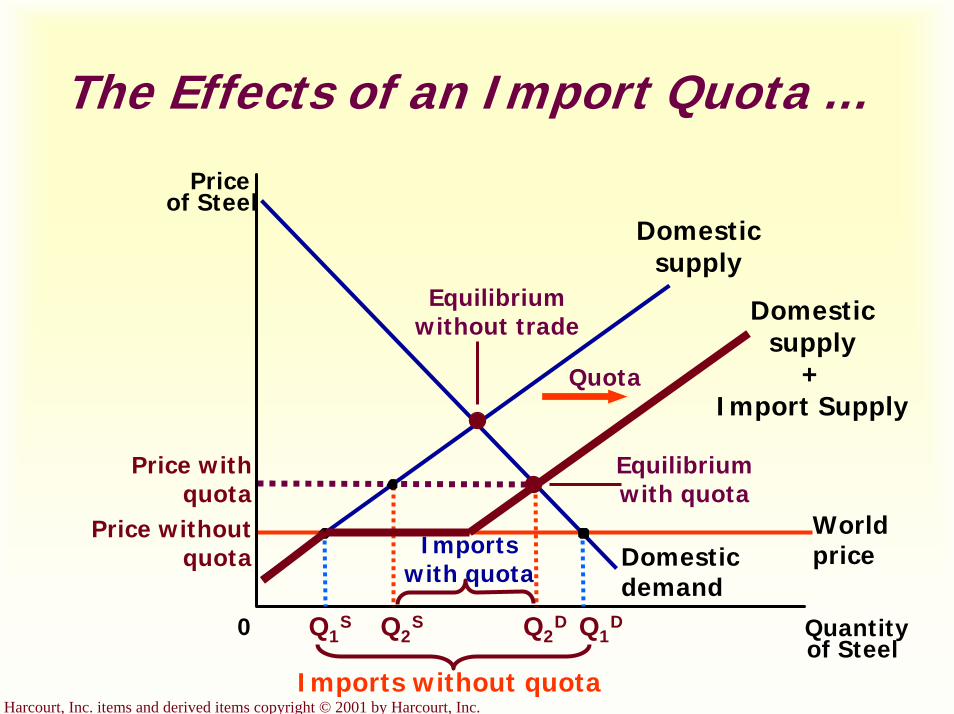
Harcourt, Inc. items and derived items copyright © 2001 by Harcourt, Inc.
The Effects of an Import Quota ...
Price with quota
World price
Price without quota
Priceof Steel
0 Quantityof Steel
Domestic supply
Domestic demand
Q1S Q2
S Q2D
Imports without quota
Imports with quota
Domestic supply
+Import Supply
Quota
Equilibrium with quota
Equilibrium without trade
Q1D
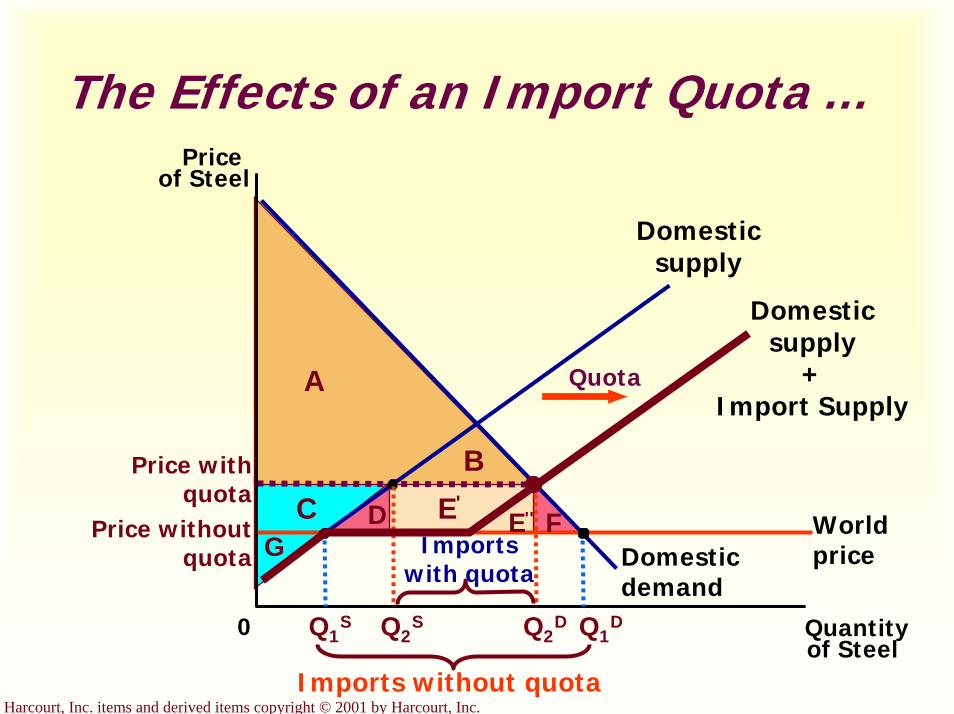
Harcourt, Inc. items and derived items copyright © 2001 by Harcourt, Inc.
The Effects of an Import Quota ...Price
of Steel
0 Quantityof Steel
Domestic supply
Domestic demand
World price
Q1S Q2
S Q2D Q1
D
Price without quota
Price with quota
Imports without quota
Imports with quota
Domestic supply
+Import Supply
QuotaA
B
C E'E'' F
GD

Harcourt, Inc. items and derived items copyright © 2001 by Harcourt, Inc.
Externalities
Chapter 10
Copyright © 2001 by Harcourt, Inc.
All rights reserved. Requests for permission to make copies of any part of thework should be mailed to:
Permissions Department, Harcourt College Publishers,6277 Sea Harbor Drive, Orlando, Florida 32887-6777.
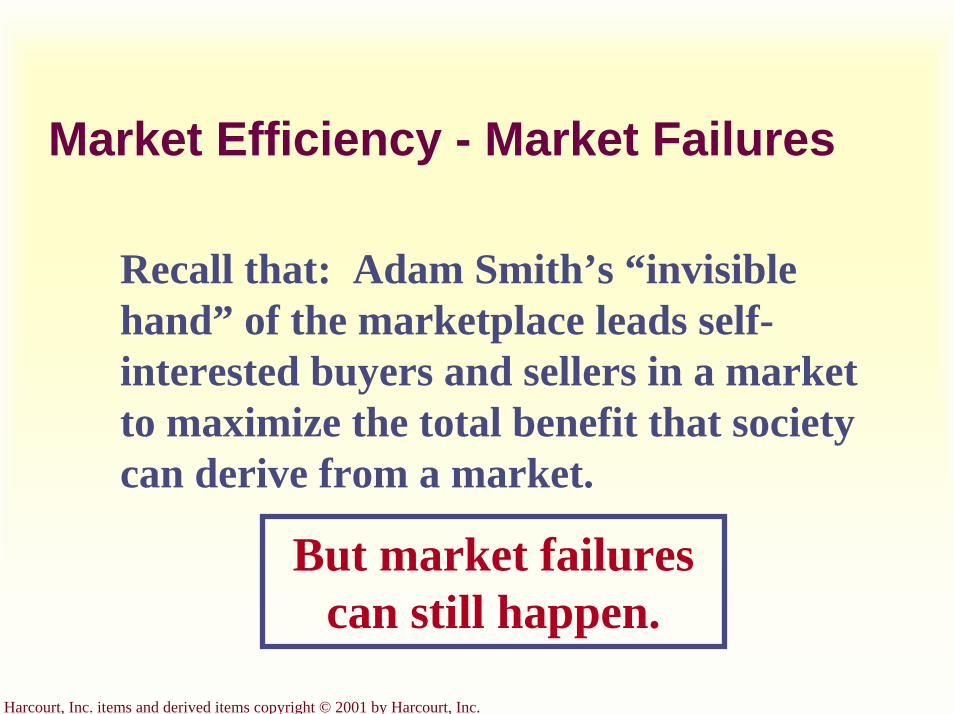
Harcourt, Inc. items and derived items copyright © 2001 by Harcourt, Inc.
Market Efficiency - Market Failures
Recall that: Adam Smith’s “invisible hand” of the marketplace leads self-interested buyers and sellers in a market to maximize the total benefit that society can derive from a market.
But market failures can still happen.
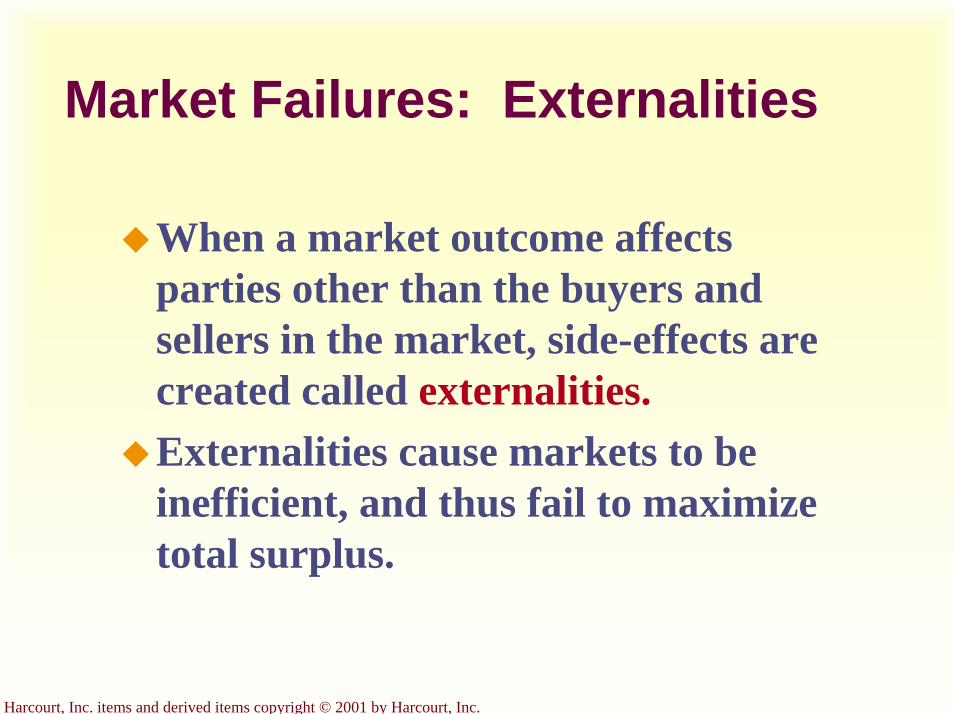
Harcourt, Inc. items and derived items copyright © 2001 by Harcourt, Inc.
Market Failures: Externalities
When a market outcome affects parties other than the buyers and sellers in the market, side-effects are created called externalities.Externalities cause markets to be inefficient, and thus fail to maximize total surplus.

Harcourt, Inc. items and derived items copyright © 2001 by Harcourt, Inc.
An externality arises...
. . . when a person engages in an activity that influences the well-being of a bystander and yet neither pays nor receives any compensation for that effect.
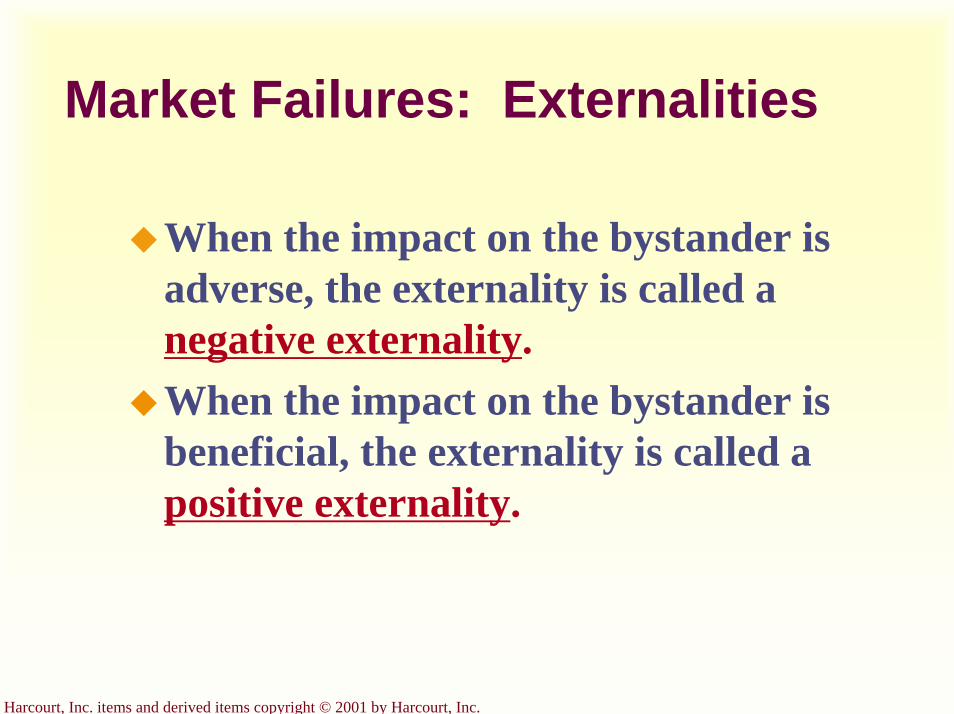
Harcourt, Inc. items and derived items copyright © 2001 by Harcourt, Inc.
Market Failures: Externalities
When the impact on the bystander is adverse, the externality is called a negative externality.When the impact on the bystander is beneficial, the externality is called a positive externality.

Harcourt, Inc. items and derived items copyright © 2001 by Harcourt, Inc.
Automobile exhaustCigarette smokingBarking dogs (loud pets)Loud stereos in an apartment building
Examples of Negative Externalities

Harcourt, Inc. items and derived items copyright © 2001 by Harcourt, Inc.
ImmunizationsRestored historic buildingsResearch into new technologies
Examples of Positive Externalities

Harcourt, Inc. items and derived items copyright © 2001 by Harcourt, Inc.
The Market for Aluminum...
Quantity ofAluminum
0
Price ofAluminum
QMARKET
Demand(private value)
Supply(private cost)
Equilibrium
Harcourt, Inc. items and derived items copyright © 2001 by Harcourt, Inc.
The Market for Aluminum and Welfare Economics
The quantity produced and consumed in the market equilibrium is efficient in the sense that it maximizes the sum of producer and consumer surplus.
Harcourt, Inc. items and derived items copyright © 2001 by Harcourt, Inc.
The Market for Aluminum and Welfare Economics
If the aluminum factories emit pollution (a negative externality), then the cost to society of producing aluminum is larger than the cost to aluminum producers.
Harcourt, Inc. items and derived items copyright © 2001 by Harcourt, Inc.
The Market for Aluminum and Welfare Economics
For each unit of aluminum produced, the social cost includes the private costs of the producers plus the cost to those bystanders adversely affected by the pollution.

Harcourt, Inc. items and derived items copyright © 2001 by Harcourt, Inc.
Pollution and the Social Optimum...
QMARKET Quantity ofAluminum
0
Price ofAluminum
Demand(private value)
Supply(private cost)
Social cost
Qoptimum
Cost ofpollution
Equilibrium
Optimum
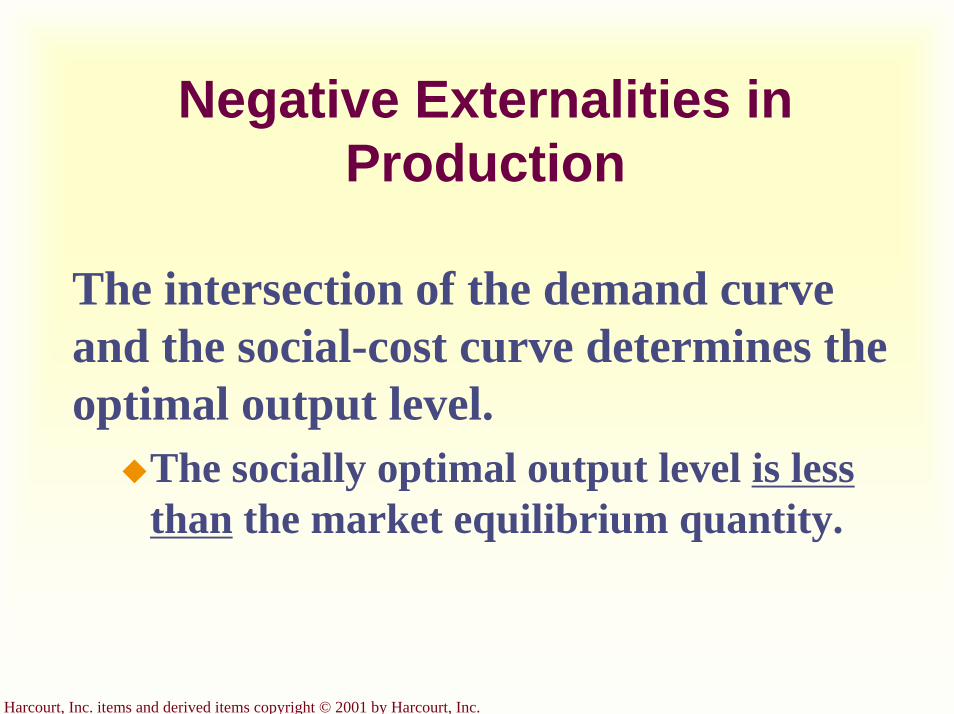
Harcourt, Inc. items and derived items copyright © 2001 by Harcourt, Inc.
Negative Externalities in Production
The intersection of the demand curve and the social-cost curve determines the optimal output level.
The socially optimal output level is less than the market equilibrium quantity.
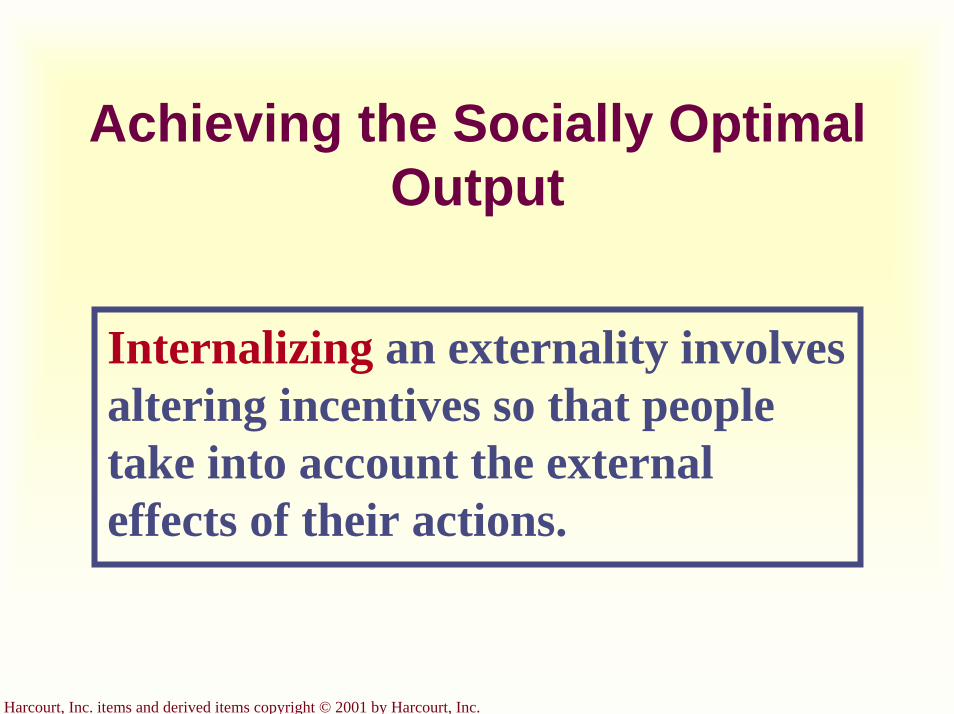
Harcourt, Inc. items and derived items copyright © 2001 by Harcourt, Inc.
Achieving the Socially Optimal Output
Internalizing an externality involves altering incentives so that people take into account the external effects of their actions.
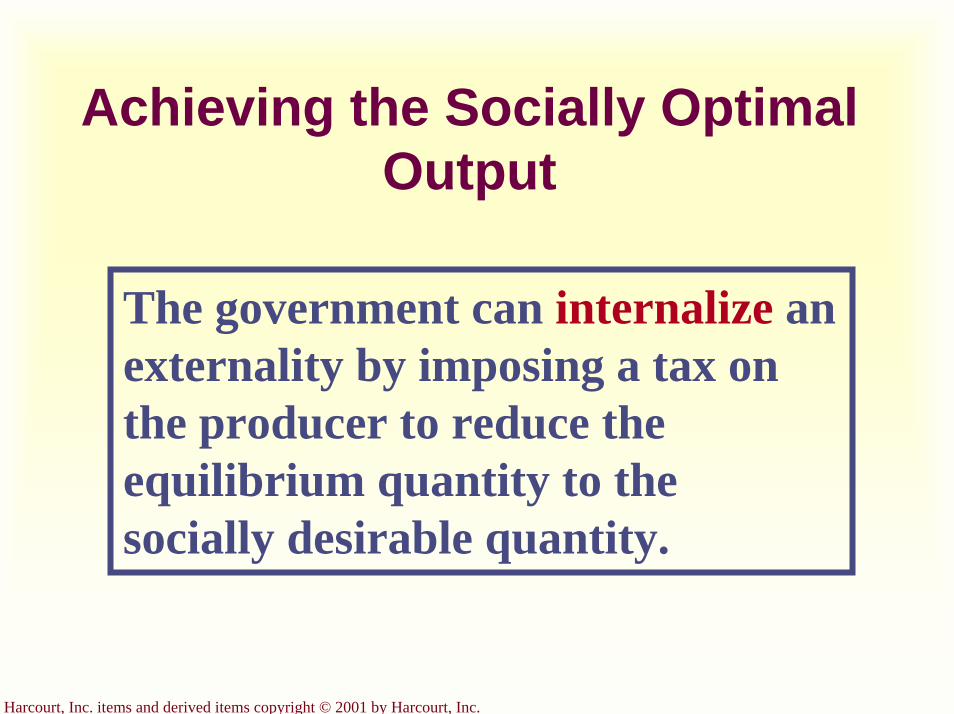
Harcourt, Inc. items and derived items copyright © 2001 by Harcourt, Inc.
Achieving the Socially Optimal Output
The government can internalize an externality by imposing a tax on the producer to reduce the equilibrium quantity to the socially desirable quantity.
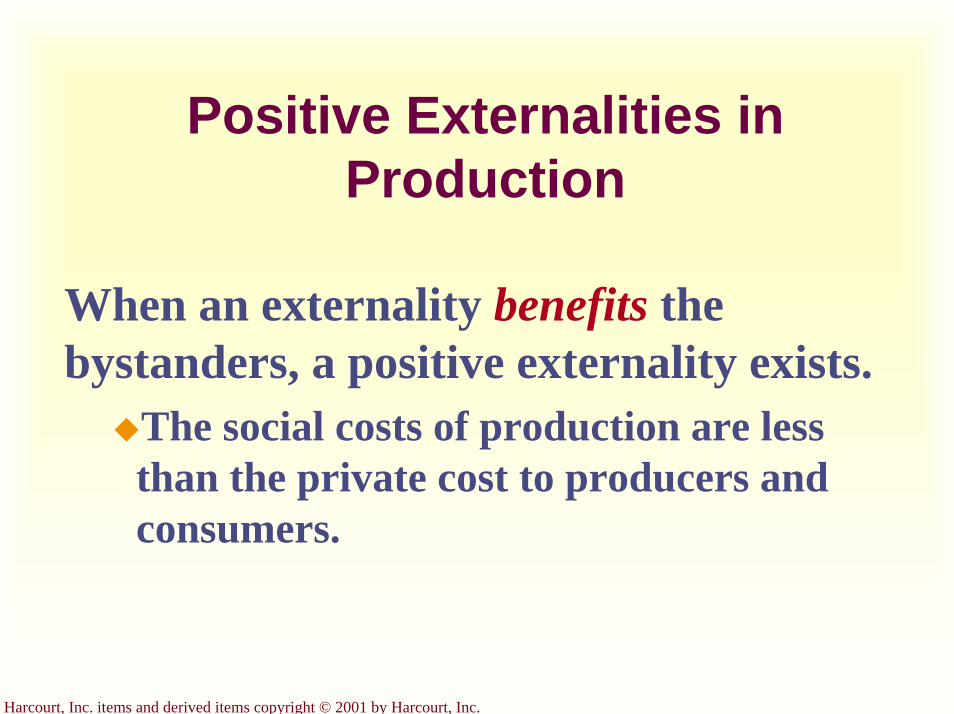
Harcourt, Inc. items and derived items copyright © 2001 by Harcourt, Inc.
Positive Externalities in Production
When an externality benefits the bystanders, a positive externality exists.
The social costs of production are less than the private cost to producers and consumers.

Harcourt, Inc. items and derived items copyright © 2001 by Harcourt, Inc.
Positive Externalities in Production
A technology spillover is a type of positive externality that exists when a firm’s innovation or design not only benefits the firm, but enters society’s pool of technological knowledge and benefits society as a whole.

Harcourt, Inc. items and derived items copyright © 2001 by Harcourt, Inc.
Positive Externalities in Production...
Quantityof Robots
0
Priceof Robot
QOPTIMUM
Demand(private value)
Supply (private cost)
Social cost
QMARKET
Value oftechnologyspillover
Equilibrium
Optimum
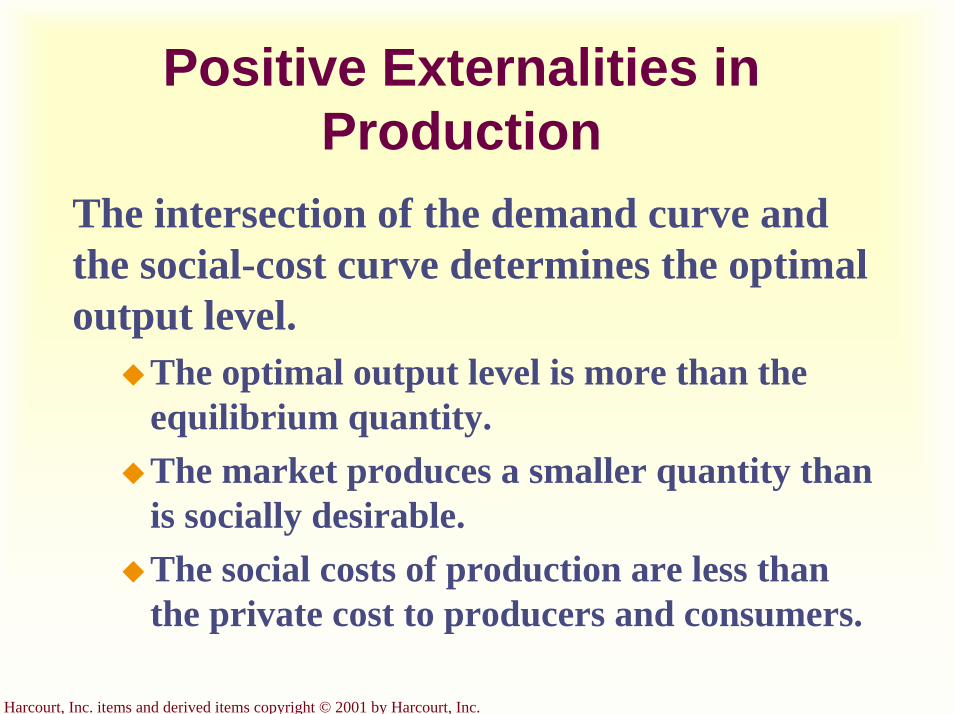
Harcourt, Inc. items and derived items copyright © 2001 by Harcourt, Inc.
Positive Externalities in Production
The intersection of the demand curve and the social-cost curve determines the optimal output level.
The optimal output level is more than the equilibrium quantity.The market produces a smaller quantity than is socially desirable. The social costs of production are less than the private cost to producers and consumers.

Harcourt, Inc. items and derived items copyright © 2001 by Harcourt, Inc.
Internalizing Externalities: Subsidies
Government many times uses subsidies as the primary method for attempting to internalize positive externalities.

Harcourt, Inc. items and derived items copyright © 2001 by Harcourt, Inc.
Technology Policy
Government intervention in the economy that aims to promote technology-enhancing industries is called technology policy.
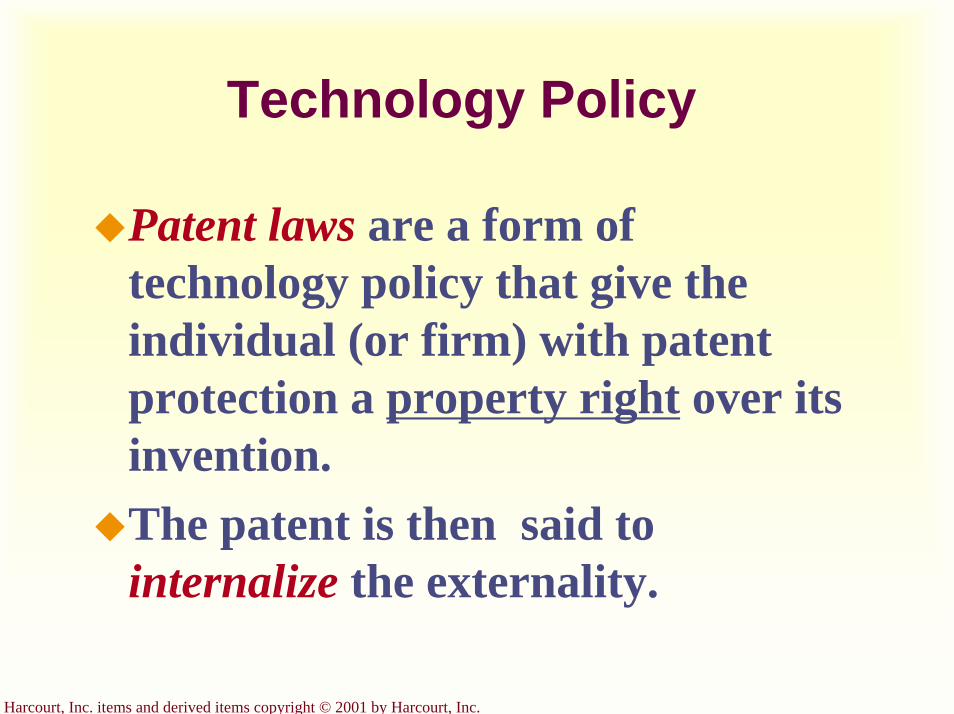
Harcourt, Inc. items and derived items copyright © 2001 by Harcourt, Inc.
Technology Policy
Patent laws are a form of technology policy that give the individual (or firm) with patent protection a property right over its invention. The patent is then said to internalize the externality.
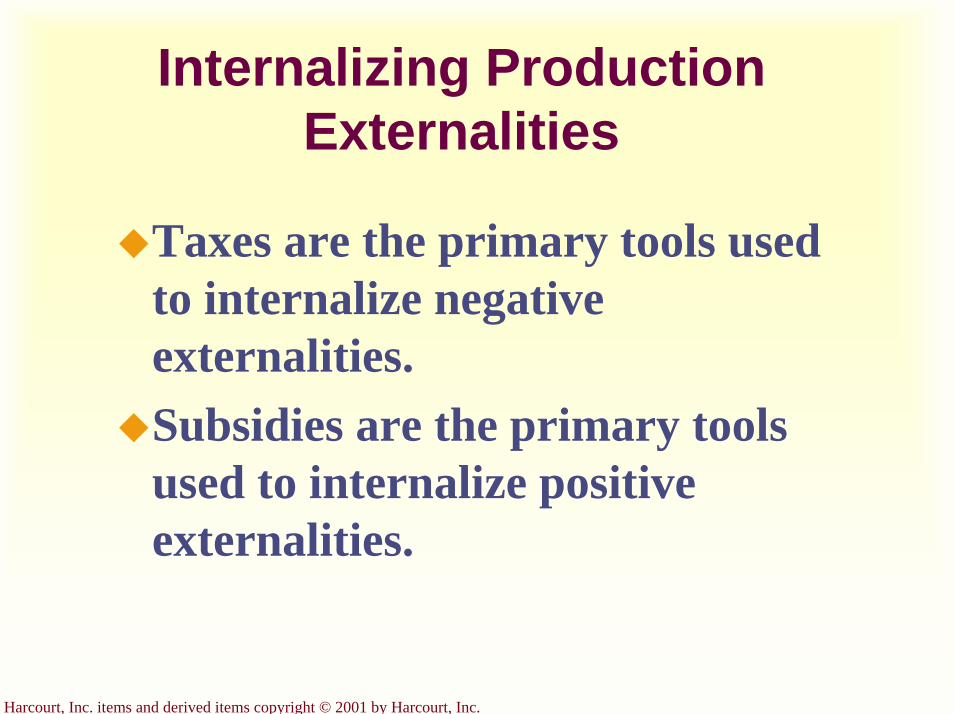
Harcourt, Inc. items and derived items copyright © 2001 by Harcourt, Inc.
Internalizing Production Externalities
Taxes are the primary tools used to internalize negative externalities.Subsidies are the primary tools used to internalize positive externalities.
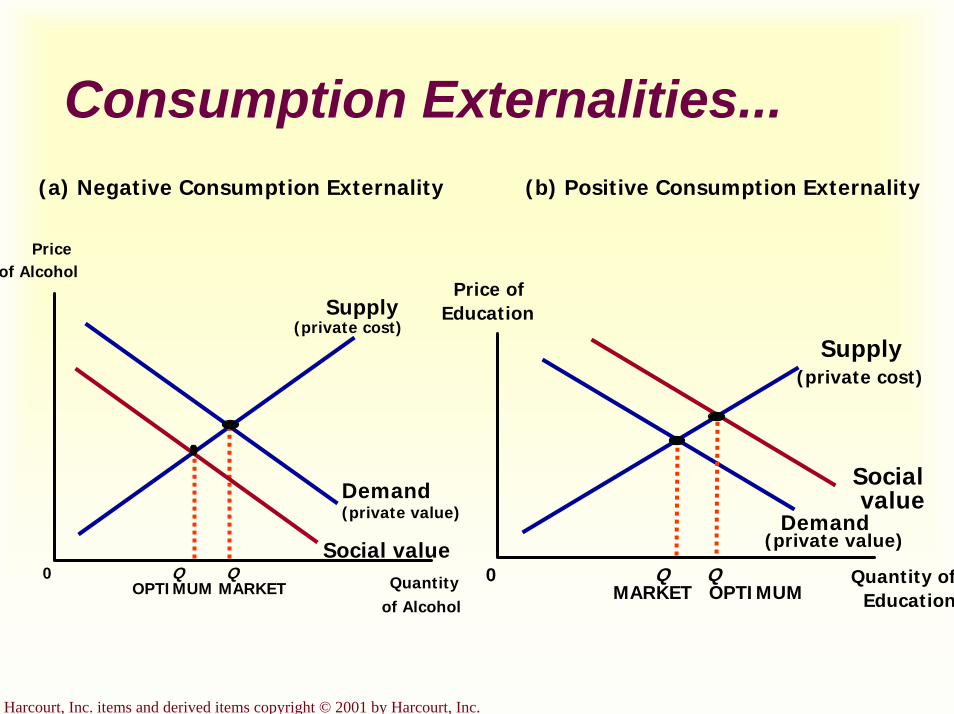
Harcourt, Inc. items and derived items copyright © 2001 by Harcourt, Inc.
Consumption Externalities...(a) Negative Consumption Externality (b) Positive Consumption Externality
Quantity ofEducation
0
Price ofEducation
QMARKET
Demand(private value)
Socialvalue
QOPTIMUM
Supply(private cost)
Quantityof Alcohol
0
Priceof Alcohol
QMARKET
Demand (private value)
Supply(private cost)
Social valueQ
OPTIMUM
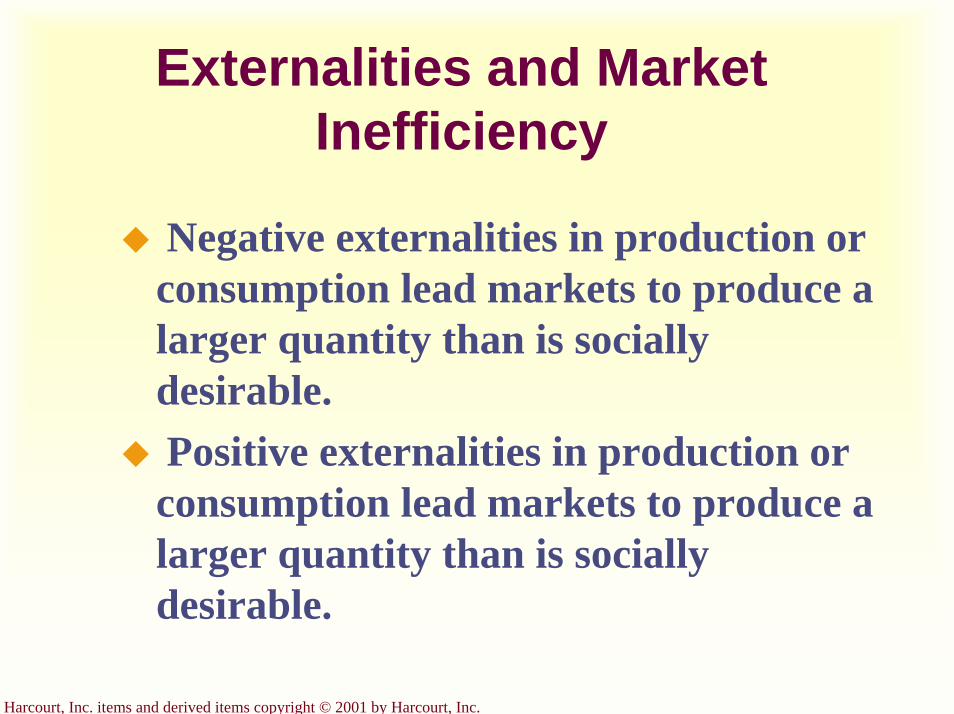
Harcourt, Inc. items and derived items copyright © 2001 by Harcourt, Inc.
Externalities and Market Inefficiency
Negative externalities in production or consumption lead markets to produce a larger quantity than is socially desirable.Positive externalities in production or consumption lead markets to produce a larger quantity than is socially desirable.

Harcourt, Inc. items and derived items copyright © 2001 by Harcourt, Inc.
Private Solutions to Externalities
Government action is not always needed to solve the problem of externalities.
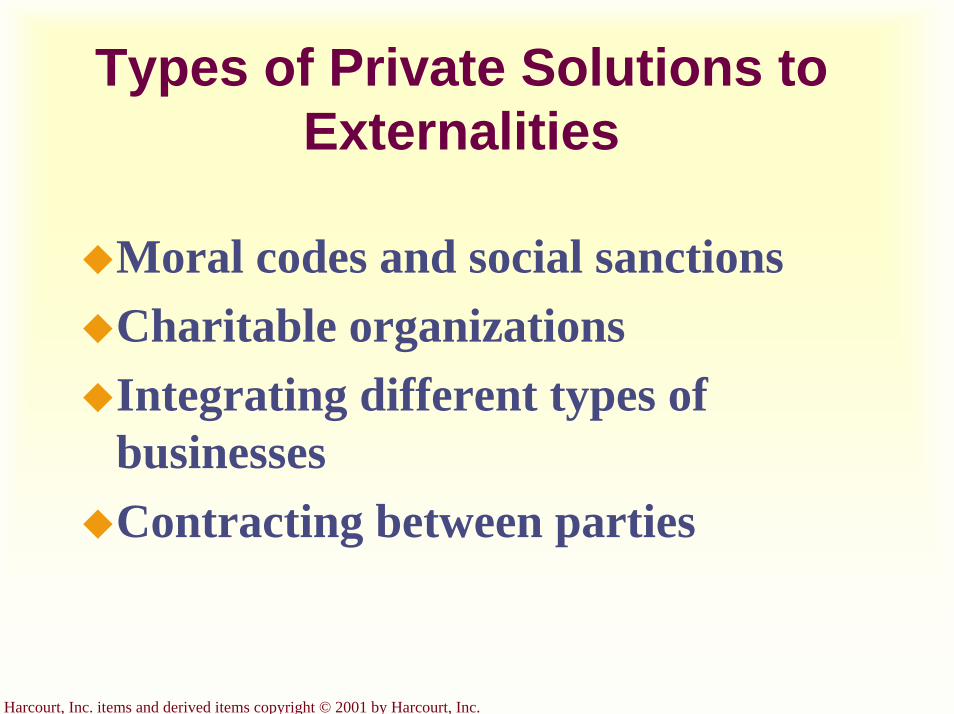
Harcourt, Inc. items and derived items copyright © 2001 by Harcourt, Inc.
Types of Private Solutions to Externalities
Moral codes and social sanctionsCharitable organizationsIntegrating different types of businessesContracting between parties
Harcourt, Inc. items and derived items copyright © 2001 by Harcourt, Inc.
The Coase Theorem
The Coase Theorem states that if private parties can bargain without cost over the allocation of resources, then the private market will always solve the problem of externalities on its own and allocate resources efficiently.
Harcourt, Inc. items and derived items copyright © 2001 by Harcourt, Inc.
Transactions Costs
Transaction costs are the costs that parties incur in the process of agreeing to and following through on a bargain.

Harcourt, Inc. items and derived items copyright © 2001 by Harcourt, Inc.
Why Private Solutions Do Not Always Work
Sometimes the private solution approach fails because transaction
costs can be so high that private agreement is not possible.
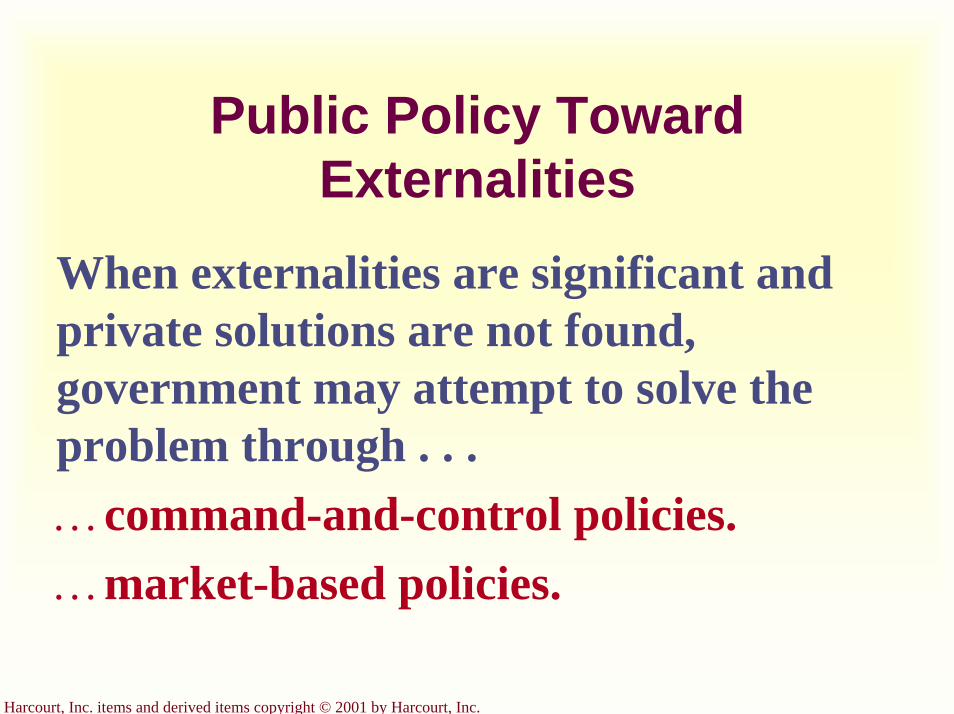
Harcourt, Inc. items and derived items copyright © 2001 by Harcourt, Inc.
Public Policy Toward Externalities
When externalities are significant and private solutions are not found, government may attempt to solve the problem through . . .…command-and-control policies.…market-based policies.

Harcourt, Inc. items and derived items copyright © 2001 by Harcourt, Inc.
Command-and-Control Policies
Usually take the form of regulations:Forbid certain behaviors.Require certain behaviors.
Examples:Requirements that all students be immunized.Stipulations on pollution emission levels set by the Environmental Protection Agency (EPA).
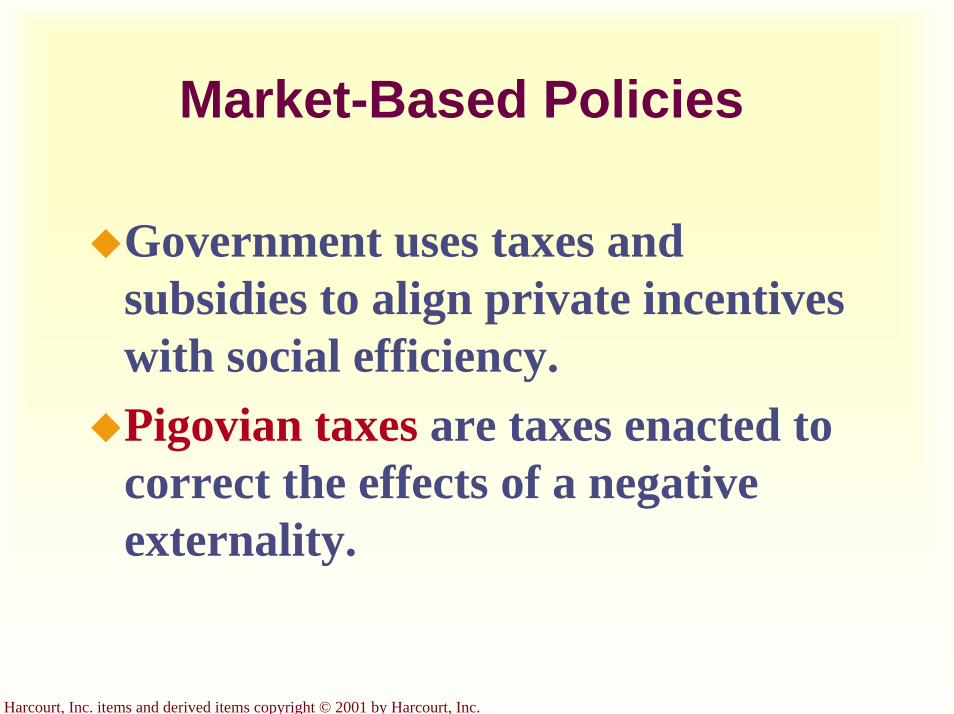
Harcourt, Inc. items and derived items copyright © 2001 by Harcourt, Inc.
Market-Based Policies
Government uses taxes and subsidies to align private incentives with social efficiency.Pigovian taxes are taxes enacted to correct the effects of a negative externality.
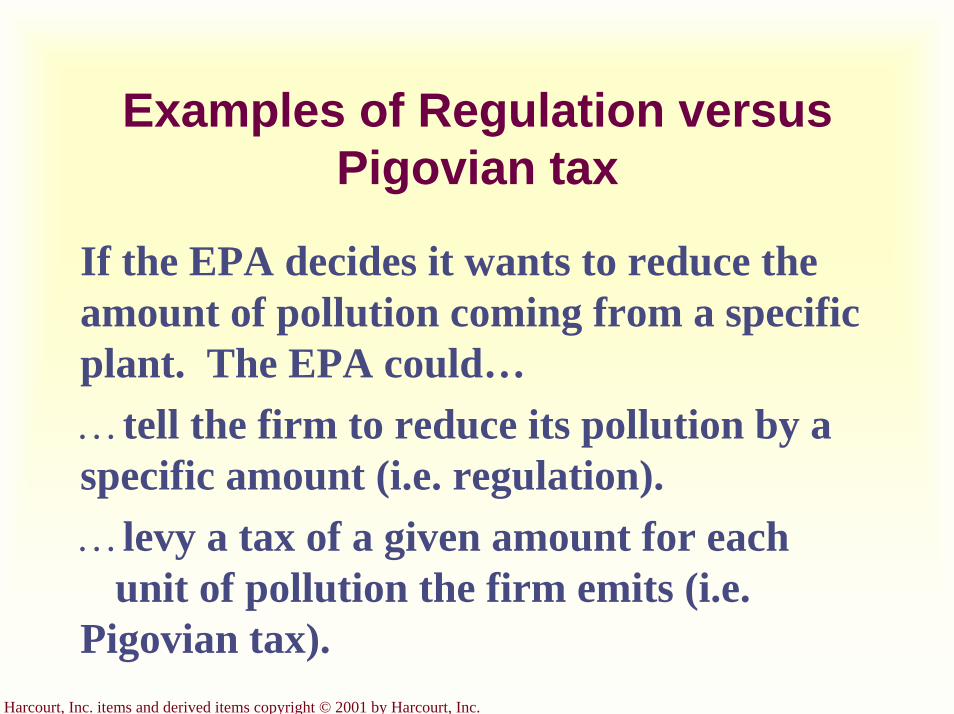
Harcourt, Inc. items and derived items copyright © 2001 by Harcourt, Inc.
Examples of Regulation versus Pigovian tax
If the EPA decides it wants to reduce the amount of pollution coming from a specific plant. The EPA could……tell the firm to reduce its pollution by a specific amount (i.e. regulation).…levy a tax of a given amount for each
unit of pollution the firm emits (i.e.Pigovian tax).
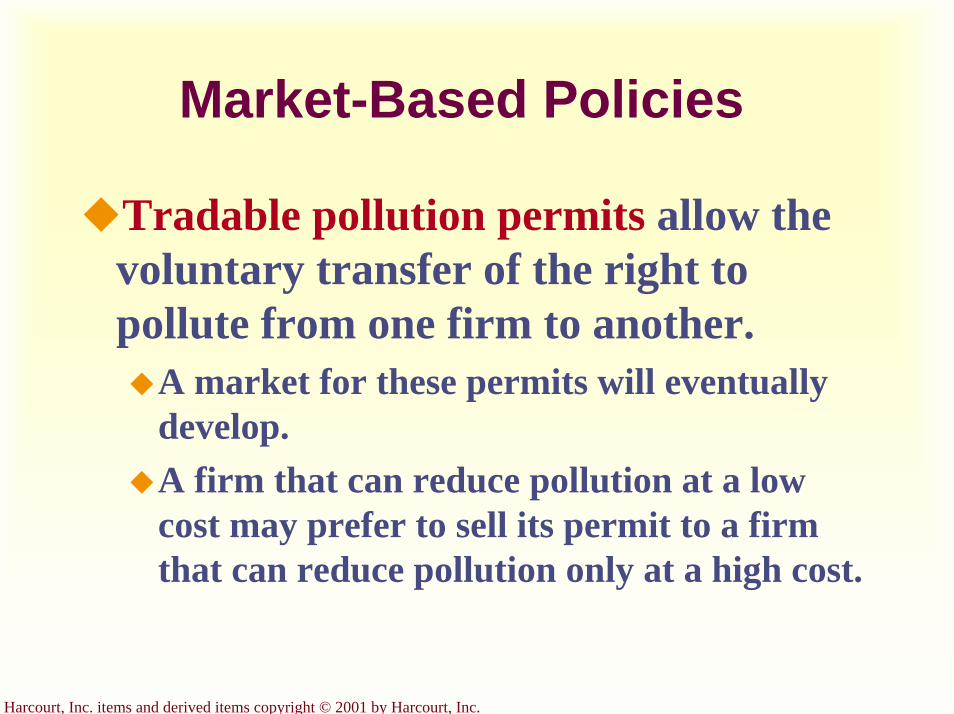
Harcourt, Inc. items and derived items copyright © 2001 by Harcourt, Inc.
Market-Based Policies
Tradable pollution permits allow thevoluntary transfer of the right to pollute from one firm to another.
A market for these permits will eventually develop.A firm that can reduce pollution at a low cost may prefer to sell its permit to a firm that can reduce pollution only at a high cost.

Harcourt, Inc. items and derived items copyright © 2001 by Harcourt, Inc.
The Equivalence of Pigovian Taxes and Pollution Permits...
(a) Pigovian Tax (b) Pollution Permits
Quantity ofPollution
0
Price ofPollution
P
Q
Demand forpollution rights
Pigoviantax
2. ...which, togetherwith the demand curve,determines the quantityof pollution.
1. A Pigoviantax sets theprice ofpollution...
Quantity ofPollution
0 Q
Demand forpollution rights
Supply ofpollution permits
Price ofPollution
P
2. ...which, togetherwith the demand curve,determines the priceof pollution.
1. Pollutionpermits setthe quantityof pollution...
Harcourt, Inc. items and derived items copyright © 2001 by Harcourt, Inc.
SummaryWhen a transaction between a buyer and a seller directly affects a third party, the effect is called an externality.Negative externalities cause the socially optimal quantity in a market to be less than the equilibrium quantity.Positive externalities cause the socially optimal quantity in a market to be greater than the equilibrium quantity.
Harcourt, Inc. items and derived items copyright © 2001 by Harcourt, Inc.
Summary
Those affected by externalities can sometimes solve the problem privately.The Coase theorem states that if people can bargain without a cost, then they can always reach an agreement in which resources are allocated efficiently.

Harcourt, Inc. items and derived items copyright © 2001 by Harcourt, Inc.
Summary
When private parties cannot adequately deal with externalities, then the government steps in.The government can either regulate behavior or internalize the externality by using Pigovian taxes.

Harcourt, Inc. items and derived items copyright © 2001 by Harcourt, Inc.
Graphical Review
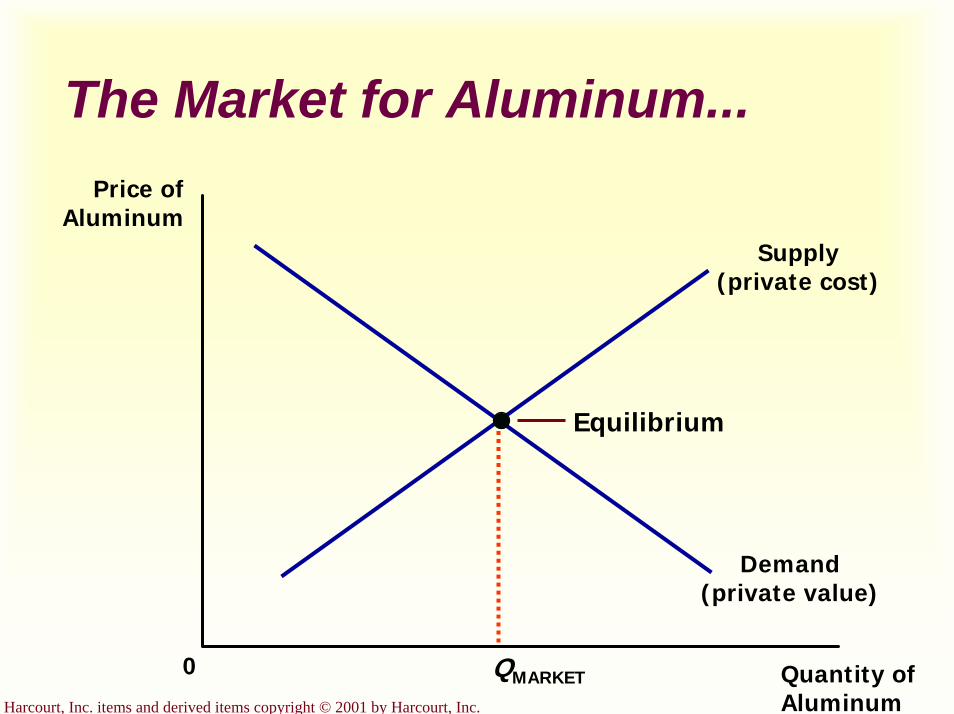
Harcourt, Inc. items and derived items copyright © 2001 by Harcourt, Inc.
The Market for Aluminum...
Quantity ofAluminum
0
Price ofAluminum
QMARKET
Demand(private value)
Supply(private cost)
Equilibrium
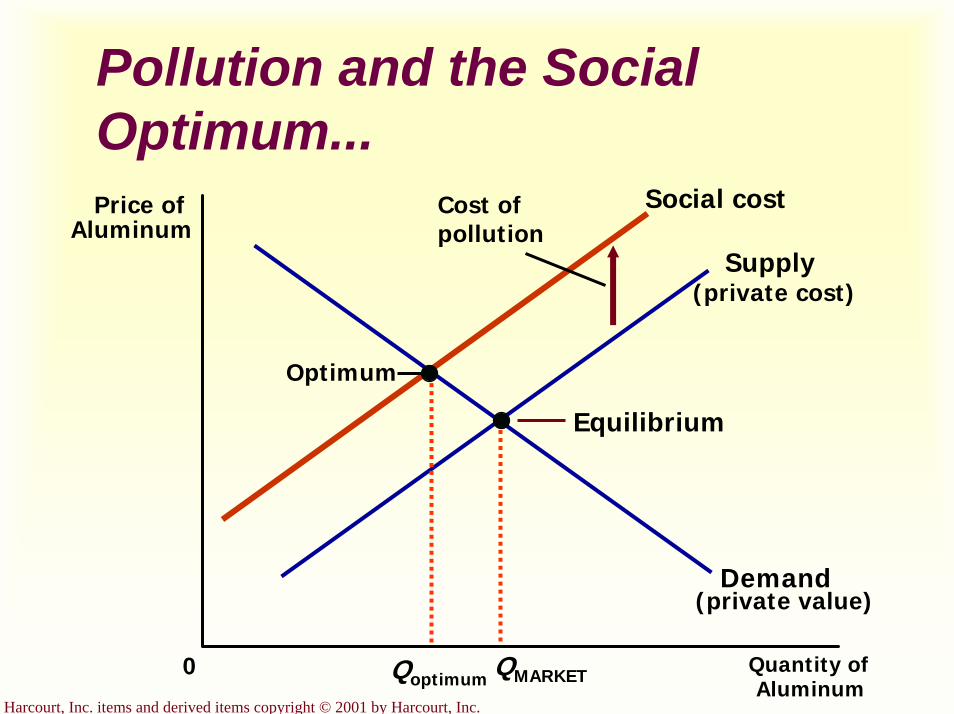
Harcourt, Inc. items and derived items copyright © 2001 by Harcourt, Inc.
Pollution and the Social Optimum...
QMARKET Quantity ofAluminum
0
Price ofAluminum
Demand(private value)
Supply(private cost)
Social cost
Qoptimum
Cost ofpollution
Equilibrium
Optimum
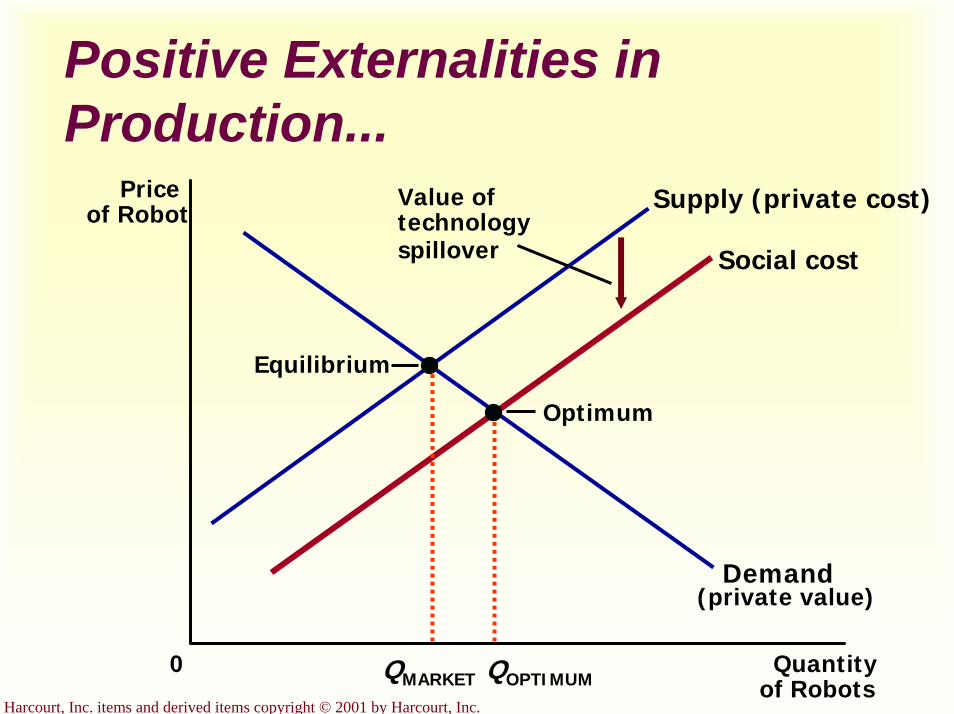
Harcourt, Inc. items and derived items copyright © 2001 by Harcourt, Inc.
Positive Externalities in Production...
Quantityof Robots
0
Priceof Robot
QOPTIMUM
Demand(private value)
Supply (private cost)
Social cost
QMARKET
Value oftechnologyspillover
Equilibrium
Optimum

Harcourt, Inc. items and derived items copyright © 2001 by Harcourt, Inc.
Consumption Externalities...
Quantity ofEducation
0
Price ofEducation
QMARKET
Demand(private value)
Socialvalue
QOPTIMUM
(b) Positive Consumption Externality
Supply(private cost)
Quantityof Alcohol
0
Priceof Alcohol
QMARKET
Demand (private value)
Supply(private cost)
Social valueQ
OPTIMUM
(a) Negative Consumption Externality
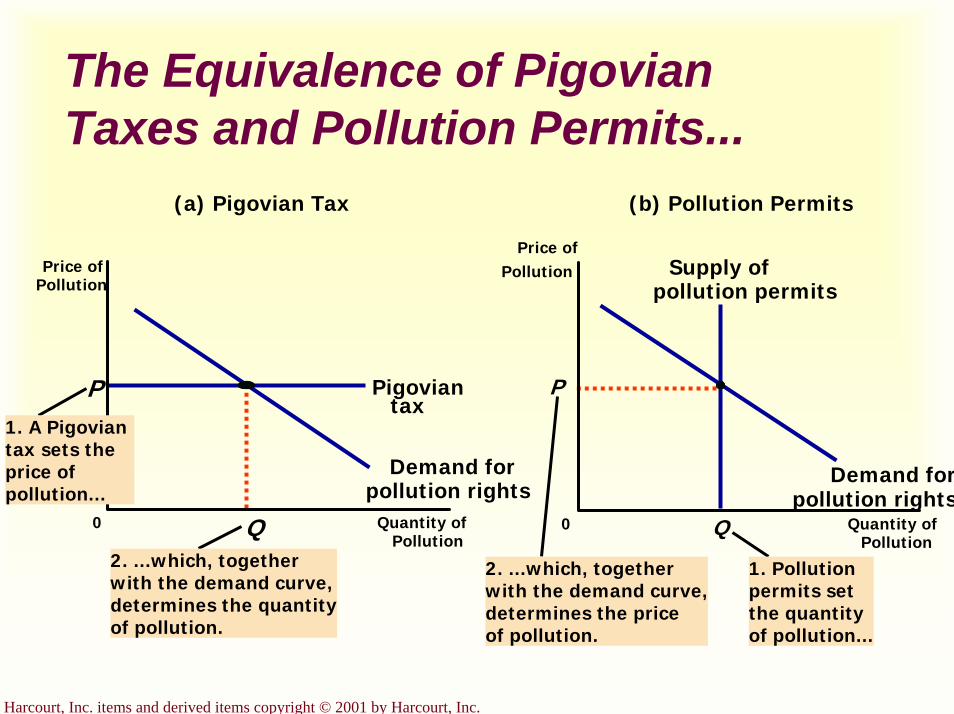
Harcourt, Inc. items and derived items copyright © 2001 by Harcourt, Inc.
The Equivalence of Pigovian Taxes and Pollution Permits...
Quantity ofPollution
0
Price ofPollution
P
Q
Demand forpollution rights
Pigoviantax
(a) Pigovian Tax
2. ...which, togetherwith the demand curve,determines the quantityof pollution.
1. A Pigoviantax sets theprice ofpollution...
Quantity ofPollution
0 Q
Demand forpollution rights
Supply ofpollution permits
(b) Pollution Permits
Price ofPollution
P
2. ...which, togetherwith the demand curve,determines the priceof pollution.
1. Pollutionpermits setthe quantityof pollution...
Public Goods and Common Resources
Chapter 11
Copyright © 2001 by Harcourt, Inc.
All rights reserved. Requests for permission to make copies of any part of thework should be mailed to:
Permissions Department, Harcourt College Publishers,6277 Sea Harbor Drive, Orlando, Florida 32887-6777.

Harcourt, Inc. items and derived items copyright © 2001 by Harcourt, Inc.
“The best things in life are free. . .”
Free goods provide a special challenge for economic analysis
Most goods in our economy are allocated in markets…
…for these goods, prices are the signals that guide the decisions of
buyers and sellers.
Harcourt, Inc. items and derived items copyright © 2001 by Harcourt, Inc.
“The best things in life are free. . .”
When goods are available free of charge, the market forces that normally allocate resources in our economy are absent.

Harcourt, Inc. items and derived items copyright © 2001 by Harcourt, Inc.
“The best things in life are free. . .”
When a good does not have a price attached to it, private markets cannot ensure that the good is produced and consumed in the proper amounts.

Harcourt, Inc. items and derived items copyright © 2001 by Harcourt, Inc.
“The best things in life are free. . .”
In such cases, government policy can potentially remedy the market failure that results, and raise economic well-being.
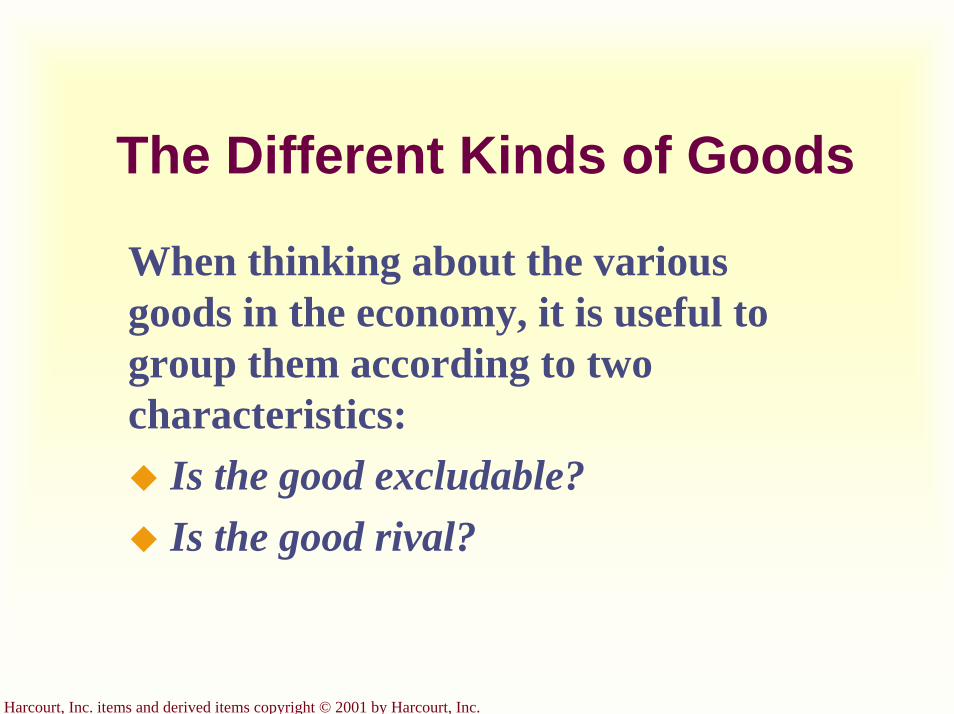
Harcourt, Inc. items and derived items copyright © 2001 by Harcourt, Inc.
The Different Kinds of Goods
When thinking about the various goods in the economy, it is useful to group them according to two characteristics:
Is the good excludable?Is the good rival?

Harcourt, Inc. items and derived items copyright © 2001 by Harcourt, Inc.
The Different Kinds of Goods
ExcludabilityPeople can be prevented from enjoying the good.Laws recognize and enforce private
property rights.

Harcourt, Inc. items and derived items copyright © 2001 by Harcourt, Inc.
The Different Kinds of Goods
RivalnessOne person’s use of the good diminishes another person’s enjoyment of it.
Harcourt, Inc. items and derived items copyright © 2001 by Harcourt, Inc.
Four Types of Goods
Private GoodsPublic GoodsCommon ResourcesNatural Monopolies
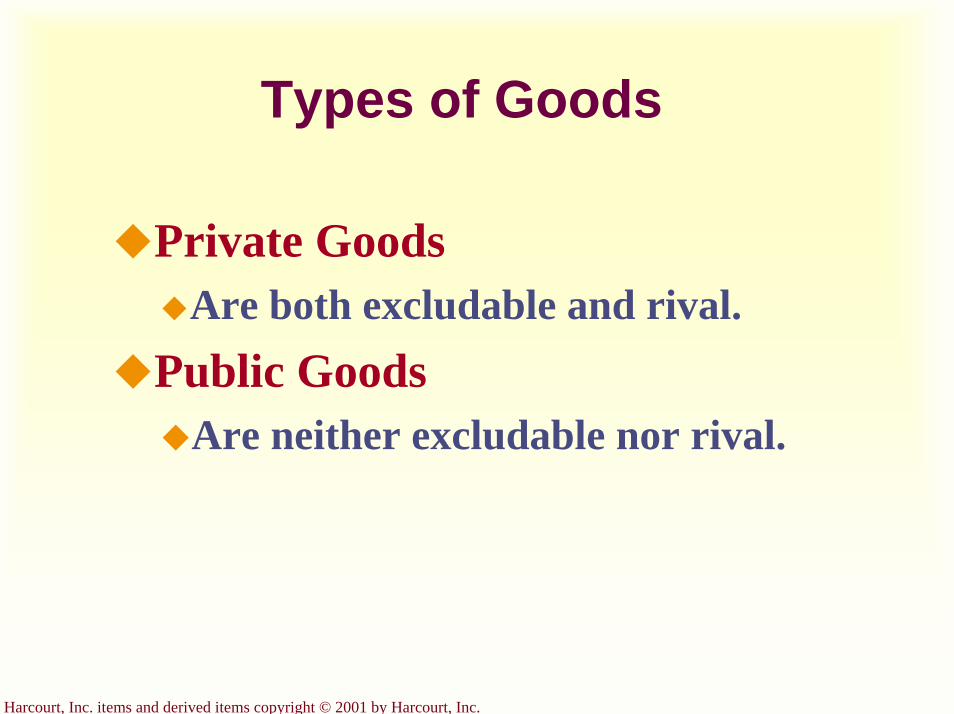
Harcourt, Inc. items and derived items copyright © 2001 by Harcourt, Inc.
Types of Goods
Private GoodsAre both excludable and rival.
Public GoodsAre neither excludable nor rival.

Harcourt, Inc. items and derived items copyright © 2001 by Harcourt, Inc.
Types of Goods
Common ResourcesAre rival but not excludable.
Natural MonopoliesAre excludable but not rival.
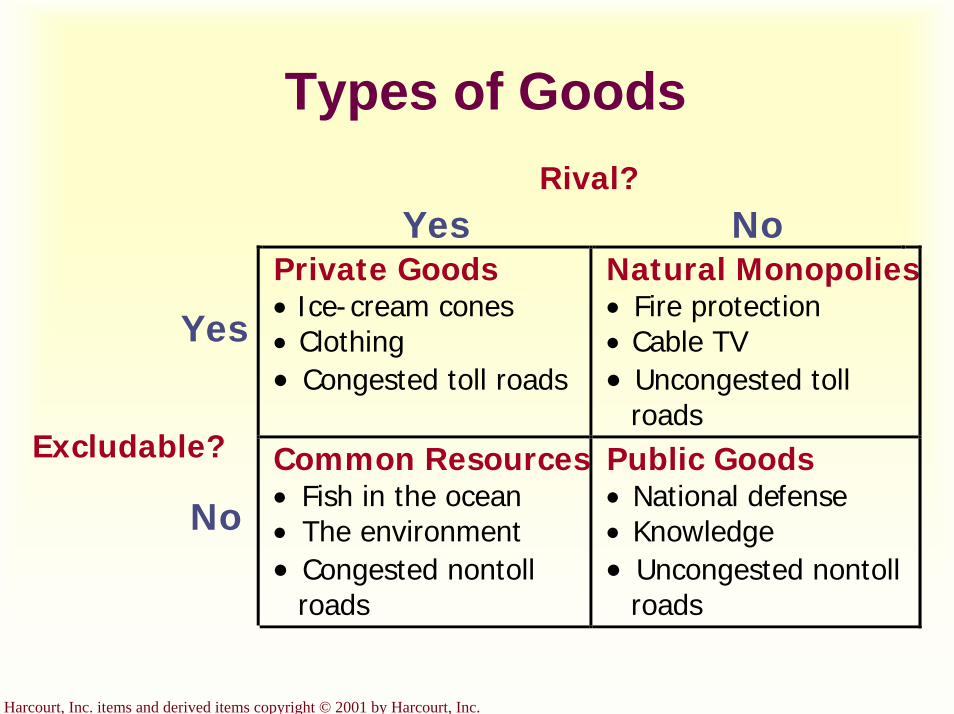
Harcourt, Inc. items and derived items copyright © 2001 by Harcourt, Inc.
Types of GoodsRival?
Yes No
Yes
Private Goods• Ice-cream cones• Clothing• Congested toll roads
Natural Monopolies• Fire protection• Cable TV• Uncongested toll
roads
No
Common Resources• Fish in the ocean• The environment• Congested nontoll
roads
Public Goods• National defense• Knowledge• Uncongested nontoll
roads
Excludable?

Harcourt, Inc. items and derived items copyright © 2001 by Harcourt, Inc.
The Free-Rider Problem
A free-rider is a person who receives the benefit of a good but avoids paying for it.
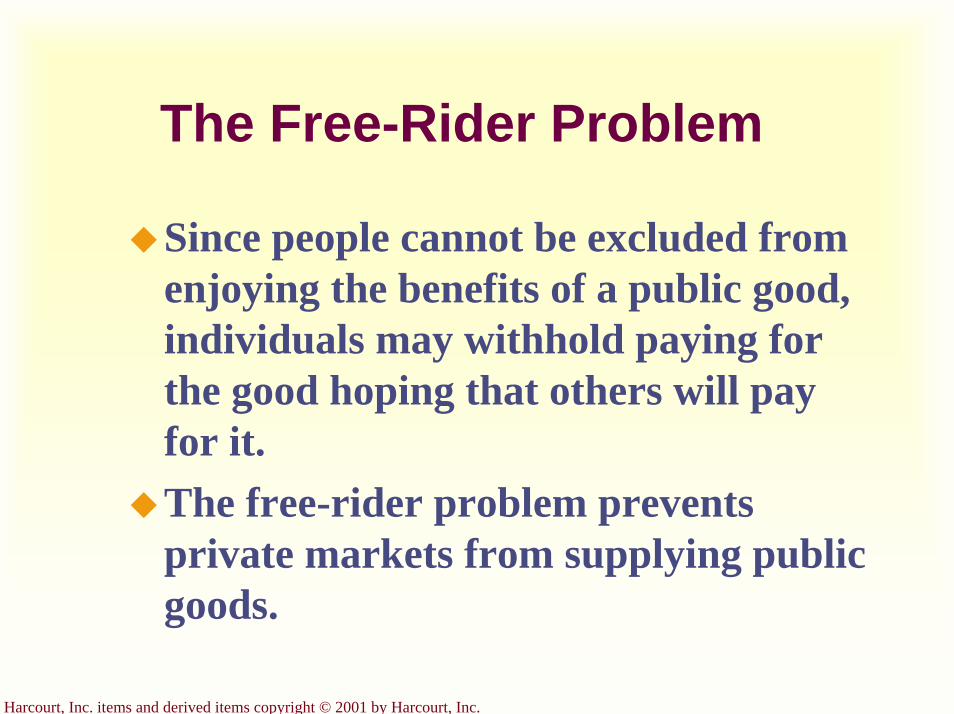
Harcourt, Inc. items and derived items copyright © 2001 by Harcourt, Inc.
The Free-Rider Problem
Since people cannot be excluded from enjoying the benefits of a public good, individuals may withhold paying for the good hoping that others will pay for it.The free-rider problem prevents private markets from supplying public goods.
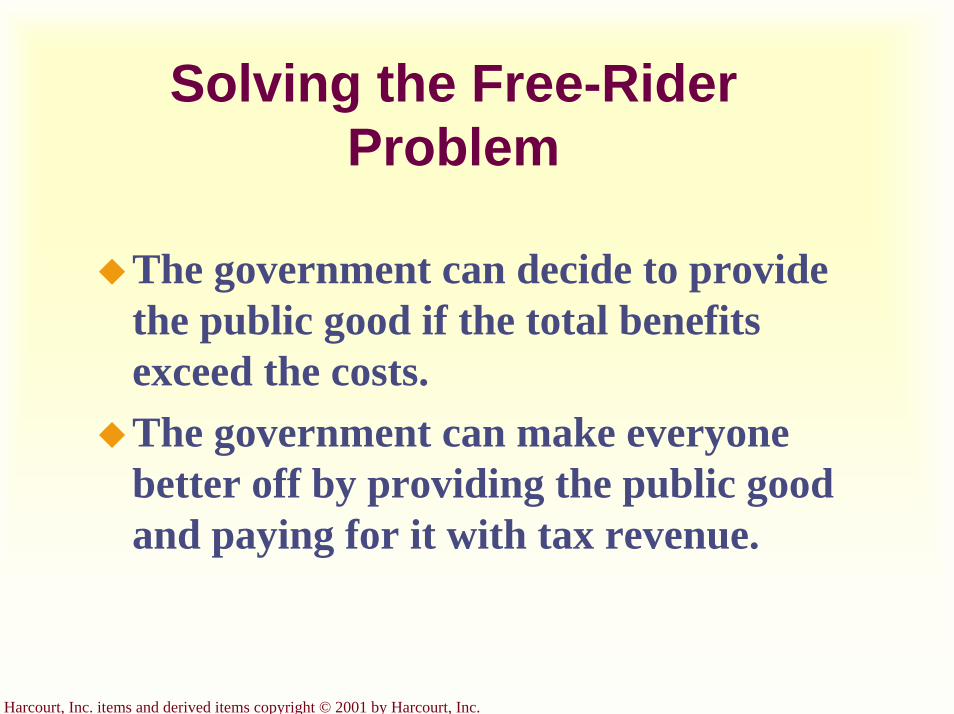
Harcourt, Inc. items and derived items copyright © 2001 by Harcourt, Inc.
Solving the Free-Rider Problem
The government can decide to provide the public good if the total benefits exceed the costs.The government can make everyone better off by providing the public good and paying for it with tax revenue.

Harcourt, Inc. items and derived items copyright © 2001 by Harcourt, Inc.
Some Important Public Goods
National DefenseBasic ResearchPrograms to Fight Poverty

Harcourt, Inc. items and derived items copyright © 2001 by Harcourt, Inc.
Are Lighthouses Public Goods?
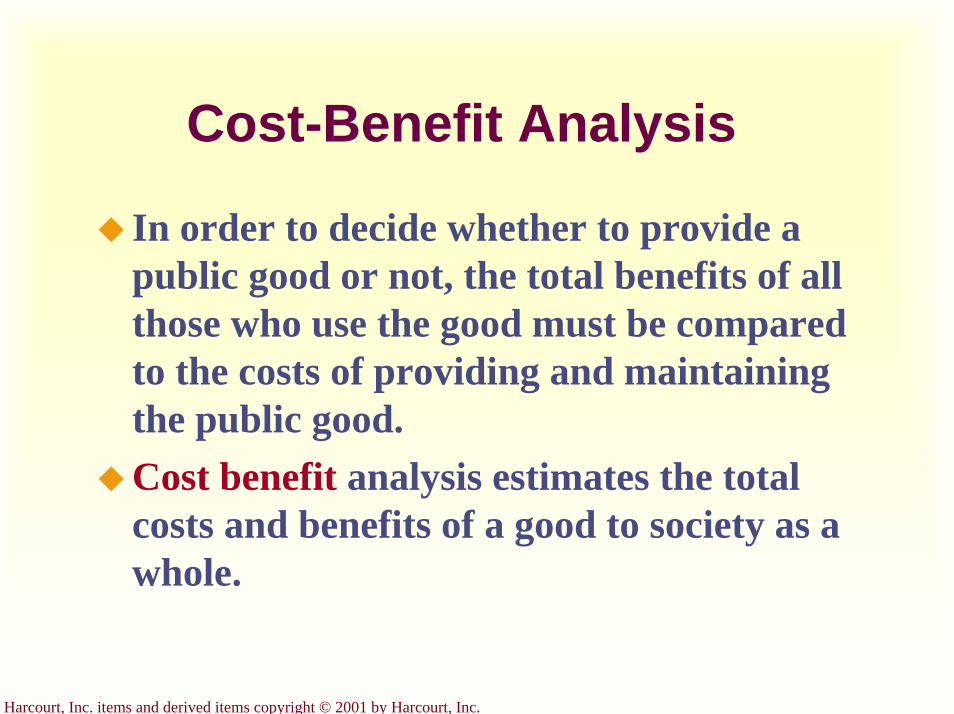
Harcourt, Inc. items and derived items copyright © 2001 by Harcourt, Inc.
Cost-Benefit Analysis
In order to decide whether to provide a public good or not, the total benefits of all those who use the good must be compared to the costs of providing and maintaining the public good.Cost benefit analysis estimates the total costs and benefits of a good to society as a whole.
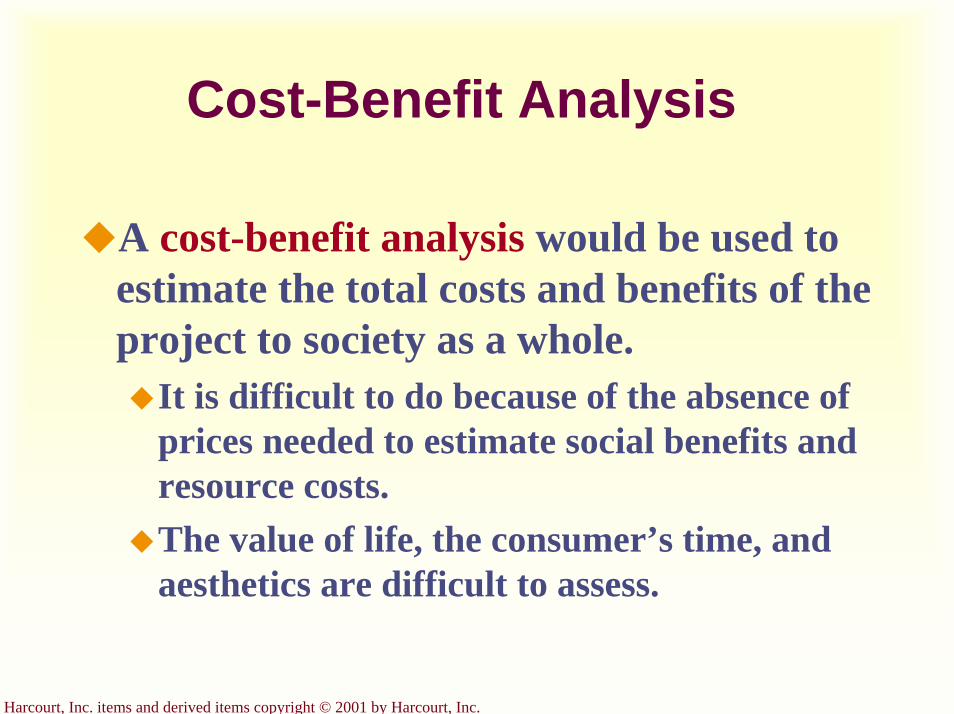
Harcourt, Inc. items and derived items copyright © 2001 by Harcourt, Inc.
Cost-Benefit Analysis
A cost-benefit analysis would be used to estimate the total costs and benefits of the project to society as a whole.
It is difficult to do because of the absence of prices needed to estimate social benefits and resource costs.The value of life, the consumer’s time, and aesthetics are difficult to assess.

Harcourt, Inc. items and derived items copyright © 2001 by Harcourt, Inc.
Common Resources
Common resources, like public goods, are not excludable. They are available free of charge to anyone who wishes to use them.

Harcourt, Inc. items and derived items copyright © 2001 by Harcourt, Inc.
Common Resources
Common resources are rival goods because one person’s use of the common resource reduces other people’s use.

Harcourt, Inc. items and derived items copyright © 2001 by Harcourt, Inc.
Tragedy of the Commons
The Tragedy of the Commons is a story with a general lesson: When one person uses a common resource, he or she diminishes another person’s enjoyment of it.
Common resources tend to be used excessively when individuals are not charged for their usage.
This creates a negative externality.

Harcourt, Inc. items and derived items copyright © 2001 by Harcourt, Inc.
Examples of Common Resources
Clean air and waterOil poolsCongested roadsFish, whales, and other wildlife

Harcourt, Inc. items and derived items copyright © 2001 by Harcourt, Inc.
Why Isn’t the Cow Extinct?
PrivateOwnership and
the Profit Motive!
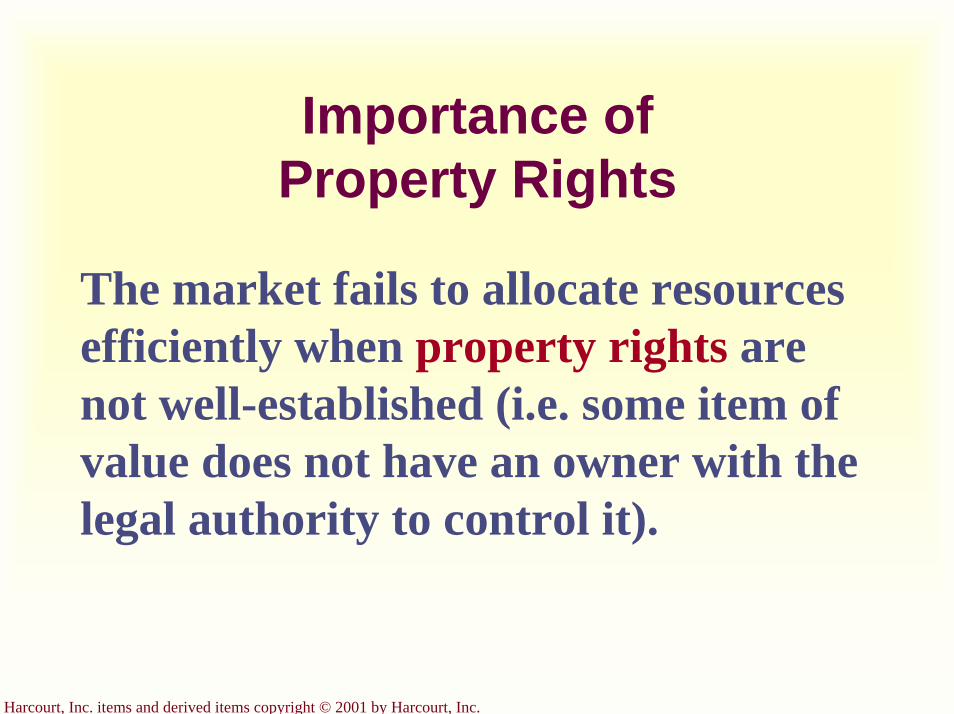
Harcourt, Inc. items and derived items copyright © 2001 by Harcourt, Inc.
Importance of Property Rights
The market fails to allocate resources efficiently when property rights are not well-established (i.e. some item of value does not have an owner with the legal authority to control it).
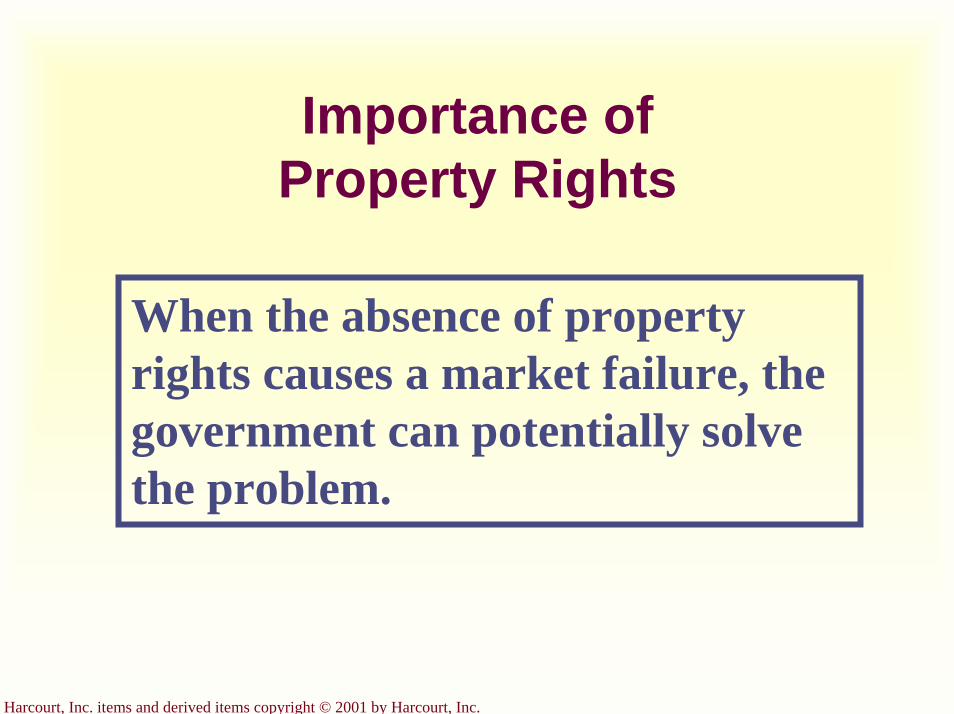
Harcourt, Inc. items and derived items copyright © 2001 by Harcourt, Inc.
Importance of Property Rights
When the absence of property rights causes a market failure, the government can potentially solve the problem.

Harcourt, Inc. items and derived items copyright © 2001 by Harcourt, Inc.
Summary
Goods differ in whether they are excludable and whether they are rival.A good is excludable if it is possible to prevent someone from using it.A good is rival if one person’s enjoyment of the good prevents other people from enjoying the same unit of the good.
Harcourt, Inc. items and derived items copyright © 2001 by Harcourt, Inc.
Summary
Public goods are neither rival nor excludable.Because people are not charged for their use of public goods, they have an incentive to free ride when the good is provided privately.Governments provide public goods, making quantity decisions based upon cost-benefit analysis.

Harcourt, Inc. items and derived items copyright © 2001 by Harcourt, Inc.
SummaryCommon resources are rival but not excludable.Because people are not charged for their use of common resources, they tend to use them excessively.Governments tend to try to limit the use of common resources.
The Costs of Production
Chapter 13
Copyright © 2001 by Harcourt, Inc.
All rights reserved. Requests for permission to make copies of any part of thework should be mailed to:
Permissions Department, Harcourt College Publishers,6277 Sea Harbor Drive, Orlando, Florida 32887-6777.
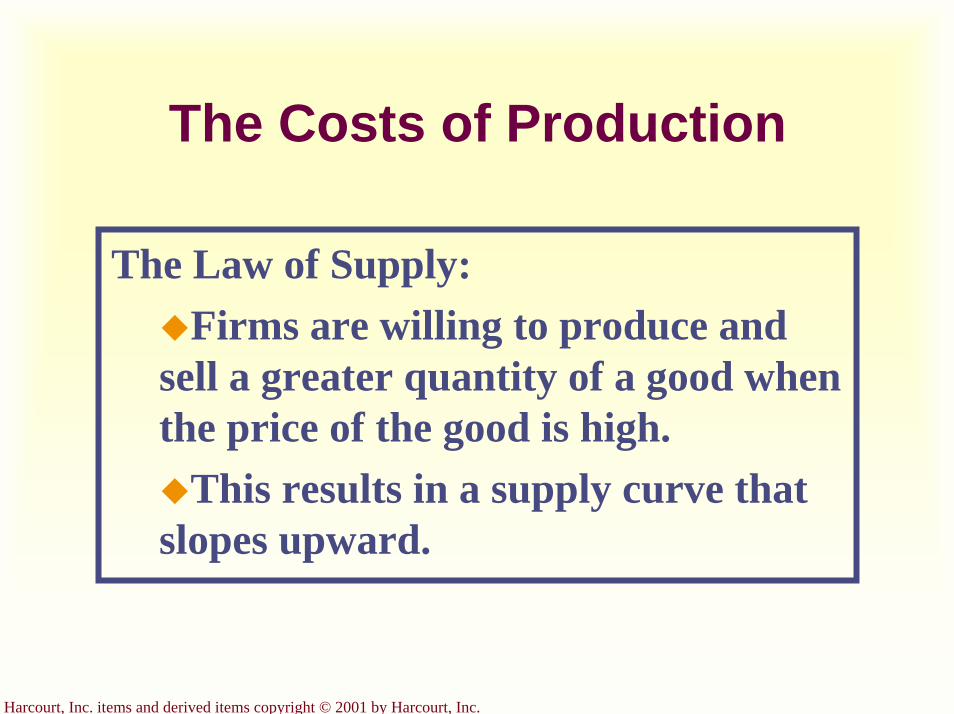
Harcourt, Inc. items and derived items copyright © 2001 by Harcourt, Inc.
The Costs of Production
The Law of Supply:Firms are willing to produce and
sell a greater quantity of a good when the price of the good is high.
This results in a supply curve that slopes upward.
Harcourt, Inc. items and derived items copyright © 2001 by Harcourt, Inc.
The Firm’s Objective
The economic goal of the firm is to maximize profits.
Harcourt, Inc. items and derived items copyright © 2001 by Harcourt, Inc.
A Firm’s Total Revenue and Total Cost
Total RevenueThe amount that the firm receives for the sale of its output.
Total CostThe amount that the firm pays to buy inputs.
Harcourt, Inc. items and derived items copyright © 2001 by Harcourt, Inc.
A Firm’s Profit
Profit is the firm’s total revenue minus its total cost.
Profit = Total revenue - Total cost
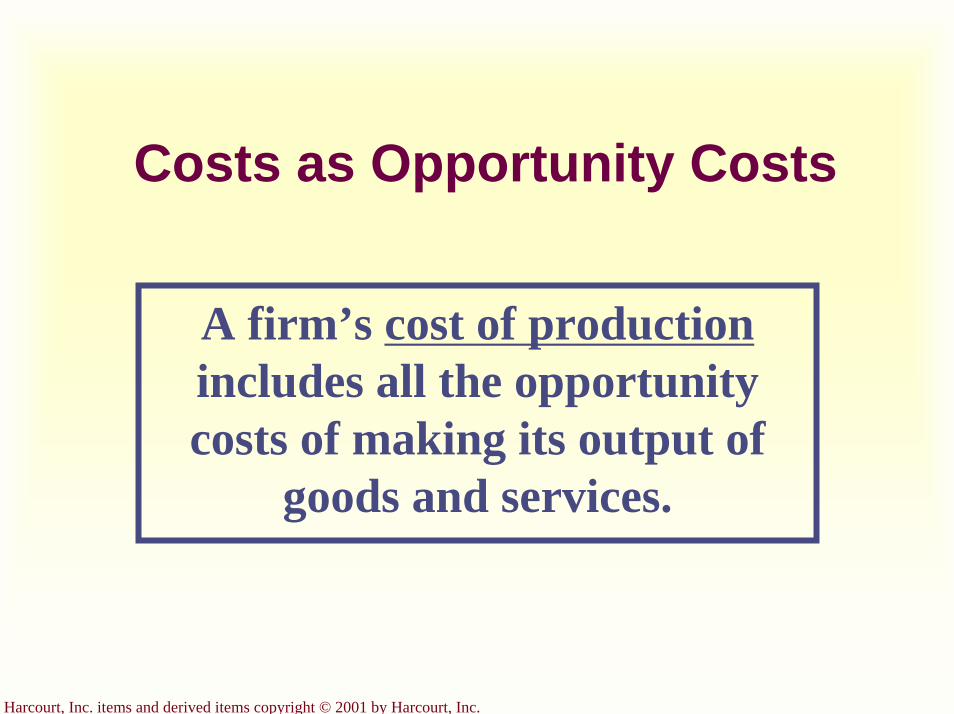
Harcourt, Inc. items and derived items copyright © 2001 by Harcourt, Inc.
Costs as Opportunity Costs
A firm’s cost of productionincludes all the opportunity costs of making its output of
goods and services.
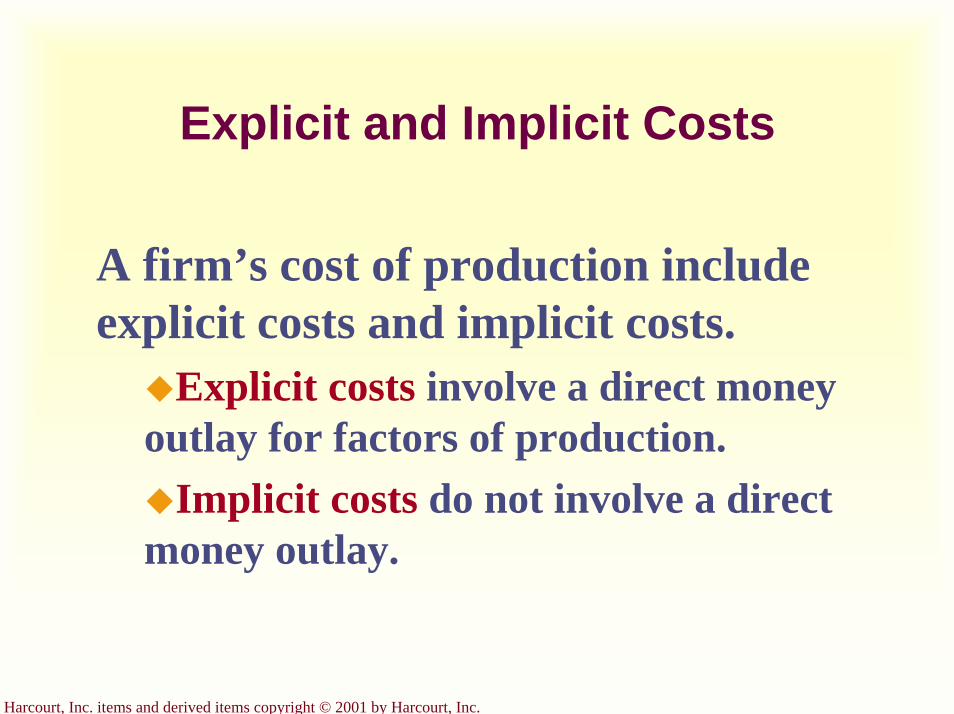
Harcourt, Inc. items and derived items copyright © 2001 by Harcourt, Inc.
Explicit and Implicit Costs
A firm’s cost of production include explicit costs and implicit costs.
Explicit costs involve a direct money outlay for factors of production.
Implicit costs do not involve a direct money outlay.
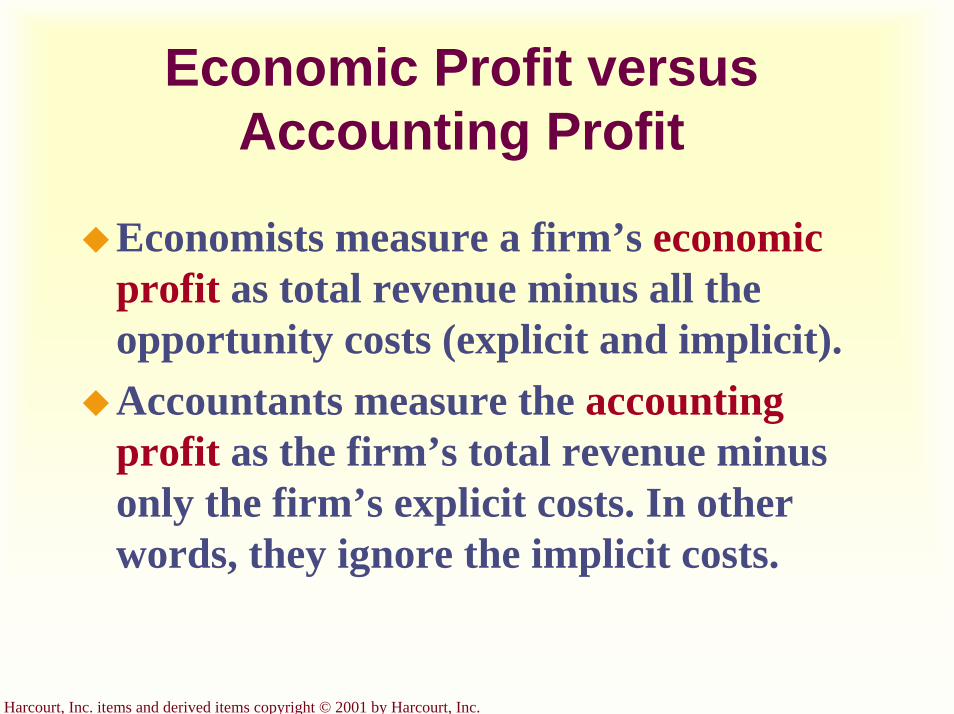
Harcourt, Inc. items and derived items copyright © 2001 by Harcourt, Inc.
Economic Profit versus Accounting Profit
Economists measure a firm’s economic profit as total revenue minus all the opportunity costs (explicit and implicit).Accountants measure the accounting profit as the firm’s total revenue minus only the firm’s explicit costs. In other words, they ignore the implicit costs.
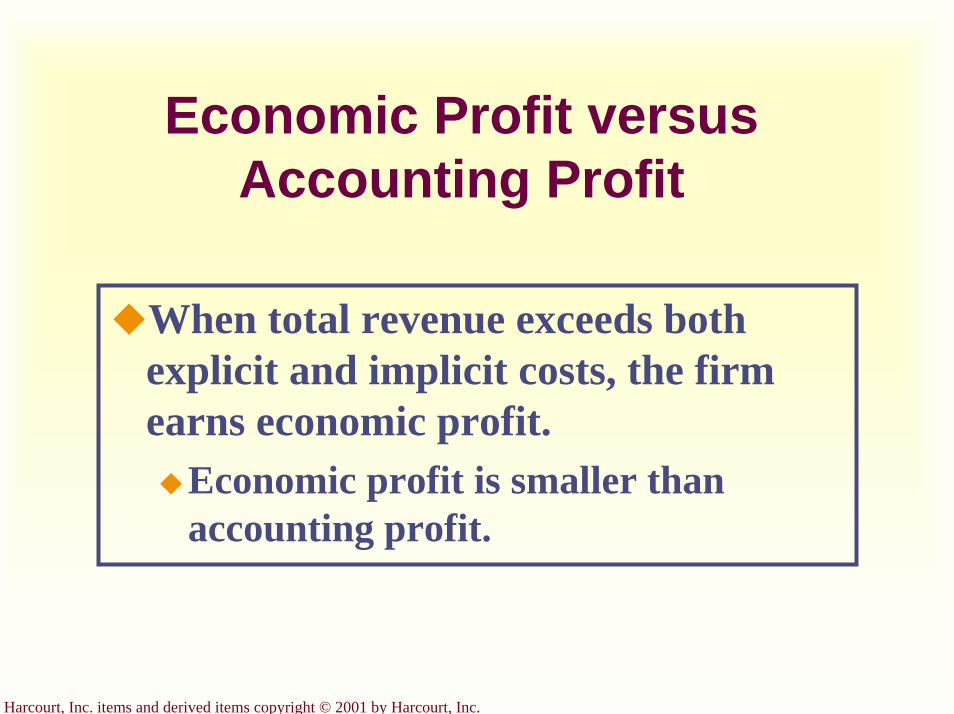
Harcourt, Inc. items and derived items copyright © 2001 by Harcourt, Inc.
Economic Profit versus Accounting Profit
When total revenue exceeds both explicit and implicit costs, the firm earns economic profit.
Economic profit is smaller than accounting profit.
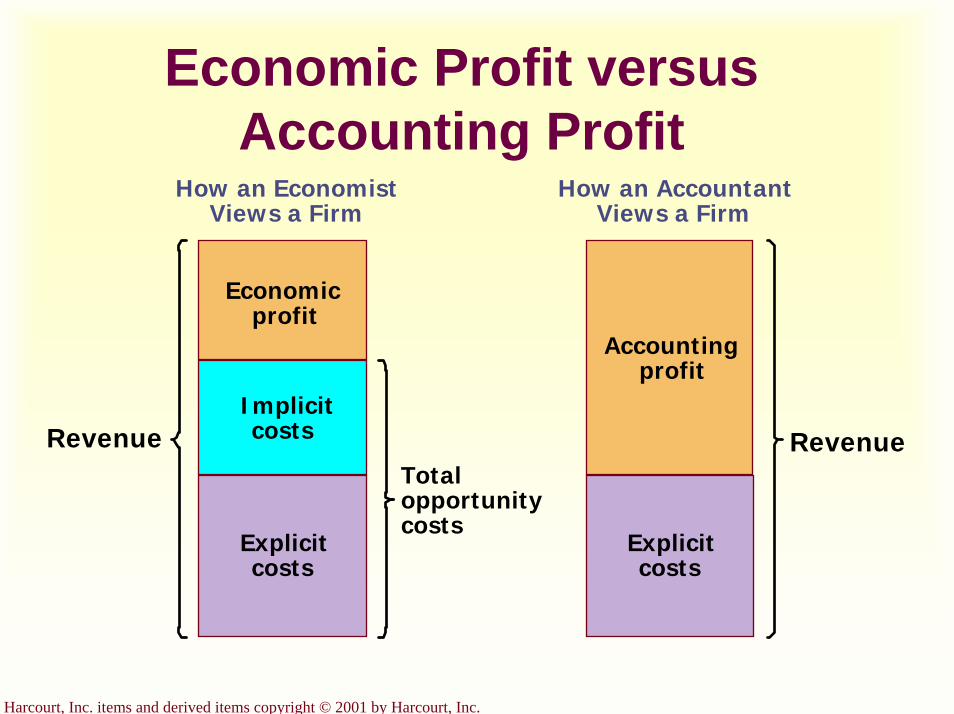
Harcourt, Inc. items and derived items copyright © 2001 by Harcourt, Inc.
Economic Profit versus Accounting Profit
Explicitcosts
Accountingprofit
How an AccountantViews a Firm
RevenueRevenueTotalopportunitycosts
How an EconomistViews a Firm
Explicitcosts
Economicprofit
Implicitcosts
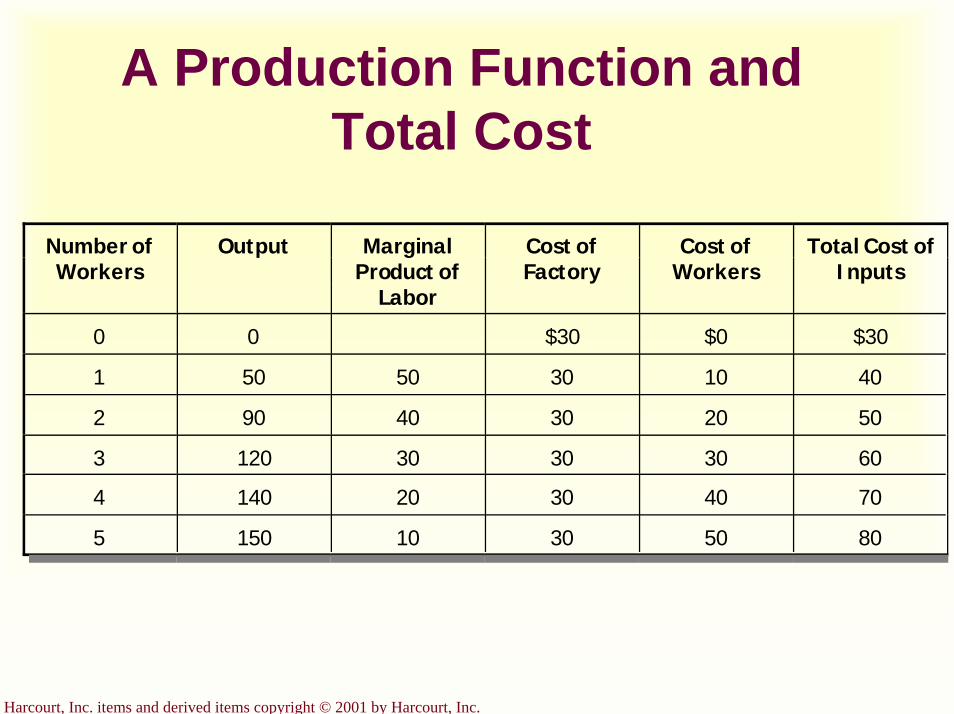
Harcourt, Inc. items and derived items copyright © 2001 by Harcourt, Inc.
A Production Function and Total Cost
Number ofWorkers
Output MarginalProduct of
Labor
Cost ofFactory
Cost ofWorkers
Total Cost ofInputs
0 0 $30 $0 $30
1 50 50 30 10 40
2 90 40 30 20 50
3 120 30 30 30 60
4 140 20 30 40 70
5 150 10 30 50 80
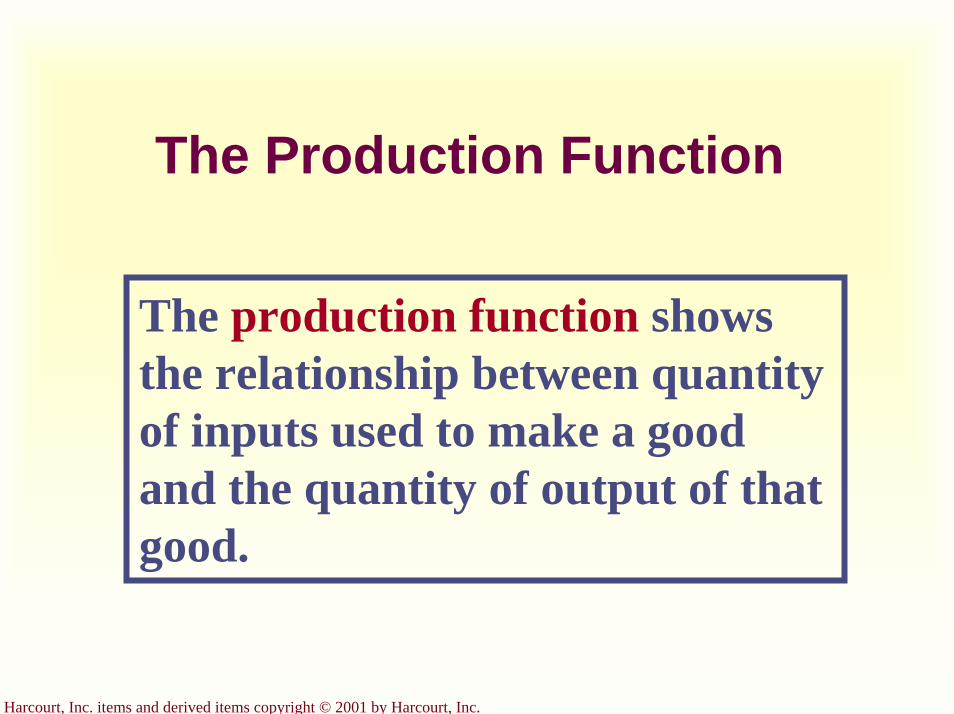
Harcourt, Inc. items and derived items copyright © 2001 by Harcourt, Inc.
The Production Function
The production function shows the relationship between quantity of inputs used to make a good and the quantity of output of that good.
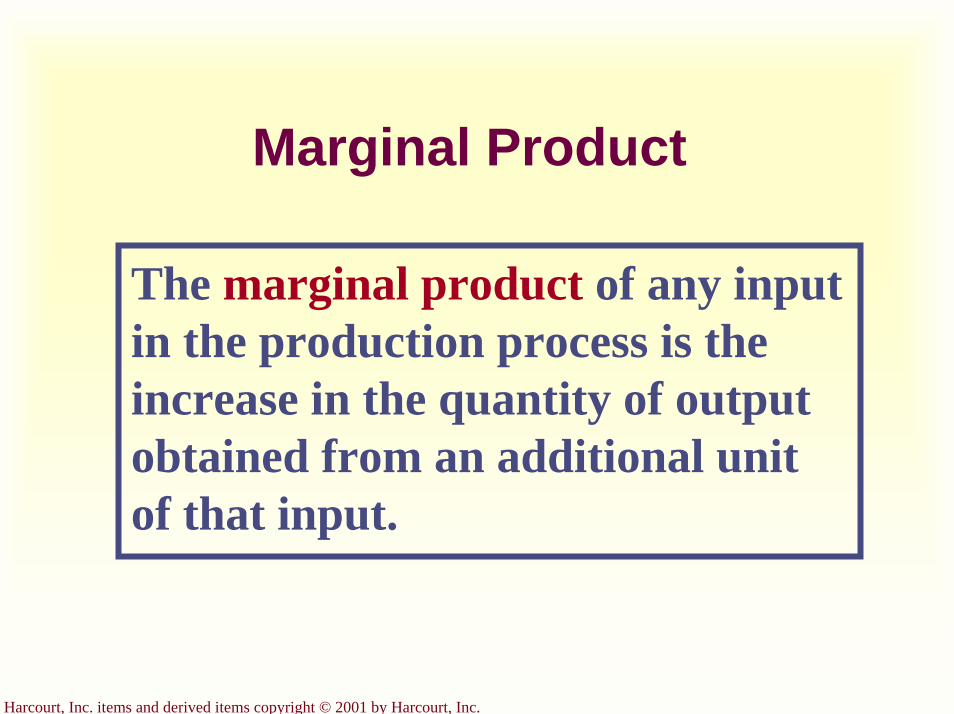
Harcourt, Inc. items and derived items copyright © 2001 by Harcourt, Inc.
Marginal Product
The marginal product of any input in the production process is the increase in the quantity of output obtained from an additional unit of that input.
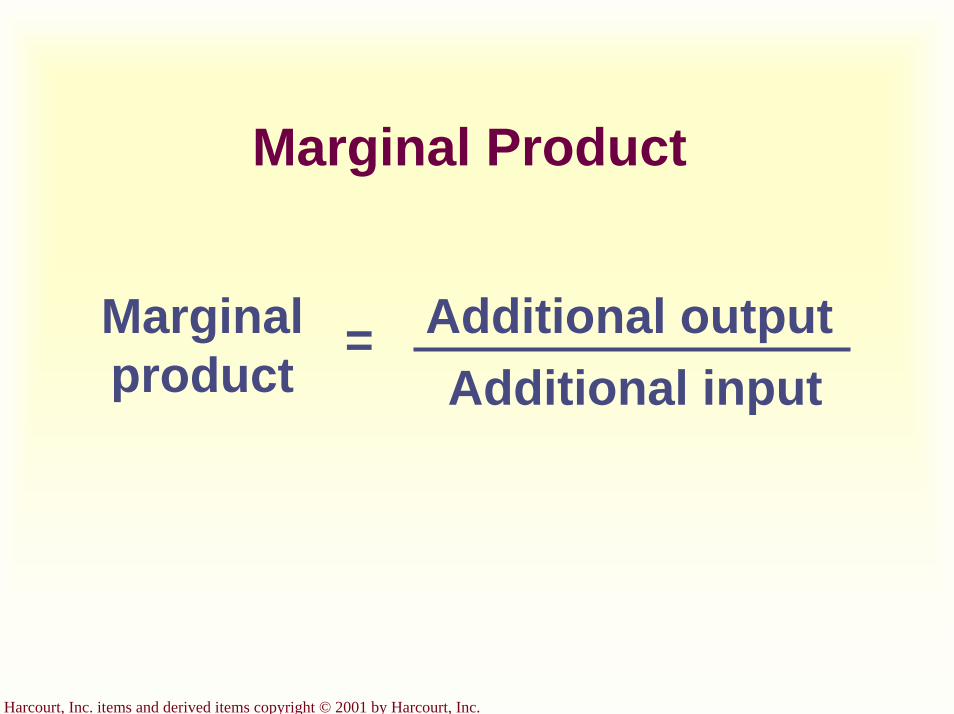
Harcourt, Inc. items and derived items copyright © 2001 by Harcourt, Inc.
Marginal Product
Additional inputAdditional output=Marginal
product
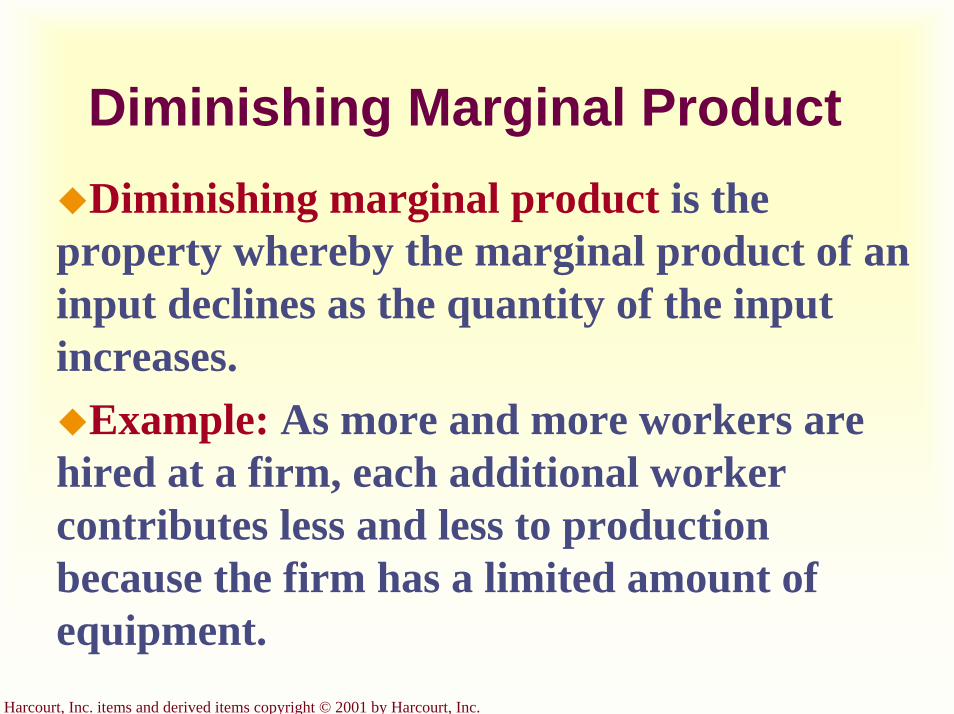
Harcourt, Inc. items and derived items copyright © 2001 by Harcourt, Inc.
Diminishing Marginal ProductDiminishing marginal product is the
property whereby the marginal product of an input declines as the quantity of the input increases.
Example: As more and more workers are hired at a firm, each additional worker contributes less and less to production because the firm has a limited amount of equipment.
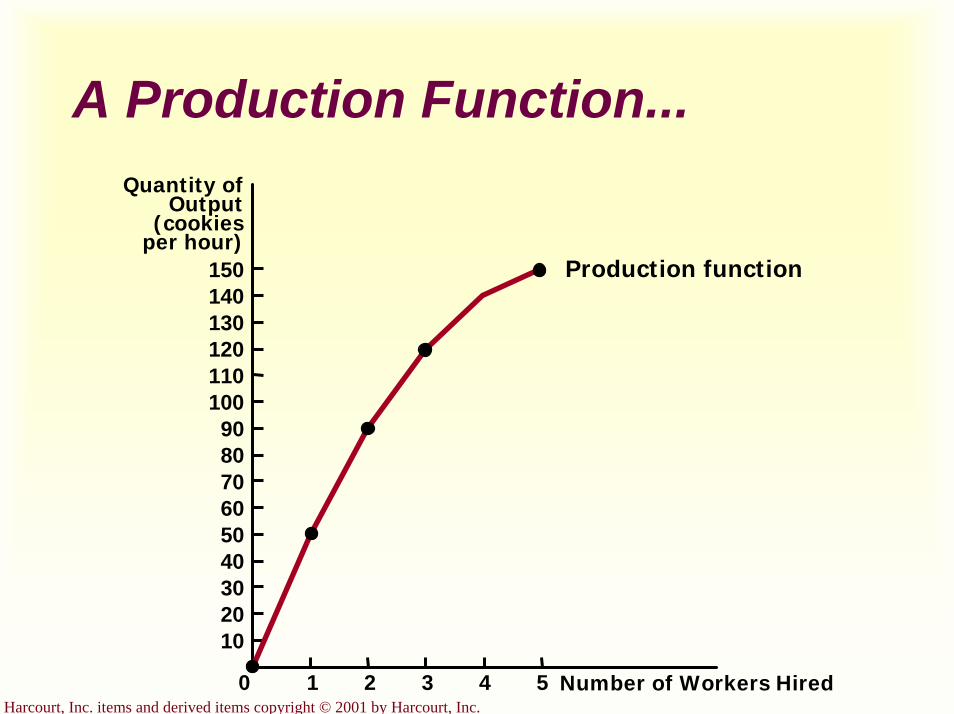
Harcourt, Inc. items and derived items copyright © 2001 by Harcourt, Inc.
A Production Function...Quantity of
Output(cookies
per hour)150140130120110100
908070605040302010
Number of Workers Hired0 1 2 3 4 5
Production function
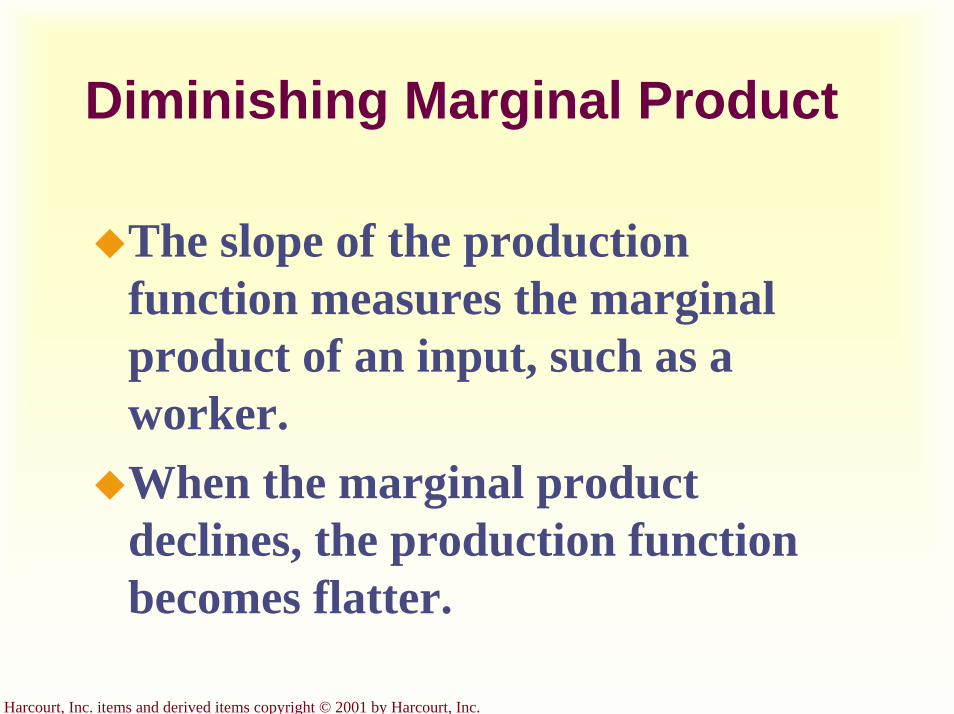
Harcourt, Inc. items and derived items copyright © 2001 by Harcourt, Inc.
Diminishing Marginal Product
The slope of the production function measures the marginal product of an input, such as a worker.When the marginal product declines, the production function becomes flatter.
Harcourt, Inc. items and derived items copyright © 2001 by Harcourt, Inc.
From the Production Function to the Total-Cost Curve
The relationship between the quantity a firm can produce and its costs determines pricing decisions.The total-cost curve shows this relationship graphically.
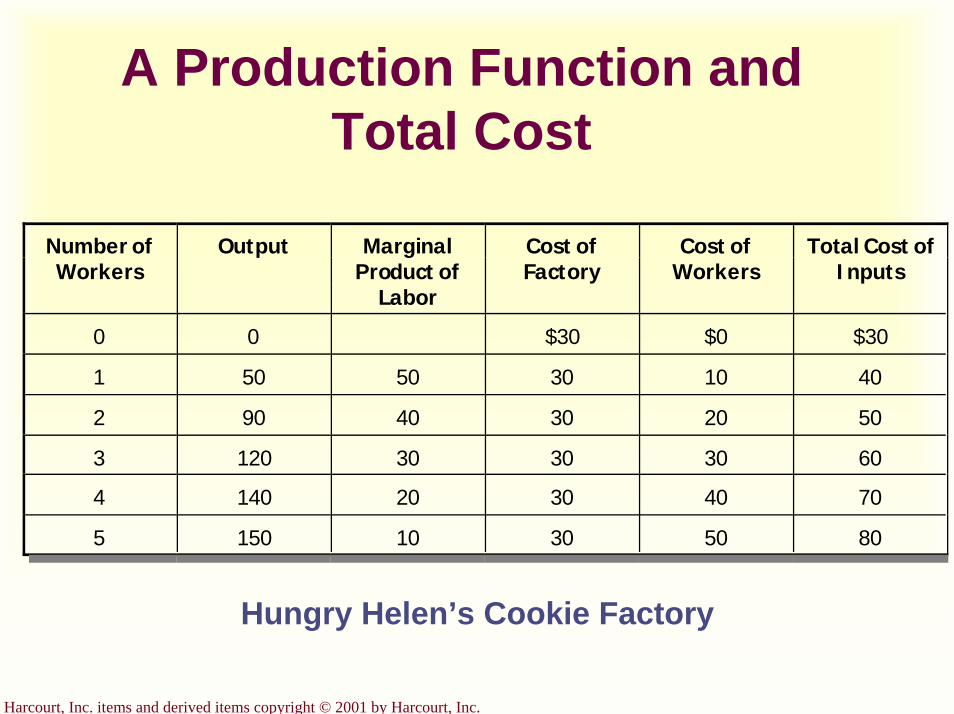
Harcourt, Inc. items and derived items copyright © 2001 by Harcourt, Inc.
A Production Function and Total Cost
Number ofWorkers
Output MarginalProduct of
Labor
Cost ofFactory
Cost ofWorkers
Total Cost ofInputs
0 0 $30 $0 $30
1 50 50 30 10 40
2 90 40 30 20 50
3 120 30 30 30 60
4 140 20 30 40 70
5 150 10 30 50 80
Hungry Helen’s Cookie Factory
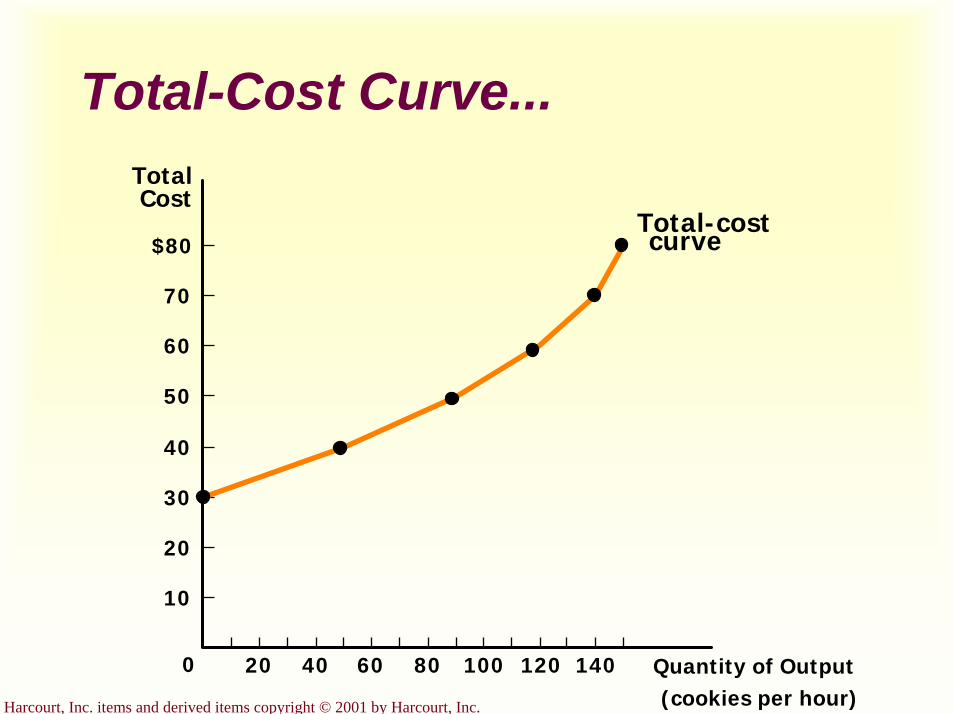
Harcourt, Inc. items and derived items copyright © 2001 by Harcourt, Inc.
Total-Cost Curve...TotalCost
$80
70
60
50
40
30
20
10
Quantity of Output(cookies per hour)
0 20 40 1401201008060
Total-costcurve
Harcourt, Inc. items and derived items copyright © 2001 by Harcourt, Inc.
The Various Measures of Cost
Costs of production may be divided into fixed costs and variable costs.
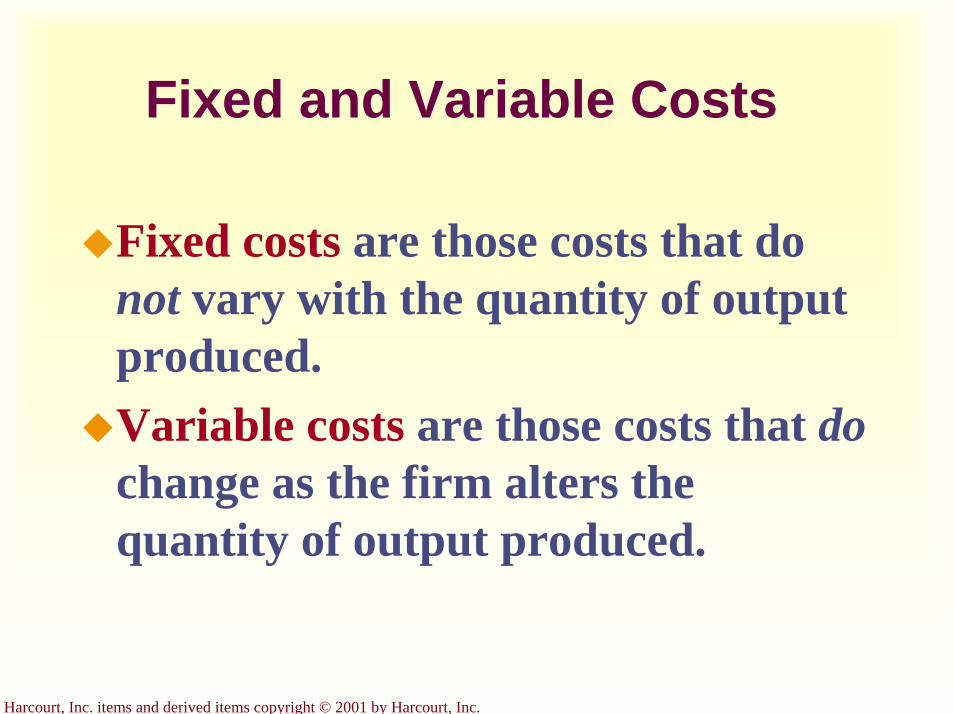
Harcourt, Inc. items and derived items copyright © 2001 by Harcourt, Inc.
Fixed and Variable Costs
Fixed costs are those costs that do not vary with the quantity of output produced.Variable costs are those costs that do change as the firm alters the quantity of output produced.
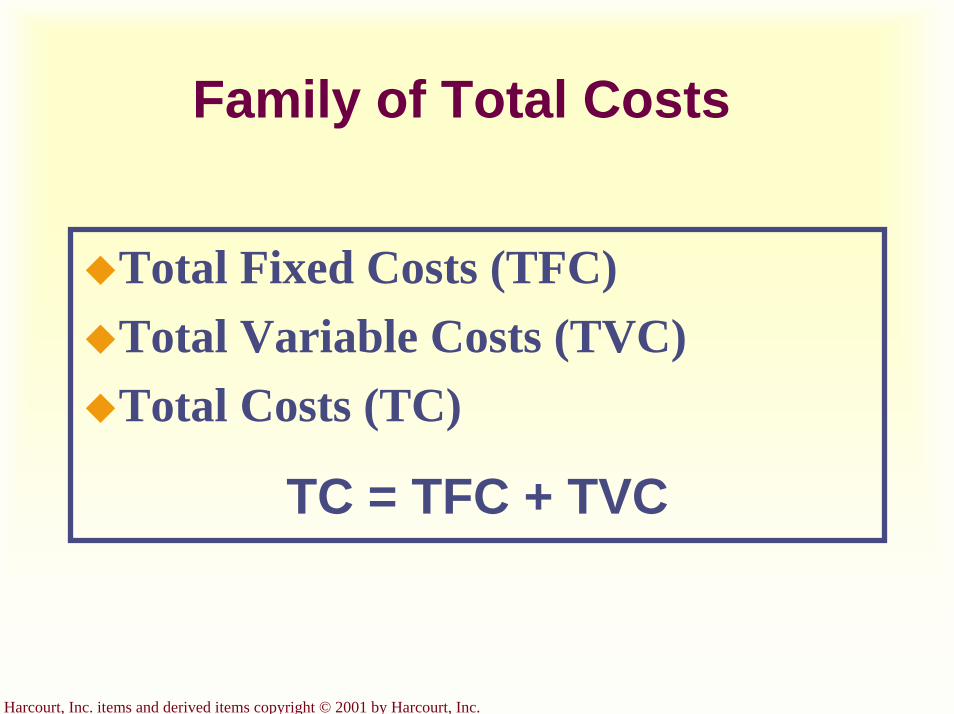
Harcourt, Inc. items and derived items copyright © 2001 by Harcourt, Inc.
Family of Total Costs
Total Fixed Costs (TFC)Total Variable Costs (TVC)Total Costs (TC)
TC = TFC + TVC
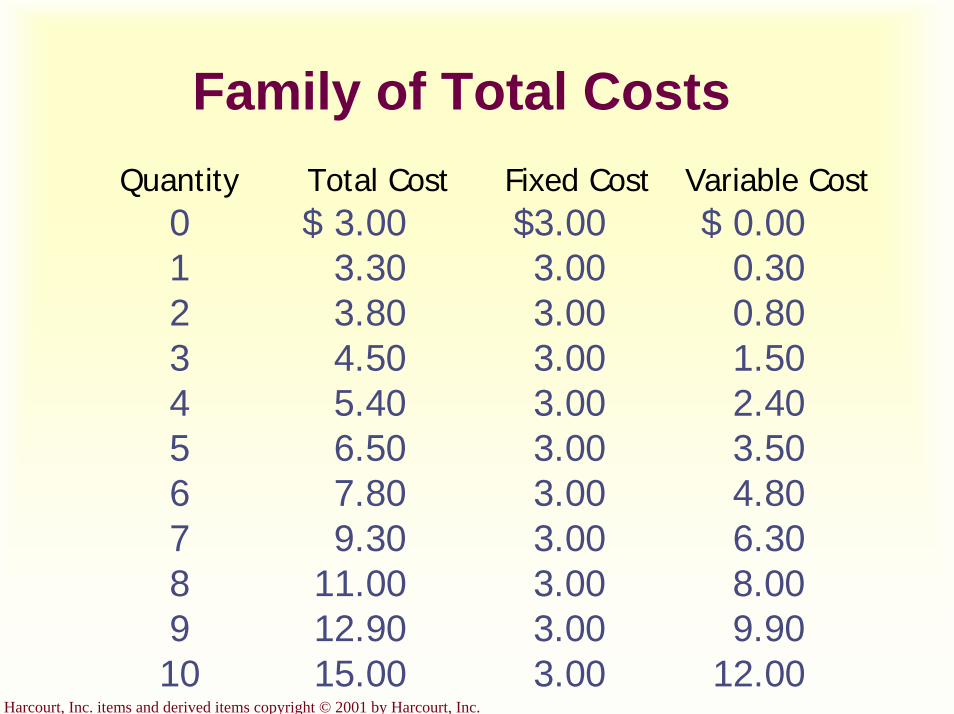
Harcourt, Inc. items and derived items copyright © 2001 by Harcourt, Inc.
Family of Total CostsQuantity
012345678910
Total Cost$ 3.00
3.303.804.505.406.507.809.30
11.0012.9015.00
Fixed Cost$3.003.003.003.003.003.003.003.003.003.003.00
Variable Cost$ 0.00
0.300.801.502.403.504.806.308.009.90
12.00
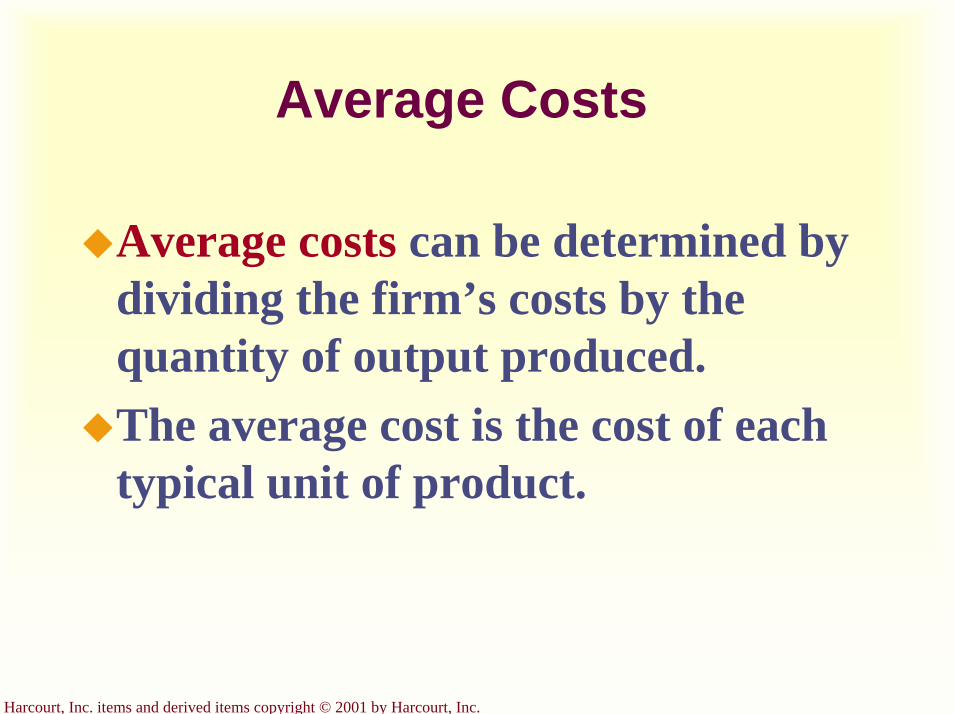
Harcourt, Inc. items and derived items copyright © 2001 by Harcourt, Inc.
Average Costs
Average costs can be determined by dividing the firm’s costs by the quantity of output produced. The average cost is the cost of each typical unit of product.
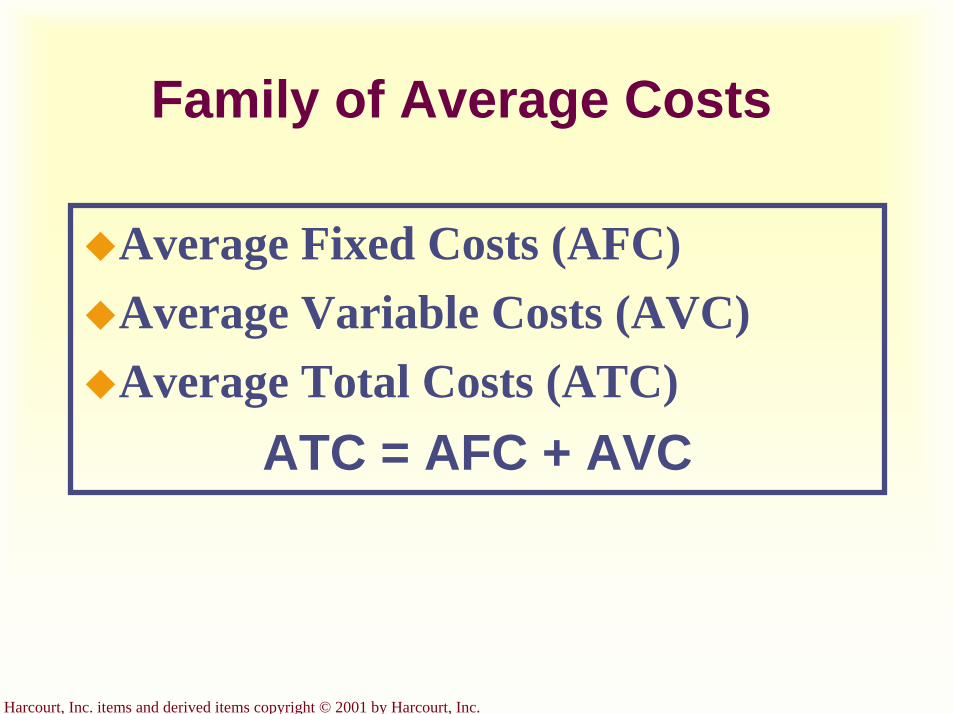
Harcourt, Inc. items and derived items copyright © 2001 by Harcourt, Inc.
Family of Average Costs
Average Fixed Costs (AFC)Average Variable Costs (AVC)Average Total Costs (ATC)
ATC = AFC + AVC
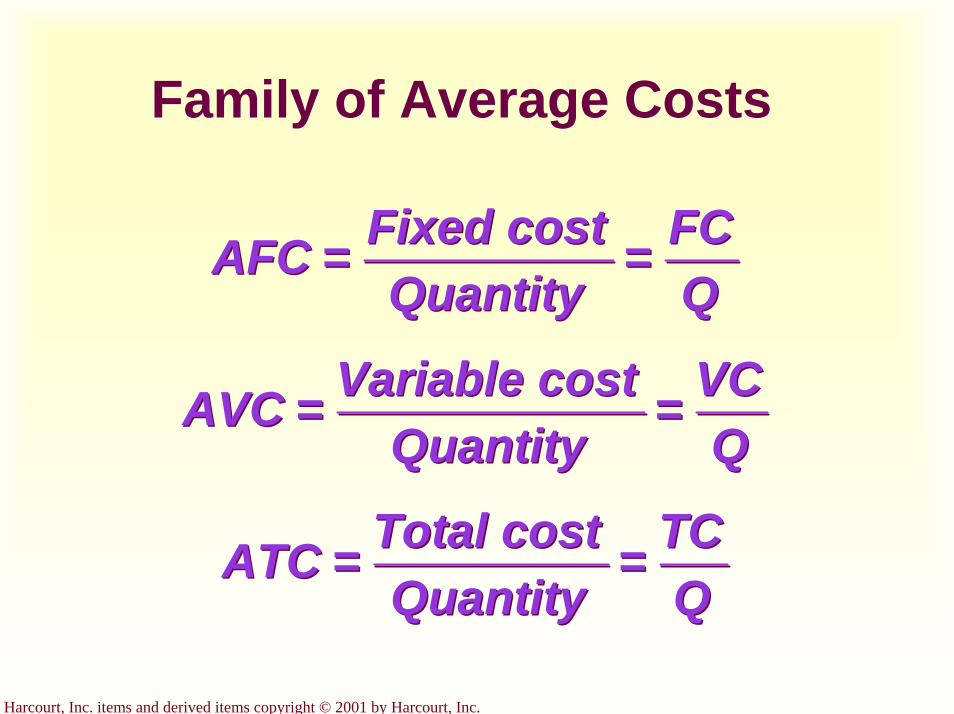
Harcourt, Inc. items and derived items copyright © 2001 by Harcourt, Inc.
Family of Average Costs
AFC = Fixed costQuantity
= FCQ
AVC = Variable costQuantity
= VCQ
ATC = Total costQuantity
= TCQ
AFC = Fixed costQuantity
= FCQ
AVC = Variable costQuantity
= VCQ
ATC = Total costQuantity
= TCQ
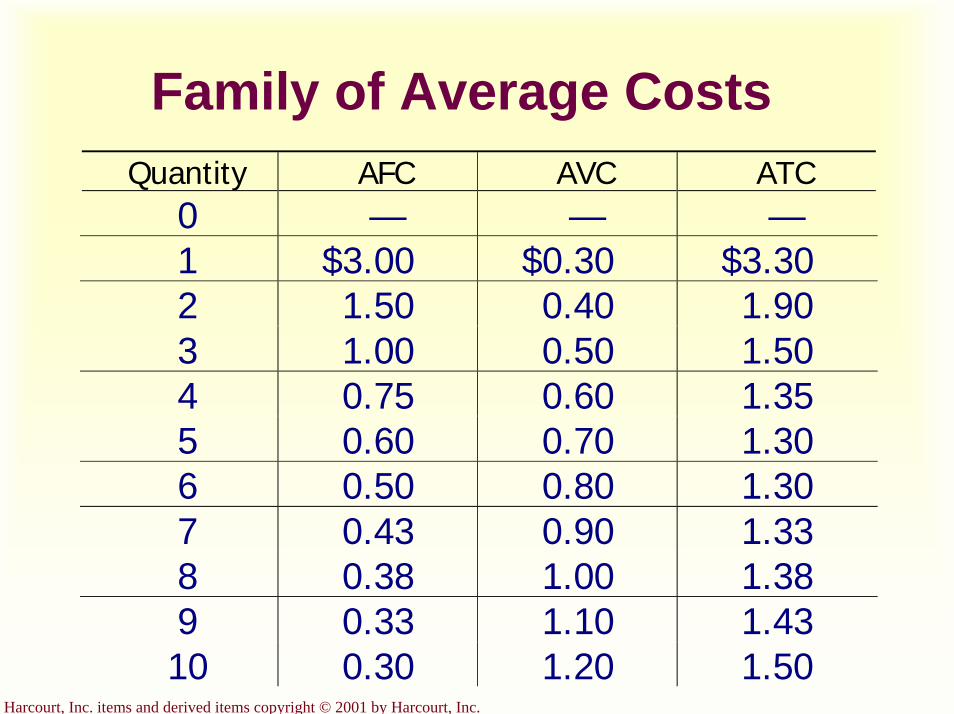
Harcourt, Inc. items and derived items copyright © 2001 by Harcourt, Inc.
Family of Average Costs
$3.00
Quantity AFC AVC ATC0 — — —1 $0.30 $3.302 1.50 0.40 1.903 1.00 0.50 1.504 0.75 0.60 1.355 0.60 0.70 1.306 0.50 0.80 1.307 0.43 0.90 1.338 0.38 1.00 1.389 0.33 1.10 1.4310 0.30 1.20 1.50
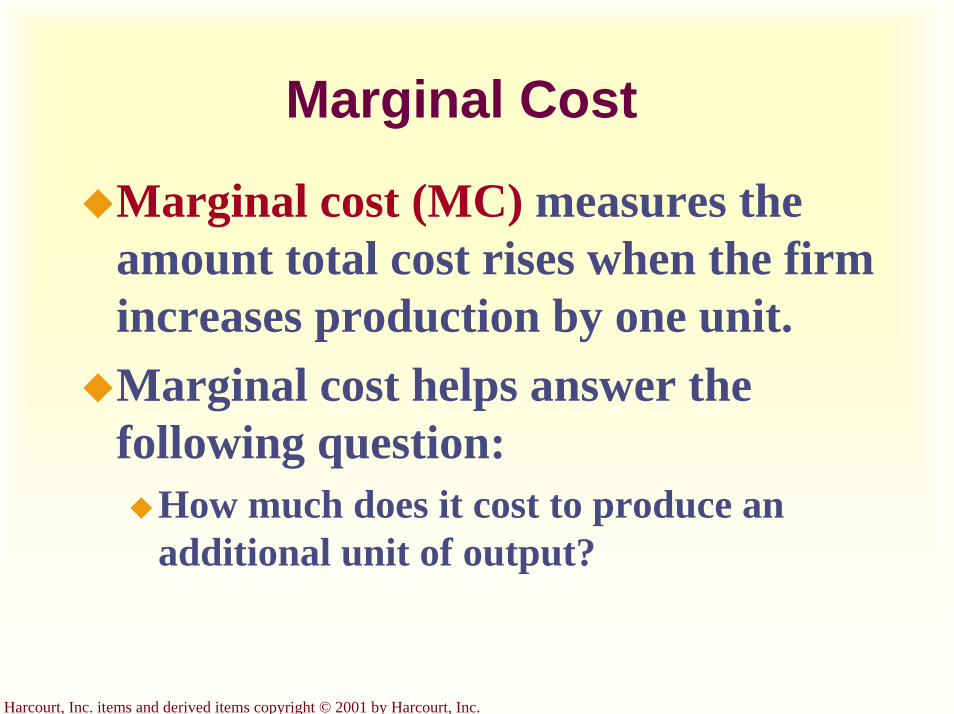
Harcourt, Inc. items and derived items copyright © 2001 by Harcourt, Inc.
Marginal Cost
Marginal cost (MC) measures the amount total cost rises when the firm increases production by one unit.Marginal cost helps answer the following question:
How much does it cost to produce an additional unit of output?

Harcourt, Inc. items and derived items copyright © 2001 by Harcourt, Inc.
Marginal Cost
QTC=
quantity) in (Changecost)total in(Change=MC
∆∆
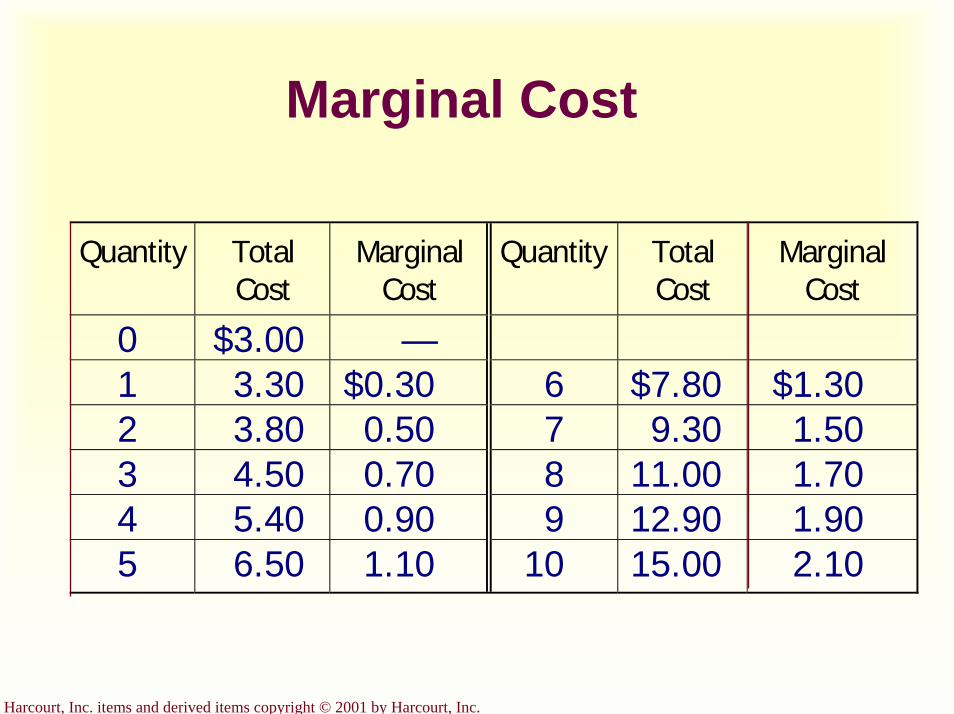
Harcourt, Inc. items and derived items copyright © 2001 by Harcourt, Inc.
Marginal Cost
Quantity TotalCost
MarginalCost
Quantity TotalCost
MarginalCost
0 $3.00 —1 3.30 $0.30 6 $7.80 $1.302 3.80 0.50 7 9.30 1.503 4.50 0.70 8 11.00 1.704 5.40 0.90 9 12.90 1.905 6.50 1.10 10 15.00 2.10

Harcourt, Inc. items and derived items copyright © 2001 by Harcourt, Inc.
Total-Cost Curve...
$0.00
$2.00
$4.00
$6.00
$8.00
$10.00
$12.00
$14.00
$16.00
0 2 4 6 8 10 12
Tota
l Cos
t
Total-cost curve
Quantity of Output(glasses of lemonade per hour)
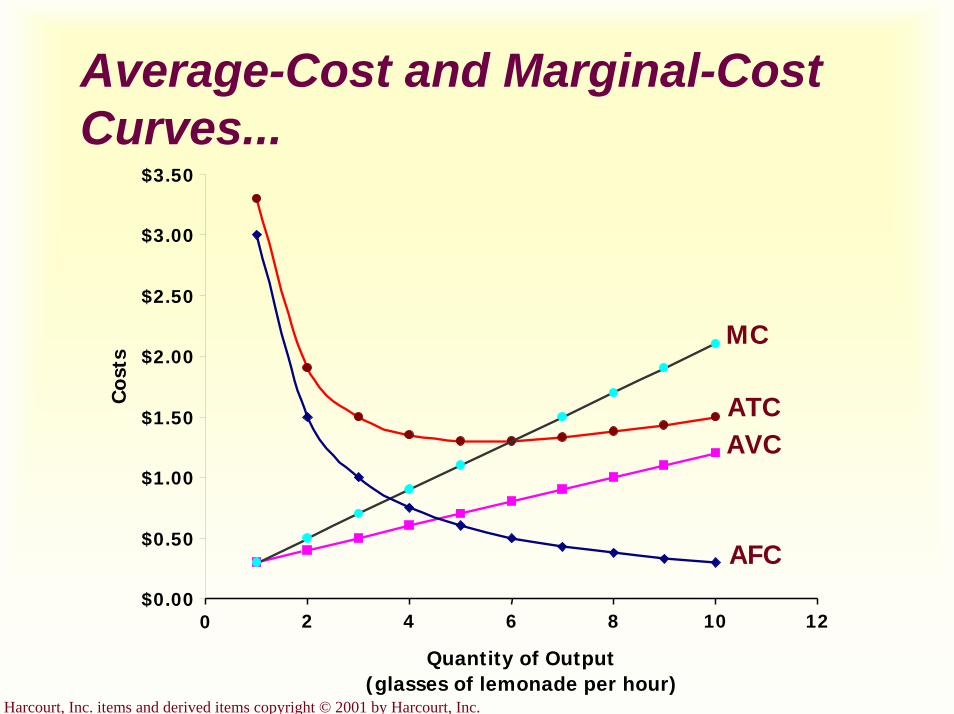
Harcourt, Inc. items and derived items copyright © 2001 by Harcourt, Inc.
ATCAVC
MC
Average-Cost and Marginal-Cost Curves...
$0.00
$0.50
$1.00
$1.50
$2.00
$2.50
$3.00
$3.50
0 2 4 6 8 10 12
Cos
ts
AFC
Quantity of Output(glasses of lemonade per hour)
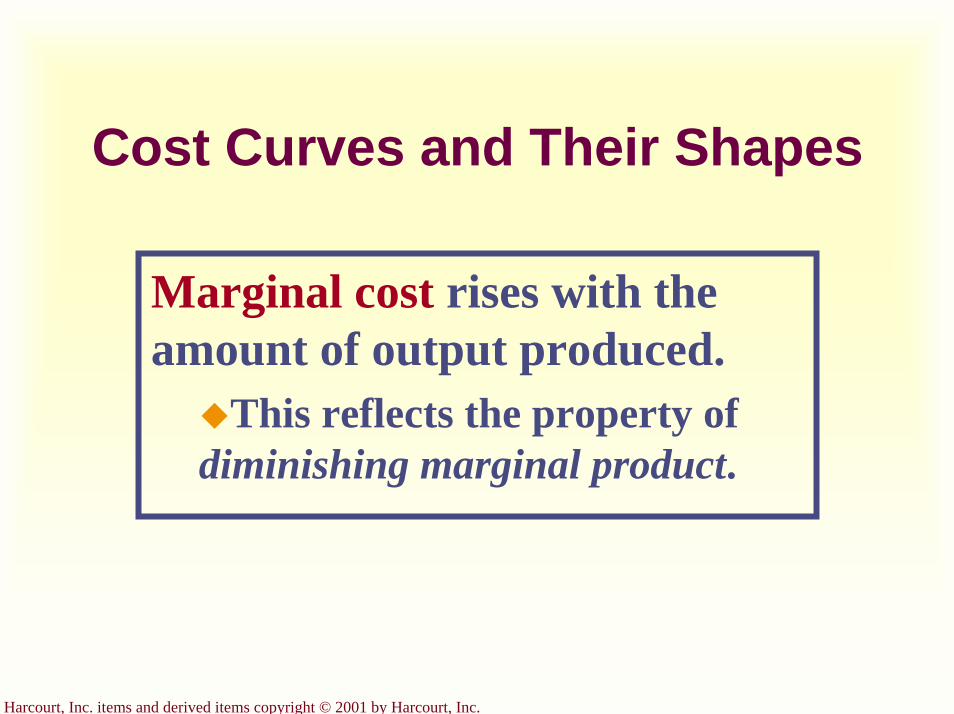
Harcourt, Inc. items and derived items copyright © 2001 by Harcourt, Inc.
Cost Curves and Their Shapes
Marginal cost rises with the amount of output produced.
This reflects the property of diminishing marginal product.

Harcourt, Inc. items and derived items copyright © 2001 by Harcourt, Inc.
Cost Curves and Their Shapes
$0.00
$0.50
$1.00
$1.50
$2.00
$2.50
0 2 4 6 8 10 12
Quantity of Output(glasses of lemonade per hour)
Cos
ts
MC
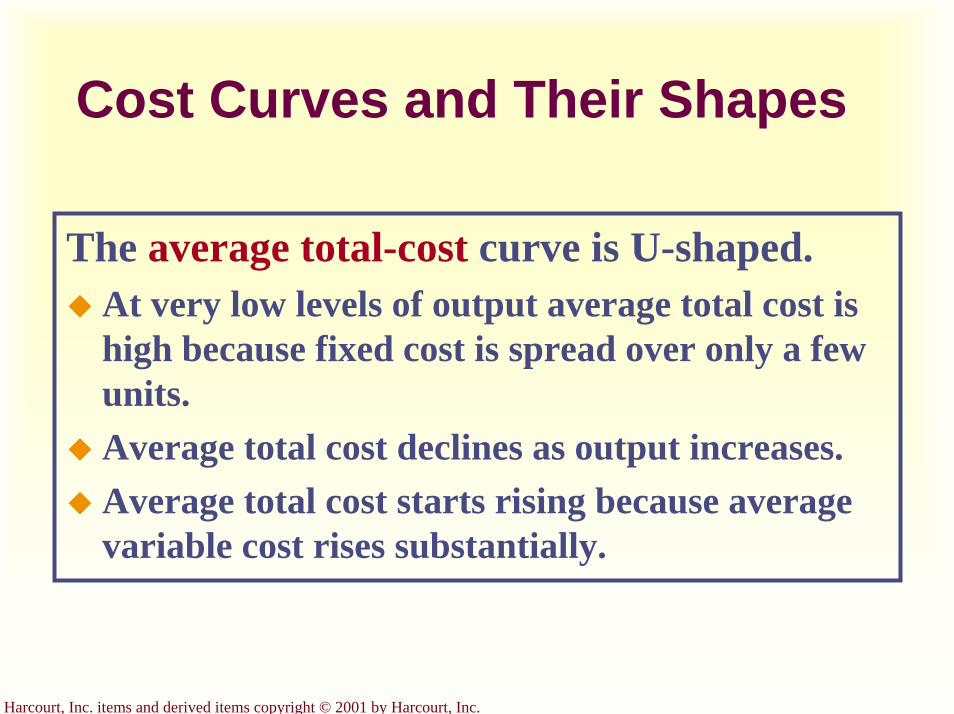
Harcourt, Inc. items and derived items copyright © 2001 by Harcourt, Inc.
Cost Curves and Their Shapes
The average total-cost curve is U-shaped.At very low levels of output average total cost is high because fixed cost is spread over only a few units.Average total cost declines as output increases.Average total cost starts rising because average variable cost rises substantially.
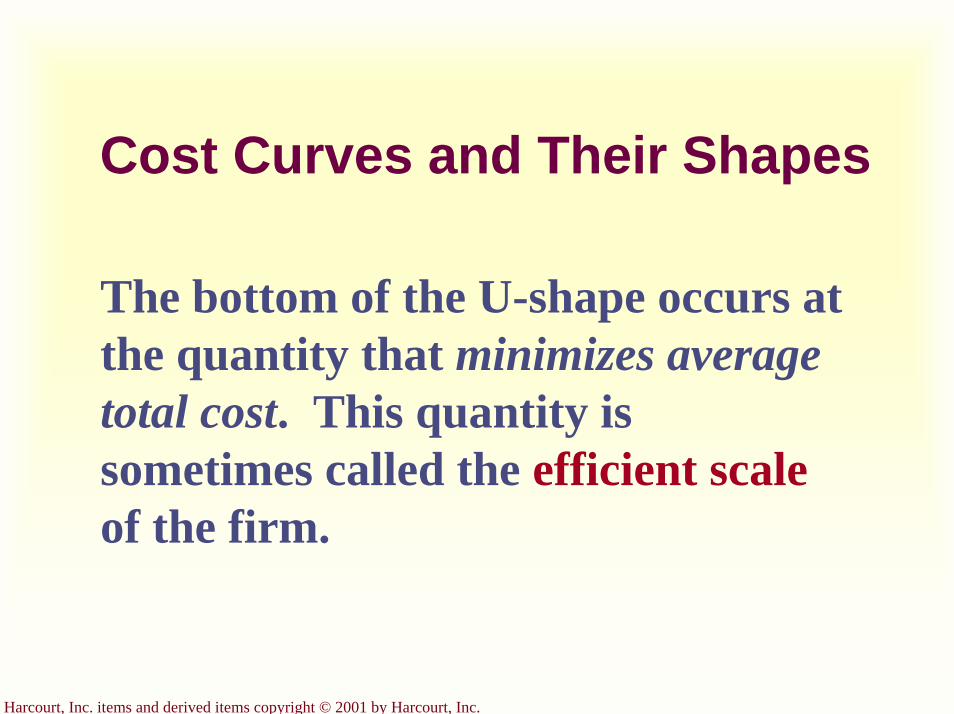
Harcourt, Inc. items and derived items copyright © 2001 by Harcourt, Inc.
Cost Curves and Their Shapes
The bottom of the U-shape occurs at the quantity that minimizes average total cost. This quantity is sometimes called the efficient scaleof the firm.

Harcourt, Inc. items and derived items copyright © 2001 by Harcourt, Inc.
Cost Curves and Their Shapes
$0.00
$0.50
$1.00
$1.50
$2.00
$2.50
$3.00
$3.50
0 2 4 6 8 10 12
Tota
l Cos
ts
ATC
Quantity of Output(glasses of lemonade per hour)
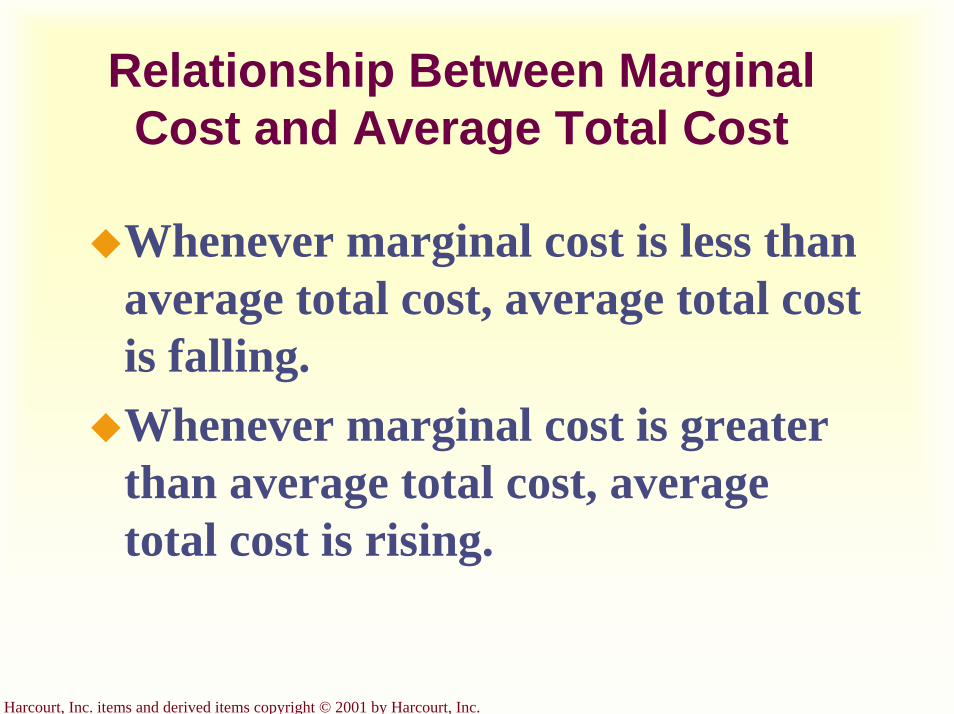
Harcourt, Inc. items and derived items copyright © 2001 by Harcourt, Inc.
Relationship Between Marginal Cost and Average Total Cost
Whenever marginal cost is less than average total cost, average total cost is falling.Whenever marginal cost is greater than average total cost, average total cost is rising.
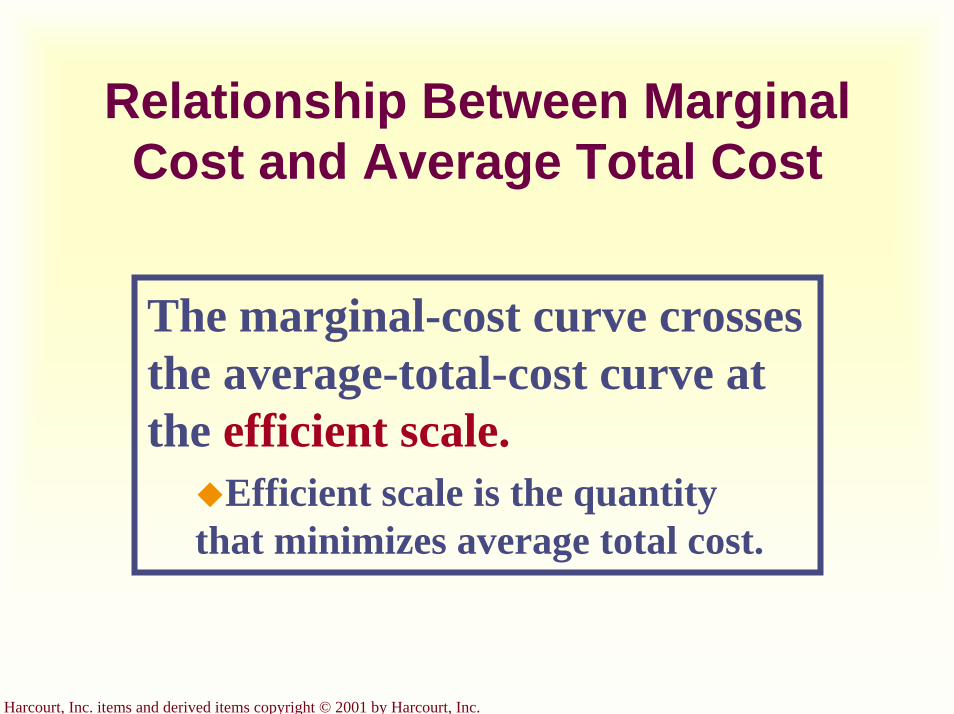
Harcourt, Inc. items and derived items copyright © 2001 by Harcourt, Inc.
Relationship Between Marginal Cost and Average Total Cost
The marginal-cost curve crosses the average-total-cost curve at the efficient scale.
Efficient scale is the quantity that minimizes average total cost.

Harcourt, Inc. items and derived items copyright © 2001 by Harcourt, Inc.
MC
ATC
Relationship Between Marginal Cost and Average Total Cost
$0.00
$0.50
$1.00
$1.50
$2.00
$2.50
$3.00
$3.50
0 2 4 6 8 10 12
Cos
ts
Quantity of Output(glasses of lemonade per hour)
Harcourt, Inc. items and derived items copyright © 2001 by Harcourt, Inc.
The Various Measures of Cost
It is now time to examine the relationships that exist between the
different measures of cost.
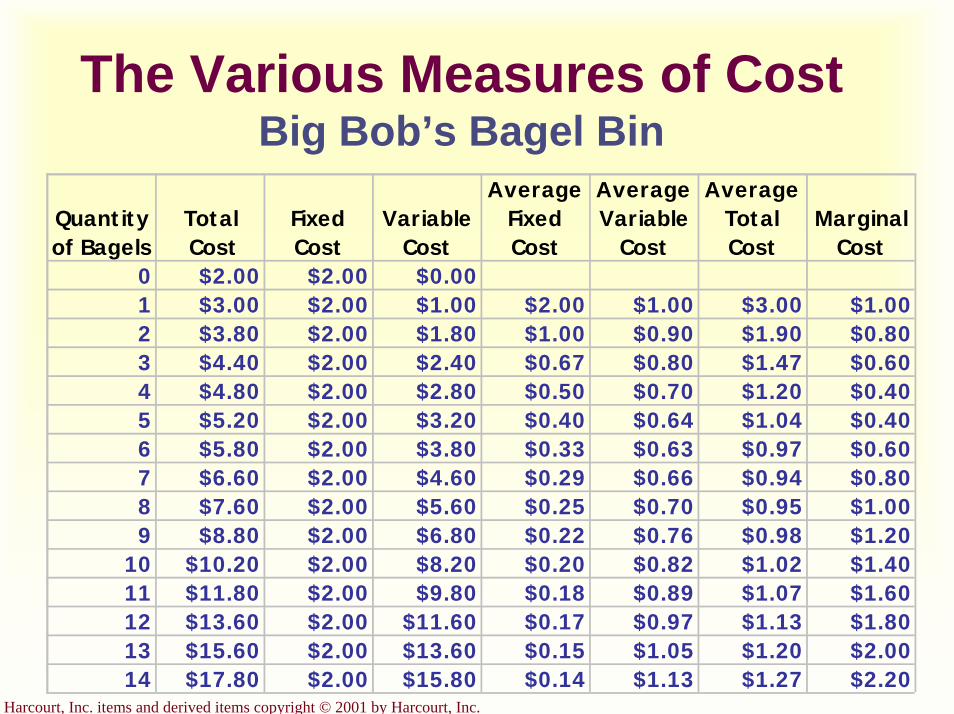
Harcourt, Inc. items and derived items copyright © 2001 by Harcourt, Inc.
The Various Measures of Cost Big Bob’s Bagel Bin
Quantity of Bagels
Total Cost
FixedCost
VariableCost
AverageFixedCost
AverageVariable
Cost
AverageTotalCost
MarginalCost
0 $2.00 $2.00 $0.001 $3.00 $2.00 $1.00 $2.00 $1.00 $3.00 $1.002 $3.80 $2.00 $1.80 $1.00 $0.90 $1.90 $0.803 $4.40 $2.00 $2.40 $0.67 $0.80 $1.47 $0.604 $4.80 $2.00 $2.80 $0.50 $0.70 $1.20 $0.405 $5.20 $2.00 $3.20 $0.40 $0.64 $1.04 $0.406 $5.80 $2.00 $3.80 $0.33 $0.63 $0.97 $0.607 $6.60 $2.00 $4.60 $0.29 $0.66 $0.94 $0.808 $7.60 $2.00 $5.60 $0.25 $0.70 $0.95 $1.009 $8.80 $2.00 $6.80 $0.22 $0.76 $0.98 $1.20
10 $10.20 $2.00 $8.20 $0.20 $0.82 $1.02 $1.4011 $11.80 $2.00 $9.80 $0.18 $0.89 $1.07 $1.6012 $13.60 $2.00 $11.60 $0.17 $0.97 $1.13 $1.8013 $15.60 $2.00 $13.60 $0.15 $1.05 $1.20 $2.0014 $17.80 $2.00 $15.80 $0.14 $1.13 $1.27 $2.20
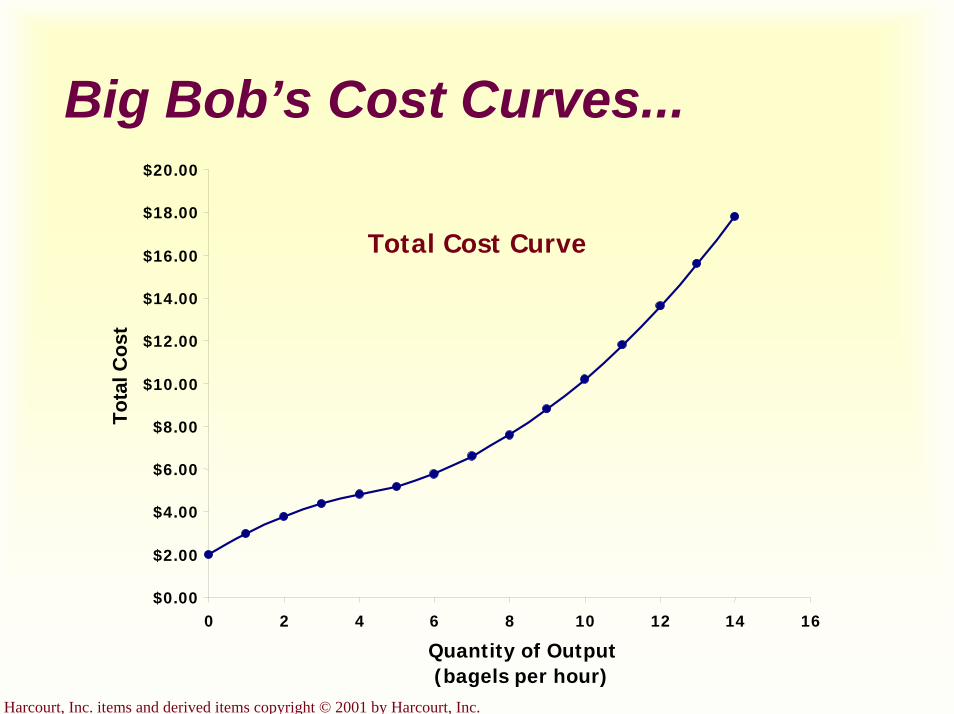
Harcourt, Inc. items and derived items copyright © 2001 by Harcourt, Inc.
Big Bob’s Cost Curves...
$0.00
$2.00
$4.00
$6.00
$8.00
$10.00
$12.00
$14.00
$16.00
$18.00
$20.00
0 2 4 6 8 10 12 14 16
Quantity of Output(bagels per hour)
Tota
l Cos
t
Total Cost Curve

Harcourt, Inc. items and derived items copyright © 2001 by Harcourt, Inc.
Big Bob’s Cost Curves...
AFC
AVC
MC
0
0.5
1
1.5
2
2.5
3
3.5
0 2 4 6 8 10 12 14 16Quantity of Output
Cos
ts
ATC
Harcourt, Inc. items and derived items copyright © 2001 by Harcourt, Inc.
Three Important Properties of Cost Curves
Marginal cost eventually rises with the quantity of output.The average-total-cost curve is U-shaped.The marginal-cost curve crosses the average-total-cost curve at the minimum of average total cost.
Harcourt, Inc. items and derived items copyright © 2001 by Harcourt, Inc.
Costs in the Long Run
For many firms, the division of total costs between fixed and variable costs depends on the time horizon being considered.
In the short run some costs are fixed.In the long run fixed costs become variable costs.
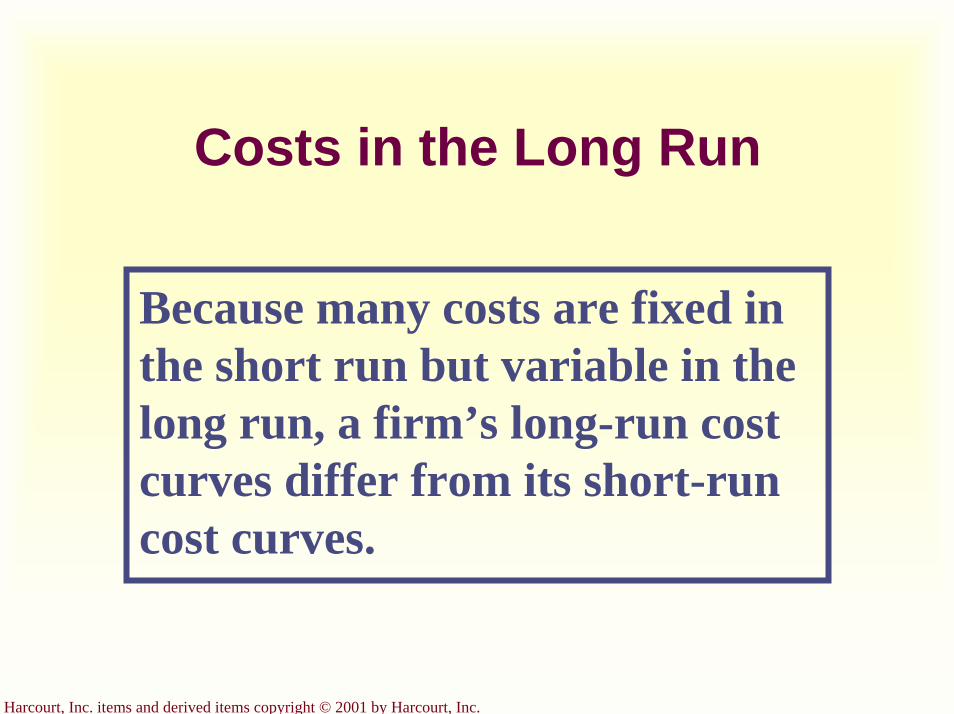
Harcourt, Inc. items and derived items copyright © 2001 by Harcourt, Inc.
Costs in the Long Run
Because many costs are fixed in the short run but variable in the long run, a firm’s long-run cost curves differ from its short-run cost curves.

Harcourt, Inc. items and derived items copyright © 2001 by Harcourt, Inc.
Average Total Cost in the Short and Long Runs...
Quantity ofCars per Day
0
AverageTotalCost
ATC in shortrun with
small factory
ATC in shortrun with
medium factory
ATC in shortrun with
large factory
ATC in long run
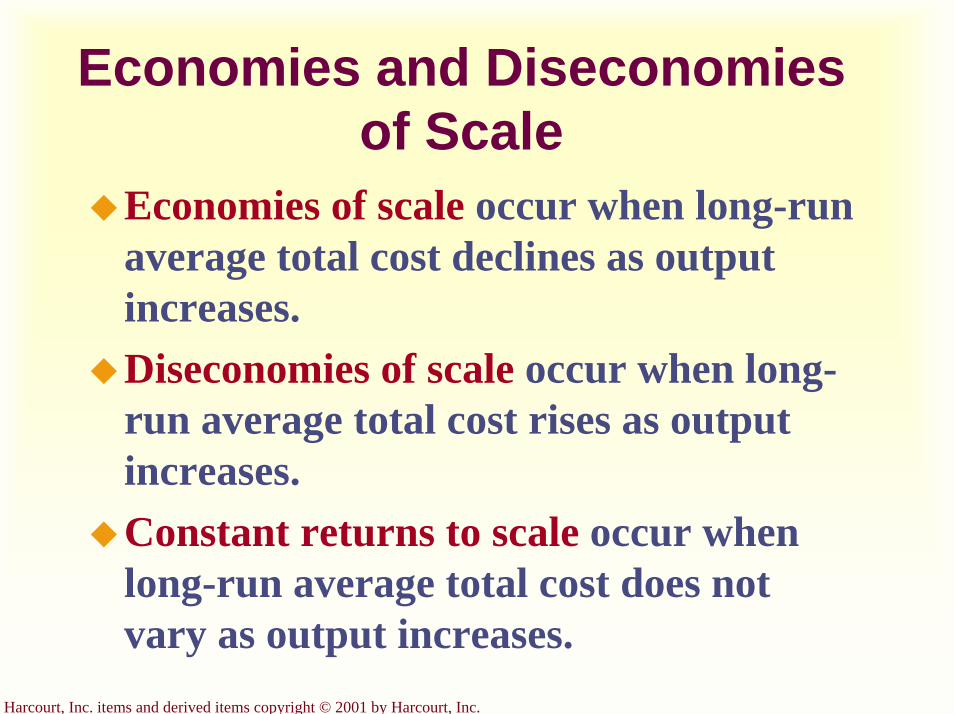
Harcourt, Inc. items and derived items copyright © 2001 by Harcourt, Inc.
Economies and Diseconomies of Scale
Economies of scale occur when long-run average total cost declines as output increases.Diseconomies of scale occur when long-run average total cost rises as output increases.Constant returns to scale occur when long-run average total cost does not vary as output increases.

Harcourt, Inc. items and derived items copyright © 2001 by Harcourt, Inc.
Economies and Diseconomies of Scale
Diseconomiesof scale
Quantity ofCars per Day
0
AverageTotalCost
ATC in long run
Economiesof scale
Constant Returnsto scale
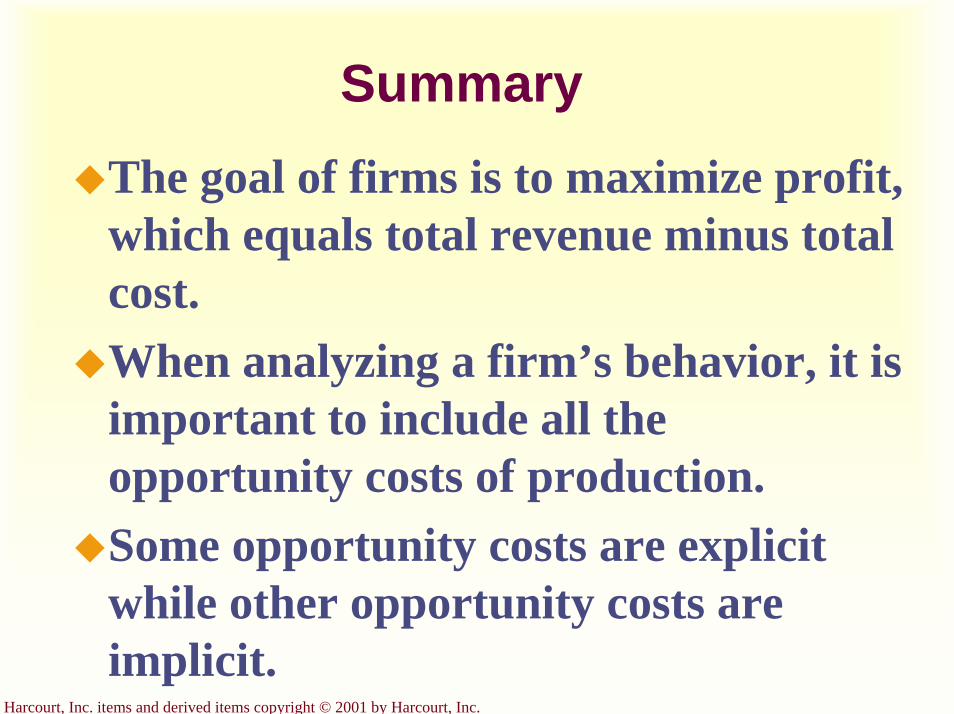
Harcourt, Inc. items and derived items copyright © 2001 by Harcourt, Inc.
SummaryThe goal of firms is to maximize profit, which equals total revenue minus total cost.When analyzing a firm’s behavior, it is important to include all the opportunity costs of production.Some opportunity costs are explicit while other opportunity costs are implicit.
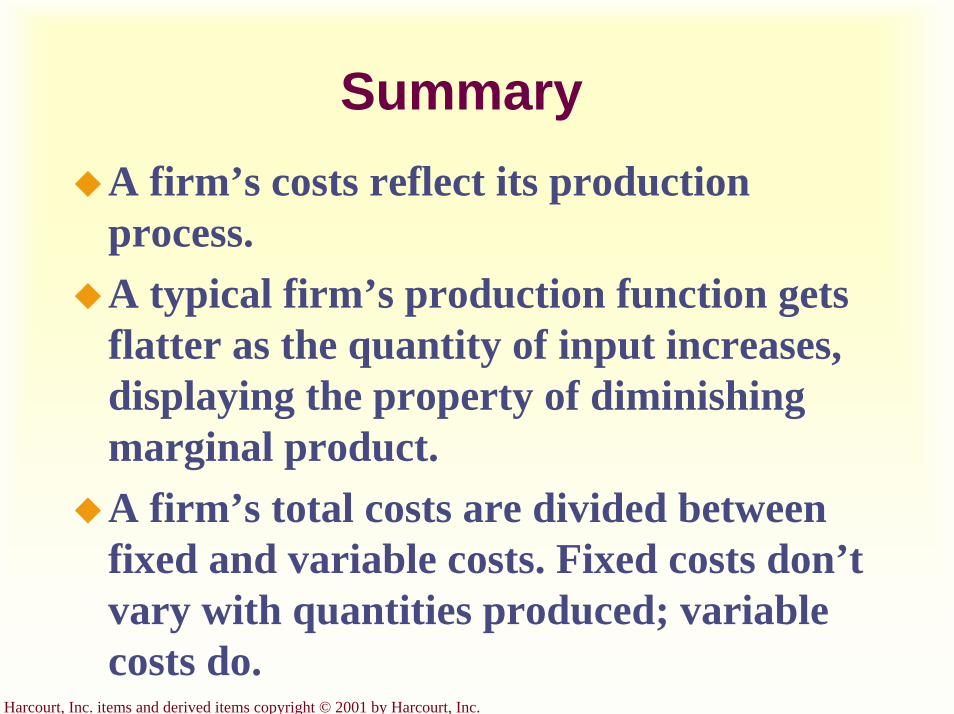
Harcourt, Inc. items and derived items copyright © 2001 by Harcourt, Inc.
SummaryA firm’s costs reflect its production process.A typical firm’s production function gets flatter as the quantity of input increases, displaying the property of diminishing marginal product.A firm’s total costs are divided between fixed and variable costs. Fixed costs don’t vary with quantities produced; variable costs do.
Harcourt, Inc. items and derived items copyright © 2001 by Harcourt, Inc.
SummaryAverage total cost is total cost divided by the quantity of output.Marginal cost is the amount by which total cost would rise if output were increased by one unit.The marginal cost always rises with the quantity of output.
Harcourt, Inc. items and derived items copyright © 2001 by Harcourt, Inc.
SummaryThe average-total-cost curve is U-shaped.The marginal-cost curve always crosses the average-total-cost curve at the minimum of ATC.A firm’s costs often depend on the time horizon being considered.

Harcourt, Inc. items and derived items copyright © 2001 by Harcourt, Inc.
Graphical Review

Harcourt, Inc. items and derived items copyright © 2001 by Harcourt, Inc.
Economic Profit versus Accounting Profit
RevenueTotalopportunitycosts
How an EconomistViews a Firm
Explicitcosts
Economicprofit
Implicitcosts
Explicitcosts
Accountingprofit
How an AccountantViews a Firm
Revenue

Harcourt, Inc. items and derived items copyright © 2001 by Harcourt, Inc.
A Production Function...Quantity of
Output(cookies
per hour)150140130120110100
908070605040302010
Number of Workers Hired0 1 2 3 4 5
Production function

Harcourt, Inc. items and derived items copyright © 2001 by Harcourt, Inc.
Total-Cost Curve...TotalCost
$80
70
60
50
40
30
20
10
Quantity of Output(cookies per hour)
0 20 40 1401201008060
Total-costcurve
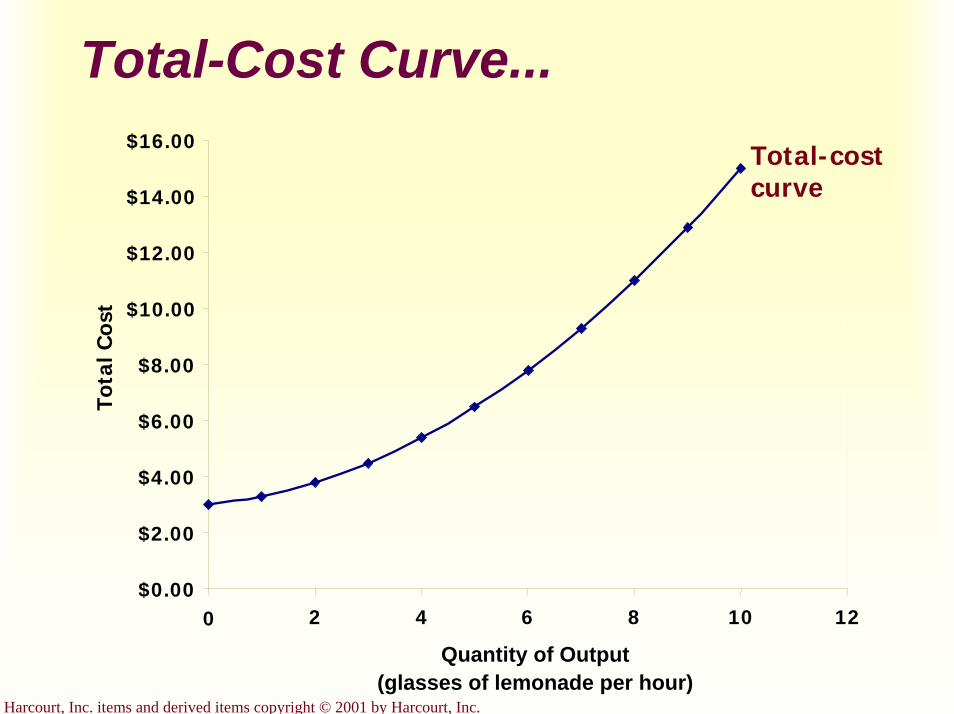
Harcourt, Inc. items and derived items copyright © 2001 by Harcourt, Inc.
Total-Cost Curve...
$0.00
$2.00
$4.00
$6.00
$8.00
$10.00
$12.00
$14.00
$16.00
0 2 4 6 8 10 12
Quantity of Output(glasses of lemonade per hour)
Tota
l Cos
t
Total-cost curve

Harcourt, Inc. items and derived items copyright © 2001 by Harcourt, Inc.
Average-Cost and Marginal-Cost Curves...
ATCAVC
MC
$0.00
$0.50
$1.00
$1.50
$2.00
$2.50
$3.00
$3.50
0 2 4 6 8 10 12
Quantity of Output(glasses of lemonade per hour)
Cos
ts
AFC
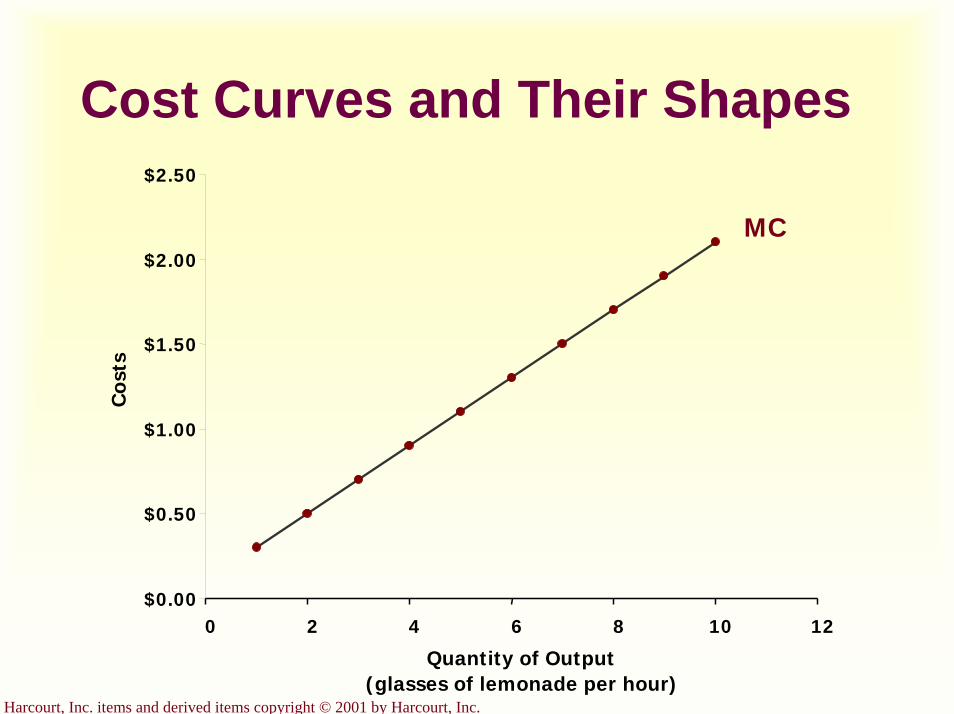
Harcourt, Inc. items and derived items copyright © 2001 by Harcourt, Inc.
Cost Curves and Their Shapes
$0.00
$0.50
$1.00
$1.50
$2.00
$2.50
0 2 4 6 8 10 12
Quantity of Output(glasses of lemonade per hour)
Cos
ts
MC
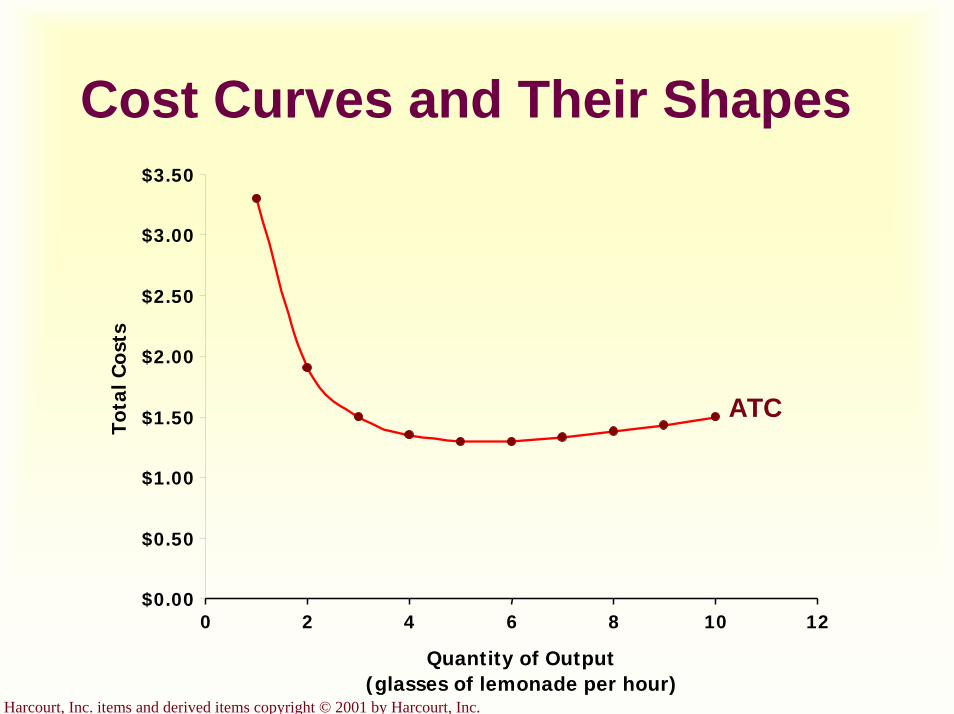
Harcourt, Inc. items and derived items copyright © 2001 by Harcourt, Inc.
Cost Curves and Their Shapes
$0.00
$0.50
$1.00
$1.50
$2.00
$2.50
$3.00
$3.50
0 2 4 6 8 10 12
Quantity of Output(glasses of lemonade per hour)
Tota
l Cos
ts
ATC
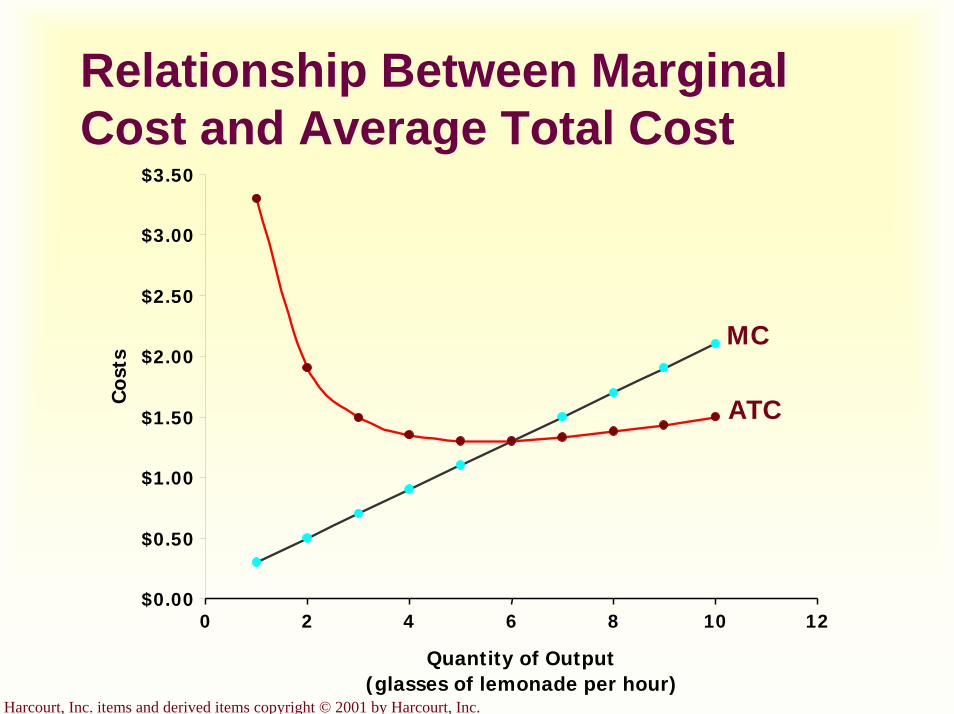
Harcourt, Inc. items and derived items copyright © 2001 by Harcourt, Inc.
Relationship Between Marginal Cost and Average Total Cost
MC
ATC
$0.00
$0.50
$1.00
$1.50
$2.00
$2.50
$3.00
$3.50
0 2 4 6 8 10 12
Quantity of Output(glasses of lemonade per hour)
Cos
ts

Harcourt, Inc. items and derived items copyright © 2001 by Harcourt, Inc.
Big Bob’s Cost Curves...
$0.00
$2.00
$4.00
$6.00
$8.00
$10.00
$12.00
$14.00
$16.00
$18.00
$20.00
0 2 4 6 8 10 12 14 16
Quantity of Output(bagels per hour)
Tota
l Cos
t
Total Cost Curve
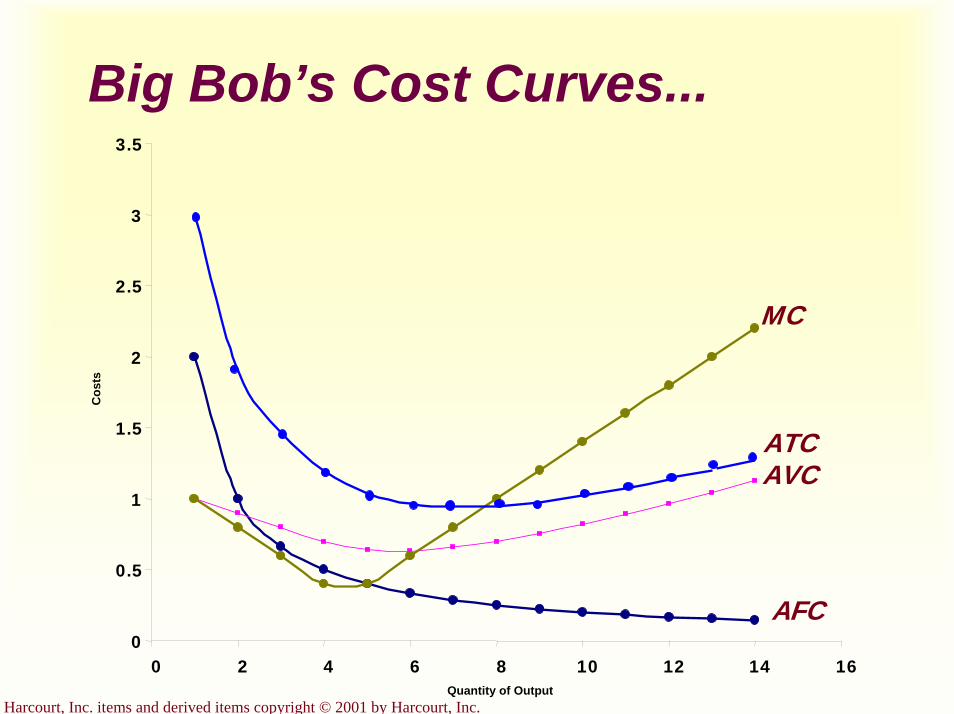
Harcourt, Inc. items and derived items copyright © 2001 by Harcourt, Inc.
Big Bob’s Cost Curves...
AFC
AVC
MC
0
0.5
1
1.5
2
2.5
3
3.5
0 2 4 6 8 10 12 14 16Quantity of Output
Cos
ts
ATC
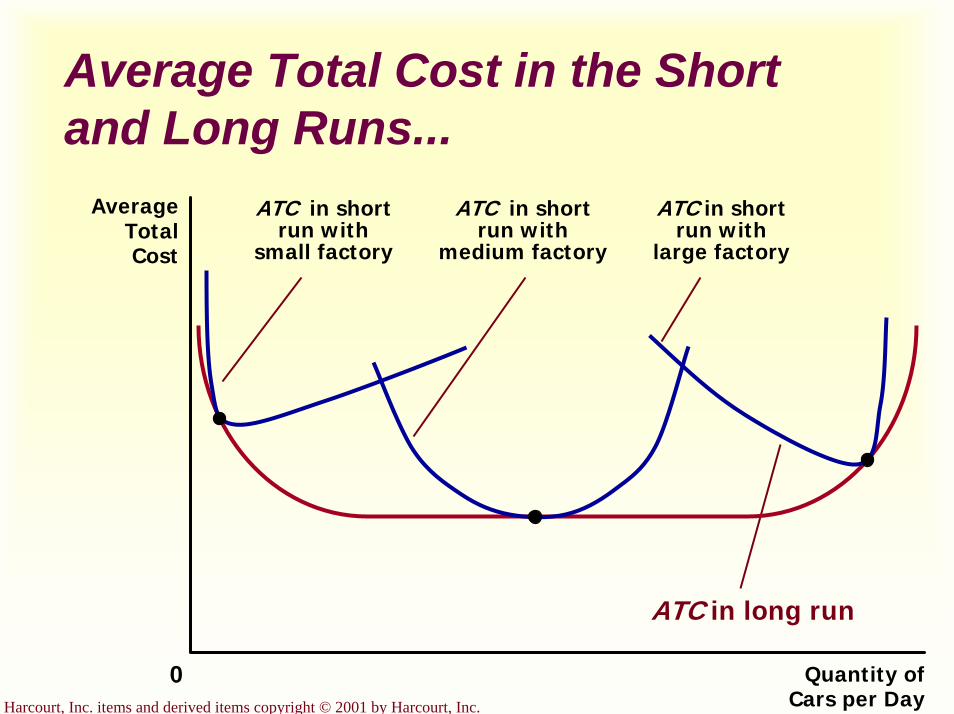
Harcourt, Inc. items and derived items copyright © 2001 by Harcourt, Inc.
Average Total Cost in the Short and Long Runs...
Quantity ofCars per Day
0
AverageTotalCost
ATC in shortrun with
small factory
ATC in shortrun with
medium factory
ATC in shortrun with
large factory
ATC in long run
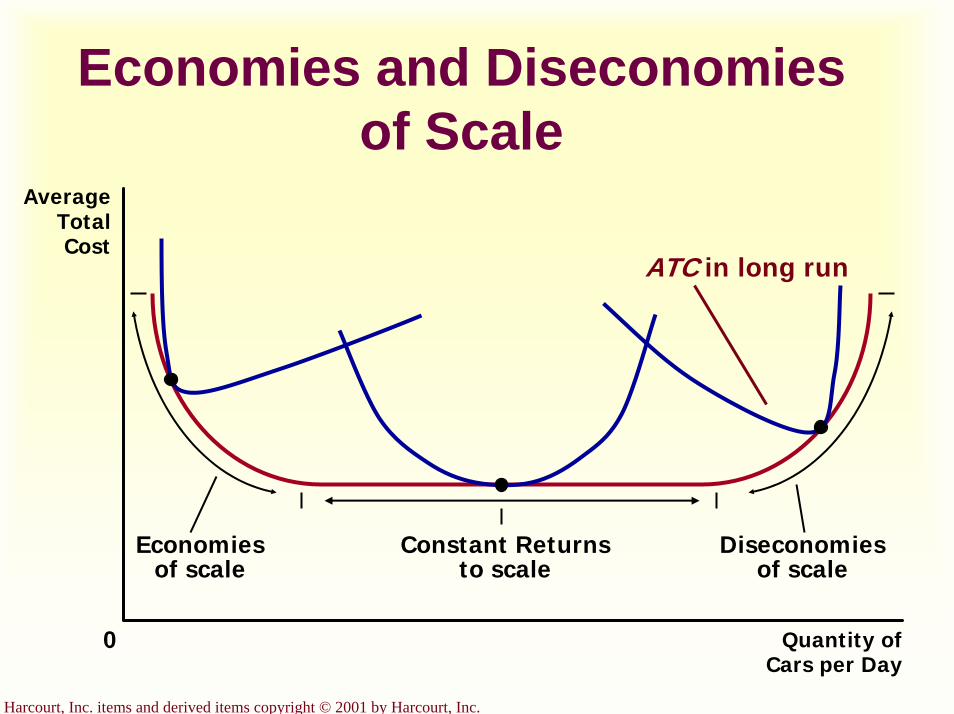
Harcourt, Inc. items and derived items copyright © 2001 by Harcourt, Inc.
Economies and Diseconomies of Scale
Diseconomiesof scale
Quantity ofCars per Day
0
AverageTotalCost
ATC in long run
Economiesof scale
Constant Returnsto scale
Firms in Competitive Markets
Chapter 14
Copyright © 2001 by Harcourt, Inc.
All rights reserved. Requests for permission to make copies of any part of thework should be mailed to:
Permissions Department, Harcourt College Publishers,6277 Sea Harbor Drive, Orlando, Florida 32887-6777.
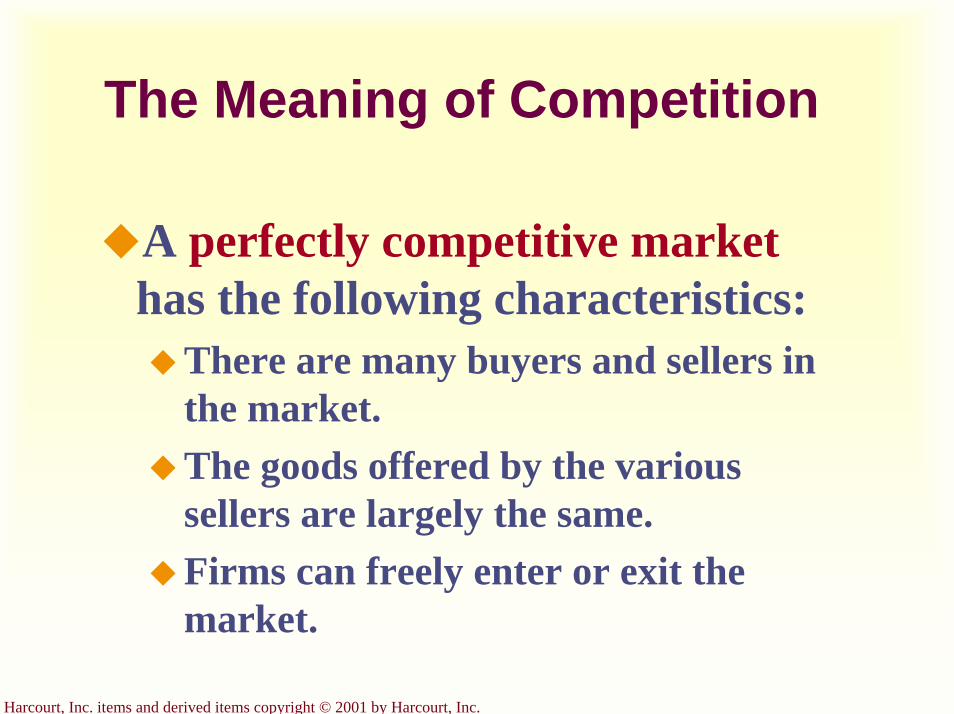
Harcourt, Inc. items and derived items copyright © 2001 by Harcourt, Inc.
The Meaning of Competition
A perfectly competitive markethas the following characteristics:
There are many buyers and sellers in the market.The goods offered by the various sellers are largely the same.Firms can freely enter or exit the market.
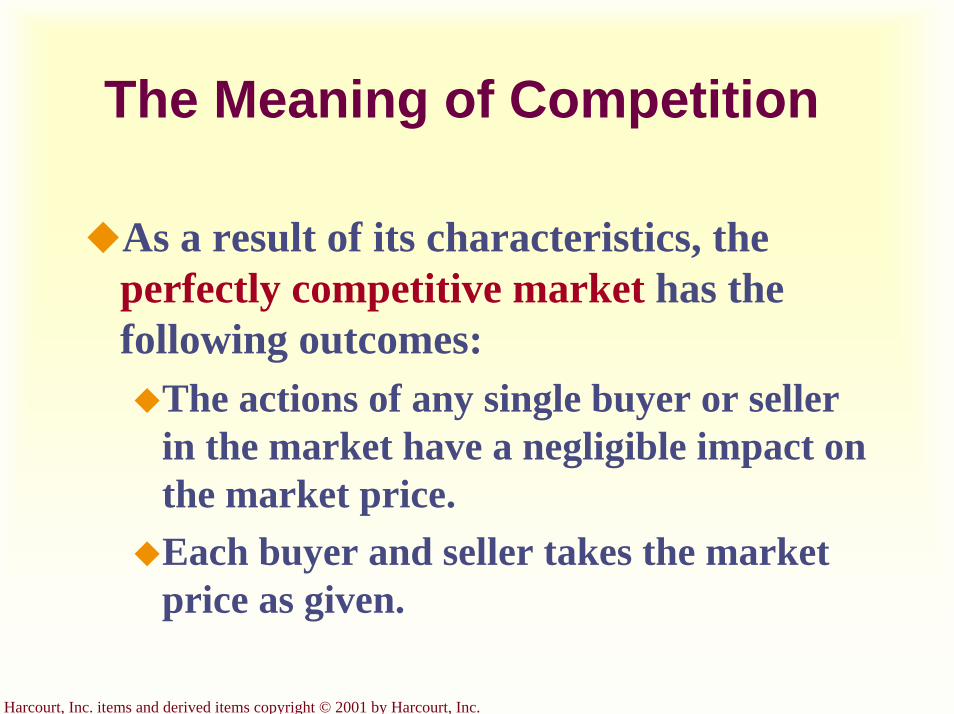
Harcourt, Inc. items and derived items copyright © 2001 by Harcourt, Inc.
The Meaning of Competition
As a result of its characteristics, the perfectly competitive market has the following outcomes:
The actions of any single buyer or seller in the market have a negligible impact on the market price.Each buyer and seller takes the market price as given.
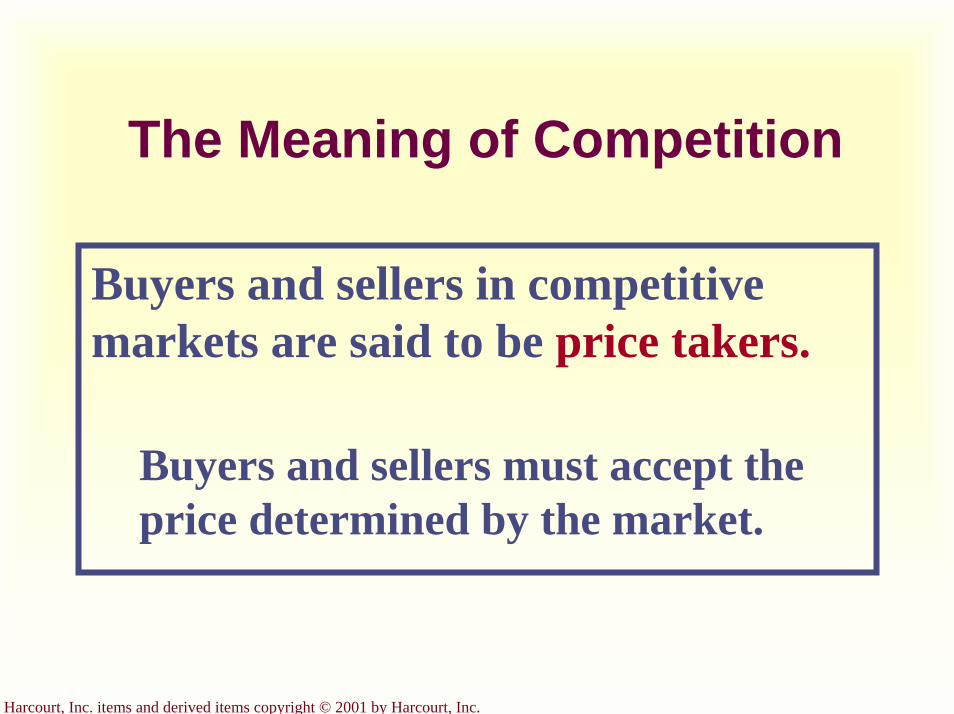
Harcourt, Inc. items and derived items copyright © 2001 by Harcourt, Inc.
The Meaning of Competition
Buyers and sellers in competitive markets are said to be price takers.
Buyers and sellers must accept the price determined by the market.
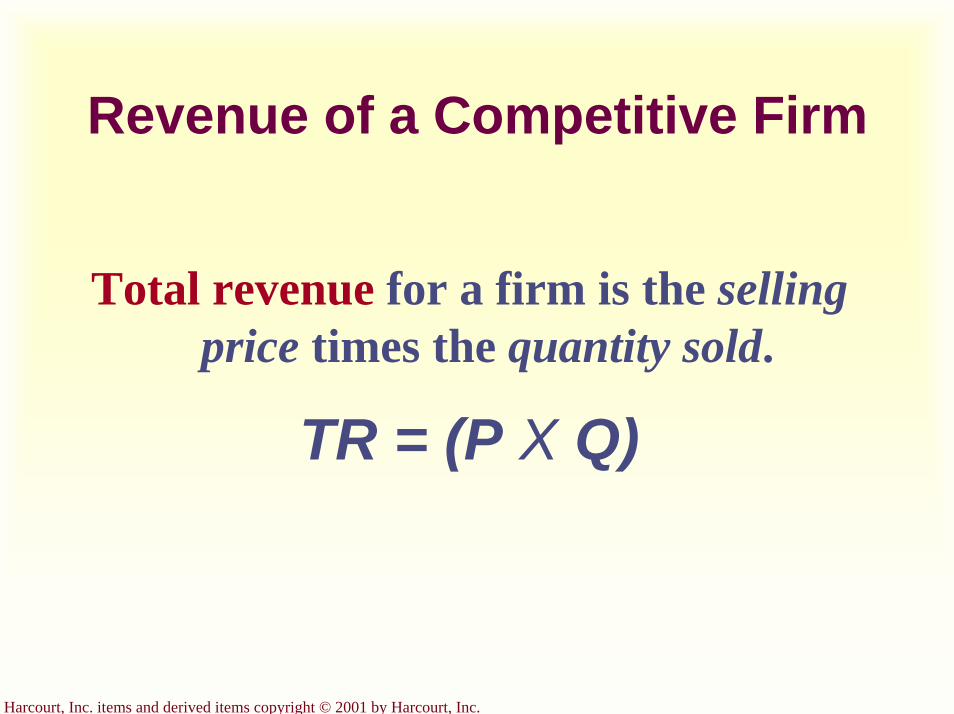
Harcourt, Inc. items and derived items copyright © 2001 by Harcourt, Inc.
Revenue of a Competitive Firm
Total revenue for a firm is the selling price times the quantity sold.
TR = (P X Q)
Harcourt, Inc. items and derived items copyright © 2001 by Harcourt, Inc.
Revenue of a Competitive Firm
Total revenue is proportional to the amount of output.
Harcourt, Inc. items and derived items copyright © 2001 by Harcourt, Inc.
Revenue of a Competitive Firm
Average revenue tells us how much revenue a firm receives for the
typical unit sold.
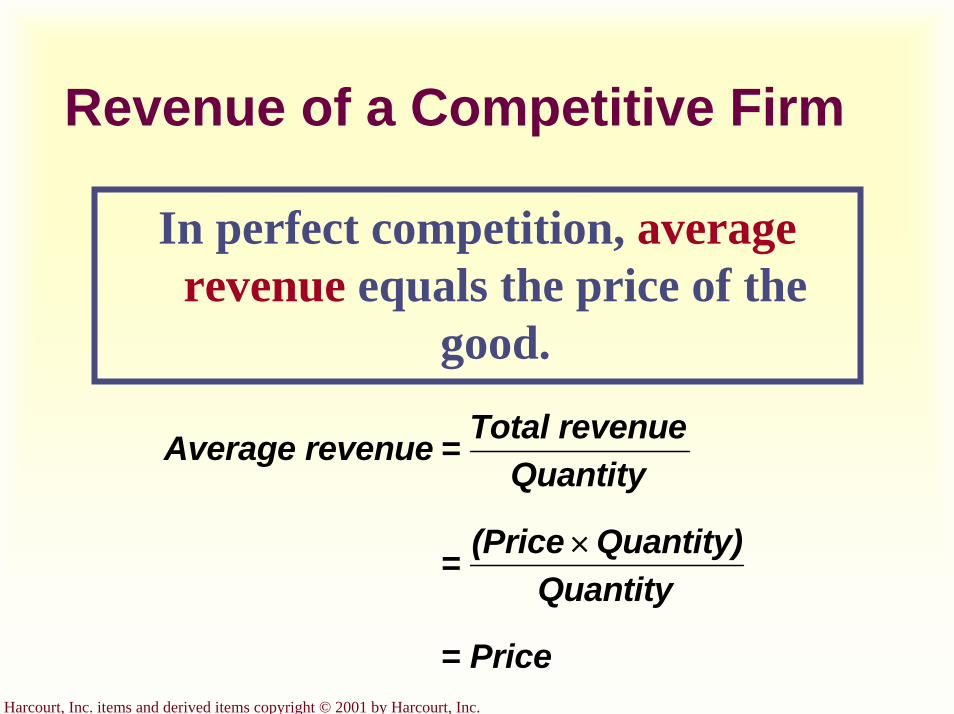
Harcourt, Inc. items and derived items copyright © 2001 by Harcourt, Inc.
Revenue of a Competitive Firm
In perfect competition, average revenue equals the price of the
good.
Average revenue = Total revenueQuantity
= (Price Quantity)Quantity
= Price
×
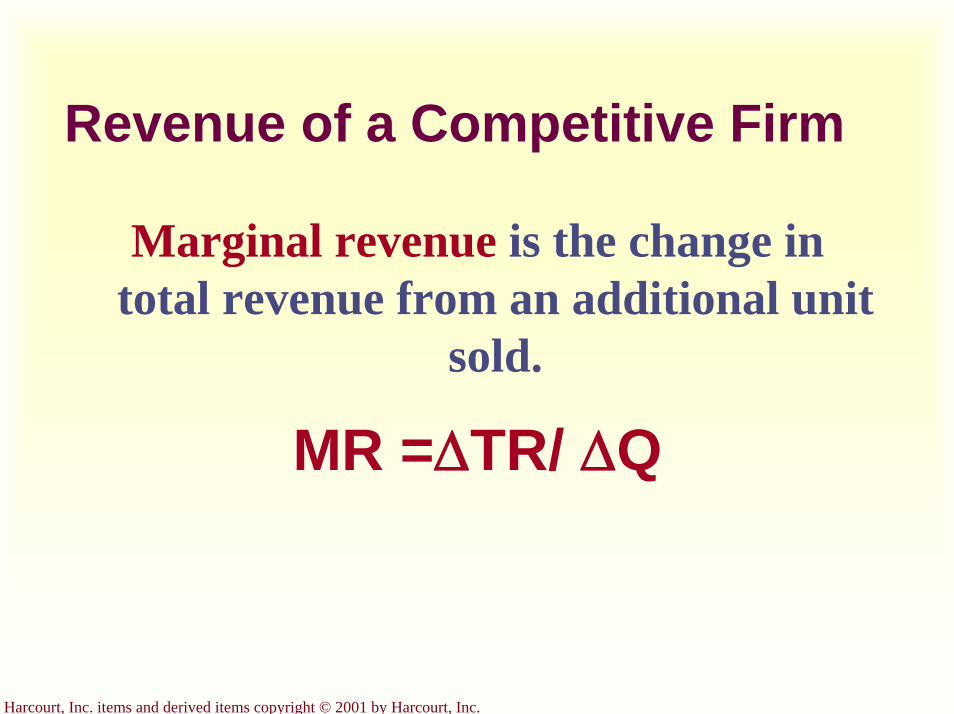
Harcourt, Inc. items and derived items copyright © 2001 by Harcourt, Inc.
Revenue of a Competitive Firm
Marginal revenue is the change in total revenue from an additional unit
sold.
MR =∆TR/ ∆Q
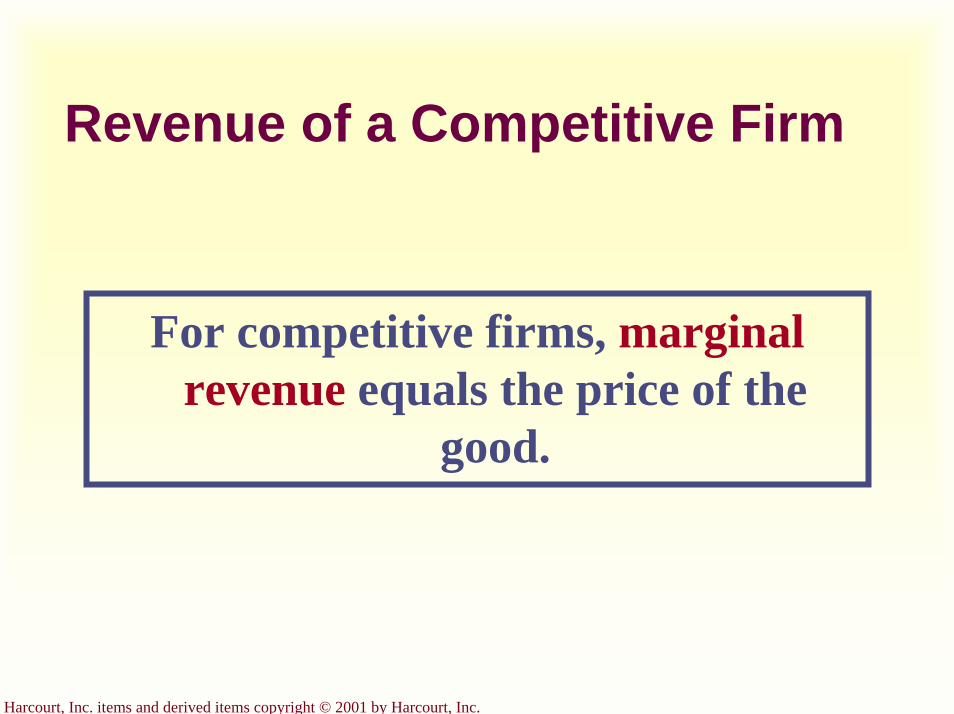
Harcourt, Inc. items and derived items copyright © 2001 by Harcourt, Inc.
Revenue of a Competitive Firm
For competitive firms, marginal revenue equals the price of the
good.
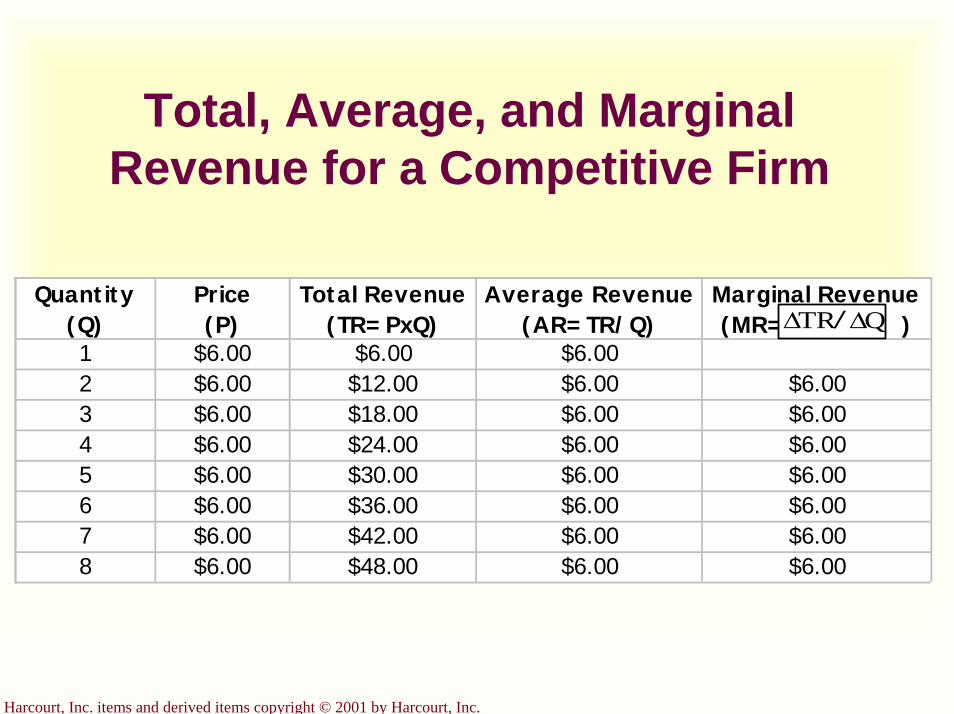
Harcourt, Inc. items and derived items copyright © 2001 by Harcourt, Inc.
Total, Average, and Marginal Revenue for a Competitive Firm
Quantity(Q)
Price(P)
Total Revenue(TR=PxQ)
Average Revenue(AR=TR/Q)
Marginal Revenue(MR= )
1 $6.00 $6.00 $6.002 $6.00 $12.00 $6.00 $6.003 $6.00 $18.00 $6.00 $6.004 $6.00 $24.00 $6.00 $6.005 $6.00 $30.00 $6.00 $6.006 $6.00 $36.00 $6.00 $6.007 $6.00 $42.00 $6.00 $6.008 $6.00 $48.00 $6.00 $6.00
QTR ∆∆ /
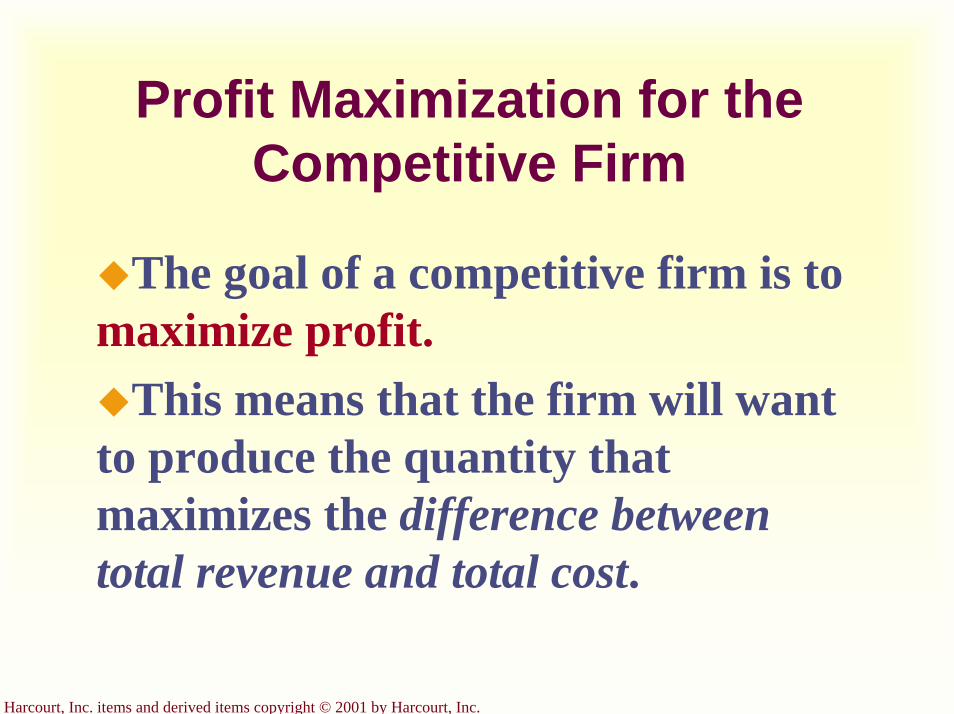
Harcourt, Inc. items and derived items copyright © 2001 by Harcourt, Inc.
Profit Maximization for the Competitive Firm
The goal of a competitive firm is to maximize profit.
This means that the firm will want to produce the quantity that maximizes the difference between total revenue and total cost.
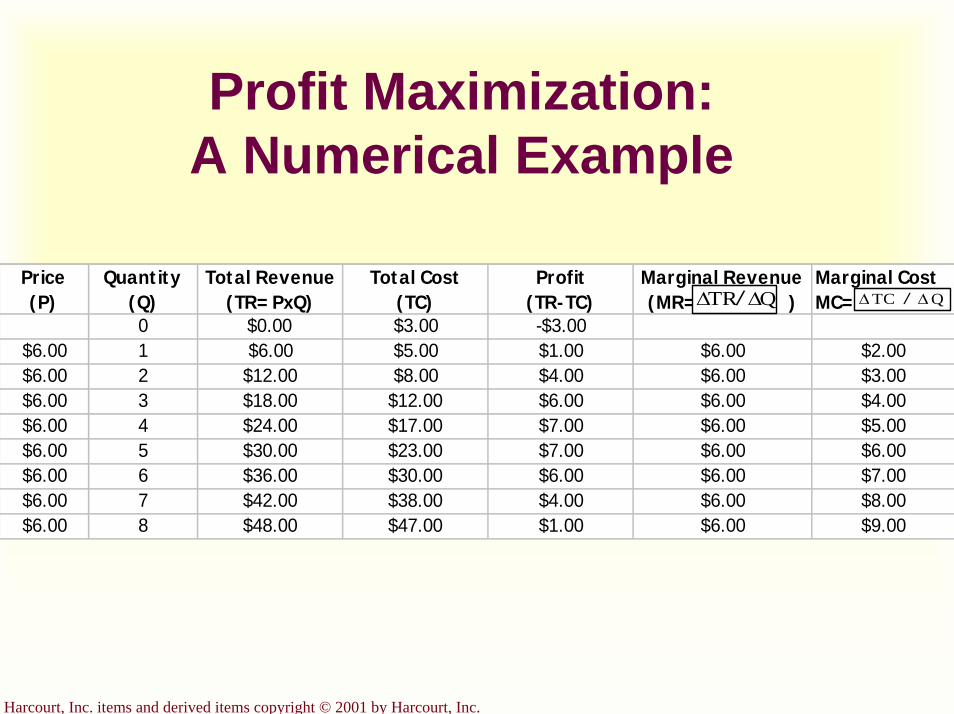
Harcourt, Inc. items and derived items copyright © 2001 by Harcourt, Inc.
Profit Maximization: A Numerical Example
Price(P)
Quantity(Q)
Total Revenue(TR=PxQ)
Total Cost(TC)
Profit(TR-TC)
Marginal Revenue(MR= )
Marginal CostMC=
0 $0.00 $3.00 -$3.00$6.00 1 $6.00 $5.00 $1.00 $6.00 $2.00$6.00 2 $12.00 $8.00 $4.00 $6.00 $3.00$6.00 3 $18.00 $12.00 $6.00 $6.00 $4.00$6.00 4 $24.00 $17.00 $7.00 $6.00 $5.00$6.00 5 $30.00 $23.00 $7.00 $6.00 $6.00$6.00 6 $36.00 $30.00 $6.00 $6.00 $7.00$6.00 7 $42.00 $38.00 $4.00 $6.00 $8.00$6.00 8 $48.00 $47.00 $1.00 $6.00 $9.00
QTR ∆∆ / QTC ∆∆ /

Harcourt, Inc. items and derived items copyright © 2001 by Harcourt, Inc.
Profit Maximization for the Competitive Firm...
P = AR = MRP=MR1
MC
Quantity0
Costsand
Revenue
ATC
AVC
QMAX
The firm maximizes profit by producing the quantity at which marginal cost equals marginal revenue.
MC1
Q1
MC2
Q2
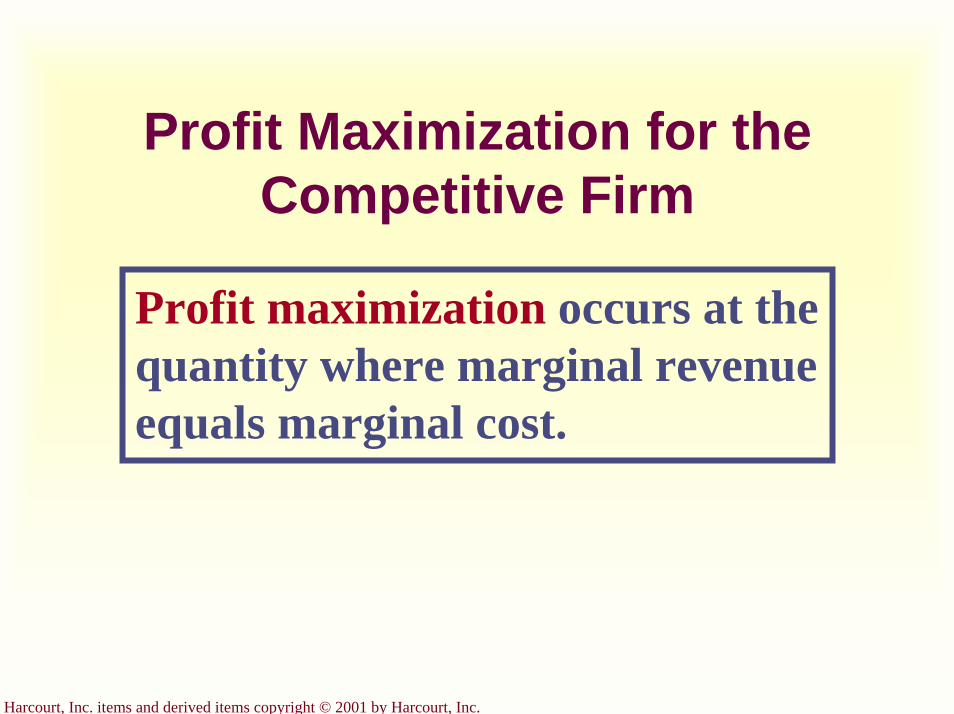
Harcourt, Inc. items and derived items copyright © 2001 by Harcourt, Inc.
Profit Maximization for the Competitive Firm
Profit maximization occurs at the quantity where marginal revenue equals marginal cost.
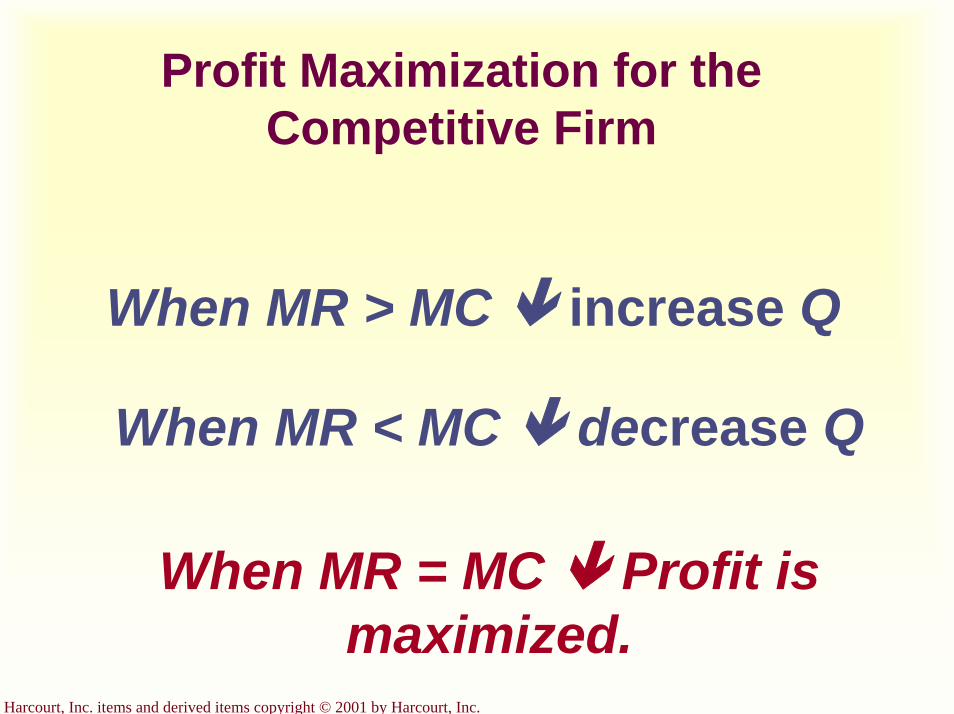
Harcourt, Inc. items and derived items copyright © 2001 by Harcourt, Inc.
Profit Maximization for the Competitive Firm
When MR > MC increase Q
When MR < MC decrease Q
When MR = MC Profit is maximized.
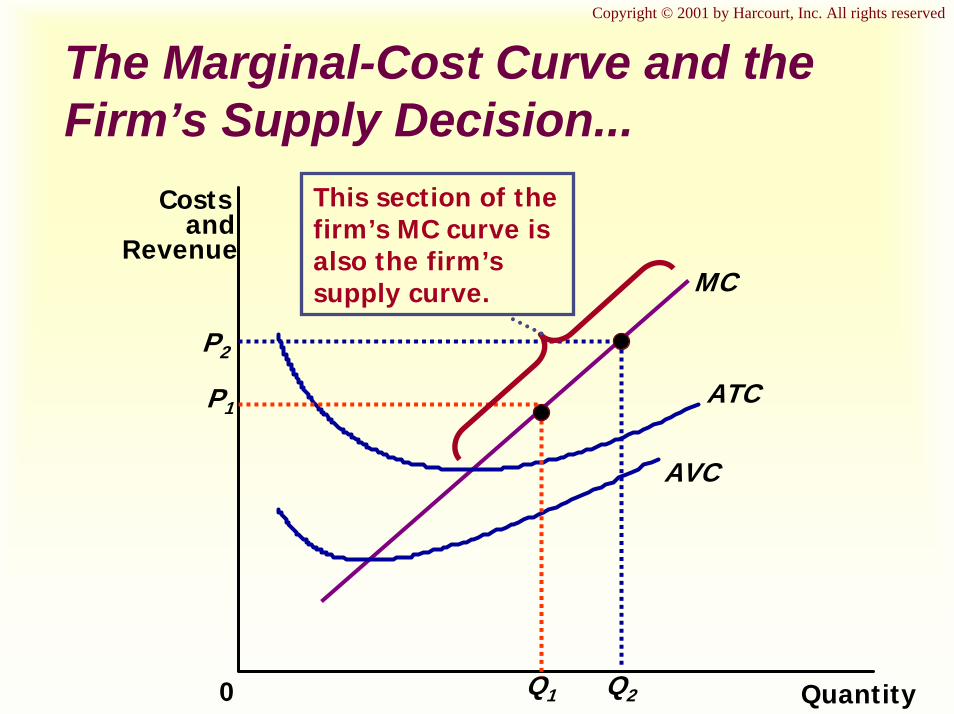
Copyright © 2001 by Harcourt, Inc. All rights reserved
The Marginal-Cost Curve and the Firm’s Supply Decision...
Quantity0
Costsand
RevenueMC
ATC
AVC
Q1
P1
P2
Q2
This section of the firm’s MC curve is also the firm’s supply curve.
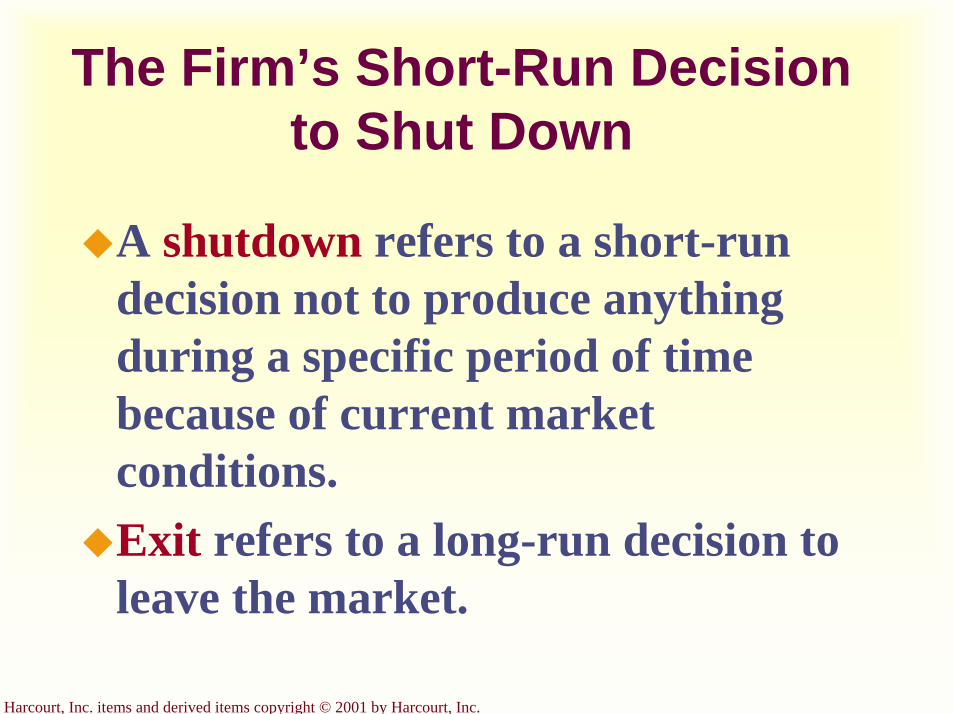
Harcourt, Inc. items and derived items copyright © 2001 by Harcourt, Inc.
The Firm’s Short-Run Decision to Shut Down
A shutdown refers to a short-run decision not to produce anything during a specific period of time because of current market conditions.Exit refers to a long-run decision to leave the market.
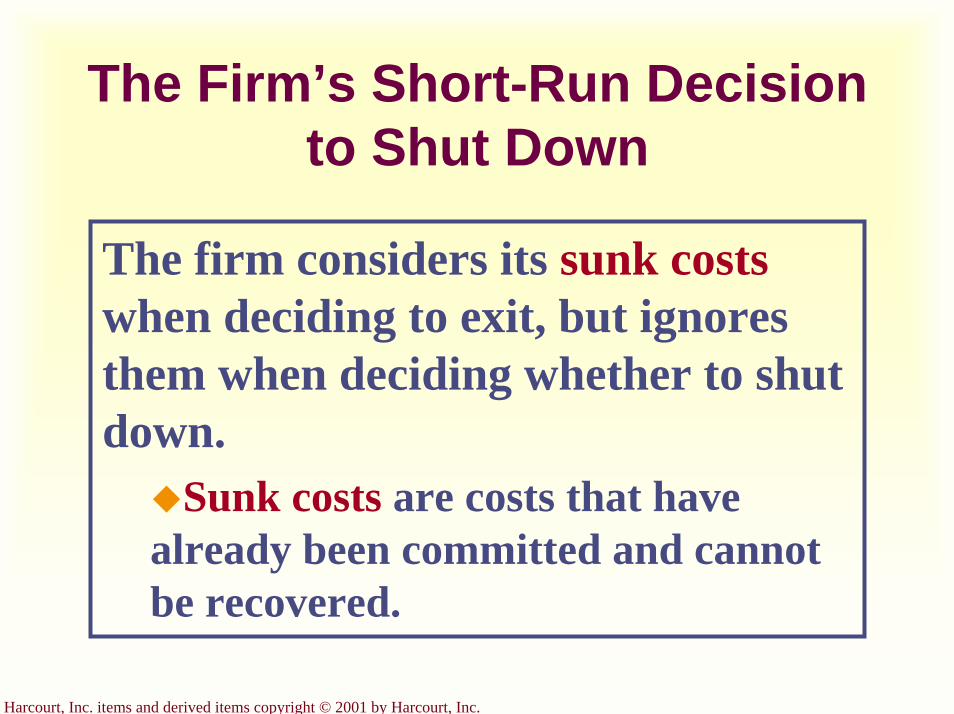
Harcourt, Inc. items and derived items copyright © 2001 by Harcourt, Inc.
The Firm’s Short-Run Decision to Shut Down
The firm considers its sunk costswhen deciding to exit, but ignores them when deciding whether to shut down.
Sunk costs are costs that have already been committed and cannot be recovered.
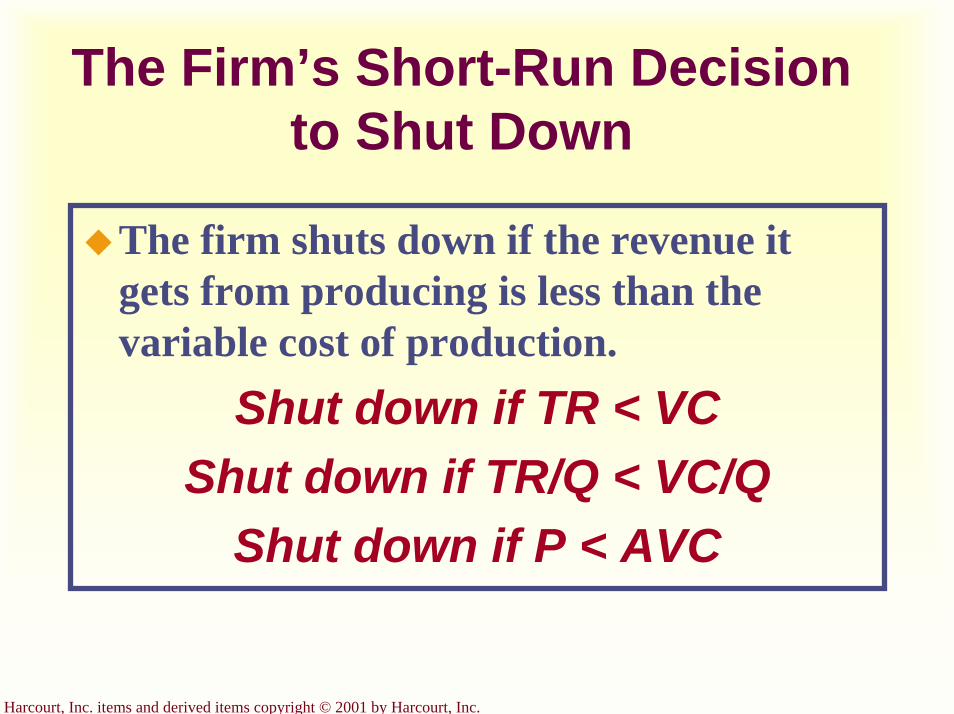
Harcourt, Inc. items and derived items copyright © 2001 by Harcourt, Inc.
The Firm’s Short-Run Decision to Shut Down
The firm shuts down if the revenue it gets from producing is less than the variable cost of production.
Shut down if TR < VCShut down if TR/Q < VC/Q
Shut down if P < AVC
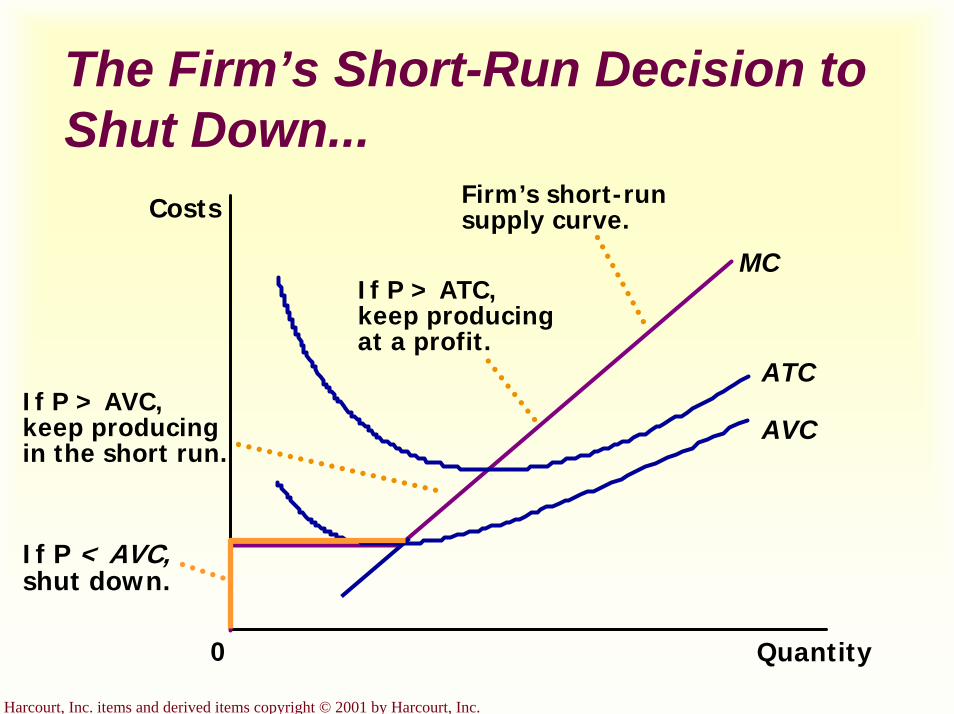
Harcourt, Inc. items and derived items copyright © 2001 by Harcourt, Inc.
The Firm’s Short-Run Decision to Shut Down...
Quantity
ATC
AVC
0
Costs
MC
If P < AVC,shut down.
If P > AVC, keep producing in the short run.
If P > ATC, keep producing at a profit.
Firm’s short-run supply curve.
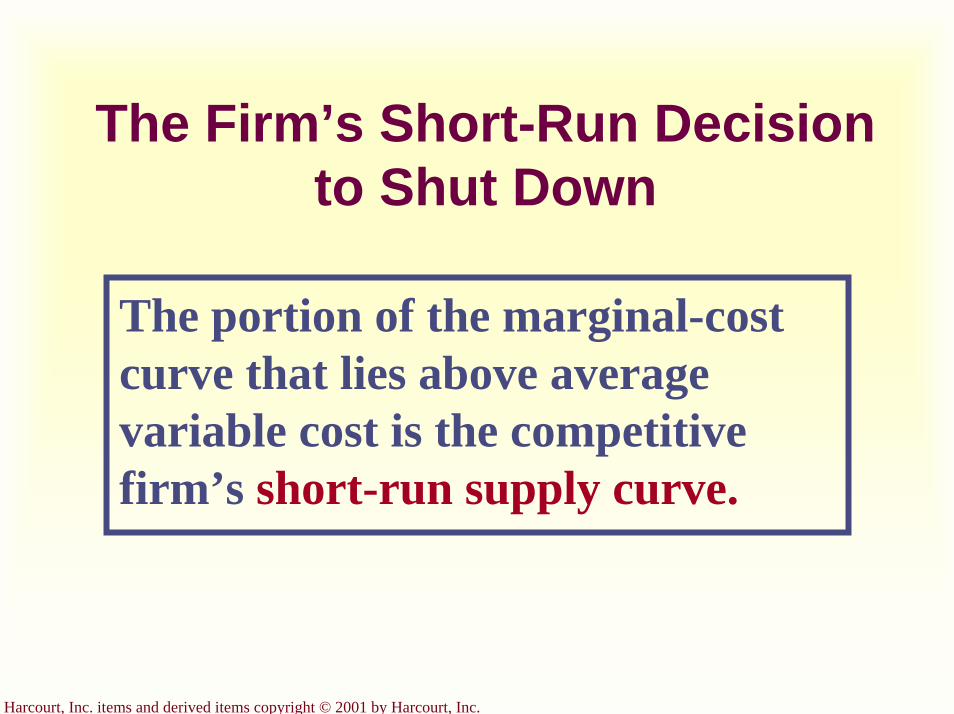
Harcourt, Inc. items and derived items copyright © 2001 by Harcourt, Inc.
The Firm’s Short-Run Decision to Shut Down
The portion of the marginal-cost curve that lies above average variable cost is the competitive firm’s short-run supply curve.
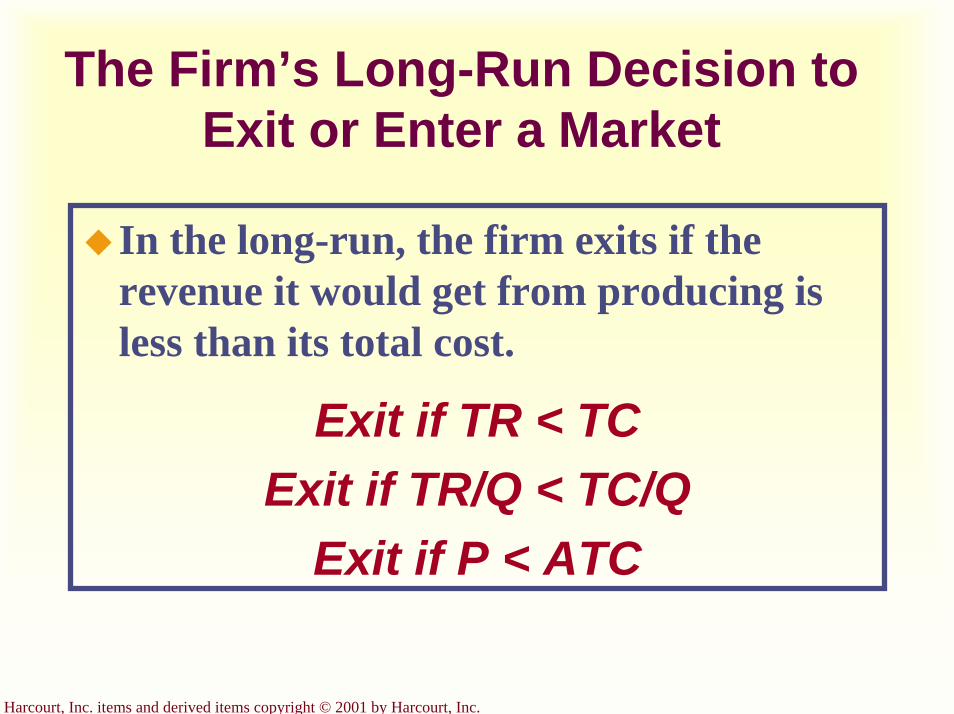
Harcourt, Inc. items and derived items copyright © 2001 by Harcourt, Inc.
The Firm’s Long-Run Decision to Exit or Enter a Market
In the long-run, the firm exits if the revenue it would get from producing is less than its total cost.
Exit if TR < TCExit if TR/Q < TC/Q
Exit if P < ATC
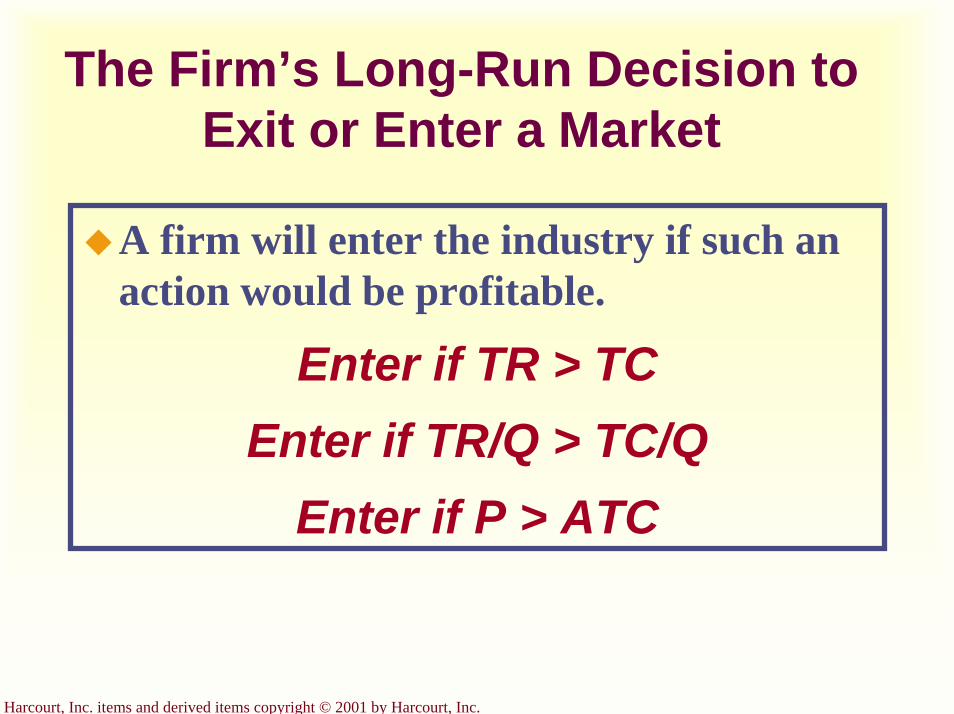
Harcourt, Inc. items and derived items copyright © 2001 by Harcourt, Inc.
The Firm’s Long-Run Decision to Exit or Enter a Market
A firm will enter the industry if such an action would be profitable.
Enter if TR > TCEnter if TR/Q > TC/Q
Enter if P > ATC
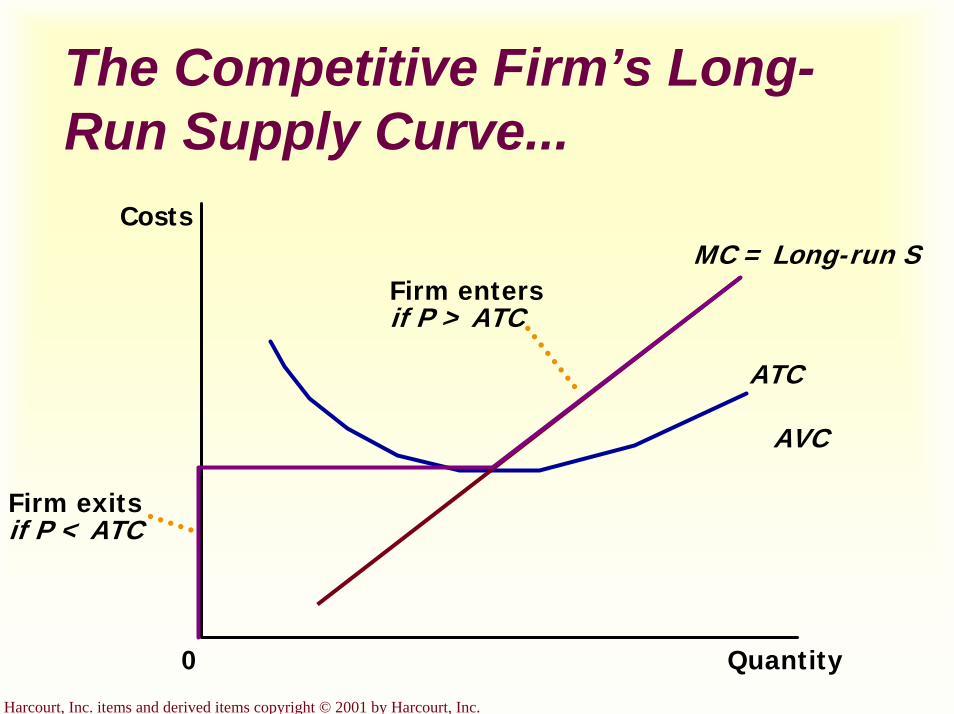
Harcourt, Inc. items and derived items copyright © 2001 by Harcourt, Inc.
The Competitive Firm’s Long-Run Supply Curve...
Quantity
MC = Long-run S
ATC
AVC
0
Costs
Firm enters if P > ATC
Firm exitsif P < ATC
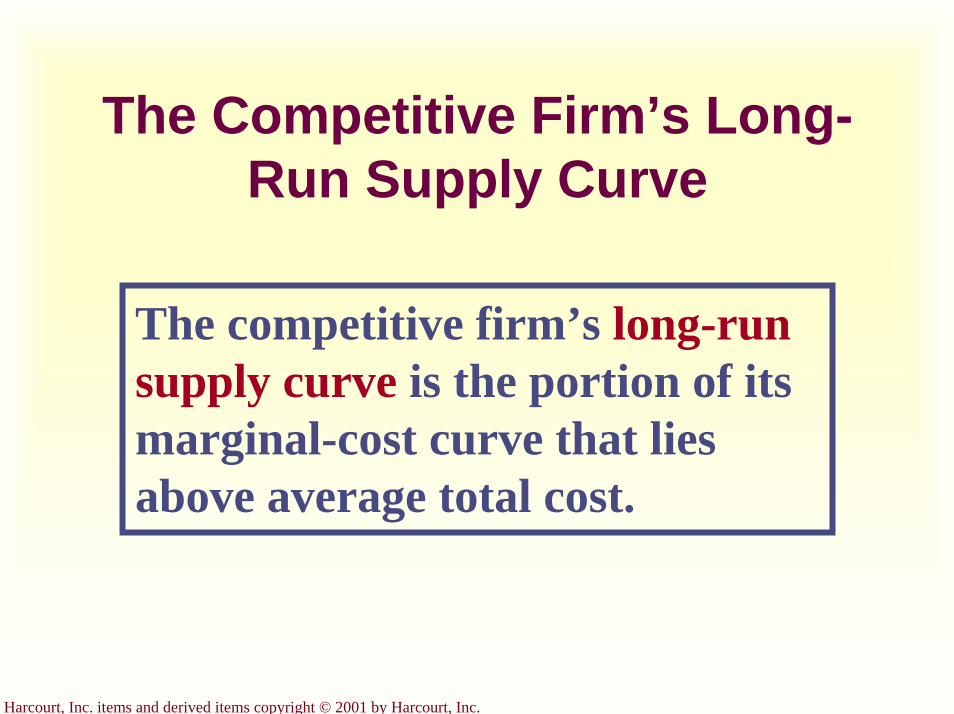
Harcourt, Inc. items and derived items copyright © 2001 by Harcourt, Inc.
The Competitive Firm’s Long-Run Supply Curve
The competitive firm’s long-run supply curve is the portion of its marginal-cost curve that lies above average total cost.

Harcourt, Inc. items and derived items copyright © 2001 by Harcourt, Inc.
The Competitive Firm’s Long-Run Supply Curve...
Quantity
MC
ATC
AVC
0
Costs
Firm’s long-run supply curve
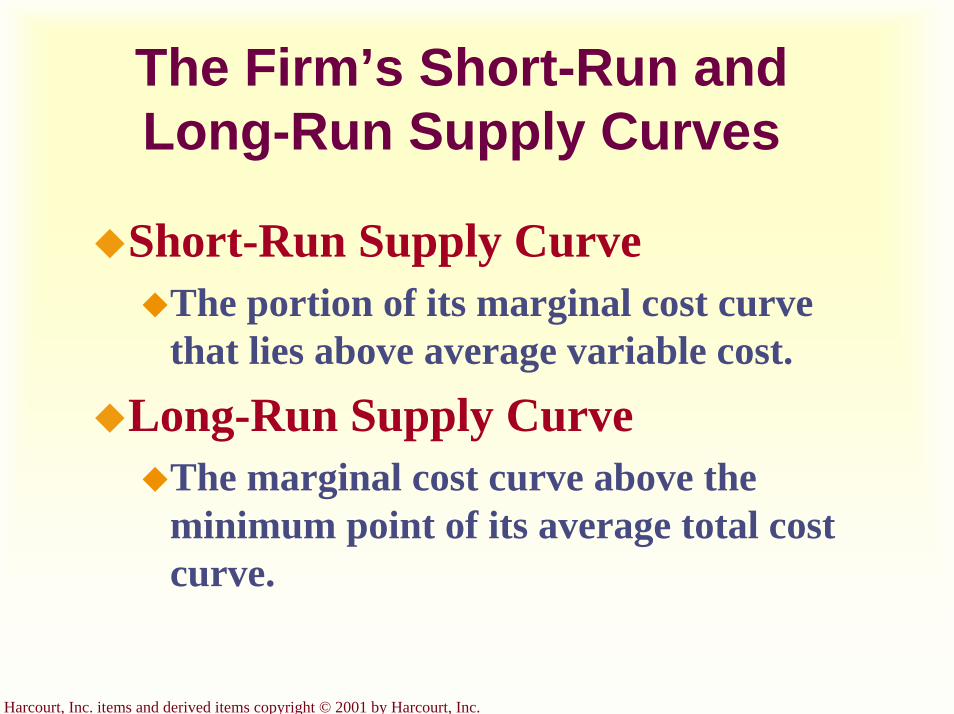
Harcourt, Inc. items and derived items copyright © 2001 by Harcourt, Inc.
The Firm’s Short-Run and Long-Run Supply Curves
Short-Run Supply CurveThe portion of its marginal cost curve that lies above average variable cost.
Long-Run Supply CurveThe marginal cost curve above the minimum point of its average total cost curve.

Harcourt, Inc. items and derived items copyright © 2001 by Harcourt, Inc.
Measuring Profit in the Graph for the Competitive Firm...
Profit
Q Quantity0
Price
P = AR = MR
ATCMC
P
ATC
a. A Firm with Profits
Profit-maximizing quantity
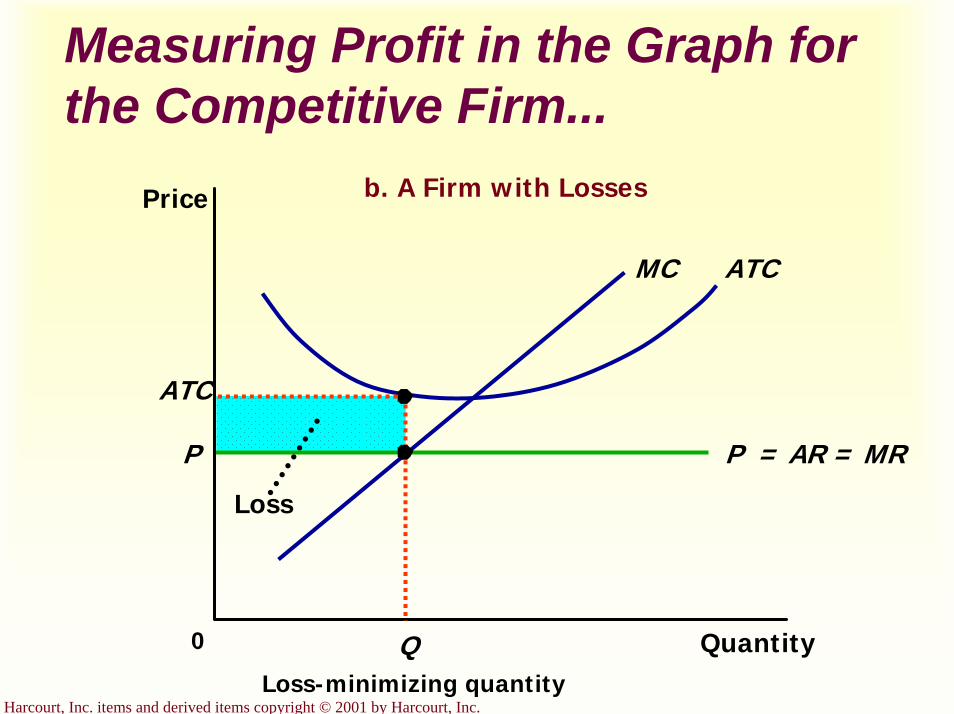
Harcourt, Inc. items and derived items copyright © 2001 by Harcourt, Inc.
Measuring Profit in the Graph for the Competitive Firm...
Loss
Quantity0
Price
P = AR = MR
ATCMC
P
Q
ATC
b. A Firm with Losses
Loss-minimizing quantity
Harcourt, Inc. items and derived items copyright © 2001 by Harcourt, Inc.
Supply in a Competitive Market
Market supply equals the sum of the quantities supplied by the individual firms in the market.
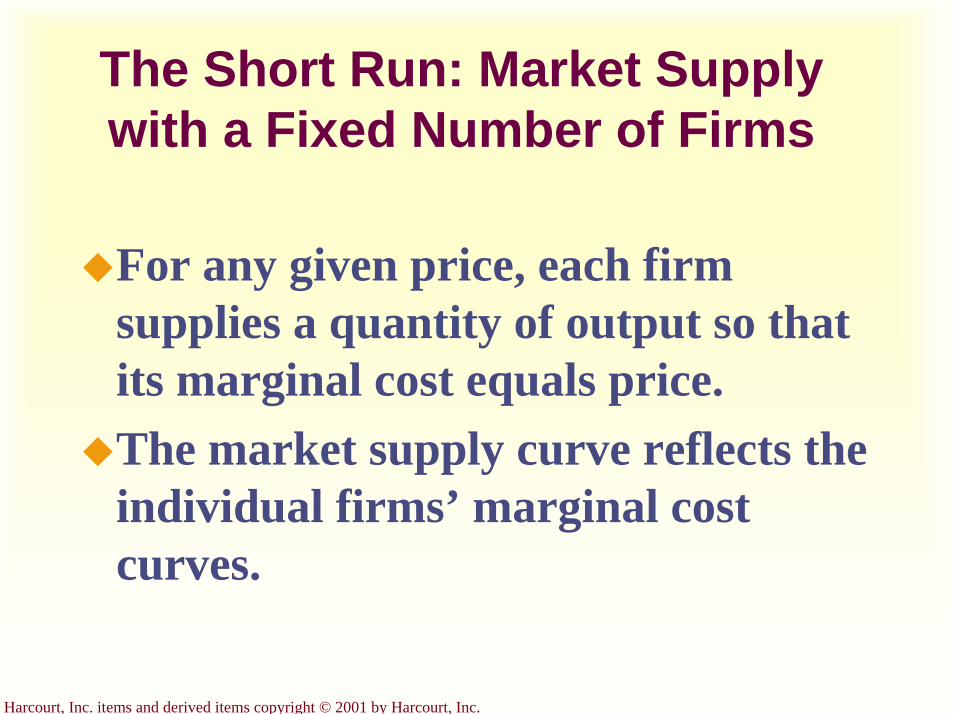
Harcourt, Inc. items and derived items copyright © 2001 by Harcourt, Inc.
The Short Run: Market Supply with a Fixed Number of Firms
For any given price, each firm supplies a quantity of output so that its marginal cost equals price. The market supply curve reflects the individual firms’ marginal cost curves.
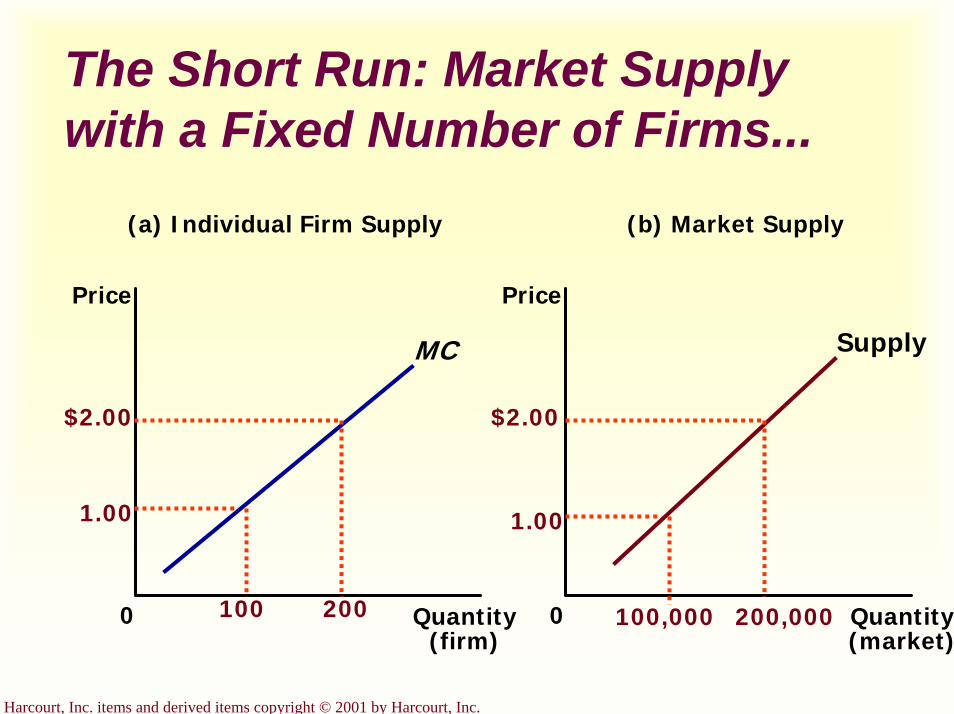
Harcourt, Inc. items and derived items copyright © 2001 by Harcourt, Inc.
The Short Run: Market Supply with a Fixed Number of Firms...
(a) Individual Firm Supply (b) Market Supply
Quantity(firm)
0
Price
Quantity(market)
Price
0
SupplyMC
1.00
$2.00
100 200
1.00
$2.00
100,000 200,000
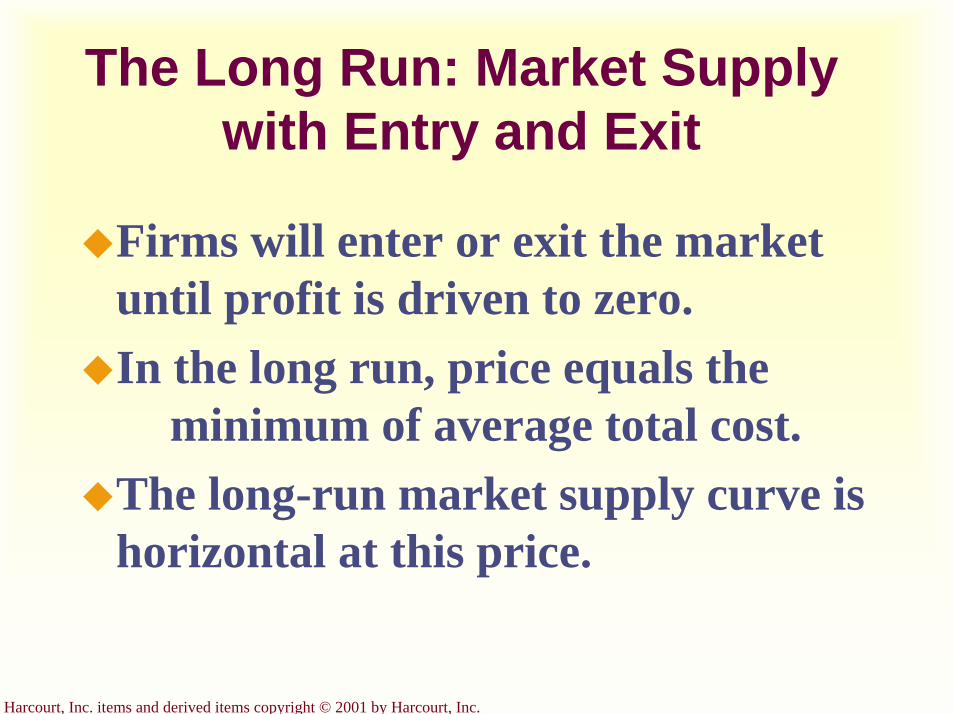
Harcourt, Inc. items and derived items copyright © 2001 by Harcourt, Inc.
The Long Run: Market Supply with Entry and Exit
Firms will enter or exit the market until profit is driven to zero.In the long run, price equals the
minimum of average total cost.The long-run market supply curve is horizontal at this price.

Harcourt, Inc. items and derived items copyright © 2001 by Harcourt, Inc.
The Long Run: Market Supply with Entry and Exit...
(a) Firm’s Zero-Profit Condition (b) Market Supply
Quantity(firm)
0
Price
P =minimum
ATC
Quantity(market)
Price
0
Supply
MCATC
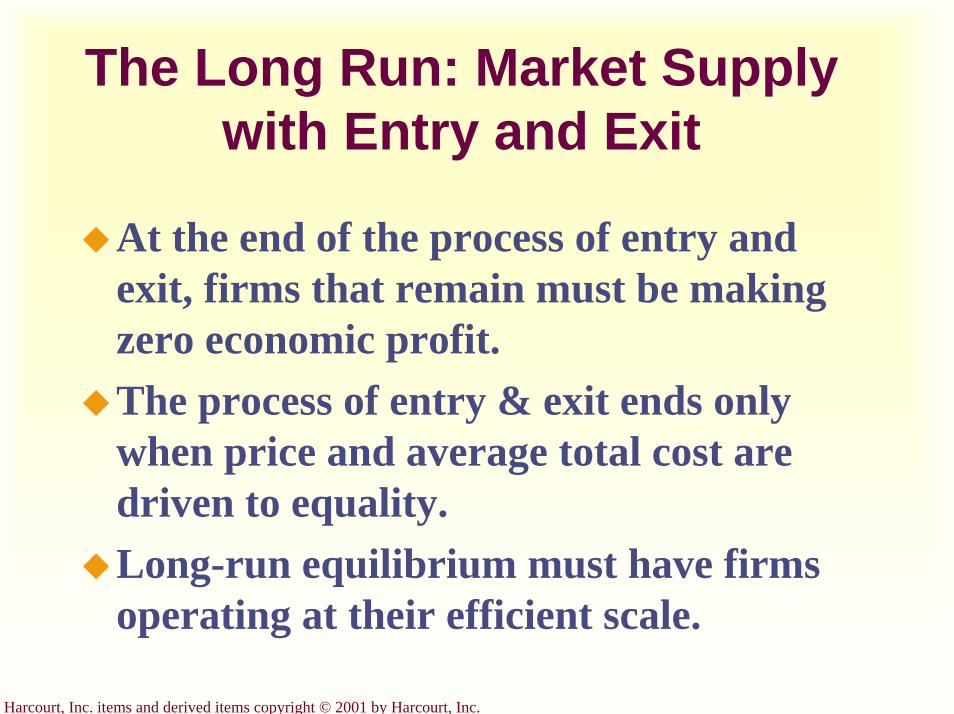
Harcourt, Inc. items and derived items copyright © 2001 by Harcourt, Inc.
The Long Run: Market Supply with Entry and Exit
At the end of the process of entry and exit, firms that remain must be making zero economic profit.The process of entry & exit ends only when price and average total cost are driven to equality.Long-run equilibrium must have firms operating at their efficient scale.
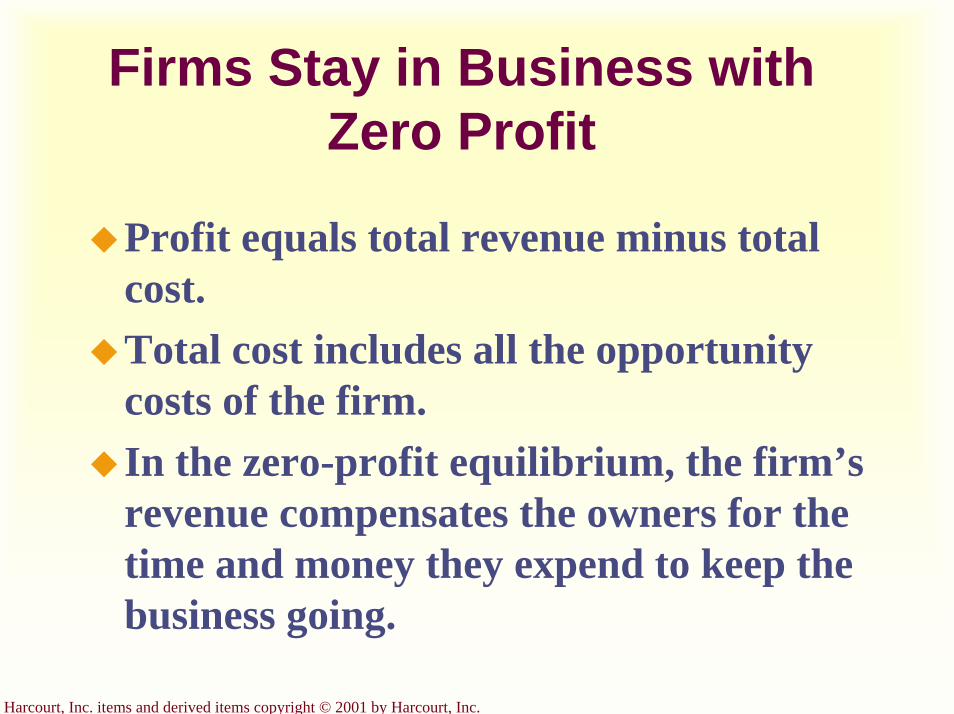
Harcourt, Inc. items and derived items copyright © 2001 by Harcourt, Inc.
Firms Stay in Business with Zero Profit
Profit equals total revenue minus total cost.Total cost includes all the opportunity costs of the firm.In the zero-profit equilibrium, the firm’s revenue compensates the owners for the time and money they expend to keep the business going.
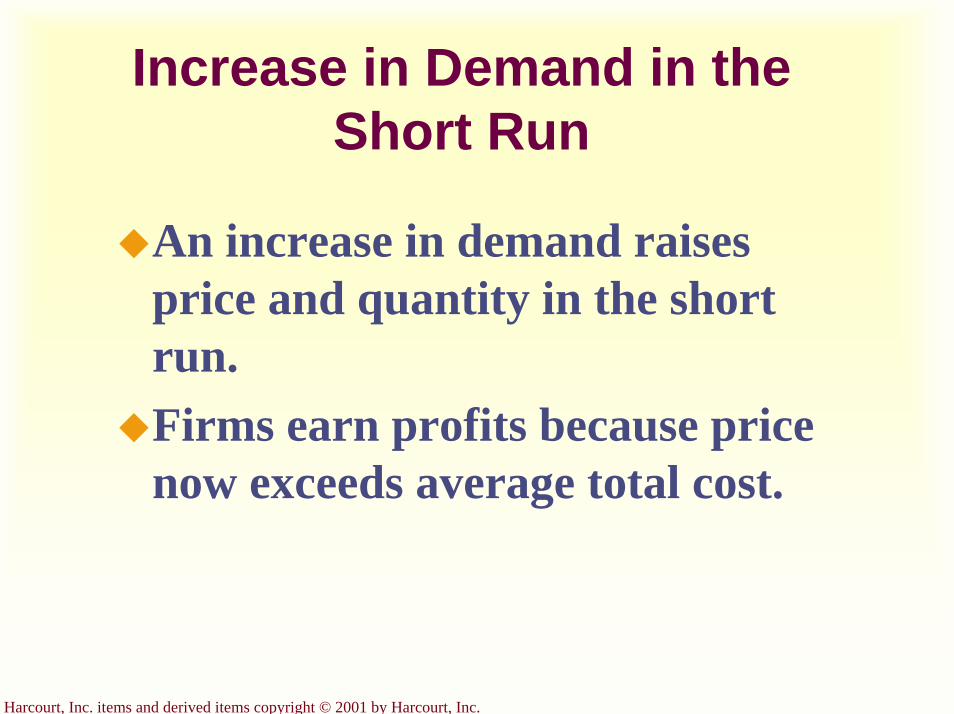
Harcourt, Inc. items and derived items copyright © 2001 by Harcourt, Inc.
Increase in Demand in the Short Run
An increase in demand raises price and quantity in the short run.Firms earn profits because price now exceeds average total cost.
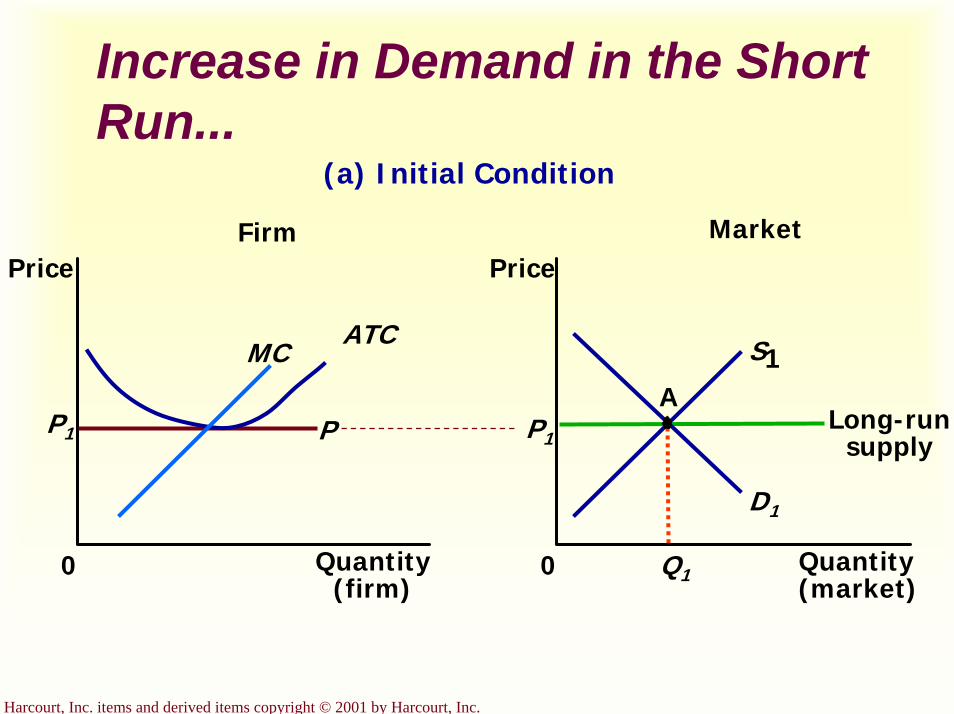
Harcourt, Inc. items and derived items copyright © 2001 by Harcourt, Inc.
Increase in Demand in the Short Run...
(a) Initial Condition
MarketFirm
Quantity(firm)
0
Price
MCATC
P1
Quantity(market)
Price
0
D1
P1
Q1
A
S1
Long-runsupplyP

Harcourt, Inc. items and derived items copyright © 2001 by Harcourt, Inc.
Increase in Demand in the Short Run...
(b) Short-Run Response
D2
MarketFirm
Quantity(firm)
0
Price
MC ATC
P1
Quantity(market)
Price
0
D1
P1
Q1
A
S1
Long-runsupply
Q2
BP2
P2
Profit

Harcourt, Inc. items and derived items copyright © 2001 by Harcourt, Inc.
Increase in Demand in the Short Run...
(c) Long-Run Response
MarketFirm
Quantity(firm)
0
Price
MC ATC
P1
Quantity(market)
Price
0
D1
P1
Q1
A
S1
Long-runsupply
D2
B
Q2
P2
S2
C
Q3
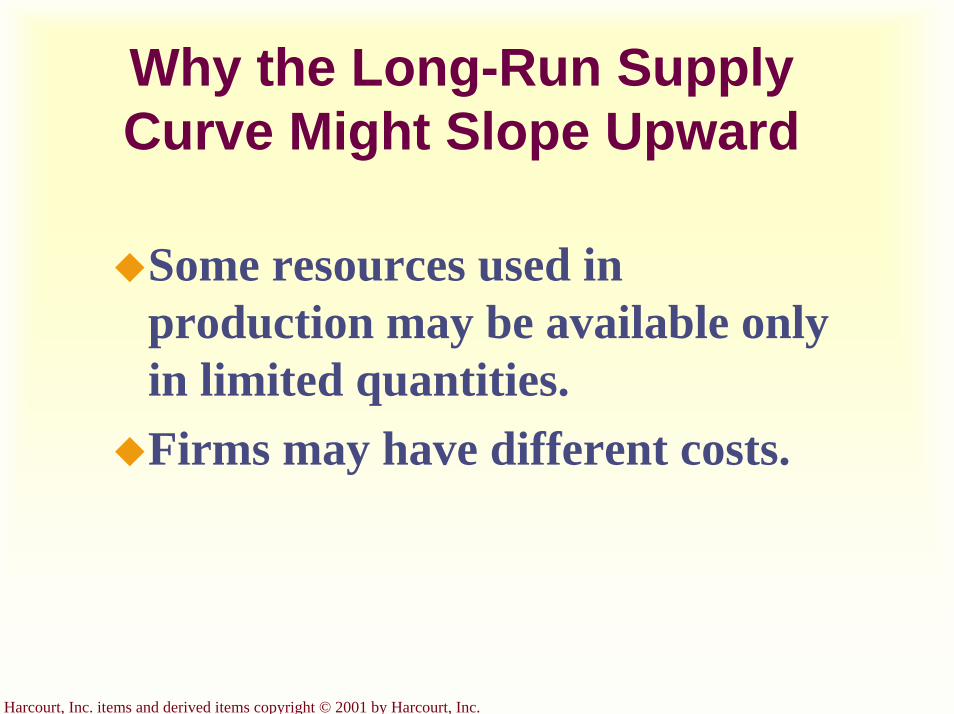
Harcourt, Inc. items and derived items copyright © 2001 by Harcourt, Inc.
Why the Long-Run Supply Curve Might Slope Upward
Some resources used in production may be available only in limited quantities.Firms may have different costs.
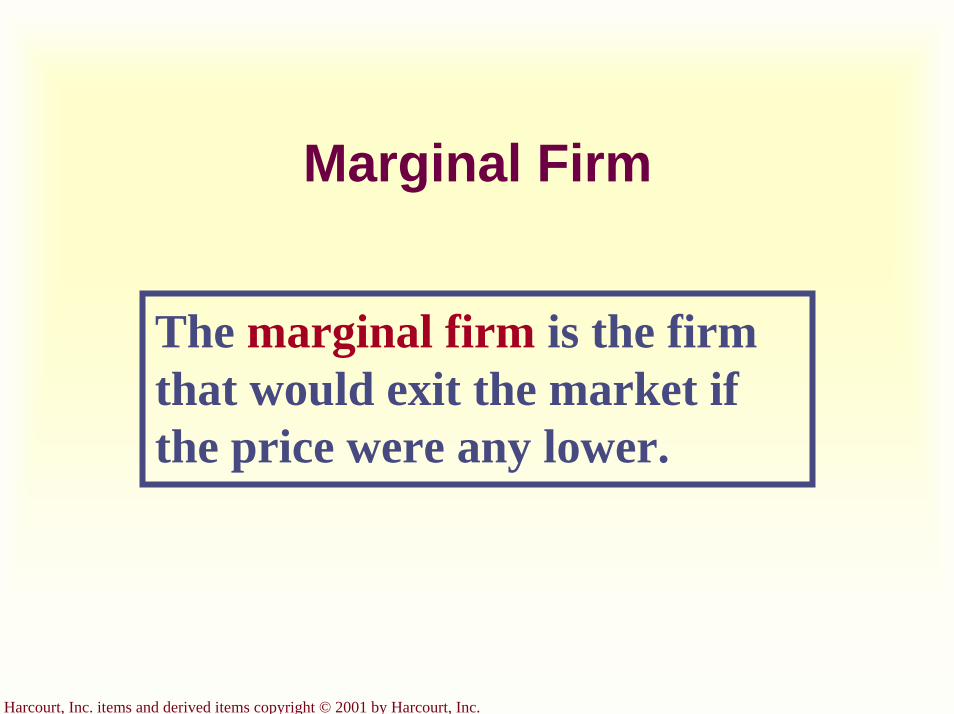
Harcourt, Inc. items and derived items copyright © 2001 by Harcourt, Inc.
Marginal Firm
The marginal firm is the firm that would exit the market if the price were any lower.
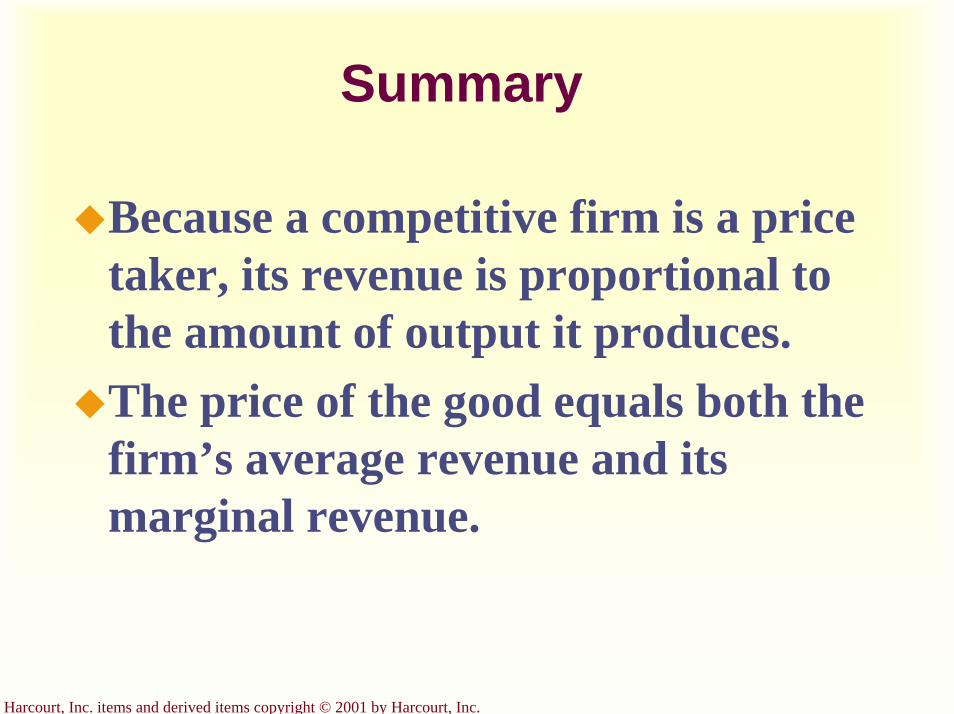
Harcourt, Inc. items and derived items copyright © 2001 by Harcourt, Inc.
Summary
Because a competitive firm is a price taker, its revenue is proportional to the amount of output it produces.The price of the good equals both the firm’s average revenue and its marginal revenue.
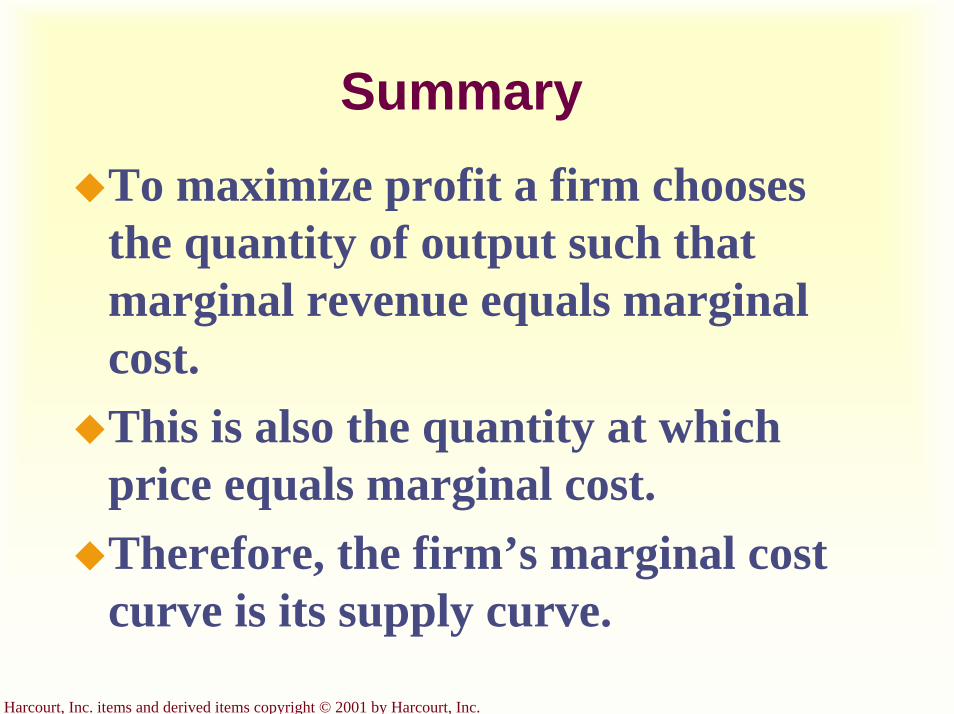
Harcourt, Inc. items and derived items copyright © 2001 by Harcourt, Inc.
SummaryTo maximize profit a firm chooses the quantity of output such that marginal revenue equals marginal cost.This is also the quantity at which price equals marginal cost.Therefore, the firm’s marginal cost curve is its supply curve.
Harcourt, Inc. items and derived items copyright © 2001 by Harcourt, Inc.
SummaryIn the short run when a firm cannot recover its fixed costs, the firm will choose to shut down temporarily if the price of the good is less than average variable cost.In the long run when the firm can recover both fixed and variable costs, it will choose to exit if the price is less than average total cost.
Harcourt, Inc. items and derived items copyright © 2001 by Harcourt, Inc.
SummaryIn a market with free entry and exit, profits are driven to zero in the long run and all firms produce at the efficient scale.Changes in demand have different effects over different time horizons.

Harcourt, Inc. items and derived items copyright © 2001 by Harcourt, Inc.
Graphical Review
Harcourt, Inc. items and derived items copyright © 2001 by Harcourt, Inc.
Profit Maximization for the Competitive Firm...
P = AR = MRP=MR1
MC
Quantity0
Costsand
Revenue
ATC
AVC
QMAX
The firm maximizes profit by producing the quantity at which marginal cost equals marginal revenue.
MC1
Q1
MC2
Q2
Harcourt, Inc. items and derived items copyright © 2001 by Harcourt, Inc.
The Marginal-Cost Curve and the Firm’s Supply Decision...
Quantity0
Costsand
RevenueMC
ATC
AVC
Q1
P1
P2
Q2
This section of the firm’s MC curve is also the firm’s supply curve.
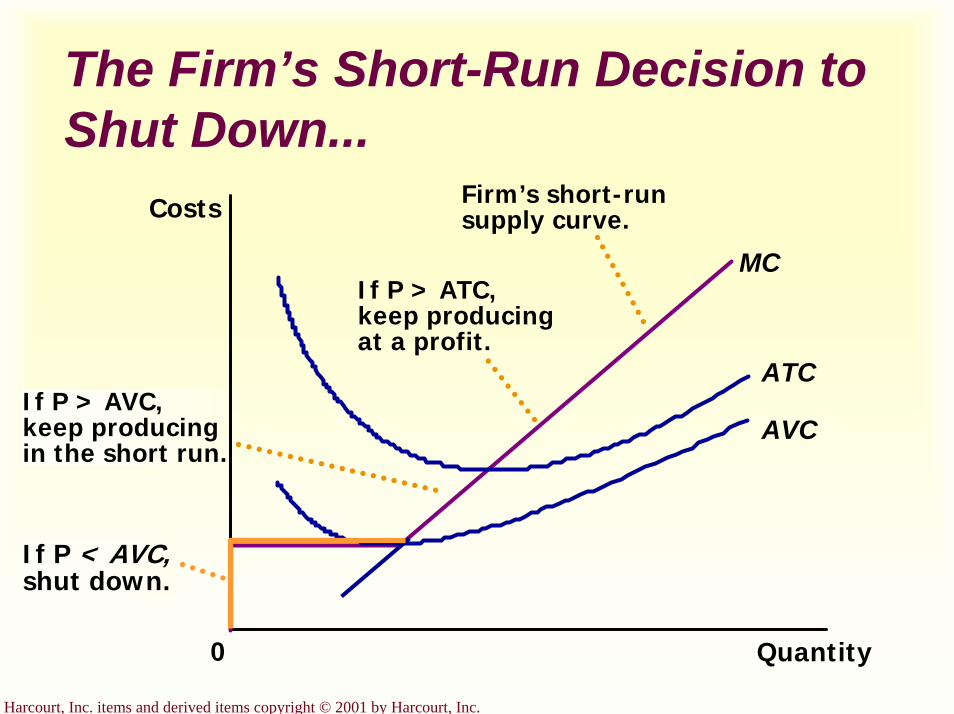
Harcourt, Inc. items and derived items copyright © 2001 by Harcourt, Inc.
The Firm’s Short-Run Decision to Shut Down...
Quantity
ATC
AVC
0
Costs
MC
If P < AVC,shut down.
If P > AVC, keep producing in the short run.
If P > ATC, keep producing at a profit.
Firm’s short-run supply curve.

Harcourt, Inc. items and derived items copyright © 2001 by Harcourt, Inc.
The Competitive Firm’s Long-Run Supply Curve...
Quantity
MC = Long-run S
ATC
AVC
0
Costs
Firm enters if P > ATC
Firm exitsif P < ATC
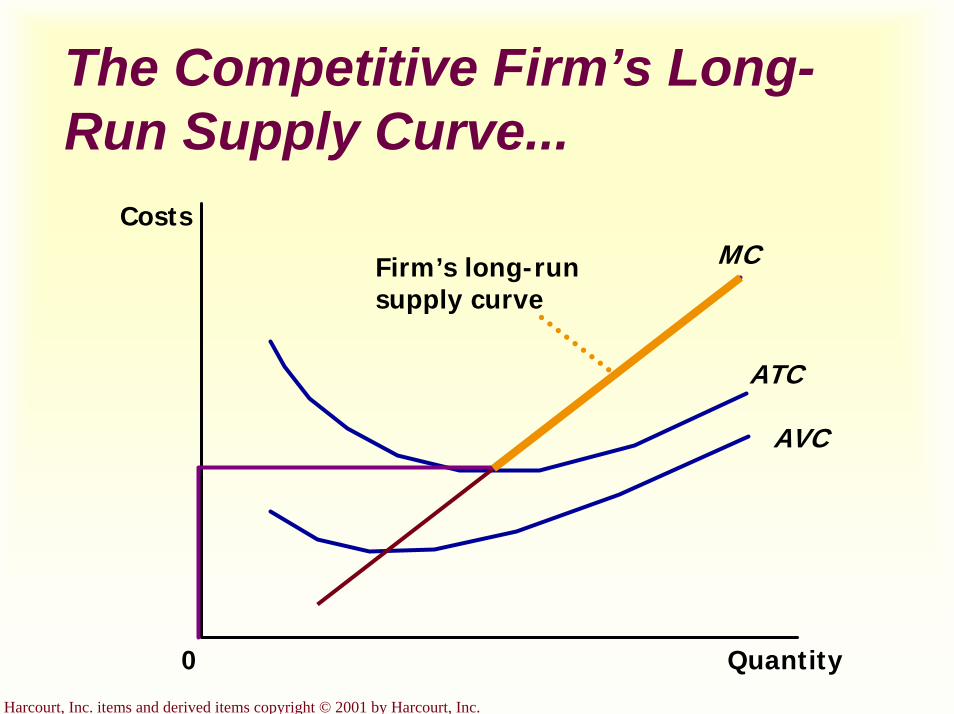
Harcourt, Inc. items and derived items copyright © 2001 by Harcourt, Inc.
The Competitive Firm’s Long-Run Supply Curve...
Quantity
MC
ATC
AVC
0
Costs
Firm’s long-run supply curve
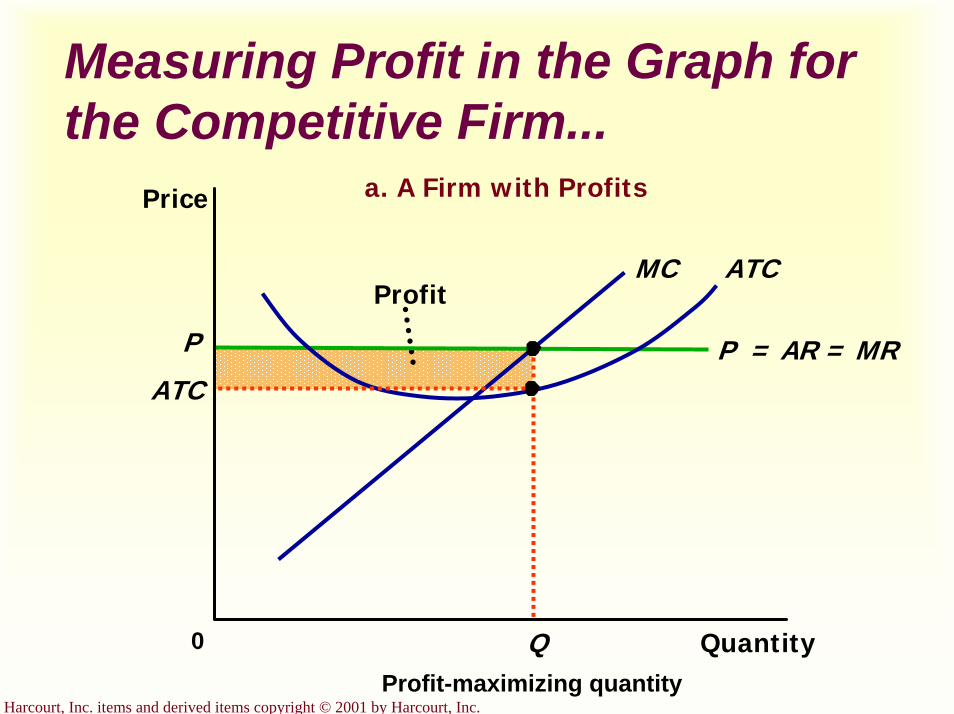
Harcourt, Inc. items and derived items copyright © 2001 by Harcourt, Inc.
Measuring Profit in the Graph for the Competitive Firm...
Profit
Q Quantity0
Price
P = AR = MR
ATCMC
P
ATC
Profit-maximizing quantity
a. A Firm with Profits

Harcourt, Inc. items and derived items copyright © 2001 by Harcourt, Inc.
Measuring Profit in the Graph for the Competitive Firm...
Loss
Quantity0
Price
P = AR = MR
ATCMC
P
QLoss-minimizing quantity
ATC
b. A Firm with Losses

Harcourt, Inc. items and derived items copyright © 2001 by Harcourt, Inc.
The Short Run: Market Supply with a Fixed Number of Firms...
(a) Individual Firm Supply
Quantity(firm)
0
Price
(b) Market Supply
Quantity(market)
Price
0
SupplyMC
1.00
$2.00
100 200
1.00
$2.00
100,000 200,000
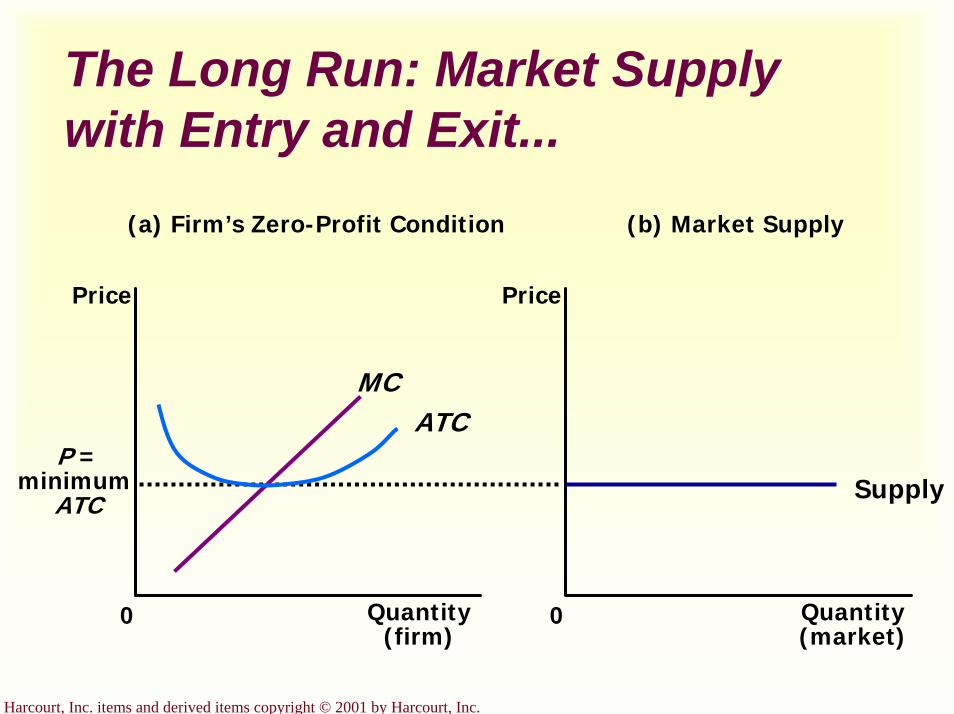
Harcourt, Inc. items and derived items copyright © 2001 by Harcourt, Inc.
The Long Run: Market Supply with Entry and Exit...
(a) Firm’s Zero-Profit Condition
Quantity(firm)
0
Price
P =minimum
ATC
(b) Market Supply
Quantity(market)
Price
0
Supply
MCATC

Harcourt, Inc. items and derived items copyright © 2001 by Harcourt, Inc.
Increase in Demand in the Short Run...
MarketFirm
Quantity(firm)
0
Price
MCATC
P1
Quantity(market)
Price
0
D1
P1
Q1
A
S1
Long-runsupply
(a) Initial Condition
P
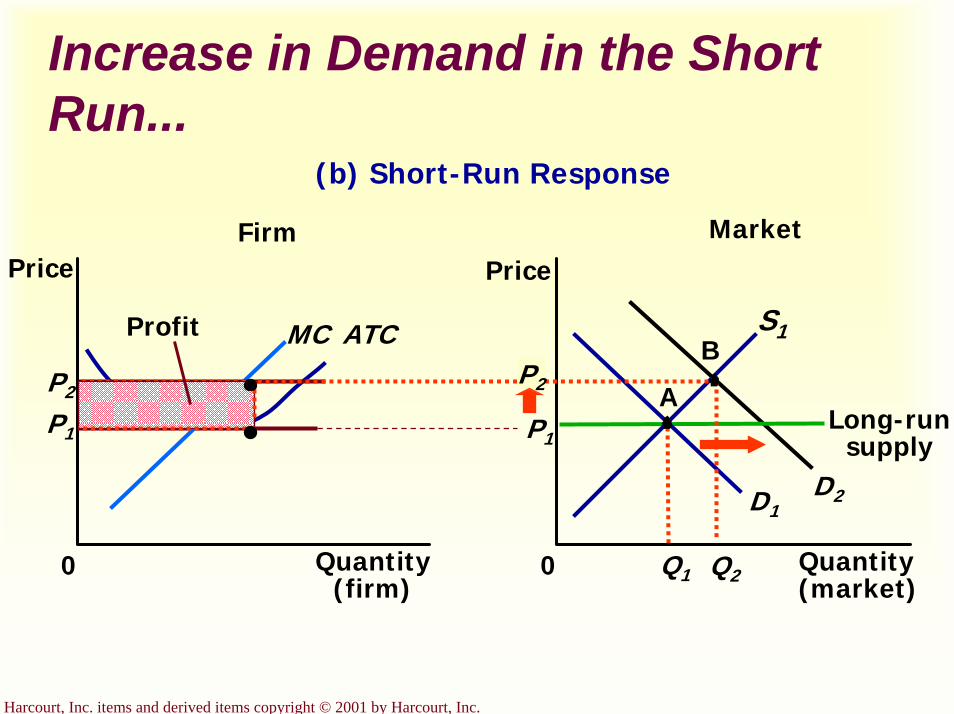
Harcourt, Inc. items and derived items copyright © 2001 by Harcourt, Inc.
Increase in Demand in the Short Run...
D2
MarketFirm
Quantity(firm)
0
Price
MC ATC
P1
Quantity(market)
Price
0
D1
P1
Q1
A
S1
Long-runsupply
(b) Short-Run Response
Q2
BP2
P2
Profit
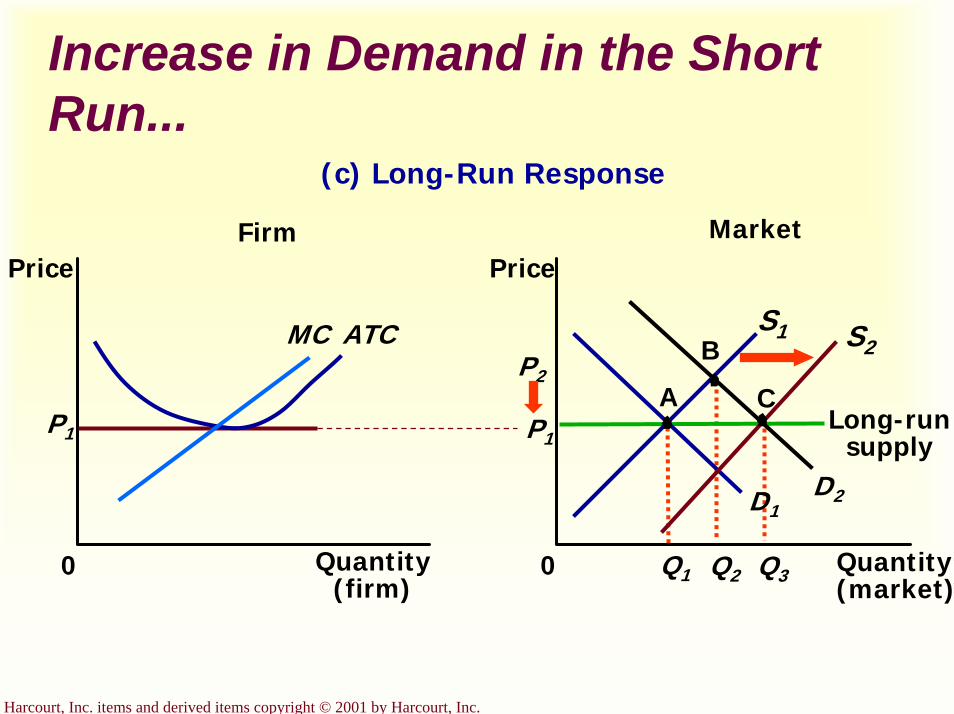
Harcourt, Inc. items and derived items copyright © 2001 by Harcourt, Inc.
Increase in Demand in the Short Run...
MarketFirm
Quantity(firm)
0
Price
MC ATC
P1
Quantity(market)
Price
0
D1
P1
Q1
A
S1
Long-runsupply
(c) Long-Run Response
D2
B
Q2
P2
S2
C
Q3
Monopoly
Chapter 15
Copyright © 2001 by Harcourt, Inc.
All rights reserved. Requests for permission to make copies of any part of thework should be mailed to:
Permissions Department, Harcourt College Publishers,6277 Sea Harbor Drive, Orlando, Florida 32887-6777.
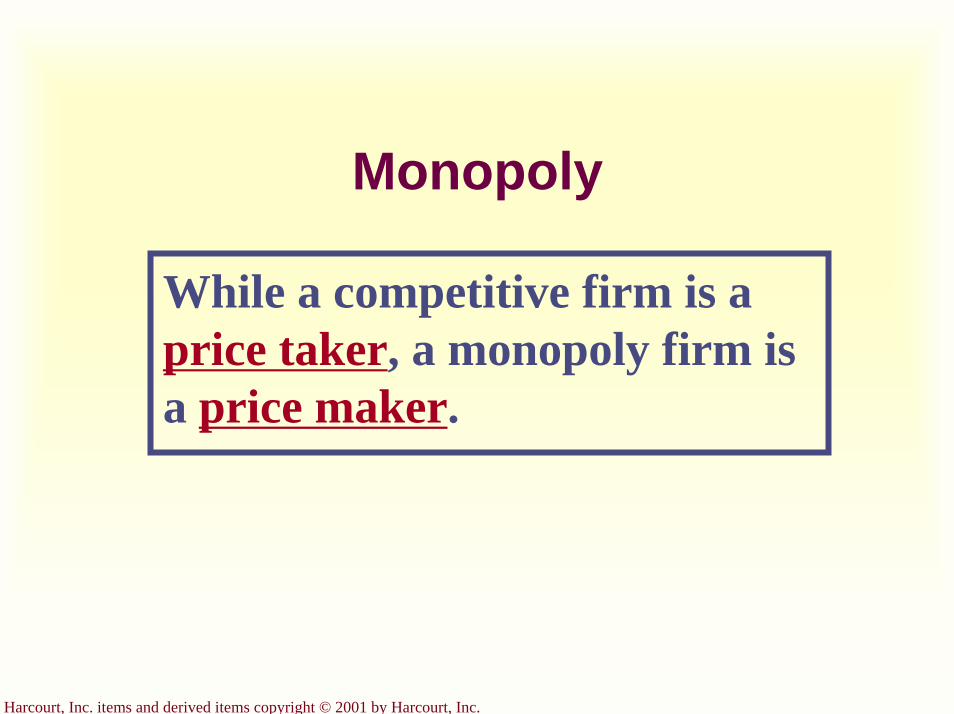
Harcourt, Inc. items and derived items copyright © 2001 by Harcourt, Inc.
Monopoly
While a competitive firm is a price taker, a monopoly firm is a price maker.
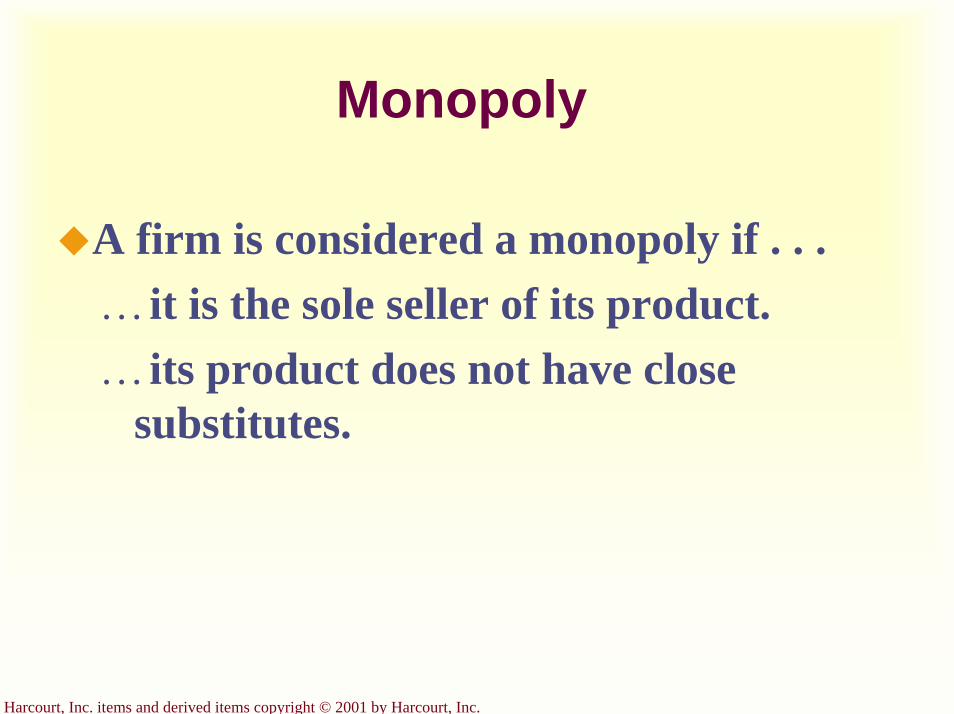
Harcourt, Inc. items and derived items copyright © 2001 by Harcourt, Inc.
Monopoly
A firm is considered a monopoly if . . .…it is the sole seller of its product.…its product does not have close
substitutes.

Harcourt, Inc. items and derived items copyright © 2001 by Harcourt, Inc.
Why Monopolies Arise
The fundamental cause of monopoly is barriers to entry.
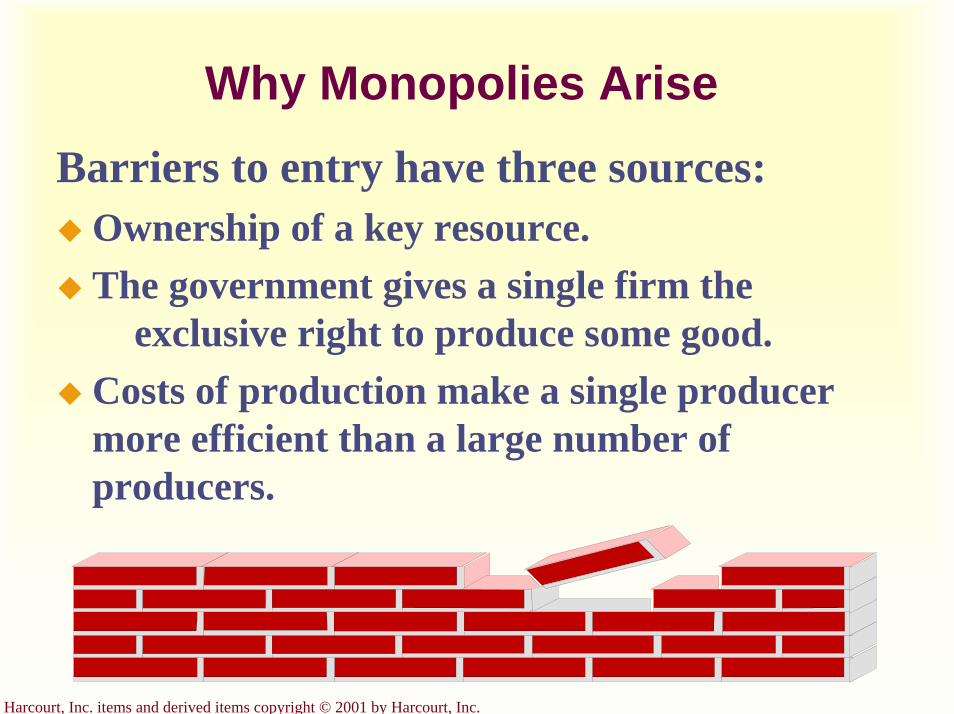
Harcourt, Inc. items and derived items copyright © 2001 by Harcourt, Inc.
Why Monopolies AriseBarriers to entry have three sources:
Ownership of a key resource.The government gives a single firm the
exclusive right to produce some good.Costs of production make a single producer more efficient than a large number of producers.
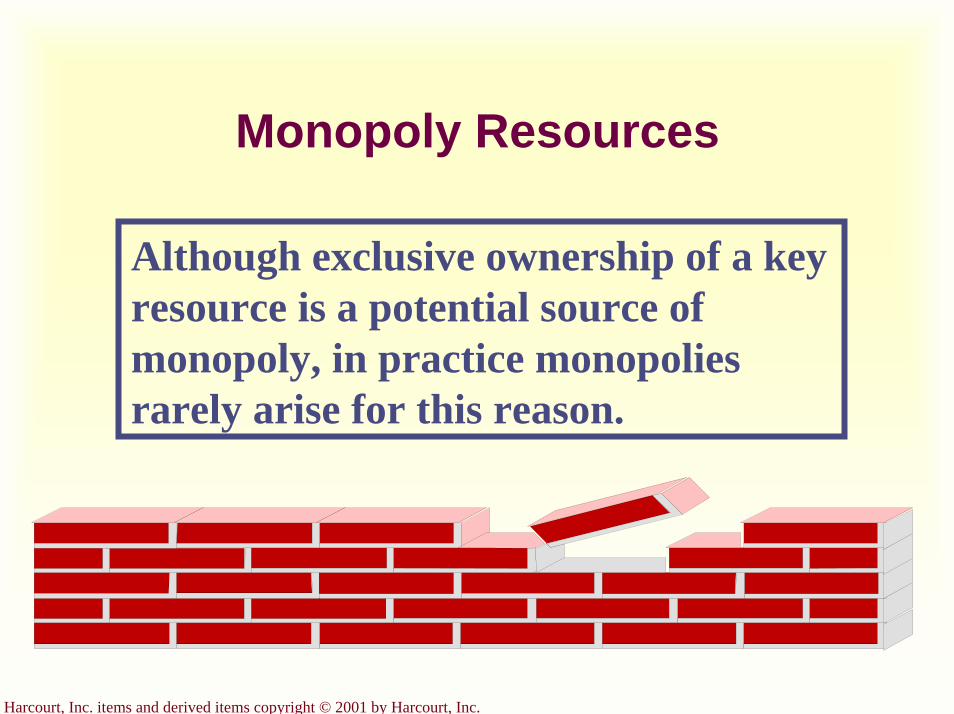
Harcourt, Inc. items and derived items copyright © 2001 by Harcourt, Inc.
Monopoly Resources
Although exclusive ownership of a key resource is a potential source of monopoly, in practice monopolies rarely arise for this reason.
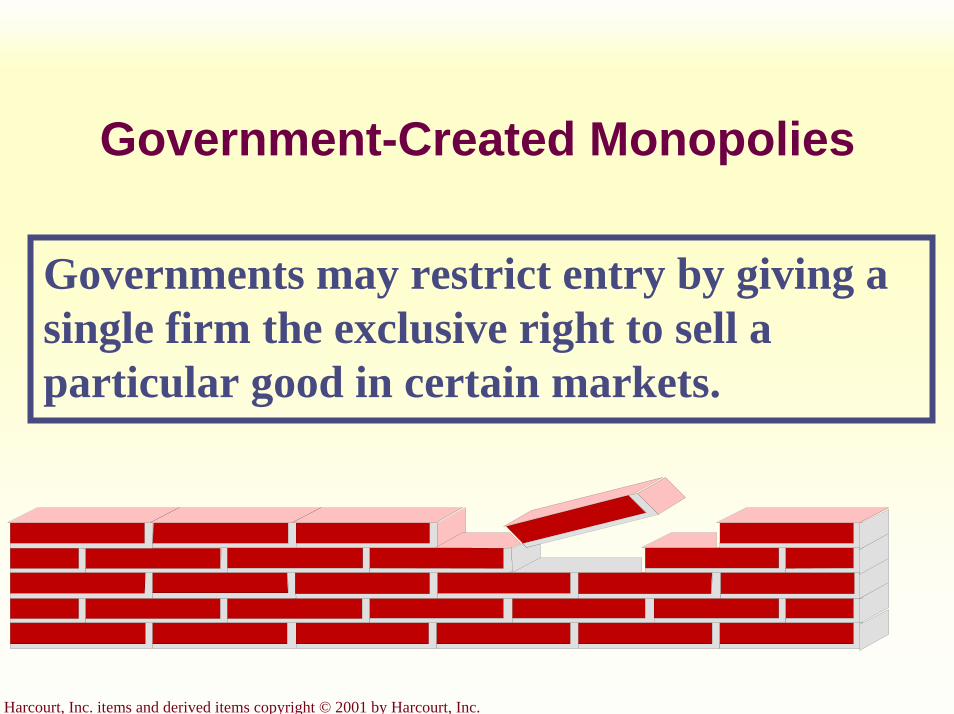
Harcourt, Inc. items and derived items copyright © 2001 by Harcourt, Inc.
Government-Created Monopolies
Governments may restrict entry by giving a single firm the exclusive right to sell a particular good in certain markets.
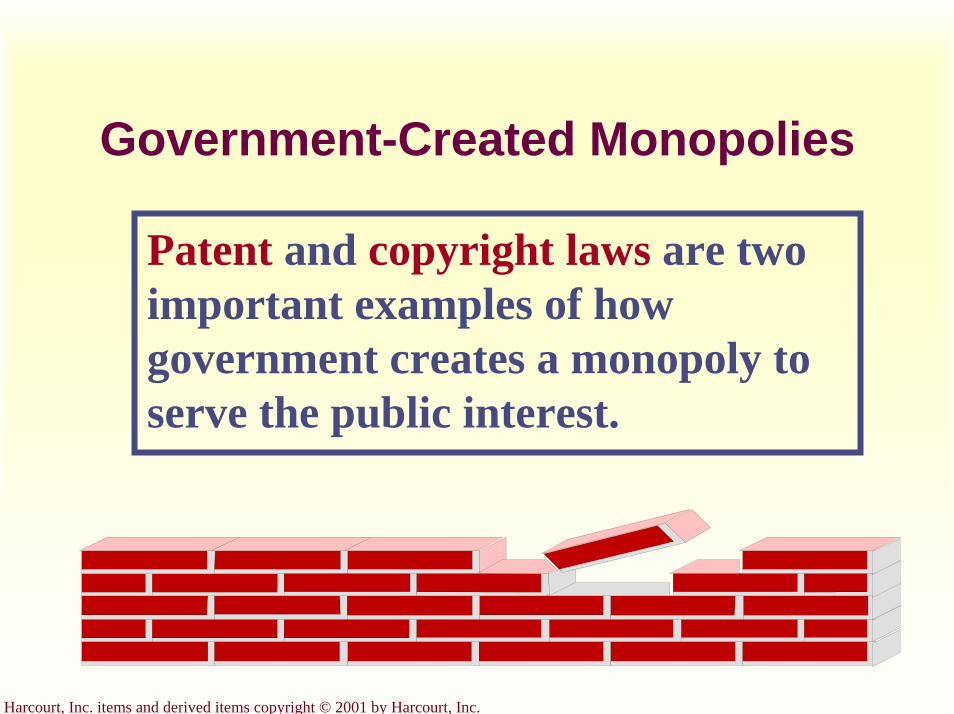
Harcourt, Inc. items and derived items copyright © 2001 by Harcourt, Inc.
Government-Created Monopolies
Patent and copyright laws are two important examples of how government creates a monopoly to serve the public interest.
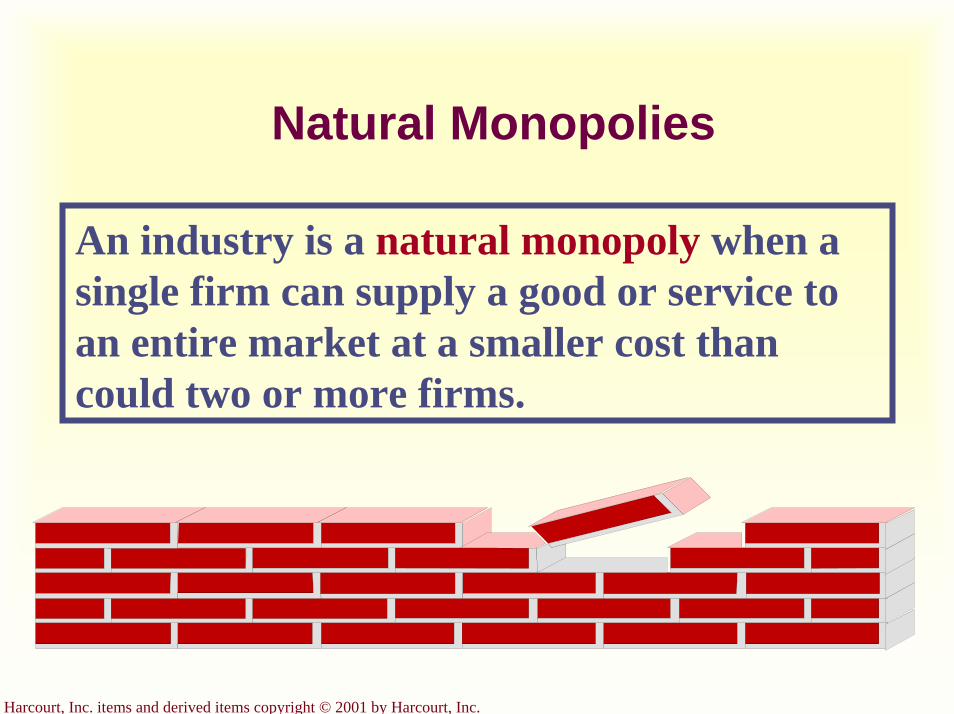
Harcourt, Inc. items and derived items copyright © 2001 by Harcourt, Inc.
Natural Monopolies
An industry is a natural monopoly when a single firm can supply a good or service to an entire market at a smaller cost than could two or more firms.
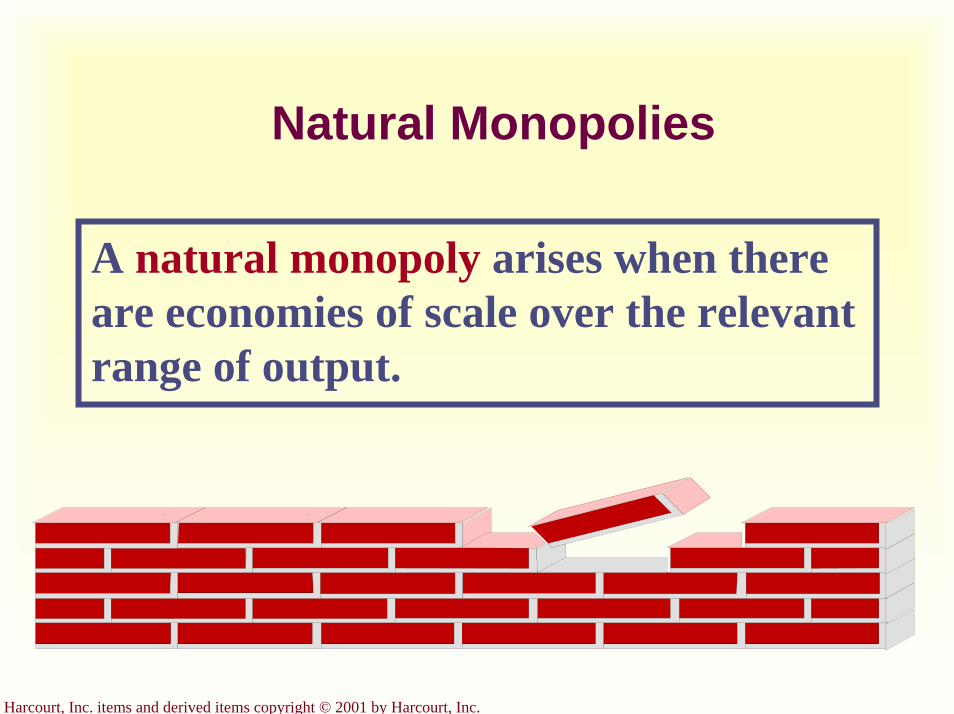
Harcourt, Inc. items and derived items copyright © 2001 by Harcourt, Inc.
Natural Monopolies
A natural monopoly arises when there are economies of scale over the relevant range of output.

Harcourt, Inc. items and derived items copyright © 2001 by Harcourt, Inc.
Economies of Scale as a Cause of Monopoly...
Cost
Average total cost
Quantity of Output0
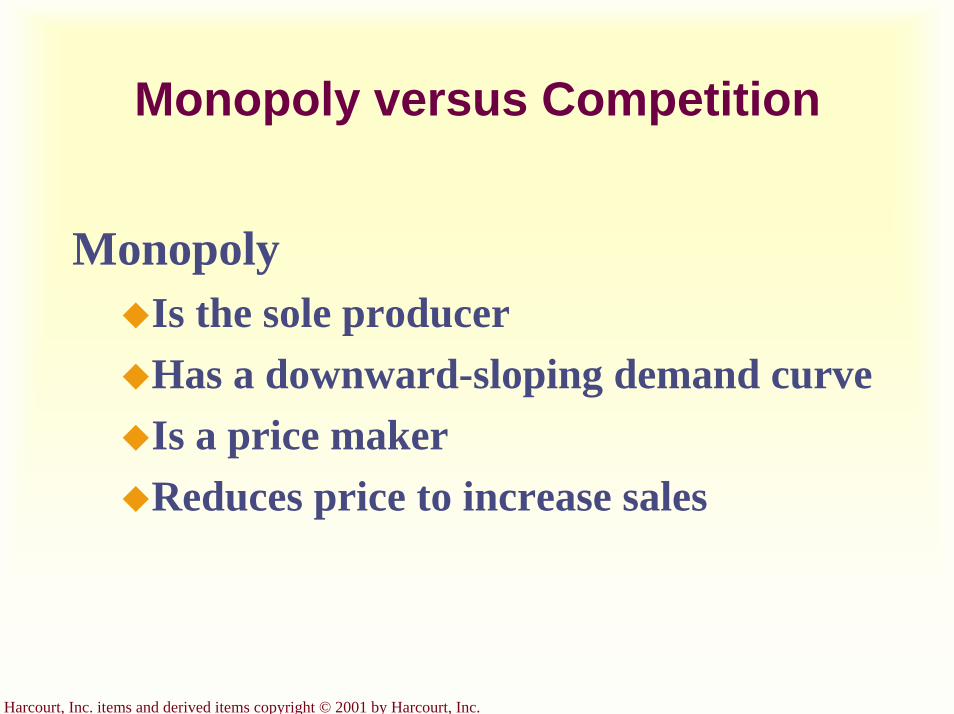
Harcourt, Inc. items and derived items copyright © 2001 by Harcourt, Inc.
Monopoly versus Competition
MonopolyIs the sole producerHas a downward-sloping demand curveIs a price makerReduces price to increase sales
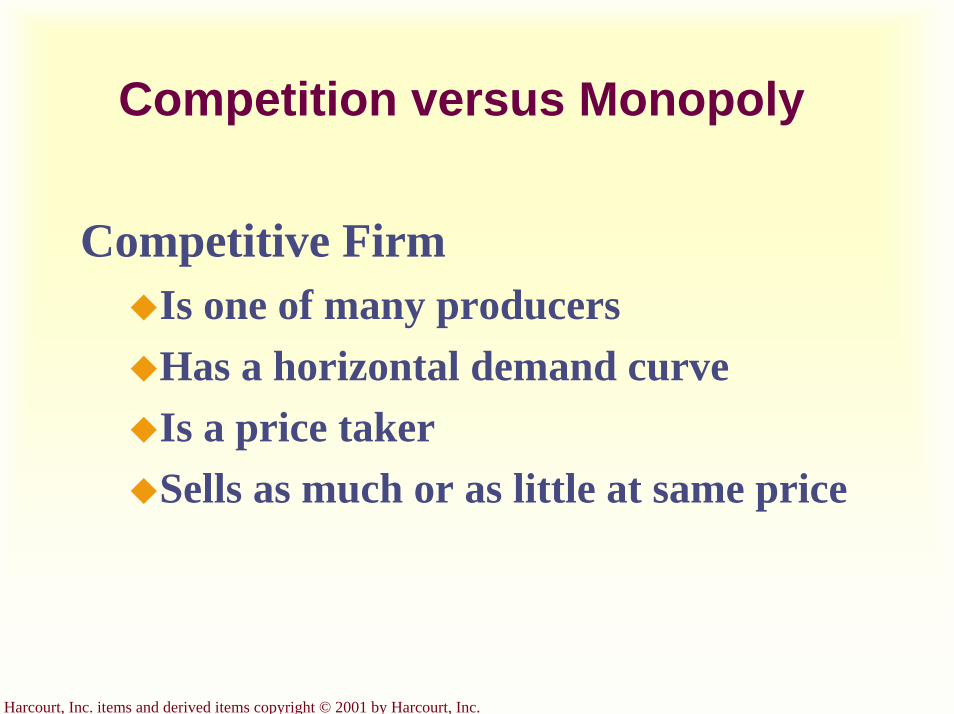
Harcourt, Inc. items and derived items copyright © 2001 by Harcourt, Inc.
Competition versus Monopoly
Competitive FirmIs one of many producersHas a horizontal demand curveIs a price takerSells as much or as little at same price
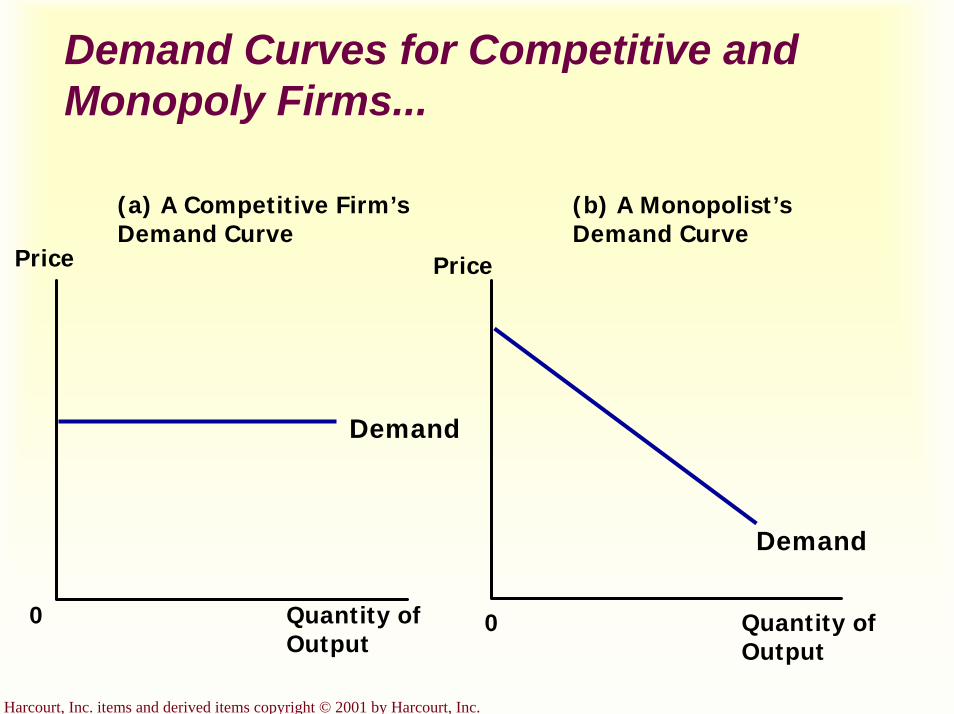
Harcourt, Inc. items and derived items copyright © 2001 by Harcourt, Inc.
Demand Curves for Competitive and Monopoly Firms...
Quantity of Output
Demand
(a) A Competitive Firm’s Demand Curve
(b) A Monopolist’s Demand Curve
0
Price
0 Quantity of Output
Price
Demand
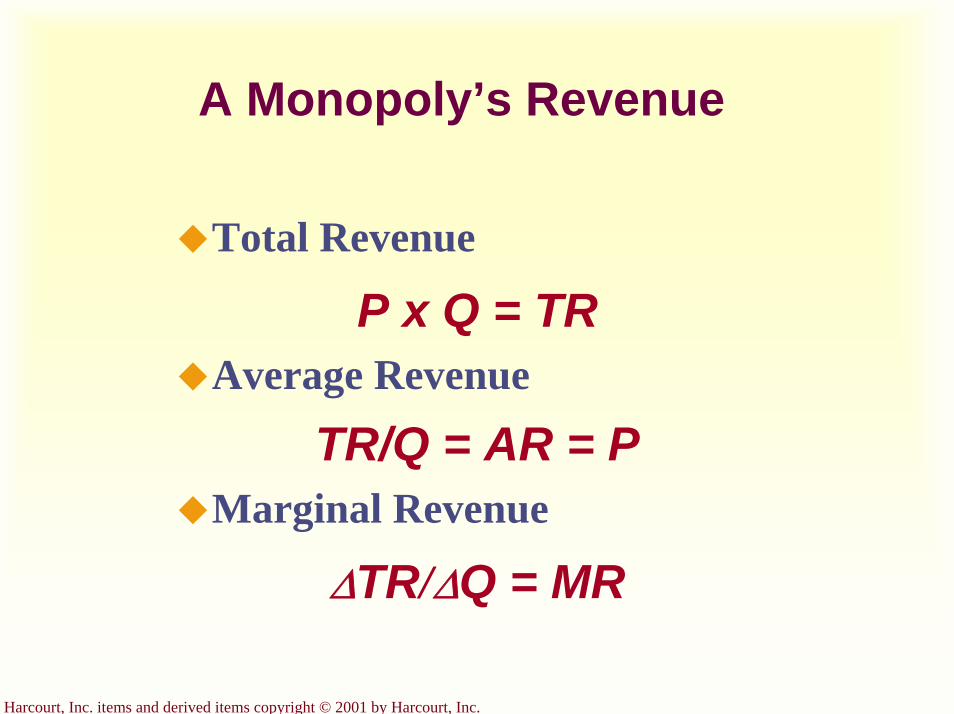
Harcourt, Inc. items and derived items copyright © 2001 by Harcourt, Inc.
A Monopoly’s Revenue
Total Revenue
P x Q = TRAverage Revenue
TR/Q = AR = PMarginal Revenue
∆TR/∆Q = MR
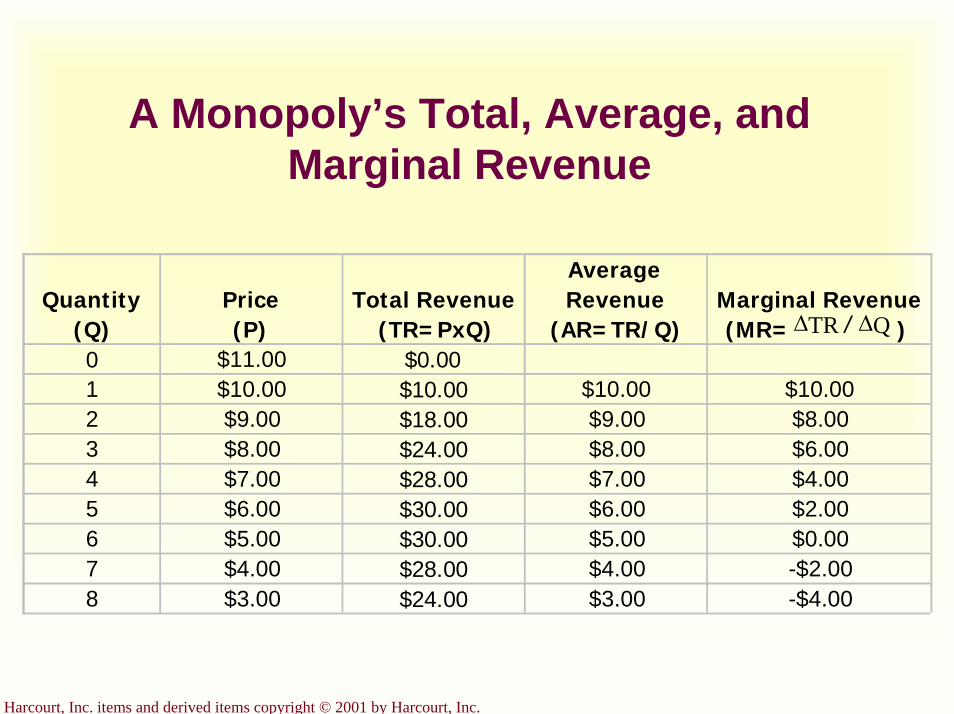
Harcourt, Inc. items and derived items copyright © 2001 by Harcourt, Inc.
A Monopoly’s Total, Average, and Marginal Revenue
Quantity(Q)
Price(P)
Total Revenue(TR=PxQ)
Average Revenue
(AR=TR/Q)Marginal Revenue(MR= )
0 $11.00 $0.001 $10.00 $10.00 $10.00 $10.002 $9.00 $18.00 $9.00 $8.003 $8.00 $24.00 $8.00 $6.004 $7.00 $28.00 $7.00 $4.005 $6.00 $30.00 $6.00 $2.006 $5.00 $30.00 $5.00 $0.007 $4.00 $28.00 $4.00 -$2.008 $3.00 $24.00 $3.00 -$4.00
QTR ∆∆ /

Harcourt, Inc. items and derived items copyright © 2001 by Harcourt, Inc.
A Monopoly’s Marginal Revenue
A monopolist’s marginal revenue is always less than the price of its good.
The demand curve is downward sloping.When a monopoly drops the price to sell one more unit, the revenue received from previously sold units also decreases.
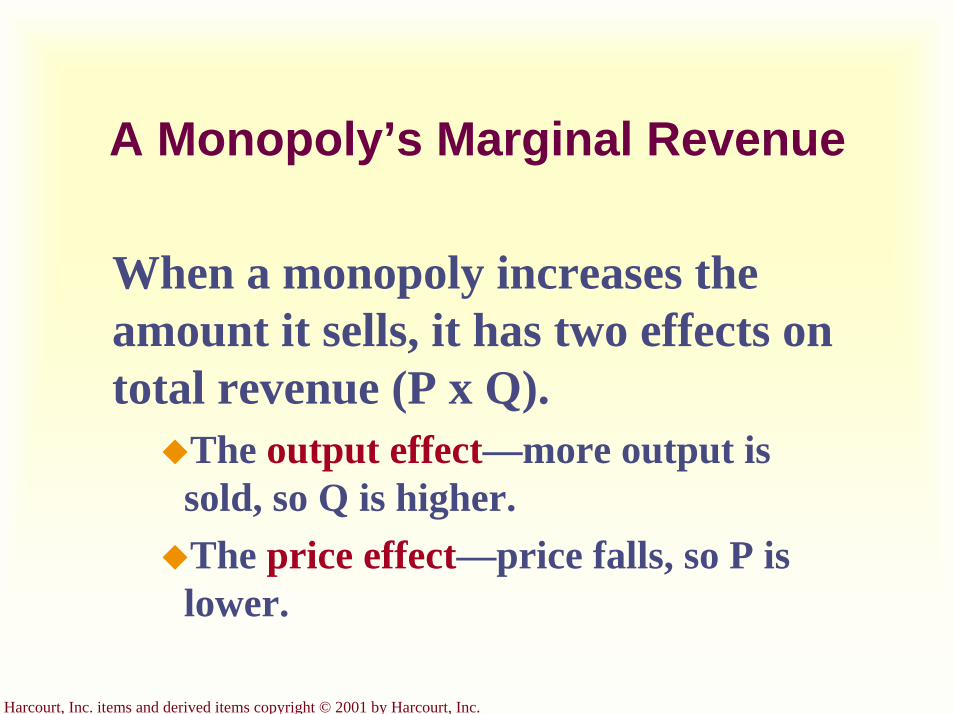
Harcourt, Inc. items and derived items copyright © 2001 by Harcourt, Inc.
A Monopoly’s Marginal Revenue
When a monopoly increases the amount it sells, it has two effects on total revenue (P x Q).
The output effect—more output is sold, so Q is higher.The price effect—price falls, so P is lower.

Harcourt, Inc. items and derived items copyright © 2001 by Harcourt, Inc.
Demand and Marginal Revenue Curves for a Monopoly...
Quantity of Water
Price$11109876543210
-1-2-3-4
1 2 3 4 5 6 7 8
Marginalrevenue
Demand(average revenue)
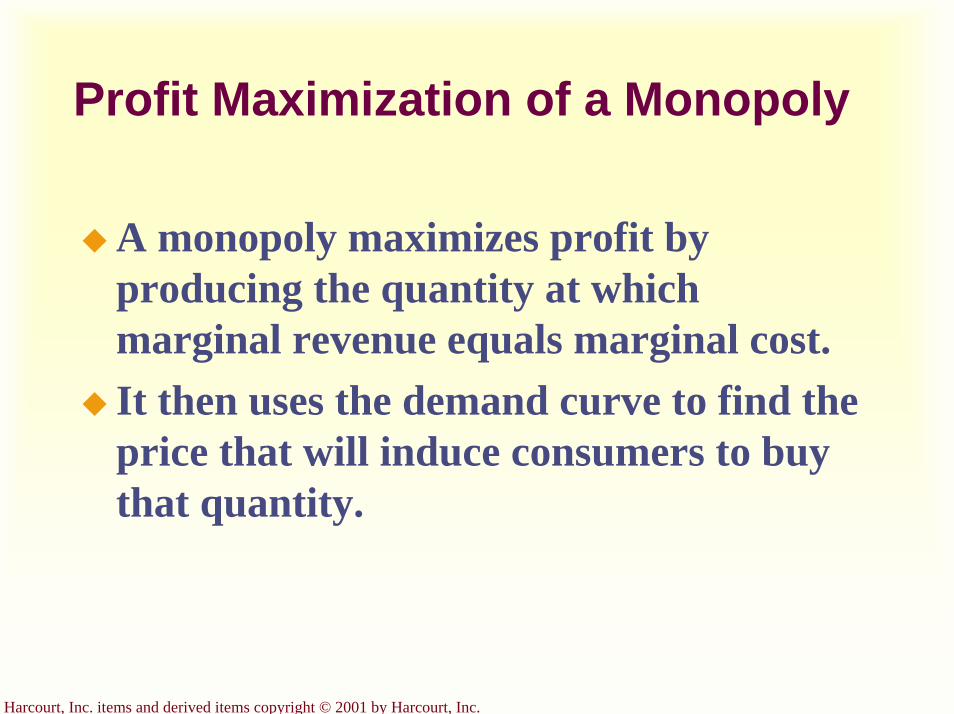
Harcourt, Inc. items and derived items copyright © 2001 by Harcourt, Inc.
Profit Maximization of a Monopoly
A monopoly maximizes profit by producing the quantity at which marginal revenue equals marginal cost.It then uses the demand curve to find the price that will induce consumers to buy that quantity.
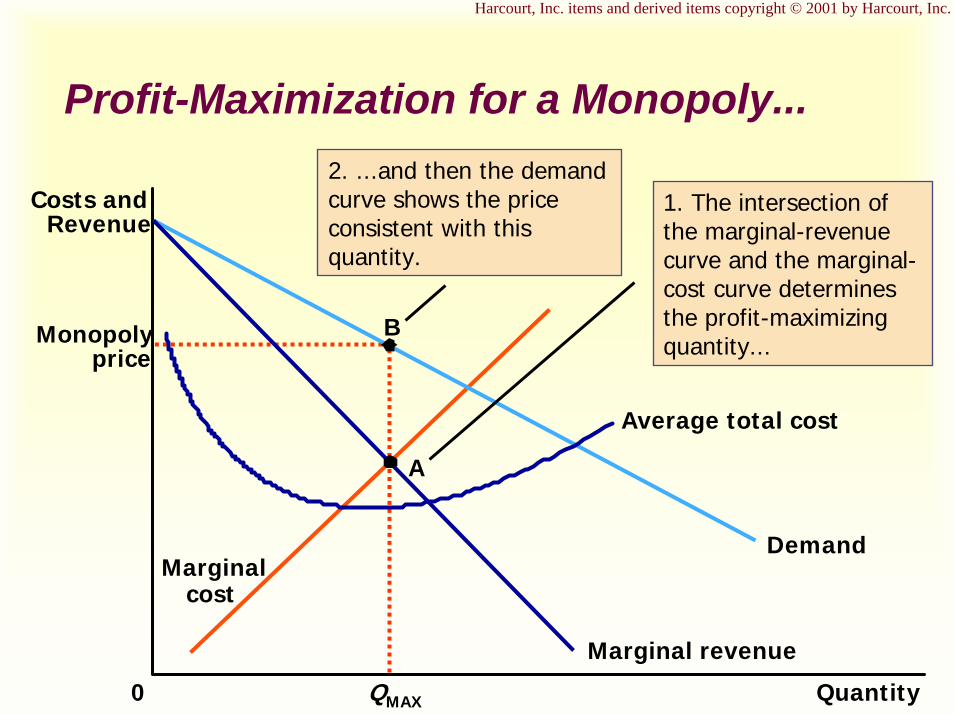
Harcourt, Inc. items and derived items copyright © 2001 by Harcourt, Inc.
Profit-Maximization for a Monopoly...
Monopolyprice
QuantityQMAX0
Costs andRevenue
Demand
Average total cost
Marginal revenue
Marginalcost
A
1. The intersection of the marginal-revenue curve and the marginal-cost curve determines the profit-maximizing quantity...
B
2. ...and then the demand curve shows the price consistent with this quantity.
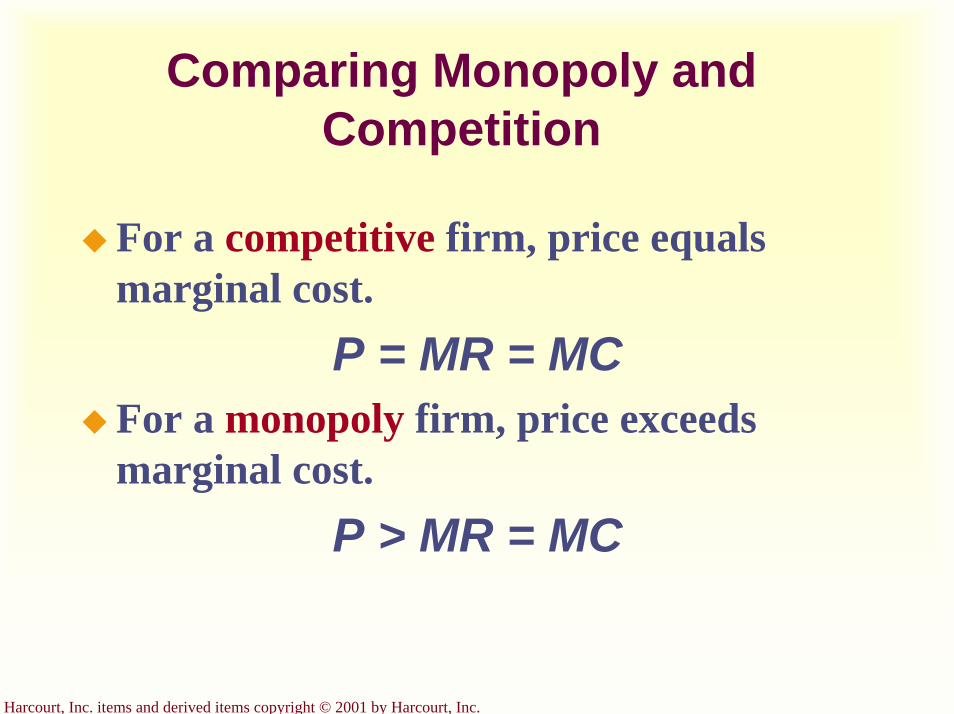
Harcourt, Inc. items and derived items copyright © 2001 by Harcourt, Inc.
Comparing Monopoly and Competition
For a competitive firm, price equals marginal cost.
P = MR = MCFor a monopoly firm, price exceeds marginal cost.
P > MR = MC
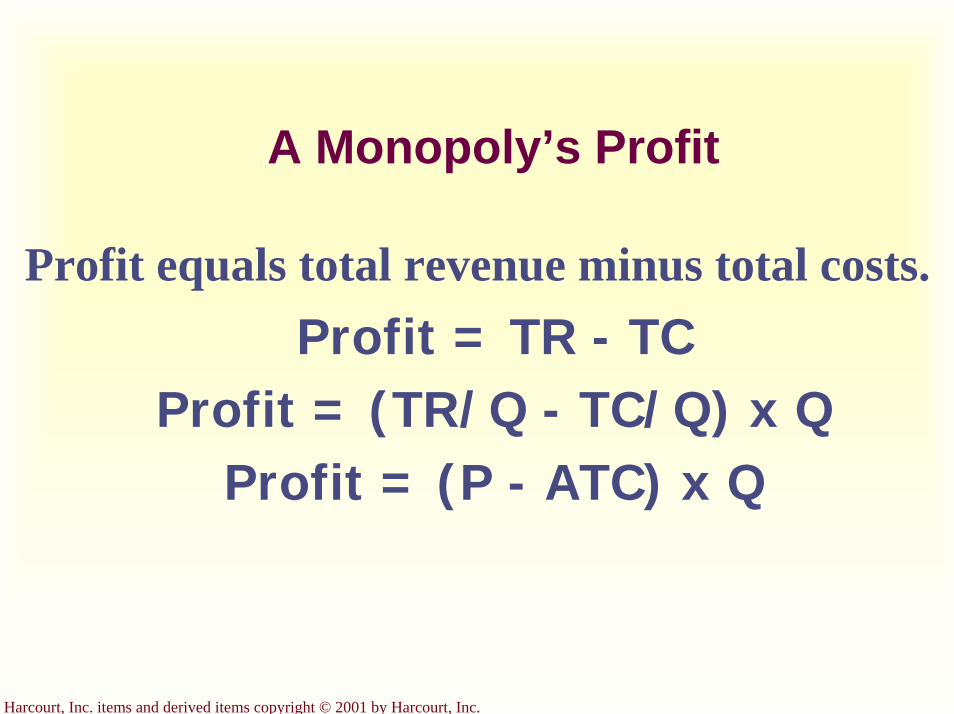
Harcourt, Inc. items and derived items copyright © 2001 by Harcourt, Inc.
A Monopoly’s Profit
Profit equals total revenue minus total costs.Profit = TR - TC
Profit = (TR/Q - TC/Q) x QProfit = (P - ATC) x Q
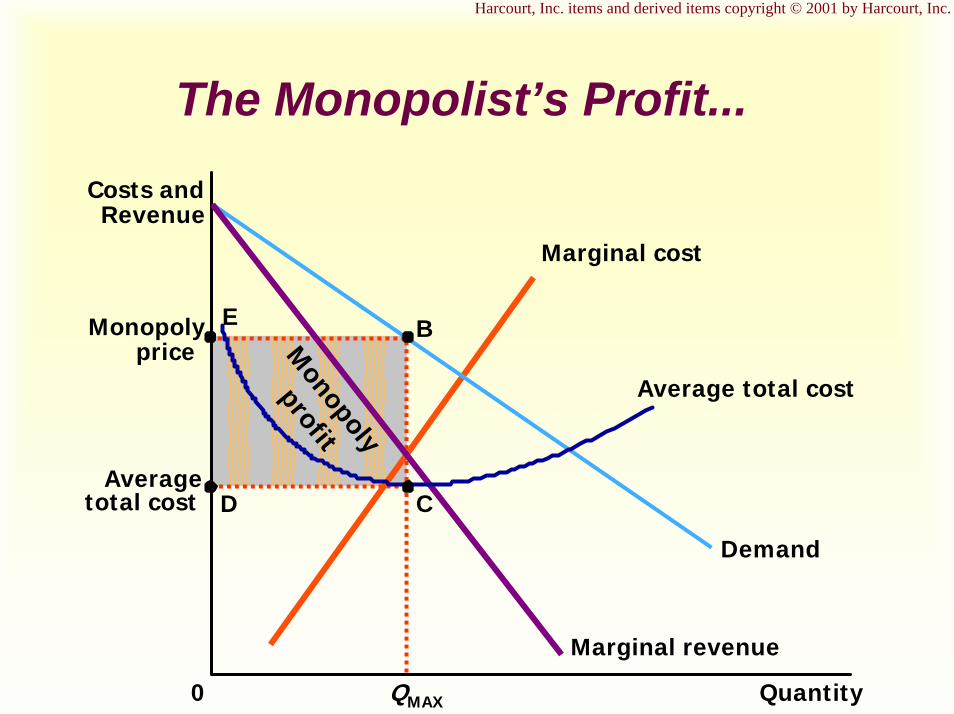
Harcourt, Inc. items and derived items copyright © 2001 by Harcourt, Inc.
The Monopolist’s Profit...
Monopoly
profit
Quantity0
Costs andRevenue
Demand
Marginal cost
Marginal revenue
QMAX
BMonopolyprice
E
Averagetotal cost D
Average total cost
C
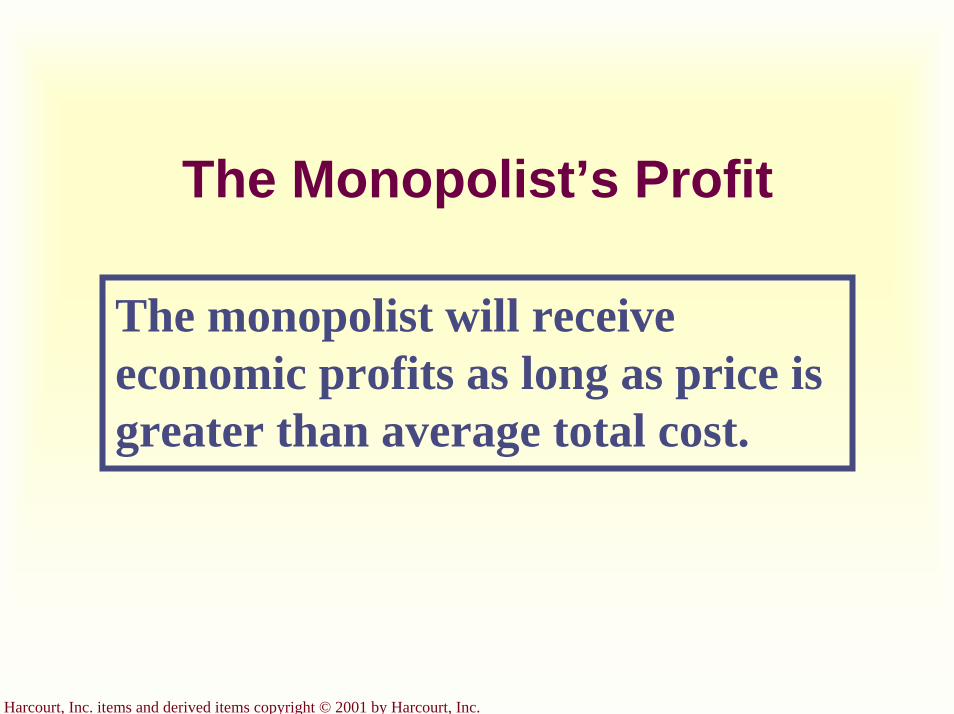
Harcourt, Inc. items and derived items copyright © 2001 by Harcourt, Inc.
The Monopolist’s Profit
The monopolist will receive economic profits as long as price is greater than average total cost.

Harcourt, Inc. items and derived items copyright © 2001 by Harcourt, Inc.
The Market for Drugs...
Costs and Revenue
Price during
patent life
Price after patent
expires
Monopoly quantity
Competitive quantity
Quantity
Marginal revenue
0
Marginal cost
Demand
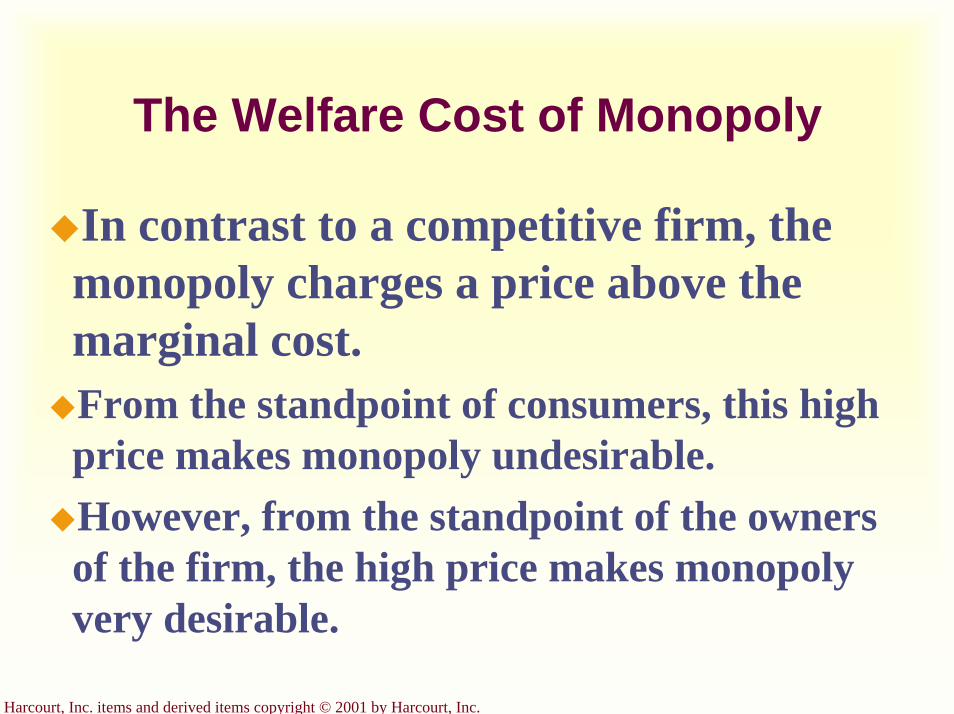
Harcourt, Inc. items and derived items copyright © 2001 by Harcourt, Inc.
The Welfare Cost of Monopoly
In contrast to a competitive firm, the monopoly charges a price above the marginal cost.From the standpoint of consumers, this high price makes monopoly undesirable. However, from the standpoint of the owners of the firm, the high price makes monopoly very desirable.
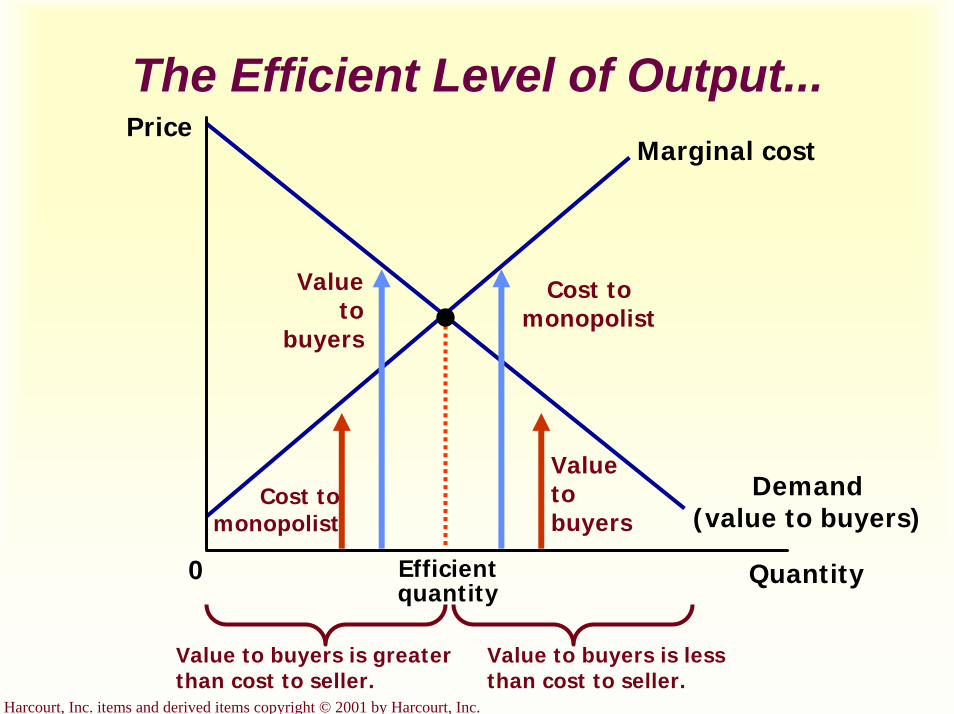
Harcourt, Inc. items and derived items copyright © 2001 by Harcourt, Inc.
The Efficient Level of Output...Price
0 Quantity
Marginal cost
Demand(value to buyers)
Efficientquantity
Cost to monopolist
Value to buyers
Value to
buyers
Cost to monopolist
Value to buyers is greater than cost to seller.
Value to buyers is less than cost to seller.
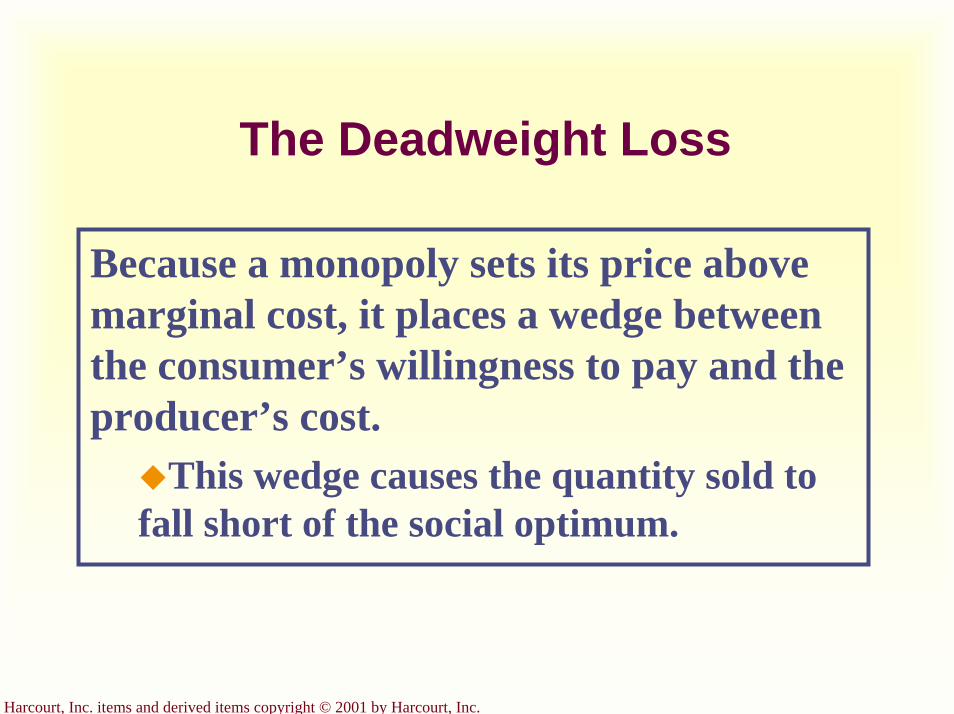
Harcourt, Inc. items and derived items copyright © 2001 by Harcourt, Inc.
The Deadweight Loss
Because a monopoly sets its price above marginal cost, it places a wedge between the consumer’s willingness to pay and the producer’s cost.
This wedge causes the quantity sold to fall short of the social optimum.

Harcourt, Inc. items and derived items copyright © 2001 by Harcourt, Inc.
The Inefficiency of Monopoly...
Quantity0
DemandMarginalrevenue
Marginal cost
Monopolyprice
Deadweightloss
Efficientquantity
Monopolyquantity
Price
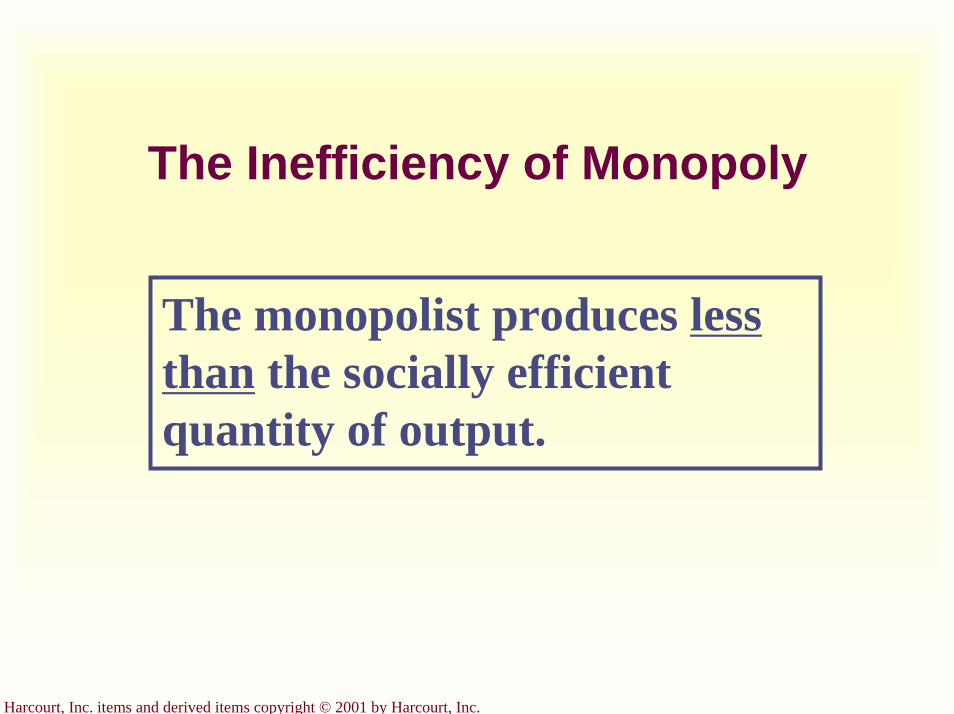
Harcourt, Inc. items and derived items copyright © 2001 by Harcourt, Inc.
The Inefficiency of Monopoly
The monopolist produces less than the socially efficient quantity of output.
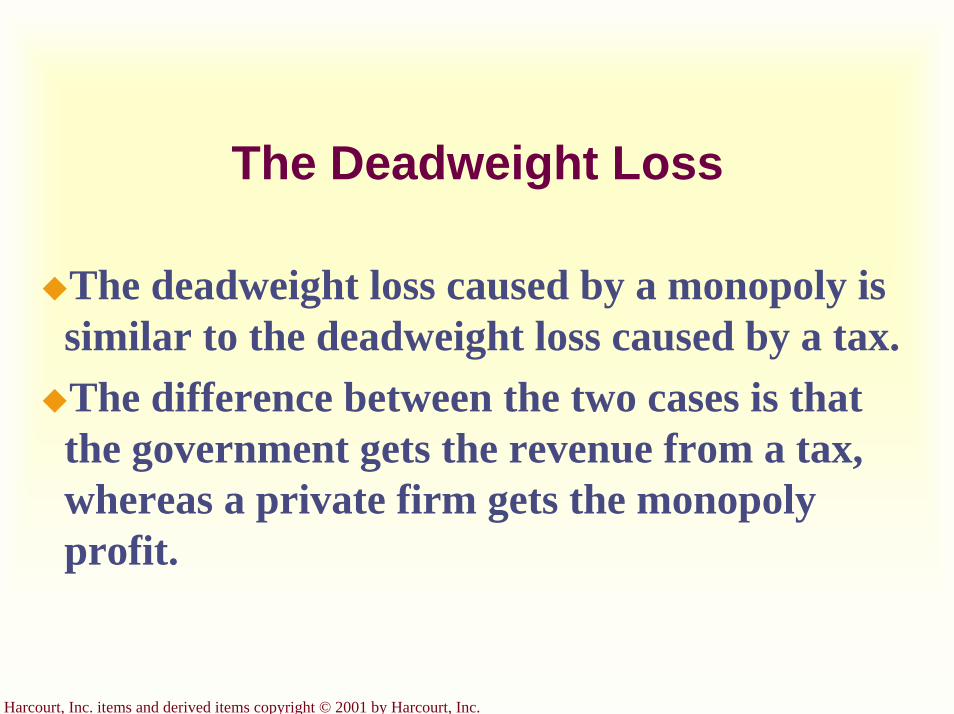
Harcourt, Inc. items and derived items copyright © 2001 by Harcourt, Inc.
The Deadweight Loss
The deadweight loss caused by a monopoly is similar to the deadweight loss caused by a tax.The difference between the two cases is that the government gets the revenue from a tax, whereas a private firm gets the monopoly profit.
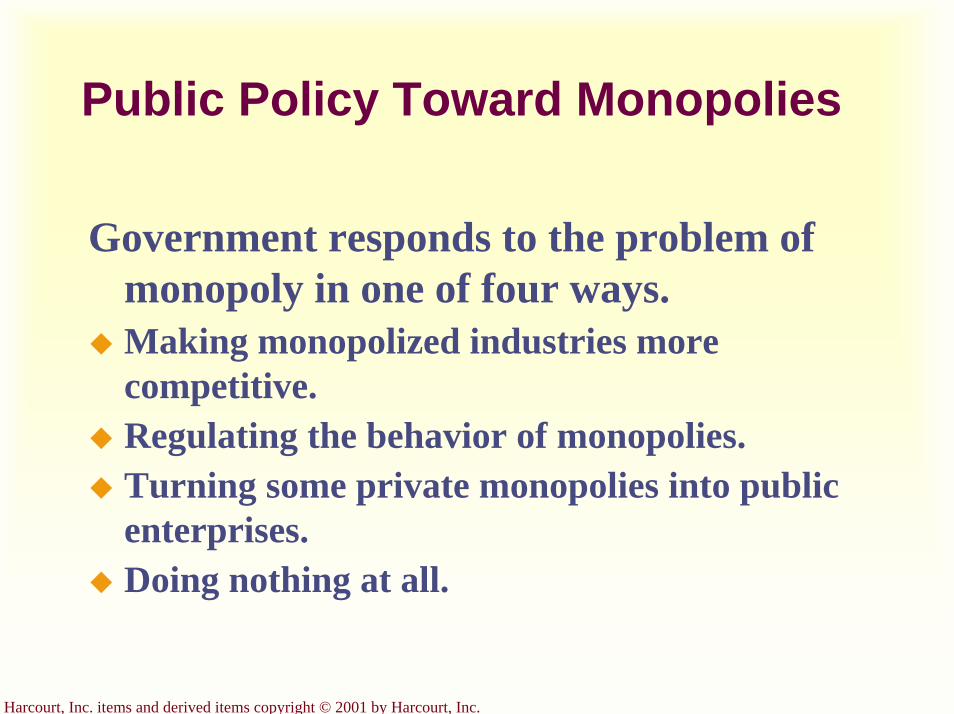
Harcourt, Inc. items and derived items copyright © 2001 by Harcourt, Inc.
Public Policy Toward Monopolies
Government responds to the problem of monopoly in one of four ways.Making monopolized industries more competitive.Regulating the behavior of monopolies.Turning some private monopolies into public enterprises.Doing nothing at all.
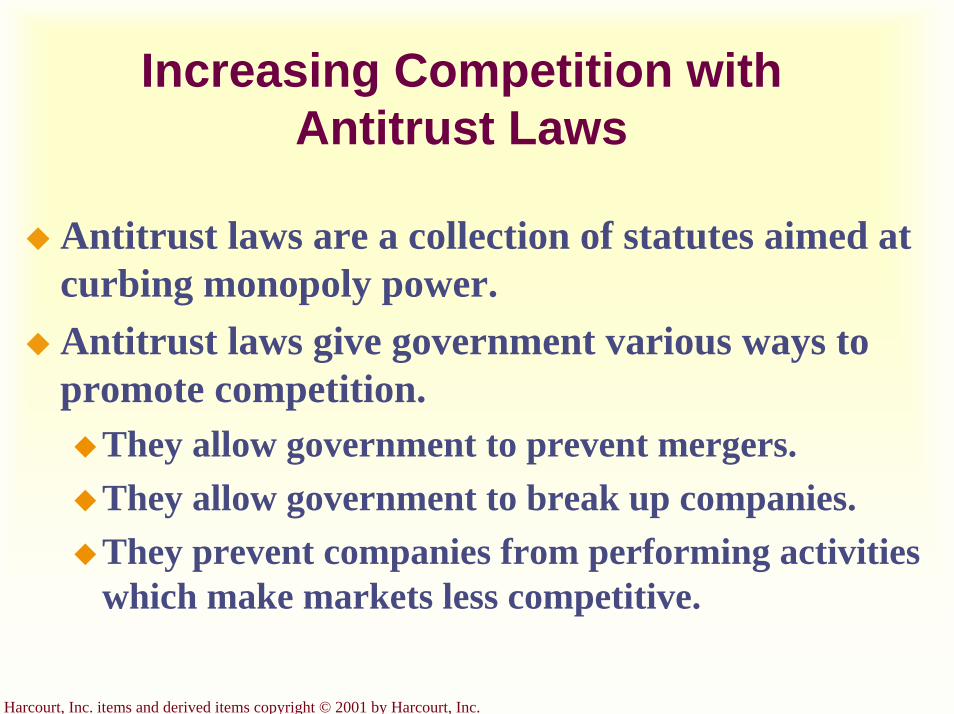
Harcourt, Inc. items and derived items copyright © 2001 by Harcourt, Inc.
Increasing Competition with Antitrust Laws
Antitrust laws are a collection of statutes aimed at curbing monopoly power.Antitrust laws give government various ways to promote competition.
They allow government to prevent mergers.They allow government to break up companies.They prevent companies from performing activities which make markets less competitive.
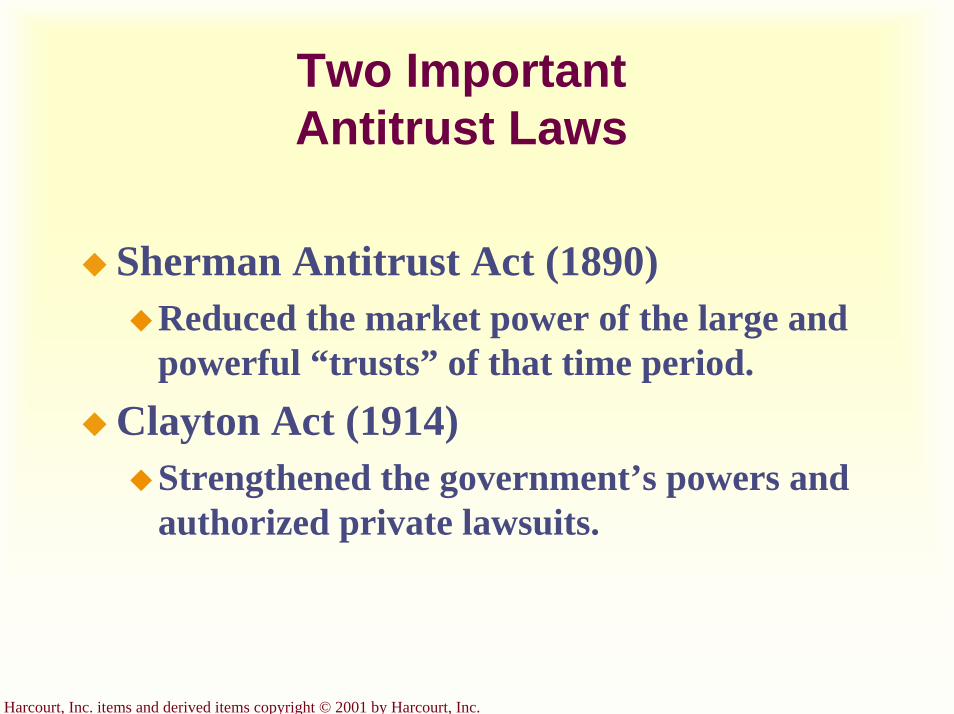
Harcourt, Inc. items and derived items copyright © 2001 by Harcourt, Inc.
Two Important Antitrust Laws
Sherman Antitrust Act (1890)Reduced the market power of the large and powerful “trusts” of that time period.
Clayton Act (1914)Strengthened the government’s powers and authorized private lawsuits.
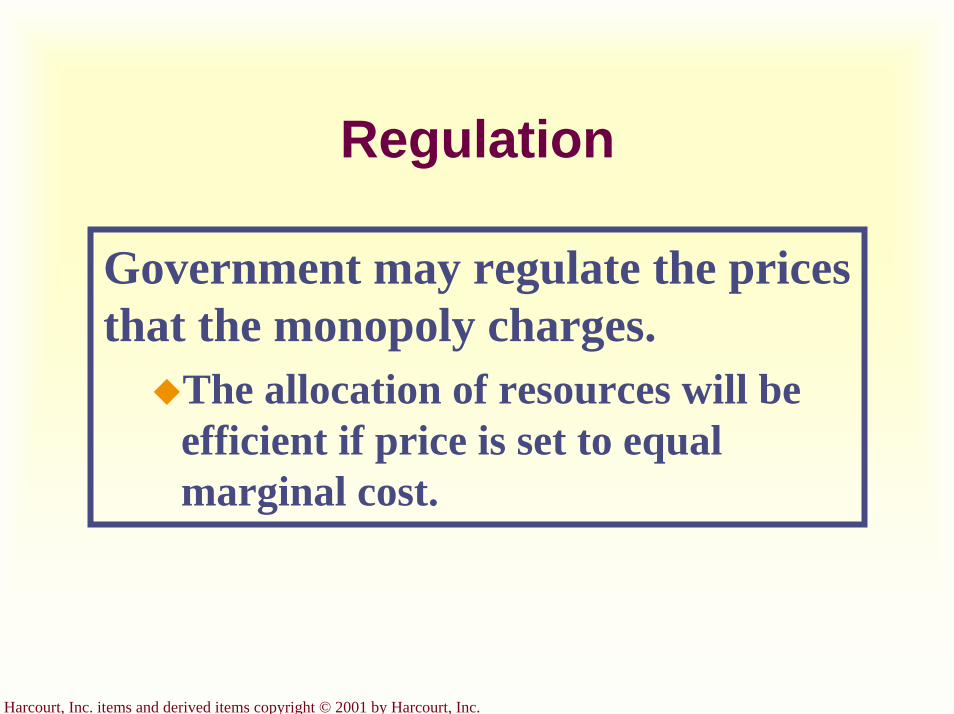
Harcourt, Inc. items and derived items copyright © 2001 by Harcourt, Inc.
Regulation
Government may regulate the prices that the monopoly charges.
The allocation of resources will be efficient if price is set to equal marginal cost.
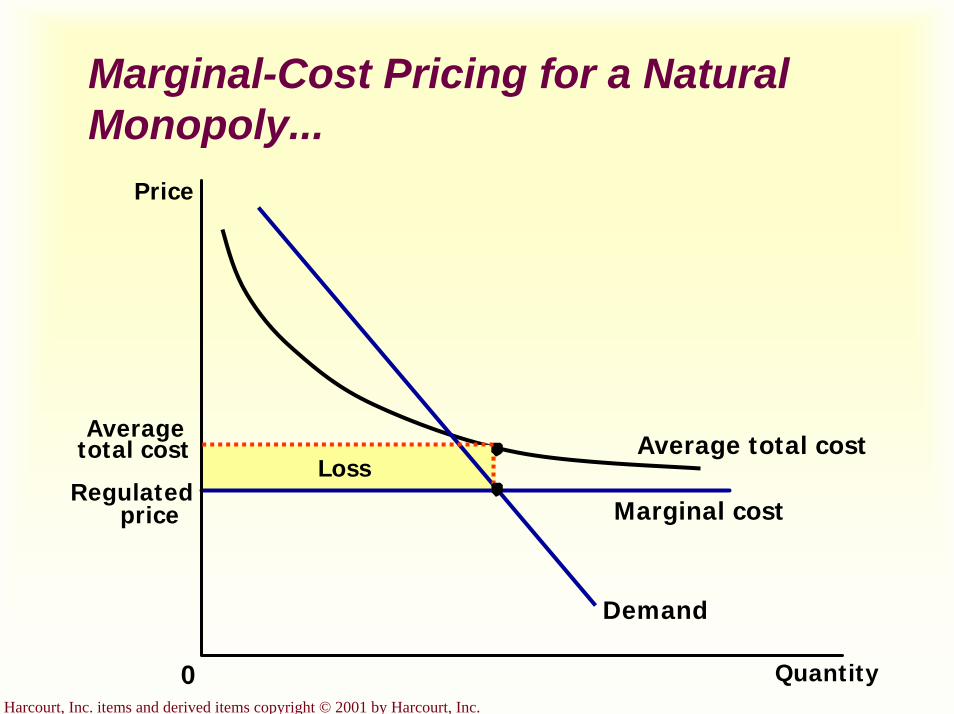
Harcourt, Inc. items and derived items copyright © 2001 by Harcourt, Inc.
Marginal-Cost Pricing for a Natural Monopoly...
Regulatedprice
Quantity0
Loss
Price
Demand
Marginal cost
Average total costAverage
total cost
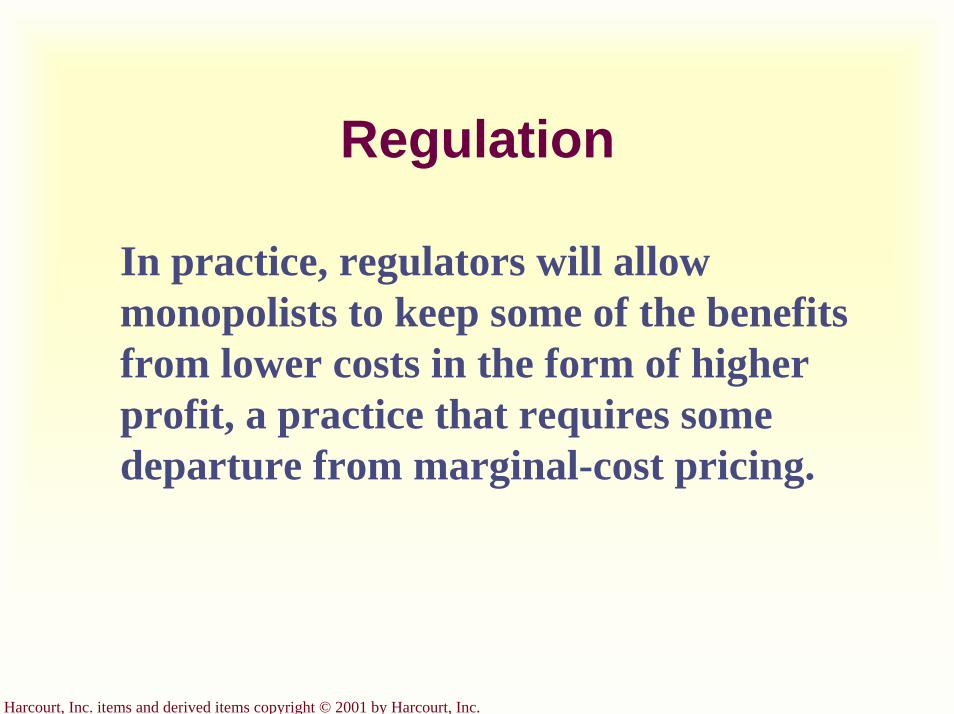
Harcourt, Inc. items and derived items copyright © 2001 by Harcourt, Inc.
Regulation
In practice, regulators will allow monopolists to keep some of the benefits from lower costs in the form of higher profit, a practice that requires some departure from marginal-cost pricing.
Harcourt, Inc. items and derived items copyright © 2001 by Harcourt, Inc.
Public Ownership
Rather than regulating a natural monopoly that is run by a private firm, the government can run the monopoly itself. (e.g. in the U.S., the government runs the Postal Service).
Harcourt, Inc. items and derived items copyright © 2001 by Harcourt, Inc.
Doing Nothing
Government can do nothing at all if the market failure is deemed small compared to the imperfections of public policies.
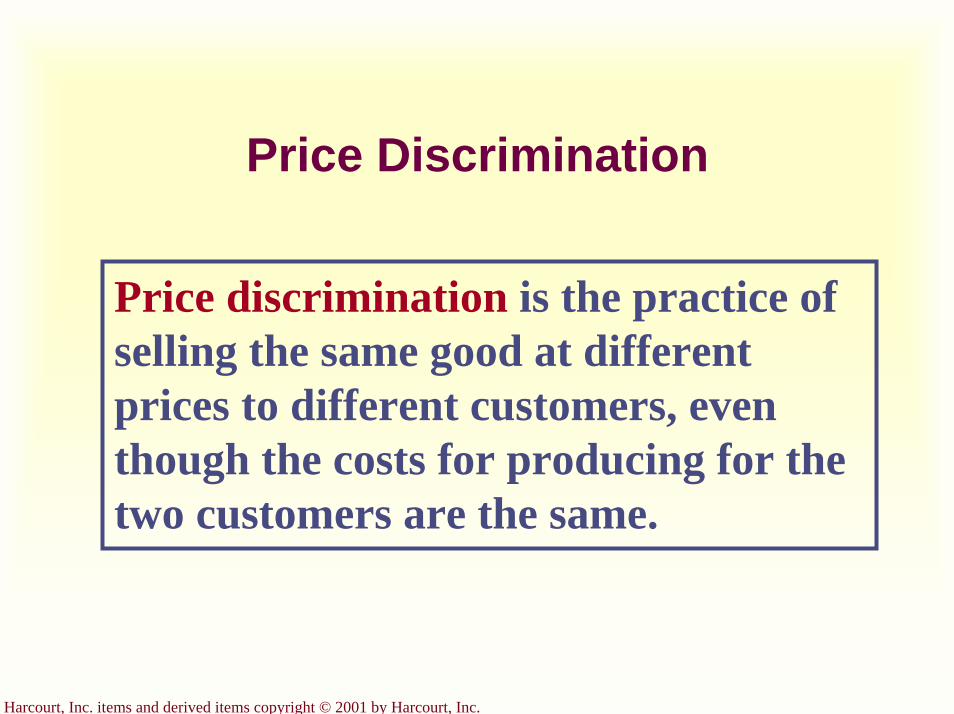
Harcourt, Inc. items and derived items copyright © 2001 by Harcourt, Inc.
Price Discrimination
Price discrimination is the practice of selling the same good at different prices to different customers, even though the costs for producing for the two customers are the same.
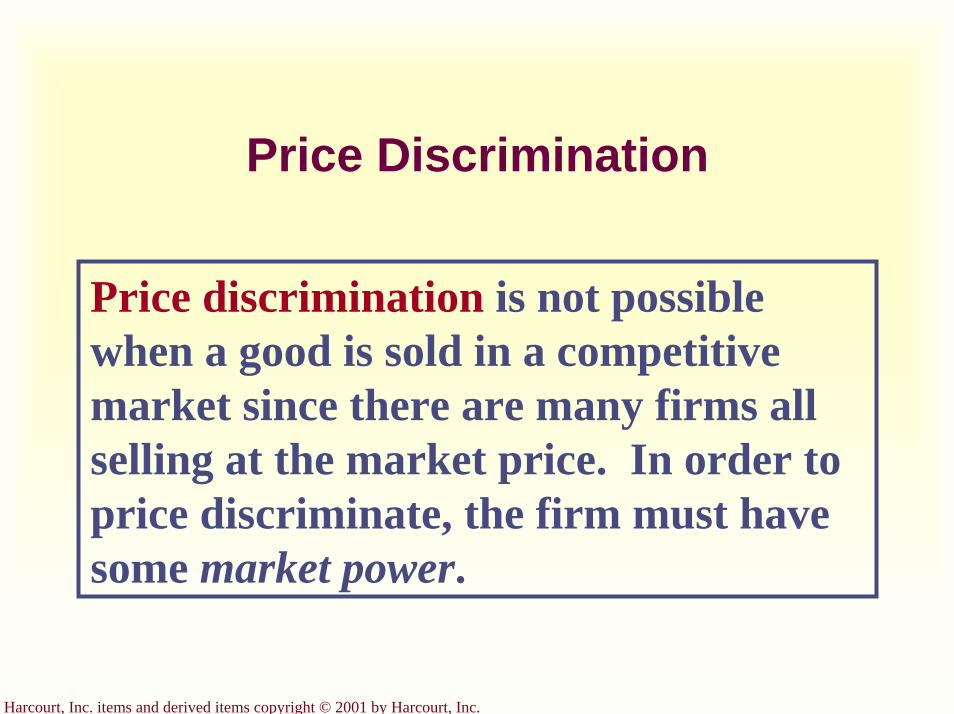
Harcourt, Inc. items and derived items copyright © 2001 by Harcourt, Inc.
Price Discrimination
Price discrimination is not possible when a good is sold in a competitive market since there are many firms all selling at the market price. In order to price discriminate, the firm must have some market power.
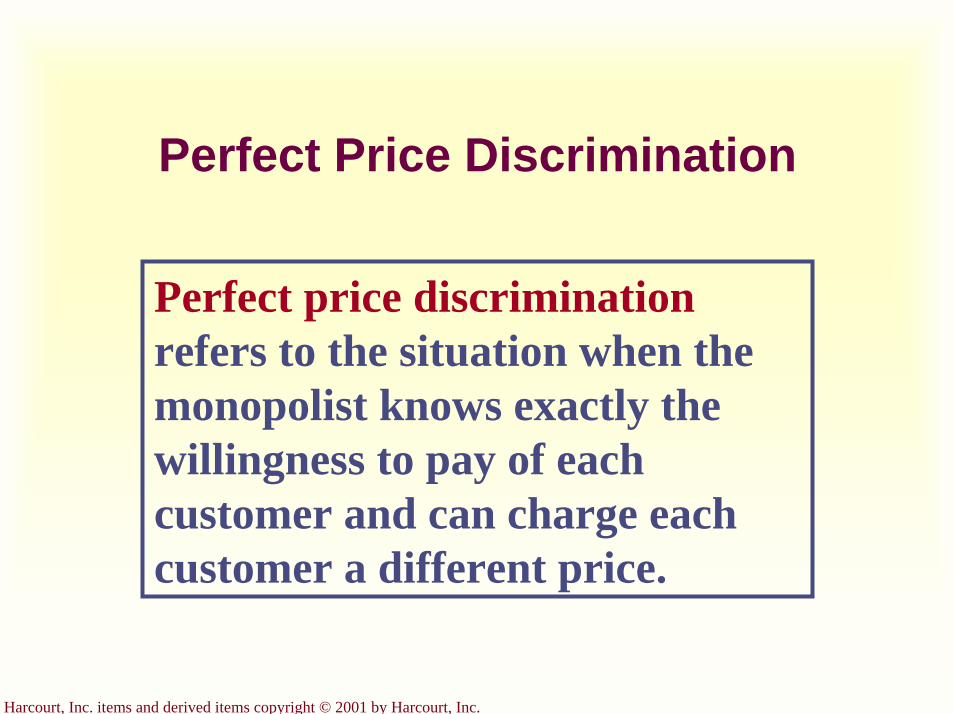
Harcourt, Inc. items and derived items copyright © 2001 by Harcourt, Inc.
Perfect Price Discrimination
Perfect price discriminationrefers to the situation when the monopolist knows exactly the willingness to pay of each customer and can charge each customer a different price.
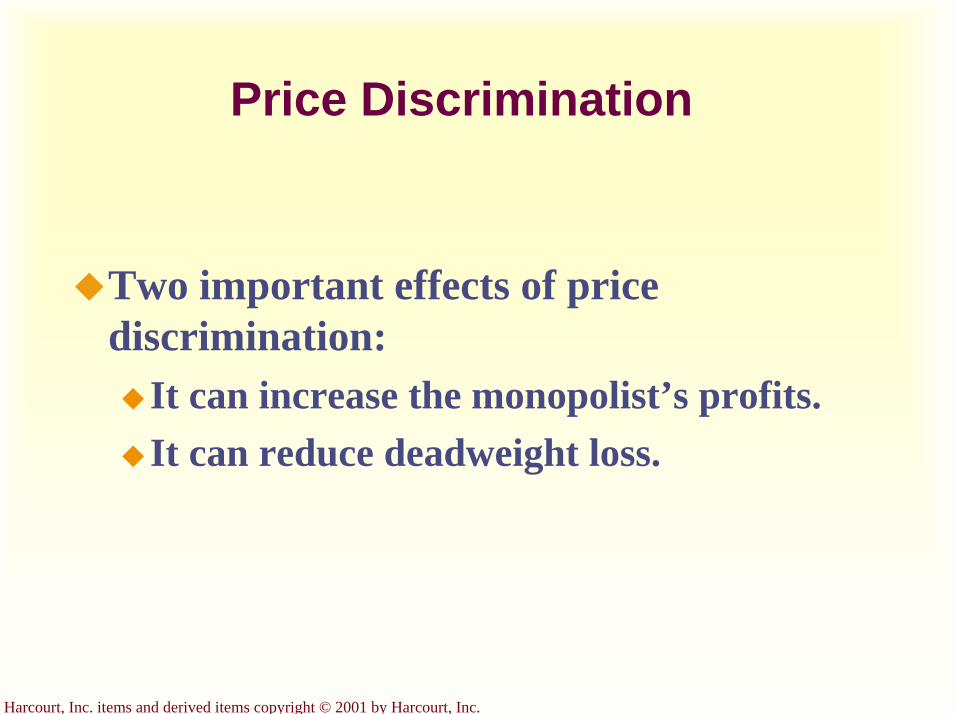
Harcourt, Inc. items and derived items copyright © 2001 by Harcourt, Inc.
Price Discrimination
Two important effects of price discrimination:
It can increase the monopolist’s profits.It can reduce deadweight loss.

Harcourt, Inc. items and derived items copyright © 2001 by Harcourt, Inc.
Welfare Without Price Discrimination...
Deadweightloss
Consumersurplus
Price
0 Quantity
Profit
Demand
Marginal cost
Marginalrevenue
Quantity sold
Monopolyprice
(a) Monopolist with Single Price
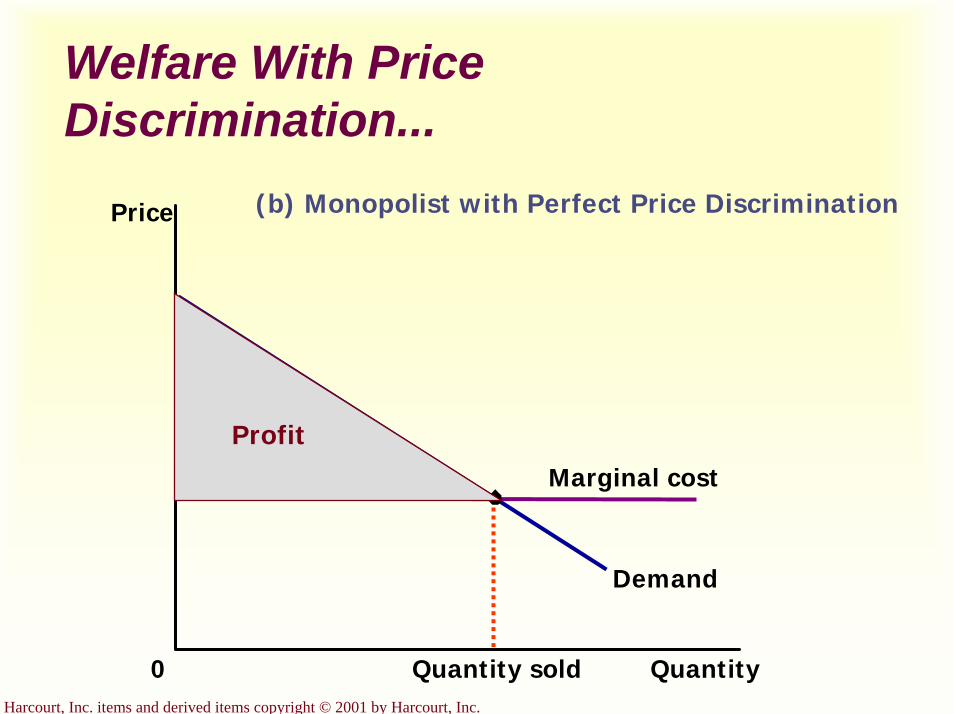
Harcourt, Inc. items and derived items copyright © 2001 by Harcourt, Inc.
Welfare With Price Discrimination...
Price
0 Quantity
Demand
Marginal cost
Quantity sold
(b) Monopolist with Perfect Price Discrimination
Profit
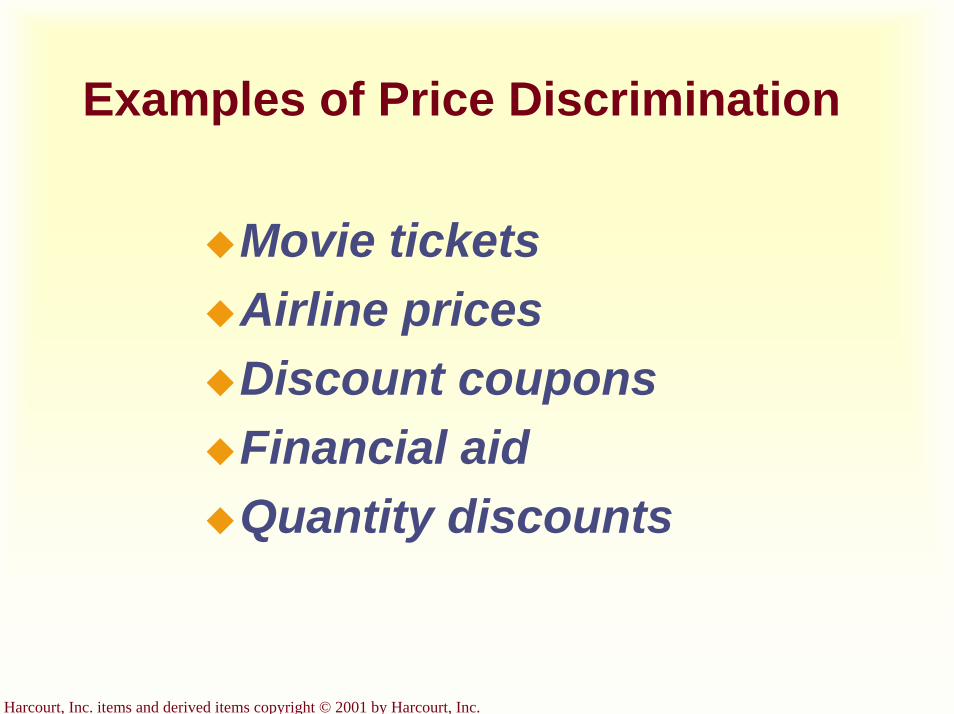
Harcourt, Inc. items and derived items copyright © 2001 by Harcourt, Inc.
Examples of Price Discrimination
Movie ticketsAirline pricesDiscount couponsFinancial aidQuantity discounts
Harcourt, Inc. items and derived items copyright © 2001 by Harcourt, Inc.
The Prevalence of Monopoly
How prevalent are the problems of monopolies?
Monopolies are common. Most firms have some control over their prices because of differentiated products.Firms with substantial monopoly power are rare. Few goods are truly unique.
Harcourt, Inc. items and derived items copyright © 2001 by Harcourt, Inc.
Summary
A monopoly is a firm that is the sole seller in its market.It faces a downward-sloping demand curve for its product.A monopoly’s marginal revenue is always below the price of its good.
Harcourt, Inc. items and derived items copyright © 2001 by Harcourt, Inc.
Summary
Like a competitive firm, a monopoly maximizes profit by producing the quantity at which marginal cost and marginal revenue are equal.Unlike a competitive firm, its price exceeds its marginal revenue, so its price exceeds marginal cost.
Harcourt, Inc. items and derived items copyright © 2001 by Harcourt, Inc.
Summary
A monopolist’s profit-maximizing level of output is below the level that maximizes the sum of consumer and producer surplus.A monopoly causes deadweight losses similar to the deadweight losses caused by taxes.
Harcourt, Inc. items and derived items copyright © 2001 by Harcourt, Inc.
Summary
Policymakers can respond to the inefficiencies of monopoly behavior with antitrust laws, regulation of prices, or by turning the monopoly into a government-run enterprise. If the market failure is deemed small, policymakers may decide to do nothing at all.
Harcourt, Inc. items and derived items copyright © 2001 by Harcourt, Inc.
Summary
Monopolists can raise their profits by charging different prices to different buyers based on their willingness to pay. Price discrimination can raise economic welfare and lessen deadweight losses.

Harcourt, Inc. items and derived items copyright © 2001 by Harcourt, Inc.
Graphical Review
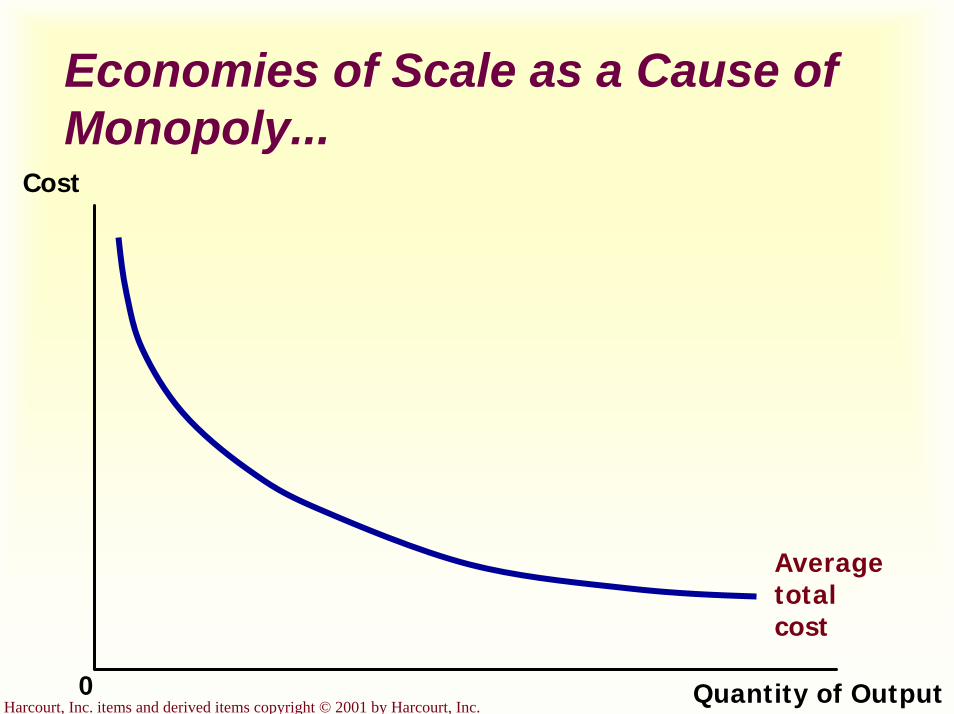
Harcourt, Inc. items and derived items copyright © 2001 by Harcourt, Inc.
Economies of Scale as a Cause of Monopoly...
Average total cost
Quantity of Output
Cost
0
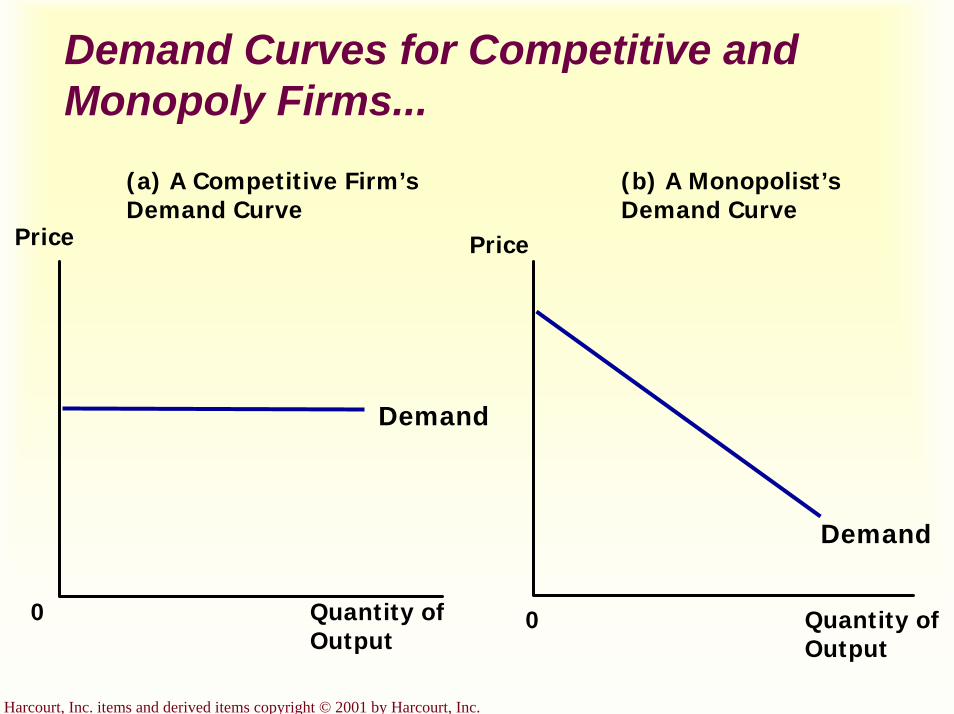
Harcourt, Inc. items and derived items copyright © 2001 by Harcourt, Inc.
Demand Curves for Competitive and Monopoly Firms...
Quantity of Output
Demand
(a) A Competitive Firm’s Demand Curve
(b) A Monopolist’s Demand Curve
0
Price
0 Quantity of Output
Price
Demand
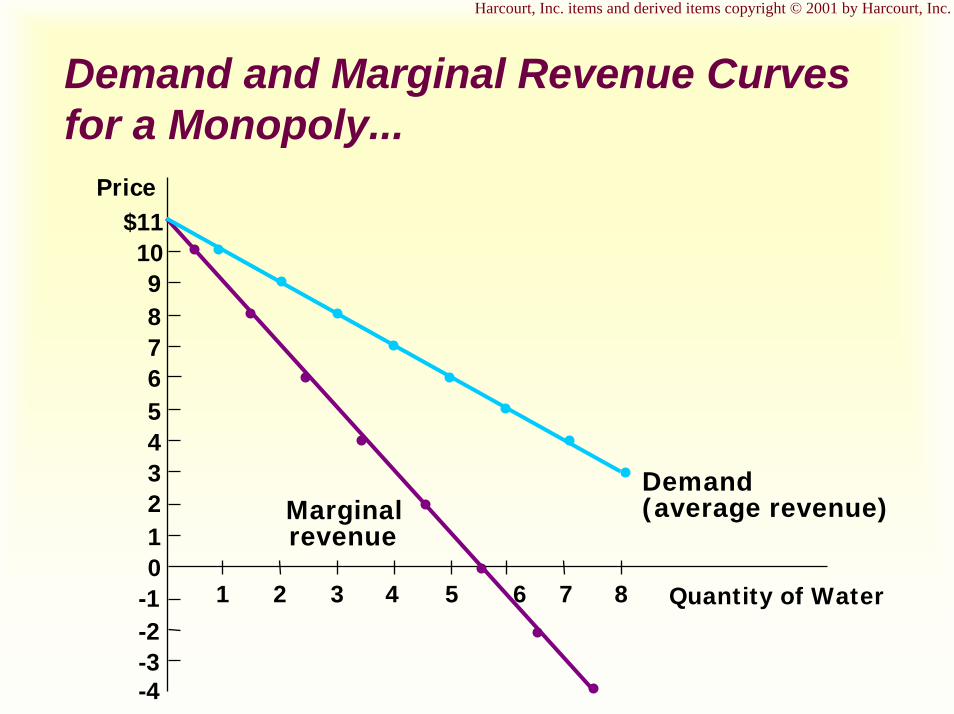
Harcourt, Inc. items and derived items copyright © 2001 by Harcourt, Inc.
Demand and Marginal Revenue Curves for a Monopoly...
Quantity of Water
Price$11109876543210
-1-2-3-4
1 2 3 4 5 6 7 8
Marginalrevenue
Demand(average revenue)

Harcourt, Inc. items and derived items copyright © 2001 by Harcourt, Inc.
Profit-Maximization for a Monopoly...
Monopolyprice
QuantityQMAX0
Costs andRevenue
Demand
Average total cost
Marginal revenue
Marginalcost
A
1. The intersection of the marginal-revenue curve and the marginal-cost curve determines the profit-maximizing quantity...
B
2. ...and then the demand curve shows the price consistent with this quantity.

Harcourt, Inc. items and derived items copyright © 2001 by Harcourt, Inc.
The Monopolist’s Profit...
Monopoly
profit
Quantity0
Costs andRevenue
Demand
Marginal cost
Marginal revenue
QMAX
BMonopolyprice
E
Averagetotal cost D
Average total cost
C
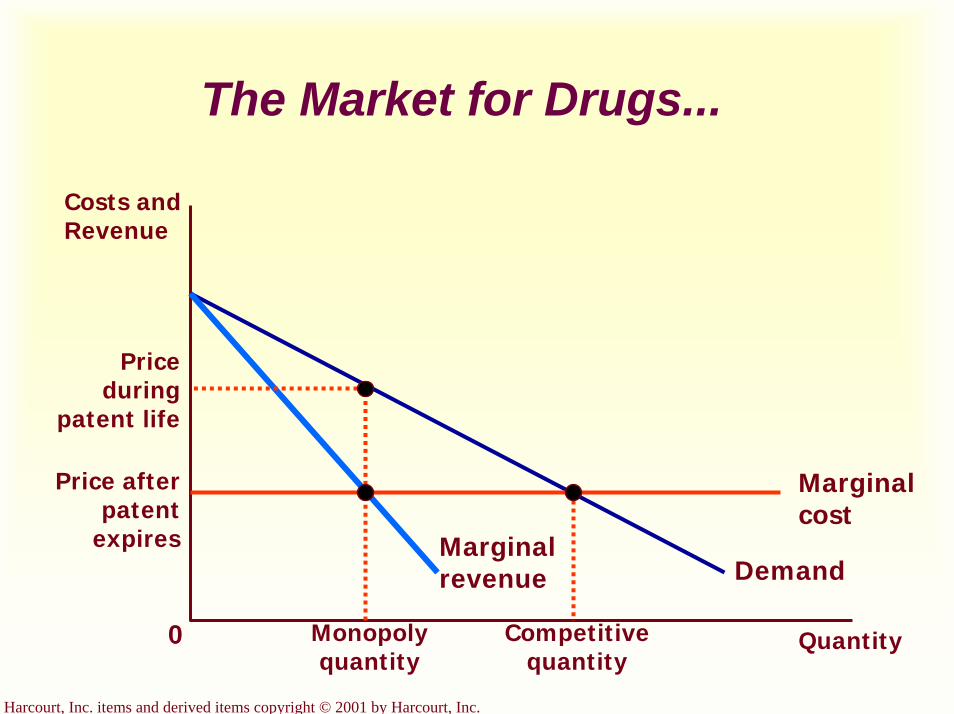
Harcourt, Inc. items and derived items copyright © 2001 by Harcourt, Inc.
The Market for Drugs...
Costs and Revenue
Price during
patent life
Price after patent
expires
Monopoly quantity
Competitive quantity
0 Quantity
Demand
Marginal cost
Marginal revenue

Harcourt, Inc. items and derived items copyright © 2001 by Harcourt, Inc.
The Efficient Level of Output...Price
0 Quantity
Marginal cost
Demand(value to buyers)
Efficientquantity
Cost to monopolist
Value to buyers
Value to
buyers
Cost to monopolist
Value to buyers is greater than cost to seller.
Value to buyers is less than cost to seller.
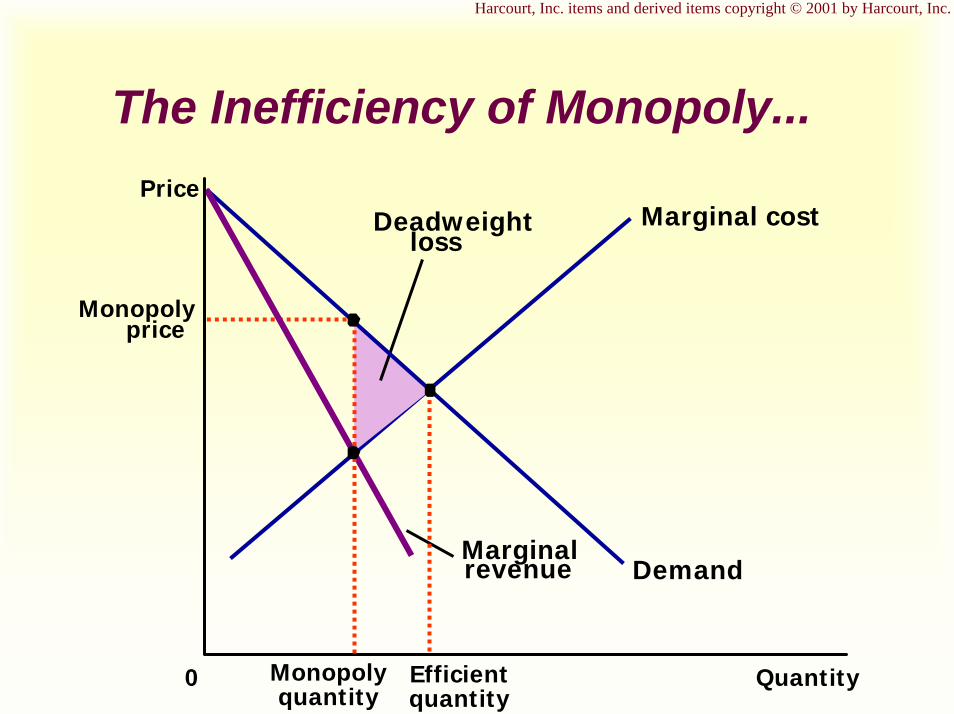
Harcourt, Inc. items and derived items copyright © 2001 by Harcourt, Inc.
The Inefficiency of Monopoly...
Quantity0
DemandMarginalrevenue
Marginal cost
Monopolyprice
Deadweightloss
Efficientquantity
Monopolyquantity
Price

Harcourt, Inc. items and derived items copyright © 2001 by Harcourt, Inc.
Marginal-Cost Pricing for a Natural Monopoly...
Regulatedprice
Quantity0
Loss
Price
Demand
Marginal cost
Average total costAverage
total cost
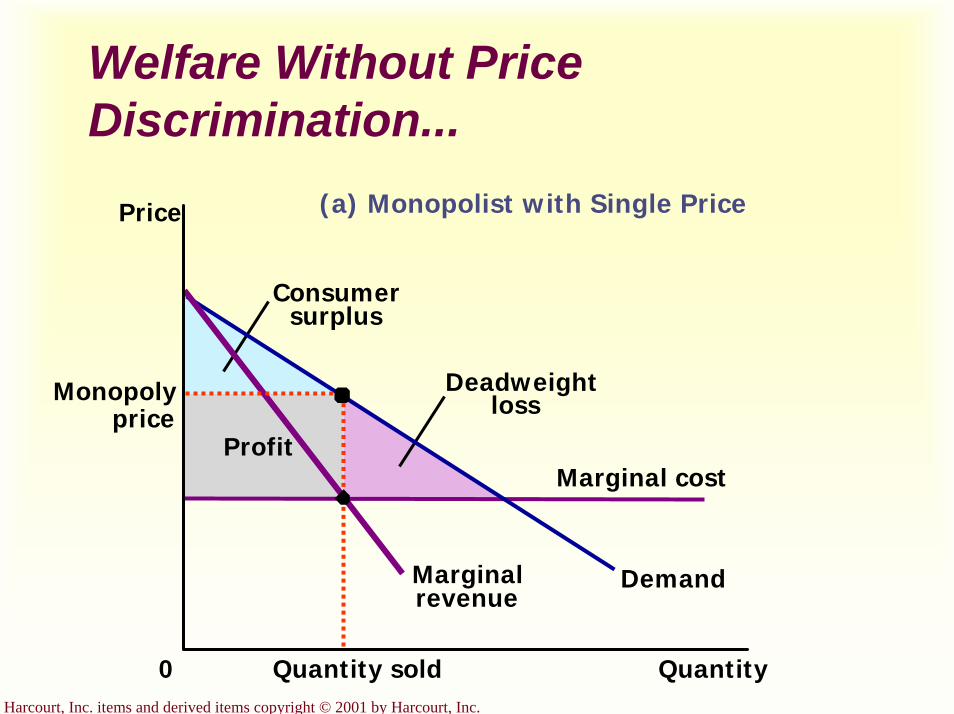
Harcourt, Inc. items and derived items copyright © 2001 by Harcourt, Inc.
Welfare Without Price Discrimination...
Deadweightloss
Consumersurplus
Price
0 Quantity
Profit
Demand
Marginal cost
Marginalrevenue
Quantity sold
Monopolyprice
(a) Monopolist with Single Price

Harcourt, Inc. items and derived items copyright © 2001 by Harcourt, Inc.
Welfare With Price Discrimination...
Price
0 Quantity
Demand
Marginal cost
Quantity sold
(b) Monopolist with Perfect Price Discrimination
Profit

Harcourt, Inc. items and derived items copyright © 2001 by Harcourt, Inc.
Oligopoly
Chapter 16
Copyright © 2001 by Harcourt, Inc.
All rights reserved. Requests for permission to make copies of any part of thework should be mailed to:
Permissions Department, Harcourt College Publishers,6277 Sea Harbor Drive, Orlando, Florida 32887-6777.
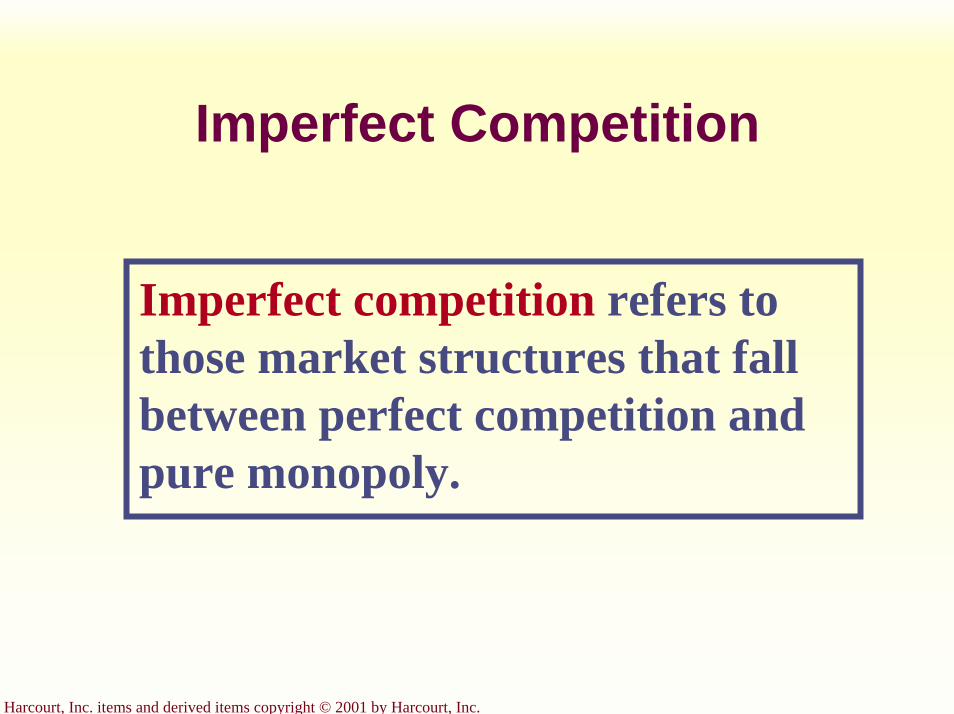
Harcourt, Inc. items and derived items copyright © 2001 by Harcourt, Inc.
Imperfect Competition
Imperfect competition refers to those market structures that fall between perfect competition and pure monopoly.
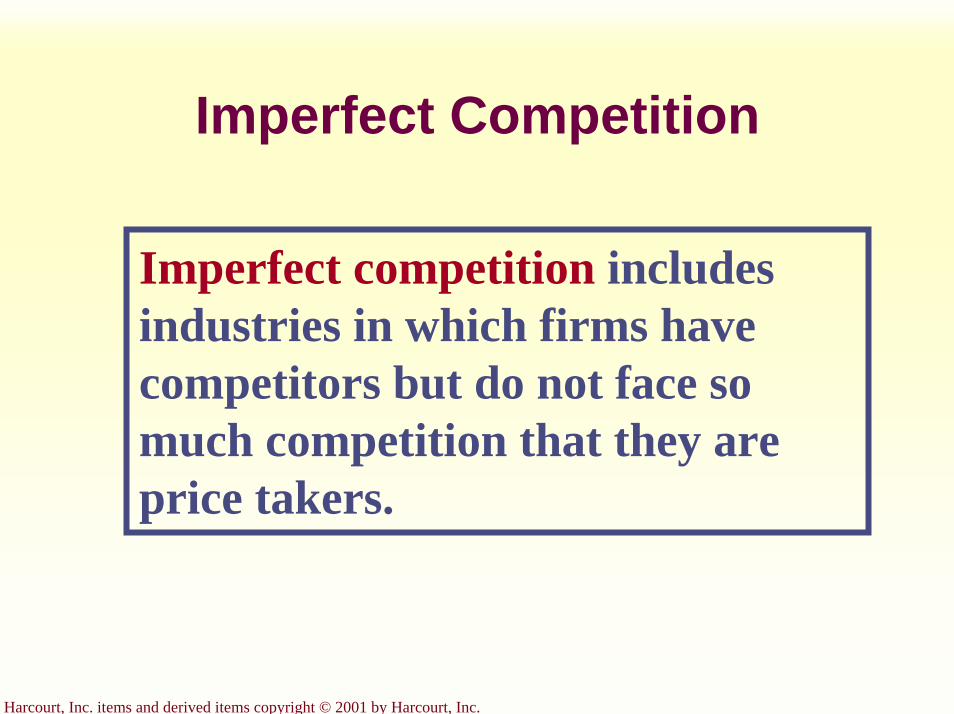
Harcourt, Inc. items and derived items copyright © 2001 by Harcourt, Inc.
Imperfect Competition
Imperfect competition includes industries in which firms have competitors but do not face so much competition that they are price takers.
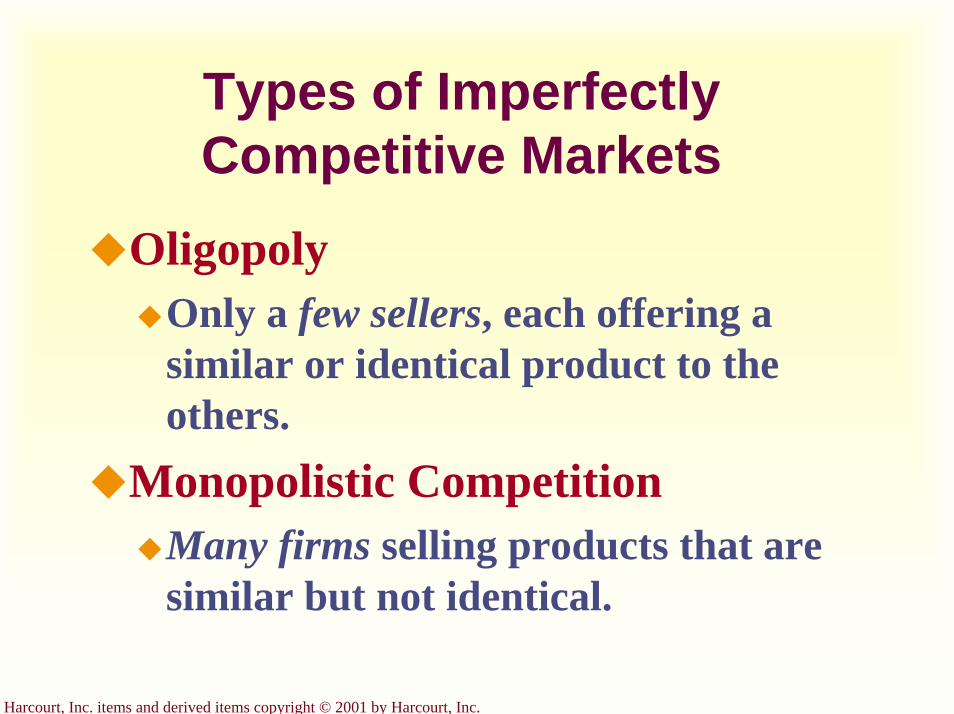
Harcourt, Inc. items and derived items copyright © 2001 by Harcourt, Inc.
Types of Imperfectly Competitive Markets
OligopolyOnly a few sellers, each offering a similar or identical product to the others.
Monopolistic CompetitionMany firms selling products that are similar but not identical.
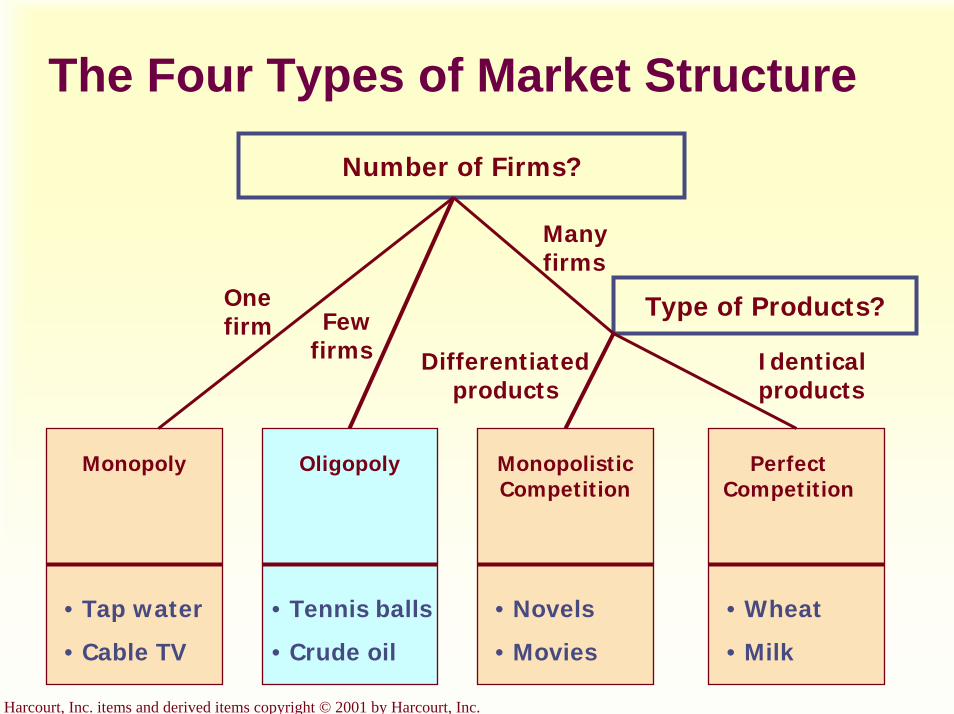
Harcourt, Inc. items and derived items copyright © 2001 by Harcourt, Inc.
The Four Types of Market Structure
Monopoly Oligopoly Monopolistic Competition
Perfect Competition
• Tap water
• Cable TV
• Tennis balls
• Crude oil
• Novels
• Movies
• Wheat
• Milk
Number of Firms?
Type of Products?
Many firms
One firm Few
firms Differentiated products
Identical products
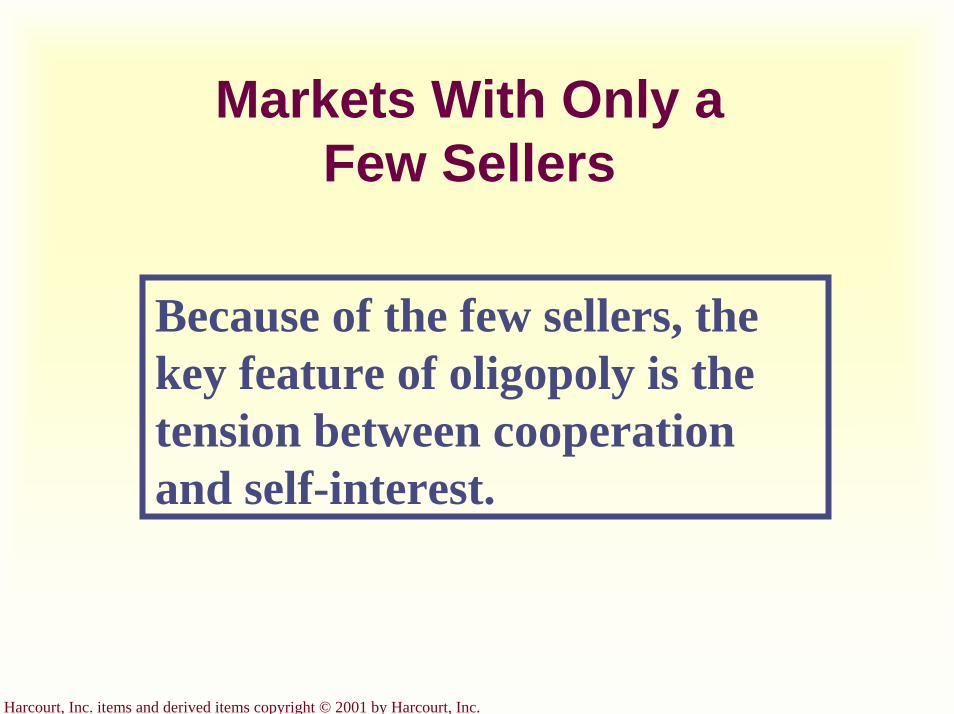
Harcourt, Inc. items and derived items copyright © 2001 by Harcourt, Inc.
Markets With Only a Few Sellers
Because of the few sellers, the key feature of oligopoly is the tension between cooperation and self-interest.
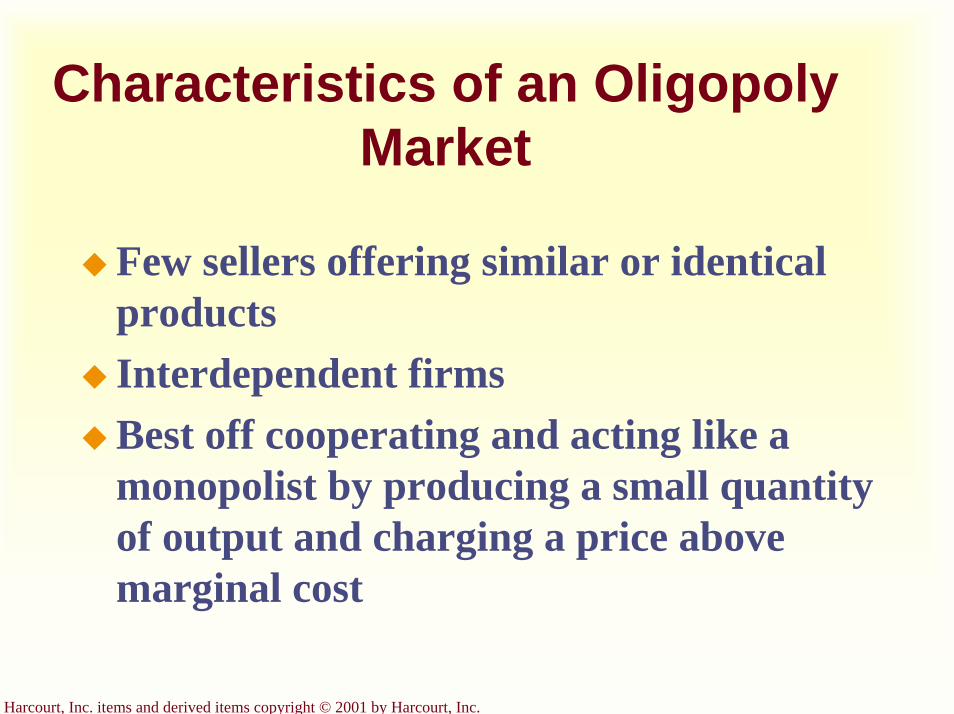
Harcourt, Inc. items and derived items copyright © 2001 by Harcourt, Inc.
Characteristics of an Oligopoly Market
Few sellers offering similar or identical productsInterdependent firmsBest off cooperating and acting like a monopolist by producing a small quantity of output and charging a price above marginal cost
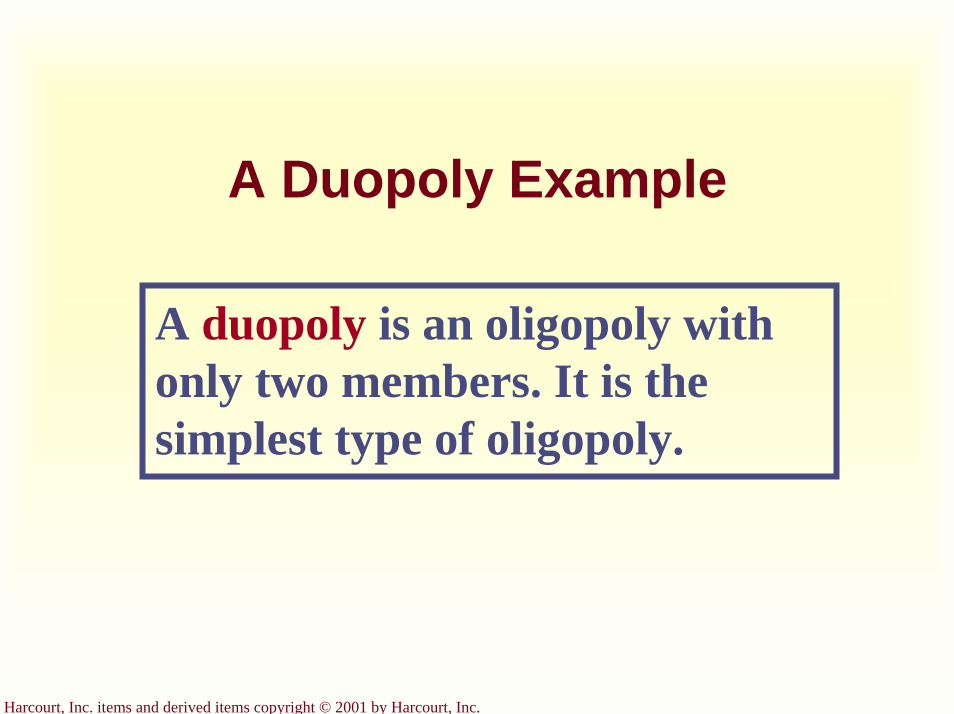
Harcourt, Inc. items and derived items copyright © 2001 by Harcourt, Inc.
A Duopoly Example
A duopoly is an oligopoly with only two members. It is the simplest type of oligopoly.
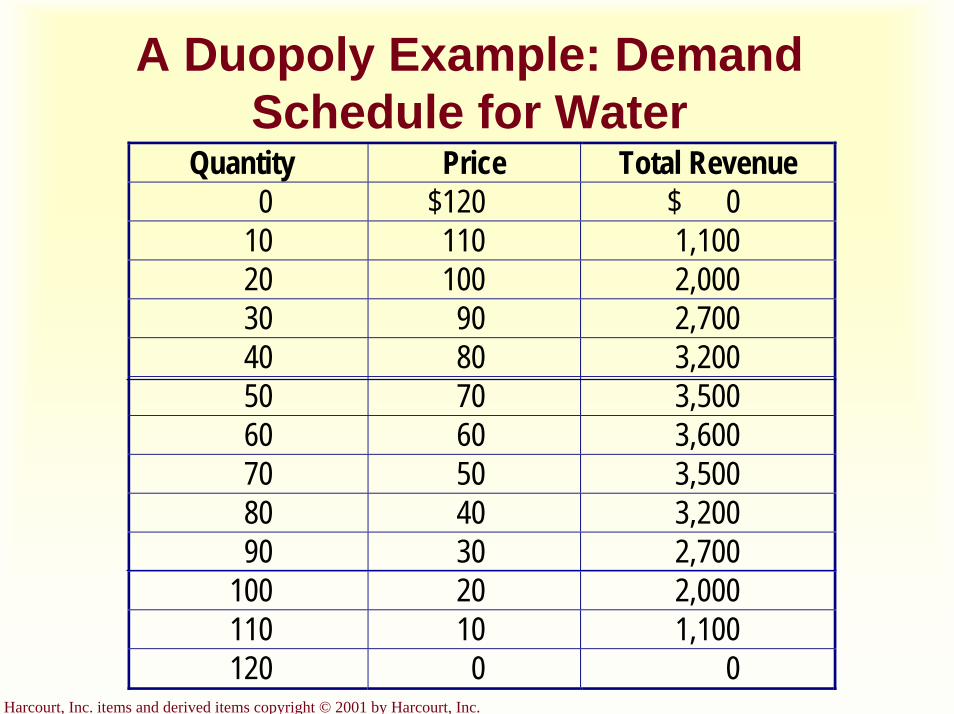
Harcourt, Inc. items and derived items copyright © 2001 by Harcourt, Inc.
A Duopoly Example: Demand Schedule for Water
Quantity Price Total Revenue0 $120 $ 0
10 110 1,10020 100 2,00030 90 2,70040 80 3,20050 70 3,50060 60 3,60070 50 3,50080 40 3,20090 30 2,700
100 20 2,000110 10 1,100120 0 0
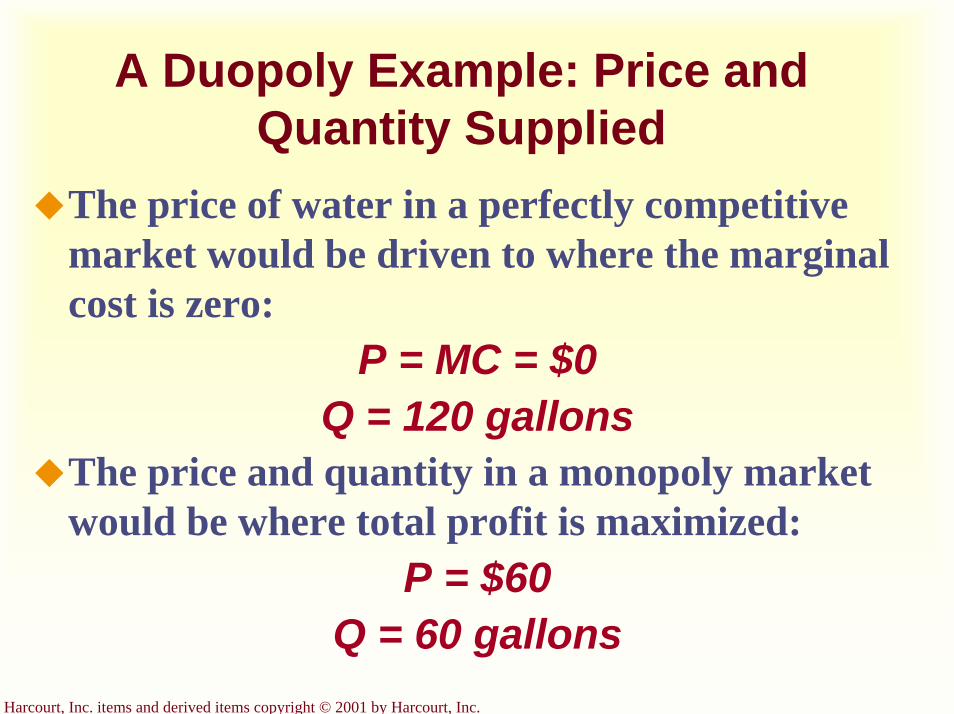
Harcourt, Inc. items and derived items copyright © 2001 by Harcourt, Inc.
A Duopoly Example: Price andQuantity Supplied
The price of water in a perfectly competitive market would be driven to where the marginal cost is zero:
P = MC = $0Q = 120 gallons
The price and quantity in a monopoly market would be where total profit is maximized:
P = $60Q = 60 gallons
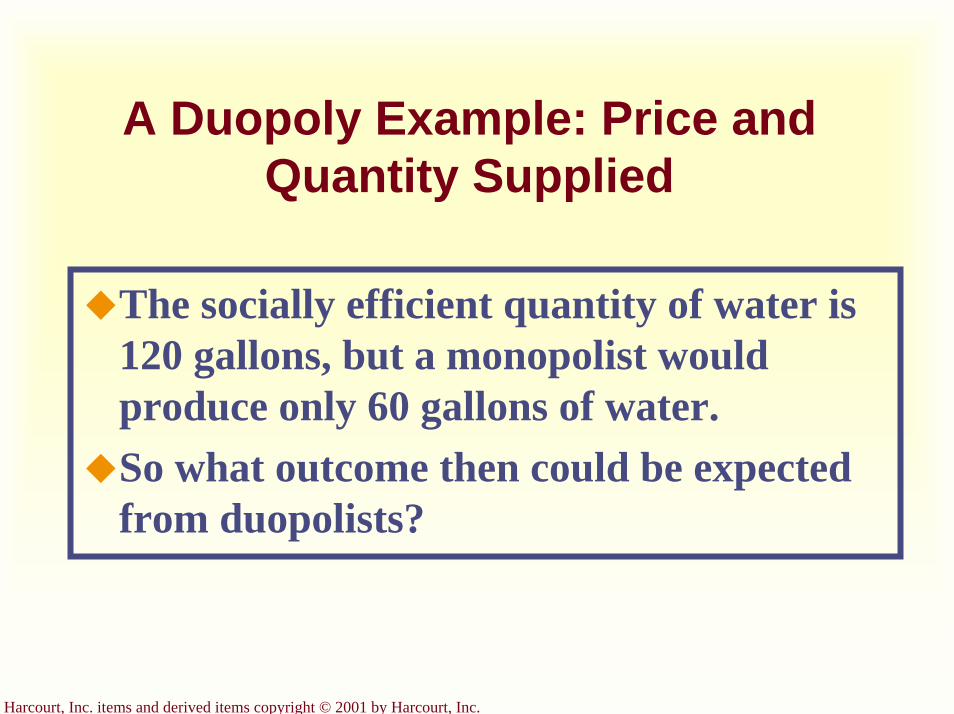
Harcourt, Inc. items and derived items copyright © 2001 by Harcourt, Inc.
A Duopoly Example: Price andQuantity Supplied
The socially efficient quantity of water is 120 gallons, but a monopolist would produce only 60 gallons of water.So what outcome then could be expected from duopolists?
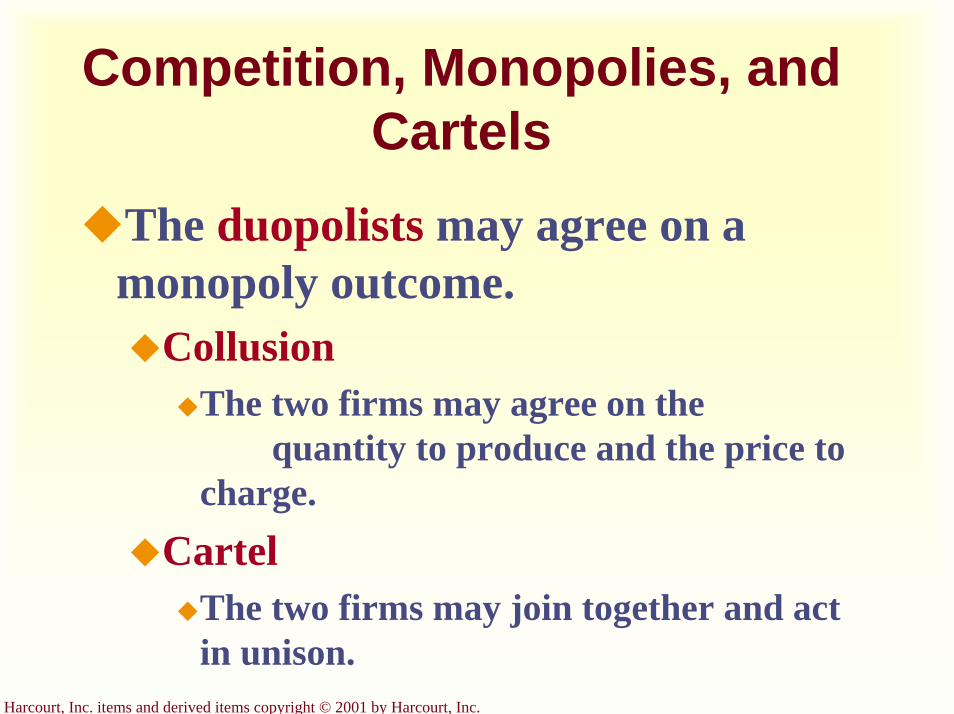
Harcourt, Inc. items and derived items copyright © 2001 by Harcourt, Inc.
Competition, Monopolies, and Cartels
The duopolists may agree on a monopoly outcome.
CollusionThe two firms may agree on the
quantity to produce and the price to charge.
CartelThe two firms may join together and act in unison.
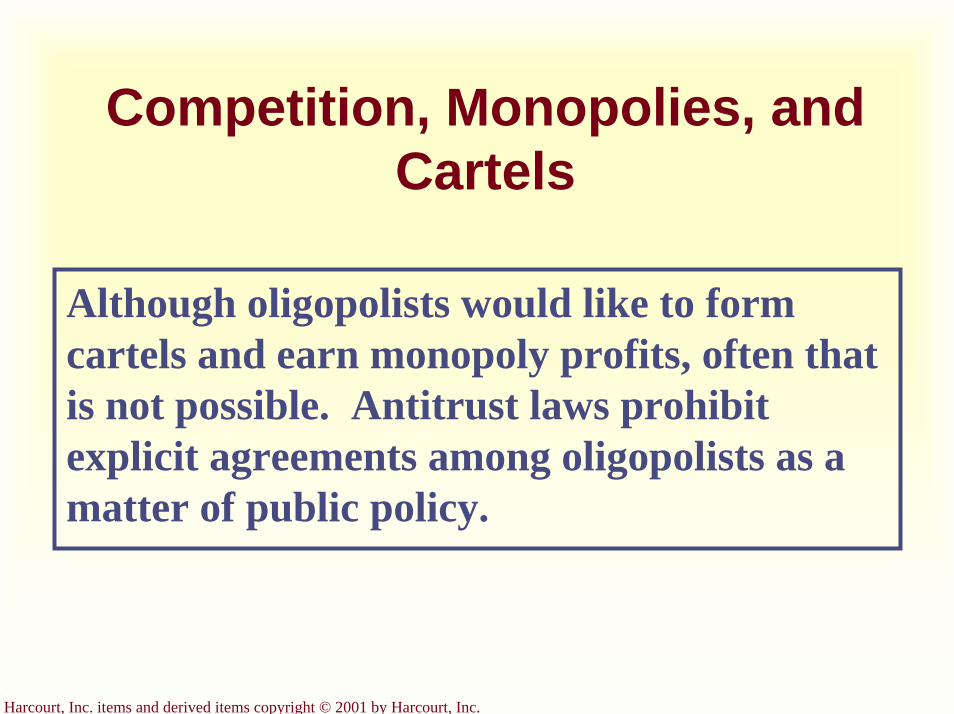
Harcourt, Inc. items and derived items copyright © 2001 by Harcourt, Inc.
Competition, Monopolies, and Cartels
Although oligopolists would like to form cartels and earn monopoly profits, often that is not possible. Antitrust laws prohibit explicit agreements among oligopolists as a matter of public policy.
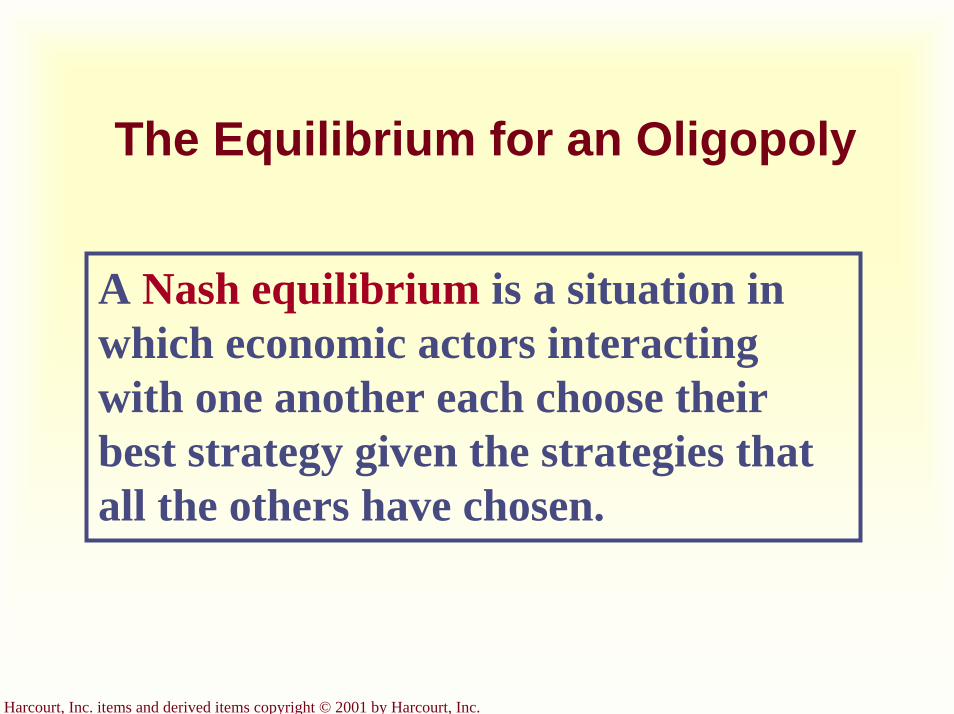
Harcourt, Inc. items and derived items copyright © 2001 by Harcourt, Inc.
The Equilibrium for an Oligopoly
A Nash equilibrium is a situation in which economic actors interacting with one another each choose their best strategy given the strategies that all the others have chosen.
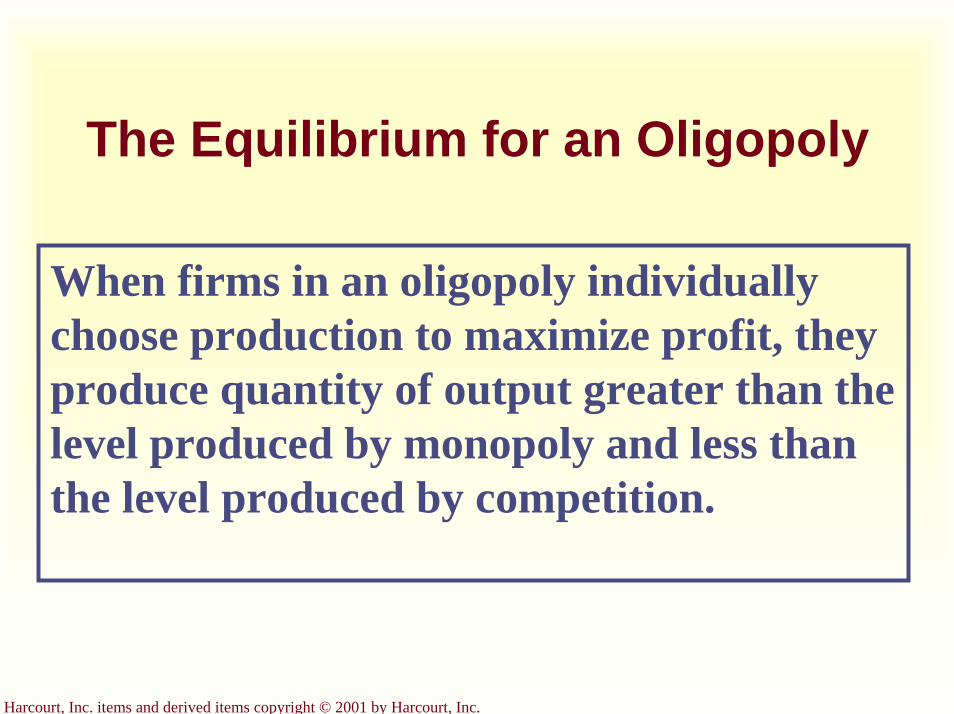
Harcourt, Inc. items and derived items copyright © 2001 by Harcourt, Inc.
The Equilibrium for an Oligopoly
When firms in an oligopoly individually choose production to maximize profit, they produce quantity of output greater than the level produced by monopoly and less than the level produced by competition.
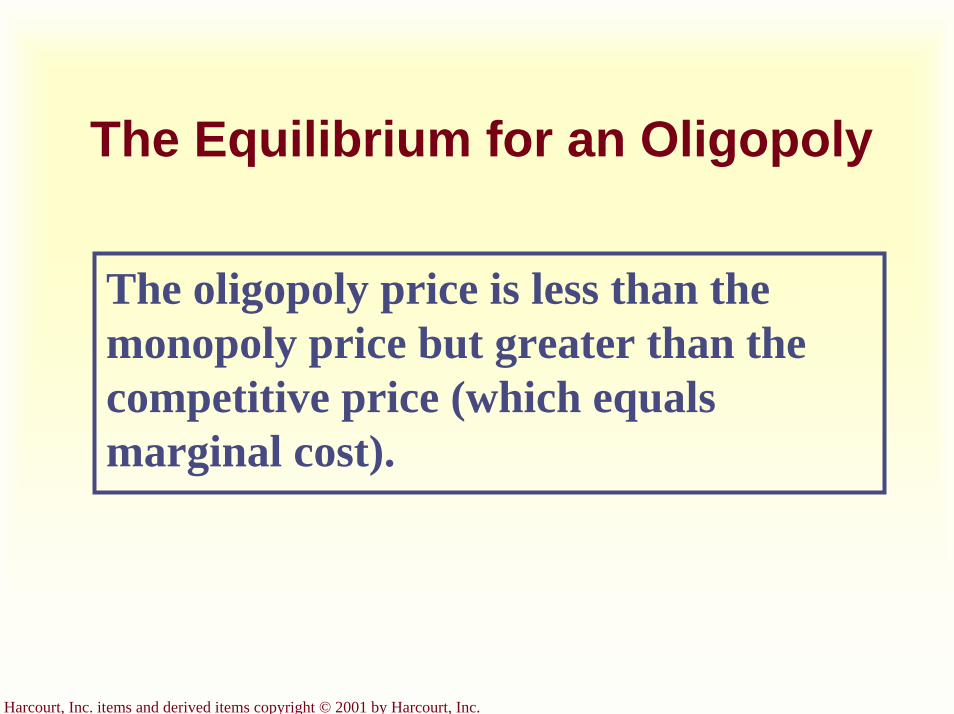
Harcourt, Inc. items and derived items copyright © 2001 by Harcourt, Inc.
The Equilibrium for an Oligopoly
The oligopoly price is less than the monopoly price but greater than the competitive price (which equals marginal cost).
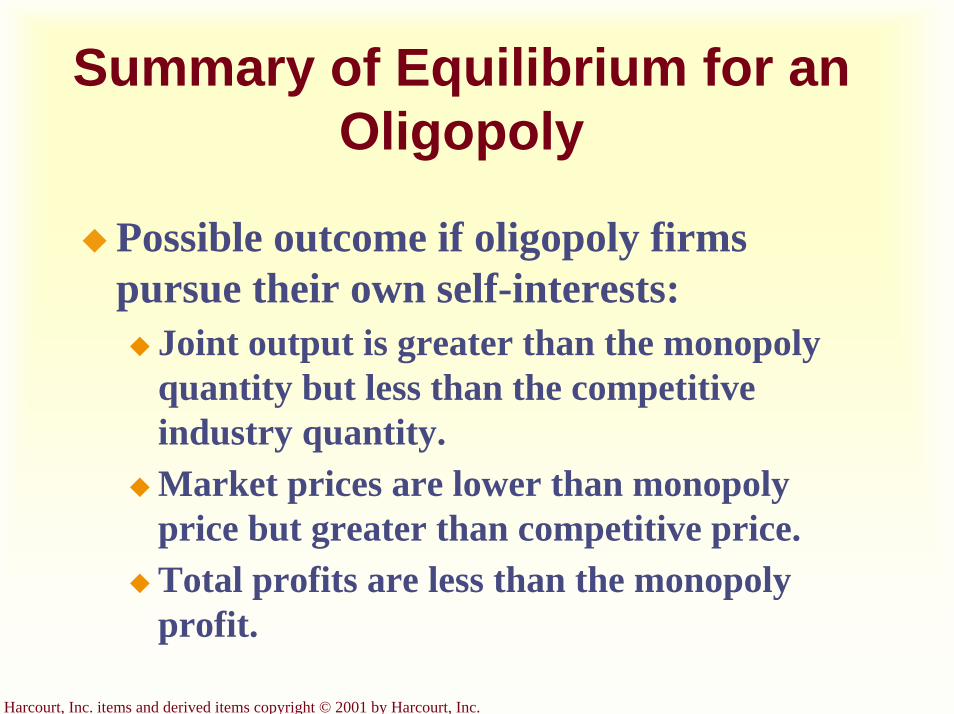
Harcourt, Inc. items and derived items copyright © 2001 by Harcourt, Inc.
Summary of Equilibrium for an Oligopoly
Possible outcome if oligopoly firms pursue their own self-interests:
Joint output is greater than the monopoly quantity but less than the competitive industry quantity.Market prices are lower than monopoly price but greater than competitive price.Total profits are less than the monopoly profit.
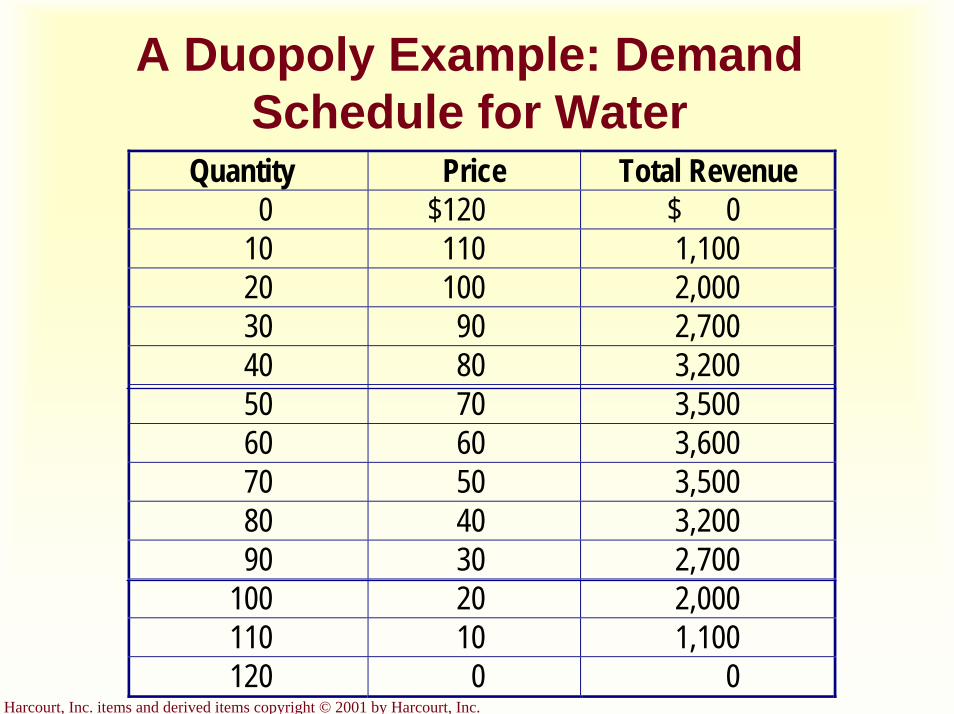
Harcourt, Inc. items and derived items copyright © 2001 by Harcourt, Inc.
A Duopoly Example: Demand Schedule for Water
Quantity Price Total Revenue0 $120 $ 0
10 110 1,10020 100 2,00030 90 2,70040 80 3,20050 70 3,50060 60 3,60070 50 3,50080 40 3,20090 30 2,700
100 20 2,000110 10 1,100120 0 0
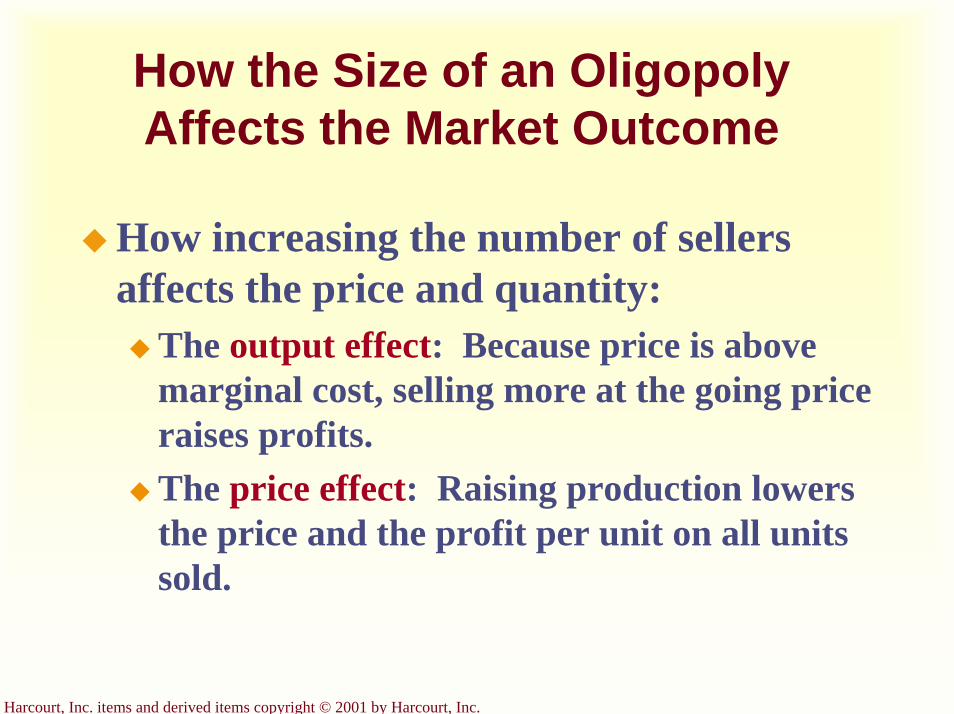
Harcourt, Inc. items and derived items copyright © 2001 by Harcourt, Inc.
How the Size of an Oligopoly Affects the Market Outcome
How increasing the number of sellers affects the price and quantity:
The output effect: Because price is above marginal cost, selling more at the going price raises profits.The price effect: Raising production lowers the price and the profit per unit on all units sold.
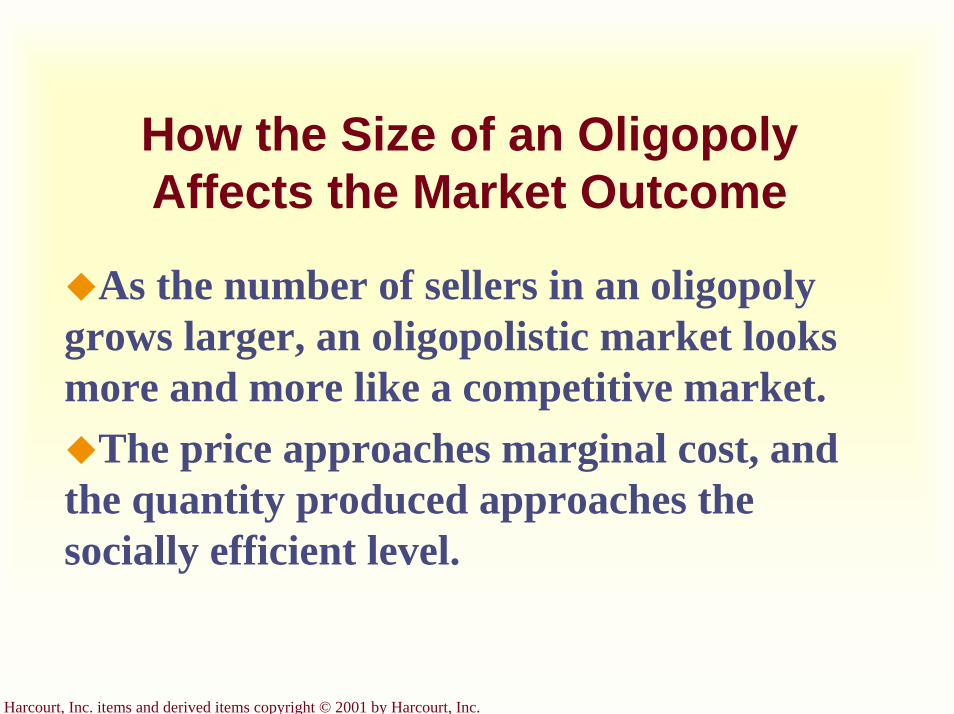
Harcourt, Inc. items and derived items copyright © 2001 by Harcourt, Inc.
How the Size of an Oligopoly Affects the Market Outcome
As the number of sellers in an oligopoly grows larger, an oligopolistic market looks more and more like a competitive market.
The price approaches marginal cost, and the quantity produced approaches the socially efficient level.
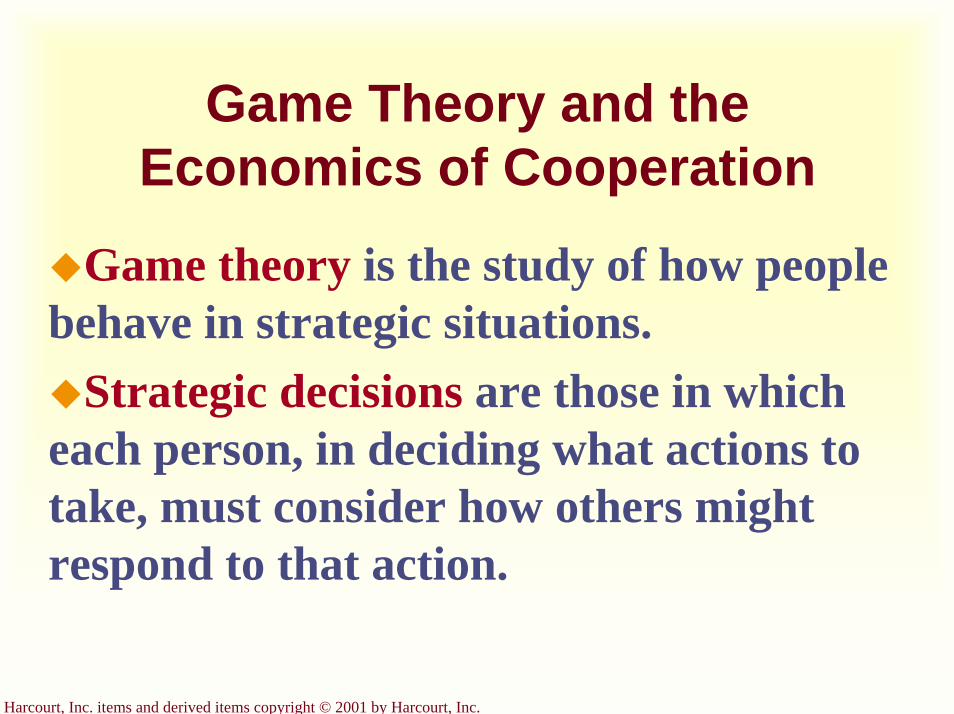
Harcourt, Inc. items and derived items copyright © 2001 by Harcourt, Inc.
Game Theory and the Economics of Cooperation
Game theory is the study of how people behave in strategic situations.
Strategic decisions are those in which each person, in deciding what actions to take, must consider how others might respond to that action.
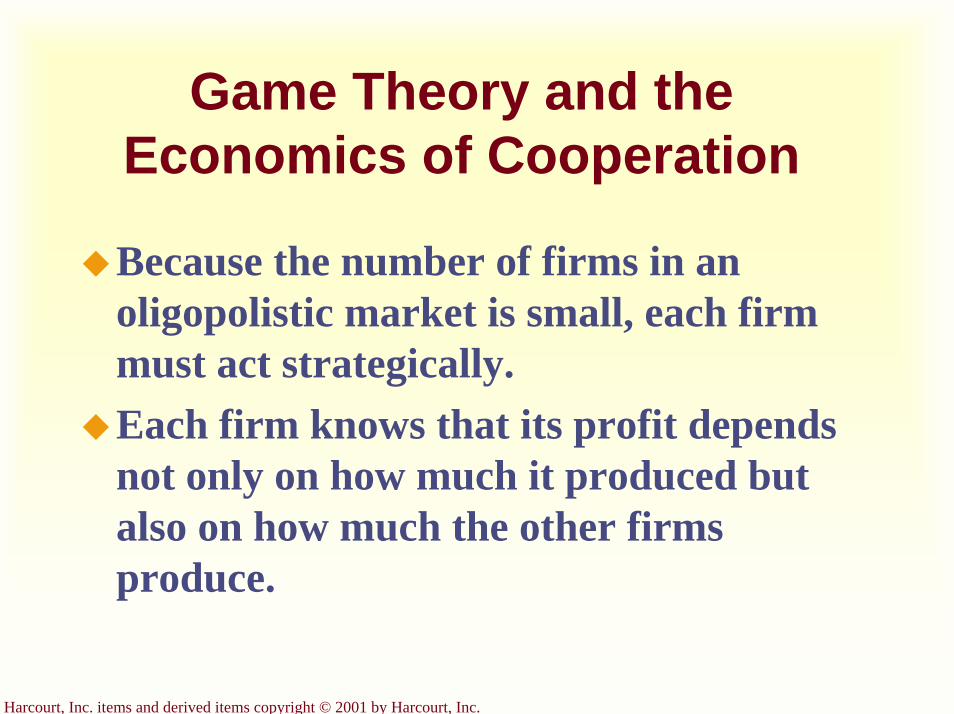
Harcourt, Inc. items and derived items copyright © 2001 by Harcourt, Inc.
Game Theory and the Economics of Cooperation
Because the number of firms in anoligopolistic market is small, each firm must act strategically. Each firm knows that its profit depends not only on how much it produced but also on how much the other firms produce.
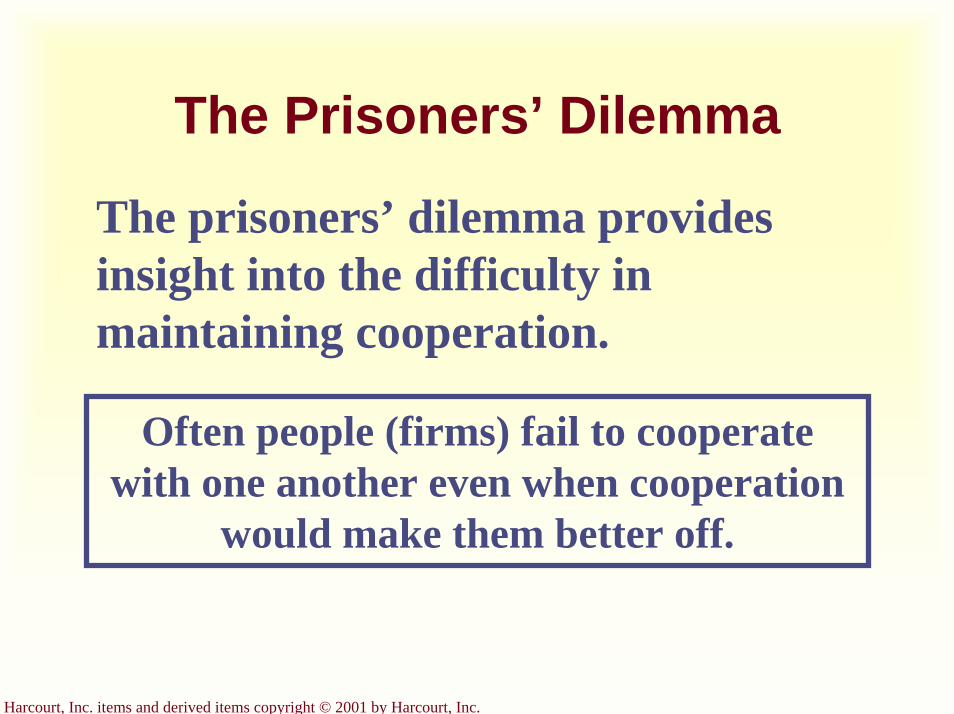
Harcourt, Inc. items and derived items copyright © 2001 by Harcourt, Inc.
The Prisoners’ Dilemma
The prisoners’ dilemma provides insight into the difficulty in maintaining cooperation.
Often people (firms) fail to cooperate with one another even when cooperation
would make them better off.

Harcourt, Inc. items and derived items copyright © 2001 by Harcourt, Inc.
The Prisoners’ DilemmaBonnie’s Decision
Confess Remain Silent
Confess
Remain Silent
Clyde gets8 years
Bonnie gets8 years
Bonnie gets20 years
Bonnie gets1 year
Bonnie goes free
Clyde gets20 years
Clyde gets1 year
Clyde goes freeClyde’s
Decision
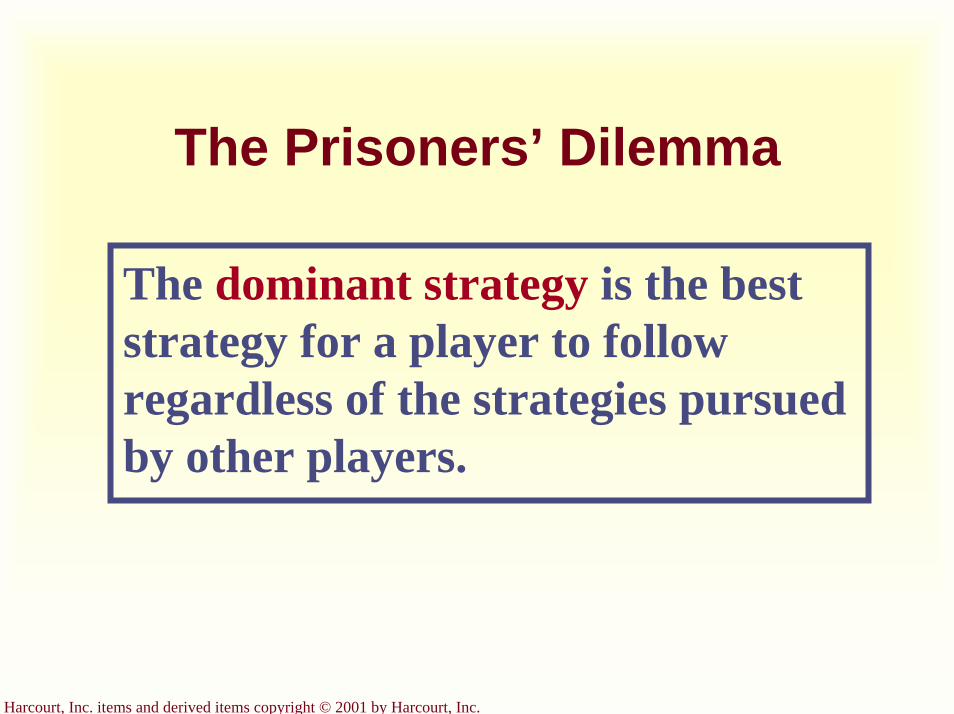
Harcourt, Inc. items and derived items copyright © 2001 by Harcourt, Inc.
The Prisoners’ Dilemma
The dominant strategy is the best strategy for a player to follow regardless of the strategies pursued by other players.
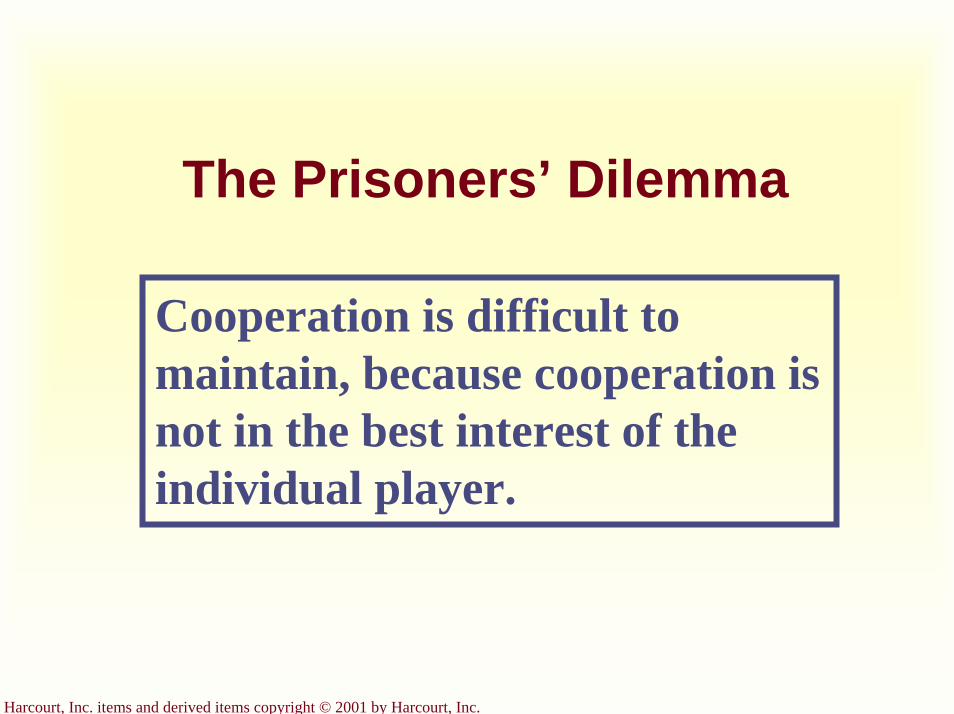
Harcourt, Inc. items and derived items copyright © 2001 by Harcourt, Inc.
The Prisoners’ Dilemma
Cooperation is difficult to maintain, because cooperation is not in the best interest of the individual player.

Harcourt, Inc. items and derived items copyright © 2001 by Harcourt, Inc.
Oligopolies as a Prisoners’ Dilemma
Iraq’s Decision
High Production Low Production
High Production
Low Production
Iran gets$40 billion
Iraq gets$40 billion
Iraq gets$30 billion
Iraq gets$50 billion
Iraq gets $60 billion
Iran gets$30 billion
Iran gets$50 billion
Iran gets $60 billionIran’s
Decision
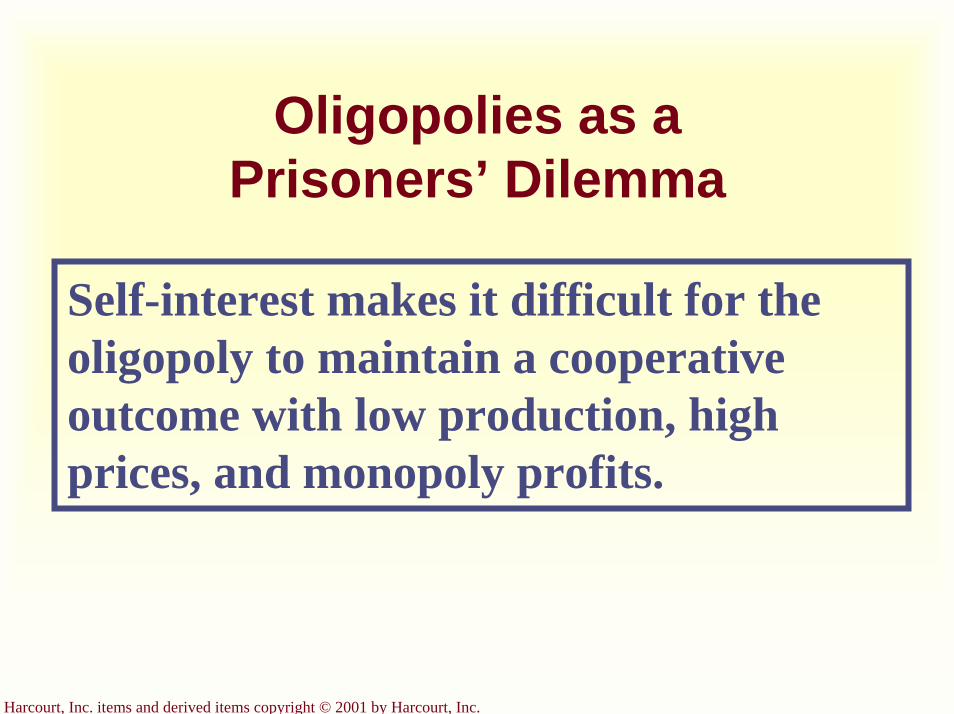
Harcourt, Inc. items and derived items copyright © 2001 by Harcourt, Inc.
Oligopolies as a Prisoners’ Dilemma
Self-interest makes it difficult for the oligopoly to maintain a cooperative outcome with low production, high prices, and monopoly profits.

Harcourt, Inc. items and derived items copyright © 2001 by Harcourt, Inc.
An Arms-Race GameDecision of the United States (U.S.)
Arm Disarm
Arm
Disarm
USSR at risk
U.S. at risk U.S. at risk and weak
U.S. safeU.S. safe and powerful
USSR at risk and weak
USSR safe
USSR safe and powerful
Decision of the Soviet Union
(USSR)

Harcourt, Inc. items and derived items copyright © 2001 by Harcourt, Inc.
An Advertising GameMarlboro’s Decision
Advertise Don’t Advertise
Advertise
Don’t Advertise
Camel gets $3 billion profit
Marlboro gets $3 billion
profit
Marlboro gets $2
billion profit
Marlboro gets $4 billion
profit
Marlboro gets $5 billion
profitCamel gets $2 billion profit
Camel gets $4 billion profit
Camel gets $5 billion profitCamel’s
Decision

Harcourt, Inc. items and derived items copyright © 2001 by Harcourt, Inc.
A Common-Resources GameExxon’s Decision
Drill Two Wells Drill One Well
Drill Two Wells
Drill One Well
Arco gets $4 million profit
Exxon gets $4 million
profit
Exxon gets $3 million
profit
Exxon gets $5 million profit
Exxon gets $6 million
profitArco gets $3 million profit
Arco gets $5 million profit
Arco gets $6 million profitArco’s
Decision
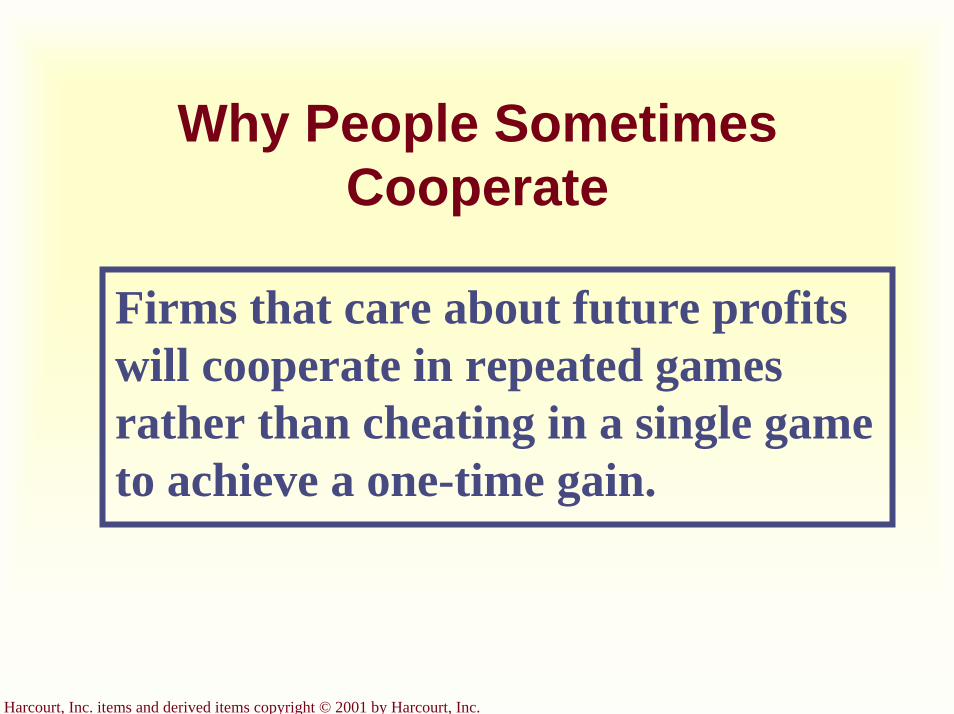
Harcourt, Inc. items and derived items copyright © 2001 by Harcourt, Inc.
Why People Sometimes Cooperate
Firms that care about future profits will cooperate in repeated games rather than cheating in a single game to achieve a one-time gain.

Harcourt, Inc. items and derived items copyright © 2001 by Harcourt, Inc.
Jack and Jill’s Oligopoly GameJack’s Decision
Sell 40 gallons Sell 30 gallons
Sell 40 gallons
Sell 30 gallons
Jill gets $1,600 profit
Jack gets $1,600 profit
Jack gets $1,500 profit
Jack gets $1,800 profit
Jack gets $2,000 profit
Jill gets $1,500 profit
Jill gets $1,800 profit
Jill gets $2,000 profitJill’s
Decision
Harcourt, Inc. items and derived items copyright © 2001 by Harcourt, Inc.
Public Policy Toward Oligopolies
Cooperation among oligopolists is undesirable from the standpoint of society as a whole because it leads to production that is too low and prices that are too high.
Harcourt, Inc. items and derived items copyright © 2001 by Harcourt, Inc.
Restraint of Trade and the Antitrust Laws
Antitrust laws make it illegal to restrain trade or attempt to monopolize a market.
Sherman Antitrust Act of 1890 Clayton Act of 1914
Harcourt, Inc. items and derived items copyright © 2001 by Harcourt, Inc.
Controversies over Antitrust Policy
Antitrust policies sometimes may not allow business practices that have potentially positive effects:
Resale price maintenance Predatory pricingTying
Harcourt, Inc. items and derived items copyright © 2001 by Harcourt, Inc.
Resale Price Maintenance
Resale price maintenance (or fair trade) occurs when suppliers (like wholesalers) require the retailers that they sell to, to charge customers a specific amount.
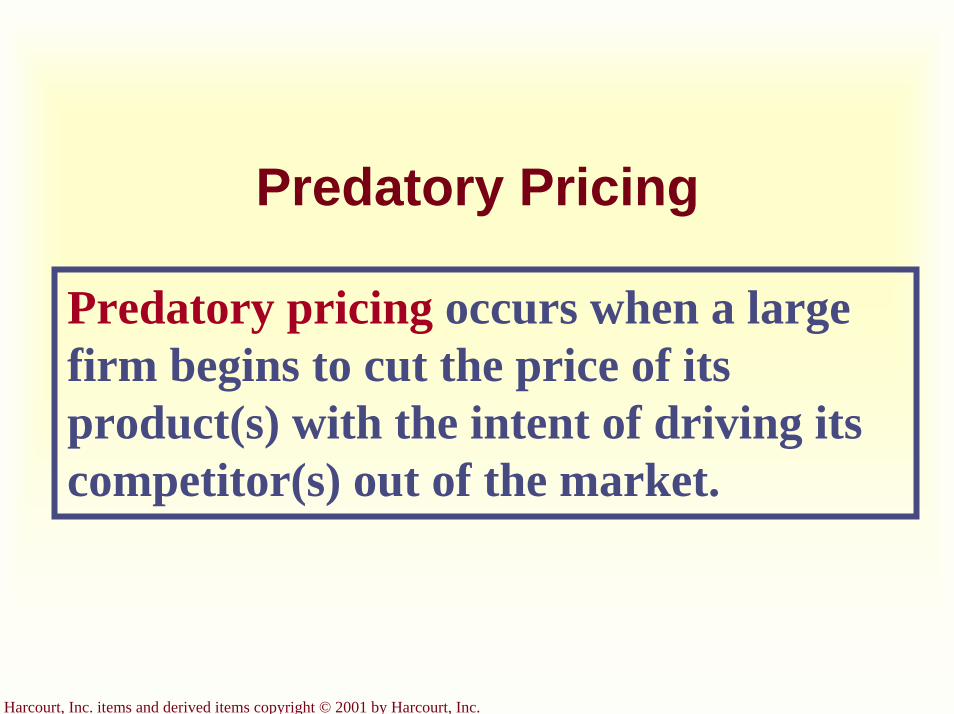
Harcourt, Inc. items and derived items copyright © 2001 by Harcourt, Inc.
Predatory Pricing
Predatory pricing occurs when a large firm begins to cut the price of its product(s) with the intent of driving its competitor(s) out of the market.
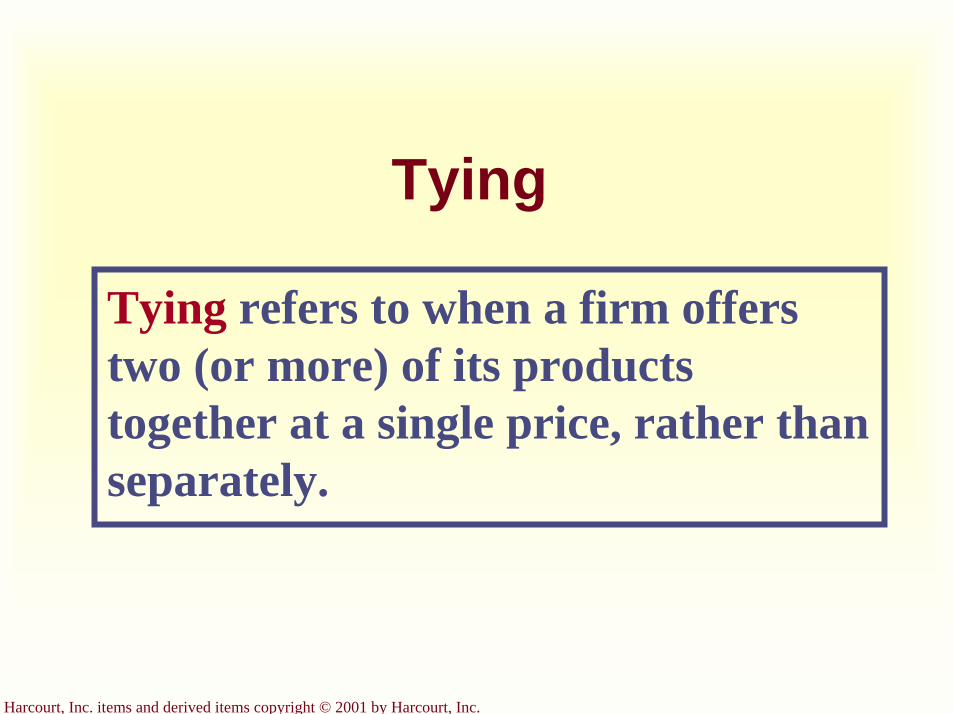
Harcourt, Inc. items and derived items copyright © 2001 by Harcourt, Inc.
Tying
Tying refers to when a firm offers two (or more) of its products together at a single price, rather than separately.
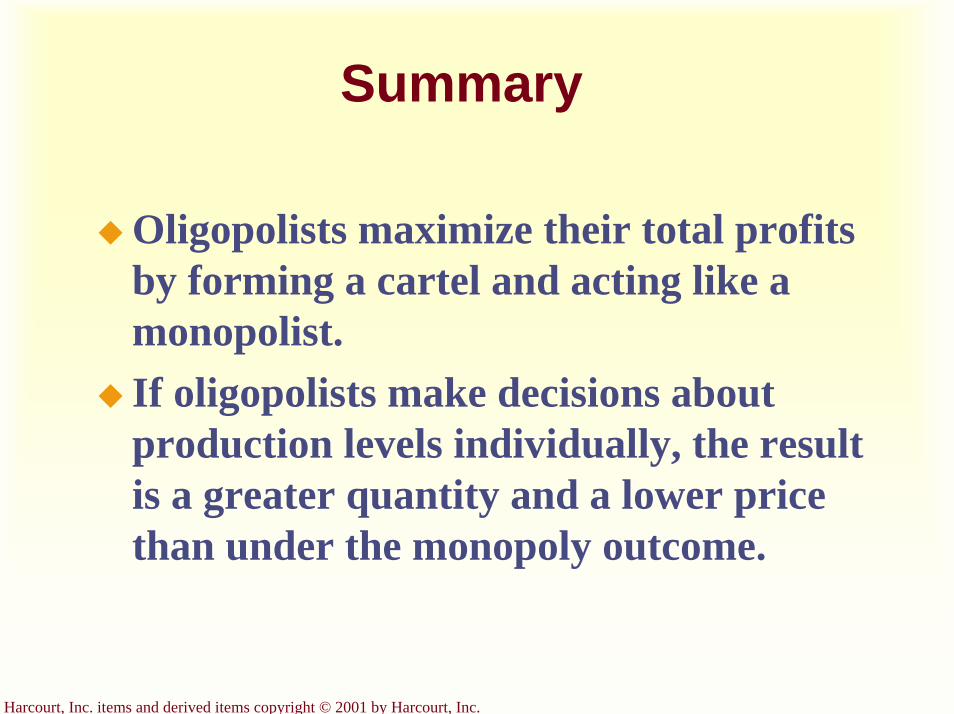
Harcourt, Inc. items and derived items copyright © 2001 by Harcourt, Inc.
Summary
Oligopolists maximize their total profits by forming a cartel and acting like a monopolist.If oligopolists make decisions about production levels individually, the result is a greater quantity and a lower price than under the monopoly outcome.
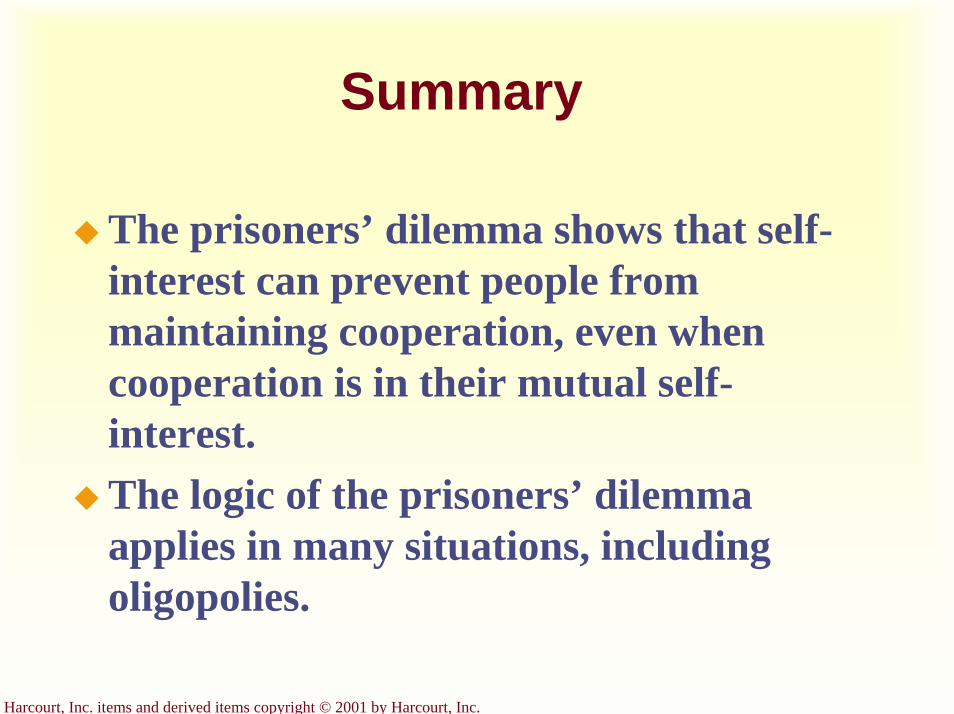
Harcourt, Inc. items and derived items copyright © 2001 by Harcourt, Inc.
Summary
The prisoners’ dilemma shows that self-interest can prevent people from maintaining cooperation, even when cooperation is in their mutual self-interest. The logic of the prisoners’ dilemma applies in many situations, including oligopolies.
Harcourt, Inc. items and derived items copyright © 2001 by Harcourt, Inc.
Summary
Policymakers use the antitrust laws to prevent oligopolies from engaging in behavior that reduces competition.

Harcourt, Inc. items and derived items copyright © 2001 by Harcourt, Inc.
Graphical Review

Harcourt, Inc. items and derived items copyright © 2001 by Harcourt, Inc.
The Four Types of Market Structure
Monopoly Oligopoly Monopolistic Competition
Perfect Competition
• Tap water
• Cable TV
• Tennis balls
• Crude oil
• Novels
• Movies
• Wheat
• Milk
Number of Firms?
Type of Products?
Many firms
One firm Few
firms Differentiated products
Identical products
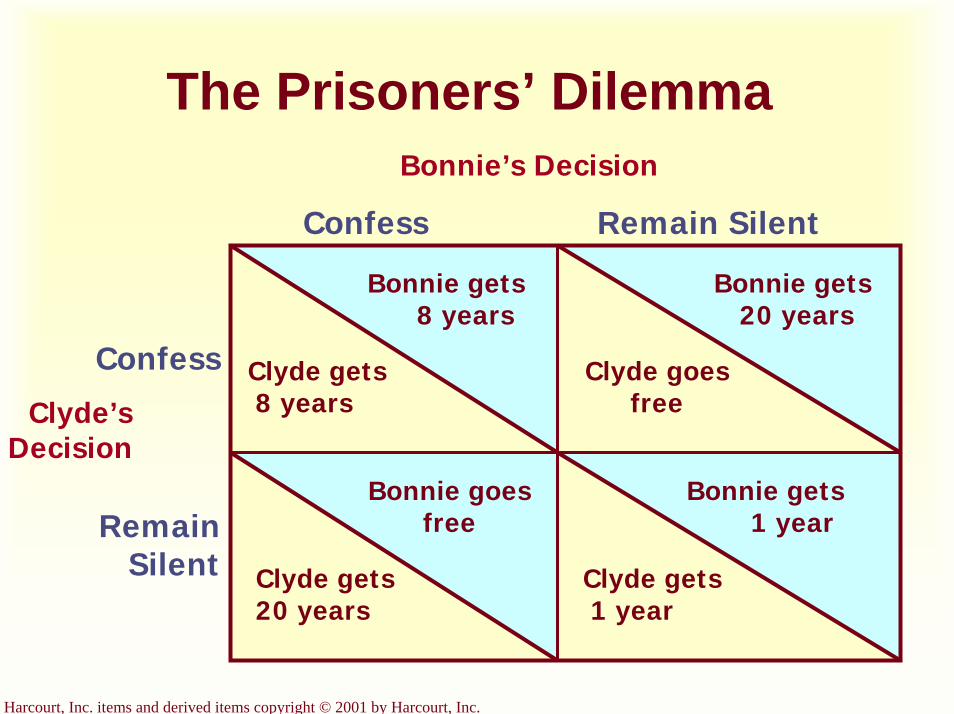
Harcourt, Inc. items and derived items copyright © 2001 by Harcourt, Inc.
The Prisoners’ DilemmaBonnie’s Decision
Confess Remain Silent
Confess
Remain Silent
Clyde’sDecision
Clyde gets8 years
Bonnie gets8 years
Bonnie gets20 years
Bonnie gets1 year
Bonnie goes free
Clyde gets20 years
Clyde gets1 year
Clyde goes free
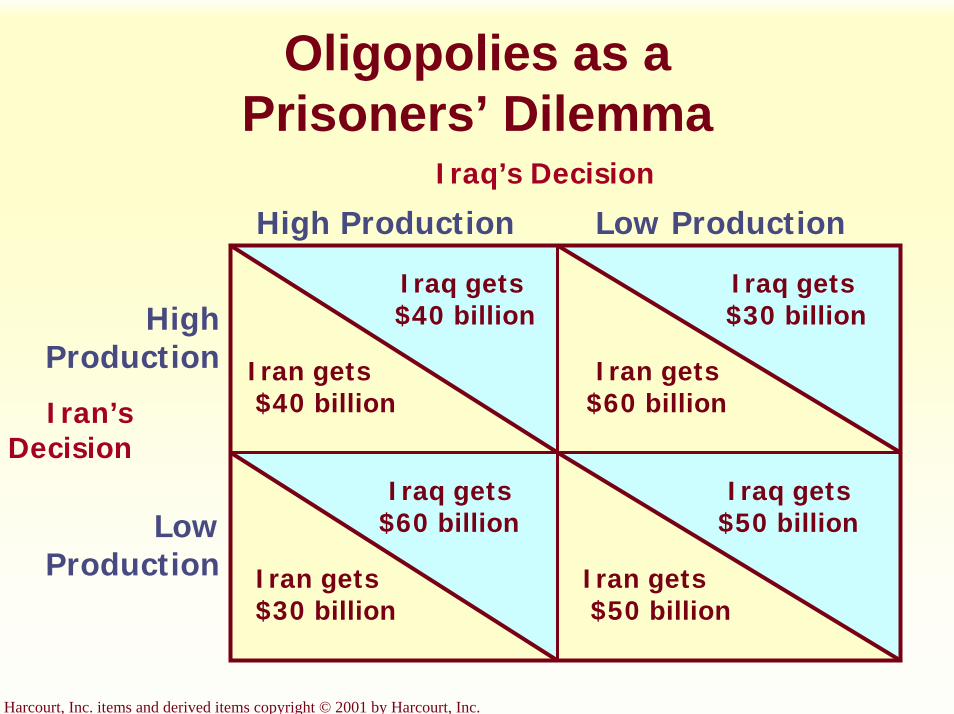
Harcourt, Inc. items and derived items copyright © 2001 by Harcourt, Inc.
Oligopolies as a Prisoners’ Dilemma
Iraq’s Decision
High Production Low Production
High Production
Low Production
Iran’s Decision
Iran gets$40 billion
Iraq gets$40 billion
Iraq gets$30 billion
Iraq gets$50 billion
Iraq gets $60 billion
Iran gets$30 billion
Iran gets$50 billion
Iran gets $60 billion
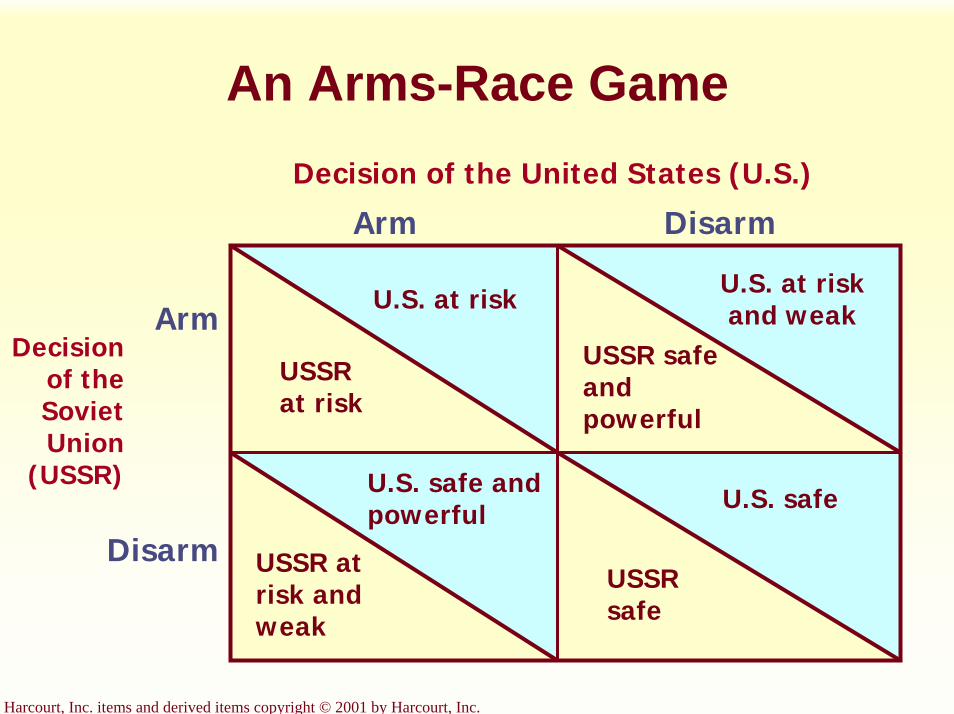
Harcourt, Inc. items and derived items copyright © 2001 by Harcourt, Inc.
An Arms-Race GameDecision of the United States (U.S.)
Arm Disarm
Arm
Disarm
Decision of the Soviet Union
(USSR)
USSR at risk
U.S. at risk U.S. at risk and weak
U.S. safeU.S. safe and powerful
USSR at risk and weak
USSR safe
USSR safe and powerful
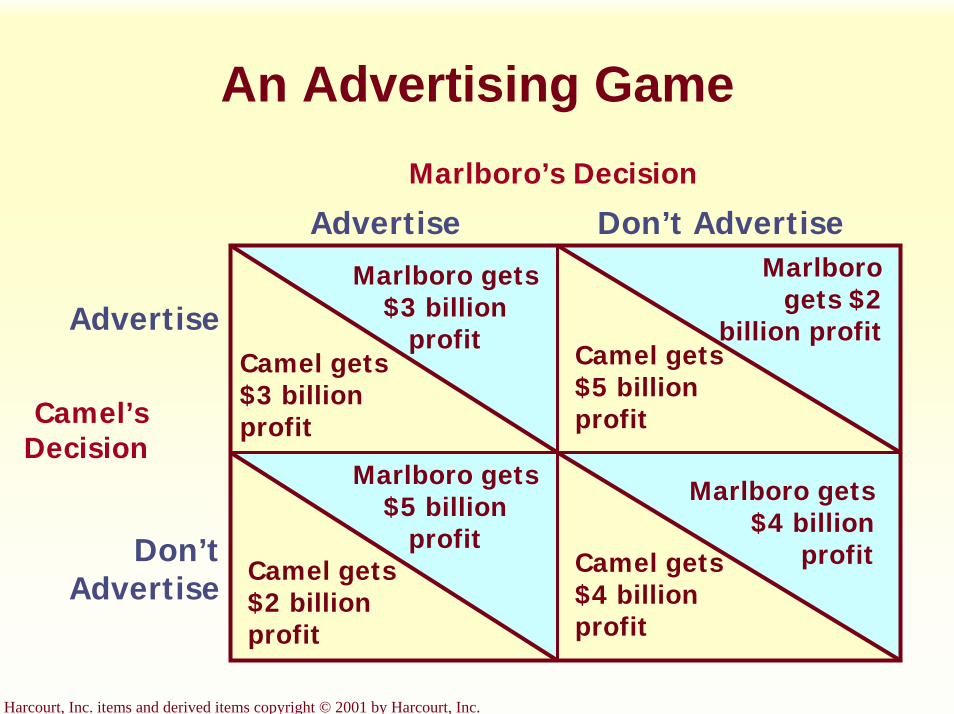
Harcourt, Inc. items and derived items copyright © 2001 by Harcourt, Inc.
An Advertising GameMarlboro’s Decision
Advertise Don’t Advertise
Advertise
Don’t Advertise
Camel’s Decision
Camel gets $3 billion profit
Marlboro gets $3 billion
profit
Marlboro gets $2
billion profit
Marlboro gets $4 billion
profit
Marlboro gets $5 billion
profitCamel gets $2 billion profit
Camel gets $4 billion profit
Camel gets $5 billion profit
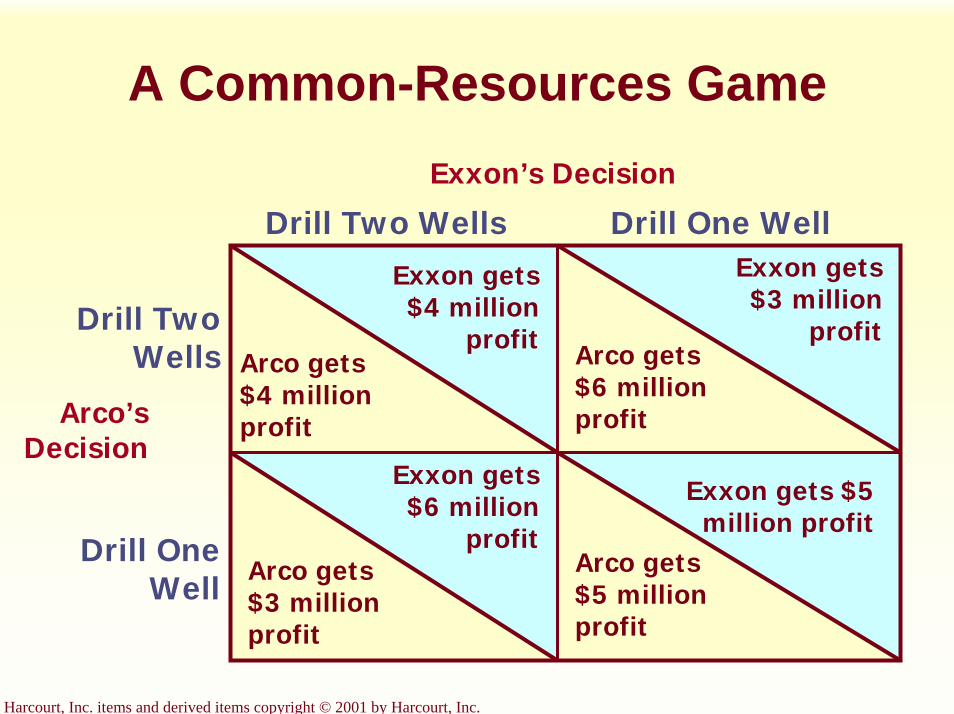
Harcourt, Inc. items and derived items copyright © 2001 by Harcourt, Inc.
A Common-Resources GameExxon’s Decision
Drill Two Wells Drill One Well
Drill Two Wells
Drill One Well
Arco’s Decision
Arco gets $4 million profit
Exxon gets $4 million
profit
Exxon gets $3 million
profit
Exxon gets $5 million profit
Exxon gets $6 million
profitArco gets $3 million profit
Arco gets $5 million profit
Arco gets $6 million profit
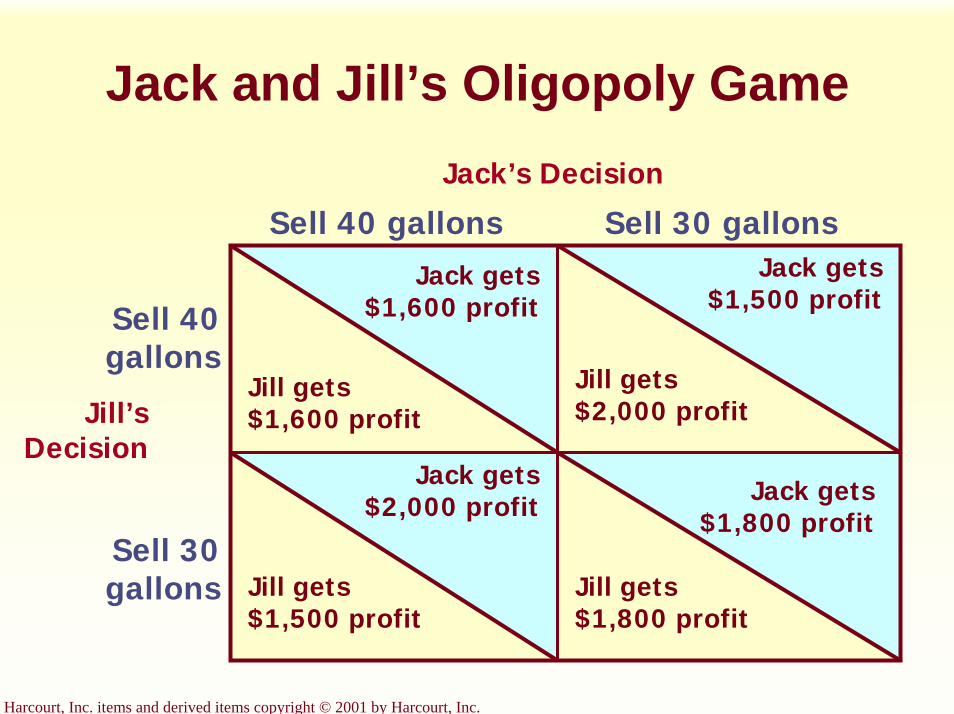
Harcourt, Inc. items and derived items copyright © 2001 by Harcourt, Inc.
Jack and Jill’s Oligopoly GameJack’s Decision
Sell 40 gallons Sell 30 gallons
Sell 40 gallons
Sell 30 gallons
Jill’s Decision
Jill gets $1,600 profit
Jack gets $1,600 profit
Jack gets $1,500 profit
Jack gets $1,800 profit
Jack gets $2,000 profit
Jill gets $1,500 profit
Jill gets $1,800 profit
Jill gets $2,000 profit

Monopolistic Competition
Chapter 17
Copyright © 2001 by Harcourt, Inc.
All rights reserved. Requests for permission to make copies of any part of thework should be mailed to:
Permissions Department, Harcourt College Publishers,6277 Sea Harbor Drive, Orlando, Florida 32887-6777.

Harcourt, Inc. items and derived items copyright © 2001 by Harcourt, Inc.
The Four Types of Market Structure
Monopoly Oligopoly Monopolistic Competition
Perfect Competition
• Tap water
• Cable TV
• Tennis balls
• Crude oil
• Novels
• Movies
• Wheat
• Milk
Number of Firms?
Type of Products?
Many firms
One firm Few
firms Differentiated products
Identical products
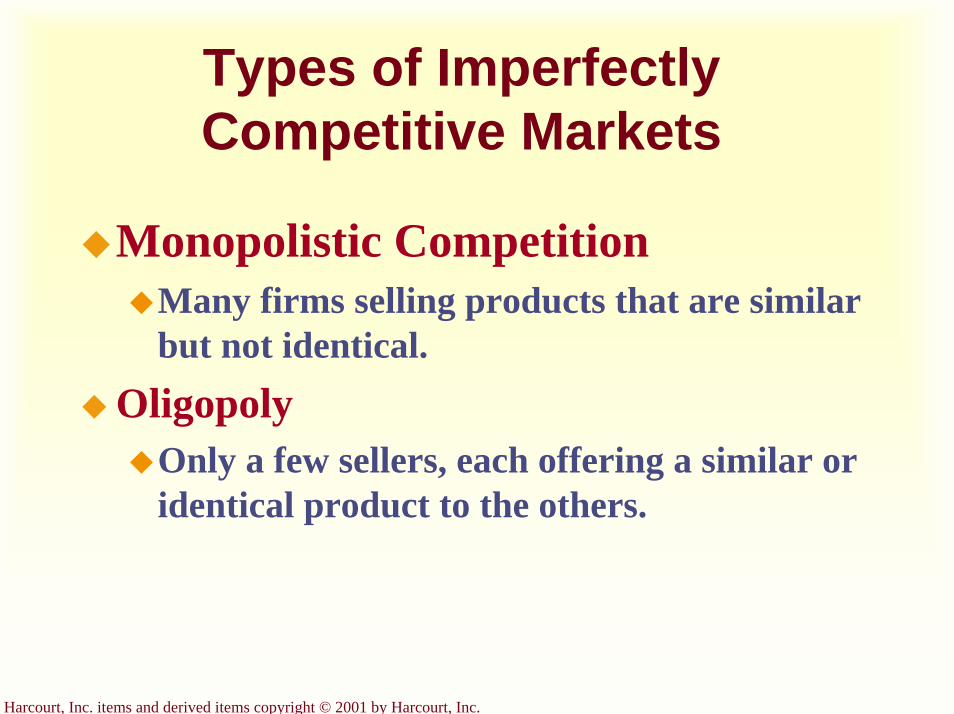
Harcourt, Inc. items and derived items copyright © 2001 by Harcourt, Inc.
Types of Imperfectly Competitive Markets
Monopolistic CompetitionMany firms selling products that are similar but not identical.
OligopolyOnly a few sellers, each offering a similar or identical product to the others.
Harcourt, Inc. items and derived items copyright © 2001 by Harcourt, Inc.
Monopolistic Competition
Markets that have some features of competition and some features of monopoly.
Harcourt, Inc. items and derived items copyright © 2001 by Harcourt, Inc.
Attributes of Monopolistic Competition
Many sellersProduct differentiationFree entry and exit

Harcourt, Inc. items and derived items copyright © 2001 by Harcourt, Inc.
Many SellersThere are many firms competing for the same group of customers.
Product examples include books, CDs, movies, computer games, restaurants, piano lessons, cookies, furniture, etc.
Harcourt, Inc. items and derived items copyright © 2001 by Harcourt, Inc.
Product Differentiation
Each firm produces a product that is at least slightly different from those of other firms.Rather than being a price taker, each firm faces a downward-sloping demand curve.
Harcourt, Inc. items and derived items copyright © 2001 by Harcourt, Inc.
Free Entry or Exit
Firms can enter or exit the market without restriction.The number of firms in the market adjusts until economic profits are zero.
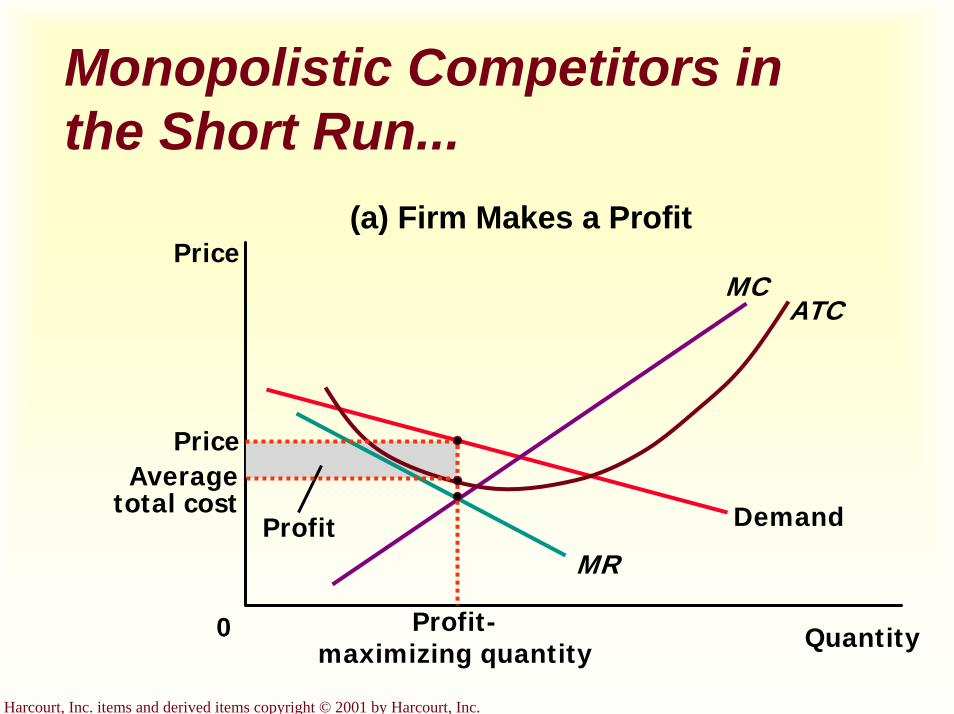
Harcourt, Inc. items and derived items copyright © 2001 by Harcourt, Inc.
Monopolistic Competitors in the Short Run...
(a) Firm Makes a Profit
Quantity0
Price
Demand
MR
ATC
Profit
MC
Profit-maximizing quantity
PriceAverage
total cost

Harcourt, Inc. items and derived items copyright © 2001 by Harcourt, Inc.
Monopolistic Competitors in the Short Run...
Quantity0
Price
Demand
MR
Losses
(b) Firm Makes LossesMC ATC
Averagetotal cost
Loss-minimizing
quantity
Price

Harcourt, Inc. items and derived items copyright © 2001 by Harcourt, Inc.
Monopolistic Competition in the Short Run
Short-run economic profits encourage new firms to enter the market. This:Increases the number of products offered.Reduces demand faced by firms already in the market.Incumbent firms’ demand curves shift to the left.Demand for the incumbent firms’ products fall, and their profits decline.
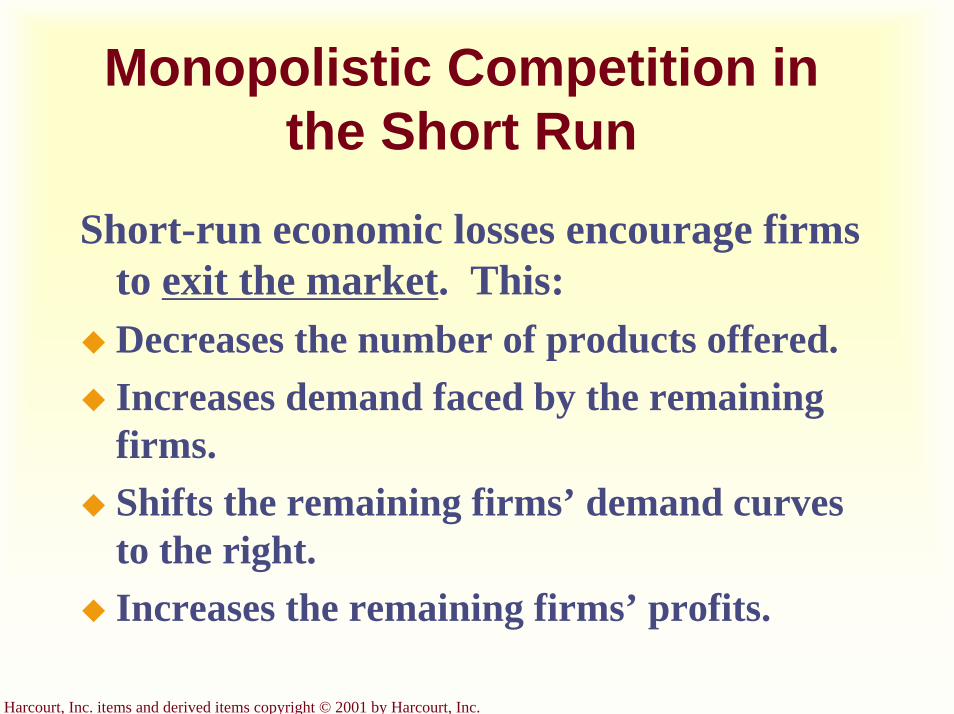
Harcourt, Inc. items and derived items copyright © 2001 by Harcourt, Inc.
Monopolistic Competition in the Short Run
Short-run economic losses encourage firms to exit the market. This:Decreases the number of products offered.Increases demand faced by the remaining firms.Shifts the remaining firms’ demand curves to the right.Increases the remaining firms’ profits.
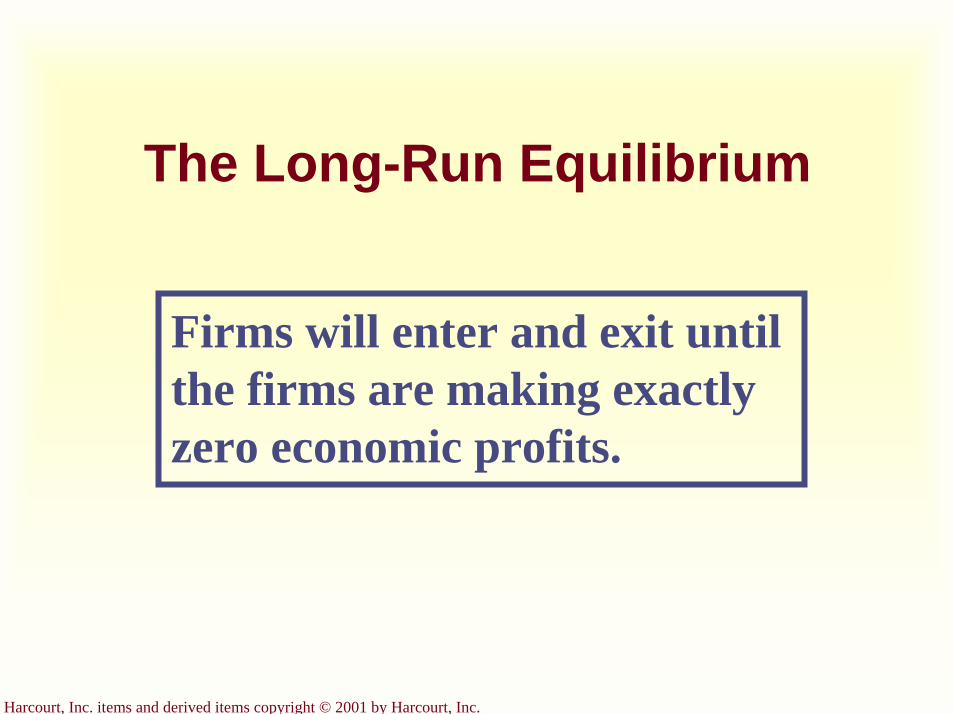
Harcourt, Inc. items and derived items copyright © 2001 by Harcourt, Inc.
The Long-Run Equilibrium
Firms will enter and exit until the firms are making exactly zero economic profits.
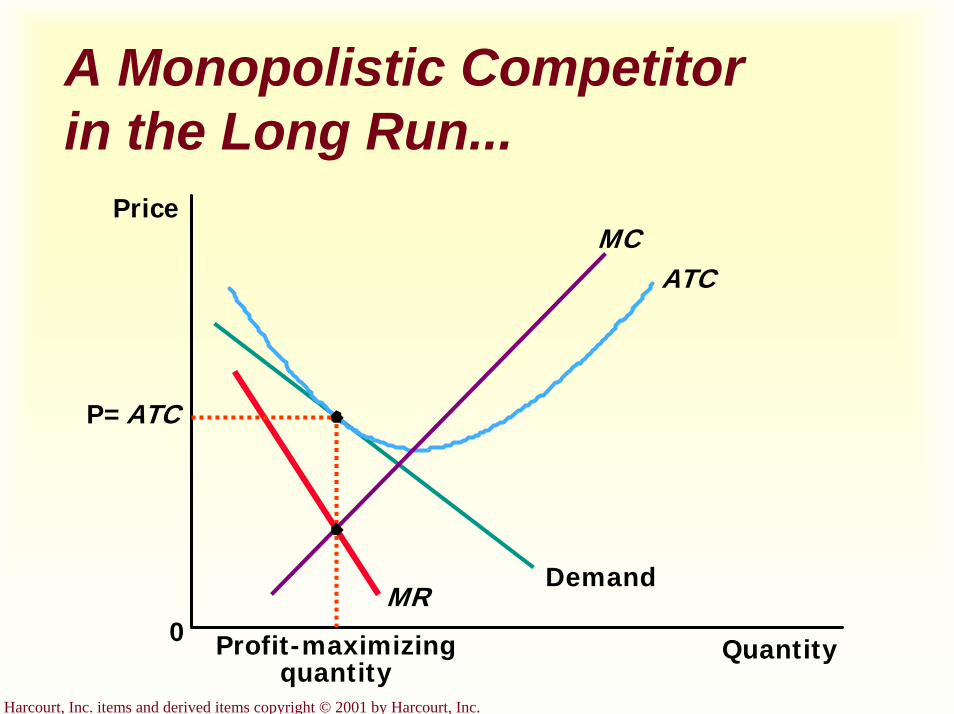
Harcourt, Inc. items and derived items copyright © 2001 by Harcourt, Inc.
A Monopolistic Competitor in the Long Run...
Quantity
Price
0
DemandMR
ATCMC
Profit-maximizingquantity
P=ATC
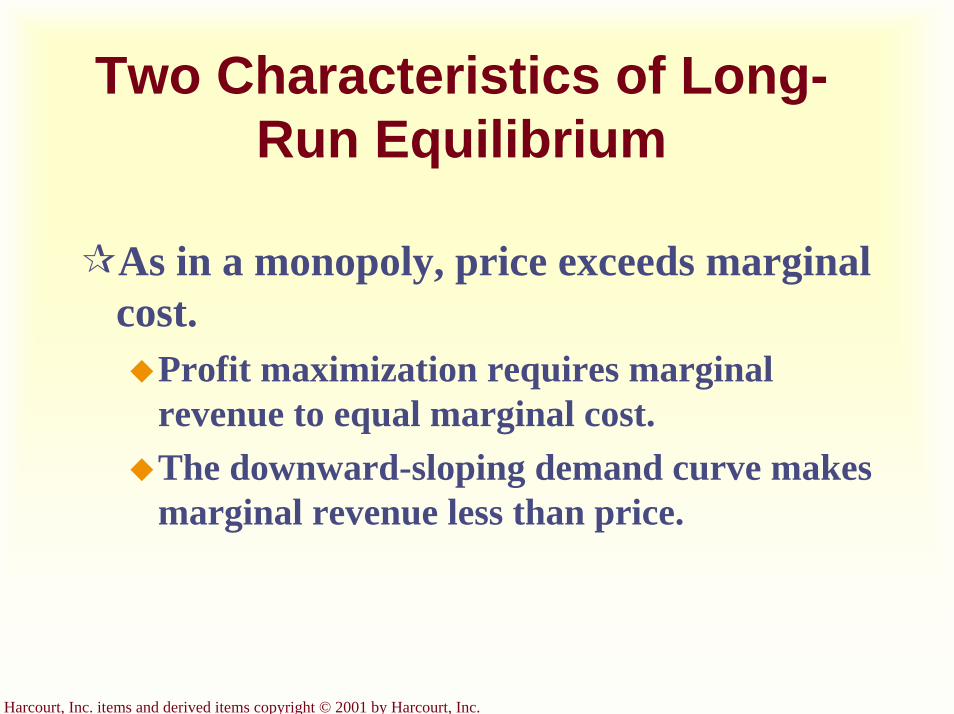
Harcourt, Inc. items and derived items copyright © 2001 by Harcourt, Inc.
Two Characteristics of Long-Run Equilibrium
As in a monopoly, price exceeds marginal cost.
Profit maximization requires marginal revenue to equal marginal cost.The downward-sloping demand curve makes marginal revenue less than price.
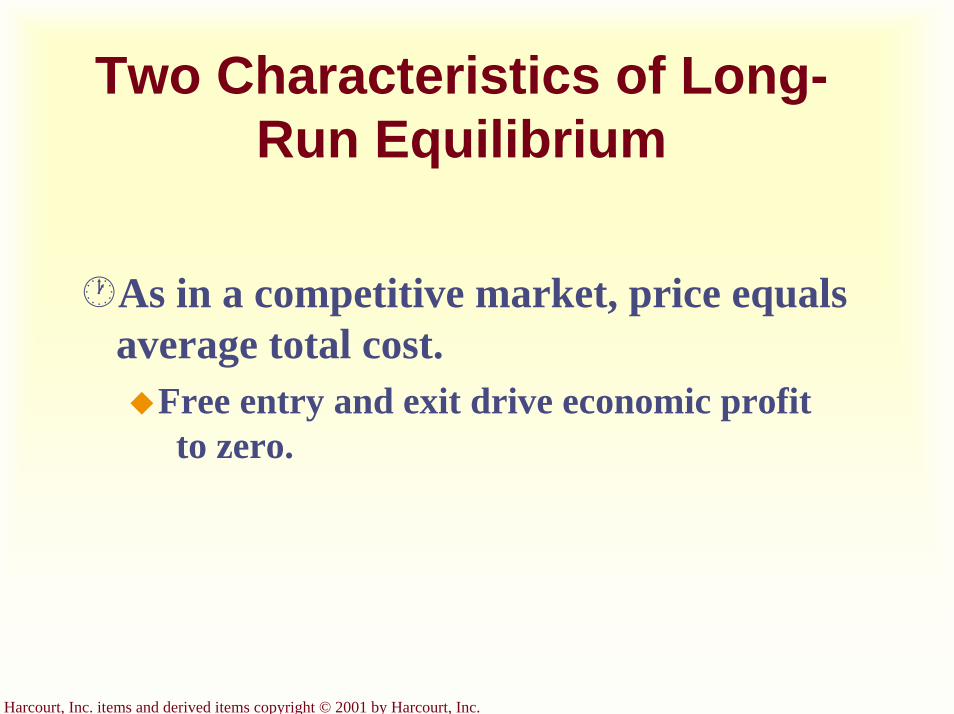
Harcourt, Inc. items and derived items copyright © 2001 by Harcourt, Inc.
Two Characteristics of Long-Run Equilibrium
As in a competitive market, price equals average total cost.
Free entry and exit drive economic profit to zero.
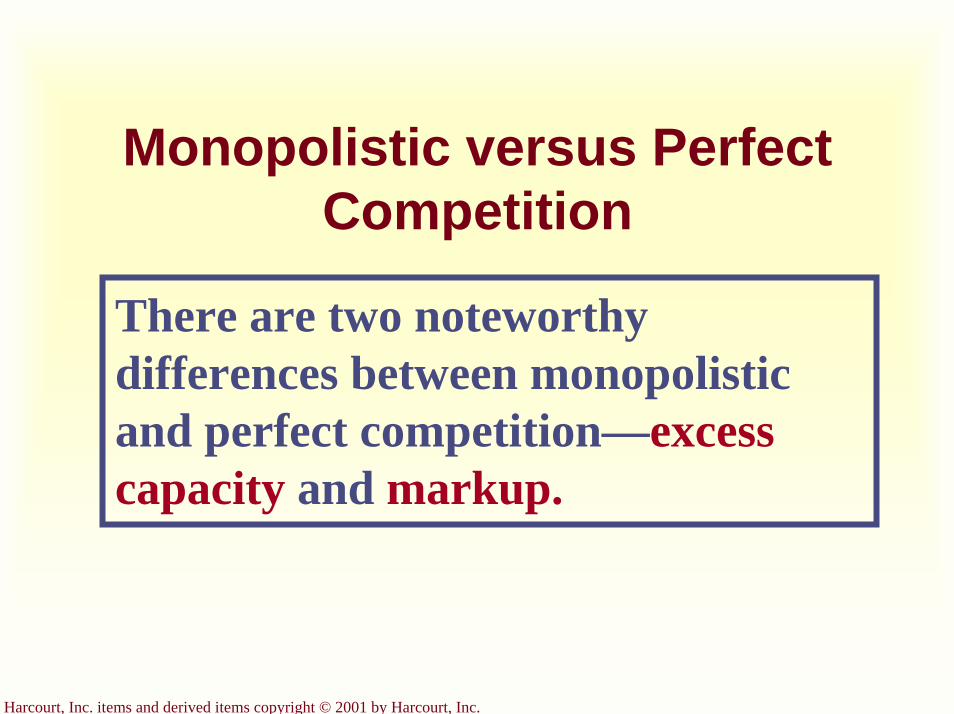
Harcourt, Inc. items and derived items copyright © 2001 by Harcourt, Inc.
Monopolistic versus Perfect Competition
There are two noteworthy differences between monopolistic and perfect competition—excess capacity and markup.
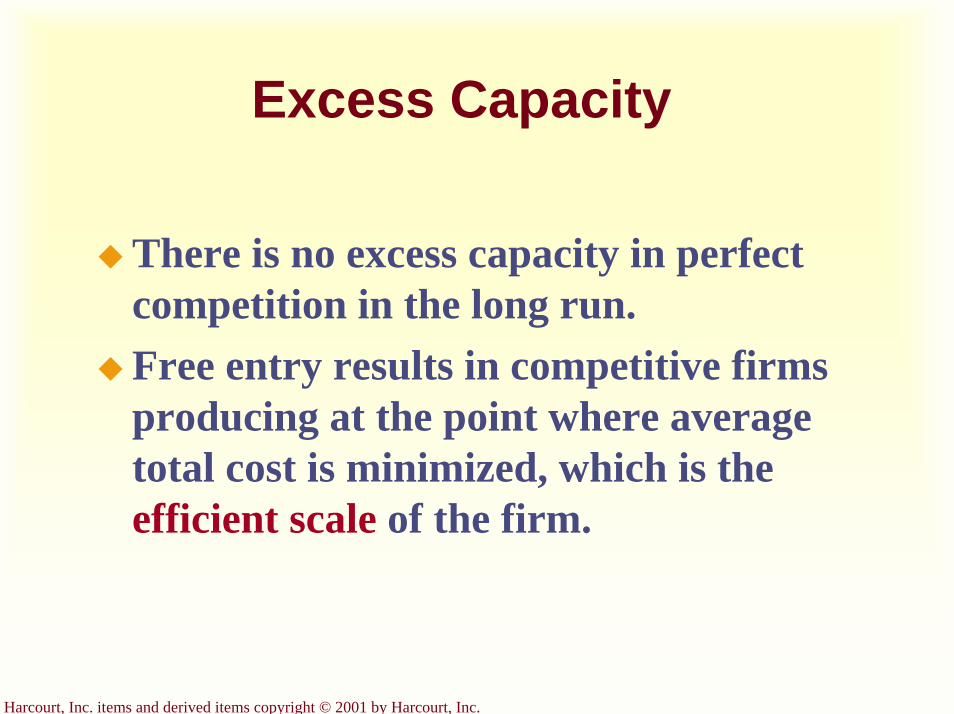
Harcourt, Inc. items and derived items copyright © 2001 by Harcourt, Inc.
Excess Capacity
There is no excess capacity in perfect competition in the long run.Free entry results in competitive firms producing at the point where average total cost is minimized, which is the efficient scale of the firm.
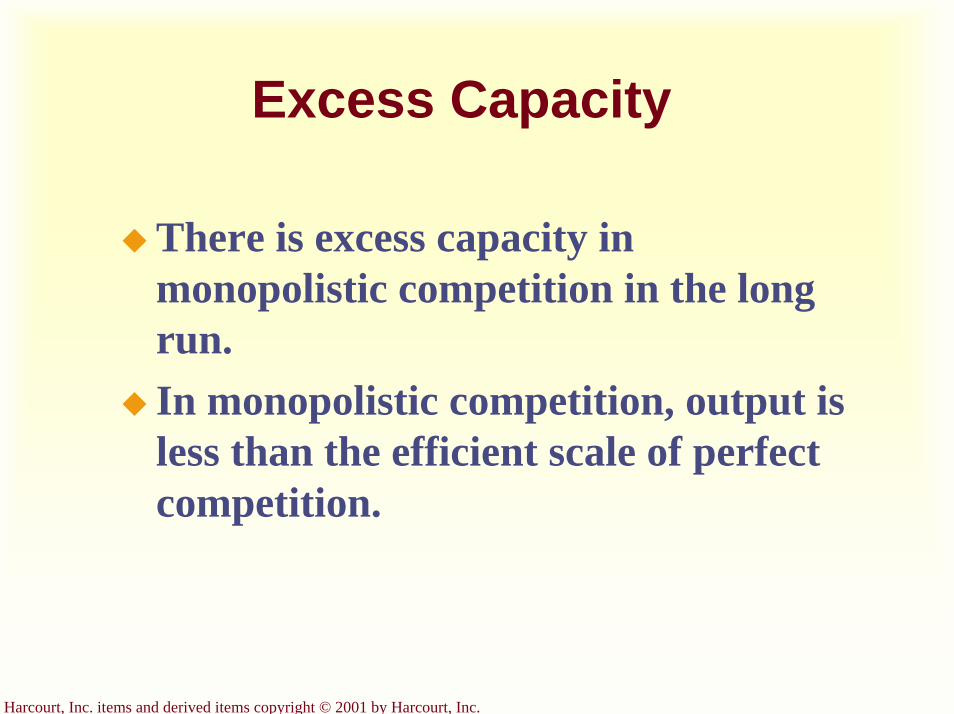
Harcourt, Inc. items and derived items copyright © 2001 by Harcourt, Inc.
Excess Capacity
There is excess capacity in monopolistic competition in the long run.In monopolistic competition, output is less than the efficient scale of perfect competition.

Harcourt, Inc. items and derived items copyright © 2001 by Harcourt, Inc.
Excess Capacity...
(a) Monopolistically Competitive Firm (b) Perfectly Competitive Firm
Quantity Quantity
Price
P = MR(demand
curve)
MC ATC
Price
Demand
MC ATC
Excess capacity
Quantityproduced
Efficientscale
P = MC
Quantityproduced
= Efficientscale
P
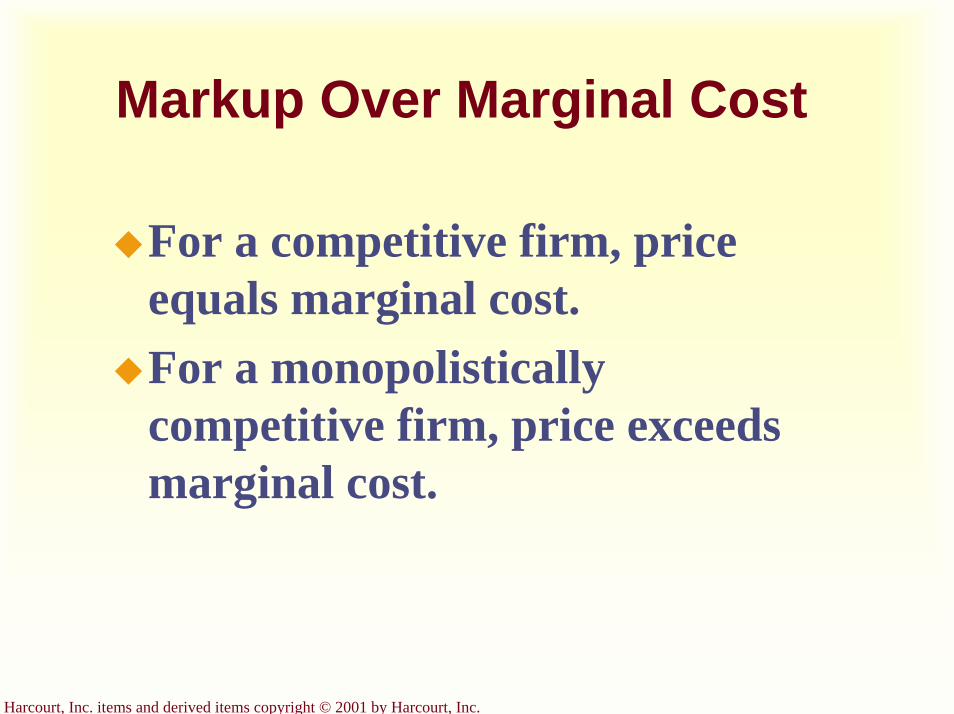
Harcourt, Inc. items and derived items copyright © 2001 by Harcourt, Inc.
Markup Over Marginal Cost
For a competitive firm, price equals marginal cost.For a monopolistically competitive firm, price exceeds marginal cost.
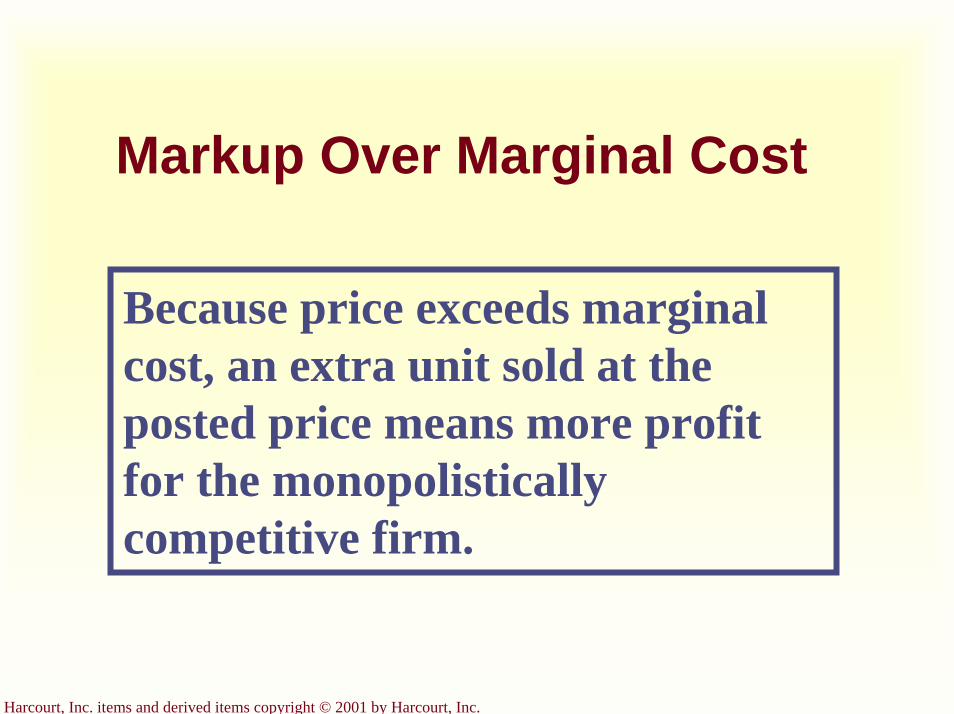
Harcourt, Inc. items and derived items copyright © 2001 by Harcourt, Inc.
Markup Over Marginal Cost
Because price exceeds marginal cost, an extra unit sold at the posted price means more profit for the monopolistically competitive firm.

Harcourt, Inc. items and derived items copyright © 2001 by Harcourt, Inc.
Markup Over Marginal Cost...
(a) Monopolistically Competitive Firm (b) Perfectly Competitive Firm
Quantity Quantity
Price
P = MC P = MR(demand
curve)
MC ATC
Quantityproduced
Price
P
Demand
Marginalcost
MC ATC
MR
Markup
Quantityproduced
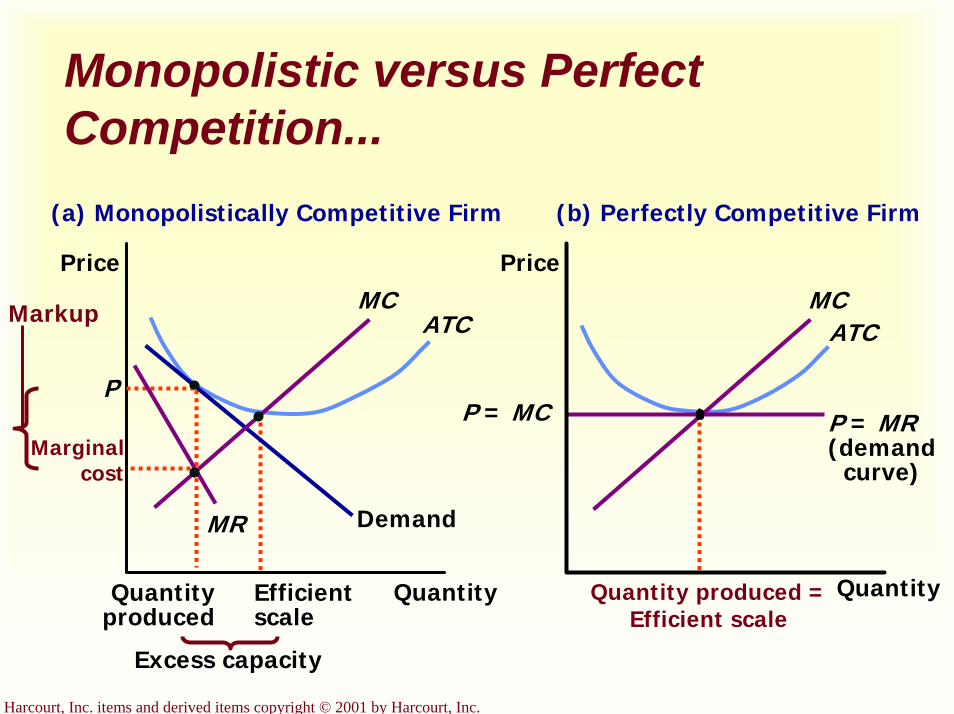
Harcourt, Inc. items and derived items copyright © 2001 by Harcourt, Inc.
Monopolistic versus Perfect Competition...
(a) Monopolistically Competitive Firm (b) Perfectly Competitive Firm
Quantity Quantity
Price
P = MR(demand
curve)
MCATC
Quantityproduced
Efficientscale
Price
P
Demand
MCATC
P = MC
Excess capacity
Marginal cost
Markup
MR
Quantity produced = Efficient scale
Harcourt, Inc. items and derived items copyright © 2001 by Harcourt, Inc.
Monopolistic Competition and the Welfare of Society
Monopolistic competition does not have all the desirable properties of perfect competition.
Harcourt, Inc. items and derived items copyright © 2001 by Harcourt, Inc.
Monopolistic Competition and the Welfare of Society
There is the normal deadweight loss of monopoly pricing in monopolistic competition caused by the markup of price over marginal cost.However, the administrative burden of regulating the pricing of all firms that produce differentiated products would be overwhelming.
Harcourt, Inc. items and derived items copyright © 2001 by Harcourt, Inc.
Monopolistic Competition and the Welfare of Society
Another way in which monopolistic competition may be socially inefficient is that the number of firms in the market may not be the “ideal” one. There may be too much or too little entry.

Harcourt, Inc. items and derived items copyright © 2001 by Harcourt, Inc.
Monopolistic Competition and the Welfare of Society
Externalities of entry include:product-variety externalities.business-stealing externalities.
Harcourt, Inc. items and derived items copyright © 2001 by Harcourt, Inc.
Monopolistic Competition and the Welfare of Society
The product-variety externality:Because consumers get some consumer surplus from the introduction of a new product, entry of a new firm conveys a positive externality on consumers.
Harcourt, Inc. items and derived items copyright © 2001 by Harcourt, Inc.
Monopolistic Competition and the Welfare of Society
The business-stealing externality:Because other firms lose customers and profits from the entry of a new competitor, entry of a new firm imposes a negative externality on existing firms.
Harcourt, Inc. items and derived items copyright © 2001 by Harcourt, Inc.
Advertising
When firms sell differentiated products and charge prices above marginal cost, each firm has an incentive to advertise in order to attract more buyers to its particular product.
Harcourt, Inc. items and derived items copyright © 2001 by Harcourt, Inc.
Advertising
Firms that sell highly differentiated consumer goods typically spend between 10 and 20 percent of revenue on advertising.Overall, about 2 percent of total revenue, or over $100 billion a year, is spent on advertising.
Harcourt, Inc. items and derived items copyright © 2001 by Harcourt, Inc.
Advertising
Critics of advertising argue that firms advertise in order to manipulate people’s tastes. They also argue that it impedes competition by implying that products are more different than they truly are.

Harcourt, Inc. items and derived items copyright © 2001 by Harcourt, Inc.
Advertising
Defenders argue that advertising provides information to consumersThey also argue that advertising increases competition by offering a greater variety of products and prices.The willingness of a firm to spend advertising dollars can be a signal to consumers about the quality of the product being offered.
Harcourt, Inc. items and derived items copyright © 2001 by Harcourt, Inc.
Brand Names
Critics argue that brand names cause consumers to perceive differences that do not really exist.

Harcourt, Inc. items and derived items copyright © 2001 by Harcourt, Inc.
Brand Names
Economists have argued that brand names may be a useful way for consumers to ensure that the goods they are buying are of high quality.
providing information about quality.giving firms incentive to maintain high quality.
Harcourt, Inc. items and derived items copyright © 2001 by Harcourt, Inc.
Summary
A monopolistically competitive market is characterized by three attributes: many firms, differentiated products, and free entry.The equilibrium in a monopolistically competitive market differs from perfect competition in that each firm has excess capacity and each firm charges a price above marginal cost.
Harcourt, Inc. items and derived items copyright © 2001 by Harcourt, Inc.
Summary
Monopolistic competition does not have all of the desirable properties of perfect competition.There is a standard deadweight loss of monopoly caused by the markup of price over marginal cost.The number of firms can be too large or too small.
Harcourt, Inc. items and derived items copyright © 2001 by Harcourt, Inc.
Summary
The product differentiation inherent in monopolistic competition leads to the use of advertising and brand names.Critics of advertising and brand names argue that firms use them to take advantage of consumer irrationality and to reduce competition.
Harcourt, Inc. items and derived items copyright © 2001 by Harcourt, Inc.
Summary
Defenders argue that firms use advertising and brand names to inform consumers and to compete more vigorously on price and product quality.

Harcourt, Inc. items and derived items copyright © 2001 by Harcourt, Inc.
Graphical Review

Harcourt, Inc. items and derived items copyright © 2001 by Harcourt, Inc.
The Four Types of Market Structure
Monopoly Oligopoly Monopolistic Competition
Perfect Competition
• Tap water
• Cable TV
• Tennis balls
• Crude oil
• Novels
• Movies
• Wheat
• Milk
Number of Firms?
Type of Products?
Many firms
One firm Few
firms Differentiated products
Identical products

Harcourt, Inc. items and derived items copyright © 2001 by Harcourt, Inc.
Monopolistic Competitors in the Short Run...
(a) Firm Makes a Profit
Quantity0
Price
Demand
MR
ATC
Profit
MC
Profit-maximizing quantity
PriceAverage
total cost
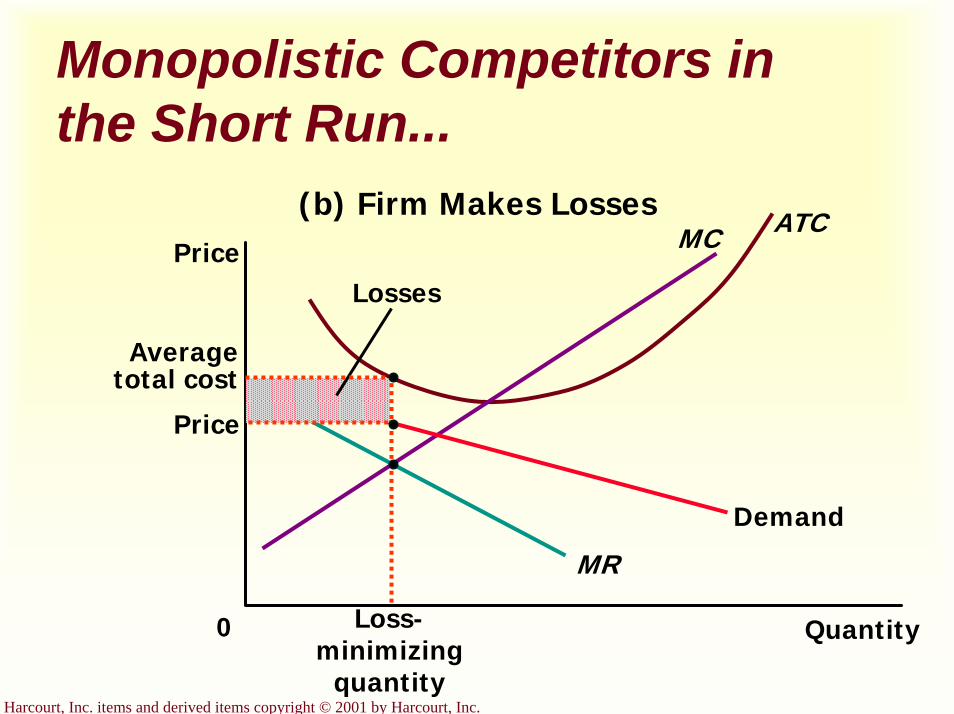
Harcourt, Inc. items and derived items copyright © 2001 by Harcourt, Inc.
Monopolistic Competitors in the Short Run...
Quantity0
Price
Demand
MR
Losses
(b) Firm Makes LossesMC ATC
Averagetotal cost
Loss-minimizing
quantity
Price

Harcourt, Inc. items and derived items copyright © 2001 by Harcourt, Inc.
A Monopolistic Competitor in the Long Run...
Quantity
Price
0
DemandMR
ATCMC
Profit-maximizingquantity
P=ATC
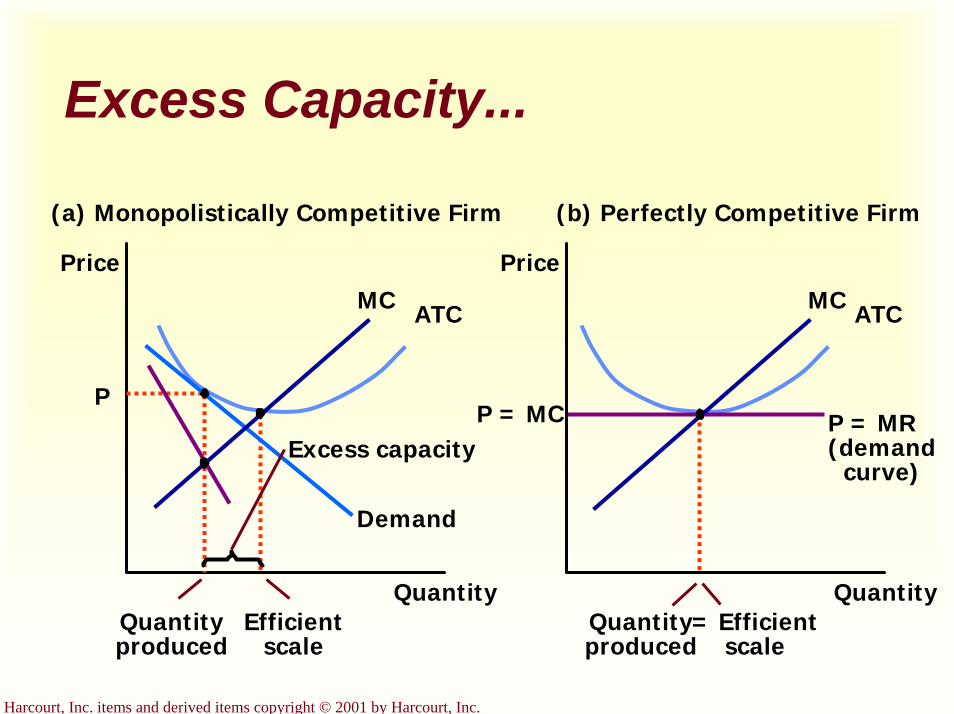
Harcourt, Inc. items and derived items copyright © 2001 by Harcourt, Inc.
Excess Capacity...
Quantity
(a) Monopolistically Competitive Firm (b) Perfectly Competitive Firm
Quantity
Price
P = MR(demand
curve)
MC ATC
Price
Demand
MC ATC
Excess capacity
Quantityproduced
Efficientscale
P = MC
Quantityproduced
= Efficientscale
P
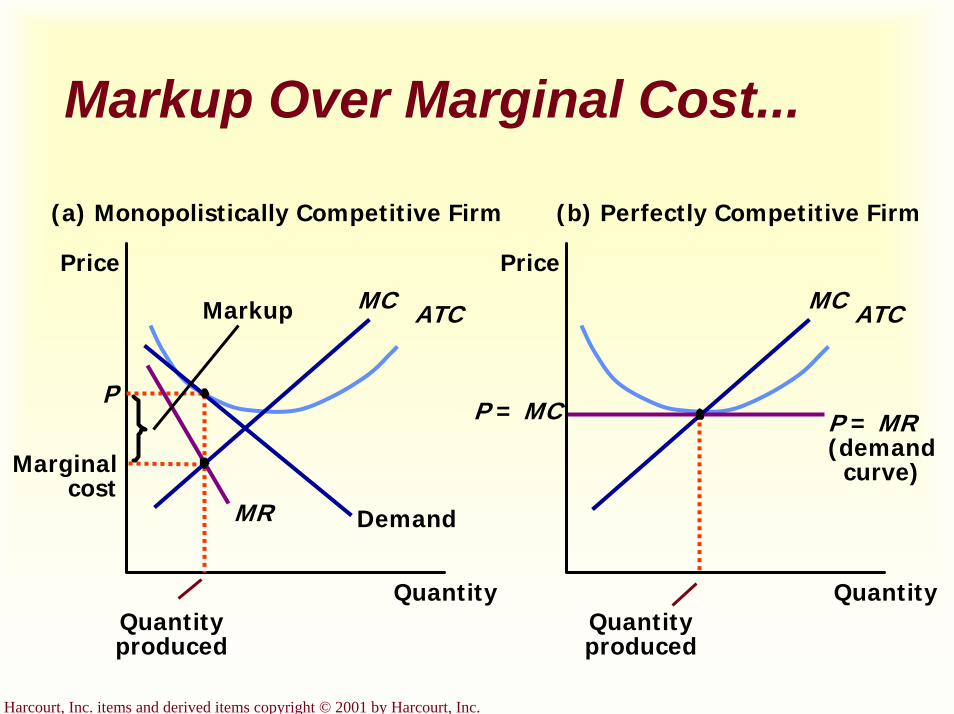
Harcourt, Inc. items and derived items copyright © 2001 by Harcourt, Inc.
Markup Over Marginal Cost...
Quantity
(a) Monopolistically Competitive Firm (b) Perfectly Competitive Firm
Quantity
Price
P = MC P = MR(demand
curve)
MC ATC
Quantityproduced
Price
P
Demand
Marginalcost
MC ATC
MR
Markup
Quantityproduced

Harcourt, Inc. items and derived items copyright © 2001 by Harcourt, Inc.
Monopolistic versus Perfect Competition...
Quantity
(a) Monopolistically Competitive Firm (b) Perfectly Competitive Firm
Quantity
Price
P = MR(demand
curve)
MCATC
Quantityproduced
Efficientscale
Price
P
Demand
MCATC
P = MC
Excess capacity
Marginal cost
Markup
MR
Quantity produced = Efficient scale
The Economics of Labor Markets
Chapter 18
Copyright © 2001 by Harcourt, Inc.
All rights reserved. Requests for permission to make copies of any part of thework should be mailed to:
Permissions Department, Harcourt College Publishers,6277 Sea Harbor Drive, Orlando, Florida 32887-6777.
Harcourt, Inc. items and derived items copyright © 2001 by Harcourt, Inc.
Factors of Production
Factors of production are the inputs used to produce goods and services.
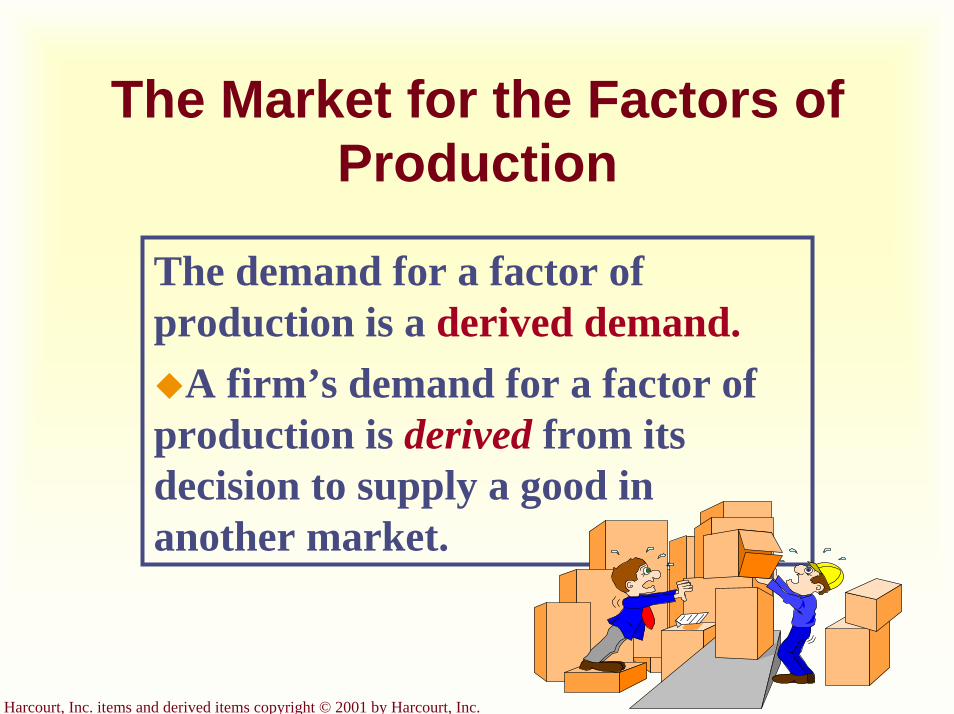
Harcourt, Inc. items and derived items copyright © 2001 by Harcourt, Inc.
The Market for the Factors of Production
The demand for a factor of production is a derived demand.
A firm’s demand for a factor of production is derived from its decision to supply a good in another market.
Harcourt, Inc. items and derived items copyright © 2001 by Harcourt, Inc.
The Demand for Labor
Labor markets, like other markets in the economy, are governed by the forces of supply and demand.

Harcourt, Inc. items and derived items copyright © 2001 by Harcourt, Inc.
The Versatility of Supply and Demand...
(a) The Market for Apples (b) The Market for Apple Pickers
Quantity of Apples
Quantity of Apple Pickers
Q L
W
0 0
Wage of Apple
Pickers
DemandDemand
Supply SupplyPrice of Apples
P
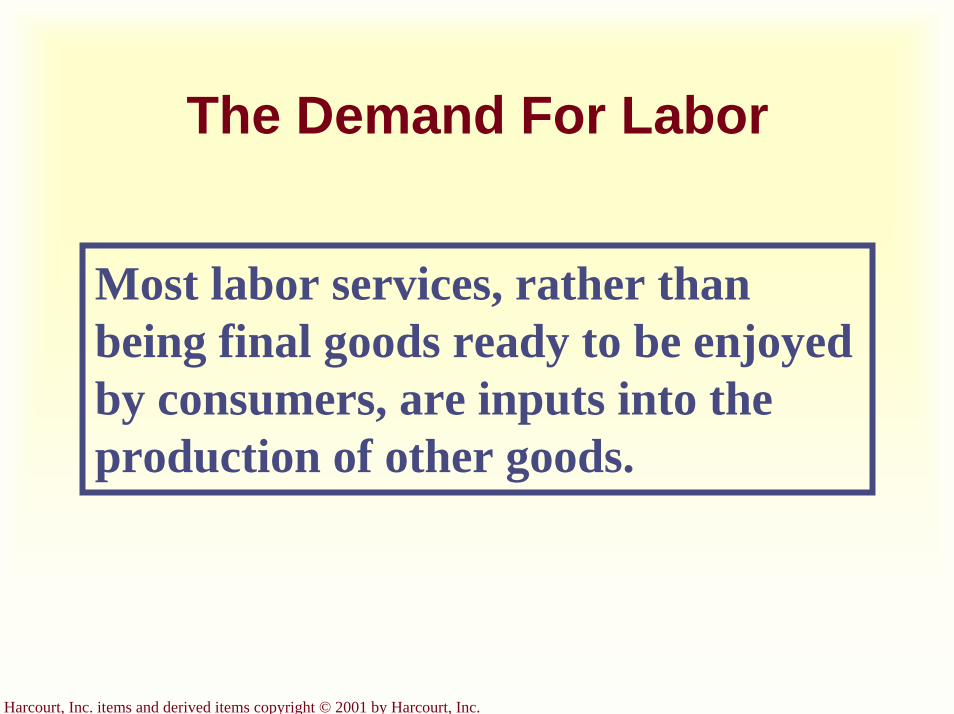
Harcourt, Inc. items and derived items copyright © 2001 by Harcourt, Inc.
The Demand For Labor
Most labor services, rather than being final goods ready to be enjoyed by consumers, are inputs into the production of other goods.
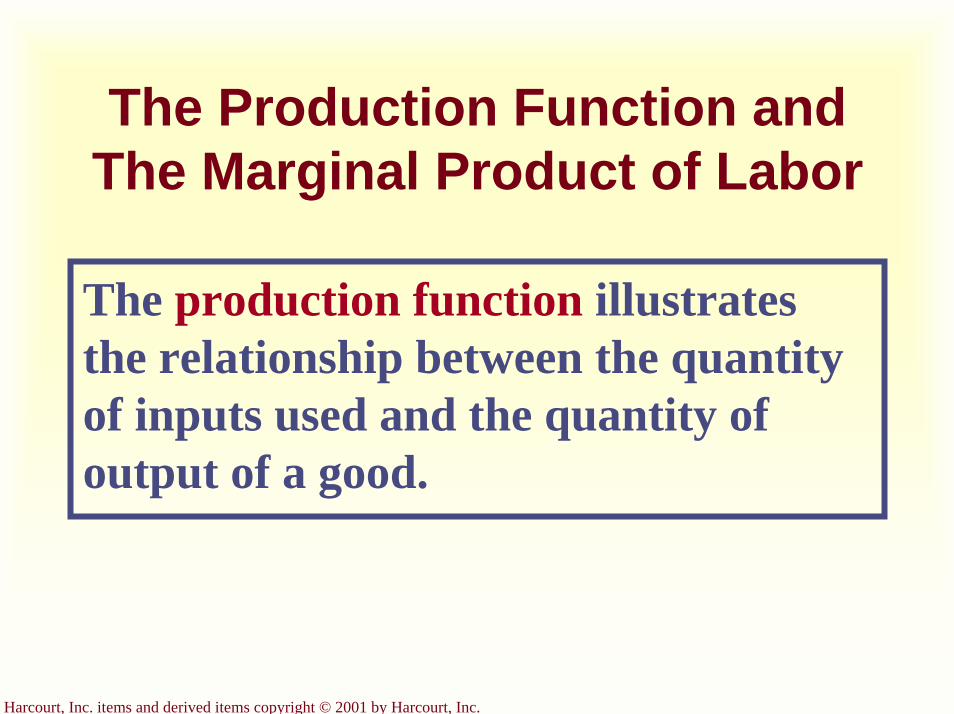
Harcourt, Inc. items and derived items copyright © 2001 by Harcourt, Inc.
The Production Function and The Marginal Product of Labor
The production function illustrates the relationship between the quantity of inputs used and the quantity of output of a good.
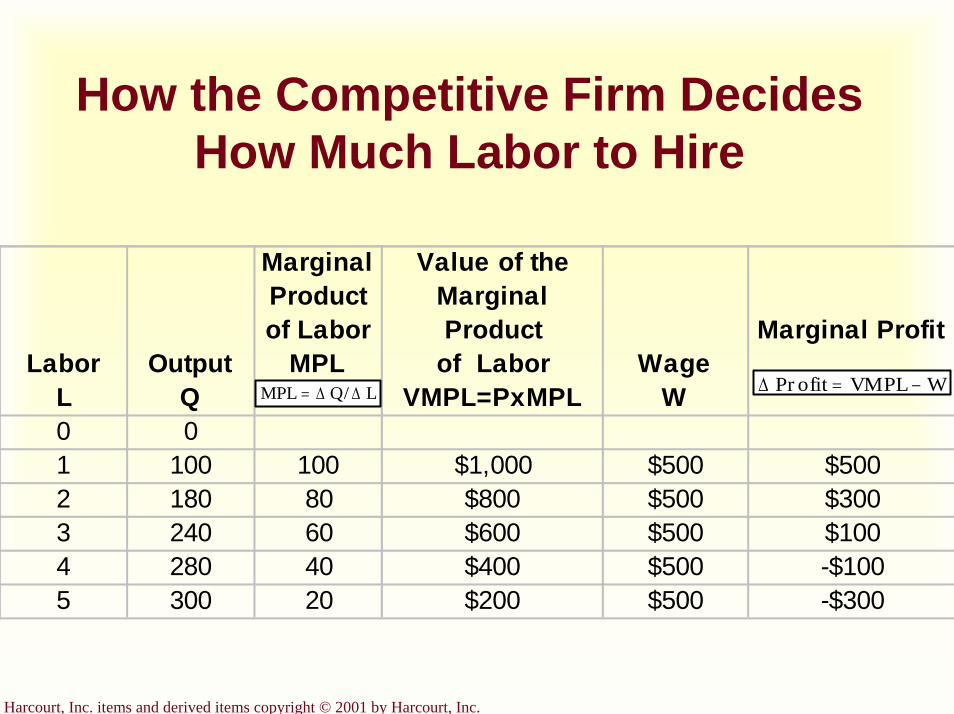
Harcourt, Inc. items and derived items copyright © 2001 by Harcourt, Inc.
How the Competitive Firm Decides How Much Labor to Hire
LaborL
OutputQ
Marginal Product of Labor
MPL
Value of theMarginal Product
of LaborVMPL=PxMPL
WageW
Marginal Profit
0 01 100 100 $1,000 $500 $5002 180 80 $800 $500 $3003 240 60 $600 $500 $1004 280 40 $400 $500 -$1005 300 20 $200 $500 -$300
∆ Pr ofit VMPL W= −MPL Q/ L= ∆ ∆

Harcourt, Inc. items and derived items copyright © 2001 by Harcourt, Inc.
The Production Function...
00
50
100
150
200
250
300
350
0 1 2 3 4 5 6
Quantity of Apple Pickers
1
2
3
4
5
Qu
anti
ty o
f A
pple
s
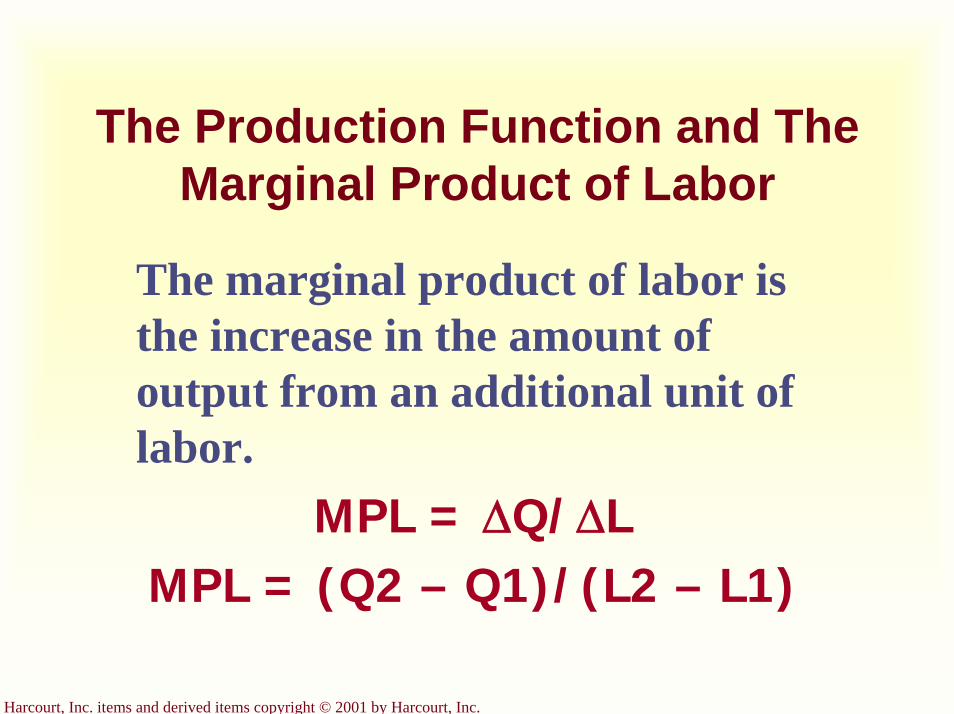
Harcourt, Inc. items and derived items copyright © 2001 by Harcourt, Inc.
The Production Function and The Marginal Product of Labor
The marginal product of labor is the increase in the amount of output from an additional unit of labor.
MPL = ∆Q/∆LMPL = (Q2 – Q1)/(L2 – L1)
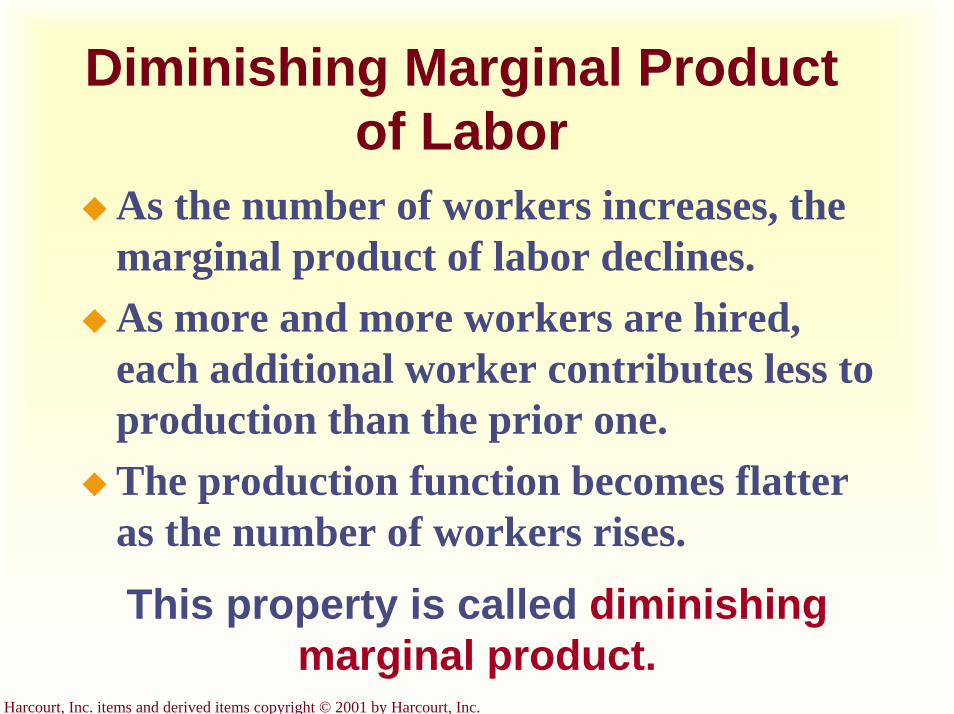
Harcourt, Inc. items and derived items copyright © 2001 by Harcourt, Inc.
Diminishing Marginal Product of Labor
As the number of workers increases, the marginal product of labor declines. As more and more workers are hired, each additional worker contributes less to production than the prior one.The production function becomes flatter as the number of workers rises.
This property is called diminishing marginal product.
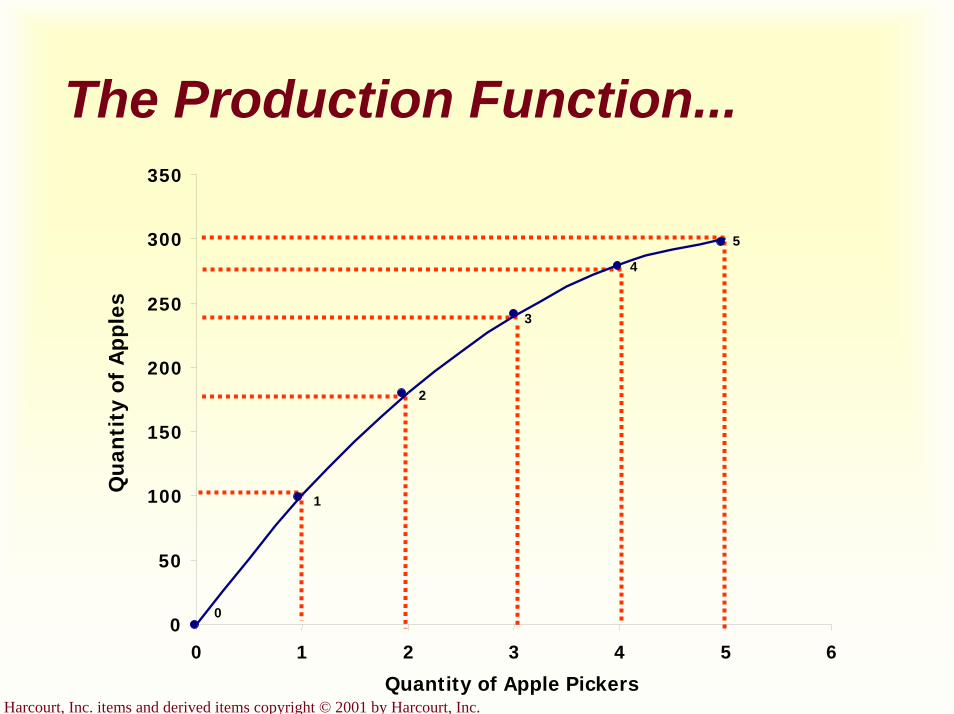
Harcourt, Inc. items and derived items copyright © 2001 by Harcourt, Inc.
The Production Function...
00
50
100
150
200
250
300
350
0 1 2 3 4 5 6
Quantity of Apple Pickers
1
2
3
4
5
Qu
anti
ty o
f A
pple
s
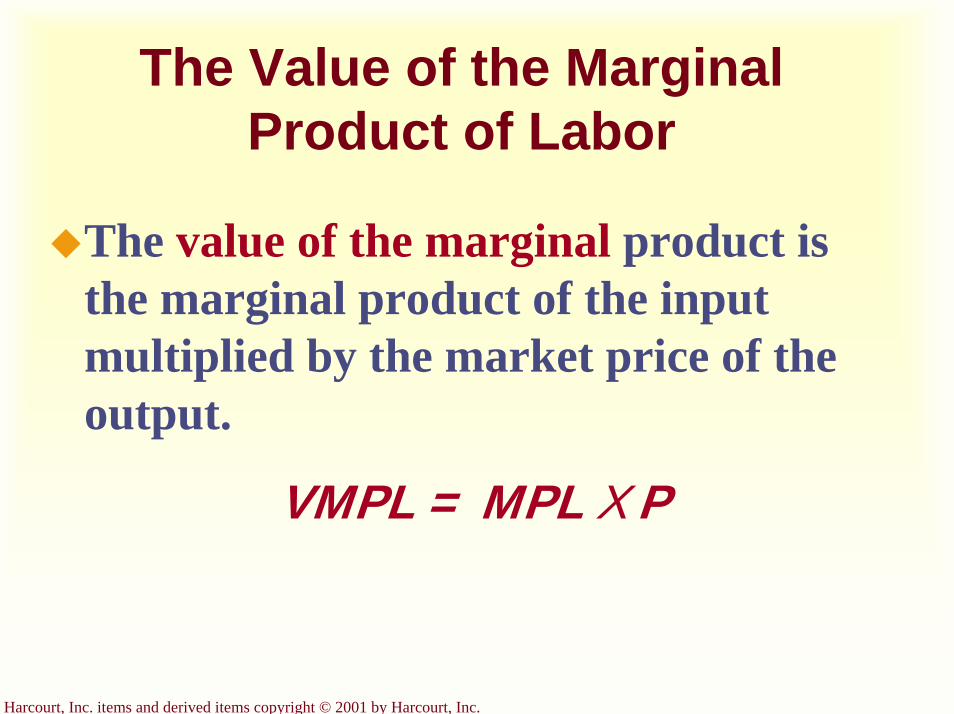
Harcourt, Inc. items and derived items copyright © 2001 by Harcourt, Inc.
The Value of the Marginal Product of Labor
The value of the marginal product is the marginal product of the input multiplied by the market price of the output.
VMPL = MPL X P
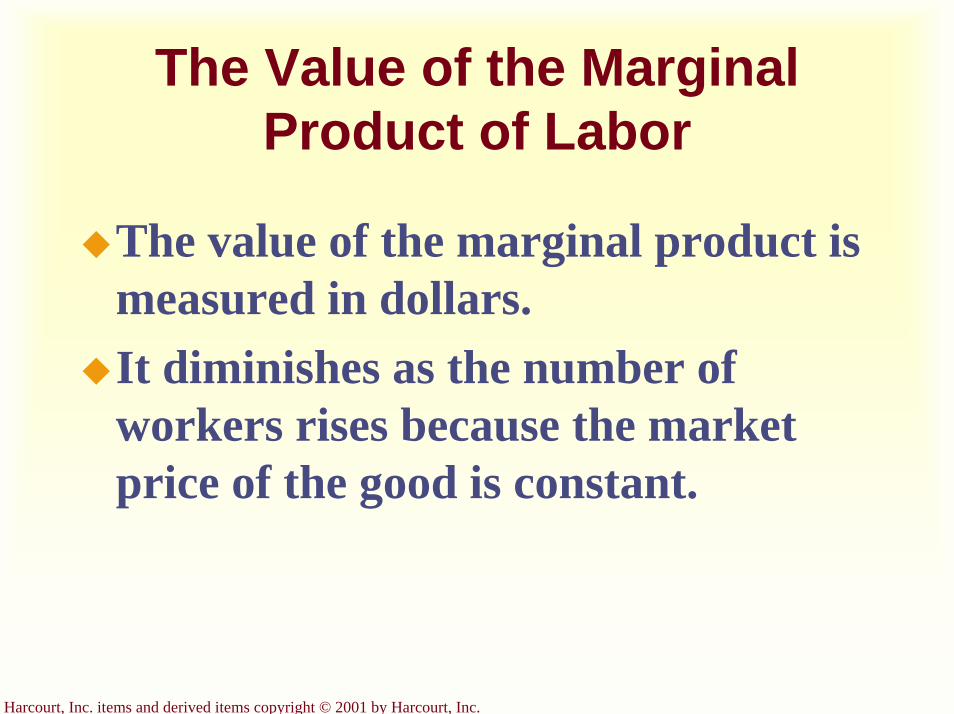
Harcourt, Inc. items and derived items copyright © 2001 by Harcourt, Inc.
The Value of the Marginal Product of Labor
The value of the marginal product is measured in dollars.It diminishes as the number of workers rises because the market price of the good is constant.
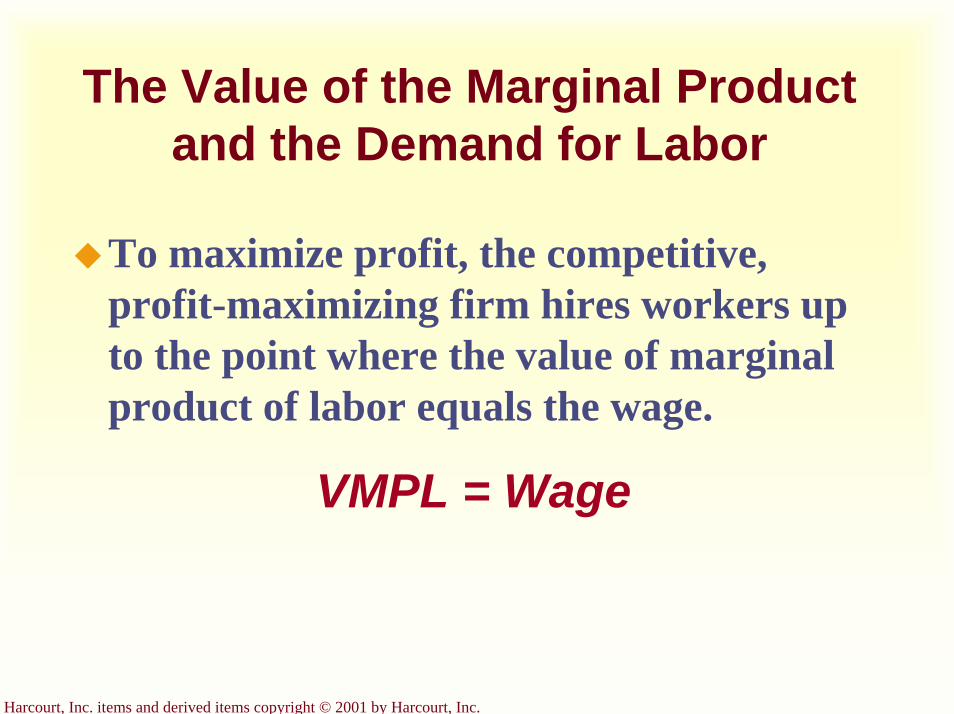
Harcourt, Inc. items and derived items copyright © 2001 by Harcourt, Inc.
The Value of the Marginal Product and the Demand for Labor
To maximize profit, the competitive, profit-maximizing firm hires workers up to the point where the value of marginal product of labor equals the wage.
VMPL = Wage
Harcourt, Inc. items and derived items copyright © 2001 by Harcourt, Inc.
The Value of the Marginal Product and the Demand for Labor
The value-of-marginal-product curve is the labor demand curve for a competitive, profit-maximizing firm.
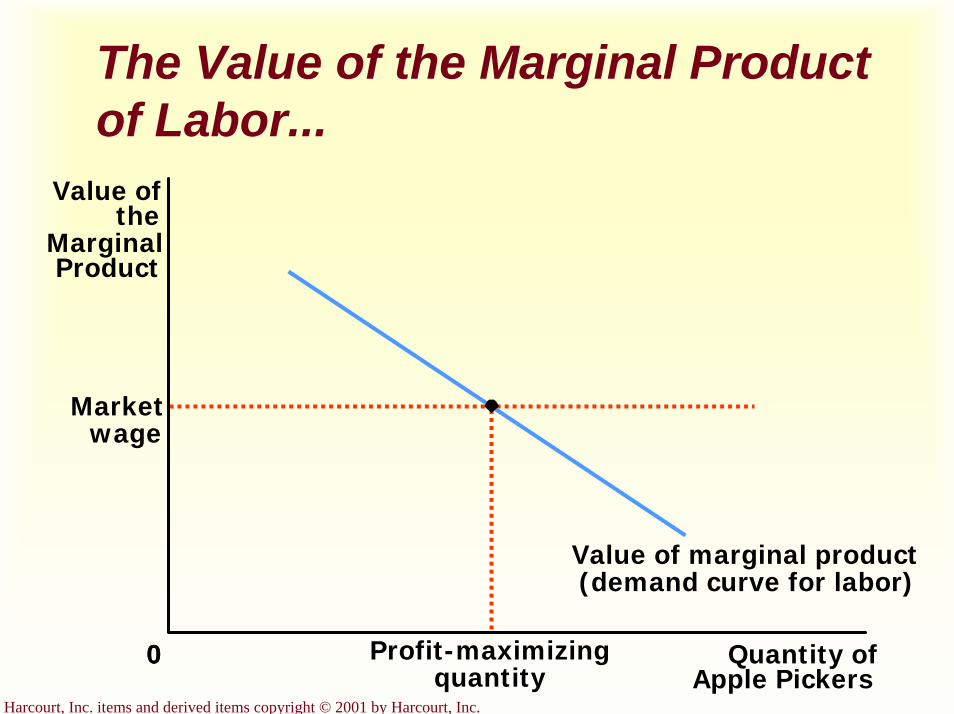
Harcourt, Inc. items and derived items copyright © 2001 by Harcourt, Inc.
The Value of the Marginal Product of Labor...
0 Quantity ofApple Pickers
0
Value ofthe
MarginalProduct
Value of marginal product(demand curve for labor)
Marketwage
Profit-maximizingquantity
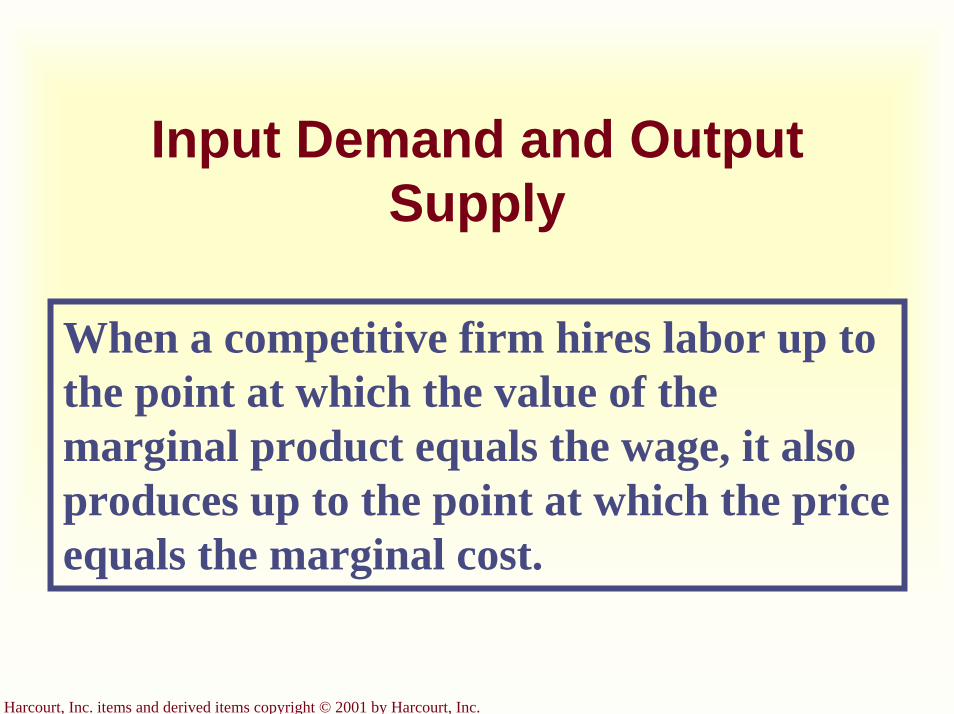
Harcourt, Inc. items and derived items copyright © 2001 by Harcourt, Inc.
Input Demand and Output Supply
When a competitive firm hires labor up to the point at which the value of the marginal product equals the wage, it also produces up to the point at which the price equals the marginal cost.
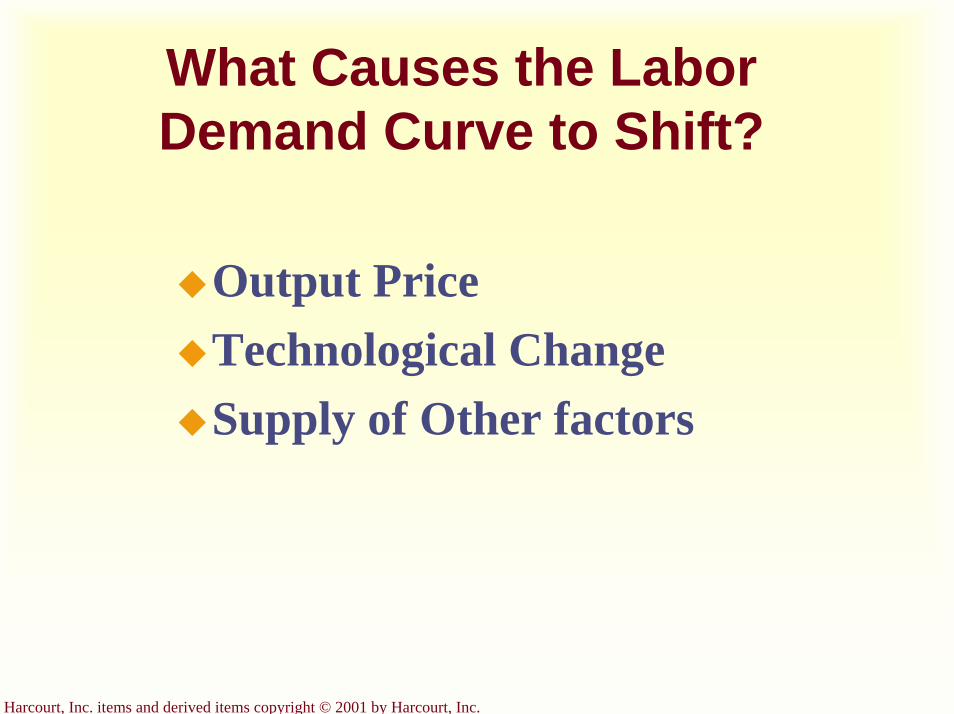
Harcourt, Inc. items and derived items copyright © 2001 by Harcourt, Inc.
What Causes the Labor Demand Curve to Shift?
Output PriceTechnological ChangeSupply of Other factors
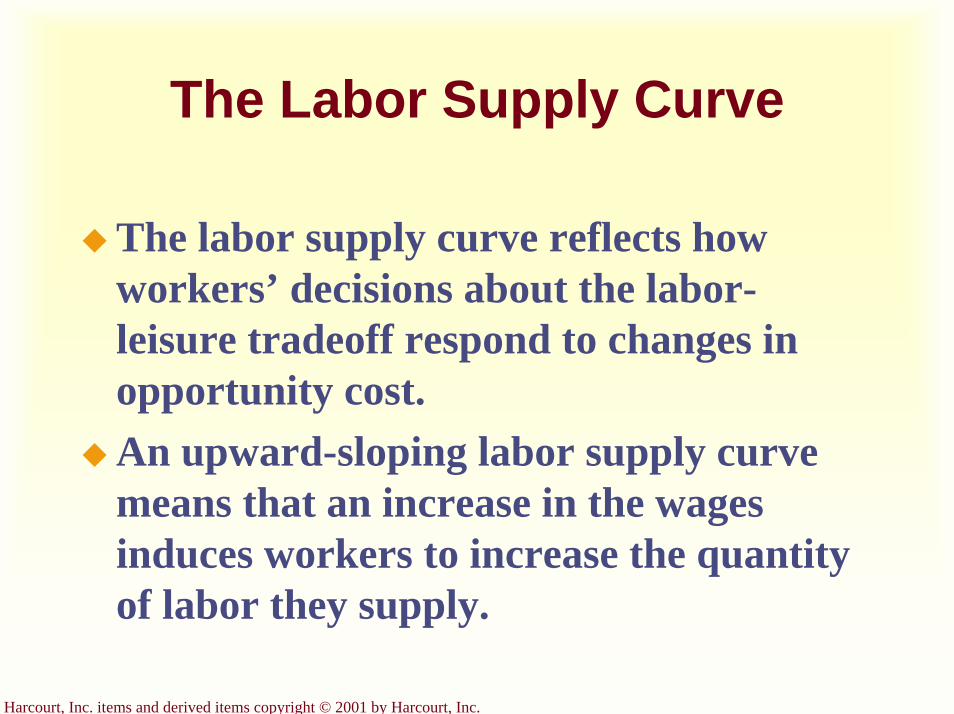
Harcourt, Inc. items and derived items copyright © 2001 by Harcourt, Inc.
The Labor Supply Curve
The labor supply curve reflects how workers’ decisions about the labor-leisure tradeoff respond to changes in opportunity cost.An upward-sloping labor supply curve means that an increase in the wages induces workers to increase the quantity of labor they supply.
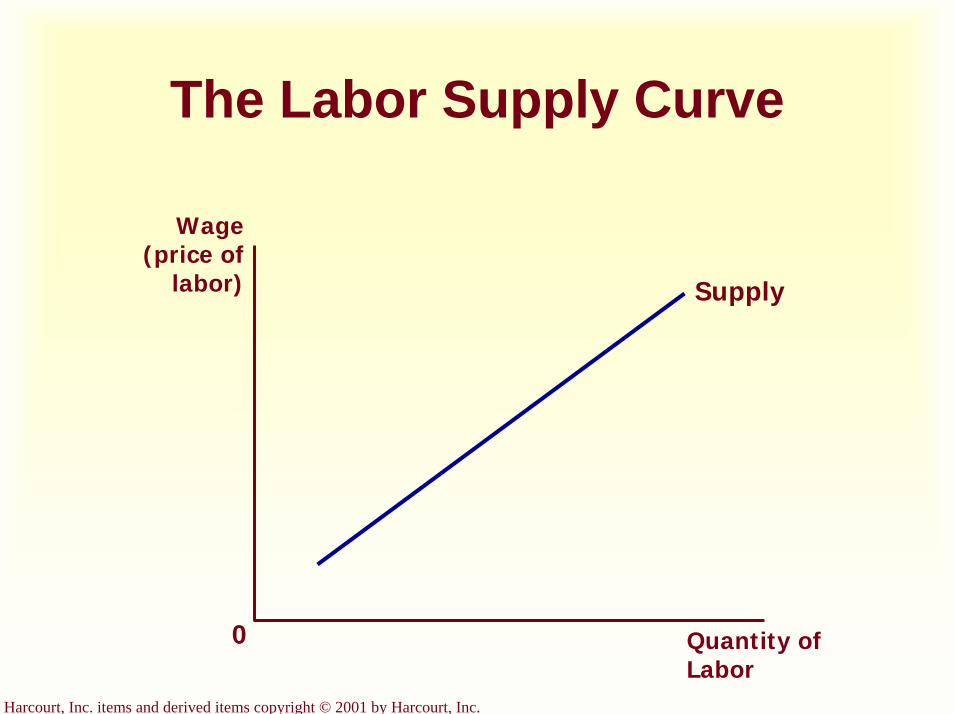
Harcourt, Inc. items and derived items copyright © 2001 by Harcourt, Inc.
The Labor Supply Curve
Wage (price of
labor) Supply
0 Quantity of Labor

Harcourt, Inc. items and derived items copyright © 2001 by Harcourt, Inc.
What Causes the Labor Supply Curve to Shift?
Changes in TastesChanges in Alternative OpportunitiesImmigration
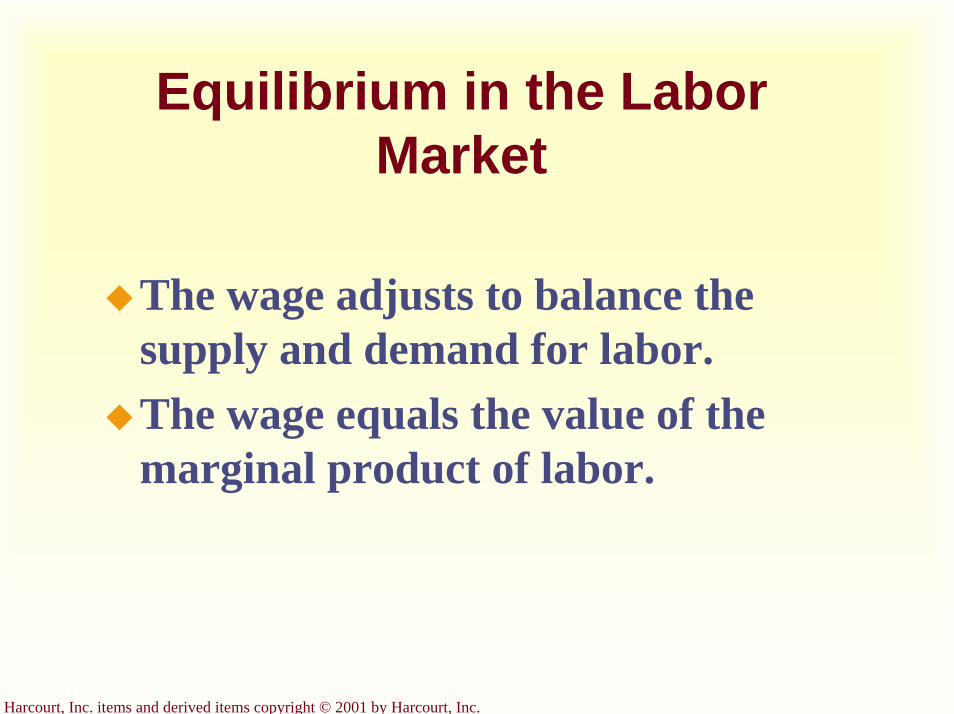
Harcourt, Inc. items and derived items copyright © 2001 by Harcourt, Inc.
Equilibrium in the Labor Market
The wage adjusts to balance the supply and demand for labor.The wage equals the value of the marginal product of labor.

Harcourt, Inc. items and derived items copyright © 2001 by Harcourt, Inc.
Equilibrium in the Labor Market...
Equilibrium employment, L
Supply
0
Wage (price of
labor)
Demand
Equilibrium wage, W
Quantity of Labor
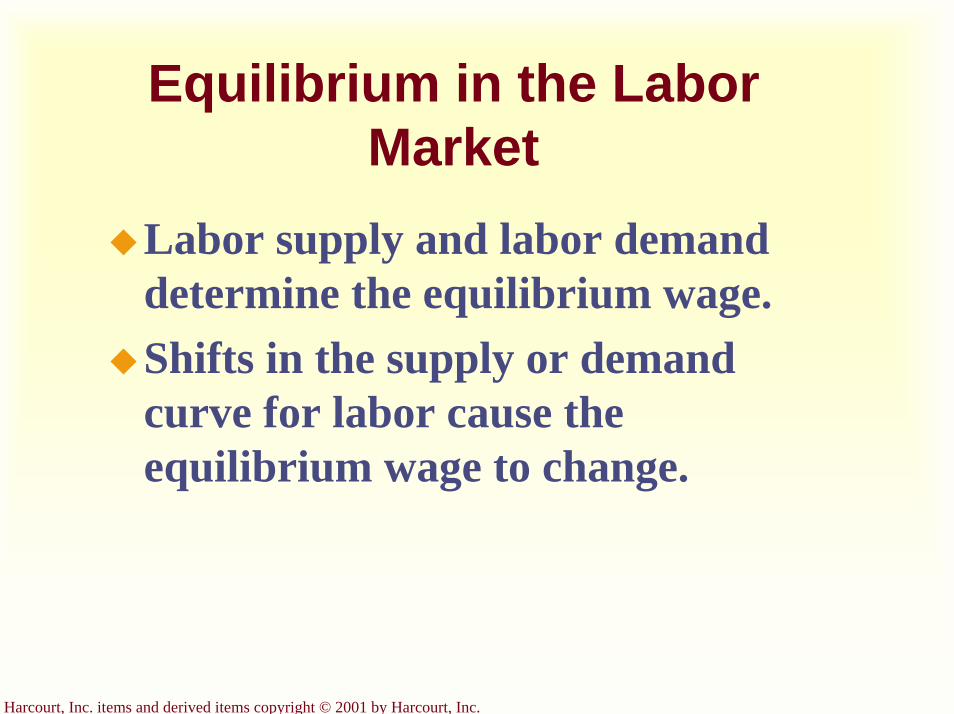
Harcourt, Inc. items and derived items copyright © 2001 by Harcourt, Inc.
Equilibrium in the Labor Market
Labor supply and labor demand determine the equilibrium wage.Shifts in the supply or demand curve for labor cause the equilibrium wage to change.

Harcourt, Inc. items and derived items copyright © 2001 by Harcourt, Inc.
A Shift in Labor Supply...
Wage(price of
labor)
W1
0 Quantity ofLabor
L1
Supply, S1
Demand
2. ...reducesthe wage...
3. ...and raises employment.
1. An increase inlabor supply...
S2
W2
L2
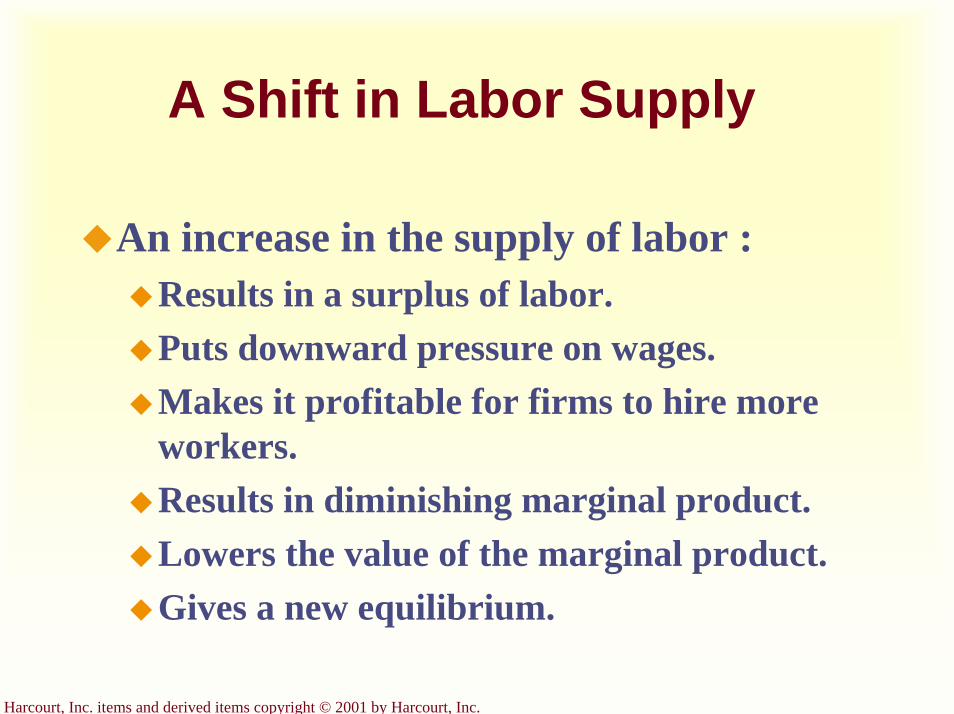
Harcourt, Inc. items and derived items copyright © 2001 by Harcourt, Inc.
A Shift in Labor Supply
An increase in the supply of labor :Results in a surplus of labor.Puts downward pressure on wages.Makes it profitable for firms to hire more workers.Results in diminishing marginal product.Lowers the value of the marginal product.Gives a new equilibrium.
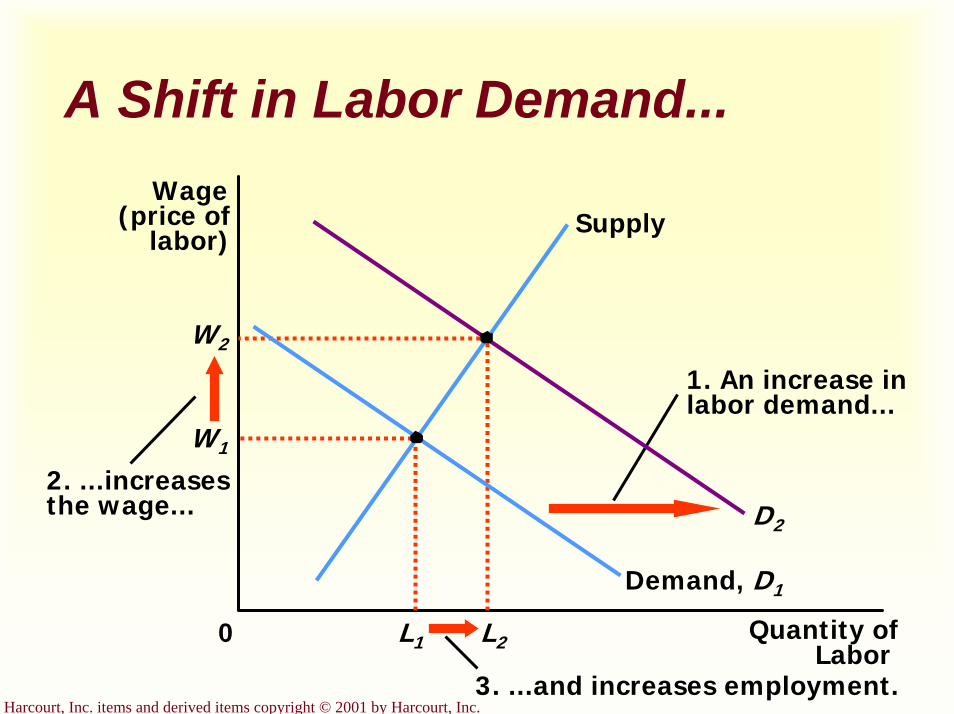
Harcourt, Inc. items and derived items copyright © 2001 by Harcourt, Inc.
A Shift in Labor Demand...Wage
(price oflabor)
W1
0 Quantity ofLabor
L1
Supply
Demand, D1
2. ...increasesthe wage...
3. ...and increases employment.
1. An increase inlabor demand...
D2
W2
L2
Harcourt, Inc. items and derived items copyright © 2001 by Harcourt, Inc.
Shifts in Labor Demand
An increase in the demand for labor :Makes it profitable for firms to hire more workers.Puts upward pressure on wages.Raises the value of the marginal product.Gives a new equilibrium.

Harcourt, Inc. items and derived items copyright © 2001 by Harcourt, Inc.
Three Determinants of Productivity
Physical CapitalWhen workers work with a larger quantity of equipment and structures, they produce more.
Human CapitalWhen workers are more educated, they produce more.
Technological KnowledgeWhen workers have access to more sophisticated technologies, they produce more.

Harcourt, Inc. items and derived items copyright © 2001 by Harcourt, Inc.
Productivity and Wage Growth in the United States
Time Period Growth Rate ofProductivity
Growth Rate ofWages
1959 - 1997 1.8 1.71959 - 1973 2.9 2.91973 - 1997 1.1 1.0
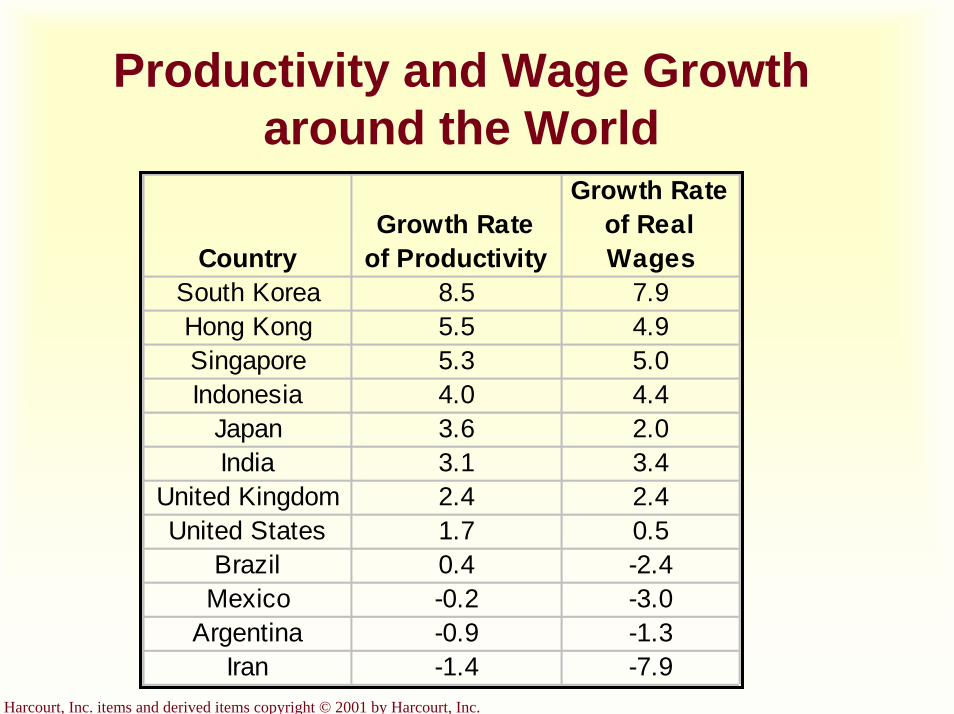
Harcourt, Inc. items and derived items copyright © 2001 by Harcourt, Inc.
Productivity and Wage Growth around the World
CountryGrowth Rate
of Productivity
Growth Rate of Real Wages
South Korea 8.5 7.9Hong Kong 5.5 4.9Singapore 5.3 5.0Indonesia 4.0 4.4
Japan 3.6 2.0India 3.1 3.4
United Kingdom 2.4 2.4United States 1.7 0.5
Brazil 0.4 -2.4Mexico -0.2 -3.0
Argentina -0.9 -1.3Iran -1.4 -7.9
Harcourt, Inc. items and derived items copyright © 2001 by Harcourt, Inc.
Other Factors of Production: Land and Capital
Capital refers to the stock of equipment and structures used for production.
The economy’s capital represents the accumulation of goods produced in the past that are being used in the present to produce new goods and services.
Harcourt, Inc. items and derived items copyright © 2001 by Harcourt, Inc.
Prices of Land and Capital
The purchase price is what a person pays to own a factor of production indefinitely.The rental price is what a person pays to use a factor of production for a limited period of time.
Harcourt, Inc. items and derived items copyright © 2001 by Harcourt, Inc.
Equilibrium in Markets for Land and Capital
The rental price of land and the rental price of capital are determined by supply and demand.
The firm increases the quantity hired until the value of the factor’s marginal product equals the factor’s price.
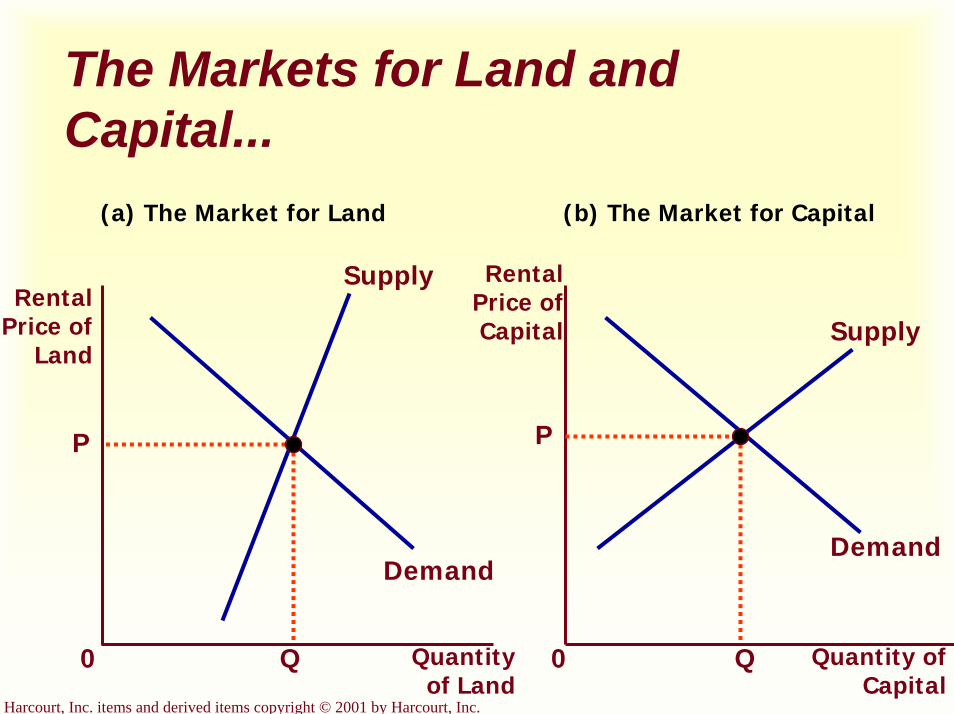
Harcourt, Inc. items and derived items copyright © 2001 by Harcourt, Inc.
The Markets for Land and Capital...
(a) The Market for Land (b) The Market for Capital
Quantity of Land
Quantity of Capital
Q Q0 0
Rental Price of Capital
DemandDemand
Supply
SupplyRental
Price of Land
PP
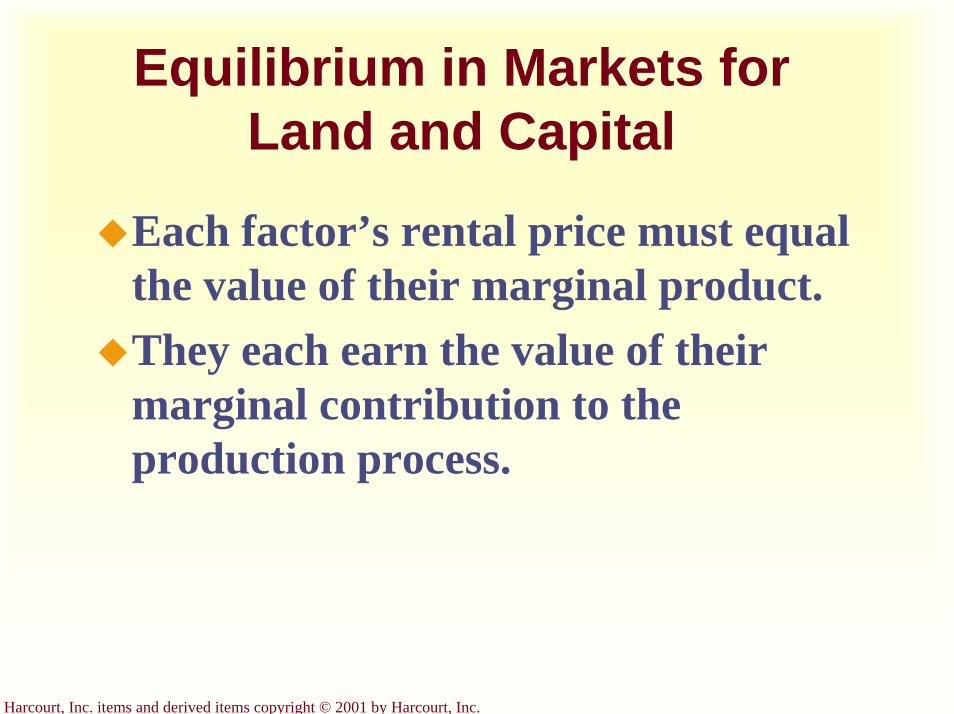
Harcourt, Inc. items and derived items copyright © 2001 by Harcourt, Inc.
Equilibrium in Markets for Land and Capital
Each factor’s rental price must equal the value of their marginal product. They each earn the value of their marginal contribution to the production process.
Harcourt, Inc. items and derived items copyright © 2001 by Harcourt, Inc.
Linkages Among the Factors of Production
Factors of production are used together.The marginal product of any one factor depends on the quantities of all factors that are available.
Harcourt, Inc. items and derived items copyright © 2001 by Harcourt, Inc.
Linkages Among the Factors of Production
A change in the supply of one factor alters the earnings of all the factors.
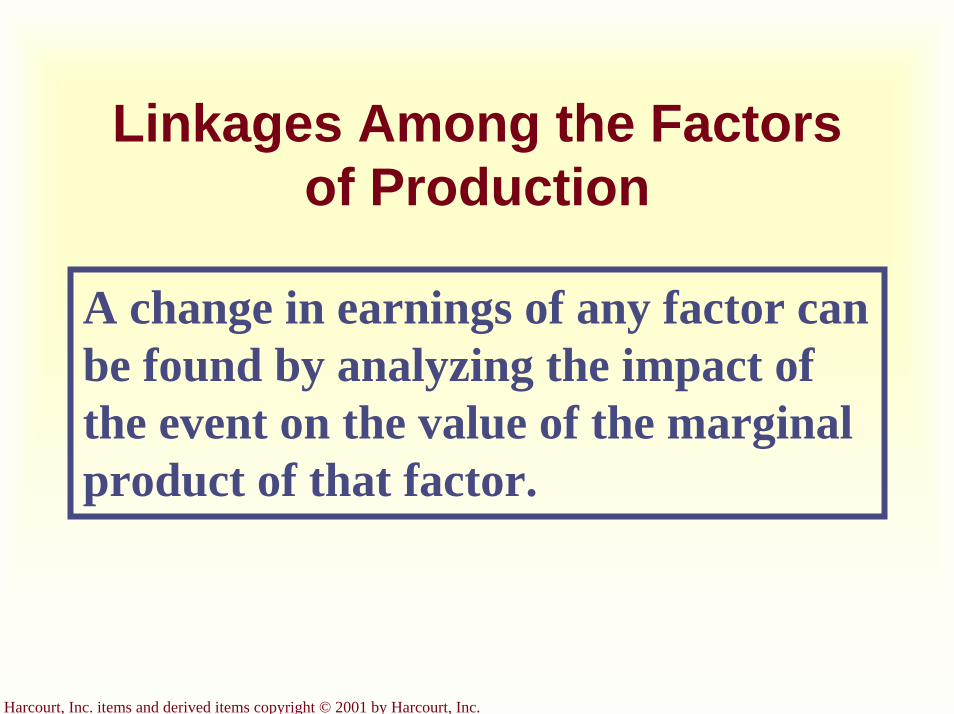
Harcourt, Inc. items and derived items copyright © 2001 by Harcourt, Inc.
Linkages Among the Factors of Production
A change in earnings of any factor can be found by analyzing the impact of the event on the value of the marginal product of that factor.
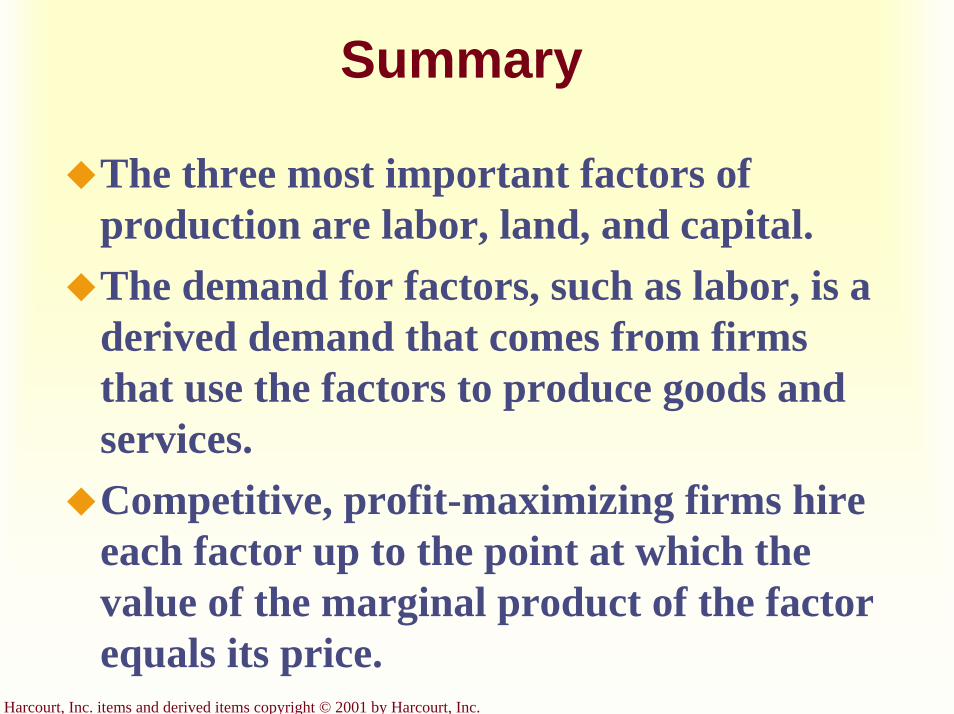
Harcourt, Inc. items and derived items copyright © 2001 by Harcourt, Inc.
Summary
The three most important factors of production are labor, land, and capital.The demand for factors, such as labor, is a derived demand that comes from firms that use the factors to produce goods and services.Competitive, profit-maximizing firms hire each factor up to the point at which the value of the marginal product of the factor equals its price.
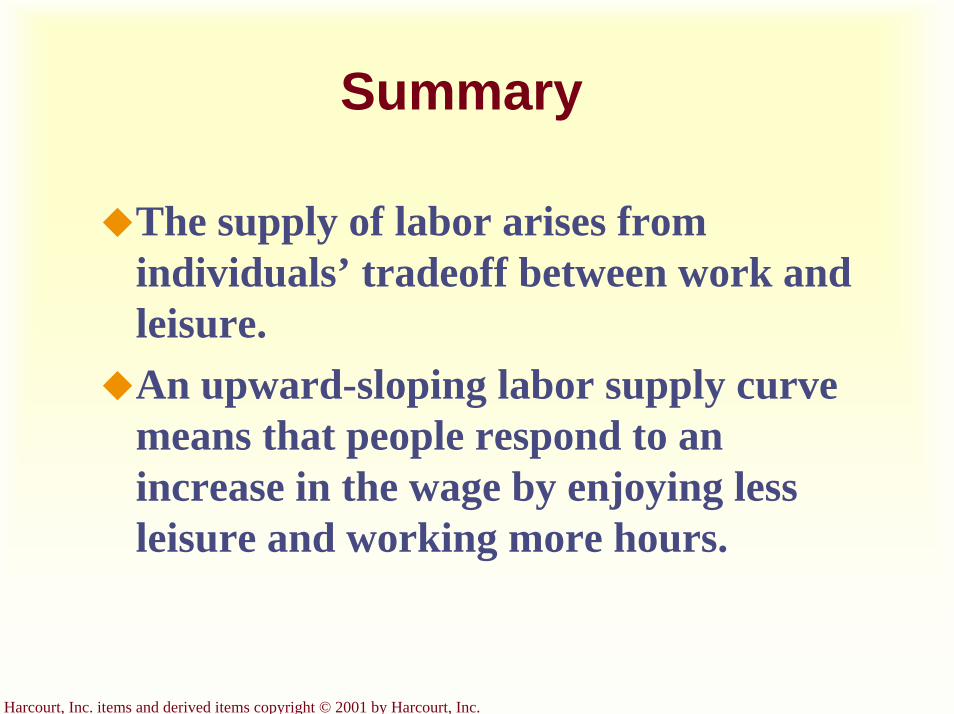
Harcourt, Inc. items and derived items copyright © 2001 by Harcourt, Inc.
Summary
The supply of labor arises from individuals’ tradeoff between work and leisure.An upward-sloping labor supply curve means that people respond to an increase in the wage by enjoying less leisure and working more hours.
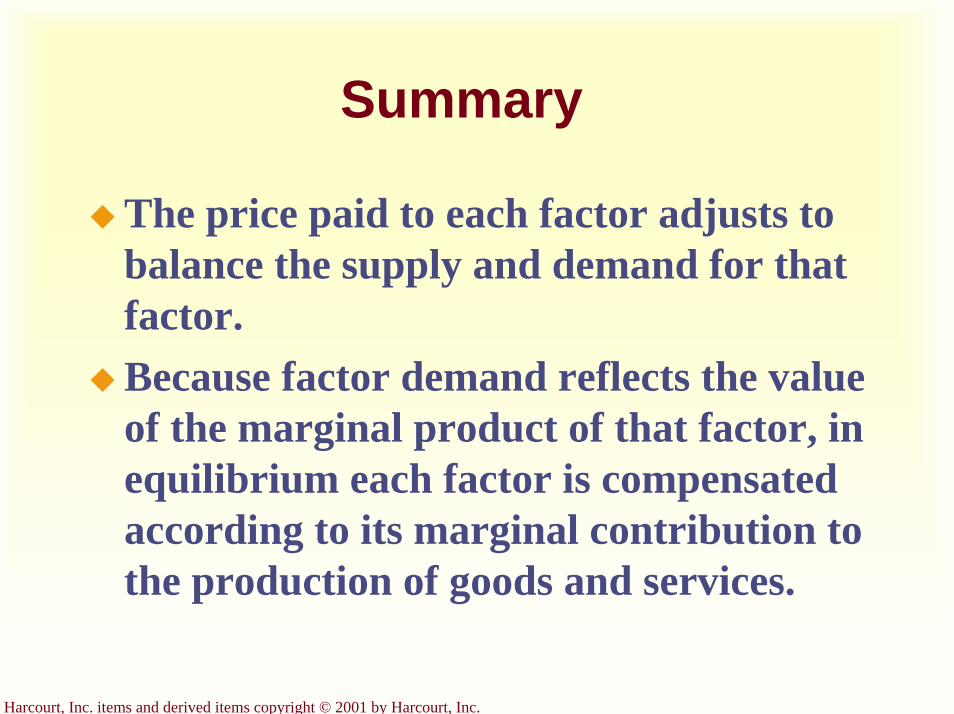
Harcourt, Inc. items and derived items copyright © 2001 by Harcourt, Inc.
Summary
The price paid to each factor adjusts to balance the supply and demand for that factor.Because factor demand reflects the value of the marginal product of that factor, in equilibrium each factor is compensated according to its marginal contribution to the production of goods and services.
Harcourt, Inc. items and derived items copyright © 2001 by Harcourt, Inc.
Summary
Because factors of production are used together, the marginal product of any one factor depends on the quantities of all factors that are available.As a result, a change in the supply of one factor alters the equilibrium earnings of all the factors.

Harcourt, Inc. items and derived items copyright © 2001 by Harcourt, Inc.
Graphical Review
Harcourt, Inc. items and derived items copyright © 2001 by Harcourt, Inc.
The Versatility of Supply and Demand...
(a) The Market for Apples (b) The Market for Apple Pickers
Quantity of Apples
Quantity of Apple Pickers
Q L
P W
0 0
Price of Apples
Wage of Apple
Pickers
DemandDemand
Supply Supply

Harcourt, Inc. items and derived items copyright © 2001 by Harcourt, Inc.
The Production Function...
00
50
100
150
200
250
300
350
0 1 2 3 4 5 6
Quantity of Apple Pickers
Qu
anti
ty o
f A
pple
s
1
2
3
4
5

Harcourt, Inc. items and derived items copyright © 2001 by Harcourt, Inc.
The Value of the Marginal Product of Labor...
0 Quantity ofApple Pickers
0
Value ofthe
MarginalProduct
Value of marginal product(demand curve for labor)
Marketwage
Profit-maximizingquantity

Harcourt, Inc. items and derived items copyright © 2001 by Harcourt, Inc.
The Labor Supply Curve
Supply
Wage (price of
labor)
Quantity of Labor
0
Harcourt, Inc. items and derived items copyright © 2001 by Harcourt, Inc.
Equilibrium in the Labor Market...
Equilibrium employment, L
Supply
Wage (price of
labor)
Quantity of Labor
0
Demand
Equilibrium wage, W
Harcourt, Inc. items and derived items copyright © 2001 by Harcourt, Inc.
A Shift in Labor Supply...
Wage(price of
labor)
W1
0 Quantity ofLabor
L1
Supply, S1
Demand
2. ...reducesthe wage...
3. ...and raises employment.
1. An increase inlabor supply...
S2
W2
L2

Harcourt, Inc. items and derived items copyright © 2001 by Harcourt, Inc.
A Shift in Labor Demand...Wage
(price oflabor)
W1
0 Quantity ofLabor
L1
Supply
Demand, D1
2. ...increasesthe wage...
3. ...and increases employment.
1. An increase inlabor demand...
D2
W2
L2

Harcourt, Inc. items and derived items copyright © 2001 by Harcourt, Inc.
The Markets for Land and Capital...
Quantity of Land
Quantity of Capital
Q Q
P P
0 0
Rental Price of
Land
Rental Price of Capital
DemandDemand
Supply
Supply
(a) The Market for Land (b) The Market for Capital