Embed Size (px)
Citation preview
7/29/2019 Microeconomic mankiw English
http://slidepdf.com/reader/full/microeconomic-mankiw-english 1/8
Kisi – kisi Mikro UAS
Chapter 11
What is the free-rider problem? Why does the free-rider problem induce the government to provide public goods? • How
should the government decide whether to provide a public good?
The free-rider problem occurs when people receive the benefits of a good but avoid payingfor it. The free-rider problem induces the government to provide public goods because the
private market will not produce an efficient quantity on its own. The government uses taxrevenue to provide the good, everyone pays for it, and everyone enjoys its benefits. Thegovernment should decide whether to provide a public good by comparing the good’s costs to its benefits. If the benefits exceed the costs, society is better off.
why do governments try to limit the use of common resources?
Governments try to limit the use of common resources because one person’s use of the
resource diminishes others’ use of it. This means that there is a negative externality and
people tend to use common resources excessively.
Define and give an example of a public good.
Can the private market provide this good on its
own? Explain.
A public good is a good that is neither excludable nor rival in consumption. An example isnational defense, which protects the entire nation. No one can be prevented from enjoyingthe benefits of it, so it is not excludable, and an additional person who benefits from it does
not diminish the value of it to others, so it is not rival in consumption. The private market willnot supply the good, because no one would pay for it because they cannot be excluded fromenjoying it if they don't pay for it.
Chapter 13
Define total cost, average total cost, and marginal
cost . How are they related?
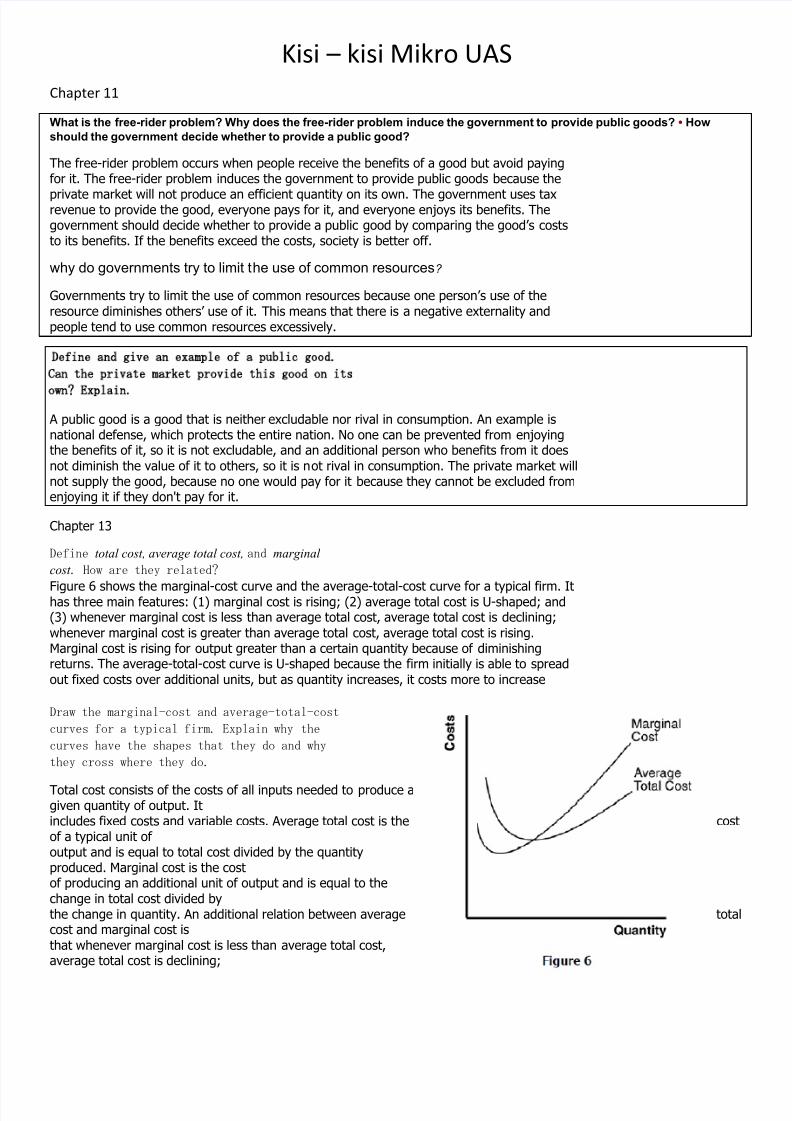
Figure 6 shows the marginal-cost curve and the average-total-cost curve for a typical firm. Ithas three main features: (1) marginal cost is rising; (2) average total cost is U-shaped; and(3) whenever marginal cost is less than average total cost, average total cost is declining;
whenever marginal cost is greater than average total cost, average total cost is rising.Marginal cost is rising for output greater than a certain quantity because of diminishingreturns. The average-total-cost curve is U-shaped because the firm initially is able to spread
out fixed costs over additional units, but as quantity increases, it costs more to increase
Draw the marginal-cost and average-total-cost
curves for a typical firm. Explain why the
curves have the shapes that they do and why
they cross where they do.
Total cost consists of the costs of all inputs needed to produce agiven quantity of output. Itincludes fixed costs and variable costs. Average total cost is the costof a typical unit of output and is equal to total cost divided by the quantityproduced. Marginal cost is the costof producing an additional unit of output and is equal to the
change in total cost divided bythe change in quantity. An additional relation between average totacost and marginal cost is
that whenever marginal cost is less than average total cost,average total cost is declining;
7/29/2019 Microeconomic mankiw English
http://slidepdf.com/reader/full/microeconomic-mankiw-english 2/8
whenever marginal cost is greater than average total cost, average total cost is rising.
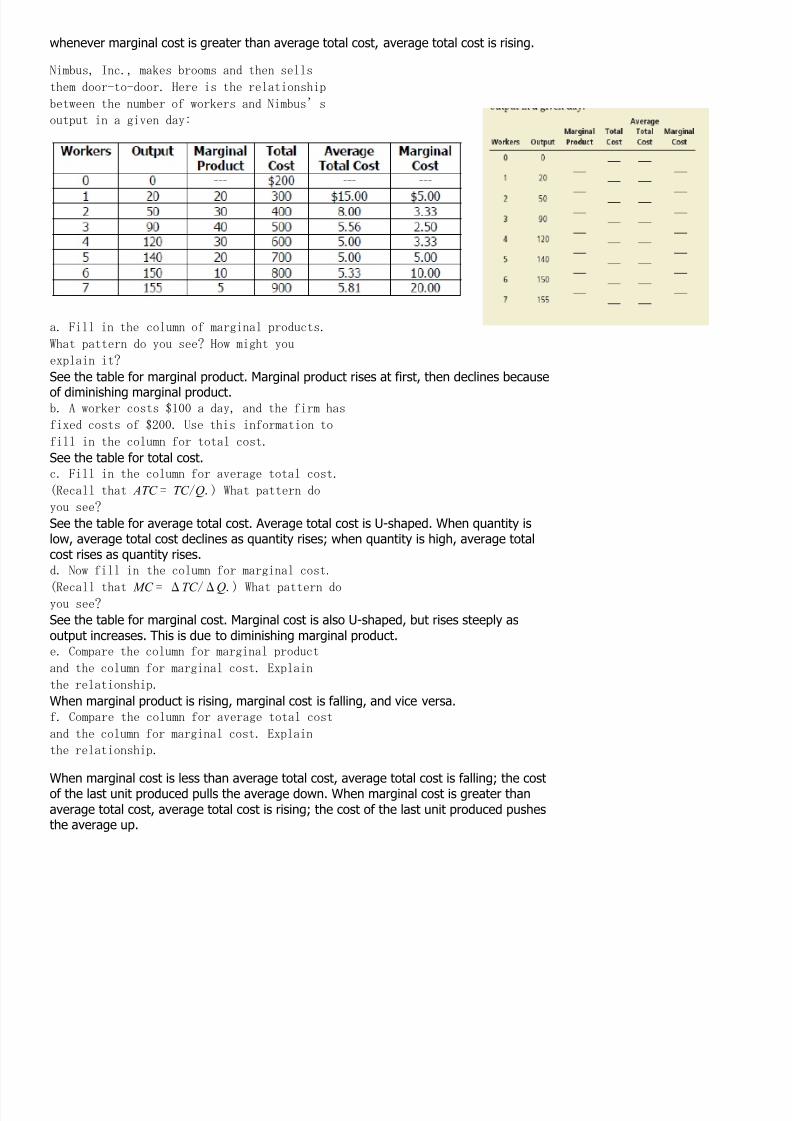
Nimbus, Inc., makes brooms and then sells
them door-to-door. Here is the relationship
between the number of workers and Nimbus’s
output in a given day:
a. Fill in the column of marginal products.
What pattern do you see? How might you
explain it?
See the table for marginal product. Marginal product rises at first, then declines because
of diminishing marginal product. b. A worker costs $100 a day, and the firm has
fixed costs of $200. Use this information to
fill in the column for total cost.
See the table for total cost.
c. Fill in the column for average total cost.
(Recall that ATC = TC /Q.) What pattern do
you see?
See the table for average total cost. Average total cost is U-shaped. When quantity islow, average total cost declines as quantity rises; when quantity is high, average totalcost rises as quantity rises.
d. Now fill in the column for marginal cost.
(Recall that MC = ΔTC /ΔQ.) What pattern doyou see?
See the table for marginal cost. Marginal cost is also U-shaped, but rises steeply as
output increases. This is due to diminishing marginal product. e. Compare the column for marginal product
and the column for marginal cost. Explain
the relationship.
When marginal product is rising, marginal cost is falling, and vice versa.
f. Compare the column for average total cost
and the column for marginal cost. Explain
the relationship.
When marginal cost is less than average total cost, average total cost is falling; the costof the last unit produced pulls the average down. When marginal cost is greater than
average total cost, average total cost is rising; the cost of the last unit produced pushesthe average up.
7/29/2019 Microeconomic mankiw English
http://slidepdf.com/reader/full/microeconomic-mankiw-english 3/8
Chapter 14
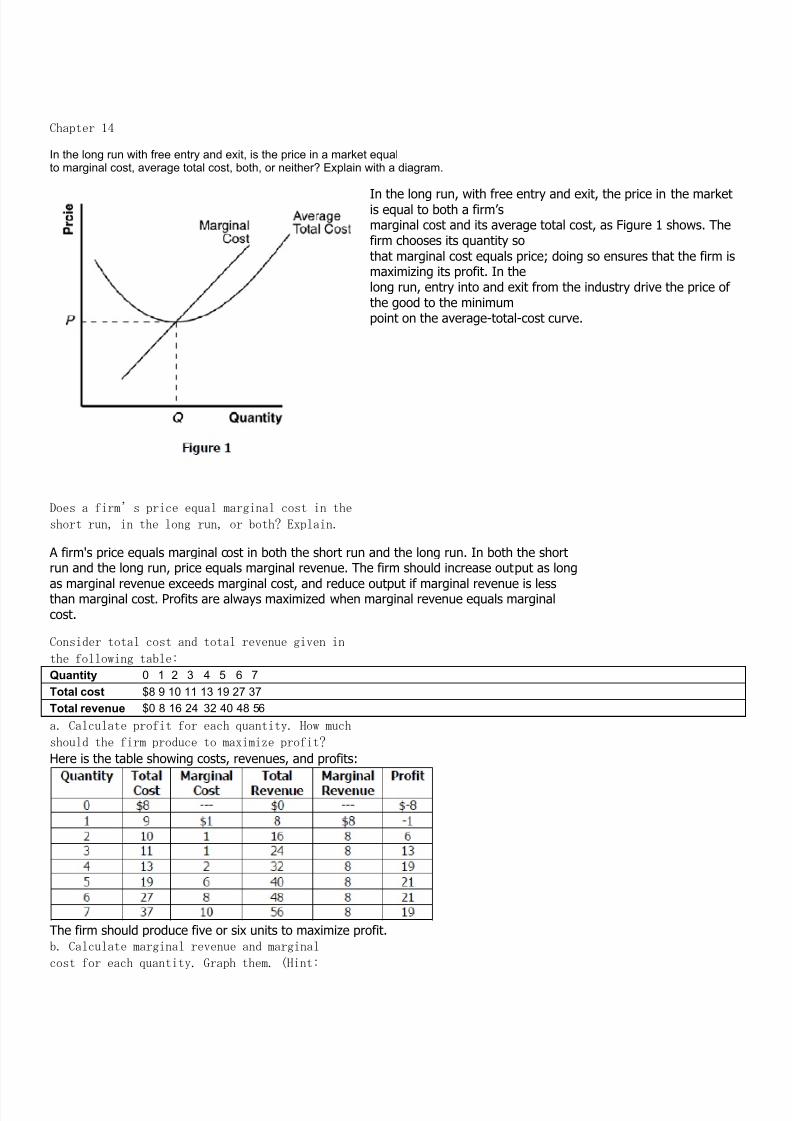
In the long run with free entry and exit, is the price in a market equalto marginal cost, average total cost, both, or neither? Explain with a diagram.
In the long run, with free entry and exit, the price in the marketis equal to both a firm’s marginal cost and its average total cost, as Figure 1 shows. Thefirm chooses its quantity so
that marginal cost equals price; doing so ensures that the firm ismaximizing its profit. In thelong run, entry into and exit from the industry drive the price of the good to the minimumpoint on the average-total-cost curve.
Does a firm’s price equal marginal cost in the
short run, in the long run, or both? Explain.
A firm's price equals marginal cost in both the short run and the long run. In both the shortrun and the long run, price equals marginal revenue. The firm should increase output as long
as marginal revenue exceeds marginal cost, and reduce output if marginal revenue is lessthan marginal cost. Profits are always maximized when marginal revenue equals marginalcost.
Consider total cost and total revenue given in
the following table:
Quantity 0 1 2 3 4 5 6 7
Total cost $8 9 10 11 13 19 27 37
Total revenue $0 8 16 24 32 40 48 56
a. Calculate profit for each quantity. How much
should the firm produce to maximize profit?
Here is the table showing costs, revenues, and profits:
The firm should produce five or six units to maximize profit.
b. Calculate marginal revenue and marginal
cost for each quantity. Graph them. (Hint:
7/29/2019 Microeconomic mankiw English
http://slidepdf.com/reader/full/microeconomic-mankiw-english 4/8
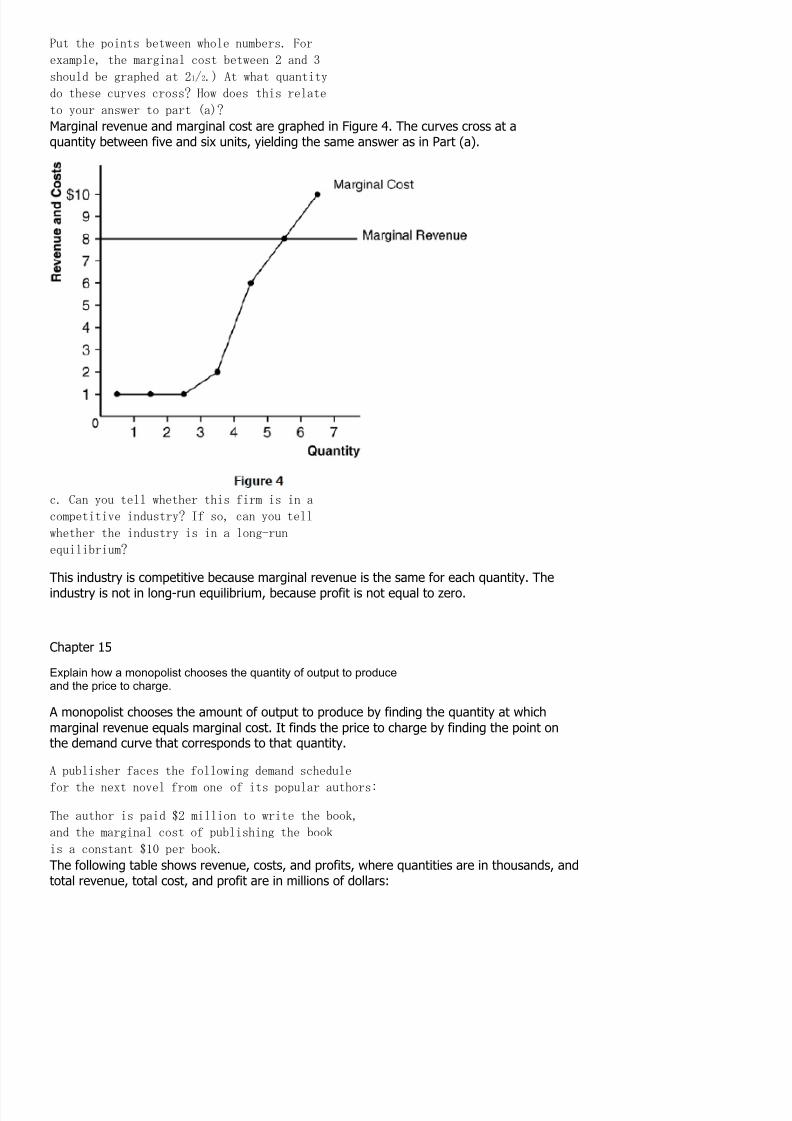
Put the points between whole numbers. For
example, the marginal cost between 2 and 3
should be graphed at 21⁄2.) At what quantity
do these curves cross? How does this relate
to your answer to part (a)?
Marginal revenue and marginal cost are graphed in Figure 4. The curves cross at aquantity between five and six units, yielding the same answer as in Part (a).
c. Can you tell whether this firm is in a
competitive industry? If so, can you tell
whether the industry is in a long-run
equilibrium?
This industry is competitive because marginal revenue is the same for each quantity. The
industry is not in long-run equilibrium, because profit is not equal to zero.
Chapter 15
Explain how a monopolist chooses the quantity of output to produceand the price to charge.
A monopolist chooses the amount of output to produce by finding the quantity at which
marginal revenue equals marginal cost. It finds the price to charge by finding the point onthe demand curve that corresponds to that quantity.
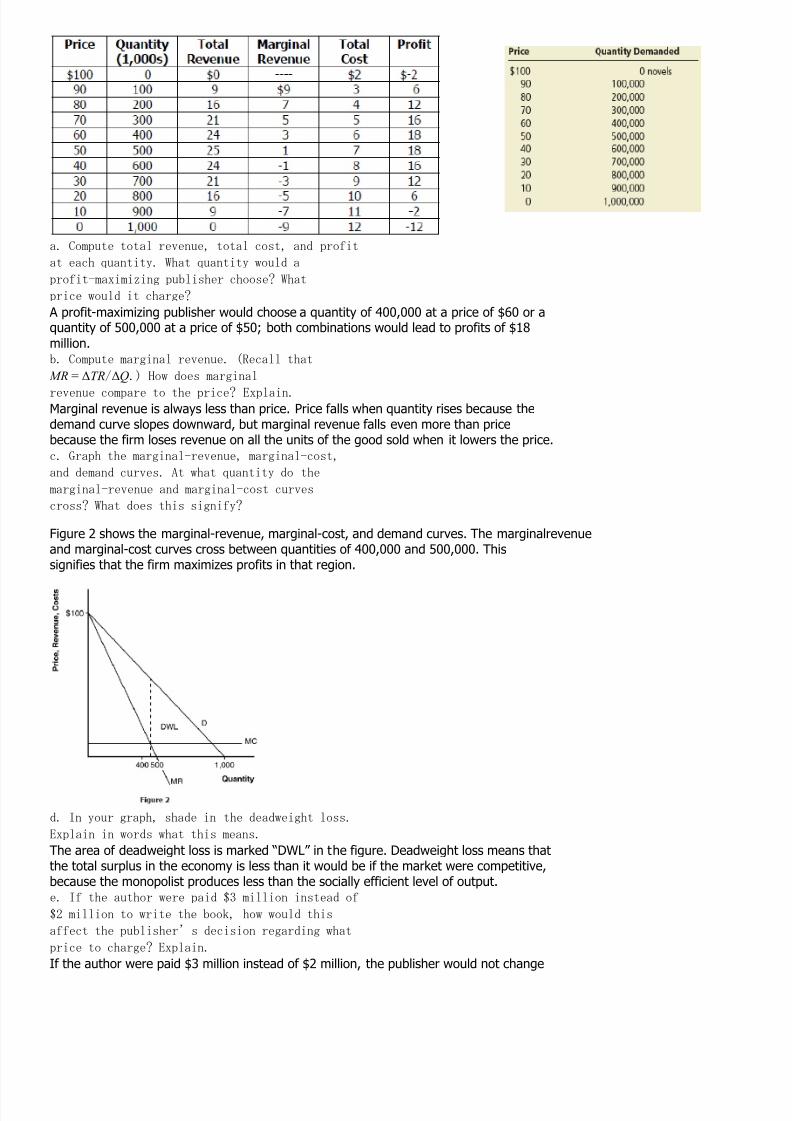
A publisher faces the following demand schedule
for the next novel from one of its popular authors:
The author is paid $2 million to write the book,
and the marginal cost of publishing the book
is a constant $10 per book.
The following table shows revenue, costs, and profits, where quantities are in thousands, andtotal revenue, total cost, and profit are in millions of dollars:
7/29/2019 Microeconomic mankiw English
http://slidepdf.com/reader/full/microeconomic-mankiw-english 5/8
a. Compute total revenue, total cost, and profit
at each quantity. What quantity would a
profit-maximizing publisher choose? What
price would it charge?
A profit-maximizing publisher would choose a quantity of 400,000 at a price of $60 or aquantity of 500,000 at a price of $50; both combinations would lead to profits of $18
million.
b. Compute marginal revenue. (Recall that
MR = ΔTR/ΔQ.) How does marginal
revenue compare to the price? Explain.Marginal revenue is always less than price. Price falls when quantity rises because thedemand curve slopes downward, but marginal revenue falls even more than pricebecause the firm loses revenue on all the units of the good sold when it lowers the price.
c. Graph the marginal-revenue, marginal-cost,
and demand curves. At what quantity do the
marginal-revenue and marginal-cost curves
cross? What does this signify?
Figure 2 shows the marginal-revenue, marginal-cost, and demand curves. The marginalrevenueand marginal-cost curves cross between quantities of 400,000 and 500,000. Thissignifies that the firm maximizes profits in that region.
d. In your graph, shade in the deadweight loss.
Explain in words what this means.
The area of deadweight loss is marked “DWL” in the figure. Deadweight loss means that the total surplus in the economy is less than it would be if the market were competitive,because the monopolist produces less than the socially efficient level of output.
e. If the author were paid $3 million instead of
$2 million to write the book, how would this
affect the publisher’s decision regarding what
price to charge? Explain.
If the author were paid $3 million instead of $2 million, the publisher would not change
7/29/2019 Microeconomic mankiw English
http://slidepdf.com/reader/full/microeconomic-mankiw-english 6/8
the price, because there would be no change in marginal cost or marginal revenue. The
only thing that would be affected would be the firm’s profit, which would fall. f. Suppose the publisher was not profit-maximizing
but was concerned with maximizing
economic efficiency. What price
would it charge for the book? How much
profit would it make at this price?
To maximize economic efficiency, the publisher would set the price at $10 per book,because that is the marginal cost of the book. At that price, the publisher would have
negative profits equal to the amount paid to the author.
Chapter 16Define oligopoly and monopolistic competition and give an exampleof each.
Oligopoly a market structure in which only a few sellers offer similar or identical productsMonopolistic competition a market structure in which many firms sell products that are similar but not identical
Describe the three attributes of monopolistic
competition. How is monopolistic competition
like monopoly? How is it like perfectcompetition?
To be more precise, monopolistic competition describes a market with the following
attributes:
• Many sellers: There are many firms competing for the same group of customers.
• Product differentiation: Each firm produces a product that is at least slightly
different from those of other firms. Thus, rather than being a price taker,
each firm faces a downward-sloping demand curve.
• Free entry and exit : Firms can enter or exit the market without restriction.
Thus, the number of firms in the market adjusts until economic profits are
driven to zero.
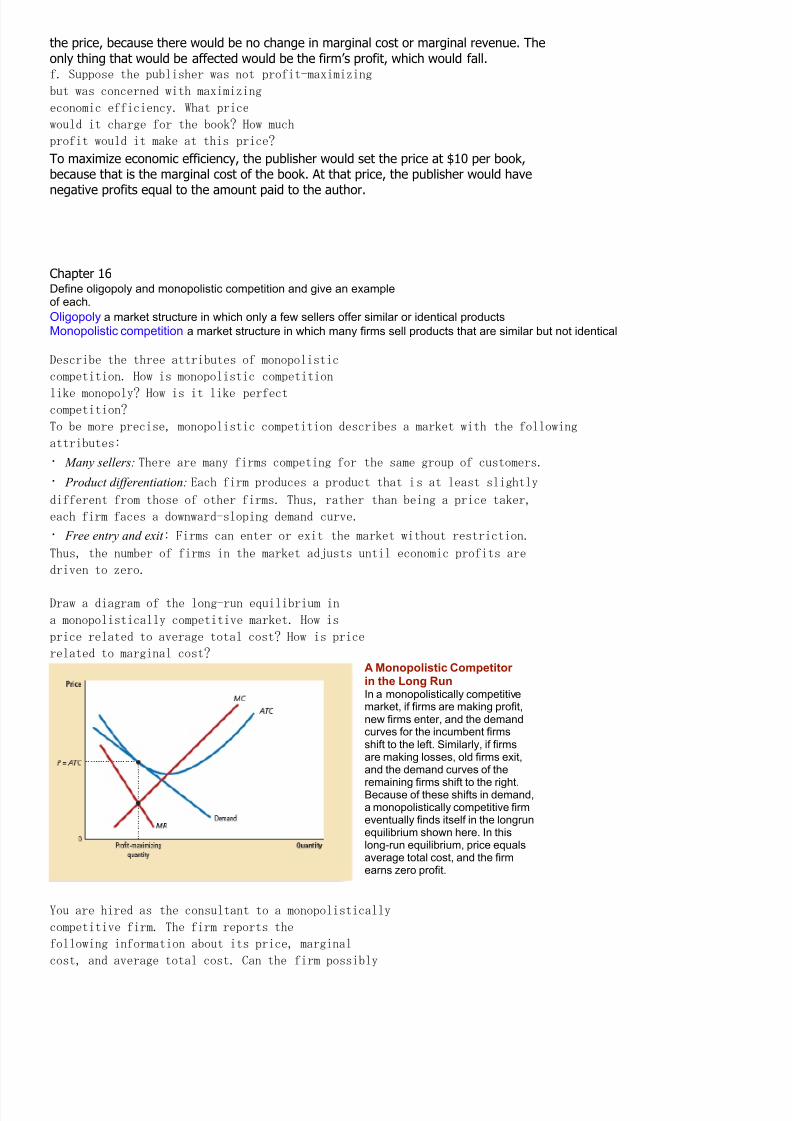
Draw a diagram of the long-run equilibrium in
a monopolistically competitive market. How is
price related to average total cost? How is price
related to marginal cost?A Monopolistic Competitor in the Long RunIn a monopolistically competitivemarket, if firms are making profit,new firms enter, and the demandcurves for the incumbent firmsshift to the left. Similarly, if firmsare making losses, old firms exit,and the demand curves of the
remaining firms shift to the right.Because of these shifts in demand,a monopolistically competitive firmeventually finds itself in the longrunequilibrium shown here. In thislong-run equilibrium, price equalsaverage total cost, and the firmearns zero profit.
You are hired as the consultant to a monopolistically
competitive firm. The firm reports the
following information about its price, marginal
cost, and average total cost. Can the firm possibly
7/29/2019 Microeconomic mankiw English
http://slidepdf.com/reader/full/microeconomic-mankiw-english 7/8
be maximizing profit? If not, what should it
do to increase profit? If the firm is profit maximizing,
is the firm in a long-run equilibrium?
If not, what will happen to restore long-run
equilibrium?
a. P < MC , P > ATC
b. P > MC , P < ATC
c. P = MC , P > ATC
d. P > MC , P = ATC
Chaptr 17
Compare the quantity and price of an oligopoly
to those of a monopoly.
Firms in an oligopoly produce a quantity of output that is greater than the level produced by monopoly. They sell the
product at a price that is lower than the monopoly price.
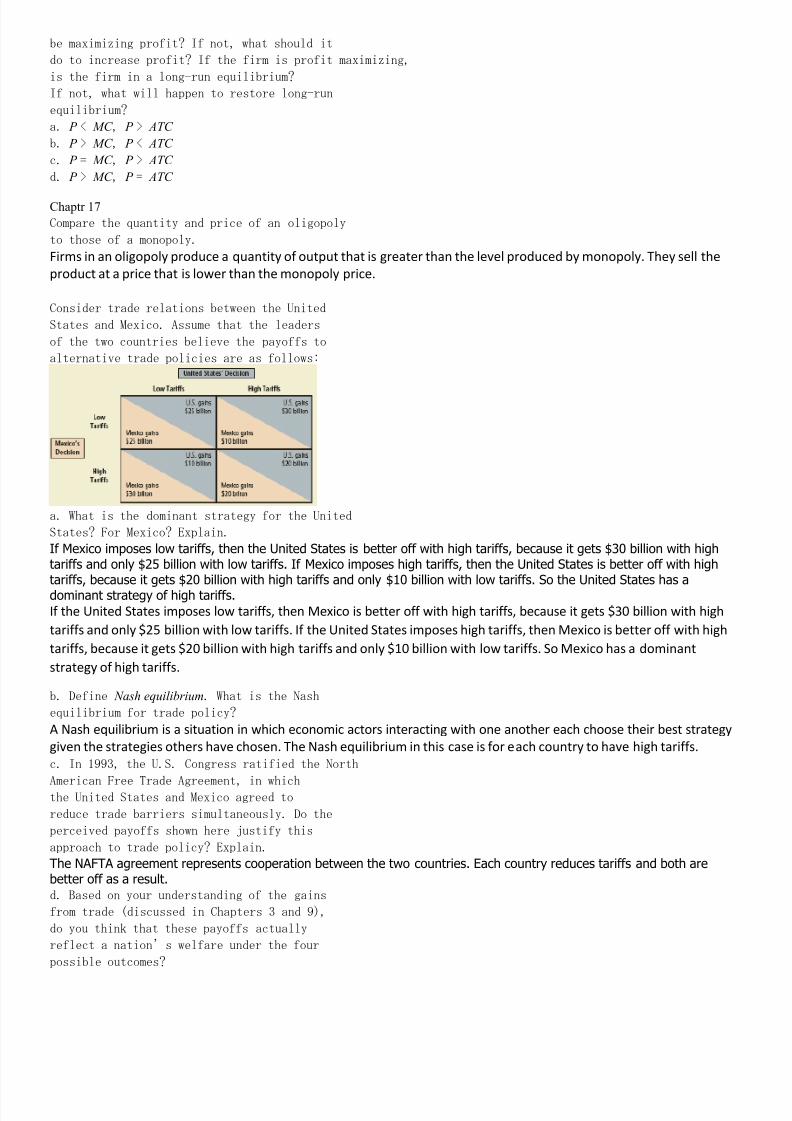
Consider trade relations between the United
States and Mexico. Assume that the leaders
of the two countries believe the payoffs to
alternative trade policies are as follows:
a. What is the dominant strategy for the United
States? For Mexico? Explain.
If Mexico imposes low tariffs, then the United States is better off with high tariffs, because it gets $30 billion with hightariffs and only $25 billion with low tariffs. If Mexico imposes high tariffs, then the United States is better off with hightariffs, because it gets $20 billion with high tariffs and only $10 billion with low tariffs. So the United States has adominant strategy of high tariffs.
If the United States imposes low tariffs, then Mexico is better off with high tariffs, because it gets $30 billion with high
tariffs and only $25 billion with low tariffs. If the United States imposes high tariffs, then Mexico is better off with high
tariffs, because it gets $20 billion with high tariffs and only $10 billion with low tariffs. So Mexico has a dominant
strategy of high tariffs.
b. Define Nash equilibrium. What is the Nash
equilibrium for trade policy?
A Nash equilibrium is a situation in which economic actors interacting with one another each choose their best strategy
given the strategies others have chosen. The Nash equilibrium in this case is for each country to have high tariffs.
c. In 1993, the U.S. Congress ratified the North
American Free Trade Agreement, in whichthe United States and Mexico agreed to
reduce trade barriers simultaneously. Do the
perceived payoffs shown here justify this
approach to trade policy? Explain.
The NAFTA agreement represents cooperation between the two countries. Each country reduces tariffs and both arebetter off as a result.
d. Based on your understanding of the gains
from trade (discussed in Chapters 3 and 9),
do you think that these payoffs actually
reflect a nation’s welfare under the four
possible outcomes?
7/29/2019 Microeconomic mankiw English
http://slidepdf.com/reader/full/microeconomic-mankiw-english 8/8
The payoffs in the upper left and lower right parts of the box do reflect a nation’s welfare. Trade is beneficial and tariffs
are a barrier to trade. However, the payoffs in the upper right and lower left parts of the box are not valid. A tariff hurtsdomestic consumers and helps domestic producers, but total surplus declines, as we saw in Chapter 9. So it would bemore accurate for these two areas of the box to show that both countries’ welfare will decline if they imposed high tariffs,whether or not the other country had high or low tariffs.
Chapter 18Define marginal product of labor and value of the marginal productof labor. • Describe how a competitive, profit-maximizing firm decides how manyworkers to hire.
The marginal product of labor is the increase in the amount of output from an additional unit of labor. The value of themarginal product of labor is the marginal product of labor times the price of the good. A competitive, profit-maximizing firm decides how many workers to hire by hiring workers up to the point where the valueof the marginal product of labor equals the wage.
The Demand for LaborThe wage of workers is determined by the supply and demand
for workers.