Embed Size (px)
Citation preview

Presentation by Rebecca H. Cort, Deputy CommissionerOffice of Vocational and Educational Services for Individuals with Disabilities
Statewide Briefing, October 2009
The State of Special EducationOctober 2009

2
Results
Performance Indicators– Graduation rates– Drop out rates– Participation &
performance on State Assessments
– High suspension rates– Placements in least
restrictive environment– Preschool outcomes– Parental involvement– Post school outcomes
Compliance Indicators– Timely evaluations– Timely services– Transition planning– Disproportionality by
race/ethnicity due to inappropriate policies and procedures

Academic Outcomes and Students with
Disabilities

4
39.3% 41.3%
55.0%
37.5%37.9%
2001 Cohort 2002 Cohort 2003 Cohort 2004 Cohort NYSGraduationMinimum
Target
NYSGraduationGoal 2012
Bo
ard
of
Re
ge
nts
dis
cu
ss
ing
Trend in Percent of Students with Disabilities Graduating with Regents or Local Diploma After 4 Years as of June
2004 cohort results of 41.3% exceeded the IDEA target of 38% Future targets are more rigorous:
2008-09 target is 44%2009-10 target will be 49%2010-11 target will be 52%
NYSED, VESID APR Feb 2009 data as of 1/23/09, Indicator #1
(This slide presents data available when each APR was prepared. Later changes made by SED to 2001 and 2002 total cohort data are not reflected here.)
5
17.6
%
30.4
%
32.5
%
48.1
%
74.0
%
20.5
% 28.8
%
31.2
%
45.6
%
22.6
%
26.3
% 34.8
%
36.1
%
51.7
%
74.4
%
21.7
%
18.6
%
74.1
%
72.4
%
49.0
%
35.9
%
31.7
%
22.5
%
19.8
%
New York City Large City Urban-Suburban Rural Average Low
2001 Cohort 2002 Cohort 2003 Cohort 2004 Cohort
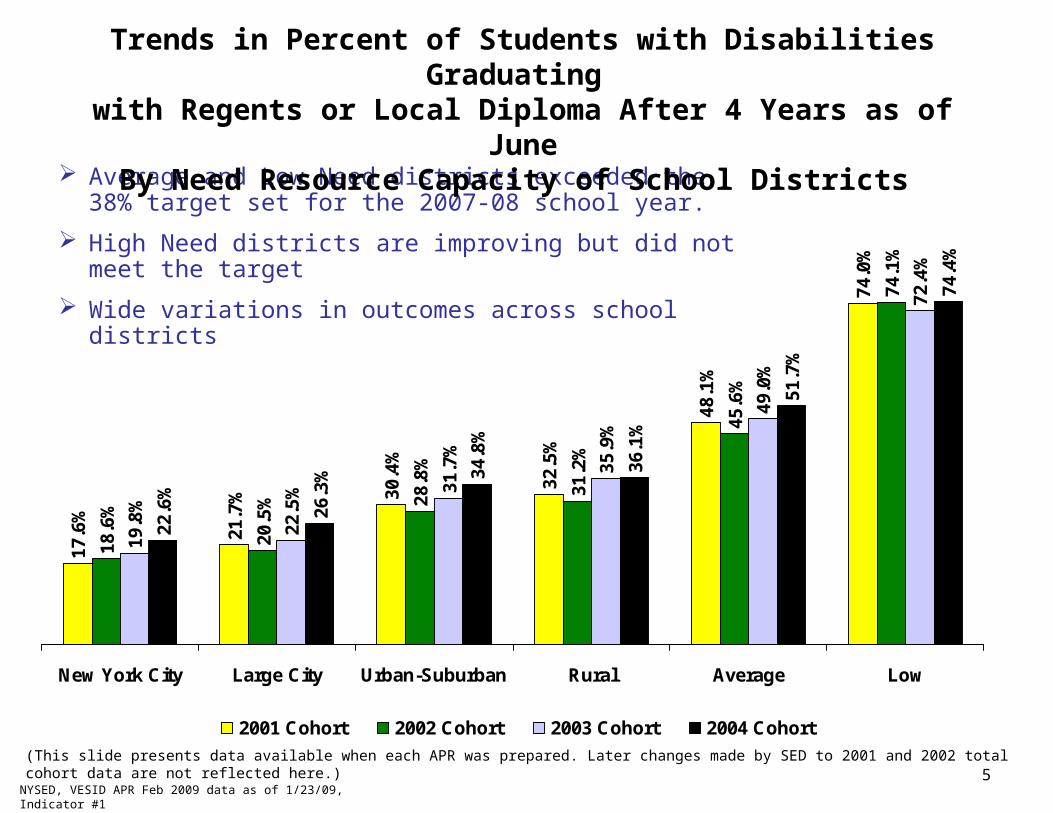
Average and Low Need districts exceeded the 38% target set for the 2007-08 school year.
High Need districts are improving but did not meet the target
Wide variations in outcomes across school districts
NYSED, VESID APR Feb 2009 data as of 1/23/09, Indicator #1
(This slide presents data available when each APR was prepared. Later changes made by SED to 2001 and 2002 total cohort data are not reflected here.)
Trends in Percent of Students with Disabilities Graduating with Regents or Local Diploma After 4 Years as of June
By Need Resource Capacity of School Districts

6
2004 Total Cohort Status after Four Years as of June (n=31,252 students with disabilities)
Regents Diploma
21%
Local Diploma21%
IEP Diploma12%
Dropped Out16%
HSEP/AHSEP2%
Still Enrolled after 4 Yrs.
28%
*AHSEP = Alternative High School Equivalency Preparation program

7
More students with disabilities graduate after 5 years.
49
.7%
46
.5%
41
.5%
38
.4%
43
.9%
44
.6%
48
.0%
43
.0%
39
.5%
Four Years Five Years Six Years
2001 Cohort(n=28,906)
2002 Cohort(n=26,678)
2003 Cohort(n=28,390)
2004 Cohort(n=31,352)
Percent of Students with Disabilities Graduating withRegents or Local Diploma After 4, 5 and 6 Years - Through June

8
41
.3%
16
.0%22
.6%
26
.3% 3
4.8
%
36
.1%
51
.7%
74
.4%
3.5
%
13
.4%
11
.7%
17
.4%
20
.3%
11
.3%
12
.1%
3.8
%
12
.1%2
1.6
%
31
.5%
16
.6%
19
.2%
New YorkCity
Large 4Cities
Urban/Suburban
Rural HighNeed
AverageNeed
Low Need Total Public
% High School Diploma % IEP Diplomas % Dropped Out
2004 Total Cohort
10,112 1,612 2,633 2,408 10,221 4,102
2004 Total Cohort after Four Years as of June:Graduation, IEP Diploma and Dropout Rates
NYSED, VESID APR February 2009, Indicators #1 & 2)
There are wide variations across school districts in the ways that students with disabilities leave school.
Different types of exit have post school consequences for young adults with disabilities.

9
25.5%22.2%
16.9% 16.0%
2001 Cohort 2002 Cohort 2003 Cohort 2004 Cohort
Percentage of Students with Disabilities Dropping Out after Four Years as of June
NYSED, VESID APR Feb 2009 data as of 1/23/09, Indicator #2
2007-08 Statewide results of 16% exceeded the target that no more than 19% would drop out.

10
42
.8%
25
.5%
25
.1%
18
.3%
7.5
%
30
.4% 3
9.7
%
26
.2%
26
.1%
16
.6%
5.6
%
22
.0%
38
.9%
20
.0%
19
.9%
12
.5%
4.0
%
37
.8%
19
.2%
16
.6%
31
.5%
21
.6%
12
.1%
3.8
%
NYC Large 4 Cities Urban/Suburban Rural High Need Average Need Low Need
2001 Cohort 2002 Cohort 2003 Cohort 2004 Cohort
All Need Resource Categories show significant improvement, but not all met the 2007-08 target to reduce to 19% or below, particularly in the Large 4 Cities.
Future targets will be more rigorous
• 2008-09 target is no more than 18%
• 2009-10 target will be no more than 16%
• 2010-11 target will be no more than 15%
NYSED, VESID APR Feb 2009 data as of 1/23/09, Indicator #2
Percentage of Students with Disabilities Dropping Out after Four Years as of June

Getting There from Here: Proficiency on State Assessments

12
Participation Rate of Students with Disabilities Subgroup on State Assessments
90.0%
91.0%
96.9%
90.0%89.0%
95.0%96.0%
92.7%
96.8%
94.0%
95.0%
94.1%
96.9%96.9%
85%
90%
95%
100%
Grades 3-8 ELA Grades 3-8 Math HS ELA HS Math
Per
cent
of
Stu
dent
s w
ith D
isab
ilitie
s pa
rtic
ipat
ing
in S
tate
ass
essm
ents
2004-05 2005-06 2006-07 2007-08
Target95%
NYS achieved the participation rate target for all grades and subjects except high school ELA in 2007-08.
NYSED, VESID APR Feb 2009 data as of 1/23/09, Indicator #3

13
Percent of School Districts Making Adequate Yearly ProgressFor Students with Disabilities in All Required Subjects and Grades
48.3%
57.2%
75.5%71.3%
0%
10%
20%
30%
40%
50%
60%
70%
80%
90%
100%
Baseline 2004-05(n=290 Districts)Grades 4 and 8
and High School
2005-06 (n=675districts) Grades
3-8 and HighSchool
2006-07 (n=648districts) Grades
3-8 and HighSchool
2007-08 (n=655districts) Grades
3-8 and HighSchool
Pe
rce
nt
of
Sch
oo
l Dis
tric
ts M
aki
ng
AY
P
NYS exceeded the SPP AYP target in 2007-08.
NYSED, VESID APR Feb 2009 data as of 1/23/09, Indicator #3
Target 58%

Getting There from HereGrades 3-8
English Language Arts (ELA)

15
Increasingly students with disabilities are demonstrating proficiency by scoring at Levels 3 & 4 on Grade 3-8 ELA assessments.
Percent of Students with Disabilitiesat Levels 3-4 in ELA
Number Tested 2006 2007 2008 2009
Grade 3 = 23,811 26,692 27,285 27,702
Grade 4 = 26,474 28,281 29,983 29,562
Grade 5 = 28,987 29,985 30,661 31,410
Grade 6 = 28,883 29,055 31,195 31,021
Grade 7 = 29,237 29,842 31,180 31,840
Grade 8 = 29,119 29,514 31,017 31,312
Grades 3-8 = 166,511 173,369 181,381 182,847

16
15
.2%
13
.3%
15
.2%
13
.3% 22
.3%
40
.2%
20
.2%
17
.5%
10
.6%
17
.1%
17
.0% 26
.0%
44
.5%
22
.8%
23
.3%
16
.1%
21
.4%
20
.9% 3
0.4
%
48
.9%
27
.9%35
.2%
25
.0%
31
.6%
30
.7% 4
2.4
%
60
.5%
39
.3%
New YorkCity
Large City Urban-Suburban
Rural Average Low Total Public
2006 2007 2008 2009
Proficiency is improving in every Need/Resource Capacity category of school districts on Grade 3-8 ELA assessments. But
Gaps among school districts in these categories persist.
Percent of Students with Disabilities at Levels 3-4 in Grades 3-8 ELA

17
Fewer students with disabilities are demonstrating serious academic difficulties by scoring at Level 1 on the ELA examinations.
Percent of Students with Disabilities at Level 1 in ELA

18
Percentage of Students with Disabilities Scoring at Level 1 in Grades 3-8 ELA
Fewer students with disabilities demonstrate serious academic difficulties in each of the Big Five Cities. But, more students in Big Five Cities score at Level 1 compared to rest of school districts.

19
Proficiency continues to improve for students with disabilities in all racial/ethnic groups across Grades 3-8 ELA.
Percent of Students with Disabilities at Levels 3-4 in ELA

20
There were slight improvements in every grade on the Grade 3-8 ELA, but the performance of students with disabilities who are also
English language learners (ELL) is very low
13.1
%
10.3
%
9.6%
4.1%
3.2%
1.1% 6.
5%
14.1
%
11.0
%
9.8%
5.0%
3.6%
2.5% 8.
4%
15.2
%
14.1
%
19.4
%
5.6% 7.6%
1.7%
11.7
%
23.7
%
21.3
% 27.3
%
21.1
%
15.0
%
5.4%
20.0
%
Grade 3 Grade 4 Grade 5 Grade 6 Grade 7 Grade 8 Grades 3-8
2005-06 ELL SWD 2006-07 ELL SWD 2007-08 ELL SWD 2008-09 ELL SWD
Percent of ELL Students with Disabilities at Levels 3 and 4 in ELA
Number Tested 2006 2007 2008 2009
Grade 3 = 1,512 3,816 3,474 3,642
Grade 4 = 1,858 3,783 3,606 3,712
Grade 5 = 2,477 3,451 3,295 3,619
Grade 6 = 2,246 2,935 2,841 3,160
Grade 7 = 2,195 2,534 2,351 2,740
Grade 8 = 2,194 2,433 1,933 2,410
Grades 3-8 = 12,482 18,952 17,500 19,283

21
Percentage of students with disabilities scoring at Level 3 and 4 in 2009 Grades 3-8 ELA
The gap between students with disabilities who were and were not English language learners (ELL) occurs even in Low Need districts.

22
76
.3%
65
.1%
78
.2%
84
.4%
90
.5%
84
.3%
35
.2%
25
.0% 31
.6%
30
.7%
42
.4%
60
.5%
39
.3%
96
.2%
New York City Large City Urban-Suburban
Rural Average Low Total Public
General Education Students Students with Disabilities
Percent of General Education and Students with Disabilities at Levels 3-4 in 2009 Grades 3-8 ELA
The gap between performance of students with disabilities and general education students at proficient levels in Grades 3-8 ELA is significant in all Need/Resource categories of school districts.

Getting There From Here:Grades 3-8 Math Proficiency

24
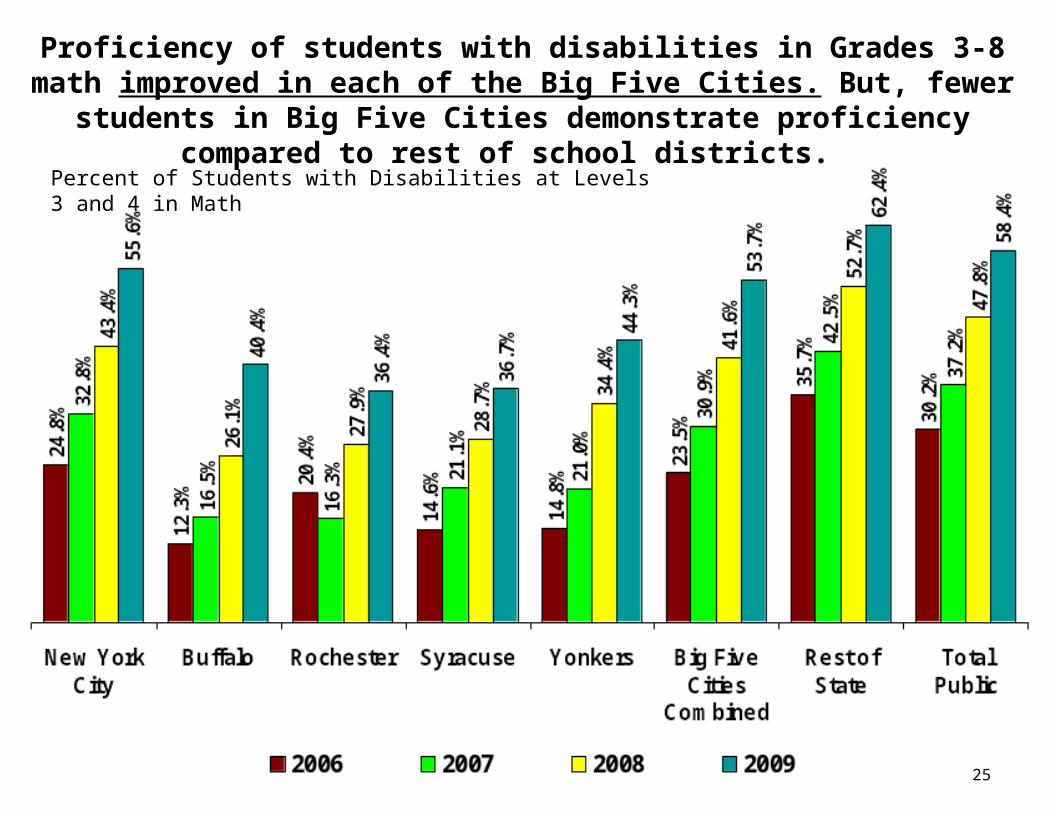
Increasingly, students with disabilities are showing proficiency by scoring at levels 3 & 4 on the Grade 3-8 Mathematics assessment.
Percent of students with disabilities scoring at levels 3 or 4
25
Percent of Students with Disabilities at Levels 3 and 4 in Math
Proficiency of students with disabilities in Grades 3-8 math improved in each of the Big Five Cities. But, fewer students in Big Five Cities
demonstrate proficiency compared to rest of school districts.

26
Students with Disabilities Scoring at Level 1on 2009 Grades 3-8 Mathematics
5.2
%
16
.7%
9.8
% 16
.3%
6.7
%
16
.2%
11
.9%
36
.8%4
4.4
%
42
.1%
44
.4%
35
.9%
28
.8%
23
.7%
28
.2%
40
.2%
28
.6%
33
.5%
23
.7%
24
.8%
17
.5%
19
.9%
29
.5%
17
.5%2
3.9
%
16
.3%
20
.4%
11
.0%
Grade 3 Grade 4 Grade 5 Grade 6 Grade 7 Grade 8 Grades 3-8
2006 2007 2008 2009
There is a substantial decease in the percentage of students with disabilities scoring at Level 1 in all grades in Mathematics in each of the past three years.

High School English and Math Proficiencies

28
13,057
2,4994,154
4,969
2,832
6,7905,675
8,3057,226
8,4249,767
10,506
17,299
3,414
9,514
7,545
4,175
10,4618,606
11,1949,680
12,14413,079
14,325
25,046
4,419
5,647
12,60713,518
15,366
17,321
14,101
16,309
18,94920,081
22,735
1997 1998 1999 2000 2001 2002 2003 2004 2005 2006 2007 2008
Number with Score of 65-100
Number with Score of 55-100
Total Number Tested
More students passed in 2008 with a 65 than attempted this exam in 1997. The number of students with disabilities tested has grown more than 5 times. Of the students tested in 2008, more than 2/3 passed with a score of 55-100.
2008 Regents English Examination & Students with DisabilitiesData represents Public Schools, Including Charter Schools

29
5,732
13,61612,733
5,736
12,28410,894
3,162
10,068
6,039
4,8714,028
2,675
19,29017,88017,127
15,000
8,267 7,709
13,663
4,867
8,151
6,773
4,990
3,421
18,468
28,36727,091
24,48322,129
16,826
19,015
13,016
17,074
13,304
5,776
8,327
1997 1998 1999 2000 2001 2002 2003 2004 2005 2006 2007 2008
Number with Score of 65-100
Number with Score of 55-100
Number Tested
*Note: Beginning 1999, students took either the Math A or Sequential Mathematics Course I. The Course 1 examination ended in 2002.
Students with Disabilities taking Regents Examinations in Sequential Mathematics Course I or Math A
Since 1997, the number of students with disabilities tested has grown nearly 5 times.
In 2008, more than twice as many passed at 65 than attempted these examinations in 1997.
School Report Card, 2007-08
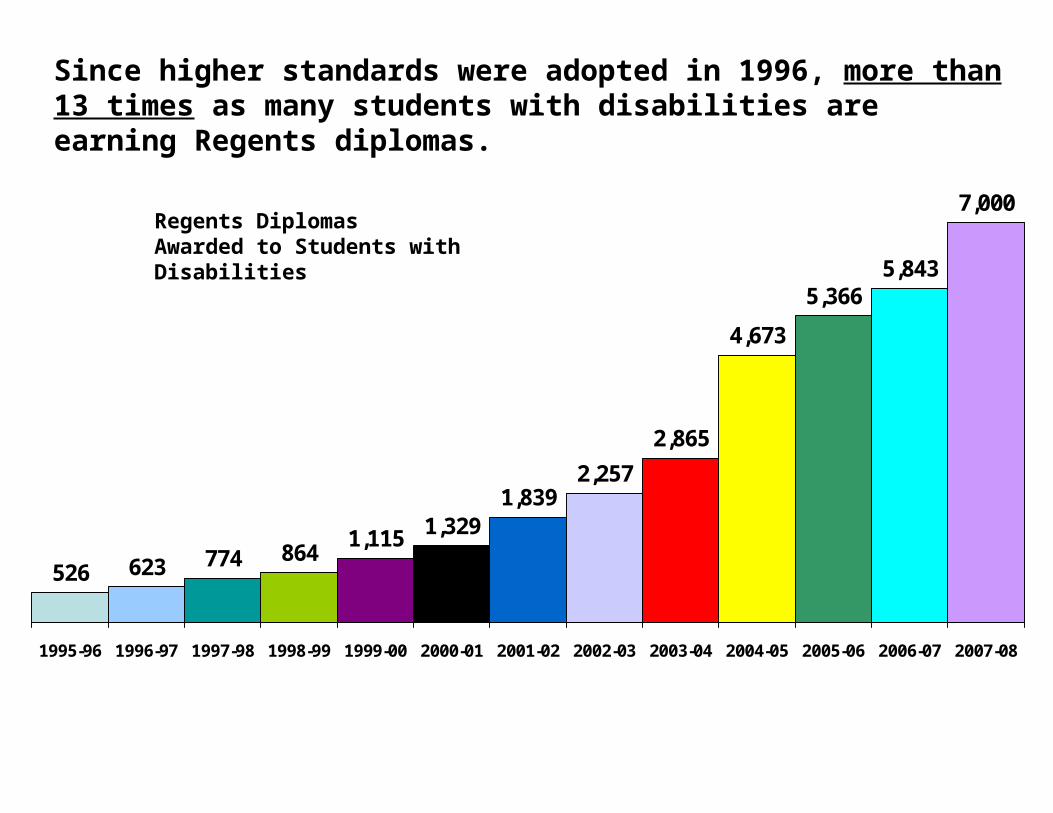
Regents Diplomas Awarded to Students with Disabilities
774 8641,115 1,329
1,8392,257
2,865
4,673
5,3665,843
7,000
623526
1995-96 1996-97 1997-98 1998-99 1999-00 2000-01 2001-02 2002-03 2003-04 2004-05 2005-06 2006-07 2007-08
Since higher standards were adopted in 1996, more than 13 times as many students with disabilities are earning Regents diplomas.

31
6,9
41
17
,82
8
8,2
16
7,6
64
16
,94
5
11
,45
0
8,8
01
17
,19
9
11
,83
4
9,1
53
16
,42
9
11
,99
2
9,9
66
15
,98
7
11
,90
4
8,9
57
17
,79
8
13
,05
1
5,3
80
6,7
62
9,6
26
Reading Writing Mathematics
2002 2003 2004 2005 2006 2007 2008
Large numbers of students with disabilities are tested on most RCT examinations.
From 2002 to 2008 the number of students tested in RCT for Reading increased by 76%; Writing by 66%; and Mathematics by 36%.
Regents Competency Tests (RCTs) & Students with Disabilities
Public Schools, Including Charter Schools
32
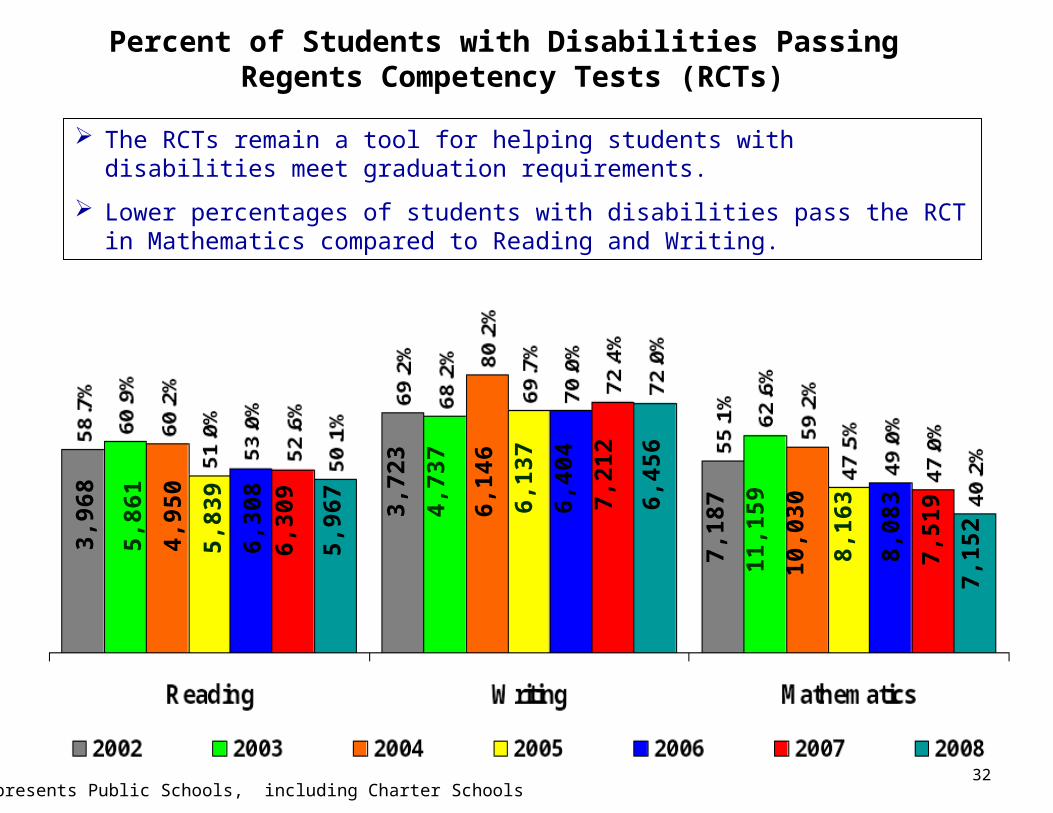
Percent of Students with Disabilities Passing Regents Competency Tests (RCTs)
Data represents Public Schools, including Charter Schools
3,96
8
7,18
73,72
3
11,1
59
5,86
1 4,73
7
10,0
30
4,95
0 6,14
6
8,16
3
5,83
9 6,13
7
6,30
8 6,40
4
8,08
3
6,30
9 7,21
2
7,51
9
The RCTs remain a tool for helping students with disabilities meet graduation requirements.
Lower percentages of students with disabilities pass the RCT in Mathematics compared to Reading and Writing.
5,96
7 6,45
6
7,15
2

33
Suspensions of Students with Disabilities

34
The number of school districts that suspend at least 2.7% of students with disabilities for more than 10 days is increasing.
50
60 64
2005-06 Baseline 2006-07 2007-08
Number of School Districts with High Suspension Rates
111 additional districts in 2007-08 were so close to the cut point that they have been informed that they are at risk of future identification.
35
1.0
8%
6.5
7%
6.4
4%
1.8
3%
1.4
8%
0.9
9%
0.3
0% 1
.34
%
6.6
3%
9.7
3%
6.2
9%
1.9
7%
1.0
8%
0.3
3% 1.3
0%
0.3
2% 1
.37
%
1.0
5%
2.9
3%
5.0
6%
5.5
8%
2.3
8%
1.4
7%
1.0
6%
0.3
0% 1.2
6%
6.1
4%
0.8
0%
1.4
3%
1.4
0%
1.1
5%2
.24
%
6.3
6%
5.8
4%
4.9
6%
1.1
4%
New YorkCity &
Yonkers
Buffalo Rochester Syracuse Urban-SuburbanHigh Need
Rural HighNeed
AverageNeed
Low Need Total Public
2004-05 2005-06 2006-07 2007-08
APR February 2009, Indicator #4A
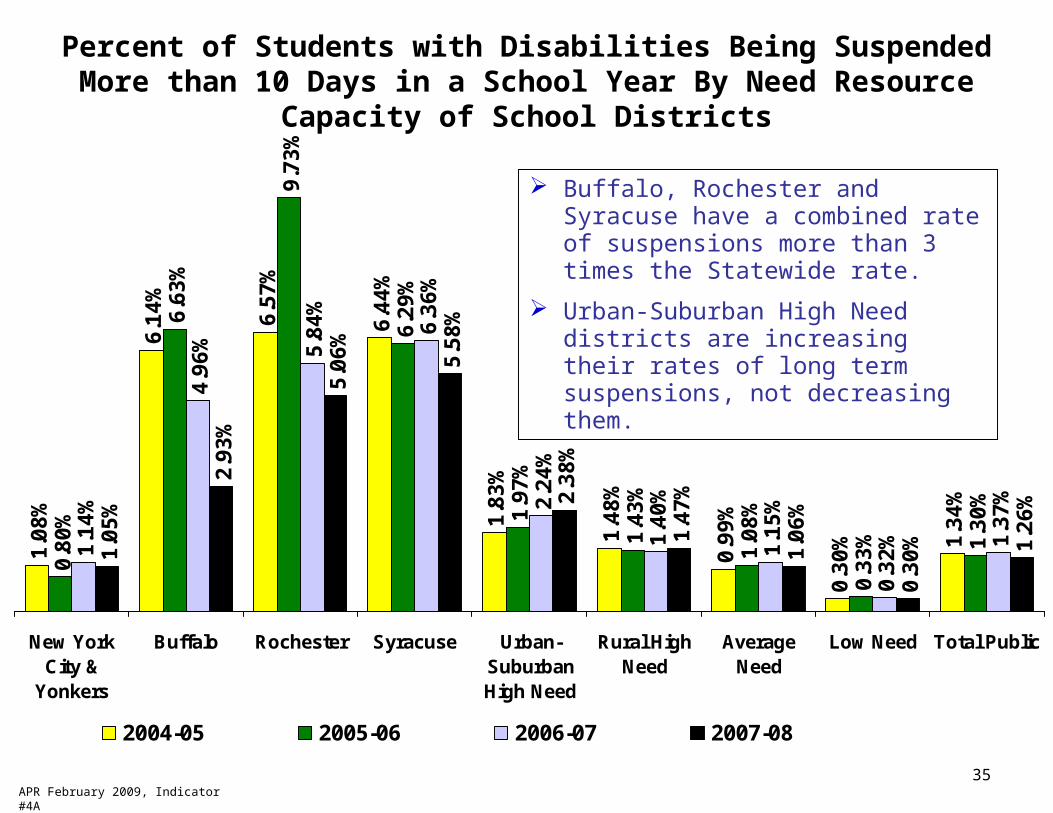
Percent of Students with Disabilities Being Suspended More than 10 Days in a School Year By Need Resource Capacity of School Districts
Buffalo, Rochester and Syracuse have a combined rate of suspensions more than 3 times the Statewide rate.
Urban-Suburban High Need districts are increasing their rates of long term suspensions, not decreasing them.

Least Restrictive Environment

375/98
1996-97 Public and Private Special Education Placements at Separate Sites for Each BOCES Region and New York City
2 Regions - Less than 2% at Separate Public Sites
9 Regions - 2-4.3% at Separate Public Sites
12 Regions - 4.4-7% at Separate Public Sites
16 Regions - Over 7% at Separate Public Sites
National Average : 4.3 percent
Separate Settings are defined as schools attended exclusively by students with disabilities; these settings include Chapter 853, Special Act, State Operated and State Supported schools, separate BOCES sites and New York City separate public schools.
38
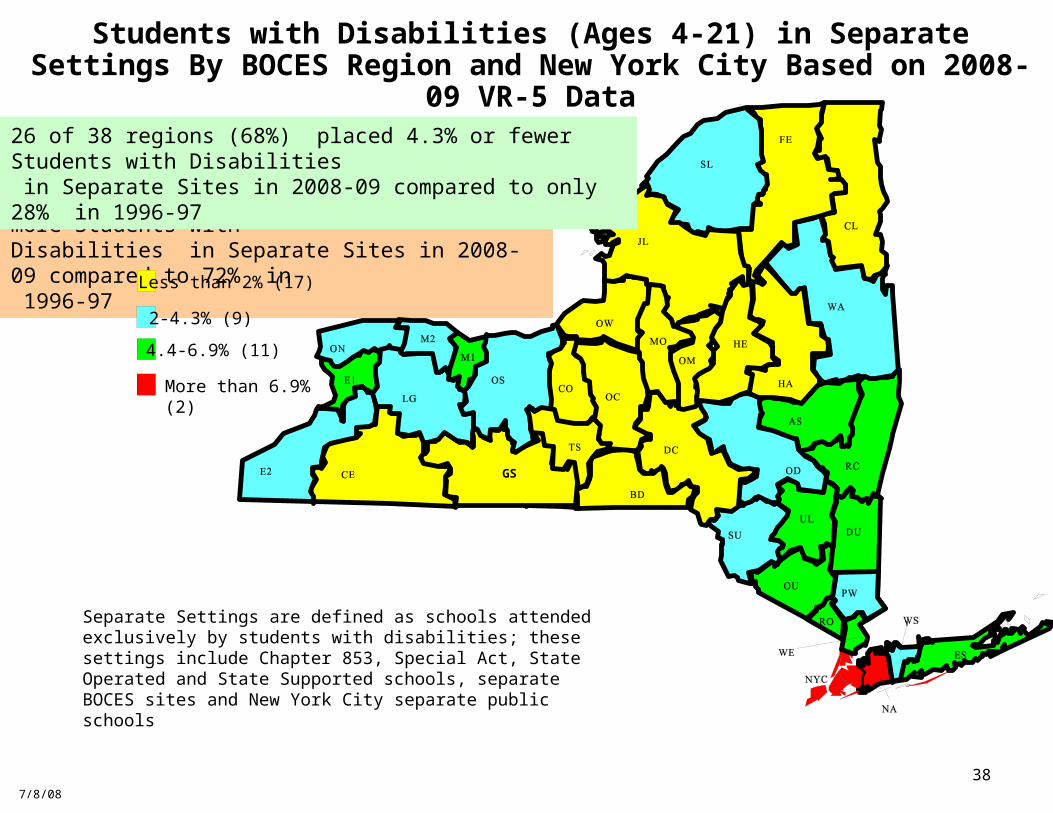
Only 2 of 38 regions (5%) placed 7% or more Students with Disabilities in Separate Sites in 2008-09 compared to 72% in 1996-97
7/8/08
Separate Settings are defined as schools attended exclusively by students with disabilities; these settings include Chapter 853, Special Act, State Operated and State Supported schools, separate BOCES sites and New York City separate public schools
Students with Disabilities (Ages 4-21) in Separate Settings By BOCES Region and New York City Based on 2008-09 VR-5 Data
Less than 2% (17)
2-4.3% (9)
4.4-6.9% (11)
More than 6.9% (2)
26 of 38 regions (68%) placed 4.3% or fewer Students with Disabilities in Separate Sites in 2008-09 compared to only 28% in 1996-97
GS

39
Placement of School-Age Students with Disabilitiesin the Least Restrictive Environment
NYSED, VESID APR Feb 2009 data as of 1/23/09, Indicator #5
All targets were met but compare NYS on the 2nd & 3rd categories with national data.

Preschool Outcomes

41
Outcomes
substantially increased their rate of
growth
were functioning within age expectations
Positive Social Emotional Skills 85.6% 55.2%
Acquisition & Use of Knowledge and Skills (e.g., communication and early literacy)
86.6% 54.3%
Use of Appropriate Behaviors to Meet Needs 86.5% 62.2%
Preschool Special Education Program Outcome Measurespercent of children entering below age expectations who, by the time of exit in 2007-08…
NYSED, VESID APR Feb 2009 data as of 1/23/09, Indicator #7

Disproportionality by Race / Ethnicity

43
The special education classification rate is increasing
Classification Rates for School-Age Students with Disabilities in New York State as of 9/09
11.1%11.6% 11.7% 11.8% 11.8% 11.9% 11.8% 12.0% 12.2% 12.1% 12.3% 12.6% 12.9% 13.0%
0%
2%
4%
6%
8%
10%
12%
14%
1995
-96
1996
-97
1997
-98
1998
-99
1999
-00
2000
-01
2001
-02
2002
-03*
2003
-04
2004
-05
2005
-06
2006
-07
2007
-08*
*
2008
-09
Cla
ssif
icat
ion
Rat
e
*Methodology revised in 2002-03 **2007-08 was the first year classification rates were based on counts of students with disabilities collected through the Student Information Repository System (SIRS)

44
Classification rates vary by Need/Resource categories
Classification Rates for School-Age Students with Disabilities in New York State as of 9/09
10.7% 11.0% 10.9% 11.1% 11.0% 11.0% 11.1% 11.5% 11.5%12.3%
12.3% 12.4% 12.5% 12.6% 12.7% 12.7% 12.7% 12.7% 12.5%
14.2% 14.6% 14.8% 15.0% 15.0% 15.3%15.9% 16.2% 16.4%
18.2%
16.8% 16.6%
12.5%12.7%
12.2%12.3%
12.1%
0%
2%
4%
6%
8%
10%
12%
14%
16%
18%
20%1
99
7-9
8
19
98
-99
19
99
-00
20
00
-01
20
01
-02
20
02
-03
*
20
03
-04
20
04
-05
20
05
-06
20
06
-07
20
07
-08
**
20
08
-09
Cla
ssif
icat
ion
Rat
e
New York City Rest of State Large Four Cities
*Methodology revised in 2002-03 **2007-08 was the first year classification rates were based on counts of students with disabilities collected through the Student Information Repository System (SIRS)

45
The special education classification rate is climbing for racial/ethnic groups, and highest for Black and American Indian students.

46
Disproportionate Representation by Race/ Ethnicity, 2008-09Scope of Disproportionality Within Districts
0
35
4
131310
44 48
1
16
in High SuspensionRate (n=20)
in Identification forSpecial Education
(n=52)
in Classifications byDisability (n=22)
By Placement Settings(n=18)
At Risk Disproportionality on One Indicator Disproportionality on Multiple Indicators
Numbers of School Districts Identified by their Data as Having Disproportionate Representation by Race/Ethnicity or being At Risk on Key Indicators
47
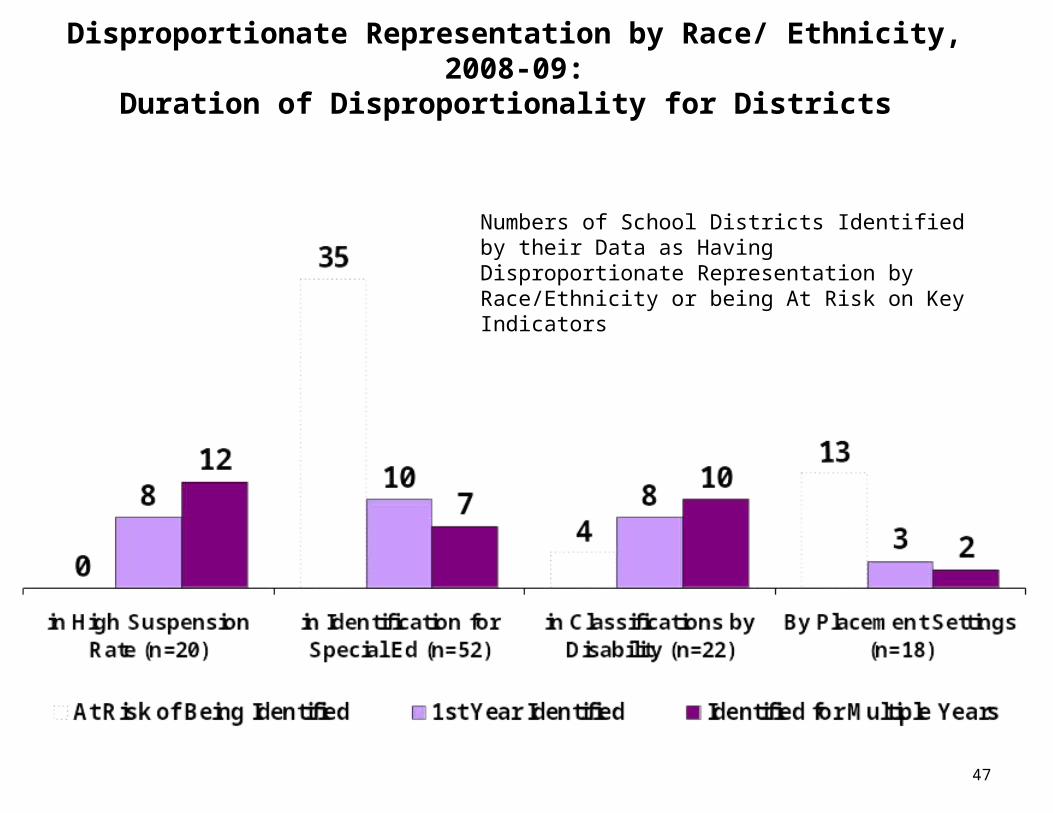
Disproportionate Representation by Race/ Ethnicity, 2008-09:Duration of Disproportionality for Districts
Numbers of School Districts Identified by their Data as Having Disproportionate Representation by Race/Ethnicity or being At Risk on Key Indicators

48
2007-08 Statewide Data
– Identification – 17 districts + 5 at risk• 13 Black students, 3 Hispanic, 1 American Indian
– Classification – 18 districts• 14 for Black students – 8 – ED, 2 MR, 2 OHI, 2 LD• 3 for Hispanic students – 2 SLI, 1 MR• 1 for American Indian - LD
– Placement – 5 districts + 4 at risk• 4 for placement of Black students in separate settings• 1 for placement of Black students for less than 40% in regular classes
– Suspension – 21 districts + 10 at risk• 20 for suspension of Black students• 1 for American Indian students

Initial Evaluations – Preschool and
School Age
Early Intervention to
PreschoolServices by the
3rd birthday
50
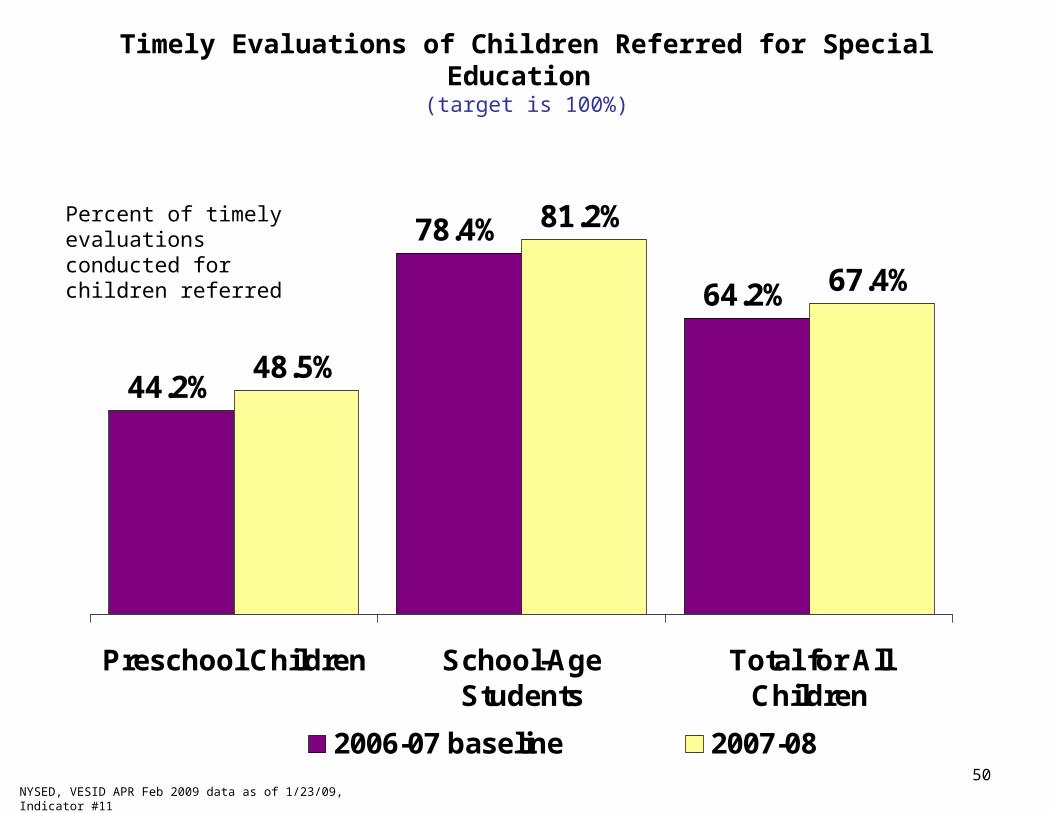
Timely Evaluations of Children Referred for Special Education (target is 100%)
44.2%
78.4%
64.2%
48.5%
81.2%
67.4%
Preschool Children School-AgeStudents
Total for AllChildren
2006-07 baseline 2007-08
NYSED, VESID APR Feb 2009 data as of 1/23/09, Indicator #11
Percent of timely evaluations conducted for children referred

51
Early Childhood Transitions into Preschool Special Education (target is 100%)
86.5%
73.8%78.2%
2005-06 2006-07 2007-08
NYSED, VESID APR Feb 2009 data as of 1/23/09, Indicator #12
Percent of Children Found Eligible Whose IEP is Implemented by Their 3rd Birthday

School to Post SchoolTransition Planning

53
Secondary Transition – Percent of Youth with IEPs Determined Reasonable to Meet Post Secondary Goals
(target is 100%)
NYSED, VESID APR Feb 2009 data as of 1/23/09, Indicator #13
Percent of Youth Whose IEPs are in Compliance with all 8 Regulatory Requirements

54
Trends in Compliance on Specific Requirements Related to Appropriate Content in IEPs of Youth in Transition
(Compliance is expected to be 100% for every student with a disability)
57%
24%
23%
54%
42%
70%
32% 37
%
61%
43% 49
%
66%
57%
80%
53% 57
%
75%
64%
62%
73%
74%
89%
65%
74%
StudentParticipation
PLP IdentifiesTransition
Needs
MeasurablePost-Secondary
Goals
Annual GoalsAddress
TransitionNeeds
Courses ofStudy
SpecialEducationServices to
Achieve AnnualGoals
Coordinated Setof NeededTransitionActivities
Responsibilitiesfor Transition
Activities
2005-06 2006-07 2007-08
Source 2009 APR Data, Indicator #13; TCS Meeting, 2/24/09, DVJ

55
Post-High School Outcomes for Young Adults with Disabilities

56
2007-08 Post-School Outcomes of Students with Disabilities at Any Point within 1 Year of Leaving High School in 2006-07
(outcomes exclude Military Service)
49%
29%20%25%
50% 61%29%
24%
16%15%
26%8%
91.2%95.4%
83.9%80.5%
0%
10%
20%
30%
40%
50%
60%
70%
80%
90%
100%
StatewideAll ExitTypes
(n=2,453)
RegularHS
Diploma(n=1,672)
IEPDiploma(n=428)
DroppedOut
(n=307)
Post Secondary School Only
Both Post Secondary School& Competitively Employed
Competitively Employed Only
perc
ent
of s
tude
nts
with
dis
abili
ties
repo
rtin
g
outc
omes
at
any
poin
t du
ring
the
year
sin
ce H
S e
xit
Note: Exit subcategory of “Other” is too small to chart
NYSED, VESID APR Feb 2009 data as of 1/23/09, Indicator #14

57
Post-School Transition Status of Students with Disabilities 9-14 Months After Leaving High School in June 2007
Connected to Post- School Outcomes Stayed Connected
APR February 2009, Indicator #14 Interview Data

58
28,174 30,593
34,041 36,06037,793 38,027
40,587 40,24541,088
0
5,000
10,000
15,000
20,000
25,000
30,000
35,000
40,000
45,000
1997 1999 2000 2001 2002 2003 2004 2005 2006
The number of self-identified individuals with disabilities in New York State’s higher education programs is increasing.
2.8% 3.0%3.3%
Number of and Percent of Individuals with Disabilities among theTotal Enrollment in NYS Institutions of Higher Education*
*Data for 1998 are not availableSource: OHE
3.4% 3.4%3.5%
3.4%
3.6%3.6%

59
Class of 2001 at 5 Years Post-High School: Post-Secondary Status for
Regents & Local Diploma Recipients
Special Education (n=852)
38%
18%
33%
11%
Currently in Postsecondary Education
Finished, Not Currently Attending
Started, Did Not Finish, Not Currently Attending
Never Attended
General Education Peers (n=886)
57%
21%
14%
12%
Currently in Postsecondary Education
Finished, Not Currently Attending
Started, Did Not Finish, Not Currently Attending
Never Attended
NYSED VESID BOR, 11/17/08, DVJLPSI, Class of 2001, 5 years out 2008, DVJ

60
Class of 2001 at 5 Years Post-High School: Employment Status by Diploma
21%
67%
10%
2%
23%
67%
8%
1%
20%
69%
8%
2%
22%
63%
11%
3%
42%
51%
3%
0%
0%
10%
20%
30%
40%
50%
60%
70%
80%
90%
100%
Not Working Now Working 1 Job Working 2 Jobs Working >2 Jobs
Per
cent
of
Stu
dent
s R
espo
ndin
g
General Education Students with Regents Diplomas (n=607)Special Education Students with Regents Diplomas (n=233)General Education Students with Local Diplomas (n=279)Special Education Students with Local Diplomas (n=619)Special Education Students with IEP Diplomas (n=351)
IEP diploma recipients are not engaged in the competitive labor market to the same degree as their peers.
NYSED VESID BOR, 11/17/08, DVJLPSI, Class of 2001, 5 years out 2008, DVJ

61
Class of 2001 at 5 Years Beyond HS:Level of Employment in the Labor Market
24%
19%30%
27%
28%
21%
18%
30%
0% 5% 10% 15% 20% 25% 30% 35%
Entry or Unskilled
Semi-Skilled
Skilled or Technical
Professional
General Education Students Currently Working for Pay (n=714)
Special Education Students Currently Working for Pay (n=906)
NYSED VESID BOR, 11/17/08, DVJLPSI, Class of 2001, 5 years out 2008, DVJ

62
Implications of the Data
• Early supports and services
• Appropriate referrals
• Engaging instructional programs
• Behavioral supports
• IEP development
• Transition planning and services
• Post secondary supports
• Parental Involvement
• Keeping students in school beyond 4 years
• Drop out prevention

63
Federal and State Policy Issues
64
NCLB Reauthorization
• Alignment of accountability requirements
• Response to Intervention
• Positive Behavioral Supports and Interventions
• Modified assessment
• 5 year graduation rate

65
State Policy Issues
• Safety Net
• IEP Diploma
• Targets for graduation
• Students with Disabilities Teacher Certification

66
Leading the way….The future is what you
cause it to be.