Embed Size (px)
Citation preview
*Correspondence: He XUE; Prof.at School of Mechanical Engineering ,Xi’an University of Science and
Technology,Xi’an’[email protected]
Prediction of the direction of XFEM crack based on Von Mises
around the crack-tip under mode-I.
Rehmat Bashir1,2, He XUE*1, Muhammad Usman2, Muneeb Irshad2, Nasir Hayat2
1 School of Mechanical Engineering, Xi'an University of Science and Technology, Xi'an 710054, China.
2 Department of Mechanical Engineering, University of Engineering and Technology, Lahore-54890, Pakistan.
Abstract: The extended finite element method (XFEM) is now widely used in crack
simulations and the direction of propagation of the XFEM crack in SS-304 has been quite
interesting. This paper discusses the direction, 𝛉(+𝐯𝐞 𝐢𝐧 𝐚𝐧𝐭𝐢 − 𝐜𝐥𝐨𝐜𝐤𝐰𝐢𝐬𝐞 𝐝𝐢𝐫𝐞𝐜𝐭𝐢𝐨𝐧), of the XFEM crack (under mode-I) propagation based on the von Mises stress-field around
the crack-tip for static loading under the light water reactors (LWRs) conditions. The Mises
core region from the crack-tip is chosen for 𝜷 = 𝟗𝟎𝒐, the angle between the load and the
initial crack. Experimental data for LWRs’environment is obtained and the simulations
have been carried out applying three different static loads and results for the direction of
the crack are calculated by measuring the stress-field around the crack-tip. It has been found
that the direction of the XFEM varies inversely as the stress-field around the crack tip is
increased. The computational results have been compared with the numerical results based
on the minimum strain energy density criterion[S-criterion].
Keywords: extended finite element method (XFEM); Von Mises; the direction of
crack(θ); strain energy density criterion[S-criterion]; Mode-I
__________________________________________________________________________________________
1. Introduction
Moës et al. [1, 2] proposed the extended finite element method (XFEM) method for crack
growth simulations without re-meshing, and Farukh et al. [3] proved the capability of the
XFEM predicting crack growth rate. The XFEM formulation is a powerful tool in numerical
modeling and is now widely used for studying crack propagation under different loading and
environmental conditions [4, 5]. With this method, mesh refinement is not required and results
are closer to the actual values [6]. Unlike other cracks [7, 8], the XFEM cannot propagate at a
constant rate i.e. the value of stress intensity factor (SIF) is changing at every instant of time
rendering the XFEM crack direction an important field of research. Merely the presence of
crack is not enough for the fracture analysis of the mechanical structures [9], the crack
propagation and the path which would be adopted by the crack under the applied load is the
key to reach the final destination of the damage. The damage consists of crack initiation, crack
propagation, and failure [10]. The problem of the XFEM crack direction assuming the arbitrary
stresses around the crack-tip was an interesting topic for the last few years. The direction of
propagation of crack is quite necessary to be studied and known to locate the point of failure
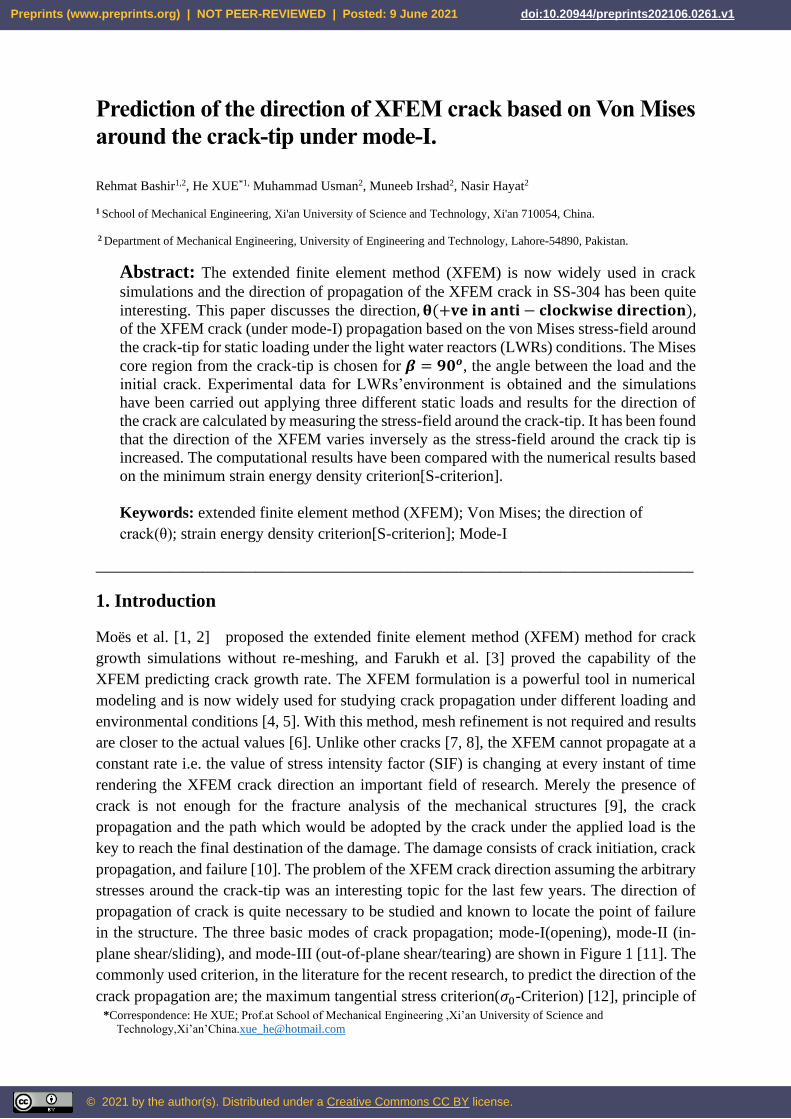
in the structure. The three basic modes of crack propagation; mode-I(opening), mode-II (in-
plane shear/sliding), and mode-III (out-of-plane shear/tearing) are shown in Figure 1 [11]. The
commonly used criterion, in the literature for the recent research, to predict the direction of the
crack propagation are; the maximum tangential stress criterion(𝜎0-Criterion) [12], principle of
Preprints (www.preprints.org) | NOT PEER-REVIEWED | Posted: 9 June 2021 doi:10.20944/preprints202106.0261.v1
© 2021 by the author(s). Distributed under a Creative Commons CC BY license.
local symmetry [13], the maximum energy release criterion(G-criterion) [14-16], and the
maximum strain energy density criterion(S-criterion) [17, 18]. The typical aforementioned
criteria rely on the Stress intensity factors (SIFs) which are determined using the auxiliary
crack-tip fields [19].
Figure 1. Modes of crack propagation.
Different authors have conducted researches based on simulation to predict the crack direction
in single and mixed-mode [20-22], but a simple method has not yet been proposed to predict
the direction of the crack. Apart from mixed mode, the direction of the crack in single-mode
also varies concerning some arbitrary axis, see Figure 1(a) from the d-e region. In this paper,
the prediction of the direction (angle, θ) of the XFEM under mode-I is discussed and the results
are compared with the maximum strain energy density criterion(S-criterion). It is assumed that
the specimen is the finite part of the Nuclear power Plants piping. Therefore, the mechanical
properties of the specimen have been considered at the elevated temperature of 340 oC. A new
and convenient technique, which is not available yet in the literature, about the prediction of
the direction of the crack under mode-I has been introduced, which can be easily visualized by
using Von Mises stress values around the crack-tip. The crack moves in the core region, not in
straight line, but in zig-zag manners under mode-I. If the values of Von Mises stress around
the crack-tip at different points are known, the tendency of the crack to deflect towards a point
relative to other points can easily be predicted.
2. Materials and Methods
Austenitic Stainless steel is an important material used extensively in an aggressive
environment like LWRs [23]. Low carbon stainless steel-304 is used in this research, which is
an important type of stainless steel that has been used in many applications [24, 25]. Chemical
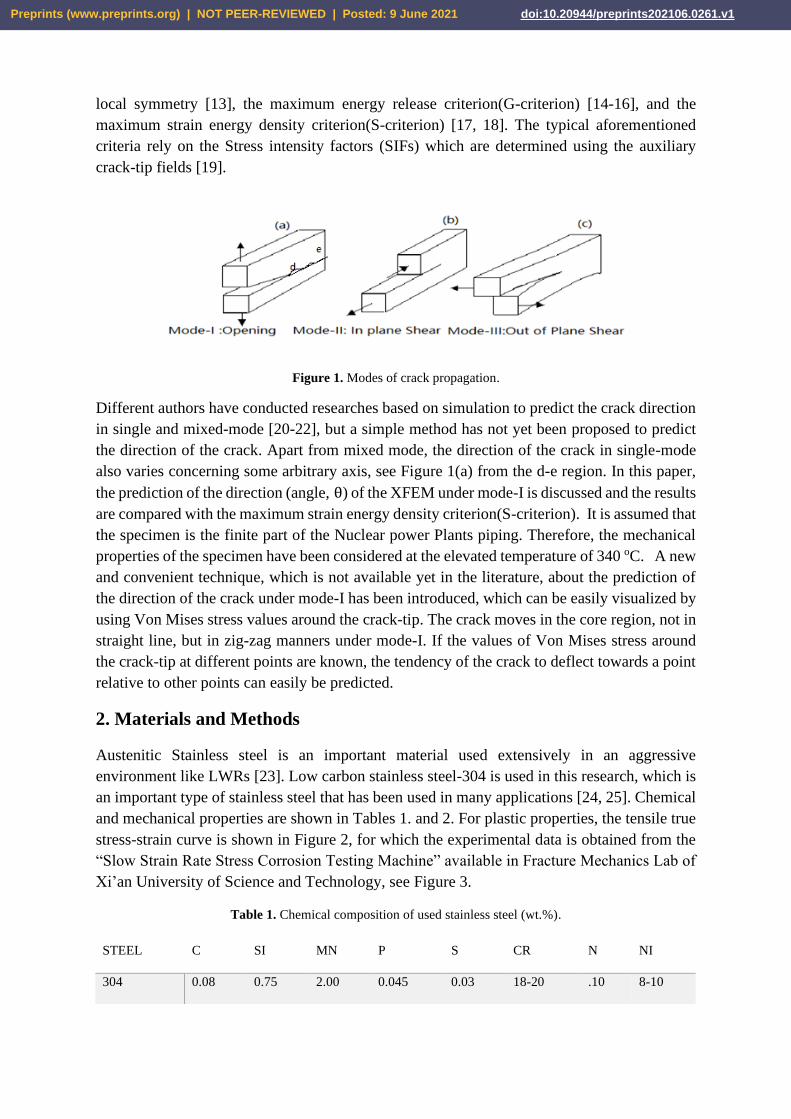
and mechanical properties are shown in Tables 1. and 2. For plastic properties, the tensile true
stress-strain curve is shown in Figure 2, for which the experimental data is obtained from the
“Slow Strain Rate Stress Corrosion Testing Machine” available in Fracture Mechanics Lab of
Xi’an University of Science and Technology, see Figure 3.
Table 1. Chemical composition of used stainless steel (wt.%).
STEEL C SI MN P S CR N NI
304 0.08 0.75 2.00 0.045 0.03 18-20 .10 8-10
Preprints (www.preprints.org) | NOT PEER-REVIEWED | Posted: 9 June 2021 doi:10.20944/preprints202106.0261.v1
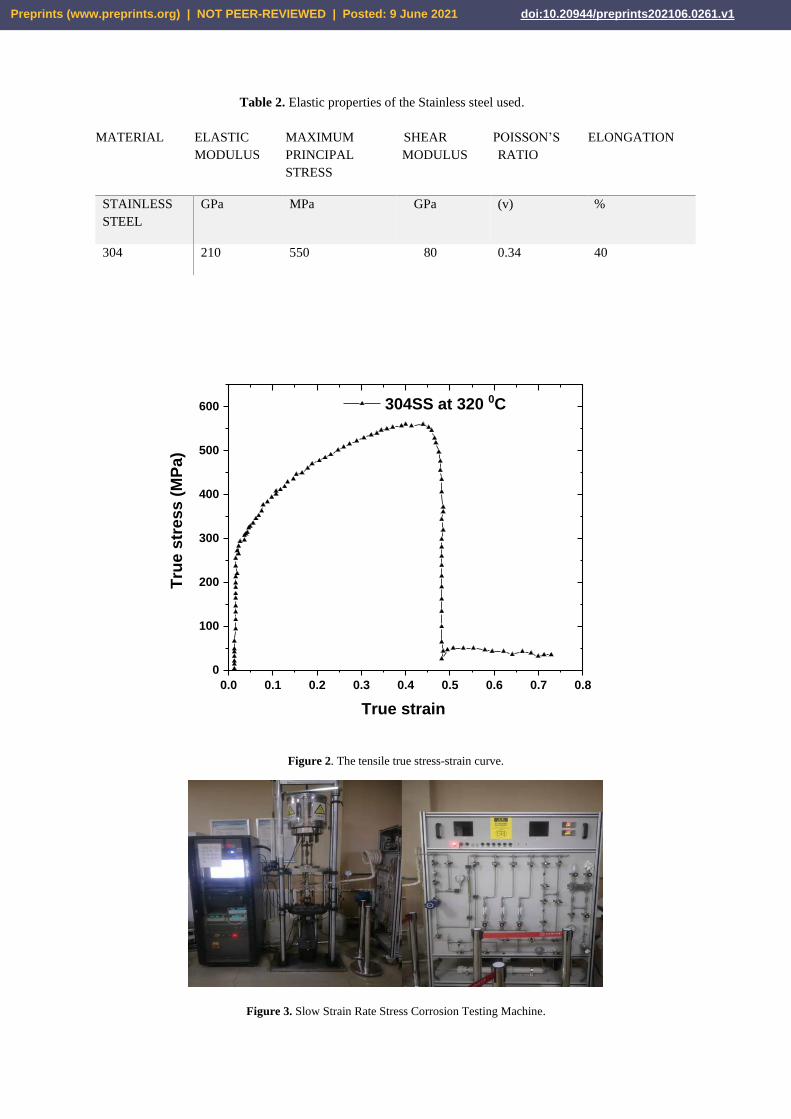
Table 2. Elastic properties of the Stainless steel used.
0.0 0.1 0.2 0.3 0.4 0.5 0.6 0.7 0.8
0
100
200
300
400
500
600
Tru
e s
tress
(M
Pa)
True strain
304SS at 320 0C
Figure 2. The tensile true stress-strain curve.
Figure 3. Slow Strain Rate Stress Corrosion Testing Machine.
MATERIAL ELASTIC
MODULUS
MAXIMUM
PRINCIPAL
STRESS
SHEAR
MODULUS
POISSON’S
RATIO
ELONGATION
STAINLESS
STEEL
GPa MPa GPa (v) %
304 210 550 80 0.34 40
Preprints (www.preprints.org) | NOT PEER-REVIEWED | Posted: 9 June 2021 doi:10.20944/preprints202106.0261.v1
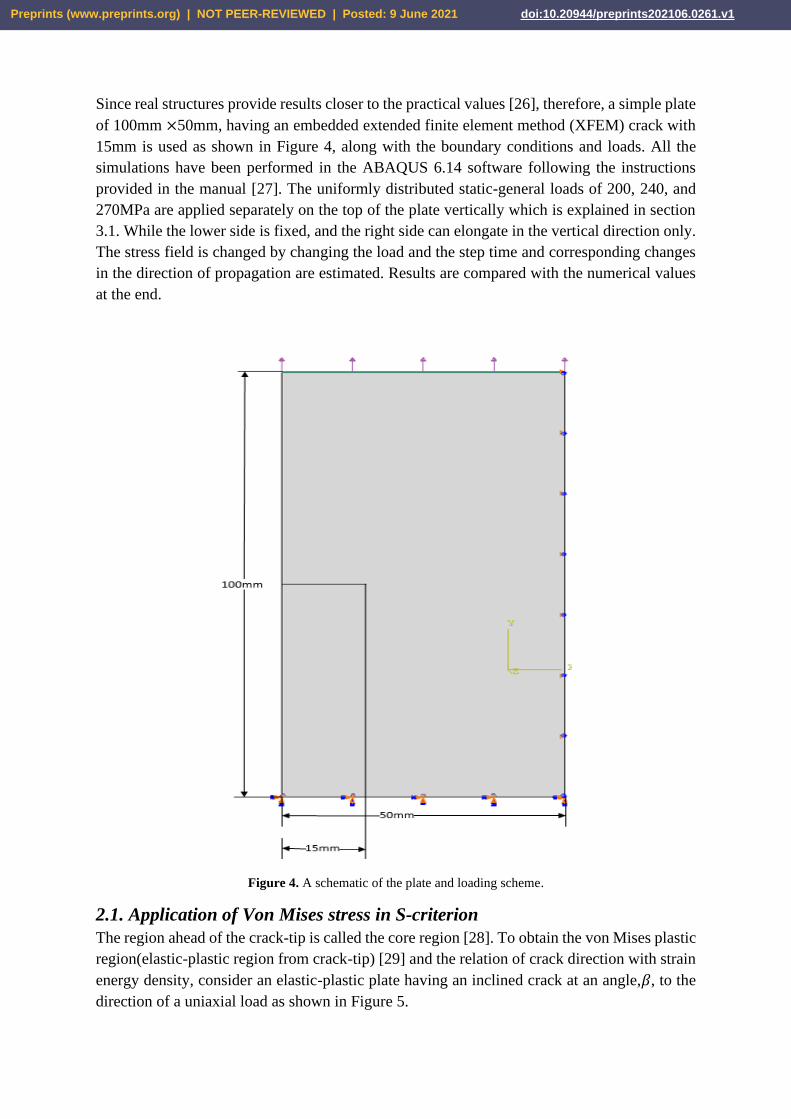
Since real structures provide results closer to the practical values [26], therefore, a simple plate
of 100mm ×50mm, having an embedded extended finite element method (XFEM) crack with
15mm is used as shown in Figure 4, along with the boundary conditions and loads. All the
simulations have been performed in the ABAQUS 6.14 software following the instructions
provided in the manual [27]. The uniformly distributed static-general loads of 200, 240, and
270MPa are applied separately on the top of the plate vertically which is explained in section
3.1. While the lower side is fixed, and the right side can elongate in the vertical direction only.
The stress field is changed by changing the load and the step time and corresponding changes
in the direction of propagation are estimated. Results are compared with the numerical values
at the end.
Figure 4. A schematic of the plate and loading scheme.
2.1. Application of Von Mises stress in S-criterion
The region ahead of the crack-tip is called the core region [28]. To obtain the von Mises plastic
region(elastic-plastic region from crack-tip) [29] and the relation of crack direction with strain
energy density, consider an elastic-plastic plate having an inclined crack at an angle,𝛽, to the
direction of a uniaxial load as shown in Figure 5.
Preprints (www.preprints.org) | NOT PEER-REVIEWED | Posted: 9 June 2021 doi:10.20944/preprints202106.0261.v1
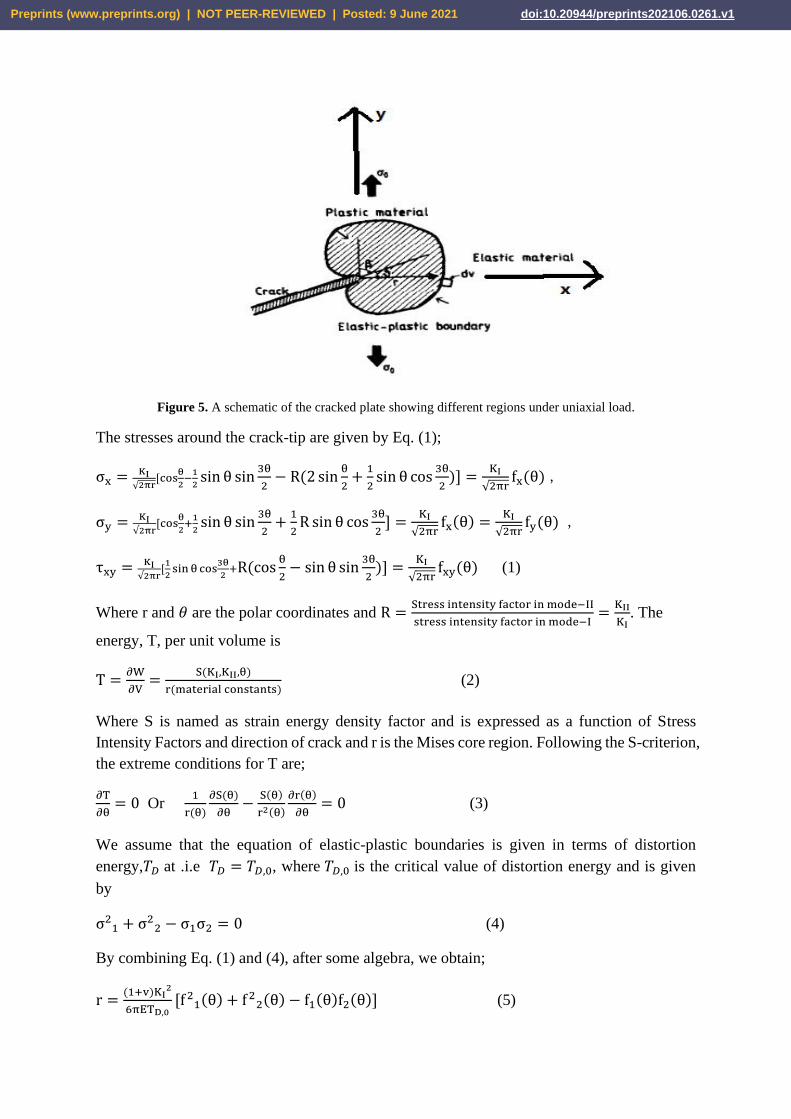
Figure 5. A schematic of the cracked plate showing different regions under uniaxial load.
The stresses around the crack-tip are given by Eq. (1);
σx = KI√2πr
[cosθ
2−
1
2sin θ sin
3θ
2− R(2 sin
θ
2+
1
2sin θ cos
3θ
2)] =
KI
√2πrfx(θ) ,
σy = KI√2πr
[cosθ
2+
1
2sin θ sin
3θ
2+
1
2R sin θ cos
3θ
2] =
KI
√2πrfx(θ) =
KI
√2πrfy(θ) ,
τxy = KI√2πr
[1
2sin θ cos
3θ
2+R(cos
θ
2− sin θ sin
3θ
2)] =
KI
√2πrfxy(θ) (1)
Where r and 𝜃 are the polar coordinates and R =Stress intensity factor in mode−II
stress intensity factor in mode−I=
KII
KI. The
energy, T, per unit volume is
T =∂W
∂V=
S(KI,KII,θ)
r(material constants) (2)
Where S is named as strain energy density factor and is expressed as a function of Stress
Intensity Factors and direction of crack and r is the Mises core region. Following the S-criterion,
the extreme conditions for T are;
∂T
∂θ= 0 Or
1
r(θ)
∂S(θ)
∂θ−
S(θ)
r2(θ)
∂r(θ)
∂θ= 0 (3)
We assume that the equation of elastic-plastic boundaries is given in terms of distortion
energy,𝑇𝐷 at .i.e 𝑇𝐷 = 𝑇𝐷,0, where 𝑇𝐷,0 is the critical value of distortion energy and is given
by
σ21 + σ2
2 − σ1σ2 = 0 (4)
By combining Eq. (1) and (4), after some algebra, we obtain;
r =(1+v)KI
2
6πETD,0[f 2
1(θ) + f 22(θ) − f1(θ)f2(θ)] (5)
Preprints (www.preprints.org) | NOT PEER-REVIEWED | Posted: 9 June 2021 doi:10.20944/preprints202106.0261.v1
Where
f1,2(θ) =1
2[fx(θ) + fy(θ)] ±
1
2[{fx(θ) − fy(θ)}2 + 4f 2
XY(θ)]2 (6)
Let A= (1+v)KI
2
6πETD,0 and F(θ) = [f 2
1(θ) + f 22(θ) − f1(θ)f2(θ)] then Eq.(5) can be written as
F(θ) =r
A (7)
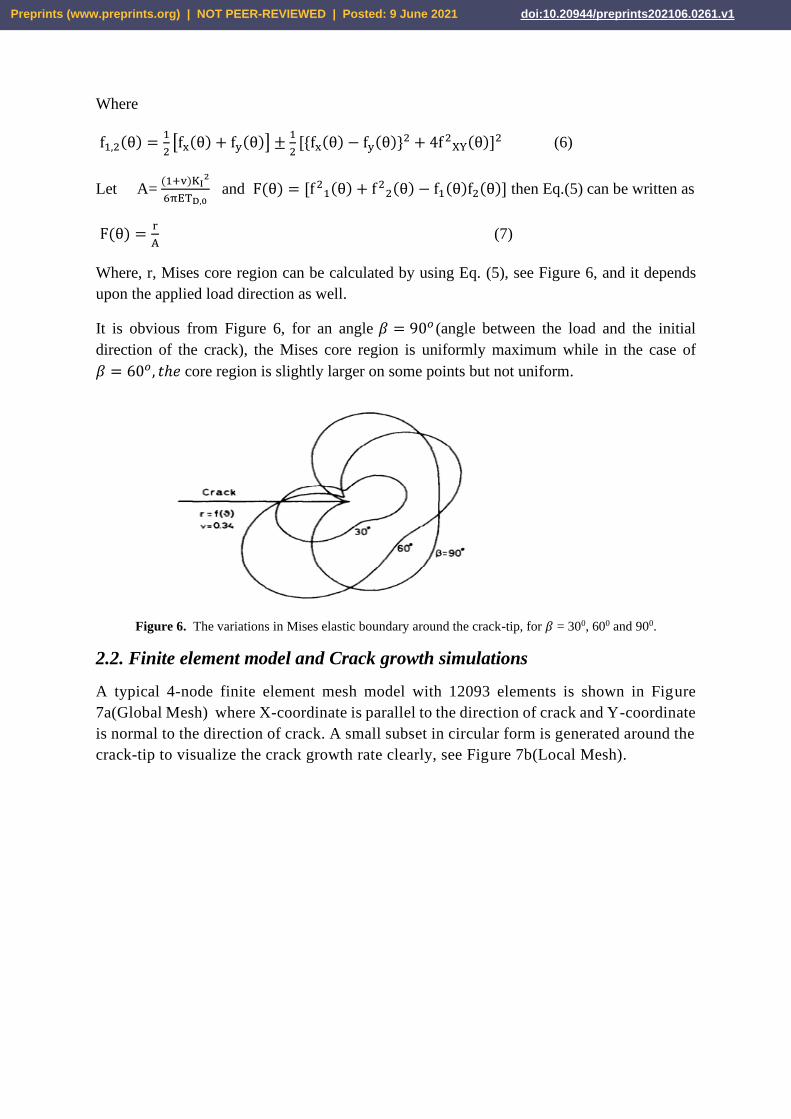
Where, r, Mises core region can be calculated by using Eq. (5), see Figure 6, and it depends
upon the applied load direction as well.
It is obvious from Figure 6, for an angle 𝛽 = 90𝑜 (angle between the load and the initial
direction of the crack), the Mises core region is uniformly maximum while in the case of
𝛽 = 60𝑜 , 𝑡ℎ𝑒 core region is slightly larger on some points but not uniform.
Figure 6. The variations in Mises elastic boundary around the crack-tip, for 𝛽 = 300, 600 and 900.
2.2. Finite element model and Crack growth simulations
A typical 4-node finite element mesh model with 12093 elements is shown in Figure
7a(Global Mesh) where X-coordinate is parallel to the direction of crack and Y-coordinate
is normal to the direction of crack. A small subset in circular form is generated around the
crack-tip to visualize the crack growth rate clearly, see Figure 7b(Local Mesh).
Preprints (www.preprints.org) | NOT PEER-REVIEWED | Posted: 9 June 2021 doi:10.20944/preprints202106.0261.v1
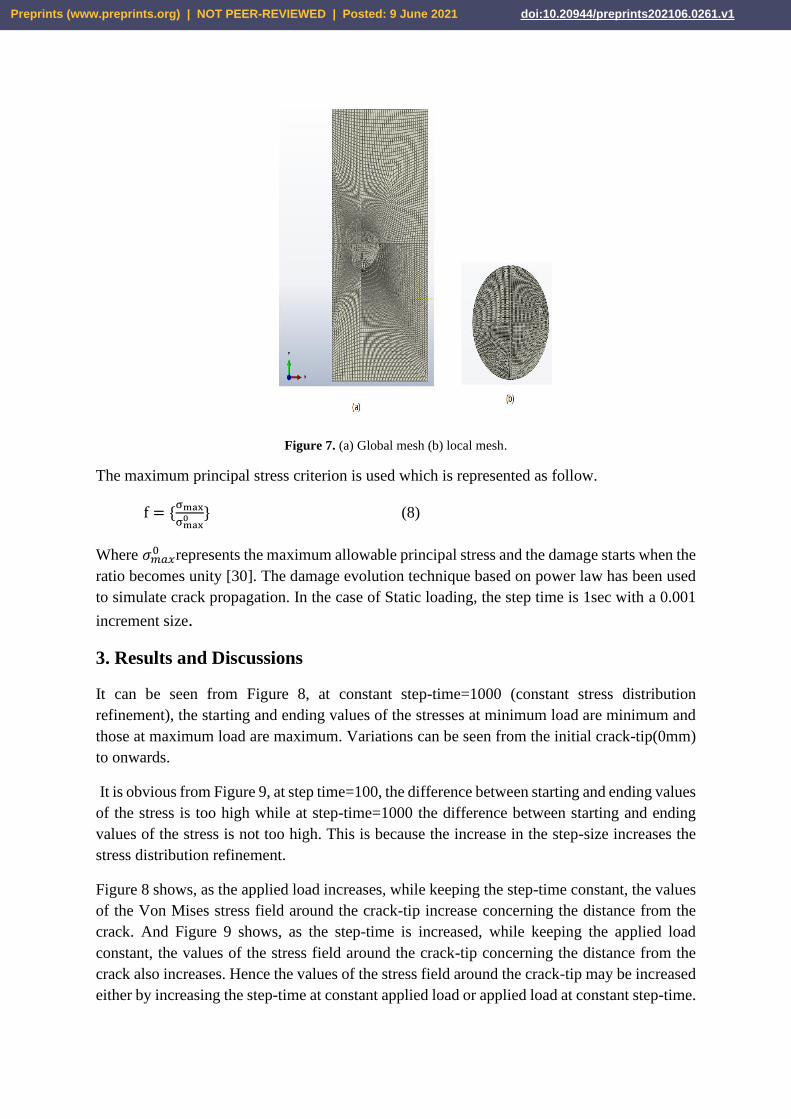
Figure 7. (a) Global mesh (b) local mesh.
The maximum principal stress criterion is used which is represented as follow.
f = {σmax
σmax0 } (8)
Where 𝜎𝑚𝑎𝑥0 represents the maximum allowable principal stress and the damage starts when the
ratio becomes unity [30]. The damage evolution technique based on power law has been used
to simulate crack propagation. In the case of Static loading, the step time is 1sec with a 0.001
increment size.
3. Results and Discussions
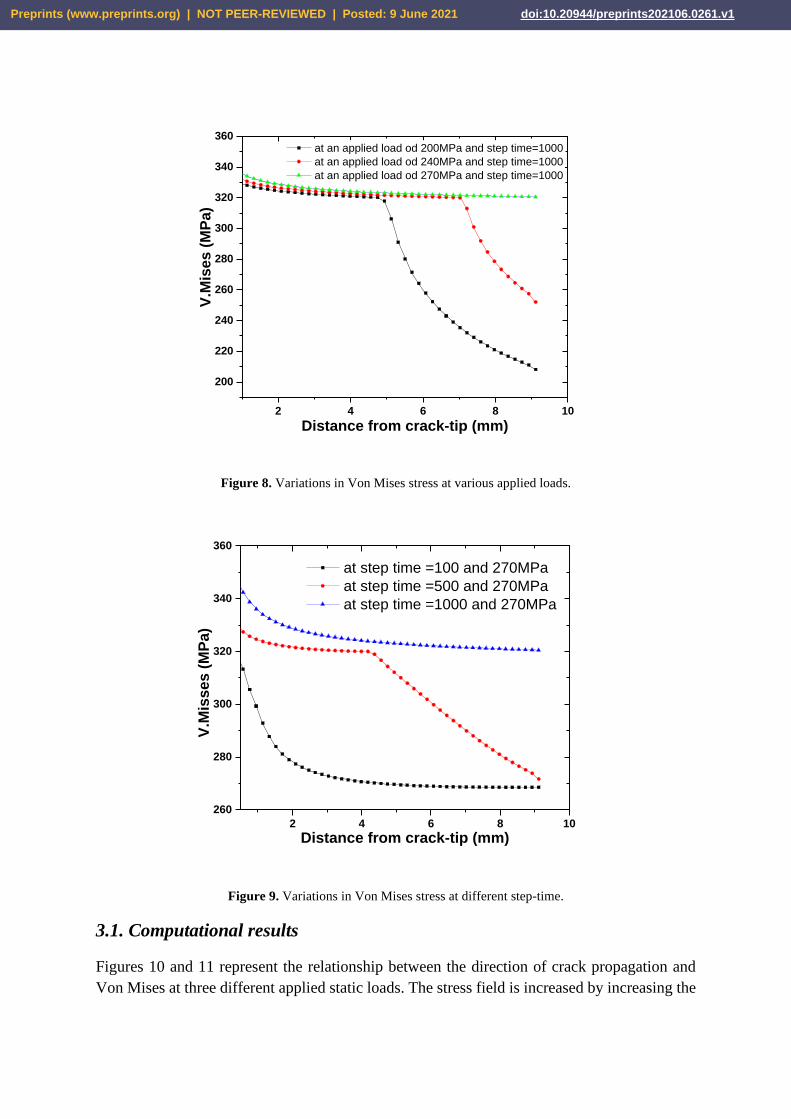
It can be seen from Figure 8, at constant step-time=1000 (constant stress distribution
refinement), the starting and ending values of the stresses at minimum load are minimum and
those at maximum load are maximum. Variations can be seen from the initial crack-tip(0mm)
to onwards.
It is obvious from Figure 9, at step time=100, the difference between starting and ending values
of the stress is too high while at step-time=1000 the difference between starting and ending
values of the stress is not too high. This is because the increase in the step-size increases the
stress distribution refinement.
Figure 8 shows, as the applied load increases, while keeping the step-time constant, the values
of the Von Mises stress field around the crack-tip increase concerning the distance from the
crack. And Figure 9 shows, as the step-time is increased, while keeping the applied load
constant, the values of the stress field around the crack-tip concerning the distance from the
crack also increases. Hence the values of the stress field around the crack-tip may be increased
either by increasing the step-time at constant applied load or applied load at constant step-time.
Preprints (www.preprints.org) | NOT PEER-REVIEWED | Posted: 9 June 2021 doi:10.20944/preprints202106.0261.v1
2 4 6 8 10
200
220
240
260
280
300
320
340
360
V.M
ises (
MP
a)
Distance from crack-tip (mm)
at an applied load od 200MPa and step time=1000
at an applied load od 240MPa and step time=1000
at an applied load od 270MPa and step time=1000
Figure 8. Variations in Von Mises stress at various applied loads.
2 4 6 8 10
260
280
300
320
340
360
V.M
iss
es
(M
Pa
)
Distance from crack-tip (mm)
at step time =100 and 270MPa
at step time =500 and 270MPa
at step time =1000 and 270MPa
Figure 9. Variations in Von Mises stress at different step-time.
3.1. Computational results
Figures 10 and 11 represent the relationship between the direction of crack propagation and
Von Mises at three different applied static loads. The stress field is increased by increasing the
Preprints (www.preprints.org) | NOT PEER-REVIEWED | Posted: 9 June 2021 doi:10.20944/preprints202106.0261.v1
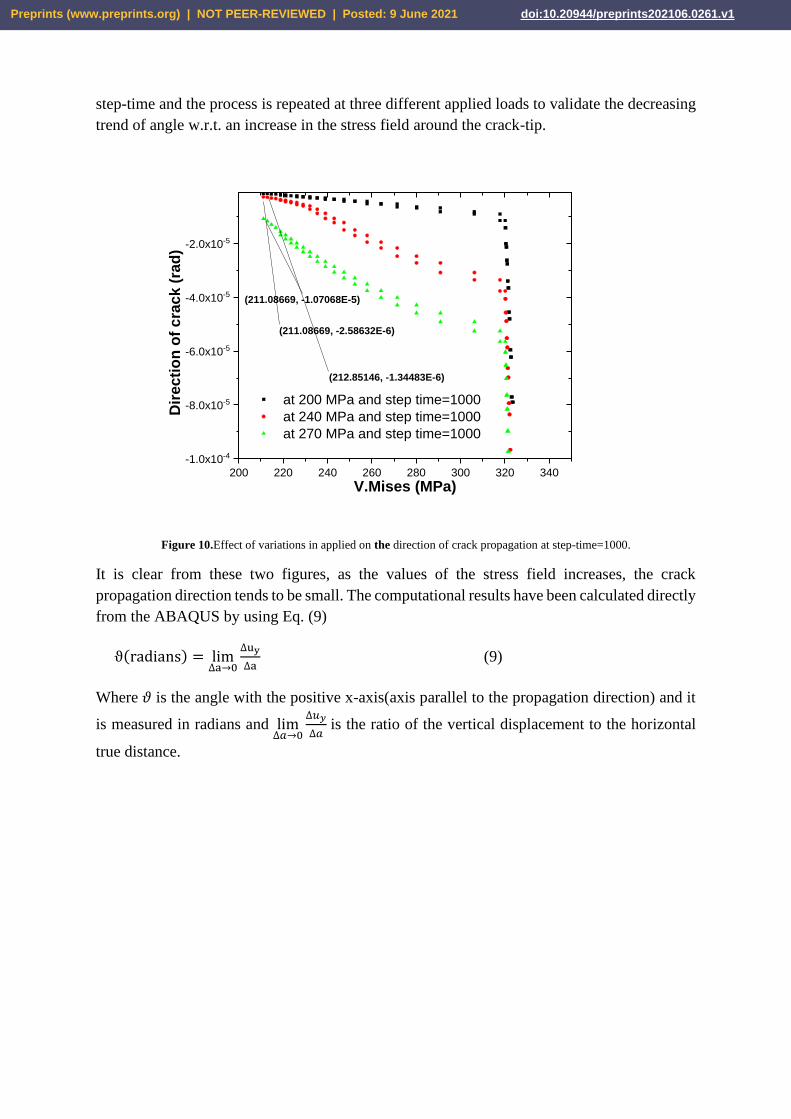
step-time and the process is repeated at three different applied loads to validate the decreasing
trend of angle w.r.t. an increase in the stress field around the crack-tip.
200 220 240 260 280 300 320 340
-1.0x10⁻⁴
-8.0x10⁻⁵
-6.0x10⁻⁵
-4.0x10⁻⁵
-2.0x10⁻⁵
Dir
ec
tio
n o
f c
rac
k (
rad
)
V.Mises (MPa)
at 200 MPa and step time=1000
at 240 MPa and step time=1000
at 270 MPa and step time=1000
(211.08669, -1.07068E-5)
(211.08669, -2.58632E-6)
(212.85146, -1.34483E-6)
Figure 10.Effect of variations in applied on the direction of crack propagation at step-time=1000.
It is clear from these two figures, as the values of the stress field increases, the crack
propagation direction tends to be small. The computational results have been calculated directly
from the ABAQUS by using Eq. (9)
ϑ(radians) = lim∆a→0
∆uy
∆a (9)
Where 𝜗 is the angle with the positive x-axis(axis parallel to the propagation direction) and it
is measured in radians and lim∆𝑎→0
∆𝑢𝑦
∆𝑎 is the ratio of the vertical displacement to the horizontal
true distance.
Preprints (www.preprints.org) | NOT PEER-REVIEWED | Posted: 9 June 2021 doi:10.20944/preprints202106.0261.v1
180 200 220 240 260 280 300 320 340
-1.0x10⁻⁵
-8.0x10⁻⁶
-6.0x10⁻⁶
-4.0x10⁻⁶
-2.0x10⁻⁶
Dir
ec
tio
n o
f c
rac
k (
rad
)
V.Mises (MPa)
at 200MPa and step time=500
at 240MPa and step time=500
at 270MPa and step time=500
(195.62321, -2.27556E-7)
(225.64041, -4.80947E-7)
(273.86588, -9.99669E-7)
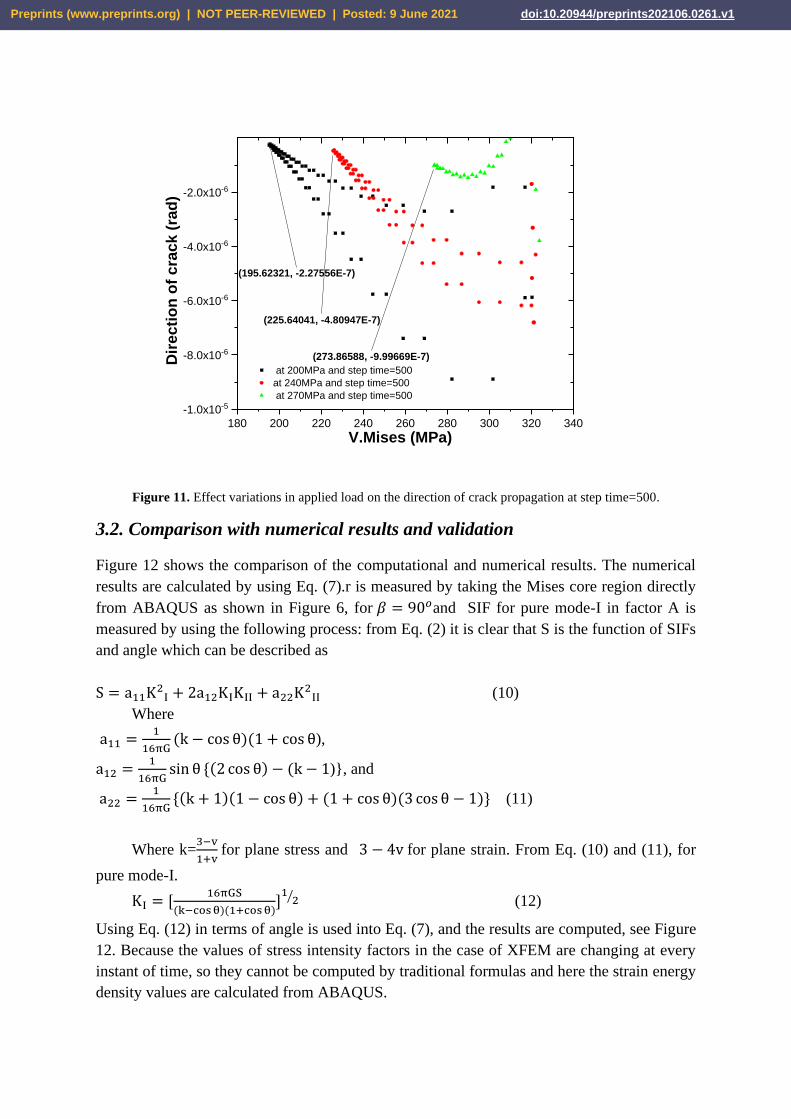
Figure 11. Effect variations in applied load on the direction of crack propagation at step time=500.
3.2. Comparison with numerical results and validation
Figure 12 shows the comparison of the computational and numerical results. The numerical
results are calculated by using Eq. (7).r is measured by taking the Mises core region directly
from ABAQUS as shown in Figure 6, for 𝛽 = 90𝑜and SIF for pure mode-I in factor A is
measured by using the following process: from Eq. (2) it is clear that S is the function of SIFs
and angle which can be described as
S = a11K2I + 2a12KIKII + a22K2
II (10)
Where
a11 =1
16πG(k − cos θ)(1 + cos θ),
a12 =1
16πGsin θ {(2 cos θ) − (k − 1)}, and
a22 =1
16πG{(k + 1)(1 − cos θ) + (1 + cos θ)(3 cos θ − 1)} (11)
Where k=3−v
1+v for plane stress and 3 − 4v for plane strain. From Eq. (10) and (11), for
pure mode-I.
KI = [16πGS
(k−cos θ)(1+cos θ)]
12⁄ (12)
Using Eq. (12) in terms of angle is used into Eq. (7), and the results are computed, see Figure
12. Because the values of stress intensity factors in the case of XFEM are changing at every
instant of time, so they cannot be computed by traditional formulas and here the strain energy
density values are calculated from ABAQUS.
Preprints (www.preprints.org) | NOT PEER-REVIEWED | Posted: 9 June 2021 doi:10.20944/preprints202106.0261.v1
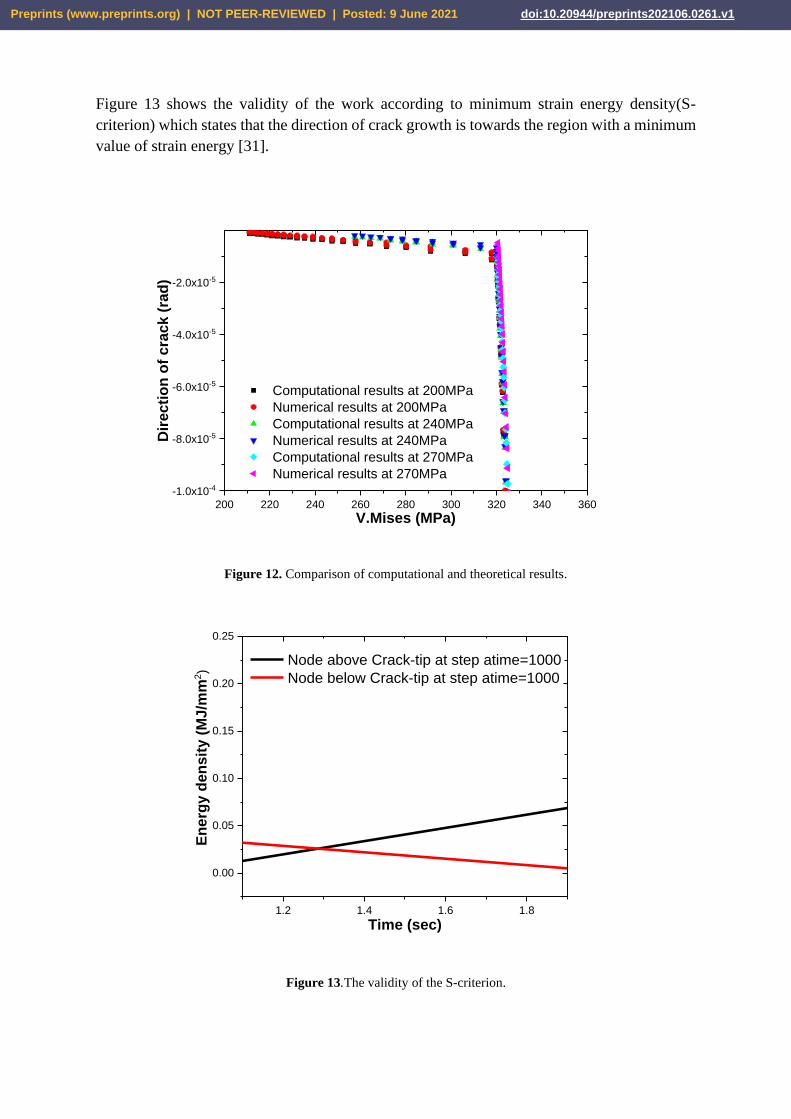
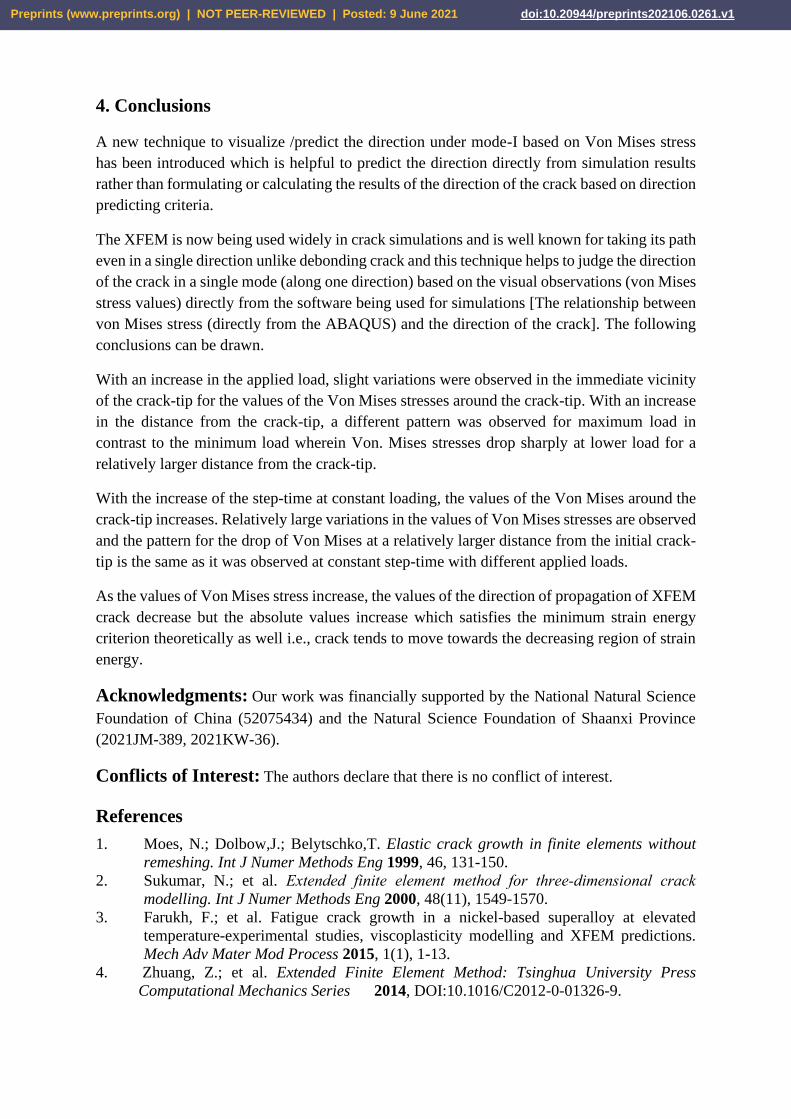
Figure 13 shows the validity of the work according to minimum strain energy density(S-
criterion) which states that the direction of crack growth is towards the region with a minimum
value of strain energy [31].
200 220 240 260 280 300 320 340 360
-1.0x10⁻⁴
-8.0x10⁻⁵
-6.0x10⁻⁵
-4.0x10⁻⁵
-2.0x10⁻⁵
Dir
ecti
on
of
cra
ck
(ra
d)
V.Mises (MPa)
Computational results at 200MPa
Numerical results at 200MPa
Computational results at 240MPa
Numerical results at 240MPa
Computational results at 270MPa
Numerical results at 270MPa
Figure 12. Comparison of computational and theoretical results.
1.2 1.4 1.6 1.8
0.00
0.05
0.10
0.15
0.20
0.25
En
erg
y d
en
sit
y (
MJ/m
m2)
Time (sec)
Node above Crack-tip at step atime=1000
Node below Crack-tip at step atime=1000
Figure 13.The validity of the S-criterion.
Preprints (www.preprints.org) | NOT PEER-REVIEWED | Posted: 9 June 2021 doi:10.20944/preprints202106.0261.v1
4. Conclusions
A new technique to visualize /predict the direction under mode-I based on Von Mises stress
has been introduced which is helpful to predict the direction directly from simulation results
rather than formulating or calculating the results of the direction of the crack based on direction
predicting criteria.
The XFEM is now being used widely in crack simulations and is well known for taking its path
even in a single direction unlike debonding crack and this technique helps to judge the direction
of the crack in a single mode (along one direction) based on the visual observations (von Mises
stress values) directly from the software being used for simulations [The relationship between
von Mises stress (directly from the ABAQUS) and the direction of the crack]. The following
conclusions can be drawn.
With an increase in the applied load, slight variations were observed in the immediate vicinity
of the crack-tip for the values of the Von Mises stresses around the crack-tip. With an increase
in the distance from the crack-tip, a different pattern was observed for maximum load in
contrast to the minimum load wherein Von. Mises stresses drop sharply at lower load for a
relatively larger distance from the crack-tip.
With the increase of the step-time at constant loading, the values of the Von Mises around the
crack-tip increases. Relatively large variations in the values of Von Mises stresses are observed
and the pattern for the drop of Von Mises at a relatively larger distance from the initial crack-
tip is the same as it was observed at constant step-time with different applied loads.
As the values of Von Mises stress increase, the values of the direction of propagation of XFEM
crack decrease but the absolute values increase which satisfies the minimum strain energy
criterion theoretically as well i.e., crack tends to move towards the decreasing region of strain
energy.
Acknowledgments: Our work was financially supported by the National Natural Science
Foundation of China (52075434) and the Natural Science Foundation of Shaanxi Province
(2021JM-389, 2021KW-36).
Conflicts of Interest: The authors declare that there is no conflict of interest.
References
1. Moes, N.; Dolbow,J.; Belytschko,T. Elastic crack growth in finite elements without
remeshing. Int J Numer Methods Eng 1999, 46, 131-150.
2. Sukumar, N.; et al. Extended finite element method for three‐dimensional crack
modelling. Int J Numer Methods Eng 2000, 48(11), 1549-1570.
3. Farukh, F.; et al. Fatigue crack growth in a nickel-based superalloy at elevated
temperature-experimental studies, viscoplasticity modelling and XFEM predictions.
Mech Adv Mater Mod Process 2015, 1(1), 1-13.
4. Zhuang, Z.; et al. Extended Finite Element Method: Tsinghua University Press
Computational Mechanics Series 2014, DOI:10.1016/C2012-0-01326-9.
Preprints (www.preprints.org) | NOT PEER-REVIEWED | Posted: 9 June 2021 doi:10.20944/preprints202106.0261.v1
5. Zhao, J.; et al. A method for modeling the transition of weak discontinuities to strong
discontinuities: from interfaces to cracks. Int J Numer Methods Eng 2016, 105(11),
834-854.
6. Yau, J.; Wang,S.; Corten, H. A mixed-mode crack analysis of isotropic solids using
conservation laws of elasticity. J Appl Mech Trans ASME 1980,
DOI:10.1115/1.3153665.
7. Xue, H.; et al. The effect of a single tensile overload on stress corrosion cracking growth
of stainless steel in a light water reactor environment. Nucl. Eng. Des. 2011, 241(3),
731-738.
8. Lu, Z.; et al. Locally Delaminating Stress Corrosion Cracking Growth of Strain-
Hardened Austenitic Alloys in Hydrogenated High Temperature Water Environments.
Am Soc Mech Eng Press Vessel Pip Div PVP 2010, DOI:10.1115/PVP2009-77622.
9. Bergara, A.; et al. Fatigue crack propagation in complex stress fields: Experiments and
numerical simulations using the Extended Finite Element Method (XFEM). Int J
Fatigue 2017, 103, 112-121.
10. Giner, E.; et al. An Abaqus implementation of the extended finite element method. Eng
Fract Mech 2009, 76(3), 347-368.
11. Sun, C.T.; Jin, Z. Chapter 1 – Introduction. Fract. Mech. 2012, DOI:10.1016/B978-0-
12-385001-0.00001-8.
12. Erdogan, F.; Sih, G. On the crack extension in plates under plane loading and transverse
shear. J Fluids Eng Trans ASME 1963, DOI:10.1115/1.3656897.
13. Gol'dstein, R.V.; Salganik, R.L. Brittle fracture of solids with arbitrary cracks. Int J
Fract 1974, 10(4), 507-523.
14. Palaniswamy, K.; Knauss,W. Propagation of a crack under general, in-plane tension.
Int J Fract Mech 1972, 8(1), 114-117.
15. Hussain, M.A.; Pu, S.L.; Underwood, J. Strain Energy Release Rate for a Crack Under
Combined Mode I and Mode II. Natl Symp Fract Mech 2009, 2, 2–27.
16. Karihaloo, B.; Keer, L.; Nemat-Nasser, S. Crack kinking under nonsymmetric loading.
Eng Fract Mech 1980, 13(4), 879-888.
17. Hayashi, K.; Nemat-Nasser, S. Energy-release rate and crack kinking under combined
loading. J Appl Mech Trans ASME 1981, DOI:10.1115/1.3157666.
18. Sih, G.C. Some basic problems in fracture mechanics and new concepts. Eng Fract
Mech 1973, 5(2), 365-377.
19. Williams, M. On the stress distribution at the base of a stationary crack. J Appl Mech
1956, DOI:10.1093/bja/54.11.1237.
20. Frank, F.; Stroh, A. On the theory of kinking. Proc. Phys. Soc. Sect. B 1952, 65(10), 811.
21. Nuismer, R. An energy release rate criterion for mixed mode fracture. Int J Fract 1975,
11(2), 245-250.
22. Shu, B.; et al. A qualitative prediction method of new crack-initiation direction during
hydraulic fracturing of pre-cracks based on hyperbolic failure envelope. Appl Energy
2019, 248, 185-195.
23. Dahlberg, M.; Bremberg, D. Fatigue margins for austenitic stainless steels in ASME
Boiler and pressure vessel code–a literature study. Publ Swedish Radiat Saf Auth 2012.
24. Hu, X.; et al. Hydrogen permeation in FeCrAl alloys for LWR cladding application. J
Nucl Mater 2015, 461, 282–91.
Preprints (www.preprints.org) | NOT PEER-REVIEWED | Posted: 9 June 2021 doi:10.20944/preprints202106.0261.v1
25. Szklarska-Smialowska, S.; Cragnolino, G. Stress corrosion cracking of sensitized type
304 stainless steel in oxygenated pure water at elevated temperatures. Corrosion 1980,
36(12), 653-665.
26. Bashir, R.; et al. Interaction of Cyclic Loading (Low-Cyclic Fatigue) with Stress
Corrosion Cracking (SCC) Growth Rate. ADV MATER SCI ENG, 2020.
27. Fish, J.; Belytschko, T. Commercial Finite Element Program ABAQUS Tutorials. A
First Course Finite Elem. 2007, DOI:10.1002/9780470510858.ch11.
28. Bashir, R.; et al. Effect of XFEM mesh density (mesh size) on stress intensity factors
(K), strain gradient (dεdr) and stress corrosion cracking (SCC) growth rate. Structures
2020, 25, 593-602.
29. Theocaris, P.; Andrianopoulos, N. The Mises elastic-plastic boundary as the core
region in fracture criteria. Eng Fract Mech 1982,16, 425–32.
30. Abaqus, V. 6.14 Documentation. Dassault Systemes Simulia Corporation 2014, 651,
6.2.
31. Aliabadi, M.H. 3.02 - Boundary Element Methods in Linear Elastic Fracture
Mechanics. Compr Struct Integr 2007, 3, 89–125.
Preprints (www.preprints.org) | NOT PEER-REVIEWED | Posted: 9 June 2021 doi:10.20944/preprints202106.0261.v1


![Delamination Buckling and Crack Propagation Simulations in Fiber … · 2019. 4. 16. · in LS-DYNA can be found in [18]. The use of xFEM would be most effective when the crack path](https://img.pdfslide.us/doc/110x75/60e2704a785bf13af37dbc37/delamination-buckling-and-crack-propagation-simulations-in-fiber-2019-4-16.jpg)
![An XFEM method for modelling geometrically elaborate crack ...pages.cs.wisc.edu/~sifakis/papers/crack_propagation_xfem_preprint.pdfIn [6] Moes, et. al., used XFEM to create a technique](https://img.pdfslide.us/doc/110x75/5f01e3527e708231d40186ba/an-xfem-method-for-modelling-geometrically-elaborate-crack-pagescswiscedusifakispaperscrackpropagationxfem.jpg)


![An XFEM method for modeling geometrically elaborate crack ... · AN XFEM METHOD FOR GEOMETRICALLY ELABORATE CRACK PROPAGATION 3 for holes and inclusions see [24]) and has also been](https://img.pdfslide.us/doc/110x75/5ad9bedd7f8b9a53618bac1b/an-xfem-method-for-modeling-geometrically-elaborate-crack-xfem-method-for-geometrically.jpg)