Embed Size (px)
Citation preview

Prediction of alternative isoforms from exonexpression levels in RNA-Seq experimentsHugues Richard1,*, Marcel H. Schulz1,2, Marc Sultan3, Asja Nurnberger3,
Sabine Schrinner3, Daniela Balzereit3, Emilie Dagand3, Axel Rasche3, Hans Lehrach3,
Martin Vingron1, Stefan A. Haas1 and Marie-Laure Yaspo3
1Department of Computational Molecular Biology, Max Planck Institute for Molecular Genetics, Ihnestr. 73,2International Max Planck Research School for Computational Biology and Scientific Computing, and3Department of Vertebrate Genomics, Max Planck Institute for Molecular Genetics, Ihnestr. 73, 14195 Berlin,Germany
Received July 26, 2009; Revised November 26, 2009; Accepted January 17, 2010
ABSTRACT
Alternative splicing, polyadenylation of pre-messenger RNA molecules and differentialpromoter usage can produce a variety of transcriptisoforms whose respective expression levels areregulated in time and space, thus contributingspecific biological functions. However, the rep-ertoire of mammalian alternative transcriptsand their regulation are still poorly understood.Second-generation sequencing is now openingunprecedented routes to address the analysis ofentire transcriptomes. Here, we developedmethods that allow the prediction and quantificationof alternative isoforms derived solely from exonexpression levels in RNA-Seq data. These arebased on an explicit statistical model and enablethe prediction of alternative isoforms within orbetween conditions using any known gene annota-tion, as well as the relative quantification of knowntranscript structures. Applying these methods to ahuman RNA-Seq dataset, we validated a significantfraction of the predictions by RT-PCR. Data furthershowed that these predictions correlated well withinformation originating from junction reads. A directcomparison with exon arrays indicated improvedperformances of RNA-Seq over microarrays inthe prediction of skipped exons. Altogether, theset of methods presented here comprehensivelyaddresses multiple aspects of alternative
isoform analysis. The software is available as anopen-source R-package called Solas at http://cmb.molgen.mpg.de/2ndGenerationSequencing/Solas/.
INTRODUCTION
Alternative splicing (AS) is the mechanism by whicha common precursor mRNA produces differentmRNA variants, by extending, shortening, skipping, orincluding exon, or retaining intron sequences.The combinatorics of such AS events generates a largevariability at the post-transcriptional level accountingfor an organism’s proteome complexity (1,2). BesidesAS, other biological mechanisms shape the trans-criptome, like alternative first or last exon usage or alter-native polyadenylation of exons (3,4). Altogether, theseevents are summarized as alternative exon events(AEEs). Various gene isoforms generated by AEEs havespecific roles in particular cell compartments, tissues,stages of development, etc. In addition, many diseases(e.g. cancer) have been related to alterations in thesplicing machinery, highlighting the relevance of AS totherapy (5–7).It has been previously estimated that 75–92% of all
human genes give rise to multiple transcripts (8–10). Upto now, systematic analysis of alternative isoforms wasbased on the analysis of expressed sequence tags (ESTs),or on microarray experiments. ESTs have been initiallyused for the detection and prediction of alternativesplice forms in different organisms and cell types(1,11–13). However, this approach showed inherent
*To whom correspondence should be addressed. Tel: +493084131159; Fax: +493084131152; Email: [email protected]
The authors wish it to be known that, in their opinion, the first three authors should be regarded as joint First Authors.
Published online 11 February 2010 Nucleic Acids Research, 2010, Vol. 38, No. 10 e112doi:10.1093/nar/gkq041
� The Author(s) 2010. Published by Oxford University Press.This is an Open Access article distributed under the terms of the Creative Commons Attribution Non-Commercial License (http://creativecommons.org/licenses/by-nc/2.5), which permits unrestricted non-commercial use, distribution, and reproduction in any medium, provided the original work is properly cited.
limitations associated with cloning strategies, non-uniformtranscript coverage and low abundance for individualtissues (11,14). More recently, alternative isoforms havebeen analysed by microarrays using exon body probes(exon arrays) and/or probes spanning splice junctions(exon junction arrays) (8,12,15–17). Custom arrays,combining exon body and splice junction probes havebeen used for quantifying isoform expression levels (18).In parallel, the standard platform provided by theAffymetrix human exon array allows the monitoring of106 exons derived from 18 000 known genes and approx-imately 262 000 predicted transcripts (19). However,several problems inherent to the use of arrays, such asprobe hybridization behaviour, cross hybridization ofrelated probes and deconvoluting signal-to-noise ratios(14) are difficult to overcome. For instance, for thehuman Affymetrix exon arrays, the validation rateranges from 33% (20) to 86% (19). Besides, thecomputational analysis of exon arrays remains acomplex task (21,22).Second-generation sequencing represents an invaluable
advance for analysing the transcriptome and the repertoireof AEEs. RNA-Seq experiments provide in-depth infor-mation on the transcriptional landscape with unprece-dented sensitivity and throughput (23–30). RNA-Seqdata allow the direct detection of AS events using thereads mapping at splice junctions, specifying bothknown as well as novel AS forms (9,10). However, a com-prehensive survey of AS by junction reads is intrinsicallydependent on the sequencing depth. Typical sequencingdepths with one or two lanes might only provide readsspecifying approximately half of the exon–exon junctionsoccurring within a cell.Here, we provide a set of methods that enable the detec-
tion and quantification of AEEs within or between condi-tions using a given gene annotation. The Cell type-specificAlternative uSage Index (CASI) predicts AEEs within agiven condition, e.g. one cell line. The PrOportionEstiMation method (POEM) enables the relative quantifi-cation of known transcript structures within a given con-dition. Finally, the Differential Alternative uSage Index(DASI) predicts AEEs differentiating two conditions,e.g. between two cell lines.All methods are based on a stochastic model of the read
distribution along a transcript and show high robustnessbased on simulations. We applied the methods on apreviously published RNA-Seq dataset from two humancell lines (27). We predicted several thousands of AEEsand estimated isoform abundance for sufficientlyexpressed genes. Further, we validated our predictionsand estimations by RT-PCR experiments on more than100 cases. The robustness of the methods was additionallyassessed by bootstrapping.We report the first comparison of splicing prediction by
RNA-Seq and exon arrays, showing that RNA-Seq ismore sensitive and estimates exon expression values withhigher accuracy. In summary, we provide a versatile andreliable set of tools that covers multiple aspects of alter-native isoform analysis, which is available as anopen-source package called Solas at http://cmb.molgen.mpg.de/2ndGenerationSequencing/Solas/.
MATERIALS AND METHODS
Transcript sampling model
All reads from an RNA-Seq experiment are of the samelength r (usually around 30–36 bp). Due to the nature ofthe RNA-Seq protocol, which involves random shearingof the messenger RNA molecules, we consider that the setof sequenced fragments is picked randomly out of a bag oftranscript positions. First, the total number of readsT covering a gene is determined by a Poisson process:T � Poissonð�� s� pÞ, where s is the total length ofthe gene, p is the relative proportion and l is a normalizingfactor related to sampling depth. The Poisson frameworksuits especially for low-coverage datasets, where a normaldistribution cannot serve as a good approximation (31).This model has already been proposed for abundance ofEST data (32), as well as SAGE libraries (33). For ease ofnotation, the approach is described for one gene, but allformulas can be extended for a set of genes.
Due to the hypothesis that the reads are positionedrandomly along every transcript, the number ofobserved reads within exons Y ¼ ðYeÞe¼1::n is drawnaccording to a multinomial distribution Mð peð Þ
ne¼1,TÞ.
The probability pe that a read falls in exon e isparameterized for every gene according to the propertiesof the RNA-Seq experiment. An obvious parameter for peis the effective length le of an exon. The effective exonlength corrects for exonic regions where reads of lengthr cannot be uniquely mapped due to highly homologousgene families, pseudogenes and low sequence complexity.Any other information affecting the read coverage—suchas GC bias or a bias specific to the protocol used—can beincluded in the definition of effective exon length. Finally,we define the normalized expression ~ye of an exon e as theexon read count normalized by the exon relative propor-tion and the gene size:
~ye ¼ye
pe � sð1Þ
We first provide a test framework to detect AEEsoccurring within a given cell type (CASI method) orrelated to the presence of different isoform patternsbetween two cell types (DASI method). In both cases, atwo-step procedure was applied, which (i) detects geneswith AEEs based on CASI and DASI p-values and (ii)highlights exons predicted to be alternative according toa z-score statistic. The z-score statistic is computed foreach exon e as:
ze ¼Re �medianðR�Þ
MADðR�Þð2Þ
where R is defined according to each exon log normalizedexpression or expression ratio (see below). We use themedian and maximum absolute deviation (MAD) asrobust estimates of mean and standard deviation toavoid a bias for genes with few exons. This statisticsassumes that the majority of the exons are constitutive.
Alternative exon usage within a condition (CASI)
Under the null hypothesis that one transcript uses all theexons of the gene, the counts within exons follow a
e112 Nucleic Acids Research, 2010, Vol. 38, No. 10 PAGE 2 OF 15

multinomial of parameters pe and T. The presence ofAEEs within a condition was assessed by usingPearson’s chi-square test on M peð Þ
ne¼1,T
� �, where the
p-value was corrected for multiple testing using theBenjamini–Hochberg procedure (34). Only genes with atleast two expressed exons were tested. A gene with a smallCASI p-value means either that (i) two or more transcriptsfrom one gene are present or (ii) one isoform is present butonly a subpart of one of its exons is expressed. Case(ii) can correspond to events of alternative donoror acceptor sites, where only a part of the exon isexpressed. The zC score (CASI) is computed for eachexon, according to its log-normalized expressionRC
e =log( ~ye). Exons with less than five counts were notconsidered for CASI computation. The CASI p-value wasset to 0.05.
Alternative exon usage between two conditions (DASI)
Two observed read distributions y and z were consid-ered for the same gene in two different experiments.The difference in exon usage pattern between the twoconditions was analysed for every gene conditionallyon its expression in both conditions. The presence ofdifferential AEEs was assessed with the FDR-correctedp-value of Fisher’s exact test (34). Every exon e of thegene was assigned a zD score (DASI) based on thelog-ratio RD
e ¼ log ye=ze of reads between the twoexperiments.
Exons with less than five read counts in both conditionswere not considered. A pseudo count of 1 was added to yeand ze if its original value was 0. The DASI p-value was setto 0.05 and the |DASI|� 2. Genes showing a significantdifference between the two biological replicates wereremoved from the DASI analysis.
Quantification of isoform levels (POEM)
Under the assumption that k different transcript variantswith counts T1, . . . ,Tk are expressed, the structure of eachtranscript is given and described by the matrix of binaryvalues Ie,j, such that Ie,j ¼ 1 if form j uses exon e. The readcounts Ye in a single exon are the sum of all transcriptreads falling within the exon:
Ye ¼X
j2isoforms
pePi
pi � Ii,j� Ie,j � Tj ð3Þ
Substituting Ye and T by their expected values, uniquemean estimates of the Tj can be obtained by solving alinear system, given that the matrix Ye is of full rank.We employed an Expectation–Maximization (EM)strategy for maximizing the likelihood and to infer theunobserved transcript proportions. The counts Yj
e ofform j in exon e are fully described by the following hier-archical model:
Tj � Poissonð�jÞ with �j ¼ � �1P
i
pi � Ii,j� qj ð4Þ
Yj1,Y
j2, . . . ,Yj
n
� �jTj ¼ mj �M
pePi
pi � Ii,j� Ie,j
0@
1A
n
e¼1
,mj
0B@
1CA
8j ¼ 1, . . . ,k
ð5Þ
where qj is the relative proportion of form j and � is anormalizing factor accounting for the depth of sequencingand the length of the transcript. Given the marginalcounts Ye ¼
Pkj¼1 Y
je, the aim is to infer the expected
counts for each exon per transcript. A condition ofidentifiability for the parameters (and thus tounambiguously identify the transcript proportions) is thelinear independence of the rows of the indicator matrix I(35). An EM algorithm was used to estimate the propor-tions of each form Pj. The EM update formulas and themethod to derive a quality score for each gene aredescribed in Supplementary Material.The CASI analysis showed that large modifications are
occurring on the most 30- or 50-exons. We, therefore, spe-cifically focused POEM estimation based on informationfrom internal exons, by artificially removing the first andlast exon of every transcript before POEM estimation.
Simulations based on a gene model
In order to assess the accuracy for different methods, wesimulated a single exon skipping event for a template genemodel. The inclusion rate of the exon as well as the lengthof the skipped exon and the gene expression level varied.Reads were drawn randomly along exons of the geneaccording to the distribution introduced previously.Noise was introduced in the model by choosing oneexon at random and artificially modifying the proportionof reads mapping to it by 20%.The simulations for CASI assumed a gene with six
exons and a length of 150 bp per exon. We simulated dif-ferent expression levels on two isoforms (proportion0.05–0.95) such that the total read number in all exonswas 300. We evaluated the proportion of genes detectedby CASI where the skipped exon was properly flagged asan AEE (sensitivity) and the proportion of genes detectedwhere only the skipped exon was predicted as an AEE(specificity). For different levels of noise, we performed500 simulations on 1000 genes.The simulations for POEM assumed a gene of 1200-bp
length. We varied the length of the skipped exon (120, 240and 360 bp), the exon inclusion rate (20 and 80%) and thegene expression level (100–600 reads) to assess theirimpact on the estimation error rate. Two thousand simu-lations were performed for each combination of theparameters. Box plots are drawn according to the follow-ing definition: the box describes 50% of the distribution,the line displays the median and whiskers display the 1.5interquartile range. Remaining outliers are shown as dots.
Simulations based on ENSEMBL transcripts
We performed a study on the database of annotated tran-scripts (see below) to monitor the error on proportionestimation with POEM as a function of gene expression.
PAGE 3 OF 15 Nucleic Acids Research, 2010, Vol. 38, No. 10 e112
The number of expressed isoforms was fixed to two, andthe relative proportions were incremented in steps of equalsize from 16.7% to 83.3% (10 000 runs for each combina-tion). The sampling of the transcripts was done hierarchi-cally. First, a gene was chosen uniformly among all genesannotated with more than two isoforms in ENSEMBL.Then, two transcripts were uniformly sampled amongthe annotated isoforms of the gene.
A bootstrap procedure for robustness assessment
Local nonhomogeneity of the read distribution along atranscript could lead to false positive predictions.Possible sources for an uneven read distribution along atranscript are preferred break points of the RNA frag-ments in the sample preparation step or a highersequencing efficiency for short cDNA fragments withcertain sequence characteristics (25,36). We ruled outthat such unevenness affects our predictions by perform-ing a bootstrap procedure for each gene.For each bootstrap sample (total of 500), each exon of a
given gene was randomly picked, with a probability of 0.25,and shortened on one end by 5, 10, 15 and 20%. Only exonswith more than 80 unique positions were shortened. Theread count and the number of possible unique positionswere recomputed for each shortened exon and treated asa new transcript annotation set. The prediction wasrepeated on every new transcript annotation set.
Transcript and AEEs database construction
Annotation of transcript structures for POEM (i.e. theindicator matrix I) was deduced from ENSEMBL,version 46. To allow description of any possible isoform(for instance, alternative donor and alternative acceptorsites), exons overlapping with different boundaries acrossisoforms were further subdivided. Redundant transcriptswere filtered out. Two transcripts were recursively clus-tered when the sequence identity, relative to the meanlength of both transcripts, was at least 95%. A represen-tative of each cluster was chosen by taking the union ofthe corresponding rows in I. The number of genes withidentifiable transcripts was counted by computing therank of the indicator matrix (qr function in R).The annotation of exon boundaries for CASI and
DASI, including the counting of nonunique positionsand treatment of overlapping genes, was done asreported previously (27).The set of genes with APSs was derived from EST data
taken from the GeneNest database (37) and wasindependently screened for putative polyadenylationsignals (AAUAAA and AUUAAA). To generate ahigh-confidence set, only EST sequences annotated as30-ends and aligned in the appropriate orientation wereselected. A reliable polyadenylation signal was definedwhen at least two ESTs carried a putative polyadenylationsignal within their 30-terminus (less than 35 bp) at the sameposition in the cDNA consensus sequence. Signals notsupported by the respective genomic sequence wererejected.The set of genes with alternative TSSs was derived from
EST consensus sequences that were mapped to the human
genome. For each ENSEMBL gene, only consensussequences covering at least two exons and with an exonboundary quality �50 (11) were selected. The 50-termini ofmutually exclusive first exons of these consensus sequenceswere defined as putative TSS.
Read alignment and splice junction annotation
Read sequences of length 27 bp were retrieved from theGene Expression Omnibus database (GSE11892) andaligned against HG18 with Eland from the Illuminacompany allowing up to two substitution errors for amatch. Only unique read matches were retained.Transcript annotation was based on all transcripts inENSEMBL version 46. Splice junction annotation wasderived by mapping reads as set of synthetical splice junc-tions that were generated for all possible exon–exon junc-tions for annotated exons of one gene [similar to (27)].AEEs identified by splice junctions were defined asfollows: each splice junction with a minimum support ofthree reads was recorded and an exon that was span bymore than one such splice junction was flagged as an AEE.
POEM validation
Reads mapping to splice junctions were used to directlyquantify AEEs by computing the proportion of readsmapping to the constitutive junction. We averaged theproportions deduced from both splice junction readcounts identifying the same AEE. An illustrativeexample is shown in Figure 4, where the inclusion rateof exon 5 (0.84) was calculated as the average of (i)counts on junctions 4–5 and 4–6 [8 / (8+2)=0.8] and(ii) counts on junctions 5–6 and 4–6 [14 / (14+2)=0.87].
For qPCR and POEM data comparison, POEM esti-mates were derived for the skipped and constitutive formsonly, irrespective of other transcripts annotated inENSEMBL.
Sample preparation
The same source of total RNA from HEK and B cells wasisolated as described by Sultan et al. (27) and was used forqPCR (DASI and POEM) experiments; the same sourceof material and one biological replicate was used for exonarray hybridization experiments; an independent source oftotal RNA from HEK and B cell was used for ReverseTranscriptase Polymerase Chain Reaction (RT-PCR)experiments (CASI).
RT
Reverse transcription was carried out using standard con-ditions. In brief, 1 mg of DNase-treated total RNA samplewas reverse-transcribed into first-strand cDNA usingrandom hexamers and SuperscriptII reverse transcriptase(Invitrogen) and subsequently diluted with nuclease-freewater (Promega) to 12.5 ng/ml equivalent total RNA.
PCR
Amplification parameters were as follows and wereadjusted according to the expected length of theproducts and to the Tm of the primers: 95�C for 10min;
e112 Nucleic Acids Research, 2010, Vol. 38, No. 10 PAGE 4 OF 15

35–50 cycles of 95�C for 45 s; 58–60�C for 30 s; and 72�Cfor 30–120 s, followed by extension at 72�C for 5min.Reaction products were analysed by agarose gelelectrophoresis.
Quantitative PCR
Reactions were performed using the ABI Prism 7900HTSequence Detection System (PE Applied Biosystems) with10 ml reaction composed of 1/10 volume of the cDNAs(prepared as described above), 300 nM primers andSYBR Green PCR Master Mix, containing SYBRGreen I Dye, AmpliTaq Gold DNA Polymerase, dNTPswith dUTP, passive reference and optimized buffercomponents (Applied Biosystems). Cycling conditionswere 50�C for 2min, 95�C for 10min followed by 40cycles of 94�C for 15 s and 60�C for 1min. Specificity ofPCR amplification was verified by analysis of the meltingcurve and subsequent electrophoresis on 4%NuSieve:agarose (3:1) gel. Negative controls producednegligible signal detection (38–40 Ct). All reactions wereperformed in triplicates on 96-well plates. Amplificationplots and predicted threshold cycle (Ct) values wereobtained with the Sequence Detector Software (SDSversion 2.0, PE Applied Biosystems). Further calculationsand graphical representations were done using Excel 2004and R. A common threshold value was chosen for allgenes and the baseline was set manually for individualgenes. The relative expression calculation method relieson the principle of the comparative Ct method(User Bulletin #2; Applied Biosystems). Ct values werefirst normalized (�Ct) to the housekeeping genes(GAPDH) and converted to a relative expressionquantity (NE) using the formula NE=2��Ct. A givenS1/S2 ratio was calculated by dividing their respectiveNE values.
Primer design for selected genes
All AEEs for CASI (61) were randomly selected amongall events annotated as internal exons with no overlappingannotation for multiple exon skipping. We further selected16 AEEs out of the highest scoring DASI genes (220),from which we tested the exons exhibiting the maximalabsolute DASI. Overall, the major selection criterion forall PCR-based validations was to facilitate the RT-PCRand qPCR primer design and experiments. The ampliconsfor the selected AEEs had to be approximately 150 bp longand the candidate exon and its flanking exons should notcontribute to another splicing event. In other words, wedid not cherry-pick the AEEs in order to achieve highvalidation rates. All primers were designed using thecommand line version of Genome PRIDE (38), andamplicons were 150 bp long. The forward primers wereplaced on the alternative exon junctions (S1 and S2primers), and a single reverse primer was placed in therespective flanking exon (R1 primers) (SupplementaryFigure S13). Junction primers were positioned on thejunction with a minor 30-overlap (3 bp) to ensure amplifi-cation specificity. S1 and S2 designs were used forRT-PCR and qPCR. For 23 CASI cases, S3 primerswere placed in the constitutive, flanking exons and used
only for RT-PCR validation. Primer sequences areavailable in Supplementary Tables S2, S5 and S7.
Exon array analysis
cDNA labelling and microarray hybridization were per-formed as described in GeneChip� Whole Transcript(WT) Sense Target Labeling Assay Manual followingmanufacturer’s instructions (P/N 701880 Rev.4, www.affymetrix.com). All four probes were hybridized ontothe Human Exon 1.0 ST Array (Affymetrix), andmicroarrays were scanned with the GeneChip� Scanner3000 7G (Affymetrix). A model-based analysis for tilingarrays (39) was applied to perform the intrachip normal-ization, with the adjustment for exon arrays described byKapur et al. (40). Quantile normalization was then appliedbetween arrays (41) with Affy package in BioConductor(version 2.2) (R statistical environment, v.2.7.0) (42).Detection call p-values were computed for each probeset with a paired Wilcoxon signed rank test thatcompares probe intensity to control probes of similarGC content. More precisely, each probe is comparedwith the 75% quantile of the set of control probes withsimilar GC content. The detection call p-value of a probeset was calculated using the chip-wise pairing of probeintensities to control intensities. An exon or gene probeset was called present when the corresponding FDR cor-rected p-value was <5% as in Gardina et al. (20). Theprobe-to-exon and probe-to-gene assignment was doneusing a chip description file (HsEx10stv2_Hs_ENSE),based on Ensembl v.46, and provided as R package (43).Exon and gene expression were defined as the mean overprobe intensities for both replicates.The isoform predictions were computed with the
MIDAS algorithm of the Affymetrix ExAcT softwareversion 1.8.0 (44) on normalized values (see below).MIDAS proceeds in two steps (20,44): (i) attributing ap-value to each exon indicative of an expression changebetween the two conditions, and (ii) attributing a splicingindex (SI) to each exon measuring the amplitude of theseexpression changes. The p-values were subsequently cor-rected using the Benjamini–Hochberg procedure (34) andthe threshold set to 0.2. This threshold was chosen as onlyone gene was found with a corrected p-value <0.05. Thethreshold for the SI (|SI|� 0.5) was set as reportedpreviously (20). The following filters were furtherapplied: (i) the corresponding gene is expressed in bothconditions, (ii) gene expression is higher than the 50%quantile in both conditions and (iii) the exon is calledpresent in either one of the two conditions.
RESULTS
A general stochastic count model for transcriptomeanalysis
Transcriptome analysis by RNA-Seq allows the directdetection of both canonical exons as well as alternativeisoforms from sequence reads overlapping splice junctions(25,27,29). However, junction reads address mostlysplicing events involving internal exons and are inherentlyunder-represented in a typical dataset. To circumvent
PAGE 5 OF 15 Nucleic Acids Research, 2010, Vol. 38, No. 10 e112
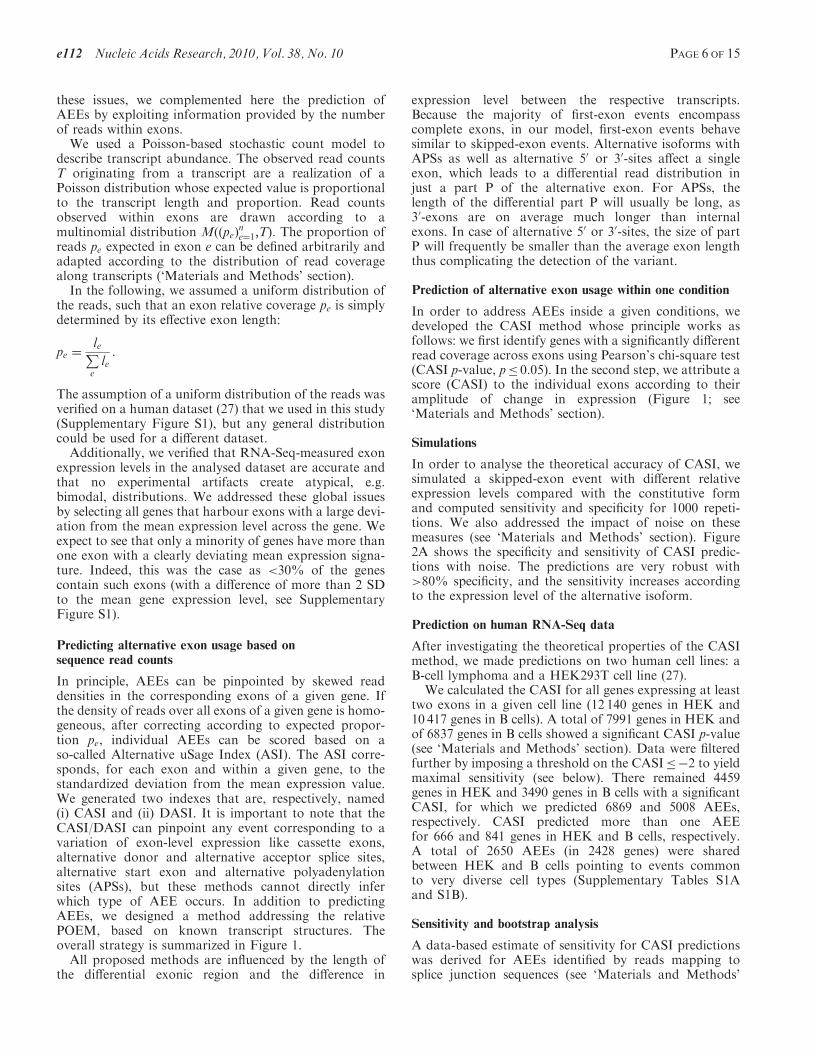
these issues, we complemented here the prediction ofAEEs by exploiting information provided by the numberof reads within exons.We used a Poisson-based stochastic count model to
describe transcript abundance. The observed read countsT originating from a transcript are a realization of aPoisson distribution whose expected value is proportionalto the transcript length and proportion. Read countsobserved within exons are drawn according to amultinomial distribution Mð peð Þ
ne¼1,TÞ. The proportion of
reads pe expected in exon e can be defined arbitrarily andadapted according to the distribution of read coveragealong transcripts (‘Materials and Methods’ section).In the following, we assumed a uniform distribution of
the reads, such that an exon relative coverage pe is simplydetermined by its effective exon length:
pe ¼lePele:
The assumption of a uniform distribution of the reads wasverified on a human dataset (27) that we used in this study(Supplementary Figure S1), but any general distributioncould be used for a different dataset.Additionally, we verified that RNA-Seq-measured exon
expression levels in the analysed dataset are accurate andthat no experimental artifacts create atypical, e.g.bimodal, distributions. We addressed these global issuesby selecting all genes that harbour exons with a large devi-ation from the mean expression level across the gene. Weexpect to see that only a minority of genes have more thanone exon with a clearly deviating mean expression signa-ture. Indeed, this was the case as <30% of the genescontain such exons (with a difference of more than 2 SDto the mean gene expression level, see SupplementaryFigure S1).
Predicting alternative exon usage based onsequence read counts
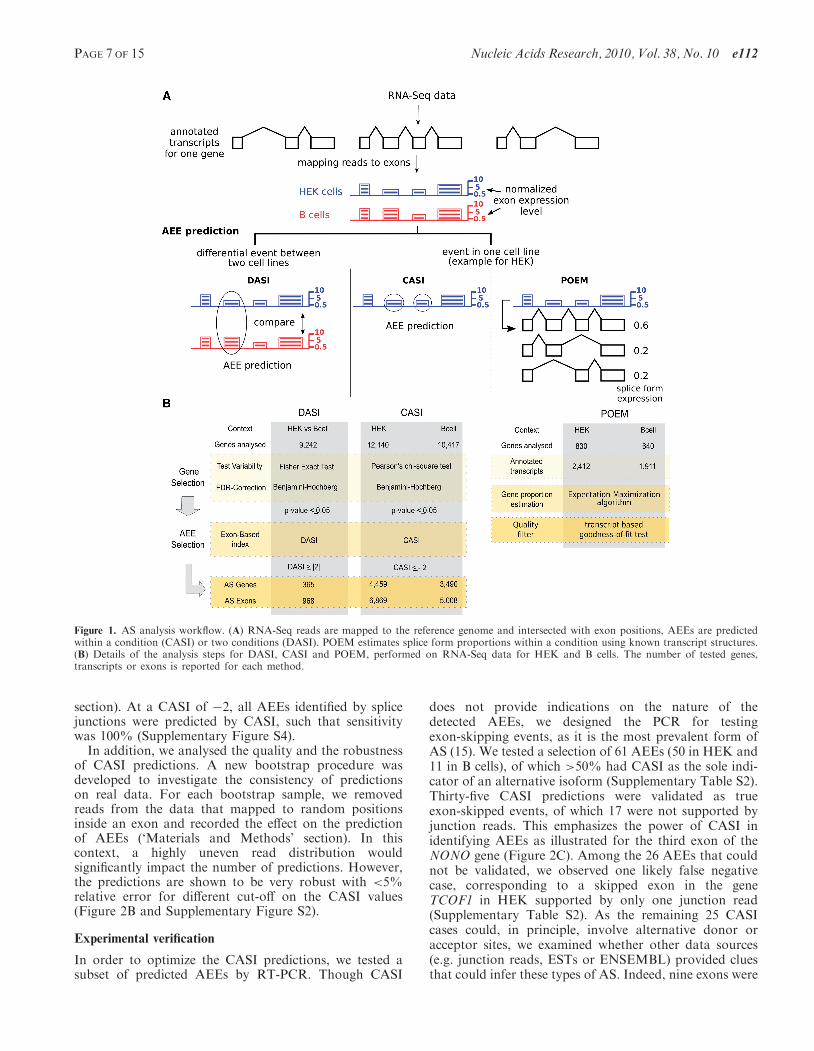
In principle, AEEs can be pinpointed by skewed readdensities in the corresponding exons of a given gene. Ifthe density of reads over all exons of a given gene is homo-geneous, after correcting according to expected propor-tion pe, individual AEEs can be scored based on aso-called Alternative uSage Index (ASI). The ASI corre-sponds, for each exon and within a given gene, to thestandardized deviation from the mean expression value.We generated two indexes that are, respectively, named(i) CASI and (ii) DASI. It is important to note that theCASI/DASI can pinpoint any event corresponding to avariation of exon-level expression like cassette exons,alternative donor and alternative acceptor splice sites,alternative start exon and alternative polyadenylationsites (APSs), but these methods cannot directly inferwhich type of AEE occurs. In addition to predictingAEEs, we designed a method addressing the relativePOEM, based on known transcript structures. Theoverall strategy is summarized in Figure 1.All proposed methods are influenced by the length of
the differential exonic region and the difference in
expression level between the respective transcripts.Because the majority of first-exon events encompasscomplete exons, in our model, first-exon events behavesimilar to skipped-exon events. Alternative isoforms withAPSs as well as alternative 50 or 30-sites affect a singleexon, which leads to a differential read distribution injust a part P of the alternative exon. For APSs, thelength of the differential part P will usually be long, as30-exons are on average much longer than internalexons. In case of alternative 50 or 30-sites, the size of partP will frequently be smaller than the average exon lengththus complicating the detection of the variant.
Prediction of alternative exon usage within one condition
In order to address AEEs inside a given conditions, wedeveloped the CASI method whose principle works asfollows: we first identify genes with a significantly differentread coverage across exons using Pearson’s chi-square test(CASI p-value, p 0.05). In the second step, we attribute ascore (CASI) to the individual exons according to theiramplitude of change in expression (Figure 1; see‘Materials and Methods’ section).
Simulations
In order to analyse the theoretical accuracy of CASI, wesimulated a skipped-exon event with different relativeexpression levels compared with the constitutive formand computed sensitivity and specificity for 1000 repeti-tions. We also addressed the impact of noise on thesemeasures (see ‘Materials and Methods’ section). Figure2A shows the specificity and sensitivity of CASI predic-tions with noise. The predictions are very robust with>80% specificity, and the sensitivity increases accordingto the expression level of the alternative isoform.
Prediction on human RNA-Seq data
After investigating the theoretical properties of the CASImethod, we made predictions on two human cell lines: aB-cell lymphoma and a HEK293T cell line (27).
We calculated the CASI for all genes expressing at leasttwo exons in a given cell line (12 140 genes in HEK and10 417 genes in B cells). A total of 7991 genes in HEK andof 6837 genes in B cells showed a significant CASI p-value(see ‘Materials and Methods’ section). Data were filteredfurther by imposing a threshold on the CASI�2 to yieldmaximal sensitivity (see below). There remained 4459genes in HEK and 3490 genes in B cells with a significantCASI, for which we predicted 6869 and 5008 AEEs,respectively. CASI predicted more than one AEEfor 666 and 841 genes in HEK and B cells, respectively.A total of 2650 AEEs (in 2428 genes) were sharedbetween HEK and B cells pointing to events commonto very diverse cell types (Supplementary Tables S1Aand S1B).
Sensitivity and bootstrap analysis
A data-based estimate of sensitivity for CASI predictionswas derived for AEEs identified by reads mapping tosplice junction sequences (see ‘Materials and Methods’
e112 Nucleic Acids Research, 2010, Vol. 38, No. 10 PAGE 6 OF 15
section). At a CASI of �2, all AEEs identified by splicejunctions were predicted by CASI, such that sensitivitywas 100% (Supplementary Figure S4).
In addition, we analysed the quality and the robustnessof CASI predictions. A new bootstrap procedure wasdeveloped to investigate the consistency of predictionson real data. For each bootstrap sample, we removedreads from the data that mapped to random positionsinside an exon and recorded the effect on the predictionof AEEs (‘Materials and Methods’ section). In thiscontext, a highly uneven read distribution wouldsignificantly impact the number of predictions. However,the predictions are shown to be very robust with <5%relative error for different cut-off on the CASI values(Figure 2B and Supplementary Figure S2).
Experimental verification
In order to optimize the CASI predictions, we tested asubset of predicted AEEs by RT-PCR. Though CASI
does not provide indications on the nature of thedetected AEEs, we designed the PCR for testingexon-skipping events, as it is the most prevalent form ofAS (15). We tested a selection of 61 AEEs (50 in HEK and11 in B cells), of which >50% had CASI as the sole indi-cator of an alternative isoform (Supplementary Table S2).Thirty-five CASI predictions were validated as trueexon-skipped events, of which 17 were not supported byjunction reads. This emphasizes the power of CASI inidentifying AEEs as illustrated for the third exon of theNONO gene (Figure 2C). Among the 26 AEEs that couldnot be validated, we observed one likely false negativecase, corresponding to a skipped exon in the geneTCOF1 in HEK supported by only one junction read(Supplementary Table S2). As the remaining 25 CASIcases could, in principle, involve alternative donor oracceptor sites, we examined whether other data sources(e.g. junction reads, ESTs or ENSEMBL) provided cluesthat could infer these types of AS. Indeed, nine exons were
Figure 1. AS analysis workflow. (A) RNA-Seq reads are mapped to the reference genome and intersected with exon positions, AEEs are predictedwithin a condition (CASI) or two conditions (DASI). POEM estimates splice form proportions within a condition using known transcript structures.(B) Details of the analysis steps for DASI, CASI and POEM, performed on RNA-Seq data for HEK and B cells. The number of tested genes,transcripts or exons is reported for each method.
PAGE 7 OF 15 Nucleic Acids Research, 2010, Vol. 38, No. 10 e112

annotated for another type of AEE in at least one source(Supplementary Table S2) among which four AEEs weredetected by junction reads, such as the usage of an alter-native acceptor site in the DUS1L gene (SupplementaryFigure S3). Based on these experimental verifications, thespecificity of the CASI was estimated to be close to 60%.Further, we estimated the predictive power of the
procedure by using the receiver operating characteristicanalysis, where each exon tested by RT-PCR (negativeor positive) was associated with its corresponding CASIvalue. Based on these PCR results, we obtained a
specificity of 89% and a sensitivity of 51% for the CASImethod (CASI�4), in line with the genome-wideestimate of sensitivity deduced by splice junction analysis(Supplementary Figure S4). The number of false positives(1� specificity) cannot be deduced from the mapping ofsplice junctions alone, due to the problem of non-uniquespliced alignment matches for short reads and the lowexpression of many alternative transcripts. However, thesimulation and bootstrapping results hint to the fact thatthe number of false positives is not much higher thanthe 11% observed in the PCR experiments on 61 AEEs.
Figure 2. (A) Sensitivity and specificity (y-axis) for CASI AEE prediction for different minor isoform proportions (x-axis) based on simulation byintroducing 20% noise (‘Materials and Methods’ section). (B) Robustness estimation for predictions on HEK data. The change in predicted numberof AEEs is shown relative to the total number of predictions for the whole dataset (y-axis) for 500 bootstrap samples using a CASI of �2. The x-axisshows the reduction in length that was introduced to an exon at random (p=0.25). (C) RT-PCR validation of a predicted AEE of NONO in HEKcells (CASI); it shows the observed exon–exon junction (blue arrows) and the corresponding number of reads (above the arrows) for all exons of thethree annotated isoforms (ENSEMBL v.46). S1 and S2 primers are placed on the splice junctions of the constitutive and the skipped forms,respectively (red dashed line) to uniquely amplify two different splice variants of NONO. R1 and S3 primers were designed inside surroundingexons. Exons not considered in CASI analysis are marked by an asterisk. (D) Agarose gels (1.5%) showing the RT-PCR amplification results ofS1-R1, S2-R1 and S3-R1 fragments. The observed sizes of the bands correspond to the expected sizes.
e112 Nucleic Acids Research, 2010, Vol. 38, No. 10 PAGE 8 OF 15
Given the conservative threshold of CASI�4, we pre-dicted 2499 AEEs in 2070 genes for HEK and to 1775AEEs in 1532 genes for B cells, respectively. Sevenhundred and twelve AEEs in 693 genes overlap betweenthe two cell lines.
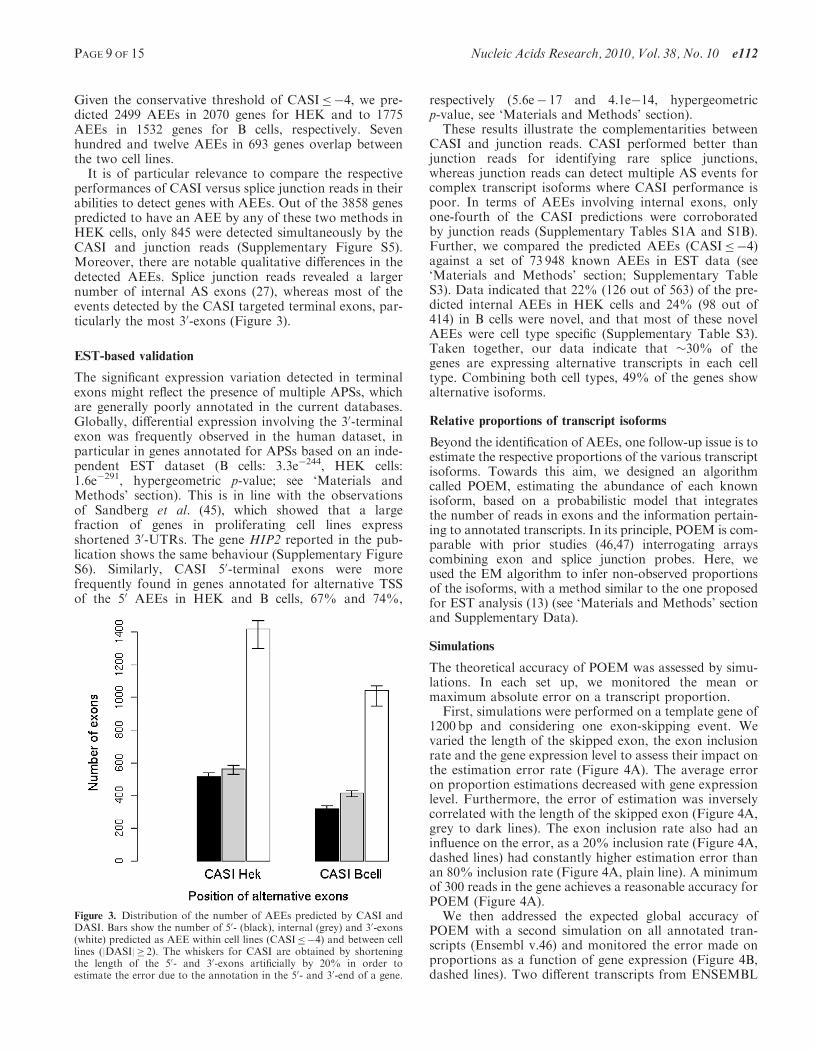
It is of particular relevance to compare the respectiveperformances of CASI versus splice junction reads in theirabilities to detect genes with AEEs. Out of the 3858 genespredicted to have an AEE by any of these two methods inHEK cells, only 845 were detected simultaneously by theCASI and junction reads (Supplementary Figure S5).Moreover, there are notable qualitative differences in thedetected AEEs. Splice junction reads revealed a largernumber of internal AS exons (27), whereas most of theevents detected by the CASI targeted terminal exons, par-ticularly the most 30-exons (Figure 3).
EST-based validation
The significant expression variation detected in terminalexons might reflect the presence of multiple APSs, whichare generally poorly annotated in the current databases.Globally, differential expression involving the 30-terminalexon was frequently observed in the human dataset, inparticular in genes annotated for APSs based on an inde-pendent EST dataset (B cells: 3.3e�244, HEK cells:1.6e�291, hypergeometric p-value; see ‘Materials andMethods’ section). This is in line with the observationsof Sandberg et al. (45), which showed that a largefraction of genes in proliferating cell lines expressshortened 30-UTRs. The gene HIP2 reported in the pub-lication shows the same behaviour (Supplementary FigureS6). Similarly, CASI 50-terminal exons were morefrequently found in genes annotated for alternative TSSof the 50 AEEs in HEK and B cells, 67% and 74%,
respectively (5.6e� 17 and 4.1e�14, hypergeometricp-value, see ‘Materials and Methods’ section).These results illustrate the complementarities between
CASI and junction reads. CASI performed better thanjunction reads for identifying rare splice junctions,whereas junction reads can detect multiple AS events forcomplex transcript isoforms where CASI performance ispoor. In terms of AEEs involving internal exons, onlyone-fourth of the CASI predictions were corroboratedby junction reads (Supplementary Tables S1A and S1B).Further, we compared the predicted AEEs (CASI�4)against a set of 73 948 known AEEs in EST data (see‘Materials and Methods’ section; Supplementary TableS3). Data indicated that 22% (126 out of 563) of the pre-dicted internal AEEs in HEK cells and 24% (98 out of414) in B cells were novel, and that most of these novelAEEs were cell type specific (Supplementary Table S3).Taken together, our data indicate that �30% of thegenes are expressing alternative transcripts in each celltype. Combining both cell types, 49% of the genes showalternative isoforms.
Relative proportions of transcript isoforms
Beyond the identification of AEEs, one follow-up issue is toestimate the respective proportions of the various transcriptisoforms. Towards this aim, we designed an algorithmcalled POEM, estimating the abundance of each knownisoform, based on a probabilistic model that integratesthe number of reads in exons and the information pertain-ing to annotated transcripts. In its principle, POEM is com-parable with prior studies (46,47) interrogating arrayscombining exon and splice junction probes. Here, weused the EM algorithm to infer non-observed proportionsof the isoforms, with a method similar to the one proposedfor EST analysis (13) (see ‘Materials and Methods’ sectionand Supplementary Data).
Simulations
The theoretical accuracy of POEM was assessed by simu-lations. In each set up, we monitored the mean ormaximum absolute error on a transcript proportion.First, simulations were performed on a template gene of
1200 bp and considering one exon-skipping event. Wevaried the length of the skipped exon, the exon inclusionrate and the gene expression level to assess their impact onthe estimation error rate (Figure 4A). The average erroron proportion estimations decreased with gene expressionlevel. Furthermore, the error of estimation was inverselycorrelated with the length of the skipped exon (Figure 4A,grey to dark lines). The exon inclusion rate also had aninfluence on the error, as a 20% inclusion rate (Figure 4A,dashed lines) had constantly higher estimation error thanan 80% inclusion rate (Figure 4A, plain line). A minimumof 300 reads in the gene achieves a reasonable accuracy forPOEM (Figure 4A).We then addressed the expected global accuracy of
POEM with a second simulation on all annotated tran-scripts (Ensembl v.46) and monitored the error made onproportions as a function of gene expression (Figure 4B,dashed lines). Two different transcripts from ENSEMBL
Figure 3. Distribution of the number of AEEs predicted by CASI andDASI. Bars show the number of 50- (black), internal (grey) and 30-exons(white) predicted as AEE within cell lines (CASI�4) and between celllines (|DASI|� 2). The whiskers for CASI are obtained by shorteningthe length of the 50- and 30-exons artificially by 20% in order toestimate the error due to the annotation in the 50- and 30-end of a gene.
PAGE 9 OF 15 Nucleic Acids Research, 2010, Vol. 38, No. 10 e112
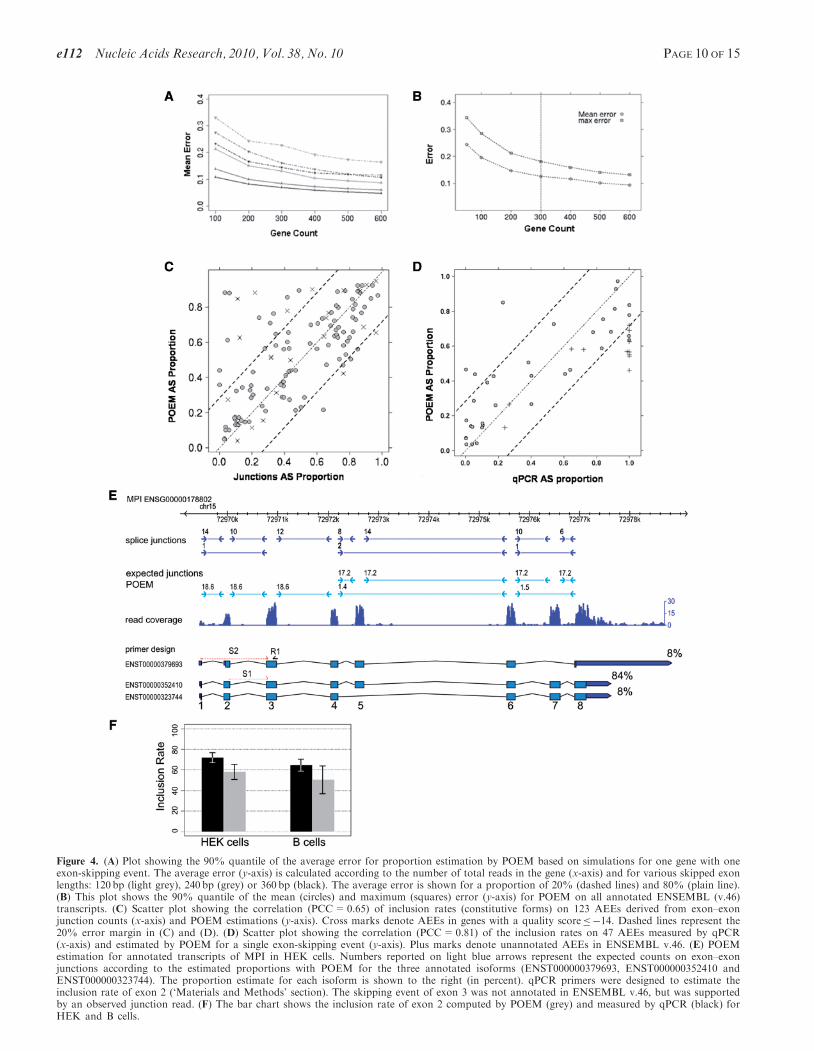
Figure 4. (A) Plot showing the 90% quantile of the average error for proportion estimation by POEM based on simulations for one gene with oneexon-skipping event. The average error (y-axis) is calculated according to the number of total reads in the gene (x-axis) and for various skipped exonlengths: 120 bp (light grey), 240 bp (grey) or 360 bp (black). The average error is shown for a proportion of 20% (dashed lines) and 80% (plain line).(B) This plot shows the 90% quantile of the mean (circles) and maximum (squares) error (y-axis) for POEM on all annotated ENSEMBL (v.46)transcripts. (C) Scatter plot showing the correlation (PCC=0.65) of inclusion rates (constitutive forms) on 123 AEEs derived from exon–exonjunction counts (x-axis) and POEM estimations (y-axis). Cross marks denote AEEs in genes with a quality score�14. Dashed lines represent the20% error margin in (C) and (D). (D) Scatter plot showing the correlation (PCC=0.81) of the inclusion rates on 47 AEEs measured by qPCR(x-axis) and estimated by POEM for a single exon-skipping event (y-axis). Plus marks denote unannotated AEEs in ENSEMBL v.46. (E) POEMestimation for annotated transcripts of MPI in HEK cells. Numbers reported on light blue arrows represent the expected counts on exon–exonjunctions according to the estimated proportions with POEM for the three annotated isoforms (ENST000000379693, ENST000000352410 andENST000000323744). The proportion estimate for each isoform is shown to the right (in percent). qPCR primers were designed to estimate theinclusion rate of exon 2 (‘Materials and Methods’ section). The skipping event of exon 3 was not annotated in ENSEMBL v.46, but was supportedby an observed junction read. (F) The bar chart shows the inclusion rate of exon 2 computed by POEM (grey) and measured by qPCR (black) forHEK and B cells.
e112 Nucleic Acids Research, 2010, Vol. 38, No. 10 PAGE 10 OF 15
were simulated to be expressed with different expressionlevels (‘Materials and Methods’ section). The 90%quantile of errors show that, with a minimum of 300reads within the gene (Figure 4B, vertical line), theaverage error is <12.6% (maximum error is <18.6%).
Application to human RNA-Seq data
Based on both simulations, we applied POEM to all geneswith at least 300 reads mapping inside the exons of thegene and annotated with at least two isoforms indicativeof AS in internal exons (‘Materials and Methods’ section).In this, we estimated the relative isoform proportions for830 and 640 genes in HEK and B cells, which wereannotated with 2412 and 1911 transcript variants, respec-tively. From this set, POEM estimated proportions for1920 and 1487 transcripts for HEK and B cells, respec-tively (Supplementary Table S4). We verified these estima-tions by (i) analysing the number of reads mapping toexon–exon junctions and (ii) experimental validationsusing qPCR. For instance, Figure 4E shows that the inclu-sion rate of exon 5 in the geneMPI could be deduced fromthe ratio of reads specifying the exon–exon junctions thatis 84% in this case (‘Materials and Methods’ section). Wecompared POEM predictions with the information
provided by junction reads for 267 constitutive AEEs(149 pairs in HEK and 118 pairs in B cells), showing atleast three exon–exon junction counts. On the whole,POEM agreed well with the estimates deduced fromjunction reads, with a correlation coefficient of 0.65 andan estimated proportion difference of <20% for 80% ofthe events (Figure 4C).
Experimental validation
The comparison of POEM estimates with qPCR measure-ments for a total of 47 AEEs in both cell lines (22exon-skipping events, two mutually exclusive events;‘Materials and Methods’ section) showed a high correla-tion (PCC=0.81, Figure 4D and Supplementary TableS5). The gene MPI is an illustrative example (Figure4E), which is also confirmed by junction reads. Preciseinference of a large difference in relative expressionlevels is hampered if one of the isoforms has a very lowexpression value. This is illustrated in Figure 4D, where 13events (with qPCR AS proportion close to 0% or 100%)display an expression level difference of 2–3 orders of mag-nitude between the constitutive and the skipped form(Supplementary Table S5).
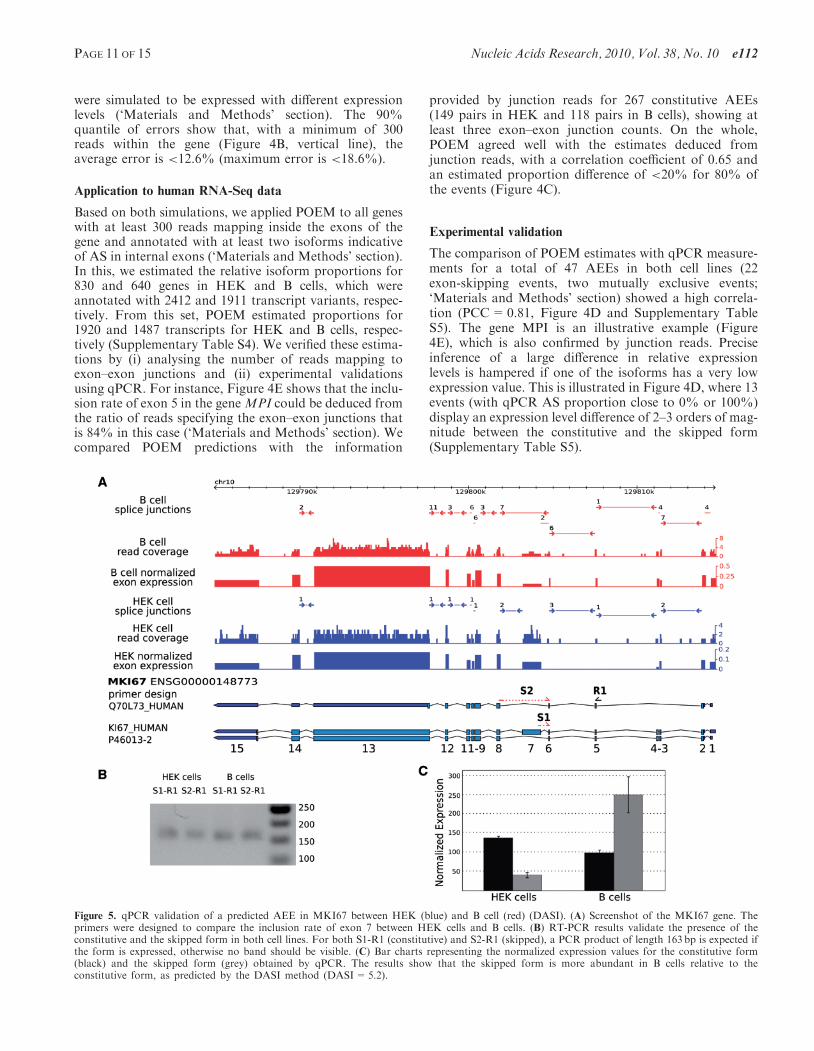
Figure 5. qPCR validation of a predicted AEE in MKI67 between HEK (blue) and B cell (red) (DASI). (A) Screenshot of the MKI67 gene. Theprimers were designed to compare the inclusion rate of exon 7 between HEK cells and B cells. (B) RT-PCR results validate the presence of theconstitutive and the skipped form in both cell lines. For both S1-R1 (constitutive) and S2-R1 (skipped), a PCR product of length 163 bp is expected ifthe form is expressed, otherwise no band should be visible. (C) Bar charts representing the normalized expression values for the constitutive form(black) and the skipped form (grey) obtained by qPCR. The results show that the skipped form is more abundant in B cells relative to theconstitutive form, as predicted by the DASI method (DASI=5.2).
PAGE 11 OF 15 Nucleic Acids Research, 2010, Vol. 38, No. 10 e112
It is worth mentioning that 38 out of the 47 tested AEEswere supported by junction reads. When we compared theestimated proportions derived from junction reads withthe estimates from qPCR for these 38 AEEs, the correla-tion was slightly lower (PCC=0.74). This is due to thepaucity of reads identifying junctions, reducing the signi-ficance of ratios associated with low read counts forestimating AEEs. Besides, with twice 8 million readssequenced, the junction reads depth is still far from satu-ration, so we expect to see at most 50% of the expectedjunctions. Therefore, exploiting the number of counts inexons offers complementary information in detecting andquantifying AEEs, in particular when the dataset does notreach saturation.
Analysis of differential isoform usage between twoconditions
In order to address AEEs differentiating between two con-ditions, e.g. control and disease sample, we developed theDASI method whose principle works as follows. Briefly,we first identify genes whose relative exon usage differssignificantly between two conditions using Fisher’s exacttest (DASI p-value, adjusted p 0.05). Secondly, the indi-vidual exons are scored (DASI) according to the ampli-tude of the detected differential expression (Figure 1;‘Materials and Methods’ section).
Application to human RNA-Seq data
We applied this procedure to the 9242 genes expressed inboth HEK and B cells (‘Materials and Methods’ section),leading to the identification of 613 genes with a significantDASI p-value (5%). After applying a filtering step(|DASI|� 2), we predicted that 968 exons (in 365 genes)were differentially used between the two cell types(Supplementary Table S6), from which the majority(78%) were internal exons. A total of 161 genes hadmore than one differential AEE between HEK and B cells.
Functional analysis
Analysis of the functional properties of these 365 genesshowed that DASI-predicted genes were enriched forfactors whose molecular functions are involved in transla-tion and RNA metabolic processes, nucleic acid transport,ribonucleoprotein complex biogenesis and assembly andtranscriptional regulation. Three transcription factors(MEF2B, MAZ and SMARCB1) were among the top 20genes showing the most significant DASI p-values. Thebest candidate, MEF2B, known to be involved in B-celldifferentiation (48) showed indeed an alternative TSS in Bcells (Supplementary Figure S7), suggesting the usage ofalternative promoters associated with its specific function.
Experimental verification
We validated a subset of 16 high-scoring DASI events byqPCR. Comparison of the expression ratios of the skippedversus constitutive exons between the two cell linesshowed that the DASI predictions and the qPCR resultswere concordant, with a validation rate of 69% (consid-ering a fold change of at least 1.5 for the qPCR)
(Supplementary Table S7). An illustrative example is theproliferation marker gene MKI67, which is universallyexpressed in proliferating cells but almost absent in quies-cent cells (49). The MKI67 mRNA that contains the largeexon 7 is equally abundant in B cells and HEK cells, butthe skipped form is more highly expressed in B cells thanin HEK cells (Figure 5).
Comparison with exon arrays
Previous attempts, to systematically decipher AEEsoccurring between different conditions or tissues, havemade use of exon arrays alone or in combination withsplice junction arrays (6,19,20,50). For comparativepurposes, we interrogated the human Affymetrix exonchips 1.0ST using the same source of material as well asone biological replicate (‘Materials and Methods’ section).For sake of simplicity, we focused the present analysis onthe probe sets corresponding to all exons annotated inENSEMBL (‘Materials and Methods’ section), i.e.149 079 exons in 16 527 genes. A total of 70 627 exons(9322 genes) in HEK cells and of 57 406 exons (7823genes) in B cells were found expressed by bothtechnologies. In terms of detected exons, there was agood agreement between arrays and RNA-Seq, where90% of the genes detected by exon chips were alsoscored by RNA-Seq. As previously reported (27),RNA-Seq is more sensitive than arrays, with 26 300 and23 866 additional exons detected in HEK and B cells, asbeing expressed solely by RNA-Seq.
A total of 51 302 exons (in 7210 genes) were detected byboth RNA-Seq and exon arrays in the two cell linessimultaneously, used as a framework for comparing thepower of the respective technologies in the detection of ASevents. We observed a good correlation (PCC=0.73;Supplementary Figure S8) between the log-ratio of expres-sion values for the exons expressed in both cell lines, withincreased correlation for higher expression.
For detecting differential AS with exon arrays, we usedthe standard MIDAS method (20,44) and analysed onlythe genes expressed above the 50% quantile of the expres-sion values in both cell lines (‘Materials and Methods’section). MIDAS proceeds in two steps, which aresimilar to the DASI. Comparison of the DASI resultswith MIDAS showed little agreement in the detection ofgenes with AEEs between HEK and B cells (10 genes with16 exons are in common, Supplementary Figure S9). Allgenes with predicted AEEs by DASI and MIDAS wereamong the most highly expressed ones in both cell lines.
In order to investigate the platform differences, wecalculated the quadratic mean distance for every gene,between RNA-Seq and exon arrays, over exon expressionlog-ratios (HEK versus B cells). The quadratic mean dis-tances associated with genes with AEEs predicted byeither DASI only, MIDAS only or by both methodssimultaneously did not show major differences(Supplementary Figure S10). The lack of agreementbetween the methods reflects the fact that the analysis ofalternative isoforms is very sensitive to subtle variations inexpression values that arise both at the individual exonand whole gene expression level. In this context, a
e112 Nucleic Acids Research, 2010, Vol. 38, No. 10 PAGE 12 OF 15

minimal variation of expression between exons is a pre-requisite for pinpointing variable exons with a reasonablespecificity. This problem appeared to be less prominentwith RNA-Seq, showing clearly a smaller variation ofexpression values across exons of a given gene(Supplementary Figure S11). The RCC1 gene, forexample, was detected by DASI and validated by qPCR,but not detected by MIDAS (Supplementary Fig. S12). Inthis case, the alternative exon was below the detectionthreshold on arrays. Only two of the eight DASI predic-tions verified by qPCR were also detected by MIDAS(genes MDC1 and MKI67).
DISCUSSION
Digital transcriptome analysis using next-generationsequencing opens up unprecedented possibilities for theanalysis of the dynamics of transcription and transcriptprocessing, in particular alternative isoforms expressedwithin a single tissue or differentially expressed betweentissues (or physiological conditions). We described here aset of methods that can infer AEEs from mRNAsequencing data using short-read sequencing technology.The proposed approach, combining hypothesis testing andEM estimation, was evaluated by RT-PCR-based experi-mental validations and by comparison with exon arraydata. As a prerequisite, the principle of the methodsassumes the distribution of reads across transcripts isknown. Whereas possible biases might affect the read dis-tribution (25,36), we showed that the reads were ratheruniformely distributed in internal exons in the analyseddataset. However, 50- and 30-terminal exons oftenshowed deviations mostly due to natural variationassociated with APS and alternative TSS. We ruled outthat biases not accounted in our model could significantlyaffect our results by applying a bootstrap procedure andshowed that >95% of the predictions remained stable. Analternative source for nonuniformity might be antisensetranscription in case of an RNA-Seq protocol withoutstrand information. While we have removed exonicregions where two genes overlap, still some antisense tran-scripts may not be represented in current gene annotation.Read counts of unannotated sense–antisense overlappingregions will, therefore, be increased artificially in thecurrent dataset. Further improvements in protocols forthe RNA-Seq library preparation will help to reduceread distribution biases (25) and to resolve strand-specificexpression (51).
For single genes, it is expected that the length of thevariable region between two isoforms will influence thedetection power of methods using read coverage(Simulations). For extreme cases affecting only a fewbases of one exon—like NAGNAG sites (15)—thosemethods are likely unable to detect these changes. Bydesign, CASI and DASI have certain biases in detectingsplice variants. While CASI requires in most cases theexistence of at least two transcripts for a gene, DASI isable to predict variations on single transcripts with onlyone transcript in each condition. In contrast to DASI,exons with low expression are not taken into account by
CASI to avoid, for instance, the influence of potentialannotation errors. Consequently, CASI predictions arebased on a smaller set of expressed internal exonscompared with DASI predictions.In their principle, the CASI/DASI strategies could be
paralleled with the type of analysis performed with exonchips. We showed that using digital information derivedfrom only �8 million reads sequenced in each condition,the prediction of AEEs differentiating HEK from B cellsexhibited higher sensitivity and specificity than estima-tions derived from exon chips. We demonstrated thatone of the major problems with arrays is that the largevariation of expression levels across exons of a given geneadversely affects the detection of AEEs. This problemadds up to the well-known array issues related to probedesign, cross-hybridization and detection of specificsignals for genes that are poorly expressed. Here, datashowed that only a small fraction of the qPCR-verifiedAEEs were detected by the exon array.Previous array-based predictions of AEEs reported a
specificity of 82–85% and a sensitivity of 49–53% (8,52).Here, given the actual dataset, CASI alone reached aspecificity of 89% and a sensitivity of 51%. However, aswe have shown here, the inventory of AEEs is drasticallyimproved after integration of splice junction reads. Giventhat our work was conducted with only �4 millions ofmapped reads per cell line and allowed to estimateAEEs with largely improved performances as comparedwith exon array-based analysis, there is no doubt that anexhaustive inventory of alternative transcript isoforms willbe made possible via RNA-Seq. Our data show that it isessential to merge information from junction reads andpredictions from CASI/DASI types of analysis. Whilehighly expressed genes are associated with a largenumber of reads directly identifying the different splicejunctions (and will therefore identify a larger set ofsplice junctions in these genes), moderately abundant tran-scripts will, in many cases, show a sufficient number ofexonic tags to allow the prediction of AEEs by CASI,but might not enable the identification of reads at splicejunctions. In general, the complexity of AEEs in a givengene might better be addressed by junction or paired-endreads, because for exons affected by multiple variations,the read distribution will be difficult to interpret.Our data could be exploited for the prediction of the
combinatorics of AEEs associated with the biology ofspecific cell types. Based on the composite analysis ofmany cell types, two recent RNA-Seq studies estimatedthat >92% of the human genes undergo AS (9,10). Inline with this observation, we show here that in only twocell types, 49% of the expressed genes exhibit alternativeisoforms. However, it remains to be understood if all theseAEEs are biologically relevant.In the quantitative estimation of isoform proportions
(POEM), we obtained a good correlation with qPCRand junction reads. Alternative strategies estimated AEEinclusion rates directly from the ratio of junction readcounts (9) or read counts from pooled junction and exonbody reads (10). These methods work well for genes withhigh coverage, but the EM-based procedure of POEM isalso more accurate for genes with a low coverage. A new
PAGE 13 OF 15 Nucleic Acids Research, 2010, Vol. 38, No. 10 e112
in silico study, using model assumptions similar to POEM,showed a lower but reasonable correlation ofRNA-Seq-deduced inclusion rates compared with inclu-sion rates estimated from microarray data (53). In itscurrent form, POEM relies on a given transcript annota-tion to estimate isoform proportions. We are currentlyinvestigating the inference of new transcript structuresand their relative proportions from RNA-Seq within thePOEM framework.Current advances in sequencing technologies are
leading to more and longer reads per experiment. Theresulting increase in sequence coverage will ease AEEdetection by direct observation. The general framework,provided herein, can be extended to more complex sce-narios integrating additional types of evidence, such assplice junction reads or paired-end reads. The strategywe propose will keep its discriminative power forlow-coverage studies, such as those obtained bymultiplexing different samples on the same sequencinglane.
SUPPLEMENTARY DATA
Supplementary Data are available at NAR Online.The Gene Expression Omnibus accession number for theexon array data is GSE13474.
ACKNOWLEDGEMENT
We thank K. Metz and K. Schmidt for technicalassistance.
FUNDING
Max Planck Society and the European Union[AnEUploidy (LSHG-CT-2006-037627)]. Funding foropen access charge: Max-Planck Society.
Conflict of interest statement. None declared.
REFERENCES
1. Brett,D., Pospisil,H., Valcarcel,J., Reich,J. and Bork,P. (2002)Alternative splicing and genome complexity. Nat. Genet., 30,29–30.
2. Maniatis,T. and Tasic,B. (2002) Alternative pre-mRNA splicingand proteome expansion in metazoans. Nature, 418, 236–243.
3. Davuluri,R.V., Suzuki,Y., Sugano,S., Plass,C. and Huang,T.H.(2008) The functional consequences of alternative promoter use inmammalian genomes. Trends Genet., 24, 167–177.
4. Zhang,H., Lee,J.Y. and Tian,B. (2005) Biased alternativepolyadenylation in human tissues. Genome Biol., 6, R100.
5. Cork,D., Lennard,T. and Tyson-Capper,A. (2008) Alternativesplicing and the progesterone receptor in breast cancer. BreastCancer Res., 10, 207.
6. French,P.J., Peeters,J., Horsman,S., Duijm,E., Siccama,I., van denBent,M.J., Luider,T.M., Kros,J.M., van der Spek,P. andSmitt,P.A.S. (2007) Identification of differentially regulated splicevariants and novel exons in glial brain tumors using exonexpression arrays. Cancer Res., 67, 5635–5642.
7. Klinck,R., Bramard,A., Inkel,L., Dufresne-Martin,G.,Gervais-Bird,J., Madden,R., Paquet,E.R., Koh,C., Venables,J.P.,Prinos,P. et al. (2008) Multiple alternative splicing markers forovarian cancer. Cancer Res., 68, 657–663.
8. Johnson,J.M., Castle,J., Garrett-Engele,P., Kan,Z., Loerch,P.M.,Armour,C.D., Santos,R., Schadt,E.E., Stoughton,R. andShoemaker,D.D. (2003) Genome-wide survey of humanalternative pre-mRNA splicing with exon junction microarrays.Science, 302, 2141–2144.
9. Pan,Q., Shai,O., Lee,L.J., Frey,B.J. and Blencowe,B.J. (2008)Deep surveying of alternative splicing complexity in the humantranscriptome by high-throughput sequencing. Nat. Genet., 40,1413–1415.
10. Wang,E.T., Sandberg,R., Luo,S., Khrebtukova,I., Zhang,L.,Mayr,C., Kingsmore,S.F., Schroth,G.P. and Burge,C.B. (2008)Alternative isoform regulation in human tissue transcriptomes.Nature, 456, 470–476.
11. Gupta,S., Zink,D., Korn,B., Vingron,M. and Haas,S.A. (2004)Genome wide identification and classification of alternativesplicing based on EST data. Bioinformatics, 20, 2579–2585.
12. Lee,C. and Wang,Q. (2005) Bioinformatics analysis of alternativesplicing. Brief. Bioinform., 6, 23–33.
13. Xing,Y., Yu,T., Wu,Y.N., Roy,M., Kim,J. and Lee,C. (2006) Anexpectation-maximization algorithm for probabilisticreconstructions of full-length isoforms from splice graphs. NucleicAcids Res., 34, 3150–3160.
14. Lee,C. and Roy,M. (2004) Analysis of alternative splicing withmicroarrays: successes and challenges. Genome Biol., 5, 231.
15. Blencowe,B.J. (2006) Alternative splicing: new insights fromglobal analyses. Cell, 126, 37–47.
16. Clark,T.A., Sugnet,C.W. and Ares,M. (2002) Genomewideanalysis of mRNA processing in yeast using splicing-specificmicroarrays. Science, 296, 907–910.
17. Le,K., Mitsouras,K., Roy,M., Wang,Q., Xu,Q., Nelson,S.F. andLee,C. (2004) Detecting tissue-specific regulation of alternativesplicing as a qualitative change in microarray data. Nucleic AcidsRes., 32, e180.
18. Pan,Q., Shai,O., Misquitta,C., Zhang,W., Saltzman,A.L.,Mohammad,N., Babak,T., Siu,H., Hughes,T.R., Morris,Q.D.et al. (2004) Revealing global regulatory features of mammalianalternative splicing using a quantitative microarray platform.Mol. Cell, 16, 929–941.
19. Clark,T.A., Schweitzer,A.C., Chen,T.X., Staples,M.K., Lu,G.,Wang,H., Williams,A. and Blume,J.E. (2007) Discovery oftissue-specific exons using comprehensive human exonmicroarrays. Genome Biol., 8, R64.
20. Gardina,P.J., Clark,T.A., Shimada,B., Staples,M.K., Yang,Q.,Veitch,J., Schweitzer,A., Awad,T., Sugnet,C., Dee,S. et al. (2006)Alternative splicing and differential gene expression in coloncancer detected by a whole genome exon array. BMC Genomics,7, 325.
21. Purdom,E., Simpson,K.M., Robinson,M.D., Conboy,J.G.,Lapuk,A.V. and Speed,T.P. (2008) FIRMA: a method fordetection of alternative splicing from exon array data.Bioinformatics., 24, 1707–1714.
22. Xing,Y., Stoilov,P., Kapur,K., Han,A., Jiang,H., Shen,S.,Black,D.L. and Wong,W.H. (2008) MADS: a new and improvedmethod for analysis of differential alternative splicing byexon-tiling microarrays. RNA., 14, 1470–1479.
23. Lister,R., O’Malley,R.C., Tonti-Filippini,J., Gregory,B.D.,Berry,C.C., Millar,A.H. and Ecker,J.R. (2008) Highly integratedsingle-base resolution maps of the epigenome in Arabidopsis.Cell, 133, 523–536.
24. Marioni,J., Mason,C., Mane,S., Stephens,M. and Gilad,Y. (2008)RNA-seq: an assessment of technical reproducibility andcomparison with gene expression arrays. Genome Res., 18,1509–1517.
25. Mortazavi,A., Williams,B.A., McCue,K., Schaeffer,L. andWold,B. (2008) Mapping and quantifying mammaliantranscriptomes by RNA-Seq. Nat. Methods, 5, 621–628.
26. Nagalakshmi,U., Wang,Z., Waern,K., Shou,C., Raha,D.,Gerstein,M. and Snyder,M. (2008) The transcriptional landscapeof the yeast genome defined by RNA sequencing. Science, 320,1344–1349.
27. Sultan,M., Schulz,M.H., Richard,H., Magen,A., Klingenhoff,A.,Scherf,M., Seifert,M., Borodina,T., Soldatov,A., Parkhomchuk,D.et al. (2008) A global view of gene activity and alternative
e112 Nucleic Acids Research, 2010, Vol. 38, No. 10 PAGE 14 OF 15
splicing by deep sequencing of the human transcriptome. Science,321, 956–960.
28. Wilhelm,B.T., Marguerat,S., Watt,S., Schubert,F., Wood,V.,Goodhead,I., Penkett,C.J., Rogers,J. and Bahler,J. (2008)Dynamic repertoire of a eukaryotic transcriptome surveyed atsingle-nucleotide resolution. Nature, 453, 1239–1243.
29. Cloonan,N., Forrest,A.R.R., Kolle,G., Gardiner,B.B.A.,Faulkner,G.J., Brown,M.K., Taylor,D.F., Steptoe,A.L., Wani,S.,Bethel,G. et al. (2008) Stem cell transcriptome profiling viamassive-scale mRNA sequencing. Nat. Methods, 5, 613–619.
30. Li,H., Lovci,M.T., Kwon,Y.S., Rosenfeld,M.G., Fu,X.D. andYeo,G.W. (2008) Determination of tag density required for digitaltranscriptome analysis: application to an androgen-sensitiveprostate cancer model. Proc. Natl Acad. Sci. USA, 105,20179–20184.
31. Cameron,A.C. and Trivedi,P.K. (1998) Regression Analysis ofCount Data. Cambridge University Press, USA.
32. Audic,S. and Claverie,J.M. (1997) The significance of digital geneexpression profiles. Genome Res., 7, 986–995.
33. Beissbarth,T., Hyde,L., Smyth,G.K., Job,C., Boon,W.M.,Tan,S.S., Scott,H.S. and Speed,T.P. (2004) Statistical modeling ofsequencing errors in SAGE libraries. Bioinformatics, 20(Suppl. 1),i31–i39.
34. Benjamini,Y. and Hochberg,Y. (1995) Controlling the falsediscovery rate: a practical and powerful approach to multipletesting. J. R. Statist. Soc. B, 57, 289–300.
35. Lacroix,V., Sammeth,M., Guigo,R. and Bergeron,A. (2008)Algorithms in Bioinformatics, Vol. 5251. Springer,Berlin/Heidelberg, pp. 50–63.
36. Dohm,J.C., Lottaz,C., Borodina,T. and Himmelbauer,H. (2008)Substantial biases in ultra-short read data sets fromhigh-throughput DNA sequencing. Nucleic Acids Res., 36, e105.
37. Haas,S.A., Beissbarth,T., Rivals,E., Krause,A. and Vingron,M.(2000) GeneNest: automated generation and visualization of geneindices. Trends Genet., 16, 521–523.
38. Haas,S.A., Hild,M., Wright,A.P., Hain,T., Talibi,D. andVingron,M. (2003) Genome-scale design of PCR primers and longoligomers for DNA microarrays. Nucleic Acids Res., 31,5576–5581.
39. Johnson,W.E., Li,W., Meyer,C.A., Gottardo,R., Carroll,J.S.,Brown,M. and Liu,X.S. (2006) Model-based analysis oftiling-arrays for ChIP-chip. Proc. Natl Acad. Sci. USA, 103,12457–12462.
40. Kapur,K., Xing,Y., Ouyang,Z. and Wong,W.H. (2007) Exonarrays provide accurate assessments of gene expression.Genome Biol., 8, R82.
41. Irizarry,R.A., Hobbs,B., Collin,F., Beazer-Barclay,Y.D.,Antonellis,K.J., Scherf,U. and Speed,T.P. (2003) Exploration,normalization, and summaries of high density oligonucleotidearray probe level data. Biostatistics, 4, 249–264.
42. Gentleman,R.C., Carey,V.J., Bates,D.M., Bolstad,B., Dettling,M.,Dudoit,S., Ellis,B., Gautier,L., Ge,Y., Gentry,J. et al. (2004)Bioconductor: open software development for computationalbiology and bioinformatics. Genome Biol., 5, R80.
43. Dai,M., Wang,P., Boyd,A.D., Kostov,G., Athey,B., Jones,E.G.,Bunney,W.E., Myers,R.M., Speed,T.P., Akil,H. et al. (2005)Evolving gene/transcript definitions significantly alter theinterpretation of GeneChip data. Nucleic Acids Res., 33, e175.
44. Affymetrix. (2005) Affymetrix White Papers:Alternative TranscriptAnalysis Methods for Exon Arrays v1.1 http://www.affymetrix.com/support/technical/whitepapers/exon_alt_transcript_analysis_whitepaper.pdf (24 June 2009, date last accessed).
45. Sandberg,R., Neilson,J.R., Sarma,A., Sharp,P.A. and Burge,C.B.(2008) Proliferating cells express mRNAs with shortened 30
untranslated regions and fewer microRNA target sites. Science,320, 1643–1647.
46. Anton,M., Gorostiaga,D., Guruceaga,E., Segura,V.,Carmona-Saez,P., Pascual-Montano,A., Pio,R., Montuenga,L. andRubio,A. (2008) SPACE: an algorithm to predict and quantifyalternatively spliced isoforms using microarrays. Genome Biol., 9,R46.
47. Wang,H., Hubbell,E., Hu,J.-S., Mei,G., Cline,M., Lu,G.,Clark,T., Siani-Rose,M.A., Ares,M., Kulp,D.C. et al. (2003)Gene structure-based splice variant deconvolution using amicroarray platform. Bioinformatics, 19(Suppl. 1), i315–i322.
48. Swanson,B.J., Jack,H.M. and Lyons,G.E. (1998) Characterizationof myocyte enhancer factor 2 (MEF2) expression in B and Tcells: MEF2C is a B cell-restricted transcription factor inlymphocytes. Mol. Immunol., 35, 445–458.
49. Urruticoechea,A., Smith,I.E. and Dowsett,M. (2005) Proliferationmarker Ki-67 in early breast cancer. J. Clin. Oncol., 23,7212–7220.
50. Das,D., Clark,T.A., Schweitzer,A., Yamamoto,M., Marr,H.,Arribere,J., Minovitsky,S., Poliakov,A., Dubchak,I., Blume,J.E.et al. (2007) A correlation with exon expression approach toidentify cis-regulatory elements for tissue-specific alternativesplicing. Nucleic Acids Res., 35, 4845–4857.
51. Parkhomchuk,D., Borodina,T., Amstislavskiy,V., Banaru,M.,Hallen,L., Krobitsch,S., Lehrach,H. and Soldatov,A. (2009)Transcriptome analysis by strand-specific sequencing ofcomplementary DNA. Nucleic Acids Res., 37, e123.
52. Sugnet,C.W., Srinivasan,K., Clark,T.A., O’Brien,G., Cline,M.S.,Wang,H., Williams,A., Kulp,D., Blume,J.E., Haussler,D. et al.(2006) Unusual intron conservation near tissue-regulated exonsfound by splicing microarrays. PLoS Comput Biol., 2, e4.
53. Jiang,H. and Wong,W.H. (2009) Statistical inferences for isoformexpression in RNA-Seq. Bioinformatics, 25, 1026–1032.
PAGE 15 OF 15 Nucleic Acids Research, 2010, Vol. 38, No. 10 e112