Embed Size (px)
Citation preview
Postgraduate Certificate in StatisticsDesign and Analysis of Experiments
Lecturer: Dr. Michael Stuart,
Department of Statistics
email:[email protected]
Lectures: Tuesday, Thursday, 6.00 - 8.00pm
Laboratory: Thursday, March 12th, 6.00 - 8.00pm
Tuesday, March 31st, 6.00 - 8.00pmPostgraduate Certificate in Statistics Design and Analysis of Experiments
Lecture 1.1 1© 2015 Michael Stuart
Design and Analysis of ExperimentsCourse Outline
• The need for experiments
– experimental and observational studies
– cause and effect
– control
Postgraduate Certificate in Statistics Design and Analysis of Experiments
Lecture 1.1 2© 2015 Michael Stuart
Design and Analysis of ExperimentsCourse Outline
• Basic design principles for experiments
– Control
– Blocking (pairing)
– Randomization
– Replication
– Factorial structure
Postgraduate Certificate in Statistics Design and Analysis of Experiments
Lecture 1.1 3© 2015 Michael Stuart
Design and Analysis of ExperimentsCourse Outline
• Standard designs
– Completely randomized designs
– Randomized blocks
– Two-level factors
– Split units
Postgraduate Certificate in Statistics Design and Analysis of Experiments
Lecture 1.1 4© 2015 Michael Stuart
Design and Analysis of ExperimentsCourse Outline
• Analysis of experimental data
– Exploratory data analysis
– Effect estimation and significance testing
– Analysis of variance
– Statistical models, fixed and random effects
– Model validation, diagnostics
– Software laboratories
Postgraduate Certificate in Statistics Design and Analysis of Experiments
Lecture 1.1 5© 2015 Michael Stuart
Design and Analysis of ExperimentsReferences
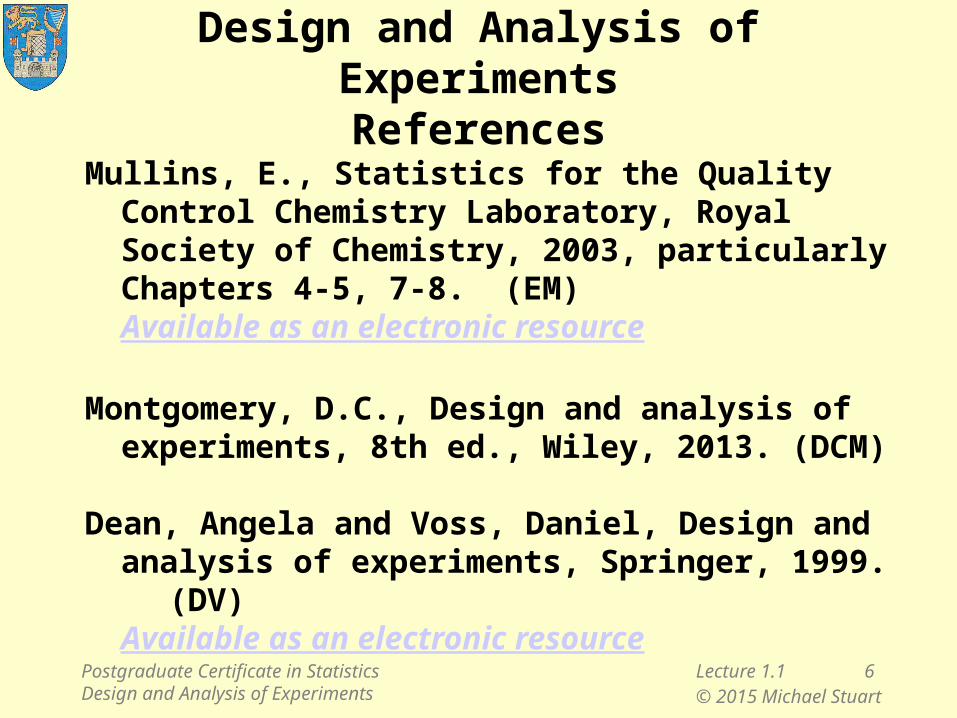
Mullins, E., Statistics for the Quality Control Chemistry Laboratory, Royal Society of Chemistry, 2003, particularly Chapters 4-5, 7-8. (EM)Available as an electronic resource
Montgomery, D.C., Design and analysis of experiments, 8th ed., Wiley, 2013. (DCM)
Dean, Angela and Voss, Daniel, Design and analysis of experiments, Springer, 1999. (DV)Available as an electronic resource
Postgraduate Certificate in Statistics Design and Analysis of Experiments
Lecture 1.1 6© 2015 Michael Stuart
Design and Analysis of ExperimentsFurther reading
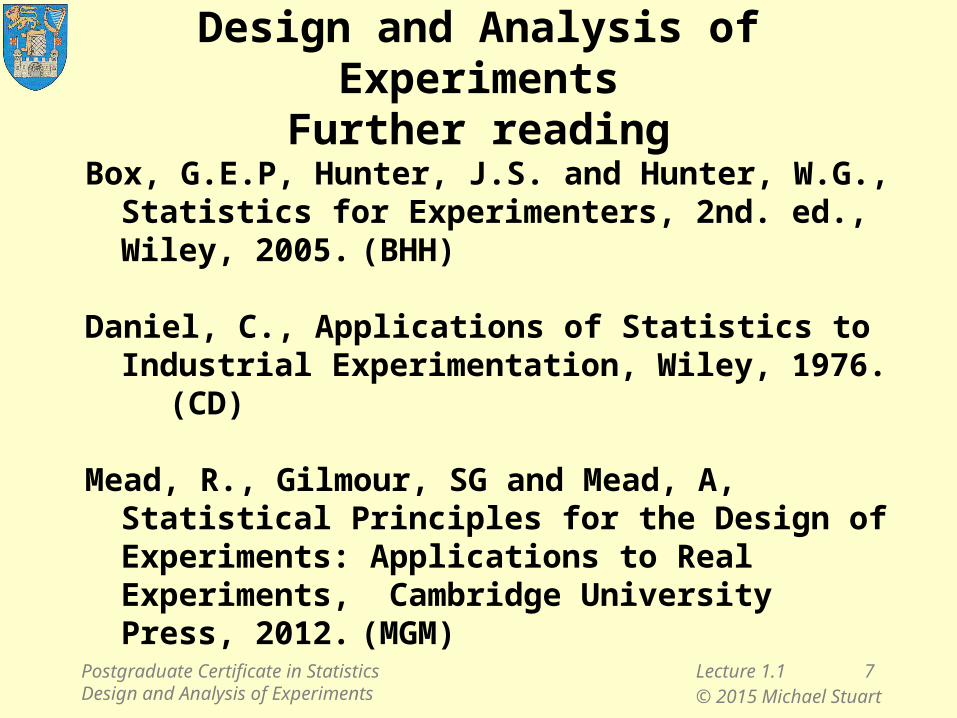
Box, G.E.P, Hunter, J.S. and Hunter, W.G., Statistics for Experimenters, 2nd. ed., Wiley, 2005. (BHH)
Daniel, C., Applications of Statistics to Industrial Experimentation, Wiley, 1976. (CD)
Mead, R., Gilmour, SG and Mead, A, Statistical Principles for the Design of Experiments: Applications to Real Experiments, Cambridge University Press, 2012. (MGM)
Postgraduate Certificate in Statistics Design and Analysis of Experiments
Lecture 1.1 7© 2015 Michael Stuart
Design and Analysis of ExperimentsLecture notes and supplements
Module Web Page
Postgraduate Certificate in Statistics Design and Analysis of Experiments
Lecture 1.1 8© 2015 Michael Stuart
Assessment
• 3-hour written examination
– 3 questions. Questions 1 and 2 carry 30 marks each, Question 3 carries 40 marks.
– Appendix gives tables of critical values of the t‑distribution and selected critical values of the F distribution.
– Non-programmable calculators are permitted for this examination
Postgraduate Certificate in Statistics Design and Analysis of Experiments
Lecture 1.1 9© 2015 Michael Stuart
Assessment
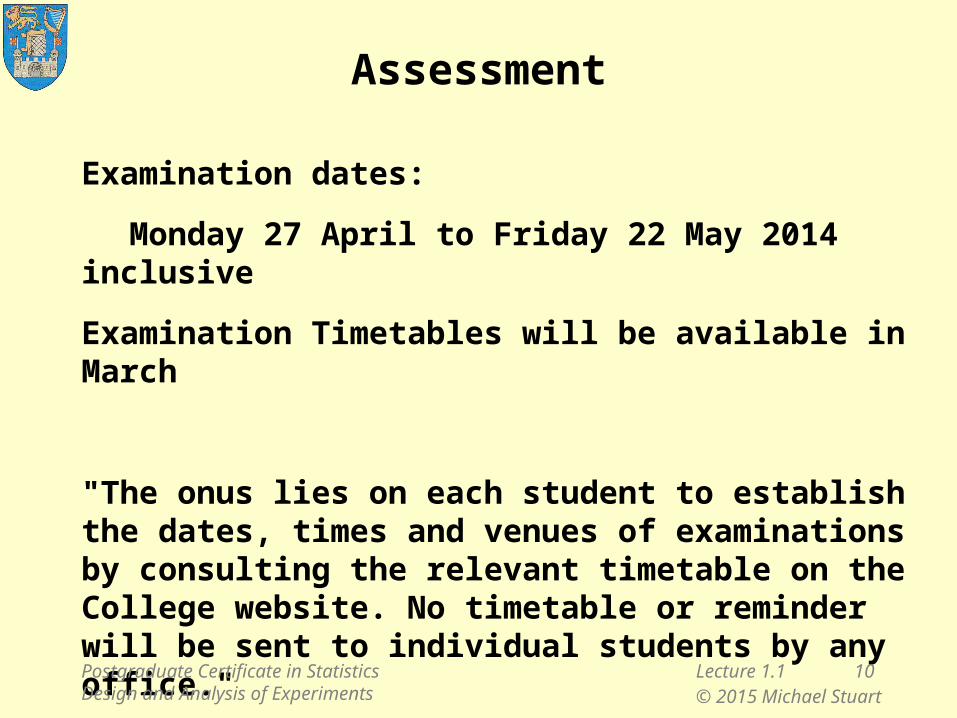
Examination dates:
Monday 27 April to Friday 22 May 2014 inclusive
Examination Timetables will be available in March
"The onus lies on each student to establish the dates, times and venues of examinations by consulting the relevant timetable on the College website. No timetable or reminder will be sent to individual students by any office."
Postgraduate Certificate in Statistics Design and Analysis of Experiments
Lecture 1.1 10© 2015 Michael Stuart
Course assessments
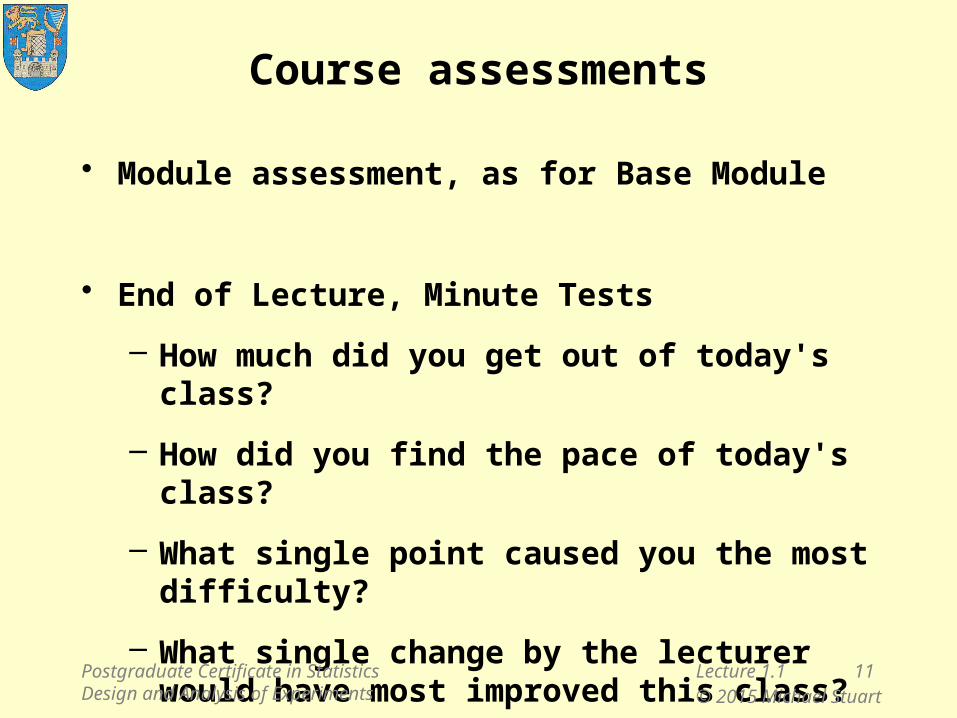
• Module assessment, as for Base Module
• End of Lecture, Minute Tests
– How much did you get out of today's class?
– How did you find the pace of today's class?
– What single point caused you the most difficulty?
– What single change by the lecturer would have most improved this class?
Postgraduate Certificate in Statistics Design and Analysis of Experiments
Lecture 1.1 11© 2015 Michael Stuart

Lecture 1.1
1. Introduction to Course
2. What is an experiment?
3. Case study: Industrial process improvement
− three design principles
4. Case study: Clinical trial
− how randomization works
5. Multifactor Designs
6. Other application areas
7. Experimental vs Observational Studies
8. Strategies for Experimentation
Postgraduate Certificate in Statistics Design and Analysis of Experiments
Lecture 1.1 12© 2015 Michael Stuart
Part 2 What is an experiment?
Try something, to see what happens
Try something different, to see the difference in what happens
Postgraduate Certificate in Statistics Design and Analysis of Experiments
Lecture 1.1 13© 2015 Michael Stuart
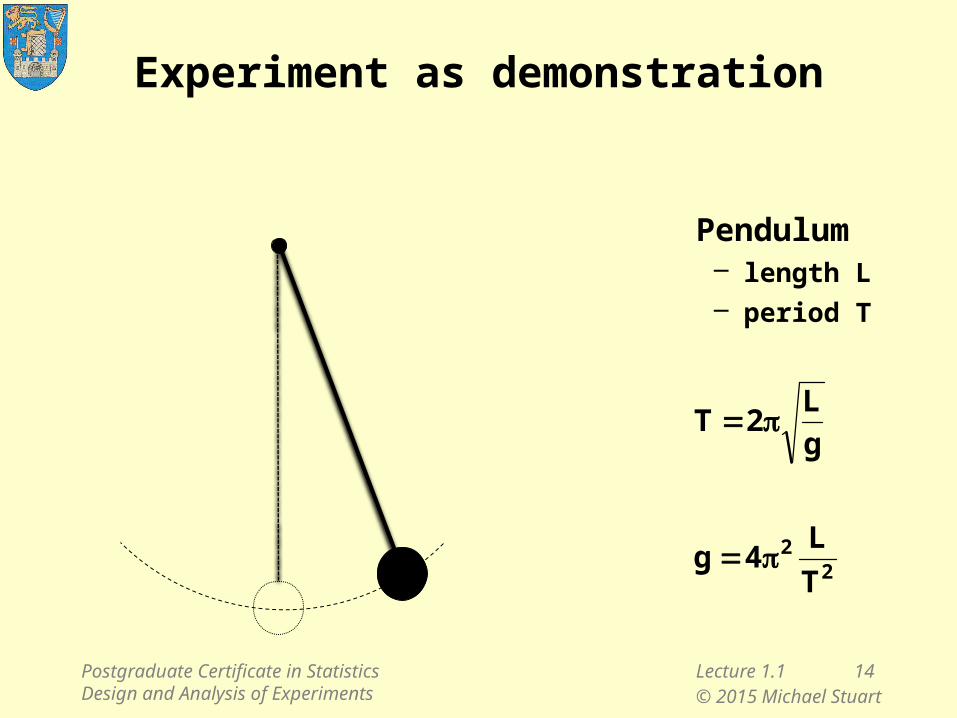
Experiment as demonstration
Pendulum– length L– period T
g
L2T
22
T
L4g
Postgraduate Certificate in Statistics Design and Analysis of Experiments
Lecture 1.1 14© 2015 Michael Stuart
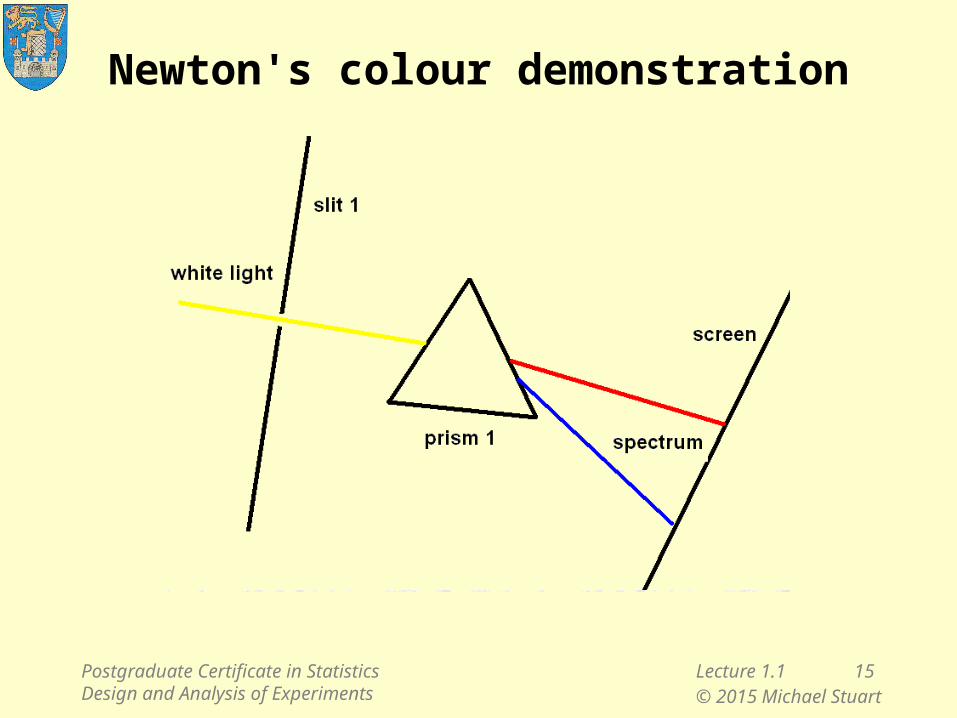
Newton's colour demonstration
Postgraduate Certificate in Statistics Design and Analysis of Experiments
Lecture 1.1 15© 2015 Michael Stuart
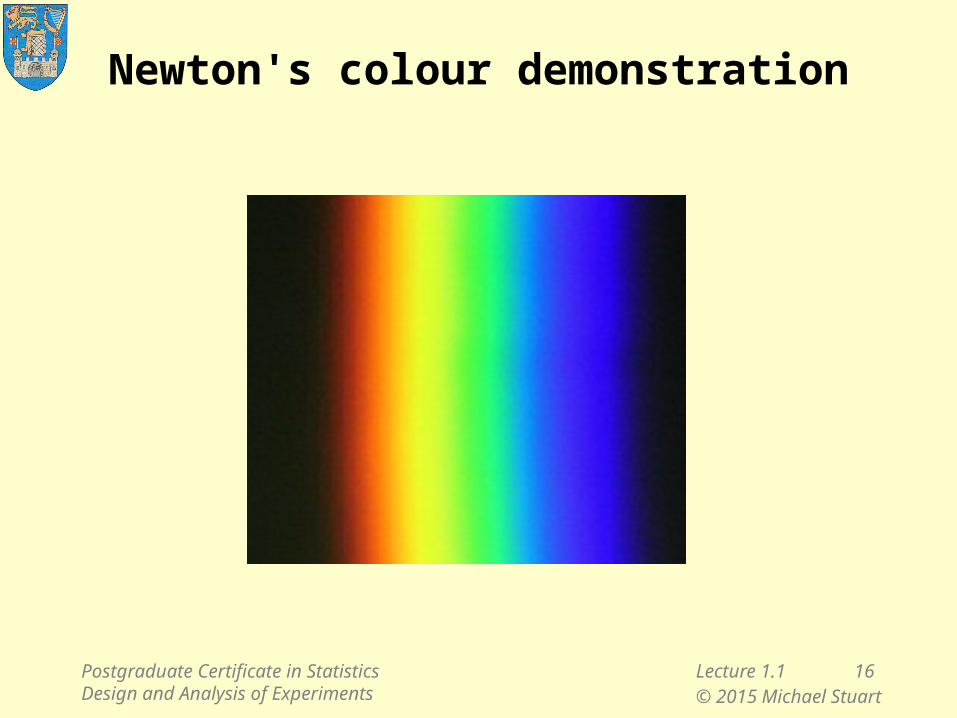
Newton's colour demonstration
Postgraduate Certificate in Statistics Design and Analysis of Experiments
Lecture 1.1 16© 2015 Michael Stuart
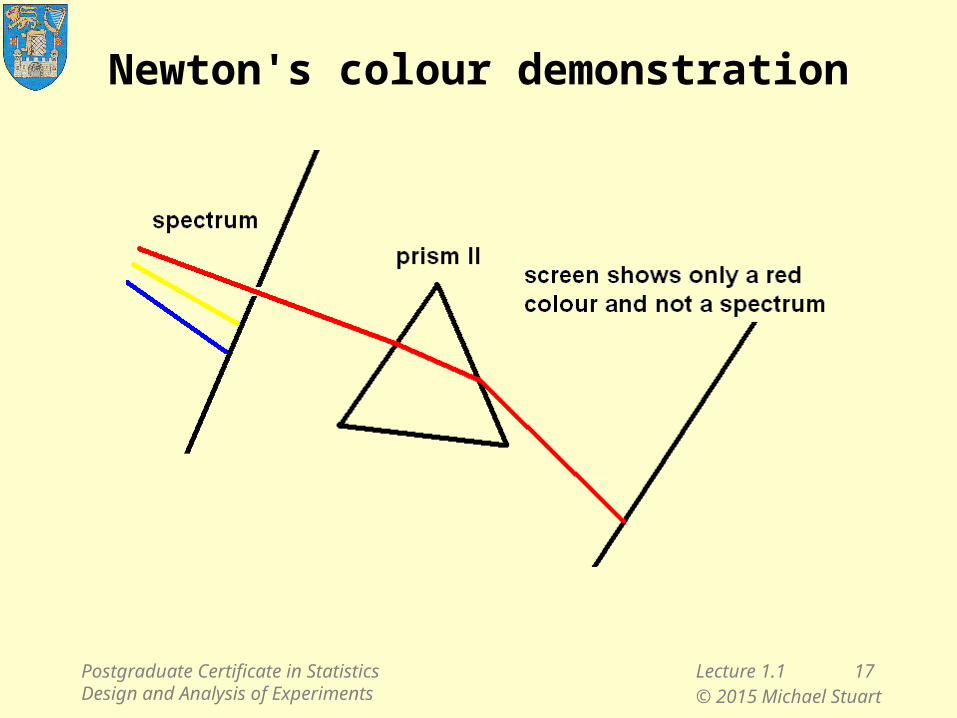
Newton's colour demonstration
Postgraduate Certificate in Statistics Design and Analysis of Experiments
Lecture 1.1 17© 2015 Michael Stuart
Thought experiments
• Aristotle (4th century BC):
– speed of falling objects is proportional to weight
• Galileo (17th century AD):
– not true!
Postgraduate Certificate in Statistics Design and Analysis of Experiments
Lecture 1.1 18© 2015 Michael Stuart
Comparative experiments
• Galileo's pendulum experiments
• A comparative experiment is a programme of actions undertaken to study the effects of making changes to a process or system.
• “To find out what happens when you change something, it is necessary to change it”.
(BHH, p. 404)
Postgraduate Certificate in Statistics Design and Analysis of Experiments
Lecture 1.1 19© 2015 Michael Stuart
Control, a key feature ofcomparative experiments
• Complete control
– the counterfactual argument
• Practical control of study environment
– chance variation if no change introduced
– comparing results of change to no change involves a test of statistical significance
Postgraduate Certificate in Statistics Design and Analysis of Experiments
Lecture 1.1 20© 2015 Michael Stuart
Lecture 1.1
1. Introduction to Course
2. What is an experiment?
3. Case study: Industrial process improvement
− three design principles
4. Case study: Clinical trial
− how randomization works
5. Multifactor Designs
6. Other application areas
7. Experimental vs Observational Studies
8. Strategies for Experimentation
Postgraduate Certificate in Statistics Design and Analysis of Experiments
Lecture 1.1 21© 2015 Michael Stuart
Part 3Case study on process improvement
• Comparison of standard (old) process and new process for manufacture of electronic components
• Key criterion:
– number of defective components
Ref: EM Notes, Ch 4, Example 1, pp. 3-6Hahn.xls
Postgraduate Certificate in Statistics Design and Analysis of Experiments
Lecture 1.1 22© 2015 Michael Stuart
Experimental design
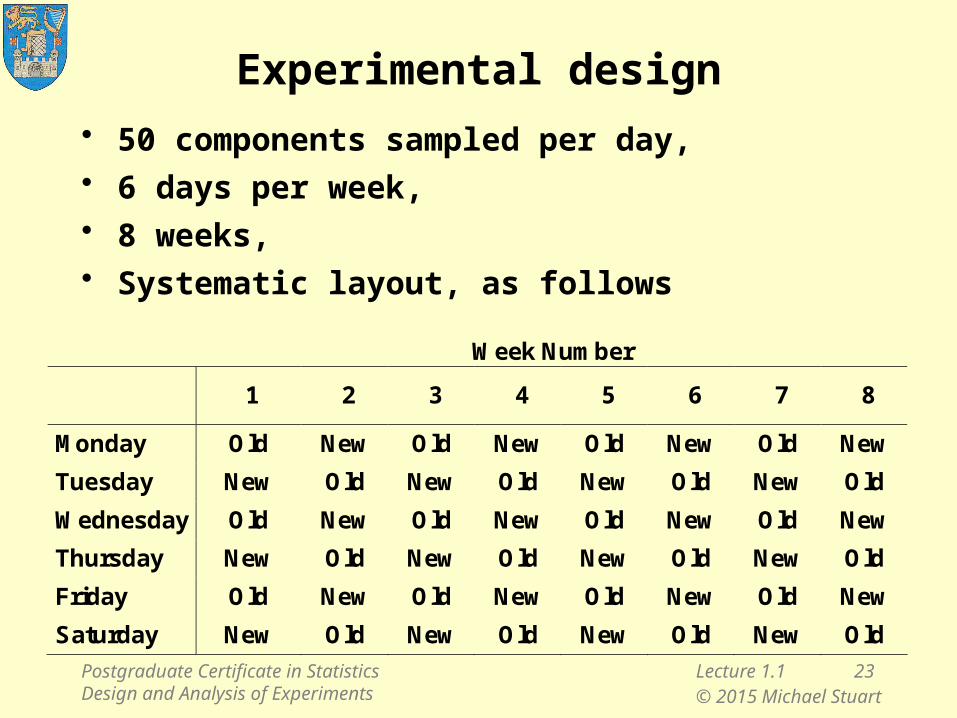
• 50 components sampled per day,• 6 days per week,• 8 weeks,• Systematic layout, as follows
Week Number
1 2 3 4 5 6 7 8
Monday Old New Old New Old New Old New
Tuesday New Old New Old New Old New Old
Wednesday Old New Old New Old New Old New
Thursday New Old New Old New Old New Old
Friday Old New Old New Old New Old New
Saturday New Old New Old New Old New Old
Postgraduate Certificate in Statistics Design and Analysis of Experiments
Lecture 1.1 23© 2015 Michael Stuart
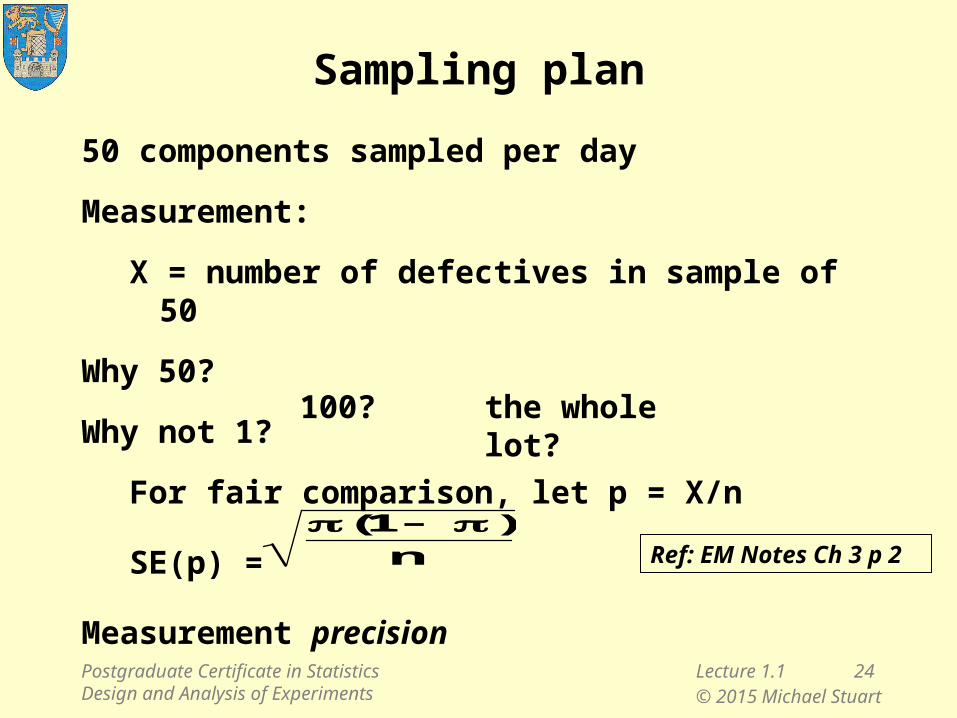
50 components sampled per day
Measurement:
X = number of defectives in sample of 50
Why 50?
Why not 1?
For fair comparison, let p = X/n
SE(p) =
Measurement precision
Sampling plan
n)1(
Ref: EM Notes Ch 3 p 2
100? the whole lot?
Postgraduate Certificate in Statistics Design and Analysis of Experiments
Lecture 1.1 24© 2015 Michael Stuart
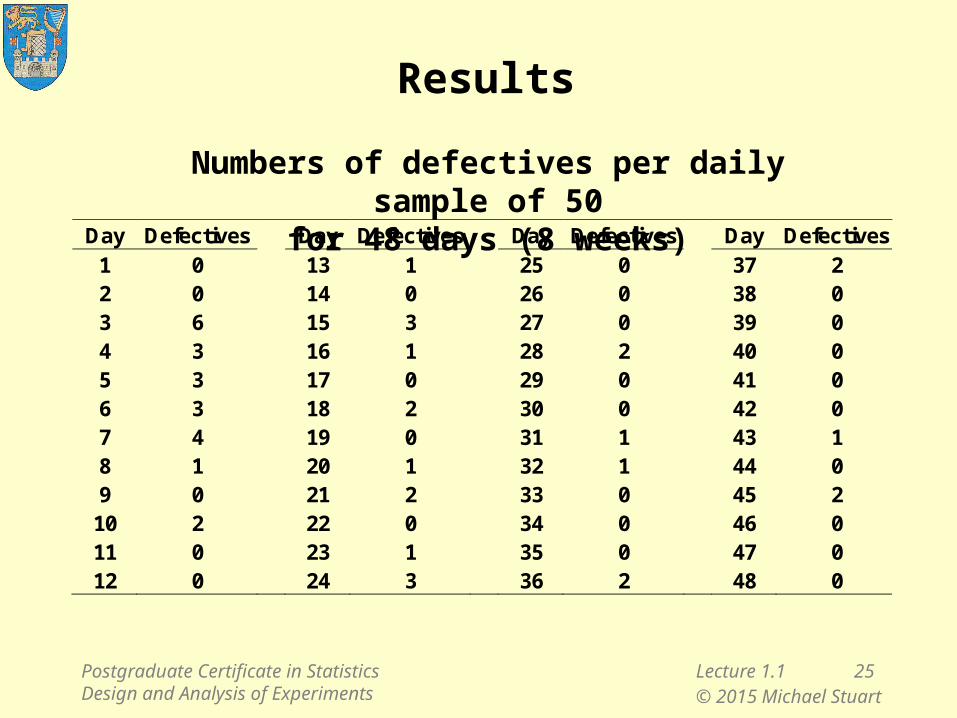
Results
Day Defectives Day Defectives Day Defectives Day Defectives 1 0 13 1 25 0 37 2 2 0 14 0 26 0 38 0 3 6 15 3 27 0 39 0 4 3 16 1 28 2 40 0 5 3 17 0 29 0 41 0 6 3 18 2 30 0 42 0 7 4 19 0 31 1 43 1 8 1 20 1 32 1 44 0 9 0 21 2 33 0 45 2 10 2 22 0 34 0 46 0 11 0 23 1 35 0 47 0 12 0 24 3 36 2 48 0
Numbers of defectives per daily sample of 50for 48 days (8 weeks)
Postgraduate Certificate in Statistics Design and Analysis of Experiments
Lecture 1.1 25© 2015 Michael Stuart
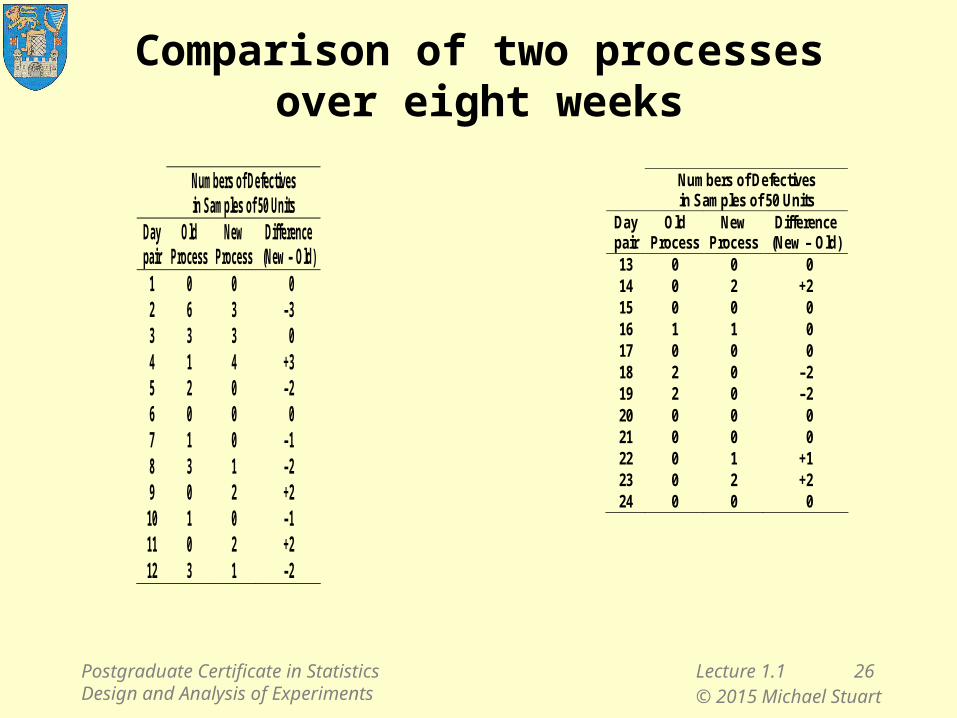
Comparison of two processesover eight weeks
Numbers of Defectives in Samples of 50 Units
Day pair
Old Process
New Process
Difference (New – Old)
1 0 0 0 2 6 3 –3 3 3 3 0 4 1 4 +3 5 2 0 –2 6 0 0 0 7 1 0 –1 8 3 1 –2 9 0 2 +2 10 1 0 –1 11 0 2 +2 12 3 1 –2
Numbers of Defectives in Samples of 50 Units
Day pair
Old Process
New Process
Difference (New – Old)
13 0 0 0 14 0 2 +2 15 0 0 0 16 1 1 0 17 0 0 0 18 2 0 –2 19 2 0 –2 20 0 0 0 21 0 0 0 22 0 1 +1 23 0 2 +2 24 0 0 0
Postgraduate Certificate in Statistics Design and Analysis of Experiments
Lecture 1.1 26© 2015 Michael Stuart
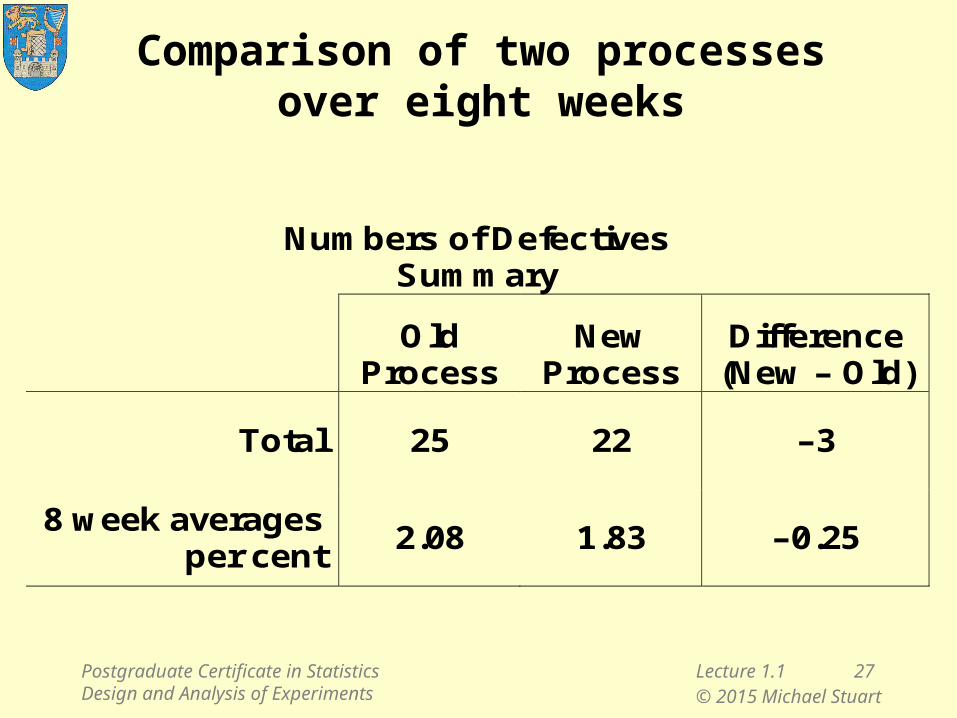
Numbers of Defectives Summary
Old
Process New
Process Difference
(New – Old)
Total 25 22 –3
8 week averages per cent
2.08 1.83 –0.25
Comparison of two processesover eight weeks
Postgraduate Certificate in Statistics Design and Analysis of Experiments
Lecture 1.1 27© 2015 Michael Stuart
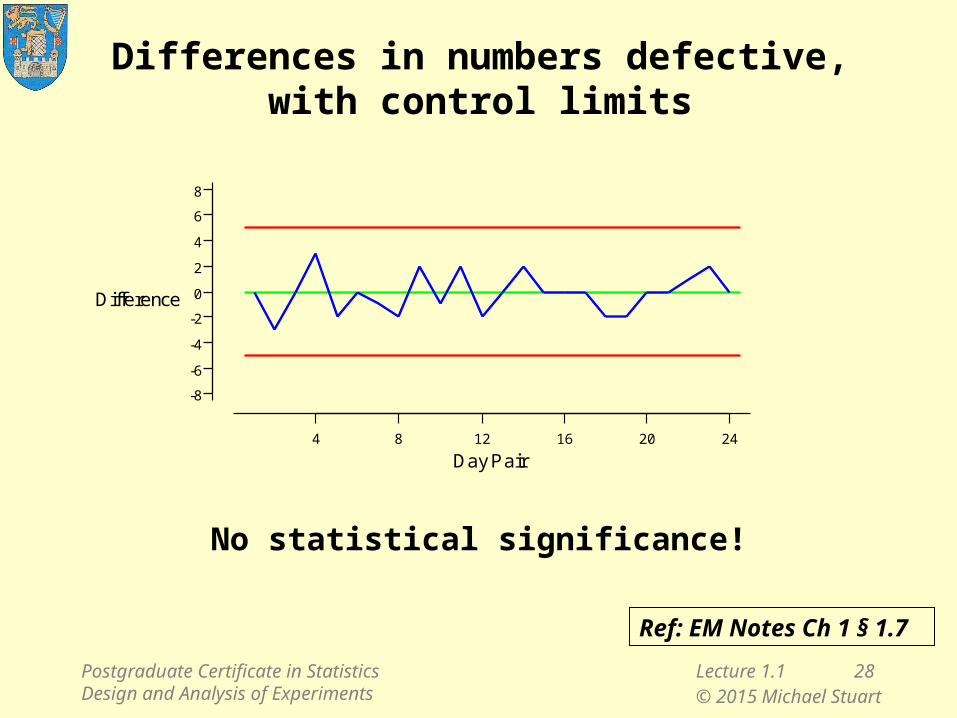
Differences in numbers defective,with control limits
4 8 12 16 20 24
Day Pair
-8
-6
-4
-2
0
2
4
6
8
Difference
No statistical significance!
Ref: EM Notes Ch 1 § 1.7
Postgraduate Certificate in Statistics Design and Analysis of Experiments
Lecture 1.1 28© 2015 Michael Stuart
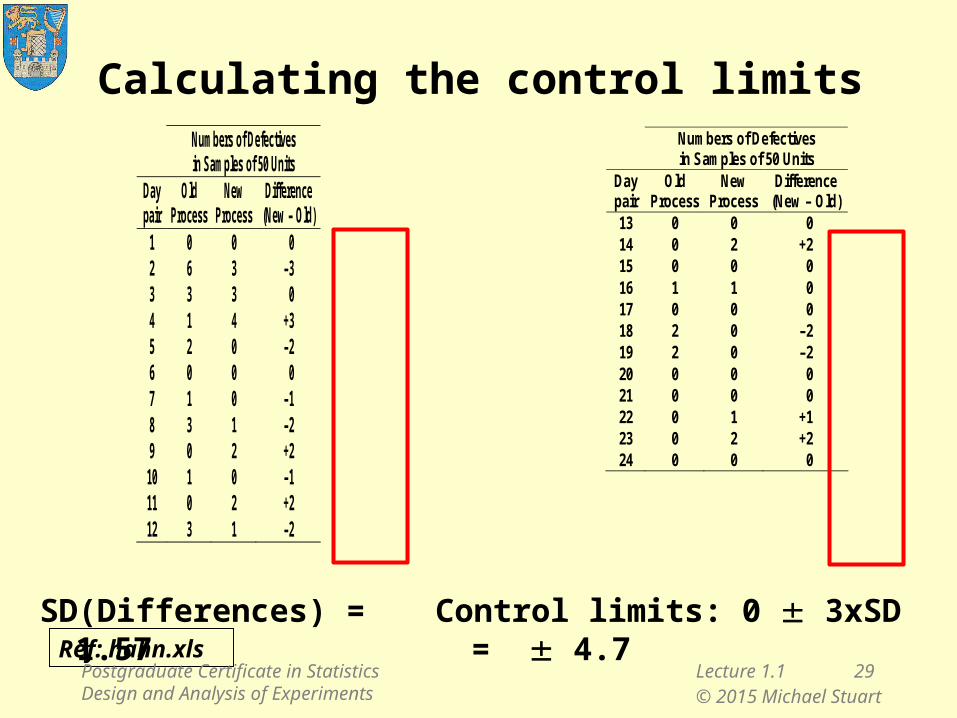
Numbers of Defectives in Samples of 50 Units
Day pair
Old Process
New Process
Difference (New – Old)
1 0 0 0 2 6 3 –3 3 3 3 0 4 1 4 +3 5 2 0 –2 6 0 0 0 7 1 0 –1 8 3 1 –2 9 0 2 +2 10 1 0 –1 11 0 2 +2 12 3 1 –2
Numbers of Defectives in Samples of 50 Units
Day pair
Old Process
New Process
Difference (New – Old)
13 0 0 0 14 0 2 +2 15 0 0 0 16 1 1 0 17 0 0 0 18 2 0 –2 19 2 0 –2 20 0 0 0 21 0 0 0 22 0 1 +1 23 0 2 +2 24 0 0 0
Calculating the control limits
SD(Differences) = 1.57 Control limits: 0 3xSD = 4.7Ref: hahn.xls
Postgraduate Certificate in Statistics Design and Analysis of Experiments
Lecture 1.1 29© 2015 Michael Stuart
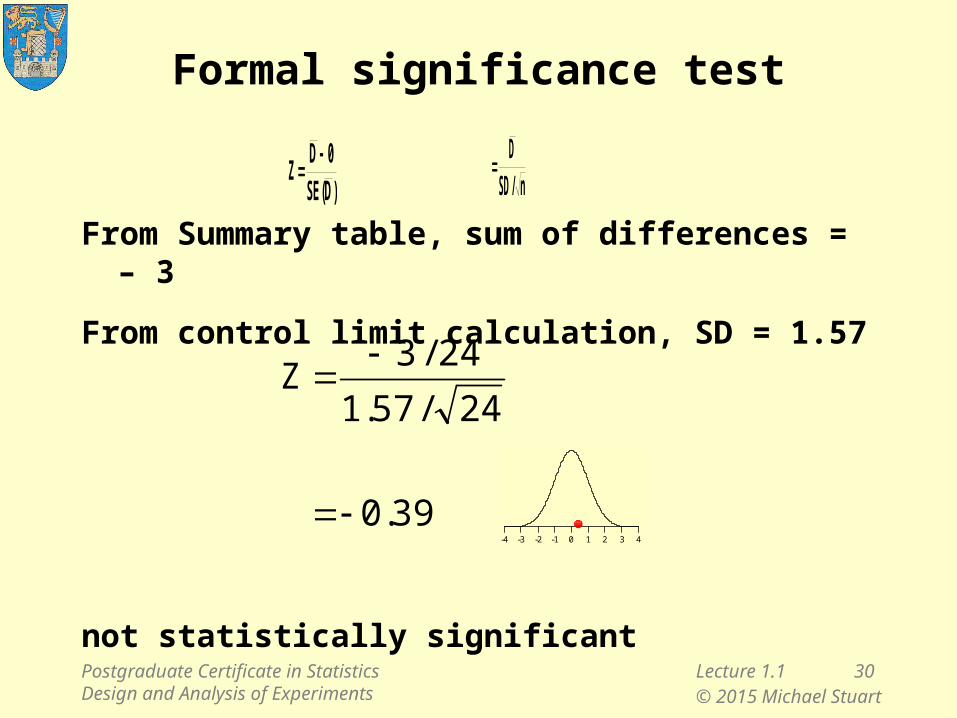
Formal significance test
From Summary table, sum of differences = – 3
From control limit calculation, SD = 1.57
not statistically significant
)D(SE0D
Z
n/SDD
-4 -3 -2 -1 0 1 2 3 4
39.0
24/57.1
24/3Z
Postgraduate Certificate in Statistics Design and Analysis of Experiments
Lecture 1.1 30© 2015 Michael Stuart
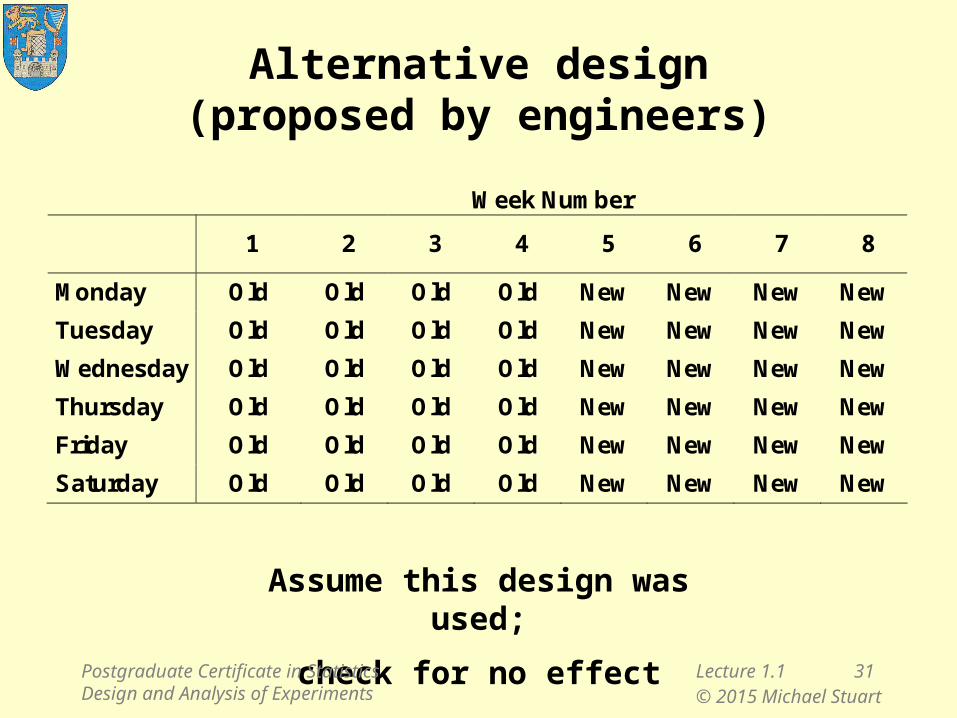
Alternative design(proposed by engineers)
Week Number
1 2 3 4 5 6 7 8
Monday Old Old Old Old New New New New
Tuesday Old Old Old Old New New New New
Wednesday Old Old Old Old New New New New
Thursday Old Old Old Old New New New New
Friday Old Old Old Old New New New New
Saturday Old Old Old Old New New New New
Assume this design was used;
check for no effectPostgraduate Certificate in Statistics Design and Analysis of Experiments
Lecture 1.1 31© 2015 Michael Stuart
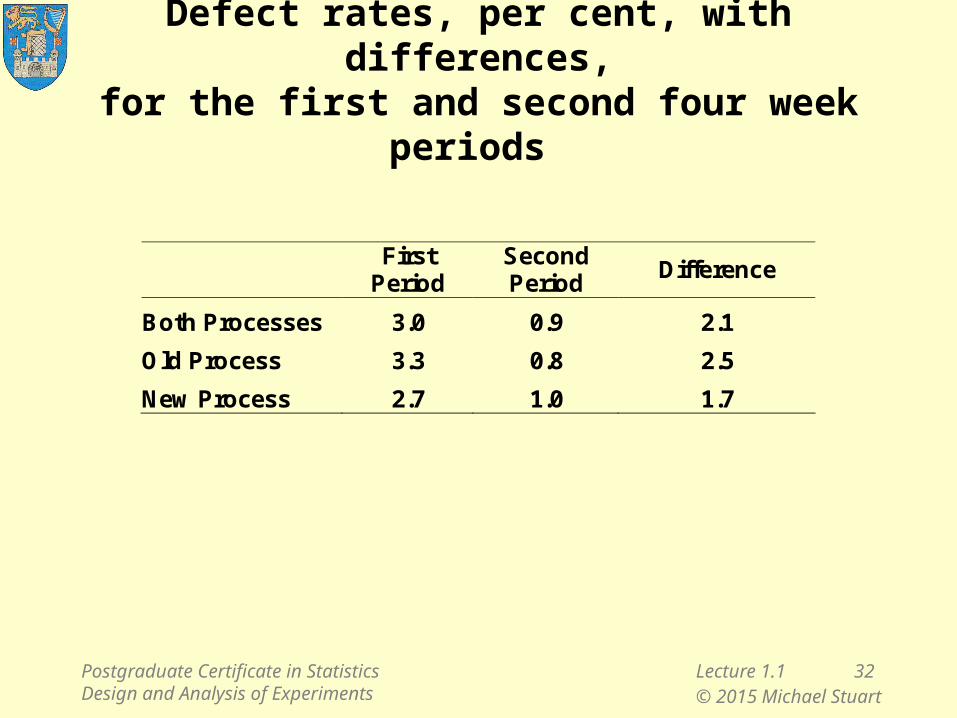
Defect rates, per cent, with differences,for the first and second four week periods
First
Period Second Period
Difference
Both Processes 3.0 0.9 2.1
Old Process 3.3 0.8 2.5
New Process 2.7 1.0 1.7
Postgraduate Certificate in Statistics Design and Analysis of Experiments
Lecture 1.1 32© 2015 Michael Stuart
75.3
56.0
1.2
1200
1.999.0
1200
9739.00.3
n)P̂100(P̂
n)P̂100(P̂
P̂P̂Z
2
22
1
11
21
75.3
56.0
1.2
1200
1.999.0
1200
973
9.00.3
n
)P̂100(P̂
n
)P̂100(P̂
P̂P̂Z
2
22
1
11
21
75.3
56.0
1.2
1200
1.999.0
1200
9739.00.3
n
)P̂100(P̂
n
)P̂100(P̂
P̂P̂Z
2
22
1
11
21
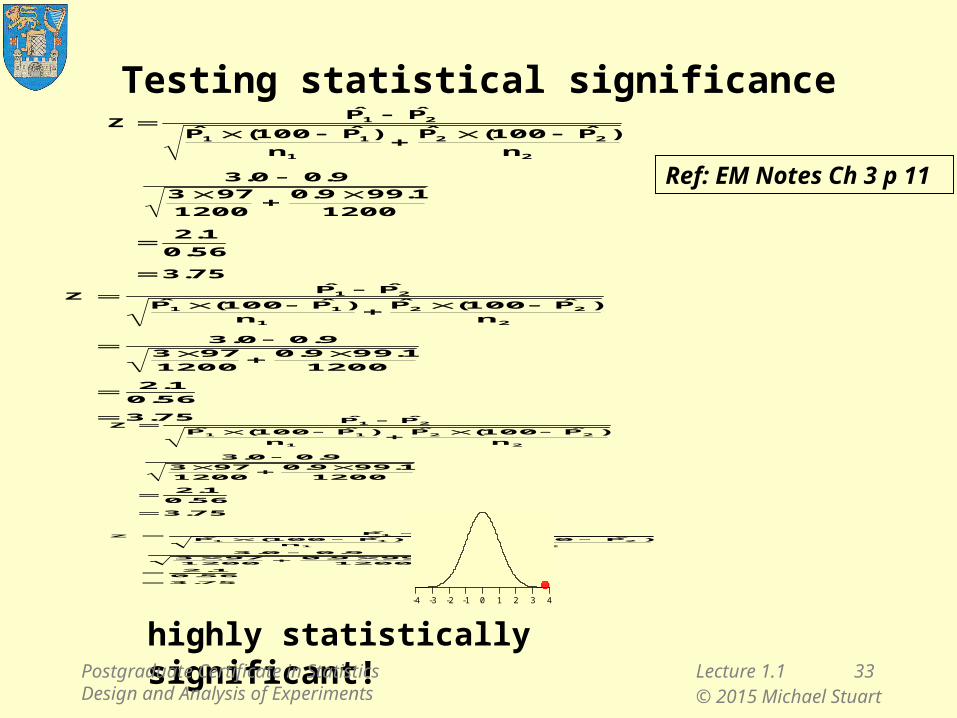
Testing statistical significance
75.3
56.0
1.2
1200
1.999.0
1200
9739.00.3
n
)P̂100(P̂
n
)P̂100(P̂
P̂P̂Z
2
22
1
11
21
highly statistically significant!
Ref: EM Notes Ch 3 p 11
-4 -3 -2 -1 0 1 2 3 4
Postgraduate Certificate in Statistics Design and Analysis of Experiments
Lecture 1.1 33© 2015 Michael Stuart
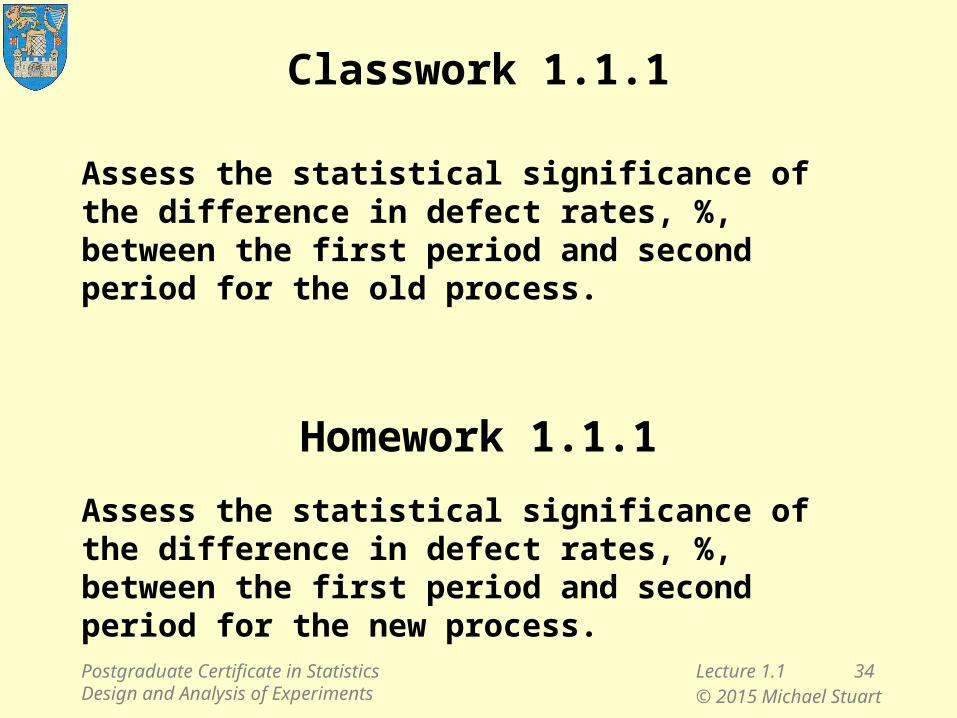
Classwork 1.1.1
Assess the statistical significance of the difference in defect rates, %, between the first period and second period for the old process.
Homework 1.1.1
Assess the statistical significance of the difference in defect rates, %, between the first period and second period for the new process.
Postgraduate Certificate in Statistics Design and Analysis of Experiments
Lecture 1.1 34© 2015 Michael Stuart
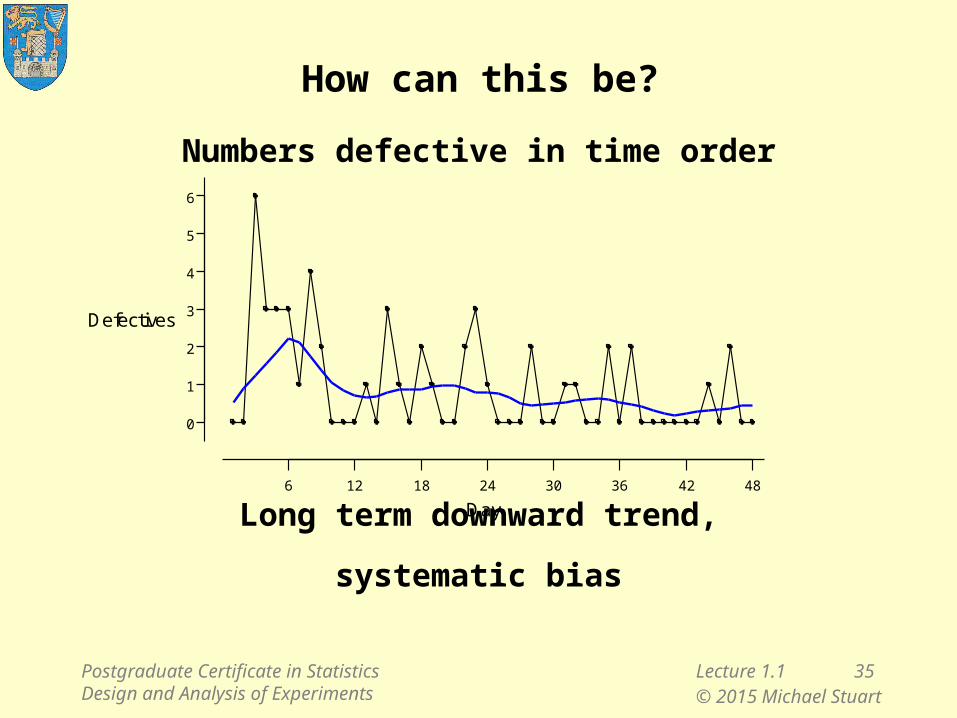
Numbers defective in time order
Long term downward trend,
systematic bias
How can this be?
6 12 18 24 30 36 42 48
Day
0
1
2
3
4
5
6
Defectives
Postgraduate Certificate in Statistics Design and Analysis of Experiments
Lecture 1.1 35© 2015 Michael Stuart
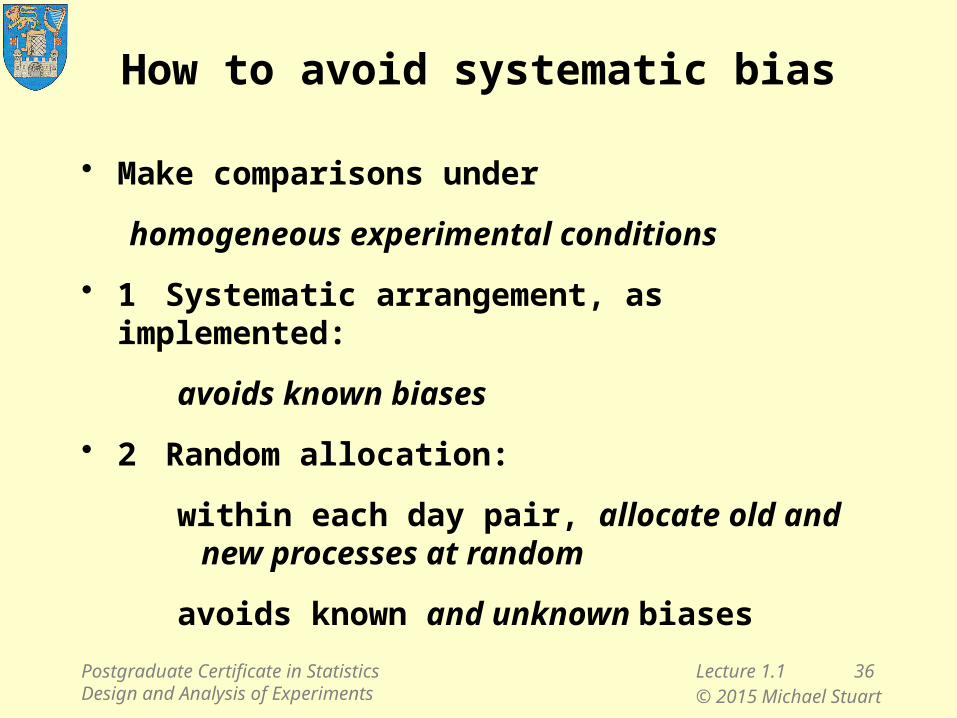
How to avoid systematic bias
• Make comparisons under
homogeneous experimental conditions
• 1 Systematic arrangement, as implemented:
avoids known biases
• 2 Random allocation:
within each day pair, allocate old and new processes at random
avoids known and unknown biases
Postgraduate Certificate in Statistics Design and Analysis of Experiments
Lecture 1.1 36© 2015 Michael Stuart
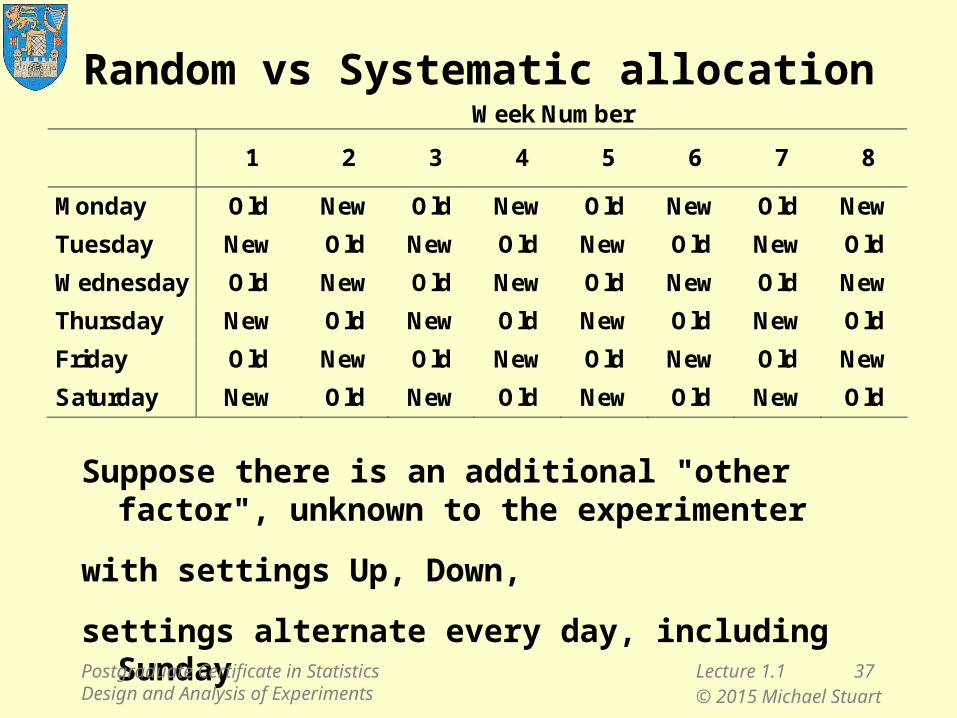
Random vs Systematic allocation
Suppose there is an additional "other factor", unknown to the experimenter
with settings Up, Down,
settings alternate every day, including Sunday
Week Number
1 2 3 4 5 6 7 8
Monday Old New Old New Old New Old New
Tuesday New Old New Old New Old New Old
Wednesday Old New Old New Old New Old New
Thursday New Old New Old New Old New Old
Friday Old New Old New Old New Old New
Saturday New Old New Old New Old New Old
Postgraduate Certificate in Statistics Design and Analysis of Experiments
Lecture 1.1 37© 2015 Michael Stuart
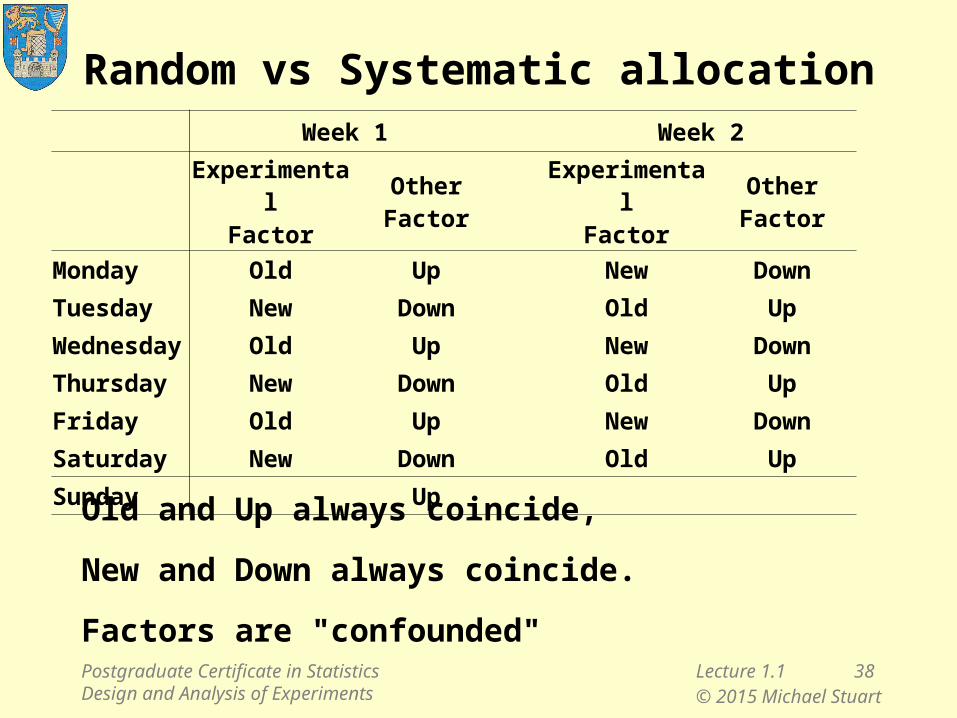
Random vs Systematic allocation
Old and Up always coincide,
New and Down always coincide.
Factors are "confounded"
Week 1 Week 2
Experimental
FactorOtherFactor
Experimental
FactorOtherFactor
Monday Old Up New Down
Tuesday New Down Old Up
Wednesday Old Up New Down
Thursday New Down Old Up
Friday Old Up New Down
Saturday New Down Old Up
Sunday Up
Postgraduate Certificate in Statistics Design and Analysis of Experiments
Lecture 1.1 38© 2015 Michael Stuart
Random vs Systematic allocation
Random allocation minimises chances that
experimental factor settings pattern
coincides with
other factor settings pattern.
Postgraduate Certificate in Statistics Design and Analysis of Experiments
Lecture 1.1 39© 2015 Michael Stuart
Two design principles
• Blocking (or local control)
– identify homogeneous blocks of experimental units
– assess effects of experimental change within homogeneous blocks
– average effects across blocks
• Randomization
– allocate experimental settings to units at random
Postgraduate Certificate in Statistics Design and Analysis of Experiments
Lecture 1.1 40© 2015 Michael Stuart
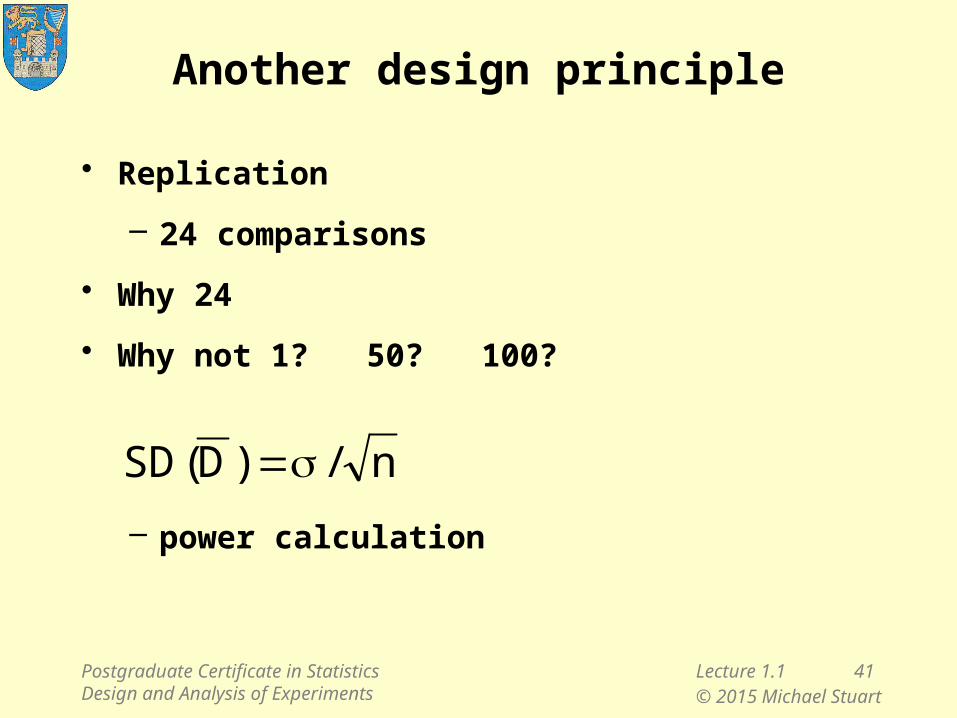
Another design principle
• Replication
– 24 comparisons
• Why 24
• Why not 1? 50? 100?
– power calculation
Postgraduate Certificate in Statistics Design and Analysis of Experiments
n/)D(SD
Lecture 1.1 41© 2015 Michael Stuart
Lecture 1.1
1. Introduction to Course
2. What is an experiment?
3. Case study: Industrial process improvement
− three design principles
4. Case study: Clinical trial
− how randomization works
5. Multifactor Designs
6. Other application areas
7. Experimental vs Observational Studies
8. Strategies for Experimentation
Postgraduate Certificate in Statistics Design and Analysis of Experiments
Lecture 1.1 42© 2015 Michael Stuart

Part 4Clinical trial of heart disease treatments
• 596 patients suffering from heart disease
• to be treated by drugs or by surgery
• each patient assigned at random to one treatment
– 310 (52%) assigned to Drugs
– 286 (48%) assigned to Surgery
• Was the randomization successful?
Postgraduate Certificate in Statistics Design and Analysis of Experiments
Lecture 1.1 43© 2015 Michael Stuart
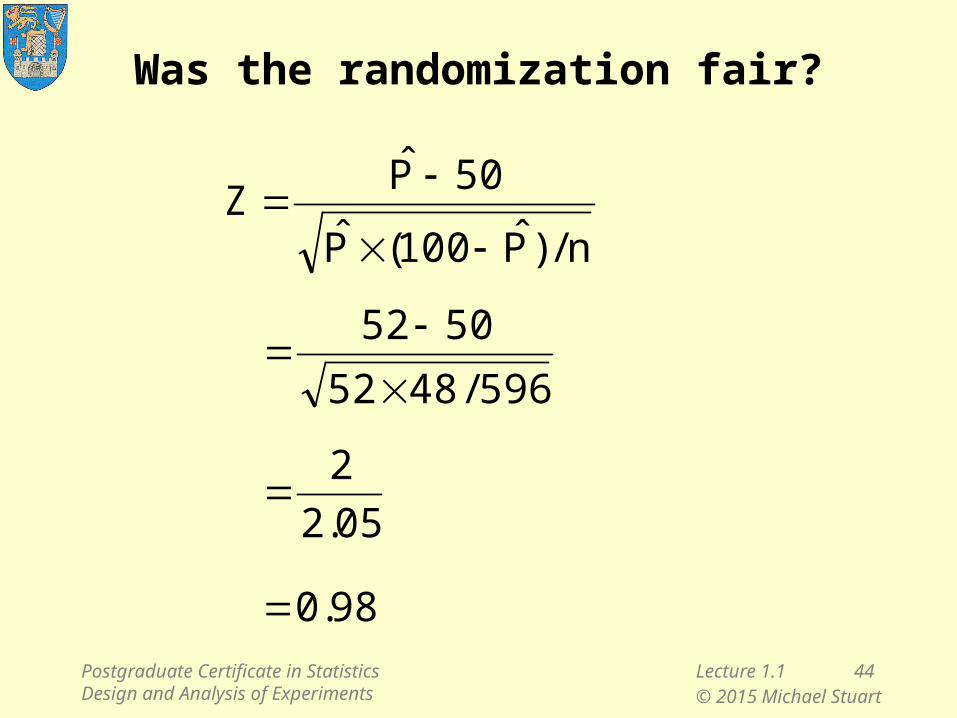
Was the randomization fair?
Postgraduate Certificate in Statistics Design and Analysis of Experiments
Lecture 1.1 44© 2015 Michael Stuart
n/)P̂100(P̂
50P̂Z
596/4852
5052
05.2
2
98.0
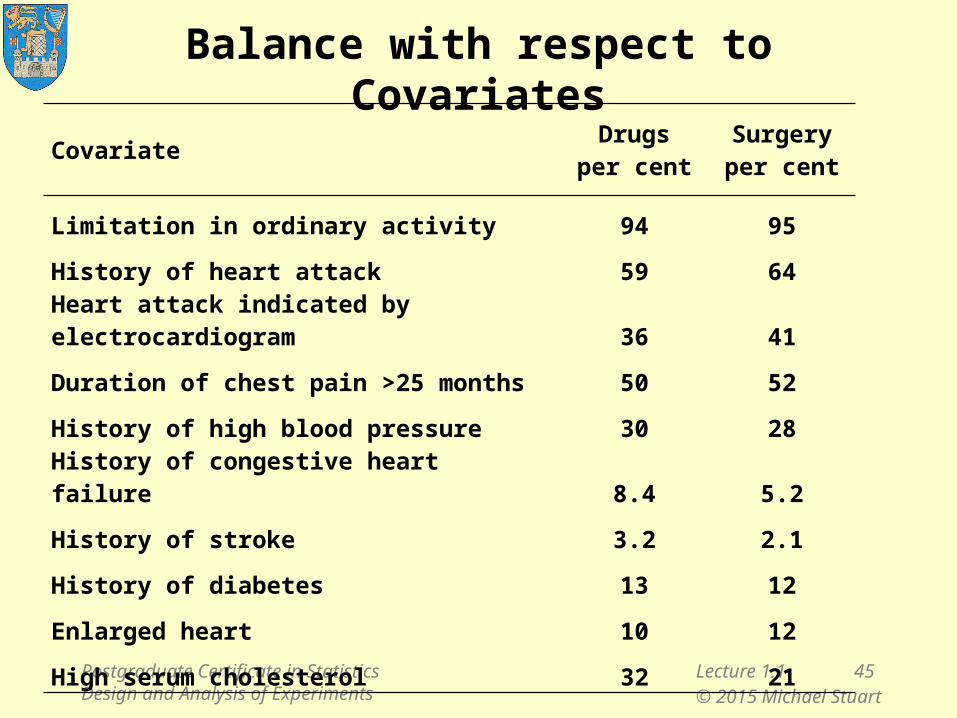
Balance with respect to Covariates
Postgraduate Certificate in Statistics Design and Analysis of Experiments
Lecture 1.1 45© 2015 Michael Stuart
CovariateDrugs
per centSurgeryper cent
Limitation in ordinary activity 94 95
History of heart attack 59 64
Heart attack indicated by electrocardiogram 36 41
Duration of chest pain >25 months 50 52
History of high blood pressure 30 28
History of congestive heart failure 8.4 5.2
History of stroke 3.2 2.1
History of diabetes 13 12
Enlarged heart 10 12
High serum cholesterol 32 21
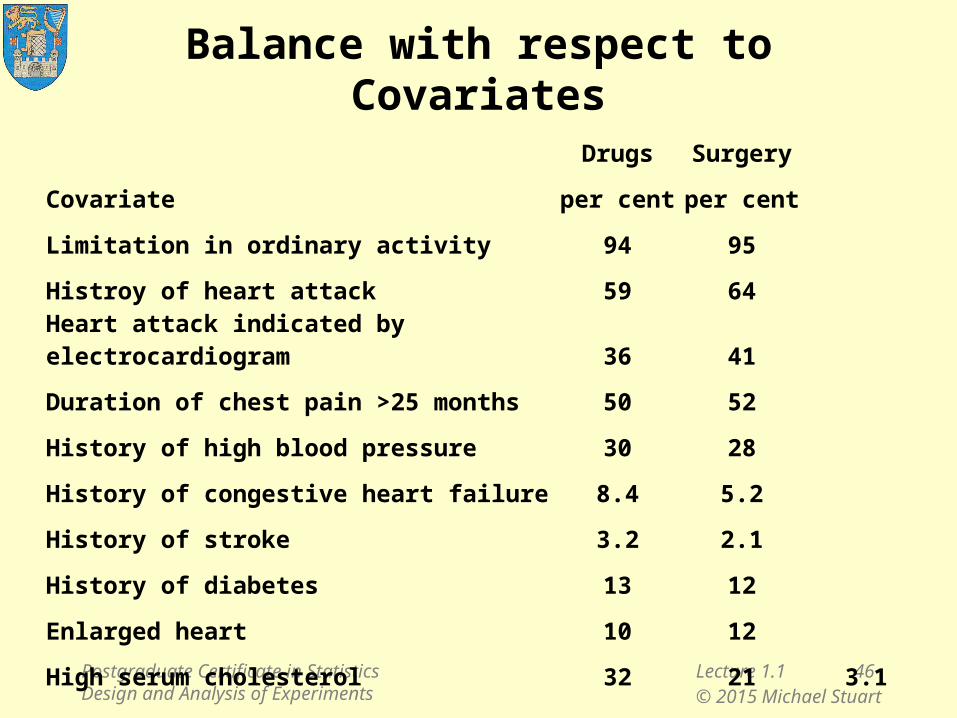
Balance with respect to Covariates
Postgraduate Certificate in Statistics Design and Analysis of Experiments
Lecture 1.1 46© 2015 Michael Stuart
Covariate
Drugs Surgery Z(Diff-0)
per cent per cent
Limitation in ordinary activity 94 95 -0.5
Histroy of heart attack 59 64 -1.3
Heart attack indicated by electrocardiogram 36 41 -1.3
Duration of chest pain >25 months 50 52 -0.5
History of high blood pressure 30 28 0.5
History of congestive heart failure 8.4 5.2 1.6
History of stroke 3.2 2.1 0.8
History of diabetes 13 12 0.4
Enlarged heart 10 12 -0.8
High serum cholesterol 32 21 3.1
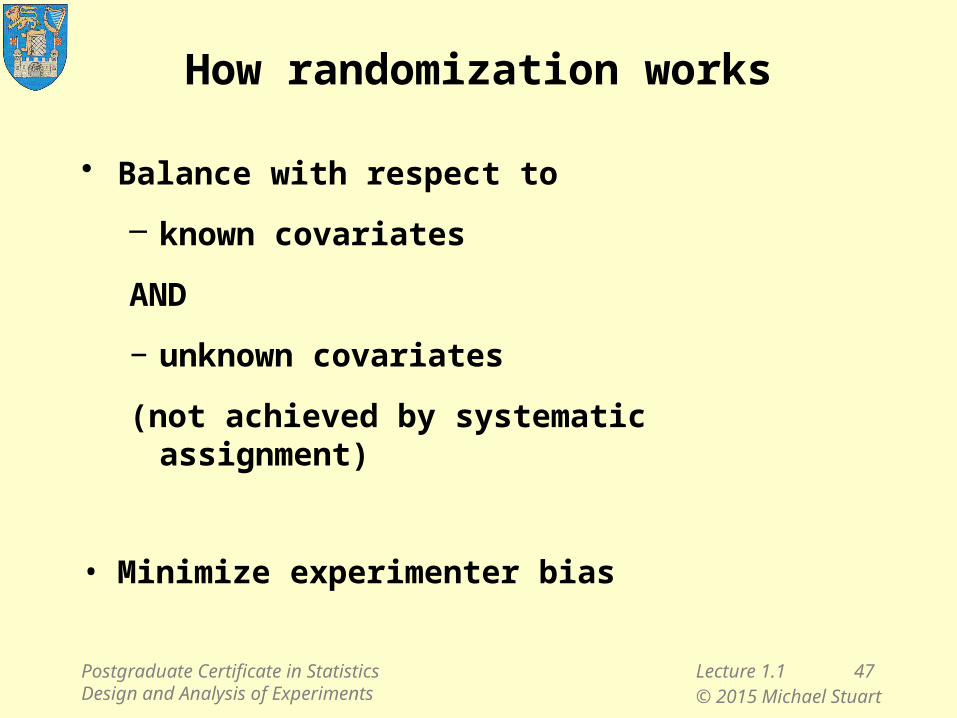
How randomization works
• Balance with respect to
– known covariates
AND
− unknown covariates
(not achieved by systematic assignment)
• Minimize experimenter bias
Postgraduate Certificate in Statistics Design and Analysis of Experiments
Lecture 1.1 47© 2015 Michael Stuart
1. Class count
2. Random number
Postgraduate Certificate in Statistics Design and Analysis of Experiments
Lecture 1.1 48© 2015 Michael Stuart
Lecture 1.1
1. Introduction to Course
2. What is an experiment?
3. Case study: Industrial process improvement
− three design principles
4. Case study: Clinical trial
− how randomization works
5. Multifactor Designs
6. Other application areas
7. Experimental vs Observational Studies
8. Strategies for Experimentation
Postgraduate Certificate in Statistics Design and Analysis of Experiments
Lecture 1.1 49© 2015 Michael Stuart
Part 5Multi-factor Designs
• Traditional versus statistical design
– efficiency
– interaction
Ref: EM §5.2
Postgraduate Certificate in Statistics Design and Analysis of Experiments
Lecture 1.1 50© 2015 Michael Stuart
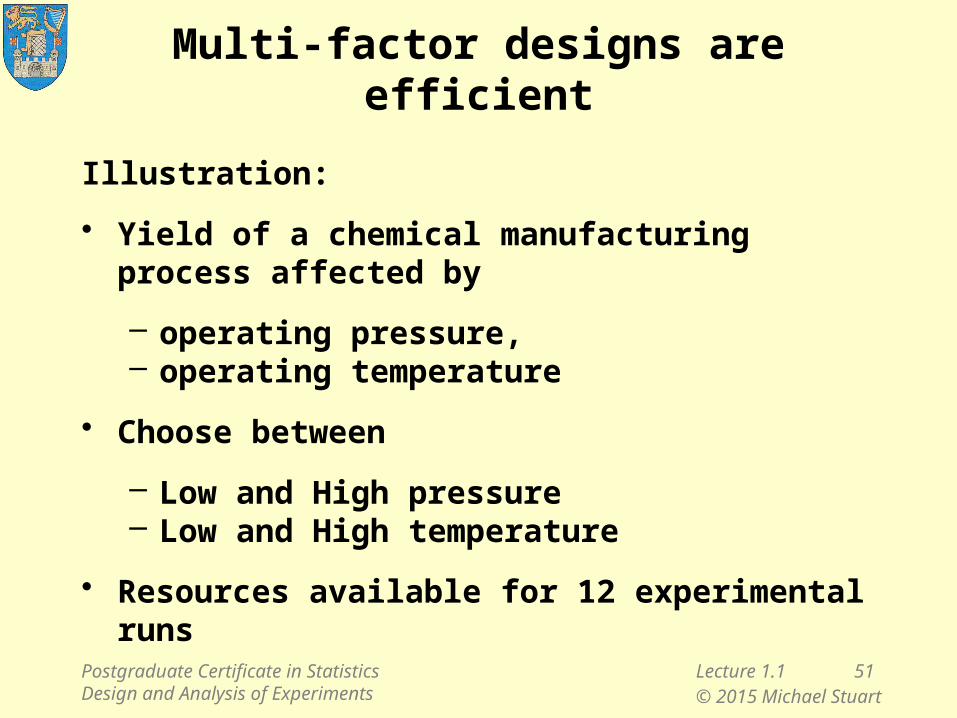
Multi-factor designs are efficient
Illustration:
• Yield of a chemical manufacturing process affected by
– operating pressure, – operating temperature
• Choose between
– Low and High pressure– Low and High temperature
• Resources available for 12 experimental runs
Postgraduate Certificate in Statistics Design and Analysis of Experiments
Lecture 1.1 51© 2015 Michael Stuart
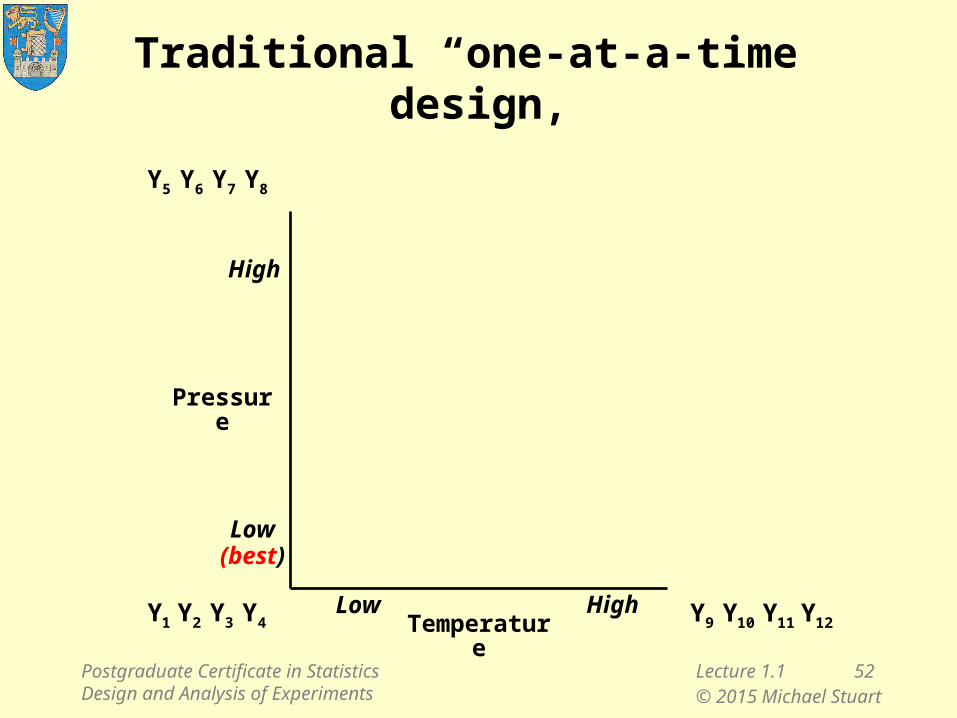
Traditional “one-at-a-time” design,
Pressure
Temperature
High
High
Low
Low4321 YYYY
8765 YYYY
1211109 YYYY
(best)
Postgraduate Certificate in Statistics Design and Analysis of Experiments
Lecture 1.1 52© 2015 Michael Stuart
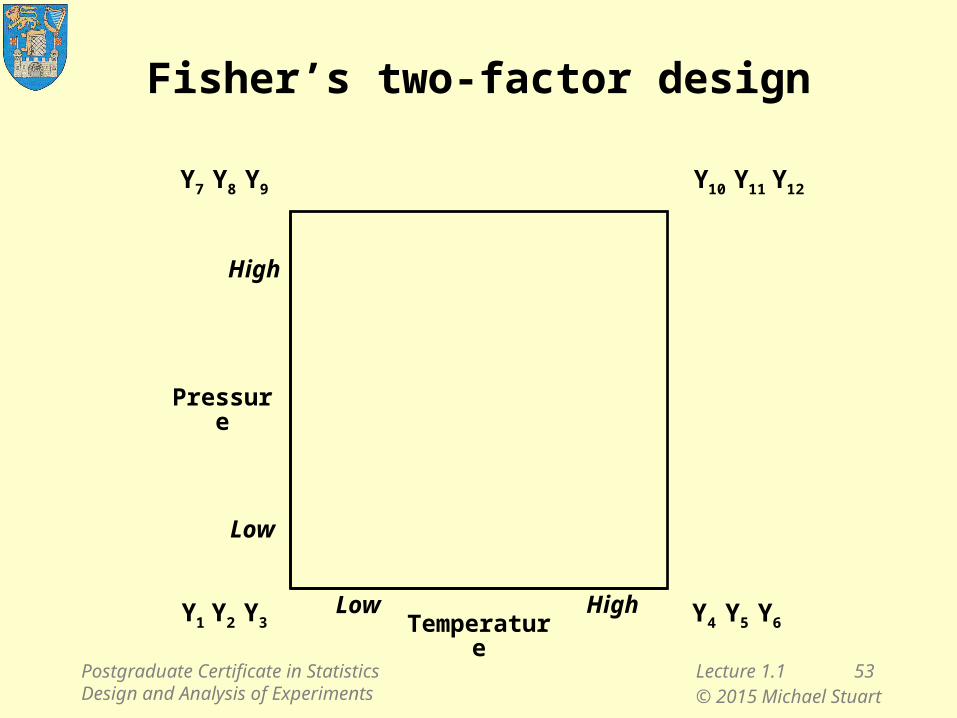
Fisher’s two-factor design
Pressure
Temperature
High
High
Low
Low321 YYY
121110 YYY987 YYY
654 YYY
Postgraduate Certificate in Statistics Design and Analysis of Experiments
Lecture 1.1 53© 2015 Michael Stuart
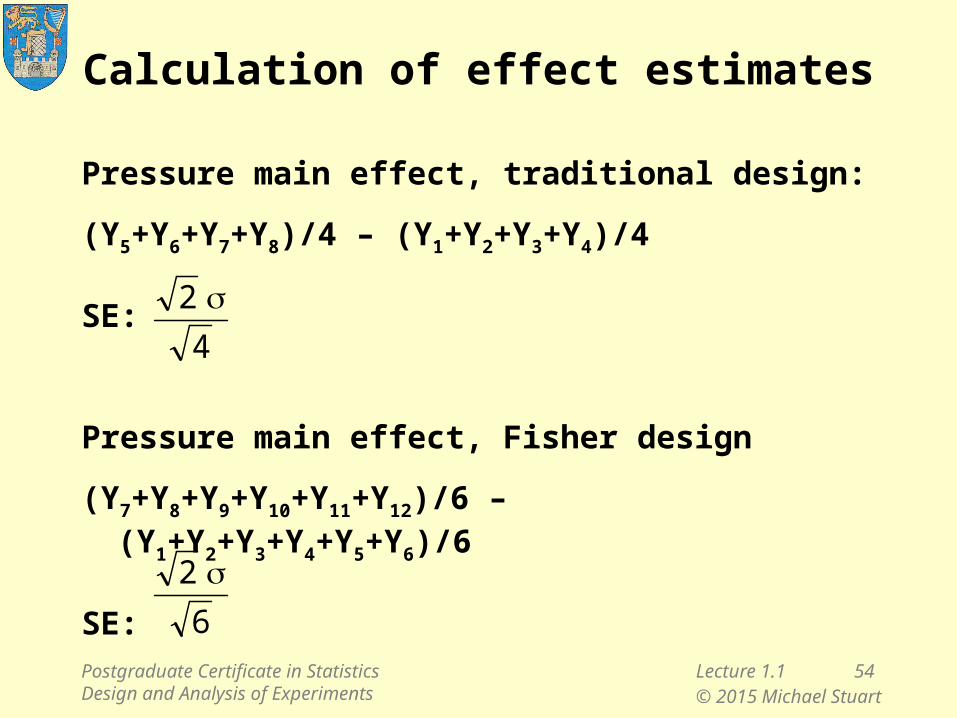
Calculation of effect estimates
Pressure main effect, traditional design:
(Y5+Y6+Y7+Y8)/4 – (Y1+Y2+Y3+Y4)/4
SE:
Pressure main effect, Fisher design
(Y7+Y8+Y9+Y10+Y11+Y12)/6 – (Y1+Y2+Y3+Y4+Y5+Y6)/6
SE:
4
2
6
2
Postgraduate Certificate in Statistics Design and Analysis of Experiments
Lecture 1.1 54© 2015 Michael Stuart
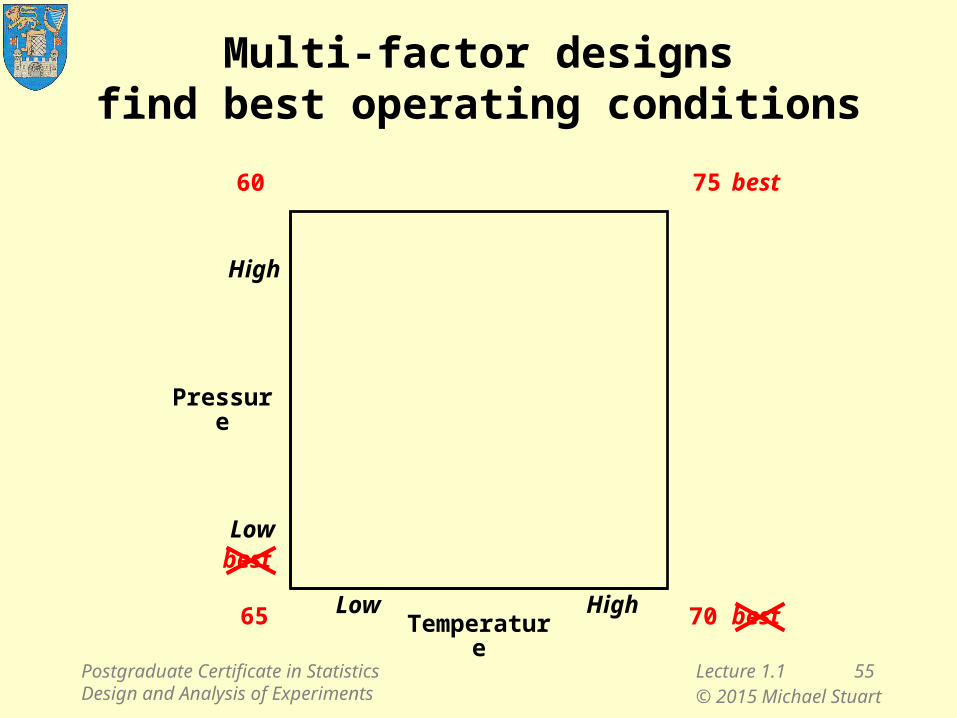
Multi-factor designsfind best operating conditions
Pressure
Temperature
High
High
Low
Low65
75
70
60
best
best
best
Postgraduate Certificate in Statistics Design and Analysis of Experiments
Lecture 1.1 55© 2015 Michael Stuart
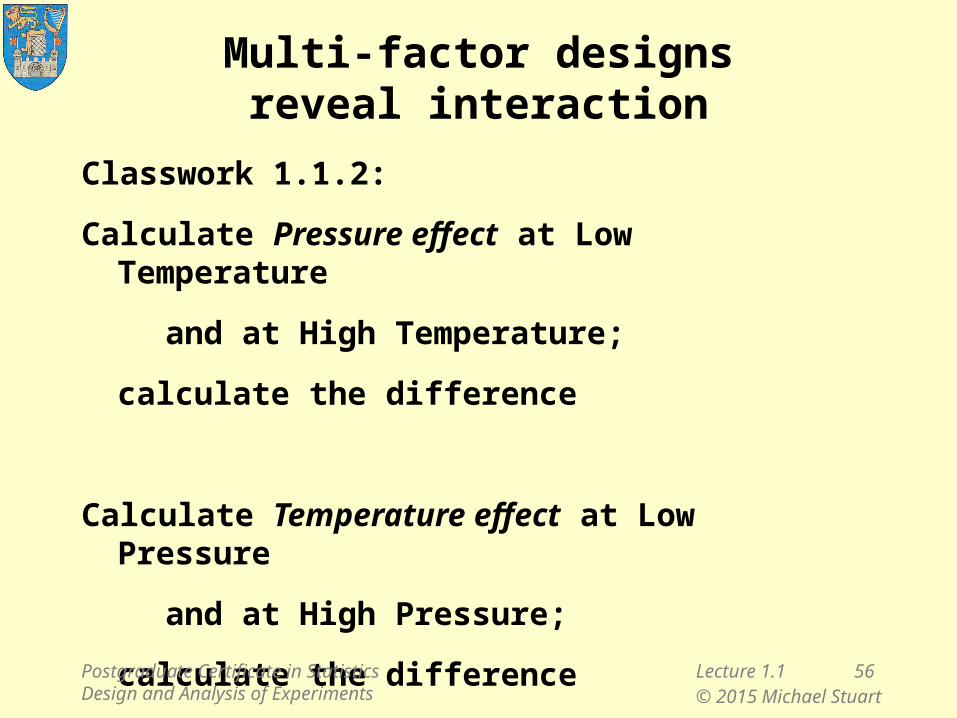
Multi-factor designsreveal interaction
Classwork 1.1.2:
Calculate Pressure effect at Low Temperature
and at High Temperature;
calculate the difference
Calculate Temperature effect at Low Pressure
and at High Pressure;
calculate the difference
Postgraduate Certificate in Statistics Design and Analysis of Experiments
Lecture 1.1 56© 2015 Michael Stuart
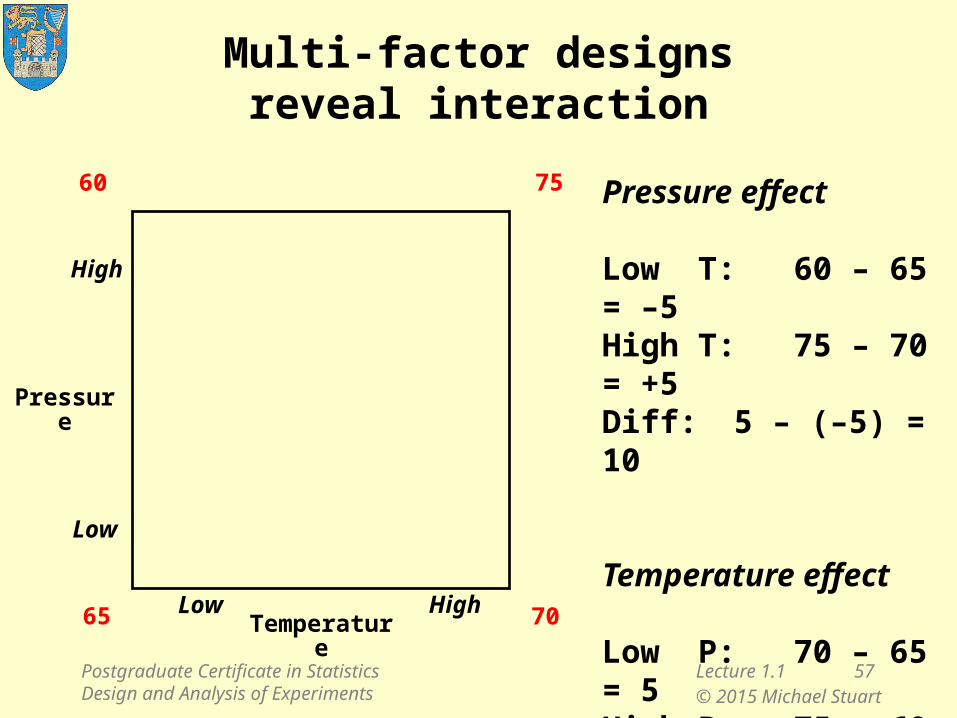
Multi-factor designsreveal interaction
Pressure
Temperature
High
High
Low
Low65
75
70
60 Pressure effect
Low T: 60 – 65 = –5High T: 75 – 70 = +5Diff: 5 – (–5) = 10
Temperature effect
Low P: 70 – 65 = 5High P: 75 – 60 = 15Diff: 15 – 5 = 10
Postgraduate Certificate in Statistics Design and Analysis of Experiments
Lecture 1.1 57© 2015 Michael Stuart
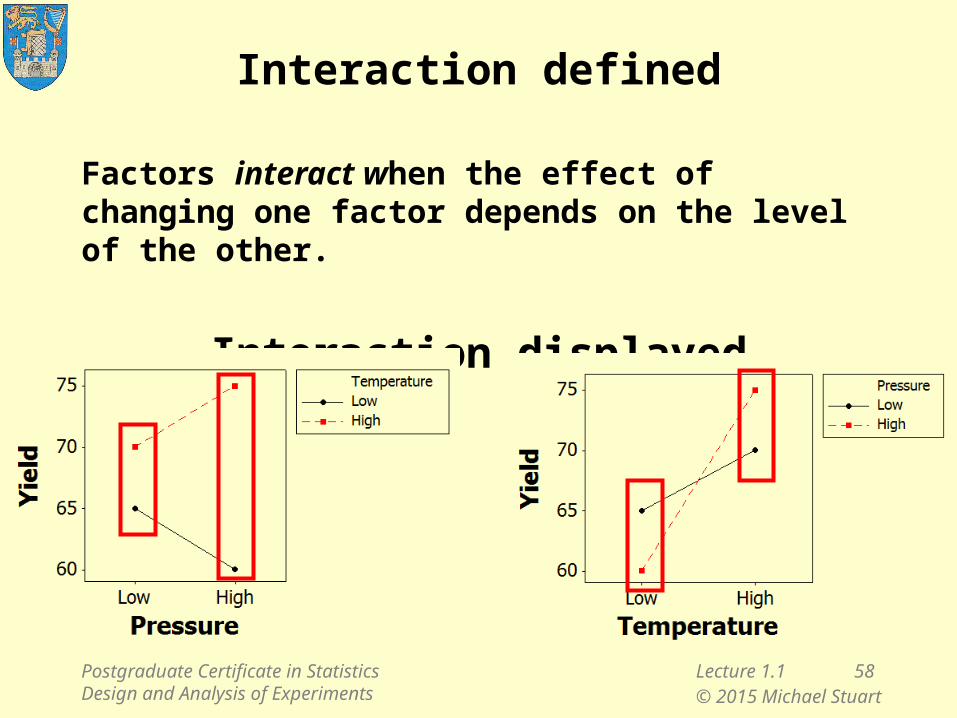
Interaction defined
Factors interact when the effect of changing one factor depends on the level of the other.
Interaction displayed
Postgraduate Certificate in Statistics Design and Analysis of Experiments
Lecture 1.1 58© 2015 Michael Stuart
Lecture 1.1
1. Introduction to Course
2. What is an experiment?
3. Case study: Industrial process improvement
− three design principles
4. Case study: Clinical trial
− how randomization works
5. Multifactor Designs
6. Other application areas
7. Experimental vs Observational Studies
8. Strategies for Experimentation
Postgraduate Certificate in Statistics Design and Analysis of Experiments
Lecture 1.1 59© 2015 Michael Stuart
Part 6Other application areas
• Agriculture
• Genetics
• Biological Sciences
• Physical Sciences
• Engineering
• Psychology
• Social Sciences?
Postgraduate Certificate in Statistics Design and Analysis of Experiments
Lecture 1.1 60© 2015 Michael Stuart
Lecture 1.1
1. Introduction to Course
2. What is an experiment?
3. Case study: Industrial process improvement
− three design principles
4. Case study: Clinical trial
− how randomization works
5. Multifactor Designs
6. Other application areas
7. Experimental vs Observational Studies
8. Strategies for Experimentation
Postgraduate Certificate in Statistics Design and Analysis of Experiments
Lecture 1.1 61© 2015 Michael Stuart
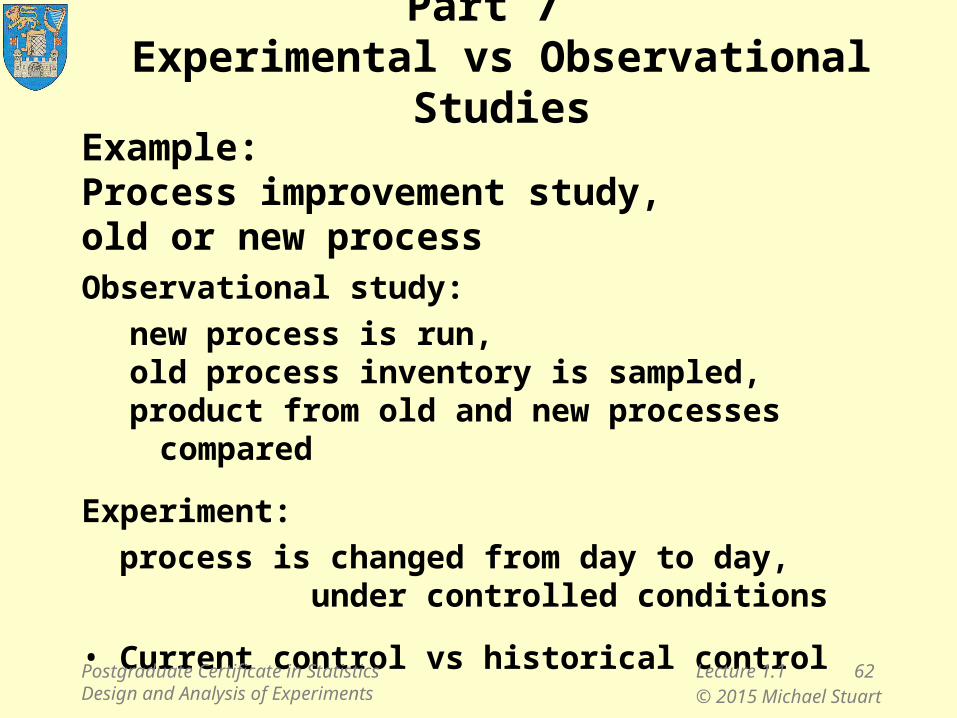
Part 7Experimental vs Observational Studies
Observational study:
new process is run,old process inventory is sampled,product from old and new processes compared
Experiment:
process is changed from day to day, under controlled conditions
• Current control vs historical control
Example:Process improvement study,old or new process
Postgraduate Certificate in Statistics Design and Analysis of Experiments
Lecture 1.1 62© 2015 Michael Stuart
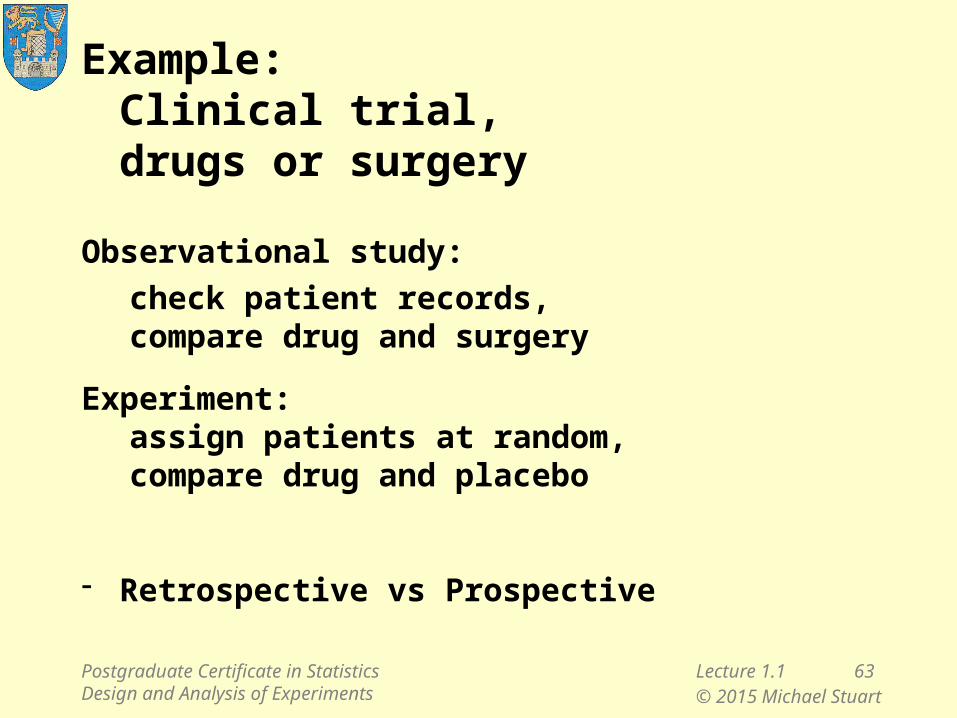
Example:Clinical trial,drugs or surgery
Observational study:
check patient records,compare drug and surgery
Experiment:assign patients at random,compare drug and placebo
- Retrospective vs Prospective
Postgraduate Certificate in Statistics Design and Analysis of Experiments
Lecture 1.1 63© 2015 Michael Stuart
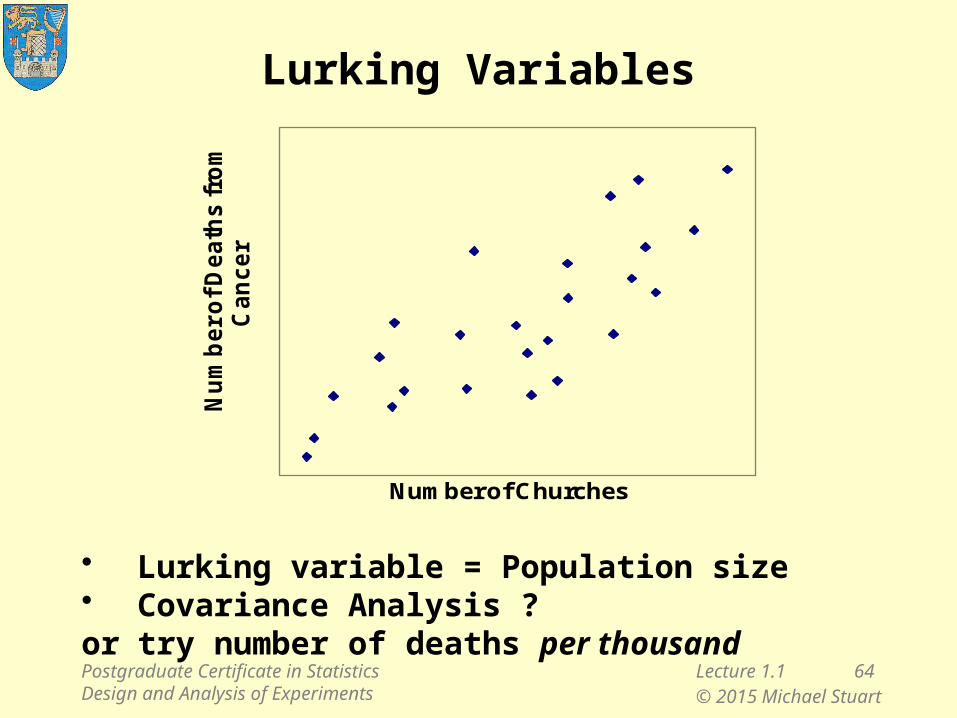
Lurking Variables
• Lurking variable = Population size• Covariance Analysis ?or try number of deaths per thousand
Nu
mb
er
of
De
ath
s f
rom
C
an
ce
r
Number of Churches
Postgraduate Certificate in Statistics Design and Analysis of Experiments
Lecture 1.1 64© 2015 Michael Stuart
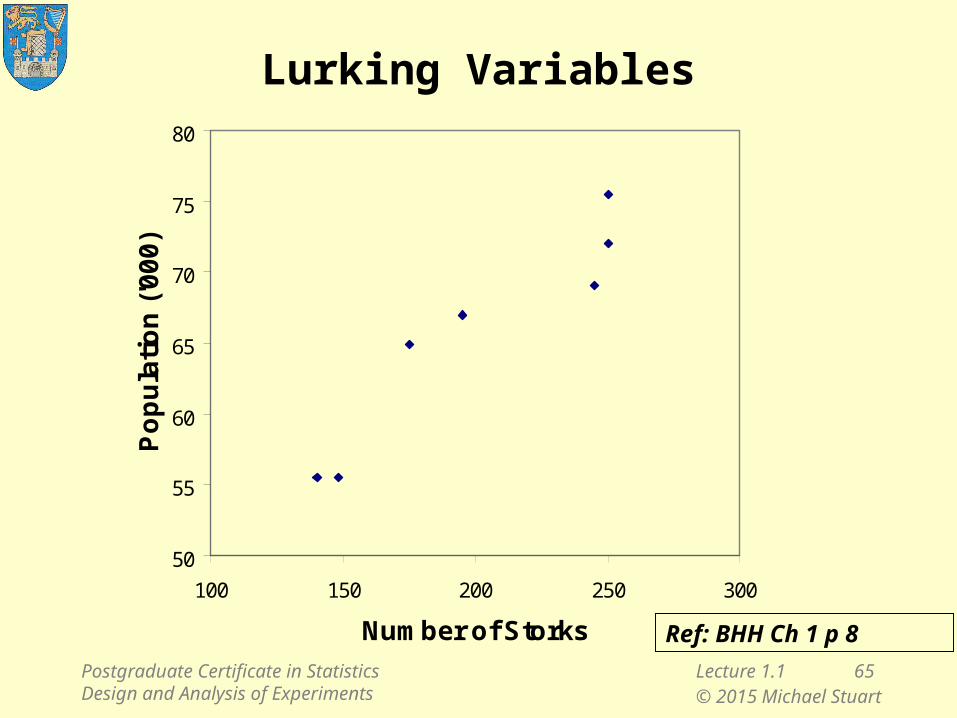
Lurking Variables
50
55
60
65
70
75
80
100 150 200 250 300
Number of Storks
Po
pu
lati
on
('0
00
)
Ref: BHH Ch 1 p 8
Postgraduate Certificate in Statistics Design and Analysis of Experiments
Lecture 1.1 65© 2015 Michael Stuart
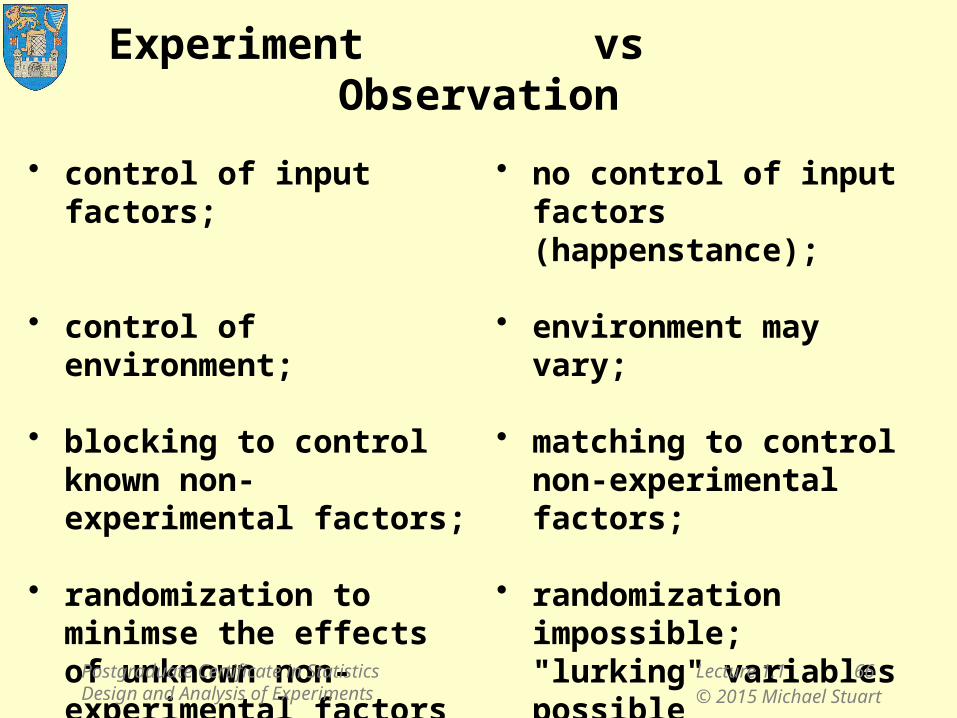
Experiment vs Observation
• control of input factors;
• control of environment;
• blocking to control known non-experimental factors;
• randomization to minimse the effects of unknown non-experimental factors
• no control of input factors (happenstance);
• environment may vary;
• matching to control non-experimental factors;
• randomization impossible; "lurking" variables possible
Postgraduate Certificate in Statistics Design and Analysis of Experiments
Lecture 1.1 66© 2015 Michael Stuart
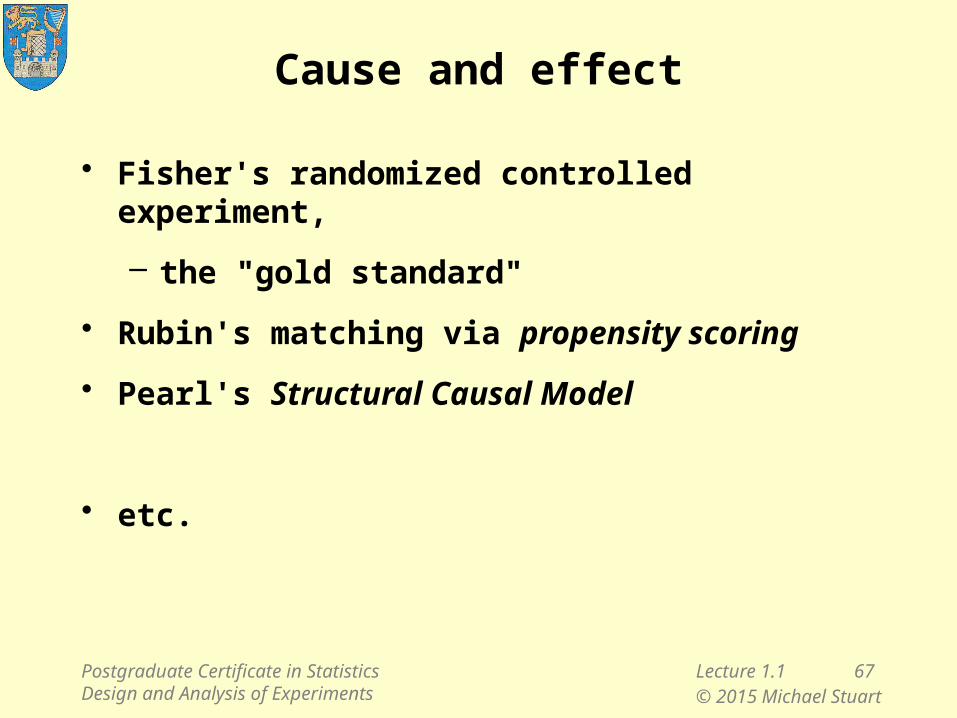
Cause and effect
• Fisher's randomized controlled experiment,
– the "gold standard"
• Rubin's matching via propensity scoring
• Pearl's Structural Causal Model
• etc.
Postgraduate Certificate in Statistics Design and Analysis of Experiments
Lecture 1.1 67© 2015 Michael Stuart
Caustic comments
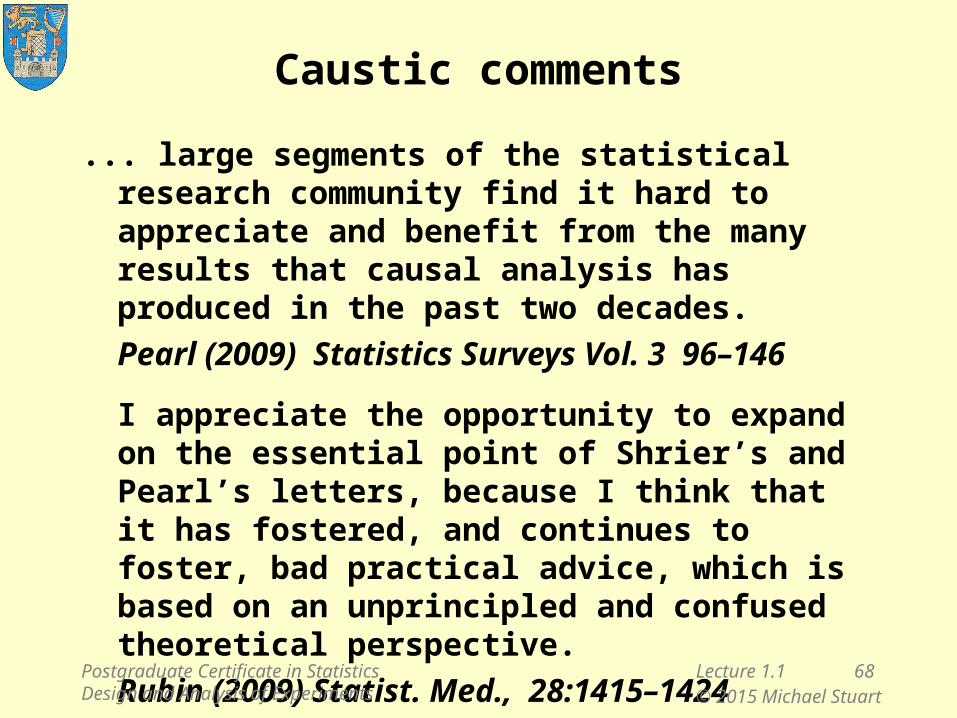
... large segments of the statistical research community find it hard to appreciate and benefit from the many results that causal analysis has produced in the past two decades.
Pearl (2009) Statistics Surveys Vol. 3 96–146
I appreciate the opportunity to expand on the essential point of Shrier’s and Pearl’s letters, because I think that it has fostered, and continues to foster, bad practical advice, which is based on an unprincipled and confused theoretical perspective.
Rubin (2009) Statist. Med., 28:1415–1424
Postgraduate Certificate in Statistics Design and Analysis of Experiments
Lecture 1.1 68© 2015 Michael Stuart
Fisher on smoking and lung cancer
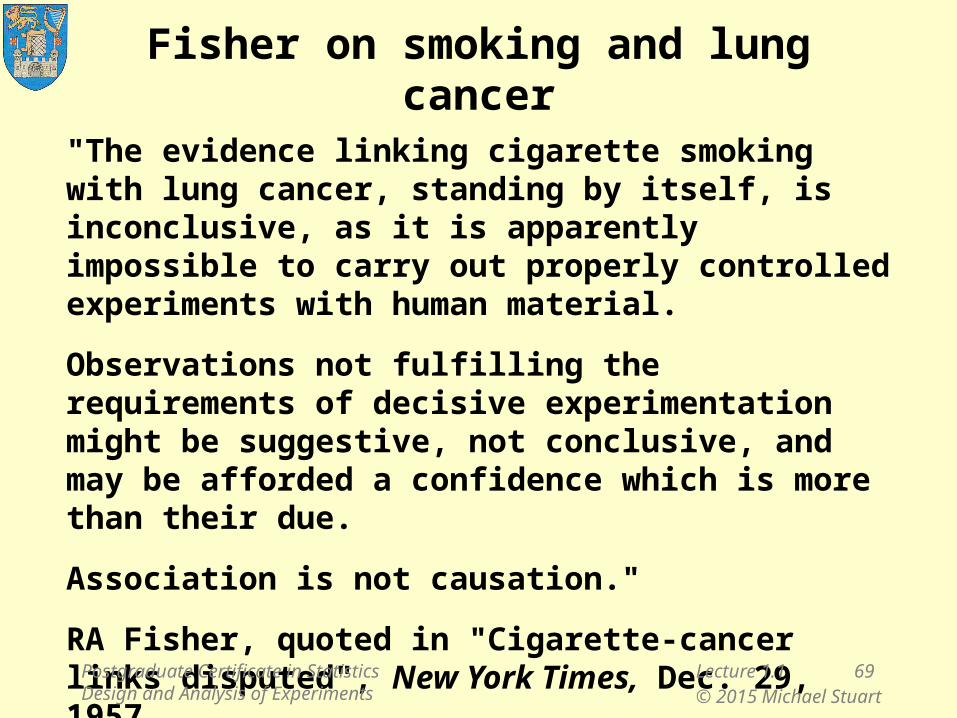
"The evidence linking cigarette smoking with lung cancer, standing by itself, is inconclusive, as it is apparently impossible to carry out properly controlled experiments with human material.
Observations not fulfilling the requirements of decisive experimentation might be suggestive, not conclusive, and may be afforded a confidence which is more than their due.
Association is not causation."
RA Fisher, quoted in "Cigarette-cancer links disputed", New York Times, Dec. 29, 1957
Postgraduate Certificate in Statistics Design and Analysis of Experiments
Lecture 1.1 69© 2015 Michael Stuart
Regression analysis andcause and effect
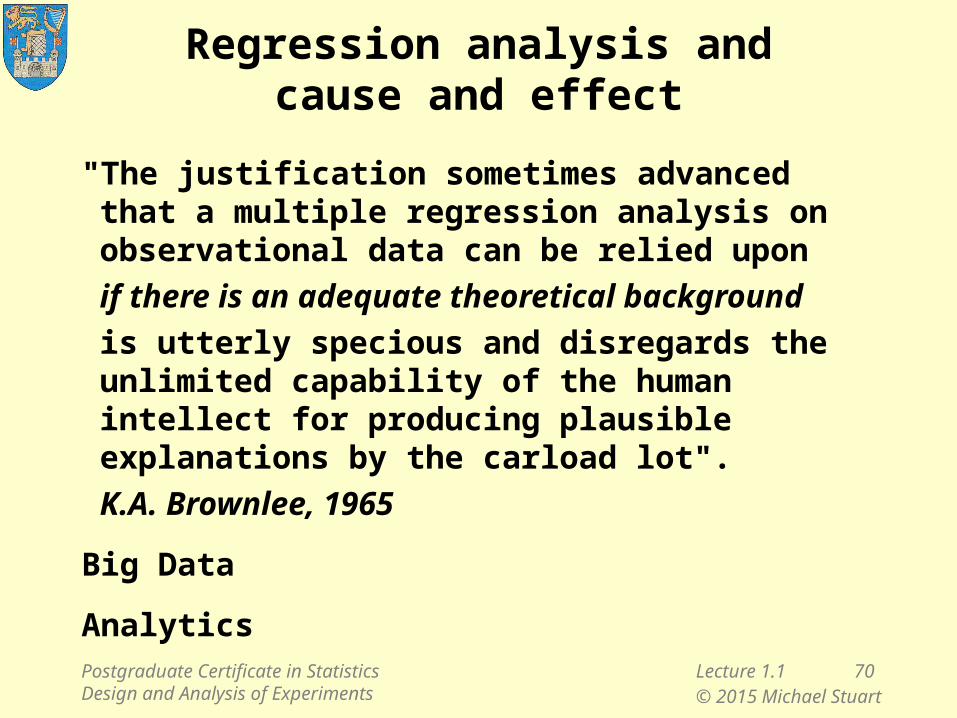
"The justification sometimes advanced that a multiple regression analysis on observational data can be relied upon
if there is an adequate theoretical background
is utterly specious and disregards the unlimited capability of the human intellect for producing plausible explanations by the carload lot".
K.A. Brownlee, 1965
Big Data
Analytics
Postgraduate Certificate in Statistics Design and Analysis of Experiments
Lecture 1.1 70© 2015 Michael Stuart
Lecture 1.1
1. Introduction to Course
2. What is an experiment?
3. Case study: Industrial process improvement
− three design principles
4. Case study: Clinical trial
− how randomization works
5. Multifactor Designs
6. Other application areas
7. Experimental vs Observational Studies
8. Strategies for Experimentation
Postgraduate Certificate in Statistics Design and Analysis of Experiments
Lecture 1.1 71© 2015 Michael Stuart

Part 8Strategies for Experimentation
Box on strategy:
When you see the credits roll at the end of a successful movie you realize there are many more things that must be attended to in addition to choosing a good script.
Similarly in running a successful experiment there are many more things that must be attended to in addition to choosing a good experimental design. (BHH, End notes)
Postgraduate Certificate in Statistics Design and Analysis of Experiments
Lecture 1.1 72© 2015 Michael Stuart
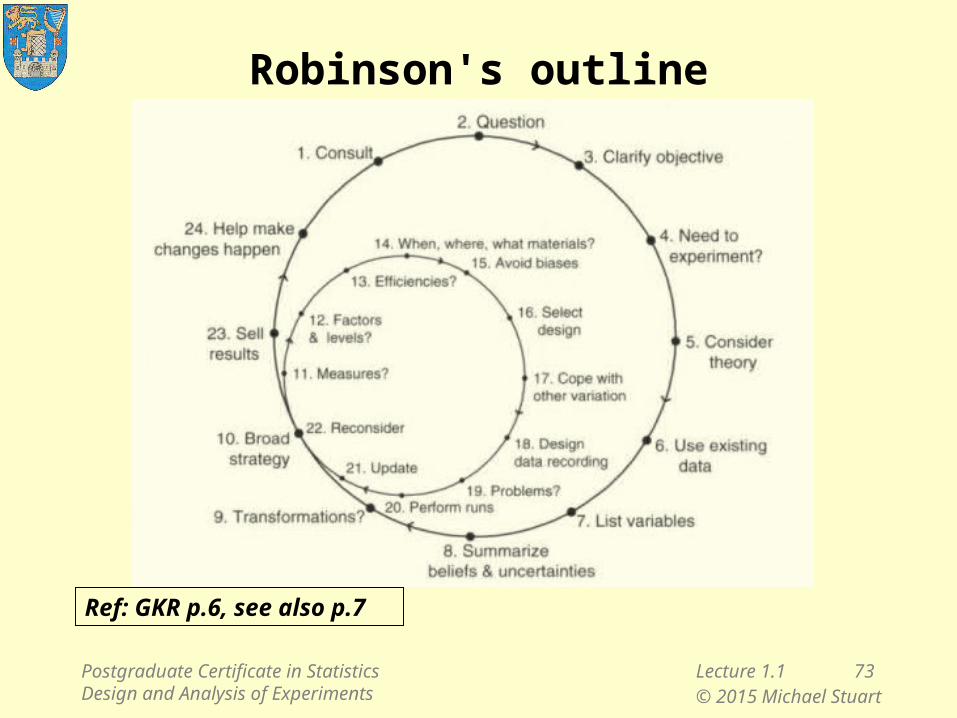
Robinson's outline
Ref: GKR p.6, see also p.7
Postgraduate Certificate in Statistics Design and Analysis of Experiments
Lecture 1.1 73© 2015 Michael Stuart
Lecture 1.1
1. Introduction to Course
2. What is an experiment?
3. Case study: Industrial process improvement
− three design principles
4. Case study: Clinical trial
− how randomization works
5. Multifactor Designs
6. Other application areas
7. Experimental vs Observational Studies
8. Strategies for Experimentation
Postgraduate Certificate in Statistics Design and Analysis of Experiments
Lecture 1.1 74© 2015 Michael Stuart
Minute test
– How much did you get out of today's class?
– How did you find the pace of today's class?
– What single point caused you the most difficulty?
– What single change by the lecturer would have most improved this class?
Postgraduate Certificate in Statistics Design and Analysis of Experiments
Lecture 1.1 75© 2015 Michael Stuart
ReadingLecture 1.1
EM Sections 4.3, 4.5.1, 4.5.3, 4.6, 5.2
Supplementary reading:
DCM Chapter 1, Section 2.5DV Chapter 1, Sections 2.2, 2.3
Next lecture:
EM Notes, Chapter 4
Postgraduate Certificate in Statistics Design and Analysis of Experiments
Lecture 1.1 76© 2015 Michael Stuart

![Systematic Approaches to Literature Reviewing Presenter: Dr. Derek Richards derek.richards [at] tcd.ie](https://img.pdfslide.us/doc/110x75/56649cc45503460f9498db16/systematic-approaches-to-literature-reviewing-presenter-dr-derek-richards.jpg)