Embed Size (px)
Citation preview
Petrinjak et al. Possibility of using Landsat satellite recordings…
18 EnvEng-IO (2020) / Vol.7 / No.1
POSSIBILITY OF USING LANDSAT SATELLITE RECORDINGS IN
VISUALIZATION AND DETECTION OF THERMAL ISLANDS IN THE
AREA OF THE CITY VINKOVCI
Ivana Petrinjak 1, Nikola Kranjčić 1*, Milan Rezo 1, Bojan Đurin 2 1 University of Zagreb, Faculty of Geotechnical Engineering, Hallerova aleja 7, 42000 Varaždin, Croatia
2 University North, Department of Civil Engineering, Jurja Križanića 31b, 42000 Varaždin, Croatia
*E-mail of corresponding author: [email protected]
Abstract: All satellite data is generated as a record of electromagnetic radiation detected on the satellite sensor. The product
of collecting information in remote explorations is a digital satellite record consisting of a pixel network representing the
smallest surface that a particular sensor can collect, which is also a spatial resolution of the image. The position of each pixel
is determined in the Cartesian coordinate system. To allow the ability to monitor climate change or mitigate the consequences
of a natural disaster, the USGS has developed the Earth Explorer tool. USGS (US Geological Institute) provides science on
natural hazards endangering life and existence; water, energy, minerals and other natural resources we rely on. This analysis
will highlight the ability to use and monitor satellite imagery using the Earth Explorer browser. All satellite images are
processed in QGIS. The spatial resolution of the satellite index (NDVI) as a quantitative measure of the state of the vegetation
cover was tested on Landsat 8 images in the area of the city of Vinkovci. Highlighted natural disasters are thermal islands,
and damage to the forest cover.
Keywords: USGS Earth Explorer, Landsat 8, natural disasters, floods, thermal islands.
Received: 24.09.2019. / Accepted: 16.01.2020.
Published online: 10.07.2020.
Original scientific paper
https://doi.org/10.37023/ee.7.1.3
1. INTRODUCTION
Remote Sensing is the process of detecting and monitoring the physical and solid surface area by measuring
reflected and emitted radiation at a distance from the targeted areas. Special cameras capture images of Earth from
a distance that help researchers "feel" things around Earth. It excludes all activities from recordings, procedures,
analyzes, interpretations, and obtains data from data collected through these studies (Lapaine & Frančula 2015)
Data is obtained from long distance (from several hundred to several thousand kilometres) instruments
placed in aircraft or spacecraft. The first aerial photography of the Earth was made in the mid-19th century. In
1858, the Balloon Tournachon made the first recordings to analyze the metropolitan area of Paris, and in 1862,
the recordings used in the American Civil War. Massive application of aerial imagery and photointerpretation
began in the First and continued in the Second World War. The revolution in remote sensing is the beginnin g
of space photography. The first capture of Earth from space was done in 1959 by the US Explorer, Explorer
6. There are several recording procedures, which are sorted by recording (full size or results), equipment
(photographic or electronic), transmission and processes (analogue or digital), number of channels in the
spectrum (single or multi-channel), recording view (plane or stereoscopic), use of natural radiation or
broadcast with the aircraft (passive or active), usage (for geodetic, cartographic, agrotechnical, meteorological,
traffic, military and other needs).
Some specific usage of remote sensing images:
• large forest fires can be mapped from space, which enables monitoring of larger area,
• cloud monitoring to predict the weather or view of the volcano's evacuation and help track storms.
• monitoring the growth of the city and changes in farmland or forests over several years or even
de-seeding,
• Ocean Bottom Mapping - Detecting and mapping rough ocean bottom topographies (e.g., huge
mountain ranges, deep-sided canyons and "magnetic strip" at the bottom of the ocean).
The beginning of collection usable and more widely available satellite information with applications to
various segments of human activity is closely linked to the Landsat mission, which has operated since 1972 to
the present. The Landsat program, which established a collaboration between the United States Space Agency
(NASA) and the US Geo-logical Survey (USGS), consist of a series of satellite missions (Landsat 1 - Landsat
8). They have been continuously upgraded to this day, and today they are one of the most significant sources
of global retrospective data (Gutman & Masek 2012). The use of satellite Landsat imagery has been particularly
increased in last few years since the archives of the recordings are made public on the USGS portal. It is
Petrinjak et al. Possibility of using Landsat satellite recordings…
EnvEng-IO (2020) / Vol.7 / No.1 19
important to familiarize society with readily available information so that different scientific fields can
progress more easily. The most used satellite imagery sources are USGS Earth Explorer, Landviewer,
Copernicus Open Access Hub, Sentinel Hub, Nasa Earthdata Search, Remote Pixel, INPE Image Catalogue
(Top free satellite imagery sources in 2019).
This paper seeks to emphasize the issue of natural disasters, followed largely by environmental pollution
sources. Furthermore, besides population growth, environmental pollution is also significantly influenced by
human activities, whose primary role is meeting the needs of a part of the population, with the most significant
impact on the natural environment in the form of greenhouse gases, environmental degradation, increasing
wastewater, etc. Therefore, introducing the monitoring of satellite images in order to protect natural resources
and enable further growth and development of the planet Earth. Recent advances in remote sensing and
technology applications have made it possible to use remote sensing satellite imagery to assess the
vulnerability of urban areas to natural disasters such as earthquakes. QuickBird, a high-resolution commercial
satellite with a maximum spatial resolution of 0.6 m, successfully launched on October 18, 2001. It acquires
optical images of urban areas and enables the identification and assessment of critical areas at which objects
are most at risk (developing threat assessments, plans protection). The area of the Republic of Croatia, as part
of the Mediterranean-Transasian belt, is characterized by a pronounced seismic activity and in the future, this
type of monitoring could be applied in the construction of resilient buildings
2. LANDSAT MISSION
Since 1972, Landsat satellites have provided continuous spatial data on Earth's terrestrial surface in order to
improve scientific research in order to understand our rapidly changing planet. First Landsat satellites generated a
vast amount of new data that improved the mapping of remote areas and geological features along with digital
vegetation analysis. Landsat's spatial and spectral resolutions have increased its use for broader societal benefits
such as global crop forecasting, forest monitoring, water use, carbon estimates, and as a basis for developing a
Google map. Landsat's long-term data record is important resource for monitoring land cover change and land use
over a period of more than four decades. A free and open Land-Hour data policy, published in 2008, launched a
global-scale survey. Developing analytical and computational capabilities allows solving a complex worldwide
problem. Landsat offers real-time monitoring capabilities to help further understand the changing planet Earth.
Thus, a unique historical archive was created that stands out for its number of details, quality and the
spatiotemporal segment covered. This database continuously provides insight into the visual and scientific features
of our planet. The Landsat recording archive is often cited as one of the greatest treasures of humanity, an
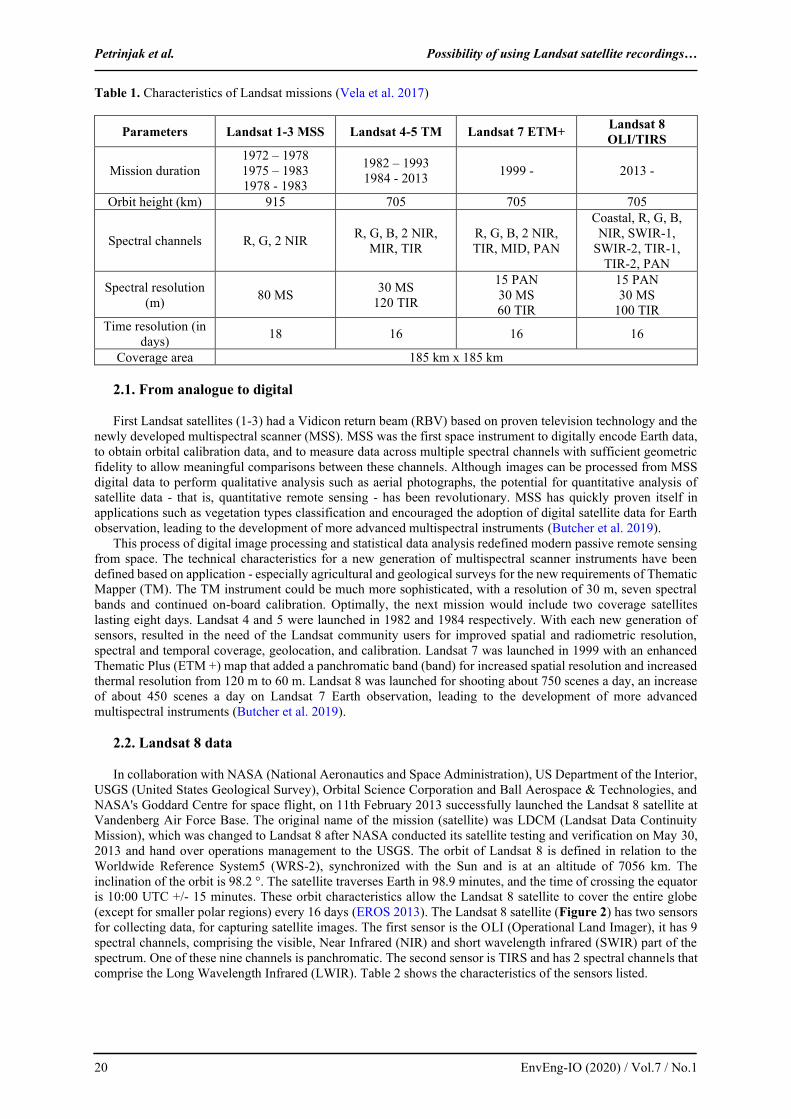
achievement that brings great benefit to all segments of society (Butcher et al. 2019). Table 1 shows the
characteristics of the Landsat missions, where R - Red, G - Green, B - Blue, NIR – Near Infrared, SWIR – Short
Wave Infrared, TIR – Thermal Infrared, MID - Mid-Infrared, MS - lower spatial resolution - multispectral, PAN
- higher spatial resolution - panchromatic. Early Landsat recordings revealed many errors in modern nautical
charts. For example, researchers have seen that reefs, coasts, and islands have been misplaced or omitted entirely
in the Chagos Islands (Figure 1; left). Landsat provided information to warn boaters in the region until the revised
chart (Figure 1; middle) included the newly discovered Colvocoresses coral reef (fully submerged "Indian Ocean
atoll") and the adjusted position of the ring coral reef, Speakers bank. Landsat dated April 2, 2018 (Figure 1; right)
shows the current locations of the Colvocoresses, Speakers Bank and Blenheim reefs.
Figure 1. Nautical map and new coral reef in Indian ocean (Butcher et al. 2019)
Petrinjak et al. Possibility of using Landsat satellite recordings…
20 EnvEng-IO (2020) / Vol.7 / No.1
Table 1. Characteristics of Landsat missions (Vela et al. 2017)
Parameters Landsat 1-3 MSS Landsat 4-5 TM Landsat 7 ETM+ Landsat 8
OLI/TIRS
Mission duration
1972 – 1978
1975 – 1983
1978 - 1983
1982 – 1993
1984 - 2013 1999 - 2013 -
Orbit height (km) 915 705 705 705
Spectral channels R, G, 2 NIR R, G, B, 2 NIR,
MIR, TIR
R, G, B, 2 NIR,
TIR, MID, PAN
Coastal, R, G, B,
NIR, SWIR-1,
SWIR-2, TIR-1,
TIR-2, PAN
Spectral resolution
(m) 80 MS
30 MS
120 TIR
15 PAN
30 MS
60 TIR
15 PAN
30 MS
100 TIR
Time resolution (in
days) 18 16 16 16
Coverage area 185 km x 185 km
2.1. From analogue to digital
First Landsat satellites (1-3) had a Vidicon return beam (RBV) based on proven television technology and the
newly developed multispectral scanner (MSS). MSS was the first space instrument to digitally encode Earth data,
to obtain orbital calibration data, and to measure data across multiple spectral channels with sufficient geometric
fidelity to allow meaningful comparisons between these channels. Although images can be processed from MSS
digital data to perform qualitative analysis such as aerial photographs, the potential for quantitative analysis of
satellite data - that is, quantitative remote sensing - has been revolutionary. MSS has quickly proven itself in
applications such as vegetation types classification and encouraged the adoption of digital satellite data for Earth
observation, leading to the development of more advanced multispectral instruments (Butcher et al. 2019).
This process of digital image processing and statistical data analysis redefined modern passive remote sensing
from space. The technical characteristics for a new generation of multispectral scanner instruments have been
defined based on application - especially agricultural and geological surveys for the new requirements of Thematic
Mapper (TM). The TM instrument could be much more sophisticated, with a resolution of 30 m, seven spectral
bands and continued on-board calibration. Optimally, the next mission would include two coverage satellites
lasting eight days. Landsat 4 and 5 were launched in 1982 and 1984 respectively. With each new generation of
sensors, resulted in the need of the Landsat community users for improved spatial and radiometric resolution,
spectral and temporal coverage, geolocation, and calibration. Landsat 7 was launched in 1999 with an enhanced
Thematic Plus (ETM +) map that added a panchromatic band (band) for increased spatial resolution and increased
thermal resolution from 120 m to 60 m. Landsat 8 was launched for shooting about 750 scenes a day, an increase
of about 450 scenes a day on Landsat 7 Earth observation, leading to the development of more advanced
multispectral instruments (Butcher et al. 2019).
2.2. Landsat 8 data
In collaboration with NASA (National Aeronautics and Space Administration), US Department of the Interior,
USGS (United States Geological Survey), Orbital Science Corporation and Ball Aerospace & Technologies, and
NASA's Goddard Centre for space flight, on 11th February 2013 successfully launched the Landsat 8 satellite at
Vandenberg Air Force Base. The original name of the mission (satellite) was LDCM (Landsat Data Continuity
Mission), which was changed to Landsat 8 after NASA conducted its satellite testing and verification on May 30,
2013 and hand over operations management to the USGS. The orbit of Landsat 8 is defined in relation to the
Worldwide Reference System5 (WRS-2), synchronized with the Sun and is at an altitude of 7056 km. The
inclination of the orbit is 98.2 °. The satellite traverses Earth in 98.9 minutes, and the time of crossing the equator
is 10:00 UTC +/- 15 minutes. These orbit characteristics allow the Landsat 8 satellite to cover the entire globe
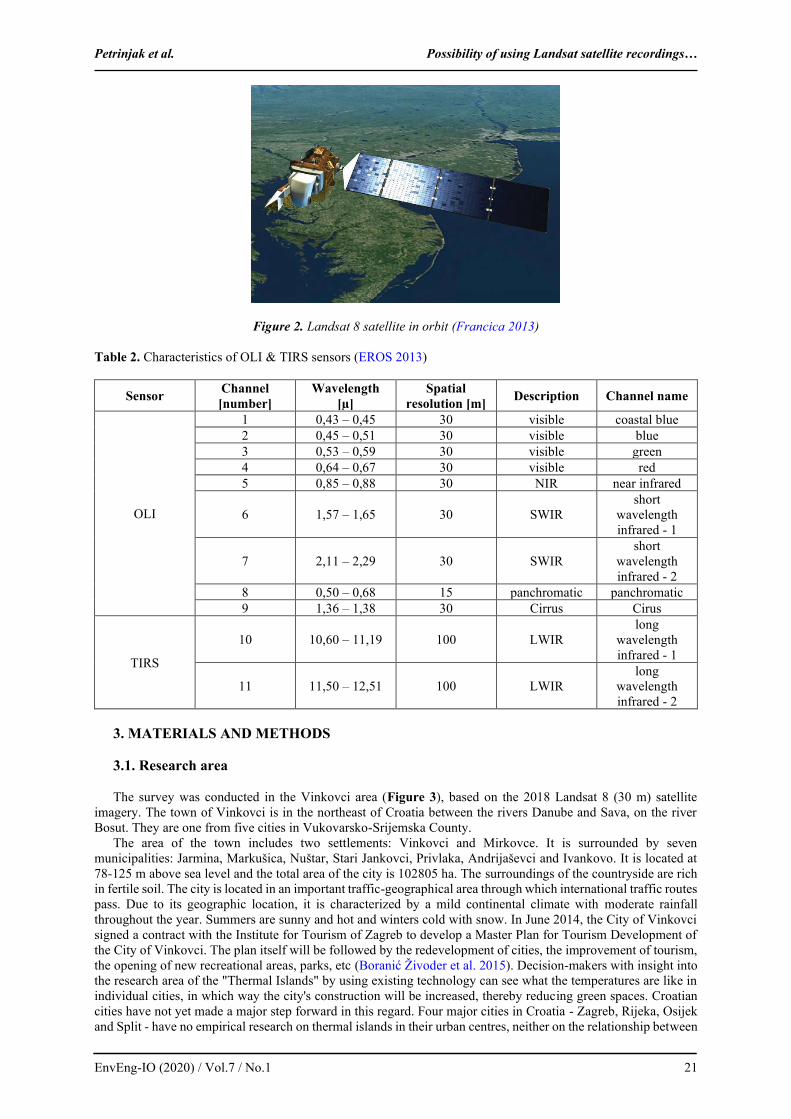
(except for smaller polar regions) every 16 days (EROS 2013). The Landsat 8 satellite (Figure 2) has two sensors
for collecting data, for capturing satellite images. The first sensor is the OLI (Operational Land Imager), it has 9
spectral channels, comprising the visible, Near Infrared (NIR) and short wavelength infrared (SWIR) part of the
spectrum. One of these nine channels is panchromatic. The second sensor is TIRS and has 2 spectral channels that
comprise the Long Wavelength Infrared (LWIR). Table 2 shows the characteristics of the sensors listed.
Petrinjak et al. Possibility of using Landsat satellite recordings…
EnvEng-IO (2020) / Vol.7 / No.1 21
Figure 2. Landsat 8 satellite in orbit (Francica 2013)
Table 2. Characteristics of OLI & TIRS sensors (EROS 2013)
Sensor Channel
[number]
Wavelength
[µ]
Spatial
resolution [m] Description Channel name
OLI
1 0,43 – 0,45 30 visible coastal blue
2 0,45 – 0,51 30 visible blue
3 0,53 – 0,59 30 visible green
4 0,64 – 0,67 30 visible red
5 0,85 – 0,88 30 NIR near infrared
6 1,57 – 1,65 30 SWIR
short
wavelength
infrared - 1
7 2,11 – 2,29 30 SWIR
short
wavelength
infrared - 2
8 0,50 – 0,68 15 panchromatic panchromatic
9 1,36 – 1,38 30 Cirrus Cirus
TIRS
10 10,60 – 11,19 100 LWIR
long
wavelength
infrared - 1
11 11,50 – 12,51 100 LWIR
long
wavelength
infrared - 2
3. MATERIALS AND METHODS
3.1. Research area
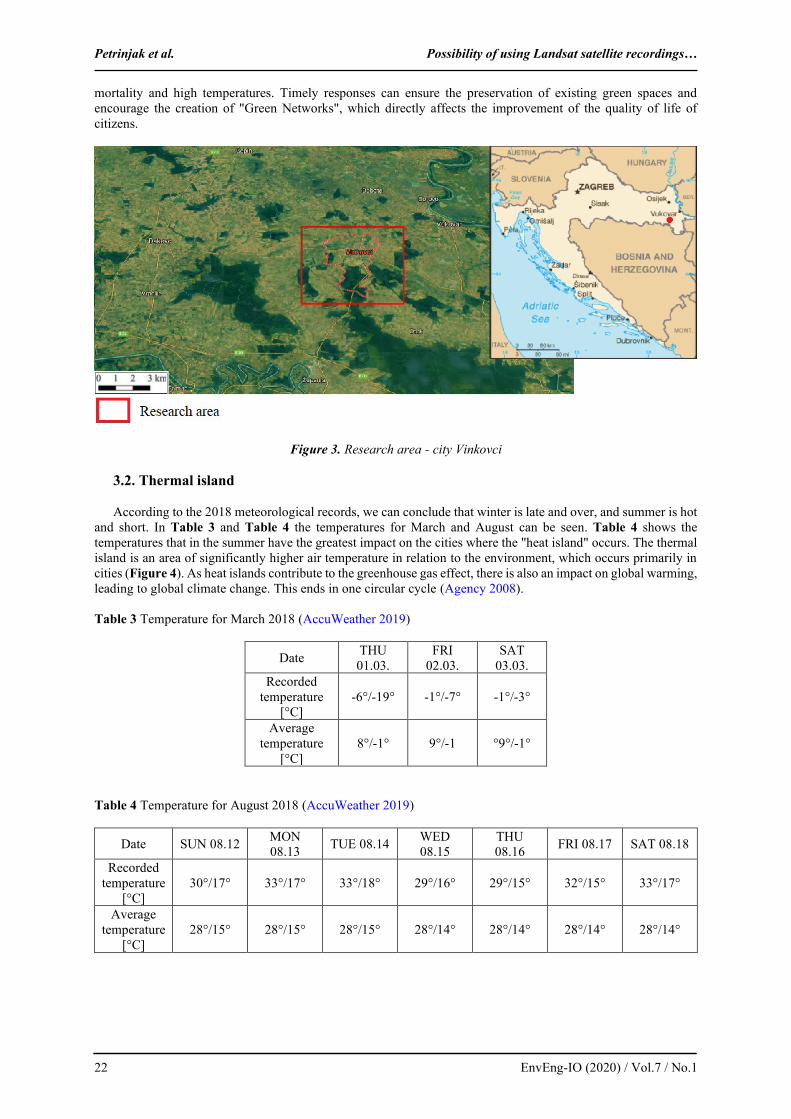
The survey was conducted in the Vinkovci area (Figure 3), based on the 2018 Landsat 8 (30 m) satellite
imagery. The town of Vinkovci is in the northeast of Croatia between the rivers Danube and Sava, on the river
Bosut. They are one from five cities in Vukovarsko-Srijemska County.
The area of the town includes two settlements: Vinkovci and Mirkovce. It is surrounded by seven
municipalities: Jarmina, Markušica, Nuštar, Stari Jankovci, Privlaka, Andrijaševci and Ivankovo. It is located at
78-125 m above sea level and the total area of the city is 102805 ha. The surroundings of the countryside are rich
in fertile soil. The city is located in an important traffic-geographical area through which international traffic routes
pass. Due to its geographic location, it is characterized by a mild continental climate with moderate rainfall
throughout the year. Summers are sunny and hot and winters cold with snow. In June 2014, the City of Vinkovci
signed a contract with the Institute for Tourism of Zagreb to develop a Master Plan for Tourism Development of
the City of Vinkovci. The plan itself will be followed by the redevelopment of cities, the improvement of tourism,
the opening of new recreational areas, parks, etc (Boranić Živoder et al. 2015). Decision-makers with insight into
the research area of the "Thermal Islands" by using existing technology can see what the temperatures are like in
individual cities, in which way the city's construction will be increased, thereby reducing green spaces. Croatian
cities have not yet made a major step forward in this regard. Four major cities in Croatia - Zagreb, Rijeka, Osijek
and Split - have no empirical research on thermal islands in their urban centres, neither on the relationship between
Petrinjak et al. Possibility of using Landsat satellite recordings…
22 EnvEng-IO (2020) / Vol.7 / No.1
mortality and high temperatures. Timely responses can ensure the preservation of existing green spaces and
encourage the creation of "Green Networks", which directly affects the improvement of the quality of life of
citizens.
Figure 3. Research area - city Vinkovci
3.2. Thermal island
According to the 2018 meteorological records, we can conclude that winter is late and over, and summer is hot
and short. In Table 3 and Table 4 the temperatures for March and August can be seen. Table 4 shows the
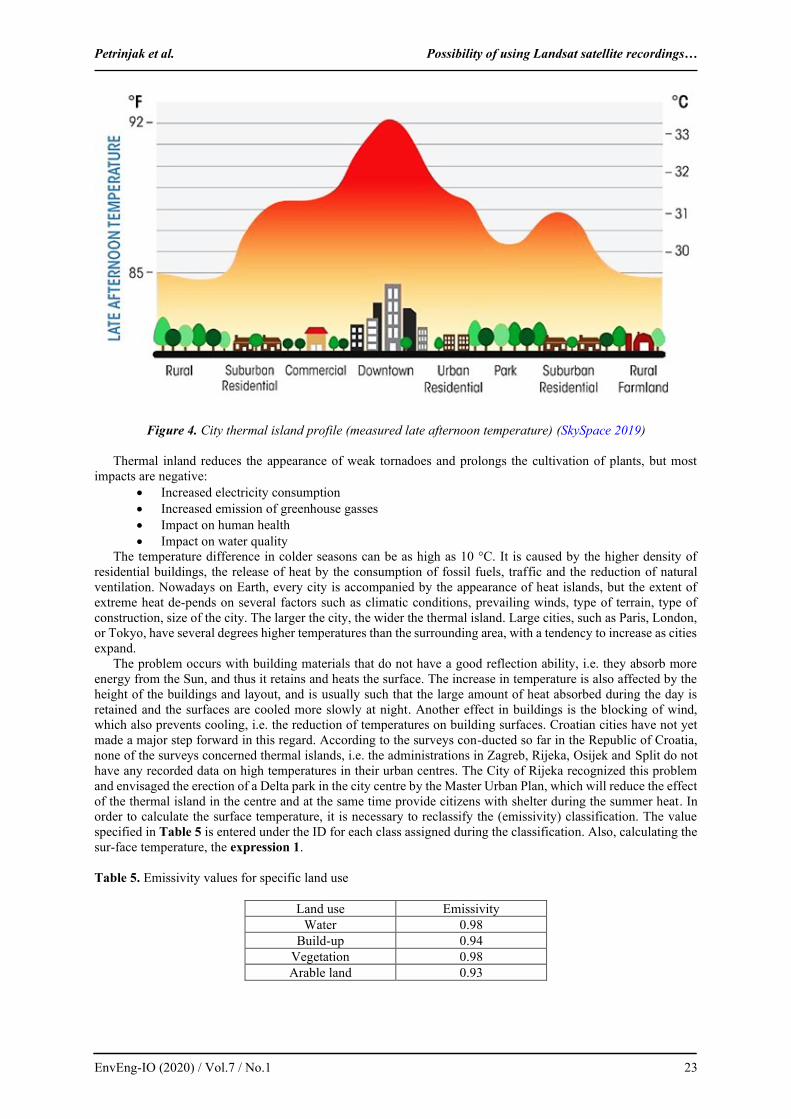
temperatures that in the summer have the greatest impact on the cities where the "heat island" occurs. The thermal
island is an area of significantly higher air temperature in relation to the environment, which occurs primarily in
cities (Figure 4). As heat islands contribute to the greenhouse gas effect, there is also an impact on global warming,
leading to global climate change. This ends in one circular cycle (Agency 2008).
Table 3 Temperature for March 2018 (AccuWeather 2019)
Date THU
01.03.
FRI
02.03.
SAT
03.03.
Recorded
temperature
[°C]
-6°/-19° -1°/-7° -1°/-3°
Average
temperature
[°C]
8°/-1° 9°/-1 °9°/-1°
Table 4 Temperature for August 2018 (AccuWeather 2019)
Date SUN 08.12 MON
08.13 TUE 08.14
WED
08.15
THU
08.16 FRI 08.17 SAT 08.18
Recorded
temperature
[°C]
30°/17° 33°/17° 33°/18° 29°/16° 29°/15° 32°/15° 33°/17°
Average
temperature
[°C]
28°/15° 28°/15° 28°/15° 28°/14° 28°/14° 28°/14° 28°/14°
Petrinjak et al. Possibility of using Landsat satellite recordings…
EnvEng-IO (2020) / Vol.7 / No.1 23
Figure 4. City thermal island profile (measured late afternoon temperature) (SkySpace 2019)
Thermal inland reduces the appearance of weak tornadoes and prolongs the cultivation of plants, but most
impacts are negative:
• Increased electricity consumption
• Increased emission of greenhouse gasses
• Impact on human health
• Impact on water quality
The temperature difference in colder seasons can be as high as 10 °C. It is caused by the higher density of
residential buildings, the release of heat by the consumption of fossil fuels, traffic and the reduction of natural
ventilation. Nowadays on Earth, every city is accompanied by the appearance of heat islands, but the extent of
extreme heat de-pends on several factors such as climatic conditions, prevailing winds, type of terrain, type of
construction, size of the city. The larger the city, the wider the thermal island. Large cities, such as Paris, London,
or Tokyo, have several degrees higher temperatures than the surrounding area, with a tendency to increase as cities
expand.
The problem occurs with building materials that do not have a good reflection ability, i.e. they absorb more
energy from the Sun, and thus it retains and heats the surface. The increase in temperature is also affected by the
height of the buildings and layout, and is usually such that the large amount of heat absorbed during the day is
retained and the surfaces are cooled more slowly at night. Another effect in buildings is the blocking of wind,
which also prevents cooling, i.e. the reduction of temperatures on building surfaces. Croatian cities have not yet
made a major step forward in this regard. According to the surveys con-ducted so far in the Republic of Croatia,
none of the surveys concerned thermal islands, i.e. the administrations in Zagreb, Rijeka, Osijek and Split do not
have any recorded data on high temperatures in their urban centres. The City of Rijeka recognized this problem
and envisaged the erection of a Delta park in the city centre by the Master Urban Plan, which will reduce the effect
of the thermal island in the centre and at the same time provide citizens with shelter during the summer heat. In
order to calculate the surface temperature, it is necessary to reclassify the (emissivity) classification. The value
specified in Table 5 is entered under the ID for each class assigned during the classification. Also, calculating the
sur-face temperature, the expression 1.
Table 5. Emissivity values for specific land use
Land use Emissivity
Water 0.98
Build-up 0.94
Vegetation 0.98
Arable land 0.93
Petrinjak et al. Possibility of using Landsat satellite recordings…
24 EnvEng-IO (2020) / Vol.7 / No.1
The surface temperature values for a given area are calculated by the following expression:
( ) ( )b b 2T T / 1 *T / c *ln e= + (1)
where:
Tb = At-Satellite Brightness Temperature
λ = wavelength
c2 = h∗c/s = 1.4388∗10−2c2 = h∗c/s = 1.4388∗10−2 m K = 14388 µm K
h = Planck’s constant = 6.626∗10−346.626∗10−34 J s
s = Boltzmann constant = 1.38∗10−231.38∗10−23 J/K
c = speed of light = 2.998∗1082.998∗108 m/s.
The emission wavelengths for the Landsat class are listed in Table 6.
Table 6. The emission wavelength for the Landsat class
Satellite Class
Landsat 4;5;7 6
Landsat 8 10
Landsat 8 11
3.3. Normalized Difference Vegetation Index - NDVI
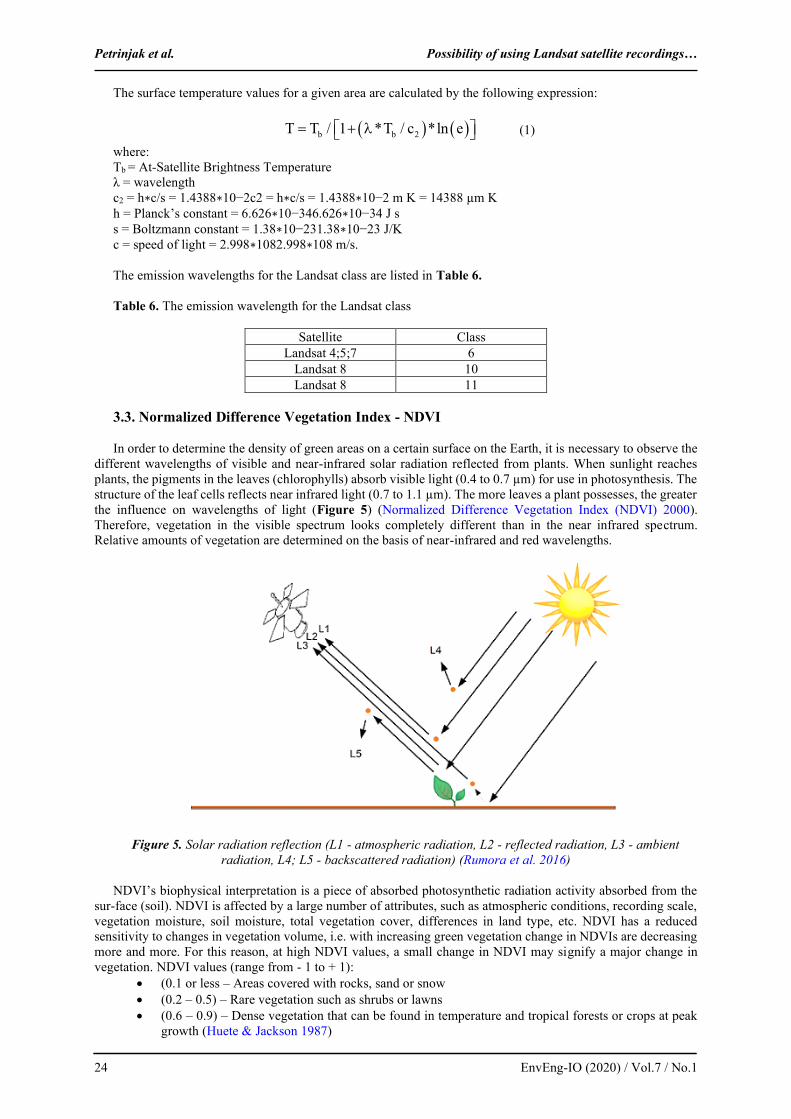
In order to determine the density of green areas on a certain surface on the Earth, it is necessary to observe the
different wavelengths of visible and near-infrared solar radiation reflected from plants. When sunlight reaches
plants, the pigments in the leaves (chlorophylls) absorb visible light (0.4 to 0.7 µm) for use in photosynthesis. The
structure of the leaf cells reflects near infrared light (0.7 to 1.1 µm). The more leaves a plant possesses, the greater
the influence on wavelengths of light (Figure 5) (Normalized Difference Vegetation Index (NDVI) 2000).
Therefore, vegetation in the visible spectrum looks completely different than in the near infrared spectrum.
Relative amounts of vegetation are determined on the basis of near-infrared and red wavelengths.
Figure 5. Solar radiation reflection (L1 - atmospheric radiation, L2 - reflected radiation, L3 - ambient
radiation, L4; L5 - backscattered radiation) (Rumora et al. 2016)
NDVI’s biophysical interpretation is a piece of absorbed photosynthetic radiation activity absorbed from the
sur-face (soil). NDVI is affected by a large number of attributes, such as atmospheric conditions, recording scale,
vegetation moisture, soil moisture, total vegetation cover, differences in land type, etc. NDVI has a reduced
sensitivity to changes in vegetation volume, i.e. with increasing green vegetation change in NDVIs are decreasing
more and more. For this reason, at high NDVI values, a small change in NDVI may signify a major change in
vegetation. NDVI values (range from - 1 to + 1):
• (0.1 or less – Areas covered with rocks, sand or snow
• (0.2 – 0.5) – Rare vegetation such as shrubs or lawns
• (0.6 – 0.9) – Dense vegetation that can be found in temperature and tropical forests or crops at peak
growth (Huete & Jackson 1987)
Petrinjak et al. Possibility of using Landsat satellite recordings…
EnvEng-IO (2020) / Vol.7 / No.1 25
NDVI can be calculated by Expression 2:
NDVI (NIR RED) (NIR RED)= − + (2)
where:
NIR – near infrared channel,
RED – red channel
4. RESULTS
4.1. Classification
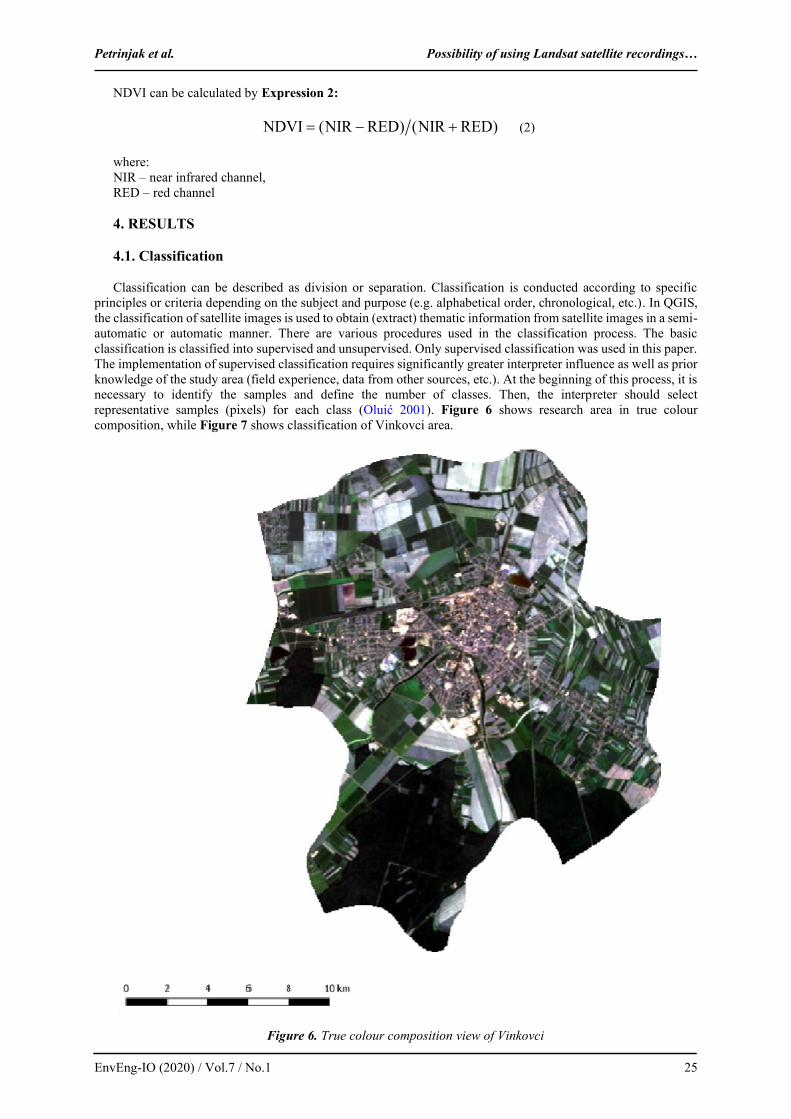
Classification can be described as division or separation. Classification is conducted according to specific
principles or criteria depending on the subject and purpose (e.g. alphabetical order, chronological, etc.). In QGIS,
the classification of satellite images is used to obtain (extract) thematic information from satellite images in a semi-
automatic or automatic manner. There are various procedures used in the classification process. The basic
classification is classified into supervised and unsupervised. Only supervised classification was used in this paper.
The implementation of supervised classification requires significantly greater interpreter influence as well as prior
knowledge of the study area (field experience, data from other sources, etc.). At the beginning of this process, it is
necessary to identify the samples and define the number of classes. Then, the interpreter should select
representative samples (pixels) for each class (Oluić 2001). Figure 6 shows research area in true colour
composition, while Figure 7 shows classification of Vinkovci area.
Figure 6. True colour composition view of Vinkovci
Petrinjak et al. Possibility of using Landsat satellite recordings…
26 EnvEng-IO (2020) / Vol.7 / No.1
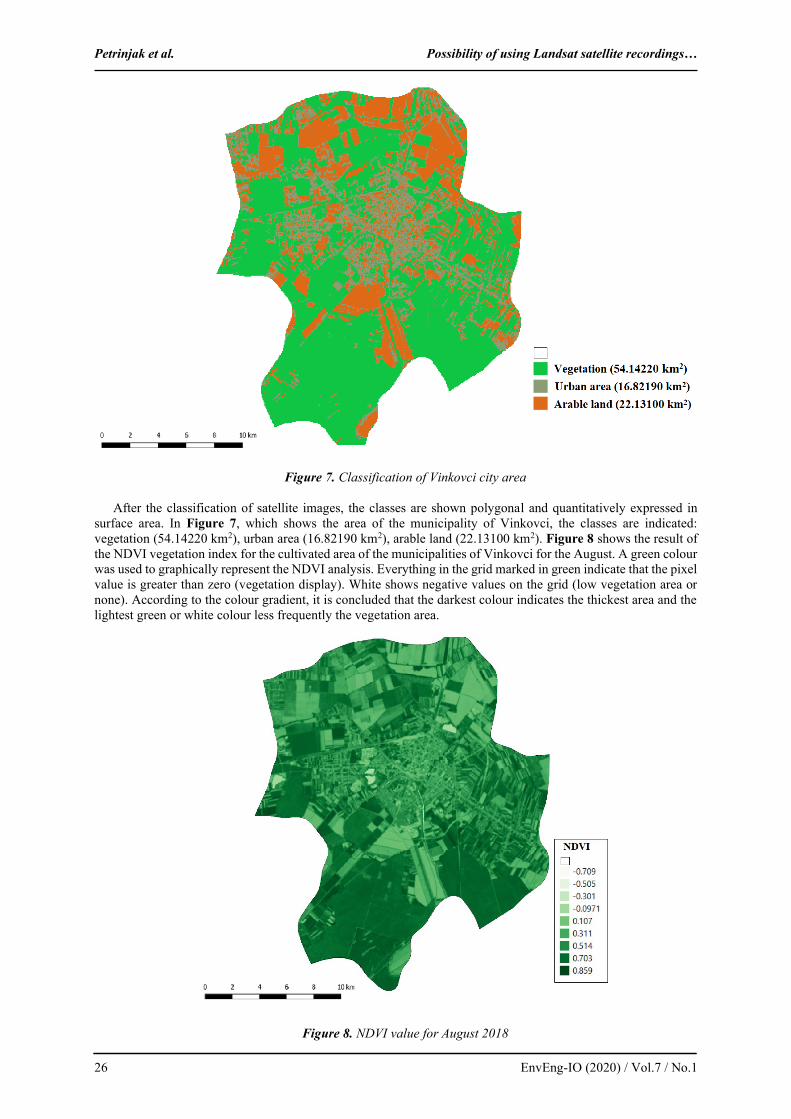
Figure 7. Classification of Vinkovci city area
After the classification of satellite images, the classes are shown polygonal and quantitatively expressed in
surface area. In Figure 7, which shows the area of the municipality of Vinkovci, the classes are indicated:
vegetation (54.14220 km2), urban area (16.82190 km2), arable land (22.13100 km2). Figure 8 shows the result of
the NDVI vegetation index for the cultivated area of the municipalities of Vinkovci for the August. A green colour
was used to graphically represent the NDVI analysis. Everything in the grid marked in green indicate that the pixel
value is greater than zero (vegetation display). White shows negative values on the grid (low vegetation area or
none). According to the colour gradient, it is concluded that the darkest colour indicates the thickest area and the
lightest green or white colour less frequently the vegetation area.
Figure 8. NDVI value for August 2018
Petrinjak et al. Possibility of using Landsat satellite recordings…
EnvEng-IO (2020) / Vol.7 / No.1 27
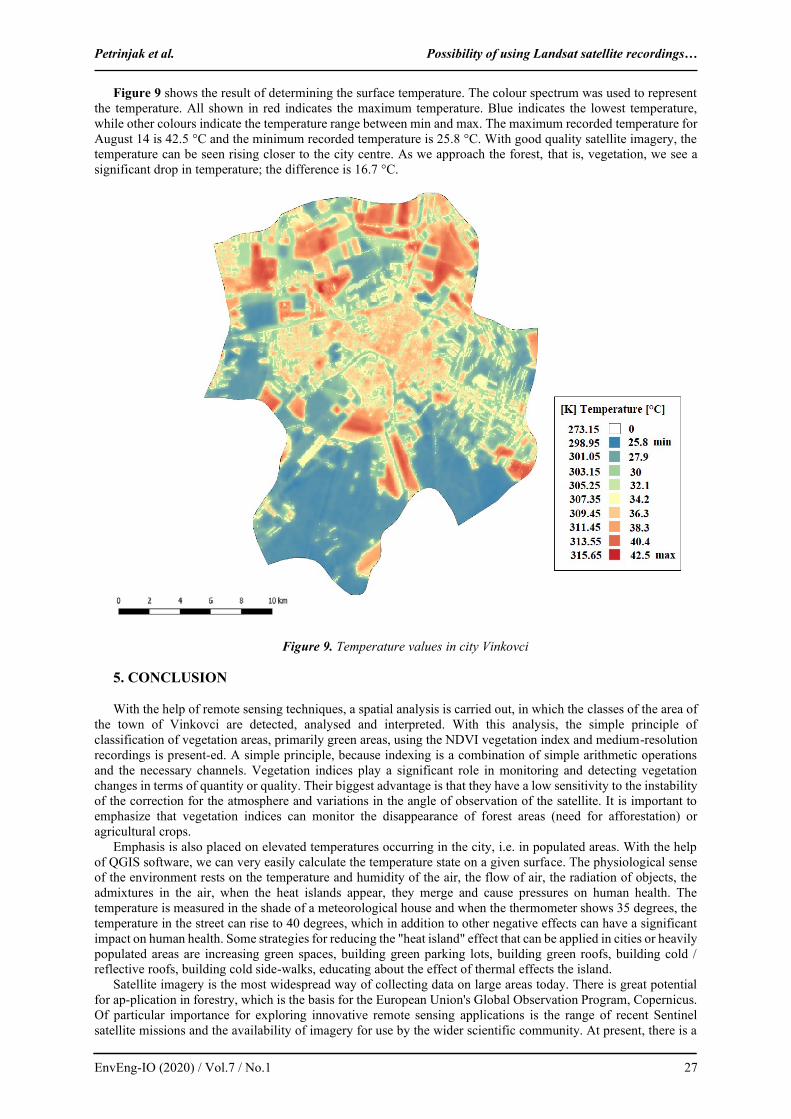
Figure 9 shows the result of determining the surface temperature. The colour spectrum was used to represent
the temperature. All shown in red indicates the maximum temperature. Blue indicates the lowest temperature,
while other colours indicate the temperature range between min and max. The maximum recorded temperature for
August 14 is 42.5 °C and the minimum recorded temperature is 25.8 °C. With good quality satellite imagery, the
temperature can be seen rising closer to the city centre. As we approach the forest, that is, vegetation, we see a
significant drop in temperature; the difference is 16.7 °C.
Figure 9. Temperature values in city Vinkovci
5. CONCLUSION
With the help of remote sensing techniques, a spatial analysis is carried out, in which the classes of the area of
the town of Vinkovci are detected, analysed and interpreted. With this analysis, the simple principle of
classification of vegetation areas, primarily green areas, using the NDVI vegetation index and medium-resolution
recordings is present-ed. A simple principle, because indexing is a combination of simple arithmetic operations
and the necessary channels. Vegetation indices play a significant role in monitoring and detecting vegetation
changes in terms of quantity or quality. Their biggest advantage is that they have a low sensitivity to the instability
of the correction for the atmosphere and variations in the angle of observation of the satellite. It is important to
emphasize that vegetation indices can monitor the disappearance of forest areas (need for afforestation) or
agricultural crops.
Emphasis is also placed on elevated temperatures occurring in the city, i.e. in populated areas. With the help
of QGIS software, we can very easily calculate the temperature state on a given surface. The physiological sense
of the environment rests on the temperature and humidity of the air, the flow of air, the radiation of objects, the
admixtures in the air, when the heat islands appear, they merge and cause pressures on human health. The
temperature is measured in the shade of a meteorological house and when the thermometer shows 35 degrees, the
temperature in the street can rise to 40 degrees, which in addition to other negative effects can have a significant
impact on human health. Some strategies for reducing the "heat island" effect that can be applied in cities or heavily
populated areas are increasing green spaces, building green parking lots, building green roofs, building cold /
reflective roofs, building cold side-walks, educating about the effect of thermal effects the island.
Satellite imagery is the most widespread way of collecting data on large areas today. There is great potential
for ap-plication in forestry, which is the basis for the European Union's Global Observation Program, Copernicus.
Of particular importance for exploring innovative remote sensing applications is the range of recent Sentinel
satellite missions and the availability of imagery for use by the wider scientific community. At present, there is a
Petrinjak et al. Possibility of using Landsat satellite recordings…
28 EnvEng-IO (2020) / Vol.7 / No.1
very strong EU initiative aimed at examining different ways of applying and commercializing satellite information,
primarily collected from the Sentinel, in different land-based economic sectors (forestry, agriculture, nature
protection, water management, etc.). Free satellite imagery can be downloaded with a large amount of new data.
The processing of the data is one of the basic prerequisites for obtaining quality results. In the future,
interdisciplinarity and the collaboration of all professions from different fields will be important. There is still
plenty of room for progress in this field of work. It is possible to work in geo-databases where it would be the
source of all information e.g. related to a single location (surface, population, seismicity, temperature, hours of
sunshine, soil type, etc.). Also, satellite images can be used in comparison with other images (e.g. Sentinel data)
and the ability to compared digital and visual interpretations.
6. LITERATURE
Top free satellite imagery sources in 2019 [online], 2019. Earth observing system. Available via:
https://eos.com/blog/7-top-free-satellite-imagery-sources-in-2019. Cited 14 May 2019
AccuWeather (2019) Monthly temperatures in Vinkovci [online]. Accuweather. Available via:
https://www.accuweather.com/hr/hr/vinkovci/116156/month/116156?monyr=3/01/2018. Cited 20 Apr 2019
Agency USEP (2008) Urban Heat Island Basics. In: Reducing Urban Heat Islands: Compendium of Strategies.
Boranić Živoder S, Ivandić N, Čorak S, Marković I (2015: Master plan razvoja turizma grada Vinkovaca.
Butcher, G, Owen, L, and Barnes, C, 2019. Landsat: the Cornerstone of Global Land Imaging. GIM
International, 44.
EROS U (2013) Landsat 8.
Francica J (2013) Everything You Need to Know about Landsat 8 [online]. Directions Magazine. Available
via: https://www.directionsmag.com/article/1662. Cited 14 May 2019
Gutman G, Masek JG (2012) Long-term time series of the Earth’s land-surface observations from space.
International Journal of Remote Sensing, 33 (15), 4700–4719.
Huete AR, Jackson RD (1987) Suitability of spectral indices for evaluating vegetation characteristics on arid
rangelands. Remote Sensing of Environment, 23 (2), 213-232.
Lapaine M, Frančula N (2015) Kartografija i daljinska istraživanja [online]. Available via
http://www.kartografija.hr/old_hkd/daljinska.pdf. Cited 19 Apr 2019
Normalized Difference Vegetation Index (NDVI) [online], 2000. NASA Earth observatory.
Oluić M (2001) Snimanje i istraživanje Zemlje iz svemira; Sateliti - Senzori - Primjena. Hrvatska akademija
znanosti i umjetnosti.
Rumora L, Medved I, Pilaš I, Medak D (2016) Comparison of Vegetation Index Value Based on Digital
Number and Top of Atmosphere Reflectance. Geodetski list, 70 (93) (1), 15.
SkySpace (2019) Urban heat island effect [online]. Sky Space Green Roofs. Available via:
http://skyspacegreenroofs.com/wp-content/uploads/2016/10/urban_heat_island_effect2.jpg. Cited 20 Apr 2019
Vela E, Medved I, Miljković V (2017) Geostatistical Analysis of Vegetation Indices in Forest Ecosystem
Česma. Geodetski list, 71 (94) (1).