Embed Size (px)
Citation preview
Silver_production read v3 (clean) (Do Not Delete) 8/7/2015 3:09 PM
559
Policy Limits, Payouts, and Blood Money: Medical Malpractice Settlements in the
Shadow of Insurance
Charles Silver, David A. Hyman, Bernard S. Black, and Myungho Paik*
In prior research, we found that policy limits in Texas medical malpractice (“med mal”) cases often served as de facto caps on recoveries in both tried and settled cases. We also found that physicians faced little personal exposure on malpractice claims. Out-of-pocket payments (OOPPs) by physicians were rare and usually small. Physicians could reduce their personal exposure to near zero by carrying $1 million in primary coverage—a standard amount in many states. Finally, the real amount of insurance coverage purchased by physicians with paid claims declined substantially over 1988–1999, consistent with physicians learning over time how low the OOPP risk was and deciding to carry less coverage.
We now revisit our findings, using an extended dataset (1988–2005) that lets us study policies purchased through 2003, which encompasses the period during which Texas experienced a med mal insurance crisis (1999–2003) and adopted tort reform to limit med mal lawsuits (2003). Our updated findings are largely consistent with our original findings: policy limits continue to cap recoveries; physicians still rarely make OOPPs; most OOPPs are modest; and real policy limits continue to shrink. We also find evidence that, at the end of the extended period, physicians often purchased less coverage (i.e., policies with limits of $100,000–$200,000 instead of $500,000–$1 million).
Our findings have important policy implications. If physicians carry less real coverage over time, lawsuits should become less profitable. This will
* Charles Silver, McDonald Endowed Chair in Civil Procedure, School of Law, University of Texas. Tel. 512-232-1337; e-mail: [email protected]. Professor Silver is the corresponding author for this Article. David Hyman, H. Ross and Helen Workman Chair in Law and Professor of Medicine, College of Law, University of Illinois. Tel. 217-333-0061; e-mail: [email protected]. Bernard Black, Nicholas J. Chabraja Professor, School of Law and Department of Finance, Kellogg School of Management, Northwestern University. Tel. 312-503-2784; e-mail: [email protected]. Myungho Paik, Assistant Professor, Department of Policy, College of Policy Science, Hanyang University, South Korea. Tel. +82-2-2220-2803; e-mail: [email protected]. We appreciate the helpful comments received when we presented this paper at the University of California, Irvine School of Law—particularly the comments of Professor Allison Hoffman.
Silver_production read v3 (clean) (Do Not Delete) 8/7/2015 3:09 PM
560 UC IRVINE LAW REVIEW [Vol. 5:559
make it harder for injured patients to find plaintiffs’ lawyers willing to handle their cases; shift the cost of medical injuries away from providers and toward patients and first-party health insurers; weaken liability insurers’ incentives to monitor providers; and diminish the (already modest) deterrent effect of tort law. If these findings are representative, they may help explain the nationwide decline in med mal claiming that we document elsewhere. Finally, our findings raise questions about the explanatory power of Baker’s “blood money” norm, at least for med mal litigation.
Introduction ..................................................................................................................... 560 I. Data and Data Limitations ......................................................................................... 563 II. Policy Limits as De Facto Caps on Recoveries .................................................... 567 III. Physician OOPPs ..................................................................................................... 572 IV. What Policy Limits Do Physicians Choose? ........................................................ 573 V. Discussion ................................................................................................................... 577 Conclusion ........................................................................................................................ 586
INTRODUCTION
Almost all practicing physicians carry medical professional liability insurance. Some do so to satisfy states’ financial responsibility laws.1 Others want to meet requirements for admitting privileges at hospitals or membership in provider networks.2 Still others simply want to protect themselves (and their assets) from lawsuits.
Texas does not require physicians to maintain a minimum level of medical malpractice (“med mal”) coverage, but most hospitals require physicians with admitting privileges to carry insurance, and almost all physicians are insured. In 2001, approximately 29,000 physicians had commercial med mal insurance.3 This was roughly 90% of the active nonfederal patient care physicians who practiced in Texas in that year. Many of the remaining doctors had employer provided malpractice insurance. This was true, for example, of doctors employed by the University of Texas hospital system.4
Insurance influences all aspects of the med mal claiming environment, starting with physicians’ willingness to deliver services that expose patients to risks.
1. AM. MED. ASS’N, STATE LAWS MANDATING MINIMUM LEVELS OF PROFESSIONAL
LIABILITY INSURANCE 1 (2012). 2. See Rachel Emma Silverman, So Sue Me: Doctors Without Insurance, WALL ST. J., Jan. 28, 2004,
at D1. 3. TEX. DEP’T OF INS., MEDICAL MALPRACTICE INSURANCE: OVERVIEW AND DISCUSSION 3
(2003), available at http://www.tdi.texas.gov/hprovider/documents/spromptpay.pdf [http://perma.cc/Y52S-W3AC].
4. TEX. EDUC. CODE ANN. §§ 59.01–.08 (West 2012) (exempting University of Texas healthcare system from reporting requirements of Insurance Code). See generally TEX. DEP’T OF INS., TEXAS CLOSED CLAIM REPORTING GUIDE (2015), available at http://www.tdi.texas.gov/company/documents/ccguide2015.pdf [http://perma.cc/8FNN-EWR6] (discussing general reporting requirements for doctors and insurers).
Silver_production read v3 (clean) (Do Not Delete) 8/7/2015 3:09 PM
2015] POLICY LIMITS, PAYOUTS, AND BLOOD MONEY 561
Presumably, insured providers are more willing to deliver services with significant potential to generate malpractice claims than they would be if they were personally liable for any resulting damages. By insulating doctors from risks, insurance can also reduce physicians’ incentive to exercise due care. After an injury occurs, insurance makes cases more attractive to plaintiffs’ lawyers, who are generally willing to sue only solvent defendants. Uninsured physicians may not fit this description. Insurance also funds and controls the defense and settlement of these claims, which affects the speed, resolution stage, and accuracy of claim outcomes.
In earlier work, we studied the impact of med mal policy limits on payouts in tried and settled med mal cases during 1988–1999.5 In this Article, we extend our prior work by adding an additional four years of data on policy limits. This allows us to show the impact of the malpractice crisis that hit Texas beginning in 1999. Our dataset contains 12,383 large paid med mal claims against physicians that closed in Texas from 1988 to 2005, as reported to the Texas Department of Insurance (TDI). We use this data to study the policy limits carried by doctors who experienced paid med mal claims from 1988–2003 (the earlier ending year is needed to allow time for claims to close and be reported to TDI). We also study the ratio between plaintiffs’ recoveries and policy limits (the payment-to-limits or PTL ratio), the extent to which defendants pay what juries award, and the source of the dollars paid to claimants in tried and settled cases—particularly when payments exceed policy limits. Here is a summary of our findings:
Although it is widely believed that med mal policies with per occurrence limits of $1 million and annual aggregate limits $3 million are standard among physicians, many Texas physicians with paid claims had much less coverage. Throughout the period we study, the median nominal policy limit (the maximum amount shown in the policy that the insurer could be obligated to pay on a single claim with no adjustment for inflation) was $500,000. Only 34% of the doctors in our dataset had nominal limits of $1 million or more. The mean real policy limit (the nominal policy limit converted to constant 2010 dollars) fell over time, and was $619,000 in 2003.
Physicians appear to have responded to Texas’s malpractice crisis by purchasing policies with lower limits.
Payouts rarely exceeded the amount of available med mal insurance: 98.5% of claims were resolved with payments at or below the primary
5. See, e.g., David A. Hyman, Bernard Black, Kathryn Zeiler, Charles Silver & William M. Sage, Do Defendants Pay What Juries Award? Post-Verdict Haircuts in Texas Medical Malpractice Cases, 1988–2003, 4 J. EMPIRICAL LEGAL STUD. 3 (2007) [hereinafter Hyman et al., Do Defendants Pay What Juries Award?]; Charles Silver, Kathryn Zeiler, Bernard Black, David A. Hyman & William Sage, Malpractice Payouts and Malpractice Insurance: Evidence from Texas Closed Claims, 1990–2003, 33 GENEVA PAPERS ON RISK & INS. 177 (2008); Kathryn Zeiler, Charles Silver, Bernard Black, David A. Hyman & William M. Sage, Physicians’ Insurance Limits and Malpractice Payments: Evidence from Texas Closed Claims, 1990–2003, 36 J. LEGAL STUD. S9 (2007); see also David A. Hyman, Bernard Black & Charles Silver, Settlement at Policy Limits and the Duty to Settle: Evidence from Texas, 8 J. EMPIRICAL LEGAL STUD. 48 (2011).
Silver_production read v3 (clean) (Do Not Delete) 8/7/2015 3:09 PM
562 UC IRVINE LAW REVIEW [Vol. 5:559
malpractice policy limits. A sharp spike in payments at or near the policy limits underscores the importance of policy size: 16% of claims were resolved with payments from 95%–100% of limits (“at-limits payments”), with most payments exactly equal to the policy limits.
Doctors sued for injuries to infants aged 0–1 months at date of injury “perinatal physicians”) carried less insurance than other physicians with paid claims, even though the claims they faced were larger.
The spike in at-limits payments rises as policy limits fall. The spike is exceptionally large for perinatal physicians, reflecting the combination of relatively large claims and relatively low policy limits.
Ignoring deductibles, physicians rarely used personal assets to resolve malpractice claims. This was true even when claimants recovered more than the policy limits. Physicians made out-of-pocket payments (OOPPs) in only 77 cases over 18 years, about 4 times per year. Physicians with policies with real limits under $250,000 made OOPPs more often than others, but even for these “low-limits” physicians the probability that a paid claim would include an OOPP was a mere 1.2%. Most OOPPs were too small to threaten physicians with bankruptcy, but nineteen—an average of one per year—exceeded $250,000.
Thus, policy limits cap patients’ recoveries. Patients rarely recover more than the amount of insurance that is available to satisfy claims. Another way to say this is that insurance facilitates recoveries within the policy limits, but after that, patients are on their own. Does this mean that, in the absence of insurance, many patients injured by physicians’ negligence would likely recover little or nothing at all? Because our dataset contains only insured claims, we cannot answer this question directly.
That said, we believe that liability insurance dramatically increases the ability of negligently injured patients to recover damages. In conversations, plaintiffs’ attorneys repeatedly emphasized the difficulty of collecting judgments against physicians’ personal assets and told us that they routinely reject requests for representation when doctors’ policy limits are too low. Other academics and commentators have also suggested that the availability of insurance may explain patterns of claiming and litigation.6
These findings have important implications for public policy. They suggest, among other things, that large jury verdicts against physicians should receive little emphasis in discussions of medical liability costs because patients rarely collect them. Second, the amount of insurance doctors carry merits far more attention than it has received. Third, states without minimum insurance requirements should consider enacting them and should gather data on policy size. Lastly, states with
6. Stephen C. Yeazell, Re-Financing Civil Litigation, 51 DEPAUL L. REV. 183, 186 (2001) (“No one working on a contingent fee intentionally sues an insolvent defendant.”); id. at 189 (“Liability insurance directly produces a solvent prospective defendant and, given liability and injury, obviously increases prospective recovery.”).
Silver_production read v3 (clean) (Do Not Delete) 8/7/2015 3:09 PM
2015] POLICY LIMITS, PAYOUTS, AND BLOOD MONEY 563
minimum policy requirements should index policy size for inflation to prevent real coverage from eroding. We elaborate on these and other matters below.
I. DATA AND DATA LIMITATIONS
Since 1988, TDI has maintained the Texas Closed Claim Dataset (TCCD),7 an enormous dataset that contains individual reports of all paid tort claims, over a dollar threshold, covered by five lines of commercial insurance: mono-line general liability, commercial auto liability, commercial multi-peril, medical professional liability, and other professional liability insurance. Initially, TDI did not audit individual claim reports. After discovering that some insurers were not filing reports for all claims, in 1990 it began to reconcile the payouts shown on individual reports against aggregate payout data that insurers also had to report. TDI also reviews individual claim reports for internal consistency.
The TCCD is a wonderful resource for studying med mal claims. Audits make the TCCD more reliable than the other two publicly available datasets—a Florida closed claim dataset8 and the National Practitioner Data Bank (NPDB)9 that contains information on paid med mal claims against physicians in all states. These other datasets are not audited for accuracy or completeness. The TCCD also contains richer information about liability claims than the Florida or NPDB datasets. Of particular relevance for this study, the TCCD is unique in including the amount of primary insurance the defendant carried and, in tried cases, both the jury verdict and the actual payment. This richness of detail lets us study aspects of the liability system about which little is known because the requisite data are not generally available.
The TCCD’s richness derives mainly from its Long Form reports, which contain detailed information about closed claims. From 1988 through 2005, the closing year for the subset of the TCCD studied here, TDI required insurers to file Long Form reports for claims that closed with payouts by all defendants of more than $25,000 (nominal). Insurers filed “Short Form” reports for claims that closed with payouts by all defendants of $10,000 (nominal) or more but that fell below the Long Form threshold. TDI also publishes aggregate annual reports on all closed claims, including zero- and small-payout claims, by line of insurance.
In this Article, we use the TCCD to study Long Form reports of malpractice claims against physicians that closed between 1988 and 2005. We chose the closing date to capture the operation of Texas civil justice system before the Texas cap on noneconomic damages and other lawsuit restrictions, adopted in September 2003,
7. See, e.g., Closed Claim Data, TEX. DEPT. INS., http://www.tdi.texas.gov/reports/report4.html#closed [http://perma.cc/P5WH-7U75] (last updated May 13, 2015).
8. Insurance Reports and Required Data Reporting, FLA. OFFICE INS. REG., http://www.floir.com/office/datareports.aspx [http://perma.cc/P63J-XLQ7] (last visited June 21, 2015).
9. Research & Data, NAT’L PRAC. DATA BANK, U.S. DEP’T HEALTH & HUMAN SERVS., http://www.npdb.hrsa.gov/resources/aboutStatData.jsp [http://perma.cc/8ZCD-J4SK] (last visited June 21, 2015).
Silver_production read v3 (clean) (Do Not Delete) 8/7/2015 3:09 PM
564 UC IRVINE LAW REVIEW [Vol. 5:559
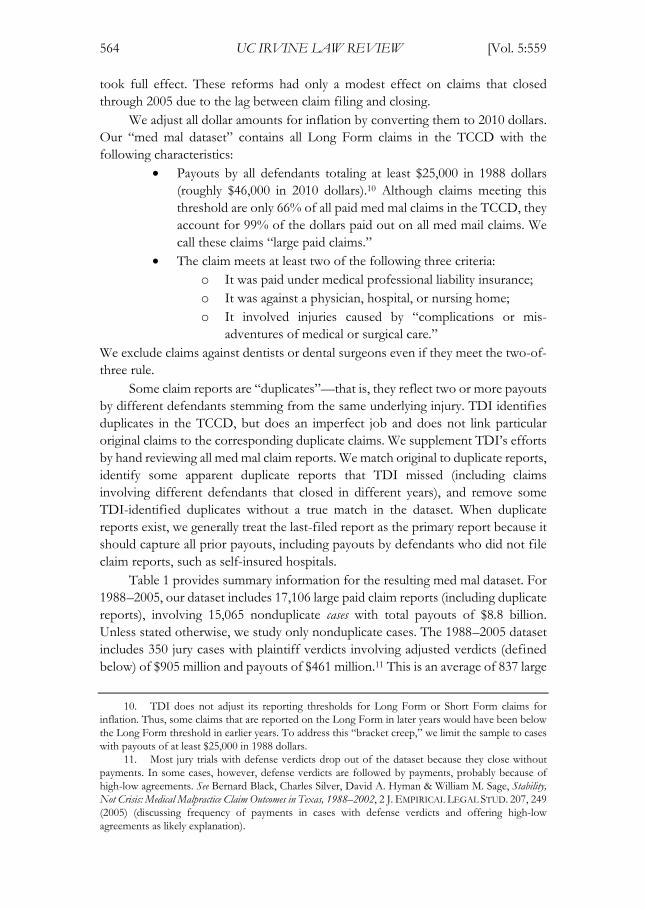
took full effect. These reforms had only a modest effect on claims that closed through 2005 due to the lag between claim filing and closing.
We adjust all dollar amounts for inflation by converting them to 2010 dollars. Our “med mal dataset” contains all Long Form claims in the TCCD with the following characteristics:
Payouts by all defendants totaling at least $25,000 in 1988 dollars (roughly $46,000 in 2010 dollars).10 Although claims meeting this threshold are only 66% of all paid med mal claims in the TCCD, they account for 99% of the dollars paid out on all med mail claims. We call these claims “large paid claims.”
The claim meets at least two of the following three criteria: o It was paid under medical professional liability insurance; o It was against a physician, hospital, or nursing home; o It involved injuries caused by “complications or mis-
adventures of medical or surgical care.” We exclude claims against dentists or dental surgeons even if they meet the two-of-three rule.
Some claim reports are “duplicates”—that is, they reflect two or more payouts by different defendants stemming from the same underlying injury. TDI identifies duplicates in the TCCD, but does an imperfect job and does not link particular original claims to the corresponding duplicate claims. We supplement TDI’s efforts by hand reviewing all med mal claim reports. We match original to duplicate reports, identify some apparent duplicate reports that TDI missed (including claims involving different defendants that closed in different years), and remove some TDI-identified duplicates without a true match in the dataset. When duplicate reports exist, we generally treat the last-filed report as the primary report because it should capture all prior payouts, including payouts by defendants who did not file claim reports, such as self-insured hospitals.
Table 1 provides summary information for the resulting med mal dataset. For 1988–2005, our dataset includes 17,106 large paid claim reports (including duplicate reports), involving 15,065 nonduplicate cases with total payouts of $8.8 billion. Unless stated otherwise, we study only nonduplicate cases. The 1988–2005 dataset includes 350 jury cases with plaintiff verdicts involving adjusted verdicts (defined below) of $905 million and payouts of $461 million.11 This is an average of 837 large
10. TDI does not adjust its reporting thresholds for Long Form or Short Form claims for inflation. Thus, some claims that are reported on the Long Form in later years would have been below the Long Form threshold in earlier years. To address this “bracket creep,” we limit the sample to cases with payouts of at least $25,000 in 1988 dollars.
11. Most jury trials with defense verdicts drop out of the dataset because they close without payments. In some cases, however, defense verdicts are followed by payments, probably because of high-low agreements. See Bernard Black, Charles Silver, David A. Hyman & William M. Sage, Stability, Not Crisis: Medical Malpractice Claim Outcomes in Texas, 1988–2002, 2 J. EMPIRICAL LEGAL STUD. 207, 249 (2005) (discussing frequency of payments in cases with defense verdicts and offering high-low agreements as likely explanation).
Silver_production read v3 (clean) (Do Not Delete) 8/7/2015 3:09 PM
2015] POLICY LIMITS, PAYOUTS, AND BLOOD MONEY 565
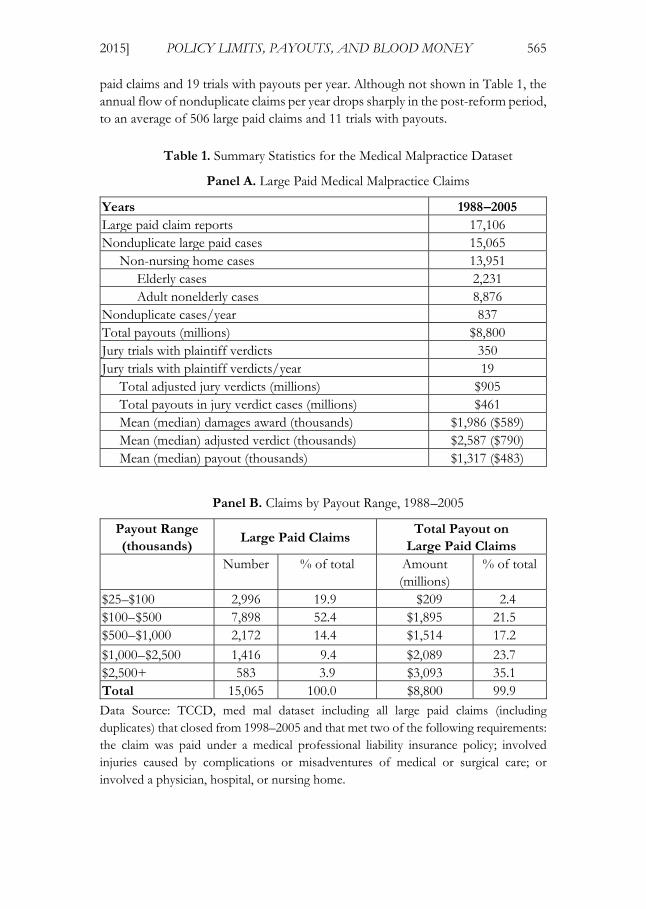
paid claims and 19 trials with payouts per year. Although not shown in Table 1, the annual flow of nonduplicate claims per year drops sharply in the post-reform period, to an average of 506 large paid claims and 11 trials with payouts.
Table 1. Summary Statistics for the Medical Malpractice Dataset
Panel A. Large Paid Medical Malpractice Claims
Years 1988–2005 Large paid claim reports 17,106 Nonduplicate large paid cases 15,065 Non-nursing home cases 13,951 Elderly cases 2,231 Adult nonelderly cases 8,876 Nonduplicate cases/year 837 Total payouts (millions) $8,800 Jury trials with plaintiff verdicts 350 Jury trials with plaintiff verdicts/year 19 Total adjusted jury verdicts (millions) $905 Total payouts in jury verdict cases (millions) $461 Mean (median) damages award (thousands) $1,986 ($589) Mean (median) adjusted verdict (thousands) $2,587 ($790) Mean (median) payout (thousands) $1,317 ($483)
Panel B. Claims by Payout Range, 1988–2005
Payout Range (thousands)
Large Paid Claims Total Payout on
Large Paid Claims Number % of total Amount
(millions)% of total
$25–$100 2,996 19.9 $209 2.4 $100–$500 7,898 52.4 $1,895 21.5 $500–$1,000 2,172 14.4 $1,514 17.2
$1,000–$2,500 1,416 9.4 $2,089 23.7 $2,500+ 583 3.9 $3,093 35.1 Total 15,065 100.0 $8,800 99.9 Data Source: TCCD, med mal dataset including all large paid claims (including duplicates) that closed from 1998–2005 and that met two of the following requirements: the claim was paid under a medical professional liability insurance policy; involved injuries caused by complications or misadventures of medical or surgical care; or involved a physician, hospital, or nursing home.

Silver_production read v3 (clean) (Do Not Delete) 8/7/2015 3:09 PM
566 UC IRVINE LAW REVIEW [Vol. 5:559
Data on claims involving physicians. In this Article, we focus upon a subset of the med mal dataset that contains only paid claims against physicians. The 12,383 paid claims in the subset come from 10,940 nonduplicate cases. We calculate the total payout on each claim by summing the deductible payment, the primary carrier’s payment, the excess carrier’s payment, and the physician’s payment above policy limits. As shown below, in most instances the primary carrier bore the entire loss. The other payment components contained zeroes.
Most med mal policies sold to doctors contain both per-occurrence limits and aggregate annual limits. The TCCD includes 9,947 claims with per-occurrence limits. Some policies instead have a combined single limit (2,436 claims). We treat the combined single limit as a per-occurrence limit in our analyses. We obtain results similar to those reported below when we exclude claims with combined single limits from our analyses.
Some med mal insurance policies are claims made, meaning that they cover claims that are asserted during the policy period. Other policies are occurrence based. They cover harms associated with services rendered during the policy period, no matter when the claim is made. Our dataset includes 7,777 claims-made and 4,606 occurrence policies. Over time, claims-made policies have displaced occurrence policies and predominate in more recent years.
We study time trends in policy limits based on the year in which policies were purchased. Because the TCCD does not include a field for purchase year, we use the year a claim was reported as the purchase year for claims-made policies and the injury year as the purchase year for occurrence polices. Med mal claims that close with payments often take several years to resolve—the median time from injury to closing is around 4 years. Taking into account the lag between injury or claim opening and claim closing, we have reasonably complete data on policies bought between 1986 and 2003—a total of 11,602 policies.
Data limitations. We discuss the limitations of the TCCD in more detail in other publications and direct readers to them for more information.12 Our data come only from Texas and only from med mal claims against physicians that closed with payments of at least $25,000 in 1988 dollars. Physicians with paid claims may not be representative of all Texas physicians, and Texas physicians may not be representative of doctors nationwide. Second, we lack data on physician specialty. Thus, except for perinatal claims, we can say little about how policy limits or other claim characteristics vary by specialty. Third, in some cases, nominal policy limits may have been eroded by payments on prior claims under the same policy in the same policy year, leading to a remaining limit that was lower than the nominal limit reported by the insurer. We do not have data on which policies have eroded limits. Fourth, we do not know the policy limits for excess policies, which some physicians purchase. These policies provide additional insurance above the primary insurance layer. For this reason, when studying how limits affect payments, we exclude 179
12. Id. at 213–22.
Silver_production read v3 (clean) (Do Not Delete) 8/7/2015 3:09 PM
2015] POLICY LIMITS, PAYOUTS, AND BLOOD MONEY 567
claims with payments by excess carriers (but include these claims for other results). Fifth, we do not examine claims against hospitals, nursing homes, or other institutional defendants. Defendant type may affect claim characteristics and other salient matters, such as the effects of policy limits on payments. Finally, we have data on policy limits, but not on the premiums that physicians paid for those policies.
II. POLICY LIMITS AS DE FACTO CAPS ON RECOVERIES
As stated above, a principal finding of our research is that payments to med mal plaintiffs rarely exceed physicians’ primary policy limits. Combining this fact with the related finding that insurers fund most above-limits payments, it follows that the direct financial impact of med mal payouts falls almost exclusively on insurers. Physicians experience the financial consequences of med mal judgments and settlements primarily through insurers’ underwriting, pricing, and monitoring practices.
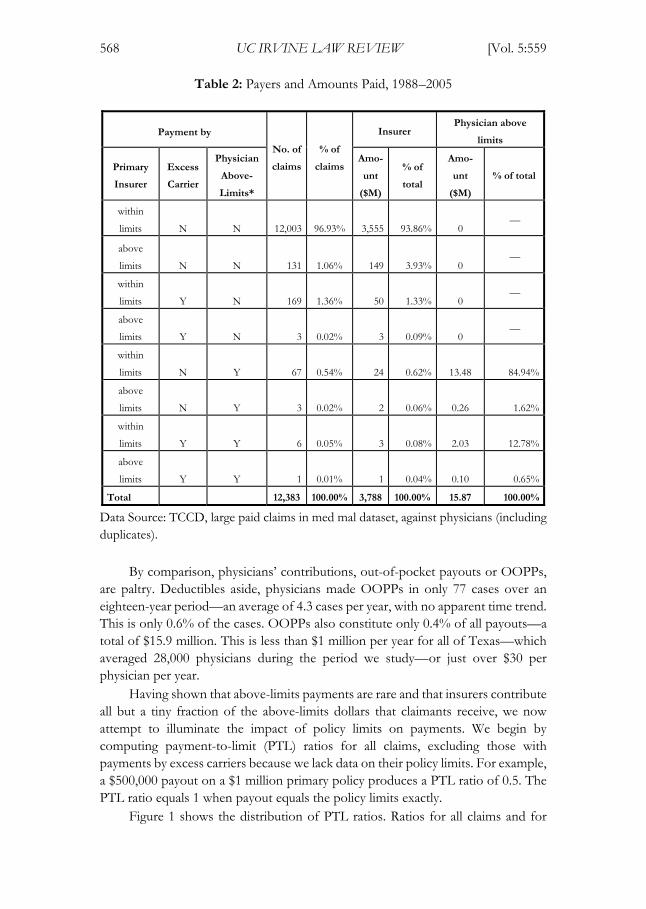
Table 2 shows how primary insurers, excess carriers, and physicians shared responsibility for payments on closed malpractice claims. Approximately 98% of claims were resolved with primary carriers’ money alone.13 This includes 131 claims in which primary carriers paid more than policy limits. Plainly, primary carriers made most of the payments on malpractice claims. Table 2 also documents the rarity of payments that exceed the primary limits. Such payments occur in only 3.1% of the cases. When above-limits payments were made, insurers usually funded them. Overall, primary carriers paid $3.6 billion at or below limits and $156 million above limits. Excess carriers paid another $87 million above the primary limits. Physicians paid only $15.9 million above limits, or only 9% of the amount paid above limits.
13. Physicians paid a total of $18 million in deductibles in 350 cases. The mean (median) real deductible was $50,000 ($28,000). Physicians paid deductibles of $100,000 or more in only 28 cases; many of these likely involved self-insured retentions for group practices. Excess carriers paid another $87 million above the primary limits in 179 cases in our dataset.
Silver_production read v3 (clean) (Do Not Delete) 8/7/2015 3:09 PM
568 UC IRVINE LAW REVIEW [Vol. 5:559
Table 2: Payers and Amounts Paid, 1988–2005
Payment by
No. of
claims
% of
claims
Insurer Physician above
limits
Primary
Insurer
Excess
Carrier
Physician
Above-
Limits*
Amo-
unt
($M)
% of
total
Amo-
unt
($M)
% of total
within
limits N N 12,003 96.93% 3,555 93.86% 0 —
above
limits N N 131 1.06% 149 3.93% 0 —
within
limits Y N 169 1.36% 50 1.33% 0 —
above
limits Y N 3 0.02% 3 0.09% 0 —
within
limits N Y 67 0.54% 24 0.62% 13.48 84.94%
above
limits N Y 3 0.02% 2 0.06% 0.26 1.62%
within
limits Y Y 6 0.05% 3 0.08% 2.03 12.78%
above
limits Y Y 1 0.01% 1 0.04% 0.10 0.65%
Total 12,383 100.00% 3,788 100.00% 15.87 100.00%
Data Source: TCCD, large paid claims in med mal dataset, against physicians (including duplicates).
By comparison, physicians’ contributions, out-of-pocket payouts or OOPPs, are paltry. Deductibles aside, physicians made OOPPs in only 77 cases over an eighteen-year period—an average of 4.3 cases per year, with no apparent time trend. This is only 0.6% of the cases. OOPPs also constitute only 0.4% of all payouts—a total of $15.9 million. This is less than $1 million per year for all of Texas—which averaged 28,000 physicians during the period we study—or just over $30 per physician per year.
Having shown that above-limits payments are rare and that insurers contribute all but a tiny fraction of the above-limits dollars that claimants receive, we now attempt to illuminate the impact of policy limits on payments. We begin by computing payment-to-limit (PTL) ratios for all claims, excluding those with payments by excess carriers because we lack data on their policy limits. For example, a $500,000 payout on a $1 million primary policy produces a PTL ratio of 0.5. The PTL ratio equals 1 when payout equals the policy limits exactly.
Figure 1 shows the distribution of PTL ratios. Ratios for all claims and for
Silver_production read v3 (clean) (Do Not Delete) 8/7/2015 3:09 PM
2015] POLICY LIMITS, PAYOUTS, AND BLOOD MONEY 569
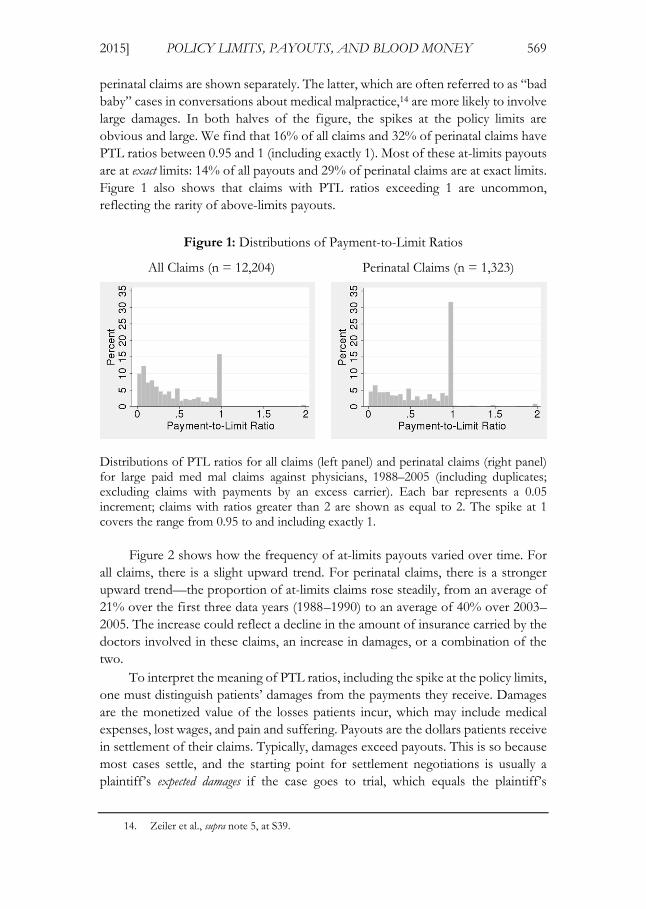
perinatal claims are shown separately. The latter, which are often referred to as “bad baby” cases in conversations about medical malpractice,14 are more likely to involve large damages. In both halves of the figure, the spikes at the policy limits are obvious and large. We find that 16% of all claims and 32% of perinatal claims have PTL ratios between 0.95 and 1 (including exactly 1). Most of these at-limits payouts are at exact limits: 14% of all payouts and 29% of perinatal claims are at exact limits. Figure 1 also shows that claims with PTL ratios exceeding 1 are uncommon, reflecting the rarity of above-limits payouts.
Figure 1: Distributions of Payment-to-Limit Ratios
All Claims (n = 12,204) Perinatal Claims (n = 1,323)
Distributions of PTL ratios for all claims (left panel) and perinatal claims (right panel) for large paid med mal claims against physicians, 1988–2005 (including duplicates; excluding claims with payments by an excess carrier). Each bar represents a 0.05 increment; claims with ratios greater than 2 are shown as equal to 2. The spike at 1 covers the range from 0.95 to and including exactly 1.
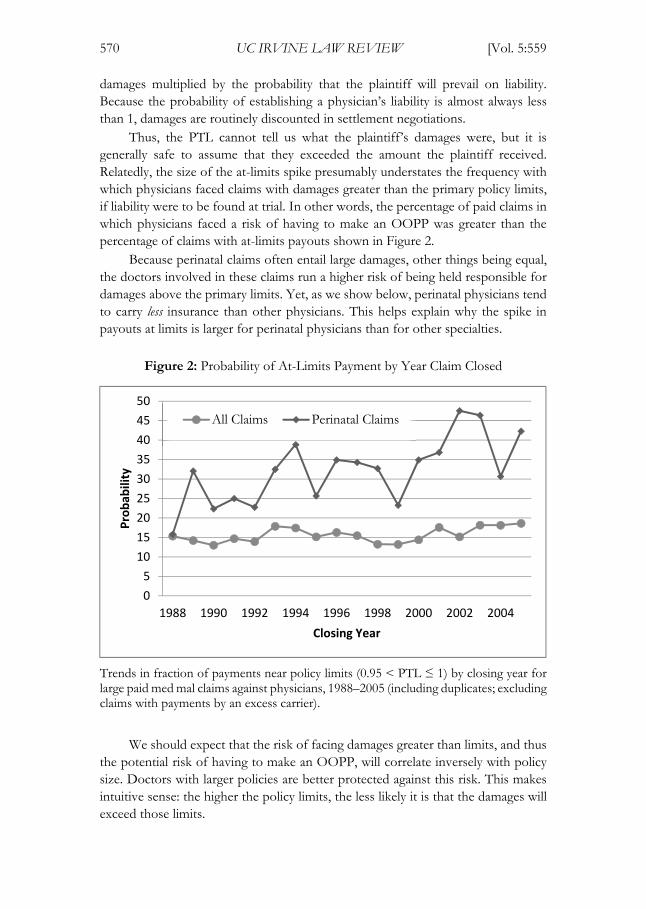
Figure 2 shows how the frequency of at-limits payouts varied over time. For all claims, there is a slight upward trend. For perinatal claims, there is a stronger upward trend—the proportion of at-limits claims rose steadily, from an average of 21% over the first three data years (1988–1990) to an average of 40% over 2003–2005. The increase could reflect a decline in the amount of insurance carried by the doctors involved in these claims, an increase in damages, or a combination of the two.
To interpret the meaning of PTL ratios, including the spike at the policy limits, one must distinguish patients’ damages from the payments they receive. Damages are the monetized value of the losses patients incur, which may include medical expenses, lost wages, and pain and suffering. Payouts are the dollars patients receive in settlement of their claims. Typically, damages exceed payouts. This is so because most cases settle, and the starting point for settlement negotiations is usually a plaintiff’s expected damages if the case goes to trial, which equals the plaintiff’s
14. Zeiler et al., supra note 5, at S39.
Silver_production read v3 (clean) (Do Not Delete) 8/7/2015 3:09 PM
570 UC IRVINE LAW REVIEW [Vol. 5:559
damages multiplied by the probability that the plaintiff will prevail on liability. Because the probability of establishing a physician’s liability is almost always less than 1, damages are routinely discounted in settlement negotiations.
Thus, the PTL cannot tell us what the plaintiff’s damages were, but it is generally safe to assume that they exceeded the amount the plaintiff received. Relatedly, the size of the at-limits spike presumably understates the frequency with which physicians faced claims with damages greater than the primary policy limits, if liability were to be found at trial. In other words, the percentage of paid claims in which physicians faced a risk of having to make an OOPP was greater than the percentage of claims with at-limits payouts shown in Figure 2.
Because perinatal claims often entail large damages, other things being equal, the doctors involved in these claims run a higher risk of being held responsible for damages above the primary limits. Yet, as we show below, perinatal physicians tend to carry less insurance than other physicians. This helps explain why the spike in payouts at limits is larger for perinatal physicians than for other specialties.
Figure 2: Probability of At-Limits Payment by Year Claim Closed
Trends in fraction of payments near policy limits (0.95 < PTL ≤ 1) by closing year for large paid med mal claims against physicians, 1988–2005 (including duplicates; excluding claims with payments by an excess carrier).
We should expect that the risk of facing damages greater than limits, and thus
the potential risk of having to make an OOPP, will correlate inversely with policy size. Doctors with larger policies are better protected against this risk. This makes intuitive sense: the higher the policy limits, the less likely it is that the damages will exceed those limits.
0
5
10
15
20
25
30
35
40
45
50
1988 1990 1992 1994 1996 1998 2000 2002 2004
Pro
bab
ility
Closing Year
All Claims Perinatal Claims
Silver_production read v3 (clean) (Do Not Delete) 8/7/2015 3:09 PM
2015] POLICY LIMITS, PAYOUTS, AND BLOOD MONEY 571
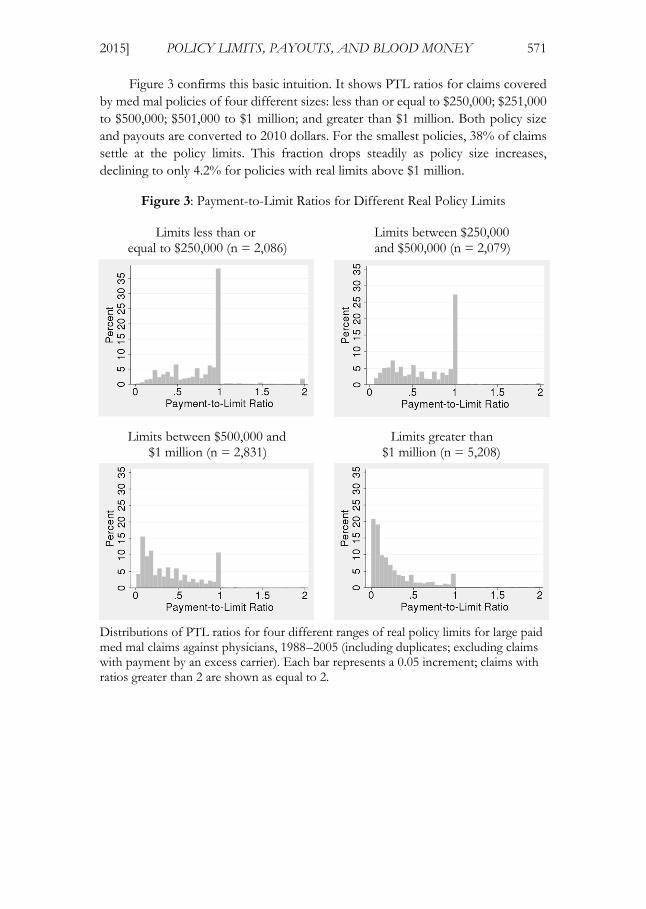
Figure 3 confirms this basic intuition. It shows PTL ratios for claims covered by med mal policies of four different sizes: less than or equal to $250,000; $251,000 to $500,000; $501,000 to $1 million; and greater than $1 million. Both policy size and payouts are converted to 2010 dollars. For the smallest policies, 38% of claims settle at the policy limits. This fraction drops steadily as policy size increases, declining to only 4.2% for policies with real limits above $1 million.
Figure 3: Payment-to-Limit Ratios for Different Real Policy Limits
Limits less than or Limits between $250,000 equal to $250,000 (n = 2,086) and $500,000 (n = 2,079)
Limits between $500,000 and Limits greater than $1 million (n = 2,831) $1 million (n = 5,208)
Distributions of PTL ratios for four different ranges of real policy limits for large paid med mal claims against physicians, 1988–2005 (including duplicates; excluding claims with payment by an excess carrier). Each bar represents a 0.05 increment; claims with ratios greater than 2 are shown as equal to 2.
Silver_production read v3 (clean) (Do Not Delete) 8/7/2015 3:09 PM
572 UC IRVINE LAW REVIEW [Vol. 5:559
As we and others have shown, payouts (and thus, presumably, damages) tend to increase as injuries become more serious, although a “death discount” also exists: payments are higher for permanent grave injuries than for deaths.15 Thus, another way of understanding our findings is the larger the policy, the lower the likelihood that a patient’s injury will be sufficiently serious to warrant a payout equal to or greater than the limits.
Winning a verdict at trial improves a patient’s chances of obtaining an above-limits payment, but it guarantees neither that the patient will be compensated in full nor that the limits will be exceeded. In other research using Texas med mal cases tried to a verdict, we find that, in the aggregate, victorious plaintiffs received only half of their jury awards—and the larger the verdict, the larger and more likely the “haircut.”16 Haircut percentages were similar whether the defendant was a physician or an institution (e.g., a hospital, or a nursing home)—a surprising finding given that institutions are wealthier than individuals and enjoy less generous protections from creditors.
Policy limits help explain these haircuts. In regression analyses, we find that in cases with jury verdicts, limits have no statistically significant impact on payouts when the verdicts are below limits, but limits strongly constrain payouts when verdicts are above limits.17 In the aggregate, plaintiffs collected, on average, 87% of below-limits adjusted verdicts but only 15% of above-limits amounts.18 To summarize, plaintiffs simply have an exceedingly hard time collecting amounts that exceed policy limits.
III. PHYSICIAN OOPPS
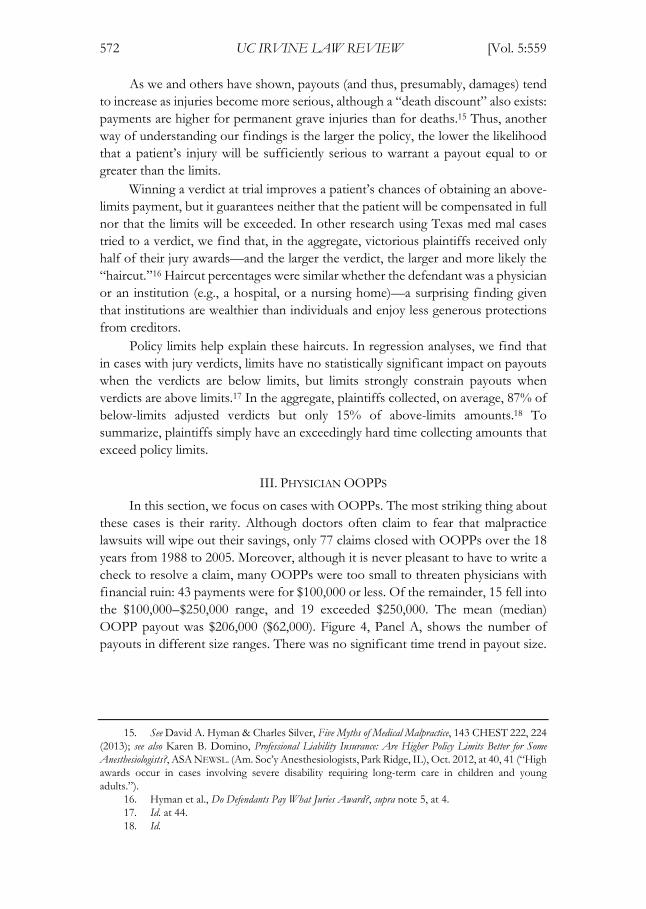
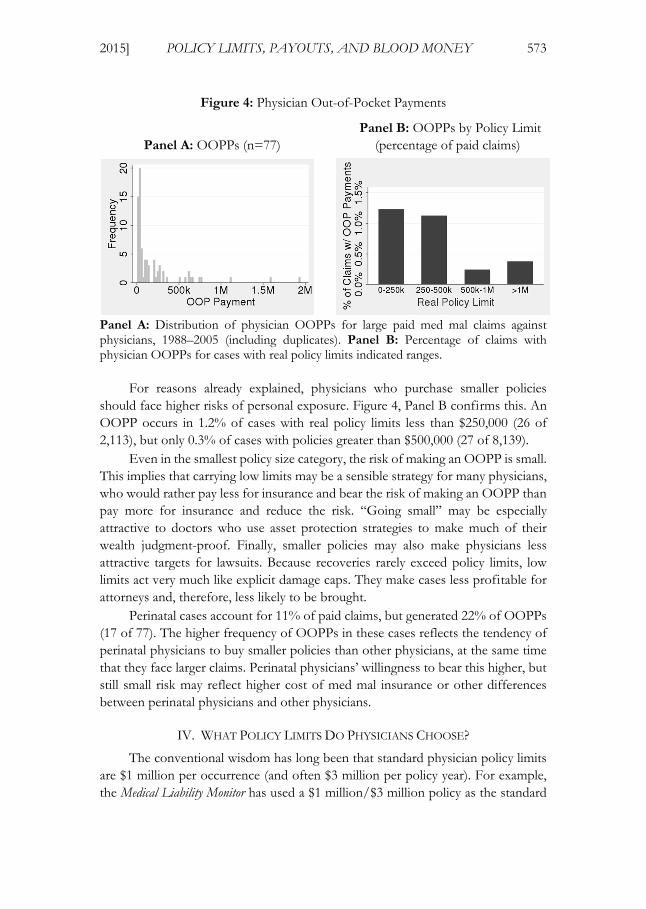
In this section, we focus on cases with OOPPs. The most striking thing about these cases is their rarity. Although doctors often claim to fear that malpractice lawsuits will wipe out their savings, only 77 claims closed with OOPPs over the 18 years from 1988 to 2005. Moreover, although it is never pleasant to have to write a check to resolve a claim, many OOPPs were too small to threaten physicians with financial ruin: 43 payments were for $100,000 or less. Of the remainder, 15 fell into the $100,000–$250,000 range, and 19 exceeded $250,000. The mean (median) OOPP payout was $206,000 ($62,000). Figure 4, Panel A, shows the number of payouts in different size ranges. There was no significant time trend in payout size.
15. See David A. Hyman & Charles Silver, Five Myths of Medical Malpractice, 143 CHEST 222, 224 (2013); see also Karen B. Domino, Professional Liability Insurance: Are Higher Policy Limits Better for Some Anesthesiologists?, ASA NEWSL. (Am. Soc’y Anesthesiologists, Park Ridge, IL), Oct. 2012, at 40, 41 (“High awards occur in cases involving severe disability requiring long-term care in children and young adults.”).
16. Hyman et al., Do Defendants Pay What Juries Award?, supra note 5, at 4. 17. Id. at 44. 18. Id.
Silver_production read v3 (clean) (Do Not Delete) 8/7/2015 3:09 PM
2015] POLICY LIMITS, PAYOUTS, AND BLOOD MONEY 573
Figure 4: Physician Out-of-Pocket Payments
Panel B: OOPPs by Policy Limit Panel A: OOPPs (n=77) (percentage of paid claims)
Panel A: Distribution of physician OOPPs for large paid med mal claims against physicians, 1988–2005 (including duplicates). Panel B: Percentage of claims with physician OOPPs for cases with real policy limits indicated ranges.
For reasons already explained, physicians who purchase smaller policies should face higher risks of personal exposure. Figure 4, Panel B confirms this. An OOPP occurs in 1.2% of cases with real policy limits less than $250,000 (26 of 2,113), but only 0.3% of cases with policies greater than $500,000 (27 of 8,139).
Even in the smallest policy size category, the risk of making an OOPP is small. This implies that carrying low limits may be a sensible strategy for many physicians, who would rather pay less for insurance and bear the risk of making an OOPP than pay more for insurance and reduce the risk. “Going small” may be especially attractive to doctors who use asset protection strategies to make much of their wealth judgment-proof. Finally, smaller policies may also make physicians less attractive targets for lawsuits. Because recoveries rarely exceed policy limits, low limits act very much like explicit damage caps. They make cases less profitable for attorneys and, therefore, less likely to be brought.
Perinatal cases account for 11% of paid claims, but generated 22% of OOPPs (17 of 77). The higher frequency of OOPPs in these cases reflects the tendency of perinatal physicians to buy smaller policies than other physicians, at the same time that they face larger claims. Perinatal physicians’ willingness to bear this higher, but still small risk may reflect higher cost of med mal insurance or other differences between perinatal physicians and other physicians.
IV. WHAT POLICY LIMITS DO PHYSICIANS CHOOSE?
The conventional wisdom has long been that standard physician policy limits are $1 million per occurrence (and often $3 million per policy year). For example, the Medical Liability Monitor has used a $1 million/$3 million policy as the standard
Silver_production read v3 (clean) (Do Not Delete) 8/7/2015 3:09 PM
574 UC IRVINE LAW REVIEW [Vol. 5:559
when obtaining prices in its annual rate surveys, conducted since 1991.19 The American Society of Anesthesiologists does the same.20 Medicare uses the cost of a $1 million/$3 million policy as the basis for its liability cost estimate in physician payment formulas.21
For Texas physicians with paid claims, the data does not support the conventional wisdom. We examine nominal limits for policies purchased from 1986 to 2003—the years for which we have reasonably complete data. Throughout this period, the median nominal policy limit was $500,000. Only 34% of the policies in this subsample had nominal limits of $1 million. Another 6% had limits greater than $1 million. By contrast, 33% had nominal limits of $200,000 or less.
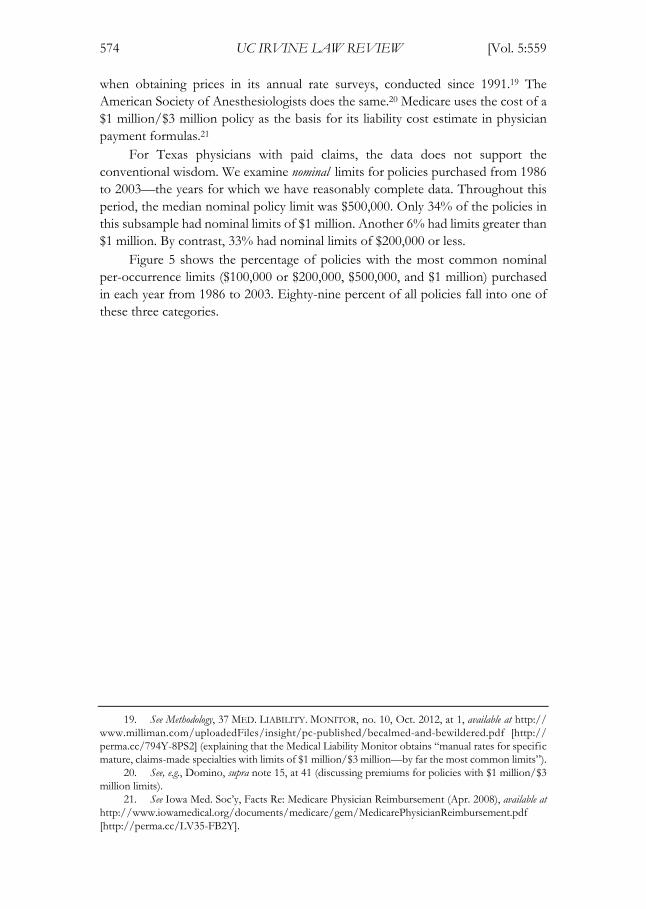
Figure 5 shows the percentage of policies with the most common nominal per-occurrence limits ($100,000 or $200,000, $500,000, and $1 million) purchased in each year from 1986 to 2003. Eighty-nine percent of all policies fall into one of these three categories.
19. See Methodology, 37 MED. LIABILITY. MONITOR, no. 10, Oct. 2012, at 1, available at http://www.milliman.com/uploadedFiles/insight/pc-published/becalmed-and-bewildered.pdf [http://perma.cc/794Y-8PS2] (explaining that the Medical Liability Monitor obtains “manual rates for specific mature, claims-made specialties with limits of $1 million/$3 million—by far the most common limits”).
20. See, e.g., Domino, supra note 15, at 41 (discussing premiums for policies with $1 million/$3 million limits).
21. See Iowa Med. Soc’y, Facts Re: Medicare Physician Reimbursement (Apr. 2008), available at http://www.iowamedical.org/documents/medicare/gem/MedicarePhysicianReimbursement.pdf [http://perma.cc/LV35-FB2Y].
Silver_production read v3 (clean) (Do Not Delete) 8/7/2015 3:09 PM
2015] POLICY LIMITS, PAYOUTS, AND BLOOD MONEY 575
Figure 5: Physician Nominal Policy Limit by Purchase Year
Per-occurrence policy limits by purchase year in nominal dollars for large paid med mal claims against physicians included in med mal dataset, with policies purchased over 1986–2003. Percentages do not equal 100% because some physicians purchased policies with sizes not shown here.
The frequency of policies with nominal limits of $100,000 or $200,000 showed no significant time trend through 2001, but then increased sharply in 2002 and 2003. The fraction of policies with $500,000 limits rose and then fell over time, while the fraction of $1 million policies fell, rose, and then fell again. The share of $1 million policies fell sharply in 2002 and 2003—the mirror image of the pattern for policies with nominal limits of $100,000 or $200,000. Over the whole period, mean nominal limits fell from $974,000 in 1986 to $619,000 in 2003. Median nominal policy limits also declined, from $750,000 to $500,000).
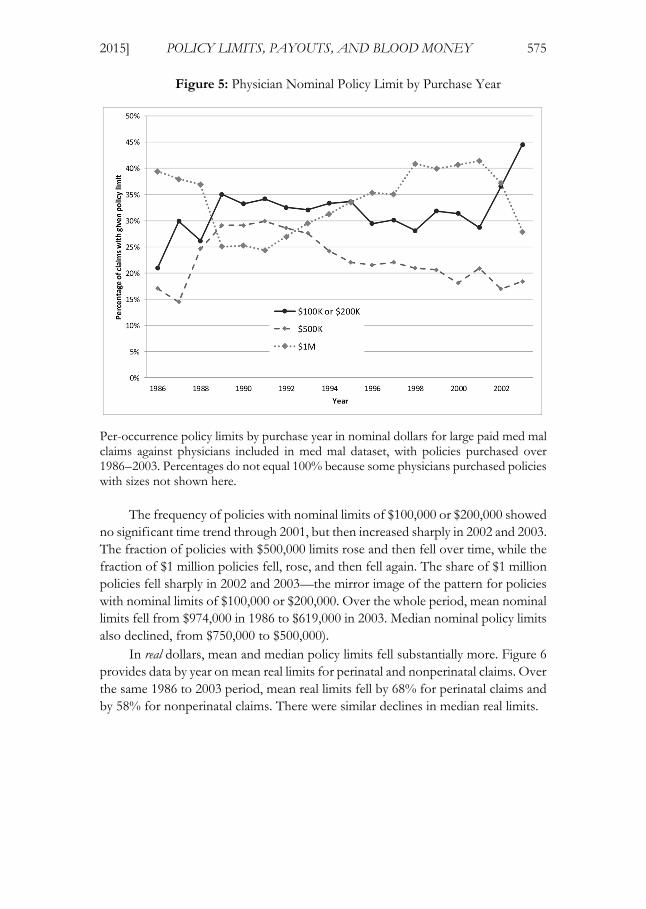
In real dollars, mean and median policy limits fell substantially more. Figure 6 provides data by year on mean real limits for perinatal and nonperinatal claims. Over the same 1986 to 2003 period, mean real limits fell by 68% for perinatal claims and by 58% for nonperinatal claims. There were similar declines in median real limits.
Silver_production read v3 (clean) (Do Not Delete) 8/7/2015 3:09 PM
576 UC IRVINE LAW REVIEW [Vol. 5:559
Figure 6: Physician Real Policy Limits by Purchase Year
Mean real per-occurrence policy limits by purchase year for large paid med mal claims against physicians, included in med mal dataset, for purchase years 1986–2003 (including duplicates), separately for perinatal and nonperinatal claims.
As Figure 6 shows, except for 1990, perinatal physicians have consistently carried policies with lower limits, with a tendency for the gap to increase over time. In particular, perinatal physicians are less likely to purchase policies with nominal limits of $1 million or more. Over our full sample period, 23% of perinatal claims involved policies with nominal limits of $1 million or more, compared to 42% of nonperinatal claims.
We do not have data on insurance policies purchased in other states. The conventional wisdom on standard policy sizes might be true elsewhere more often. But the conventional wisdom on standard size has not changed, to our knowledge, since at least the 1980s, even though nominal prices have more than doubled since then.22 This suggests that real policy limits are likely dropping in other states too. Declining real policy size could also account, at least in part, for our finding in
22. See F.W. Cheney, How Much Professional Liability Coverage is Enough? Lessons from the ASA Closed Claims Project, 63 ASA NEWSL., no. 6 (Am. Soc’y Anesthesiologists, Park Ridge, IL), 1999, at 19, 21, available at https://depts.washington.edu/asaccp/sites/default/files/pdf/Click%20here%20for%20_36.pdf [https://perma.cc/L9PC-9JVF] (“The question is often asked, ‘How much coverage should be purchased for professional liability insurance?’ While the answer will vary from state to state, ‘conventional wisdom’ calls for $1 million/$3 million, or in some cases $2 million/$6 million.”); see also Domino, supra note 15, at 40 (“Traditionally, policy limits have been $1 million per occurrence and $3 million per year.”).
Silver_production read v3 (clean) (Do Not Delete) 8/7/2015 3:09 PM
2015] POLICY LIMITS, PAYOUTS, AND BLOOD MONEY 577
related work that med mal filings decreased in all states, including those that did not impose damage caps or other tort reforms.23
Since real policy limits declined over time and policy limits often cap recoveries, one might expect that real payment per paid claim also declined. In fact, payout per claim was stable. The lack of a time trend in payout per claim could reflect an offsetting trend. Although real policy limits shrank, the underlying damages may have increased because medical costs (which are a component of damages) went up faster than general inflation.24 Another possibility is that plaintiffs’ lawyers, facing declining real policy limits as a de facto cap on recovery, became more reluctant to bring cases with lower expected damages.
V. DISCUSSION
When physicians campaign for tort reform, the risk of personal bankruptcy due to uninsured exposure to med mal claims ranks high on their list of complaints.25 They often contend that a single claim can wipe out the wealth a doctor accumulates over an entire career. The reality is quite different. OOPPs are rare, they rarely threaten physicians’ financial solvency, and they would be even rarer if all physicians bought the $1 million/$3 million policies that the conventional wisdom says they carry.
Texas is a large state, averaging around 28,000 active practicing physicians during the period we study. Yet, we found only four OOPPs per year. Thus, an average physician faced an annual risk of making an OOPP of about 0.014%. Many of those payments were relatively small—enough to hurt but not likely to render a physician insolvent.
The risk of an OOPP would drop to around two per year (and the risk per physician would fall below 0.01%) if physicians uniformly bought $1 million/$3 million policies. Why do they carry less coverage? One possible explanation is that, given prevailing prices, many prefer a cheaper policy with lower limits, despite the higher, but still very small risk of making an OOPP. It is theoretically possible that physicians lack good information about the size of the OOPP risk and would have purchased larger policies, had they known. But insurers and brokers make more money by selling larger policies. It seems unlikely that they would have left
23. Myungho Paik, Bernard Black & David A. Hyman, The Receding Tide of Medical Malpractice Litigation: Part 1—National Trends, 10 J. EMPIRICAL LEGAL STUD. 612, 614 (2013).
24. See Jeanne Sahadi, Family Health Costs Jump 5%, CNNMONEY (Sept. 15, 2009, 11:32 AM), http://money.cnn.com/2009/09/15/news/economy/health_insurance_costs/index.htm (reporting health care costs grew at an “average annual rate of 8.7%” over preceding ten years, and noting that “[i]n each of the past 10 years, [health care] insurance increases have outpaced inflation—sometimes by as much as 11 percentage points”).
25. See Howard B. Yeon & James H. Herndon, Protecting Your Assets: Why Medical Liability Insurance Isn’t Enough, AAOS NOW, Jan. 2008, http://www.aaos.org/news/aaosnow/jan08/managing6.asp [http://perma.cc/S8BV-CUXY] (“Medical liability is a ubiquitous concern for orthopedic surgeons. The prospect of a lawsuit brings well-justified fears of a prolonged, unpleasant, and costly judicial process that could result not only in professional stigma but also in financial ruin.”).
Silver_production read v3 (clean) (Do Not Delete) 8/7/2015 3:09 PM
578 UC IRVINE LAW REVIEW [Vol. 5:559
physicians in the dark about their uninsured exposure. And survey evidence suggests that physicians overestimate med mal risk.26 If physicians did not, they might buy even smaller policies than they do.
Why do perinatal physicians tend to purchase smaller policies than other doctors? We can only speculate. It is tempting to infer that, for some reason, the perceived risk of making an OOPP matters less to them. Were this not true, one might hypothesize, they ought to buy at least as much insurance as doctors in general and probably more, because they tend to face large claims. Obstetrics and gynecology is not an especially high- or low-paid specialty, so there is no reason to think that perinatal physicians are wealthier than other doctors,nor is there reason to think they are more risk preferring.
A more likely explanation is that insurance prices vary by practice area. If perinatal physicians pay more per dollar of coverage than other doctors, they may respond rationally to higher prices by purchasing less. Without data on prices, it is impossible to know why perinatal doctors carry less insurance coverage than others. Another possibility is that insurers may refuse to sell perinatal physicians larger policies. Although this seems counterintuitive—insurers should generally prefer selling more insurance to selling less—the desire to contain losses may discourage insurers from offering larger policies to perinatal physicians.27
Recently, other researchers have cast doubt on the generalizability of our findings by pointing out that Texas has favorable debtor protection laws, including an unlimited homestead exemption, which put physicians’ personal assets beyond the reach of injured patients.28 It is certainly true that we have studied only Texas and that the frequency of OOPPs in other states could differ. That said, many other states also have favorable debtor protection laws. And in states that afford creditors greater rights, doctors can use asset protection trusts and other vehicles to insulate their wealth.29 An army of financial planners and lawyers hawk information about trusts and other strategies that make it expensive or impossible for creditors to reach personal assets.30 No study has ever shown that malpractice claims threaten doctors in any state with a significant risk of insolvency.
26. Emily R. Carrier, James D. Reschovsky, David A. Katz & Michelle M. Mello, High Physician Concern About Malpractice Risk Predicts More Aggressive Diagnostic Testing in Office-Based Practice, 32 HEALTH
AFF. 1381 (2013); Emily R. Carrier, James D. Reschovsky, Michelle M. Mello, Ralph C. Mayrell & David Katz, Physicians’ Fears of Malpractice Lawsuits Are Not Assuaged by Tort Reforms, 29 HEALTH AFF. 1585 (2010).
27. James R. Posner, Trends in Medical Malpractice Insurance, 1970–1985, 49 LAW & CONTEMP. PROBS., no. 2, Spring 1986, at 37, 47 (“[F]rom 1976 to 1985, Medical Liability Mutual Insurance Company . . . in New York resisted offering limits greater than $1 million per occurrence, in the belief that higher limits would only lead to higher awards and settlements. Similarly, in 1985, the Medical Protective Company reduced its maximum limit from $1 million to $200,000 per occurrence in the Chicago area, in an effort to put a brake on the increasing size of claims.”).
28. Tom Baker, Eric Helland & Jonathan Klick, Everything’s Bigger in Texas Except the Medmal Settlements, CONN. INS. L.J. (forthcoming 2015).
29. Paul Sullivan, Safeguarding Your Assets Against the Hazards of a Lawsuit, N.Y. TIMES, Nov. 3, 2012, at B5.
30. E.g., ALAN R. EBER, FOR DOCTORS’ EYES ONLY: HOW TO PROTECT YOUR HARD-
Silver_production read v3 (clean) (Do Not Delete) 8/7/2015 3:09 PM
2015] POLICY LIMITS, PAYOUTS, AND BLOOD MONEY 579
Comments by informed persons who have no reason to pull their punches also suggest that OOPPs are uncommon nationwide. Consider the following remarks by Dr. Franklin A. Michota, a hospitalist at the Cleveland Clinic who serves as an expert witness in malpractice cases and advises doctors how to avoid being sued. After noting the possibility that a malpractice claimant could execute a judgment against a doctor’s personal wealth, Dr. Michota continued:
Most insurers love to get physicians involved in an umbrella policy; they try to scare you into believing that you need this extra coverage. I will tell you that in my experience, it’s probably not a good idea to get an umbrella policy, because attorneys aren’t going to spend the time to go after your personal assets. That’s because it’s really hard to do: It takes a lot of time, and the likelihood of getting additional assets aren’t [sic] great. . . .
So the best that they’re going to get is whatever the limits are of your policy. If you expand your policy, that’s just more limits that they will be able to go after. I’m not necessarily recommending you don’t get an umbrella policy, but in my experience, the attorneys are simply looking for where the insurance limits are, and they’re trying to get the maximum of those limits.31
The editor of Medical Economics, a magazine that covers business issues of interest to physicians, expressed the same view a decade before:
It’s also important to remember that the overwhelming majority of malpractice suits are settled for amounts within insurance limits, even when awards exceed the stated boundaries. It’s unusual for a physician to pay even part of an award or settlement out of his own pocket, although nobody wants to risk being the exception to the rule.32
Finally, consider the following observations offered by Karen Domino, a member of the research group at the University of Washington School of Medicine that has studied closed claims involving anesthesia mishaps for decades.
[A]nesthesiologists should note in general that payments are only made up to the policy limits. Hence, some liability insurance companies do not recommend higher than standard policy limits. In most cases of high awards, the insurer pays for the excess awards. The exception is that if the
EARNED ASSETS, available at http://foxlawllc.com/uploads/Alan_Eber_s_Asset_Protection_Guide_for_Doctors.pdf [http://perma.cc/MER8-5P6V]; Lawsuit Boom Pushes People into Protecting Assets, ASSET
PROTECTION CORP., http://www.assetprotectioncorp.com/litigationandassetprotection.html [http://perma.cc/6LJ7-VLUH] (last visited June 21, 2015); Making Your Client Judgment-Proof CLE, ROSSDALE
GROUP, available at http://www.mcssl.com/store/legalresourcesinc/catalog/product (follow “Making Your Client Judgment-Proof CLE” hyperlink) (last visited June 21, 2015).
31. Marrecca Fiore & Franklin A. Michota, Don’t Sue Me!: Avoiding Malpractice Pitfalls in Hospital Medicine, MEDSCAPE (May 22, 2014), http://www.medscape.com/viewarticle/825372_print.
32. Robert Lowes, Protect Your Assets Before You’re Sued, MED. ECON., Feb. 21, 2003, http://medicaleconomics.modernmedicine.com/medical-economics/news/clinical/personal-finance/protect-your-assets-youre-sued#sthash.XTqNkf3l.dpuf [http://perma.cc/65LT-XATX].
Silver_production read v3 (clean) (Do Not Delete) 8/7/2015 3:09 PM
580 UC IRVINE LAW REVIEW [Vol. 5:559
insurer proposes a settlement and the physician insists on a trial, the physician may be responsible for the award above the policy limit.33
Domino attributes anesthesiologists’ immunity from personal liability to state laws that put personal assets, “such as homes and retirement funds,” beyond the reach of malpractice claimants.34
Although it is certainly important to be cognizant of the limits of our empirical research, in the absence of direct evidence on haircuts and OOPPs in other states we continue to doubt that doctors in any state often face significant uninsured exposure on malpractice claims.
There are two competing explanations as to why plaintiffs and their attorneys are willing to settle for the available insurance money, instead of pursuing physicians’ personal assets. In a famous article, Tom Baker contends that plaintiffs’ attorneys share a norm that they will only pursue defendants’ personal assets in egregious circumstances, such as when tortfeasors engage in heinous behaviors, like drunk driving, or when they intentionally under-insure.35 An alternative possibility is that it is usually unprofitable for plaintiffs’ attorneys to pursue defendants’ personal assets and that the tactic is therefore reserved for unusual situations in which, for identifiable reasons, the normal economic incentives either do not apply or are overridden. If this purely economic account is correct, OOPPs would be rare, regardless of the norm. Indeed, the norm might do little or no real work, other than providing a convenient explanation for clients who want to know why their damages are not being paid in full.
Why, barring special circumstances, is it not economically sensible for plaintiffs’ lawyers to pursue physicians’ personal assets? We think several factors explain this behavior. First, not all doctors have much in the way of accumulated wealth. Newly minted physicians, family practitioners, doctors who work in rural areas, and doctors who practice in specialties with low wages are usually not wealthy.36 Some are saddled with considerable debts.37 Obviously, such physicians are not attractive targets for securing OOPPs.
Second, seeking to recover an OOPP is likely to delay the resolution of the
33. Domino, supra note 15, at 41. 34. Id. 35. Tom Baker, Blood Money, New Money, and the Moral Economy of Tort Law in Action, 35 LAW &
SOC’Y REV. 275 (2001). 36. See Susan Adams, Why Do So Many Doctors Regret Their Job Choice?, FORBES (Apr. 27, 2012,
4:57 PM), http://www.forbes.com/sites/susanadams/2012/04/27/why-do-so-many-doctors-regret-their-job-choice (discussing variation in pay across specialties); Jacquelyn Smith, The Best- and Worst-Paying Jobs for Doctors, FORBES ( July 21, 2011, 5:39 PM), http://www.forbes.com/sites/jacquelynsmith/2011/07/21/the-best-and-worst-paying-jobs-for-doctors.
37. See S. Ryan Greysen, Candice Chen & Fitzhugh Mullan, A History of Medical Student Debt: Observations and Implications for the Future of Medical Education, 86 ACAD. MED. 840, 840–41 (2011); James “Jay” Youngclaus & Julie Fresne, Trends in Cost and Debt at U.S. Medical Schools Using a New Measure of Medical School Cost of Attendance, ANALYSIS IN BRIEF (Ass’n. Am. Med. Colls., Washington, D.C.), July 2012, at 1–2, available at https://www.aamc.org/download/296002/data/aibvol12_no2.pdf [https://perma.cc/YN4U-RVLX].
Silver_production read v3 (clean) (Do Not Delete) 8/7/2015 3:09 PM
2015] POLICY LIMITS, PAYOUTS, AND BLOOD MONEY 581
case—and delay is costly for plaintiffs and their attorneys. Plaintiffs usually need money urgently to compensate for lost earnings and newly incurred medical expenses. Plaintiffs’ attorneys have to finance the costs of malpractice lawsuits, using bank loans and lines of credit that carry significant interest. Neither will receive any money until the case is resolved. When the insurer’s money is already on the table and holding out for an OOPP would entail significant delay, both will feel significant pressure to let the doctor off the hook. In other words, because their bargaining position is weak, plaintiffs and their lawyers routinely trade away the possibility of collecting an OOPP in exchange for an immediate payout.
Third, to retain the right to collect an OOPP, plaintiffs and their lawyers must often take unattractive gambles. Suppose a liability carrier is willing to pay the entire $500,000 limits of a physician’s policy and the doctor has another $250,000 in collectible assets. To obtain the full $750,000, the plaintiff and his attorney would have to put at risk the guaranteed $500,000, which the insurer will not pay until the doctor is released, in return for the possibility of winning an additional $250,000. The likelihood of winning the case would have to exceed 67% for a risk-neutral person to accept the gamble. When risk aversion, the time value of money, and the substantial expense of preparing for trials and defending appeals are considered, the odds would have to be considerably greater. Many risk averse persons in perilous financial straits would reject the gamble even if the likelihood of winning was close to 1.00.
From the plaintiffs’ attorneys’ perspective, the gamble is even worse because they bear all litigation costs (including both the cost of their time and out-of-pocket expenses) but receive only a fraction of the additional recovery.38 If an at-limits settlement offer is declined, the plaintiff’s lawyer will have to expend considerable time and money preparing the case for trial. Only a substantial premium over the fee that would be earned by settling could justify gambling on these terms. But, in fact, the premium is likely to be modest. Plaintiffs’ attorneys receive only a fraction of the amounts that physicians contribute, and those amounts are often too small to make the risk of going to trial worthwhile.
It may be helpful to reframe the discussion by asking a simple question. Under what circumstances does it make sense to turn down a guarantee of the policy limits for the hope of obtaining an additional payment from the physician-defendant years down the road? To our knowledge, no one has put forward a model of this marginal decision, but it seems clear that the upside would have to be sizeable given the risks and costs the gamble entails. If that is right, then it is also plausible that Baker’s “blood money” norm does little real work.
Indeed, several empirical studies indicate that plaintiffs who gamble on winning (by taking a case to trial or arbitration after rejecting an insurer’s final settlement offer) generally fare poorly. The most recent and most comprehensive
38. Joanna Shepherd, Uncovering the Silent Victims of the American Medical Liability System, 67 VAND. L. REV. 151, 165–67 (2014).
Silver_production read v3 (clean) (Do Not Delete) 8/7/2015 3:09 PM
582 UC IRVINE LAW REVIEW [Vol. 5:559
study, by Kiser, Asher and McShane, found that plaintiffs made a “decision error” 61% of the time when they rejected defendants’ final settlement offers.39 In two earlier studies, Gross and Syverud found that a majority of plaintiffs (61% or 65%, depending on the study) did less well at trial than they would have by settling.40 Rachlinski similarly found that 56% of plaintiffs made a decision error in rejecting a defendant’s final offer.41 The consistency of these findings is impressive.
If OOPPs occur infrequently, even when losses exceed the coverage limits, an obvious moral hazard arises. Doctors will have an incentive to underinvest in safety and loss prevention. This problem is eased somewhat by the collateral litigation costs that doctors do bear, even when they do not ultimately make an OOPP. Being sued imposes significant psychic costs on physicians, even when the case is dropped or dismissed at an early stage. For those cases that proceed, physicians have to provide insurers information, respond to discovery requests, and appear in depositions. These activities cost them valuable time and impose further psychic costs. Malpractice suits may also cause physicians to suffer reputational damage and lose hospital privileges. The desire to avoid these collateral costs may motivate doctors to take additional steps to protect patients from injury, notwithstanding the limited risk of an OOPP.42
But there is another way for doctors to entirely avoid the direct and collateral costs of med mal claims: deter injured patients from suing by convincing lawmakers to impose restrictions on lawsuits. Doctors are wealthy, intelligent, highly organized, and politically active. Most of their lobbying probably relates to the amounts that federal and state governments pay for their services, but tort reform has been part of physicians’ lobbying agenda for decades.43 They have enjoyed considerable success, especially at the state level.44 In fact, the patient safety movement within anesthesia succeeded despite opposition from rank-and-file members of the American Society of Anesthesiologists (ASA), who preferred lobbying for tort reform over improving their procedures and delivery systems.45 Few organizations
39. Randall L. Kiser, Martin A. Asher & Blakeley B. McShane, Let’s Not Make a Deal: An Empirical Study of Decision Making in Unsuccessful Settlement Negotiations, 5 J. EMPIRICAL LEGAL STUD. 551, 589 (2008).
40. Samuel R. Gross & Kent D. Syverud, Don’t Try: Civil Jury Verdicts in a System Geared to Settlement, 44 UCLA L. REV. 1, 42 (1996); see Samuel R. Gross & Kent D. Syverud, Getting to No: A Study of Settlement Negotiations and the Selection of Cases for Trial, 90 MICH. L. REV. 319, 360–66 (1991).
41. Jeffrey J. Rachlinski, Gains, Losses, and the Psychology of Litigation, 70 S. CAL. L. REV. 113, 154 (1996).
42. Doctors complain bitterly about these collateral costs. See, e.g., Birdstrike, Why a Malpractice Win for Doctors Feels Like a Great Loss, KEVINMD.COM (Mar. 22, 2013), http://www.kevinmd.com/blog/2013/03/malpractice-win-doctors-feels-great-loss.html [http://perma.cc/V2YJ-ENXA]. These costs are real, but their magnitude has resisted quantification. It would be a striking coincidence if these costs were large enough to encourage optimal investments in patient safety. Judging from the persistent frequency and severity of avoidable medical mistakes, these costs are not large enough.
43. Shepherd, supra note 38, at 167–68. 44. See id. at 168–71. 45. David A. Hyman & Charles Silver, The Poor State of Health Care Quality in the U.S.: Is Malpractice
Liability Part of the Problem or Part of the Solution?, 90 CORNELL L. REV. 893, 917–23 (2005).
Silver_production read v3 (clean) (Do Not Delete) 8/7/2015 3:09 PM
2015] POLICY LIMITS, PAYOUTS, AND BLOOD MONEY 583
of medical professionals have followed the ASA’s lead; most have preferred lobbying for tort reform over making sustained efforts to protect patients from medical errors.
Because insurers bear almost all the direct financial costs of malpractice claims, the deterrent signal of litigation (if any) is necessarily mediated through them. Unless insurers identify physicians who are more likely to endanger patients, charge them higher premiums, and encourage them to do better, much of the deterrent effect of the law will be lost. Whether insurers do much to influence doctors’ behavior is subject to debate. Historically, a consensus existed that they did very little.46 Researchers commonly observed that carriers rarely charged experience-rated premiums for medical professional liability coverage, restricted doctors’ practices, required doctors to obtain additional training, or employed other measures likely to protect patients from risks.47
Recently, a brighter picture has emerged. Shirley Svorny conducted extensive qualitative research on the insurance industry in California.48 She finds evidence that insurers do scrutinize doctors’ claims history and other risk-related characteristics when making underwriting decisions and when evaluating physicians for annual renewals. Some insurers study county records to find pending claims that have yet to generate payments and keep track of upgrades in doctors’ equipment and technologies. Many insurers also reserve the right to base premiums on physicians’ claims experience by offering premium discounts and credits to doctors with clean histories and by surcharging those with past payouts.49 Even a low rate of surcharges may be important, as insurers use the threat of charging more to motivate physicians with poor histories to improve.50
Insurers also segregate the market. Some cover only doctors with spotless records. Others underwrite doctors whose histories indicate higher risks. In some states, surplus lines carriers, which may charge five times as much as other insurers, cover doctors who are rejected by admitted carriers, which find them too risky. Doctors shunted into the surplus lines market know they have received a wake-up call. They pay higher premiums, their policies may saddle them with substantial deductibles, they may not be able to buy limits as high as they want, and additional claims may cause them to be rejected by the surplus market. Because companies specialize in particular risk niches, the market produces experience rating even if the companies individually do not. Finally, many insurers use risk management tools,
46. See FRANK A. SLOAN, RANDALL R. BOVBERG & PENNY B. GITHENS, INSURING MEDICAL
MALPRACTICE 211–12 (1991). 47. See id. 48. Shirley Svorny, Could Mandatory Caps on Medical Malpractice Damages Harm Consumers?, POL’Y
ANALYSIS (Cato Institute, D.C.), Oct. 20, 2011, at 1, available at http://object.cato.org/sites/cato.org/files/pubs/pdf/pa685.pdf [http://perma.cc/UNL4-MUZZ].
49. Id. at 6 (“A [rate] filing by Florida’s second largest insurer include[d] surcharges between 50 and 500 percent of standard premiums based on a physician’s seven-year claim history. A survey of Vermont companies reported surcharges as high as 400 percent.” (footnote omitted)).
50. See id. at 6–68.
Silver_production read v3 (clean) (Do Not Delete) 8/7/2015 3:09 PM
584 UC IRVINE LAW REVIEW [Vol. 5:559
such as alerts, training programs, and premium credits, for physicians who comply with risk-management guidelines, to encourage improvements. In some states, state-sponsored “joint underwriting associations” insure physicians who cannot obtain coverage in another way, similar to high-risk pools for automobile insurance. Little is known about how they operate, or what premiums they charge.
Professor Mark Geistfeld also notes that common insurer pricing practices, such as charging full- and part-time practitioners the same rate, discourage physicians on the wrong side of the volume-quality equation from continuing to practice.51 Family physicians have complained that such pricing practices make it impossible for them to continue to deliver babies,52 but that may be the point. Insurers bear the financial costs of “bad baby” cases—and they have apparently decided that it is better to have deliveries done by physicians who deliver babies full-time.
These findings suggest that researchers have given insurers too little credit for encouraging quality improvements. That said, insurers’ incentives are still inadequate. One major reason is that only a small fraction of negligent care leads to a med mal claim.53 Another is that, although insurers bear essentially all of the direct costs of malpractice claims brought by patients who do sue, they internalize only a fraction of the losses these patients incur. The remaining costs are borne by patients, their families, their first-party health insurers, and other parties and payers. Because liability carriers have incentives to avoid only losses for which they are responsible, they presumably put less emphasis on error-avoidance than is optimal when all losses are considered.
Although the portion of malpractice-related losses that liability insurers bear is unknown, it is surely well below 100%, even when a claim is brought. This may be inferred from our finding that, in the aggregate, plaintiffs who went to trial and won collected less than half of their trial verdicts. The verdicts may have overstated plaintiffs’ actual losses—some, about 8%, contained punitive awards; most, 84%, included noneconomic awards that reflected jurors’ subjective assessments of the value of pain and suffering; and some verdicts would have been reversed on appeal, had the cases not settled—but the overall haircut leaves little doubt that plaintiffs do not recover the full damages even when they win at trial. Because settlements in untried cases presumably reflect what plaintiffs can collect if they win at trial, including these post-trial haircuts, it is reasonable to think that plaintiffs recover only a fraction of their expected damages in untried cases too.
51. See Mark Geistfeld, Malpractice Insurance and the (Il)Legitimate Interests of the Medical Profession in Tort Reform, 54 DEPAUL L. REV. 439, 444, 451 (2005).
52. Id. at 448. 53. See TOM BAKER, THE MEDICAL MALPRACTICE MYTH ch. 2 (2007) (reviewing studies
comparing medical malpractice and lawsuits filed).
Silver_production read v3 (clean) (Do Not Delete) 8/7/2015 3:09 PM
2015] POLICY LIMITS, PAYOUTS, AND BLOOD MONEY 585
Other researchers also report that the tort system routinely under-compensates plaintiffs, especially those whose losses are severe.54 This comports with our finding that settlements stack up at the policy limits
As we have shown, perinatal doctors carry less coverage than other physicians. But even as a group, one can argue with considerable force that many physicians underinsure against the losses that medical errors impose on patients. Many of the Texas physicians in our dataset, all of whom experienced paid claims, carried less than the supposedly standard $1 million per-occurrence policy limits. In 2003, the median policy had $500,000 nominal limits. But, because doctors’ nominal insurance purchases failed to keep up with inflation and physicians seem to have responded to Texas’s malpractice crisis by buying less coverage, real limits declined markedly over the period we study. These findings indicate that the minimum amount of liability coverage that doctors maintain should be a central focus for policymakers as well as an object of further study.
We have not studied the factors that might explain this fall in real policy limits. One possibility is that many doctors purchase the minimum amount of coverage needed to obtain hospital privileges or to participate in provider networks. Unless these minimums rise with inflation, real policy limits will deteriorate. Another is that physicians have learned on their own, or with the help of financial advisors, that they can purchase smaller, cheaper policies and still face a very small risk of an OOPP.
This decline in the amount of real insurance coverage reflects an ongoing, hidden reduction in both the amount of compensation that is available to injured patients and physicians’ incentives to take care. Physicians save money by spending less on liability coverage and patients incur larger risks. In effect, there has been a wealth transfer from patients to physicians. Patients can insure some of the risks they have newly acquired by purchasing health, disability, and life insurance, but complete first-party coverage is rarely available for tort-induced losses, and it would not directly respond to the diminished safety incentives, in any case.
We do not know whether, in past years, the wealth transfer from physicians to patients was accompanied by increasing reliance on first-party insurers. Some commentators contend that a shift to first-party coverage would be a more efficient way to provide compensation for injuries.55 Others argue that greater use of first-party carriers would also improve the operation of the malpractice liability system because insurers, acting as patients’ subrogees, would do a better job of pursuing claims than patients can themselves.56 But there is as yet little evidence that first-party insurers are bringing claims that patients themselves would not. Moreover, if
54. Michael J. Saks, Do We Really Know Anything About the Behavior of the Tort Litigation System—and Why Not?, 140 U. PA. L. REV. 1147, 1218 (1992).
55. See, e.g., George L. Priest, The Current Insurance Crisis and Modern Tort Law, 96 YALE L.J. 1521 (1987).
56. See, e.g., Kenneth S. Reinker & David Rosenberg, Unlimited Subrogation: Improving Medical Malpractice Liability by Allowing Insurers to Take Charge, 36 J. LEGAL STUD. S261, S272–73 (2007).
Silver_production read v3 (clean) (Do Not Delete) 8/7/2015 3:09 PM
586 UC IRVINE LAW REVIEW [Vol. 5:559
doctors’ real policy limits continue to decline, first-party payers may discover that there is little or nothing for them to collect. The deterrent effect of malpractice lawsuits will be lost because it will not make sense—either for plaintiffs’ lawyers or first party insurers—to bring these suits.
Finally, in a well-functioning market, prices for medical services would decline as the cost of malpractice coverage falls. This should benefit patients by reducing health care costs. Whether physicians’ declining insurance purchases have helped keep prices in check is unknown, however, and there are good reasons to doubt that they have. The markets in which medical services are sold are far from perfect. Price are hidden; competition is impeded; and third party payment predominates. Whether patients have benefited from physicians’ reduced insurance costs is an open question, but it is possible that they have not.
CONCLUSION
Although physicians loudly complain that they are one med mal claim away from bankruptcy, the empirical evidence paints a radically different picture. The risk of an OOPP is small—vanishingly so when a physician buys $1 million in malpractice coverage. Physicians who choose to buy smaller malpractice policies, and thus incur somewhat higher but still tiny OOPP risk, probably have only themselves to blame if they end up having to make an OOPP.57
In states like Texas that do not impose minimum professional liability insurance requirements, physicians are legally free to purchase as much or as little coverage as they want. Many doctors appear to have decided that the most advantageous option is to buy the smallest policies that will satisfy the requirements set by hospitals, provider networks, and other private regulators. Little information about these requirements is publicly available, but their laxity is evidenced by the frequency with which Texas doctors carry policies with per-occurrence limits of $100,000 or $200,000.
If past is prologue, the (seemingly weak) private requirements that now exist will erode over time as inflation takes its toll on the real amount of insurance available to compensate injured patients. Physicians’ nominal insurance purchases have not risen over time, even though the primary drivers of malpractice damages—wages and health care costs—have increased substantially. Hospitals and other private regulators may feel no economic pressure to require doctors to buy larger policies, or they may feel stronger countervailing pressure from doctors to keep their requirements low. The deterrent effect of med mal liability has eroded substantially over the period covered by our data, and it seems likely to continue to do so absent regulatory change.
57. We are inevitably reminded of the classic definition of chutzpah. See Alex Kozinski & Eugene Volokh, Lawsuit, Shmawsuit, 103 YALE L.J. 463, 467 (1993) (“The most famous definition of ‘chutzpah’ is, of course, itself law-themed: chutzpah is when a man kills both his parents and begs the court for mercy because he’s an orphan.”).