Embed Size (px)
Citation preview

1783
[Journal of Business, 2006, vol. 79, no. 4]� 2006 by The University of Chicago. All rights reserved.0021-9398/2006/7904-0005$10.00
Randall A. HeronIndiana University
Erik LieUniversity of Iowa
On the Use of Poison Pills andDefensive Payouts by TakeoverTargets*
I. Introduction
On August 4, 1998, Allied Signal announced a $44.50per share unsolicited takeover offer for AMP Incor-porated. Upon the announcement, the stock price ofAMP increased by 49%, from $28.625 to $42.5625.AMP’s management, armed with a poison pill planand Pennsylvania antitakeover statutes, rejected thebuyout offer. However, over the following few weeks,72% of AMP’s shareholders chose to tender theirshares to Allied Signal rather than to give managementthe additional year it requested to turn around thecompany. Nevertheless, AMP’s management contin-ued its resistance. On September 18, 1998, AMP’smanagement reduced the threshold on the firm’s poi-son pill plan from 20% to 10%, thereby forcing AlliedSignal to reduce the size of its initial tender offer toavoid triggering the poison pill. A few days later, onSeptember 29, 1998, AMP announced a repurchase ofup to 14% of its outstanding shares at a price of $55per share. Although the repurchase price exceeded the$44.50 per share tender offer from Allied Signal by
* We thank Audra Boone, Laura Field, Jonathan Karpoff, RobertaRomano, Michael Stegemoller, an anonymous referee, and seminarparticipants at DePaul University and the Kelley School of Business(Indianapolis) for helpful suggestions. Contact the correspondingauthor, Randall Heron, at [email protected].
Using a large sample ofunsolicited takeover at-tempts, we examine thedeterminants and effectsof targets’ choice toadopt poison pills eitherbefore or after unsolicitedoffers and to initiate de-fensive payouts. Theprobability of poison pilladoptions decreases withinsider ownership,whereas the probabilityof defensive repurchasesincreases at a decreasingrate with insider owner-ship. Poison pills contrib-ute to bid increases andhigher bids, yet do notalter the likelihood oftakeover. Defensive sharerepurchases slightly re-duce the takeover likeli-hood but do not appearto harm shareholders,perhaps because theytend to fend off lowballbids or increase thefirm’s leverage.

1784 Journal of Business
$10.50, the stock of AMP fell $2.1875 per share following the announcement,or 5.6%, presumably on fears that AMP would successfully fend off Allied’stakeover offer.
Conventional wisdom based on the interpretation of announcement returnssuggests that the nearly 6% decline in AMP’s stock price at the announcementof its defensive share repurchase signaled that the defensive measure wasmerely entrenching the positions of managers and, as such, was not in thebest interests of shareholders. However, such a conclusion would be premature,since the collective strategy afforded AMP the time to find another suitor,Tyco International, which paid $11.3 billion for AMP, roughly $1.3 billionmore than Allied Signal’s offer. Notwithstanding this favorable outcome forAMP shareholders, numerous shareholder activists and legal scholars criticizedAMP’s use of a restrictive poison pill plan and defensive repurchase prior tothe resolution of the hostile takeover attempt.1
Over the past couple of decades, numerous corporate managers have em-ployed firm-level defensive measures similar to those used by AMP to improvetheir bargaining power, thwart hostile takeover offers deemed to be inadequate,and, arguably in many cases, preserve their jobs at the expense of shareholders’wealth. Despite their widespread use, they remain very controversial becauseof disagreements among practitioners and researchers regarding their “true”effects on takeover contests and shareholder value.
This study furthers our understanding of the use and effect of poison pillsand defensive payouts in response to takeover attempts in several ways. First,we use a sample and empirical test design that mitigates the endogeneityproblem highlighted by Comment and Schwert (1995). Specifically, we studythe effect of these defensive mechanisms on the final outcome for a sampleof 526 unsolicited takeover attempts. The sample includes both successfuland unsuccessful offers. Some of the firms had their takeover defenses alreadyin place, others adopted their takeover defenses in response to the offer, andsome did not employ these defenses. Thus the research design has significantpower because all firms in the sample were targeted and because of thedispersion in the defensive measures used. Second, we consider financial,ownership, governance, and offer characteristics that affect both the decisionto employ defensive mechanisms and other aspects of the takeover process.Many of these characteristics were ignored in past studies. Not only does thisminimize omission bias that might be present in other studies, it also enrichesour insight. For example, there is little evidence on the link between insiderownership and the decision to employ defensive payouts or poison pills,
1. One person in the top management team at AMP, Juergen Gromer, took a position at TycoInternational as the president of Tyco Electronics. Robert Ripp, the chairman and chief executiveofficer of AMP, was expected to join Tyco’s management team and board of directors but resignedafter the merger with Tyco was completed. In the next year he became the chairman of LightPathTechnologies and a director at Lightchip. No AMP director became a director at Tyco.

Poison Pills and Defensive Payouts 1785
despite clear predictions about this link in the literature.2 Third, we examinea much wider spectrum of measures for the outcome of the takeover process.For example, unlike Dann and DeAngelo (1988) and Denis (1990), we ex-amine the effect of defensive payouts on takeover premiums and the stockreturns during the takeover process. Further, while Comment and Schwert(1995) examine the effect of poison pills on the stock return during thetakeover process, we also examine the effect on bid increases and total takeoverpremiums.
We first examine the choice to use defensive mechanisms in response totakeover attempts. Irrespective of whether poison pills are adopted before orafter the takeover attempts, the probability that a firm will adopt a poison pilldecreases with insider ownership, suggesting that firms are more likely toerect barriers when the bargaining power of the inside owners or their personalstakes in the firms are low. In contrast, the probability that a firm will employa defensive repurchase increases at a decreasing rate with insider ownership.This provides direct evidence in support of Stulz’s (1988) model, which showsthat repurchases are more effective in fending off takeovers as insider own-ership increases, until it is so high that the firm is effectively entrenched.
Next, we examine the effect of poison pills and defensive payouts on thetakeover process. We find evidence that shareholders of targeted firms benefitfrom poison pills. In particular, poison pills do not reduce the likelihood ofa takeover and are associated with both higher takeover premiums and highershareholder gains. Further, shareholders benefit from the enhanced bargainingpower provided by poison pills regardless of whether they were in place beforethe takeover attempt or adopted as “morning-after” pills once the firm hasbeen targeted. One implication of our results is that the recent growth inopposition to poison pill defenses, such as that discussed in the March 2,2004,Wall Street Journal article titled “Where Are All the Poison Pills?” is,on the whole, misguided. Specifically, theWSJ article notes that “In additionto yielding to shareholder pressure, deal makers say companies are droppingthe takeover defense to win more favorable ratings from organizations thatevaluate corporate governance; such groups typically give lower scores tocompanies with poison pills” (p. C1). Our results suggest that among theorganizations that construct corporate governance ratings, those that routinelygive lower scores to companies with poison pills should revisit the issue inlight of the empirical evidence. Moreover, our evidence suggests that share-holders of firms that become takeover targets should encourage managers toadopt morning-after pills if they do not already have a poison pill defense in
2. Malatesta and Walkling (1988) provide univariate evidence that firms that adopt poison pillshave lower insider ownership than other firms. Field and Karpoff (2002) examine the relationbetween inside ownership and the use of takeover defenses for a sample of initial public offeringfirms in a multivariate context. However, they examine only defenses that were in place beforegoing public, and not those that might be adopted in response to a direct takeover threat, andthey do not distinguish between various types of takeover defenses.

1786 Journal of Business
place because, on average, they benefit from management’s ability to quicklyenhance their bargaining position.
Finally, although defensive repurchases reduce the likelihood that a takeoverwill be successful and do not on average produce bid increases, they do notappear to harm shareholder wealth. There are two possibilities for this. First,our evidence shows that defensive repurchases are more likely to be imple-mented in response to offers with low initial premiums, which would generateless wealth for target shareholders anyway. Second, payouts leave the firmswith higher leverage that could enhance value if the firms remain independent(Safieddine and Titman 1999).
The remainder of this paper proceeds as follows. Section II reviews theliterature, and Section III discusses the sample selection and descriptive sta-tistics. Section IV presents univariate comparisons. Section V presents theresults from our multivariate empirical tests, and Section VI presents aconclusion.
II. Literature Review
The subject of takeover defenses has been a controversial one for decades,and it remains so today. What researchers generally agree on are the twoalternative hypotheses regarding the effects of takeover defenses. The firstalternative, frequently referred to as the managerial entrenchment hypothesis,suggests that managers adopt takeover defenses to preserve their high-payingjobs at the expense of shareholders. The second hypothesis, often termed thestockholder interests hypothesis, purports that takeover defenses on averageincrease shareholder wealth because they enhance management’s ability toeither extract higher premiums from legitimate acquirers or fend off inadequateoffers (see DeAngelo and Rice [1983] and Linn and McConnell [1983] forfurther discussion). Despite the agreement on the underlying issue, researchershave arrived at different conclusions, often using similar methodologies andsample periods. For instance DeAngelo and Rice suggest that their evidencewith regard to the wealth effects of antitakeover charter amendments providesmore support for managerial entrenchment arguments, whereas Linn andMcConnell conclude that their evidence lends more support to the stockholderinterests hypothesis.
In comparison to antitakeover charter amendments that shareholders voteon, poison pills are even more controversial, largely because managers canadopt themwithout shareholder approval. Early studies of the effects of poisonpills utilize event study methodology and report negative abnormal stockreturns around the announcements of poison pill adoptions (Malatesta andWalkling 1988; Ryngaert 1988). However, Comment and Schwert (1995)argue that it is difficult to interpret announcement returns surrounding pilladoptions because they contain information about both (a) the net effects thatpills have on the probability that a takeover succeeds and the eventual premiumin a successful premium and (b) the probability of imminent takeover attempts

Poison Pills and Defensive Payouts 1787
or the status of ongoing takeover negotiations. For example, a pill announce-ment during merger negotiations “is tantamount to a disclosure of the badnews that a deal has yet to be struck, so a decline in stock price does notnecessarily imply deterrence” (19). Comment and Schwert further suggest thatperhaps “the market misestimated the eventual effect of pills and laws, over-estimating the costs of deterrence and underestimating the benefits of addedbargaining power” (38), which could explain the negative poison pill an-nouncement returns in earlier studies.
To provide more direct evidence on the deterrent effect of poison pills,Comment and Schwert relate the use of poison pills to the takeover rate forall exchange-listed firms during 1975–91. Because companies might adoptpoison pills when takeover attempts are imminent, giving rise to endogeneityproblems, they incorporate a proxy for the “surprise content” in poison pilladoptions. Their evidence suggests that poison pills do not materially detertakeovers. They also report evidence that poison pills enhance shareholdergains in successful takeovers, suggesting that poison pills benefit shareholders.In somewhat of a contrast, Field and Karpoff (2002) report that the presenceof takeover defenses, including poison pills, when a firm goes public reducesthe likelihood of a subsequent takeover and does not affect the takeoverpremium for those that are acquired.
Coates (2000) contends that the extant empirical evidence on the effectsof poison pills is weak and inconsistent because poison pills can be quicklyand inexpensively adopted, such that all firms effectively have latent or“shadow” pills. Because target boards can also easily redeem poison pills,Bebchuk, Coates, and Subramanian (2002) argue that poison pills are mosteffective when combined with an “effective” staggered board, which forcesthe bidder to go through at least two proxy contests to gain control of theboard and redeem the pill. While they do not test the interaction effect betweenpoison pills and staggered boards directly, they do report that the takeoverlikelihood is significantly lower and that shareholder returns are insignificantlylower for target firms with effective staggered boards.3 Finally, Danielson andKarpoff (2006) report that operating performance improves slightly after poi-son pill adoptions, which is not consistent with the notion that poison pillsentrench managers.
The literature relating to defensive payouts is not as broad, perhaps becausedefensive payouts are less controversial or because they are relatively infre-quent compared to poison pill adoptions. Dann and DeAngelo (1988) findthat the bidder did not gain control after any of the eight stock repurchasesin their sample of defensive restructurings, and Denis (1990) reports that themajority of firms that announce defensive payouts successfully thwart thetakeover efforts. Denis further finds negative returns around the announce-
3. Bebchuk et al. are unable to test the interaction effect of poison pills and staggered boardson the takeover process, because poison pills were in place before or adopted quickly after allthe 92 hostile bids in their sample. Thus it is unclear from their study what effect staggeredboards would have in the absence of poison pills.

1788 Journal of Business
ments of defensive payouts that are preceded by takeover activity. Collectively,one might interpret these results as evidence that managers use defensivepayouts to entrench themselves at the expense of shareholders. However,neither of these studies controls for other determinants of the final outcome.For example, defensive payouts might be implemented in response to offersthat managers believe have inadequate premiums. Such offers are less likelyto succeed even in the absence of a defensive payout, and defensive payoutsmight induce improvements in the terms for those that do succeed. Further-more, defensive payouts represent financial restructurings that often lead tosignificant increases in shareholder value due to benefits associated with in-creased debt utilization. Thus they are typically associated with subsequentimprovements in operating performance and stock returns in firms that remainindependent (Safieddine and Titman 1999). Finally, as argued by Commentand Schwert (1995), it is difficult to separate deterrence and information effectsin the stock price reaction to announcements of defensive mechanisms, evenwhen these announcements occur after the offers have been made (see theanalogous discussion above on poison pills). The Allied Signal–AMP cor-porate control contest discussed at the beginning of this study illustrates thispoint further.
The review of the literature relating to the effects of both poison pills anddefensive payouts reveals that it is mixed in the case of poison pills andinconclusive in the case of defensive payouts. Our aim with this study is toresolve some of the controversy and unanswered questions through a com-prehensive analysis of the characteristics of companies that employ thesedefenses, how these defenses affect takeover likelihood, how they affect share-holder premiums, and how they affect the returns that shareholders earn atleast through the resolution of the takeover contest.
III. Sample
Our sample is drawn from the Securities Data Company (SDC) Mergers andAcquisitions database and consists of 526 unsolicited acquisition attemptsannounced between 1985 and 1998. We define unsolicited takeover attemptsas those attempts classified as hostile or otherwise unsolicited in the SDCdatabase. By definition, all hostile takeovers are unsolicited, but the reverseis not always true. As Schwert (2000) points out, there is no consensus re-garding how to define hostile takeovers. Thus he cautions researchers andpractitioners about attempting to draw distinctions between hostile and non-hostile offers. For instance, Schwert suggests that the publicity surroundingthe bargaining process plays a large role determining whether a takeoverattempt is classified as hostile, even if managers are simply negotiating in astrategic manner, as opposed to attempting to entrench themselves. In thisstudy we focus on the strategic role that poison pills and defensive payoutsplay in the bargaining process surrounding unsolicited offers, regardless of

Poison Pills and Defensive Payouts 1789
whether the publicity of the negotiation process might prompt some observersto classify specific unsolicited bids as hostile.
We believe that our sample of unsolicited takeover attempts is well suitedto examine the choice to use defensive measures and their effect on thetakeover process. Dann and DeAngelo (1988) and Denis (1990) use samplesbased on hostile tender offers classified as contested. The exclusion of un-contested offers prevents them from analyzing the choice to resort to defensivemechanisms versus not fighting the takeover attempt. Comment and Schwert(1995) use all takeover attempts (including merger proposals and agreements),irrespective of whether they are solicited or unsolicited. Because poison pillsare unlikely to be used in solicited offers, their results might not fully revealthe effect of poison pills.
Because our tests rely on financial data, we require the sample firms to becovered by the Center for Research in Security Prices and Compustat. Weidentified the adoption dates of any poison pills for the sample firms bysearching various editions of the Clark Boardman publication titledCorporateAnti-takeover Defenses: The Poison Pill Device (1988–98) and Dow JonesNews Retrieval. Further, we identified defensive payouts by searching theSDC database and Dow Jones News Retrieval. Finally, we gathered infor-mation on CEO compensation, board composition and structure, and own-ership by officers and directors from proxy statements immediately precedingthe takeover attempts.
Table 1 provides descriptive statistics for the sample. The mean and medianmarket values of equity, determined 20 days prior to the announcement ofthe takeover attempts, are $794 million and $150 million, respectively. Themean and median total debt ratios of 56%–58% are virtually identical to thosefor respective industry norms, defined as the median for firms in the sametwo-digit Standard Industrial Classification (SIC) as each target firm. Market-to-book ratios average 1.29, with a median of 1.10; both are significantlylower than the mean of 1.35 and median of 1.25 for the industry norms (p-values! 0.05). Mean and median insider ownership levels are 12.4% and8.0%, respectively. The operating performance of the targeted firms comparesfavorably to that of industry peers. Mean and median industry-adjusted op-erating performance (defined as operating income scaled by assets) levels are1.80% and 1.75%, respectively. The mean stock return earned by the targetedfirms’ shareholders in the year prior to the takeover offer is 10.0%, with amedian of 4.6%. Initial premiums offered to shareholders (relative to the stockprice 20 days prior to the announcement of the offer) average 40%. Targetfirms received increased bid prices in 229 of the 526 offers (44% of thesample), and the mean increase in bid price is 9.7%. Not unexpectedly for asample of unsolicited takeover attempts, the sample includes a very highproportion of cash offers: 385 out of the 526 offers were 100% cash offers,and the mean proportion of cash across the entire sample is 85%.
Targeted firms had poison pills in place before 208 of the takeover an-

1790 Journal of Business
TABLE 1 Descriptive Statistics: 526 Unsolicited Takeover Targets, 1985–98
A.
Mean Median
Market value of equity $794 million $150 millionTotal liabilities/assets 56.44% 57.70%Cash/assets 9.84% 5.30%Pension overfund $/assets 1.14% 0%Market-to-book assets 1.29 1.10Insider ownership 12.42% 8.00%CEO compensation $542,201 $370,173Fraction of outside directors 53.60% 56.00%Industry-adjusted OIBD 1.80% 1.75%Stock return for prior year 9.99% 4.62%Premium offered 39.77% 37.74%Premium increase 9.66% 0%Proportion of cash in offer 84.96% 100%
B.
Number Fraction
Targets with existing poison pills 208 39.54%Targets that adopted morning-after pills 89 16.92%Targets with defensive payouts 50 9.51%
Defensive special dividend 11 2.09%Defensive share repurchase 39 7.41%
Staggered board 276 51.71%CEOpchairperson of board 322 61.22%Pill and staggered board 125 33.27%Contests with multiple bidders 225 42.78%Completed offers 110 20.91%Targets that survived less than 1 year after offer 256 48.67%Targets that survived less than 2 years after offer 307 58.37%Targets that survived less than 3 years after offer 330 62.74%Acquired within 3 years, no white knight 267 50.76%
Note.—Figures derived from financial statements pertain to the fiscal year preceding the announcement ofthe takeover attempt, unless otherwise indicated. Equity market values are as of 20 days prior to the an-nouncement of the takeover attempt. Information pertaining to insider ownership, CEO compensation, and theboard of directors comes from the most recent proxy statement prior to the announced takeover attempt. CEOcompensation is the sum of the CEO’s salary plus cash bonus for the year prior to the takeover announcement.Industry-adjusted OIBD (operating income before depreciation) is the paired difference between operatingincome/assets for the sample firm and the median figure for firms with the same two-digit SIC code. Stockreturn for prior year is the cumulative stock return over the year ending 20 days prior to the announcementdate of the takeover attempt. Premium offered is the initial offer price divided by the price 20 days prior, lessone. Premium increase is the percentage increase in the bid price, relative to the price 20 days prior to theinitial offer. Completed offers are those that were completed without ever having been withdrawn. The sur-vivability rates reflect the percentage of firms that ceased to exist as a public corporation for windows spanningone, two, and three years after the takeover offer. As is discussed further in the text, most of the firms thatdid not survive were acquired in some fashion, although some ultimately went bankrupt.
nouncements and announced morning-after pills (defined as a poison pilladopted after the takeover attempt was announced but before the outcomewas determined) in 89 contests. Fifty of the targeted firms announced a de-fensive payout in response to the takeover offer. Of the defensive payoutannouncements, 11 were special dividends and 39 were share repurchases(paid for by cash, debt, or both).4 Slightly over half of the sample firms (52%)
4. Following Denis (1990), we include exchange offers of debt or debt and cash for equity inour definition of share repurchases and excluded targeted repurchases (i.e., greenmail).

Poison Pills and Defensive Payouts 1791
had staggered boards in place, and one-third of the firms had both a poisonpill and a staggered board—a combination that Bebchuk et al. (2002) argueforms a particularly powerful antitakeover defense. Multiple bidders wereinvolved in 225 contests (43%). One hundred and ten (21%) of the takeoverattempts succeeded without the offer ever having been withdrawn by theoriginal bidder. However, public survivability rates for the targeted firms overwindows spanning up to three years after the initial takeover attempt are muchlower than what the above figure might suggest because of the possibility ofmultiple bidders, subsequent bids made by other firms or by the original bidderin another attempt, going private transactions, and bankruptcies. Specifically,once targeted, nearly half (49%) of the firms did not survive publicly for onefull year (249 of 526 were acquired and seven were delisted because ofbankruptcy). Over a three-year window subsequent to the takeover attempt,330 of the 526 firms (63%) did not survive as a public firm because theywere acquired by another public company, taken private, or delisted for otherreasons such as bankruptcy. Within three years after the initial takeover at-tempt, 51% of the sample firms were acquired by another firm that was notconsidered to be a white knight. Thus it is apparent that the long-term sur-vivability rate for firms targeted in our sample is relatively low, even if theywere initially successful in fending off the unsolicited bidder.
IV. Univariate Comparisons
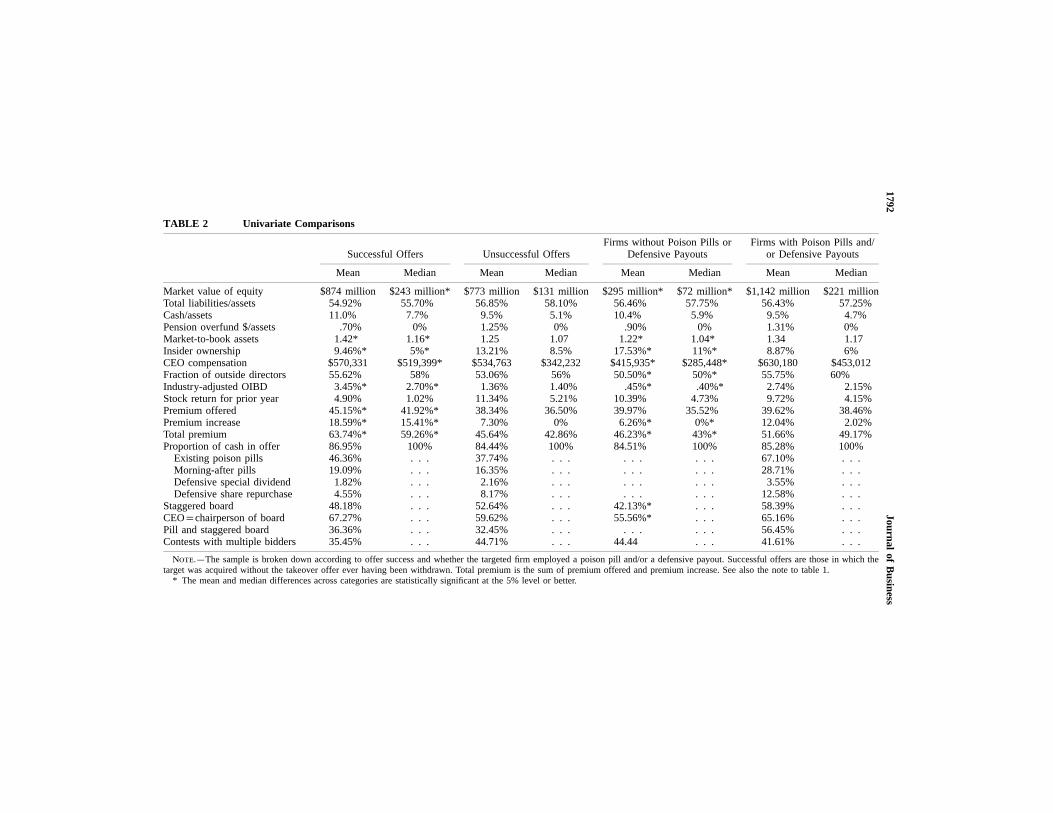
Table 2 provides a further decomposition of the sample along two dimensions:the first according to whether the takeover offer succeeded without ever havingbeen withdrawn and the second according to whether the target employed apoison pill plan and/or a defensive payout. The comparison of successfulversus unsuccessful offers reveals that market-to-book ratios and industry-adjusted operating performance are significantly higher (in terms of bothmeans and medians) for successful offers. In contrast, both mean and medianinsider ownership figures are significantly lower for successful offers. Thedifference in shareholder premiums between successful versus unsuccessfuloffers is particularly noteworthy. Initial premiums for successful offers areroughly 7% higher in terms of means (45.15% vs. 38.34%) and 5% higherin terms of medians (41.92% vs. 36.50%). The same is true for premiumincreases, where the mean premium increase for successful offers is roughly11% higher than the comparable figure for unsuccessful offers (18.59% vs.7.30%). Total premiums (the sum of the initial premium offered and thepremium increase) for successful offers are nearly 18% higher in terms ofmeans (63.74% vs. 45.64%) and 17% higher in terms of medians (59.26%vs. 42.86%). All the above noted differences in initial premiums, premiumincreases, and total premiums are significant at the 5% level or better. Althoughthe figures are not significantly different from each other, targets of successfuloffers had a slightly higher incidence of poison pill plans in place prior to
1792Journal
ofB
usiness
TABLE 2 Univariate Comparisons
Successful Offers Unsuccessful OffersFirms without Poison Pills or
Defensive PayoutsFirms with Poison Pills and/
or Defensive Payouts
Mean Median Mean Median Mean Median Mean Median
Market value of equity $874 million $243 million* $773 million $131 million $295 million* $72 million* $1,142 million $221 millionTotal liabilities/assets 54.92% 55.70% 56.85% 58.10% 56.46% 57.75% 56.43% 57.25%Cash/assets 11.0% 7.7% 9.5% 5.1% 10.4% 5.9% 9.5% 4.7%Pension overfund $/assets .70% 0% 1.25% 0% .90% 0% 1.31% 0%Market-to-book assets 1.42* 1.16* 1.25 1.07 1.22* 1.04* 1.34 1.17Insider ownership 9.46%* 5%* 13.21% 8.5% 17.53%* 11%* 8.87% 6%CEO compensation $570,331 $519,399* $534,763 $342,232 $415,935* $285,448* $630,180 $453,012Fraction of outside directors 55.62% 58% 53.06% 56% 50.50%* 50%* 55.75% 60%Industry-adjusted OIBD 3.45%* 2.70%* 1.36% 1.40% .45%* .40%* 2.74% 2.15%Stock return for prior year 4.90% 1.02% 11.34% 5.21% 10.39% 4.73% 9.72% 4.15%Premium offered 45.15%* 41.92%* 38.34% 36.50% 39.97% 35.52% 39.62% 38.46%Premium increase 18.59%* 15.41%* 7.30% 0% 6.26%* 0%* 12.04% 2.02%Total premium 63.74%* 59.26%* 45.64% 42.86% 46.23%* 43%* 51.66% 49.17%Proportion of cash in offer 86.95% 100% 84.44% 100% 84.51% 100% 85.28% 100%
Existing poison pills 46.36% . . . 37.74% . . . . . . . . . 67.10% . . .Morning-after pills 19.09% . . . 16.35% . . . . . . . . . 28.71% . . .Defensive special dividend 1.82% . . . 2.16% . . . . . . . . . 3.55% . . .Defensive share repurchase 4.55% . . . 8.17% . . . . . . . . . 12.58% . . .
Staggered board 48.18% . . . 52.64% . . . 42.13%* . . . 58.39% . . .CEOpchairperson of board 67.27% . . . 59.62% . . . 55.56%* . . . 65.16% . . .Pill and staggered board 36.36% . . . 32.45% . . . . . . . . . 56.45% . . .Contests with multiple bidders 35.45% . . . 44.71% . . . 44.44 . . . 41.61% . . .
Note.—The sample is broken down according to offer success and whether the targeted firm employed a poison pill and/or a defensive payout. Successful offers are those in which thetarget was acquired without the takeover offer ever having been withdrawn. Total premium is the sum of premium offered and premium increase. See also the note to table 1.
* The mean and median differences across categories are statistically significant at the 5% level or better.

Poison Pills and Defensive Payouts 1793
the offer (46% vs. 38%) and were more likely to adopt morning-after pillsin response to the takeover attempt (19% vs. 16%).
The univariate comparison of targets that utilized poison pill plans, defen-sive payouts, or both, with the remainder of the firms targeted for takeover,reveals significant differences along several dimensions. Firms with neitherdefense in place are significantly smaller in terms of both mean and medianequity values (p-values! .01) and have significantly higher levels of insiderownership (p-values! .01). The mean and median insider ownership levelsfor firms that did not use the defenses are 17.53% and 11%, whereas thecorresponding figures for firms that utilized the defenses are 8.87% and 6%,respectively. Interestingly, the collective group of firms that employed a poisonpill, a defensive payout, or both had significantly higher mean and medianproportions of outside board members (p-values! .01) and also exhibitedhigher levels of industry-adjusted operating performance (p-values! .01) inthe year prior to their attempted takeover. Although initial premiums offereddo not statistically differ between the firms that used the defenses and thosethat did not, premium increases and total premiums are significantly higherfor the firms that used poison pills, defensive payouts, or both (p-values!
.05). On average, firms with poison pills and/or defensive payouts were offeredtotal premiums that exceeded those offered to firms lacking such defenses byapproximately 6%.
The univariate comparisons made so far do not lend support to argumentsthat poison pills and defensive payouts are used to entrench managers at theexpense of shareholders. Instead, at least with respect to poison pills, the firmsin our sample that were successfully acquired were more likely to have apoison pill in place prior to the acquisition attempt or otherwise adopt morning-after pills in response to the bid. Moreover, our findings that the aggregatepopulation of firms that adopted either poison pills or defensive payouts havehigher fractions of outside board representation, higher market-to-book ratios,and better industry-adjusted operating performance and that they receivedlarger premium increases and total premiums than firms without such pro-tections seem inconsistent with the notion that their intended purpose is toentrench incumbent managers. We pursue these issues further in a more refinedmultivariate setting in our subsequent tests.
Although often overlooked in studies of takeover defenses, the univariatecomparisons suggest that insider ownership levels play a material role in thedecision to employ takeover defenses. Obviously, if insider ownership levelsare high enough to effectively thwart unsolicited takeovers, defensive mech-anisms are unnecessary. As further evidence in this regard, among those 16firms in the sample in which insider ownership exceeded 50%, thereby rulingout the possibility of a hostile takeover, none employed a poison pill or adefensive payout. We expand on the relationship between insider ownershipand the choice to adopt defensive mechanisms in the following multivariateframework.

1794 Journal of Business
V. Multivariate Empirical Tests
A. Determinants of Defensive Responses to Takeover Attempts
The decision by a target firm’s management to respond defensively to anunsolicited takeover offer likely depends on a host of factors, including theconsequence of a takeover for incumbent management, the premium offeredto shareholders, management’s assessment of firm value, and the target’sbargaining power and ability to resort to defensive techniques. In this section,we examine the choice to adopt poison pills or undertake defensive payouts.Although the purpose of both defensive mechanisms is to enhance manage-ment’s bargaining power, their determinants and effects might differ, so westudy them separately.
Harford (1999) and Pinkowitz (1999) report that firms with excess cashare less likely to become takeover targets.5 Both authors suggest that theseresults arise because firms with excess cash have the financial flexibility todeter takeovers through the use of defensive payouts. Consequently, we con-jecture that the probability that target firms will initiate defensive payoutsincreases with excess cash levels. Further, because excess debt capacity mightact as a substitute for excess cash, we conjecture that the probability of adefensive payout decreases with the debt ratio. Moreover, because Mitchelland Mulherin (1989) and Petersen (1992) show that overfunded defined benefitpension plans can be used by corporate raiders to finance takeover attemptsor by the firm’s existing management to pay for defensive payouts designedto thwart unsolicited takeovers, we also include the extent of pension over-funding scaled by total assets as a measure of financial flexibility.
Mikkelson and Partch (1989) and Cotter and Zenner (1994) report that theprobability that a target rejects an offer is negatively related to insider holdings.One interpretation is that managers are more inclined to support a takeoverwhen their financial benefits are large, as would be the case when their personalshareholdings are sizable. Hence, we expect that firms are more likely toinitiate defensive mechanisms when their insider holdings are low.
However, the relation between insider holdings and the use of defensivepayouts might differ from that between insider holdings and other defensivemechanisms. In Stulz’s (1988) model, repurchases can be used to entrenchthe firm because they remove outstanding shares, thereby effectively increas-ing the fraction of shares held by managers. Under the assumption that man-agers do not sell shares, the deterrent effect of a defensive share repurchaseis weak for low levels of insider holdings. But the effect increases as insider
5. Although they are not reported in a table, we confirm these results. In particular, we firstassembled a sample of control firms with size and industry characteristics similar to those ofthe target firms. Next, we estimate logistic regressions of the probability that firms were targetedusing firm size, profitability, market-to-book value of assets, leverage, and excess cash as in-dependent variables; the excess cash was estimated as explained in n. 7. As in Harford (1999)and Pinkowitz (1999), the probability of being targeted decreases with the market-to-book ratioof assets and with the excess cash ratio. None of the other control variables was statisticallysignificant at conventional levels.
Poison Pills and Defensive Payouts 1795
holdings get larger, because insiders’ incremental change in voting powerincreases with the level of their holdings prior to the repurchase.6 However,if the fraction of insider holdings is sufficiently large (i.e., large enough thatit makes the firm immune to unwanted takeovers), managers have no incentiveto conduct a defensive share repurchase. This line of reasoning implies thatthe probability of a defensive payout should increase at a decreasing rate withinsider holdings.
B. Probability of Poison Pill Adoption
Table 3 presents logistic regressions of the probability that takeover targetshad poison pills in place prior to the takeover attempt announcements basedon the entire sample (model a) or the probability that targets adopted a “morn-ing-after” poison pill in direct response to the takeover attempts based on the318 targets with no poison pill at the takeover announcement (model b). Bothmodels include as independent variables the market value of equity, the debtratio, an excess cash measure,7 a measure of pension plan overfunding,8 themarket-to-book ratio, insider ownership, board of director characteristics, CEOcompensation levels, industry-adjusted operating performance, stock price per-formance for the prior year, and indicator variables representing the use of adefensive special dividend or share repurchase.9 In addition, model b includesthe initial takeover premium and the proportion of cash in the takeover offer.We do not include these two variables in model a since they are revealed at
6. For example, if the firm repurchases half of its shares, the fraction of insider holdings willdouble provided that insiders do not sell their shares. This doubling will have a more significantimpact on voting control if insider holdings prior to the repurchase are 20% rather than 1%. Forinstance, consider insiders of two firms (A and B) that conduct defensive self-tender offers torepurchase half of their firm’s outstanding shares (managers do not participate in the repurchase).If insiders in firm A held 1% of the outstanding shares prior to the share repurchase, their holdingswould increase to 2% afterward. Although their relative voting control has doubled, it wouldhave a small effect on their ability to block a takeover on the basis of voting power. In contrast,suppose that insiders in firm B held 20% of the firm’s outstanding shares prior to the sharerepurchase. Subsequent to the repurchase, their voting block would have doubled to 40% of thetotal shares outstanding, making it very unlikely for a hostile takeover to succeed.
7. As in Harford (1999) and Pinkowitz (1999), we estimate excess cash ratios with a two-stepprocedure. First, using the universe of Compustat firms, we regress individual firms’ cash ratiosagainst their cash flow scaled by book value of assets, market-to-book ratio, natural logarithmof book value of assets, standard deviation of cash flows for firms with the same two-digitprimary SIC code, total debt scaled by book value of assets, R&D expenses scaled by bookvalue of assets, an indicator variable for financial firms, and an indicator variable for utilities.Second, we estimate excess cash ratios as the difference between actual cash ratios and predictedcash ratios based on the estimated regression coefficients.
8. For firms with defined benefit pension plans, the dollar amount of pension overfunding isthe difference between the present value of all pension plan assets and the present value of allpension plan obligations. If the plan’s assets exceed the obligations, the pension is overfunded;if the plan’s assets are less than the obligations, the pension is underfunded. In order to makeour measure comparable across firms, we scale the dollar amount of pension over- (or under-)funding by the firm’s total assets. For firms without defined contribution plans, this variabletakes on a value of zero.
9. To mitigate the influence of outliers, we estimate all regression models with the continuousvariables winsorized at the fifth and ninety-fifth percentiles. In all instances, we obtain virtuallyidentical results if we use unwinsorized data.

1796 Journal of Business
TABLE 3 Probability That the Targets Adopt Poison Pills
Model a Model b
Coefficient p-Value Coefficient p-Value
Intercept �13.129 .001 �7.702 .025Log of equity market value .171 .111 �.204 .177Total liabilities/assets �.468 .443 �.560 .474Excess cash/assets �3.738 .004 1.370 .399Pension overfund $/assets �7.151 .092 1.414 .798Market-to-book assets .216 .536 1.169 .010Special dividend .848 .239 1.879 .147Share repurchase .346 .369 .150 .799Insider ownership �2.943 .007 �3.467 .010Staggered board .531 .010 .650 .021Log of CEO compensation .838 .000 .551 .089Fraction of outside directors .084 .881 1.189 .107CEOpchairperson of board �.423 .056 .217 .482Industry-adjusted OIBD 1.391 .494 .464 .855Stock return for prior year �.809 .021 .369 .441Premium offered (%) .767 .246Proportion of cash in offer .041 .926Observations 526 318Likelihood ratio statistic 106.93 .000 35.92 .003Likelihood ratio index 15.15% 9.53%
Note.—Logistic regressions of the probability that the takeover targets had a poison pill prior to the takeoverattempt (model a) and of the probability that the target adopts a poison pill after a takeover attempt is announced,but before the outcome is determined (model b). The estimation of excess cash is explained in n. 7. Specialdividend is an indicator variable equal to one if the target declared a special dividend in response to thetakeover attempt, zero otherwise. Share repurchase is an indicator variable equal to one if the target firmannounced a share repurchase in response to the takeover attempt, zero otherwise. Insider ownership figuresrepresent the fractional ownership of officers and directors (taken from proxy statements). Staggered board isan indicator variable equal to one if the target had a staggered board, zero otherwise. The likelihood ratioindex is defined as [1� (log likelihood at convergence)/(log likelihood at zero)]. It is similar to theR2 statisticfor a multiple linear regression. See also the note to table 1.
the announcement of the offer and thus have no bearing on the decision toadopt a poison pillbefore the offer.
In model a, the coefficients on the excess cash ratio and insider ownershipare negative and significantly different from zero. Thus firms with poison pillsin place before the takeover announcement tend to have lower levels of cashand insider ownership. One interpretation is that firms are more likely toproactively adopt poison pill plans when their financial and ownership char-acteristics do not provide managers with a strong bargaining position in theevent that the firm becomes a takeover target. An alternative interpretation isthat managers of firms with poison pills allow levels of cash and insiderownership to decline in the comfort that the pill will provide sufficient pro-tection from inadequate takeover overtures. The negative coefficient on theprior year’s stock return might reflect a propensity for firms to adopt takeoverdefenses when recently poor stock price performance has increased their vul-nerability to takeover attempts. There are significantly positive coefficientson the staggered board indicator variable and the CEO compensation variable.As discussed earlier, the effectiveness of poison pill plans is enhanced whenthe firm also has a staggered board of directors. An agency cost–based in-

Poison Pills and Defensive Payouts 1797
terpretation of the positive coefficient on the CEO compensation variablewould be that CEOs are more likely to adopt takeover defenses such as poisonpills out of their own self-interests when their salaries are larger. We rely onsubsequent multivariate tests for further guidance on this issue.
The coefficient on the insider ownership variable in model b is also sig-nificantly negative, suggesting that target firms are more likely to adopt poisonpills in direct response to attempted takeovers when insider ownership is low.Our interpretation for this result and its persistence across both models is thatmanagers seek to strengthen their bargaining position via poison pills whentheir bargaining position arising from their ownership is weak, as in Stulz’s(1988) model. Another explanation is that managers are more likely to fighttakeover attempts with poison pills when their financial reward in the formof the total dollar premium on their shares is low. However, our later resultslend little credence to this second explanation, since poison pills appear toprimarily raise premiums and do not obstruct the takeover attempts. Moreover,although we do not tabulate the results, we estimated abnormal returns overthe interval from minus one to plus one surrounding 81 morning-after poisonpill adoptions that did not coincide with the announcement of the takeoverattempt. Although the average abnormal return of 0.59% does not statisticallydiffer from zero, it does contrast with the negative reactions found by priorstudies when poison pills are adopted in the midst of corporate control contests(see, e.g., Malatesta and Walkling 1988; Ryngaert 1988; Comment andSchwert 1995). Although statistically insignificant, the positive stock pricereaction indicates that the initially negative perception of poison pills hasdisappeared in later samples as more direct evidence regarding their true effectsbecomes available.10
The coefficient on the staggered board indicator variable is once againsignificantly positive, suggesting that staggered boards and poison pills arecomplementary. As discussed earlier, Bebchuk et al. (2002) provide a specificexplanation for how poison pills and staggered boards complement each other:poison pills are more effective when staggered boards prevent them frombeing redeemed in the short run. Finally, the coefficient on the market-to-book ratio is significantly positive. One possibility for this result is that man-agers find it relatively more appealing to use repurchases to fend off takeoverswhen the market-to-book ratio is low (see further discussion below on theuse of defensive payouts).
C. Probability of Defensive Payouts
Table 4 presents logistic regressions of the probability that a targeted firminitiates a defensive payout. The dependent variable in model a equals one
10. We also estimated cross-sectional regressions of the abnormal returns at the announcementof morning-after pills on the firm’s characteristic, offer characteristic, and governance structurevariables that we use as independent variables in our other cross-sectional tests. Because theseregressions did not explain enough of the variation in abnormal returns to meet conventionallevels of statistical significance, we do not tabulate the results.

1798 Journal of Business
TABLE 4 Probability That the Targets Announce Defensive Payouts
Model a Model b Model c
Coefficient p-Value Coefficient p-Value Coefficient p-Value
Intercept �14.211 .002 �11.135 .028 �11.980 .021Log of equity market value 1.254 .000 1.197 .000 1.174 .000Total liabilities/assets �2.435 .047 �2.190 .104 �2.573 .063Excess cash/assets 3.559 .130 7.210 .006 7.096 .007Pension overfund $/assets 23.303 .000 28.968 .000 28.920 .000Market-to-book assets �2.596 .000 �2.987 .000 �3.099 .000Existing poison pill .624 .165 .307 .522 .422 .394Morning-after pill .610 .275 .227 .712 .372 .553Insider ownership 18.139 .003 21.693 .003 20.563 .005Insider ownership2 �36.366 .021 �53.666 .013 �49.575 .020Staggered board .512 .171 .396 .339 .471 .265Log of CEO compensation �.114 .774 �.198 .656 �.094 .836Fraction of outside directors �3.415 .001 �3.862 .001 �3.624 .002CEOpchairperson of board .958 .036 .756 .120 .721 .141Industry-adjusted OIBD 5.117 .190 9.616 .025 10.485 .016Stock return for prior year �.549 .402 �.431 .554 �.766 .314Premium offered (%) �.975 .276 �1.738 .085 �2.002 .053Proportion of cash in offer 1.544 .040 .974 .211 .966 .224Observations 526 526 525Likelihood ratio statistic 100.96 .000 86.42 .000 86.25 .000Likelihood ratio index 30.56% 31.09% 31.62%
Note.—Logistic regressions of the probability that the takeover targets announced a defensive specialdividend or share repurchase. The dependent variable in model a is an indicator variable equal to one if thefirm either paid a defensive special dividend or carried out a defensive share repurchase, zero otherwise. Thedependent variables in models b and c equal one only for those firms that carried out defensive share repurchases.The sample size in model c is smaller by one observation since the regression model excludes one firm thatcarried out its defensive share repurchase prior to the announcement of the unsolicited takeover attempt. Alsosee the notes to tables 1–3.
for firms that announced either a defensive special dividend or a defensiveshare repurchase, and zero otherwise; the dependent variable in models b andc equals one for firms that announced a defensive share repurchase, and zerootherwise.11 Model c differs from model b in that it excludes one firm thatannounced its defensive share repurchase before its attempted takeover wasannounced. The independent variables in all models are those utilized in table3, except that all models in table 4 include both insider ownership and asecond-order ownership term to test for a nonlinear relationship as predictedby Stulz’s (1988) model.
The logistic regressions indicate that firms are more likely to conduct de-fensive payouts in response to attempted takeovers if they are large and havelow debt levels and market-to-book ratios. Further, firms are more likely toundertake defensive payouts if they have excess cash (consistent with Har-ford’s [1999] and Pinkowitz’s [1999] conjectures) or if they have the ability
11. We also estimated a regression model in which the dependent variable equaled one forthose firms that paid out defensive special dividends, and zero otherwise. The only coefficientthat differed significantly from zero was the positive coefficient on firm size. Because of thesmall number of defensive special dividends and the low explanatory power in the regressionmodel, we do not tabulate these results.

Poison Pills and Defensive Payouts 1799
to tap into an overfunded pension plan. Our results on debt, cash levels, andoverfunded pensions are intuitive because defensive payouts, unlike poisonpill adoptions, require financial flexibility in the form of excess cash or debtcapacity. Closer inspection reveals that the negative coefficient on the market-to-book ratio is driven by the defensive share repurchases. If the market-to-book ratio partially captures the extent to which the managers perceive thefirm to be undervalued, our results suggest that managers choose to repurchaseshares when they believe that their firm’s shares are undervalued.
The coefficients on the first-order insider holdings variable are positive andstatistically significant in all models, whereas the coefficients on the second-order insider ownership term are all significantly negative. Thus the probabilitythat a firm announces a defensive payout increases with insider ownershiplevels, but it does so at a decreasing rate. Because the insider ownershipvariables do not affect the decision to pay a special dividend (not tabulated),the documented curvilinear relation between defensive payouts and insiderownership is driven by defensive repurchases. Our results provide strongsupport for Stulz’s (1988) model, which incidentally pertains only to sharerepurchases and not to dividends. Other studies also provide evidence con-sistent with Stulz’s model, including McConnell and Servaes (1990), whichdocuments a curvilinear relation between firm value and insider ownership;but such studies are plagued with endogeneity issues (Cho 1998) and provideless direct evidence than we do here.
The significantly negative coefficient on the fraction of outside directorssuggests that, all else equal, firms with greater proportions of outside directorsare less likely to announce defensive payouts.12 Finally, the negative coefficienton the premium offered variable in models b and c indicates that managersare more likely to announce a defensive share repurchase when the premiumsoffered in the takeover attempt are low. In this regard, model c is more relevantsince it excludes the one observation in the sample in which the defensiveshare repurchase preceded the announcement of the attempted takeover and,thus, the revelation of the premium offered to shareholders. Consequently,managers appear to consider the value of the takeover offer to their share-holders when deciding whether to employ defensive share repurchases.
D. Determinants of Takeover Success
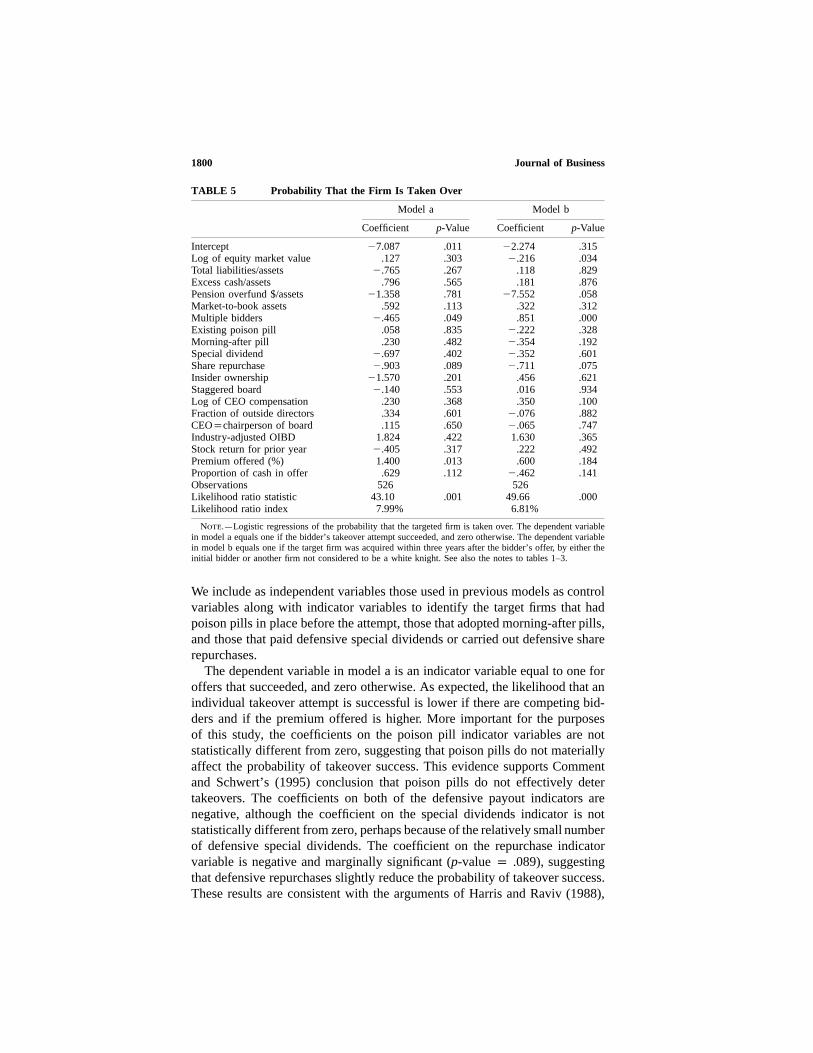
Table 5 reports the results from logistic regressions that examine the extentto which defensive maneuvers made by takeover targets affect the likelihoodof takeover success. Twenty-one percent (111 of 526) of the takeover attemptsin the sample were completed without the offer ever having been withdrawn.
12. Note that this result appears to contrast with the univariate evidence that the collective setof firms in the sample that adopted poison pills, defensive payouts, or both had higher proportionsof outside board representation. The multivariate analysis controls for characteristics that mightinfluence or otherwise correlate with the extent of outside board representation, e.g., firm size.In addition, we perform separate multivariate logistic regression analyses for both poison pilladoption and defensive payouts. As a result, we view the multivariate results as more informative.
1800 Journal of Business
TABLE 5 Probability That the Firm Is Taken Over
Model a Model b
Coefficient p-Value Coefficient p-Value
Intercept �7.087 .011 �2.274 .315Log of equity market value .127 .303 �.216 .034Total liabilities/assets �.765 .267 .118 .829Excess cash/assets .796 .565 .181 .876Pension overfund $/assets �1.358 .781 �7.552 .058Market-to-book assets .592 .113 .322 .312Multiple bidders �.465 .049 .851 .000Existing poison pill .058 .835 �.222 .328Morning-after pill .230 .482 �.354 .192Special dividend �.697 .402 �.352 .601Share repurchase �.903 .089 �.711 .075Insider ownership �1.570 .201 .456 .621Staggered board �.140 .553 .016 .934Log of CEO compensation .230 .368 .350 .100Fraction of outside directors .334 .601 �.076 .882CEOpchairperson of board .115 .650 �.065 .747Industry-adjusted OIBD 1.824 .422 1.630 .365Stock return for prior year �.405 .317 .222 .492Premium offered (%) 1.400 .013 .600 .184Proportion of cash in offer .629 .112 �.462 .141Observations 526 526Likelihood ratio statistic 43.10 .001 49.66 .000Likelihood ratio index 7.99% 6.81%
Note.—Logistic regressions of the probability that the targeted firm is taken over. The dependent variablein model a equals one if the bidder’s takeover attempt succeeded, and zero otherwise. The dependent variablein model b equals one if the target firm was acquired within three years after the bidder’s offer, by either theinitial bidder or another firm not considered to be a white knight. See also the notes to tables 1–3.
We include as independent variables those used in previous models as controlvariables along with indicator variables to identify the target firms that hadpoison pills in place before the attempt, those that adopted morning-after pills,and those that paid defensive special dividends or carried out defensive sharerepurchases.
The dependent variable in model a is an indicator variable equal to one foroffers that succeeded, and zero otherwise. As expected, the likelihood that anindividual takeover attempt is successful is lower if there are competing bid-ders and if the premium offered is higher. More important for the purposesof this study, the coefficients on the poison pill indicator variables are notstatistically different from zero, suggesting that poison pills do not materiallyaffect the probability of takeover success. This evidence supports Commentand Schwert’s (1995) conclusion that poison pills do not effectively detertakeovers. The coefficients on both of the defensive payout indicators arenegative, although the coefficient on the special dividends indicator is notstatistically different from zero, perhaps because of the relatively small numberof defensive special dividends. The coefficient on the repurchase indicatorvariable is negative and marginally significant (p-valuep .089), suggestingthat defensive repurchases slightly reduce the probability of takeover success.These results are consistent with the arguments of Harris and Raviv (1988),

Poison Pills and Defensive Payouts 1801
Stulz (1988), Bagnoli, Gordon, and Lipman (1989), Bagwell (1991), and Sinha(1991), who all argue that defensive repurchases can be used to deter takeovers.
Model b uses a longer-term measure of takeover likelihood as the dependentvariable. As we report in table 1, within the three-year period after the an-nounced takeover attempts, 51% of the targeted firms were acquired in trans-actions in which the eventual acquirer was not considered to be a white knight.The dependent variable in model c captures this information by taking on avalue of one for those firms that were acquired within the subsequent threeyears, and zero otherwise. The coefficient on the multiple bidders indicatoris positive and highly significant (p-value ! .01), indicating that targets aremore likely to be acquired within three years if multiple bidders are involved.The only defensive measure that affects the probability of takeover is a de-fensive share repurchase. The marginally significant negative coefficient onthe defensive share repurchase indicator variable (p-valuep .075) suggeststhat firms that undertake defensive repurchases are slightly less likely to beacquired.13
E. Determinants of Bid Increases and Total Premiums
If a defensive mechanism is in shareholder interests, it will assist managementin thwarting undervalued takeover offers, negotiating for higher premiums,or both. We focus on the latter in this subsection. In our sample, biddersincrease their offer price in 44% of the cases. In those instances in whichbids are increased, the mean increase relative to the price of the target 20days before the announcement of the first offer is 22.2% and the medianincrease is 18.7%.
Table 6 presents two regression models that relate to shareholder premiums.In model a, the dependent variable is the percentage increase in the bidder’sinitial offer price. Thus the estimated regression captures the extent to whichthe defensive measures allow managers to negotiate for higher premiums oncean initial bid has been made. As expected, average bid increases are signif-icantly larger (4.2%) when there are multiple bidders (p-value ! .01). Thesignificantly positive coefficients on the existing poison pill and morning-after pill indicator variables show that firms with poison pills, whether adoptedin advance of or in response to takeover attempts, are able to negotiate forlarger premium increases than firms that lack such a defense. The magnitudesof the coefficients are very similar for existing and morning-after pills andsuggest that, ceteris paribus, poison pills produce premium increases of 3.5%.The only other coefficient in the model that is statistically significant is that
13. Unlike Bebchuk et al. (2002), we find no evidence that staggered boards reduce the like-lihood of takeover completion. In untabulated regressions, we also included an indicator variableequal to one if the firm had both a poison pill and a staggered board to more directly test Bebchuket al.’s argument that the combination of poison pills and staggered boards is particularly effectivein deterring unsolicited takeovers. The coefficient on this variable was not statistically significantwhen added to either model a or model b. In fact, it was positive in model a with ap-value of.60 and negative in model b with ap-value of .93.

1802 Journal of Business
TABLE 6 Regressions of Premium Increases and Total Premiums
Model a Model b
Coefficient p-Value Coefficient p-Value
Intercept �.126 .335 �.158 .570Log of equity market value .009 .138 �.005 .686Total liabilities/assets .044 .161 .129 .054Excess cash/assets �.008 .900 �.019 .892Pension overfund $/assets �.382 .091 �.032 .946Market-to-book assets �.009 .623 �.020 .599Multiple bidders .042 .000 .083 .000Existing poison pill .035 .008 .064 .022Morning-after pill .035 .025 .071 .032Special dividend �.013 .726 .015 .854Share repurchase .015 .501 �.042 .361Insider ownership .050 .341 .283 .011Staggered board .001 .957 �.014 .561Log of CEO compensation .001 .912 .042 .103Fraction of outside directors .034 .248 .066 .291CEOpchairperson of board .011 .335 .043 .083Industry-adjusted OIBD �.005 .962 .031 .889Stock return for prior year �.039 .036 �.249 .000Premium offered (%) .030 .239Proportion of cash in offer .001 .955 �.028 .459Observations 526 526F-statistic for regression 2.93 .000 4.78 .000AdjustedR2 6.52% 11.46%
Note.—The dependent variable in model a is the percentage increase in the bidder’s offer price scaled bythe target’s price 20 days prior to the offer. The dependent variable in model b is the total percentage premium(initial premium plus any premium increase) offered by the bidder (relative to the target’s price 20 days priorto the offer). Also see the notes to tables 1–3.
on the stock return for the prior-year variable. All else equal, targets thatexperienced poorer stock returns in the prior year are able to negotiate forlarger premium increases, perhaps by more credibly arguing that their stockprice is only temporarily depressed. The coefficients on both defensive payoutmeasures are statistically indistinguishable from zero, suggesting that defen-sive payouts do not, on average, lead to bid increases. The collective evidenceon defensive share repurchases suggests that they are more effectively usedto thwart takeover overtures than to negotiate for better takeover terms.
The dependent variable in model b is the total premium offered in thetakeover attempt (initial premium plus any subsequent increases) scaled bythe target’s share price 20 days prior to the announcement of the takeoverattempt. The results for this model are qualitatively similar to those for modela. The only exception is that the coefficient on insider ownership is signifi-cantly positive in model b, perhaps because managers of acquiring firms realizethat they have to bid more when insiders of the target own a large fraction.The coefficient on the multiple bidders variable indicates that total premiumsare 8.3% larger when there are multiple bidders (p-value ! .01). The coef-ficients on the existing poison pill and morning-after poison pill variablessuggest that total premiums are 6.4% larger for firms that had existing poisonpills and 7.1% larger for firms that adopted morning-after pills (p-values!

Poison Pills and Defensive Payouts 1803
.05). Thus, regardless of whether poison pills are already in place or areadopted after an offer has been made, they enable targets to extract largerpremiums for shareholders. Our results suggest that poison pills are, on av-erage, in the best interests of shareholders, since they prove effective as atool for negotiating for more highly valued offers without entrenching in-cumbent management; the value of defensive payouts is more questionable.We provide more evidence on the net wealth effect of poison pills and de-fensive payouts in the next subsection.
F. Determinants of Shareholder Gains
The multivariate evidence presented thus far suggests that shareholders oftarget firms benefit from poison pills because they induce greater premiums,but they might be hurt by defensive payouts because they reduce takeoverlikelihood. However, because defensive payouts entail financial restructuringsthat could resolve many of the problems that made the firm an attractivetakeover target in the first place (e.g., underutilized debt capacity and over-investment), it is possible that shareholders of these firms experience shareprice gains comparable to those of shareholders of other takeover targets, eventhough our prior regressions show that they are less likely to receive a takeoverpremium. Indeed, Denis (1990), Berger, Ofek, and Yermack (1997), Denis,Denis, and Sarin (1997), and Berger and Ofek (1999) find that control contestsprompt firms to undergo significant corporate restructurings, and Safieddineand Titman (1999) find that many target firms substantially increase leveragefollowing unsuccessful takeover offers and thereby commit to making theimprovements that might have been made by the acquirer. This restructuringappears to have a positive effect on stock price performance, since Safieddineand Titman find that firms that undergo significant leverage increases tend toperform better than their benchmarks in the five years subsequent to the failedtakeovers. It is also possible that defensive payouts primarily thwart under-valued offers that would not generate much value for target shareholdersanyway, consistent with the negative relation between the probability of adefensive payout and the premium offered.
We design our final empirical tests to gauge whether the poison pills anddefensive payouts materially alter overall shareholder gains. First, we estimateshareholder gains using a one-factor market model (estimation period spansfrom �270 to �21 trading days prior to the takeover announcement) andcalculate cumulative abnormal stock returns starting from 20 days before theannouncement date through the effective date for successful takeover attemptsand five days after the withdrawal date for unsuccessful attempts. The mean(median) shareholder gain is 25% (20%) for unsuccessful takeovers and 46%(47%) for successful takeovers. Thus, although the gains to shareholders oftargeted firms are clearly larger for successful offers, they are still materialeven if the takeover is unsuccessful, perhaps because the firms are still in

1804 Journal of Business
TABLE 7 Regressions of Gains to Targeted Shareholders
Model a Model b
Coefficient p-Value Coefficient p-Value
Intercept �.109 .695 1.018 .177Log of equity market value .011 .352 .015 .662Total liabilities/assets �.037 .579 �.125 .491Excess cash/assets �.208 .140 �.548 .153Pension overfund $/assets �.536 .262 �1.718 .186Market-to-book assets �.024 .532 �.092 .384Multiple bidders .151 .000 .151 .016Existing poison pill .054 .050 .040 .597Morning-after pill .037 .266 �.012 .894Special dividend .109 .174 .468 .032Share repurchase .012 .785 .011 .931Insider ownership .074 .509 .369 .224Staggered board .033 .156 �.021 .744Log of CEO compensation .001 .974 �.105 .138Fraction of outside directors .084 .178 .160 .343CEOpchairperson of board .010 .681 .074 .271Industry-adjusted OIBD .540 .014 .672 .261Stock return for prior year �.370 .000 �.121 .258Premium offered (%) .405 .000 .542 .000Proportion of cash in offer �.016 .681 .027 .795Observations 526 526F-statistic for regression 14.56 .000 2.38 .001AdjustedR2 32.92% 4.76%
Note.—Regressions of gains to the target firms’ shareholders. The dependent variable in model a is thecumulative abnormal return to the target’s shareholders as estimated using a one-factor market model from20 days before the first announcement through either the effective date for successful takeover attempts, orthrough five days after the withdrawal date for unsuccessful attempts. The dependent variable in model b isthe difference between the target firm’s cumulative stock return and the cumulative return on an industry indexcomprising five firms with the closest market capitalization to the target firm. This excess return measurecovers the interval from 20 days before the announcement of the takeover attempt either through three yearsfor firms that are not subsequently taken over or otherwise delisted, or through the delist date for firms thatare delisted for any reason within the following three years. Also see the notes to tables 1–3.
play or because the takeover process has resulted in value-enhancingrestructuring.
Second, we estimate a longer-term measure of shareholder gain. In partic-ular, we estimate the difference between the target firms’ cumulative stockreturn and the cumulative return on an industry index comprising five firmswith the market capitalization closest to that of the target firm. This measurecovers the interval from 20 days before the announcement of the takeoverattempt through three years for firms that are not subsequently taken over ordelisted, or through the delisting date for firms that are delisted for any reasonwithin the following three years.
Table 7 contains the results of our multivariate tests of whether shareholdergains are larger when managers employ takeover defenses using either thereturn through the outcome of the takeover attempt (model a) or the longer-term return (model b). The independent variables are those used in our priortables. Because of the additional noise inherent with long-term return bench-marks such as that used in model b, we focus our interpretation primarily on

Poison Pills and Defensive Payouts 1805
the results in model a and highlight where the results from the two modelsdiffer. As expected, shareholder gains are significantly positively related toinitial premiums and negatively related to the stock price performance in theprior year. In addition, gains are about 15% higher when there are competingbidders. The coefficient on the existing poison pill indicator in model a showsthat the gains are, on average, 5.4% higher (p-value p .05) when the firmhas a poison pill in place prior to the announcement of the takeover attempt.The coefficient on the morning-after pill indicator variable is also positive at3.7% but is not statistically significant at conventional levels (p-valuep .27).We also estimated another regression (not tabulated) in which we combinedthe poison pill indicators to capture all firms that had a poison pill, regardlessof whether they were adopted before or shortly after the takeover announce-ment, and found the coefficient on the poison pill variable to be 4.8% (p-value p .05). Overall, we conclude that shareholder gains are significantlylarger for firms that had established a poison pill plan at some point prior tothe resolution of the takeover contests. Not unexpectedly given the extra noiseassociated with the longer interval over which returns are measured, the co-efficients on the poison pill indicators are not significant in model b.
The coefficients on the special dividend and share repurchase variables donot statistically differ from zero in model a, although the coefficient on thespecial dividend variable is significantly positive in model b. In light of theseresults and earlier results suggesting that special dividends have little effecton the takeover success, we are led to conclude that defensive special dividendsdo not harm shareholder wealth. Although the defensive share repurchasesappear to slightly reduce the takeover probability, the multivariate regressionson shareholder gains presented here show that they do not hurt shareholderreturns.
VI. Conclusion
Using a sample of 526 hostile takeover attempts, we investigate the relationbetween management’s choice of defensive strategies, the target firm’s finan-cial characteristics, ownership characteristics, governance characteristics, andthe takeover process. Relative to the other sample firms, takeover targets withpoison pills in place prior to the takeover attempts have lower excess cashbalances and lower levels of insider holdings, both of which are associatedwith an otherwise weak managerial bargaining position. We find that firmsthat adopt morning-after pills in direct response to unsolicited takeover offershave lower insider holdings and higher market-to-book ratios than other firmswithout pills at the time of the takeover announcement. The result for insiderholdings combined with other results on the effect of poison pills suggest thatfirms with low insider holdings adopt poison pills because their bargainingpower would otherwise be too weak. Further, firms are more likely to adoptpoison pills if they have staggered boards, suggesting that these defensivemechanisms are complementary. On the other hand, firms that undertake

1806 Journal of Business
defensive share repurchases tend to have considerable financial flexibility inthe form of high cash levels, overfunded pension plans, and low debt levels,which facilitates the financing of such a transaction, and low market-to-bookratios, which makes repurchases seem relatively more attractive. Perhaps mostinteresting, the probability of undertaking a defensive repurchase increaseswith insider ownership at a decreasing rate. This curvilinear relation betweeninsider ownership and repurchase probability represents direct evidence insupport of Stulz’s (1988) model.
Further evidence suggests that poison pills tend to be used in manners thatare in the best interests of shareholders, regardless of whether they were inplace in advance of or adopted in response to the takeover attempts. In par-ticular, poison pills enhance the bargaining power of the target firm, therebyraising the takeover premium, but do not reduce the likelihood of takeoversuccess. As a result, pills positively affect shareholder returns during thetakeover process. At a minimum, our evidence with regard to poison pillssuggests that the efforts made by shareholder activists to force firms to repealtheir poison pills plans (see Bizjak and Marquette 1998; Sidel 2004) aremisguided. In addition, at least with regard to poison pills, the evidence raisesconcerns about the increasing trend for both practitioners (such as InstitutionalShareholder Services with its corporate governance quotient) and academicresearchers (such as Gompers, Ishii, and Metrick [2003] and their corporategovernance index) to create corporate governance metrics that effectivelypenalize firms for having poison pill plans in place.
Defensive payouts are quite different with regard to the characteristics offirms that implement them and in how they affect the outcomes of corporatecontrol contests. Our evidence suggests that defensive repurchases slightlyreduce the likelihood of takeover success but do not induce higher takeoverpremiums. Yet the shareholder returns are not adversely affected by the useof defensive payouts. There are two possible reasons for this. Defensive pay-outs tend to be used in response to low-premium bids that would generateless value for target shareholders anyway. In addition, they leave the firmmore highly leveraged, such that the target firm might emerge from the take-over process with a higher value even if the takeover attempt fails.
References
Bagnoli, Mark, Roger Gordon, and Barton L. Lipman. 1989. Stock repurchase as a takeoverdefense.Review of Financial Studies 2:423–43.
Bagwell, Laurie S. 1991. Share repurchase and takeover deterrence.Rand Journal of Economics22:72–88.
Bebchuk, Lucian, John C. Coates, and Guhan Subramanian. 2002. The powerful antitakeoverforce of staggered boards.Stanford Law Review 54:887–951.
Berger, Philip, and Eli Ofek. 1999. Causes and effects of corporate refocusing programs.Reviewof Financial Studies 12:311–45.
Berger, Philip, Eli Ofek, and David Yermack. 1997. Managerial entrenchment and capital structuredecisions.Journal of Finance 52:1411–38.
Bizjak, John M., and Christopher J. Marquette. 1998. Are shareholder proposals all bark and no

Poison Pills and Defensive Payouts 1807
bite? Evidence from shareholder resolutions to rescind poison pills.Journal of Financial andQuantitative Analysis 33:499–521.
Cho, Myeong-Hyeon. 1998. Ownership structure, investments, and the corporate value: An em-pirical analysis.Journal of Financial Economics 47:103–21.
Clark Boardman Co. 1988–98.Corporate antitakeover defenses: The poison pill device. 11 vols.New York: Clark Boardman
Coates, John C. 2000. Takeover defenses in the shadow of the pill: A critique of the scientificevidence.Texas Law Review 79:271–382.
Comment, Robert, and G. William Schwert. 1995. Poison or placebo? Evidence on the deterrenceand wealth effects of modern antitakeover measures.Journal of Financial Economics 39:3–43.
Cotter, James F., and Marc Zenner. 1994. How managerial wealth affects the tender offer process.Journal of Financial Economics 35:63–97.
Danielson, Morris G., and Jonathan M. Karpoff. 2006. Do pills poison operating performance?Journal of Corporate Finance 12:536–39.
Dann, Larry Y., and Harry DeAngelo. 1988. Corporate financial policy and corporate control:A study of defensive adjustments in asset and ownership structure.Journal of FinancialEconomics 20:87–127.
DeAngelo, Harry, and Edward M. Rice. 1983. Antitakeover charter amendments and stockholderwealth.Journal of Financial Economics 11:329–60.
Denis, David J. 1990. Defensive changes in corporate payout policy: Share repurchases andspecial dividends.Journal of Finance 45:1433–56.
Denis, David J., Diane K. Denis, and Atulya Sarin. 1997. Agency problems, equity ownership,and corporate diversification.Journal of Finance 52:135–60.
Field, Laura C., and Jonathan M. Karpoff. 2002. Takeover defenses of IPO firms.Journal ofFinance 57:1857–89.
Gompers, Paul A., Joy L. Ishii, and Andrew Metrick. 2003. Corporate governance and equityprices.Quarterly Journal of Economics 118:107–55.
Harford, Jarrad. 1999. Corporate cash reserves and acquisitions.Journal of Finance 54:1969–97.Harris, Milton, and Artur Raviv. 1988. Corporate control contests and capital structure.Journal
of Financial Economics 20:55–86.Linn, Scott C., and John J. McConnell. 1983. An empirical investigation of the impact of
“antitakeover” amendments on common stock prices.Journal of Financial Economics 11:361–99.
Malatesta, Paul H., and Ralph A. Walkling. 1988. The impact of “poison pill” securities onstockholder wealth.Journal of Financial Economics 20:347–70.
McConnell, John J., and Henri Servaes. 1990. Additional evidence on equity ownership andcorporate value.Journal of Financial Economics 27:595–612.
Mikkelson, Wayne. H., and Megan M. Partch. 1989. Managers’ voting rights and corporatecontrol. Journal of Financial Economics 25:263–90.
Mitchell, Mark L., and J. Harold Mulherin. 1989. The stock price response to pension terminationsand the relation of terminations with corporate takeovers.Financial Management 18:41–56.
Petersen, Mitchell A. 1992. Pension reversions and worker-stockholder wealth transfers.QuarterlyJournal of Economics 107:1035–56.
Pinkowitz, Lee. 1999. The market for corporate control and corporate cash holdings. Unpublishedmanuscript, Georgetown University.
Ryngaert, Michael D. 1988. The effect of poison pill securities on shareholder wealth.Journalof Financial Economics 20:377–417.
Safieddine, Assem, and Sheridan Titman. 1999. Leverage and corporate performance: Evidencefrom unsuccessful takeovers.Journal of Finance 54:547–80.
Schwert, G. William. 2000. Hostility in takeovers: In the eyes of the beholder?Journal of Finance55:2599–2640.
Sidel, Robin. 2004. Where are all the poison pills?Wall Street Journal (western ed.) (March 2).Sinha, Sidharth. 1991. Share repurchase as a takeover defense.Journal of Financial and Quan-
titative Analysis 26:233–44.Stulz, Rene M. 1988. Managerial control of voting rights: Financing policies and the market for
corporate control.Journal of Financial Economics 20:25–54.