Embed Size (px)
Citation preview

Blue Energy and Desalination with Nanoporous Carbon Electrodes:Capacitance from Molecular Simulations to Continuous Models
Michele Simoncelli,1,† Nidhal Ganfoud,2 Assane Sene,3,4 Matthieu Haefele,1 Barbara Daffos,3,4
Pierre-Louis Taberna,3,4 Mathieu Salanne,1,2,4 Patrice Simon,3,4 and Benjamin Rotenberg2,4,*1Maison de la Simulation, USR 3441, CEA, CNRS, INRIA, Universite Paris-Sud,
Universite de Versailles, F-91191 Gif-sur-Yvette, France2Sorbonne Universite, CNRS, Physico-Chimie des Électrolytes et Nanosystemes Interfaciaux,
PHENIX, F-75005 Paris, France3CIRIMAT, Universite de Toulouse, CNRS, INPT, UPS, 118 route de Narbonne,
31062 Toulouse Cedex 9, France4Reseau sur le Stockage Electrochimique de l’Energie (RS2E), FR CNRS 3459,
80039 Amiens Cedex, France
(Received 8 September 2017; revised manuscript received 13 January 2018; published 26 April 2018)
Capacitive mixing (CapMix) and capacitive deionization (CDI) are currently developed as alternatives tomembrane-based processes to harvest blue energy—from salinity gradients between river and sea water—and to desalinate water—using charge-discharge cycles of capacitors. Nanoporous electrodes increase thecontact area with the electrolyte and hence, in principle, also the performance of the process. However,models to design and optimize devices should be used with caution when the size of the pores becomescomparable to that of ions and water molecules. Here, we address this issue by simulating realisticcapacitors based on aqueous electrolytes and nanoporous carbide-derived carbon (CDC) electrodes,accounting for both their complex structure and their polarization by the electrolyte under applied voltage.We compute the capacitance for two salt concentrations and validate our simulations by comparison withcyclic voltammetry experiments. We discuss the predictions of Debye-Hückel and Poisson-Boltzmanntheories, as well as modified Donnan models, and we show that the latter can be parametrized using themolecular simulation results at high concentration. This then allows us to extrapolate the capacitance andsalt adsorption capacity at lower concentrations, which cannot be simulated, finding a reasonableagreement with the experimental capacitance. We analyze the solvation of ions and their confinementwithin the electrodes—microscopic properties that are much more difficult to obtain experimentally thanthe electrochemical response but very important to understand the mechanisms at play. We finally discussthe implications of our findings for CapMix and CDI, both from the modeling point of view and from theuse of CDCs in these contexts.
DOI: 10.1103/PhysRevX.8.021024 Subject Areas: Computational Physics,Energy Research,Physical Chemistry
I. INTRODUCTION
Electric power production from salinity gradients—byharvesting the free energy lost during the mixing of riverwith sea water in estuaries—in principle, has the potential
of becoming a significant source of electricity on the global
scale [1–5]. The main technologies developed for thatpurpose to date, namely, pressure-retarded osmosis andreverse electrodialysis, exploit the osmotic pressure differ-ence using hydrostatic pressure or electric potentialdifferences applied across membranes [6]. Despite thepromises of these approaches—in particular, thanks tothe control of flow through single nanotubes for the designof improved membranes [7]—a completely different strat-egy is also under consideration, to avoid the efficiency lossinduced by membrane fouling. In 2009, Brogioli demon-strated the feasibility of capacitive mixing (CapMix) fromcycling charge-discharge of a capacitor at high-low salinity[8]. Since then, both the fundamental understanding andpractical improvement of this idea have been remark-able [9–11]. In the reverse process, capacitive deionization
*[email protected]†Present address: École Polytechnique Federale de Lausanne,
Station 9, 1015 Lausanne, Switzerland.
Published by the American Physical Society under the terms ofthe Creative Commons Attribution 4.0 International license.Further distribution of this work must maintain attribution tothe author(s) and the published article’s title, journal citation,and DOI.
PHYSICAL REVIEW X 8, 021024 (2018)
2160-3308=18=8(2)=021024(13) 021024-1 Published by the American Physical Society
(CDI) offers an alternative to membrane-based desalinationtechniques [12,13].For both CapMix and CDI, the use of porous carbon
electrodes allows for the increase of surface area with theelectrolyte, thereby increasing the specific capacitance. Asin the context of energy storage in supercapacitors, alsoknown as electric double layer capacitors (EDLC), this hasnaturally turned the attention of the community to nano-porous carbons. In particular, an unexpected increase in thecapacitance of EDLCs using ionic liquids and organicelectrolytes with carbide-derived carbon (CDC) electrodeswas observed as the pore size decreased down to the size ofelectrolyte ions [14–17]. Such materials have already beenconsidered for CDI [18,19], as “the pore volume associatedwith micropores is particularly attractive for CDI” [12].A fundamental understanding of the cation and anion
adsorption inside the electrodes is essential to predict thecapacitance and salt retention and its dependence on saltconcentration in the electrolyte, which are the key factorsgoverning the efficiency of both CapMix and CDI proc-esses. While in situ x-ray and neutron experiments nowprovide information at various scales on the localization ofions inside the electrodes [20,21], quantitative predictionsof the ionic concentrations, or equivalently the capacitanceand salt adsorption, essentially rely on models of theelectric double layer (EDL). The most commonly usedmodels in these contexts are Debye-Hückel (DH) andPoisson-Boltzmann (PB)—possibly including excludedvolume effects—theories [22–29], as well as modifiedDonnan (mD) models [30]. Recently, a better descriptionof steric effects and electrostatic correlations has also beenintroduced in this context using classical density functionaltheory (DFT) [31–33].However, these continuum-based models may fail under
extreme confinement down to the nanometer scale, wherethe discreteness of ions and water and interactions with thecarbon surface on the molecular scale play an importantrole. Previous work on CDC electrodes with ionic liquidsand organic electrolytes for EDLC applications has dem-onstrated that molecular simulation is a powerful toolto investigate charge storage and transport in this limit[34–36] and that it can be used as a starting point for amultiscale description of these systems [37]. Such simu-lations have also emphasized the role of ion solvation at theinterface and under confinement [38–41].Aqueous electrolytes and model carbon-based materials
have already been investigated by molecular simulation inthe context of desalination by reverse osmosis [42–44] orfor nanofluidic osmotic diodes [45]. Molecular simula-tion provided insights into the structure and dynamics ofwater and aqueous electrolytes in carbon nanotubes andnanopores [46–48]. Striolo and co-workers also simulatedsuch electrolytes confined between charged carbon walls asmodel electrochemical cells for desalination [49,50] andreviewed the modeling challenges and opportunities of
carbon-water interfaces for the water-energy nexus [51].Michaelides also emphasized the challenges associatedwith the description of the interactions between waterand carbon surfaces [52], as well as the peculiar propertiesof water on graphene [53] and metals in general [54].However, our previous work demonstrated the importanceof accounting for the polarization of carbon electrodes incontact with ionic liquids by using a method in which thepotential between the electrode is held fixed (i.e., constantpotential molecular dynamics, MD) [55]. In the case ofaqueous systems, this approach has been applied to purewater or ion pairs in order to understand the water-platinuminterface [56–59].We report here a constant-potential molecular dynamics
study of realistic electrochemical cells based on an aqueouselectrolyte and nanoporous carbon electrodes. In additionto polarization, under applied voltage, by the electrolyte,the complex structure of the CDC (pore-size distribution,relatively disordered structure) is also taken into account.We compute the capacitance for two salt concentrations andvalidate our simulations by comparison with cyclic vol-tammetry experiments. We then discuss the predictions ofDebye-Hückel and Poisson-Boltzmann theories, as well asmodified Donnan models, which are commonly used topredict the capacitance and salt adsorption for blue energyharvesting by capacitive mixing and for desalination bycapacitive deionization. We show that it is possible to usethe molecular simulation results to parametrize a modifiedDonnan model, which we then use to extrapolate thecapacitance and salt adsorption capacity at lower concen-trations relevant for CapMix and CDI, for which molecularsimulations are not possible. A reasonable agreement isobtained with the experimental capacitance. We analyze thesolvation of ions and their confinement within the electro-des—microscopic properties that are much more difficult toobtain experimentally than the electrochemical responsebut are very important to understand the mechanisms atplay. We finally discuss the implications of our findings forCapMix and CDI. Methods are described in Sec. II, whileresults are presented and discussed in Sec. III.
II. METHODS
A. Molecular dynamics simulations
The simulated system consists of two nanoporous carbonelectrodes and an aqueous NaCl solution as an electrolyte(see Fig. 1). The carbon structure for the porous electrodeswas obtained by quenched molecular dynamics [60], and itcorresponds to the structure of a CDC synthesized at800 °C. The geometrical analysis of the porous structure,which has a mass density ρsolid ¼ 0.939 g cm−3, is per-formed with the ZEO++ software [61] using a probe radiusrprobe ¼ 1.3 Å, which corresponds approximately to theradius of a water molecule, resulting in a porosity of
MICHELE SIMONCELLI et al. PHYS. REV. X 8, 021024 (2018)
021024-2

Φ ¼ 23.3% and a specific surface area of S ¼ 1934�2 m2 g−1 (for a probe size of 1.7 Å corresponding to anargon probe, the values are 18% and 1553� 2 m2 g−1,respectively). Two systems are simulated, correspondingapproximately to average salt concentrations of 0.5 and1.0 M, respectively.The force field consists of pairwise additive Coulomb
and Lennard-Jones interactions, with Lorentz-Berthelotmixing rules for the Lennard-Jones parameters. We usethe SPC/E model of water [62], whereas the parameters forcarbon and for the ions are taken from Refs. [63,64]. MDsimulations are performed in the NVT ensemble using atime step of 1 fs. The temperature of the fluid is maintainedat T ¼ 298 K using the Nose-Hoover thermostat with atime constant of 1 ps, while the electrode atoms are keptfixed. Two-dimensional periodic boundary conditions areused (there is no periodicity in the direction z perpendicularto the electrodes), and Ewald summation to computeelectrostatic interactions is adapted to this geometry
[65,66]. The water molecules are kept rigid with theSHAKE algorithm [67,68].A voltage of Δψ ¼ 1 V is maintained between the
electrodes by treating them as perfect conductors usingthe method of Refs. [65,69], in which the charge of eachelectrode atom is recomputed at each step of the simulationin order to satisfy the constraint of a fixed potential. As aresult, the total charge of the electrode fluctuates inresponse to the instantaneous microscopic configurationof the electrolyte (see Fig. 1, where the central panelsillustrate the heterogeneous charge distribution within theelectrodes for a given configuration of the electrolyte, asshown in the bottom panels). This is necessary for arealistic description of the electrode-electrolyte interface[55], and it provides quantitative information on thecapacitance and on the interfacial properties [70]. We haveshown previously that this method is suitable for thesimulation of ionic liquids and organic electrolytes innanoporous carbon electrodes [34–36,38].Each electrode contains 3821 carbon atoms, and repulsive
walls are placed on each side of the nonperiodic dimension ofthe simulation cell in order to prevent the molecules fromexiting. The system corresponding to an average concen-tration of0.5 M(resp. 1 M)contains 7700 (resp. 7615)watermolecules and 70 (resp. 139) NaCl pairs. The box dimen-sions are 43.3 × 43.3 × 183.0 Å3. Together with the abovenumber of atoms, this results in the correct density in the bulkregion (see the definition of the regions in Fig. 1 and thedensity in Sec. III). Despite being the state of the art ofmolecular simulations of such systems, the relatively smallsize does not allow the simulation of dilute electrolytesbecause of the small number of ions involved, which wouldrequire simulations that are too computationally expensive tosample the equilibrium properties. The systems are firstpreequilibrated by fixing the electrode atom charges to zerofor about 600 ps. Then, a voltageΔψ ¼ 1.0 V is applied, andthe system is allowed to evolve until a steady state is reached(several nanoseconds). Finally, the charge of the electrodeand the positions of the species at a steady state are averagedover about 3.2 ns to compute the capacitance, the densityprofiles, and the solvation and confinement properties.
B. Electrochemistry experiments
CDC powder (Carbon-Ukrain) is prepared by chlorina-tion of TiC powder at 800 °C as reported elsewhere [14,15].The material is annealed for 2 h at 600 °C under H2 toremove traces of chlorine and other surface groups [71].Electrochemical tests are performed using a two-electrodeSwagelok cell. Active films are made by mixing 95 wt %CDC with 5 wt % polytetrafluoroethylene (PTFE fromDupont TM) binder. Once calendered, 11-mm-diameterelectrodes are cut. The active film thickness is around300 μm, with a weight loading of 15 mg cm−2. Platinumdisks are used as current collectors, and two layers of25-μm-thick porous cellulose (from Nippon Kodoschi
FIG. 1. The simulated system (top panel) consists of two nano-porous carbon electrodes, with a structure corresponding tocarbide-derived carbons synthesized at 800 °C (cyan lines) andan aqueous NaCl solution as an electrolyte (here at 1 M; sodium isshown in blue, chloride in orange, oxygen in red, and hydrogen inwhite). A potential difference of 1 V is applied between theelectrodes, and the charge q of each electrode atom fluctuates inresponse to the instantaneous configuration of the electrolyte (seethe color scale in the central panels, wherewater is not shown). Thebottom parts illustrate the electrolyte confined in the electrodes.
BLUE ENERGY AND DESALINATION WITH NANOPOROUS … PHYS. REV. X 8, 021024 (2018)
021024-3

Corporation, NKK) are used as a separator. Cyclic voltam-metry experiments are carried out with a multichannelpotentiostat (VMP3, Biologic) for several NaCl concen-trations (0.05, 0.1, 0.5 and 1 M) at a scan rate of 1 mVs−1.Two series of measurements per system for two ranges,between 0.0 and 0.6 V and between 0.0 and 0.7 V, areperformed, leading to four estimates of the capacitance foreach of them. The values and uncertainties reported here arethe corresponding averages and standard deviations. Suchvoltages are sufficiently low to avoid faradic (redox)processes linked with water decomposition on the high-surface-area carbon electrodes.
III. RESULTS AND DISCUSSION
A. Capacitance
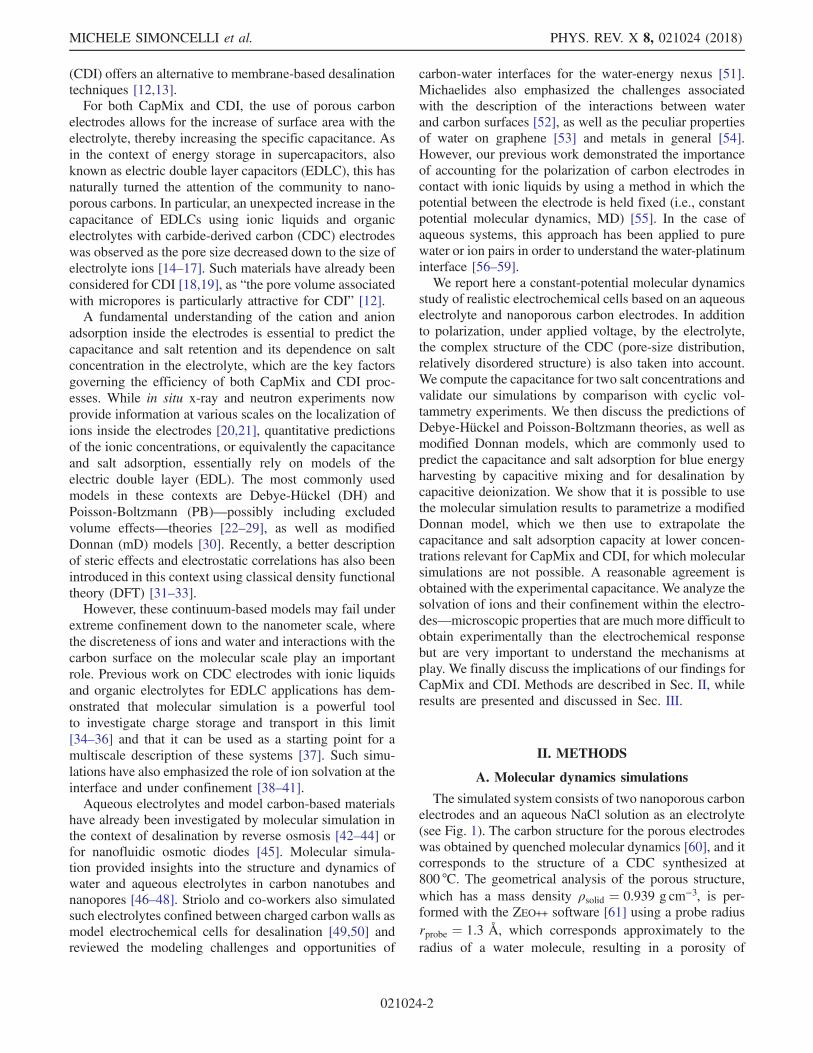
Figure 2 shows the cyclic voltammograms (CV) fordifferent salt concentrations for potentials varying between0.0 and 0.6 V. The electrochemical response is indeedcapacitive in the considered range of concentrations andvoltages. The experimental capacitance is then calculatedfrom the derivative with respect to the potential of theelectrode charge, which is obtained by integrating theelectric current during the discharge of the electrochemicalcell. In molecular simulations, we compute the integral cellcapacitance from the average charge hQi of the electrodesas Ccell ¼ hQi=Δψ , which is related to the capacitanceof both electrodes as ð1=CcellÞ ¼ ð1=CþÞ þ ð1=C−Þ. Thecorresponding electrode capacitance is then obtained byassuming that the electrodes behave symmetrically(Cþ ¼ C−). Experiments performed using a three-electrodecell confirm that this is a reasonable assumption, with C−being only slightly larger than Cþ (less than 10%).The capacitances frommolecular simulations and experi-
ments are summarized in Table I. We first note that the
results are in remarkable agreement for both salt concen-trations. Such a quantitative agreement is in fact better thanthat previously obtained in similar simulations of CDCwithionic liquids and organic electrolytes (e.g., about 20% inRef. [72]). In the latter cases, discrepancies are mainly dueto the Ohmic drop in the experiments with no or littlesolvent. We now compare these results with the predictionsof three theories that are commonly used in the contexts ofCapMix and CDI, namely, DH and PB theories, and themD model.The simplest description of the EDL capacitance follows
from DH theory, which treats the electrolyte as point ions ina continuous medium of relative permittivity ϵr, whichinteract only via mean-field electrostatics (as in Poisson-Boltzmann theory) in the limit where these interactions areweak, i.e., ½ðeψÞ=ðkBTÞ� ≪ 1, with e the elementarycharge, ψ the potential (with respect to the bulk value),kB Boltzmann’s constant, and T the temperature. Thecorresponding capacitance per unit area is
CDH ¼ ϵ0ϵrλD
; ð1Þ
with ϵ0 the vacuum permittivity and λD the Debye screen-ing length in the bulk electrolyte:
λD ¼ffiffiffiffiffiffiffiffiffiffiffiffiffiffiffiffiffiffiffiffiffiϵ0ϵrkBTe2P
iciz2i;
sð2Þ
where the sum runs over concentrations of ions, ci, withvalencies zi (in the present case of a 1-1 electrolyte with saltconcentration csalt, this sum is simply 2csalt).In order to improve the predictions, it is not sufficient to
simply numerically solve the nonlinear PB equation with-out introducing other physical effects. Indeed, in that case,the predicted capacitance would be even larger than withinDH. This is because the nonlinearity of the PB equationincreases the potential drop across the EDL and resultsin concentrations so large that interactions betweenions beyond mean-field electrostatics—in particular, theeffect of excluded volume due to the finite size of the ions
0.0 0.2 0.4 0.6Voltage (V)
80
60
40
20
0
20
40
60
80
Inte
nsity
(mA
.g1 )
0.05 M0.10 M0.50 M1.00 M
FIG. 2. Cyclic voltammograms of electrochemical cells basedon CDC and aqueous solutions of sodium chloride at concen-trations ranging from 0.05 to 1.0 M as electrolytes. The potentialscan rate is 1 mV s−1.
TABLE I. Electrode capacitance (in F g−1) from molecularsimulations and experiments. Note that the simulations cannotbe performed for the lower concentrations.
Capacitance (F g−1)
Salt concentration Simulation Experiments
0.05 M � � � 80� 30.1 M � � � 96� 40.5 M 108� 3 113� 21.0 M 117� 2 121� 3
MICHELE SIMONCELLI et al. PHYS. REV. X 8, 021024 (2018)
021024-4

—cannot be neglected. Therefore, we only discuss theextension of PB, which captures packing effects (if notelectrostatic correlations) [73,74]. Following Freise’sapproach for electrolytes [75], which was also successfullyapplied by Kornyshev in the context of ionic liquids [76],we introduce a maximum salt concentration cmax, whichcaptures the saturation of the EDL due to the finite volumeof the ions. The differential capacitance per unit area is thengiven by
CPB ¼ CDH
cosh eφ2kBT
1þ 2γsinh2 eφ2kBT
ffiffiffiffiffiffiffiffiffiffiffiffiffiffiffiffiffiffiffiffiffiffiffiffiffiffiffiffiffiffiffiffiffiffiffiffiffiffi2γsinh2 eφ
2kBT
ln ½1þ 2γsinh2 eφ2kBT
�
vuut ; ð3Þ
with γ ¼ 2csalt=cmax the lattice saturation parameter and φthe potential drop across the EDL (φ ¼ Δψ=2 for asymmetric capacitor). In macroporous or mesoporousmaterials, the next natural step to improve these modelsof the EDL is to include a Stern layer of condensedions [22], with an associated capacitance per unit surfaceCSt ¼ ϵ0ϵSt=λSt (with ϵSt and λSt the effective permittivityand width of the Stern layer, respectively), in serieswith that for the diffuse layer CDL ¼ CDH or CPB. Thetotal capacitance of the interface is then obtained asð1=CtotÞ ¼ ð1=CStÞ þ ð1=CDLÞ. However, in the presentcase (CDC material) where the pore size is comparableto that of the ions and solvent molecules, the distinctionbetween Stern and diffuse layers is certainly ambiguous—and the quantification of ϵSt and λSt is somewhat arbitrary.Therefore, while it would be possible to use CSt as a fittingparameter, we will not follow this approach here.When the screening length in the electrolyte becomes
comparable to the electrode pore size, the overlap betweenEDLs within an electrode renders the description moredifficult. However, in the limit where the EDL is largerthan the pore size, it is possible to obtain a simplifieddescription where the potential inside the micropore isuniform, with a potential difference called the Donnanpotential ΔψD between the micropore and the bulkelectrolyte. The ionic concentrations inside the micro-pores are then related to that in the bulk as follows:cmi;i ¼ cbulk;i exp½ð−zieΔψD þ μattÞ=kBT�, where μatt is anattractive excess chemical potential that results in a largersalt concentration inside the micropores even in theabsence of the Donnan potential. This parameter is usuallykept at a fixed value (typically 2–3kBT), but a self-consistent determination has also been suggested byintroducing another relation: μatt ¼ E=cmi;ions, withcmi;ions¼cmi;þþcmi;−¼2cbulkeμatt=kBT cosh½ðeΔψDÞ=ðkBTÞ�the salt concentration in the micropores and E a parameterarising from the polarizability of the electrode [77]. Thecharge density per unit volume of micropore, σmiF ¼ðcmi;þ − cmi;−ÞF ¼ −2Fcbulkeμatt=kBT sinh½ðeΔψDÞ=ðkBTÞ�,with F Faraday’s constant, is then written as
σmiF ¼ −CSt;volΔψSt, with ΔψSt the Stern potential differ-ence and CSt;vol a capacitance per unit volume of micro-pore, which is usually parametrized as CSt;vol ¼CSt;vol;0 þ ασ2mi. For the symmetric electrochemical cellconsidered here, with identical electrodes, the cell voltageunder equilibrium conditions, i.e., vanishing electriccurrent, is related to the Donnan and Stern potentialsas Δψ ¼ 2jΔψD þ ΔψStj.For comparison with molecular simulations and experi-
ments, we finally compute the specific capacitance (per unitmass of the electrode) from the capacitance per unit area ofthe DH and PB models by multiplying by the specificsurface area S and from the electrode capacitance per unitvolume of micropore of the modified Donnan model(−σmiF=ðΔψ=2Þ, the factor of 2 arising from convertingthe cell capacitance to electrode capacitance) by multiply-ing by the porosityΦ and dividing by the mass density ρsolidof the electrode.The predictions of these three models, using reasonable
assumptions for the corresponding parameters, are sum-marized in Table II. In particular, for the DH and PBmodels, we consider, for the dielectric constant of thesolvent, both the bulk value for water and a value(arbitrarily) reduced by an order of magnitude. This allowsus to account for, in a simple manner, the change inthe dielectric response of water at an electrified interfaceand under confinement, even though such a response ismore complex because of, in particular, the symmetrybreaking induced by the walls [78–82] and may result inan unexpected enhancement of permittivity in specificgeometries [83].We first observe that DH overestimates the capacitance,
compared to the molecular simulations and experiments ofTable I, by more than 1 order of magnitude, even when areduced permittivity is introduced. The increase in capaci-tance with salt concentration observed in Table I is capturedby DH theory, even though the scaling as the square rootof concentration overestimates this increase. The order ofmagnitude of the capacitance predicted by PB theory can bemade comparable to the experiments if one uses thereduced permittivity and a maximum salt concentrationinside the EDL of cmax ¼ 1 M, even though such a value issmall (see, in particular, the discussion of salt concen-trations inside the micropores below). A larger value,cmax ¼ 5 M (still below the solubility of NaCl in waterat room temperature), results in an overestimate of thecapacitance. In addition, the PB theory predicts that theconsidered conditions fall in the saturation regime, wherethe capacitance decreases slightly when the salt concen-tration increases, in contradiction with the experimental andmolecular simulation results.Finally, the modified Donnan model, using typical
values from the literature for the various parameters,underestimates the capacitance by a factor of about 2–3when a fixed value of μatt is used, but it roughly captures the
BLUE ENERGY AND DESALINATION WITH NANOPOROUS … PHYS. REV. X 8, 021024 (2018)
021024-5

slight increase in capacitance with salt concentration. Sincethe effect of the self-consistent scheme to determine μatt isto reduce the capacitance [77], it does not improve theagreement with the experimental and molecular simulationresults in the present case. Overall, none of these models isable to correctly capture the order of magnitude of thecapacitance and its increase with the salt concentration.Nevertheless, one should distinguish between the DH andPB models, which apply a priori better for planar walls orlarge pores [84], and the modified Donnan model, whichapplies in the full double-layer overlap regime, even thoughit describes the interactions of the ions with the surroundingfluid and electrode in a simplified mean-field way, whichdoes not properly account for interactions on the molecularscale. We have therefore attempted to parametrize such amodified Donnan model from our molecular simulationresults for the capacitance, changing as few parameters aspossible. As shown in Table II (case c), this can be achievedby increasing the value of CSt;vol;0 by a factor of about 2.25.Since the parameters of the modified Donnan model aresensitive to many factors such as surface area or porosityand therefore depend on the preparation process, it is notunexpected that the values from the literature (even thoughfor similar materials) are not straightforwardly transferableto the present experimental results. However, this under-lines the need for experimental data to fit the modifiedDonnan model, whereas the present molecular simulation
approach only uses the experimental capacitances forvalidation purposes.
B. Water density and ionic concentration
Molecular simulations further provide information onthe fluid confined inside the electrodes. Figure 3 shows thedensity profiles of water and ions across the simulation cellin the two simulated systems (the local carbon density isalso indicated), while Table III summarizes the correspond-ing average ion concentrations in the bulk and inside bothelectrodes (per unit pore volume) as well as the associatedwater density. The water density profile in the region farfrom the electrodes is flat, and the corresponding density isequal to that of bulk water. Some layering over 2–3 waterlayers is observed at the interface between the electrode andthe bulk region due to the discreteness of the fluid. Thewater density per unit length of simulation box is smallerinside the electrodes than in the bulk because of thepresence of the carbon matrix. However, the water densityinside the pores (see Table III) is in fact larger than in thebulk. Such an increase may be due to several factors,including confinement, which perturbs the structure of thefluid, in particular, the ability to form hydrogen bonds, orelectrostriction in the presence of the local electric fieldsinside the electrode [85]. We also note that there is anasymmetry between the electrodes, with a slightly largerwater density in the positive electrode correlated with a
TABLE II. Single-electrode capacitance in F g−1 from DH, PB, and mD theories. Here, cmax is the maximumconcentration allowed in the PB theory, accounting for volume saturation in Ref. [76] For the modified Donnanmodel, with fixed or self-consistent attraction parameter μatt, we use values from the literature for similar materialsfor the Stern capacitance parameters CSt;vol;0 and α (see text), and the electrode capacitance is computed from thecharge of a symmetric electrochemical cell under a voltage of 1.0 V. Uncertainties are based on that for the specificsurface area.
Capacitance (F g−1)
Model Parameter(s) ϵr ¼ 78.3 ϵr ¼ 8
0.5 MDH 3117� 4 997� 1PB cmax ¼ 1M 509� 1 163� 1
cmax ¼ 5M 1191� 2 381� 1mD Fixed μatt
a 43Self-consistent μatt
b 36Fitted to MD simulation c 107
1.0 MDH 4409� 6 1409� 2PB cmax ¼ 1M 500� 1 160� 1
cmax ¼ 5M 1168� 2 373� 1mD Fixed μatt
a 45Self-consistent μatt
b 38Fitted to MD simulation c 118
aFrom Ref. [18]: μatt ¼ 3kBT, CSt;vol;0 ¼ 200 MFm−3, and α ¼ 30 Fm3 mol−2.bSame CSt;vol;0 and α as above but with μatt ¼ E=cion;mi, with cions;mi the salt concentration in the pores
and E ¼ 300kBT molm−3; see Ref. [77].cFrom present molecular simulation results: μatt ¼ 3kBT, CSt;vol;0 ¼ 449 MFm−3, and α ¼ 30 Fm3 mol−2.
MICHELE SIMONCELLI et al. PHYS. REV. X 8, 021024 (2018)
021024-6

slightly smaller ion concentration. Such an asymmetry islikely due to the different ionic radii and solvation proper-ties or to the effect of the surface charge distribution on theorientation of the water molecules [40,70,86], which arenot simple dipoles—features that are not included in anyof the DH, PB, or modified Donnan models—and it isconsistent with the above-mentioned slight asymmetryobserved on the experimental capacitances. An asymmetrycould be introduced using additional parameters, e.g.,different cmax or γ (resp. μatt) for different ions in thePB (resp. modified Donnan) model, which would have tobe parametrized accordingly.
The average cation and anion concentrations in the bulkare equal and slightly lower than the ones anticipated whendesigning the simulations with the average target concen-tration; correspondingly, the ionic concentration inside thepores is larger than in the bulk. This observation isconsistent with the experimental observations that moti-vated the introduction of the attractive excess chemicalpotential in the modified Donnan model. The magnitude ofthis increase corresponds to μatt ∼ 1–2kBT, i.e., slightlysmaller than but comparable to the values used in theliterature. The increase in ion concentration inside theelectrodes may also contribute to the smaller permittivityinside the pores, even though in the bulk the decrease forsuch concentrations does not go beyond a factor of 2 [87].The ionic concentration inside the electrodes obtained
from MD simulations is compared to the predictions of themodified Donnan model in Table IV. The mass of adsorbedions is computed as the total mass of ions inside theelectrodes, divided by the mass of both electrodes [12],
Γsalt ¼ ½ðcþþ þ c−þÞMNa þ ðcþ− þ c−−ÞMCl�Φ
2ρsolid; ð4Þ
where the subscripts refer to the ions and the superscripts tothe electrodes, and MNa and MCl are the molar masses ofthe ions. The mD model underestimates the ionic concen-tration by a factor of about 3–4 if values from the literatureare used for the parameters μatt and CSt;vol;0. As for thecapacitance, using the self-consistent μatt scheme ofRef. [77] results in a slight decrease of the ionic concen-tration inside the electrodes; i.e., it does not improve the
0 50 100 150z (A)
0
2
4
6
8
Oan
dC
dens
ities
A3
10 2 csalt = 0.5 MOC
0.0
0.5
1.0
1.5
2.0
Na+
and
Cl
dens
ities
A3
10 3Na+
ClOC
0 50 100 150z (A)
0
2
4
6
8
Oan
dC
dens
ities
A3
10 2 csalt = 1.0 MOC
0.0
0.5
1.0
1.5
2.0
Na+
and
Cl
dens
ities
A3
10 3Na+
ClOC
FIG. 3. Density profiles along the simulation cell, for anaverage salt concentration of 0.5 and 1.0M (top and bottom,respectively). The negative (resp. positive) electrode is on the left(resp. right) side of the cell.
TABLE III. Cation and anion concentrations, as well as waterdensity, in the bulk and in the electrode pores, from molecularsimulation under a voltage of 1 V. The uncertainties are of order0.1 M for the ion concentrations and 0.01 g cm−3 for the waterdensities.
System SpeciesNegativeelectrode Bulk
Positiveelectrode
0.5 M Naþ (M) 2.3 0.4 0.1Cl− (M) 0.5 0.4 2.0
Water (g cm−3) 1.25 1.04 1.471.0 M Naþ (M) 2.9 0.9 0.7
Cl− (M) 1.0 0.9 3.0Water (g cm−3) 1.32 1.02 1.41
TABLE IV. Ionic concentration inside the electrode microporesfor a symmetric electrochemical cell under a voltage of 1.0 V,from molecular dynamics simulations and from the modifiedDonnan model with various assumptions. Results are given as thetotal mass of ions inside both electrodes, per unit mass of bothelectrodes [see Eq. (4)].
System MethodIon adsorption
(mg g−1)0.5 M MD simulation 18
Donnan with fixed μatta 6
Donnan with self-consistent μattb 5
Donnan fitted to MD simulation c 161.0 M MD simulation 27
Donnan with fixed μatta 7
Donnan with self-consistent μattb 5
Donnan fitted to MD simulation c 18aFrom Ref. [18]: μatt ¼ 3kBT, CSt;vol;0 ¼ 200 MFm−3,
and α ¼ 30 Fm3 mol−2.bSame CSt;vol;0 and α as above but with μatt ¼ E=cion;mi,
with cions;mi the ionic concentration in the pores andE ¼ 300kBT molm−3; see Ref. [77].
cFrom present molecular simulation results, μatt ¼ 3kBT,CSt;vol;0 ¼ 449 MFm−3, and α ¼ 30 Fm3 mol−2.
BLUE ENERGY AND DESALINATION WITH NANOPOROUS … PHYS. REV. X 8, 021024 (2018)
021024-7

prediction. Using the values of μatt and CSt;vol;0 fitted to theMD simulation results for the capacitance at high concen-tration, which reasonably reproduce the experimentalcapacitance at lower concentrations, also improves theprediction for the adsorbed salt, even though the agreementwith simulations is not quantitative.In addition, the ionic concentration is larger in the
negative electrode, where cations are in excess comparedto anions. Such an asymmetry, which cannot be predicted atthe level of DH, PB, or modified Donnan models, likelyarises from the difference in size between the cations, eventhough the asymmetry of the water molecule may also playa role (as it does in the solvation of ions in the bulk). Thisdifference in volume occupied by the ions is also anti-correlated with the difference in water density inside theelectrodes. This is consistent with previous simulations ofionic liquids and organic electrolytes inside CDC electro-des, which indicated that the overall volume of the liquidinside the pores is more or less unchanged [34,38]. Theasymmetric ion concentrations also seem to suggest that theelectrodes do not carry the same charge. However, this isnot the case because the interfacial regions (where water islayered; see Fig. 1) also carry an excess ionic charge, whichis larger on the negative electrode size. We finally note thatthis asymmetry also suggests that the capacitance of thepositive and negative electrodes may differ slightly.However, going beyond this assumption to determine theelectrode capacitances from the cell capacitance wouldrequire dedicated approaches that go beyond the scope ofthe present work [88].
C. Solvation and confinement inside the electrodes
Before examining the consequences of the above con-siderations for CapMix and CDI on the macroscopic scale,as will be done in the next section, here we provide someadditional microscopic information on the solvation of ionsand their confinement within the electrodes. Such infor-mation is indeed much more difficult to obtain experimen-tally than the electrochemical response, while it is veryimportant to understand the mechanisms at play. Thesolvation number of each ion is the number of watermolecules in its solvation shell, defined by a cutoff radiusdetermined from the position of the first minimum of theradial distribution functions (3.3 and 3.9 Å for Naþ andCl−, respectively). In addition, the degree of confinement(d.o.c.) of each ion can be computed as the fraction of thesolid angle occupied by electrode atoms within the firstcoordination shell of the ions [38].Figure 4 illustrates the solvation number distribution for
Naþ and Cl−, in the bulk and inside the positive andnegative electrodes for the 1.0 M system (similar results,not shown, are obtained for the 0.5 M system). While in thebulk the distribution for Naþ is narrow around 6 watermolecules, under confinement the average solvation num-ber decreases (to 5.4 and 5.7 in the positive and negative
electrodes, respectively) and the distribution becomesbroader. Similar behavior is observed forCl−, with a decreasefrom 7.4 in the bulk to about 7 in both the positive andnegative electrodes and a broadening of the distribution.While the decrease in solvation number under extreme
confinement may seem rather limited compared to ourprevious studies on ionic liquids and organic electrolytes[34,38], it is worth noting that Naþ ions are “traditionallythought to have an almost unbreakable solvation shell,” asdiscussed by Sayer et al. [89]. We have therefore furtherexamined the link between the coordination number andthe confinement of the ions. The broadening of thedistribution points to the existence of several microscopicenvironments experienced by both ions inside the electro-des. We further investigate this issue by computing the jointdistribution of solvation number and degree of confine-ment, illustrated for the 1.0 M system in Fig. 5. Despite the
FIG. 4. Distribution of solvation number for Naþ (left panel)and Cl− (right panel) ions in the bulk, negative and positiveelectrodes, for the 1.0 M system.
(a) (b)
FIG. 5. Joint distribution of solvation number and d.o.c. of Naþ(left panel) and Cl− (right panel) ions in positive (dark blue, red)and negative (light blue, orange) electrodes, for the 1.0 M system.The histograms correspond to the discrete values of the solvationnumber and to finite intervals of the continuous d.o.c. (of width2% and 10% for Naþ and Cl−, respectively).
MICHELE SIMONCELLI et al. PHYS. REV. X 8, 021024 (2018)
021024-8

decrease in its average solvation number, most of the Naþcations do not experience direct contact with the electrode:In the negative (resp. positive) electrode, more than 91%(resp. 96%) have a d.o.c. smaller than 2%, and no cationswith a d.o.c. larger than 8% were observed, resulting in anaverage d.o.c. of only 0.4% (resp. 0.2%) in the negative(resp. positive) electrode. While the majority of Cl− anionsin the negative electrode (about 92%) have a d.o.c. smallerthan 10%, about 20% of the anions in the positive electrodehave a d.o.c. larger than 10% and a corresponding largerdecrease in the solvation number (6.5 or less). Highlyconfined Cl− anions are also observed inside the positiveelectrode (about 3%), with a d.o.c. larger than 30% and asolvation number as small as 3. However, the average d.o.c.of Cl− remains moderate: about 3% (resp. 7%) in thenegative (resp. positive) electrode. The larger ability of Cl−
to desolvate compared to Naþ is consistent with theirdifferent hydration free energies.More generally, these results show that charging the
capacitor not only unbalances the ionic concentrationsinside the electrode micropores but also depends on morecomplex molecular features. While a detailed study of suchspecific effects is clearly out of the scope of the presentwork, they are likely to play a role in the charge anddischarge and are therefore important in practice for theapplications. Molecular simulation provides an appropriatetool to investigate such effects without introducing thema priori in a model.
D. Implications for CapMix and CDI
Finally, we now discuss the implications of our findingsfor the harvest of blue energy by capacitive mixing andCDI. The CapMix cycle is illustrated in the charge-voltageplane in Fig. 6. Using a symmetric electrochemical cellwith a voltage supply of Δφ and two electrolytes withdifferent concentrations (leading to cell capacitances C1 >C2 for sea and river water, respectively), the energyextracted per cycle is given by the area of the shadedtrapezoidal region as
ΔEcycle ¼1
2ðQ1 −Q2Þ
�C1
C2
Δφ −C2
C1
Δφ�
¼ 1
2
ðC1 − C2Þ2Ceff
Δφ2; ð5Þ
where
1
Ceff¼ 1
C1
þ 1
C2
ð6Þ
is an effective capacitance corresponding to the twocapacitors in series (note that here C1 and C2 refer to fullelectrochemical cell and not electrode capacitances).We now estimateΔEcycle for the CDC considered here by
considering typical concentrations of river and sea water(20 and 500 mM, respectively) and a typical voltage supply
Δφ ¼ 300 mV, as done in previous studies [8–10]. Table Vreports the capacitance and ion adsorption predicted by themD model with parameters fitted to the simulation data at0.5 and 1.0M, as a function of salt concentration. While notperfect, the agreement with the available experimentalcapacitance (see Table I) seems sufficient to estimate thecapacitance at an even lower concentration of 20 mM, withthe result 74 F g−1. In turn, Eq. (5) predicts a theoreticalenergy per cycle of ΔEcycle ∼ 0.6 J g−1. Such a value issmaller than the value anticipated for CDCs by Brogioliwhen introducing the idea of CapMix [8], namely, 1.6 J g−1
with comparable salt concentrations (24 and 600 mM).However, this estimate was based on the assumption of acapacitance of 300 F g−1, which is too large compared to
BC
DA
FIG. 6. Capacitive mixing thermodynamic cycle, using twoelectrolytes with different salt concentrations. Segment A: theelectrochemical cell is charged under a supply voltage Δφ in thepresence of the more concentrated electrolyte (sea water),corresponding to a large cell capacitance C1. Segment B: thevoltage between the electrodes rises when the electrolyte isreplaced by the more dilute one (river water, small cell capaci-tance C2) under open circuit conditions. Segment C: the electro-chemical cell is then discharged down to the supply voltage Δφ,before being flushed with a concentrated electrolyte under opencircuit conditions (segment D). The energy extracted per cycle,ΔEcycle, is equal to the area of the shaded region.
TABLE V. Electrode capacitance (in F g−1) and ion adsorptionfor a symmetric electrochemical cell under a voltage of 1.0 V,using the modified Donnan model with parameters fitted toreproduce our MD simulation results for the capacitance at highconcentration (see Table II). Results for ion adsorption are givenas the total mass of ions inside both electrodes, per unit mass ofboth electrodes [see Eq. (4)].
Concentration (M) Capacitance (F g−1) Ion adsorption (mg g−1)
0.005 64 100.02 74 110.05 82 120.1 89 130.5 107 161.0 118 18
BLUE ENERGY AND DESALINATION WITH NANOPOROUS … PHYS. REV. X 8, 021024 (2018)
021024-9

the actual one (see Table I). The order of magnitude,however, remains comparable. In addition, this lower valueremains about 3–4 times larger than the experimental datareported for the same voltage with a porous carbon withlarger pores (density 0.58 g cm−3, porosity of 65%, SSA1330 m2 g−1) [9]. This confirms the potential interest ofCDCs for CapMix.Previous studies of CDC electrodes focused on their
application to CDI rather than CapMix, so a directcomparison of the capacitance and adsorbed salt contentis difficult. Indeed, in such cases, the experiments areperformed at low salt concentration because at highconcentrations, CDI consumes more energy than otherdesalination processes such as reverse osmosis [12]. Forexample, Porada et al. reported capacitances of about10–15 F g−1 and salt adsorption capacities of10–15 mgg−1 for concentrations of 5 mM and variousCDCs when working with voltages of about 1 V [18,19].From the mDmodel with parameters fitted to reproduce ourMD simulation results for the capacitance (at high con-centration), we extrapolate the salt adsorption capacity to10 mgg−1. Keeping in mind that this model even under-estimates the simulation results at high concentration, thisconfirms the potential of CDCs, in general, for CDIcompared to other materials (with typical values mainlyin the range 1–10 mgg−1; see, e.g., Table 1 in Ref. [12])and simultaneously suggests that there is room for improve-ment to optimize CDCs for this application.
IV. CONCLUSION AND PERSPECTIVES
We have shown that molecular simulation provides areliable tool to investigate aqueous electrolytes in realisticnanoporous carbon electrodes, for sufficiently large saltconcentrations for which such simulations can be done inpractice. The predicted capacitances are in excellent agree-ment with experiments. In contrast, Debye-Hückel andPoisson-Boltzmann theories cannot be applied under suchextreme confinement, even by taking into account thedecrease in permittivity induced by the latter or byintroducing excluded volume following the approach thatwas successful with ionic liquids. These models should beused with caution for nanoporous carbons such as CDCsto estimate the capacitance or the extracted energy. Incontrast, we have shown that the molecular simulationresults at high concentrations can be used to parametrizea modified Donnan model, which then allows one toextrapolate the predictions to lower concentrations relevantfor river water in CapMix and for CDI, finding reasonableagreement with the experimental capacitance. Thisapproach is therefore fundamentally different from fittingthe experimental data to a modified Donnan model, whichis standard practice in CDI (such models are used much lessin the CapMix community, where Poisson-Boltzmanntheory is usually preferred).
While here we have not considered classical DFT, recentwork capturing excluded volume and electrostatic corre-lations between ions suggests that these effects mayincrease the energy produced per unit area [31], thereforefurther overestimating this quantity. Nevertheless, it wouldbe necessary to investigate the predictions of classical DFTunder comparable conditions and, ideally, also in morerealistic geometries. Molecular simulations could thenprovide reference data to validate DFT or even help buildbetter functionals for that case [47]. Explicitly including thestructure of the solvent [90–92] may also significantlyimprove the accuracy of the description of the confinedfluid. In turn, classical DFTwould also provide predictionsat low salt concentrations, which are out of reach formolecular simulations. Meanwhile, we have shown that themodified Donnan model may be a reasonable alternative tomake simple predictions, provided that the correspondingparameters are correctly adjusted.Overall, the present results underline the potential of
CDCs for both CapMix and CDI, thanks to their pore sizecomparable to that of the ions. Even though the associatedcomputational cost, which, in particular, prevents us fromreaching the low concentration regime, does not positionmolecular simulation as an alternative for the daily pre-diction of material properties for applications, the presentwork clearly demonstrates its interest to investigate infuture work the factors governing charge storage and saltadsorption in these materials, by quantifying, e.g., solvationnumbers and degrees of confinement, as shown here, ordiffusion coefficients of ions and water inside the pores.More generally, it will also help to understand, on themolecular scale, the effects of physiochemical factors suchas the geometry of the electrodes (considering not onlyCDCs but also other nanoporous carbon materials), hydro-philicity [93], ion specific effects, or the possible presenceof chemical moieties such as carboxylic groups, and henceto guide the design of improved materials. Future workshould also investigate the dynamics and the energy lossduring charging and discharging, which may be larger thanwith more porous materials, even though previous workwith ionic liquids and organic electrolytes demonstratedthat the dynamics was not slowed down to a point pre-venting their use in supercapacitors (see, e.g., Ref. [36]). Asin previous work in this latter context, molecular simulationcan serve as the starting point for a multiscale description[37], which captures possible heterogeneities on largerscales, such as the finite size of carbon grains, on the scaleof tens or hundreds of micrometers [35].
ACKNOWLEDGMENTS
The authors acknowledge financial support from theVille de Paris (Emergences, project Blue Energy), theFrench National Research Agency (Labex STORE-EX,Grant No. ANR-10-LABX-0076), ERC (Advanced GrantProject No. 291543 IONACES), as well as HPC resources
MICHELE SIMONCELLI et al. PHYS. REV. X 8, 021024 (2018)
021024-10

granted by PRACE (Grant No. 2015122929) and GENCI(resources of TGCC, Grant No. t2016087725). Weacknowledge support from EoCoE, a project funded bythe European Union Contract No. H2020-EINFRA-2015-1-676629.
M. Si. and N. G. contributed equally to this work.
[1] R. E. Pattle, Production of Electric Power by Mixing Freshand Salt Water in the Hydroelectric Pile, Nature (London)174, 660 (1954).
[2] R. S. Norman, Water Salination: A Source of Energy,Science 186, 350 (1974).
[3] J. N. Weinstein and F. B. Leitz, Electric Power fromDifferences in Salinity: The Dialytic Battery, Science191, 557 (1976).
[4] G. L. Wick and W. R. Schmitt, Prospects for RenewableEnergy from Sea, Mar. Technol. Soc. J. 11, 16 (1977).
[5] M. Olsson, G. L. Wick, and J. D. Isaacs, Salinity GradientPower: Utilizing Vapor Pressure Differences, Science 206,452 (1979).
[6] N. Y. Yip, D. Brogioli, H. V. M. Hamelers, and K. Nijmeijer,Salinity Gradients for Sustainable Energy: Primer,Progress, and Prospects, Environ. Sci. Technol. 50,12072 (2016).
[7] A. Siria, P. Poncharal, A.-L. Biance, R. Fulcrand, X. Blase,S. T. Purcell, and L. Bocquet, Giant Osmotic EnergyConversion Measured in a Single Transmembrane BoronNitride Nanotube, Nature (London) 494, 455 (2013).
[8] D. Brogioli, Extracting Renewable Energy from a SalinityDifference Using a Capacitor, Phys. Rev. Lett. 103, 058501(2009).
[9] D. Brogioli, R. Zhao, and P. M. Biesheuvel, A Prototype Cellfor Extracting Energy from a Water Salinity Difference byMeans of Double Layer Expansion in Nanoporous CarbonElectrodes, Energy Environ. Sci. 4, 772 (2011).
[10] D. Brogioli, R. Ziano, R. A. Rica, D. Salerno, O.Kozynchenko, H. V. M. Hamelers, and F. Mantegazza,Exploiting the Spontaneous Potential of the ElectrodesUsed in the Capacitive Mixing Technique for the Extractionof Energy from Salinity Difference, Energy Environ. Sci. 5,9870 (2012).
[11] R. A. Rica, D. Brogioli, R. Ziano, D. Salerno, and F.Mantegazza, Ions Transport and Adsorption Mechanismsin Porous Electrodes During Capacitive-Mixing DoubleLayer Expansion (CDLE), J. Phys. Chem. C 116, 16934(2012).
[12] S. Porada, R. Zhao, A. van der Wal, V. Presser, and P. M.Biesheuvel, Review on the Science and Technology of WaterDesalination by Capacitive Deionization, Prog. Mater. Sci.58, 1388 (2013).
[13] M. E. Suss, S. Porada, X. Sun, P. M. Biesheuvel, J. Yoon,and V. Presser, Water Desalination via Capacitive Deion-ization: What Is It and What Can We Expect from It? EnergyEnviron. Sci. 8, 2296 (2015).
[14] J. Chmiola, G. Yushin, Y. Gogotsi, C. Portet, P. Simon, andP.-L. Taberna, Anomalous Increase in Carbon Capacitance
at Pore Sizes Less Than 1 Nanometer, Science 313, 1760(2006).
[15] C. Largeot, C. Portet, J. Chmiola, P.-L. Taberna, Y. Gogotsi,and P. Simon, Relation between the Ion Size and Pore Sizefor an Electric Double-Layer Capacitor, J. Am. Chem. Soc.130, 2730 (2008).
[16] P. Simon and A. F. Burke, Nanostructured Carbons: Dou-ble-Layer Capacitance and More, Electrochem. Soc. Inter-face 17, 38 (2008).
[17] M. Salanne, B. Rotenberg, K. Naoi, K. Kaneko, P.-L.Taberna, C. P. Grey, B. Dunn, and P. Simon, EfficientStorage Mechanisms for Building Better Supercapacitors,Nat. Energy 1, 16070 (2016).
[18] S. Porada, L. Weinstein, R. Dash, A. van derWal, M. Bryjak,Y. Gogotsi, and P. M. Biesheuvel,Water Desalination UsingCapacitive Deionization with Microporous Carbon Electro-des, ACS Appl. Mater. Interfaces 4, 1194 (2012).
[19] S. Porada, L. Borchardt, M. Oschatz, M. Bryjak, J. S.Atchison, K. J. Keesman, S. Kaskel, P. M. Biesheuvel,and V. Presser, Direct Prediction of the DesalinationPerformance of Porous Carbon Electrodes for CapacitiveDeionization, Energy Environ. Sci. 6, 3700 (2013).
[20] K. Sharma, Y. H. Kim, S. Yiacoumi, J. Gabitto, H. Z.Bilheux, L. J. Santodonato, R. T. Mayes, S. Dai, and C.Tsouris, Analysis and Simulation of a Blue Energy Cycle,Renewable Energy 91, 249 (2016).
[21] C. Prehal, C. Koczwara, N. Jäckel, A. Schreiber, M. Burian,H. Amenitsch, M. A. Hartmann, V. Presser, and O. Paris,Quantification of Ion Confinement and Desolvation inNanoporous Carbon Supercapacitors with Modelling andIn Situ X-Ray Scattering, Nat. Energy 2, 16215 (2017).
[22] P. M. Biesheuvel and M. Z. Bazant, Nonlinear Dynamics ofCapacitive Charging and Desalination by Porous Electro-des, Phys. Rev. E 81, 031502 (2010).
[23] R. Zhao, P. M. Biesheuvel, H. Miedema, H. Bruning, and A.van der Wal, Charge Efficiency: A Functional Tool to Probethe Double-Layer Structure Inside of Porous Electrodes andApplication in the Modeling of Capacitive Deionization, J.Phys. Chem. Lett. 1, 205 (2010).
[24] N. Boon and R. van Roij, Blue Energy from Ion Adsorptionand Electrode Charging in Sea and River Water, Mol. Phys.109, 1229 (2011).
[25] R. A. Rica, R. Ziano, D. Salerno, F. Mantegazza, andD. Brogioli, Thermodynamic Relation between Voltage-Concentration Dependence and Salt Adsorption in Electro-chemical Cells, Phys. Rev. Lett. 109, 156103 (2012).
[26] P. M. Biesheuvel, Y. Fu, and M. Z. Bazant, Electrochemistryand Capacitive Charging of Porous Electrodes in Asym-metric Multicomponent Electrolytes, Russ. J. Electrochem.48, 580 (2012).
[27] R. A. Rica, R. Ziano, D. Salerno, F. Mantegazza, R. vanRoij, and D. Brogioli, Capacitive Mixing for Harvesting theFree Energy of Solutions at Different Concentrations,Entropy 15, 1388 (2013).
[28] M. Janssen, A. Härtel, and R. van Roij, Boosting CapacitiveBlue-Energy and Desalination Devices with Waste Heat,Phys. Rev. Lett. 113, 268501 (2014).
[29] P. B. Peters, R. van Roij, M. Z. Bazant, and P. M. Biesheuvel,Analysis of Electrolyte Transport through Charged Nano-pores, Phys. Rev. E 93, 053108 (2016).
BLUE ENERGY AND DESALINATION WITH NANOPOROUS … PHYS. REV. X 8, 021024 (2018)
021024-11

[30] P. M. Biesheuvel, R. Zhao, S. Porada, and A. van der Wal,Theory of Membrane Capacitive Deionization Including theEffect of the Electrode Pore Space, J. Colloid Interface Sci.360, 239 (2011).
[31] A. Härtel, M. Janssen, S. Samin, and R. van Roij, Funda-mental Measure Theory for the Electric Double Layer:Implications for Blue-Energy Harvesting and Water Desali-nation, J. Phys. Condens. Matter 27, 194129 (2015).
[32] A. Härtel, M. Janssen, D. Weingarth, V. Presser, and R. vanRoij, Heat-to-Current Conversion of Low-Grade Heat froma Thermocapacitive Cycle by Supercapacitors, EnergyEnviron. Sci. 8, 2396 (2015).
[33] X. Kong, A. Gallegos, D. Lu, Z. Liu, and J. Wu, AMolecular Theory for Optimal Blue Energy Extraction byElectrical Double Layer Expansion, Phys. Chem. Chem.Phys. 17, 23970 (2015).
[34] C. Merlet, B. Rotenberg, P. A. Madden, P.-L. Taberna, P.Simon, Y. Gogotsi, and M. Salanne, On the MolecularOrigin of Supercapacitance in Nanoporous Carbon Elec-trodes, Nat. Mater. 11, 306 (2012).
[35] C. Pean, C. Merlet, B. Rotenberg, P. A. Madden, P.-L.Taberna, B. Daffos, M. Salanne, and P. Simon, On theDynamics of Charging in Nanoporous Carbon-BasedSupercapacitors, ACS Nano 8, 1576 (2014).
[36] C. Pean, B. Daffos, B. Rotenberg, P. Levitz, M. Haefele,P.-L. Taberna, P. Simon, and M. Salanne, Confinement,Desolvation, and Electrosorption Effects on the Diffusion ofIons in Nanoporous Carbon Electrodes, J. Am. Chem. Soc.137, 12627 (2015).
[37] C. Pean, B. Rotenberg, P. Simon, and M. Salanne, Multi-scale Modelling of Supercapacitors: From MolecularSimulations to a Transmission Line Model, J. PowerSources 326, 680 (2016).
[38] C. Merlet, C. Pean, B. Rotenberg, P. A. Madden, B. Daffos,P.-L. Taberna, P. Simon, and M. Salanne, Highly ConfinedIons Store Charge More Efficiently in Supercapacitors, Nat.Commun. 4, 2701 (2013).
[39] C. Merlet, M. Salanne, B. Rotenberg, and P. A. Madden,Influence of Solvation on the Structural and CapacitiveProperties of Electrical Double Layer Capacitors, Electro-chim. Acta 101, 262 (2013).
[40] D. T. Limmer and A. P. Willard, Nanoscale Heterogeneity atthe Aqueous Electrolyte-Electrode Interface, Chem. Phys.Lett. 620, 144 (2015).
[41] B. Uralcan, I. A. Aksay, P. G. Debenedetti, and D. T.Limmer, Concentration Fluctuations and CapacitiveResponse in Dense Ionic Solutions, J. Phys. Chem. Lett.7, 2333 (2016).
[42] D. Cohen-Tanugi and J. C. Grossman, Water Permeabilityof Nanoporous Graphene at Realistic Pressures for ReverseOsmosis Desalination, J. Chem. Phys. 141, 074704 (2014).
[43] D. Cohen-Tanugi and J. C. Grossman, NanoporousGraphene as a Reverse Osmosis Membrane: Recent In-sights from Theory and Simulation, Desalination 366, 59(2015).
[44] D. Cohen-Tanugi, L.-C. Lin, and J. C. Grossman,MultilayerNanoporous Graphene Membranes for Water Desalination,Nano Lett. 16, 1027 (2016).
[45] C. B. Picallo, S. Gravelle, L. Joly, E. Charlaix, andL. Bocquet, Nanofluidic Osmotic Diodes: Theory and
Molecular Dynamics Simulations, Phys. Rev. Lett. 111,244501 (2013).
[46] K. Falk, F. Sedlmeier, L. Joly, R. R. Netz, and L. Bocquet,Molecular Origin of Fast Water Transport in CarbonNanotube Membranes: Superlubricity versus CurvatureDependent Friction, Nano Lett. 10, 4067 (2010).
[47] I. Kalcher, J. C. F. Schulz, and J. Dzubiella, Electrolytes in aNanometer Slab-Confinement: Ion-Specific Structure andSolvation Forces, J. Chem. Phys. 133, 164511 (2010).
[48] P.-A. Cazade, R. Hartkamp, and B. Coasne, Structure andDynamics of an Electrolyte Confined in Charged Nano-pores, J. Phys. Chem. C 118, 5061 (2014).
[49] R. K. Kalluri, T. A. Ho, J. Biener, M.M. Biener, and A.Striolo, Partition and Structure of Aqueous NaCl andCaCl2 Electrolytes in Carbon-Slit Electrodes, J. Phys.Chem. C 117, 13609 (2013).
[50] T. A. Ho and A. Striolo, Promising Performance Indicatorsfor Water Desalination and Aqueous Capacitors Obtainedby Engineering the Electric Double Layer in Nano-Structured Carbon Electrodes, J. Phys. Chem. C 119,3331 (2015).
[51] A. Striolo, A. Michaelides, and L. Joly, The Carbon-WaterInterface: Modeling Challenges and Opportunities for theWater-Energy Nexus, Annu. Rev. Chem. Biomol. Eng. 7,533 (2016).
[52] Y. S. Al-Hamdani, D. Alfe, and A. Michaelides, HowStrongly Do Hydrogen andWater Molecules Stick to CarbonNanomaterials?, J. Chem. Phys. 146, 094701 (2017).
[53] M. Ma, G. Tocci, A. Michaelides, and G. Aeppli, FastDiffusion of Water Nanodroplets on Graphene, Nat. Mater.15, 66 (2016).
[54] J. Carrasco, A. Hodgson, and A. Michaelides, A MolecularPerspective of Water at Metal Interfaces, Nat. Mater. 11,667 (2012).
[55] C. Merlet, C. Pean, B. Rotenberg, P. A. Madden, P. Simon,and M. Salanne, Simulating Supercapacitors: Can WeModel Electrodes as Constant Charge Surfaces?, J. Phys.Chem. Lett. 4, 264 (2013).
[56] A. P. Willard, S. K. Reed, P. A. Madden, and D. Chandler,Water at an Electrochemical Interface—A Simulation Study,Faraday Discuss. 141, 423 (2009).
[57] D. T. Limmer, A. P. Willard, P. Madden, and D. Chandler,Hydration of Metal Surfaces Can Be Dynamically Hetero-geneous and Hydrophobic, Proc. Natl. Acad. Sci. U.S.A.110, 4200 (2013).
[58] D. T. Limmer, A. P. Willard, P. A. Madden, and D. Chandler,Water Exchange at a Hydrated Platinum Electrode is Rareand Collective, J. Phys. Chem. C 119, 24016 (2015).
[59] J. A. Kattirtzi, D. T. Limmer, and A. P. Willard,MicroscopicDynamics of Charge Separation at the Aqueous Electro-chemical Interface, Proc. Natl. Acad. Sci. U.S.A. 114,13374 (2017).
[60] J. C. Palmer, A. Llobet, S.-H. Yeon, J. E. Fischer, Y. Shi, Y.Gogotsi, and K. E. Gubbins, Modeling the StructuralEvolution of Carbide-Derived Carbons Using QuenchedMolecular Dynamics, Carbon 48, 1116 (2010).
[61] T. F. Willems, C. H. Rycroft, M. Kazi, J. C. Meza, and M.Haranczyk, Algorithms and Tools for High-ThroughputGeometry-Based Analysis of Crystalline Porous Materials,Microporous Mesoporous Mater. 149, 134 (2012).
MICHELE SIMONCELLI et al. PHYS. REV. X 8, 021024 (2018)
021024-12

[62] H. J. C. Berendsen, J. R. Grigera, and T. P. Straatsma, TheMissing Term in Effective Pair Potentials, J. Phys. Chem.91, 6269 (1987).
[63] T. Werder, J. H. Walther, R. L. Jaffe, T. Halicioglu, and P.Koumoutsakos, On the Water–Carbon Interaction for Usein Molecular Dynamics Simulations of Graphite andCarbon Nanotubes, J. Phys. Chem. B 107, 1345 (2003).
[64] S. Koneshan, J. C. Rasaiah, R. M. Lynden-Bell, and S. H.Lee, Solvent Structure, Dynamics, and Ion Mobility inAqueous Solutions at 25 C, J. Phys. Chem. B 102, 4193(1998).
[65] S. K. Reed, O. J. Lanning, and P. A. Madden, Electrochemi-cal Interface between an Ionic Liquid and a Model MetallicElectrode, J. Chem. Phys. 126, 084704 (2007).
[66] T. R. Gingrich and M. Wilson, On the Ewald Summation ofGaussian Charges for the Simulation of Metallic Surfaces,Chem. Phys. Lett. 500, 178 (2010).
[67] J.-P. Ryckaert, G. Ciccotti, and H. JC Berendsen, NumericalIntegration of the Cartesian Equations of Motion of a Systemwith Constraints: Molecular Dynamics of N-Alkanes, J.Comput. Phys. 23, 327 (1977).
[68] G. Ciccotti, M. Ferrario, and J.-P. Ryckaert, MolecularDynamics of Rigid Systems in Cartesian Coordinates: AGeneral Formulation, Mol. Phys. 47, 1253 (1982).
[69] J. I. Siepmann and M. Sprik, Influence of Surface Topologyand Electrostatic Potential on Water/Electrode Systems, J.Chem. Phys. 102, 511 (1995).
[70] D. T. Limmer, C. Merlet, M. Salanne, D. Chandler, P. A.Madden, R. van Roij, and B. Rotenberg, Charge Fluctua-tions in Nanoscale Capacitors, Phys. Rev. Lett. 111,106102 (2013).
[71] B. Dyatkin, O. Gogotsi, B. Malinovskiy, Y. Zozulya, P.Simon, and Y. Gogotsi, High Capacitance of Coarse-Grained Carbide Derived Carbon Electrodes, J. PowerSources 306, 32 (2016).
[72] R. Burt, K. Breitsprecher, B. Daffos, P.-L. Taberna, P. Simon,G. Birkett, X. S. Zhao, C. Holm, and M. Salanne, Capaci-tance of Nanoporous Carbon-Based Supercapacitors Is aTrade-Off between the Concentration and the Separability ofthe Ions, J. Phys. Chem. Lett. 7, 4015 (2016).
[73] M. S. Kilic, M. Z. Bazant, and A. Ajdari, Steric Effects in theDynamics of Electrolytes at Large Applied Voltages. I.Double-Layer Charging, Phys. Rev. E 75, 021502 (2007).
[74] M. Z. Bazant, M. S. Kilic, B. D. Storey, and A. Ajdari,Towards an Understanding of Induced-Charge Electroki-netics at Large Applied Voltages in Concentrated Solutions,Adv. Colloid Interface Sci. 152, 48 (2009).
[75] V. Freise, Zur Theorie der Diffusen Doppelschicht, Z.Elektrochem. 56, 822 (1952).
[76] A. A. Kornyshev, Double-Layer in Ionic Liquids: ParadigmChange?, J. Phys. Chem. B 111, 5545 (2007).
[77] P. M. Biesheuvel, S. Porada, M. Levi, and M. Z. Bazant,Attractive Forces in Microporous Carbon Electrodes forCapacitive Deionization, J. Solid State Electrochem. 18,1365 (2014).
[78] B. E. Conway, J.O’M. Bockris, and I. A. Ammar, TheDielectric Constant of the Solution in the Diffuse andHelmholtz Double Layers at a Charged Interface inAqueous Solution, Trans. Faraday Soc. 47, 756 (1951).
[79] J. Dzubiella and J.-P. Hansen, Electric-Field-ControlledWater and Ion Permeation of a Hydrophobic Nanopore, J.Chem. Phys. 122, 234706 (2005).
[80] D. J. Bonthuis, S. Gekle, and R. R. Netz, Dielectric Profileof Interfacial Water and Its Effect on Double-LayerCapacitance, Phys. Rev. Lett. 107, 166102 (2011).
[81] D. J. Bonthuis, S. Gekle, and R. R. Netz, Profile of the StaticPermittivity Tensor of Water at Interfaces: Consequencesfor Capacitance, Hydration Interaction and Ion Adsorption,Langmuir 28, 7679 (2012).
[82] A. Schlaich, E. W. Knapp, and R. R. Netz, Water DielectricEffects in Planar Confinement, Phys. Rev. Lett. 117, 048001(2016).
[83] R. Renou, A. Szymczyk, G. Maurin, P. Malfreyt, and A.Ghoufi, Superpermittivity of Nanoconfined Water, J. Chem.Phys. 142, 184706 (2015).
[84] R. Kant and M. B. Singh, Generalization of the Gouy-Chapman-Stern Model of an Electric Double Layer for aMorphologically Complex Electrode: Deterministic andStochastic Morphologies, Phys. Rev. E 88, 052303 (2013).
[85] D. Vanzo, D. Bratko, and A. Luzar, Nanoconfined Waterunder Electric Field at Constant Chemical Potential Under-goes Electrostriction, J. Chem. Phys. 140, 074710 (2014).
[86] T. A. Ho and A. Striolo, Capacitance Enhancement viaElectrode Patterning, J. Chem. Phys. 139, 204708 (2013).
[87] I. Kalcher and J. Dzubiella, Structure-ThermodynamicsRelation of Electrolyte Solutions, J. Chem. Phys. 130,134507 (2009).
[88] C. Pean, B. Daffos, C. Merlet, B. Rotenberg, P.-L. Taberna,P. Simon, and M. Salanne, Single Electrode Capacitances ofPorous Carbons in Neat Ionic Liquid Electrolyte at 100C: ACombined Experimental and Modeling Approach, J. Elec-trochem. Soc. 162, A5091 (2015).
[89] T. Sayer, C. Zhang, and M. Sprik, Charge Compensation atthe Interface between the Polar NaCl(111) Surface and aNaCl Aqueous Solution, J. Chem. Phys. 147, 104702 (2017).
[90] M. Levesque, V. Marry, B. Rotenberg, G. Jeanmairet, R.Vuilleumier, and D. Borgis, Solvation of Complex Surfacesvia Molecular Density Functional Theory, J. Chem. Phys.137, 224107 (2012).
[91] G. Jeanmairet, M. Levesque, R. Vuilleumier, and D. Borgis,Molecular Density Functional Theory of Water, J. Phys.Chem. Lett. 4, 619 (2013).
[92] G. Jeanmairet, V. Marry, M. Levesque, B. Rotenberg, and D.Borgis, Hydration of Clays at the Molecular Scale: ThePromising Perspective of Classical Density FunctionalTheory, Mol. Phys. 112, 1320 (2014).
[93] C. Lian, X. Kong, H. Liu, and J. Wu, On the Hydrophilicityof Electrodes for Capacitive Energy Extraction, J. Phys.Condens. Matter 28, 464008 (2016).
BLUE ENERGY AND DESALINATION WITH NANOPOROUS … PHYS. REV. X 8, 021024 (2018)
021024-13