Embed Size (px)
Citation preview
New York State Department of Health
March 2014
PERCUTANEOUS CORONARY
INTERVENTIONS (PCI)
in New York State
2009 – 2011

M. Hashmat Ashraf, MD, FRCSChief, Department of Cardiothoracic Surgery Kaleida Health Buffalo, NYPeter B. Berger, M.D.Co-Director, Heart and Vascular InstituteDirector, Cardiovascular Center for Clinical ResearchGeisinger Health SystemDanville, PAFrederick Bierman, M.D.Director of Graduate Medical Education Westchester Medical Center Valhalla, NYJeptha Curtis, M.D.Asst. Professor, Dept. of Internal Medicine Director, Outcomes Research & Evaluation Data Analytic CenterYale University School of MedicineNew Haven, CTAlan Go, M.D.Director of ResearchKaiser Permanente of Northern CaliforniaOakland, CAJeffrey P. Gold, M.D.Chancellor University of Nebraska Medical Center Omaha, NEDavid R. Holmes Jr., M.D.Professor of Medicine Consultant, Cardiovascular Diseases Mayo Clinic Rochester, MNSuzanne Hughes, R.N., M.S.N. Clinical Education Project Director Preventative Cardiovascular Nurses Association Hudson, OH Alice Jacobs, M.D.Director, Cardiac Catheterization Laboratory and Interventional Cardiology Boston Medical Center Boston, MADesmond Jordan, M.D.Associate Professor of Clinical Anesthesiology in Biomedical Informatics NY Presbyterian Hospital – Columbia New York, NYThomas Kulik, M.D.Director, Pulmonary Hypertension Program Children’s Hospital Boston Boston, MAStephen Lahey, M.D.Chief, Division of Cardiothoracic Surgery University of Connecticut Health Center Farmington, CT
Ralph Mosca, M.D. Vice Chairman, Department of Cardiac Surgery Director, Congenital Cardiac Surgery NYU Medical Center New York, NY Tia Powell, M.D.Director, Montefiore-Einstein Center for BioethicsMontefiore Medical CenterBronx, NYCarlos E. Ruiz, M.D., Ph.D.Director, Division of Structural and Congenital Heart DiseaseLenox Hill Heart and Vascular Institute of New YorkNew York, NYSamin K. Sharma, M.D.Director, Cardiac Catheterization LaboratoryMount Sinai Medical Center New York, NYCraig Smith, M.D.Chairman, Department of Surgery NY Presbyterian Hospital - ColumbiaNew York, NYNicholas Stamato, M.D. Director of Cardiology (previous) United Health Services Hospitals Johnson City, NYThoralf Sundt, III, M.D. Chief, Cardiac Surgical Division Co-Director, Heart Center and Institute for Heart, Vascular and Stroke Massachusetts General Hospital Boston, MAJames Tweddell, M.D. Professor, Cardiothoracic and Pediatric Surgery Chair, Division of Cardiothoracic Surgery The Medical College of Wisconsin Milwaukee, WI Ferdinand Venditti, Jr., M.D.Vice Dean for Clinical Affairs Albany Medical CenterAlbany, NYAndrew S. Wechsler, M.D.Professor and Chair, Department of Cardiothoracic Surgery Drexel University College of Medicine Philadelphia, PARoberta Williams, M.D.Professor of Pediatrics Keck School of Medicine at USC Los Angeles, CA
ConsultantEdward L. Hannan, Ph.D.Distinguished Professor Emeritus Department of Health Policy, Management & BehaviorAssociate Dean EmeritusUniversity at Albany, School of Public Health Rensselaer, NY
Members
Chair Vice Chair
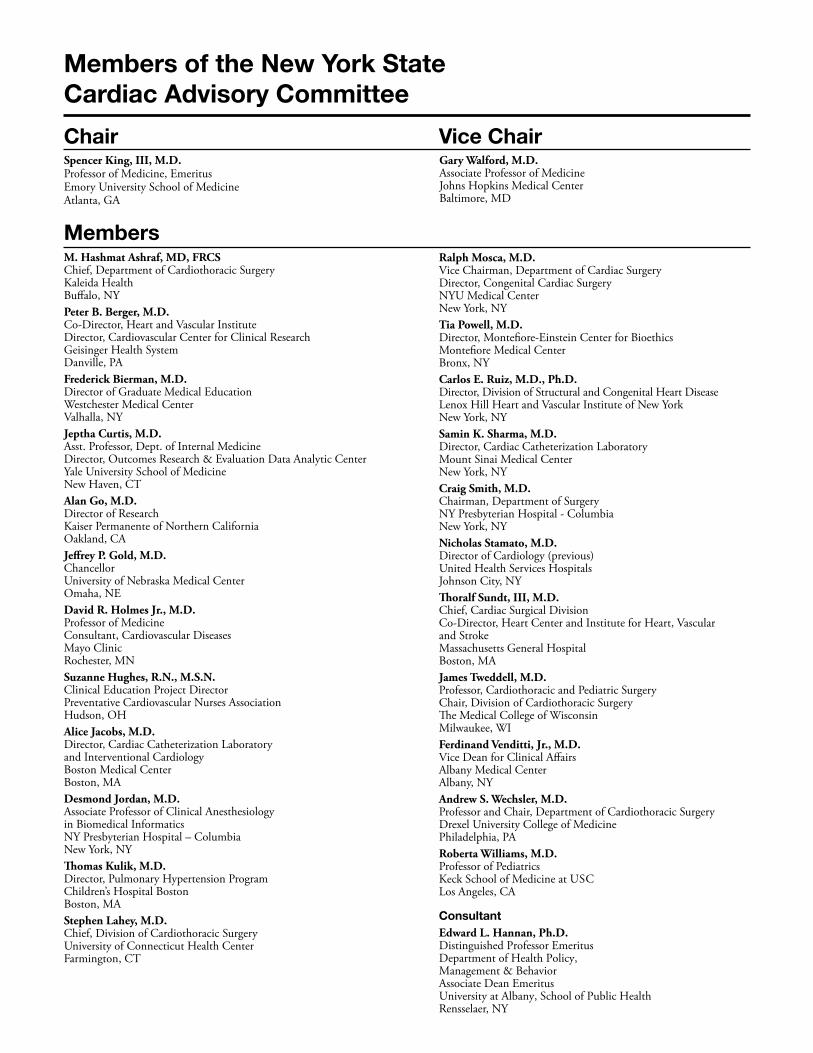
Members of the New York StateCardiac Advisory Committee
Spencer King, III, M.D.Professor of Medicine, EmeritusEmory University School of MedicineAtlanta, GA
Gary Walford, M.D.Associate Professor of MedicineJohns Hopkins Medical CenterBaltimore, MD
PCI Reporting System Analysis Workgroup
Members & ConsultantsGary Walford, M.D. (Chair)Associate Professor of Medicine Johns Hopkins Medical Center
Peter B. Berger, M.D.Co-Director, Heart and Vascular InstituteDirector, Cardiovascular Center for Clinical ResearchGeisinger Health SystemJeptha Curtis, M.D.Asst. Professor, Dept. of Internal Medicine Director, Outcomes Research & Evaluation Data Analytic CenterYale University School of MedicineEdward L. Hannan, Ph.D.Distinguished Professor Emeritus, Department of Health Policy, Management & BehaviorAssociate Dean EmeritusUniversity at Albany, School of Public HealthDavid R. Holmes, Jr., M.D.Professor of Medicine Consultant, Cardiovascular Diseases Mayo Clinic
Alice Jacobs, M.D.Director, Cardiac Catheterization Laboratory and Interventional CardiologyBoston Medical CenterCarlos Ruiz, MD, PhD Director, Division of Structural and Congenital Heart Disease Lenox Hill Heart and Vascular Institute of New YorkSamin K. Sharma, M.D.Director, Cardiac Catheterization LaboratoryMount Sinai Medical CenterNicholas Stamato, M.D.Director of Cardiology (previous)United Health Services HospitalsFerdinand Venditti, Jr., M.D.Vice Dean for Clinical Affairs Albany Medical Center
Anna D. Colello, Esq. Director of Regulatory ComplianceOffice of Quality and Patient Safety, NYSDOH
Kimberly S. Cozzens, M.A.Program Manager Cardiac Services Program
Erika Ihara, M.A.Clinical Data Coordinator Cardiac Services Program
Cynthia JohnsonPCI and Special Projects CoordinatorCardiac Services Program
Ye Zhong, M.D., M.S.Cardiac AnalystCardiac Services Program
Staff to PCI Analysis Workgroup – New York State Department of Health
TABLE OF CONTENTSMESSAGE FROM COMMISSIONER SHAH . . . . . . . . . . . . . . . . . . . . . . . . . . . . . . . . . . . . . . . . . . . . . . . . . . . . . 1
INTRODUCTION . . . . . . . . . . . . . . . . . . . . . . . . . . . . . . . . . . . . . . . . . . . . . . . . . . . . . . . . . . . . . . . . . . . . . . . . . . 3
DEPARTMENT OF HEALTH PROGRAM . . . . . . . . . . . . . . . . . . . . . . . . . . . . . . . . . . . . . . . . . . . . . . . . . . . . . . 3
PATIENT POPULATION . . . . . . . . . . . . . . . . . . . . . . . . . . . . . . . . . . . . . . . . . . . . . . . . . . . . . . . . . . . . . . . . . . . . 3
RISK ADJUSTMENT FOR ASSESSING PROVIDER PERFORMANCE . . . . . . . . . . . . . . . . . . . . . . . . . . . . . . . 4
Data Collection, Data Validation and Identifying In-Hospital/30-Day Deaths . . . . . . . . . . . . . . . . . . . . . . . . . . . . 5 Assessing Patient Risk . . . . . . . . . . . . . . . . . . . . . . . . . . . . . . . . . . . . . . . . . . . . . . . . . . . . . . . . . . . . . . . . . . . . . . . 5 Predicting Patient Mortality Rates for Providers . . . . . . . . . . . . . . . . . . . . . . . . . . . . . . . . . . . . . . . . . . . . . . . . . . . 5 Computing the Risk-Adjusted Mortality Rate. . . . . . . . . . . . . . . . . . . . . . . . . . . . . . . . . . . . . . . . . . . . . . . . . . . . . 5 Interpreting the Risk-Adjusted Mortality Rate . . . . . . . . . . . . . . . . . . . . . . . . . . . . . . . . . . . . . . . . . . . . . . . . . . . . 6 How this Initiative Contributes to Quality Improvement . . . . . . . . . . . . . . . . . . . . . . . . . . . . . . . . . . . . . . . . . . . . 6
2011 HOSPITAL RISK–ADJUSTED MORTALITY FOR PCI . . . . . . . . . . . . . . . . . . . . . . . . . . . . . . . . . . . . . . . 6
2009–2011 HOSPITAL DATA FOR PCI . . . . . . . . . . . . . . . . . . . . . . . . . . . . . . . . . . . . . . . . . . . . . . . . . . . . . . . . . 7
Table 1 In-Hospital/30-Day Observed, Expected and Risk-Adjusted Mortality Rates for PCI in New York State, 2011 Discharges . . . . . . . . . . . . . . . . . . . . . . . . . . . . . . . . . . . . . . . . . . . . . 9 Figure 1 In-Hospital/30-Day Risk-Adjusted Mortality Rates for PCI in New York State, 2011 Discharges (All Cases) . . . . . . . . . . . . . . . . . . . . . . . . . . . . . . . . . . . . . . . . . . . . . . . . . . . . . . . . 10 Figure 2 In-Hospital/30-Day Risk-Adjusted Mortality Rates for PCI in New York State, 2011 Discharges (Non-Emergency Cases) . . . . . . . . . . . . . . . . . . . . . . . . . . . . . . . . . . . . . . . . . . . . . . 11 Table 2 In-Hospital/30-Day Observed and Risk-Adjusted Mortality Rates for PCI in New York State, 2009–2011 Discharges . . . . . . . . . . . . . . . . . . . . . . . . . . . . . . . . . . . . . . . 12
2009–2011 HOSPITAL AND CARDIOLOGIST DATA FOR PCI . . . . . . . . . . . . . . . . . . . . . . . . . . . . . . . . . . . . 13
Table 3 Cardiologist In-Hospital/30-Day Observed, Expected and Risk-Adjusted Mortality Rates for PCI in New York State, 2009–2011 Discharges . . . . . . . . . . . . . . . . . . . . . . . . . . . . . . . . . . . . . . . 13 Table 4 Summary Information for Cardiologists Practicing at More Than One Hospital, 2009–2011 Discharges . . . . . . . . . . . . . . . . . . . . . . . . . . . . . . . . . . . . . . . . . . . . . . . . . . . . . . . . . . . . 29CRITERIA USED IN REPORTING SIGNIFICANT RISK FACTORS (2011) . . . . . . . . . . . . . . . . . . . . . . . . . 43
MEDICAL TERMINOLOGY . . . . . . . . . . . . . . . . . . . . . . . . . . . . . . . . . . . . . . . . . . . . . . . . . . . . . . . . . . . . . . . . 46
APPENDIx 1 2011 Risk Factors for PCI In-Hospital/30-Day Mortality (All Cases) . . . . . . . . . . . . . . . . . . . . . . . . 47
APPENDIx 2 2011 Risk Factors For In-Hospital/30-Day Mortality for Non-Emergency PCI . . . . . . . . . . . . . . . . 49
APPENDIx 3 2009–2011 Risk Factors for PCI In-Hospital/30-Day Mortality (All Cases) . . . . . . . . . . . . . . . . . . . 51
APPENDIx 4 2009–2011 Risk Factors for In-Hospital/30-Day Mortality for Non-Emergency PCI . . . . . . . . . . . . 53
APPENDIx 5 2009–2011 Risk Factors for In-Hospital/30-Day Mortality for Emergency PCI . . . . . . . . . . . . . . . . 54
NEW YORK STATE PERCUTANEOUS CORONARY INTERVENTION CENTERS . . . . . . . . . . . . . . . . . . . . 55

1
MESSAgE FROM COMMISSIONER SHAH
March 2014
I am pleased to provide the information contained in this booklet for use by health care providers, patients and families of patients who are considering treatment options for cardiovascular disease. The report provides data on risk factors associated with in-hospital/30-day mortality following percutaneous coronary intervention (PCI, also known as angioplasty) and lists hospital and physician-specific mortality rates. The analyses use a risk-adjustment process to account for pre-existing differences in patients’ health statuses. This report includes information on mortality occurring in the same hospitalization as PCI and that which occurs outside the hospital but within 30 days following PCI. We believe this to be an important quality indicator that will provide useful information to patients and providers.
The Percutaneous Coronary Interventions Reporting System (the data set upon which these analyses are based) represents the largest collection of data available in which all patients undergoing PCI have been reported. Hospitals and doctors involved in cardiac care have worked cooperatively with the New York State Department of Health and the New York State Cardiac Advisory Committee to compile accurate and meaningful data that can and have been used to enhance quality of care.
As they develop treatment plans, I encourage doctors to discuss this information with their patients and colleagues. While these statistics are an important tool in making informed health care choices, doctors and patients must make individual treatment plans together after careful consideration of all pertinent factors. It is also important to keep in mind that the information in this booklet does not include data after 2011. Important changes may have taken place in some hospitals since that time.
I would also ask that patients and physicians alike give careful consideration to the importance of healthy lifestyles for all those affected by heart disease. Controllable risk factors that contribute to a higher likelihood of developing coronary artery disease are high cholesterol levels, cigarette smoking, high blood pressure, obesity and lack of exercise. Limiting these risk factors will contribute to improved health for patients undergoing PCI and will help to minimize the development of new blockages in the coronary arteries.
I extend my appreciation to the providers in this State and to the Cardiac Advisory Committee for their efforts in developing and refining this remarkable system. The Department of Health will continue to work in partnership with hospitals and physicians to ensure high quality of care for patients with heart disease. We look forward to continuing to provide reports such as this and the Adult Cardiac Surgery Report on an annual basis. I applaud the continued high quality of care available from our New York State health care providers.
Nirav R. Shah, M.D., M.P.H. Commissioner of Health

2
3
Heart disease is the leading cause of death in New York State (NYS), and the most common form of heart disease is atherosclerotic coronary artery disease. Various treatments are recommended for patients with coronary artery disease. For some people, changes in lifestyle, such as dietary changes, not smoking and regular exercise, can result in great improvements in health. In other cases, medication prescribed for high blood pressure or other conditions can make a significant difference.
Sometimes, however, an interventional procedure is recommended. The two most common procedures performed on patients with coronary artery disease are percutaneous coronary intervention (PCI), also known as percutaneous transluminal coronary angioplasty (PTCA), and coronary artery bypass graft surgery (CABG).
During a PCI procedure, a catheter is threaded up to the site of the blockage in a coronary artery. In conjunction with the catheter, devices are used to open the blockage. In some cases, PCI is used as an emergency treatment for patients who are experiencing a heart attack or who may be in shock. Most cases, however, are not done on an emergency basis.
Those who have a PCI procedure are not cured of coronary artery disease; the disease can still occur in the treated blood vessels or other coronary arteries. In order to minimize new blockages, patients should continue to reduce their risk factors for heart disease.
The analyses contained in this report are based on the information collected on each of the 160,065 patients who underwent PCI in NYS hospitals and were discharged between December 1, 2008, and November 30, 2011. The analysis period for this report includes patients discharged in December 2008 but not those discharged in December 2011. This strategy allows for more timely report publication by eliminating the need to track patients for 30-day mortality into the following calendar year. Inclusion of cases from the previous December allows for meaningful comparison of 12-month volume as found in previous reports. The single year analysis for 2011 cases includes patients discharged from December 1, 2010 through November 30, 2011. Analyses of risk-adjusted mortality rates and associated risk factors for all cases, non-emergency cases (which represent the majority of procedures) and emergency cases are included.
DEPARTMENT OF HEALTH PROgRAMThe New York State Department of Health (Department of Health) has been studying the effects of patient and treatment characteristics on outcomes for patients with heart disease for over 20 years. Detailed statistical analyses of the information received from the study have been conducted under the guidance of the Cardiac Advisory Committee, a group of independent practicing cardiac surgeons, cardiologists and other professionals in related fields.
The results have been used to create a cardiac profile system that assesses the performance of hospitals and doctors over time, taking into account the severity of each individual patient’s pre-operative conditions. Coronary artery bypass surgery results have been assessed since 1989; PCI results were released in 1996 for the first time.
Designed to improve health in people with heart disease, this program is aimed at:• understandingthehealthrisksofpatientsthatadverselyaffecthowtheywillfareduringandafterPCI;• improvingtheresultsofdifferenttreatmentsofheartdisease;• improvingcardiaccare;and• providinginformationtohelppatientsmakebetterdecisionsabouttheirowncare.
PATIENT POPULATIONThis report is based on data for patients discharged between December 1, 2008, and November 30, 2011, provided by all 59 non-federal hospitals in NYS where PCI was performed. In total there were 160,065 PCI procedures performed during this time period. The annual number of PCI discharges was 54,882 in 2009, 54,653 in 2010, and 50,530 in 2011. For various reasons, some of these cases are excluded from analysis in this report. The reasons for exclusion and number of cases affected are described below.
At the time St. Vincent’s Hospital in Manhattan closed in April of 2010, the cardiac data validation process for 2009 cases was incomplete. Because the accuracy of risk factors, procedural information and outcomes for these cases cannot be verified, the 913 cases reported by this hospital with a discharge in 2009 are excluded from all analyses. In addition, 73 cases discharged in December 2008 are excluded from the hospital level reporting. No records were reported for this hospital in 2010.
INTRODUCTION
4
In addition, 199 records were excluded from the 2009–2011 data because they belong to patients residing outside the United States and these patients could not be followed after hospital discharge. There were an additional 32 cases excluded from analysis because each 30-day mortality can only be associated with a single PCI.
There were two additional groups of patients excluded based on clinical factors. There were 491 cases with pre-procedure cardiogenic shock excluded from analysis. Beginning with 2010 discharges, patients with hypoxic brain injury who expired under certain conditions were also excluded from analysis. This accounted for 68 cases excluded from analysis. The following two paragraphs provide further details on these clinical exclusion criteria.
Beginning with patients discharged in 2006, the Department of Health, with the advice of the Cardiac Advisory Committee, began a trial period of excluding any patients meeting the NYS Cardiac Data System definition of pre-operative cardiogenic shock from publicly released reports and analyses. Cardiogenic shock is a condition associated with severe hypotension (very low blood pressure); the technical definition used in this report can be found on Page 45. Patients in cardiogenic shock are extremely high-risk, but for some, PCI may be their best chance for survival. Furthermore, the magnitude of the risk is not always easily determined using registry data. These cases were excluded after careful deliberation and input from NYS providers and others in an effort to ensure that physicians could accept these cases where appropriate without concern over a detrimental impact on their reported outcomes. These 491 cases account for 0.31 percent of all PCI cases in the three years.
Patients were also excluded from analysis when very specific NYS Cardiac Data System criteria for hypoxic brain injury were met. Cases excluded for this reason all involved a pre-PCI cardiac arrest and acute MI (myocardial infarction, aka heart attack) with the patient in a coma-like neurological state prior to the PCI. In some cases, patients in this condition recover neurologically, although it may be days after the initial event before their neurological status improves. Treating the cardiac condition with PCI can be a lifesaving intervention. However, some patients will never regain consciousness because the injury to the brain caused by lack of oxygen at the time of their cardiac arrest is too severe. After consulting with physicians treating this condition, including the Cardiac Advisory Committee, the Department of Health determined that under certain circumstances these mortalities should be excluded from analyses. The specific criteria for exclusion under this policy can be found on Page 45.
NOTE ON HOSPITALS PERFORMINg PCI DURINg 2009–2011 PERIOD
In the 2009 - 2011 time period there were 18 hospitals approved to perform PCI without cardiac surgery on-site. Bronx Lebanon - Concourse Division performed PCI only on patients with an ST segment elevation myocardial infarction (a specific kind of heart attack also known as STEMI). The other 17 hospitals were approved to perform Primary or Elective PCI. Hospitals currently performing PCI without cardiac surgery on-site are noted on the final page of this report.
Several hospitals began performing PCI during the 2009-2011 time period. The hospital name and the month of the first PCI performed are listed below. Hospitals initially approved to perform PCI only on STEMI patients: St. Lukes Cornwall Hospital/Newburgh – February 2009; Bronx-Lebanon Hospital Center – Concourse Division – March 2009; Lutheran Medical Center – June 2009. Hospitals with initial approval not limited to STEMI patients: White Plains Hospital Center -- February 2010; Cayuga Medical Center at Ithaca – November 2010; St. Barnabas Hospital – June 2011.
RISK ADJUSTMENT FOR ASSESSINg PROVIDER PERFORMANCEHospital or physician performance is an important factor that directly relates to patient outcomes. Whether patients recover quickly, experience complications or die following a procedure is in part a result of the kind of medical care they receive. It is difficult, however, to compare outcomes among hospitals when assessing performance because different hospitals treat different types of patients. Hospitals with sicker patients may have higher rates of complications and death than other hospitals in the state. The following describes how the Department of Health adjusts for patient risk in assessing outcomes of care in different hospitals.
5
Data Collection, Data Validation and Identifying In-Hospital/30-Day DeathsAs part of the risk-adjustment process, hospitals in NYS where PCI is performed provide information to the Department of Health for each patient undergoing those procedures. Data concerning patients’ demographic and clinical characteristics are collected by hospitals’ cardiac catheterization laboratories. Approximately 40 of these characteristics (risk factors) are collected for each patient. Along with information about the hospital, physician and the patient’s status at discharge, these data are entered into a computer and sent to the Department of Health for analysis.
Data are verified through review of unusual reporting frequencies, cross-matching of PCI data with other Department of Health databases and a review of medical records for a selected sample of cases. These activities are extremely helpful in ensuring consistent interpretation of data elements across hospitals.
The analysis bases mortality on deaths occurring during the same hospital stay in which a patient underwent PCI and on deaths that occur after hospital discharge but within 30 days of PCI. In this report, an in-hospital death is defined as a patient who died subsequent to PCI during the same acute care admission or was discharged to hospice care and expired within 30 days. Data on deaths occurring after discharge from the hospital are made available by the Department of Health and its Bureau of Vital Statistics, the New York City Department of Health and Mental Hygiene, the Social Security Administration, and the National Death Index.
Assessing Patient RiskEach person who develops coronary artery disease has a unique health history. A cardiac profile system has been developed to evaluate the risk of treatment for each individual patient based on his or her history, weighing the important health facts for that person based on the experiences of thousands of patients who have undergone the same procedures in recent years. All important risk factors for each patient are combined to create his or her risk profile. For example, an 80-year-old patient with a heart attack in the past six hours has a very different risk profile than a 40-year-old who has never suffered a heart attack.
The statistical analyses conducted by the Department of Health consist of determining which of the risk factors collected are significantly related to in-hospital/30-day death and determining how to weight the significant risk factors to predict the chance each patient will have of dying in the hospital or after discharge but within 30 days of PCI, given his or her specific characteristics.
Predicting Patient Mortality Rates for ProvidersThe statistical methods used to predict mortality on the basis of the significant risk factors are tested to determine whether they are sufficiently accurate in predicting mortality for patients who are extremely ill prior to undergoing the procedure as well as for patients who are relatively healthy. These tests have confirmed that the models are reasonably accurate in predicting how patients of all different risk levels will fare when undergoing PCI.
The mortality rate for each hospital and cardiologist is also predicted using the statistical model. This is accomplished by adding the predicted probabilities of death for each of the provider’s patients and dividing by the number of patients. The resulting rate is an estimate of what the provider’s mortality rate would have been if the hospital’s performance was identical to the state performance. The percentage is called the predicted or expected mortality rate (EMR). A hospital's EMR is contrasted with its observed mortality rate (OMR), which is the number of PCI patients who died divided by the total number of PCI patients.
Computing the Risk-Adjusted Mortality RateThe risk-adjusted mortality rate (RAMR) represents the best estimate, based on the associated statistical model, of what the provider’s mortality rate would have been if the provider had a mix of patients identical to the statewide mix. Thus, the RAMR has, to the extent possible, ironed out differences among providers in patient severity of illness, since it arrives at a mortality rate for each provider based on an identical group of patients.
To get the RAMR, the OMR is first divided by the provider’s EMR. If the resulting ratio is larger than one, the provider has a higher mortality rate than expected on the basis of its patient mix; if it is smaller than one, the provider has a lower mortality rate than expected from its patient mix. The ratio is then multiplied by the overall statewide rate (0.97 percent in-hospital/30-day in 2011) to obtain the provider’s RAMR. There is no Statewide EMR or RAMR, because the statewide data is not risk-adjusted since it comprises the entire population of interest. The Statewide OMR (number of total cases divided by number of total deaths) serves as the basis for comparison for each hospital’s EMR and RAMR.
6
Interpreting the Risk-Adjusted Mortality Rate
If the RAMR is significantly lower than the statewide mortality rate, the hospital has a better performance than the state as a whole; if the RAMR is significantly higher than the statewide mortality rate, the hospital has a worse performance than the state as a whole.
The RAMR is used in this report as a measure of quality of care provided by hospitals and cardiologists. However, there are reasons that a provider’s RAMR may not be indicative of its true quality. For example, extreme outcome rates may occur due to chance alone. This is particularly true for low-volume providers, for whom very high or very low rates are more likely to occur than for high-volume providers. To prevent misinterpretation of differences caused by chance variation, expected ranges (confidence intervals) are included in the reported results.
Differences in hospital coding of risk factors could be an additional reason that a hospital’s RAMR may not be reflective of quality of care. The Department of Health monitors the quality of coded data by reviewing patients’ medical records to ascertain the presence of key risk factors. When significant coding problems are discovered, hospitals are required to correct these data and are subject to subsequent monitoring.
How This Initiative Contributes to Quality Improvement
One goal of the Department of Health and the Cardiac Advisory Committee is to improve the quality of care in relation to cardiac surgery and angioplasty in NYS. Providing the hospitals, cardiac surgeons (who perform cardiac surgery) and cardiologists (who perform PCI) in NYS with data about their own outcomes for these procedures allows them to examine the quality of their own care and to identify opportunities to improve that care.The data collected and analyzed in this program are reviewed by the Cardiac Advisory Committee, which assists with interpretation and advises the Department of Health regarding which hospitals and physicians may need special attention. Committee members have also conducted site visits to particular hospitals and have recommended that some hospitals obtain the expertise of outside consultants to design improvements for their programs.
2011 HOSPITAL RISK-ADJUSTED MORTALITY FOR PCI
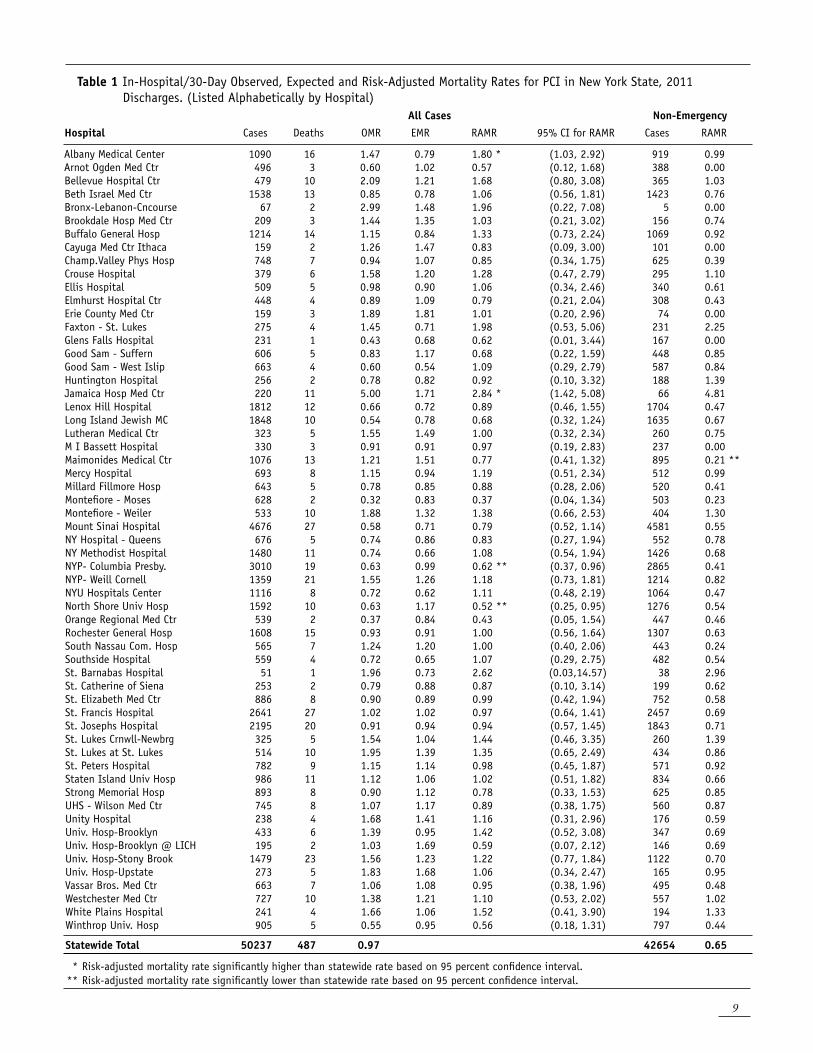
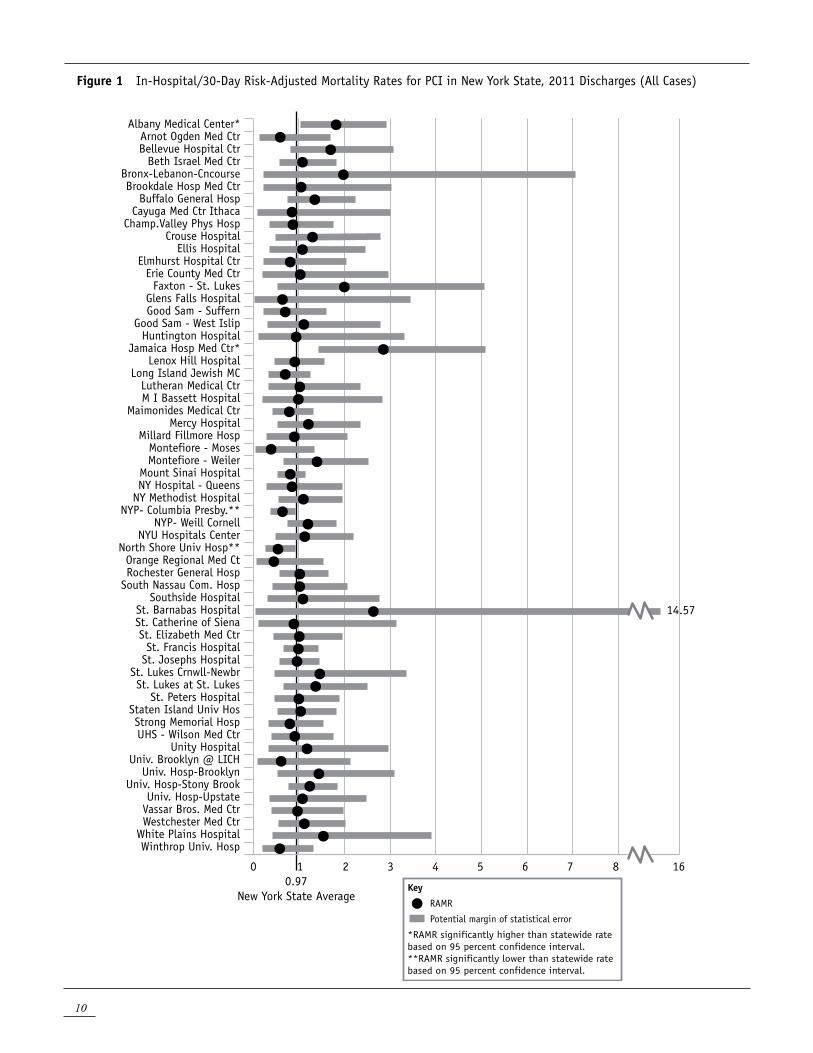
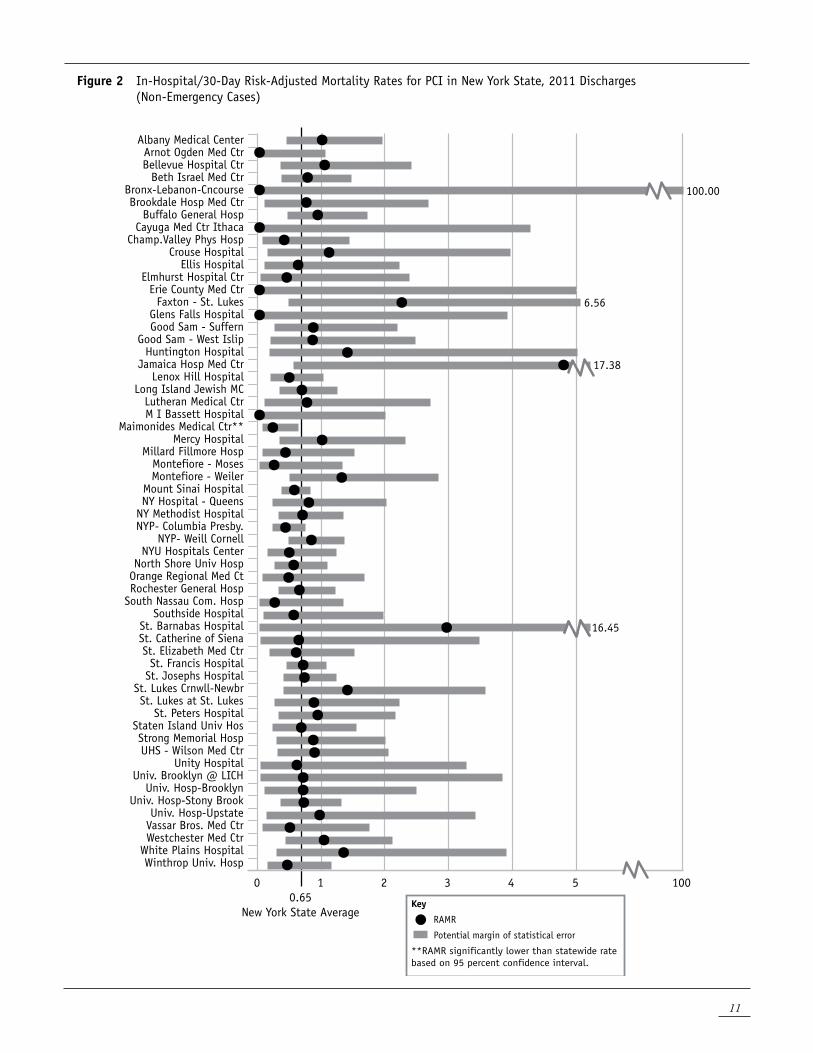
Table 1 and Figures 1 and 2 present the PCI mortality results for the 59 hospitals performing PCI in NYS in 2011 for which data could be analyzed. The table contains, for each hospital, the number of PCIs resulting in 2011 discharges, the number of in-hospital/30-day deaths, the OMR, the EMR based on the statistical model presented in Appendix 1, the RAMR and a 95 percent confidence interval for the RAMR. It also contains each hospital’s volume of cases and RAMR for non-emergency patients. Emergency patients are defined to be patients in a state of hemodynamic instability (typically associated with very low blood pressure), or patients who experienced a heart attack within 24 hours prior to undergoing PCI. The hospital RAMRs for non-emergency PCI patients are provided because many studies are confined to this group of patients and because these patients comprise the majority of all PCI patients (84.91 percent in 2011). The overall in-hospital/30-day OMR for the 50,237 PCIs included in this 2011 analysis was 0.97 percent. Observed mortality rates ranged from 0.32 percent to 5.00 percent. The range in EMRs, which measure patient severity of illness, was between 0.60 percent and 1.81 percent. The RAMRs, which measure hospital performance, range from 0.37 percent to 2.84 percent. Based on confidence intervals for RAMRs, two hospitals (Albany Medical Center and Jamaica Hospital Medical Center) had RAMRs that were significantly higher than the statewide average. Two hospitals (NY Presbyterian @ Columbia Presbyterian Medical Center in Manhattan and North Shore University Hospital in Manhasset) had RAMRs that were significantly lower than the statewide average.The last column of Table 1 presents the hospital RAMRs for non-emergency cases (based on the statistical model presented in Appendix 2). As presented in the last row, the statewide in-hospital/30-day mortality rate for non-emergency cases is 0.65 percent. The range of RAMRs was from 0.00 percent to 4.81 percent. One hospital (Maimonides Medical Center in Brooklyn) had a RAMR that was significantly lower than the statewide rate. No hospitals had RAMRs that were significantly higher than the statewide rate. Figures 1 and 2 provide a visual representation of the data displayed in Table 1. For each hospital, the black dot represents the RAMR and the gray bar represents the confidence interval, or potential statistical error, for the RAMR. The black vertical line is the NYS in-hospital/30-day mortality rate. For any hospital where the gray bar crosses the statewide average line, the RAMR is not statistically different from the state as a whole. Hospitals that are statistical outliers will have gray bars (confidence intervals) that are either entirely above or entirely below the line for the statewide rate.
7
Since the 2011 PCI analysis is based on in-hospital/30-day mortality and excludes shock cases and hypoxic brain injury deaths, the associated mortality rates cannot be compared directly to some previous NYS publications which are based on only in-hospital mortality and include all cases.The observed in-hospital mortality rate (not shown in Table 1) for 2011 PCI discharges was 0.56 percent for the 50,237 patients included in Table 1. For the non-emergency analysis, there were 42,654 patients with an in-hospital mortality rate of 0.28 percent.
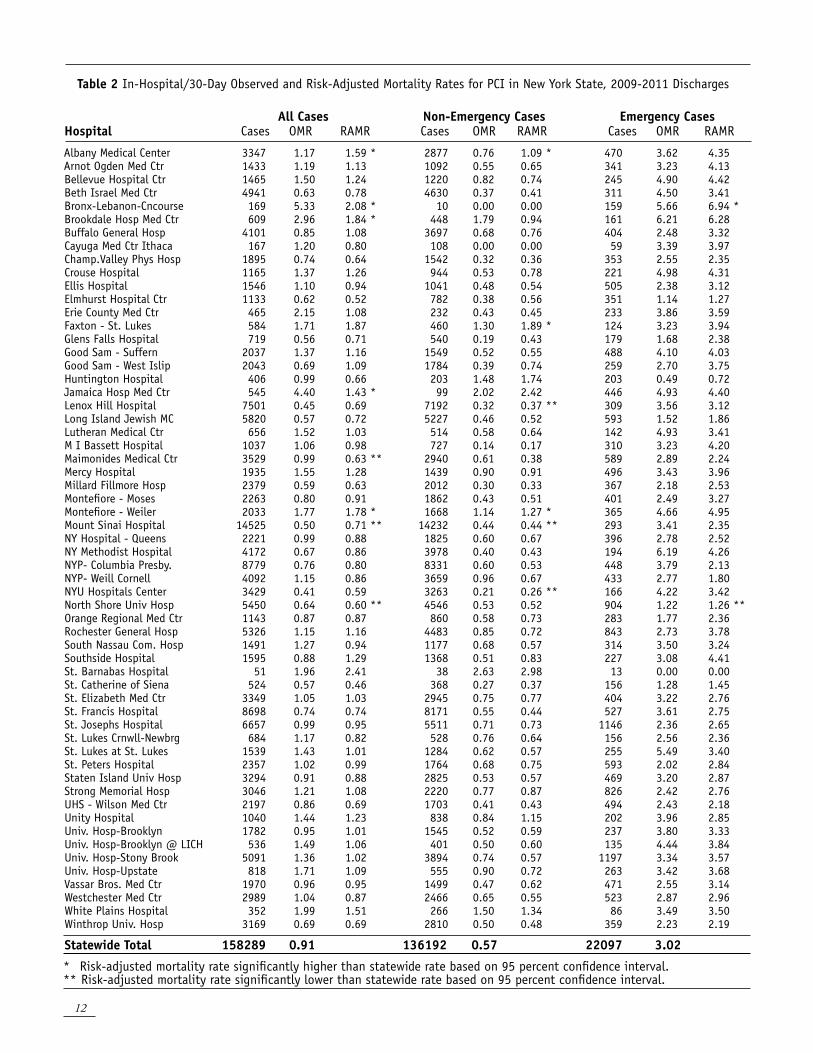
2009-2011 HOSPITAL DATA FOR PCI
Table 2 provides the number of PCIs, the in-hospital/30-day OMR and RAMR for 2009-2011 for each of three types of PCI patients in the 59 hospitals performing PCI during the time period. The three types of patients are: all patients, non-emergency patients and emergency patients (patients in a state of hemodynamic instability, typically associated with very low blood pressure, or patients who experienced a heart attack within 24 hours prior to undergoing PCI). The statistical models that are the basis for all patients, non-emergency patients and emergency patients in 2009-2011 are presented in Appendices 3-5, respectively. As indicated in Table 2, the three-year observed in-hospital/30-day mortality rates for all PCI patients ranged from 0.00 percent to 5.33 percent, and the RAMRs ranged from 0.46 percent to 2.41 percent. Five hospitals (Albany Medical Center, Bronx Lebanon – Concourse Division, Brookdale Hospital Medical Center, Jamaica Hospital Medical Center, and Montefiore Medical Center Weiler Hospital in the Bronx) had RAMRs that were significantly higher than the statewide rate. Three hospitals (Maimonides Medical Center in Brooklyn, Mount Sinai Hospital in Manhattan, and North Shore University Hospital in Manhasset) had RAMRs that were significantly lower than the statewide rate. It should be noted that hospitals are more likely to have results that show a statistically significant difference from the statewide rate when three years of data are used than when one year of data is used because the three-year volumes are higher.Table 2 also presents the 3-year in-hospital/30-day RAMRs for non-emergency cases based on the model in Appendix 4. Non-emergency cases comprise 89.43 percent of cases for the period 2009-2011. The statewide in-hospital/30-day mortality rate for the 136,192 non-emergency cases during the 3-year period was 0.57 percent. Observed mortality rates for this group of patients ranged from 0.00 percent to 2.63 percent and the RAMRs ranged from 0.00 to 2.98 percent. Three hospitals (Albany Medical Center, Faxton - St. Luke’s Healthcare in Utica, and Montefiore Medical Center Weiler Hospital in the Bronx) had RAMRs that were significantly higher than the statewide rate. Three hospitals (Lenox Hill Hospital in Manhattan, Mount Sinai Hospital in Manhattan, and NYU Hospitals Center in Manhattan) had RAMRs that were significantly lower than the statewide average for non-emergency cases.
The last three columns in Table 2 present data on emergency cases based on the model in Appendix 5. Emergency cases represented 14.51 percent of cases for the period 2009-2011. The statewide in-hospital/30-day mortality rate for the 22,097 emergency PCI cases during the 3-year period was 3.02 percent. Observed mortality rates for this group ranged from 0.00 percent to 6.21 percent and the RAMRs ranged from 0.00 percent to 6.94 percent. One hospital (Bronx Lebanon Concourse Division) had a RAMR that was significantly above the statewide average for emergency cases. One hospital (North Shore University Hospital in Manhasset) had a RAMR that was significantly below the statewide average for emergency cases.
The observed in-hospital mortality rate (not shown in Table 2) for all 158,289 cases included in Table 2 was 0.54 percent. The in-hospital mortality rate was 0.25 percent for the 136,192 non-emergency cases and 2.32 percent for the 22,097 emergency cases. As stated above, all cases with shock and hypoxic brain injury mortalities in 2010 and 2011 are excluded from these analyses. Therefore, volume and mortality rates for the all cases and emergency cases analyses are not directly comparable to some previously published by the Department of Health.
8
Definitions of key terms are as follows:
The observed mortality rate (OMR) is the observed number of deaths divided by the total number of cases.
The expected mortality rate (EMR) is the sum of the predicted probabilities of death for all patients divided by the total number of patients.
The risk-adjusted mortality rate (RAMR) is the best estimate, based on the statistical model, of what the provider’s mortality rate would have been if the provider had a mix of patients similar to the statewide mix. It is obtained by first dividing the OMR by the EMR, and then multiplying that quotient by the statewide mortality rate (0.97 percent in-hospital/30-day mortality for all PCI patients discharged in 2011).
Confidence intervals indicate which hospitals had significantly more or fewer deaths than expected given the risk factors of their patients. Hospitals with significantly higher rates than expected after adjusting for risk are those with confidence intervals entirely above the statewide rate. Hospitals with significantly lower rates than expected, given the severity of illness of their patients before the PCI, have confidence intervals entirely below the statewide rate.
9
Table 1 In-Hospital/30-Day Observed, Expected and Risk-Adjusted Mortality Rates for PCI in New York State, 2011 Discharges. (Listed Alphabetically by Hospital)
All Cases Non-EmergencyHospital Cases Deaths OMR EMR RAMR 95% CI for RAMR Cases RAMR
Albany Medical Center 1090 16 1.47 0.79 1.80 * (1.03, 2.92) 919 0.99Arnot Ogden Med Ctr 496 3 0.60 1.02 0.57 (0.12, 1.68) 388 0.00Bellevue Hospital Ctr 479 10 2.09 1.21 1.68 (0.80, 3.08) 365 1.03Beth Israel Med Ctr 1538 13 0.85 0.78 1.06 (0.56, 1.81) 1423 0.76Bronx-Lebanon-Cncourse 67 2 2.99 1.48 1.96 (0.22, 7.08) 5 0.00Brookdale Hosp Med Ctr 209 3 1.44 1.35 1.03 (0.21, 3.02) 156 0.74Buffalo General Hosp 1214 14 1.15 0.84 1.33 (0.73, 2.24) 1069 0.92Cayuga Med Ctr Ithaca 159 2 1.26 1.47 0.83 (0.09, 3.00) 101 0.00Champ.Valley Phys Hosp 748 7 0.94 1.07 0.85 (0.34, 1.75) 625 0.39Crouse Hospital 379 6 1.58 1.20 1.28 (0.47, 2.79) 295 1.10Ellis Hospital 509 5 0.98 0.90 1.06 (0.34, 2.46) 340 0.61Elmhurst Hospital Ctr 448 4 0.89 1.09 0.79 (0.21, 2.04) 308 0.43Erie County Med Ctr 159 3 1.89 1.81 1.01 (0.20, 2.96) 74 0.00Faxton - St. Lukes 275 4 1.45 0.71 1.98 (0.53, 5.06) 231 2.25Glens Falls Hospital 231 1 0.43 0.68 0.62 (0.01, 3.44) 167 0.00Good Sam - Suffern 606 5 0.83 1.17 0.68 (0.22, 1.59) 448 0.85Good Sam - West Islip 663 4 0.60 0.54 1.09 (0.29, 2.79) 587 0.84Huntington Hospital 256 2 0.78 0.82 0.92 (0.10, 3.32) 188 1.39Jamaica Hosp Med Ctr 220 11 5.00 1.71 2.84 * (1.42, 5.08) 66 4.81Lenox Hill Hospital 1812 12 0.66 0.72 0.89 (0.46, 1.55) 1704 0.47Long Island Jewish MC 1848 10 0.54 0.78 0.68 (0.32, 1.24) 1635 0.67Lutheran Medical Ctr 323 5 1.55 1.49 1.00 (0.32, 2.34) 260 0.75M I Bassett Hospital 330 3 0.91 0.91 0.97 (0.19, 2.83) 237 0.00Maimonides Medical Ctr 1076 13 1.21 1.51 0.77 (0.41, 1.32) 895 0.21 **Mercy Hospital 693 8 1.15 0.94 1.19 (0.51, 2.34) 512 0.99Millard Fillmore Hosp 643 5 0.78 0.85 0.88 (0.28, 2.06) 520 0.41Montefiore - Moses 628 2 0.32 0.83 0.37 (0.04, 1.34) 503 0.23Montefiore - Weiler 533 10 1.88 1.32 1.38 (0.66, 2.53) 404 1.30Mount Sinai Hospital 4676 27 0.58 0.71 0.79 (0.52, 1.14) 4581 0.55NY Hospital - Queens 676 5 0.74 0.86 0.83 (0.27, 1.94) 552 0.78NY Methodist Hospital 1480 11 0.74 0.66 1.08 (0.54, 1.94) 1426 0.68NYP- Columbia Presby. 3010 19 0.63 0.99 0.62 ** (0.37, 0.96) 2865 0.41NYP- Weill Cornell 1359 21 1.55 1.26 1.18 (0.73, 1.81) 1214 0.82NYU Hospitals Center 1116 8 0.72 0.62 1.11 (0.48, 2.19) 1064 0.47North Shore Univ Hosp 1592 10 0.63 1.17 0.52 ** (0.25, 0.95) 1276 0.54Orange Regional Med Ctr 539 2 0.37 0.84 0.43 (0.05, 1.54) 447 0.46Rochester General Hosp 1608 15 0.93 0.91 1.00 (0.56, 1.64) 1307 0.63South Nassau Com. Hosp 565 7 1.24 1.20 1.00 (0.40, 2.06) 443 0.24Southside Hospital 559 4 0.72 0.65 1.07 (0.29, 2.75) 482 0.54St. Barnabas Hospital 51 1 1.96 0.73 2.62 (0.03,14.57) 38 2.96St. Catherine of Siena 253 2 0.79 0.88 0.87 (0.10, 3.14) 199 0.62St. Elizabeth Med Ctr 886 8 0.90 0.89 0.99 (0.42, 1.94) 752 0.58St. Francis Hospital 2641 27 1.02 1.02 0.97 (0.64, 1.41) 2457 0.69St. Josephs Hospital 2195 20 0.91 0.94 0.94 (0.57, 1.45) 1843 0.71St. Lukes Crnwll-Newbrg 325 5 1.54 1.04 1.44 (0.46, 3.35) 260 1.39St. Lukes at St. Lukes 514 10 1.95 1.39 1.35 (0.65, 2.49) 434 0.86St. Peters Hospital 782 9 1.15 1.14 0.98 (0.45, 1.87) 571 0.92Staten Island Univ Hosp 986 11 1.12 1.06 1.02 (0.51, 1.82) 834 0.66Strong Memorial Hosp 893 8 0.90 1.12 0.78 (0.33, 1.53) 625 0.85UHS - Wilson Med Ctr 745 8 1.07 1.17 0.89 (0.38, 1.75) 560 0.87Unity Hospital 238 4 1.68 1.41 1.16 (0.31, 2.96) 176 0.59Univ. Hosp-Brooklyn 433 6 1.39 0.95 1.42 (0.52, 3.08) 347 0.69Univ. Hosp-Brooklyn @ LICH 195 2 1.03 1.69 0.59 (0.07, 2.12) 146 0.69Univ. Hosp-Stony Brook 1479 23 1.56 1.23 1.22 (0.77, 1.84) 1122 0.70Univ. Hosp-Upstate 273 5 1.83 1.68 1.06 (0.34, 2.47) 165 0.95Vassar Bros. Med Ctr 663 7 1.06 1.08 0.95 (0.38, 1.96) 495 0.48Westchester Med Ctr 727 10 1.38 1.21 1.10 (0.53, 2.02) 557 1.02White Plains Hospital 241 4 1.66 1.06 1.52 (0.41, 3.90) 194 1.33Winthrop Univ. Hosp 905 5 0.55 0.95 0.56 (0.18, 1.31) 797 0.44
Statewide Total 50237 487 0.97 42654 0.65
* Risk-adjusted mortality rate significantly higher than statewide rate based on 95 percent confidence interval. ** Risk-adjusted mortality rate significantly lower than statewide rate based on 95 percent confidence interval.
10
Figure 1 In-Hospital/30-Day Risk-Adjusted Mortality Rates for PCI in New York State, 2011 Discharges (All Cases)
0.97New York State Average
Key
RAMR
Potential margin of statistical error
*RAMR significantly higher than statewide rate based on 95 percent confidence interval.** RAMR significantly lower than statewide rate based on 95 percent confidence interval.
0 1 2 3 4 5 6 7 8 16
14.57
Albany Medical Center*Arnot Ogden Med CtrBellevue Hospital Ctr
Beth Israel Med CtrBronx-Lebanon-CncourseBrookdale Hosp Med Ctr
Buffalo General HospCayuga Med Ctr Ithaca
Champ.Valley Phys HospCrouse Hospital
Ellis HospitalElmhurst Hospital Ctr
Erie County Med CtrFaxton - St. Lukes
Glens Falls HospitalGood Sam - Suffern
Good Sam - West IslipHuntington Hospital
Jamaica Hosp Med Ctr*Lenox Hill Hospital
Long Island Jewish MCLutheran Medical CtrM I Bassett Hospital
Maimonides Medical CtrMercy Hospital
Millard Fillmore HospMontefiore - MosesMontefiore - Weiler
Mount Sinai HospitalNY Hospital - Queens
NY Methodist HospitalNYP- Columbia Presby.**
NYP- Weill CornellNYU Hospitals Center
North Shore Univ Hosp**Orange Regional Med CtRochester General Hosp
South Nassau Com. HospSouthside Hospital
St. Barnabas HospitalSt. Catherine of SienaSt. Elizabeth Med Ctr
St. Francis HospitalSt. Josephs Hospital
St. Lukes Crnwll-NewbrSt. Lukes at St. Lukes
St. Peters HospitalStaten Island Univ HosStrong Memorial HospUHS - Wilson Med Ctr
Unity HospitalUniv. Brooklyn @ LICH
Univ. Hosp-BrooklynUniv. Hosp-Stony Brook
Univ. Hosp-UpstateVassar Bros. Med CtrWestchester Med Ctr
White Plains HospitalWinthrop Univ. Hosp
11
Figure 2 In-Hospital/30-Day Risk-Adjusted Mortality Rates for PCI in New York State, 2011 Discharges (Non-Emergency Cases)
0.65New York State Average
Key
RAMR
Potential margin of statistical error
** RAMR significantly lower than statewide rate based on 95 percent confidence interval.
0 1 2 3 4 5 100
16.45
17.38
100.00
6.56
Albany Medical CenterArnot Ogden Med CtrBellevue Hospital Ctr
Beth Israel Med CtrBronx-Lebanon-CncourseBrookdale Hosp Med Ctr
Buffalo General HospCayuga Med Ctr Ithaca
Champ.Valley Phys HospCrouse Hospital
Ellis HospitalElmhurst Hospital Ctr
Erie County Med CtrFaxton - St. Lukes
Glens Falls HospitalGood Sam - Suffern
Good Sam - West IslipHuntington Hospital
Jamaica Hosp Med CtrLenox Hill Hospital
Long Island Jewish MCLutheran Medical CtrM I Bassett Hospital
Maimonides Medical Ctr**Mercy Hospital
Millard Fillmore HospMontefiore - MosesMontefiore - Weiler
Mount Sinai HospitalNY Hospital - Queens
NY Methodist HospitalNYP- Columbia Presby.
NYP- Weill CornellNYU Hospitals Center
North Shore Univ HospOrange Regional Med CtRochester General Hosp
South Nassau Com. HospSouthside Hospital
St. Barnabas HospitalSt. Catherine of SienaSt. Elizabeth Med Ctr
St. Francis HospitalSt. Josephs Hospital
St. Lukes Crnwll-NewbrSt. Lukes at St. Lukes
St. Peters HospitalStaten Island Univ HosStrong Memorial HospUHS - Wilson Med Ctr
Unity HospitalUniv. Brooklyn @ LICH
Univ. Hosp-BrooklynUniv. Hosp-Stony Brook
Univ. Hosp-UpstateVassar Bros. Med CtrWestchester Med Ctr
White Plains HospitalWinthrop Univ. Hosp
12
Table 2 In-Hospital/30-Day Observed and Risk-Adjusted Mortality Rates for PCI in New York State, 2009-2011 Discharges
All Cases Non-Emergency Cases Emergency CasesHospital Cases OMR RAMR Cases OMR RAMR Cases OMR RAMR
Albany Medical Center 3347 1.17 1.59 * 2877 0.76 1.09 * 470 3.62 4.35Arnot Ogden Med Ctr 1433 1.19 1.13 1092 0.55 0.65 341 3.23 4.13Bellevue Hospital Ctr 1465 1.50 1.24 1220 0.82 0.74 245 4.90 4.42Beth Israel Med Ctr 4941 0.63 0.78 4630 0.37 0.41 311 4.50 3.41Bronx-Lebanon-Cncourse 169 5.33 2.08 * 10 0.00 0.00 159 5.66 6.94 *Brookdale Hosp Med Ctr 609 2.96 1.84 * 448 1.79 0.94 161 6.21 6.28Buffalo General Hosp 4101 0.85 1.08 3697 0.68 0.76 404 2.48 3.32Cayuga Med Ctr Ithaca 167 1.20 0.80 108 0.00 0.00 59 3.39 3.97Champ.Valley Phys Hosp 1895 0.74 0.64 1542 0.32 0.36 353 2.55 2.35Crouse Hospital 1165 1.37 1.26 944 0.53 0.78 221 4.98 4.31Ellis Hospital 1546 1.10 0.94 1041 0.48 0.54 505 2.38 3.12Elmhurst Hospital Ctr 1133 0.62 0.52 782 0.38 0.56 351 1.14 1.27Erie County Med Ctr 465 2.15 1.08 232 0.43 0.45 233 3.86 3.59Faxton - St. Lukes 584 1.71 1.87 460 1.30 1.89 * 124 3.23 3.94Glens Falls Hospital 719 0.56 0.71 540 0.19 0.43 179 1.68 2.38Good Sam - Suffern 2037 1.37 1.16 1549 0.52 0.55 488 4.10 4.03Good Sam - West Islip 2043 0.69 1.09 1784 0.39 0.74 259 2.70 3.75Huntington Hospital 406 0.99 0.66 203 1.48 1.74 203 0.49 0.72Jamaica Hosp Med Ctr 545 4.40 1.43 * 99 2.02 2.42 446 4.93 4.40Lenox Hill Hospital 7501 0.45 0.69 7192 0.32 0.37 ** 309 3.56 3.12Long Island Jewish MC 5820 0.57 0.72 5227 0.46 0.52 593 1.52 1.86Lutheran Medical Ctr 656 1.52 1.03 514 0.58 0.64 142 4.93 3.41M I Bassett Hospital 1037 1.06 0.98 727 0.14 0.17 310 3.23 4.20Maimonides Medical Ctr 3529 0.99 0.63 ** 2940 0.61 0.38 589 2.89 2.24Mercy Hospital 1935 1.55 1.28 1439 0.90 0.91 496 3.43 3.96Millard Fillmore Hosp 2379 0.59 0.63 2012 0.30 0.33 367 2.18 2.53Montefiore - Moses 2263 0.80 0.91 1862 0.43 0.51 401 2.49 3.27Montefiore - Weiler 2033 1.77 1.78 * 1668 1.14 1.27 * 365 4.66 4.95Mount Sinai Hospital 14525 0.50 0.71 ** 14232 0.44 0.44 ** 293 3.41 2.35NY Hospital - Queens 2221 0.99 0.88 1825 0.60 0.67 396 2.78 2.52NY Methodist Hospital 4172 0.67 0.86 3978 0.40 0.43 194 6.19 4.26NYP- Columbia Presby. 8779 0.76 0.80 8331 0.60 0.53 448 3.79 2.13NYP- Weill Cornell 4092 1.15 0.86 3659 0.96 0.67 433 2.77 1.80NYU Hospitals Center 3429 0.41 0.59 3263 0.21 0.26 ** 166 4.22 3.42North Shore Univ Hosp 5450 0.64 0.60 ** 4546 0.53 0.52 904 1.22 1.26 **Orange Regional Med Ctr 1143 0.87 0.87 860 0.58 0.73 283 1.77 2.36Rochester General Hosp 5326 1.15 1.16 4483 0.85 0.72 843 2.73 3.78South Nassau Com. Hosp 1491 1.27 0.94 1177 0.68 0.57 314 3.50 3.24Southside Hospital 1595 0.88 1.29 1368 0.51 0.83 227 3.08 4.41St. Barnabas Hospital 51 1.96 2.41 38 2.63 2.98 13 0.00 0.00St. Catherine of Siena 524 0.57 0.46 368 0.27 0.37 156 1.28 1.45St. Elizabeth Med Ctr 3349 1.05 1.03 2945 0.75 0.77 404 3.22 2.76St. Francis Hospital 8698 0.74 0.74 8171 0.55 0.44 527 3.61 2.75St. Josephs Hospital 6657 0.99 0.95 5511 0.71 0.73 1146 2.36 2.65St. Lukes Crnwll-Newbrg 684 1.17 0.82 528 0.76 0.64 156 2.56 2.36St. Lukes at St. Lukes 1539 1.43 1.01 1284 0.62 0.57 255 5.49 3.40St. Peters Hospital 2357 1.02 0.99 1764 0.68 0.75 593 2.02 2.84Staten Island Univ Hosp 3294 0.91 0.88 2825 0.53 0.57 469 3.20 2.87Strong Memorial Hosp 3046 1.21 1.08 2220 0.77 0.87 826 2.42 2.76UHS - Wilson Med Ctr 2197 0.86 0.69 1703 0.41 0.43 494 2.43 2.18Unity Hospital 1040 1.44 1.23 838 0.84 1.15 202 3.96 2.85Univ. Hosp-Brooklyn 1782 0.95 1.01 1545 0.52 0.59 237 3.80 3.33Univ. Hosp-Brooklyn @ LICH 536 1.49 1.06 401 0.50 0.60 135 4.44 3.84Univ. Hosp-Stony Brook 5091 1.36 1.02 3894 0.74 0.57 1197 3.34 3.57Univ. Hosp-Upstate 818 1.71 1.09 555 0.90 0.72 263 3.42 3.68Vassar Bros. Med Ctr 1970 0.96 0.95 1499 0.47 0.62 471 2.55 3.14Westchester Med Ctr 2989 1.04 0.87 2466 0.65 0.55 523 2.87 2.96White Plains Hospital 352 1.99 1.51 266 1.50 1.34 86 3.49 3.50Winthrop Univ. Hosp 3169 0.69 0.69 2810 0.50 0.48 359 2.23 2.19
Statewide Total 158289 0.91 136192 0.57 22097 3.02
* Risk-adjusted mortality rate significantly higher than statewide rate based on 95 percent confidence interval.** Risk-adjusted mortality rate significantly lower than statewide rate based on 95 percent confidence interval.
13
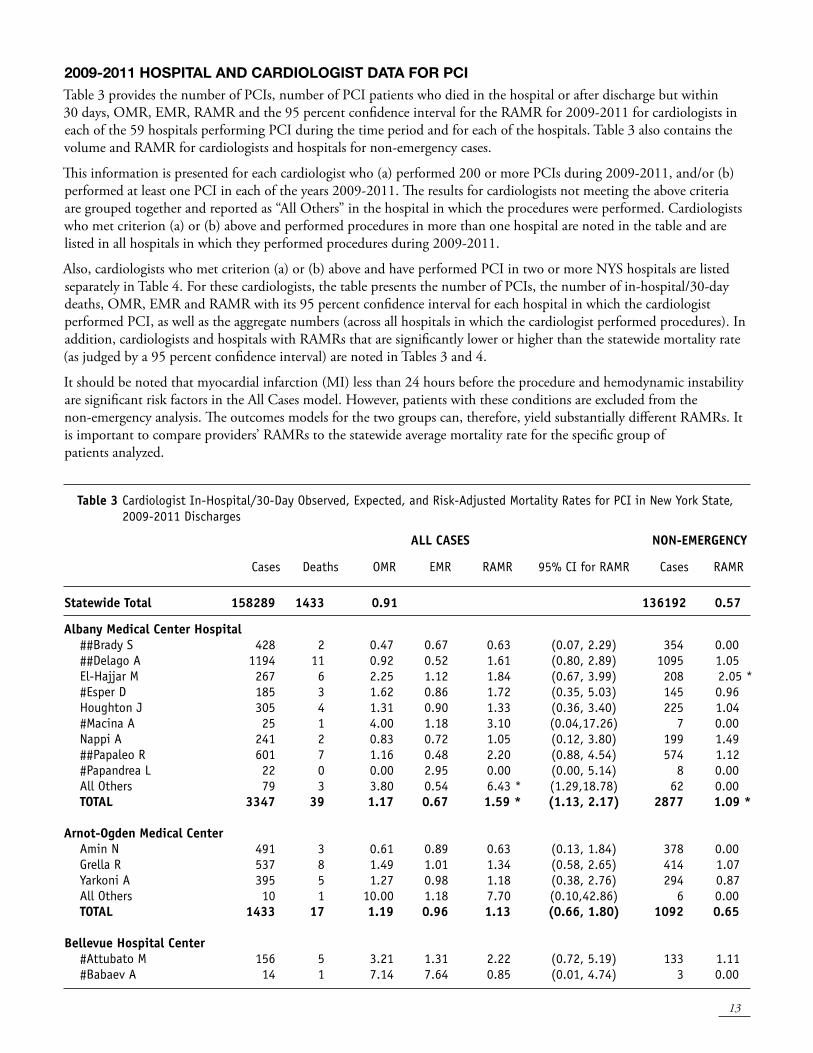
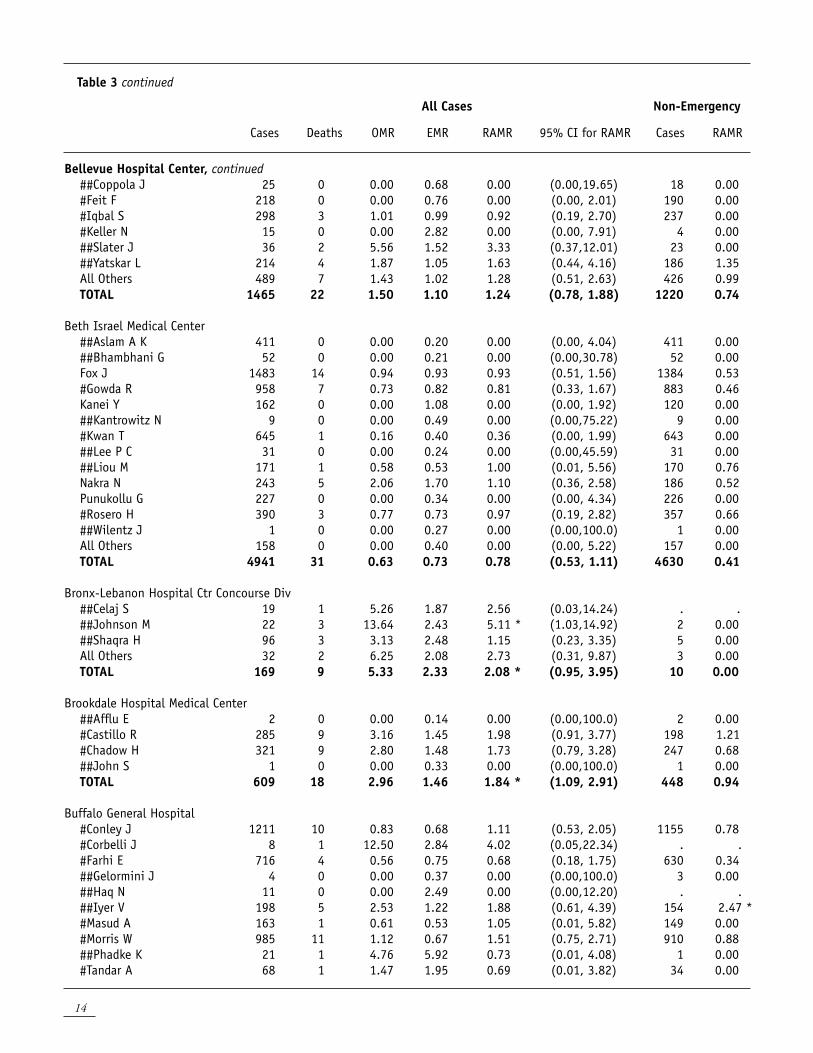
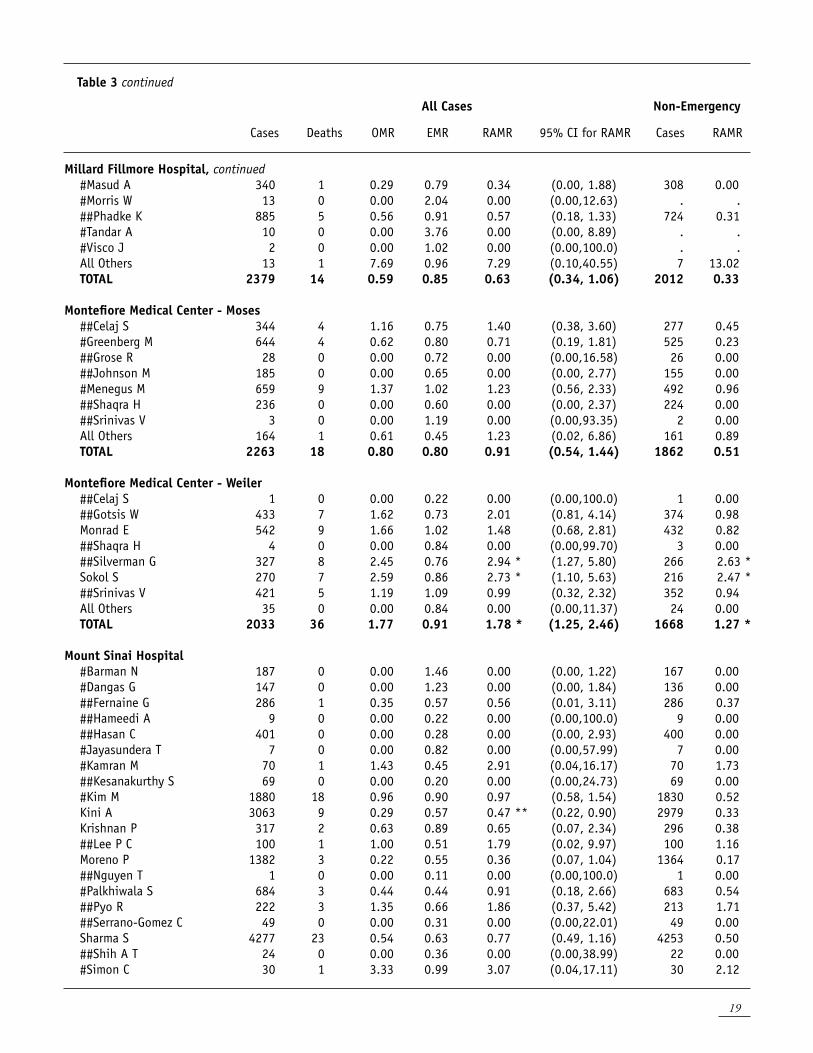
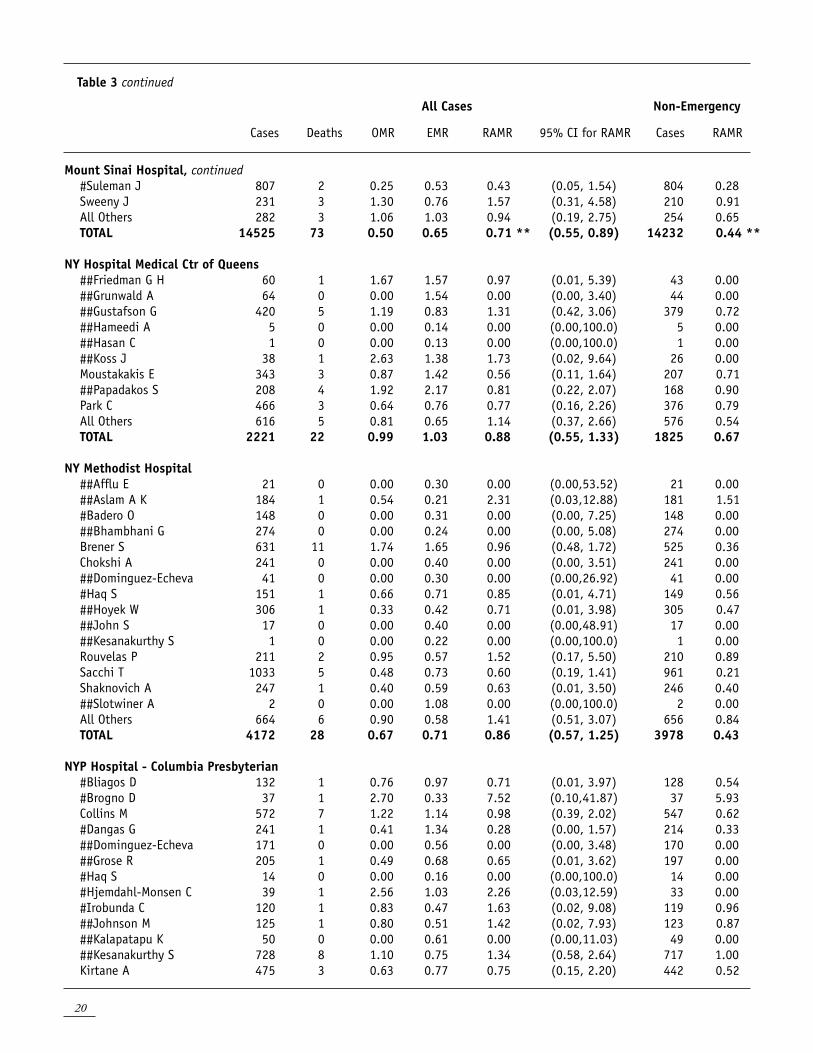
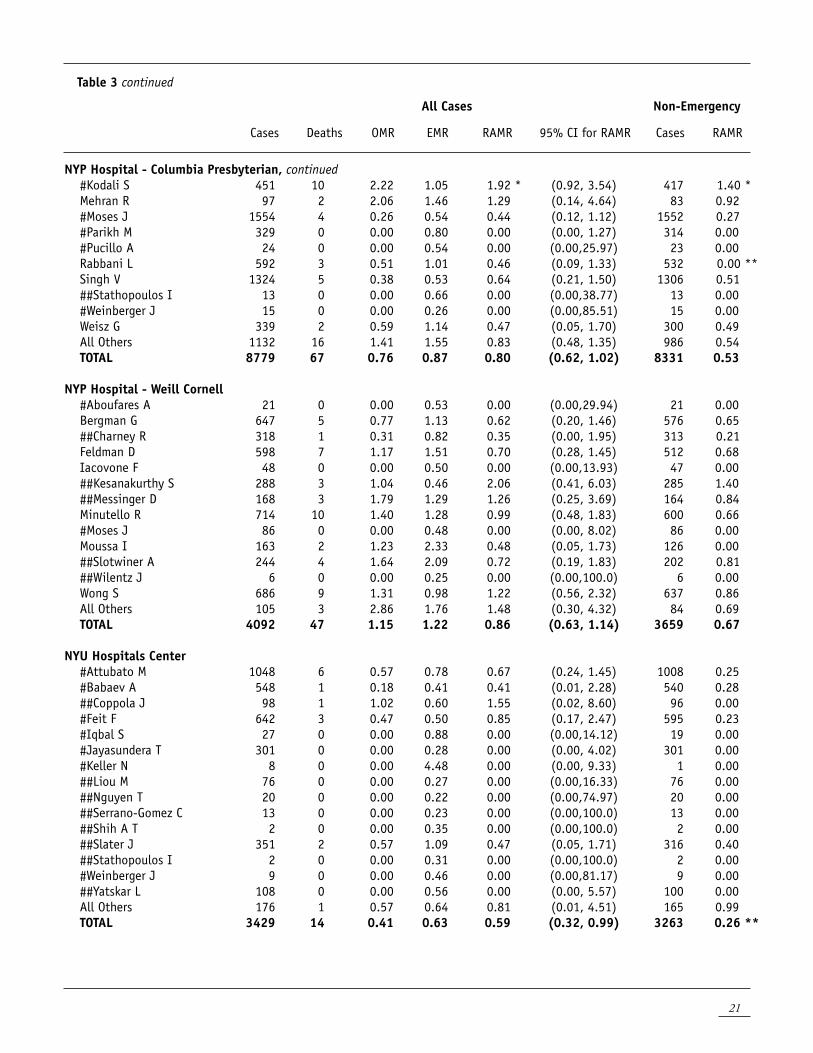
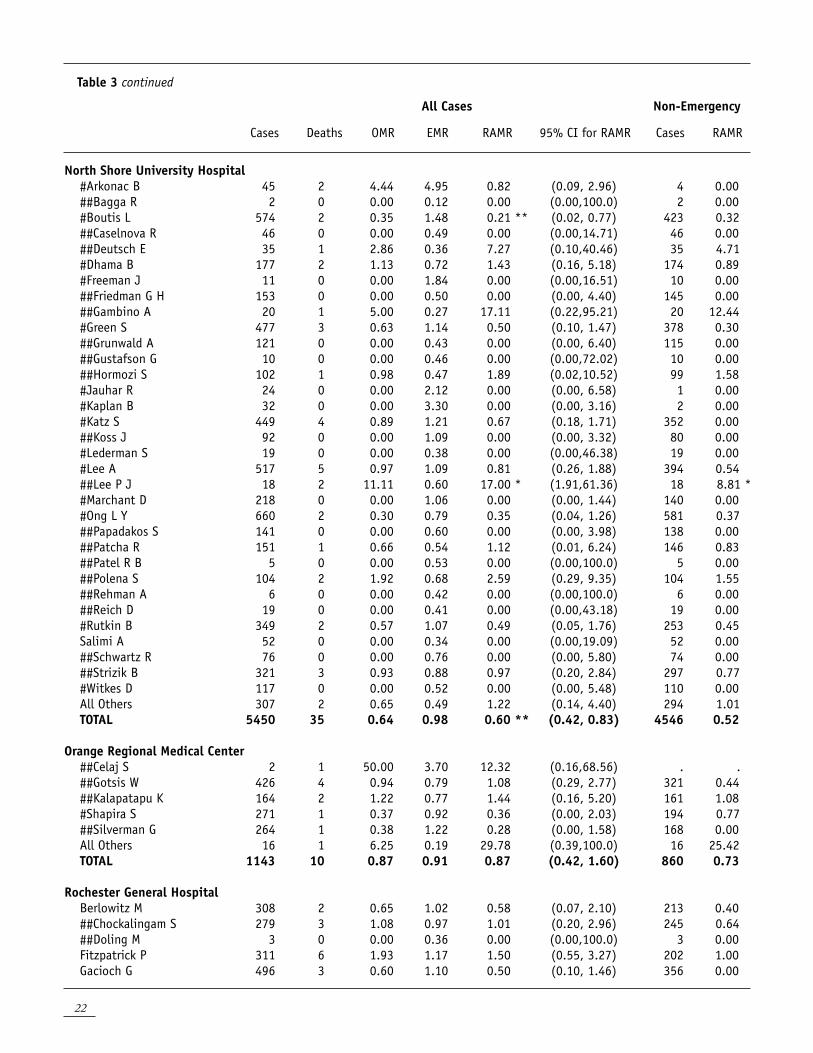
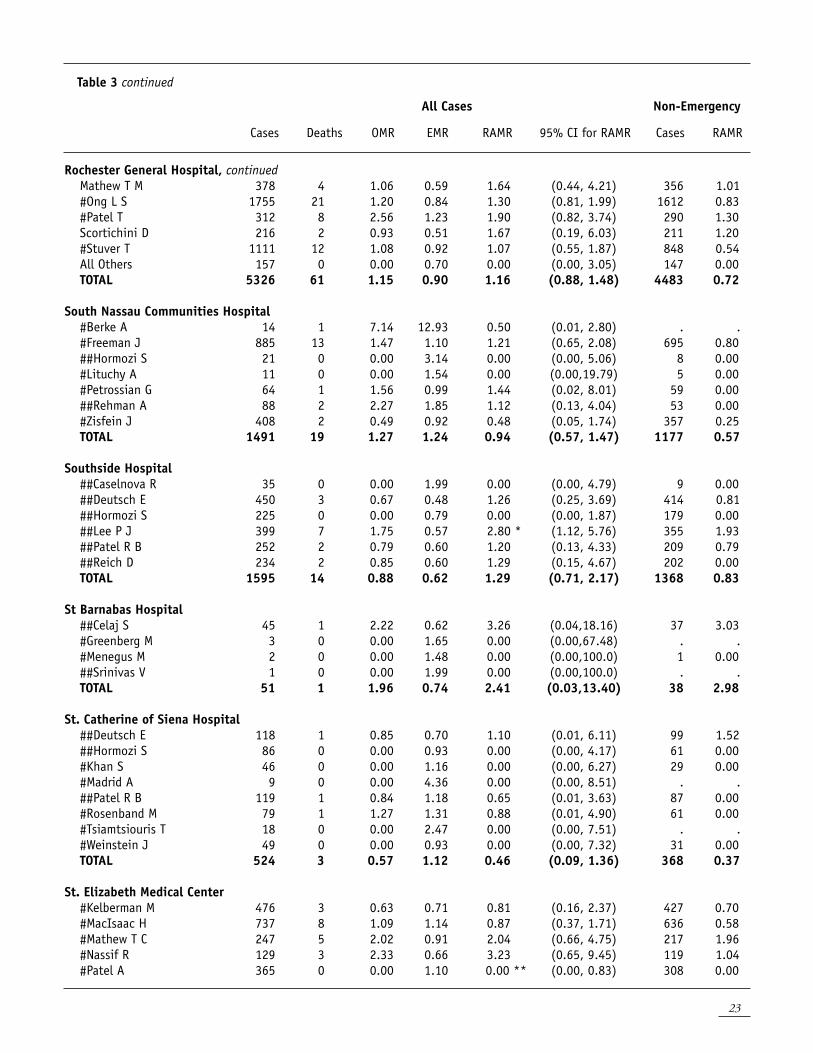
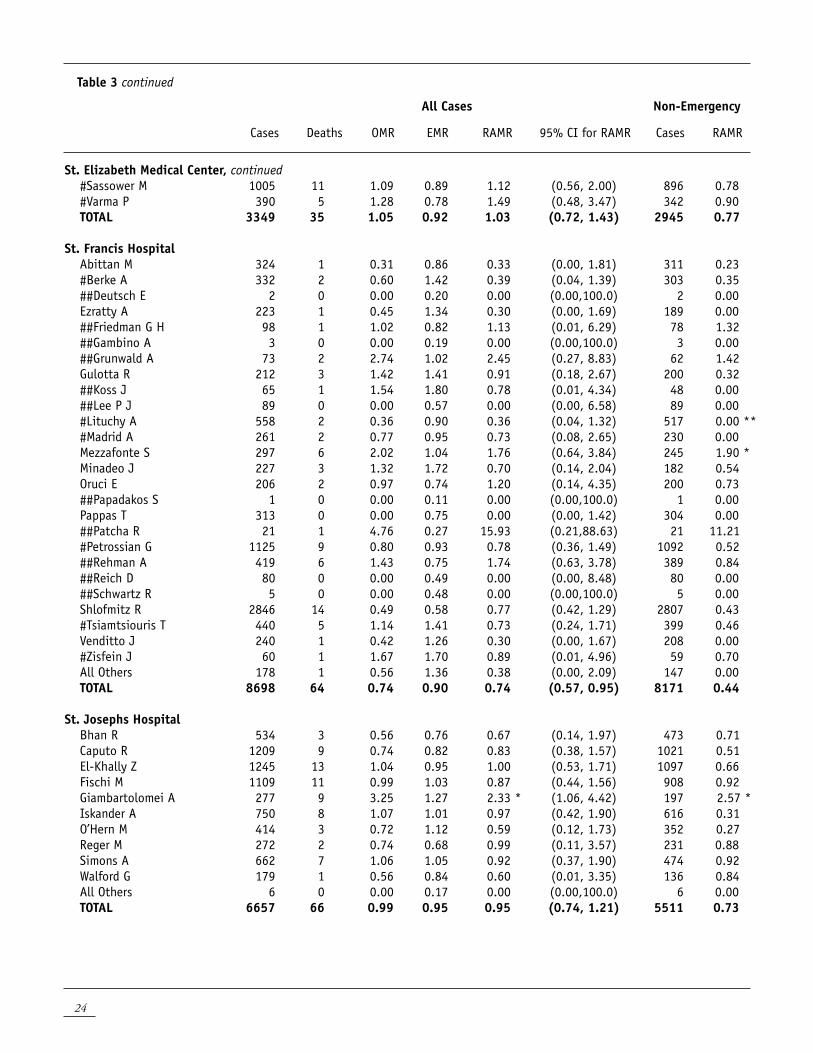
2009-2011 HOSPITAL AND CARDIOLOgIST DATA FOR PCITable 3 provides the number of PCIs, number of PCI patients who died in the hospital or after discharge but within 30 days, OMR, EMR, RAMR and the 95 percent confidence interval for the RAMR for 2009-2011 for cardiologists in each of the 59 hospitals performing PCI during the time period and for each of the hospitals. Table 3 also contains the volume and RAMR for cardiologists and hospitals for non-emergency cases.
This information is presented for each cardiologist who (a) performed 200 or more PCIs during 2009-2011, and/or (b) performed at least one PCI in each of the years 2009-2011. The results for cardiologists not meeting the above criteria are grouped together and reported as “All Others” in the hospital in which the procedures were performed. Cardiologists who met criterion (a) or (b) above and performed procedures in more than one hospital are noted in the table and are listed in all hospitals in which they performed procedures during 2009-2011.
Also, cardiologists who met criterion (a) or (b) above and have performed PCI in two or more NYS hospitals are listed separately in Table 4. For these cardiologists, the table presents the number of PCIs, the number of in-hospital/30-day deaths, OMR, EMR and RAMR with its 95 percent confidence interval for each hospital in which the cardiologist performed PCI, as well as the aggregate numbers (across all hospitals in which the cardiologist performed procedures). In addition, cardiologists and hospitals with RAMRs that are significantly lower or higher than the statewide mortality rate (as judged by a 95 percent confidence interval) are noted in Tables 3 and 4.
It should be noted that myocardial infarction (MI) less than 24 hours before the procedure and hemodynamic instability are significant risk factors in the All Cases model. However, patients with these conditions are excluded from the non-emergency analysis. The outcomes models for the two groups can, therefore, yield substantially different RAMRs. It is important to compare providers’ RAMRs to the statewide average mortality rate for the specific group of patients analyzed.
Table 3 Cardiologist In-Hospital/30-Day Observed, Expected, and Risk-Adjusted Mortality Rates for PCI in New York State, 2009-2011 Discharges
ALL CASES NON-EMERGENCY
Cases Deaths OMR EMR RAMR 95% CI for RAMR Cases RAMR
Statewide Total 158289 1433 0.91 136192 0.57
Albany Medical Center Hospital ##Brady S 428 2 0.47 0.67 0.63 (0.07, 2.29) 354 0.00 ##Delago A 1194 11 0.92 0.52 1.61 (0.80, 2.89) 1095 1.05 El-Hajjar M 267 6 2.25 1.12 1.84 (0.67, 3.99) 208 2.05 * #Esper D 185 3 1.62 0.86 1.72 (0.35, 5.03) 145 0.96 Houghton J 305 4 1.31 0.90 1.33 (0.36, 3.40) 225 1.04 #Macina A 25 1 4.00 1.18 3.10 (0.04,17.26) 7 0.00 Nappi A 241 2 0.83 0.72 1.05 (0.12, 3.80) 199 1.49 ##Papaleo R 601 7 1.16 0.48 2.20 (0.88, 4.54) 574 1.12 #Papandrea L 22 0 0.00 2.95 0.00 (0.00, 5.14) 8 0.00 All Others 79 3 3.80 0.54 6.43 * (1.29,18.78) 62 0.00 TOTAL 3347 39 1.17 0.67 1.59 * (1.13, 2.17) 2877 1.09 *
Arnot-Ogden Medical Center Amin N 491 3 0.61 0.89 0.63 (0.13, 1.84) 378 0.00 Grella R 537 8 1.49 1.01 1.34 (0.58, 2.65) 414 1.07 Yarkoni A 395 5 1.27 0.98 1.18 (0.38, 2.76) 294 0.87 All Others 10 1 10.00 1.18 7.70 (0.10,42.86) 6 0.00 TOTAL 1433 17 1.19 0.96 1.13 (0.66, 1.80) 1092 0.65
Bellevue Hospital Center #Attubato M 156 5 3.21 1.31 2.22 (0.72, 5.19) 133 1.11 #Babaev A 14 1 7.14 7.64 0.85 (0.01, 4.74) 3 0.00
14
Table 3 continued
All Cases Non-Emergency
Cases Deaths OMR EMR RAMR 95% CI for RAMR Cases RAMR
Bellevue Hospital Center, continued ##Coppola J 25 0 0.00 0.68 0.00 (0.00,19.65) 18 0.00 #Feit F 218 0 0.00 0.76 0.00 (0.00, 2.01) 190 0.00 #Iqbal S 298 3 1.01 0.99 0.92 (0.19, 2.70) 237 0.00 #Keller N 15 0 0.00 2.82 0.00 (0.00, 7.91) 4 0.00 ##Slater J 36 2 5.56 1.52 3.33 (0.37,12.01) 23 0.00 ##Yatskar L 214 4 1.87 1.05 1.63 (0.44, 4.16) 186 1.35 All Others 489 7 1.43 1.02 1.28 (0.51, 2.63) 426 0.99 TOTAL 1465 22 1.50 1.10 1.24 (0.78, 1.88) 1220 0.74
Beth Israel Medical Center ##Aslam A K 411 0 0.00 0.20 0.00 (0.00, 4.04) 411 0.00 ##Bhambhani G 52 0 0.00 0.21 0.00 (0.00,30.78) 52 0.00 Fox J 1483 14 0.94 0.93 0.93 (0.51, 1.56) 1384 0.53 #Gowda R 958 7 0.73 0.82 0.81 (0.33, 1.67) 883 0.46 Kanei Y 162 0 0.00 1.08 0.00 (0.00, 1.92) 120 0.00 ##Kantrowitz N 9 0 0.00 0.49 0.00 (0.00,75.22) 9 0.00 #Kwan T 645 1 0.16 0.40 0.36 (0.00, 1.99) 643 0.00 ##Lee P C 31 0 0.00 0.24 0.00 (0.00,45.59) 31 0.00 ##Liou M 171 1 0.58 0.53 1.00 (0.01, 5.56) 170 0.76 Nakra N 243 5 2.06 1.70 1.10 (0.36, 2.58) 186 0.52 Punukollu G 227 0 0.00 0.34 0.00 (0.00, 4.34) 226 0.00 #Rosero H 390 3 0.77 0.73 0.97 (0.19, 2.82) 357 0.66 ##Wilentz J 1 0 0.00 0.27 0.00 (0.00,100.0) 1 0.00 All Others 158 0 0.00 0.40 0.00 (0.00, 5.22) 157 0.00 TOTAL 4941 31 0.63 0.73 0.78 (0.53, 1.11) 4630 0.41
Bronx-Lebanon Hospital Ctr Concourse Div ##Celaj S 19 1 5.26 1.87 2.56 (0.03,14.24) . . ##Johnson M 22 3 13.64 2.43 5.11 * (1.03,14.92) 2 0.00 ##Shaqra H 96 3 3.13 2.48 1.15 (0.23, 3.35) 5 0.00 All Others 32 2 6.25 2.08 2.73 (0.31, 9.87) 3 0.00 TOTAL 169 9 5.33 2.33 2.08 * (0.95, 3.95) 10 0.00
Brookdale Hospital Medical Center ##Afflu E 2 0 0.00 0.14 0.00 (0.00,100.0) 2 0.00 #Castillo R 285 9 3.16 1.45 1.98 (0.91, 3.77) 198 1.21 #Chadow H 321 9 2.80 1.48 1.73 (0.79, 3.28) 247 0.68 ##John S 1 0 0.00 0.33 0.00 (0.00,100.0) 1 0.00 TOTAL 609 18 2.96 1.46 1.84 * (1.09, 2.91) 448 0.94
Buffalo General Hospital #Conley J 1211 10 0.83 0.68 1.11 (0.53, 2.05) 1155 0.78 #Corbelli J 8 1 12.50 2.84 4.02 (0.05,22.34) . . #Farhi E 716 4 0.56 0.75 0.68 (0.18, 1.75) 630 0.34 ##Gelormini J 4 0 0.00 0.37 0.00 (0.00,100.0) 3 0.00 ##Haq N 11 0 0.00 2.49 0.00 (0.00,12.20) . . ##Iyer V 198 5 2.53 1.22 1.88 (0.61, 4.39) 154 2.47 * #Masud A 163 1 0.61 0.53 1.05 (0.01, 5.82) 149 0.00 #Morris W 985 11 1.12 0.67 1.51 (0.75, 2.71) 910 0.88 ##Phadke K 21 1 4.76 5.92 0.73 (0.01, 4.08) 1 0.00 #Tandar A 68 1 1.47 1.95 0.69 (0.01, 3.82) 34 0.00
15
Table 3 continued
All Cases Non-Emergency
Cases Deaths OMR EMR RAMR 95% CI for RAMR Cases RAMR
Buffalo General Hospital, continued #Visco J 611 1 0.16 0.31 0.48 (0.01, 2.69) 586 0.45 All Others 105 0 0.00 1.03 0.00 (0.00, 3.08) 75 0.00 TOTAL 4101 35 0.85 0.72 1.08 (0.75, 1.50) 3697 0.76
Cayuga Medical Center at Ithaca All Others 167 2 1.20 1.36 0.80 (0.09, 2.90) 108 0.00 TOTAL 167 2 1.20 1.36 0.80 (0.09, 2.90) 108 0.00
Champlain Valley Physicians Hospital Bradley W 742 7 0.94 0.99 0.87 (0.35, 1.79) 605 0.55 Garrand T 552 4 0.72 1.35 0.49 (0.13, 1.25) 447 0.00 Gauthier E 599 3 0.50 0.86 0.53 (0.11, 1.56) 490 0.43 ##Slotwiner A 2 0 0.00 1.49 0.00 (0.00,100.0) . . TOTAL 1895 14 0.74 1.05 0.64 (0.35, 1.07) 1542 0.36
Crouse Hospital #Battaglia J 688 6 0.87 0.82 0.97 (0.36, 2.12) 564 0.74 #George A 476 10 2.10 1.26 1.52 (0.73, 2.80) 379 0.85 All Others 1 0 0.00 0.11 0.00 (0.00,100.0) 1 0.00 TOTAL 1165 16 1.37 1.00 1.26 (0.72, 2.04) 944 0.78
Ellis Hospital Cospito P 372 5 1.34 1.01 1.21 (0.39, 2.83) 244 0.45 Jordan M 313 3 0.96 1.22 0.71 (0.14, 2.09) 198 0.76 Parkes R 459 7 1.53 1.03 1.35 (0.54, 2.78) 314 0.33 Weitz S 247 1 0.40 1.37 0.27 (0.00, 1.50) 140 0.70 All Others 155 1 0.65 0.55 1.06 (0.01, 5.90) 145 0.78 TOTAL 1546 17 1.10 1.07 0.94 (0.55, 1.50) 1041 0.54
Elmhurst Hospital Center #Barman N 36 2 5.56 3.39 1.49 (0.17, 5.39) 9 0.00 #Kamran M 914 4 0.44 0.83 0.48 (0.13, 1.24) 695 0.63 #Kim M 42 0 0.00 2.13 0.00 (0.00, 3.73) 6 0.00 ##Pyo R 25 1 4.00 2.86 1.28 (0.02, 7.10) 2 0.00 ##Serrano-Gomez C 7 0 0.00 0.29 0.00 (0.00,100.0) 7 0.00 ##Yatskar L 109 0 0.00 1.71 0.00 (0.00, 1.79) 63 0.00 TOTAL 1133 7 0.62 1.08 0.52 (0.21, 1.07) 782 0.56
Erie County Medical Center Dashkoff N 357 5 1.40 1.68 0.76 (0.25, 1.78) 204 0.50 #Emerson R 1 0 0.00 0.36 0.00 (0.00,100.0) . . ##Iyer V 46 0 0.00 1.93 0.00 (0.00, 3.76) 14 0.00 ##Phadke K 9 0 0.00 3.80 0.00 (0.00, 9.77) 5 0.00 All Others 52 5 9.62 2.32 3.78 * (1.22, 8.82) 9 0.00 TOTAL 465 10 2.15 1.81 1.08 (0.52, 1.99) 232 0.45
Faxton-St. Lukes Hlthcare- St.Lukes Div #Kelberman M 16 1 6.25 1.59 3.58 (0.05,19.90) 9 0.00 #MacIsaac H 41 3 7.32 1.88 3.54 (0.71,10.35) 22 4.91 #Mathew T C 323 1 0.31 0.70 0.40 (0.01, 2.23) 265 0.67 #Nassif R 150 3 2.00 0.51 3.57 (0.72,10.44) 132 4.57 *
16
Table 3 continued
All Cases Non-Emergency
Cases Deaths OMR EMR RAMR 95% CI for RAMR Cases RAMR
Faxton-St. Lukes Hlthcare- St.Lukes Div, continued #Patel A 14 1 7.14 1.57 4.14 (0.05,23.04) 5 0.00 #Sassower M 25 0 0.00 1.68 0.00 (0.00, 7.96) 16 0.00 #Varma P 14 1 7.14 1.08 6.02 (0.08,33.48) 11 4.09 All Others 1 0 0.00 0.83 0.00 (0.00,100.0) . . TOTAL 584 10 1.71 0.83 1.87 (0.90, 3.45) 460 1.89 *
Glens Falls Hospital Bashir I 381 2 0.52 0.68 0.70 (0.08, 2.54) 291 0.79 ##Brady S 1 0 0.00 1.15 0.00 (0.00,100.0) . . ##Delago A 1 0 0.00 0.89 0.00 (0.00,100.0) . . Hogan R 325 1 0.31 0.66 0.42 (0.01, 2.35) 248 0.00 ##Papaleo R 11 1 9.09 3.57 2.32 (0.03,12.90) 1 0.00 TOTAL 719 4 0.56 0.72 0.71 (0.19, 1.81) 540 0.43
Good Samaritan Hosp - Suffern #Brogno D 516 5 0.97 0.93 0.94 (0.30, 2.20) 438 0.51 Hirsch C 279 3 1.08 0.81 1.21 (0.24, 3.53) 230 0.55 Kernis S 272 7 2.57 1.43 1.64 (0.66, 3.37) 166 0.76 Kovar L 336 0 0.00 0.88 0.00 (0.00, 1.13) 284 0.00 ##Pyo R 38 1 2.63 0.80 3.01 (0.04,16.73) 35 2.18 #Shapira S 57 0 0.00 0.33 0.00 (0.00,17.75) 56 0.00 All Others 539 12 2.23 1.40 1.45 (0.75, 2.54) 340 0.91 TOTAL 2037 28 1.37 1.08 1.16 (0.77, 1.68) 1549 0.55
Good Samaritan Hosp Med Ctr- West Islip ##Caselnova R 483 2 0.41 0.52 0.73 (0.08, 2.63) 439 0.40 ##Deutsch E 100 3 3.00 0.91 2.99 (0.60, 8.75) 79 1.77 ##Hormozi S 473 3 0.63 0.58 0.99 (0.20, 2.89) 425 0.44 ##Lee P J 472 4 0.85 0.51 1.50 (0.40, 3.85) 417 0.99 ##Patel R B 122 0 0.00 0.74 0.00 (0.00, 3.71) 85 0.00 ##Reich D 393 2 0.51 0.57 0.82 (0.09, 2.95) 339 1.20 TOTAL 2043 14 0.69 0.57 1.09 (0.59, 1.82) 1784 0.74
Huntington Hospital ##Bagga R 144 1 0.69 1.43 0.44 (0.01, 2.47) 65 1.52 ##Caselnova R 5 0 0.00 0.90 0.00 (0.00,73.91) 1 0.00 ##Patcha R 80 0 0.00 1.42 0.00 (0.00, 2.95) 37 0.00 ##Polena S 91 2 2.20 0.97 2.06 (0.23, 7.43) 65 3.70 ##Schwartz R 3 0 0.00 2.60 0.00 (0.00,42.84) . . ##Strizik B 83 1 1.20 1.55 0.71 (0.01, 3.94) 35 0.00 TOTAL 406 4 0.99 1.35 0.66 (0.18, 1.70) 203 1.74
Jamaica Hospital Medical Center #Gade C 1 0 0.00 5.60 0.00 (0.00,59.64) . . #Jain S 164 7 4.27 3.35 1.16 (0.47, 2.40) 42 2.81 #Kaki A 13 2 15.38 1.85 7.57 (0.85,27.33) 1 0.00 #Kukar A 16 1 6.25 1.78 3.20 (0.04,17.79) . . #Lasic Z 157 8 5.10 2.69 1.73 (0.74, 3.40) 26 6.44 #Puma A 12 2 16.67 1.68 9.04 * (1.02,32.64) . . #Raza J 147 4 2.72 2.89 0.86 (0.23, 2.20) 30 0.00 #Soffer D 18 0 0.00 1.42 0.00 (0.00,13.10) . .
17
Table 3 continued
All Cases Non-Emergency
Cases Deaths OMR EMR RAMR 95% CI for RAMR Cases RAMR
Jamaica Hospital Medical Center, continued #Yang Y 17 0 0.00 1.95 0.00 (0.00,10.11) . . TOTAL 545 24 4.40 2.81 1.43 * (0.91, 2.12) 99 2.42
Lenox Hill Hospital #Aboufares A 254 1 0.39 0.67 0.54 (0.01, 2.98) 246 0.00 Cohen H 431 2 0.46 0.65 0.65 (0.07, 2.34) 405 0.32 ##Dominguez-Echeva 157 0 0.00 0.41 0.00 (0.00, 5.15) 156 0.00 ##Fernaine G 100 0 0.00 0.53 0.00 (0.00, 6.36) 98 0.00 #Gade C 89 0 0.00 0.41 0.00 (0.00, 9.16) 85 0.00 Garratt K 543 3 0.55 0.76 0.67 (0.13, 1.95) 496 0.21 ##Gustafson G 36 0 0.00 0.52 0.00 (0.00,17.81) 36 0.00 Iyer S 309 3 0.97 0.65 1.36 (0.27, 3.99) 285 1.10 #Jain S 354 2 0.56 0.77 0.67 (0.07, 2.41) 343 0.51 #Kaki A 130 0 0.00 0.69 0.00 (0.00, 3.70) 110 0.00 ##Kesanakurthy S 322 1 0.31 0.39 0.73 (0.01, 4.04) 317 0.48 #Kukar A 272 2 0.74 0.82 0.81 (0.09, 2.94) 259 0.32 #Lasic Z 339 0 0.00 0.68 0.00 (0.00, 1.45) 331 0.00 Oboler L 15 0 0.00 0.46 0.00 (0.00,48.56) 14 0.00 #Palkhiwala S 38 0 0.00 0.20 0.00 (0.00,44.67) 38 0.00 ##Papadakos S 407 3 0.74 0.39 1.74 (0.35, 5.09) 403 1.10 #Parikh M 656 1 0.15 0.63 0.22 (0.00, 1.22) 644 0.16 #Puma A 263 1 0.38 0.38 0.91 (0.01, 5.08) 253 0.70 #Raza J 413 3 0.73 0.69 0.96 (0.19, 2.79) 405 0.40 Reimers C 891 3 0.34 0.53 0.58 (0.12, 1.69) 867 0.44 Ruiz C 6 0 0.00 0.36 0.00 (0.00,100.0) 6 0.00 #Soffer D 228 1 0.44 0.42 0.96 (0.01, 5.32) 222 0.60 ##Stathopoulos I 85 1 1.18 0.66 1.63 (0.02, 9.09) 83 1.04 ##Wilentz J 265 0 0.00 0.67 0.00 (0.00, 1.88) 240 0.00 #Yang Y 319 2 0.63 0.55 1.05 (0.12, 3.77) 308 0.75 All Others 579 5 0.86 0.66 1.19 (0.38, 2.78) 542 0.27 TOTAL 7501 34 0.45 0.60 0.69 (0.48, 0.96) 7192 0.37 **
Long Island Jewish Medical Center #Arkonac B 577 7 1.21 1.09 1.01 (0.41, 2.09) 481 0.79 ##Bagga R 202 1 0.50 0.46 0.98 (0.01, 5.46) 199 0.64 #Boutis L 27 1 3.70 4.57 0.74 (0.01, 4.11) 5 0.00 ##Deutsch E 3 0 0.00 0.71 0.00 (0.00,100.0) 3 0.00 #Dhama B 370 2 0.54 0.67 0.73 (0.08, 2.64) 361 0.48 ##Friedman G H 177 1 0.56 0.60 0.86 (0.01, 4.79) 169 0.73 #Green S 23 0 0.00 2.38 0.00 (0.00, 6.11) 3 0.00 ##Grunwald A 195 0 0.00 0.82 0.00 (0.00, 2.08) 186 0.00 ##Hameedi A 740 0 0.00 0.20 0.00 (0.00, 2.29) 739 0.00 #Jauhar R 1478 8 0.54 0.66 0.75 (0.32, 1.48) 1305 0.60 #Kaplan B 1513 9 0.59 0.73 0.74 (0.34, 1.41) 1368 0.46 #Katz S 33 0 0.00 1.85 0.00 (0.00, 5.47) 7 0.00 ##Koss J 247 3 1.21 0.75 1.47 (0.30, 4.31) 231 1.26 #Lee A 26 1 3.85 2.81 1.25 (0.02, 6.94) 3 0.00 #Marchant D 19 0 0.00 1.95 0.00 (0.00, 9.01) 5 0.00 #Musso J 12 0 0.00 0.21 0.00 (0.00,100.0) 12 0.00 #Ong L Y 10 0 0.00 1.82 0.00 (0.00,18.38) 3 0.00 ##Polena S 14 0 0.00 1.13 0.00 (0.00,21.19) 14 0.00
18
Table 3 continued
All Cases Non-Emergency
Cases Deaths OMR EMR RAMR 95% CI for RAMR Cases RAMR
Long Island Jewish Medical Center, continued #Rutkin B 19 0 0.00 3.80 0.00 (0.00, 4.63) 1 0.00 ##Strizik B 11 0 0.00 0.75 0.00 (0.00,40.77) 11 0.00 #Suleman J 3 0 0.00 0.18 0.00 (0.00,100.0) 3 0.00 All Others 121 0 0.00 0.58 0.00 (0.00, 4.75) 118 0.00 TOTAL 5820 33 0.57 0.72 0.72 (0.49, 1.01) 5227 0.52
Lutheran Medical Center ##Dominguez-Echeva 63 0 0.00 0.87 0.00 (0.00, 6.13) 61 0.00 ##Fernaine G 441 5 1.13 0.93 1.11 (0.36, 2.59) 376 0.97 ##Hoyek W 56 2 3.57 1.39 2.34 (0.26, 8.45) 35 0.00 #Kandov R 27 2 7.41 4.82 1.40 (0.16, 5.06) 12 0.00 ##Lee P C 42 0 0.00 1.78 0.00 (0.00, 4.47) 22 0.00 ##Pyo R 4 0 0.00 2.81 0.00 (0.00,29.77) . . #Royzman R 23 1 4.35 5.41 0.73 (0.01, 4.07) 8 0.00 TOTAL 656 10 1.52 1.35 1.03 (0.49, 1.90) 514 0.64
M I Bassett Hospital Clark V 218 2 0.92 0.96 0.87 (0.10, 3.14) 148 0.00 McNulty P 263 3 1.14 0.93 1.11 (0.22, 3.25) 190 0.00 Menzies D 421 4 0.95 0.98 0.88 (0.24, 2.26) 309 0.00 All Others 135 2 1.48 1.17 1.15 (0.13, 4.17) 80 1.56 TOTAL 1037 11 1.06 0.99 0.98 (0.49, 1.75) 727 0.17
Maimonides Medical Center Ayzenberg S 501 7 1.40 1.88 0.68 (0.27, 1.40) 366 0.39 Borgen E 733 9 1.23 1.77 0.63 (0.29, 1.20) 566 0.47 Frankel R 604 4 0.66 1.06 0.57 (0.15, 1.46) 559 0.51 Friedman M 289 3 1.04 1.68 0.56 (0.11, 1.64) 198 0.00 ##Kantrowitz N 23 0 0.00 1.72 0.00 (0.00, 8.45) 23 0.00 Malik B 913 8 0.88 1.37 0.58 (0.25, 1.15) 776 0.24 Shani J 447 4 0.89 0.90 0.91 (0.24, 2.33) 433 0.52 All Others 19 0 0.00 0.27 0.00 (0.00,66.28) 19 0.00 TOTAL 3529 35 0.99 1.43 0.63 ** (0.44, 0.88) 2940 0.38
Mercy Hospital #Calandra S 423 2 0.47 0.92 0.47 (0.05, 1.69) 335 0.00 #Emerson R 257 7 2.72 1.28 1.94 (0.78, 3.99) 159 1.71 ##Gelormini J 457 11 2.41 1.26 1.74 (0.87, 3.11) 349 1.69 * ##Haq N 315 2 0.63 0.89 0.65 (0.07, 2.34) 249 0.36 Meltser H 388 4 1.03 1.11 0.84 (0.23, 2.16) 280 0.00 All Others 95 4 4.21 1.32 2.91 (0.78, 7.45) 67 2.91 * TOTAL 1935 30 1.55 1.10 1.28 (0.86, 1.83) 1439 0.91
Millard Fillmore Hospital #Calandra S 27 0 0.00 0.21 0.00 (0.00,57.84) 27 0.00 #Conley J 3 0 0.00 1.80 0.00 (0.00,62.03) . . #Corbelli J 920 7 0.76 0.78 0.89 (0.36, 1.83) 820 0.39 #Farhi E 5 0 0.00 1.72 0.00 (0.00,38.96) . . ##Gelormini J 106 0 0.00 0.41 0.00 (0.00, 7.60) 103 0.00 ##Haq N 43 0 0.00 1.32 0.00 (0.00, 5.89) 21 0.00 ##Iyer V 12 0 0.00 3.07 0.00 (0.00, 9.08) 2 0.00
19
Table 3 continued
All Cases Non-Emergency
Cases Deaths OMR EMR RAMR 95% CI for RAMR Cases RAMR
Millard Fillmore Hospital, continued #Masud A 340 1 0.29 0.79 0.34 (0.00, 1.88) 308 0.00 #Morris W 13 0 0.00 2.04 0.00 (0.00,12.63) . . ##Phadke K 885 5 0.56 0.91 0.57 (0.18, 1.33) 724 0.31 #Tandar A 10 0 0.00 3.76 0.00 (0.00, 8.89) . . #Visco J 2 0 0.00 1.02 0.00 (0.00,100.0) . . All Others 13 1 7.69 0.96 7.29 (0.10,40.55) 7 13.02 TOTAL 2379 14 0.59 0.85 0.63 (0.34, 1.06) 2012 0.33
Montefiore Medical Center - Moses ##Celaj S 344 4 1.16 0.75 1.40 (0.38, 3.60) 277 0.45 #Greenberg M 644 4 0.62 0.80 0.71 (0.19, 1.81) 525 0.23 ##Grose R 28 0 0.00 0.72 0.00 (0.00,16.58) 26 0.00 ##Johnson M 185 0 0.00 0.65 0.00 (0.00, 2.77) 155 0.00 #Menegus M 659 9 1.37 1.02 1.23 (0.56, 2.33) 492 0.96 ##Shaqra H 236 0 0.00 0.60 0.00 (0.00, 2.37) 224 0.00 ##Srinivas V 3 0 0.00 1.19 0.00 (0.00,93.35) 2 0.00 All Others 164 1 0.61 0.45 1.23 (0.02, 6.86) 161 0.89 TOTAL 2263 18 0.80 0.80 0.91 (0.54, 1.44) 1862 0.51
Montefiore Medical Center - Weiler ##Celaj S 1 0 0.00 0.22 0.00 (0.00,100.0) 1 0.00 ##Gotsis W 433 7 1.62 0.73 2.01 (0.81, 4.14) 374 0.98 Monrad E 542 9 1.66 1.02 1.48 (0.68, 2.81) 432 0.82 ##Shaqra H 4 0 0.00 0.84 0.00 (0.00,99.70) 3 0.00 ##Silverman G 327 8 2.45 0.76 2.94 * (1.27, 5.80) 266 2.63 * Sokol S 270 7 2.59 0.86 2.73 * (1.10, 5.63) 216 2.47 * ##Srinivas V 421 5 1.19 1.09 0.99 (0.32, 2.32) 352 0.94 All Others 35 0 0.00 0.84 0.00 (0.00,11.37) 24 0.00 TOTAL 2033 36 1.77 0.91 1.78 * (1.25, 2.46) 1668 1.27 *
Mount Sinai Hospital #Barman N 187 0 0.00 1.46 0.00 (0.00, 1.22) 167 0.00 #Dangas G 147 0 0.00 1.23 0.00 (0.00, 1.84) 136 0.00 ##Fernaine G 286 1 0.35 0.57 0.56 (0.01, 3.11) 286 0.37 ##Hameedi A 9 0 0.00 0.22 0.00 (0.00,100.0) 9 0.00 ##Hasan C 401 0 0.00 0.28 0.00 (0.00, 2.93) 400 0.00 #Jayasundera T 7 0 0.00 0.82 0.00 (0.00,57.99) 7 0.00 #Kamran M 70 1 1.43 0.45 2.91 (0.04,16.17) 70 1.73 ##Kesanakurthy S 69 0 0.00 0.20 0.00 (0.00,24.73) 69 0.00 #Kim M 1880 18 0.96 0.90 0.97 (0.58, 1.54) 1830 0.52 Kini A 3063 9 0.29 0.57 0.47 ** (0.22, 0.90) 2979 0.33 Krishnan P 317 2 0.63 0.89 0.65 (0.07, 2.34) 296 0.38 ##Lee P C 100 1 1.00 0.51 1.79 (0.02, 9.97) 100 1.16 Moreno P 1382 3 0.22 0.55 0.36 (0.07, 1.04) 1364 0.17 ##Nguyen T 1 0 0.00 0.11 0.00 (0.00,100.0) 1 0.00 #Palkhiwala S 684 3 0.44 0.44 0.91 (0.18, 2.66) 683 0.54 ##Pyo R 222 3 1.35 0.66 1.86 (0.37, 5.42) 213 1.71 ##Serrano-Gomez C 49 0 0.00 0.31 0.00 (0.00,22.01) 49 0.00 Sharma S 4277 23 0.54 0.63 0.77 (0.49, 1.16) 4253 0.50 ##Shih A T 24 0 0.00 0.36 0.00 (0.00,38.99) 22 0.00 #Simon C 30 1 3.33 0.99 3.07 (0.04,17.11) 30 2.12
20
Table 3 continued
All Cases Non-Emergency
Cases Deaths OMR EMR RAMR 95% CI for RAMR Cases RAMR
Mount Sinai Hospital, continued #Suleman J 807 2 0.25 0.53 0.43 (0.05, 1.54) 804 0.28 Sweeny J 231 3 1.30 0.76 1.57 (0.31, 4.58) 210 0.91 All Others 282 3 1.06 1.03 0.94 (0.19, 2.75) 254 0.65 TOTAL 14525 73 0.50 0.65 0.71 ** (0.55, 0.89) 14232 0.44 **
NY Hospital Medical Ctr of Queens ##Friedman G H 60 1 1.67 1.57 0.97 (0.01, 5.39) 43 0.00 ##Grunwald A 64 0 0.00 1.54 0.00 (0.00, 3.40) 44 0.00 ##Gustafson G 420 5 1.19 0.83 1.31 (0.42, 3.06) 379 0.72 ##Hameedi A 5 0 0.00 0.14 0.00 (0.00,100.0) 5 0.00 ##Hasan C 1 0 0.00 0.13 0.00 (0.00,100.0) 1 0.00 ##Koss J 38 1 2.63 1.38 1.73 (0.02, 9.64) 26 0.00 Moustakakis E 343 3 0.87 1.42 0.56 (0.11, 1.64) 207 0.71 ##Papadakos S 208 4 1.92 2.17 0.81 (0.22, 2.07) 168 0.90 Park C 466 3 0.64 0.76 0.77 (0.16, 2.26) 376 0.79 All Others 616 5 0.81 0.65 1.14 (0.37, 2.66) 576 0.54 TOTAL 2221 22 0.99 1.03 0.88 (0.55, 1.33) 1825 0.67
NY Methodist Hospital ##Afflu E 21 0 0.00 0.30 0.00 (0.00,53.52) 21 0.00 ##Aslam A K 184 1 0.54 0.21 2.31 (0.03,12.88) 181 1.51 #Badero O 148 0 0.00 0.31 0.00 (0.00, 7.25) 148 0.00 ##Bhambhani G 274 0 0.00 0.24 0.00 (0.00, 5.08) 274 0.00 Brener S 631 11 1.74 1.65 0.96 (0.48, 1.72) 525 0.36 Chokshi A 241 0 0.00 0.40 0.00 (0.00, 3.51) 241 0.00 ##Dominguez-Echeva 41 0 0.00 0.30 0.00 (0.00,26.92) 41 0.00 #Haq S 151 1 0.66 0.71 0.85 (0.01, 4.71) 149 0.56 ##Hoyek W 306 1 0.33 0.42 0.71 (0.01, 3.98) 305 0.47 ##John S 17 0 0.00 0.40 0.00 (0.00,48.91) 17 0.00 ##Kesanakurthy S 1 0 0.00 0.22 0.00 (0.00,100.0) 1 0.00 Rouvelas P 211 2 0.95 0.57 1.52 (0.17, 5.50) 210 0.89 Sacchi T 1033 5 0.48 0.73 0.60 (0.19, 1.41) 961 0.21 Shaknovich A 247 1 0.40 0.59 0.63 (0.01, 3.50) 246 0.40 ##Slotwiner A 2 0 0.00 1.08 0.00 (0.00,100.0) 2 0.00 All Others 664 6 0.90 0.58 1.41 (0.51, 3.07) 656 0.84 TOTAL 4172 28 0.67 0.71 0.86 (0.57, 1.25) 3978 0.43
NYP Hospital - Columbia Presbyterian #Bliagos D 132 1 0.76 0.97 0.71 (0.01, 3.97) 128 0.54 #Brogno D 37 1 2.70 0.33 7.52 (0.10,41.87) 37 5.93 Collins M 572 7 1.22 1.14 0.98 (0.39, 2.02) 547 0.62 #Dangas G 241 1 0.41 1.34 0.28 (0.00, 1.57) 214 0.33 ##Dominguez-Echeva 171 0 0.00 0.56 0.00 (0.00, 3.48) 170 0.00 ##Grose R 205 1 0.49 0.68 0.65 (0.01, 3.62) 197 0.00 #Haq S 14 0 0.00 0.16 0.00 (0.00,100.0) 14 0.00 #Hjemdahl-Monsen C 39 1 2.56 1.03 2.26 (0.03,12.59) 33 0.00 #Irobunda C 120 1 0.83 0.47 1.63 (0.02, 9.08) 119 0.96 ##Johnson M 125 1 0.80 0.51 1.42 (0.02, 7.93) 123 0.87 ##Kalapatapu K 50 0 0.00 0.61 0.00 (0.00,11.03) 49 0.00 ##Kesanakurthy S 728 8 1.10 0.75 1.34 (0.58, 2.64) 717 1.00 Kirtane A 475 3 0.63 0.77 0.75 (0.15, 2.20) 442 0.52
21
Table 3 continued
All Cases Non-Emergency
Cases Deaths OMR EMR RAMR 95% CI for RAMR Cases RAMR
NYP Hospital - Columbia Presbyterian, continued #Kodali S 451 10 2.22 1.05 1.92 * (0.92, 3.54) 417 1.40 * Mehran R 97 2 2.06 1.46 1.29 (0.14, 4.64) 83 0.92 #Moses J 1554 4 0.26 0.54 0.44 (0.12, 1.12) 1552 0.27 #Parikh M 329 0 0.00 0.80 0.00 (0.00, 1.27) 314 0.00 #Pucillo A 24 0 0.00 0.54 0.00 (0.00,25.97) 23 0.00 Rabbani L 592 3 0.51 1.01 0.46 (0.09, 1.33) 532 0.00 ** Singh V 1324 5 0.38 0.53 0.64 (0.21, 1.50) 1306 0.51 ##Stathopoulos I 13 0 0.00 0.66 0.00 (0.00,38.77) 13 0.00 #Weinberger J 15 0 0.00 0.26 0.00 (0.00,85.51) 15 0.00 Weisz G 339 2 0.59 1.14 0.47 (0.05, 1.70) 300 0.49 All Others 1132 16 1.41 1.55 0.83 (0.48, 1.35) 986 0.54 TOTAL 8779 67 0.76 0.87 0.80 (0.62, 1.02) 8331 0.53
NYP Hospital - Weill Cornell #Aboufares A 21 0 0.00 0.53 0.00 (0.00,29.94) 21 0.00 Bergman G 647 5 0.77 1.13 0.62 (0.20, 1.46) 576 0.65 ##Charney R 318 1 0.31 0.82 0.35 (0.00, 1.95) 313 0.21 Feldman D 598 7 1.17 1.51 0.70 (0.28, 1.45) 512 0.68 Iacovone F 48 0 0.00 0.50 0.00 (0.00,13.93) 47 0.00 ##Kesanakurthy S 288 3 1.04 0.46 2.06 (0.41, 6.03) 285 1.40 ##Messinger D 168 3 1.79 1.29 1.26 (0.25, 3.69) 164 0.84 Minutello R 714 10 1.40 1.28 0.99 (0.48, 1.83) 600 0.66 #Moses J 86 0 0.00 0.48 0.00 (0.00, 8.02) 86 0.00 Moussa I 163 2 1.23 2.33 0.48 (0.05, 1.73) 126 0.00 ##Slotwiner A 244 4 1.64 2.09 0.72 (0.19, 1.83) 202 0.81 ##Wilentz J 6 0 0.00 0.25 0.00 (0.00,100.0) 6 0.00 Wong S 686 9 1.31 0.98 1.22 (0.56, 2.32) 637 0.86 All Others 105 3 2.86 1.76 1.48 (0.30, 4.32) 84 0.69 TOTAL 4092 47 1.15 1.22 0.86 (0.63, 1.14) 3659 0.67
NYU Hospitals Center #Attubato M 1048 6 0.57 0.78 0.67 (0.24, 1.45) 1008 0.25 #Babaev A 548 1 0.18 0.41 0.41 (0.01, 2.28) 540 0.28 ##Coppola J 98 1 1.02 0.60 1.55 (0.02, 8.60) 96 0.00 #Feit F 642 3 0.47 0.50 0.85 (0.17, 2.47) 595 0.23 #Iqbal S 27 0 0.00 0.88 0.00 (0.00,14.12) 19 0.00 #Jayasundera T 301 0 0.00 0.28 0.00 (0.00, 4.02) 301 0.00 #Keller N 8 0 0.00 4.48 0.00 (0.00, 9.33) 1 0.00 ##Liou M 76 0 0.00 0.27 0.00 (0.00,16.33) 76 0.00 ##Nguyen T 20 0 0.00 0.22 0.00 (0.00,74.97) 20 0.00 ##Serrano-Gomez C 13 0 0.00 0.23 0.00 (0.00,100.0) 13 0.00 ##Shih A T 2 0 0.00 0.35 0.00 (0.00,100.0) 2 0.00 ##Slater J 351 2 0.57 1.09 0.47 (0.05, 1.71) 316 0.40 ##Stathopoulos I 2 0 0.00 0.31 0.00 (0.00,100.0) 2 0.00 #Weinberger J 9 0 0.00 0.46 0.00 (0.00,81.17) 9 0.00 ##Yatskar L 108 0 0.00 0.56 0.00 (0.00, 5.57) 100 0.00 All Others 176 1 0.57 0.64 0.81 (0.01, 4.51) 165 0.99 TOTAL 3429 14 0.41 0.63 0.59 (0.32, 0.99) 3263 0.26 **
22
Table 3 continued
All Cases Non-Emergency
Cases Deaths OMR EMR RAMR 95% CI for RAMR Cases RAMR
North Shore University Hospital #Arkonac B 45 2 4.44 4.95 0.82 (0.09, 2.96) 4 0.00 ##Bagga R 2 0 0.00 0.12 0.00 (0.00,100.0) 2 0.00 #Boutis L 574 2 0.35 1.48 0.21 ** (0.02, 0.77) 423 0.32 ##Caselnova R 46 0 0.00 0.49 0.00 (0.00,14.71) 46 0.00 ##Deutsch E 35 1 2.86 0.36 7.27 (0.10,40.46) 35 4.71 #Dhama B 177 2 1.13 0.72 1.43 (0.16, 5.18) 174 0.89 #Freeman J 11 0 0.00 1.84 0.00 (0.00,16.51) 10 0.00 ##Friedman G H 153 0 0.00 0.50 0.00 (0.00, 4.40) 145 0.00 ##Gambino A 20 1 5.00 0.27 17.11 (0.22,95.21) 20 12.44 #Green S 477 3 0.63 1.14 0.50 (0.10, 1.47) 378 0.30 ##Grunwald A 121 0 0.00 0.43 0.00 (0.00, 6.40) 115 0.00 ##Gustafson G 10 0 0.00 0.46 0.00 (0.00,72.02) 10 0.00 ##Hormozi S 102 1 0.98 0.47 1.89 (0.02,10.52) 99 1.58 #Jauhar R 24 0 0.00 2.12 0.00 (0.00, 6.58) 1 0.00 #Kaplan B 32 0 0.00 3.30 0.00 (0.00, 3.16) 2 0.00 #Katz S 449 4 0.89 1.21 0.67 (0.18, 1.71) 352 0.00 ##Koss J 92 0 0.00 1.09 0.00 (0.00, 3.32) 80 0.00 #Lederman S 19 0 0.00 0.38 0.00 (0.00,46.38) 19 0.00 #Lee A 517 5 0.97 1.09 0.81 (0.26, 1.88) 394 0.54 ##Lee P J 18 2 11.11 0.60 17.00 * (1.91,61.36) 18 8.81 * #Marchant D 218 0 0.00 1.06 0.00 (0.00, 1.44) 140 0.00 #Ong L Y 660 2 0.30 0.79 0.35 (0.04, 1.26) 581 0.37 ##Papadakos S 141 0 0.00 0.60 0.00 (0.00, 3.98) 138 0.00 ##Patcha R 151 1 0.66 0.54 1.12 (0.01, 6.24) 146 0.83 ##Patel R B 5 0 0.00 0.53 0.00 (0.00,100.0) 5 0.00 ##Polena S 104 2 1.92 0.68 2.59 (0.29, 9.35) 104 1.55 ##Rehman A 6 0 0.00 0.42 0.00 (0.00,100.0) 6 0.00 ##Reich D 19 0 0.00 0.41 0.00 (0.00,43.18) 19 0.00 #Rutkin B 349 2 0.57 1.07 0.49 (0.05, 1.76) 253 0.45 Salimi A 52 0 0.00 0.34 0.00 (0.00,19.09) 52 0.00 ##Schwartz R 76 0 0.00 0.76 0.00 (0.00, 5.80) 74 0.00 ##Strizik B 321 3 0.93 0.88 0.97 (0.20, 2.84) 297 0.77 #Witkes D 117 0 0.00 0.52 0.00 (0.00, 5.48) 110 0.00 All Others 307 2 0.65 0.49 1.22 (0.14, 4.40) 294 1.01 TOTAL 5450 35 0.64 0.98 0.60 ** (0.42, 0.83) 4546 0.52
Orange Regional Medical Center ##Celaj S 2 1 50.00 3.70 12.32 (0.16,68.56) . . ##Gotsis W 426 4 0.94 0.79 1.08 (0.29, 2.77) 321 0.44 ##Kalapatapu K 164 2 1.22 0.77 1.44 (0.16, 5.20) 161 1.08 #Shapira S 271 1 0.37 0.92 0.36 (0.00, 2.03) 194 0.77 ##Silverman G 264 1 0.38 1.22 0.28 (0.00, 1.58) 168 0.00 All Others 16 1 6.25 0.19 29.78 (0.39,100.0) 16 25.42 TOTAL 1143 10 0.87 0.91 0.87 (0.42, 1.60) 860 0.73
Rochester General Hospital Berlowitz M 308 2 0.65 1.02 0.58 (0.07, 2.10) 213 0.40 ##Chockalingam S 279 3 1.08 0.97 1.01 (0.20, 2.96) 245 0.64 ##Doling M 3 0 0.00 0.36 0.00 (0.00,100.0) 3 0.00 Fitzpatrick P 311 6 1.93 1.17 1.50 (0.55, 3.27) 202 1.00 Gacioch G 496 3 0.60 1.10 0.50 (0.10, 1.46) 356 0.00
23
Table 3 continued
All Cases Non-Emergency
Cases Deaths OMR EMR RAMR 95% CI for RAMR Cases RAMR
Rochester General Hospital, continued Mathew T M 378 4 1.06 0.59 1.64 (0.44, 4.21) 356 1.01 #Ong L S 1755 21 1.20 0.84 1.30 (0.81, 1.99) 1612 0.83 #Patel T 312 8 2.56 1.23 1.90 (0.82, 3.74) 290 1.30 Scortichini D 216 2 0.93 0.51 1.67 (0.19, 6.03) 211 1.20 #Stuver T 1111 12 1.08 0.92 1.07 (0.55, 1.87) 848 0.54 All Others 157 0 0.00 0.70 0.00 (0.00, 3.05) 147 0.00 TOTAL 5326 61 1.15 0.90 1.16 (0.88, 1.48) 4483 0.72
South Nassau Communities Hospital #Berke A 14 1 7.14 12.93 0.50 (0.01, 2.80) . . #Freeman J 885 13 1.47 1.10 1.21 (0.65, 2.08) 695 0.80 ##Hormozi S 21 0 0.00 3.14 0.00 (0.00, 5.06) 8 0.00 #Lituchy A 11 0 0.00 1.54 0.00 (0.00,19.79) 5 0.00 #Petrossian G 64 1 1.56 0.99 1.44 (0.02, 8.01) 59 0.00 ##Rehman A 88 2 2.27 1.85 1.12 (0.13, 4.04) 53 0.00 #Zisfein J 408 2 0.49 0.92 0.48 (0.05, 1.74) 357 0.25 TOTAL 1491 19 1.27 1.24 0.94 (0.57, 1.47) 1177 0.57
Southside Hospital ##Caselnova R 35 0 0.00 1.99 0.00 (0.00, 4.79) 9 0.00 ##Deutsch E 450 3 0.67 0.48 1.26 (0.25, 3.69) 414 0.81 ##Hormozi S 225 0 0.00 0.79 0.00 (0.00, 1.87) 179 0.00 ##Lee P J 399 7 1.75 0.57 2.80 * (1.12, 5.76) 355 1.93 ##Patel R B 252 2 0.79 0.60 1.20 (0.13, 4.33) 209 0.79 ##Reich D 234 2 0.85 0.60 1.29 (0.15, 4.67) 202 0.00 TOTAL 1595 14 0.88 0.62 1.29 (0.71, 2.17) 1368 0.83
St Barnabas Hospital ##Celaj S 45 1 2.22 0.62 3.26 (0.04,18.16) 37 3.03 #Greenberg M 3 0 0.00 1.65 0.00 (0.00,67.48) . . #Menegus M 2 0 0.00 1.48 0.00 (0.00,100.0) 1 0.00 ##Srinivas V 1 0 0.00 1.99 0.00 (0.00,100.0) . . TOTAL 51 1 1.96 0.74 2.41 (0.03,13.40) 38 2.98
St. Catherine of Siena Hospital ##Deutsch E 118 1 0.85 0.70 1.10 (0.01, 6.11) 99 1.52 ##Hormozi S 86 0 0.00 0.93 0.00 (0.00, 4.17) 61 0.00 #Khan S 46 0 0.00 1.16 0.00 (0.00, 6.27) 29 0.00 #Madrid A 9 0 0.00 4.36 0.00 (0.00, 8.51) . . ##Patel R B 119 1 0.84 1.18 0.65 (0.01, 3.63) 87 0.00 #Rosenband M 79 1 1.27 1.31 0.88 (0.01, 4.90) 61 0.00 #Tsiamtsiouris T 18 0 0.00 2.47 0.00 (0.00, 7.51) . . #Weinstein J 49 0 0.00 0.93 0.00 (0.00, 7.32) 31 0.00 TOTAL 524 3 0.57 1.12 0.46 (0.09, 1.36) 368 0.37 St. Elizabeth Medical Center #Kelberman M 476 3 0.63 0.71 0.81 (0.16, 2.37) 427 0.70 #MacIsaac H 737 8 1.09 1.14 0.87 (0.37, 1.71) 636 0.58 #Mathew T C 247 5 2.02 0.91 2.04 (0.66, 4.75) 217 1.96 #Nassif R 129 3 2.33 0.66 3.23 (0.65, 9.45) 119 1.04 #Patel A 365 0 0.00 1.10 0.00 ** (0.00, 0.83) 308 0.00
24
Table 3 continued
All Cases Non-Emergency
Cases Deaths OMR EMR RAMR 95% CI for RAMR Cases RAMR
St. Elizabeth Medical Center, continued #Sassower M 1005 11 1.09 0.89 1.12 (0.56, 2.00) 896 0.78 #Varma P 390 5 1.28 0.78 1.49 (0.48, 3.47) 342 0.90 TOTAL 3349 35 1.05 0.92 1.03 (0.72, 1.43) 2945 0.77
St. Francis Hospital Abittan M 324 1 0.31 0.86 0.33 (0.00, 1.81) 311 0.23 #Berke A 332 2 0.60 1.42 0.39 (0.04, 1.39) 303 0.35 ##Deutsch E 2 0 0.00 0.20 0.00 (0.00,100.0) 2 0.00 Ezratty A 223 1 0.45 1.34 0.30 (0.00, 1.69) 189 0.00 ##Friedman G H 98 1 1.02 0.82 1.13 (0.01, 6.29) 78 1.32 ##Gambino A 3 0 0.00 0.19 0.00 (0.00,100.0) 3 0.00 ##Grunwald A 73 2 2.74 1.02 2.45 (0.27, 8.83) 62 1.42 Gulotta R 212 3 1.42 1.41 0.91 (0.18, 2.67) 200 0.32 ##Koss J 65 1 1.54 1.80 0.78 (0.01, 4.34) 48 0.00 ##Lee P J 89 0 0.00 0.57 0.00 (0.00, 6.58) 89 0.00 #Lituchy A 558 2 0.36 0.90 0.36 (0.04, 1.32) 517 0.00 ** #Madrid A 261 2 0.77 0.95 0.73 (0.08, 2.65) 230 0.00 Mezzafonte S 297 6 2.02 1.04 1.76 (0.64, 3.84) 245 1.90 * Minadeo J 227 3 1.32 1.72 0.70 (0.14, 2.04) 182 0.54 Oruci E 206 2 0.97 0.74 1.20 (0.14, 4.35) 200 0.73 ##Papadakos S 1 0 0.00 0.11 0.00 (0.00,100.0) 1 0.00 Pappas T 313 0 0.00 0.75 0.00 (0.00, 1.42) 304 0.00 ##Patcha R 21 1 4.76 0.27 15.93 (0.21,88.63) 21 11.21 #Petrossian G 1125 9 0.80 0.93 0.78 (0.36, 1.49) 1092 0.52 ##Rehman A 419 6 1.43 0.75 1.74 (0.63, 3.78) 389 0.84 ##Reich D 80 0 0.00 0.49 0.00 (0.00, 8.48) 80 0.00 ##Schwartz R 5 0 0.00 0.48 0.00 (0.00,100.0) 5 0.00 Shlofmitz R 2846 14 0.49 0.58 0.77 (0.42, 1.29) 2807 0.43 #Tsiamtsiouris T 440 5 1.14 1.41 0.73 (0.24, 1.71) 399 0.46 Venditto J 240 1 0.42 1.26 0.30 (0.00, 1.67) 208 0.00 #Zisfein J 60 1 1.67 1.70 0.89 (0.01, 4.96) 59 0.70 All Others 178 1 0.56 1.36 0.38 (0.00, 2.09) 147 0.00 TOTAL 8698 64 0.74 0.90 0.74 (0.57, 0.95) 8171 0.44
St. Josephs Hospital Bhan R 534 3 0.56 0.76 0.67 (0.14, 1.97) 473 0.71 Caputo R 1209 9 0.74 0.82 0.83 (0.38, 1.57) 1021 0.51 El-Khally Z 1245 13 1.04 0.95 1.00 (0.53, 1.71) 1097 0.66 Fischi M 1109 11 0.99 1.03 0.87 (0.44, 1.56) 908 0.92 Giambartolomei A 277 9 3.25 1.27 2.33 * (1.06, 4.42) 197 2.57 * Iskander A 750 8 1.07 1.01 0.97 (0.42, 1.90) 616 0.31 O’Hern M 414 3 0.72 1.12 0.59 (0.12, 1.73) 352 0.27 Reger M 272 2 0.74 0.68 0.99 (0.11, 3.57) 231 0.88 Simons A 662 7 1.06 1.05 0.92 (0.37, 1.90) 474 0.92 Walford G 179 1 0.56 0.84 0.60 (0.01, 3.35) 136 0.84 All Others 6 0 0.00 0.17 0.00 (0.00,100.0) 6 0.00 TOTAL 6657 66 0.99 0.95 0.95 (0.74, 1.21) 5511 0.73
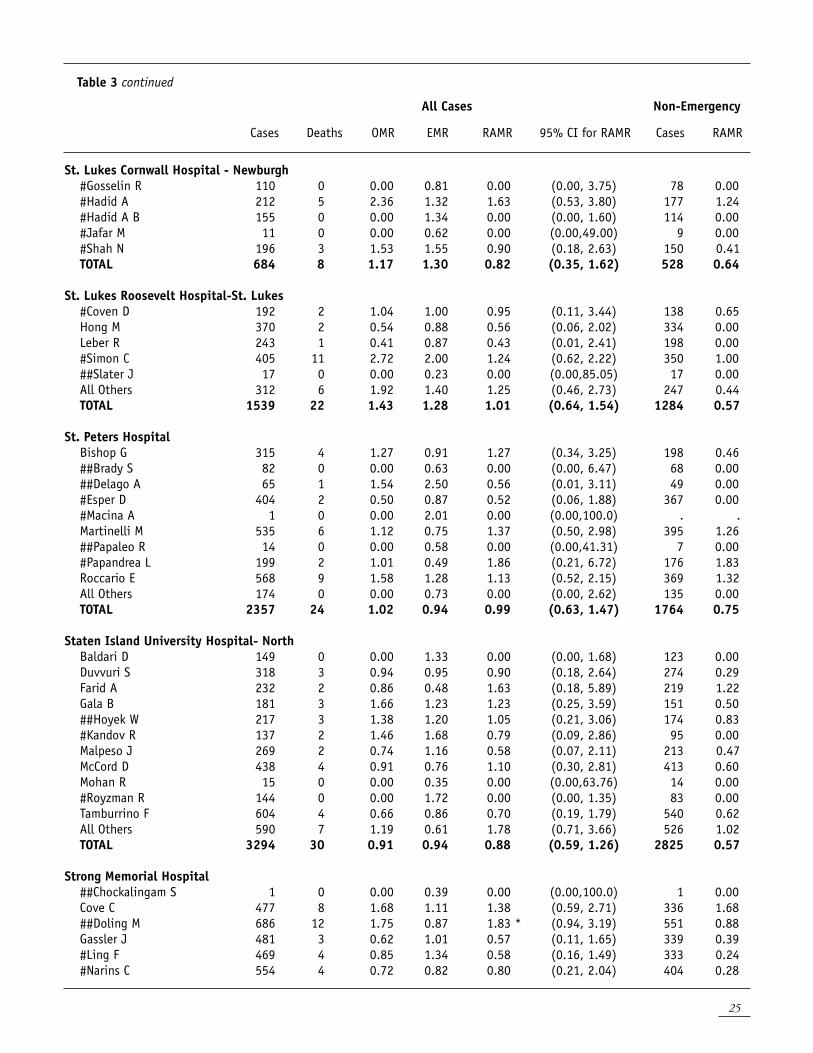
25
Table 3 continued
All Cases Non-Emergency
Cases Deaths OMR EMR RAMR 95% CI for RAMR Cases RAMR
St. Lukes Cornwall Hospital - Newburgh #Gosselin R 110 0 0.00 0.81 0.00 (0.00, 3.75) 78 0.00 #Hadid A 212 5 2.36 1.32 1.63 (0.53, 3.80) 177 1.24 #Hadid A B 155 0 0.00 1.34 0.00 (0.00, 1.60) 114 0.00 #Jafar M 11 0 0.00 0.62 0.00 (0.00,49.00) 9 0.00 #Shah N 196 3 1.53 1.55 0.90 (0.18, 2.63) 150 0.41 TOTAL 684 8 1.17 1.30 0.82 (0.35, 1.62) 528 0.64
St. Lukes Roosevelt Hospital-St. Lukes #Coven D 192 2 1.04 1.00 0.95 (0.11, 3.44) 138 0.65 Hong M 370 2 0.54 0.88 0.56 (0.06, 2.02) 334 0.00 Leber R 243 1 0.41 0.87 0.43 (0.01, 2.41) 198 0.00 #Simon C 405 11 2.72 2.00 1.24 (0.62, 2.22) 350 1.00 ##Slater J 17 0 0.00 0.23 0.00 (0.00,85.05) 17 0.00 All Others 312 6 1.92 1.40 1.25 (0.46, 2.73) 247 0.44 TOTAL 1539 22 1.43 1.28 1.01 (0.64, 1.54) 1284 0.57
St. Peters Hospital Bishop G 315 4 1.27 0.91 1.27 (0.34, 3.25) 198 0.46 ##Brady S 82 0 0.00 0.63 0.00 (0.00, 6.47) 68 0.00 ##Delago A 65 1 1.54 2.50 0.56 (0.01, 3.11) 49 0.00 #Esper D 404 2 0.50 0.87 0.52 (0.06, 1.88) 367 0.00 #Macina A 1 0 0.00 2.01 0.00 (0.00,100.0) . . Martinelli M 535 6 1.12 0.75 1.37 (0.50, 2.98) 395 1.26 ##Papaleo R 14 0 0.00 0.58 0.00 (0.00,41.31) 7 0.00 #Papandrea L 199 2 1.01 0.49 1.86 (0.21, 6.72) 176 1.83 Roccario E 568 9 1.58 1.28 1.13 (0.52, 2.15) 369 1.32 All Others 174 0 0.00 0.73 0.00 (0.00, 2.62) 135 0.00 TOTAL 2357 24 1.02 0.94 0.99 (0.63, 1.47) 1764 0.75
Staten Island University Hospital- North Baldari D 149 0 0.00 1.33 0.00 (0.00, 1.68) 123 0.00 Duvvuri S 318 3 0.94 0.95 0.90 (0.18, 2.64) 274 0.29 Farid A 232 2 0.86 0.48 1.63 (0.18, 5.89) 219 1.22 Gala B 181 3 1.66 1.23 1.23 (0.25, 3.59) 151 0.50 ##Hoyek W 217 3 1.38 1.20 1.05 (0.21, 3.06) 174 0.83 #Kandov R 137 2 1.46 1.68 0.79 (0.09, 2.86) 95 0.00 Malpeso J 269 2 0.74 1.16 0.58 (0.07, 2.11) 213 0.47 McCord D 438 4 0.91 0.76 1.10 (0.30, 2.81) 413 0.60 Mohan R 15 0 0.00 0.35 0.00 (0.00,63.76) 14 0.00 #Royzman R 144 0 0.00 1.72 0.00 (0.00, 1.35) 83 0.00 Tamburrino F 604 4 0.66 0.86 0.70 (0.19, 1.79) 540 0.62 All Others 590 7 1.19 0.61 1.78 (0.71, 3.66) 526 1.02 TOTAL 3294 30 0.91 0.94 0.88 (0.59, 1.26) 2825 0.57
Strong Memorial Hospital ##Chockalingam S 1 0 0.00 0.39 0.00 (0.00,100.0) 1 0.00 Cove C 477 8 1.68 1.11 1.38 (0.59, 2.71) 336 1.68 ##Doling M 686 12 1.75 0.87 1.83 * (0.94, 3.19) 551 0.88 Gassler J 481 3 0.62 1.01 0.57 (0.11, 1.65) 339 0.39 #Ling F 469 4 0.85 1.34 0.58 (0.16, 1.49) 333 0.24 #Narins C 554 4 0.72 0.82 0.80 (0.21, 2.04) 404 0.28
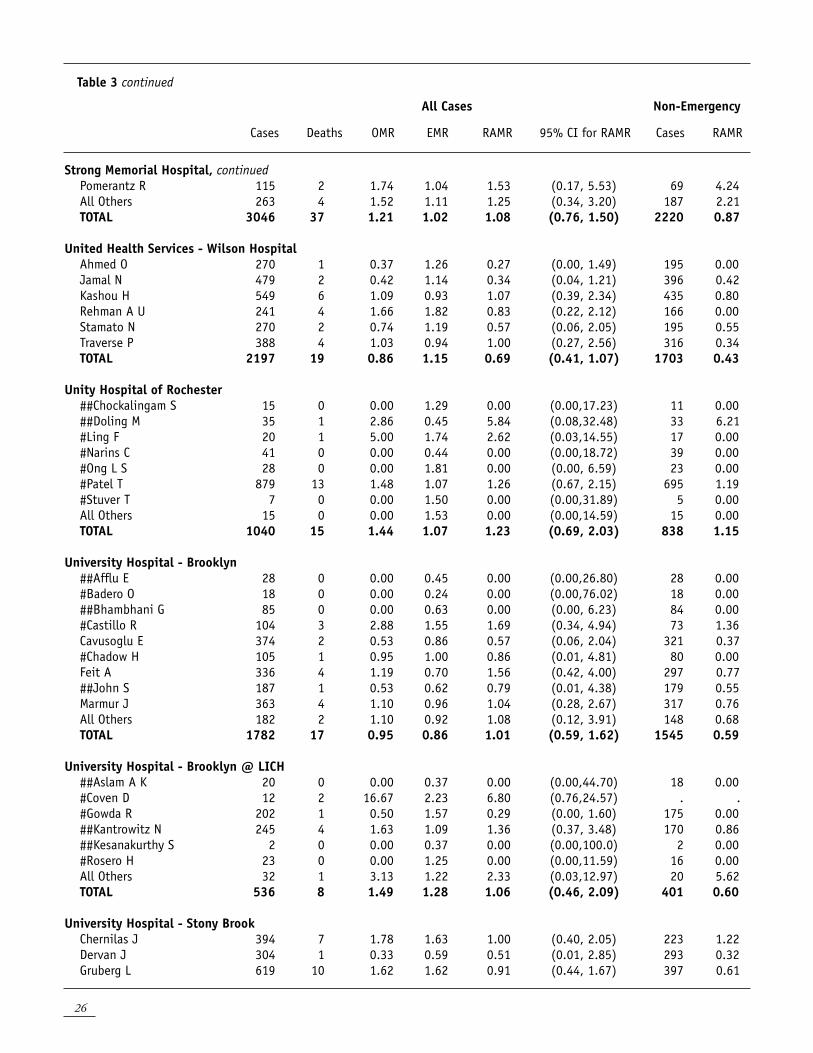
26
Table 3 continued
All Cases Non-Emergency
Cases Deaths OMR EMR RAMR 95% CI for RAMR Cases RAMR
Strong Memorial Hospital, continued Pomerantz R 115 2 1.74 1.04 1.53 (0.17, 5.53) 69 4.24 All Others 263 4 1.52 1.11 1.25 (0.34, 3.20) 187 2.21 TOTAL 3046 37 1.21 1.02 1.08 (0.76, 1.50) 2220 0.87
United Health Services - Wilson Hospital Ahmed O 270 1 0.37 1.26 0.27 (0.00, 1.49) 195 0.00 Jamal N 479 2 0.42 1.14 0.34 (0.04, 1.21) 396 0.42 Kashou H 549 6 1.09 0.93 1.07 (0.39, 2.34) 435 0.80 Rehman A U 241 4 1.66 1.82 0.83 (0.22, 2.12) 166 0.00 Stamato N 270 2 0.74 1.19 0.57 (0.06, 2.05) 195 0.55 Traverse P 388 4 1.03 0.94 1.00 (0.27, 2.56) 316 0.34 TOTAL 2197 19 0.86 1.15 0.69 (0.41, 1.07) 1703 0.43
Unity Hospital of Rochester ##Chockalingam S 15 0 0.00 1.29 0.00 (0.00,17.23) 11 0.00 ##Doling M 35 1 2.86 0.45 5.84 (0.08,32.48) 33 6.21 #Ling F 20 1 5.00 1.74 2.62 (0.03,14.55) 17 0.00 #Narins C 41 0 0.00 0.44 0.00 (0.00,18.72) 39 0.00 #Ong L S 28 0 0.00 1.81 0.00 (0.00, 6.59) 23 0.00 #Patel T 879 13 1.48 1.07 1.26 (0.67, 2.15) 695 1.19 #Stuver T 7 0 0.00 1.50 0.00 (0.00,31.89) 5 0.00 All Others 15 0 0.00 1.53 0.00 (0.00,14.59) 15 0.00 TOTAL 1040 15 1.44 1.07 1.23 (0.69, 2.03) 838 1.15
University Hospital - Brooklyn ##Afflu E 28 0 0.00 0.45 0.00 (0.00,26.80) 28 0.00 #Badero O 18 0 0.00 0.24 0.00 (0.00,76.02) 18 0.00 ##Bhambhani G 85 0 0.00 0.63 0.00 (0.00, 6.23) 84 0.00 #Castillo R 104 3 2.88 1.55 1.69 (0.34, 4.94) 73 1.36 Cavusoglu E 374 2 0.53 0.86 0.57 (0.06, 2.04) 321 0.37 #Chadow H 105 1 0.95 1.00 0.86 (0.01, 4.81) 80 0.00 Feit A 336 4 1.19 0.70 1.56 (0.42, 4.00) 297 0.77 ##John S 187 1 0.53 0.62 0.79 (0.01, 4.38) 179 0.55 Marmur J 363 4 1.10 0.96 1.04 (0.28, 2.67) 317 0.76 All Others 182 2 1.10 0.92 1.08 (0.12, 3.91) 148 0.68 TOTAL 1782 17 0.95 0.86 1.01 (0.59, 1.62) 1545 0.59
University Hospital - Brooklyn @ LICH ##Aslam A K 20 0 0.00 0.37 0.00 (0.00,44.70) 18 0.00 #Coven D 12 2 16.67 2.23 6.80 (0.76,24.57) . . #Gowda R 202 1 0.50 1.57 0.29 (0.00, 1.60) 175 0.00 ##Kantrowitz N 245 4 1.63 1.09 1.36 (0.37, 3.48) 170 0.86 ##Kesanakurthy S 2 0 0.00 0.37 0.00 (0.00,100.0) 2 0.00 #Rosero H 23 0 0.00 1.25 0.00 (0.00,11.59) 16 0.00 All Others 32 1 3.13 1.22 2.33 (0.03,12.97) 20 5.62 TOTAL 536 8 1.49 1.28 1.06 (0.46, 2.09) 401 0.60
University Hospital - Stony Brook Chernilas J 394 7 1.78 1.63 1.00 (0.40, 2.05) 223 1.22 Dervan J 304 1 0.33 0.59 0.51 (0.01, 2.85) 293 0.32 Gruberg L 619 10 1.62 1.62 0.91 (0.44, 1.67) 397 0.61
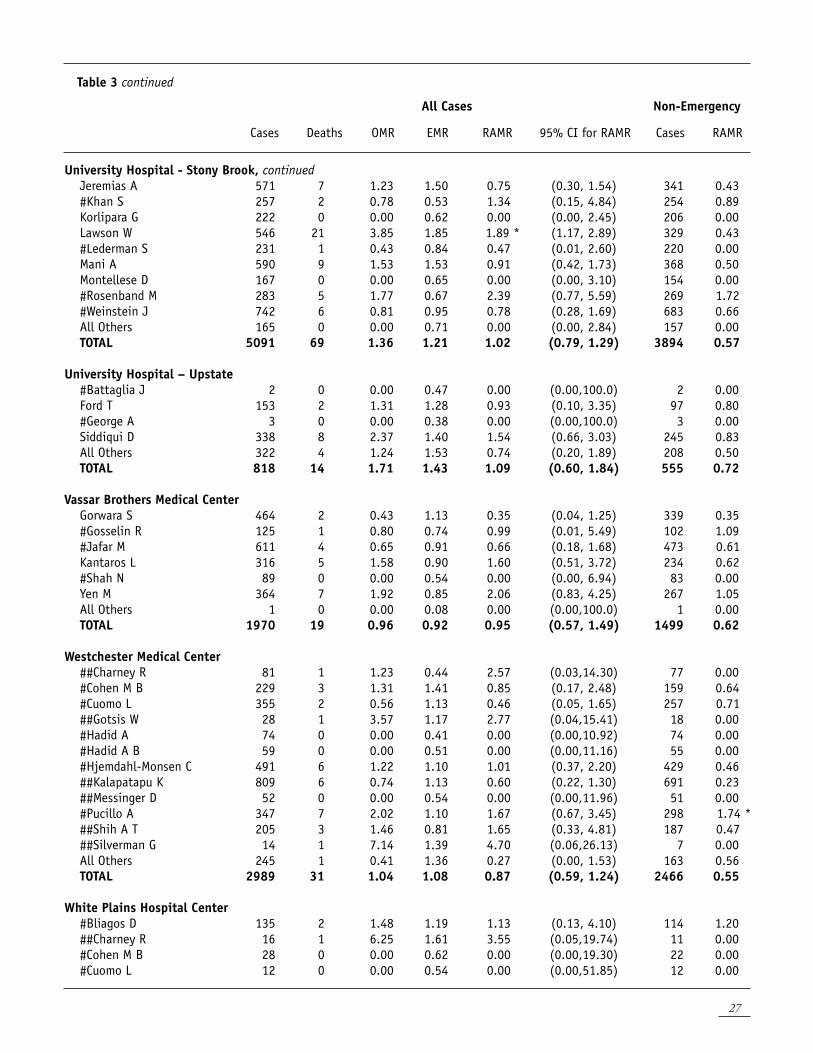
27
Table 3 continued
All Cases Non-Emergency
Cases Deaths OMR EMR RAMR 95% CI for RAMR Cases RAMR
University Hospital - Stony Brook, continued Jeremias A 571 7 1.23 1.50 0.75 (0.30, 1.54) 341 0.43 #Khan S 257 2 0.78 0.53 1.34 (0.15, 4.84) 254 0.89 Korlipara G 222 0 0.00 0.62 0.00 (0.00, 2.45) 206 0.00 Lawson W 546 21 3.85 1.85 1.89 * (1.17, 2.89) 329 0.43 #Lederman S 231 1 0.43 0.84 0.47 (0.01, 2.60) 220 0.00 Mani A 590 9 1.53 1.53 0.91 (0.42, 1.73) 368 0.50 Montellese D 167 0 0.00 0.65 0.00 (0.00, 3.10) 154 0.00 #Rosenband M 283 5 1.77 0.67 2.39 (0.77, 5.59) 269 1.72 #Weinstein J 742 6 0.81 0.95 0.78 (0.28, 1.69) 683 0.66 All Others 165 0 0.00 0.71 0.00 (0.00, 2.84) 157 0.00 TOTAL 5091 69 1.36 1.21 1.02 (0.79, 1.29) 3894 0.57
University Hospital – Upstate #Battaglia J 2 0 0.00 0.47 0.00 (0.00,100.0) 2 0.00 Ford T 153 2 1.31 1.28 0.93 (0.10, 3.35) 97 0.80 #George A 3 0 0.00 0.38 0.00 (0.00,100.0) 3 0.00 Siddiqui D 338 8 2.37 1.40 1.54 (0.66, 3.03) 245 0.83 All Others 322 4 1.24 1.53 0.74 (0.20, 1.89) 208 0.50 TOTAL 818 14 1.71 1.43 1.09 (0.60, 1.84) 555 0.72
Vassar Brothers Medical Center Gorwara S 464 2 0.43 1.13 0.35 (0.04, 1.25) 339 0.35 #Gosselin R 125 1 0.80 0.74 0.99 (0.01, 5.49) 102 1.09 #Jafar M 611 4 0.65 0.91 0.66 (0.18, 1.68) 473 0.61 Kantaros L 316 5 1.58 0.90 1.60 (0.51, 3.72) 234 0.62 #Shah N 89 0 0.00 0.54 0.00 (0.00, 6.94) 83 0.00 Yen M 364 7 1.92 0.85 2.06 (0.83, 4.25) 267 1.05 All Others 1 0 0.00 0.08 0.00 (0.00,100.0) 1 0.00 TOTAL 1970 19 0.96 0.92 0.95 (0.57, 1.49) 1499 0.62
Westchester Medical Center ##Charney R 81 1 1.23 0.44 2.57 (0.03,14.30) 77 0.00 #Cohen M B 229 3 1.31 1.41 0.85 (0.17, 2.48) 159 0.64 #Cuomo L 355 2 0.56 1.13 0.46 (0.05, 1.65) 257 0.71 ##Gotsis W 28 1 3.57 1.17 2.77 (0.04,15.41) 18 0.00 #Hadid A 74 0 0.00 0.41 0.00 (0.00,10.92) 74 0.00 #Hadid A B 59 0 0.00 0.51 0.00 (0.00,11.16) 55 0.00 #Hjemdahl-Monsen C 491 6 1.22 1.10 1.01 (0.37, 2.20) 429 0.46 ##Kalapatapu K 809 6 0.74 1.13 0.60 (0.22, 1.30) 691 0.23 ##Messinger D 52 0 0.00 0.54 0.00 (0.00,11.96) 51 0.00 #Pucillo A 347 7 2.02 1.10 1.67 (0.67, 3.45) 298 1.74 * ##Shih A T 205 3 1.46 0.81 1.65 (0.33, 4.81) 187 0.47 ##Silverman G 14 1 7.14 1.39 4.70 (0.06,26.13) 7 0.00 All Others 245 1 0.41 1.36 0.27 (0.00, 1.53) 163 0.56 TOTAL 2989 31 1.04 1.08 0.87 (0.59, 1.24) 2466 0.55
White Plains Hospital Center #Bliagos D 135 2 1.48 1.19 1.13 (0.13, 4.10) 114 1.20 ##Charney R 16 1 6.25 1.61 3.55 (0.05,19.74) 11 0.00 #Cohen M B 28 0 0.00 0.62 0.00 (0.00,19.30) 22 0.00 #Cuomo L 12 0 0.00 0.54 0.00 (0.00,51.85) 12 0.00
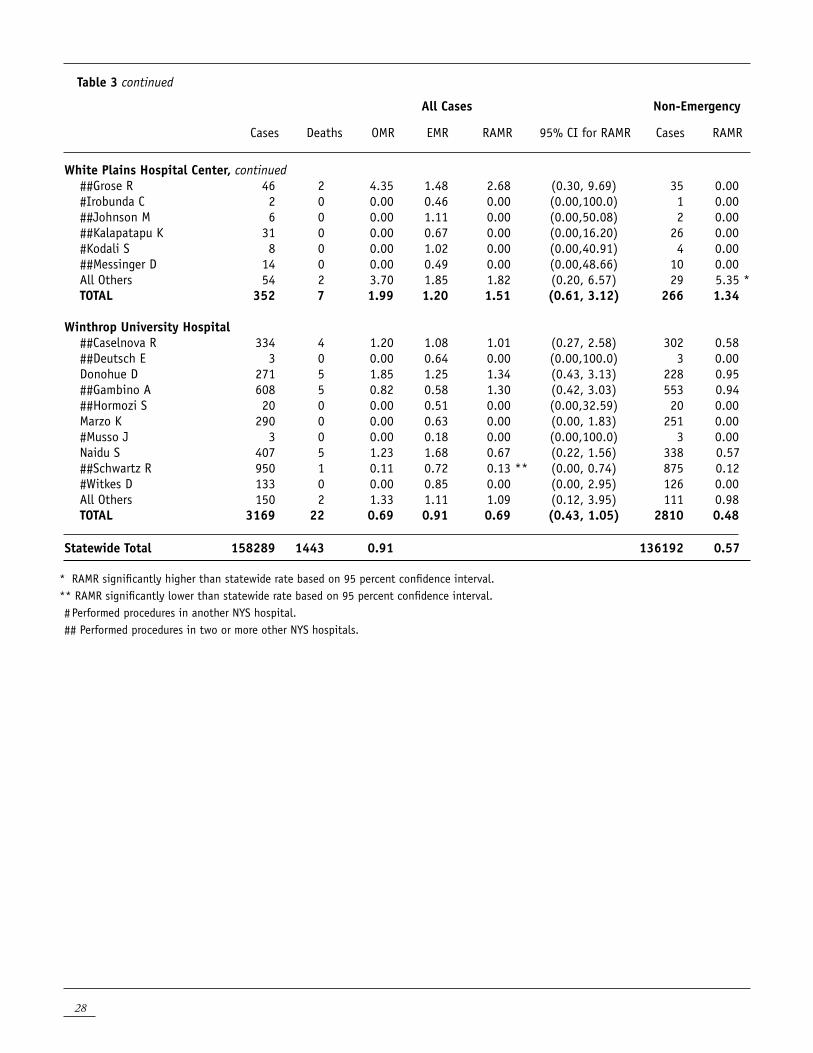
28
Table 3 continued
All Cases Non-Emergency
Cases Deaths OMR EMR RAMR 95% CI for RAMR Cases RAMR
White Plains Hospital Center, continued ##Grose R 46 2 4.35 1.48 2.68 (0.30, 9.69) 35 0.00 #Irobunda C 2 0 0.00 0.46 0.00 (0.00,100.0) 1 0.00 ##Johnson M 6 0 0.00 1.11 0.00 (0.00,50.08) 2 0.00 ##Kalapatapu K 31 0 0.00 0.67 0.00 (0.00,16.20) 26 0.00 #Kodali S 8 0 0.00 1.02 0.00 (0.00,40.91) 4 0.00 ##Messinger D 14 0 0.00 0.49 0.00 (0.00,48.66) 10 0.00 All Others 54 2 3.70 1.85 1.82 (0.20, 6.57) 29 5.35 * TOTAL 352 7 1.99 1.20 1.51 (0.61, 3.12) 266 1.34
Winthrop University Hospital ##Caselnova R 334 4 1.20 1.08 1.01 (0.27, 2.58) 302 0.58 ##Deutsch E 3 0 0.00 0.64 0.00 (0.00,100.0) 3 0.00 Donohue D 271 5 1.85 1.25 1.34 (0.43, 3.13) 228 0.95 ##Gambino A 608 5 0.82 0.58 1.30 (0.42, 3.03) 553 0.94 ##Hormozi S 20 0 0.00 0.51 0.00 (0.00,32.59) 20 0.00 Marzo K 290 0 0.00 0.63 0.00 (0.00, 1.83) 251 0.00 #Musso J 3 0 0.00 0.18 0.00 (0.00,100.0) 3 0.00 Naidu S 407 5 1.23 1.68 0.67 (0.22, 1.56) 338 0.57 ##Schwartz R 950 1 0.11 0.72 0.13 ** (0.00, 0.74) 875 0.12 #Witkes D 133 0 0.00 0.85 0.00 (0.00, 2.95) 126 0.00 All Others 150 2 1.33 1.11 1.09 (0.12, 3.95) 111 0.98 TOTAL 3169 22 0.69 0.91 0.69 (0.43, 1.05) 2810 0.48
Statewide Total 158289 1443 0.91 136192 0.57
* RAMR significantly higher than statewide rate based on 95 percent confidence interval. ** RAMR significantly lower than statewide rate based on 95 percent confidence interval. # Performed procedures in another NYS hospital.## Performed procedures in two or more other NYS hospitals.
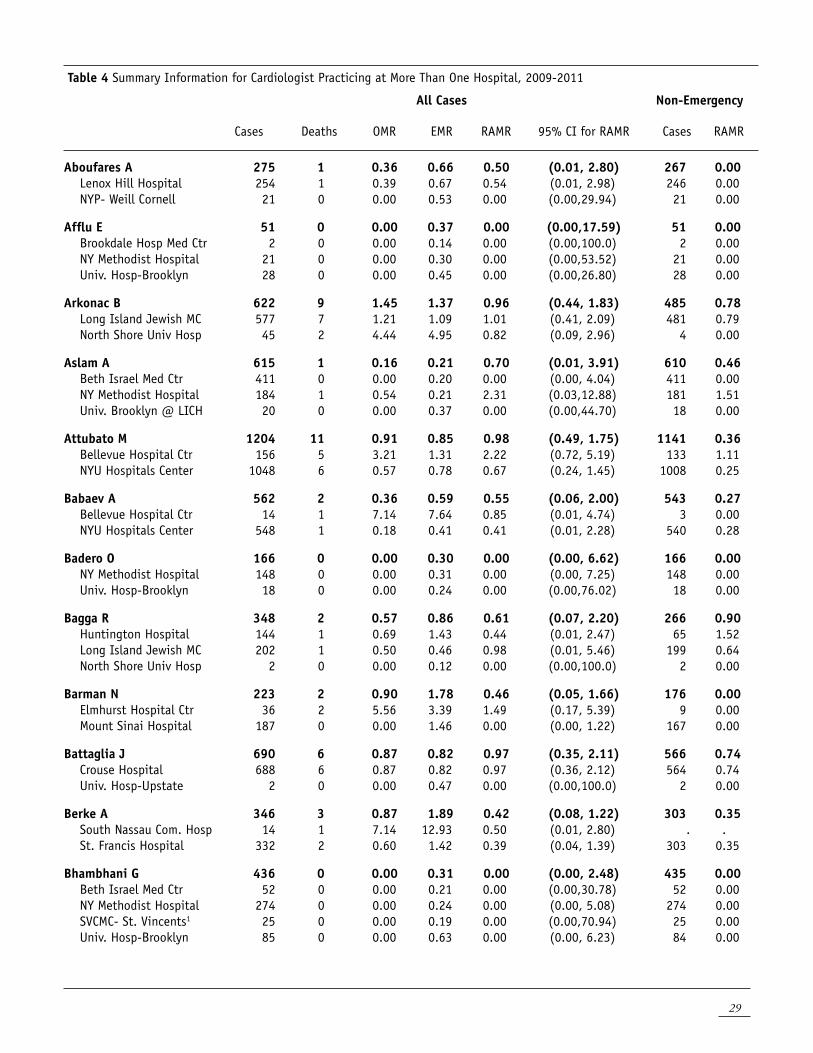
29
Table 4 Summary Information for Cardiologist Practicing at More Than One Hospital, 2009-2011
All Cases Non-Emergency
Cases Deaths OMR EMR RAMR 95% CI for RAMR Cases RAMR
Aboufares A 275 1 0.36 0.66 0.50 (0.01, 2.80) 267 0.00 Lenox Hill Hospital 254 1 0.39 0.67 0.54 (0.01, 2.98) 246 0.00 NYP- Weill Cornell 21 0 0.00 0.53 0.00 (0.00,29.94) 21 0.00
Afflu E 51 0 0.00 0.37 0.00 (0.00,17.59) 51 0.00 Brookdale Hosp Med Ctr 2 0 0.00 0.14 0.00 (0.00,100.0) 2 0.00 NY Methodist Hospital 21 0 0.00 0.30 0.00 (0.00,53.52) 21 0.00 Univ. Hosp-Brooklyn 28 0 0.00 0.45 0.00 (0.00,26.80) 28 0.00
Arkonac B 622 9 1.45 1.37 0.96 (0.44, 1.83) 485 0.78 Long Island Jewish MC 577 7 1.21 1.09 1.01 (0.41, 2.09) 481 0.79 North Shore Univ Hosp 45 2 4.44 4.95 0.82 (0.09, 2.96) 4 0.00
Aslam A 615 1 0.16 0.21 0.70 (0.01, 3.91) 610 0.46 Beth Israel Med Ctr 411 0 0.00 0.20 0.00 (0.00, 4.04) 411 0.00 NY Methodist Hospital 184 1 0.54 0.21 2.31 (0.03,12.88) 181 1.51 Univ. Brooklyn @ LICH 20 0 0.00 0.37 0.00 (0.00,44.70) 18 0.00
Attubato M 1204 11 0.91 0.85 0.98 (0.49, 1.75) 1141 0.36 Bellevue Hospital Ctr 156 5 3.21 1.31 2.22 (0.72, 5.19) 133 1.11 NYU Hospitals Center 1048 6 0.57 0.78 0.67 (0.24, 1.45) 1008 0.25
Babaev A 562 2 0.36 0.59 0.55 (0.06, 2.00) 543 0.27 Bellevue Hospital Ctr 14 1 7.14 7.64 0.85 (0.01, 4.74) 3 0.00 NYU Hospitals Center 548 1 0.18 0.41 0.41 (0.01, 2.28) 540 0.28
Badero O 166 0 0.00 0.30 0.00 (0.00, 6.62) 166 0.00 NY Methodist Hospital 148 0 0.00 0.31 0.00 (0.00, 7.25) 148 0.00 Univ. Hosp-Brooklyn 18 0 0.00 0.24 0.00 (0.00,76.02) 18 0.00
Bagga R 348 2 0.57 0.86 0.61 (0.07, 2.20) 266 0.90 Huntington Hospital 144 1 0.69 1.43 0.44 (0.01, 2.47) 65 1.52 Long Island Jewish MC 202 1 0.50 0.46 0.98 (0.01, 5.46) 199 0.64 North Shore Univ Hosp 2 0 0.00 0.12 0.00 (0.00,100.0) 2 0.00
Barman N 223 2 0.90 1.78 0.46 (0.05, 1.66) 176 0.00 Elmhurst Hospital Ctr 36 2 5.56 3.39 1.49 (0.17, 5.39) 9 0.00 Mount Sinai Hospital 187 0 0.00 1.46 0.00 (0.00, 1.22) 167 0.00
Battaglia J 690 6 0.87 0.82 0.97 (0.35, 2.11) 566 0.74 Crouse Hospital 688 6 0.87 0.82 0.97 (0.36, 2.12) 564 0.74 Univ. Hosp-Upstate 2 0 0.00 0.47 0.00 (0.00,100.0) 2 0.00
Berke A 346 3 0.87 1.89 0.42 (0.08, 1.22) 303 0.35 South Nassau Com. Hosp 14 1 7.14 12.93 0.50 (0.01, 2.80) . . St. Francis Hospital 332 2 0.60 1.42 0.39 (0.04, 1.39) 303 0.35
Bhambhani G 436 0 0.00 0.31 0.00 (0.00, 2.48) 435 0.00 Beth Israel Med Ctr 52 0 0.00 0.21 0.00 (0.00,30.78) 52 0.00 NY Methodist Hospital 274 0 0.00 0.24 0.00 (0.00, 5.08) 274 0.00 SVCMC- St. Vincents1 25 0 0.00 0.19 0.00 (0.00,70.94) 25 0.00 Univ. Hosp-Brooklyn 85 0 0.00 0.63 0.00 (0.00, 6.23) 84 0.00
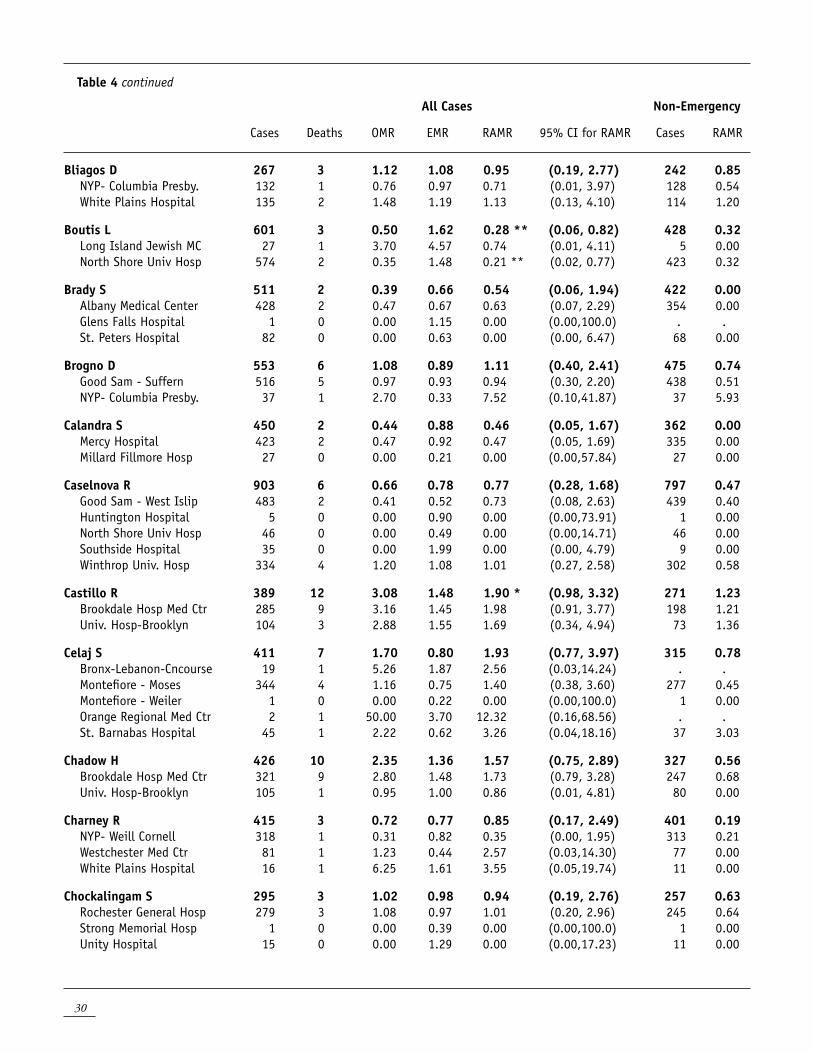
30
Table 4 continued
All Cases Non-Emergency
Cases Deaths OMR EMR RAMR 95% CI for RAMR Cases RAMR
Bliagos D 267 3 1.12 1.08 0.95 (0.19, 2.77) 242 0.85 NYP- Columbia Presby. 132 1 0.76 0.97 0.71 (0.01, 3.97) 128 0.54 White Plains Hospital 135 2 1.48 1.19 1.13 (0.13, 4.10) 114 1.20
Boutis L 601 3 0.50 1.62 0.28 ** (0.06, 0.82) 428 0.32 Long Island Jewish MC 27 1 3.70 4.57 0.74 (0.01, 4.11) 5 0.00 North Shore Univ Hosp 574 2 0.35 1.48 0.21 ** (0.02, 0.77) 423 0.32
Brady S 511 2 0.39 0.66 0.54 (0.06, 1.94) 422 0.00 Albany Medical Center 428 2 0.47 0.67 0.63 (0.07, 2.29) 354 0.00 Glens Falls Hospital 1 0 0.00 1.15 0.00 (0.00,100.0) . . St. Peters Hospital 82 0 0.00 0.63 0.00 (0.00, 6.47) 68 0.00
Brogno D 553 6 1.08 0.89 1.11 (0.40, 2.41) 475 0.74 Good Sam - Suffern 516 5 0.97 0.93 0.94 (0.30, 2.20) 438 0.51 NYP- Columbia Presby. 37 1 2.70 0.33 7.52 (0.10,41.87) 37 5.93
Calandra S 450 2 0.44 0.88 0.46 (0.05, 1.67) 362 0.00 Mercy Hospital 423 2 0.47 0.92 0.47 (0.05, 1.69) 335 0.00 Millard Fillmore Hosp 27 0 0.00 0.21 0.00 (0.00,57.84) 27 0.00
Caselnova R 903 6 0.66 0.78 0.77 (0.28, 1.68) 797 0.47 Good Sam - West Islip 483 2 0.41 0.52 0.73 (0.08, 2.63) 439 0.40 Huntington Hospital 5 0 0.00 0.90 0.00 (0.00,73.91) 1 0.00 North Shore Univ Hosp 46 0 0.00 0.49 0.00 (0.00,14.71) 46 0.00 Southside Hospital 35 0 0.00 1.99 0.00 (0.00, 4.79) 9 0.00 Winthrop Univ. Hosp 334 4 1.20 1.08 1.01 (0.27, 2.58) 302 0.58
Castillo R 389 12 3.08 1.48 1.90 * (0.98, 3.32) 271 1.23 Brookdale Hosp Med Ctr 285 9 3.16 1.45 1.98 (0.91, 3.77) 198 1.21 Univ. Hosp-Brooklyn 104 3 2.88 1.55 1.69 (0.34, 4.94) 73 1.36
Celaj S 411 7 1.70 0.80 1.93 (0.77, 3.97) 315 0.78 Bronx-Lebanon-Cncourse 19 1 5.26 1.87 2.56 (0.03,14.24) . . Montefiore - Moses 344 4 1.16 0.75 1.40 (0.38, 3.60) 277 0.45 Montefiore - Weiler 1 0 0.00 0.22 0.00 (0.00,100.0) 1 0.00 Orange Regional Med Ctr 2 1 50.00 3.70 12.32 (0.16,68.56) . . St. Barnabas Hospital 45 1 2.22 0.62 3.26 (0.04,18.16) 37 3.03
Chadow H 426 10 2.35 1.36 1.57 (0.75, 2.89) 327 0.56 Brookdale Hosp Med Ctr 321 9 2.80 1.48 1.73 (0.79, 3.28) 247 0.68 Univ. Hosp-Brooklyn 105 1 0.95 1.00 0.86 (0.01, 4.81) 80 0.00
Charney R 415 3 0.72 0.77 0.85 (0.17, 2.49) 401 0.19 NYP- Weill Cornell 318 1 0.31 0.82 0.35 (0.00, 1.95) 313 0.21 Westchester Med Ctr 81 1 1.23 0.44 2.57 (0.03,14.30) 77 0.00 White Plains Hospital 16 1 6.25 1.61 3.55 (0.05,19.74) 11 0.00
Chockalingam S 295 3 1.02 0.98 0.94 (0.19, 2.76) 257 0.63 Rochester General Hosp 279 3 1.08 0.97 1.01 (0.20, 2.96) 245 0.64 Strong Memorial Hosp 1 0 0.00 0.39 0.00 (0.00,100.0) 1 0.00 Unity Hospital 15 0 0.00 1.29 0.00 (0.00,17.23) 11 0.00
31
Table 4 continued
All Cases Non-Emergency
Cases Deaths OMR EMR RAMR 95% CI for RAMR Cases RAMR
Cohen M B 257 3 1.17 1.32 0.81 (0.16, 2.35) 181 0.57 Westchester Med Ctr 229 3 1.31 1.41 0.85 (0.17, 2.48) 159 0.64 White Plains Hospital 28 0 0.00 0.62 0.00 (0.00,19.30) 22 0.00
Conley J 1214 10 0.82 0.68 1.11 (0.53, 2.04) 1155 0.78 Buffalo General Hosp 1211 10 0.83 0.68 1.11 (0.53, 2.05) 1155 0.78 Millard Fillmore Hosp 3 0 0.00 1.80 0.00 (0.00,62.03) . .
Coppola J 130 1 0.77 0.60 1.16 (0.02, 6.47) 120 0.00 Bellevue Hospital Ctr 25 0 0.00 0.68 0.00 (0.00,19.65) 18 0.00 NYU Hospitals Center 98 1 1.02 0.60 1.55 (0.02, 8.60) 96 0.00 SVCMC- St. Vincents1 7 0 0.00 0.35 0.00 (0.00,100.0) 6 0.00
Corbelli J 928 8 0.86 0.80 0.99 (0.42, 1.94) 820 0.39 Buffalo General Hosp 8 1 12.50 2.84 4.02 (0.05,22.34) . . Millard Fillmore Hosp 920 7 0.76 0.78 0.89 (0.36, 1.83) 820 0.39
Coven D 204 4 1.96 1.07 1.67 (0.45, 4.28) 138 0.65 St. Lukes at St. Lukes 192 2 1.04 1.00 0.95 (0.11, 3.44) 138 0.65 Univ. Brooklyn @ LICH 12 2 16.67 2.23 6.80 (0.76,24.57) . .
Cuomo L 367 2 0.54 1.11 0.45 (0.05, 1.62) 269 0.68 Westchester Med Ctr 355 2 0.56 1.13 0.46 (0.05, 1.65) 257 0.71 White Plains Hospital 12 0 0.00 0.54 0.00 (0.00,51.85) 12 0.00
Dangas G 388 1 0.26 1.30 0.18 (0.00, 1.01) 350 0.18 Mount Sinai Hospital 147 0 0.00 1.23 0.00 (0.00, 1.84) 136 0.00 NYP- Columbia Presby. 241 1 0.41 1.34 0.28 (0.00, 1.57) 214 0.33
Delago A 1260 12 0.95 0.62 1.39 (0.72, 2.43) 1144 0.99 Albany Medical Center 1194 11 0.92 0.52 1.61 (0.80, 2.89) 1095 1.05 Glens Falls Hospital 1 0 0.00 0.89 0.00 (0.00,100.0) . . St. Peters Hospital 65 1 1.54 2.50 0.56 (0.01, 3.11) 49 0.00
Deutsch E 711 8 1.13 0.57 1.79 (0.77, 3.52) 635 1.25 Good Sam - West Islip 100 3 3.00 0.91 2.99 (0.60, 8.75) 79 1.77 Long Island Jewish MC 3 0 0.00 0.71 0.00 (0.00,100.0) 3 0.00 North Shore Univ Hosp 35 1 2.86 0.36 7.27 (0.10,40.46) 35 4.71 Southside Hospital 450 3 0.67 0.48 1.26 (0.25, 3.69) 414 0.81 St. Catherine of Siena 118 1 0.85 0.70 1.10 (0.01, 6.11) 99 1.52 St. Francis Hospital 2 0 0.00 0.20 0.00 (0.00,100.0) 2 0.00 Winthrop Univ. Hosp 3 0 0.00 0.64 0.00 (0.00,100.0) 3 0.00
Dhama B 547 4 0.73 0.69 0.97 (0.26, 2.48) 535 0.62 Long Island Jewish MC 370 2 0.54 0.67 0.73 (0.08, 2.64) 361 0.48 North Shore Univ Hosp 177 2 1.13 0.72 1.43 (0.16, 5.18) 174 0.89
Doling M 724 13 1.80 0.85 1.93 * (1.02, 3.29) 587 1.07 Rochester General Hosp 3 0 0.00 0.36 0.00 (0.00,100.0) 3 0.00 Strong Memorial Hosp 686 12 1.75 0.87 1.83 * (0.94, 3.19) 551 0.88 Unity Hospital 35 1 2.86 0.45 5.84 (0.08,32.48) 33 6.21
32
Table 4 continued
All Cases Non-Emergency
Cases Deaths OMR EMR RAMR 95% CI for RAMR Cases RAMR
Dominguez-Echevarria A 435 0 0.00 0.53 0.00 (0.00, 1.46) 431 0.00 Lenox Hill Hospital 157 0 0.00 0.41 0.00 (0.00, 5.15) 156 0.00 Lutheran Medical Ctr 63 0 0.00 0.87 0.00 (0.00, 6.13) 61 0.00 NY Methodist Hospital 41 0 0.00 0.30 0.00 (0.00,26.92) 41 0.00 NYP- Columbia Presby. 171 0 0.00 0.56 0.00 (0.00, 3.48) 170 0.00 SVCMC- St. Vincents1 3 0 0.00 0.30 0.00 (0.00,100.0) 3 0.00
Emerson R 258 7 2.71 1.28 1.93 (0.78, 3.99) 159 1.71 Erie County Med Ctr 1 0 0.00 0.36 0.00 (0.00,100.0) . . Mercy Hospital 257 7 2.72 1.28 1.94 (0.78, 3.99) 159 1.71
Esper D 589 5 0.85 0.86 0.90 (0.29, 2.09) 512 0.21 Albany Medical Center 185 3 1.62 0.86 1.72 (0.35, 5.03) 145 0.96 St. Peters Hospital 404 2 0.50 0.87 0.52 (0.06, 1.88) 367 0.00
Farhi E 721 4 0.55 0.75 0.67 (0.18, 1.72) 630 0.34 Buffalo General Hosp 716 4 0.56 0.75 0.68 (0.18, 1.75) 630 0.34 Millard Fillmore Hosp 5 0 0.00 1.72 0.00 (0.00,38.96) . .
Feit F 860 3 0.35 0.57 0.56 (0.11, 1.63) 785 0.17 Bellevue Hospital Ctr 218 0 0.00 0.76 0.00 (0.00, 2.01) 190 0.00 NYU Hospitals Center 642 3 0.47 0.50 0.85 (0.17, 2.47) 595 0.23
Fernaine G 827 6 0.73 0.76 0.87 (0.32, 1.90) 760 0.60 Lenox Hill Hospital 100 0 0.00 0.53 0.00 (0.00, 6.36) 98 0.00 Lutheran Medical Ctr 441 5 1.13 0.93 1.11 (0.36, 2.59) 376 0.97 Mount Sinai Hospital 286 1 0.35 0.57 0.56 (0.01, 3.11) 286 0.37
Freeman J 896 13 1.45 1.11 1.19 (0.63, 2.03) 705 0.77 North Shore Univ Hosp 11 0 0.00 1.84 0.00 (0.00,16.51) 10 0.00 South Nassau Com. Hosp 885 13 1.47 1.10 1.21 (0.65, 2.08) 695 0.80
Friedman G H 488 3 0.61 0.73 0.77 (0.15, 2.24) 435 0.57 Long Island Jewish MC 177 1 0.56 0.60 0.86 (0.01, 4.79) 169 0.73 NY Hospital - Queens 60 1 1.67 1.57 0.97 (0.01, 5.39) 43 0.00 North Shore Univ Hosp 153 0 0.00 0.50 0.00 (0.00, 4.40) 145 0.00 St. Francis Hospital 98 1 1.02 0.82 1.13 (0.01, 6.29) 78 1.32
Gade C 90 0 0.00 0.47 0.00 (0.00, 7.94) 85 0.00 Jamaica Hosp Med Ctr 1 0 0.00 5.60 0.00 (0.00,59.64) . . Lenox Hill Hospital 89 0 0.00 0.41 0.00 (0.00, 9.16) 85 0.00
Gambino A 631 6 0.95 0.57 1.53 (0.56, 3.33) 576 1.15 North Shore Univ Hosp 20 1 5.00 0.27 17.11 (0.22,95.21) 20 12.44 St. Francis Hospital 3 0 0.00 0.19 0.00 (0.00,100.0) 3 0.00 Winthrop Univ. Hosp 608 5 0.82 0.58 1.30 (0.42, 3.03) 553 0.94
Gelormini J 567 11 1.94 1.10 1.61 (0.80, 2.88) 455 1.43 Buffalo General Hosp 4 0 0.00 0.37 0.00 (0.00,100.0) 3 0.00 Mercy Hospital 457 11 2.41 1.26 1.74 (0.87, 3.11) 349 1.69* Millard Fillmore Hosp 106 0 0.00 0.41 0.00 (0.00, 7.60) 103 0.00
33
Table 4 continued
All Cases Non-Emergency
Cases Deaths OMR EMR RAMR 95% CI for RAMR Cases RAMR
George A 479 10 2.09 1.25 1.52 (0.73, 2.80) 382 0.84 Crouse Hospital 476 10 2.10 1.26 1.52 (0.73, 2.80) 379 0.85 Univ. Hosp-Upstate 3 0 0.00 0.38 0.00 (0.00,100.0) 3 0.00
Gosselin R 235 1 0.43 0.77 0.50 (0.01, 2.79) 180 0.65 St. Lukes Crnwll-Newbrg 110 0 0.00 0.81 0.00 (0.00, 3.75) 78 0.00 Vassar Bros. Med Ctr 125 1 0.80 0.74 0.99 (0.01, 5.49) 102 1.09
Gotsis W 887 12 1.35 0.77 1.59 (0.82, 2.78) 713 0.72 Montefiore - Weiler 433 7 1.62 0.73 2.01 (0.81, 4.14) 374 0.98 Orange Regional Med Ctr 426 4 0.94 0.79 1.08 (0.29, 2.77) 321 0.44 Westchester Med Ctr 28 1 3.57 1.17 2.77 (0.04,15.41) 18 0.00
Gowda R 1160 8 0.69 0.95 0.66 (0.28, 1.30) 1058 0.38 Beth Israel Med Ctr 958 7 0.73 0.82 0.81 (0.33, 1.67) 883 0.46 Univ. Brooklyn @ LICH 202 1 0.50 1.57 0.29 (0.00, 1.60) 175 0.00
Green S 500 3 0.60 1.20 0.46 (0.09, 1.34) 381 0.29 Long Island Jewish MC 23 0 0.00 2.38 0.00 (0.00, 6.11) 3 0.00 North Shore Univ Hosp 477 3 0.63 1.14 0.50 (0.10, 1.47) 378 0.30
Greenberg M 647 4 0.62 0.81 0.70 (0.19, 1.79) 525 0.23 Montefiore - Moses 644 4 0.62 0.80 0.71 (0.19, 1.81) 525 0.23 St. Barnabas Hospital 3 0 0.00 1.65 0.00 (0.00,67.48) . .
Grose R 279 3 1.08 0.82 1.20 (0.24, 3.50) 258 0.00 Montefiore - Moses 28 0 0.00 0.72 0.00 (0.00,16.58) 26 0.00 NYP- Columbia Presby. 205 1 0.49 0.68 0.65 (0.01, 3.62) 197 0.00 White Plains Hospital 46 2 4.35 1.48 2.68 (0.30, 9.69) 35 0.00
Grunwald A 453 2 0.44 0.85 0.47 (0.05, 1.71) 407 0.23 Long Island Jewish MC 195 0 0.00 0.82 0.00 (0.00, 2.08) 186 0.00 NY Hospital - Queens 64 0 0.00 1.54 0.00 (0.00, 3.40) 44 0.00 North Shore Univ Hosp 121 0 0.00 0.43 0.00 (0.00, 6.40) 115 0.00 St. Francis Hospital 73 2 2.74 1.02 2.45 (0.27, 8.83) 62 1.42
Gustafson G 466 5 1.07 0.80 1.23 (0.40, 2.87) 425 0.66 Lenox Hill Hospital 36 0 0.00 0.52 0.00 (0.00,17.81) 36 0.00 NY Hospital - Queens 420 5 1.19 0.83 1.31 (0.42, 3.06) 379 0.72 North Shore Univ Hosp 10 0 0.00 0.46 0.00 (0.00,72.02) 10 0.00
Hadid A 286 5 1.75 1.08 1.47 (0.47, 3.43) 251 1.01 St. Lukes Crnwll-Newbrg 212 5 2.36 1.32 1.63 (0.53, 3.80) 177 1.24 Westchester Med Ctr 74 0 0.00 0.41 0.00 (0.00,10.92) 74 0.00
Hadid A B 214 0 0.00 1.11 0.00 (0.00, 1.40) 169 0.00 St. Lukes Crnwll-Newbrg 155 0 0.00 1.34 0.00 (0.00, 1.60) 114 0.00 Westchester Med Ctr 59 0 0.00 0.51 0.00 (0.00,11.16) 55 0.00
Hameedi A 754 0 0.00 0.20 0.00 (0.00, 2.25) 753 0.00 Long Island Jewish MC 740 0 0.00 0.20 0.00 (0.00, 2.29) 739 0.00 Mount Sinai Hospital 9 0 0.00 0.22 0.00 (0.00,100.0) 9 0.00 NY Hospital - Queens 5 0 0.00 0.14 0.00 (0.00,100.0) 5 0.00
34
Table 4 continued
All Cases Non-Emergency
Cases Deaths OMR EMR RAMR 95% CI for RAMR Cases RAMR
Haq N 369 2 0.54 0.99 0.50 (0.06, 1.80) 270 0.34 Buffalo General Hosp 11 0 0.00 2.49 0.00 (0.00,12.20) . . Mercy Hospital 315 2 0.63 0.89 0.65 (0.07, 2.34) 249 0.36 Millard Fillmore Hosp 43 0 0.00 1.32 0.00 (0.00, 5.89) 21 0.00
Haq S 165 1 0.61 0.67 0.83 (0.01, 4.62) 163 0.55 NY Methodist Hospital 151 1 0.66 0.71 0.85 (0.01, 4.71) 149 0.56 NYP- Columbia Presby. 14 0 0.00 0.16 0.00 (0.00,100.0) 14 0.00
Hasan C 404 0 0.00 0.28 0.00 (0.00, 2.91) 403 0.00 Mount Sinai Hospital 401 0 0.00 0.28 0.00 (0.00, 2.93) 400 0.00 NY Hospital - Queens 1 0 0.00 0.13 0.00 (0.00,100.0) 1 0.00 SVCMC- St. Vincents1 2 0 0.00 0.31 0.00 (0.00,100.0) 2 0.00
Hjemdahl-Monsen C 530 7 1.32 1.10 1.10 (0.44, 2.26) 462 0.44 NYP- Columbia Presby. 39 1 2.56 1.03 2.26 (0.03,12.59) 33 0.00 Westchester Med Ctr 491 6 1.22 1.10 1.01 (0.37, 2.20) 429 0.46
Hormozi S 927 4 0.43 0.71 0.55 (0.15, 1.42) 792 0.38 Good Sam - West Islip 473 3 0.63 0.58 0.99 (0.20, 2.89) 425 0.44 North Shore Univ Hosp 102 1 0.98 0.47 1.89 (0.02,10.52) 99 1.58 South Nassau Com. Hosp 21 0 0.00 3.14 0.00 (0.00, 5.06) 8 0.00 Southside Hospital 225 0 0.00 0.79 0.00 (0.00, 1.87) 179 0.00 St. Catherine of Siena 86 0 0.00 0.93 0.00 (0.00, 4.17) 61 0.00 Winthrop Univ. Hosp 20 0 0.00 0.51 0.00 (0.00,32.59) 20 0.00
Hoyek W 579 6 1.04 0.81 1.17 (0.43, 2.55) 514 0.56 Lutheran Medical Ctr 56 2 3.57 1.39 2.34 (0.26, 8.45) 35 0.00 NY Methodist Hospital 306 1 0.33 0.42 0.71 (0.01, 3.98) 305 0.47 Staten Island Univ Hosp 217 3 1.38 1.20 1.05 (0.21, 3.06) 174 0.83
Iqbal S 325 3 0.92 0.98 0.85 (0.17, 2.50) 256 0.00 Bellevue Hospital Ctr 298 3 1.01 0.99 0.92 (0.19, 2.70) 237 0.00 NYU Hospitals Center 27 0 0.00 0.88 0.00 (0.00,14.12) 19 0.00
Irobunda C 122 1 0.82 0.47 1.60 (0.02, 8.93) 120 0.95 NYP- Columbia Presby. 120 1 0.83 0.47 1.63 (0.02, 9.08) 119 0.96 White Plains Hospital 2 0 0.00 0.46 0.00 (0.00,100.0) 1 0.00
Iyer V 256 5 1.95 1.44 1.24 (0.40, 2.89) 170 2.26 * Buffalo General Hosp 198 5 2.53 1.22 1.88 (0.61, 4.39) 154 2.47 * Erie County Med Ctr 46 0 0.00 1.93 0.00 (0.00, 3.76) 14 0.00 Millard Fillmore Hosp 12 0 0.00 3.07 0.00 (0.00, 9.08) 2 0.00
Jafar M 622 4 0.64 0.90 0.65 (0.17, 1.66) 482 0.60 St. Lukes Crnwll-Newbrg 11 0 0.00 0.62 0.00 (0.00,49.00) 9 0.00 Vassar Bros. Med Ctr 611 4 0.65 0.91 0.66 (0.18, 1.68) 473 0.61
Jain S 518 9 1.74 1.59 1.00 (0.46, 1.89) 385 0.70 Jamaica Hosp Med Ctr 164 7 4.27 3.35 1.16 (0.47, 2.40) 42 2.81 Lenox Hill Hospital 354 2 0.56 0.77 0.67 (0.07, 2.41) 343 0.51
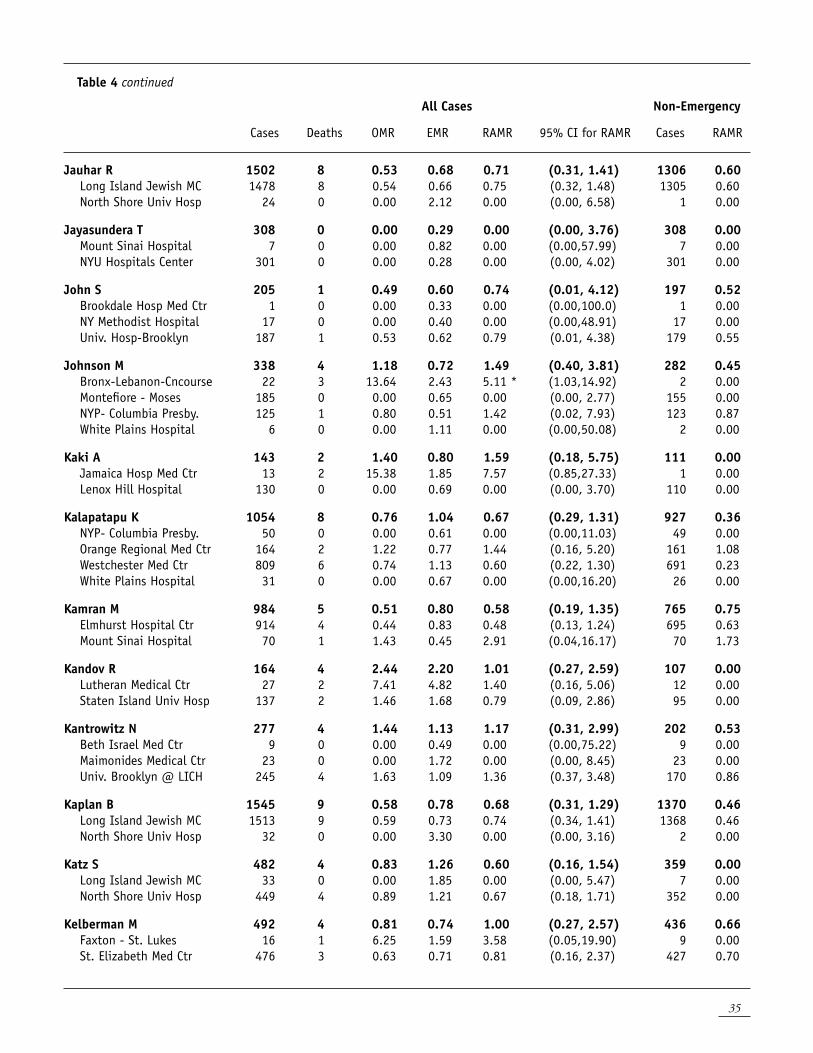
35
Table 4 continued
All Cases Non-Emergency
Cases Deaths OMR EMR RAMR 95% CI for RAMR Cases RAMR
Jauhar R 1502 8 0.53 0.68 0.71 (0.31, 1.41) 1306 0.60 Long Island Jewish MC 1478 8 0.54 0.66 0.75 (0.32, 1.48) 1305 0.60 North Shore Univ Hosp 24 0 0.00 2.12 0.00 (0.00, 6.58) 1 0.00
Jayasundera T 308 0 0.00 0.29 0.00 (0.00, 3.76) 308 0.00 Mount Sinai Hospital 7 0 0.00 0.82 0.00 (0.00,57.99) 7 0.00 NYU Hospitals Center 301 0 0.00 0.28 0.00 (0.00, 4.02) 301 0.00
John S 205 1 0.49 0.60 0.74 (0.01, 4.12) 197 0.52 Brookdale Hosp Med Ctr 1 0 0.00 0.33 0.00 (0.00,100.0) 1 0.00 NY Methodist Hospital 17 0 0.00 0.40 0.00 (0.00,48.91) 17 0.00 Univ. Hosp-Brooklyn 187 1 0.53 0.62 0.79 (0.01, 4.38) 179 0.55
Johnson M 338 4 1.18 0.72 1.49 (0.40, 3.81) 282 0.45 Bronx-Lebanon-Cncourse 22 3 13.64 2.43 5.11 * (1.03,14.92) 2 0.00 Montefiore - Moses 185 0 0.00 0.65 0.00 (0.00, 2.77) 155 0.00 NYP- Columbia Presby. 125 1 0.80 0.51 1.42 (0.02, 7.93) 123 0.87 White Plains Hospital 6 0 0.00 1.11 0.00 (0.00,50.08) 2 0.00
Kaki A 143 2 1.40 0.80 1.59 (0.18, 5.75) 111 0.00 Jamaica Hosp Med Ctr 13 2 15.38 1.85 7.57 (0.85,27.33) 1 0.00 Lenox Hill Hospital 130 0 0.00 0.69 0.00 (0.00, 3.70) 110 0.00
Kalapatapu K 1054 8 0.76 1.04 0.67 (0.29, 1.31) 927 0.36 NYP- Columbia Presby. 50 0 0.00 0.61 0.00 (0.00,11.03) 49 0.00 Orange Regional Med Ctr 164 2 1.22 0.77 1.44 (0.16, 5.20) 161 1.08 Westchester Med Ctr 809 6 0.74 1.13 0.60 (0.22, 1.30) 691 0.23 White Plains Hospital 31 0 0.00 0.67 0.00 (0.00,16.20) 26 0.00
Kamran M 984 5 0.51 0.80 0.58 (0.19, 1.35) 765 0.75 Elmhurst Hospital Ctr 914 4 0.44 0.83 0.48 (0.13, 1.24) 695 0.63 Mount Sinai Hospital 70 1 1.43 0.45 2.91 (0.04,16.17) 70 1.73
Kandov R 164 4 2.44 2.20 1.01 (0.27, 2.59) 107 0.00 Lutheran Medical Ctr 27 2 7.41 4.82 1.40 (0.16, 5.06) 12 0.00 Staten Island Univ Hosp 137 2 1.46 1.68 0.79 (0.09, 2.86) 95 0.00
Kantrowitz N 277 4 1.44 1.13 1.17 (0.31, 2.99) 202 0.53 Beth Israel Med Ctr 9 0 0.00 0.49 0.00 (0.00,75.22) 9 0.00 Maimonides Medical Ctr 23 0 0.00 1.72 0.00 (0.00, 8.45) 23 0.00 Univ. Brooklyn @ LICH 245 4 1.63 1.09 1.36 (0.37, 3.48) 170 0.86
Kaplan B 1545 9 0.58 0.78 0.68 (0.31, 1.29) 1370 0.46 Long Island Jewish MC 1513 9 0.59 0.73 0.74 (0.34, 1.41) 1368 0.46 North Shore Univ Hosp 32 0 0.00 3.30 0.00 (0.00, 3.16) 2 0.00
Katz S 482 4 0.83 1.26 0.60 (0.16, 1.54) 359 0.00 Long Island Jewish MC 33 0 0.00 1.85 0.00 (0.00, 5.47) 7 0.00 North Shore Univ Hosp 449 4 0.89 1.21 0.67 (0.18, 1.71) 352 0.00
Kelberman M 492 4 0.81 0.74 1.00 (0.27, 2.57) 436 0.66 Faxton - St. Lukes 16 1 6.25 1.59 3.58 (0.05,19.90) 9 0.00 St. Elizabeth Med Ctr 476 3 0.63 0.71 0.81 (0.16, 2.37) 427 0.70
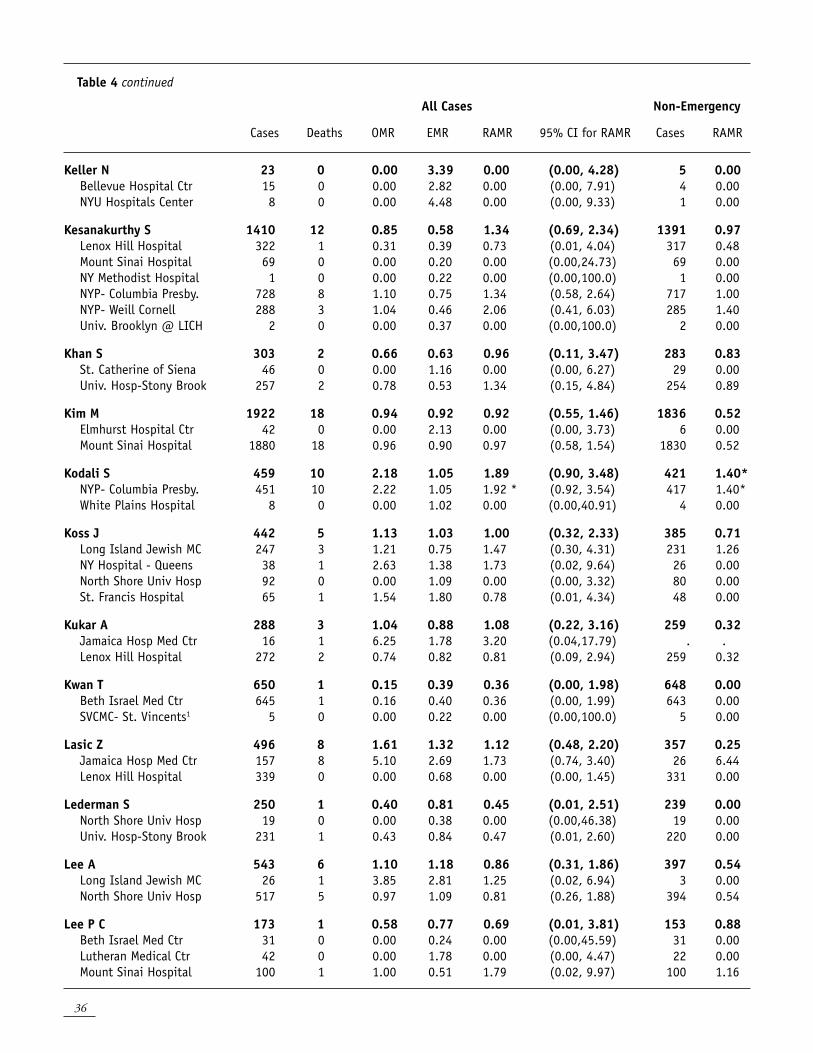
36
Table 4 continued
All Cases Non-Emergency
Cases Deaths OMR EMR RAMR 95% CI for RAMR Cases RAMR
Keller N 23 0 0.00 3.39 0.00 (0.00, 4.28) 5 0.00 Bellevue Hospital Ctr 15 0 0.00 2.82 0.00 (0.00, 7.91) 4 0.00 NYU Hospitals Center 8 0 0.00 4.48 0.00 (0.00, 9.33) 1 0.00
Kesanakurthy S 1410 12 0.85 0.58 1.34 (0.69, 2.34) 1391 0.97 Lenox Hill Hospital 322 1 0.31 0.39 0.73 (0.01, 4.04) 317 0.48 Mount Sinai Hospital 69 0 0.00 0.20 0.00 (0.00,24.73) 69 0.00 NY Methodist Hospital 1 0 0.00 0.22 0.00 (0.00,100.0) 1 0.00 NYP- Columbia Presby. 728 8 1.10 0.75 1.34 (0.58, 2.64) 717 1.00 NYP- Weill Cornell 288 3 1.04 0.46 2.06 (0.41, 6.03) 285 1.40 Univ. Brooklyn @ LICH 2 0 0.00 0.37 0.00 (0.00,100.0) 2 0.00
Khan S 303 2 0.66 0.63 0.96 (0.11, 3.47) 283 0.83 St. Catherine of Siena 46 0 0.00 1.16 0.00 (0.00, 6.27) 29 0.00 Univ. Hosp-Stony Brook 257 2 0.78 0.53 1.34 (0.15, 4.84) 254 0.89
Kim M 1922 18 0.94 0.92 0.92 (0.55, 1.46) 1836 0.52 Elmhurst Hospital Ctr 42 0 0.00 2.13 0.00 (0.00, 3.73) 6 0.00 Mount Sinai Hospital 1880 18 0.96 0.90 0.97 (0.58, 1.54) 1830 0.52
Kodali S 459 10 2.18 1.05 1.89 (0.90, 3.48) 421 1.40* NYP- Columbia Presby. 451 10 2.22 1.05 1.92 * (0.92, 3.54) 417 1.40* White Plains Hospital 8 0 0.00 1.02 0.00 (0.00,40.91) 4 0.00
Koss J 442 5 1.13 1.03 1.00 (0.32, 2.33) 385 0.71 Long Island Jewish MC 247 3 1.21 0.75 1.47 (0.30, 4.31) 231 1.26 NY Hospital - Queens 38 1 2.63 1.38 1.73 (0.02, 9.64) 26 0.00 North Shore Univ Hosp 92 0 0.00 1.09 0.00 (0.00, 3.32) 80 0.00 St. Francis Hospital 65 1 1.54 1.80 0.78 (0.01, 4.34) 48 0.00
Kukar A 288 3 1.04 0.88 1.08 (0.22, 3.16) 259 0.32 Jamaica Hosp Med Ctr 16 1 6.25 1.78 3.20 (0.04,17.79) . . Lenox Hill Hospital 272 2 0.74 0.82 0.81 (0.09, 2.94) 259 0.32
Kwan T 650 1 0.15 0.39 0.36 (0.00, 1.98) 648 0.00 Beth Israel Med Ctr 645 1 0.16 0.40 0.36 (0.00, 1.99) 643 0.00 SVCMC- St. Vincents1 5 0 0.00 0.22 0.00 (0.00,100.0) 5 0.00
Lasic Z 496 8 1.61 1.32 1.12 (0.48, 2.20) 357 0.25 Jamaica Hosp Med Ctr 157 8 5.10 2.69 1.73 (0.74, 3.40) 26 6.44 Lenox Hill Hospital 339 0 0.00 0.68 0.00 (0.00, 1.45) 331 0.00
Lederman S 250 1 0.40 0.81 0.45 (0.01, 2.51) 239 0.00 North Shore Univ Hosp 19 0 0.00 0.38 0.00 (0.00,46.38) 19 0.00 Univ. Hosp-Stony Brook 231 1 0.43 0.84 0.47 (0.01, 2.60) 220 0.00
Lee A 543 6 1.10 1.18 0.86 (0.31, 1.86) 397 0.54 Long Island Jewish MC 26 1 3.85 2.81 1.25 (0.02, 6.94) 3 0.00 North Shore Univ Hosp 517 5 0.97 1.09 0.81 (0.26, 1.88) 394 0.54
Lee P C 173 1 0.58 0.77 0.69 (0.01, 3.81) 153 0.88 Beth Israel Med Ctr 31 0 0.00 0.24 0.00 (0.00,45.59) 31 0.00 Lutheran Medical Ctr 42 0 0.00 1.78 0.00 (0.00, 4.47) 22 0.00 Mount Sinai Hospital 100 1 1.00 0.51 1.79 (0.02, 9.97) 100 1.16
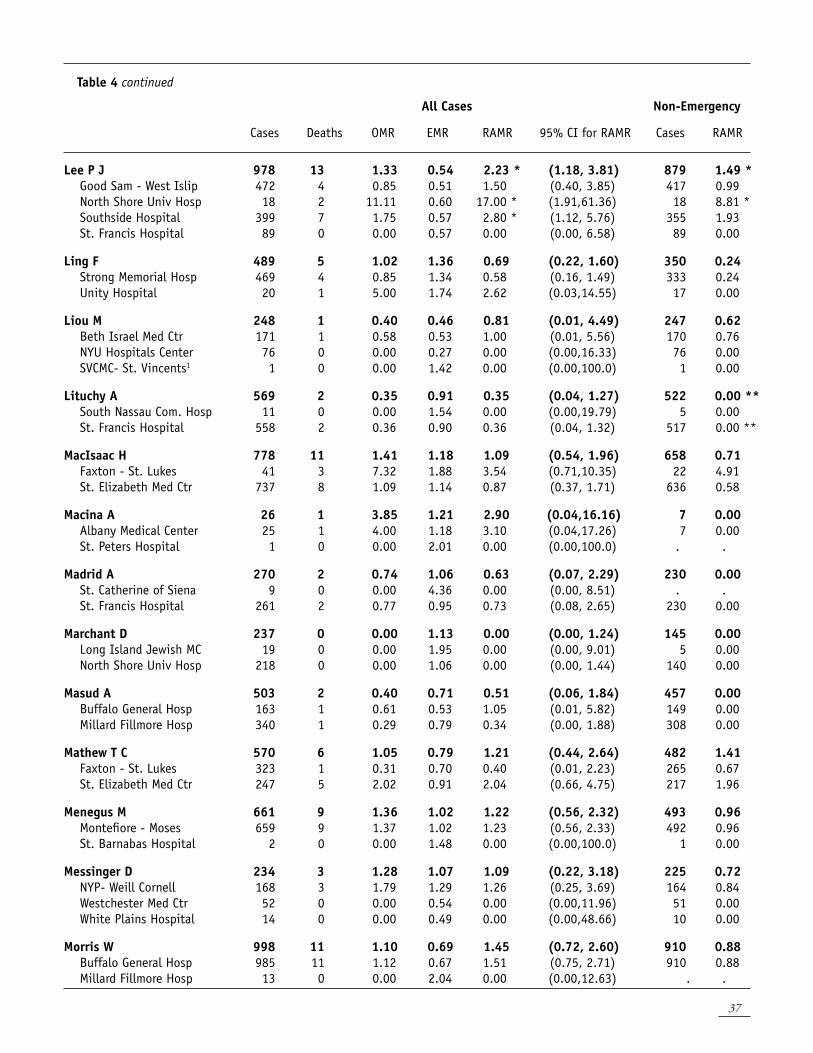
37
Table 4 continued
All Cases Non-Emergency
Cases Deaths OMR EMR RAMR 95% CI for RAMR Cases RAMR
Lee P J 978 13 1.33 0.54 2.23 * (1.18, 3.81) 879 1.49 * Good Sam - West Islip 472 4 0.85 0.51 1.50 (0.40, 3.85) 417 0.99 North Shore Univ Hosp 18 2 11.11 0.60 17.00 * (1.91,61.36) 18 8.81 * Southside Hospital 399 7 1.75 0.57 2.80 * (1.12, 5.76) 355 1.93 St. Francis Hospital 89 0 0.00 0.57 0.00 (0.00, 6.58) 89 0.00
Ling F 489 5 1.02 1.36 0.69 (0.22, 1.60) 350 0.24 Strong Memorial Hosp 469 4 0.85 1.34 0.58 (0.16, 1.49) 333 0.24 Unity Hospital 20 1 5.00 1.74 2.62 (0.03,14.55) 17 0.00
Liou M 248 1 0.40 0.46 0.81 (0.01, 4.49) 247 0.62 Beth Israel Med Ctr 171 1 0.58 0.53 1.00 (0.01, 5.56) 170 0.76 NYU Hospitals Center 76 0 0.00 0.27 0.00 (0.00,16.33) 76 0.00 SVCMC- St. Vincents1 1 0 0.00 1.42 0.00 (0.00,100.0) 1 0.00
Lituchy A 569 2 0.35 0.91 0.35 (0.04, 1.27) 522 0.00 ** South Nassau Com. Hosp 11 0 0.00 1.54 0.00 (0.00,19.79) 5 0.00 St. Francis Hospital 558 2 0.36 0.90 0.36 (0.04, 1.32) 517 0.00 **
MacIsaac H 778 11 1.41 1.18 1.09 (0.54, 1.96) 658 0.71 Faxton - St. Lukes 41 3 7.32 1.88 3.54 (0.71,10.35) 22 4.91 St. Elizabeth Med Ctr 737 8 1.09 1.14 0.87 (0.37, 1.71) 636 0.58
Macina A 26 1 3.85 1.21 2.90 (0.04,16.16) 7 0.00 Albany Medical Center 25 1 4.00 1.18 3.10 (0.04,17.26) 7 0.00 St. Peters Hospital 1 0 0.00 2.01 0.00 (0.00,100.0) . .
Madrid A 270 2 0.74 1.06 0.63 (0.07, 2.29) 230 0.00 St. Catherine of Siena 9 0 0.00 4.36 0.00 (0.00, 8.51) . . St. Francis Hospital 261 2 0.77 0.95 0.73 (0.08, 2.65) 230 0.00
Marchant D 237 0 0.00 1.13 0.00 (0.00, 1.24) 145 0.00 Long Island Jewish MC 19 0 0.00 1.95 0.00 (0.00, 9.01) 5 0.00 North Shore Univ Hosp 218 0 0.00 1.06 0.00 (0.00, 1.44) 140 0.00
Masud A 503 2 0.40 0.71 0.51 (0.06, 1.84) 457 0.00 Buffalo General Hosp 163 1 0.61 0.53 1.05 (0.01, 5.82) 149 0.00 Millard Fillmore Hosp 340 1 0.29 0.79 0.34 (0.00, 1.88) 308 0.00
Mathew T C 570 6 1.05 0.79 1.21 (0.44, 2.64) 482 1.41 Faxton - St. Lukes 323 1 0.31 0.70 0.40 (0.01, 2.23) 265 0.67 St. Elizabeth Med Ctr 247 5 2.02 0.91 2.04 (0.66, 4.75) 217 1.96
Menegus M 661 9 1.36 1.02 1.22 (0.56, 2.32) 493 0.96 Montefiore - Moses 659 9 1.37 1.02 1.23 (0.56, 2.33) 492 0.96 St. Barnabas Hospital 2 0 0.00 1.48 0.00 (0.00,100.0) 1 0.00
Messinger D 234 3 1.28 1.07 1.09 (0.22, 3.18) 225 0.72 NYP- Weill Cornell 168 3 1.79 1.29 1.26 (0.25, 3.69) 164 0.84 Westchester Med Ctr 52 0 0.00 0.54 0.00 (0.00,11.96) 51 0.00 White Plains Hospital 14 0 0.00 0.49 0.00 (0.00,48.66) 10 0.00
Morris W 998 11 1.10 0.69 1.45 (0.72, 2.60) 910 0.88 Buffalo General Hosp 985 11 1.12 0.67 1.51 (0.75, 2.71) 910 0.88 Millard Fillmore Hosp 13 0 0.00 2.04 0.00 (0.00,12.63) . .
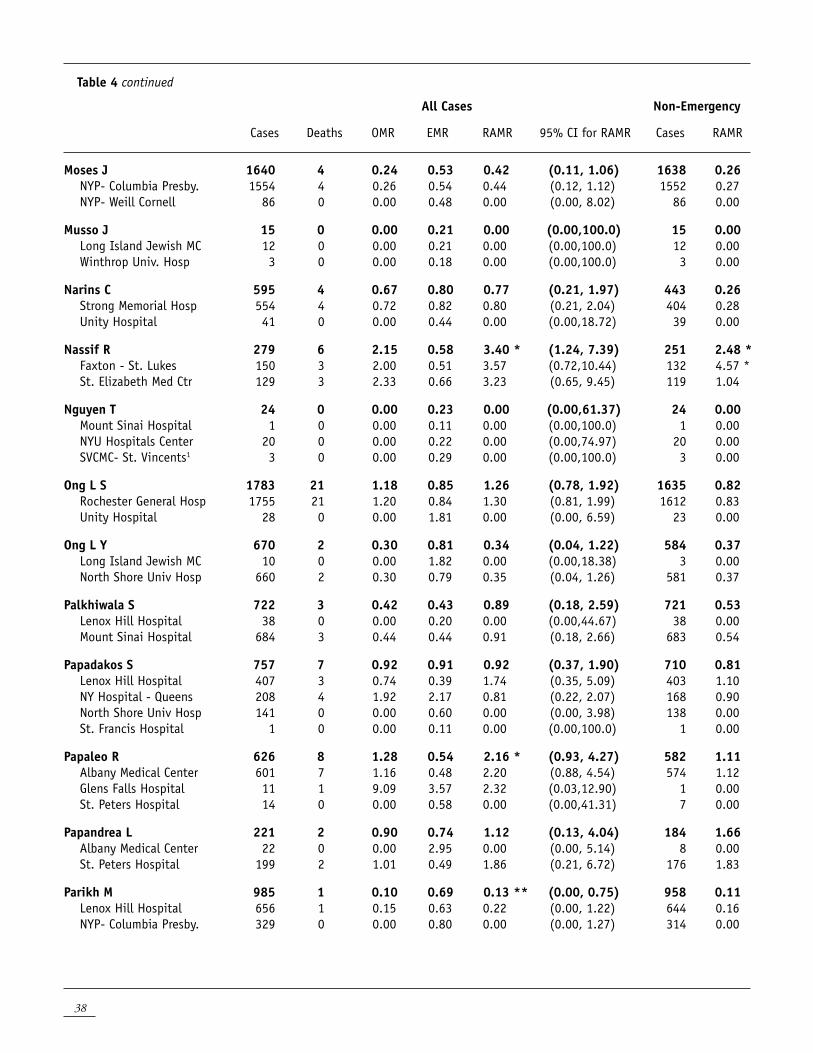
38
Table 4 continued
All Cases Non-Emergency
Cases Deaths OMR EMR RAMR 95% CI for RAMR Cases RAMR
Moses J 1640 4 0.24 0.53 0.42 (0.11, 1.06) 1638 0.26 NYP- Columbia Presby. 1554 4 0.26 0.54 0.44 (0.12, 1.12) 1552 0.27 NYP- Weill Cornell 86 0 0.00 0.48 0.00 (0.00, 8.02) 86 0.00
Musso J 15 0 0.00 0.21 0.00 (0.00,100.0) 15 0.00 Long Island Jewish MC 12 0 0.00 0.21 0.00 (0.00,100.0) 12 0.00 Winthrop Univ. Hosp 3 0 0.00 0.18 0.00 (0.00,100.0) 3 0.00
Narins C 595 4 0.67 0.80 0.77 (0.21, 1.97) 443 0.26 Strong Memorial Hosp 554 4 0.72 0.82 0.80 (0.21, 2.04) 404 0.28 Unity Hospital 41 0 0.00 0.44 0.00 (0.00,18.72) 39 0.00
Nassif R 279 6 2.15 0.58 3.40 * (1.24, 7.39) 251 2.48 * Faxton - St. Lukes 150 3 2.00 0.51 3.57 (0.72,10.44) 132 4.57 * St. Elizabeth Med Ctr 129 3 2.33 0.66 3.23 (0.65, 9.45) 119 1.04
Nguyen T 24 0 0.00 0.23 0.00 (0.00,61.37) 24 0.00 Mount Sinai Hospital 1 0 0.00 0.11 0.00 (0.00,100.0) 1 0.00 NYU Hospitals Center 20 0 0.00 0.22 0.00 (0.00,74.97) 20 0.00 SVCMC- St. Vincents1 3 0 0.00 0.29 0.00 (0.00,100.0) 3 0.00
Ong L S 1783 21 1.18 0.85 1.26 (0.78, 1.92) 1635 0.82 Rochester General Hosp 1755 21 1.20 0.84 1.30 (0.81, 1.99) 1612 0.83 Unity Hospital 28 0 0.00 1.81 0.00 (0.00, 6.59) 23 0.00
Ong L Y 670 2 0.30 0.81 0.34 (0.04, 1.22) 584 0.37 Long Island Jewish MC 10 0 0.00 1.82 0.00 (0.00,18.38) 3 0.00 North Shore Univ Hosp 660 2 0.30 0.79 0.35 (0.04, 1.26) 581 0.37
Palkhiwala S 722 3 0.42 0.43 0.89 (0.18, 2.59) 721 0.53 Lenox Hill Hospital 38 0 0.00 0.20 0.00 (0.00,44.67) 38 0.00 Mount Sinai Hospital 684 3 0.44 0.44 0.91 (0.18, 2.66) 683 0.54
Papadakos S 757 7 0.92 0.91 0.92 (0.37, 1.90) 710 0.81 Lenox Hill Hospital 407 3 0.74 0.39 1.74 (0.35, 5.09) 403 1.10 NY Hospital - Queens 208 4 1.92 2.17 0.81 (0.22, 2.07) 168 0.90 North Shore Univ Hosp 141 0 0.00 0.60 0.00 (0.00, 3.98) 138 0.00 St. Francis Hospital 1 0 0.00 0.11 0.00 (0.00,100.0) 1 0.00
Papaleo R 626 8 1.28 0.54 2.16 * (0.93, 4.27) 582 1.11 Albany Medical Center 601 7 1.16 0.48 2.20 (0.88, 4.54) 574 1.12 Glens Falls Hospital 11 1 9.09 3.57 2.32 (0.03,12.90) 1 0.00 St. Peters Hospital 14 0 0.00 0.58 0.00 (0.00,41.31) 7 0.00
Papandrea L 221 2 0.90 0.74 1.12 (0.13, 4.04) 184 1.66 Albany Medical Center 22 0 0.00 2.95 0.00 (0.00, 5.14) 8 0.00 St. Peters Hospital 199 2 1.01 0.49 1.86 (0.21, 6.72) 176 1.83
Parikh M 985 1 0.10 0.69 0.13 ** (0.00, 0.75) 958 0.11 Lenox Hill Hospital 656 1 0.15 0.63 0.22 (0.00, 1.22) 644 0.16 NYP- Columbia Presby. 329 0 0.00 0.80 0.00 (0.00, 1.27) 314 0.00
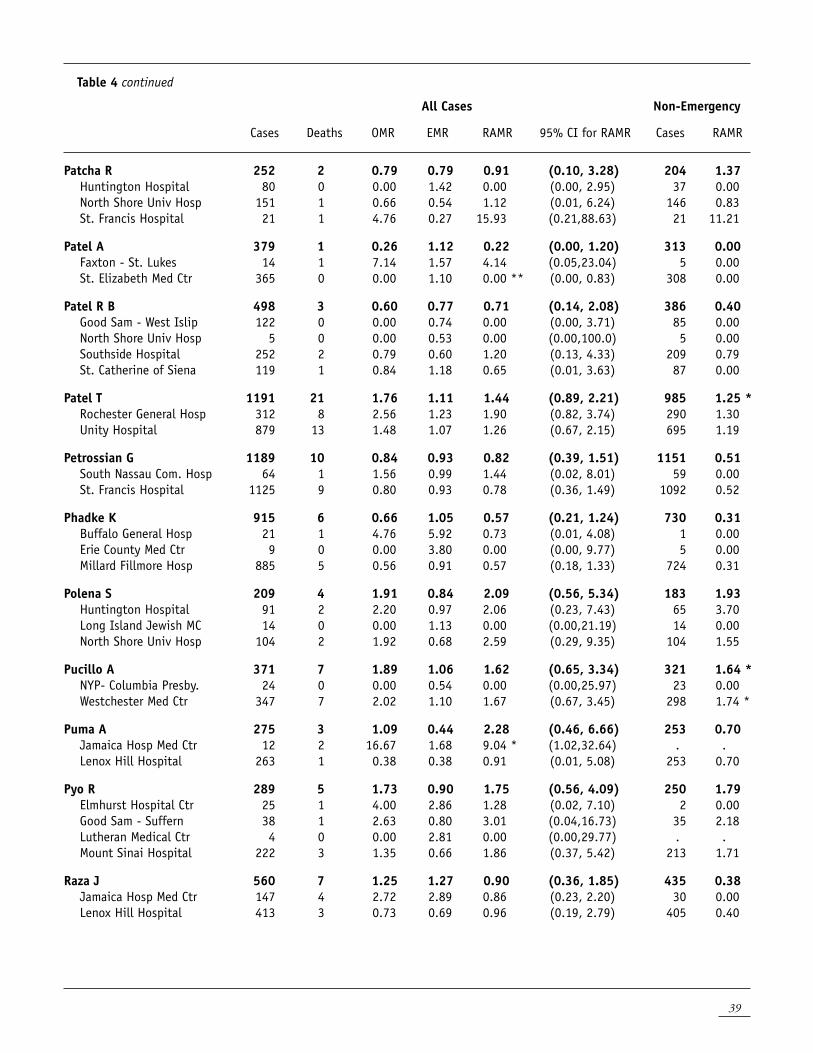
39
Table 4 continued
All Cases Non-Emergency
Cases Deaths OMR EMR RAMR 95% CI for RAMR Cases RAMR
Patcha R 252 2 0.79 0.79 0.91 (0.10, 3.28) 204 1.37 Huntington Hospital 80 0 0.00 1.42 0.00 (0.00, 2.95) 37 0.00 North Shore Univ Hosp 151 1 0.66 0.54 1.12 (0.01, 6.24) 146 0.83 St. Francis Hospital 21 1 4.76 0.27 15.93 (0.21,88.63) 21 11.21
Patel A 379 1 0.26 1.12 0.22 (0.00, 1.20) 313 0.00 Faxton - St. Lukes 14 1 7.14 1.57 4.14 (0.05,23.04) 5 0.00 St. Elizabeth Med Ctr 365 0 0.00 1.10 0.00 ** (0.00, 0.83) 308 0.00
Patel R B 498 3 0.60 0.77 0.71 (0.14, 2.08) 386 0.40 Good Sam - West Islip 122 0 0.00 0.74 0.00 (0.00, 3.71) 85 0.00 North Shore Univ Hosp 5 0 0.00 0.53 0.00 (0.00,100.0) 5 0.00 Southside Hospital 252 2 0.79 0.60 1.20 (0.13, 4.33) 209 0.79 St. Catherine of Siena 119 1 0.84 1.18 0.65 (0.01, 3.63) 87 0.00
Patel T 1191 21 1.76 1.11 1.44 (0.89, 2.21) 985 1.25 * Rochester General Hosp 312 8 2.56 1.23 1.90 (0.82, 3.74) 290 1.30 Unity Hospital 879 13 1.48 1.07 1.26 (0.67, 2.15) 695 1.19
Petrossian G 1189 10 0.84 0.93 0.82 (0.39, 1.51) 1151 0.51 South Nassau Com. Hosp 64 1 1.56 0.99 1.44 (0.02, 8.01) 59 0.00 St. Francis Hospital 1125 9 0.80 0.93 0.78 (0.36, 1.49) 1092 0.52
Phadke K 915 6 0.66 1.05 0.57 (0.21, 1.24) 730 0.31 Buffalo General Hosp 21 1 4.76 5.92 0.73 (0.01, 4.08) 1 0.00 Erie County Med Ctr 9 0 0.00 3.80 0.00 (0.00, 9.77) 5 0.00 Millard Fillmore Hosp 885 5 0.56 0.91 0.57 (0.18, 1.33) 724 0.31
Polena S 209 4 1.91 0.84 2.09 (0.56, 5.34) 183 1.93 Huntington Hospital 91 2 2.20 0.97 2.06 (0.23, 7.43) 65 3.70 Long Island Jewish MC 14 0 0.00 1.13 0.00 (0.00,21.19) 14 0.00 North Shore Univ Hosp 104 2 1.92 0.68 2.59 (0.29, 9.35) 104 1.55
Pucillo A 371 7 1.89 1.06 1.62 (0.65, 3.34) 321 1.64 * NYP- Columbia Presby. 24 0 0.00 0.54 0.00 (0.00,25.97) 23 0.00 Westchester Med Ctr 347 7 2.02 1.10 1.67 (0.67, 3.45) 298 1.74 *
Puma A 275 3 1.09 0.44 2.28 (0.46, 6.66) 253 0.70 Jamaica Hosp Med Ctr 12 2 16.67 1.68 9.04 * (1.02,32.64) . . Lenox Hill Hospital 263 1 0.38 0.38 0.91 (0.01, 5.08) 253 0.70
Pyo R 289 5 1.73 0.90 1.75 (0.56, 4.09) 250 1.79 Elmhurst Hospital Ctr 25 1 4.00 2.86 1.28 (0.02, 7.10) 2 0.00 Good Sam - Suffern 38 1 2.63 0.80 3.01 (0.04,16.73) 35 2.18 Lutheran Medical Ctr 4 0 0.00 2.81 0.00 (0.00,29.77) . . Mount Sinai Hospital 222 3 1.35 0.66 1.86 (0.37, 5.42) 213 1.71
Raza J 560 7 1.25 1.27 0.90 (0.36, 1.85) 435 0.38 Jamaica Hosp Med Ctr 147 4 2.72 2.89 0.86 (0.23, 2.20) 30 0.00 Lenox Hill Hospital 413 3 0.73 0.69 0.96 (0.19, 2.79) 405 0.40
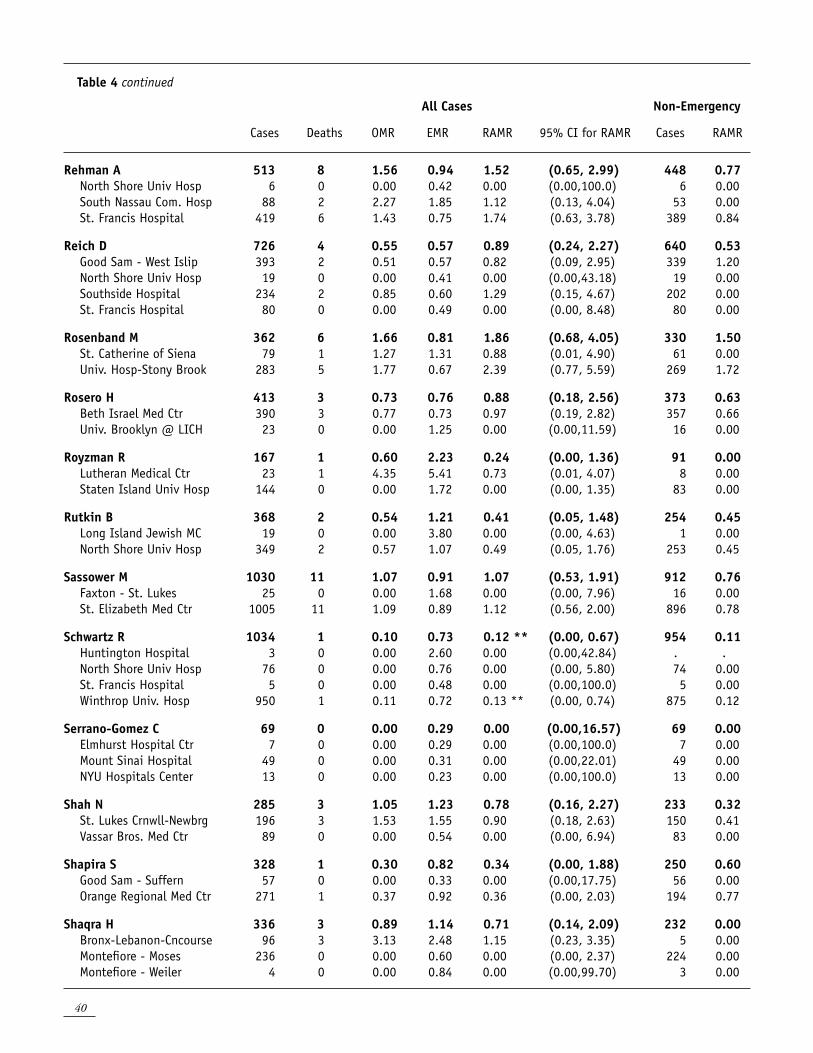
40
Table 4 continued
All Cases Non-Emergency
Cases Deaths OMR EMR RAMR 95% CI for RAMR Cases RAMR
Rehman A 513 8 1.56 0.94 1.52 (0.65, 2.99) 448 0.77 North Shore Univ Hosp 6 0 0.00 0.42 0.00 (0.00,100.0) 6 0.00 South Nassau Com. Hosp 88 2 2.27 1.85 1.12 (0.13, 4.04) 53 0.00 St. Francis Hospital 419 6 1.43 0.75 1.74 (0.63, 3.78) 389 0.84
Reich D 726 4 0.55 0.57 0.89 (0.24, 2.27) 640 0.53 Good Sam - West Islip 393 2 0.51 0.57 0.82 (0.09, 2.95) 339 1.20 North Shore Univ Hosp 19 0 0.00 0.41 0.00 (0.00,43.18) 19 0.00 Southside Hospital 234 2 0.85 0.60 1.29 (0.15, 4.67) 202 0.00 St. Francis Hospital 80 0 0.00 0.49 0.00 (0.00, 8.48) 80 0.00
Rosenband M 362 6 1.66 0.81 1.86 (0.68, 4.05) 330 1.50 St. Catherine of Siena 79 1 1.27 1.31 0.88 (0.01, 4.90) 61 0.00 Univ. Hosp-Stony Brook 283 5 1.77 0.67 2.39 (0.77, 5.59) 269 1.72
Rosero H 413 3 0.73 0.76 0.88 (0.18, 2.56) 373 0.63 Beth Israel Med Ctr 390 3 0.77 0.73 0.97 (0.19, 2.82) 357 0.66 Univ. Brooklyn @ LICH 23 0 0.00 1.25 0.00 (0.00,11.59) 16 0.00
Royzman R 167 1 0.60 2.23 0.24 (0.00, 1.36) 91 0.00 Lutheran Medical Ctr 23 1 4.35 5.41 0.73 (0.01, 4.07) 8 0.00 Staten Island Univ Hosp 144 0 0.00 1.72 0.00 (0.00, 1.35) 83 0.00
Rutkin B 368 2 0.54 1.21 0.41 (0.05, 1.48) 254 0.45 Long Island Jewish MC 19 0 0.00 3.80 0.00 (0.00, 4.63) 1 0.00 North Shore Univ Hosp 349 2 0.57 1.07 0.49 (0.05, 1.76) 253 0.45
Sassower M 1030 11 1.07 0.91 1.07 (0.53, 1.91) 912 0.76 Faxton - St. Lukes 25 0 0.00 1.68 0.00 (0.00, 7.96) 16 0.00 St. Elizabeth Med Ctr 1005 11 1.09 0.89 1.12 (0.56, 2.00) 896 0.78
Schwartz R 1034 1 0.10 0.73 0.12 ** (0.00, 0.67) 954 0.11 Huntington Hospital 3 0 0.00 2.60 0.00 (0.00,42.84) . . North Shore Univ Hosp 76 0 0.00 0.76 0.00 (0.00, 5.80) 74 0.00 St. Francis Hospital 5 0 0.00 0.48 0.00 (0.00,100.0) 5 0.00 Winthrop Univ. Hosp 950 1 0.11 0.72 0.13 ** (0.00, 0.74) 875 0.12
Serrano-Gomez C 69 0 0.00 0.29 0.00 (0.00,16.57) 69 0.00 Elmhurst Hospital Ctr 7 0 0.00 0.29 0.00 (0.00,100.0) 7 0.00 Mount Sinai Hospital 49 0 0.00 0.31 0.00 (0.00,22.01) 49 0.00 NYU Hospitals Center 13 0 0.00 0.23 0.00 (0.00,100.0) 13 0.00
Shah N 285 3 1.05 1.23 0.78 (0.16, 2.27) 233 0.32 St. Lukes Crnwll-Newbrg 196 3 1.53 1.55 0.90 (0.18, 2.63) 150 0.41 Vassar Bros. Med Ctr 89 0 0.00 0.54 0.00 (0.00, 6.94) 83 0.00
Shapira S 328 1 0.30 0.82 0.34 (0.00, 1.88) 250 0.60 Good Sam - Suffern 57 0 0.00 0.33 0.00 (0.00,17.75) 56 0.00 Orange Regional Med Ctr 271 1 0.37 0.92 0.36 (0.00, 2.03) 194 0.77
Shaqra H 336 3 0.89 1.14 0.71 (0.14, 2.09) 232 0.00 Bronx-Lebanon-Cncourse 96 3 3.13 2.48 1.15 (0.23, 3.35) 5 0.00 Montefiore - Moses 236 0 0.00 0.60 0.00 (0.00, 2.37) 224 0.00 Montefiore - Weiler 4 0 0.00 0.84 0.00 (0.00,99.70) 3 0.00
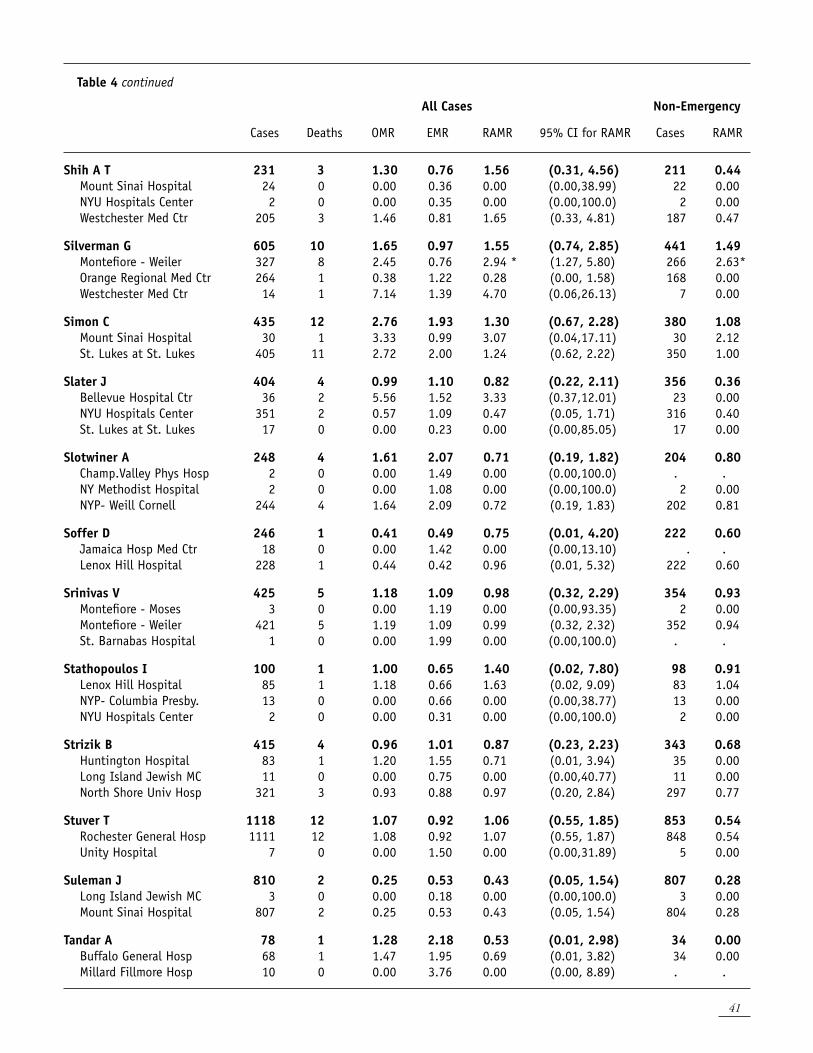
41
Table 4 continued
All Cases Non-Emergency
Cases Deaths OMR EMR RAMR 95% CI for RAMR Cases RAMR
Shih A T 231 3 1.30 0.76 1.56 (0.31, 4.56) 211 0.44 Mount Sinai Hospital 24 0 0.00 0.36 0.00 (0.00,38.99) 22 0.00 NYU Hospitals Center 2 0 0.00 0.35 0.00 (0.00,100.0) 2 0.00 Westchester Med Ctr 205 3 1.46 0.81 1.65 (0.33, 4.81) 187 0.47
Silverman G 605 10 1.65 0.97 1.55 (0.74, 2.85) 441 1.49 Montefiore - Weiler 327 8 2.45 0.76 2.94 * (1.27, 5.80) 266 2.63* Orange Regional Med Ctr 264 1 0.38 1.22 0.28 (0.00, 1.58) 168 0.00 Westchester Med Ctr 14 1 7.14 1.39 4.70 (0.06,26.13) 7 0.00
Simon C 435 12 2.76 1.93 1.30 (0.67, 2.28) 380 1.08 Mount Sinai Hospital 30 1 3.33 0.99 3.07 (0.04,17.11) 30 2.12 St. Lukes at St. Lukes 405 11 2.72 2.00 1.24 (0.62, 2.22) 350 1.00
Slater J 404 4 0.99 1.10 0.82 (0.22, 2.11) 356 0.36 Bellevue Hospital Ctr 36 2 5.56 1.52 3.33 (0.37,12.01) 23 0.00 NYU Hospitals Center 351 2 0.57 1.09 0.47 (0.05, 1.71) 316 0.40 St. Lukes at St. Lukes 17 0 0.00 0.23 0.00 (0.00,85.05) 17 0.00
Slotwiner A 248 4 1.61 2.07 0.71 (0.19, 1.82) 204 0.80 Champ.Valley Phys Hosp 2 0 0.00 1.49 0.00 (0.00,100.0) . . NY Methodist Hospital 2 0 0.00 1.08 0.00 (0.00,100.0) 2 0.00 NYP- Weill Cornell 244 4 1.64 2.09 0.72 (0.19, 1.83) 202 0.81
Soffer D 246 1 0.41 0.49 0.75 (0.01, 4.20) 222 0.60 Jamaica Hosp Med Ctr 18 0 0.00 1.42 0.00 (0.00,13.10) . . Lenox Hill Hospital 228 1 0.44 0.42 0.96 (0.01, 5.32) 222 0.60
Srinivas V 425 5 1.18 1.09 0.98 (0.32, 2.29) 354 0.93 Montefiore - Moses 3 0 0.00 1.19 0.00 (0.00,93.35) 2 0.00 Montefiore - Weiler 421 5 1.19 1.09 0.99 (0.32, 2.32) 352 0.94 St. Barnabas Hospital 1 0 0.00 1.99 0.00 (0.00,100.0) . .
Stathopoulos I 100 1 1.00 0.65 1.40 (0.02, 7.80) 98 0.91 Lenox Hill Hospital 85 1 1.18 0.66 1.63 (0.02, 9.09) 83 1.04 NYP- Columbia Presby. 13 0 0.00 0.66 0.00 (0.00,38.77) 13 0.00 NYU Hospitals Center 2 0 0.00 0.31 0.00 (0.00,100.0) 2 0.00
Strizik B 415 4 0.96 1.01 0.87 (0.23, 2.23) 343 0.68 Huntington Hospital 83 1 1.20 1.55 0.71 (0.01, 3.94) 35 0.00 Long Island Jewish MC 11 0 0.00 0.75 0.00 (0.00,40.77) 11 0.00 North Shore Univ Hosp 321 3 0.93 0.88 0.97 (0.20, 2.84) 297 0.77
Stuver T 1118 12 1.07 0.92 1.06 (0.55, 1.85) 853 0.54 Rochester General Hosp 1111 12 1.08 0.92 1.07 (0.55, 1.87) 848 0.54 Unity Hospital 7 0 0.00 1.50 0.00 (0.00,31.89) 5 0.00
Suleman J 810 2 0.25 0.53 0.43 (0.05, 1.54) 807 0.28 Long Island Jewish MC 3 0 0.00 0.18 0.00 (0.00,100.0) 3 0.00 Mount Sinai Hospital 807 2 0.25 0.53 0.43 (0.05, 1.54) 804 0.28
Tandar A 78 1 1.28 2.18 0.53 (0.01, 2.98) 34 0.00 Buffalo General Hosp 68 1 1.47 1.95 0.69 (0.01, 3.82) 34 0.00 Millard Fillmore Hosp 10 0 0.00 3.76 0.00 (0.00, 8.89) . .
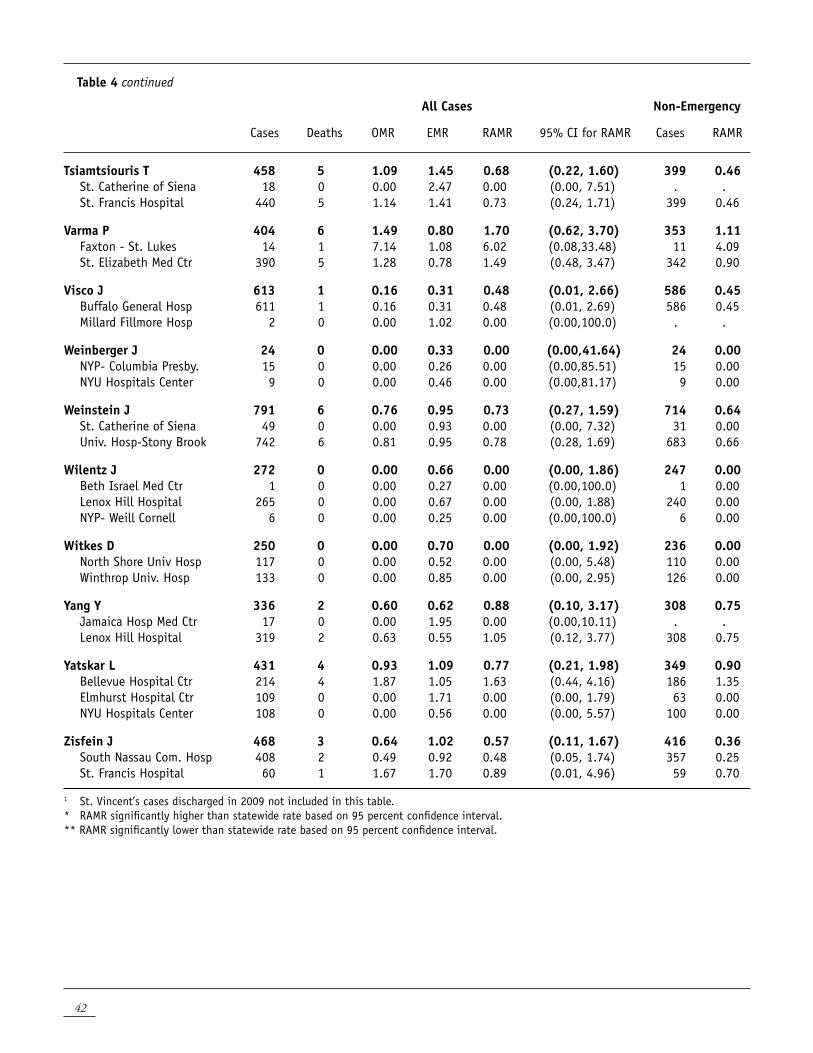
42
Table 4 continued
All Cases Non-Emergency
Cases Deaths OMR EMR RAMR 95% CI for RAMR Cases RAMR
Tsiamtsiouris T 458 5 1.09 1.45 0.68 (0.22, 1.60) 399 0.46 St. Catherine of Siena 18 0 0.00 2.47 0.00 (0.00, 7.51) . . St. Francis Hospital 440 5 1.14 1.41 0.73 (0.24, 1.71) 399 0.46
Varma P 404 6 1.49 0.80 1.70 (0.62, 3.70) 353 1.11 Faxton - St. Lukes 14 1 7.14 1.08 6.02 (0.08,33.48) 11 4.09 St. Elizabeth Med Ctr 390 5 1.28 0.78 1.49 (0.48, 3.47) 342 0.90
Visco J 613 1 0.16 0.31 0.48 (0.01, 2.66) 586 0.45 Buffalo General Hosp 611 1 0.16 0.31 0.48 (0.01, 2.69) 586 0.45 Millard Fillmore Hosp 2 0 0.00 1.02 0.00 (0.00,100.0) . .
Weinberger J 24 0 0.00 0.33 0.00 (0.00,41.64) 24 0.00 NYP- Columbia Presby. 15 0 0.00 0.26 0.00 (0.00,85.51) 15 0.00 NYU Hospitals Center 9 0 0.00 0.46 0.00 (0.00,81.17) 9 0.00
Weinstein J 791 6 0.76 0.95 0.73 (0.27, 1.59) 714 0.64 St. Catherine of Siena 49 0 0.00 0.93 0.00 (0.00, 7.32) 31 0.00 Univ. Hosp-Stony Brook 742 6 0.81 0.95 0.78 (0.28, 1.69) 683 0.66
Wilentz J 272 0 0.00 0.66 0.00 (0.00, 1.86) 247 0.00 Beth Israel Med Ctr 1 0 0.00 0.27 0.00 (0.00,100.0) 1 0.00 Lenox Hill Hospital 265 0 0.00 0.67 0.00 (0.00, 1.88) 240 0.00 NYP- Weill Cornell 6 0 0.00 0.25 0.00 (0.00,100.0) 6 0.00
Witkes D 250 0 0.00 0.70 0.00 (0.00, 1.92) 236 0.00 North Shore Univ Hosp 117 0 0.00 0.52 0.00 (0.00, 5.48) 110 0.00 Winthrop Univ. Hosp 133 0 0.00 0.85 0.00 (0.00, 2.95) 126 0.00
Yang Y 336 2 0.60 0.62 0.88 (0.10, 3.17) 308 0.75 Jamaica Hosp Med Ctr 17 0 0.00 1.95 0.00 (0.00,10.11) . . Lenox Hill Hospital 319 2 0.63 0.55 1.05 (0.12, 3.77) 308 0.75
Yatskar L 431 4 0.93 1.09 0.77 (0.21, 1.98) 349 0.90 Bellevue Hospital Ctr 214 4 1.87 1.05 1.63 (0.44, 4.16) 186 1.35 Elmhurst Hospital Ctr 109 0 0.00 1.71 0.00 (0.00, 1.79) 63 0.00 NYU Hospitals Center 108 0 0.00 0.56 0.00 (0.00, 5.57) 100 0.00
Zisfein J 468 3 0.64 1.02 0.57 (0.11, 1.67) 416 0.36 South Nassau Com. Hosp 408 2 0.49 0.92 0.48 (0.05, 1.74) 357 0.25 St. Francis Hospital 60 1 1.67 1.70 0.89 (0.01, 4.96) 59 0.70
1 St. Vincent’s cases discharged in 2009 not included in this table.
* RAMR significantly higher than statewide rate based on 95 percent confidence interval. ** RAMR significantly lower than statewide rate based on 95 percent confidence interval.
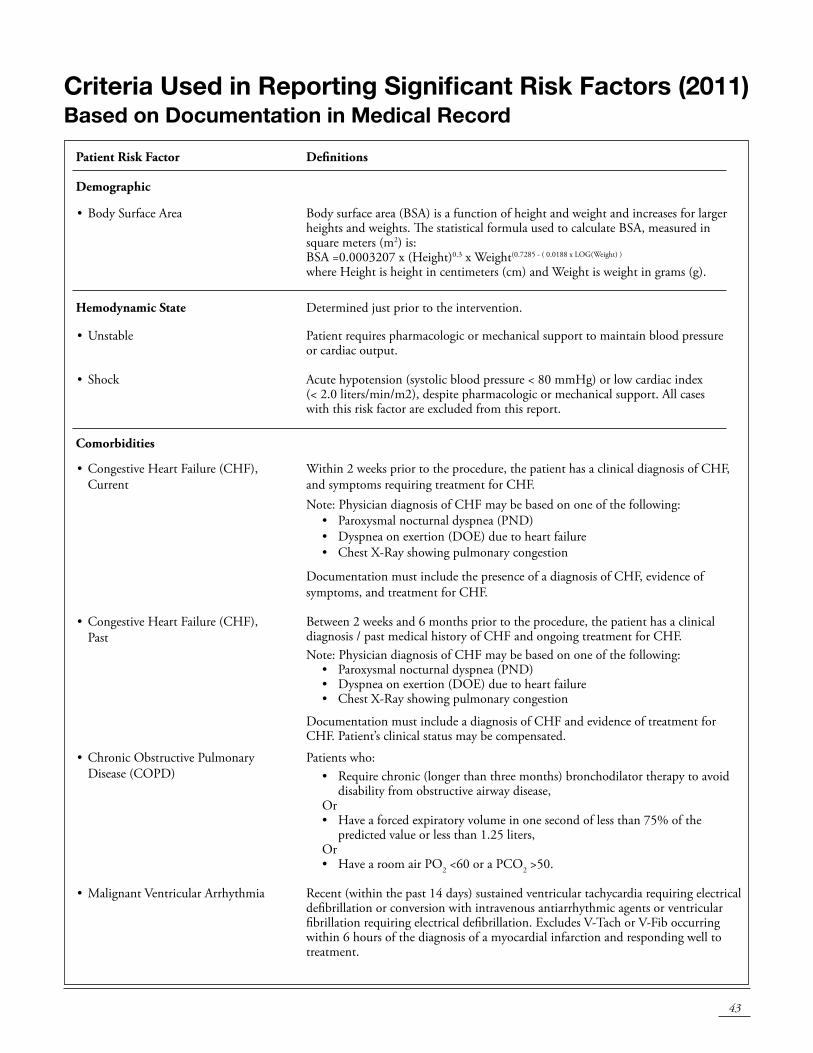
43
Criteria Used in Reporting Significant Risk Factors (2011)Based on Documentation in Medical Record
Patient Risk Factor Definitions
Demographic
• BodySurfaceArea Body surface area (BSA) is a function of height and weight and increases for larger heights and weights. The statistical formula used to calculate BSA, measured in square meters (m2) is: BSA =0.0003207 x (Height)0.3 x Weight(0.7285 - ( 0.0188 x LOG(Weight) ) where Height is height in centimeters (cm) and Weight is weight in grams (g).
Hemodynamic State Determined just prior to the intervention.
• Unstable Patient requires pharmacologic or mechanical support to maintain blood pressure or cardiac output.
• Shock Acute hypotension (systolic blood pressure < 80 mmHg) or low cardiac index (< 2.0 liters/min/m2), despite pharmacologic or mechanical support. All cases with this risk factor are excluded from this report.
Comorbidities
• CongestiveHeartFailure(CHF), Current
Within 2 weeks prior to the procedure, the patient has a clinical diagnosis of CHF, and symptoms requiring treatment for CHF.Note: Physician diagnosis of CHF may be based on one of the following:
• Paroxysmal nocturnal dyspnea (PND)• Dyspnea on exertion (DOE) due to heart failure• Chest x-Ray showing pulmonary congestion
Documentation must include the presence of a diagnosis of CHF, evidence of symptoms, and treatment for CHF.
• CongestiveHeartFailure(CHF), Past
Between 2 weeks and 6 months prior to the procedure, the patient has a clinical diagnosis / past medical history of CHF and ongoing treatment for CHF. Note: Physician diagnosis of CHF may be based on one of the following:
• Paroxysmalnocturnaldyspnea(PND)• Dyspneaonexertion(DOE)duetoheartfailure• ChestX-Rayshowingpulmonarycongestion
Documentation must include a diagnosis of CHF and evidence of treatment for CHF. Patient’s clinical status may be compensated.
• ChronicObstructivePulmonary Disease (COPD)
Patients who:• Requirechronic(longerthanthreemonths)bronchodilatortherapytoavoid
disability from obstructive airway disease,Or• Haveaforcedexpiratoryvolumeinonesecondoflessthan75%ofthe
predicted value or less than 1.25 liters,Or• HavearoomairPO2 <60 or a PCO2 >50.
•Malignant Ventricular Arrhythmia Recent (within the past 14 days) sustained ventricular tachycardia requiring electrical defibrillation or conversion with intravenous antiarrhythmic agents or ventricular fibrillation requiring electrical defibrillation. Excludes V-Tach or V-Fib occurring within 6 hours of the diagnosis of a myocardial infarction and responding well to treatment.
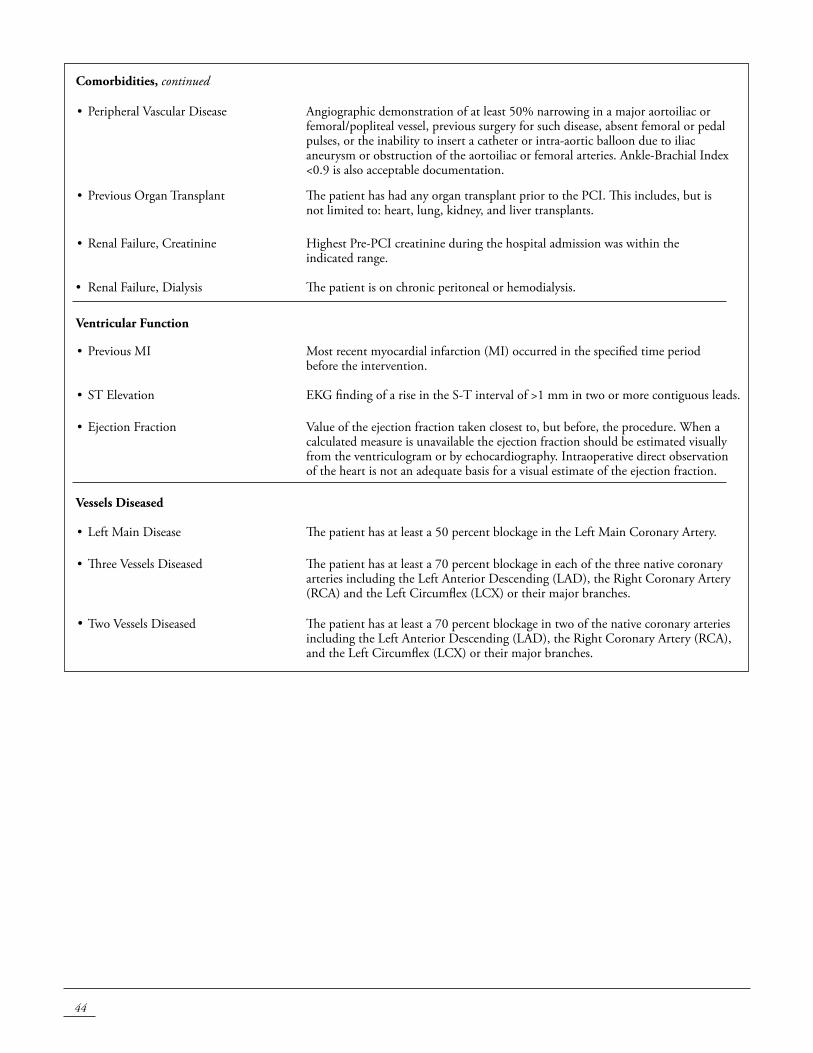
44
Comorbidities, continued
• PeripheralVascularDisease Angiographicdemonstrationofatleast50%narrowinginamajoraortoiliacorfemoral/popliteal vessel, previous surgery for such disease, absent femoral or pedal pulses, or the inability to insert a catheter or intra-aortic balloon due to iliac aneurysm or obstruction of the aortoiliac or femoral arteries. Ankle-Brachial Index <0.9 is also acceptable documentation.
• PreviousOrganTransplant The patient has had any organ transplant prior to the PCI. This includes, but is not limited to: heart, lung, kidney, and liver transplants.
• RenalFailure,Creatinine Highest Pre-PCI creatinine during the hospital admission was within the indicated range.
• RenalFailure,Dialysis The patient is on chronic peritoneal or hemodialysis.
Ventricular Function
• PreviousMI Most recent myocardial infarction (MI) occurred in the specified time period before the intervention.
• ST Elevation EKG finding of a rise in the S-T interval of >1 mm in two or more contiguous leads.
• EjectionFraction Value of the ejection fraction taken closest to, but before, the procedure. When a calculated measure is unavailable the ejection fraction should be estimated visually from the ventriculogram or by echocardiography. Intraoperative direct observation of the heart is not an adequate basis for a visual estimate of the ejection fraction.
Vessels Diseased
• LeftMainDisease The patient has at least a 50 percent blockage in the Left Main Coronary Artery.
•ThreeVesselsDiseased The patient has at least a 70 percent blockage in each of the three native coronary arteries including the Left Anterior Descending (LAD), the Right Coronary Artery (RCA) and the Left Circumflex (LCx) or their major branches.
•Two Vessels Diseased The patient has at least a 70 percent blockage in two of the native coronary arteries including the Left Anterior Descending (LAD), the Right Coronary Artery (RCA), and the Left Circumflex (LCx) or their major branches.
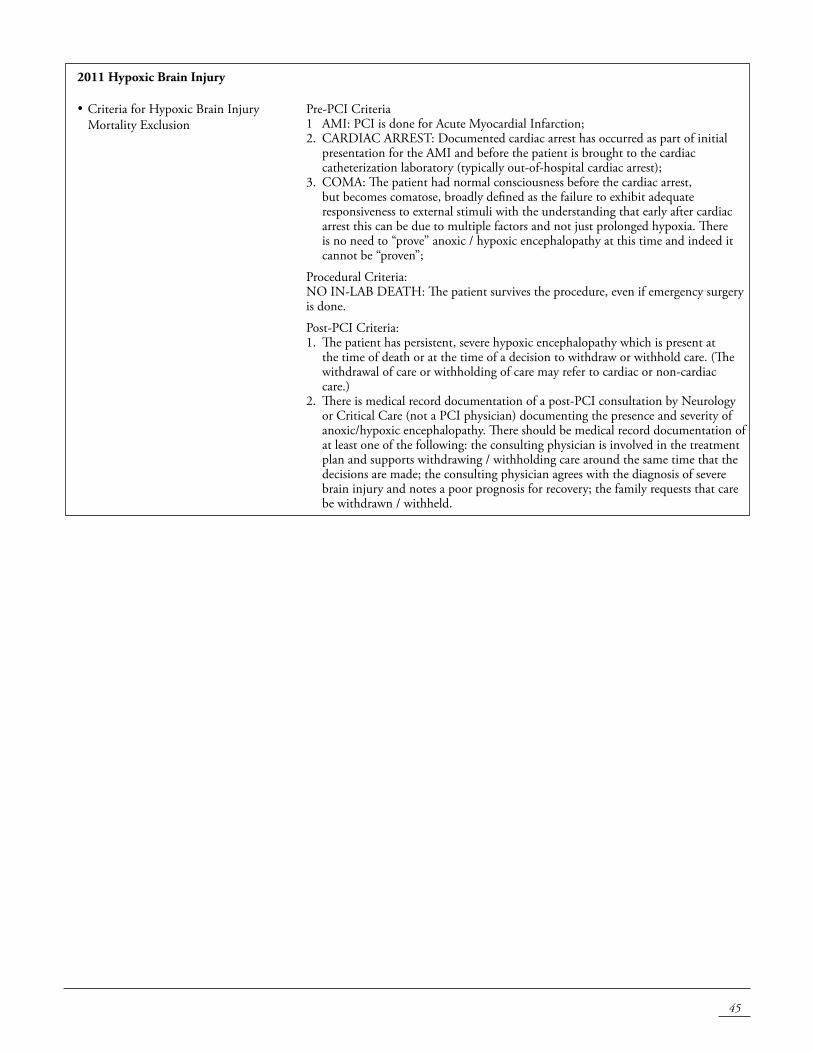
45
2011 Hypoxic Brain Injury
•Criteria for Hypoxic Brain Injury Mortality Exclusion
Pre-PCI Criteria 1 AMI: PCI is done for Acute Myocardial Infarction; 2. CARDIAC ARREST: Documented cardiac arrest has occurred as part of initial
presentation for the AMI and before the patient is brought to the cardiac catheterization laboratory (typically out-of-hospital cardiac arrest);
3. COMA: The patient had normal consciousness before the cardiac arrest, but becomes comatose, broadly defined as the failure to exhibit adequate responsiveness to external stimuli with the understanding that early after cardiac arrest this can be due to multiple factors and not just prolonged hypoxia. There is no need to “prove” anoxic / hypoxic encephalopathy at this time and indeed it cannot be “proven”;
Procedural Criteria: NO IN-LAB DEATH: The patient survives the procedure, even if emergency surgery is done.
Post-PCI Criteria:1. The patient has persistent, severe hypoxic encephalopathy which is present at
the time of death or at the time of a decision to withdraw or withhold care. (The withdrawal of care or withholding of care may refer to cardiac or non-cardiac care.)
2. There is medical record documentation of a post-PCI consultation by Neurology or Critical Care (not a PCI physician) documenting the presence and severity of anoxic/hypoxic encephalopathy. There should be medical record documentation of at least one of the following: the consulting physician is involved in the treatment plan and supports withdrawing / withholding care around the same time that the decisions are made; the consulting physician agrees with the diagnosis of severe brain injury and notes a poor prognosis for recovery; the family requests that care be withdrawn / withheld.
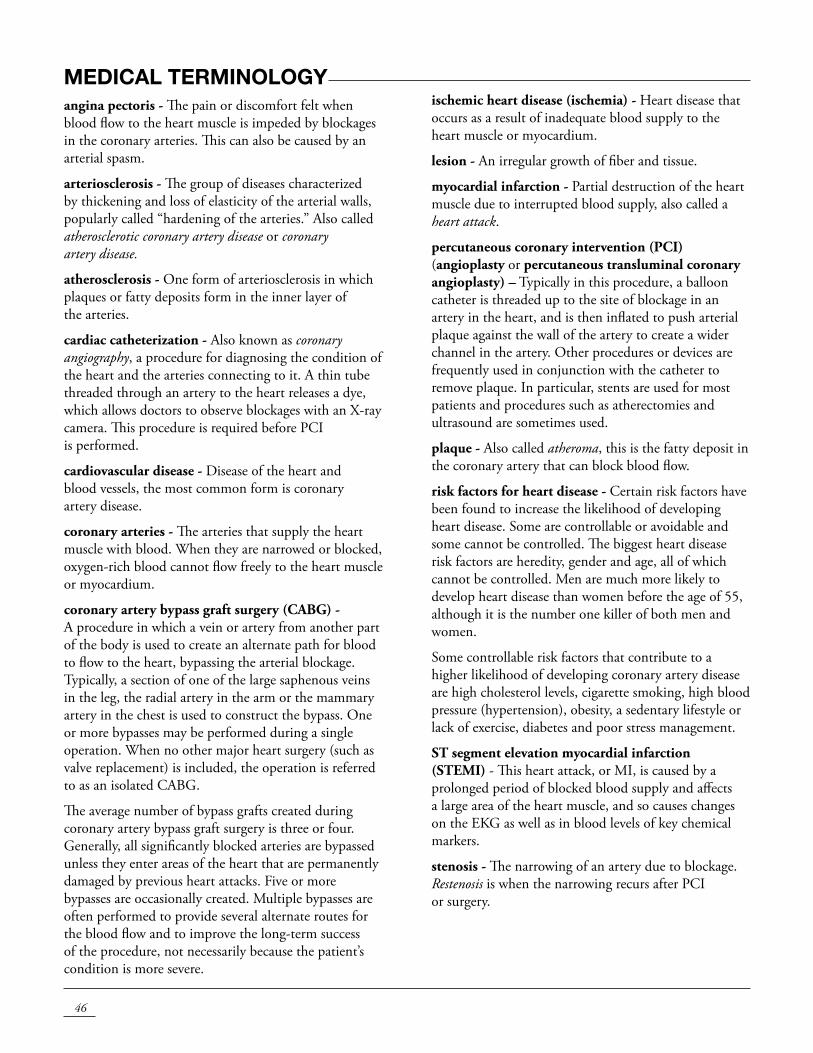
46
MEDICAL TERMINOLOgY angina pectoris - The pain or discomfort felt when blood flow to the heart muscle is impeded by blockages in the coronary arteries. This can also be caused by an arterial spasm.
arteriosclerosis - The group of diseases characterized by thickening and loss of elasticity of the arterial walls, popularly called “hardening of the arteries.” Also called atherosclerotic coronary artery disease or coronary artery disease.
atherosclerosis - One form of arteriosclerosis in which plaques or fatty deposits form in the inner layer of the arteries.
cardiac catheterization - Also known as coronary angiography, a procedure for diagnosing the condition of the heart and the arteries connecting to it. A thin tube threaded through an artery to the heart releases a dye, which allows doctors to observe blockages with an x-ray camera. This procedure is required before PCI is performed.
cardiovascular disease - Disease of the heart and blood vessels, the most common form is coronary artery disease.
coronary arteries - The arteries that supply the heart muscle with blood. When they are narrowed or blocked, oxygen-rich blood cannot flow freely to the heart muscle or myocardium.
coronary artery bypass graft surgery (CABG) - A procedure in which a vein or artery from another part of the body is used to create an alternate path for blood to flow to the heart, bypassing the arterial blockage. Typically, a section of one of the large saphenous veins in the leg, the radial artery in the arm or the mammary artery in the chest is used to construct the bypass. One or more bypasses may be performed during a single operation. When no other major heart surgery (such as valve replacement) is included, the operation is referred to as an isolated CABG.
The average number of bypass grafts created during coronary artery bypass graft surgery is three or four. Generally, all significantly blocked arteries are bypassed unless they enter areas of the heart that are permanently damaged by previous heart attacks. Five or more bypasses are occasionally created. Multiple bypasses are often performed to provide several alternate routes for the blood flow and to improve the long-term success of the procedure, not necessarily because the patient’s condition is more severe.
ischemic heart disease (ischemia) - Heart disease that occurs as a result of inadequate blood supply to the heart muscle or myocardium.
lesion - An irregular growth of fiber and tissue.
myocardial infarction - Partial destruction of the heart muscle due to interrupted blood supply, also called a heart attack.
percutaneous coronary intervention (PCI) (angioplasty or percutaneous transluminal coronary angioplasty) – Typically in this procedure, a balloon catheter is threaded up to the site of blockage in an artery in the heart, and is then inflated to push arterial plaque against the wall of the artery to create a wider channel in the artery. Other procedures or devices are frequently used in conjunction with the catheter to remove plaque. In particular, stents are used for most patients and procedures such as atherectomies and ultrasound are sometimes used.
plaque - Also called atheroma, this is the fatty deposit in the coronary artery that can block blood flow.
risk factors for heart disease - Certain risk factors have been found to increase the likelihood of developing heart disease. Some are controllable or avoidable and some cannot be controlled. The biggest heart disease risk factors are heredity, gender and age, all of which cannot be controlled. Men are much more likely to develop heart disease than women before the age of 55, although it is the number one killer of both men and women.
Some controllable risk factors that contribute to a higher likelihood of developing coronary artery disease are high cholesterol levels, cigarette smoking, high blood pressure (hypertension), obesity, a sedentary lifestyle or lack of exercise, diabetes and poor stress management.
ST segment elevation myocardial infarction (STEMI) - This heart attack, or MI, is caused by a prolonged period of blocked blood supply and affects a large area of the heart muscle, and so causes changes on the EKG as well as in blood levels of key chemical markers.
stenosis - The narrowing of an artery due to blockage. Restenosis is when the narrowing recurs after PCI or surgery.
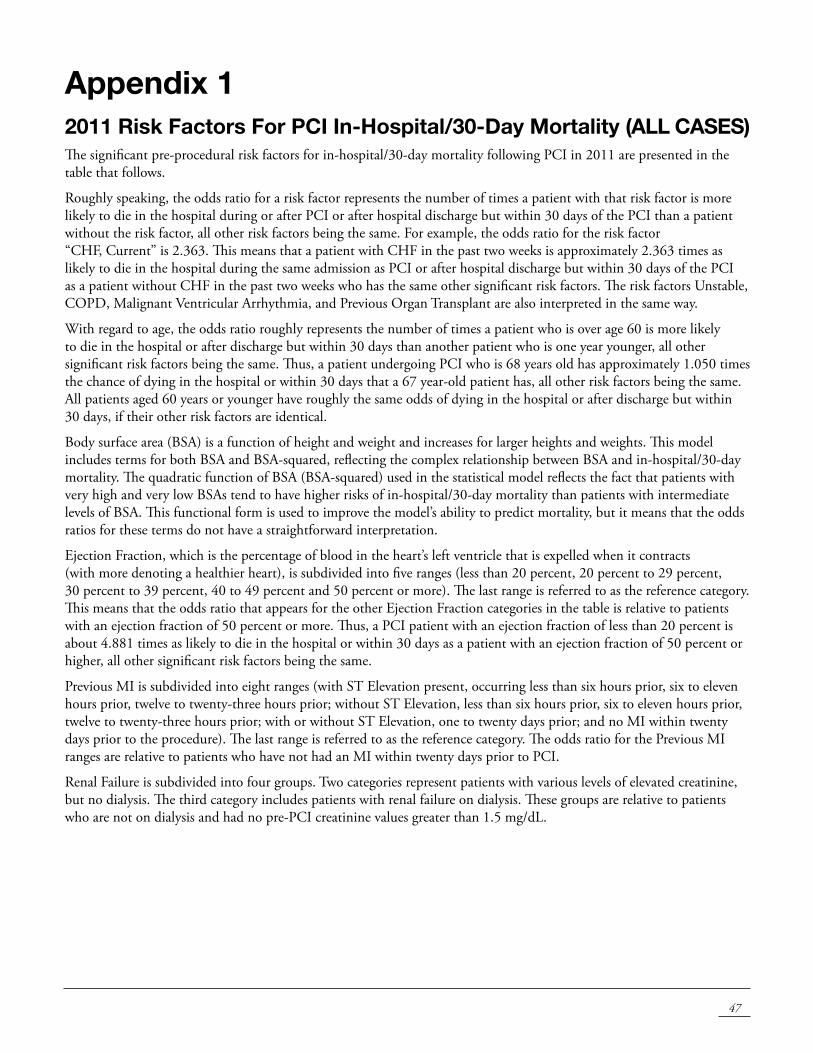
47
Appendix 12011 Risk Factors For PCI In-Hospital/30-Day Mortality (ALL CASES)The significant pre-procedural risk factors for in-hospital/30-day mortality following PCI in 2011 are presented in the table that follows.
Roughly speaking, the odds ratio for a risk factor represents the number of times a patient with that risk factor is more likely to die in the hospital during or after PCI or after hospital discharge but within 30 days of the PCI than a patient without the risk factor, all other risk factors being the same. For example, the odds ratio for the risk factor “CHF, Current” is 2.363. This means that a patient with CHF in the past two weeks is approximately 2.363 times as likely to die in the hospital during the same admission as PCI or after hospital discharge but within 30 days of the PCI as a patient without CHF in the past two weeks who has the same other significant risk factors. The risk factors Unstable, COPD, Malignant Ventricular Arrhythmia, and Previous Organ Transplant are also interpreted in the same way.
With regard to age, the odds ratio roughly represents the number of times a patient who is over age 60 is more likely to die in the hospital or after discharge but within 30 days than another patient who is one year younger, all other significant risk factors being the same. Thus, a patient undergoing PCI who is 68 years old has approximately 1.050 times the chance of dying in the hospital or within 30 days that a 67 year-old patient has, all other risk factors being the same. All patients aged 60 years or younger have roughly the same odds of dying in the hospital or after discharge but within 30 days, if their other risk factors are identical.
Body surface area (BSA) is a function of height and weight and increases for larger heights and weights. This model includes terms for both BSA and BSA-squared, reflecting the complex relationship between BSA and in-hospital/30-day mortality. The quadratic function of BSA (BSA-squared) used in the statistical model reflects the fact that patients with very high and very low BSAs tend to have higher risks of in-hospital/30-day mortality than patients with intermediate levels of BSA. This functional form is used to improve the model’s ability to predict mortality, but it means that the odds ratios for these terms do not have a straightforward interpretation.
Ejection Fraction, which is the percentage of blood in the heart’s left ventricle that is expelled when it contracts (with more denoting a healthier heart), is subdivided into five ranges (less than 20 percent, 20 percent to 29 percent, 30 percent to 39 percent, 40 to 49 percent and 50 percent or more). The last range is referred to as the reference category. This means that the odds ratio that appears for the other Ejection Fraction categories in the table is relative to patients with an ejection fraction of 50 percent or more. Thus, a PCI patient with an ejection fraction of less than 20 percent is about 4.881 times as likely to die in the hospital or within 30 days as a patient with an ejection fraction of 50 percent or higher, all other significant risk factors being the same.
Previous MI is subdivided into eight ranges (with ST Elevation present, occurring less than six hours prior, six to eleven hours prior, twelve to twenty-three hours prior; without ST Elevation, less than six hours prior, six to eleven hours prior, twelve to twenty-three hours prior; with or without ST Elevation, one to twenty days prior; and no MI within twenty days prior to the procedure). The last range is referred to as the reference category. The odds ratio for the Previous MI ranges are relative to patients who have not had an MI within twenty days prior to PCI.
Renal Failure is subdivided into four groups. Two categories represent patients with various levels of elevated creatinine, but no dialysis. The third category includes patients with renal failure on dialysis. These groups are relative to patients who are not on dialysis and had no pre-PCI creatinine values greater than 1.5 mg/dL.
48
Appendix 1 Multivariate Risk-Factor Equation for In-Hospital/30-Day Deaths During or Following PCI, 2011 (All Cases)
Logistic Regression
Patient Risk Factor Prevalence (%) Coefficient P-Value Odds Ratio
DemographicAge: number of years > 60 — 0.0485 <.0001 1.050
Body Surface Area — -2.7595 0.0006 —
Body Surface Area - squared — 0.5468 0.0031 —
Hemodynamic StateUnstable 0.49 2.0222 <.0001 7.555
Ventricular FunctionEjection Fraction
Ejection Fraction 50% or greater 72.87 — Reference — 1.000
Ejection Fraction less than 20% 0.78 1.5854 <.0001 4.881
Ejection Fraction 20-29% 3.72 1.1063 <.0001 3.023
Ejection Fraction 30-39% 7.25 0.7364 <.0001 2.088
Ejection Fraction 40-49% 15.38 0.3449 0.0091 1.412
Pre-Procedural MI
No MI within 20 days 70.72 — Reference — 1.000
MI with ST Elevation
MI < 6 hrs 8.61 1.7342 <.0001 5.664
MI 6-11 hrs 1.63 2.0387 <.0001 7.681
MI 12 – 23 hrs 1.00 2.5446 <.0001 12.738
MI without ST Elevation
MI < 6 hrs 0.74 1.4694 0.0002 4.347
MI 6-11 hrs 1.00 0.2400 0.6888 1.271
MI 12 – 23 hrs 2.00 1.0372 0.0007 2.821
MI with or without ST Elevation
MI 1-20 days 14.30 1.1447 <.0001 3.141
ComorbiditiesCHF, Current 5.46 0.8601 <.0001 2.363
COPD 6.48 0.4696 0.0019 1.599
Malignant Ventricular Arrhythmia 0.67 1.0681 <.0001 2.910
Previous Organ Transplant 0.49 1.2344 0.0018 3.436
Renal Failure
No Renal Failure 90.05 — Reference — 1.000
Renal Failure, Creatinine 1.6-2.0 mg/dl 5.39 0.7237 <.0001 2.062
Renal Failure, Creatinine > 2.0 mg/dl 2.20 0.8515 <.0001 2.343
Renal Failure, Requiring Dialysis 2.36 1.2426 <.0001 3.465
Intercept = -3.7105
C Statistic = 0.857
49
Appendix 22011 Risk Factors For In-Hospital/30-Day Mortality For Non-Emergency PCIAppendix 2 contains the significant pre-procedural risk factors for 2011 New York State PCI patients who were not emergency patients (were not hemodynamically unstable and who did not suffer a heart attack within 24 hours prior to the PCI being performed).
The interpretation for Body Surface Area, Body Surface Area – squared, Ejection Fraction, CHF, COPD, Malignant Ventricular Arrhythmia, and Previous Organ Transplant is the same as presented in Appendix 1. Age is interpreted in roughly the same manner as in Appendix 1 except in this model each year above the age of 65 is associated with an increased risk of in-hospital/30-day mortality.
In this model, there are only two categories for Previous MI (one to fourteen days prior to PCI and no MI within fourteen days prior to the procedure). The odds ratio for the Previous MI ranges are relative to patients who have not had an MI within fourteen days prior to PCI.
In this model there are only three categories of Renal Failure, but the explanation is otherwise the same as presented in Appendix 1
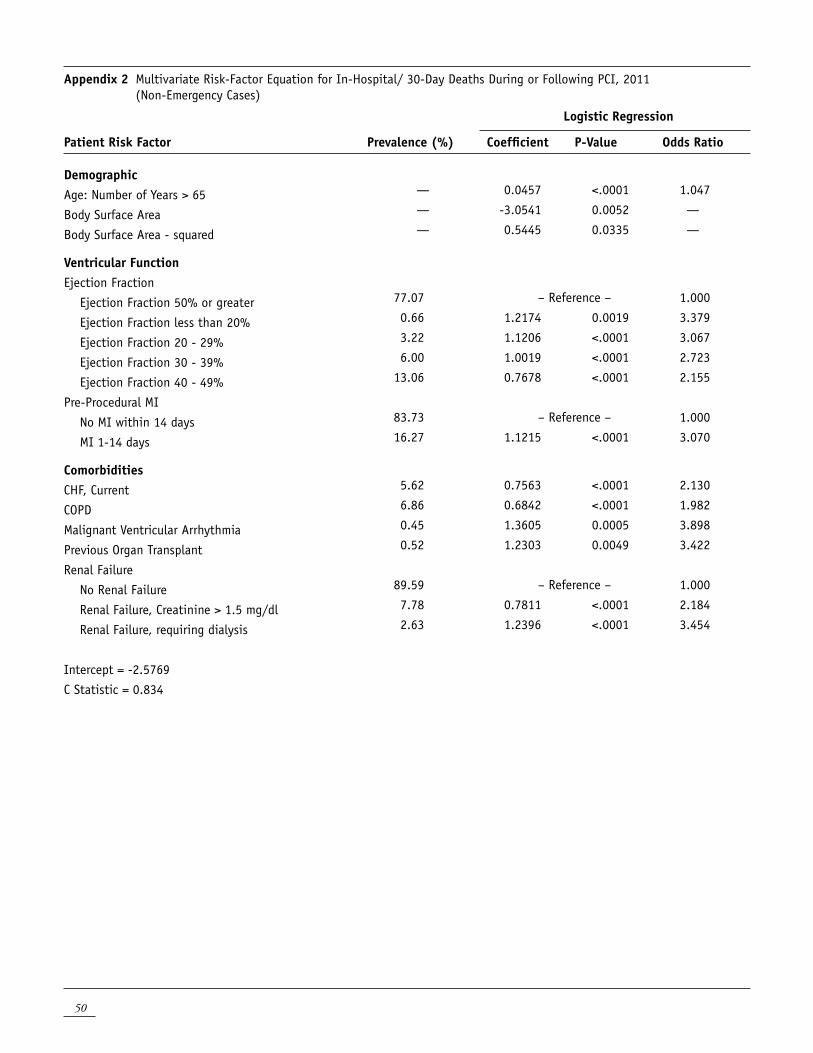
50
Appendix 2 Multivariate Risk-Factor Equation for In-Hospital/ 30-Day Deaths During or Following PCI, 2011 (Non-Emergency Cases)
Logistic Regression
Patient Risk Factor Prevalence (%) Coefficient P-Value Odds Ratio
DemographicAge: Number of Years > 65 — 0.0457 <.0001 1.047
Body Surface Area — -3.0541 0.0052 —
Body Surface Area - squared — 0.5445 0.0335 —
Ventricular FunctionEjection Fraction
Ejection Fraction 50% or greater 77.07 – Reference – 1.000
Ejection Fraction less than 20% 0.66 1.2174 0.0019 3.379
Ejection Fraction 20 - 29% 3.22 1.1206 <.0001 3.067
Ejection Fraction 30 - 39% 6.00 1.0019 <.0001 2.723
Ejection Fraction 40 - 49% 13.06 0.7678 <.0001 2.155
Pre-Procedural MI
No MI within 14 days 83.73 – Reference – 1.000
MI 1-14 days 16.27 1.1215 <.0001 3.070
ComorbiditiesCHF, Current 5.62 0.7563 <.0001 2.130
COPD 6.86 0.6842 <.0001 1.982
Malignant Ventricular Arrhythmia 0.45 1.3605 0.0005 3.898
Previous Organ Transplant 0.52 1.2303 0.0049 3.422
Renal Failure
No Renal Failure 89.59 – Reference – 1.000
Renal Failure, Creatinine > 1.5 mg/dl 7.78 0.7811 <.0001 2.184
Renal Failure, requiring dialysis 2.63 1.2396 <.0001 3.454
Intercept = -2.5769
C Statistic = 0.834
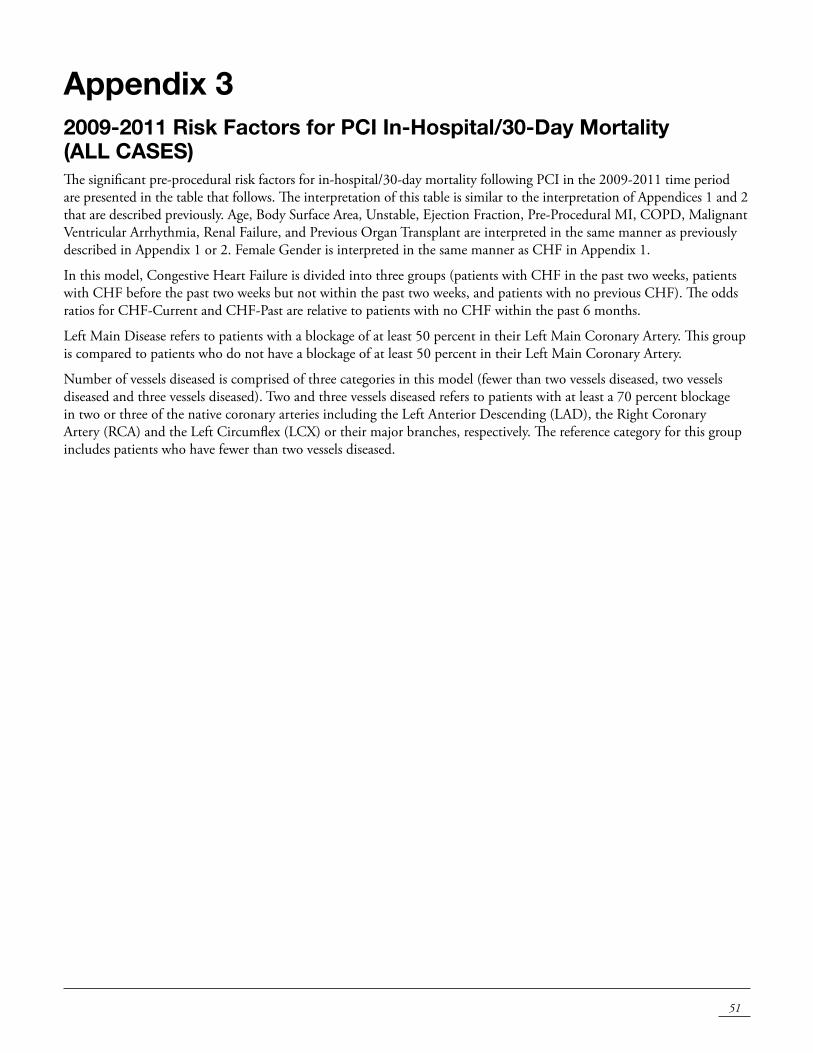
51
Appendix 32009-2011 Risk Factors for PCI In-Hospital/30-Day Mortality (ALL CASES)The significant pre-procedural risk factors for in-hospital/30-day mortality following PCI in the 2009-2011 time period are presented in the table that follows. The interpretation of this table is similar to the interpretation of Appendices 1 and 2 that are described previously. Age, Body Surface Area, Unstable, Ejection Fraction, Pre-Procedural MI, COPD, Malignant Ventricular Arrhythmia, Renal Failure, and Previous Organ Transplant are interpreted in the same manner as previously described in Appendix 1 or 2. Female Gender is interpreted in the same manner as CHF in Appendix 1.
In this model, Congestive Heart Failure is divided into three groups (patients with CHF in the past two weeks, patients with CHF before the past two weeks but not within the past two weeks, and patients with no previous CHF). The odds ratios for CHF-Current and CHF-Past are relative to patients with no CHF within the past 6 months.
Left Main Disease refers to patients with a blockage of at least 50 percent in their Left Main Coronary Artery. This group is compared to patients who do not have a blockage of at least 50 percent in their Left Main Coronary Artery.
Number of vessels diseased is comprised of three categories in this model (fewer than two vessels diseased, two vessels diseased and three vessels diseased). Two and three vessels diseased refers to patients with at least a 70 percent blockage in two or three of the native coronary arteries including the Left Anterior Descending (LAD), the Right Coronary Artery (RCA) and the Left Circumflex (LCx) or their major branches, respectively. The reference category for this group includes patients who have fewer than two vessels diseased.
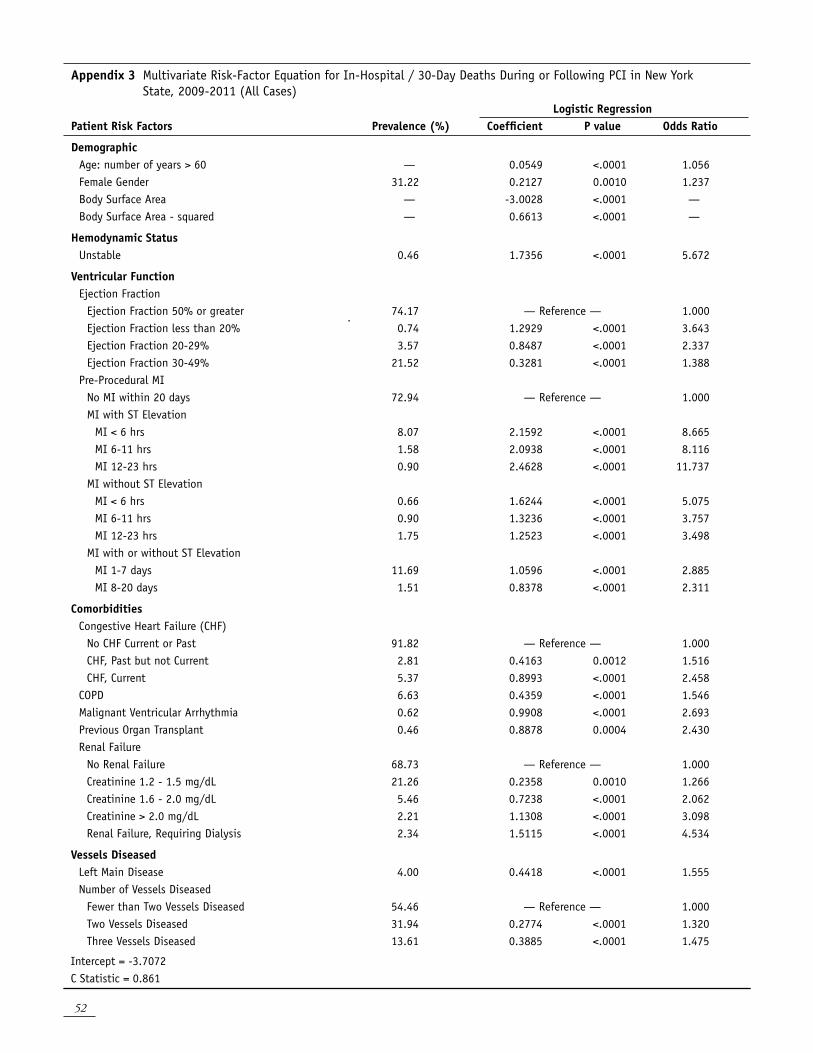
52
Appendix 3 Multivariate Risk-Factor Equation for In-Hospital / 30-Day Deaths During or Following PCI in New York State, 2009-2011 (All Cases)
Logistic RegressionPatient Risk Factors Prevalence (%) Coefficient P value Odds Ratio
Demographic Age: number of years > 60 — 0.0549 <.0001 1.056Female Gender 31.22 0.2127 0.0010 1.237Body Surface Area — -3.0028 <.0001 —Body Surface Area - squared — 0.6613 <.0001 —
Hemodynamic StatusUnstable 0.46 1.7356 <.0001 5.672
Ventricular FunctionEjection Fraction
Ejection Fraction 50% or greater 74.17 — Reference — 1.000Ejection Fraction less than 20% 0.74 1.2929 <.0001 3.643Ejection Fraction 20-29% 3.57 0.8487 <.0001 2.337Ejection Fraction 30-49% 21.52 0.3281 <.0001 1.388
Pre-Procedural MI No MI within 20 days 72.94 — Reference — 1.000MI with ST Elevation
MI < 6 hrs 8.07 2.1592 <.0001 8.665MI 6-11 hrs 1.58 2.0938 <.0001 8.116MI 12-23 hrs 0.90 2.4628 <.0001 11.737
MI without ST ElevationMI < 6 hrs 0.66 1.6244 <.0001 5.075MI 6-11 hrs 0.90 1.3236 <.0001 3.757MI 12-23 hrs 1.75 1.2523 <.0001 3.498
MI with or without ST ElevationMI 1-7 days 11.69 1.0596 <.0001 2.885MI 8-20 days 1.51 0.8378 <.0001 2.311
ComorbiditiesCongestive Heart Failure (CHF)
No CHF Current or Past 91.82 — Reference — 1.000CHF, Past but not Current 2.81 0.4163 0.0012 1.516CHF, Current 5.37 0.8993 <.0001 2.458
COPD 6.63 0.4359 <.0001 1.546Malignant Ventricular Arrhythmia 0.62 0.9908 <.0001 2.693Previous Organ Transplant 0.46 0.8878 0.0004 2.430Renal Failure
No Renal Failure 68.73 — Reference — 1.000Creatinine 1.2 - 1.5 mg/dL 21.26 0.2358 0.0010 1.266Creatinine 1.6 - 2.0 mg/dL 5.46 0.7238 <.0001 2.062Creatinine > 2.0 mg/dL 2.21 1.1308 <.0001 3.098Renal Failure, Requiring Dialysis 2.34 1.5115 <.0001 4.534
Vessels DiseasedLeft Main Disease 4.00 0.4418 <.0001 1.555Number of Vessels Diseased
Fewer than Two Vessels Diseased 54.46 — Reference — 1.000Two Vessels Diseased 31.94 0.2774 <.0001 1.320Three Vessels Diseased 13.61 0.3885 <.0001 1.475
Intercept = -3.7072C Statistic = 0.861
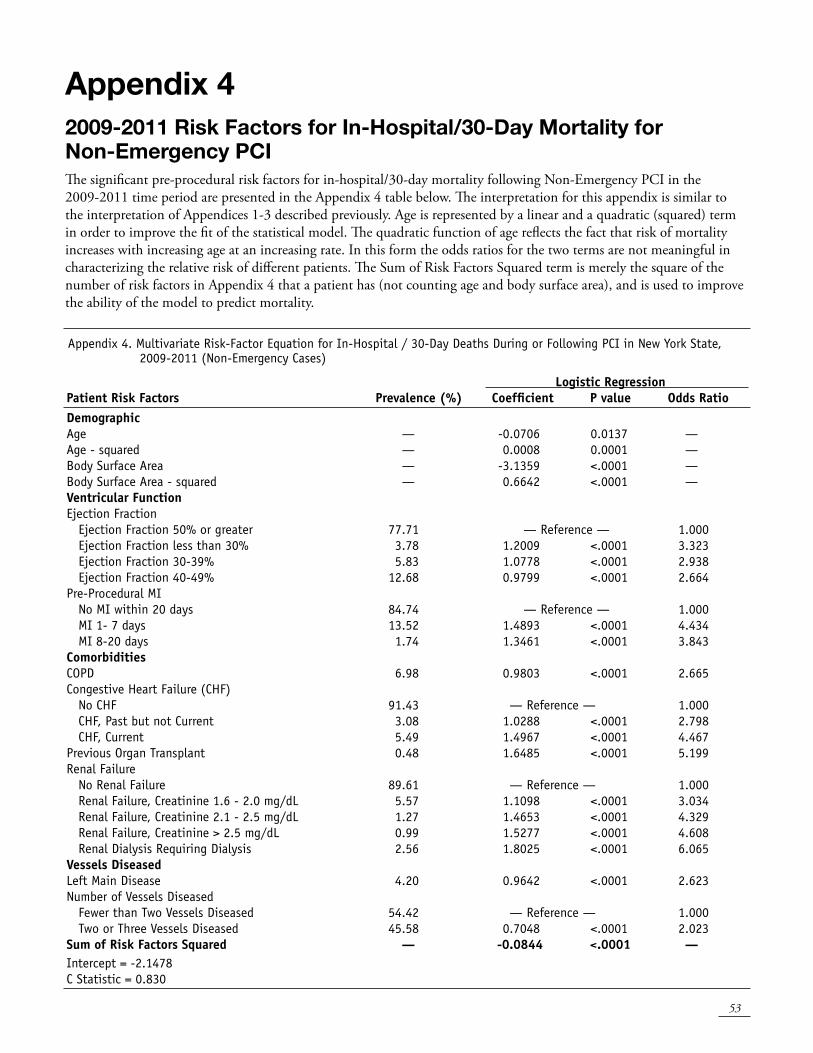
53
Appendix 42009-2011 Risk Factors for In-Hospital/30-Day Mortality for Non-Emergency PCIThe significant pre-procedural risk factors for in-hospital/30-day mortality following Non-Emergency PCI in the 2009-2011 time period are presented in the Appendix 4 table below. The interpretation for this appendix is similar to the interpretation of Appendices 1-3 described previously. Age is represented by a linear and a quadratic (squared) term in order to improve the fit of the statistical model. The quadratic function of age reflects the fact that risk of mortality increases with increasing age at an increasing rate. In this form the odds ratios for the two terms are not meaningful in characterizing the relative risk of different patients. The Sum of Risk Factors Squared term is merely the square of the number of risk factors in Appendix 4 that a patient has (not counting age and body surface area), and is used to improve the ability of the model to predict mortality.
Appendix 4. Multivariate Risk-Factor Equation for In-Hospital / 30-Day Deaths During or Following PCI in New York State, 2009-2011 (Non-Emergency Cases)
Logistic RegressionPatient Risk Factors Prevalence (%) Coefficient P value Odds RatioDemographic Age — -0.0706 0.0137 —Age - squared — 0.0008 0.0001 —Body Surface Area — -3.1359 <.0001 —Body Surface Area - squared — 0.6642 <.0001 —Ventricular FunctionEjection Fraction
Ejection Fraction 50% or greater 77.71 — Reference — 1.000 Ejection Fraction less than 30% 3.78 1.2009 <.0001 3.323 Ejection Fraction 30-39% 5.83 1.0778 <.0001 2.938 Ejection Fraction 40-49% 12.68 0.9799 <.0001 2.664
Pre-Procedural MI No MI within 20 days 84.74 — Reference — 1.000 MI 1- 7 days 13.52 1.4893 <.0001 4.434 MI 8-20 days 1.74 1.3461 <.0001 3.843
ComorbiditiesCOPD 6.98 0.9803 <.0001 2.665Congestive Heart Failure (CHF)
No CHF 91.43 — Reference — 1.000 CHF, Past but not Current 3.08 1.0288 <.0001 2.798 CHF, Current 5.49 1.4967 <.0001 4.467
Previous Organ Transplant 0.48 1.6485 <.0001 5.199Renal Failure
No Renal Failure 89.61 — Reference — 1.000 Renal Failure, Creatinine 1.6 - 2.0 mg/dL 5.57 1.1098 <.0001 3.034 Renal Failure, Creatinine 2.1 - 2.5 mg/dL 1.27 1.4653 <.0001 4.329 Renal Failure, Creatinine > 2.5 mg/dL 0.99 1.5277 <.0001 4.608 Renal Dialysis Requiring Dialysis 2.56 1.8025 <.0001 6.065
Vessels DiseasedLeft Main Disease 4.20 0.9642 <.0001 2.623Number of Vessels Diseased
Fewer than Two Vessels Diseased 54.42 — Reference — 1.000 Two or Three Vessels Diseased 45.58 0.7048 <.0001 2.023
Sum of Risk Factors Squared — -0.0844 <.0001 —Intercept = -2.1478C Statistic = 0.830
54
Appendix 5 2009-2011 Risk Factors for In-Hospital/30-Day Mortality for Emergency PCIThe significant pre-procedural risk factors for in-hospital/30-day mortality following Emergency PCI in the 2009-2011 time period are presented in the Appendix 5 table below. The interpretation of this table is similar to the interpretation of Appendices 1-4.
Appendix 5 Multivariate Risk-Factor Equation for In-Hospital / 30-Day Deaths During or Following PCI in New York State, 2009 - 2011 (Emergency Cases)
Logistic RegressionPatient Risk Factors Prevalence (%) Coefficient P value Odds Ratio
Demographic Age: Number of years greater than 50 — 0.0503 <.0001 1.052Body Surface Area — -4.6737 0.0009 —Body Surface Area – squared — 1.0477 0.0025 —
Hemodynamic StatusUnstable 3.28 1.9699 <.0001 7.170
Ventricular FunctionEjection Fraction
Ejection Fraction 30% or greater 92.46 — Reference — 1.000Ejection Fraction less than 20% 1.34 2.0766 <.0001 7.977Ejection Fraction 20-29% 6.20 1.2747 <.0001 3.578
Pre-Procedural MI No STEMI within 24 hrs 24.38 — Reference — 1.000STEMI within 24 hrs 75.62 1.2311 <.0001 3.425
ComorbiditiesCerebrovascular Disease 4.80 0.7627 <.0001 2.144CHF, Current 4.59 1.2578 <.0001 3.518Malignant Ventricular Arrhythmia 1.91 1.4523 <.0001 4.273Peripheral Vascular Disease 4.78 0.8832 <.0001 2.419Renal Failure
No Renal Failure 70.43 — Reference — 1.000Renal Failure, Creatinine 1.2 - 1.5 mg/dL 21.87 0.6443 <.0001 1.905Renal Failure , Creatinine 1.6 - 2.0 mg/dL 4.79 1.0009 <.0001 2.721Renal Failure , Creatinine 2.1 - 3.0 mg/dL 1.43 1.3900 <.0001 4.015Renal Failure , Creatinine > 3.0 mg/dL 0.52 1.6677 <.0001 5.300Renal Failure Requiring Dialysis 0.96 1.8853 <.0001 6.588
Vessels DiseasedLeft Main Disease 2.81 0.9969 <.0001 2.710Number of Vessels Diseased
Fewer than Three Vessels Diseased 85.70 — Reference — 1.000Three Vessels Diseased 14.30 0.7121 <.0001 2.038
Sum of Risk Factors Squared — -0.0689 0.0004 —
Intercept = -1.1237C Statistic = 0.840
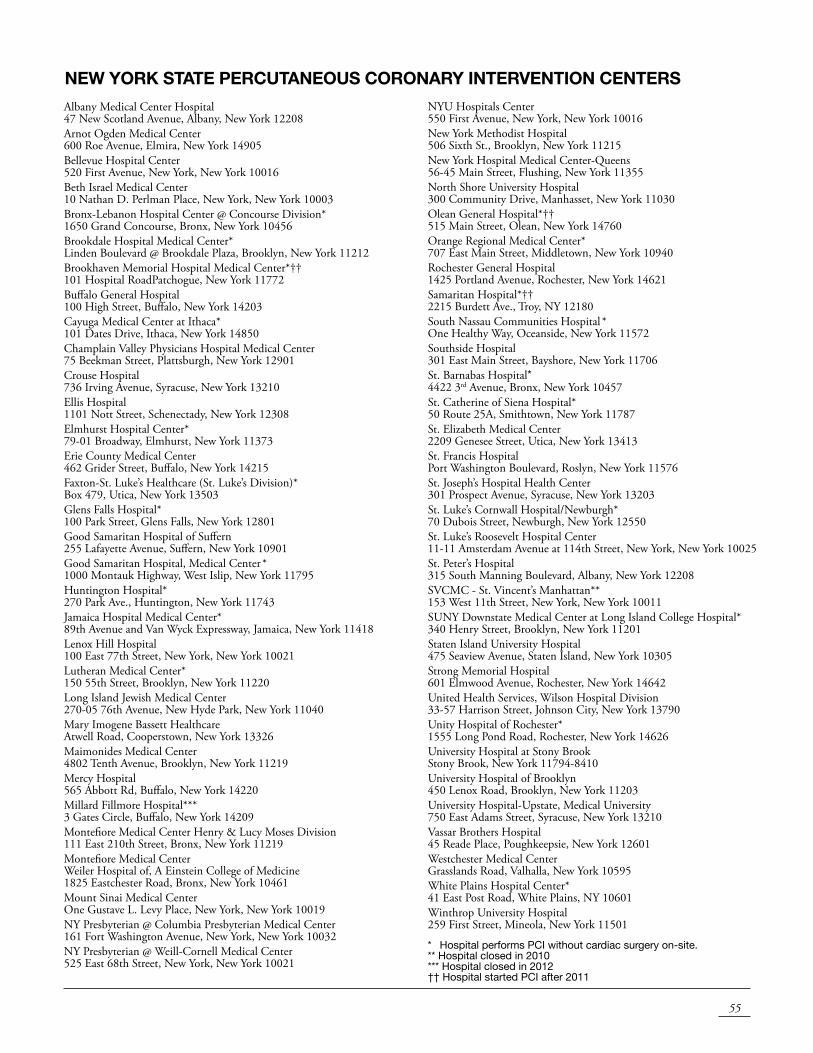
55
Albany Medical Center Hospital 47 New Scotland Avenue, Albany, New York 12208Arnot Ogden Medical Center 600 Roe Avenue, Elmira, New York 14905Bellevue Hospital Center 520 First Avenue, New York, New York 10016Beth Israel Medical Center 10 Nathan D. Perlman Place, New York, New York 10003Bronx-Lebanon Hospital Center @ Concourse Division* 1650 Grand Concourse, Bronx, New York 10456Brookdale Hospital Medical Center* Linden Boulevard @ Brookdale Plaza, Brooklyn, New York 11212 Brookhaven Memorial Hospital Medical Center*†† 101 Hospital RoadPatchogue, New York 11772Buffalo General Hospital 100 High Street, Buffalo, New York 14203Cayuga Medical Center at Ithaca* 101 Dates Drive, Ithaca, New York 14850Champlain Valley Physicians Hospital Medical Center 75 Beekman Street, Plattsburgh, New York 12901Crouse Hospital 736 Irving Avenue, Syracuse, New York 13210Ellis Hospital 1101 Nott Street, Schenectady, New York 12308Elmhurst Hospital Center* 79-01 Broadway, Elmhurst, New York 11373Erie County Medical Center 462 Grider Street, Buffalo, New York 14215Faxton-St. Luke’s Healthcare (St. Luke’s Division)* Box 479, Utica, New York 13503Glens Falls Hospital* 100 Park Street, Glens Falls, New York 12801Good Samaritan Hospital of Suffern 255 Lafayette Avenue, Suffern, New York 10901Good Samaritan Hospital, Medical Center * 1000 Montauk Highway, West Islip, New York 11795Huntington Hospital* 270 Park Ave., Huntington, New York 11743Jamaica Hospital Medical Center* 89th Avenue and Van Wyck Expressway, Jamaica, New York 11418 Lenox Hill Hospital 100 East 77th Street, New York, New York 10021Lutheran Medical Center* 150 55th Street, Brooklyn, New York 11220Long Island Jewish Medical Center 270-05 76th Avenue, New Hyde Park, New York 11040Mary Imogene Bassett Healthcare Atwell Road, Cooperstown, New York 13326Maimonides Medical Center 4802 Tenth Avenue, Brooklyn, New York 11219Mercy Hospital 565 Abbott Rd, Buffalo, New York 14220Millard Fillmore Hospital*** 3 Gates Circle, Buffalo, New York 14209Montefiore Medical Center Henry & Lucy Moses Division 111 East 210th Street, Bronx, New York 11219Montefiore Medical Center Weiler Hospital of, A Einstein College of Medicine 1825 Eastchester Road, Bronx, New York 10461Mount Sinai Medical Center One Gustave L. Levy Place, New York, New York 10019NY Presbyterian @ Columbia Presbyterian Medical Center 161 Fort Washington Avenue, New York, New York 10032NY Presbyterian @ Weill-Cornell Medical Center 525 East 68th Street, New York, New York 10021
NYU Hospitals Center 550 First Avenue, New York, New York 10016New York Methodist Hospital 506 Sixth St., Brooklyn, New York 11215New York Hospital Medical Center-Queens 56-45 Main Street, Flushing, New York 11355North Shore University Hospital 300 Community Drive, Manhasset, New York 11030Olean General Hospital*†† 515 Main Street, Olean, New York 14760Orange Regional Medical Center* 707 East Main Street, Middletown, New York 10940Rochester General Hospital 1425 Portland Avenue, Rochester, New York 14621Samaritan Hospital*†† 2215 Burdett Ave., Troy, NY 12180South Nassau Communities Hospital * One Healthy Way, Oceanside, New York 11572Southside Hospital 301 East Main Street, Bayshore, New York 11706St. Barnabas Hospital* 4422 3rd Avenue, Bronx, New York 10457St. Catherine of Siena Hospital* 50 Route 25A, Smithtown, New York 11787St. Elizabeth Medical Center 2209 Genesee Street, Utica, New York 13413St. Francis Hospital Port Washington Boulevard, Roslyn, New York 11576St. Joseph’s Hospital Health Center 301 Prospect Avenue, Syracuse, New York 13203St. Luke’s Cornwall Hospital/Newburgh* 70 Dubois Street, Newburgh, New York 12550St. Luke’s Roosevelt Hospital Center 11-11 Amsterdam Avenue at 114th Street, New York, New York 10025St. Peter’s Hospital 315 South Manning Boulevard, Albany, New York 12208SVCMC - St. Vincent’s Manhattan** 153 West 11th Street, New York, New York 10011SUNY Downstate Medical Center at Long Island College Hospital* 340 Henry Street, Brooklyn, New York 11201Staten Island University Hospital 475 Seaview Avenue, Staten Island, New York 10305Strong Memorial Hospital 601 Elmwood Avenue, Rochester, New York 14642United Health Services, Wilson Hospital Division 33-57 Harrison Street, Johnson City, New York 13790Unity Hospital of Rochester* 1555 Long Pond Road, Rochester, New York 14626University Hospital at Stony Brook Stony Brook, New York 11794-8410University Hospital of Brooklyn 450 Lenox Road, Brooklyn, New York 11203University Hospital-Upstate, Medical University 750 East Adams Street, Syracuse, New York 13210Vassar Brothers Hospital 45 Reade Place, Poughkeepsie, New York 12601Westchester Medical Center Grasslands Road, Valhalla, New York 10595White Plains Hospital Center* 41 East Post Road, White Plains, NY 10601Winthrop University Hospital 259 First Street, Mineola, New York 11501
NEW YORK STATE PERCUTANEOUS CORONARY INTERVENTION CENTERS
* Hospital performs PCI without cardiac surgery on-site.** Hospital closed in 2010*** Hospital closed in 2012†† Hospital started PCI after 2011

56
57
Additional copies of this report may be obtained through the Department of Health web site at http://www.nyhealth.govor by writing to: Cardiac Box 2000 New York State Department of Health Albany, New York 12220

3/14