Embed Size (px)
Citation preview
New York State Department of Health
February 2008
PERCUTANEOUS CORONARY
INTERVENTIONS (PCI)
in New York State
2003-2005

George Alfieris, M.D.Associate Professor of SurgeryStrong Memorial HospitalChief of Pediatric Cardiopulmonary SurgerySUNY - Upstate Medical UniversityRochester and Syracuse, NY
Frederick Bierman, M.D.Director of Pediatric CardiologyNorth Shore – LIJ Health SystemNew Hyde Park, NY
Alfred T. Culliford, M.D.Professor of Clinical SurgeryNYU Medical Center, New York, NY
Michael H. Gewitz, M.D.Chief, Pediatric CardiologyWestchester Medical CenterDirector of PediatricsNew York Medical College, Valhalla, NY
Jeffrey P. Gold, M.D.Provost and Executive Vice President for Health AffairsDean of the College of MedicineThe University of Toledo, Toledo, OH
Mary Hibberd, M.D.Public Health Consultant
Robert Higgins, M.D.Mary & John Bent ChairmanProfessor of SurgeryRush University, Chicago, IL
David R. Holmes Jr., M.D.Professor of MedicineDirector, Cardiac Catheterization LaboratoryMayo Clinic, Rochester, MN
Robert Jones, M.D.Mary & Deryl Hart Professor of SurgeryDuke University Medical Center, Durham, NC
Stanley Katz, M.D.Chief, Division of CardiologyNorth Shore - LIJ Health System, Manhasset, NY
Thomas J. Kulik, M.D.Director Pediatric CardiologyCincinnati Children’s Hospital Medical Center Cincinnati, OH
John J. Lamberti Jr., M.D.Director, Pediatric Cardiac SurgeryChildren’s Hospital of San Diego, San Diego, CA
Tia Powell, M.D.Executive Director, New York State Task Force on Life and
the LawNew York State Department of Health, New York, NY
Samin K. Sharma, M.D.Director, Cardiac Catheterization LaboratoryMt. Sinai Hospital, New York, NY
Craig Smith, M.D.Chief, Division of Cardiothoracic SurgeryNY Presbyterian Hospital - ColumbiaNew York, NY
Deborah Whalen, R.N.C.S, M.B.A, A.N.P.Clinical Service ManagerDivision of CardiologyBoston Medical Center, Boston, MA
Roberta Williams, M.D.V.P. for Pediatrics & Academic Affairs University of Southern CaliforniaProfessor and Chair of PediatricsKeck School of Medicine at USC, Los Angeles, CA
Members
Chair Vice Chair
Members of the New York StateCardiac Advisory Committee
Spencer King, M.D.Fuqua Chair of Interventional CardiologyFuqua Heart Center @ Piedmont HospitalProfessor Emeritus in CardiologyEmory University Hospital, Atlanta, GA
Gary Walford, M.D.Director Cardiac Catheterization LabSt. Joseph’s HospitalSyracuse, NY
PCI Reporting System Analysis Workgroup
Members & ConsultantsGary Walford, M.D. (Chair)Director, Cardiac Catheterization Laboratory St. Joseph’s Hospital
Edward L. Hannan, Ph.D.Distinguished Professor, Department of Health Policy,
Management & BehaviorAssociate Dean for ResearchUniversity at Albany, School of Public Health
David R. Holmes Jr., M.D.Professor of Medicine Director, Cardiac Catheterization Laboratory Mayo Clinic
Robert Jones, M.D.Mary & Deryl Hart Professor of Surgery Duke University Medical Center
Stanley Katz, M.D.Chief, Division of Cardiology North Shore – LIJ Health System
Samin K. Sharma, M.D.Director, Cardiac Catheterization LaboratoryMt. Sinai Hospital
Paula M. Waselauskas, RN, MSNAdministrator, Cardiac Services Program New York State Department of Health
Kimberly S. Cozzens, M.A.Cardiac Initiatives Research Manager Cardiac Services Program
Cynthia JohnsonPCI and Special Projects CoordinatorCardiac Services Program
Karen C. Keller-Ullrich, RNClinical InvestigatorCardiac Services Program
Michael Racz, Ph.D.Research Scientist Department of Health Policy, Management & Behavior University at Albany, School of Public HealthCardiac Services ProgramNew York State Department of Health
Chuntao Wu, M.D., Ph.D.Research Scientist Cardiac Services Program
Staff to PCI Analysis Workgroup
ConsultantEdward L. Hannan, Ph.D.Distinguished Professor, Department of Health Policy,
Management & BehaviorAssociate Dean for ResearchUniversity at Albany, School of Public Health
Program AdministratorPaula M. Waselauskas, RN, MSNCardiac Services ProgramNYS Department of Health
Members of the New York State Cardiac Advisory Committee, con’t.
TABLE OF CONTENTSMESSAGE FROM COMMISSIONER . . . . . . . . . . . . . . . . . . . . . . . . . . . . . . . . . . . . . . . . . . . . . . . . . . . . . . . . . . . 1
INTRODUCTION . . . . . . . . . . . . . . . . . . . . . . . . . . . . . . . . . . . . . . . . . . . . . . . . . . . . . . . . . . . . . . . . . . . . . . . . . . 3
HEALTH DEPARTMENT PROGRAM . . . . . . . . . . . . . . . . . . . . . . . . . . . . . . . . . . . . . . . . . . . . . . . . . . . . . . . . . . 3
PATIENT POPULATION . . . . . . . . . . . . . . . . . . . . . . . . . . . . . . . . . . . . . . . . . . . . . . . . . . . . . . . . . . . . . . . . . . . . 3
RISK ADJUSTMENT FOR ASSESSING PROVIDER PERFORMANCE . . . . . . . . . . . . . . . . . . . . . . . . . . . . . . . 4
Data Collection, Data Validation and Identifying In-hospital/30-Day Deaths . . . . . . . . . . . . . . . . . . . . . . . . . . . . 4 Assessing Patient Risk . . . . . . . . . . . . . . . . . . . . . . . . . . . . . . . . . . . . . . . . . . . . . . . . . . . . . . . . . . . . . . . . . . . . . . . 4 Predicting Patient Mortality Rates for Providers . . . . . . . . . . . . . . . . . . . . . . . . . . . . . . . . . . . . . . . . . . . . . . . . . . . 4 Computing the Risk-Adjusted Rate . . . . . . . . . . . . . . . . . . . . . . . . . . . . . . . . . . . . . . . . . . . . . . . . . . . . . . . . . . . . 5 Interpreting the Risk-Adjusted Mortality Rate . . . . . . . . . . . . . . . . . . . . . . . . . . . . . . . . . . . . . . . . . . . . . . . . . . . . 5 How this Contributes to Quality Improvement . . . . . . . . . . . . . . . . . . . . . . . . . . . . . . . . . . . . . . . . . . . . . . . . . . . 52005 HOSPITAL RISK–ADJUSTED MORTALITY FOR PCI . . . . . . . . . . . . . . . . . . . . . . . . . . . . . . . . . . . . . . . 6
2003 – 2005 HOSPITAL DATA FOR PCI . . . . . . . . . . . . . . . . . . . . . . . . . . . . . . . . . . . . . . . . . . . . . . . . . . . . . . . . 6
Table 1 Hospital Observed, Expected and Risk-Adjusted In-Hospital/30-Day Mortality Rates (RAMR) for PCI in New York State, 2005 Discharges . . . . . . . . . . . . . . . . . . . . . . . . . . . . . . . . . 8 Figure 1 In-Hospital/30-Day Risk-Adjusted Mortality Rates for PCI in New York State, 2005 Discharges (All Cases) . . . . . . . . . . . . . . . . . . . . . . . . . . . . . . . . . . . . . . . . . . . . . . . . . . . . . . . . . 9 Figure 2 In-Hospital/30-Day Risk-Adjusted Mortality Rates for PCI in New York State, 2005 Discharges (Non-Emergency Cases) . . . . . . . . . . . . . . . . . . . . . . . . . . . . . . . . . . . . . . . . . . . . . . 10 Table 2 Hospital Observed, and Risk-Adjusted In-Hospital/30-Day Mortality Rates (RAMR) for PCI in New York State, 2003 – 2005 Discharges . . . . . . . . . . . . . . . . . . . . . . . . . . 112003 – 2005 HOSPITAL AND CARDIOLOGIST DATA FOR PCI . . . . . . . . . . . . . . . . . . . . . . . . . . . . . . . . . . . 12
Table 3 Cardiologist Observed, Expected and Risk-Adjusted In-Hospital/30-Day Mortality Rates (RAMR) for PCI in New York State, 2003 – 2005 Discharges . . . . . . . . . . . . . . . . . . . . . . . . . . 12 Table 4 Summary Information for Cardiologists Practicing at More Than One Hospital, 2003 – 2005 Discharges . . . . . . . . . . . . . . . . . . . . . . . . . . . . . . . . . . . . . . . . . . . 28CRITERIA USED IN REPORTING SIGNIFICANT RISK FACTORS (2005) . . . . . . . . . . . . . . . . . . . . . . . . . 42
MEDICAL TERMINOLOGY . . . . . . . . . . . . . . . . . . . . . . . . . . . . . . . . . . . . . . . . . . . . . . . . . . . . . . . . . . . . . . . . 43
APPENDIx 1 2005 Risk Factors for PCI In-Hospital/30-Day Mortality . . . . . . . . . . . . . . . . . . . . . . . . . . . . . . . . . 44
APPENDIx 2 2005 Risk Factors For In-Hospital/30-Day Mortality for Non-Emergency PCI . . . . . . . . . . . . . . . . 46
APPENDIx 3 2003 – 2005 Risk Factors for PCI In-Hospital/30-Day Mortality (All Cases) . . . . . . . . . . . . . . . . . . 47
APPENDIx 4 2003 – 2005 Risk Factors for In-Hospital/30-Day Mortality for Non-Emergency PCI . . . . . . . . . . . 49
APPENDIx 5 2003 – 2005 Risk Factors for In-Hospita/30-Day Mortality for Emergency PCI. . . . . . . . . . . . . . . . 50
NYS Percutaneous Coronary Intervention Centers . . . . . . . . . . . . . . . . . . . . . . . . . . . . . . . . . . . . . . . . . . . . . . . . . . 51

1
MESSAgE FROM COMMISSIONERI am pleased to provide the information contained in this booklet for use by health care providers, patients and families of patients who are considering treatment options for cardiovascular disease. The report provides data on risk factors associated with in-hospital/30-day mortality following percutaneous coronary intervention (PCI) (also known as angioplasty) and lists hospital and physician-specific mortality rates. The analyses use a risk-adjustment process to account for pre-existing differences in patients’ health status. This report includes information on mortality occurring in the same hospitalization as PCI and that which occurs outside the hospital but within 30 days following PCI. We believe this to be an important quality indicator that will provide useful information to patients and providers.
The Percutaneous Coronary Interventions (PCI) Reporting System (the data set upon which these analyses are based) represents the largest collection of data available in which all patients undergoing PCI have been reported. Hospitals and doctors involved in cardiac care have worked cooperatively with the Department of Health and the Cardiac Advisory Committee to compile accurate and meaningful data that can and have been used to enhance quality of care.
I encourage doctors to discuss this information with their patients and colleagues as they develop treatment plans. While these statistics are an important tool in making informed health care choices, doctors and patients must make individual treatment plans together after careful consideration of all pertinent factors. It is also important to keep in mind that the information in this booklet does not include data after 2005. Important changes may have taken place in some hospitals since that time.
I would also ask that patients and physicians alike give careful consideration to the importance of healthy lifestyles for all those affected by heart disease. Controllable risk factors that contribute to a higher likelihood of developing coronary artery disease are high cholesterol levels, cigarette smoking, high blood pressure, obesity and lack of exercise. Limiting these risk factors will contribute to improved health for patients undergoing PCI and will help to minimize the development of new blockages in the coronary arteries.
I extend my appreciation to the providers in this state and to the Cardiac Advisory Committee for their efforts in developing and refining this remarkable system. The Department of Health will continue to work in partnership with hospitals and physicians to ensure high quality of care for patients with heart disease. We look forward to providing reports such as this and the Adult Cardiac Surgery Report on an annual basis. I applaud the continued high quality of care available from our New York State health care providers.

2
3
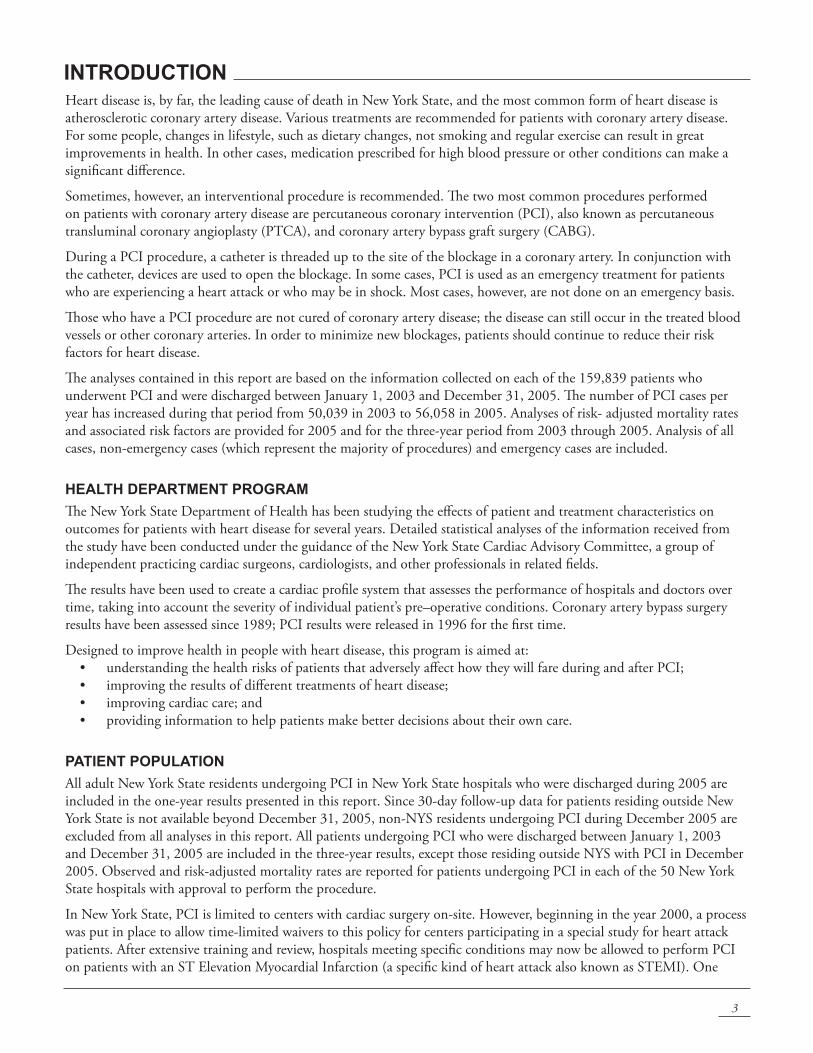
Heart disease is, by far, the leading cause of death in New York State, and the most common form of heart disease is atherosclerotic coronary artery disease. Various treatments are recommended for patients with coronary artery disease. For some people, changes in lifestyle, such as dietary changes, not smoking and regular exercise can result in great improvements in health. In other cases, medication prescribed for high blood pressure or other conditions can make a significant difference.
Sometimes, however, an interventional procedure is recommended. The two most common procedures performed on patients with coronary artery disease are percutaneous coronary intervention (PCI), also known as percutaneous transluminal coronary angioplasty (PTCA), and coronary artery bypass graft surgery (CABG).
During a PCI procedure, a catheter is threaded up to the site of the blockage in a coronary artery. In conjunction with the catheter, devices are used to open the blockage. In some cases, PCI is used as an emergency treatment for patients who are experiencing a heart attack or who may be in shock. Most cases, however, are not done on an emergency basis.
Those who have a PCI procedure are not cured of coronary artery disease; the disease can still occur in the treated blood vessels or other coronary arteries. In order to minimize new blockages, patients should continue to reduce their risk factors for heart disease.
The analyses contained in this report are based on the information collected on each of the 159,839 patients who underwent PCI and were discharged between January 1, 2003 and December 31, 2005. The number of PCI cases per year has increased during that period from 50,039 in 2003 to 56,058 in 2005. Analyses of risk- adjusted mortality rates and associated risk factors are provided for 2005 and for the three-year period from 2003 through 2005. Analysis of all cases, non-emergency cases (which represent the majority of procedures) and emergency cases are included.
HEALTH DEPARTMENT PROgRAM
The New York State Department of Health has been studying the effects of patient and treatment characteristics on outcomes for patients with heart disease for several years. Detailed statistical analyses of the information received from the study have been conducted under the guidance of the New York State Cardiac Advisory Committee, a group of independent practicing cardiac surgeons, cardiologists, and other professionals in related fields.
The results have been used to create a cardiac profile system that assesses the performance of hospitals and doctors over time, taking into account the severity of individual patient’s pre–operative conditions. Coronary artery bypass surgery results have been assessed since 1989; PCI results were released in 1996 for the first time.
Designed to improve health in people with heart disease, this program is aimed at:• understandingthehealthrisksofpatientsthatadverselyaffecthowtheywillfareduringandafterPCI;• improvingtheresultsofdifferenttreatmentsofheartdisease;• improvingcardiaccare;and• providinginformationtohelppatientsmakebetterdecisionsabouttheirowncare.
PATIENT POPULATION
All adult New York State residents undergoing PCI in New York State hospitals who were discharged during 2005 are included in the one-year results presented in this report. Since 30-day follow-up data for patients residing outside New York State is not available beyond December 31, 2005, non-NYS residents undergoing PCI during December 2005 are excluded from all analyses in this report. All patients undergoing PCI who were discharged between January 1, 2003 and December 31, 2005 are included in the three-year results, except those residing outside NYS with PCI in December 2005. Observed and risk-adjusted mortality rates are reported for patients undergoing PCI in each of the 50 New York State hospitals with approval to perform the procedure.
In New York State, PCI is limited to centers with cardiac surgery on-site. However, beginning in the year 2000, a process was put in place to allow time-limited waivers to this policy for centers participating in a special study for heart attack patients. After extensive training and review, hospitals meeting specific conditions may now be allowed to perform PCI on patients with an ST Elevation Myocardial Infarction (a specific kind of heart attack also known as STEMI). One
INTRODUCTION
4
hospital began performing PCI under these conditions in 2000, eight were added between 2001 and 2004, and one more began in 2005. Several of these hospitals have also been granted permission to perform PCI on patients not having a STEMI. This project did not begin until 2006 and therefore outcomes for these programs are not included in this report. We will continue to study the impact of these changes over the next several years.
RISK ADJUSTMENT FOR ASSESSINg PROVIDER PERFORMANCE
Hospital or physician performance is an important factor that directly relates to patient outcomes. Whether patients recover quickly, experience complications, or die following a procedure is in part a result of the kind of medical care they receive. It is difficult, however, to compare outcomes among hospitals when assessing performance, because different hospitals treat different types of patients. Hospitals with sicker patients may have higher rates of complications and death than other hospitals in the state. The following describes how the New York State Department of Health adjusts for patient risk in assessing outcomes of care in different hospitals.
Data Collection, Data Validation and Identifying In-Hospital/30-Day Deaths
As part of the risk-adjustment process, hospitals in New York State where PCI is performed provide information to the Department of Health for each patient undergoing those procedures. Data concerning patients’ demographic and clinical characteristics are collected by hospitals’ cardiac catheterization laboratories. Approximately 40 of these characteristics (or risk factors) are collected for each patient. Along with information about the hospital, physician, and the patient’s status at discharge, these data are entered into a computer, and sent to the Department of Health for analysis.
Data are verified through review of unusual reporting frequencies, cross-matching of PCI data with other Department of Health databases and a review of medical records for a selected sample of cases. These activities are extremely helpful in ensuring consistent interpretation of data elements across hospitals.
The analysis bases mortality on deaths occurring during the same hospital stay in which a patient underwent PCI and on deaths that occur after hospital discharge but within 30 days of PCI. In this report, an in-hospital death is defined as a patient who died subsequent to PCI during the same acute care admission or was discharged to hospice care and expired within 30 days. Data on deaths occurring after discharge from the hospital are made available by the National Center for Health Statistics. More information on this data source can be obtained from http://www.cdc.gov/nchs/ndi.htm.
Assessing Patient Risk
Each person who develops coronary artery disease has a unique health history. A cardiac profile system has been developed to evaluate the risk of treatment for each individual patient based on his or her history, weighing the important health facts for that person based on the experiences of thousands of patients who have undergone the same procedures in recent years. All important risk factors for each patient are combined to create his or her risk profile.
For example, an 80-year-old patient with a heart attack in the past six hours has a very different risk profile than a 40-year-old who has never suffered a heart attack.
The statistical analyses conducted by the New York State Department of Health consist of determining which of the risk factors collected are significantly related to in-hospital/30-day death, and determining how to weight the significant risk factors to predict the chance each patient will have of dying in the hospital given his or her specific characteristics.
Predicting Patient Mortality Rates for Providers
The statistical methods used to predict mortality on the basis of the significant risk factors are tested to determine if they are sufficiently accurate in predicting mortality for patients who are extremely ill prior to undergoing the procedure as well as for patients who are relatively healthy. These tests have confirmed that the models are reasonably accurate in predicting how patients of all different risk levels will fare when undergoing PCI.
The mortality rate for each hospital and cardiologist is also predicted using the statistical model. This is accomplished by adding the predicted probabilities of death for each of the provider’s patients and dividing by the number of patients. The resulting rate is an estimate of what the provider’s mortality rate would have been if the hospital’s performance was identical to the state performance. The percentage is called the predicted or expected mortality rate (EMR). A hospital's expected mortality rate is contrasted with its observed mortality rate (OMR), which is the number of PCI patients who died divided by the total number of PCI patients.
5
Computing the Risk-Adjusted Rate
The risk-adjusted mortality rate (RAMR) represents the best estimate, based on the associated statistical model, of what the provider’s mortality rate would have been if the provider had a mix of patients identical to the statewide mix. Thus, the risk-adjusted mortality rate has, to the extent possible, ironed out differences among providers in patient severity of illness, since it arrives at a mortality rate for each provider based on an identical group of patients.
To get the risk-adjusted mortality rate, the observed mortality rate is first divided by the provider’s expected mortality rate. If the resulting ratio is larger than one, the provider has a higher mortality rate than expected on the basis of its patient mix; if it is smaller than one, the provider has a lower mortality rate than expected from its patient mix. The ratio is then multiplied by the overall statewide rate (0.88% in-hospital/30-day for NYS residents in 2005) to obtain the provider’s risk-adjusted rate.
Interpreting the Risk-Adjusted Mortality Rate
If the risk-adjusted mortality rate is lower than the statewide mortality rate, the hospital has a better performance than the state as a whole; if the risk-adjusted mortality rate is higher than the statewide mortality rate, the hospital has a worse performance than the state as a whole.
The risk-adjusted mortality rate is used in this report as a measure of quality of care provided by hospitals and cardiologists. However, there are reasons that a provider’s risk-adjusted rate may not be indicative of its true quality.
For example, extreme outcome rates may occur due to chance alone. This is particularly true for low-volume providers, for whom very high or very low rates are more likely to occur than for high-volume providers. Another attempt to prevent misinterpretation of differences caused by chance variation is the use of expected ranges (confidence intervals) in the reported results.
Differences in hospital coding of risk factors could be an additional reason that a hospital’s risk-adjusted rate may not be reflective of quality of care. The Department of Health monitors the quality of coded data by reviewing patients’ medical records to ascertain the presence of key risk factors. When significant coding problems have been discovered, hospitals have been required to recode these data and have been subject to subsequent monitoring.
Some commentators have suggested that patient severity of illness may not be accurately estimated because some risk factors are not included in the data system, and this could lead to misleading risk-adjusted rates. This is not likely because the New York State data system has been reviewed by practicing physicians in the field and is updated continually. It now contains virtually every risk factor that has ever been demonstrated to be related to patient mortality in national and international studies.
How This Contributes to Quality Improvement
The goal of the Department of Health and the Cardiac Advisory Committee is to improve the quality of care in relation to cardiac surgery and angioplasty in New York State. Providing the hospitals, cardiac surgeons (who perform cardiac surgery), and cardiologists (who perform PCI) in New York State with data about their own outcomes for these procedures allows them to examine the quality of their own care, and to identify opportunities to improve that care.
The data collected and analyzed in this program are reviewed by the Cardiac Advisory Committee, who assist with interpretation and advise the Department of Health regarding which hospitals and physicians may need special attention. Committee members have also conducted site visits to particular hospitals, and have recommended that some hospitals obtain the expertise of outside consultants to design improvements for their programs.
6
2005 HOSPITAL RISK-ADJUSTED MORTALITY FOR PCI
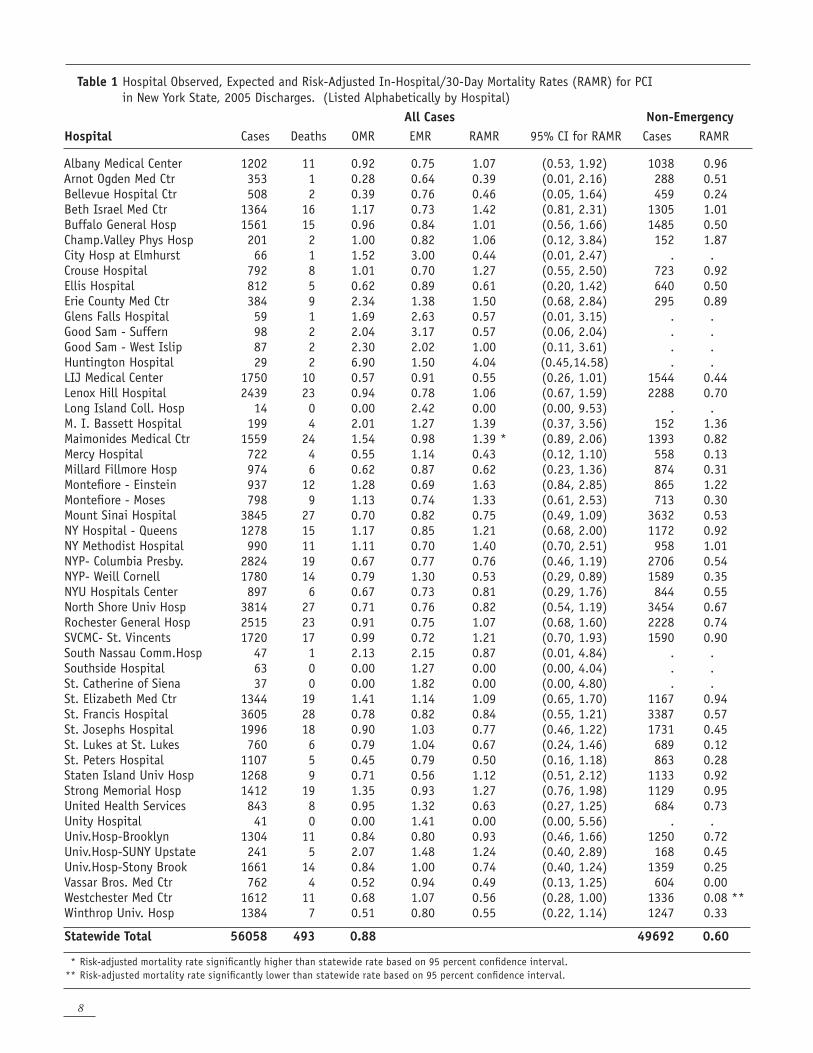
Table 1 and figures 1 and 2 present the 2005 PCI mortality results for the 50 hospitals performing PCI in New York in 2005. The table contains, for each hospital, the number of PCIs resulting in 2005 discharges, the number of in-hospital/30-day deaths, the observed mortality rate, the expected mortality rate based on the statistical model presented in Appendix 1, the risk-adjusted mortality rate, and a 95% confidence interval for the risk-adjusted rate. Also, it contains each hospital’s volume of cases and risk-adjusted mortality rate for non-emergency patients. Emergency patients are defined to be patients in shock, a state of hemodynamic instability (very low blood pressure), or patients who experienced a heart attack within 24 hours prior to undergoing PCI. The hospital risk-adjusted rates for non-emergency PCI patients are provided because many studies are confined to this group of patients, and because these patients comprise the majority of all PCI patients (88.64% in 2005).
The overall in-hospital/30-day mortality rate for the 56,058 PCIs performed at the 50 hospitals was 0.88%. Observed mortality rates ranged from 0.00% to 6.90%. The range in expected mortality rates, which measure patient severity of illness, was between 0.56% and 3.17%. The risk-adjusted rates, which measure hospital performance, range from 0.00% to 4.04%. Based on confidence intervals for risk-adjusted rates, one hospital (Maimonides Medical Center) had a risk-adjusted mortality rate that was significantly higher than the statewide average. No hospitals had risk-adjusted mortality rates significantly lower than the statewide average.
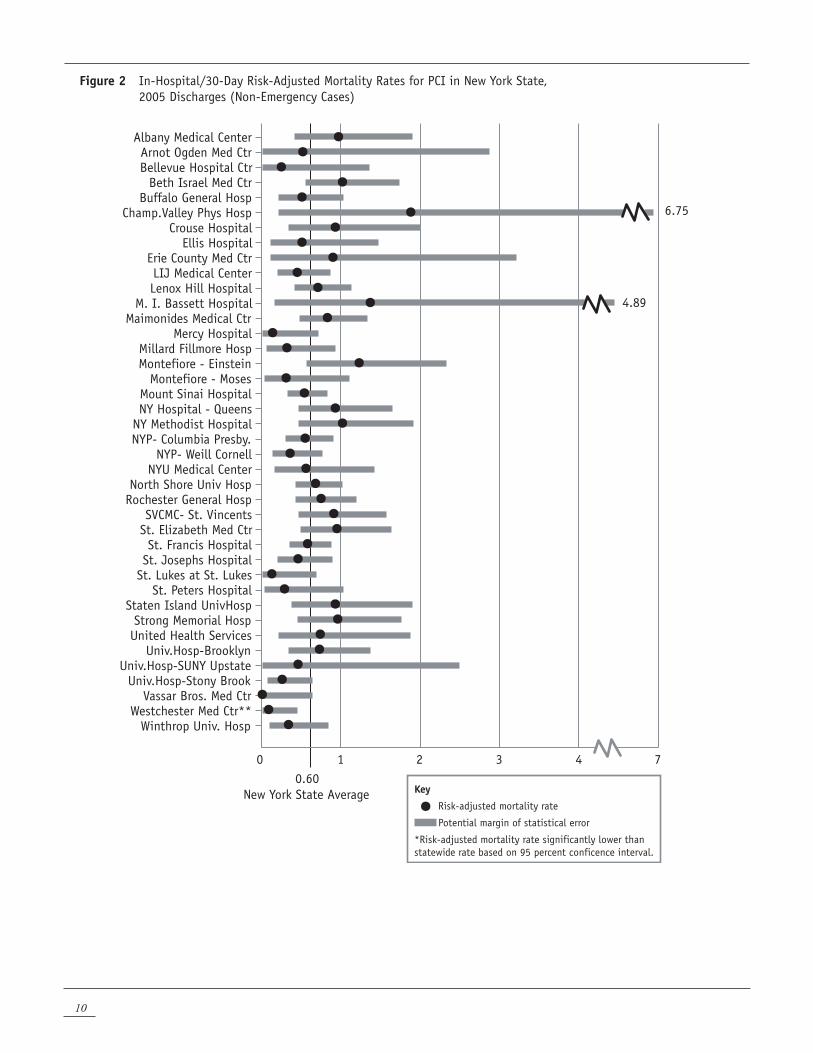
The last column of Table 1 presents the hospital risk-adjusted mortality rates for non-emergency cases (based on the statistical model presented in Appendix 2). As presented in the last row, the statewide in-hospital/30-day mortality rate for non-emergency cases is 0.60%. The range of risk-adjusted rates was from 0.00% to 1.87%. No hospitals had risk-adjusted mortality rates that were significantly higher than the statewide rate. One hospital (Westchester Medical Center) had a risk-adjusted mortality rate that was significantly lower than the statewide rate.
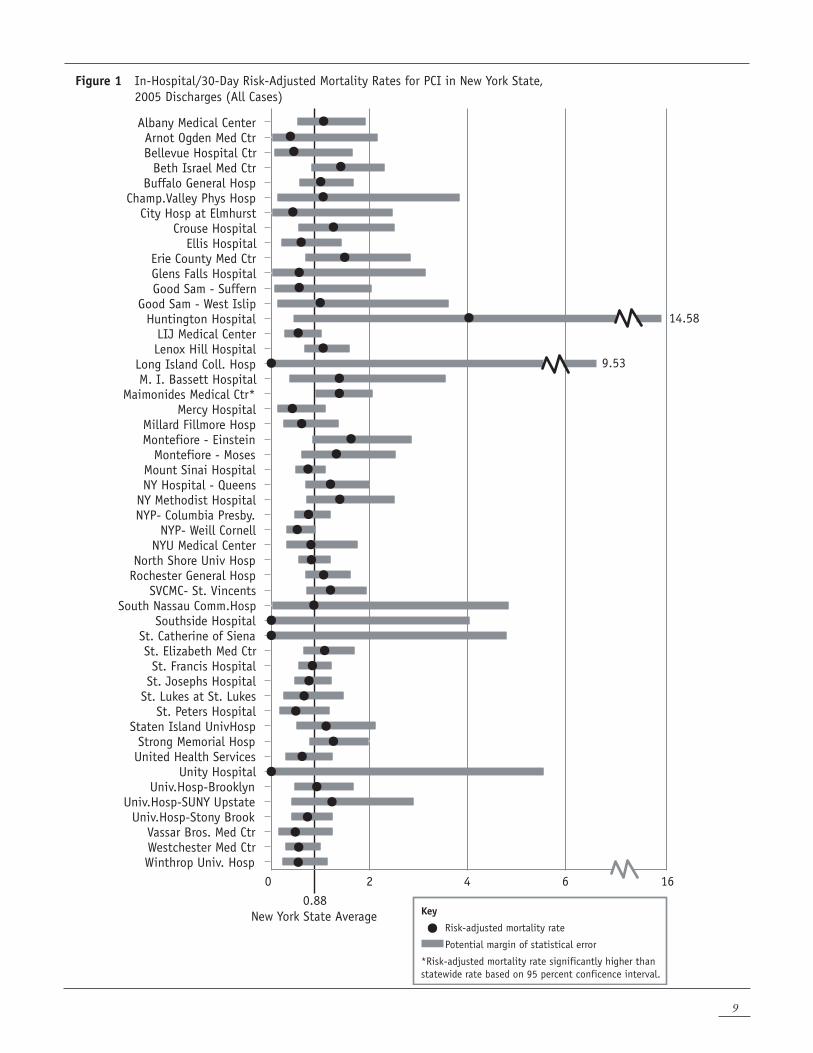
Figures 1 and 2 provide a visual representation of the data displayed in Table 1. For each hospital, the black dot represents the risk-adjusted mortality rate (RAMR) and the gray bar represents the confidence interval, or potential statistical error, for the RAMR. The black vertical line is the New York State in-hospital/30-day mortality rate. For any hospital where the gray bar crosses the state average line, the RAMR is not statistically different from the state as a whole. Hospitals that are statistical outliers will have gray bars (confidence intervals) that are either entirely above or entirely below the line for the statewide rate.
Since the 2005 PCI analysis is based on in-hospital 30-day mortality, the associated mortality rates cannot be compared directly to some previous NYS publications which are based on only in-hospital mortality.
The observed in-hospital mortality rate for all 2005 PCI discharges (not shown in Table 1) was 0.52% for all 56,058 patients included in Table 1. For the Non-Emergency analysis, there were 49,692 patients altogether with an in-hospital mortality rate of 0.26%. As stated above, non-NYS residents with PCI performed in December of 2005 are excluded from analyses due to lack of follow-up data. This accounts for 174 cases.
2003-2005 HOSPITAL DATA FOR PCI
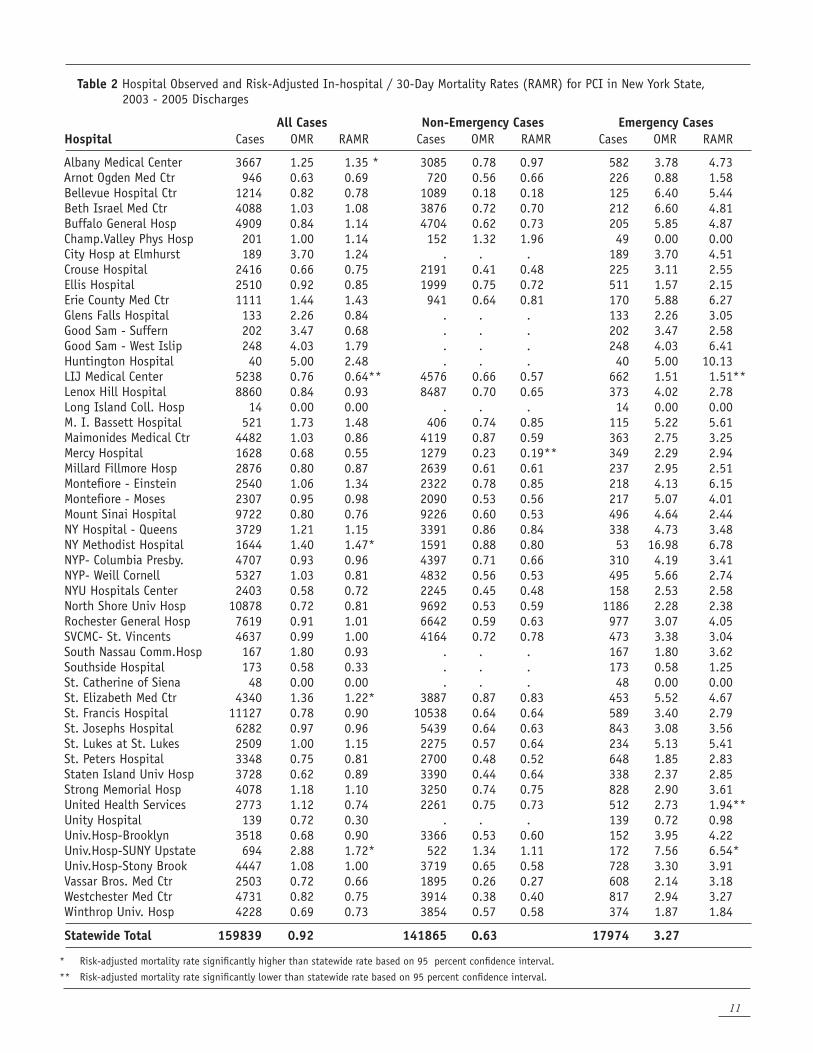
Table 2 provides the number of PCIs, the observed in-hospital mortality rate, and the risk-adjusted in-hospital mortality rate for 2003-2005 for each of three types of PCI patients in the 50 hospitals performing PCI during the time period. The three types of patients are: all patients, non-emergency patients, and emergency patients (patients in shock, a state of hemodynamic instability (very low blood pressure), or patients who experienced a heart attack within 24 hours prior to undergoing PCI). The statistical models that are the basis for all patients, non-emergency patients, and emergency patients in 2003-2005 are presented in Appendices 3-5, respectively.
As indicated in Table 2, the three-year observed in-hospital/30-day mortality rates for all PCI patients ranged from 0.00% to 5.00%, and the risk-adjusted mortality rates ranged from 0.00% to 2.48%. Four hospitals (Albany Medical Center, NY Methodist Hospital, St. Elizabeth Medical Center and University Hospital Upstate) had risk-adjusted mortality rates that were significantly higher than the statewide rate. One hospital (Long Island Jewish Medical Center) had a risk-adjusted mortality rate that was significantly lower than the statewide rate. It should be noted that hospitals are more likely to have results that show a statistically significant difference from the statewide rate when three years of data are used than when one year of data is used because the three-year volumes are higher.
7
Table 2 also presents the 3-year risk-adjusted in-hospital/30-day mortality rates for non-emergency cases based on the model in Appendix 4. Non-emergency cases comprise 88.75% of cases for the period 2003-2005. The statewide in-hospital/30-day mortality rate for the 141,865 non-emergency cases during the 3-year period was 0.63%. Observed mortality rates for this group of patients ranged from 0.18% to 1.34% and the risk-adjusted mortality rates ranged from 0.18 to 1.96%. No hospitals had risk-adjusted mortality rates that were significantly higher than the statewide average. One hospital (Mercy Hopital) had a risk-adjusted mortality rate significantly below the statewide rate for non-emergency cases.
The last three columns in Table 2 present data on emergency cases based on the model in Appendix 5. Emergency cases represented 11.25% of cases for the period 2003-2005. The statewide in-hospital/30-day mortality rate for the 17,974 emergency PCI cases during the 3-year period was 3.27%. Observed mortality rates for this group ranged from 0.00% to 16.98% and the risk-adjusted mortality rates ranged from 0.00% to 10.13%. One hospital (University Hospital Upstate) had a risk-adjusted mortality rate that was significantly above the statewide average and two hospitals (Long Island Jewish Medical Center and United Health Services) had risk-adjusted mortality rates that were significantly below the statewide average for emergency cases.
The observed in-hospital mortality rate for all 159,839 cases included in Table 2 is 0.56. The in-hospital mortality rate was 0.29 for the 141865 non-emergency cases, and 2.73 for the 17974 emergency cases.
Note on Hospitals Not Performing PCI During Entire 2003-2005 PeriodSeveral hospitals began performing PCI during the 2003 - 2005 time period on which this report is based. These hospitals and the month of the first PCI are listed below. Hospitals marked with “#” were allowed to perform PCI only on acute myocardial infarction (heart attack) patients in 2003-2005. Mary Imogene Bassett Hospital - March 2003; #Park Ridge Hospital - May 2003; #Glens Falls Hospital - June 2003; #Good Samaritan Suffern - October 2003; New York Methodist - April 2004; #St. Catherine of Siena - October 2004; #Huntington Hospital - November 2004; Champlain Valley Physicians Hospital - January 2005; #Long Island College Hospital - September 2005.
Definitions of key terms are as follows:
The observed mortality rate (OMR) is the observed number of deaths divided by the number of patients.
The expected mortality rate (EMR) is the sum of the predicted probabilities of death for all patients divided by the total number of patients.
The risk-adjusted mortality rate (RAMR) is the best estimate, based on the statistical model, of what the provider’s mortality rate would have been if the provider had a mix of patients similar to the statewide mix. It is obtained by first dividing the observed mortality rate by the expected mortality rate, and then multiplying that quotient by the statewide mortality rate (0.88% in-hospital/30-day mortality for all PCI patients discharged in 2005).
Confidence intervals indicate which hospitals had significantly more or fewer deaths than expected given the risk factors of their patients. Hospitals with significantly higher rates than expected after adjusting for risk are those with confidence intervals entirely above the statewide rate. Hospitals with significantly lower rates than expected given the severity of illness of their patients before the PCI have confidence intervals entirely below the statewide rate.
8
Table 1 Hospital Observed, Expected and Risk-Adjusted In-Hospital/30-Day Mortality Rates (RAMR) for PCI in New York State, 2005 Discharges. (Listed Alphabetically by Hospital) All Cases Non-Emergency
Hospital Cases Deaths OMR EMR RAMR 95% CI for RAMR Cases RAMR
Albany Medical Center 1202 11 0.92 0.75 1.07 (0.53, 1.92) 1038 0.96Arnot Ogden Med Ctr 353 1 0.28 0.64 0.39 (0.01, 2.16) 288 0.51Bellevue Hospital Ctr 508 2 0.39 0.76 0.46 (0.05, 1.64) 459 0.24Beth Israel Med Ctr 1364 16 1.17 0.73 1.42 (0.81, 2.31) 1305 1.01Buffalo General Hosp 1561 15 0.96 0.84 1.01 (0.56, 1.66) 1485 0.50Champ.Valley Phys Hosp 201 2 1.00 0.82 1.06 (0.12, 3.84) 152 1.87City Hosp at Elmhurst 66 1 1.52 3.00 0.44 (0.01, 2.47) . .Crouse Hospital 792 8 1.01 0.70 1.27 (0.55, 2.50) 723 0.92Ellis Hospital 812 5 0.62 0.89 0.61 (0.20, 1.42) 640 0.50Erie County Med Ctr 384 9 2.34 1.38 1.50 (0.68, 2.84) 295 0.89Glens Falls Hospital 59 1 1.69 2.63 0.57 (0.01, 3.15) . .Good Sam - Suffern 98 2 2.04 3.17 0.57 (0.06, 2.04) . .Good Sam - West Islip 87 2 2.30 2.02 1.00 (0.11, 3.61) . .Huntington Hospital 29 2 6.90 1.50 4.04 (0.45,14.58) . .LIJ Medical Center 1750 10 0.57 0.91 0.55 (0.26, 1.01) 1544 0.44Lenox Hill Hospital 2439 23 0.94 0.78 1.06 (0.67, 1.59) 2288 0.70Long Island Coll. Hosp 14 0 0.00 2.42 0.00 (0.00, 9.53) . .M. I. Bassett Hospital 199 4 2.01 1.27 1.39 (0.37, 3.56) 152 1.36Maimonides Medical Ctr 1559 24 1.54 0.98 1.39 * (0.89, 2.06) 1393 0.82Mercy Hospital 722 4 0.55 1.14 0.43 (0.12, 1.10) 558 0.13Millard Fillmore Hosp 974 6 0.62 0.87 0.62 (0.23, 1.36) 874 0.31Montefiore - Einstein 937 12 1.28 0.69 1.63 (0.84, 2.85) 865 1.22Montefiore - Moses 798 9 1.13 0.74 1.33 (0.61, 2.53) 713 0.30Mount Sinai Hospital 3845 27 0.70 0.82 0.75 (0.49, 1.09) 3632 0.53NY Hospital - Queens 1278 15 1.17 0.85 1.21 (0.68, 2.00) 1172 0.92NY Methodist Hospital 990 11 1.11 0.70 1.40 (0.70, 2.51) 958 1.01NYP- Columbia Presby. 2824 19 0.67 0.77 0.76 (0.46, 1.19) 2706 0.54NYP- Weill Cornell 1780 14 0.79 1.30 0.53 (0.29, 0.89) 1589 0.35NYU Hospitals Center 897 6 0.67 0.73 0.81 (0.29, 1.76) 844 0.55North Shore Univ Hosp 3814 27 0.71 0.76 0.82 (0.54, 1.19) 3454 0.67Rochester General Hosp 2515 23 0.91 0.75 1.07 (0.68, 1.60) 2228 0.74SVCMC- St. Vincents 1720 17 0.99 0.72 1.21 (0.70, 1.93) 1590 0.90South Nassau Comm.Hosp 47 1 2.13 2.15 0.87 (0.01, 4.84) . .Southside Hospital 63 0 0.00 1.27 0.00 (0.00, 4.04) . .St. Catherine of Siena 37 0 0.00 1.82 0.00 (0.00, 4.80) . .St. Elizabeth Med Ctr 1344 19 1.41 1.14 1.09 (0.65, 1.70) 1167 0.94St. Francis Hospital 3605 28 0.78 0.82 0.84 (0.55, 1.21) 3387 0.57St. Josephs Hospital 1996 18 0.90 1.03 0.77 (0.46, 1.22) 1731 0.45St. Lukes at St. Lukes 760 6 0.79 1.04 0.67 (0.24, 1.46) 689 0.12St. Peters Hospital 1107 5 0.45 0.79 0.50 (0.16, 1.18) 863 0.28Staten Island Univ Hosp 1268 9 0.71 0.56 1.12 (0.51, 2.12) 1133 0.92Strong Memorial Hosp 1412 19 1.35 0.93 1.27 (0.76, 1.98) 1129 0.95United Health Services 843 8 0.95 1.32 0.63 (0.27, 1.25) 684 0.73Unity Hospital 41 0 0.00 1.41 0.00 (0.00, 5.56) . .Univ.Hosp-Brooklyn 1304 11 0.84 0.80 0.93 (0.46, 1.66) 1250 0.72Univ.Hosp-SUNY Upstate 241 5 2.07 1.48 1.24 (0.40, 2.89) 168 0.45Univ.Hosp-Stony Brook 1661 14 0.84 1.00 0.74 (0.40, 1.24) 1359 0.25Vassar Bros. Med Ctr 762 4 0.52 0.94 0.49 (0.13, 1.25) 604 0.00Westchester Med Ctr 1612 11 0.68 1.07 0.56 (0.28, 1.00) 1336 0.08 **Winthrop Univ. Hosp 1384 7 0.51 0.80 0.55 (0.22, 1.14) 1247 0.33
Statewide Total 56058 493 0.88 49692 0.60
* Risk-adjusted mortality rate significantly higher than statewide rate based on 95 percent confidence interval. ** Risk-adjusted mortality rate significantly lower than statewide rate based on 95 percent confidence interval.
9
Figure 1 In-Hospital/30-Day Risk-Adjusted Mortality Rates for PCI in New York State, 2005 Discharges (All Cases)
0 2 4 6 160.88
New York State Average
14.58
9.53
Key
Risk-adjusted mortality rate
Potential margin of statistical error
*Risk-adjusted mortality rate significantly higher than statewide rate based on 95 percent conficence interval.
Albany Medical CenterArnot Ogden Med CtrBellevue Hospital Ctr
Beth Israel Med CtrBuffalo General Hosp
Champ.Valley Phys HospCity Hosp at Elmhurst
Crouse HospitalEllis Hospital
Erie County Med CtrGlens Falls HospitalGood Sam - Suffern
Good Sam - West IslipHuntington Hospital
LIJ Medical CenterLenox Hill Hospital
Long Island Coll. HospM. I. Bassett Hospital
Maimonides Medical Ctr*Mercy Hospital
Millard Fillmore HospMontefiore - Einstein
Montefiore - MosesMount Sinai HospitalNY Hospital - Queens
NY Methodist HospitalNYP- Columbia Presby.
NYP- Weill CornellNYU Medical Center
North Shore Univ HospRochester General Hosp
SVCMC- St. VincentsSouth Nassau Comm.Hosp
Southside HospitalSt. Catherine of SienaSt. Elizabeth Med CtrSt. Francis Hospital
St. Josephs HospitalSt. Lukes at St. Lukes
St. Peters HospitalStaten Island UnivHosp
Strong Memorial HospUnited Health Services
Unity HospitalUniv.Hosp-Brooklyn
Univ.Hosp-SUNY UpstateUniv.Hosp-Stony Brook
Vassar Bros. Med CtrWestchester Med CtrWinthrop Univ. Hosp
10
Figure 2 In-Hospital/30-Day Risk-Adjusted Mortality Rates for PCI in New York State, 2005 Discharges (Non-Emergency Cases)
0 1 2 3 4 7
Albany Medical CenterArnot Ogden Med CtrBellevue Hospital Ctr
Beth Israel Med CtrBuffalo General Hosp
Champ.Valley Phys HospCrouse Hospital
Ellis HospitalErie County Med CtrLIJ Medical CenterLenox Hill Hospital
M. I. Bassett HospitalMaimonides Medical Ctr
Mercy HospitalMillard Fillmore HospMontefiore - Einstein
Montefiore - MosesMount Sinai HospitalNY Hospital - Queens
NY Methodist HospitalNYP- Columbia Presby.
NYP- Weill CornellNYU Medical Center
North Shore Univ HospRochester General Hosp
SVCMC- St. VincentsSt. Elizabeth Med CtrSt. Francis Hospital
St. Josephs HospitalSt. Lukes at St. Lukes
St. Peters HospitalStaten Island UnivHosp
Strong Memorial HospUnited Health Services
Univ.Hosp-BrooklynUniv.Hosp-SUNY Upstate
Univ.Hosp-Stony BrookVassar Bros. Med Ctr
Westchester Med Ctr**Winthrop Univ. Hosp
0.60New York State Average Key
Risk-adjusted mortality rate
Potential margin of statistical error
*Risk-adjusted mortality rate significantly lower than statewide rate based on 95 percent conficence interval.
4.89
6.75
11
Table 2 Hospital Observed and Risk-Adjusted In-hospital / 30-Day Mortality Rates (RAMR) for PCI in New York State, 2003 - 2005 Discharges
All Cases Non-Emergency Cases Emergency CasesHospital Cases OMR RAMR Cases OMR RAMR Cases OMR RAMR
Albany Medical Center 3667 1.25 1.35 * 3085 0.78 0.97 582 3.78 4.73Arnot Ogden Med Ctr 946 0.63 0.69 720 0.56 0.66 226 0.88 1.58Bellevue Hospital Ctr 1214 0.82 0.78 1089 0.18 0.18 125 6.40 5.44Beth Israel Med Ctr 4088 1.03 1.08 3876 0.72 0.70 212 6.60 4.81Buffalo General Hosp 4909 0.84 1.14 4704 0.62 0.73 205 5.85 4.87Champ.Valley Phys Hosp 201 1.00 1.14 152 1.32 1.96 49 0.00 0.00City Hosp at Elmhurst 189 3.70 1.24 . . . 189 3.70 4.51Crouse Hospital 2416 0.66 0.75 2191 0.41 0.48 225 3.11 2.55Ellis Hospital 2510 0.92 0.85 1999 0.75 0.72 511 1.57 2.15Erie County Med Ctr 1111 1.44 1.43 941 0.64 0.81 170 5.88 6.27Glens Falls Hospital 133 2.26 0.84 . . . 133 2.26 3.05Good Sam - Suffern 202 3.47 0.68 . . . 202 3.47 2.58Good Sam - West Islip 248 4.03 1.79 . . . 248 4.03 6.41Huntington Hospital 40 5.00 2.48 . . . 40 5.00 10.13LIJ Medical Center 5238 0.76 0.64** 4576 0.66 0.57 662 1.51 1.51**Lenox Hill Hospital 8860 0.84 0.93 8487 0.70 0.65 373 4.02 2.78Long Island Coll. Hosp 14 0.00 0.00 . . . 14 0.00 0.00M. I. Bassett Hospital 521 1.73 1.48 406 0.74 0.85 115 5.22 5.61Maimonides Medical Ctr 4482 1.03 0.86 4119 0.87 0.59 363 2.75 3.25Mercy Hospital 1628 0.68 0.55 1279 0.23 0.19** 349 2.29 2.94Millard Fillmore Hosp 2876 0.80 0.87 2639 0.61 0.61 237 2.95 2.51Montefiore - Einstein 2540 1.06 1.34 2322 0.78 0.85 218 4.13 6.15Montefiore - Moses 2307 0.95 0.98 2090 0.53 0.56 217 5.07 4.01Mount Sinai Hospital 9722 0.80 0.76 9226 0.60 0.53 496 4.64 2.44NY Hospital - Queens 3729 1.21 1.15 3391 0.86 0.84 338 4.73 3.48NY Methodist Hospital 1644 1.40 1.47* 1591 0.88 0.80 53 16.98 6.78NYP- Columbia Presby. 4707 0.93 0.96 4397 0.71 0.66 310 4.19 3.41NYP- Weill Cornell 5327 1.03 0.81 4832 0.56 0.53 495 5.66 2.74NYU Hospitals Center 2403 0.58 0.72 2245 0.45 0.48 158 2.53 2.58North Shore Univ Hosp 10878 0.72 0.81 9692 0.53 0.59 1186 2.28 2.38Rochester General Hosp 7619 0.91 1.01 6642 0.59 0.63 977 3.07 4.05SVCMC- St. Vincents 4637 0.99 1.00 4164 0.72 0.78 473 3.38 3.04South Nassau Comm.Hosp 167 1.80 0.93 . . . 167 1.80 3.62Southside Hospital 173 0.58 0.33 . . . 173 0.58 1.25St. Catherine of Siena 48 0.00 0.00 . . . 48 0.00 0.00St. Elizabeth Med Ctr 4340 1.36 1.22* 3887 0.87 0.83 453 5.52 4.67St. Francis Hospital 11127 0.78 0.90 10538 0.64 0.64 589 3.40 2.79St. Josephs Hospital 6282 0.97 0.96 5439 0.64 0.63 843 3.08 3.56St. Lukes at St. Lukes 2509 1.00 1.15 2275 0.57 0.64 234 5.13 5.41St. Peters Hospital 3348 0.75 0.81 2700 0.48 0.52 648 1.85 2.83Staten Island Univ Hosp 3728 0.62 0.89 3390 0.44 0.64 338 2.37 2.85Strong Memorial Hosp 4078 1.18 1.10 3250 0.74 0.75 828 2.90 3.61United Health Services 2773 1.12 0.74 2261 0.75 0.73 512 2.73 1.94**Unity Hospital 139 0.72 0.30 . . . 139 0.72 0.98Univ.Hosp-Brooklyn 3518 0.68 0.90 3366 0.53 0.60 152 3.95 4.22Univ.Hosp-SUNY Upstate 694 2.88 1.72* 522 1.34 1.11 172 7.56 6.54*Univ.Hosp-Stony Brook 4447 1.08 1.00 3719 0.65 0.58 728 3.30 3.91Vassar Bros. Med Ctr 2503 0.72 0.66 1895 0.26 0.27 608 2.14 3.18Westchester Med Ctr 4731 0.82 0.75 3914 0.38 0.40 817 2.94 3.27Winthrop Univ. Hosp 4228 0.69 0.73 3854 0.57 0.58 374 1.87 1.84
Statewide Total 159839 0.92 141865 0.63 17974 3.27
* Risk-adjusted mortality rate significantly higher than statewide rate based on 95 percent confidence interval.
** Risk-adjusted mortality rate significantly lower than statewide rate based on 95 percent confidence interval.
2003-2005 HOSPITAL AND CARDIOLOgIST DATA FOR PCI
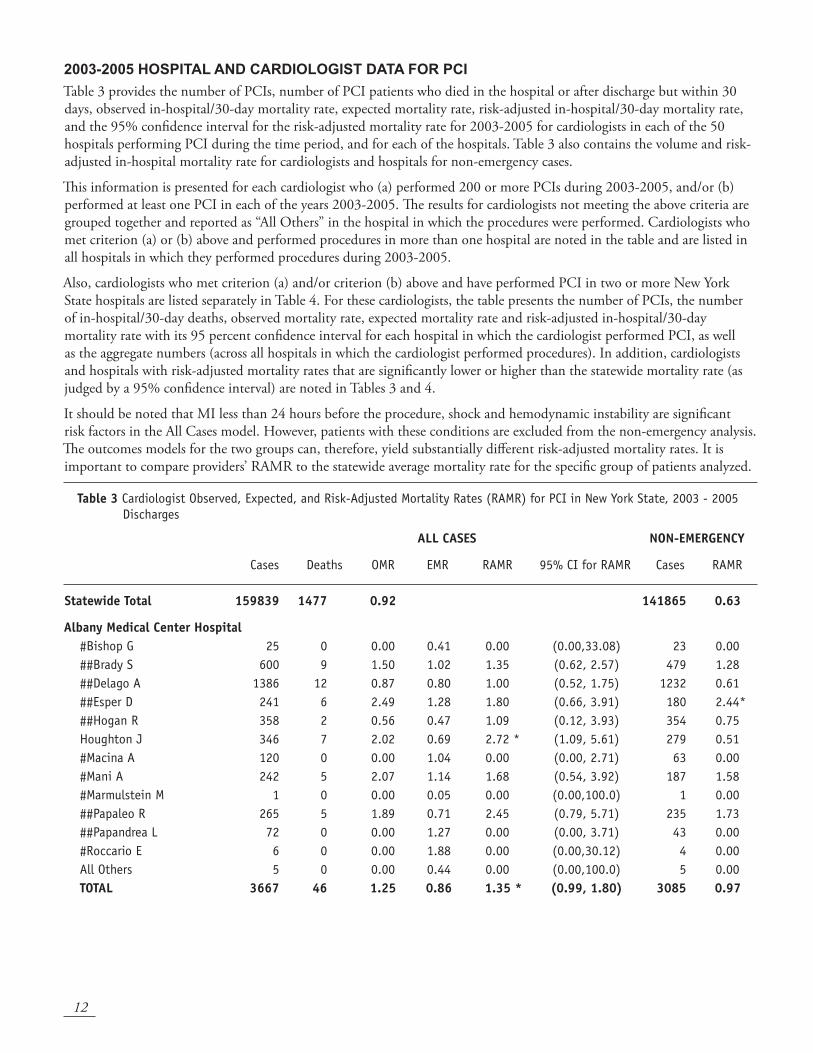
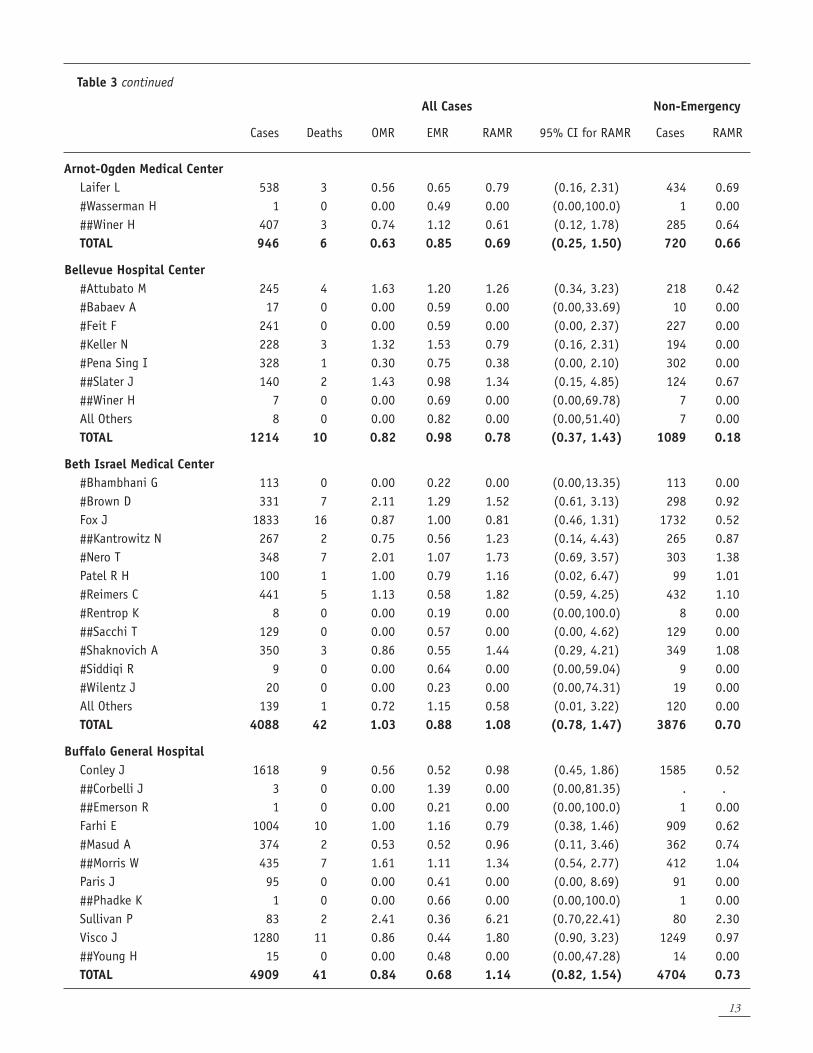
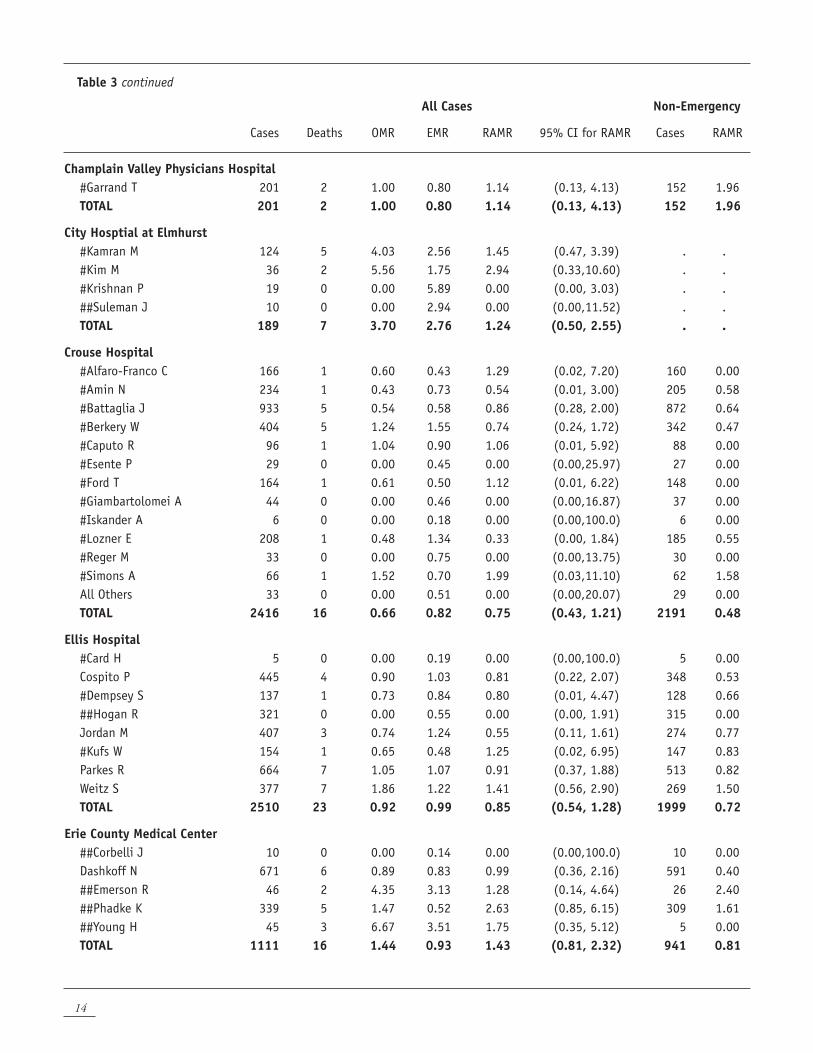
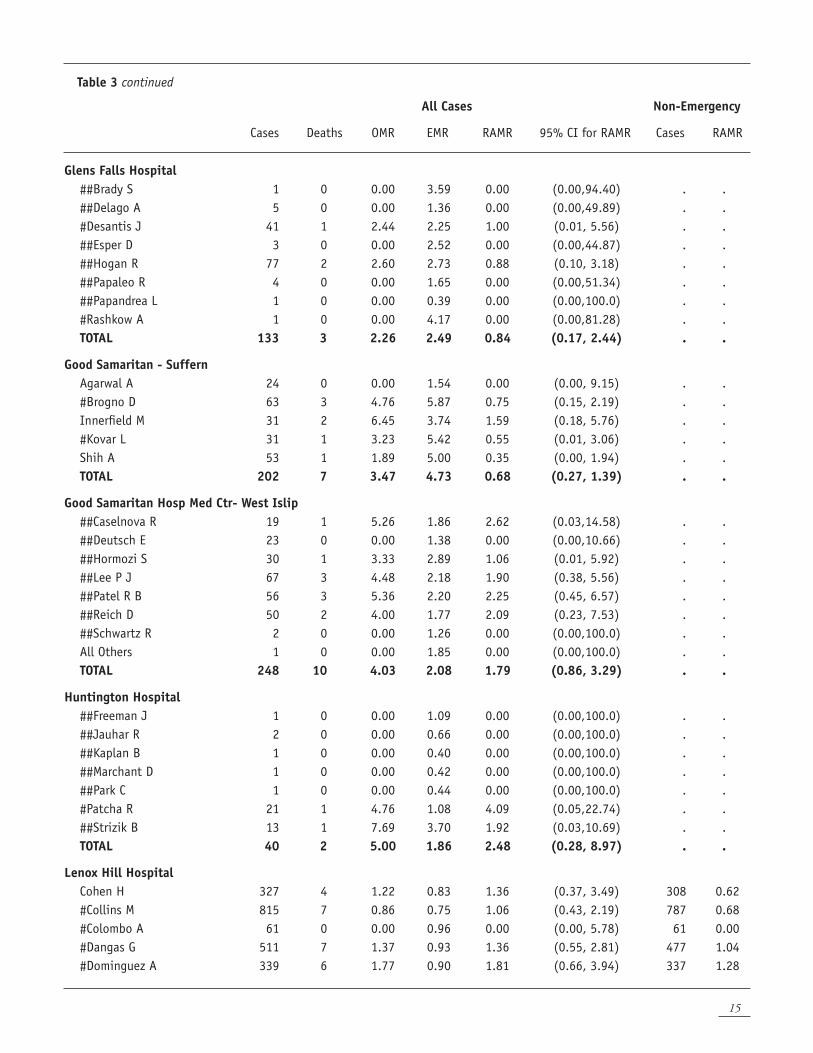
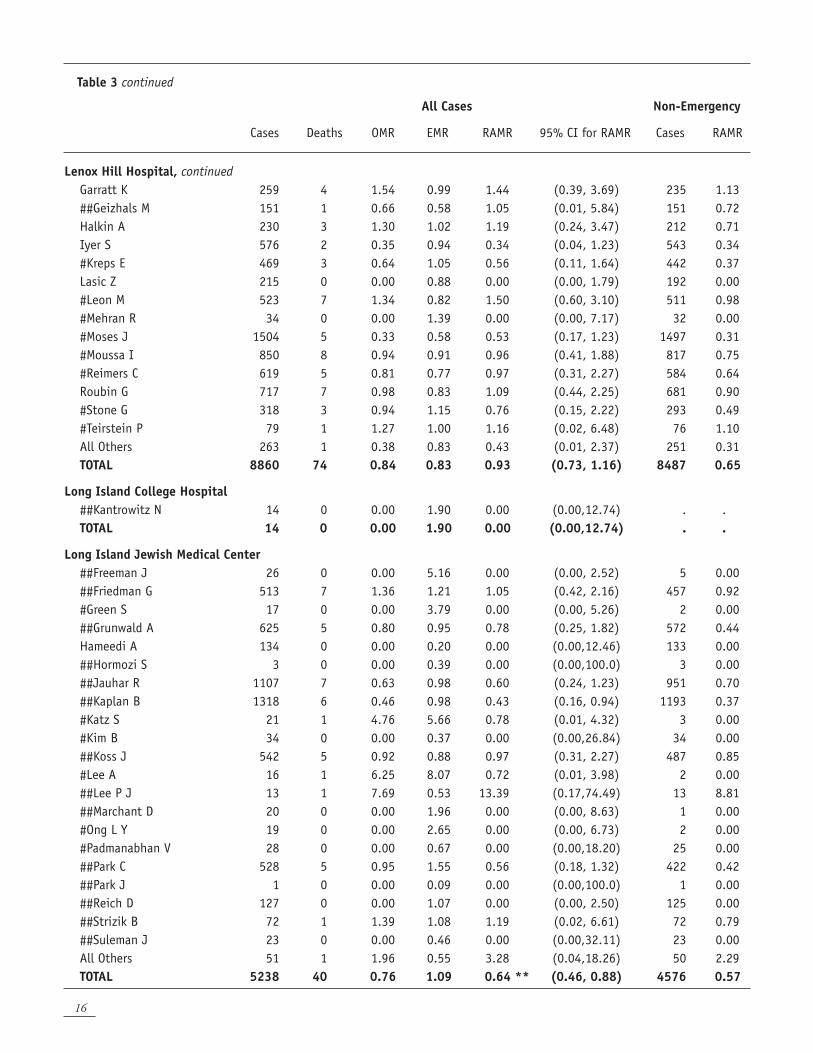
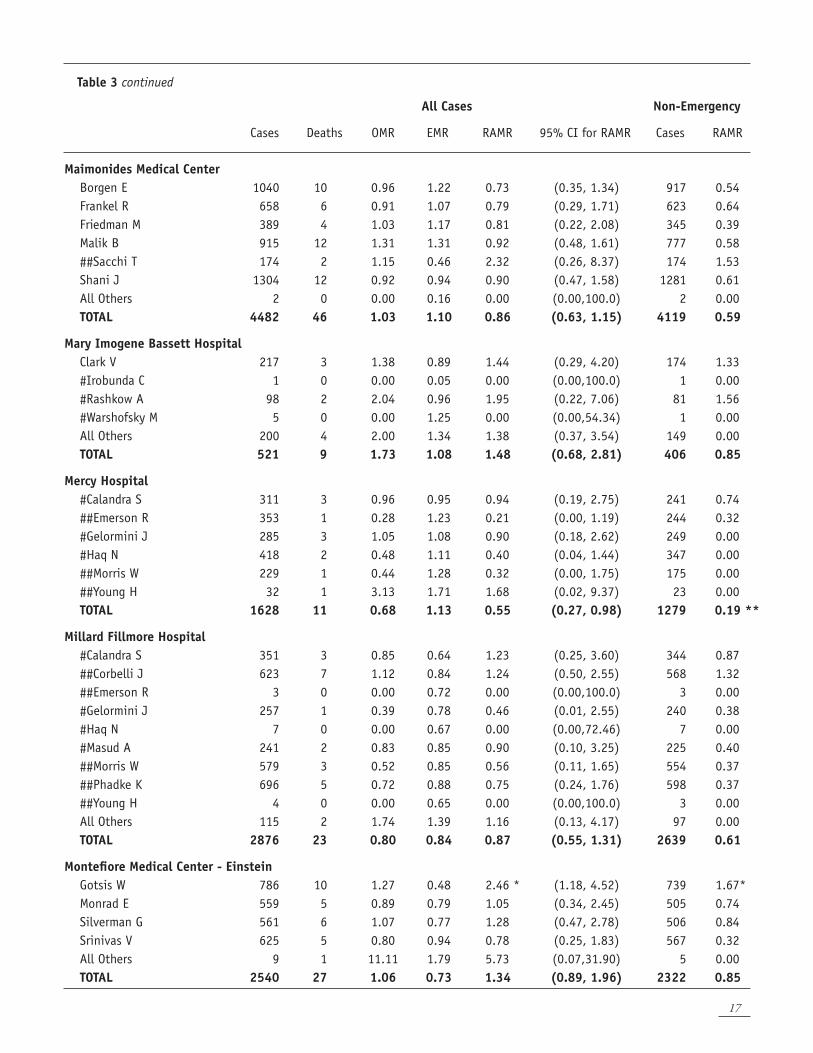
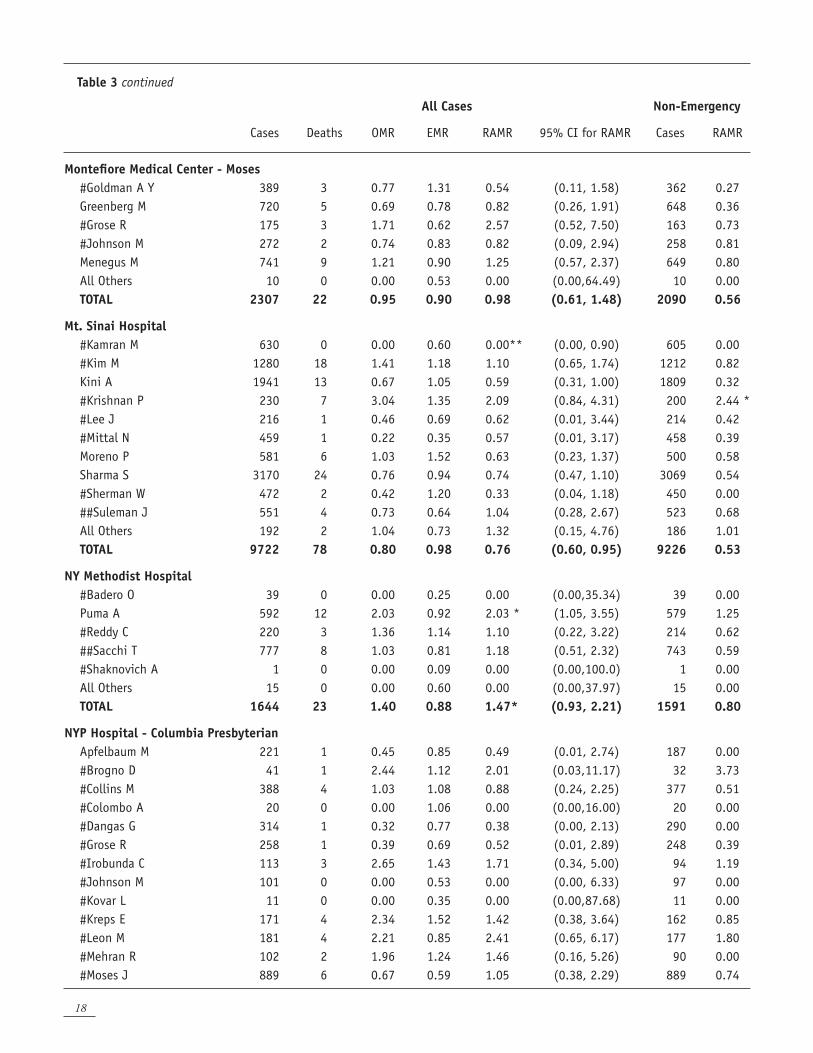
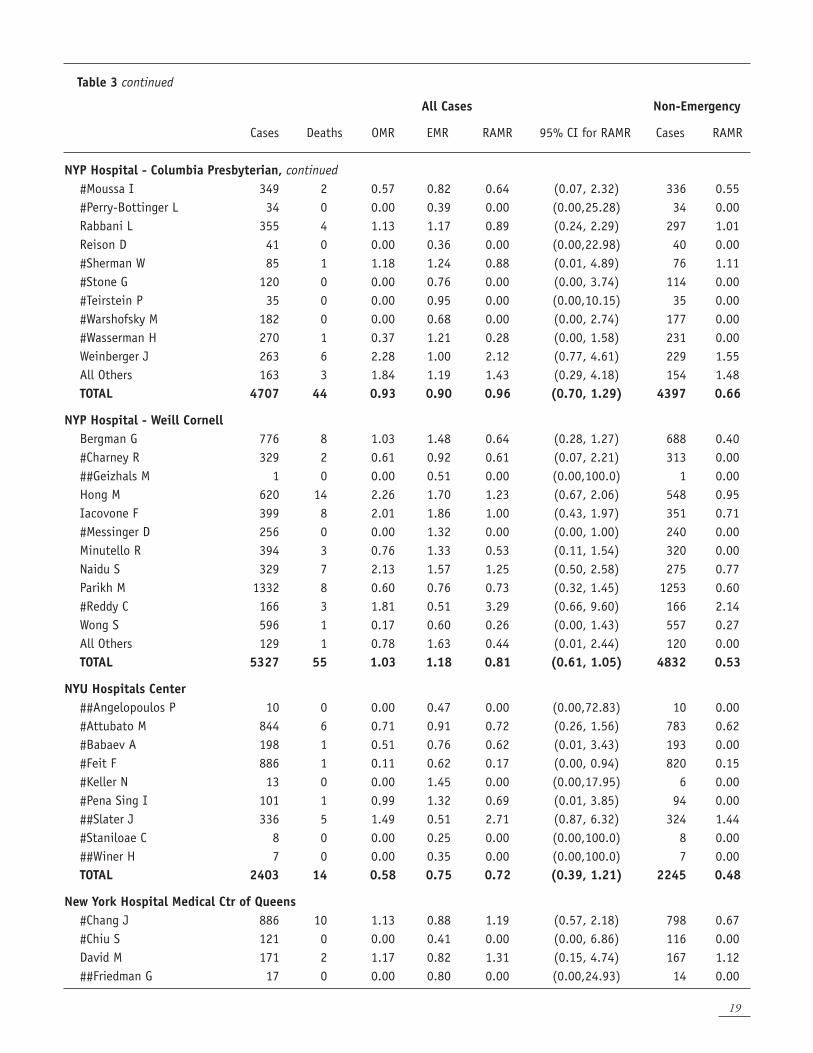
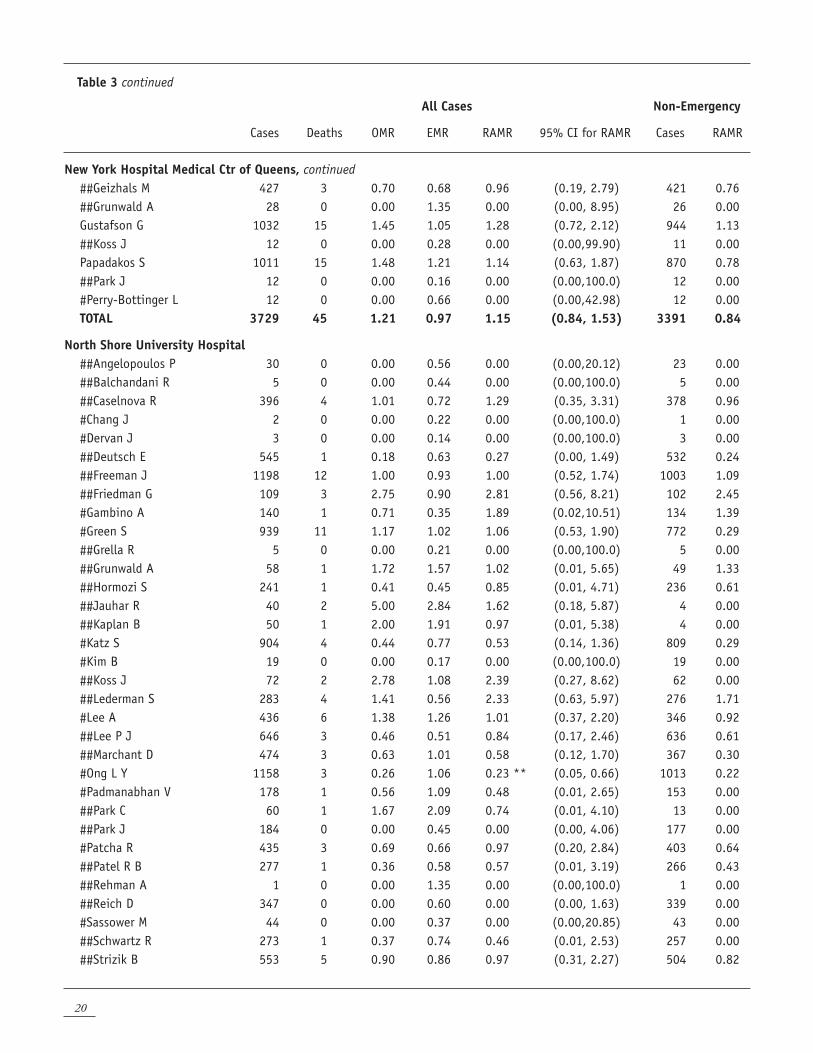
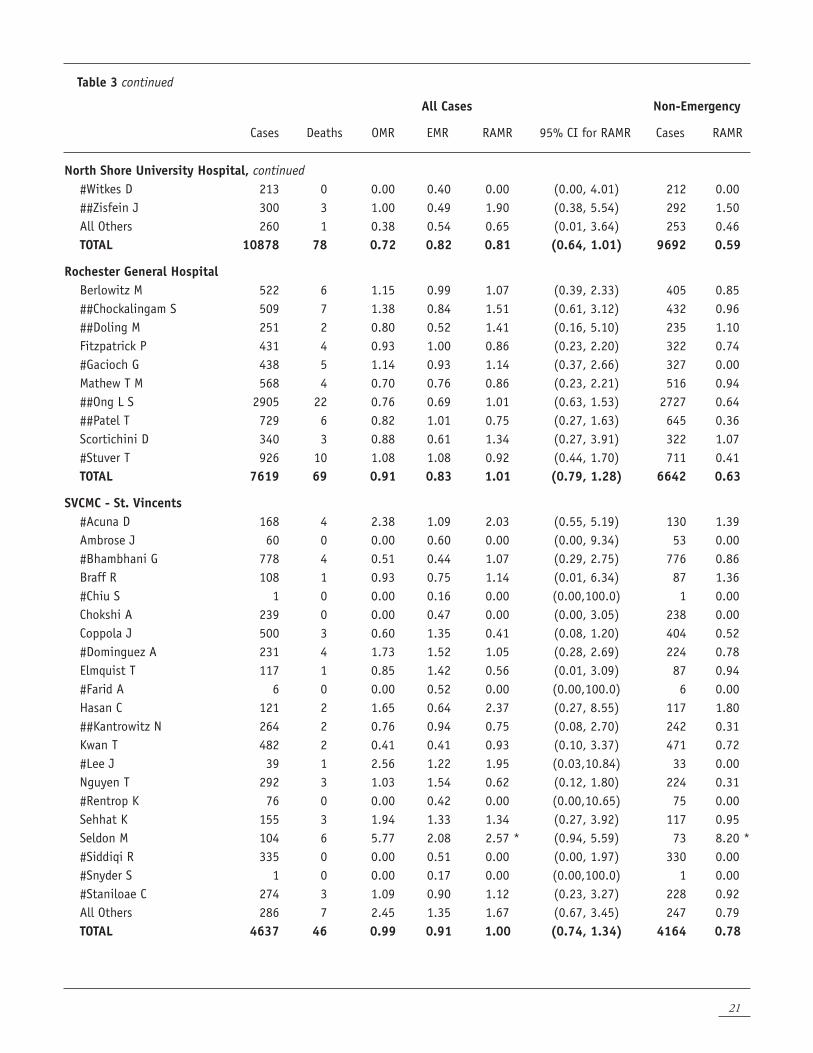
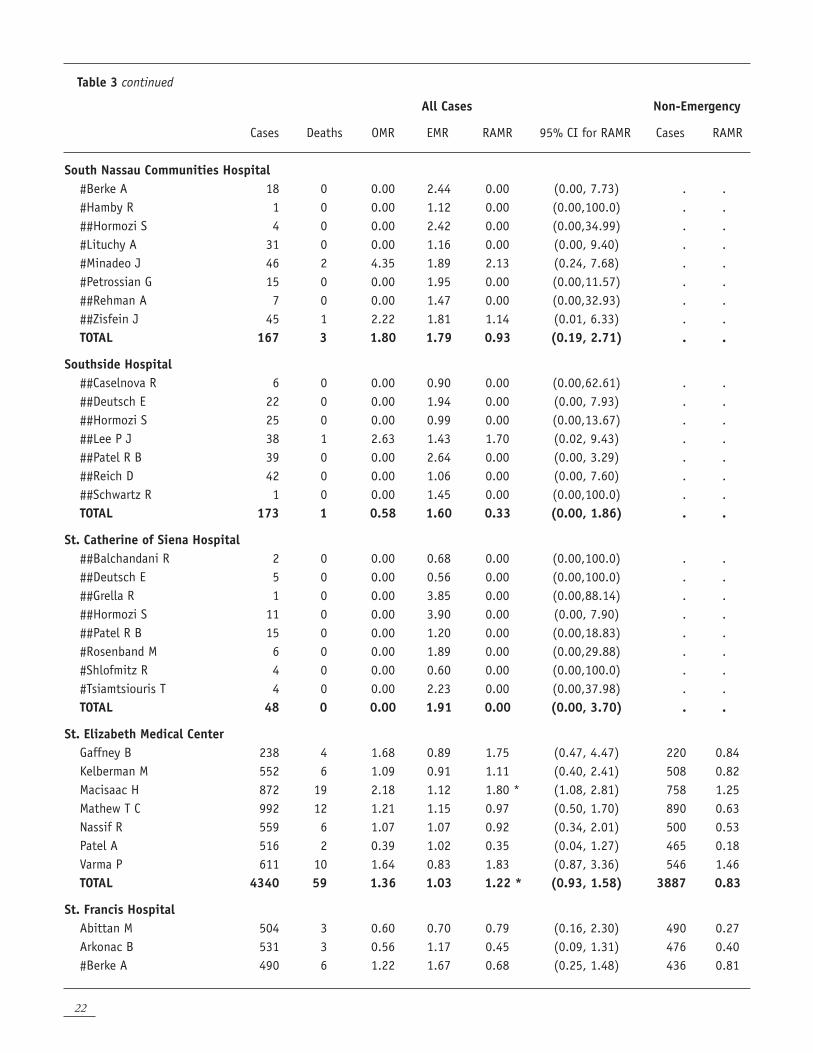
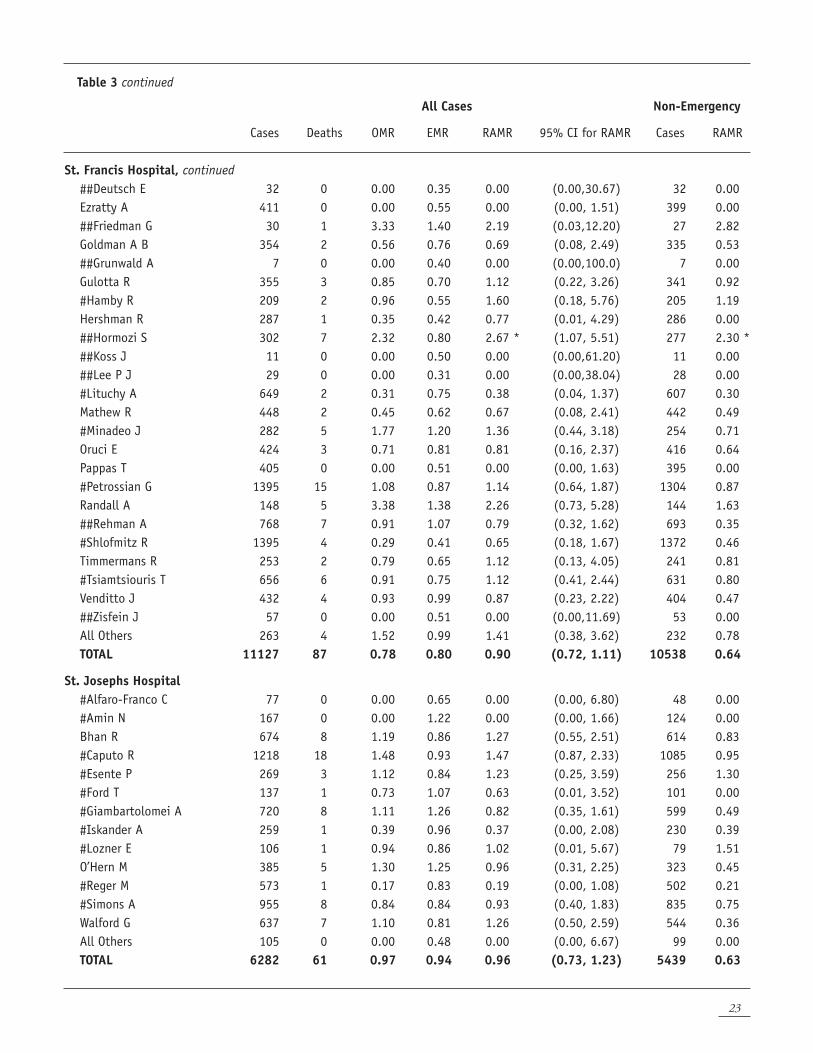
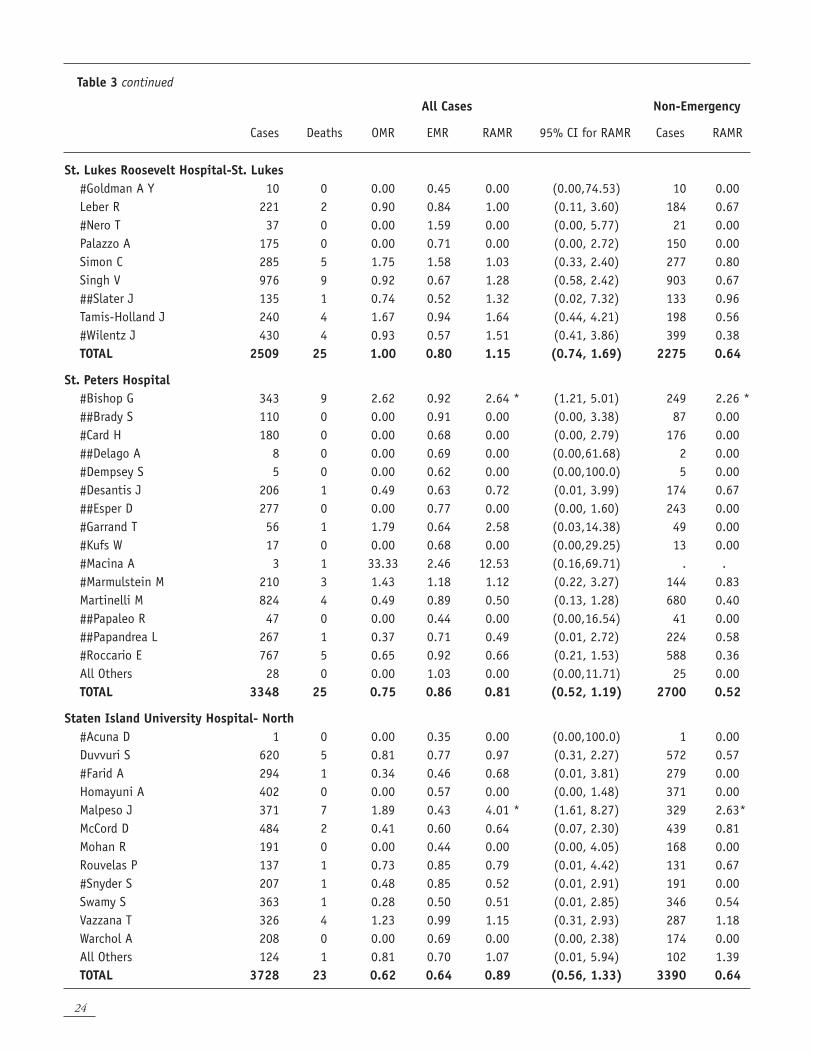
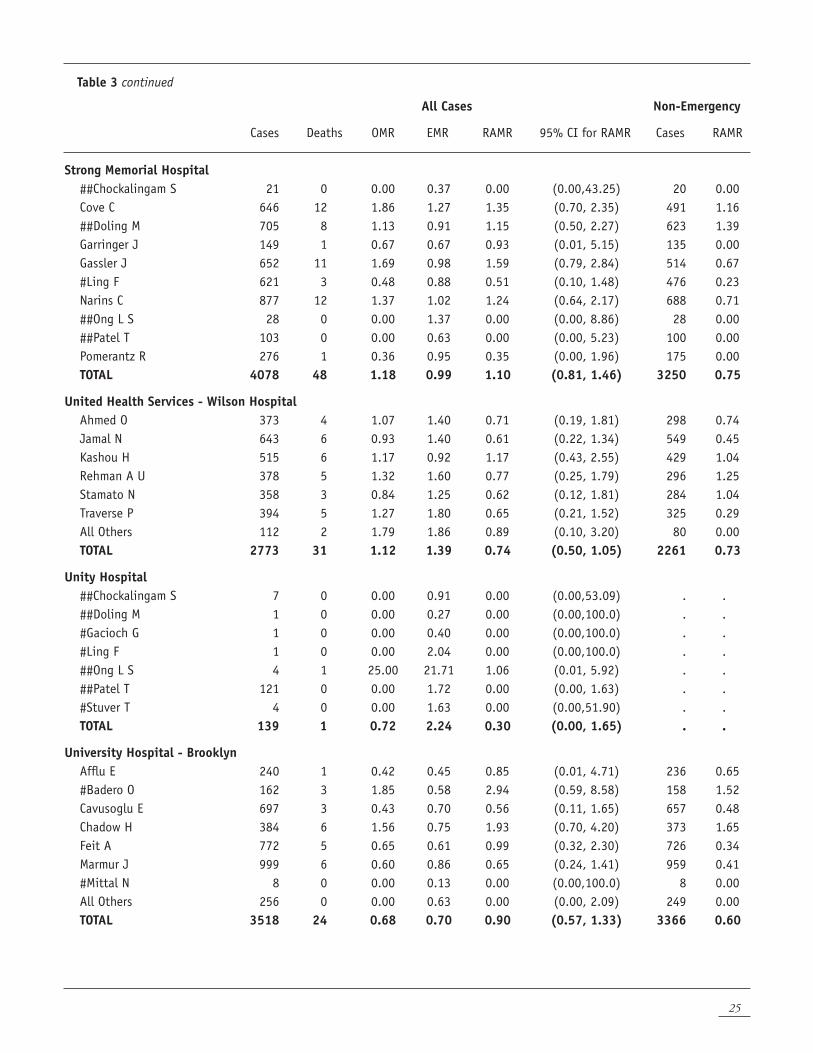
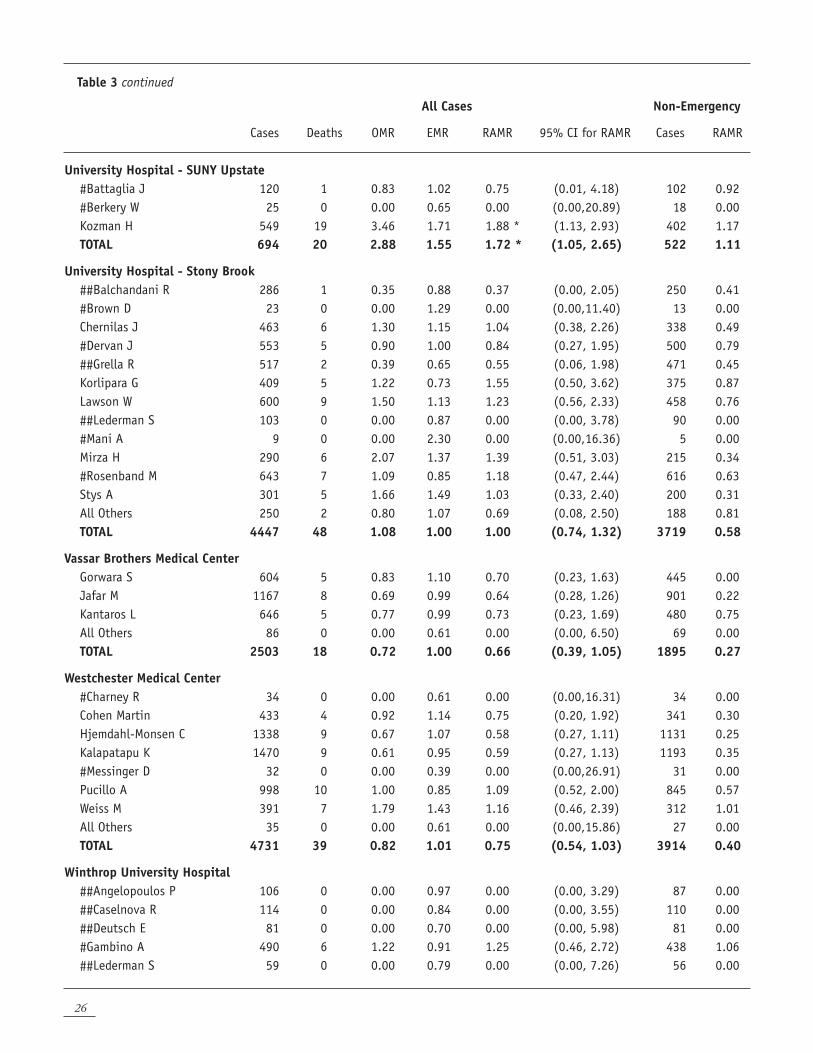
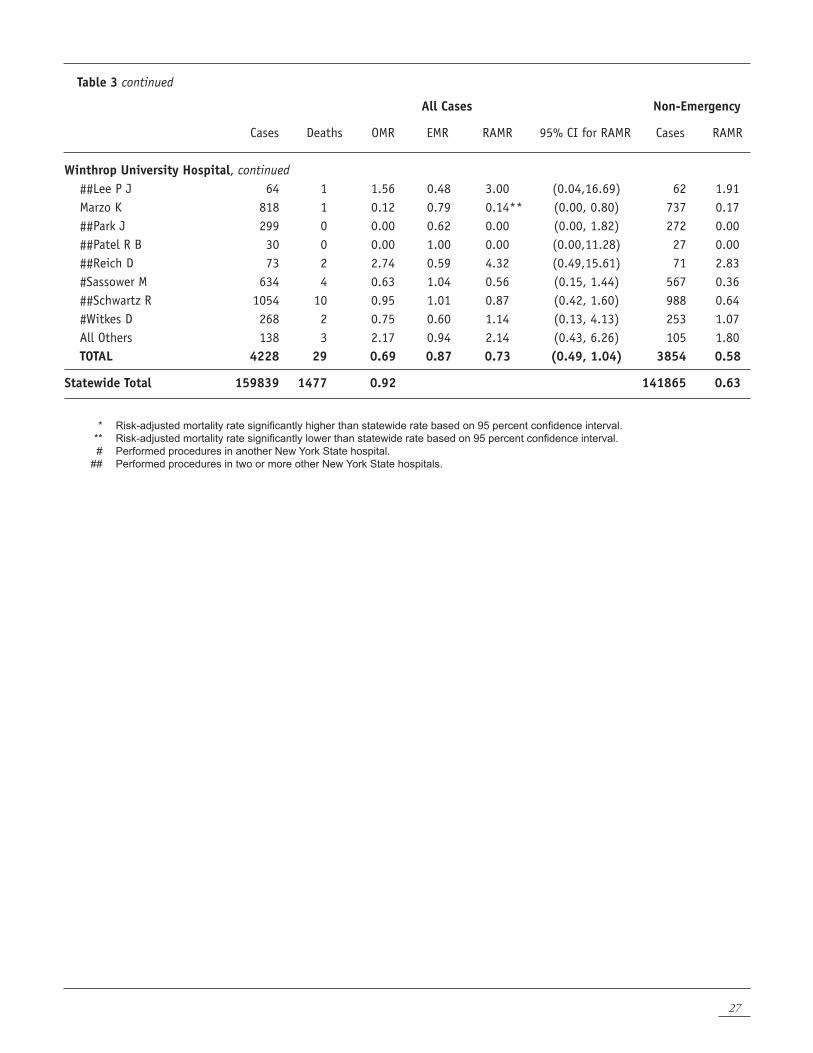
Table 3 provides the number of PCIs, number of PCI patients who died in the hospital or after discharge but within 30 days, observed in-hospital/30-day mortality rate, expected mortality rate, risk-adjusted in-hospital/30-day mortality rate, and the 95% confidence interval for the risk-adjusted mortality rate for 2003-2005 for cardiologists in each of the 50 hospitals performing PCI during the time period, and for each of the hospitals. Table 3 also contains the volume and risk-adjusted in-hospital mortality rate for cardiologists and hospitals for non-emergency cases.
This information is presented for each cardiologist who (a) performed 200 or more PCIs during 2003-2005, and/or (b) performed at least one PCI in each of the years 2003-2005. The results for cardiologists not meeting the above criteria are grouped together and reported as “All Others” in the hospital in which the procedures were performed. Cardiologists who met criterion (a) or (b) above and performed procedures in more than one hospital are noted in the table and are listed in all hospitals in which they performed procedures during 2003-2005.
Also, cardiologists who met criterion (a) and/or criterion (b) above and have performed PCI in two or more New York State hospitals are listed separately in Table 4. For these cardiologists, the table presents the number of PCIs, the number of in-hospital/30-day deaths, observed mortality rate, expected mortality rate and risk-adjusted in-hospital/30-day mortality rate with its 95 percent confidence interval for each hospital in which the cardiologist performed PCI, as well as the aggregate numbers (across all hospitals in which the cardiologist performed procedures). In addition, cardiologists and hospitals with risk-adjusted mortality rates that are significantly lower or higher than the statewide mortality rate (as judged by a 95% confidence interval) are noted in Tables 3 and 4.
It should be noted that MI less than 24 hours before the procedure, shock and hemodynamic instability are significant risk factors in the All Cases model. However, patients with these conditions are excluded from the non-emergency analysis. The outcomes models for the two groups can, therefore, yield substantially different risk-adjusted mortality rates. It is important to compare providers’ RAMR to the statewide average mortality rate for the specific group of patients analyzed.
Table 3 Cardiologist Observed, Expected, and Risk-Adjusted Mortality Rates (RAMR) for PCI in New York State, 2003 - 2005 Discharges
ALL CASES NON-EMERGENCY
Cases Deaths OMR EMR RAMR 95% CI for RAMR Cases RAMR
Statewide Total 159839 1477 0.92 141865 0.63
Albany Medical Center Hospital #Bishop G 25 0 0.00 0.41 0.00 (0.00,33.08) 23 0.00 ##Brady S 600 9 1.50 1.02 1.35 (0.62, 2.57) 479 1.28 ##Delago A 1386 12 0.87 0.80 1.00 (0.52, 1.75) 1232 0.61 ##Esper D 241 6 2.49 1.28 1.80 (0.66, 3.91) 180 2.44* ##Hogan R 358 2 0.56 0.47 1.09 (0.12, 3.93) 354 0.75 Houghton J 346 7 2.02 0.69 2.72 * (1.09, 5.61) 279 0.51 #Macina A 120 0 0.00 1.04 0.00 (0.00, 2.71) 63 0.00 #Mani A 242 5 2.07 1.14 1.68 (0.54, 3.92) 187 1.58 #Marmulstein M 1 0 0.00 0.05 0.00 (0.00,100.0) 1 0.00 ##Papaleo R 265 5 1.89 0.71 2.45 (0.79, 5.71) 235 1.73 ##Papandrea L 72 0 0.00 1.27 0.00 (0.00, 3.71) 43 0.00 #Roccario E 6 0 0.00 1.88 0.00 (0.00,30.12) 4 0.00 All Others 5 0 0.00 0.44 0.00 (0.00,100.0) 5 0.00 TOTAL 3667 46 1.25 0.86 1.35 * (0.99, 1.80) 3085 0.97
12
13
Table 3 continued
All Cases Non-Emergency
Cases Deaths OMR EMR RAMR 95% CI for RAMR Cases RAMR
Arnot-Ogden Medical Center Laifer L 538 3 0.56 0.65 0.79 (0.16, 2.31) 434 0.69 #Wasserman H 1 0 0.00 0.49 0.00 (0.00,100.0) 1 0.00 ##Winer H 407 3 0.74 1.12 0.61 (0.12, 1.78) 285 0.64 TOTAL 946 6 0.63 0.85 0.69 (0.25, 1.50) 720 0.66
Bellevue Hospital Center #Attubato M 245 4 1.63 1.20 1.26 (0.34, 3.23) 218 0.42 #Babaev A 17 0 0.00 0.59 0.00 (0.00,33.69) 10 0.00 #Feit F 241 0 0.00 0.59 0.00 (0.00, 2.37) 227 0.00 #Keller N 228 3 1.32 1.53 0.79 (0.16, 2.31) 194 0.00 #Pena Sing I 328 1 0.30 0.75 0.38 (0.00, 2.10) 302 0.00 ##Slater J 140 2 1.43 0.98 1.34 (0.15, 4.85) 124 0.67 ##Winer H 7 0 0.00 0.69 0.00 (0.00,69.78) 7 0.00 All Others 8 0 0.00 0.82 0.00 (0.00,51.40) 7 0.00 TOTAL 1214 10 0.82 0.98 0.78 (0.37, 1.43) 1089 0.18
Beth Israel Medical Center #Bhambhani G 113 0 0.00 0.22 0.00 (0.00,13.35) 113 0.00 #Brown D 331 7 2.11 1.29 1.52 (0.61, 3.13) 298 0.92 Fox J 1833 16 0.87 1.00 0.81 (0.46, 1.31) 1732 0.52 ##Kantrowitz N 267 2 0.75 0.56 1.23 (0.14, 4.43) 265 0.87 #Nero T 348 7 2.01 1.07 1.73 (0.69, 3.57) 303 1.38 Patel R H 100 1 1.00 0.79 1.16 (0.02, 6.47) 99 1.01 #Reimers C 441 5 1.13 0.58 1.82 (0.59, 4.25) 432 1.10 #Rentrop K 8 0 0.00 0.19 0.00 (0.00,100.0) 8 0.00 ##Sacchi T 129 0 0.00 0.57 0.00 (0.00, 4.62) 129 0.00 #Shaknovich A 350 3 0.86 0.55 1.44 (0.29, 4.21) 349 1.08 #Siddiqi R 9 0 0.00 0.64 0.00 (0.00,59.04) 9 0.00 #Wilentz J 20 0 0.00 0.23 0.00 (0.00,74.31) 19 0.00 All Others 139 1 0.72 1.15 0.58 (0.01, 3.22) 120 0.00 TOTAL 4088 42 1.03 0.88 1.08 (0.78, 1.47) 3876 0.70
Buffalo General Hospital Conley J 1618 9 0.56 0.52 0.98 (0.45, 1.86) 1585 0.52 ##Corbelli J 3 0 0.00 1.39 0.00 (0.00,81.35) . . ##Emerson R 1 0 0.00 0.21 0.00 (0.00,100.0) 1 0.00 Farhi E 1004 10 1.00 1.16 0.79 (0.38, 1.46) 909 0.62 #Masud A 374 2 0.53 0.52 0.96 (0.11, 3.46) 362 0.74 ##Morris W 435 7 1.61 1.11 1.34 (0.54, 2.77) 412 1.04 Paris J 95 0 0.00 0.41 0.00 (0.00, 8.69) 91 0.00 ##Phadke K 1 0 0.00 0.66 0.00 (0.00,100.0) 1 0.00 Sullivan P 83 2 2.41 0.36 6.21 (0.70,22.41) 80 2.30 Visco J 1280 11 0.86 0.44 1.80 (0.90, 3.23) 1249 0.97 ##Young H 15 0 0.00 0.48 0.00 (0.00,47.28) 14 0.00 TOTAL 4909 41 0.84 0.68 1.14 (0.82, 1.54) 4704 0.73
14
Table 3 continued
All Cases Non-Emergency
Cases Deaths OMR EMR RAMR 95% CI for RAMR Cases RAMR
Champlain Valley Physicians Hospital #Garrand T 201 2 1.00 0.80 1.14 (0.13, 4.13) 152 1.96 TOTAL 201 2 1.00 0.80 1.14 (0.13, 4.13) 152 1.96
City Hosptial at Elmhurst #Kamran M 124 5 4.03 2.56 1.45 (0.47, 3.39) . . #Kim M 36 2 5.56 1.75 2.94 (0.33,10.60) . . #Krishnan P 19 0 0.00 5.89 0.00 (0.00, 3.03) . . ##Suleman J 10 0 0.00 2.94 0.00 (0.00,11.52) . . TOTAL 189 7 3.70 2.76 1.24 (0.50, 2.55) . .
Crouse Hospital #Alfaro-Franco C 166 1 0.60 0.43 1.29 (0.02, 7.20) 160 0.00 #Amin N 234 1 0.43 0.73 0.54 (0.01, 3.00) 205 0.58 #Battaglia J 933 5 0.54 0.58 0.86 (0.28, 2.00) 872 0.64 #Berkery W 404 5 1.24 1.55 0.74 (0.24, 1.72) 342 0.47 #Caputo R 96 1 1.04 0.90 1.06 (0.01, 5.92) 88 0.00 #Esente P 29 0 0.00 0.45 0.00 (0.00,25.97) 27 0.00 #Ford T 164 1 0.61 0.50 1.12 (0.01, 6.22) 148 0.00 #Giambartolomei A 44 0 0.00 0.46 0.00 (0.00,16.87) 37 0.00 #Iskander A 6 0 0.00 0.18 0.00 (0.00,100.0) 6 0.00 #Lozner E 208 1 0.48 1.34 0.33 (0.00, 1.84) 185 0.55 #Reger M 33 0 0.00 0.75 0.00 (0.00,13.75) 30 0.00 #Simons A 66 1 1.52 0.70 1.99 (0.03,11.10) 62 1.58 All Others 33 0 0.00 0.51 0.00 (0.00,20.07) 29 0.00 TOTAL 2416 16 0.66 0.82 0.75 (0.43, 1.21) 2191 0.48
Ellis Hospital #Card H 5 0 0.00 0.19 0.00 (0.00,100.0) 5 0.00 Cospito P 445 4 0.90 1.03 0.81 (0.22, 2.07) 348 0.53 #Dempsey S 137 1 0.73 0.84 0.80 (0.01, 4.47) 128 0.66 ##Hogan R 321 0 0.00 0.55 0.00 (0.00, 1.91) 315 0.00 Jordan M 407 3 0.74 1.24 0.55 (0.11, 1.61) 274 0.77 #Kufs W 154 1 0.65 0.48 1.25 (0.02, 6.95) 147 0.83 Parkes R 664 7 1.05 1.07 0.91 (0.37, 1.88) 513 0.82 Weitz S 377 7 1.86 1.22 1.41 (0.56, 2.90) 269 1.50 TOTAL 2510 23 0.92 0.99 0.85 (0.54, 1.28) 1999 0.72
Erie County Medical Center ##Corbelli J 10 0 0.00 0.14 0.00 (0.00,100.0) 10 0.00 Dashkoff N 671 6 0.89 0.83 0.99 (0.36, 2.16) 591 0.40 ##Emerson R 46 2 4.35 3.13 1.28 (0.14, 4.64) 26 2.40 ##Phadke K 339 5 1.47 0.52 2.63 (0.85, 6.15) 309 1.61 ##Young H 45 3 6.67 3.51 1.75 (0.35, 5.12) 5 0.00 TOTAL 1111 16 1.44 0.93 1.43 (0.81, 2.32) 941 0.81
15
Table 3 continued
All Cases Non-Emergency
Cases Deaths OMR EMR RAMR 95% CI for RAMR Cases RAMR
Glens Falls Hospital ##Brady S 1 0 0.00 3.59 0.00 (0.00,94.40) . . ##Delago A 5 0 0.00 1.36 0.00 (0.00,49.89) . . #Desantis J 41 1 2.44 2.25 1.00 (0.01, 5.56) . . ##Esper D 3 0 0.00 2.52 0.00 (0.00,44.87) . . ##Hogan R 77 2 2.60 2.73 0.88 (0.10, 3.18) . . ##Papaleo R 4 0 0.00 1.65 0.00 (0.00,51.34) . . ##Papandrea L 1 0 0.00 0.39 0.00 (0.00,100.0) . . #Rashkow A 1 0 0.00 4.17 0.00 (0.00,81.28) . . TOTAL 133 3 2.26 2.49 0.84 (0.17, 2.44) . .
Good Samaritan - Suffern Agarwal A 24 0 0.00 1.54 0.00 (0.00, 9.15) . . #Brogno D 63 3 4.76 5.87 0.75 (0.15, 2.19) . . Innerfield M 31 2 6.45 3.74 1.59 (0.18, 5.76) . . #Kovar L 31 1 3.23 5.42 0.55 (0.01, 3.06) . . Shih A 53 1 1.89 5.00 0.35 (0.00, 1.94) . . TOTAL 202 7 3.47 4.73 0.68 (0.27, 1.39) . .
Good Samaritan Hosp Med Ctr- West Islip ##Caselnova R 19 1 5.26 1.86 2.62 (0.03,14.58) . . ##Deutsch E 23 0 0.00 1.38 0.00 (0.00,10.66) . . ##Hormozi S 30 1 3.33 2.89 1.06 (0.01, 5.92) . . ##Lee P J 67 3 4.48 2.18 1.90 (0.38, 5.56) . . ##Patel R B 56 3 5.36 2.20 2.25 (0.45, 6.57) . . ##Reich D 50 2 4.00 1.77 2.09 (0.23, 7.53) . . ##Schwartz R 2 0 0.00 1.26 0.00 (0.00,100.0) . . All Others 1 0 0.00 1.85 0.00 (0.00,100.0) . . TOTAL 248 10 4.03 2.08 1.79 (0.86, 3.29) . .
Huntington Hospital ##Freeman J 1 0 0.00 1.09 0.00 (0.00,100.0) . . ##Jauhar R 2 0 0.00 0.66 0.00 (0.00,100.0) . . ##Kaplan B 1 0 0.00 0.40 0.00 (0.00,100.0) . . ##Marchant D 1 0 0.00 0.42 0.00 (0.00,100.0) . . ##Park C 1 0 0.00 0.44 0.00 (0.00,100.0) . . #Patcha R 21 1 4.76 1.08 4.09 (0.05,22.74) . . ##Strizik B 13 1 7.69 3.70 1.92 (0.03,10.69) . . TOTAL 40 2 5.00 1.86 2.48 (0.28, 8.97) . .
Lenox Hill Hospital Cohen H 327 4 1.22 0.83 1.36 (0.37, 3.49) 308 0.62 #Collins M 815 7 0.86 0.75 1.06 (0.43, 2.19) 787 0.68 #Colombo A 61 0 0.00 0.96 0.00 (0.00, 5.78) 61 0.00 #Dangas G 511 7 1.37 0.93 1.36 (0.55, 2.81) 477 1.04 #Dominguez A 339 6 1.77 0.90 1.81 (0.66, 3.94) 337 1.28
16
Table 3 continued
All Cases Non-Emergency
Cases Deaths OMR EMR RAMR 95% CI for RAMR Cases RAMR
Lenox Hill Hospital, continued Garratt K 259 4 1.54 0.99 1.44 (0.39, 3.69) 235 1.13 ##Geizhals M 151 1 0.66 0.58 1.05 (0.01, 5.84) 151 0.72 Halkin A 230 3 1.30 1.02 1.19 (0.24, 3.47) 212 0.71 Iyer S 576 2 0.35 0.94 0.34 (0.04, 1.23) 543 0.34 #Kreps E 469 3 0.64 1.05 0.56 (0.11, 1.64) 442 0.37 Lasic Z 215 0 0.00 0.88 0.00 (0.00, 1.79) 192 0.00 #Leon M 523 7 1.34 0.82 1.50 (0.60, 3.10) 511 0.98 #Mehran R 34 0 0.00 1.39 0.00 (0.00, 7.17) 32 0.00 #Moses J 1504 5 0.33 0.58 0.53 (0.17, 1.23) 1497 0.31 #Moussa I 850 8 0.94 0.91 0.96 (0.41, 1.88) 817 0.75 #Reimers C 619 5 0.81 0.77 0.97 (0.31, 2.27) 584 0.64 Roubin G 717 7 0.98 0.83 1.09 (0.44, 2.25) 681 0.90 #Stone G 318 3 0.94 1.15 0.76 (0.15, 2.22) 293 0.49 #Teirstein P 79 1 1.27 1.00 1.16 (0.02, 6.48) 76 1.10 All Others 263 1 0.38 0.83 0.43 (0.01, 2.37) 251 0.31 TOTAL 8860 74 0.84 0.83 0.93 (0.73, 1.16) 8487 0.65
Long Island College Hospital ##Kantrowitz N 14 0 0.00 1.90 0.00 (0.00,12.74) . . TOTAL 14 0 0.00 1.90 0.00 (0.00,12.74) . .
Long Island Jewish Medical Center ##Freeman J 26 0 0.00 5.16 0.00 (0.00, 2.52) 5 0.00 ##Friedman G 513 7 1.36 1.21 1.05 (0.42, 2.16) 457 0.92 #Green S 17 0 0.00 3.79 0.00 (0.00, 5.26) 2 0.00 ##Grunwald A 625 5 0.80 0.95 0.78 (0.25, 1.82) 572 0.44 Hameedi A 134 0 0.00 0.20 0.00 (0.00,12.46) 133 0.00 ##Hormozi S 3 0 0.00 0.39 0.00 (0.00,100.0) 3 0.00 ##Jauhar R 1107 7 0.63 0.98 0.60 (0.24, 1.23) 951 0.70 ##Kaplan B 1318 6 0.46 0.98 0.43 (0.16, 0.94) 1193 0.37 #Katz S 21 1 4.76 5.66 0.78 (0.01, 4.32) 3 0.00 #Kim B 34 0 0.00 0.37 0.00 (0.00,26.84) 34 0.00 ##Koss J 542 5 0.92 0.88 0.97 (0.31, 2.27) 487 0.85 #Lee A 16 1 6.25 8.07 0.72 (0.01, 3.98) 2 0.00 ##Lee P J 13 1 7.69 0.53 13.39 (0.17,74.49) 13 8.81 ##Marchant D 20 0 0.00 1.96 0.00 (0.00, 8.63) 1 0.00 #Ong L Y 19 0 0.00 2.65 0.00 (0.00, 6.73) 2 0.00 #Padmanabhan V 28 0 0.00 0.67 0.00 (0.00,18.20) 25 0.00 ##Park C 528 5 0.95 1.55 0.56 (0.18, 1.32) 422 0.42 ##Park J 1 0 0.00 0.09 0.00 (0.00,100.0) 1 0.00 ##Reich D 127 0 0.00 1.07 0.00 (0.00, 2.50) 125 0.00 ##Strizik B 72 1 1.39 1.08 1.19 (0.02, 6.61) 72 0.79 ##Suleman J 23 0 0.00 0.46 0.00 (0.00,32.11) 23 0.00 All Others 51 1 1.96 0.55 3.28 (0.04,18.26) 50 2.29 TOTAL 5238 40 0.76 1.09 0.64 ** (0.46, 0.88) 4576 0.57
17
Table 3 continued
All Cases Non-Emergency
Cases Deaths OMR EMR RAMR 95% CI for RAMR Cases RAMR
Maimonides Medical Center Borgen E 1040 10 0.96 1.22 0.73 (0.35, 1.34) 917 0.54 Frankel R 658 6 0.91 1.07 0.79 (0.29, 1.71) 623 0.64 Friedman M 389 4 1.03 1.17 0.81 (0.22, 2.08) 345 0.39 Malik B 915 12 1.31 1.31 0.92 (0.48, 1.61) 777 0.58 ##Sacchi T 174 2 1.15 0.46 2.32 (0.26, 8.37) 174 1.53 Shani J 1304 12 0.92 0.94 0.90 (0.47, 1.58) 1281 0.61 All Others 2 0 0.00 0.16 0.00 (0.00,100.0) 2 0.00 TOTAL 4482 46 1.03 1.10 0.86 (0.63, 1.15) 4119 0.59
Mary Imogene Bassett Hospital Clark V 217 3 1.38 0.89 1.44 (0.29, 4.20) 174 1.33 #Irobunda C 1 0 0.00 0.05 0.00 (0.00,100.0) 1 0.00 #Rashkow A 98 2 2.04 0.96 1.95 (0.22, 7.06) 81 1.56 #Warshofsky M 5 0 0.00 1.25 0.00 (0.00,54.34) 1 0.00 All Others 200 4 2.00 1.34 1.38 (0.37, 3.54) 149 0.00 TOTAL 521 9 1.73 1.08 1.48 (0.68, 2.81) 406 0.85
Mercy Hospital #Calandra S 311 3 0.96 0.95 0.94 (0.19, 2.75) 241 0.74 ##Emerson R 353 1 0.28 1.23 0.21 (0.00, 1.19) 244 0.32 #Gelormini J 285 3 1.05 1.08 0.90 (0.18, 2.62) 249 0.00 #Haq N 418 2 0.48 1.11 0.40 (0.04, 1.44) 347 0.00 ##Morris W 229 1 0.44 1.28 0.32 (0.00, 1.75) 175 0.00 ##Young H 32 1 3.13 1.71 1.68 (0.02, 9.37) 23 0.00 TOTAL 1628 11 0.68 1.13 0.55 (0.27, 0.98) 1279 0.19 **
Millard Fillmore Hospital #Calandra S 351 3 0.85 0.64 1.23 (0.25, 3.60) 344 0.87 ##Corbelli J 623 7 1.12 0.84 1.24 (0.50, 2.55) 568 1.32 ##Emerson R 3 0 0.00 0.72 0.00 (0.00,100.0) 3 0.00 #Gelormini J 257 1 0.39 0.78 0.46 (0.01, 2.55) 240 0.38 #Haq N 7 0 0.00 0.67 0.00 (0.00,72.46) 7 0.00 #Masud A 241 2 0.83 0.85 0.90 (0.10, 3.25) 225 0.40 ##Morris W 579 3 0.52 0.85 0.56 (0.11, 1.65) 554 0.37 ##Phadke K 696 5 0.72 0.88 0.75 (0.24, 1.76) 598 0.37 ##Young H 4 0 0.00 0.65 0.00 (0.00,100.0) 3 0.00 All Others 115 2 1.74 1.39 1.16 (0.13, 4.17) 97 0.00 TOTAL 2876 23 0.80 0.84 0.87 (0.55, 1.31) 2639 0.61
Montefiore Medical Center - Einstein Gotsis W 786 10 1.27 0.48 2.46 * (1.18, 4.52) 739 1.67* Monrad E 559 5 0.89 0.79 1.05 (0.34, 2.45) 505 0.74 Silverman G 561 6 1.07 0.77 1.28 (0.47, 2.78) 506 0.84 Srinivas V 625 5 0.80 0.94 0.78 (0.25, 1.83) 567 0.32 All Others 9 1 11.11 1.79 5.73 (0.07,31.90) 5 0.00 TOTAL 2540 27 1.06 0.73 1.34 (0.89, 1.96) 2322 0.85
18
Table 3 continued
All Cases Non-Emergency
Cases Deaths OMR EMR RAMR 95% CI for RAMR Cases RAMR
Montefiore Medical Center - Moses #Goldman A Y 389 3 0.77 1.31 0.54 (0.11, 1.58) 362 0.27 Greenberg M 720 5 0.69 0.78 0.82 (0.26, 1.91) 648 0.36 #Grose R 175 3 1.71 0.62 2.57 (0.52, 7.50) 163 0.73 #Johnson M 272 2 0.74 0.83 0.82 (0.09, 2.94) 258 0.81 Menegus M 741 9 1.21 0.90 1.25 (0.57, 2.37) 649 0.80 All Others 10 0 0.00 0.53 0.00 (0.00,64.49) 10 0.00 TOTAL 2307 22 0.95 0.90 0.98 (0.61, 1.48) 2090 0.56
Mt. Sinai Hospital #Kamran M 630 0 0.00 0.60 0.00** (0.00, 0.90) 605 0.00 #Kim M 1280 18 1.41 1.18 1.10 (0.65, 1.74) 1212 0.82 Kini A 1941 13 0.67 1.05 0.59 (0.31, 1.00) 1809 0.32 #Krishnan P 230 7 3.04 1.35 2.09 (0.84, 4.31) 200 2.44 * #Lee J 216 1 0.46 0.69 0.62 (0.01, 3.44) 214 0.42 #Mittal N 459 1 0.22 0.35 0.57 (0.01, 3.17) 458 0.39 Moreno P 581 6 1.03 1.52 0.63 (0.23, 1.37) 500 0.58 Sharma S 3170 24 0.76 0.94 0.74 (0.47, 1.10) 3069 0.54 #Sherman W 472 2 0.42 1.20 0.33 (0.04, 1.18) 450 0.00 ##Suleman J 551 4 0.73 0.64 1.04 (0.28, 2.67) 523 0.68 All Others 192 2 1.04 0.73 1.32 (0.15, 4.76) 186 1.01 TOTAL 9722 78 0.80 0.98 0.76 (0.60, 0.95) 9226 0.53
NY Methodist Hospital #Badero O 39 0 0.00 0.25 0.00 (0.00,35.34) 39 0.00 Puma A 592 12 2.03 0.92 2.03 * (1.05, 3.55) 579 1.25 #Reddy C 220 3 1.36 1.14 1.10 (0.22, 3.22) 214 0.62 ##Sacchi T 777 8 1.03 0.81 1.18 (0.51, 2.32) 743 0.59 #Shaknovich A 1 0 0.00 0.09 0.00 (0.00,100.0) 1 0.00 All Others 15 0 0.00 0.60 0.00 (0.00,37.97) 15 0.00 TOTAL 1644 23 1.40 0.88 1.47* (0.93, 2.21) 1591 0.80
NYP Hospital - Columbia Presbyterian Apfelbaum M 221 1 0.45 0.85 0.49 (0.01, 2.74) 187 0.00 #Brogno D 41 1 2.44 1.12 2.01 (0.03,11.17) 32 3.73 #Collins M 388 4 1.03 1.08 0.88 (0.24, 2.25) 377 0.51 #Colombo A 20 0 0.00 1.06 0.00 (0.00,16.00) 20 0.00 #Dangas G 314 1 0.32 0.77 0.38 (0.00, 2.13) 290 0.00 #Grose R 258 1 0.39 0.69 0.52 (0.01, 2.89) 248 0.39 #Irobunda C 113 3 2.65 1.43 1.71 (0.34, 5.00) 94 1.19 #Johnson M 101 0 0.00 0.53 0.00 (0.00, 6.33) 97 0.00 #Kovar L 11 0 0.00 0.35 0.00 (0.00,87.68) 11 0.00 #Kreps E 171 4 2.34 1.52 1.42 (0.38, 3.64) 162 0.85 #Leon M 181 4 2.21 0.85 2.41 (0.65, 6.17) 177 1.80 #Mehran R 102 2 1.96 1.24 1.46 (0.16, 5.26) 90 0.00 #Moses J 889 6 0.67 0.59 1.05 (0.38, 2.29) 889 0.74
19
Table 3 continued
All Cases Non-Emergency
Cases Deaths OMR EMR RAMR 95% CI for RAMR Cases RAMR
NYP Hospital - Columbia Presbyterian, continued #Moussa I 349 2 0.57 0.82 0.64 (0.07, 2.32) 336 0.55 #Perry-Bottinger L 34 0 0.00 0.39 0.00 (0.00,25.28) 34 0.00 Rabbani L 355 4 1.13 1.17 0.89 (0.24, 2.29) 297 1.01 Reison D 41 0 0.00 0.36 0.00 (0.00,22.98) 40 0.00 #Sherman W 85 1 1.18 1.24 0.88 (0.01, 4.89) 76 1.11 #Stone G 120 0 0.00 0.76 0.00 (0.00, 3.74) 114 0.00 #Teirstein P 35 0 0.00 0.95 0.00 (0.00,10.15) 35 0.00 #Warshofsky M 182 0 0.00 0.68 0.00 (0.00, 2.74) 177 0.00 #Wasserman H 270 1 0.37 1.21 0.28 (0.00, 1.58) 231 0.00 Weinberger J 263 6 2.28 1.00 2.12 (0.77, 4.61) 229 1.55 All Others 163 3 1.84 1.19 1.43 (0.29, 4.18) 154 1.48 TOTAL 4707 44 0.93 0.90 0.96 (0.70, 1.29) 4397 0.66
NYP Hospital - Weill Cornell Bergman G 776 8 1.03 1.48 0.64 (0.28, 1.27) 688 0.40 #Charney R 329 2 0.61 0.92 0.61 (0.07, 2.21) 313 0.00 ##Geizhals M 1 0 0.00 0.51 0.00 (0.00,100.0) 1 0.00 Hong M 620 14 2.26 1.70 1.23 (0.67, 2.06) 548 0.95 Iacovone F 399 8 2.01 1.86 1.00 (0.43, 1.97) 351 0.71 #Messinger D 256 0 0.00 1.32 0.00 (0.00, 1.00) 240 0.00 Minutello R 394 3 0.76 1.33 0.53 (0.11, 1.54) 320 0.00 Naidu S 329 7 2.13 1.57 1.25 (0.50, 2.58) 275 0.77 Parikh M 1332 8 0.60 0.76 0.73 (0.32, 1.45) 1253 0.60 #Reddy C 166 3 1.81 0.51 3.29 (0.66, 9.60) 166 2.14 Wong S 596 1 0.17 0.60 0.26 (0.00, 1.43) 557 0.27 All Others 129 1 0.78 1.63 0.44 (0.01, 2.44) 120 0.00 TOTAL 5327 55 1.03 1.18 0.81 (0.61, 1.05) 4832 0.53
NYU Hospitals Center ##Angelopoulos P 10 0 0.00 0.47 0.00 (0.00,72.83) 10 0.00 #Attubato M 844 6 0.71 0.91 0.72 (0.26, 1.56) 783 0.62 #Babaev A 198 1 0.51 0.76 0.62 (0.01, 3.43) 193 0.00 #Feit F 886 1 0.11 0.62 0.17 (0.00, 0.94) 820 0.15 #Keller N 13 0 0.00 1.45 0.00 (0.00,17.95) 6 0.00 #Pena Sing I 101 1 0.99 1.32 0.69 (0.01, 3.85) 94 0.00 ##Slater J 336 5 1.49 0.51 2.71 (0.87, 6.32) 324 1.44 #Staniloae C 8 0 0.00 0.25 0.00 (0.00,100.0) 8 0.00 ##Winer H 7 0 0.00 0.35 0.00 (0.00,100.0) 7 0.00 TOTAL 2403 14 0.58 0.75 0.72 (0.39, 1.21) 2245 0.48
New York Hospital Medical Ctr of Queens #Chang J 886 10 1.13 0.88 1.19 (0.57, 2.18) 798 0.67 #Chiu S 121 0 0.00 0.41 0.00 (0.00, 6.86) 116 0.00 David M 171 2 1.17 0.82 1.31 (0.15, 4.74) 167 1.12 ##Friedman G 17 0 0.00 0.80 0.00 (0.00,24.93) 14 0.00
20
Table 3 continued
All Cases Non-Emergency
Cases Deaths OMR EMR RAMR 95% CI for RAMR Cases RAMR
New York Hospital Medical Ctr of Queens, continued ##Geizhals M 427 3 0.70 0.68 0.96 (0.19, 2.79) 421 0.76 ##Grunwald A 28 0 0.00 1.35 0.00 (0.00, 8.95) 26 0.00 Gustafson G 1032 15 1.45 1.05 1.28 (0.72, 2.12) 944 1.13 ##Koss J 12 0 0.00 0.28 0.00 (0.00,99.90) 11 0.00 Papadakos S 1011 15 1.48 1.21 1.14 (0.63, 1.87) 870 0.78 ##Park J 12 0 0.00 0.16 0.00 (0.00,100.0) 12 0.00 #Perry-Bottinger L 12 0 0.00 0.66 0.00 (0.00,42.98) 12 0.00 TOTAL 3729 45 1.21 0.97 1.15 (0.84, 1.53) 3391 0.84
North Shore University Hospital ##Angelopoulos P 30 0 0.00 0.56 0.00 (0.00,20.12) 23 0.00 ##Balchandani R 5 0 0.00 0.44 0.00 (0.00,100.0) 5 0.00 ##Caselnova R 396 4 1.01 0.72 1.29 (0.35, 3.31) 378 0.96 #Chang J 2 0 0.00 0.22 0.00 (0.00,100.0) 1 0.00 #Dervan J 3 0 0.00 0.14 0.00 (0.00,100.0) 3 0.00 ##Deutsch E 545 1 0.18 0.63 0.27 (0.00, 1.49) 532 0.24 ##Freeman J 1198 12 1.00 0.93 1.00 (0.52, 1.74) 1003 1.09 ##Friedman G 109 3 2.75 0.90 2.81 (0.56, 8.21) 102 2.45 #Gambino A 140 1 0.71 0.35 1.89 (0.02,10.51) 134 1.39 #Green S 939 11 1.17 1.02 1.06 (0.53, 1.90) 772 0.29 ##Grella R 5 0 0.00 0.21 0.00 (0.00,100.0) 5 0.00 ##Grunwald A 58 1 1.72 1.57 1.02 (0.01, 5.65) 49 1.33 ##Hormozi S 241 1 0.41 0.45 0.85 (0.01, 4.71) 236 0.61 ##Jauhar R 40 2 5.00 2.84 1.62 (0.18, 5.87) 4 0.00 ##Kaplan B 50 1 2.00 1.91 0.97 (0.01, 5.38) 4 0.00 #Katz S 904 4 0.44 0.77 0.53 (0.14, 1.36) 809 0.29 #Kim B 19 0 0.00 0.17 0.00 (0.00,100.0) 19 0.00 ##Koss J 72 2 2.78 1.08 2.39 (0.27, 8.62) 62 0.00 ##Lederman S 283 4 1.41 0.56 2.33 (0.63, 5.97) 276 1.71 #Lee A 436 6 1.38 1.26 1.01 (0.37, 2.20) 346 0.92 ##Lee P J 646 3 0.46 0.51 0.84 (0.17, 2.46) 636 0.61 ##Marchant D 474 3 0.63 1.01 0.58 (0.12, 1.70) 367 0.30 #Ong L Y 1158 3 0.26 1.06 0.23 ** (0.05, 0.66) 1013 0.22 #Padmanabhan V 178 1 0.56 1.09 0.48 (0.01, 2.65) 153 0.00 ##Park C 60 1 1.67 2.09 0.74 (0.01, 4.10) 13 0.00 ##Park J 184 0 0.00 0.45 0.00 (0.00, 4.06) 177 0.00 #Patcha R 435 3 0.69 0.66 0.97 (0.20, 2.84) 403 0.64 ##Patel R B 277 1 0.36 0.58 0.57 (0.01, 3.19) 266 0.43 ##Rehman A 1 0 0.00 1.35 0.00 (0.00,100.0) 1 0.00 ##Reich D 347 0 0.00 0.60 0.00 (0.00, 1.63) 339 0.00 #Sassower M 44 0 0.00 0.37 0.00 (0.00,20.85) 43 0.00 ##Schwartz R 273 1 0.37 0.74 0.46 (0.01, 2.53) 257 0.00 ##Strizik B 553 5 0.90 0.86 0.97 (0.31, 2.27) 504 0.82
21
Table 3 continued
All Cases Non-Emergency
Cases Deaths OMR EMR RAMR 95% CI for RAMR Cases RAMR
North Shore University Hospital, continued #Witkes D 213 0 0.00 0.40 0.00 (0.00, 4.01) 212 0.00 ##Zisfein J 300 3 1.00 0.49 1.90 (0.38, 5.54) 292 1.50 All Others 260 1 0.38 0.54 0.65 (0.01, 3.64) 253 0.46 TOTAL 10878 78 0.72 0.82 0.81 (0.64, 1.01) 9692 0.59
Rochester General Hospital Berlowitz M 522 6 1.15 0.99 1.07 (0.39, 2.33) 405 0.85 ##Chockalingam S 509 7 1.38 0.84 1.51 (0.61, 3.12) 432 0.96 ##Doling M 251 2 0.80 0.52 1.41 (0.16, 5.10) 235 1.10 Fitzpatrick P 431 4 0.93 1.00 0.86 (0.23, 2.20) 322 0.74 #Gacioch G 438 5 1.14 0.93 1.14 (0.37, 2.66) 327 0.00 Mathew T M 568 4 0.70 0.76 0.86 (0.23, 2.21) 516 0.94 ##Ong L S 2905 22 0.76 0.69 1.01 (0.63, 1.53) 2727 0.64 ##Patel T 729 6 0.82 1.01 0.75 (0.27, 1.63) 645 0.36 Scortichini D 340 3 0.88 0.61 1.34 (0.27, 3.91) 322 1.07 #Stuver T 926 10 1.08 1.08 0.92 (0.44, 1.70) 711 0.41 TOTAL 7619 69 0.91 0.83 1.01 (0.79, 1.28) 6642 0.63
SVCMC - St. Vincents #Acuna D 168 4 2.38 1.09 2.03 (0.55, 5.19) 130 1.39 Ambrose J 60 0 0.00 0.60 0.00 (0.00, 9.34) 53 0.00 #Bhambhani G 778 4 0.51 0.44 1.07 (0.29, 2.75) 776 0.86 Braff R 108 1 0.93 0.75 1.14 (0.01, 6.34) 87 1.36 #Chiu S 1 0 0.00 0.16 0.00 (0.00,100.0) 1 0.00 Chokshi A 239 0 0.00 0.47 0.00 (0.00, 3.05) 238 0.00 Coppola J 500 3 0.60 1.35 0.41 (0.08, 1.20) 404 0.52 #Dominguez A 231 4 1.73 1.52 1.05 (0.28, 2.69) 224 0.78 Elmquist T 117 1 0.85 1.42 0.56 (0.01, 3.09) 87 0.94 #Farid A 6 0 0.00 0.52 0.00 (0.00,100.0) 6 0.00 Hasan C 121 2 1.65 0.64 2.37 (0.27, 8.55) 117 1.80 ##Kantrowitz N 264 2 0.76 0.94 0.75 (0.08, 2.70) 242 0.31 Kwan T 482 2 0.41 0.41 0.93 (0.10, 3.37) 471 0.72 #Lee J 39 1 2.56 1.22 1.95 (0.03,10.84) 33 0.00 Nguyen T 292 3 1.03 1.54 0.62 (0.12, 1.80) 224 0.31 #Rentrop K 76 0 0.00 0.42 0.00 (0.00,10.65) 75 0.00 Sehhat K 155 3 1.94 1.33 1.34 (0.27, 3.92) 117 0.95 Seldon M 104 6 5.77 2.08 2.57 * (0.94, 5.59) 73 8.20 * #Siddiqi R 335 0 0.00 0.51 0.00 (0.00, 1.97) 330 0.00 #Snyder S 1 0 0.00 0.17 0.00 (0.00,100.0) 1 0.00 #Staniloae C 274 3 1.09 0.90 1.12 (0.23, 3.27) 228 0.92 All Others 286 7 2.45 1.35 1.67 (0.67, 3.45) 247 0.79 TOTAL 4637 46 0.99 0.91 1.00 (0.74, 1.34) 4164 0.78
22
Table 3 continued
All Cases Non-Emergency
Cases Deaths OMR EMR RAMR 95% CI for RAMR Cases RAMR
South Nassau Communities Hospital #Berke A 18 0 0.00 2.44 0.00 (0.00, 7.73) . . #Hamby R 1 0 0.00 1.12 0.00 (0.00,100.0) . . ##Hormozi S 4 0 0.00 2.42 0.00 (0.00,34.99) . . #Lituchy A 31 0 0.00 1.16 0.00 (0.00, 9.40) . . #Minadeo J 46 2 4.35 1.89 2.13 (0.24, 7.68) . . #Petrossian G 15 0 0.00 1.95 0.00 (0.00,11.57) . . ##Rehman A 7 0 0.00 1.47 0.00 (0.00,32.93) . . ##Zisfein J 45 1 2.22 1.81 1.14 (0.01, 6.33) . . TOTAL 167 3 1.80 1.79 0.93 (0.19, 2.71) . .
Southside Hospital ##Caselnova R 6 0 0.00 0.90 0.00 (0.00,62.61) . . ##Deutsch E 22 0 0.00 1.94 0.00 (0.00, 7.93) . . ##Hormozi S 25 0 0.00 0.99 0.00 (0.00,13.67) . . ##Lee P J 38 1 2.63 1.43 1.70 (0.02, 9.43) . . ##Patel R B 39 0 0.00 2.64 0.00 (0.00, 3.29) . . ##Reich D 42 0 0.00 1.06 0.00 (0.00, 7.60) . . ##Schwartz R 1 0 0.00 1.45 0.00 (0.00,100.0) . . TOTAL 173 1 0.58 1.60 0.33 (0.00, 1.86) . .
St. Catherine of Siena Hospital ##Balchandani R 2 0 0.00 0.68 0.00 (0.00,100.0) . . ##Deutsch E 5 0 0.00 0.56 0.00 (0.00,100.0) . . ##Grella R 1 0 0.00 3.85 0.00 (0.00,88.14) . . ##Hormozi S 11 0 0.00 3.90 0.00 (0.00, 7.90) . . ##Patel R B 15 0 0.00 1.20 0.00 (0.00,18.83) . . #Rosenband M 6 0 0.00 1.89 0.00 (0.00,29.88) . . #Shlofmitz R 4 0 0.00 0.60 0.00 (0.00,100.0) . . #Tsiamtsiouris T 4 0 0.00 2.23 0.00 (0.00,37.98) . . TOTAL 48 0 0.00 1.91 0.00 (0.00, 3.70) . .
St. Elizabeth Medical Center Gaffney B 238 4 1.68 0.89 1.75 (0.47, 4.47) 220 0.84 Kelberman M 552 6 1.09 0.91 1.11 (0.40, 2.41) 508 0.82 Macisaac H 872 19 2.18 1.12 1.80 * (1.08, 2.81) 758 1.25 Mathew T C 992 12 1.21 1.15 0.97 (0.50, 1.70) 890 0.63 Nassif R 559 6 1.07 1.07 0.92 (0.34, 2.01) 500 0.53 Patel A 516 2 0.39 1.02 0.35 (0.04, 1.27) 465 0.18 Varma P 611 10 1.64 0.83 1.83 (0.87, 3.36) 546 1.46 TOTAL 4340 59 1.36 1.03 1.22 * (0.93, 1.58) 3887 0.83
St. Francis Hospital Abittan M 504 3 0.60 0.70 0.79 (0.16, 2.30) 490 0.27 Arkonac B 531 3 0.56 1.17 0.45 (0.09, 1.31) 476 0.40 #Berke A 490 6 1.22 1.67 0.68 (0.25, 1.48) 436 0.81
23
Table 3 continued
All Cases Non-Emergency
Cases Deaths OMR EMR RAMR 95% CI for RAMR Cases RAMR
St. Francis Hospital, continued ##Deutsch E 32 0 0.00 0.35 0.00 (0.00,30.67) 32 0.00 Ezratty A 411 0 0.00 0.55 0.00 (0.00, 1.51) 399 0.00 ##Friedman G 30 1 3.33 1.40 2.19 (0.03,12.20) 27 2.82 Goldman A B 354 2 0.56 0.76 0.69 (0.08, 2.49) 335 0.53 ##Grunwald A 7 0 0.00 0.40 0.00 (0.00,100.0) 7 0.00 Gulotta R 355 3 0.85 0.70 1.12 (0.22, 3.26) 341 0.92 #Hamby R 209 2 0.96 0.55 1.60 (0.18, 5.76) 205 1.19 Hershman R 287 1 0.35 0.42 0.77 (0.01, 4.29) 286 0.00 ##Hormozi S 302 7 2.32 0.80 2.67 * (1.07, 5.51) 277 2.30 * ##Koss J 11 0 0.00 0.50 0.00 (0.00,61.20) 11 0.00 ##Lee P J 29 0 0.00 0.31 0.00 (0.00,38.04) 28 0.00 #Lituchy A 649 2 0.31 0.75 0.38 (0.04, 1.37) 607 0.30 Mathew R 448 2 0.45 0.62 0.67 (0.08, 2.41) 442 0.49 #Minadeo J 282 5 1.77 1.20 1.36 (0.44, 3.18) 254 0.71 Oruci E 424 3 0.71 0.81 0.81 (0.16, 2.37) 416 0.64 Pappas T 405 0 0.00 0.51 0.00 (0.00, 1.63) 395 0.00 #Petrossian G 1395 15 1.08 0.87 1.14 (0.64, 1.87) 1304 0.87 Randall A 148 5 3.38 1.38 2.26 (0.73, 5.28) 144 1.63 ##Rehman A 768 7 0.91 1.07 0.79 (0.32, 1.62) 693 0.35 #Shlofmitz R 1395 4 0.29 0.41 0.65 (0.18, 1.67) 1372 0.46 Timmermans R 253 2 0.79 0.65 1.12 (0.13, 4.05) 241 0.81 #Tsiamtsiouris T 656 6 0.91 0.75 1.12 (0.41, 2.44) 631 0.80 Venditto J 432 4 0.93 0.99 0.87 (0.23, 2.22) 404 0.47 ##Zisfein J 57 0 0.00 0.51 0.00 (0.00,11.69) 53 0.00 All Others 263 4 1.52 0.99 1.41 (0.38, 3.62) 232 0.78 TOTAL 11127 87 0.78 0.80 0.90 (0.72, 1.11) 10538 0.64
St. Josephs Hospital #Alfaro-Franco C 77 0 0.00 0.65 0.00 (0.00, 6.80) 48 0.00 #Amin N 167 0 0.00 1.22 0.00 (0.00, 1.66) 124 0.00 Bhan R 674 8 1.19 0.86 1.27 (0.55, 2.51) 614 0.83 #Caputo R 1218 18 1.48 0.93 1.47 (0.87, 2.33) 1085 0.95 #Esente P 269 3 1.12 0.84 1.23 (0.25, 3.59) 256 1.30 #Ford T 137 1 0.73 1.07 0.63 (0.01, 3.52) 101 0.00 #Giambartolomei A 720 8 1.11 1.26 0.82 (0.35, 1.61) 599 0.49 #Iskander A 259 1 0.39 0.96 0.37 (0.00, 2.08) 230 0.39 #Lozner E 106 1 0.94 0.86 1.02 (0.01, 5.67) 79 1.51 O’Hern M 385 5 1.30 1.25 0.96 (0.31, 2.25) 323 0.45 #Reger M 573 1 0.17 0.83 0.19 (0.00, 1.08) 502 0.21 #Simons A 955 8 0.84 0.84 0.93 (0.40, 1.83) 835 0.75 Walford G 637 7 1.10 0.81 1.26 (0.50, 2.59) 544 0.36 All Others 105 0 0.00 0.48 0.00 (0.00, 6.67) 99 0.00 TOTAL 6282 61 0.97 0.94 0.96 (0.73, 1.23) 5439 0.63
24
Table 3 continued
All Cases Non-Emergency
Cases Deaths OMR EMR RAMR 95% CI for RAMR Cases RAMR
St. Lukes Roosevelt Hospital-St. Lukes #Goldman A Y 10 0 0.00 0.45 0.00 (0.00,74.53) 10 0.00 Leber R 221 2 0.90 0.84 1.00 (0.11, 3.60) 184 0.67 #Nero T 37 0 0.00 1.59 0.00 (0.00, 5.77) 21 0.00 Palazzo A 175 0 0.00 0.71 0.00 (0.00, 2.72) 150 0.00 Simon C 285 5 1.75 1.58 1.03 (0.33, 2.40) 277 0.80 Singh V 976 9 0.92 0.67 1.28 (0.58, 2.42) 903 0.67 ##Slater J 135 1 0.74 0.52 1.32 (0.02, 7.32) 133 0.96 Tamis-Holland J 240 4 1.67 0.94 1.64 (0.44, 4.21) 198 0.56 #Wilentz J 430 4 0.93 0.57 1.51 (0.41, 3.86) 399 0.38 TOTAL 2509 25 1.00 0.80 1.15 (0.74, 1.69) 2275 0.64
St. Peters Hospital #Bishop G 343 9 2.62 0.92 2.64 * (1.21, 5.01) 249 2.26 * ##Brady S 110 0 0.00 0.91 0.00 (0.00, 3.38) 87 0.00 #Card H 180 0 0.00 0.68 0.00 (0.00, 2.79) 176 0.00 ##Delago A 8 0 0.00 0.69 0.00 (0.00,61.68) 2 0.00 #Dempsey S 5 0 0.00 0.62 0.00 (0.00,100.0) 5 0.00 #Desantis J 206 1 0.49 0.63 0.72 (0.01, 3.99) 174 0.67 ##Esper D 277 0 0.00 0.77 0.00 (0.00, 1.60) 243 0.00 #Garrand T 56 1 1.79 0.64 2.58 (0.03,14.38) 49 0.00 #Kufs W 17 0 0.00 0.68 0.00 (0.00,29.25) 13 0.00 #Macina A 3 1 33.33 2.46 12.53 (0.16,69.71) . . #Marmulstein M 210 3 1.43 1.18 1.12 (0.22, 3.27) 144 0.83 Martinelli M 824 4 0.49 0.89 0.50 (0.13, 1.28) 680 0.40 ##Papaleo R 47 0 0.00 0.44 0.00 (0.00,16.54) 41 0.00 ##Papandrea L 267 1 0.37 0.71 0.49 (0.01, 2.72) 224 0.58 #Roccario E 767 5 0.65 0.92 0.66 (0.21, 1.53) 588 0.36 All Others 28 0 0.00 1.03 0.00 (0.00,11.71) 25 0.00 TOTAL 3348 25 0.75 0.86 0.81 (0.52, 1.19) 2700 0.52
Staten Island University Hospital- North #Acuna D 1 0 0.00 0.35 0.00 (0.00,100.0) 1 0.00 Duvvuri S 620 5 0.81 0.77 0.97 (0.31, 2.27) 572 0.57 #Farid A 294 1 0.34 0.46 0.68 (0.01, 3.81) 279 0.00 Homayuni A 402 0 0.00 0.57 0.00 (0.00, 1.48) 371 0.00 Malpeso J 371 7 1.89 0.43 4.01 * (1.61, 8.27) 329 2.63* McCord D 484 2 0.41 0.60 0.64 (0.07, 2.30) 439 0.81 Mohan R 191 0 0.00 0.44 0.00 (0.00, 4.05) 168 0.00 Rouvelas P 137 1 0.73 0.85 0.79 (0.01, 4.42) 131 0.67 #Snyder S 207 1 0.48 0.85 0.52 (0.01, 2.91) 191 0.00 Swamy S 363 1 0.28 0.50 0.51 (0.01, 2.85) 346 0.54 Vazzana T 326 4 1.23 0.99 1.15 (0.31, 2.93) 287 1.18 Warchol A 208 0 0.00 0.69 0.00 (0.00, 2.38) 174 0.00 All Others 124 1 0.81 0.70 1.07 (0.01, 5.94) 102 1.39 TOTAL 3728 23 0.62 0.64 0.89 (0.56, 1.33) 3390 0.64
25
Table 3 continued
All Cases Non-Emergency
Cases Deaths OMR EMR RAMR 95% CI for RAMR Cases RAMR
Strong Memorial Hospital ##Chockalingam S 21 0 0.00 0.37 0.00 (0.00,43.25) 20 0.00 Cove C 646 12 1.86 1.27 1.35 (0.70, 2.35) 491 1.16 ##Doling M 705 8 1.13 0.91 1.15 (0.50, 2.27) 623 1.39 Garringer J 149 1 0.67 0.67 0.93 (0.01, 5.15) 135 0.00 Gassler J 652 11 1.69 0.98 1.59 (0.79, 2.84) 514 0.67 #Ling F 621 3 0.48 0.88 0.51 (0.10, 1.48) 476 0.23 Narins C 877 12 1.37 1.02 1.24 (0.64, 2.17) 688 0.71 ##Ong L S 28 0 0.00 1.37 0.00 (0.00, 8.86) 28 0.00 ##Patel T 103 0 0.00 0.63 0.00 (0.00, 5.23) 100 0.00 Pomerantz R 276 1 0.36 0.95 0.35 (0.00, 1.96) 175 0.00 TOTAL 4078 48 1.18 0.99 1.10 (0.81, 1.46) 3250 0.75
United Health Services - Wilson Hospital Ahmed O 373 4 1.07 1.40 0.71 (0.19, 1.81) 298 0.74 Jamal N 643 6 0.93 1.40 0.61 (0.22, 1.34) 549 0.45 Kashou H 515 6 1.17 0.92 1.17 (0.43, 2.55) 429 1.04 Rehman A U 378 5 1.32 1.60 0.77 (0.25, 1.79) 296 1.25 Stamato N 358 3 0.84 1.25 0.62 (0.12, 1.81) 284 1.04 Traverse P 394 5 1.27 1.80 0.65 (0.21, 1.52) 325 0.29 All Others 112 2 1.79 1.86 0.89 (0.10, 3.20) 80 0.00 TOTAL 2773 31 1.12 1.39 0.74 (0.50, 1.05) 2261 0.73
Unity Hospital ##Chockalingam S 7 0 0.00 0.91 0.00 (0.00,53.09) . . ##Doling M 1 0 0.00 0.27 0.00 (0.00,100.0) . . #Gacioch G 1 0 0.00 0.40 0.00 (0.00,100.0) . . #Ling F 1 0 0.00 2.04 0.00 (0.00,100.0) . . ##Ong L S 4 1 25.00 21.71 1.06 (0.01, 5.92) . . ##Patel T 121 0 0.00 1.72 0.00 (0.00, 1.63) . . #Stuver T 4 0 0.00 1.63 0.00 (0.00,51.90) . . TOTAL 139 1 0.72 2.24 0.30 (0.00, 1.65) . .
University Hospital - Brooklyn Afflu E 240 1 0.42 0.45 0.85 (0.01, 4.71) 236 0.65 #Badero O 162 3 1.85 0.58 2.94 (0.59, 8.58) 158 1.52 Cavusoglu E 697 3 0.43 0.70 0.56 (0.11, 1.65) 657 0.48 Chadow H 384 6 1.56 0.75 1.93 (0.70, 4.20) 373 1.65 Feit A 772 5 0.65 0.61 0.99 (0.32, 2.30) 726 0.34 Marmur J 999 6 0.60 0.86 0.65 (0.24, 1.41) 959 0.41 #Mittal N 8 0 0.00 0.13 0.00 (0.00,100.0) 8 0.00 All Others 256 0 0.00 0.63 0.00 (0.00, 2.09) 249 0.00 TOTAL 3518 24 0.68 0.70 0.90 (0.57, 1.33) 3366 0.60
26
Table 3 continued
All Cases Non-Emergency
Cases Deaths OMR EMR RAMR 95% CI for RAMR Cases RAMR
University Hospital - SUNY Upstate #Battaglia J 120 1 0.83 1.02 0.75 (0.01, 4.18) 102 0.92 #Berkery W 25 0 0.00 0.65 0.00 (0.00,20.89) 18 0.00 Kozman H 549 19 3.46 1.71 1.88 * (1.13, 2.93) 402 1.17 TOTAL 694 20 2.88 1.55 1.72 * (1.05, 2.65) 522 1.11
University Hospital - Stony Brook ##Balchandani R 286 1 0.35 0.88 0.37 (0.00, 2.05) 250 0.41 #Brown D 23 0 0.00 1.29 0.00 (0.00,11.40) 13 0.00 Chernilas J 463 6 1.30 1.15 1.04 (0.38, 2.26) 338 0.49 #Dervan J 553 5 0.90 1.00 0.84 (0.27, 1.95) 500 0.79 ##Grella R 517 2 0.39 0.65 0.55 (0.06, 1.98) 471 0.45 Korlipara G 409 5 1.22 0.73 1.55 (0.50, 3.62) 375 0.87 Lawson W 600 9 1.50 1.13 1.23 (0.56, 2.33) 458 0.76 ##Lederman S 103 0 0.00 0.87 0.00 (0.00, 3.78) 90 0.00 #Mani A 9 0 0.00 2.30 0.00 (0.00,16.36) 5 0.00 Mirza H 290 6 2.07 1.37 1.39 (0.51, 3.03) 215 0.34 #Rosenband M 643 7 1.09 0.85 1.18 (0.47, 2.44) 616 0.63 Stys A 301 5 1.66 1.49 1.03 (0.33, 2.40) 200 0.31 All Others 250 2 0.80 1.07 0.69 (0.08, 2.50) 188 0.81 TOTAL 4447 48 1.08 1.00 1.00 (0.74, 1.32) 3719 0.58
Vassar Brothers Medical Center Gorwara S 604 5 0.83 1.10 0.70 (0.23, 1.63) 445 0.00 Jafar M 1167 8 0.69 0.99 0.64 (0.28, 1.26) 901 0.22 Kantaros L 646 5 0.77 0.99 0.73 (0.23, 1.69) 480 0.75 All Others 86 0 0.00 0.61 0.00 (0.00, 6.50) 69 0.00 TOTAL 2503 18 0.72 1.00 0.66 (0.39, 1.05) 1895 0.27
Westchester Medical Center #Charney R 34 0 0.00 0.61 0.00 (0.00,16.31) 34 0.00 Cohen Martin 433 4 0.92 1.14 0.75 (0.20, 1.92) 341 0.30 Hjemdahl-Monsen C 1338 9 0.67 1.07 0.58 (0.27, 1.11) 1131 0.25 Kalapatapu K 1470 9 0.61 0.95 0.59 (0.27, 1.13) 1193 0.35 #Messinger D 32 0 0.00 0.39 0.00 (0.00,26.91) 31 0.00 Pucillo A 998 10 1.00 0.85 1.09 (0.52, 2.00) 845 0.57 Weiss M 391 7 1.79 1.43 1.16 (0.46, 2.39) 312 1.01 All Others 35 0 0.00 0.61 0.00 (0.00,15.86) 27 0.00 TOTAL 4731 39 0.82 1.01 0.75 (0.54, 1.03) 3914 0.40
Winthrop University Hospital ##Angelopoulos P 106 0 0.00 0.97 0.00 (0.00, 3.29) 87 0.00 ##Caselnova R 114 0 0.00 0.84 0.00 (0.00, 3.55) 110 0.00 ##Deutsch E 81 0 0.00 0.70 0.00 (0.00, 5.98) 81 0.00 #Gambino A 490 6 1.22 0.91 1.25 (0.46, 2.72) 438 1.06 ##Lederman S 59 0 0.00 0.79 0.00 (0.00, 7.26) 56 0.00
27
Table 3 continued
All Cases Non-Emergency
Cases Deaths OMR EMR RAMR 95% CI for RAMR Cases RAMR
Winthrop University Hospital, continued ##Lee P J 64 1 1.56 0.48 3.00 (0.04,16.69) 62 1.91 Marzo K 818 1 0.12 0.79 0.14** (0.00, 0.80) 737 0.17 ##Park J 299 0 0.00 0.62 0.00 (0.00, 1.82) 272 0.00 ##Patel R B 30 0 0.00 1.00 0.00 (0.00,11.28) 27 0.00 ##Reich D 73 2 2.74 0.59 4.32 (0.49,15.61) 71 2.83 #Sassower M 634 4 0.63 1.04 0.56 (0.15, 1.44) 567 0.36 ##Schwartz R 1054 10 0.95 1.01 0.87 (0.42, 1.60) 988 0.64 #Witkes D 268 2 0.75 0.60 1.14 (0.13, 4.13) 253 1.07 All Others 138 3 2.17 0.94 2.14 (0.43, 6.26) 105 1.80 TOTAL 4228 29 0.69 0.87 0.73 (0.49, 1.04) 3854 0.58
Statewide Total 159839 1477 0.92 141865 0.63
* Risk-adjustedmortalityratesignificantlyhigherthanstatewideratebasedon95percentconfidenceinterval. ** Risk-adjustedmortalityratesignificantlylowerthanstatewideratebasedon95percentconfidenceinterval. # PerformedproceduresinanotherNewYorkStatehospital.## PerformedproceduresintwoormoreotherNewYorkStatehospitals.
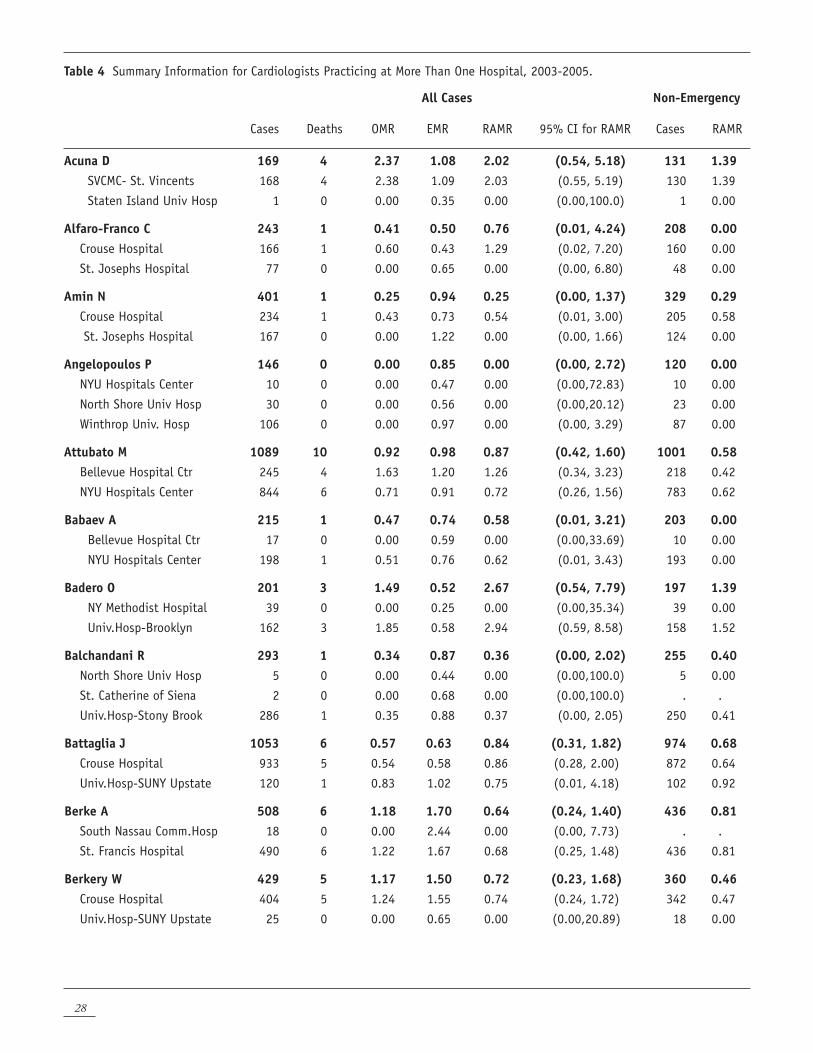
28
Table 4 Summary Information for Cardiologists Practicing at More Than One Hospital, 2003-2005.
All Cases Non-Emergency
Cases Deaths OMR EMR RAMR 95% CI for RAMR Cases RAMR
Acuna D 169 4 2.37 1.08 2.02 (0.54, 5.18) 131 1.39 SVCMC- St. Vincents 168 4 2.38 1.09 2.03 (0.55, 5.19) 130 1.39
Staten Island Univ Hosp 1 0 0.00 0.35 0.00 (0.00,100.0) 1 0.00
Alfaro-Franco C 243 1 0.41 0.50 0.76 (0.01, 4.24) 208 0.00 Crouse Hospital 166 1 0.60 0.43 1.29 (0.02, 7.20) 160 0.00
St. Josephs Hospital 77 0 0.00 0.65 0.00 (0.00, 6.80) 48 0.00
Amin N 401 1 0.25 0.94 0.25 (0.00, 1.37) 329 0.29 Crouse Hospital 234 1 0.43 0.73 0.54 (0.01, 3.00) 205 0.58
St. Josephs Hospital 167 0 0.00 1.22 0.00 (0.00, 1.66) 124 0.00
Angelopoulos P 146 0 0.00 0.85 0.00 (0.00, 2.72) 120 0.00 NYU Hospitals Center 10 0 0.00 0.47 0.00 (0.00,72.83) 10 0.00
North Shore Univ Hosp 30 0 0.00 0.56 0.00 (0.00,20.12) 23 0.00
Winthrop Univ. Hosp 106 0 0.00 0.97 0.00 (0.00, 3.29) 87 0.00
Attubato M 1089 10 0.92 0.98 0.87 (0.42, 1.60) 1001 0.58 Bellevue Hospital Ctr 245 4 1.63 1.20 1.26 (0.34, 3.23) 218 0.42
NYU Hospitals Center 844 6 0.71 0.91 0.72 (0.26, 1.56) 783 0.62
Babaev A 215 1 0.47 0.74 0.58 (0.01, 3.21) 203 0.00 Bellevue Hospital Ctr 17 0 0.00 0.59 0.00 (0.00,33.69) 10 0.00
NYU Hospitals Center 198 1 0.51 0.76 0.62 (0.01, 3.43) 193 0.00
Badero O 201 3 1.49 0.52 2.67 (0.54, 7.79) 197 1.39 NY Methodist Hospital 39 0 0.00 0.25 0.00 (0.00,35.34) 39 0.00
Univ.Hosp-Brooklyn 162 3 1.85 0.58 2.94 (0.59, 8.58) 158 1.52
Balchandani R 293 1 0.34 0.87 0.36 (0.00, 2.02) 255 0.40 North Shore Univ Hosp 5 0 0.00 0.44 0.00 (0.00,100.0) 5 0.00
St. Catherine of Siena 2 0 0.00 0.68 0.00 (0.00,100.0) . .
Univ.Hosp-Stony Brook 286 1 0.35 0.88 0.37 (0.00, 2.05) 250 0.41
Battaglia J 1053 6 0.57 0.63 0.84 (0.31, 1.82) 974 0.68 Crouse Hospital 933 5 0.54 0.58 0.86 (0.28, 2.00) 872 0.64
Univ.Hosp-SUNY Upstate 120 1 0.83 1.02 0.75 (0.01, 4.18) 102 0.92
Berke A 508 6 1.18 1.70 0.64 (0.24, 1.40) 436 0.81 South Nassau Comm.Hosp 18 0 0.00 2.44 0.00 (0.00, 7.73) . .
St. Francis Hospital 490 6 1.22 1.67 0.68 (0.25, 1.48) 436 0.81
Berkery W 429 5 1.17 1.50 0.72 (0.23, 1.68) 360 0.46 Crouse Hospital 404 5 1.24 1.55 0.74 (0.24, 1.72) 342 0.47
Univ.Hosp-SUNY Upstate 25 0 0.00 0.65 0.00 (0.00,20.89) 18 0.00
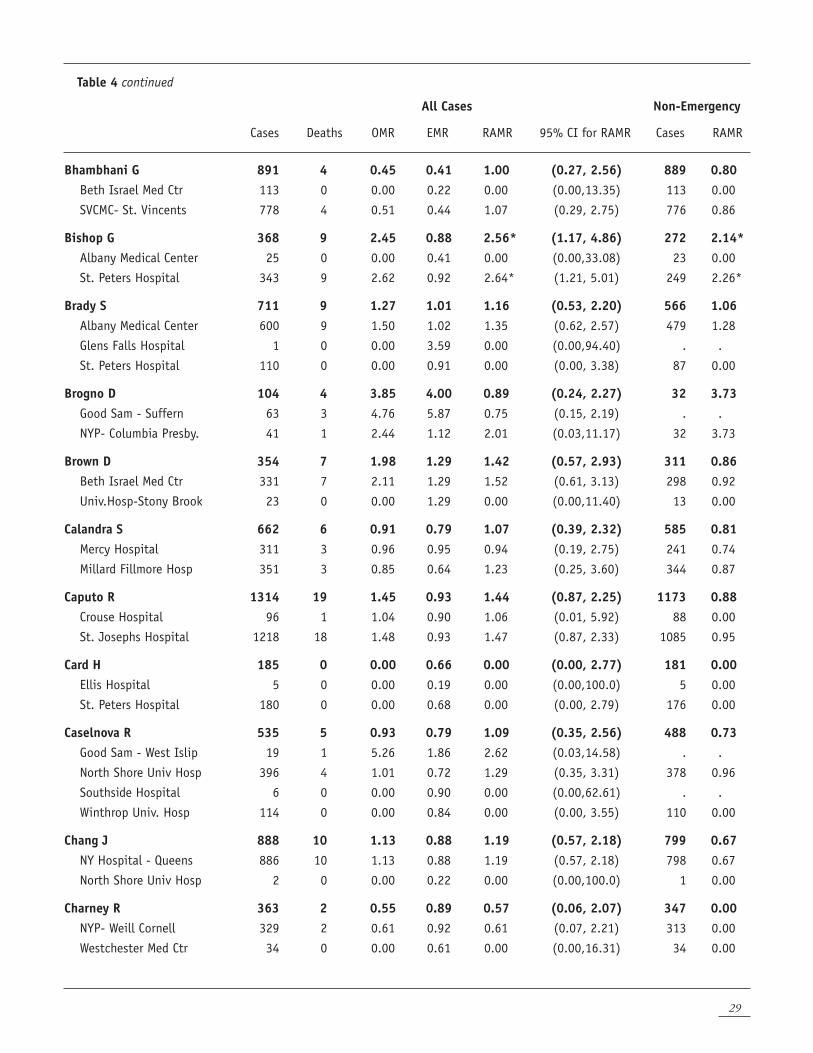
29
Table 4 continued
All Cases Non-Emergency
Cases Deaths OMR EMR RAMR 95% CI for RAMR Cases RAMR
Bhambhani G 891 4 0.45 0.41 1.00 (0.27, 2.56) 889 0.80 Beth Israel Med Ctr 113 0 0.00 0.22 0.00 (0.00,13.35) 113 0.00
SVCMC- St. Vincents 778 4 0.51 0.44 1.07 (0.29, 2.75) 776 0.86
Bishop G 368 9 2.45 0.88 2.56* (1.17, 4.86) 272 2.14* Albany Medical Center 25 0 0.00 0.41 0.00 (0.00,33.08) 23 0.00
St. Peters Hospital 343 9 2.62 0.92 2.64* (1.21, 5.01) 249 2.26*
Brady S 711 9 1.27 1.01 1.16 (0.53, 2.20) 566 1.06 Albany Medical Center 600 9 1.50 1.02 1.35 (0.62, 2.57) 479 1.28
Glens Falls Hospital 1 0 0.00 3.59 0.00 (0.00,94.40) . .
St. Peters Hospital 110 0 0.00 0.91 0.00 (0.00, 3.38) 87 0.00
Brogno D 104 4 3.85 4.00 0.89 (0.24, 2.27) 32 3.73 Good Sam - Suffern 63 3 4.76 5.87 0.75 (0.15, 2.19) . .
NYP- Columbia Presby. 41 1 2.44 1.12 2.01 (0.03,11.17) 32 3.73
Brown D 354 7 1.98 1.29 1.42 (0.57, 2.93) 311 0.86 Beth Israel Med Ctr 331 7 2.11 1.29 1.52 (0.61, 3.13) 298 0.92
Univ.Hosp-Stony Brook 23 0 0.00 1.29 0.00 (0.00,11.40) 13 0.00
Calandra S 662 6 0.91 0.79 1.07 (0.39, 2.32) 585 0.81 Mercy Hospital 311 3 0.96 0.95 0.94 (0.19, 2.75) 241 0.74
Millard Fillmore Hosp 351 3 0.85 0.64 1.23 (0.25, 3.60) 344 0.87
Caputo R 1314 19 1.45 0.93 1.44 (0.87, 2.25) 1173 0.88 Crouse Hospital 96 1 1.04 0.90 1.06 (0.01, 5.92) 88 0.00
St. Josephs Hospital 1218 18 1.48 0.93 1.47 (0.87, 2.33) 1085 0.95
Card H 185 0 0.00 0.66 0.00 (0.00, 2.77) 181 0.00 Ellis Hospital 5 0 0.00 0.19 0.00 (0.00,100.0) 5 0.00
St. Peters Hospital 180 0 0.00 0.68 0.00 (0.00, 2.79) 176 0.00
Caselnova R 535 5 0.93 0.79 1.09 (0.35, 2.56) 488 0.73 Good Sam - West Islip 19 1 5.26 1.86 2.62 (0.03,14.58) . .
North Shore Univ Hosp 396 4 1.01 0.72 1.29 (0.35, 3.31) 378 0.96
Southside Hospital 6 0 0.00 0.90 0.00 (0.00,62.61) . .
Winthrop Univ. Hosp 114 0 0.00 0.84 0.00 (0.00, 3.55) 110 0.00
Chang J 888 10 1.13 0.88 1.19 (0.57, 2.18) 799 0.67 NY Hospital - Queens 886 10 1.13 0.88 1.19 (0.57, 2.18) 798 0.67
North Shore Univ Hosp 2 0 0.00 0.22 0.00 (0.00,100.0) 1 0.00
Charney R 363 2 0.55 0.89 0.57 (0.06, 2.07) 347 0.00 NYP- Weill Cornell 329 2 0.61 0.92 0.61 (0.07, 2.21) 313 0.00
Westchester Med Ctr 34 0 0.00 0.61 0.00 (0.00,16.31) 34 0.00
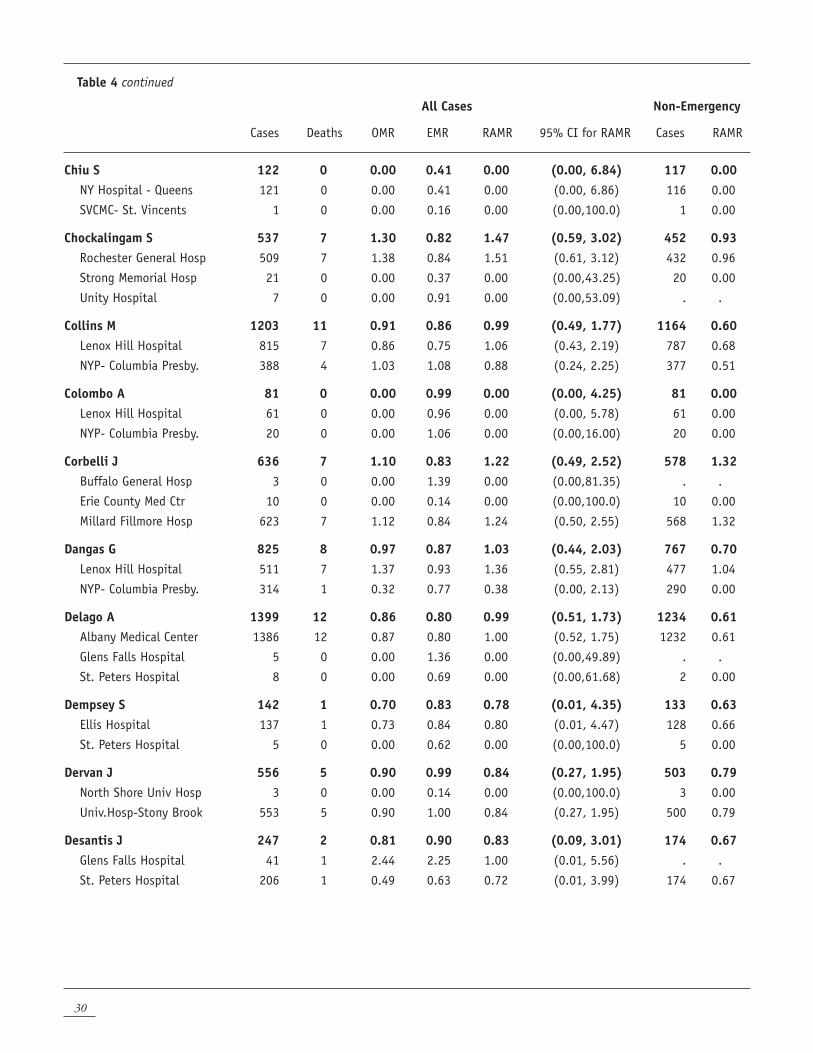
30
Table 4 continued
All Cases Non-Emergency
Cases Deaths OMR EMR RAMR 95% CI for RAMR Cases RAMR
Chiu S 122 0 0.00 0.41 0.00 (0.00, 6.84) 117 0.00 NY Hospital - Queens 121 0 0.00 0.41 0.00 (0.00, 6.86) 116 0.00
SVCMC- St. Vincents 1 0 0.00 0.16 0.00 (0.00,100.0) 1 0.00
Chockalingam S 537 7 1.30 0.82 1.47 (0.59, 3.02) 452 0.93 Rochester General Hosp 509 7 1.38 0.84 1.51 (0.61, 3.12) 432 0.96
Strong Memorial Hosp 21 0 0.00 0.37 0.00 (0.00,43.25) 20 0.00
Unity Hospital 7 0 0.00 0.91 0.00 (0.00,53.09) . .
Collins M 1203 11 0.91 0.86 0.99 (0.49, 1.77) 1164 0.60 Lenox Hill Hospital 815 7 0.86 0.75 1.06 (0.43, 2.19) 787 0.68
NYP- Columbia Presby. 388 4 1.03 1.08 0.88 (0.24, 2.25) 377 0.51
Colombo A 81 0 0.00 0.99 0.00 (0.00, 4.25) 81 0.00 Lenox Hill Hospital 61 0 0.00 0.96 0.00 (0.00, 5.78) 61 0.00
NYP- Columbia Presby. 20 0 0.00 1.06 0.00 (0.00,16.00) 20 0.00
Corbelli J 636 7 1.10 0.83 1.22 (0.49, 2.52) 578 1.32 Buffalo General Hosp 3 0 0.00 1.39 0.00 (0.00,81.35) . .
Erie County Med Ctr 10 0 0.00 0.14 0.00 (0.00,100.0) 10 0.00
Millard Fillmore Hosp 623 7 1.12 0.84 1.24 (0.50, 2.55) 568 1.32
Dangas G 825 8 0.97 0.87 1.03 (0.44, 2.03) 767 0.70 Lenox Hill Hospital 511 7 1.37 0.93 1.36 (0.55, 2.81) 477 1.04
NYP- Columbia Presby. 314 1 0.32 0.77 0.38 (0.00, 2.13) 290 0.00
Delago A 1399 12 0.86 0.80 0.99 (0.51, 1.73) 1234 0.61 Albany Medical Center 1386 12 0.87 0.80 1.00 (0.52, 1.75) 1232 0.61
Glens Falls Hospital 5 0 0.00 1.36 0.00 (0.00,49.89) . .
St. Peters Hospital 8 0 0.00 0.69 0.00 (0.00,61.68) 2 0.00
Dempsey S 142 1 0.70 0.83 0.78 (0.01, 4.35) 133 0.63 Ellis Hospital 137 1 0.73 0.84 0.80 (0.01, 4.47) 128 0.66
St. Peters Hospital 5 0 0.00 0.62 0.00 (0.00,100.0) 5 0.00
Dervan J 556 5 0.90 0.99 0.84 (0.27, 1.95) 503 0.79 North Shore Univ Hosp 3 0 0.00 0.14 0.00 (0.00,100.0) 3 0.00
Univ.Hosp-Stony Brook 553 5 0.90 1.00 0.84 (0.27, 1.95) 500 0.79
Desantis J 247 2 0.81 0.90 0.83 (0.09, 3.01) 174 0.67 Glens Falls Hospital 41 1 2.44 2.25 1.00 (0.01, 5.56) . .
St. Peters Hospital 206 1 0.49 0.63 0.72 (0.01, 3.99) 174 0.67
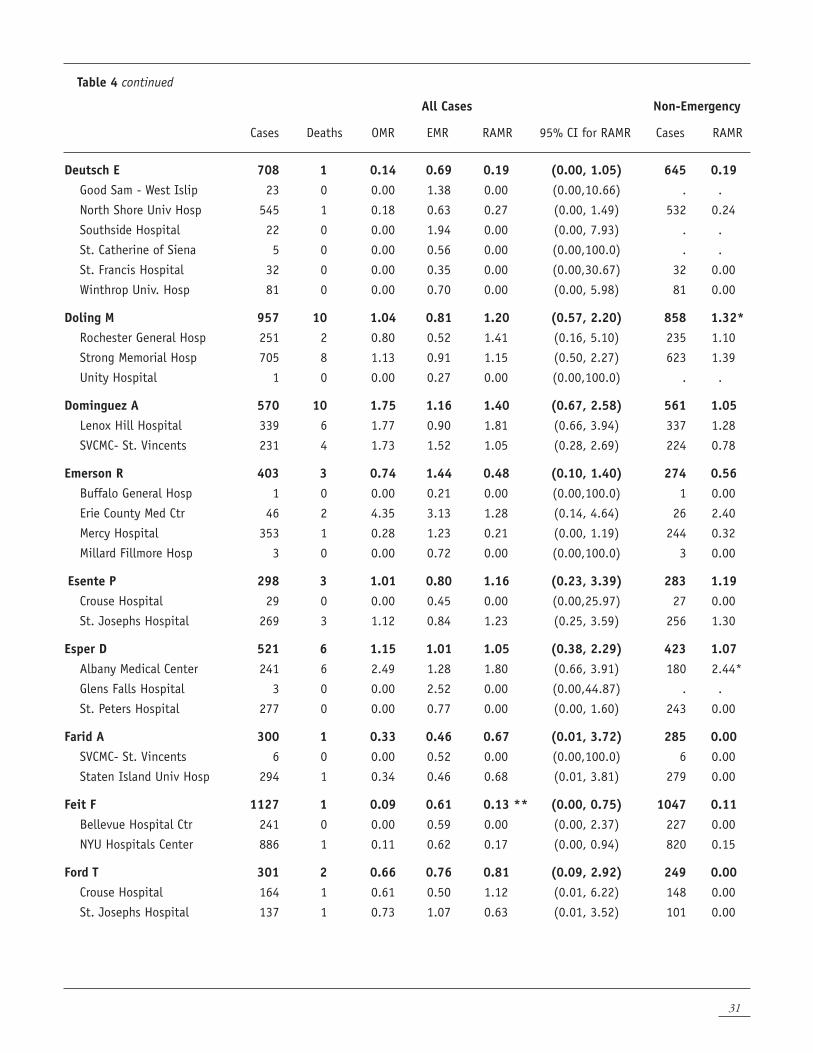
31
Table 4 continued
All Cases Non-Emergency
Cases Deaths OMR EMR RAMR 95% CI for RAMR Cases RAMR
Deutsch E 708 1 0.14 0.69 0.19 (0.00, 1.05) 645 0.19 Good Sam - West Islip 23 0 0.00 1.38 0.00 (0.00,10.66) . .
North Shore Univ Hosp 545 1 0.18 0.63 0.27 (0.00, 1.49) 532 0.24
Southside Hospital 22 0 0.00 1.94 0.00 (0.00, 7.93) . .
St. Catherine of Siena 5 0 0.00 0.56 0.00 (0.00,100.0) . .
St. Francis Hospital 32 0 0.00 0.35 0.00 (0.00,30.67) 32 0.00
Winthrop Univ. Hosp 81 0 0.00 0.70 0.00 (0.00, 5.98) 81 0.00
Doling M 957 10 1.04 0.81 1.20 (0.57, 2.20) 858 1.32* Rochester General Hosp 251 2 0.80 0.52 1.41 (0.16, 5.10) 235 1.10
Strong Memorial Hosp 705 8 1.13 0.91 1.15 (0.50, 2.27) 623 1.39
Unity Hospital 1 0 0.00 0.27 0.00 (0.00,100.0) . .
Dominguez A 570 10 1.75 1.16 1.40 (0.67, 2.58) 561 1.05 Lenox Hill Hospital 339 6 1.77 0.90 1.81 (0.66, 3.94) 337 1.28
SVCMC- St. Vincents 231 4 1.73 1.52 1.05 (0.28, 2.69) 224 0.78
Emerson R 403 3 0.74 1.44 0.48 (0.10, 1.40) 274 0.56 Buffalo General Hosp 1 0 0.00 0.21 0.00 (0.00,100.0) 1 0.00
Erie County Med Ctr 46 2 4.35 3.13 1.28 (0.14, 4.64) 26 2.40
Mercy Hospital 353 1 0.28 1.23 0.21 (0.00, 1.19) 244 0.32
Millard Fillmore Hosp 3 0 0.00 0.72 0.00 (0.00,100.0) 3 0.00
Esente P 298 3 1.01 0.80 1.16 (0.23, 3.39) 283 1.19 Crouse Hospital 29 0 0.00 0.45 0.00 (0.00,25.97) 27 0.00
St. Josephs Hospital 269 3 1.12 0.84 1.23 (0.25, 3.59) 256 1.30
Esper D 521 6 1.15 1.01 1.05 (0.38, 2.29) 423 1.07 Albany Medical Center 241 6 2.49 1.28 1.80 (0.66, 3.91) 180 2.44*
Glens Falls Hospital 3 0 0.00 2.52 0.00 (0.00,44.87) . .
St. Peters Hospital 277 0 0.00 0.77 0.00 (0.00, 1.60) 243 0.00
Farid A 300 1 0.33 0.46 0.67 (0.01, 3.72) 285 0.00 SVCMC- St. Vincents 6 0 0.00 0.52 0.00 (0.00,100.0) 6 0.00
Staten Island Univ Hosp 294 1 0.34 0.46 0.68 (0.01, 3.81) 279 0.00
Feit F 1127 1 0.09 0.61 0.13 ** (0.00, 0.75) 1047 0.11 Bellevue Hospital Ctr 241 0 0.00 0.59 0.00 (0.00, 2.37) 227 0.00
NYU Hospitals Center 886 1 0.11 0.62 0.17 (0.00, 0.94) 820 0.15
Ford T 301 2 0.66 0.76 0.81 (0.09, 2.92) 249 0.00 Crouse Hospital 164 1 0.61 0.50 1.12 (0.01, 6.22) 148 0.00
St. Josephs Hospital 137 1 0.73 1.07 0.63 (0.01, 3.52) 101 0.00
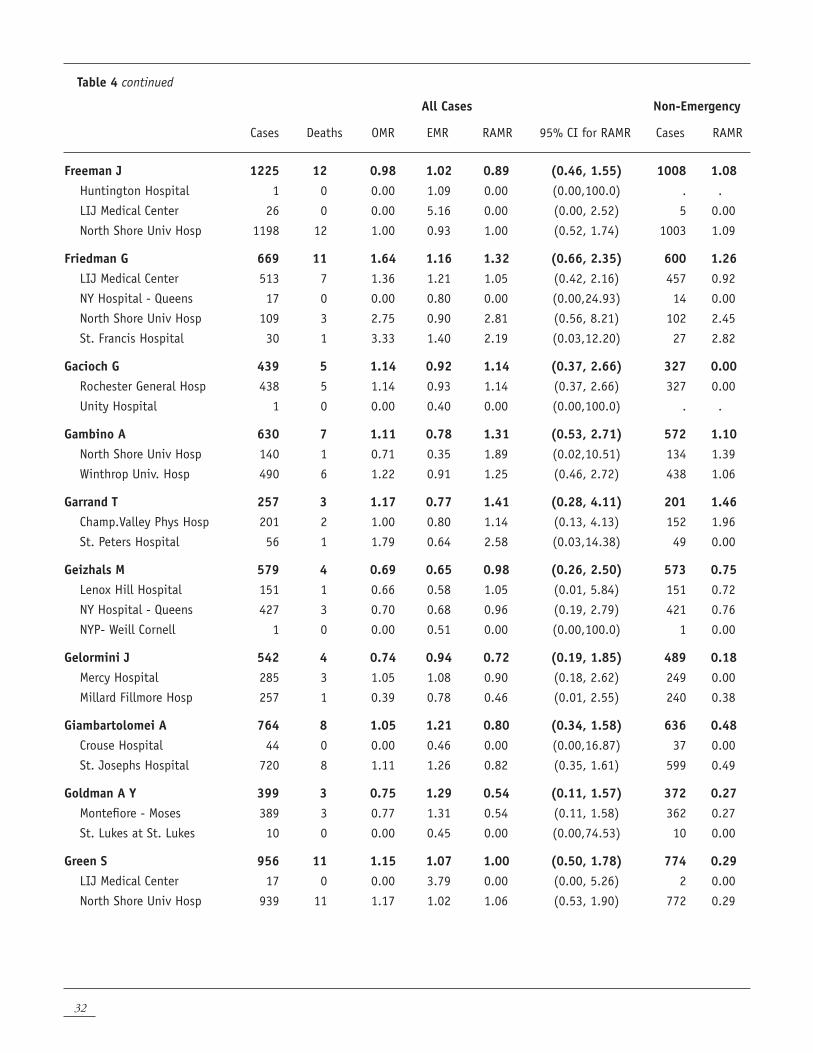
32
Table 4 continued
All Cases Non-Emergency
Cases Deaths OMR EMR RAMR 95% CI for RAMR Cases RAMR
Freeman J 1225 12 0.98 1.02 0.89 (0.46, 1.55) 1008 1.08 Huntington Hospital 1 0 0.00 1.09 0.00 (0.00,100.0) . .
LIJ Medical Center 26 0 0.00 5.16 0.00 (0.00, 2.52) 5 0.00
North Shore Univ Hosp 1198 12 1.00 0.93 1.00 (0.52, 1.74) 1003 1.09
Friedman G 669 11 1.64 1.16 1.32 (0.66, 2.35) 600 1.26 LIJ Medical Center 513 7 1.36 1.21 1.05 (0.42, 2.16) 457 0.92
NY Hospital - Queens 17 0 0.00 0.80 0.00 (0.00,24.93) 14 0.00
North Shore Univ Hosp 109 3 2.75 0.90 2.81 (0.56, 8.21) 102 2.45
St. Francis Hospital 30 1 3.33 1.40 2.19 (0.03,12.20) 27 2.82
Gacioch G 439 5 1.14 0.92 1.14 (0.37, 2.66) 327 0.00 Rochester General Hosp 438 5 1.14 0.93 1.14 (0.37, 2.66) 327 0.00
Unity Hospital 1 0 0.00 0.40 0.00 (0.00,100.0) . .
Gambino A 630 7 1.11 0.78 1.31 (0.53, 2.71) 572 1.10 North Shore Univ Hosp 140 1 0.71 0.35 1.89 (0.02,10.51) 134 1.39
Winthrop Univ. Hosp 490 6 1.22 0.91 1.25 (0.46, 2.72) 438 1.06
Garrand T 257 3 1.17 0.77 1.41 (0.28, 4.11) 201 1.46 Champ.Valley Phys Hosp 201 2 1.00 0.80 1.14 (0.13, 4.13) 152 1.96
St. Peters Hospital 56 1 1.79 0.64 2.58 (0.03,14.38) 49 0.00
Geizhals M 579 4 0.69 0.65 0.98 (0.26, 2.50) 573 0.75 Lenox Hill Hospital 151 1 0.66 0.58 1.05 (0.01, 5.84) 151 0.72
NY Hospital - Queens 427 3 0.70 0.68 0.96 (0.19, 2.79) 421 0.76
NYP- Weill Cornell 1 0 0.00 0.51 0.00 (0.00,100.0) 1 0.00
Gelormini J 542 4 0.74 0.94 0.72 (0.19, 1.85) 489 0.18 Mercy Hospital 285 3 1.05 1.08 0.90 (0.18, 2.62) 249 0.00
Millard Fillmore Hosp 257 1 0.39 0.78 0.46 (0.01, 2.55) 240 0.38
Giambartolomei A 764 8 1.05 1.21 0.80 (0.34, 1.58) 636 0.48 Crouse Hospital 44 0 0.00 0.46 0.00 (0.00,16.87) 37 0.00
St. Josephs Hospital 720 8 1.11 1.26 0.82 (0.35, 1.61) 599 0.49
Goldman A Y 399 3 0.75 1.29 0.54 (0.11, 1.57) 372 0.27 Montefiore - Moses 389 3 0.77 1.31 0.54 (0.11, 1.58) 362 0.27
St. Lukes at St. Lukes 10 0 0.00 0.45 0.00 (0.00,74.53) 10 0.00
Green S 956 11 1.15 1.07 1.00 (0.50, 1.78) 774 0.29 LIJ Medical Center 17 0 0.00 3.79 0.00 (0.00, 5.26) 2 0.00
North Shore Univ Hosp 939 11 1.17 1.02 1.06 (0.53, 1.90) 772 0.29
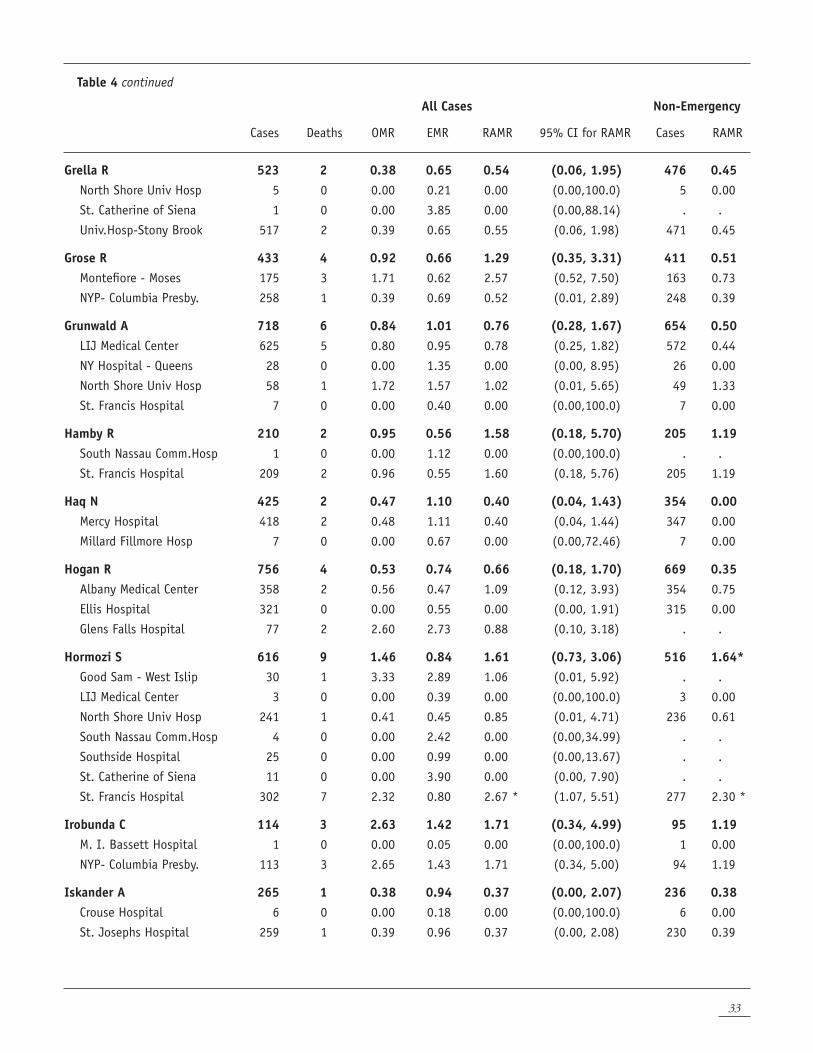
33
Table 4 continued
All Cases Non-Emergency
Cases Deaths OMR EMR RAMR 95% CI for RAMR Cases RAMR
Grella R 523 2 0.38 0.65 0.54 (0.06, 1.95) 476 0.45 North Shore Univ Hosp 5 0 0.00 0.21 0.00 (0.00,100.0) 5 0.00
St. Catherine of Siena 1 0 0.00 3.85 0.00 (0.00,88.14) . .
Univ.Hosp-Stony Brook 517 2 0.39 0.65 0.55 (0.06, 1.98) 471 0.45
Grose R 433 4 0.92 0.66 1.29 (0.35, 3.31) 411 0.51 Montefiore - Moses 175 3 1.71 0.62 2.57 (0.52, 7.50) 163 0.73
NYP- Columbia Presby. 258 1 0.39 0.69 0.52 (0.01, 2.89) 248 0.39
Grunwald A 718 6 0.84 1.01 0.76 (0.28, 1.67) 654 0.50 LIJ Medical Center 625 5 0.80 0.95 0.78 (0.25, 1.82) 572 0.44
NY Hospital - Queens 28 0 0.00 1.35 0.00 (0.00, 8.95) 26 0.00
North Shore Univ Hosp 58 1 1.72 1.57 1.02 (0.01, 5.65) 49 1.33
St. Francis Hospital 7 0 0.00 0.40 0.00 (0.00,100.0) 7 0.00
Hamby R 210 2 0.95 0.56 1.58 (0.18, 5.70) 205 1.19 South Nassau Comm.Hosp 1 0 0.00 1.12 0.00 (0.00,100.0) . .
St. Francis Hospital 209 2 0.96 0.55 1.60 (0.18, 5.76) 205 1.19
Haq N 425 2 0.47 1.10 0.40 (0.04, 1.43) 354 0.00 Mercy Hospital 418 2 0.48 1.11 0.40 (0.04, 1.44) 347 0.00
Millard Fillmore Hosp 7 0 0.00 0.67 0.00 (0.00,72.46) 7 0.00
Hogan R 756 4 0.53 0.74 0.66 (0.18, 1.70) 669 0.35 Albany Medical Center 358 2 0.56 0.47 1.09 (0.12, 3.93) 354 0.75
Ellis Hospital 321 0 0.00 0.55 0.00 (0.00, 1.91) 315 0.00
Glens Falls Hospital 77 2 2.60 2.73 0.88 (0.10, 3.18) . .
Hormozi S 616 9 1.46 0.84 1.61 (0.73, 3.06) 516 1.64* Good Sam - West Islip 30 1 3.33 2.89 1.06 (0.01, 5.92) . .
LIJ Medical Center 3 0 0.00 0.39 0.00 (0.00,100.0) 3 0.00
North Shore Univ Hosp 241 1 0.41 0.45 0.85 (0.01, 4.71) 236 0.61
South Nassau Comm.Hosp 4 0 0.00 2.42 0.00 (0.00,34.99) . .
Southside Hospital 25 0 0.00 0.99 0.00 (0.00,13.67) . .
St. Catherine of Siena 11 0 0.00 3.90 0.00 (0.00, 7.90) . .
St. Francis Hospital 302 7 2.32 0.80 2.67 * (1.07, 5.51) 277 2.30 *
Irobunda C 114 3 2.63 1.42 1.71 (0.34, 4.99) 95 1.19 M. I. Bassett Hospital 1 0 0.00 0.05 0.00 (0.00,100.0) 1 0.00
NYP- Columbia Presby. 113 3 2.65 1.43 1.71 (0.34, 5.00) 94 1.19
Iskander A 265 1 0.38 0.94 0.37 (0.00, 2.07) 236 0.38 Crouse Hospital 6 0 0.00 0.18 0.00 (0.00,100.0) 6 0.00
St. Josephs Hospital 259 1 0.39 0.96 0.37 (0.00, 2.08) 230 0.39
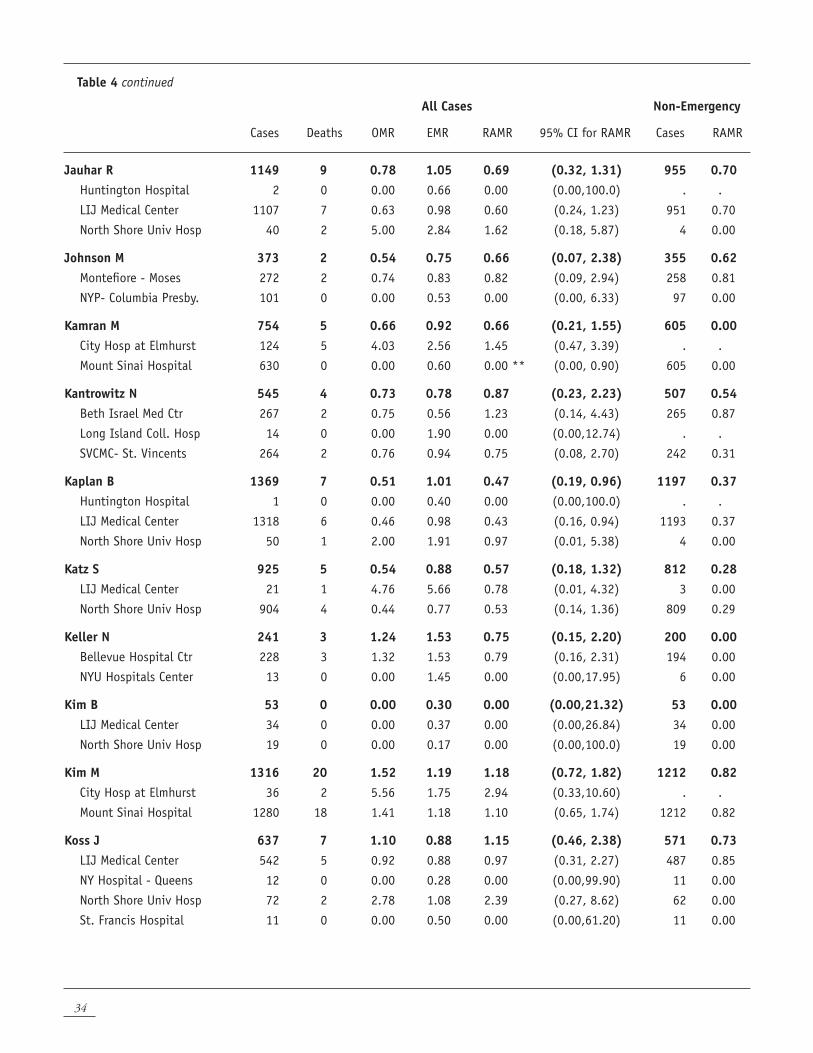
34
Table 4 continued
All Cases Non-Emergency
Cases Deaths OMR EMR RAMR 95% CI for RAMR Cases RAMR
Jauhar R 1149 9 0.78 1.05 0.69 (0.32, 1.31) 955 0.70 Huntington Hospital 2 0 0.00 0.66 0.00 (0.00,100.0) . .
LIJ Medical Center 1107 7 0.63 0.98 0.60 (0.24, 1.23) 951 0.70
North Shore Univ Hosp 40 2 5.00 2.84 1.62 (0.18, 5.87) 4 0.00
Johnson M 373 2 0.54 0.75 0.66 (0.07, 2.38) 355 0.62 Montefiore - Moses 272 2 0.74 0.83 0.82 (0.09, 2.94) 258 0.81
NYP- Columbia Presby. 101 0 0.00 0.53 0.00 (0.00, 6.33) 97 0.00
Kamran M 754 5 0.66 0.92 0.66 (0.21, 1.55) 605 0.00 City Hosp at Elmhurst 124 5 4.03 2.56 1.45 (0.47, 3.39) . .
Mount Sinai Hospital 630 0 0.00 0.60 0.00 ** (0.00, 0.90) 605 0.00
Kantrowitz N 545 4 0.73 0.78 0.87 (0.23, 2.23) 507 0.54 Beth Israel Med Ctr 267 2 0.75 0.56 1.23 (0.14, 4.43) 265 0.87
Long Island Coll. Hosp 14 0 0.00 1.90 0.00 (0.00,12.74) . .
SVCMC- St. Vincents 264 2 0.76 0.94 0.75 (0.08, 2.70) 242 0.31
Kaplan B 1369 7 0.51 1.01 0.47 (0.19, 0.96) 1197 0.37 Huntington Hospital 1 0 0.00 0.40 0.00 (0.00,100.0) . .
LIJ Medical Center 1318 6 0.46 0.98 0.43 (0.16, 0.94) 1193 0.37
North Shore Univ Hosp 50 1 2.00 1.91 0.97 (0.01, 5.38) 4 0.00
Katz S 925 5 0.54 0.88 0.57 (0.18, 1.32) 812 0.28 LIJ Medical Center 21 1 4.76 5.66 0.78 (0.01, 4.32) 3 0.00
North Shore Univ Hosp 904 4 0.44 0.77 0.53 (0.14, 1.36) 809 0.29
Keller N 241 3 1.24 1.53 0.75 (0.15, 2.20) 200 0.00 Bellevue Hospital Ctr 228 3 1.32 1.53 0.79 (0.16, 2.31) 194 0.00
NYU Hospitals Center 13 0 0.00 1.45 0.00 (0.00,17.95) 6 0.00
Kim B 53 0 0.00 0.30 0.00 (0.00,21.32) 53 0.00 LIJ Medical Center 34 0 0.00 0.37 0.00 (0.00,26.84) 34 0.00
North Shore Univ Hosp 19 0 0.00 0.17 0.00 (0.00,100.0) 19 0.00
Kim M 1316 20 1.52 1.19 1.18 (0.72, 1.82) 1212 0.82 City Hosp at Elmhurst 36 2 5.56 1.75 2.94 (0.33,10.60) . .
Mount Sinai Hospital 1280 18 1.41 1.18 1.10 (0.65, 1.74) 1212 0.82
Koss J 637 7 1.10 0.88 1.15 (0.46, 2.38) 571 0.73 LIJ Medical Center 542 5 0.92 0.88 0.97 (0.31, 2.27) 487 0.85
NY Hospital - Queens 12 0 0.00 0.28 0.00 (0.00,99.90) 11 0.00
North Shore Univ Hosp 72 2 2.78 1.08 2.39 (0.27, 8.62) 62 0.00
St. Francis Hospital 11 0 0.00 0.50 0.00 (0.00,61.20) 11 0.00
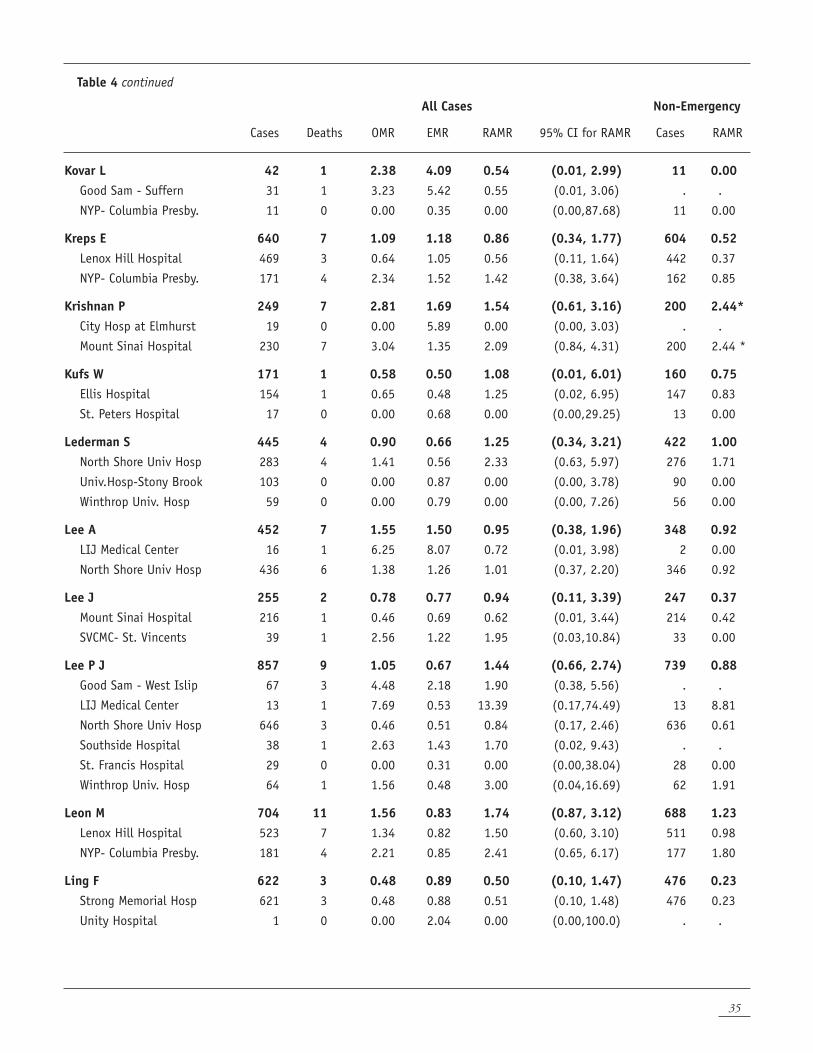
35
Table 4 continued
All Cases Non-Emergency
Cases Deaths OMR EMR RAMR 95% CI for RAMR Cases RAMR
Kovar L 42 1 2.38 4.09 0.54 (0.01, 2.99) 11 0.00 Good Sam - Suffern 31 1 3.23 5.42 0.55 (0.01, 3.06) . .
NYP- Columbia Presby. 11 0 0.00 0.35 0.00 (0.00,87.68) 11 0.00
Kreps E 640 7 1.09 1.18 0.86 (0.34, 1.77) 604 0.52 Lenox Hill Hospital 469 3 0.64 1.05 0.56 (0.11, 1.64) 442 0.37
NYP- Columbia Presby. 171 4 2.34 1.52 1.42 (0.38, 3.64) 162 0.85
Krishnan P 249 7 2.81 1.69 1.54 (0.61, 3.16) 200 2.44* City Hosp at Elmhurst 19 0 0.00 5.89 0.00 (0.00, 3.03) . .
Mount Sinai Hospital 230 7 3.04 1.35 2.09 (0.84, 4.31) 200 2.44 *
Kufs W 171 1 0.58 0.50 1.08 (0.01, 6.01) 160 0.75 Ellis Hospital 154 1 0.65 0.48 1.25 (0.02, 6.95) 147 0.83
St. Peters Hospital 17 0 0.00 0.68 0.00 (0.00,29.25) 13 0.00
Lederman S 445 4 0.90 0.66 1.25 (0.34, 3.21) 422 1.00 North Shore Univ Hosp 283 4 1.41 0.56 2.33 (0.63, 5.97) 276 1.71
Univ.Hosp-Stony Brook 103 0 0.00 0.87 0.00 (0.00, 3.78) 90 0.00
Winthrop Univ. Hosp 59 0 0.00 0.79 0.00 (0.00, 7.26) 56 0.00
Lee A 452 7 1.55 1.50 0.95 (0.38, 1.96) 348 0.92 LIJ Medical Center 16 1 6.25 8.07 0.72 (0.01, 3.98) 2 0.00
North Shore Univ Hosp 436 6 1.38 1.26 1.01 (0.37, 2.20) 346 0.92
Lee J 255 2 0.78 0.77 0.94 (0.11, 3.39) 247 0.37 Mount Sinai Hospital 216 1 0.46 0.69 0.62 (0.01, 3.44) 214 0.42
SVCMC- St. Vincents 39 1 2.56 1.22 1.95 (0.03,10.84) 33 0.00
Lee P J 857 9 1.05 0.67 1.44 (0.66, 2.74) 739 0.88 Good Sam - West Islip 67 3 4.48 2.18 1.90 (0.38, 5.56) . .
LIJ Medical Center 13 1 7.69 0.53 13.39 (0.17,74.49) 13 8.81
North Shore Univ Hosp 646 3 0.46 0.51 0.84 (0.17, 2.46) 636 0.61
Southside Hospital 38 1 2.63 1.43 1.70 (0.02, 9.43) . .
St. Francis Hospital 29 0 0.00 0.31 0.00 (0.00,38.04) 28 0.00
Winthrop Univ. Hosp 64 1 1.56 0.48 3.00 (0.04,16.69) 62 1.91
Leon M 704 11 1.56 0.83 1.74 (0.87, 3.12) 688 1.23 Lenox Hill Hospital 523 7 1.34 0.82 1.50 (0.60, 3.10) 511 0.98
NYP- Columbia Presby. 181 4 2.21 0.85 2.41 (0.65, 6.17) 177 1.80
Ling F 622 3 0.48 0.89 0.50 (0.10, 1.47) 476 0.23 Strong Memorial Hosp 621 3 0.48 0.88 0.51 (0.10, 1.48) 476 0.23
Unity Hospital 1 0 0.00 2.04 0.00 (0.00,100.0) . .
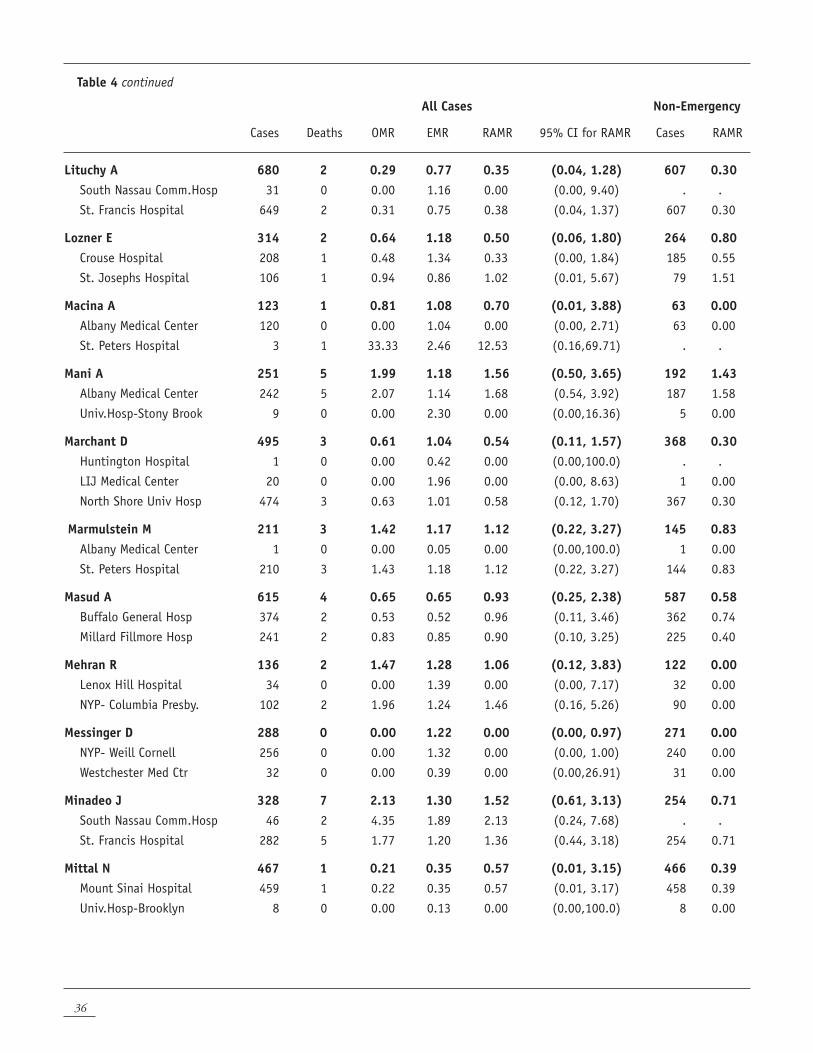
36
Table 4 continued
All Cases Non-Emergency
Cases Deaths OMR EMR RAMR 95% CI for RAMR Cases RAMR
Lituchy A 680 2 0.29 0.77 0.35 (0.04, 1.28) 607 0.30 South Nassau Comm.Hosp 31 0 0.00 1.16 0.00 (0.00, 9.40) . .
St. Francis Hospital 649 2 0.31 0.75 0.38 (0.04, 1.37) 607 0.30
Lozner E 314 2 0.64 1.18 0.50 (0.06, 1.80) 264 0.80 Crouse Hospital 208 1 0.48 1.34 0.33 (0.00, 1.84) 185 0.55
St. Josephs Hospital 106 1 0.94 0.86 1.02 (0.01, 5.67) 79 1.51
Macina A 123 1 0.81 1.08 0.70 (0.01, 3.88) 63 0.00 Albany Medical Center 120 0 0.00 1.04 0.00 (0.00, 2.71) 63 0.00
St. Peters Hospital 3 1 33.33 2.46 12.53 (0.16,69.71) . .
Mani A 251 5 1.99 1.18 1.56 (0.50, 3.65) 192 1.43 Albany Medical Center 242 5 2.07 1.14 1.68 (0.54, 3.92) 187 1.58
Univ.Hosp-Stony Brook 9 0 0.00 2.30 0.00 (0.00,16.36) 5 0.00
Marchant D 495 3 0.61 1.04 0.54 (0.11, 1.57) 368 0.30 Huntington Hospital 1 0 0.00 0.42 0.00 (0.00,100.0) . .
LIJ Medical Center 20 0 0.00 1.96 0.00 (0.00, 8.63) 1 0.00
North Shore Univ Hosp 474 3 0.63 1.01 0.58 (0.12, 1.70) 367 0.30
Marmulstein M 211 3 1.42 1.17 1.12 (0.22, 3.27) 145 0.83 Albany Medical Center 1 0 0.00 0.05 0.00 (0.00,100.0) 1 0.00
St. Peters Hospital 210 3 1.43 1.18 1.12 (0.22, 3.27) 144 0.83
Masud A 615 4 0.65 0.65 0.93 (0.25, 2.38) 587 0.58 Buffalo General Hosp 374 2 0.53 0.52 0.96 (0.11, 3.46) 362 0.74
Millard Fillmore Hosp 241 2 0.83 0.85 0.90 (0.10, 3.25) 225 0.40
Mehran R 136 2 1.47 1.28 1.06 (0.12, 3.83) 122 0.00 Lenox Hill Hospital 34 0 0.00 1.39 0.00 (0.00, 7.17) 32 0.00
NYP- Columbia Presby. 102 2 1.96 1.24 1.46 (0.16, 5.26) 90 0.00
Messinger D 288 0 0.00 1.22 0.00 (0.00, 0.97) 271 0.00 NYP- Weill Cornell 256 0 0.00 1.32 0.00 (0.00, 1.00) 240 0.00
Westchester Med Ctr 32 0 0.00 0.39 0.00 (0.00,26.91) 31 0.00
Minadeo J 328 7 2.13 1.30 1.52 (0.61, 3.13) 254 0.71 South Nassau Comm.Hosp 46 2 4.35 1.89 2.13 (0.24, 7.68) . .
St. Francis Hospital 282 5 1.77 1.20 1.36 (0.44, 3.18) 254 0.71
Mittal N 467 1 0.21 0.35 0.57 (0.01, 3.15) 466 0.39 Mount Sinai Hospital 459 1 0.22 0.35 0.57 (0.01, 3.17) 458 0.39
Univ.Hosp-Brooklyn 8 0 0.00 0.13 0.00 (0.00,100.0) 8 0.00
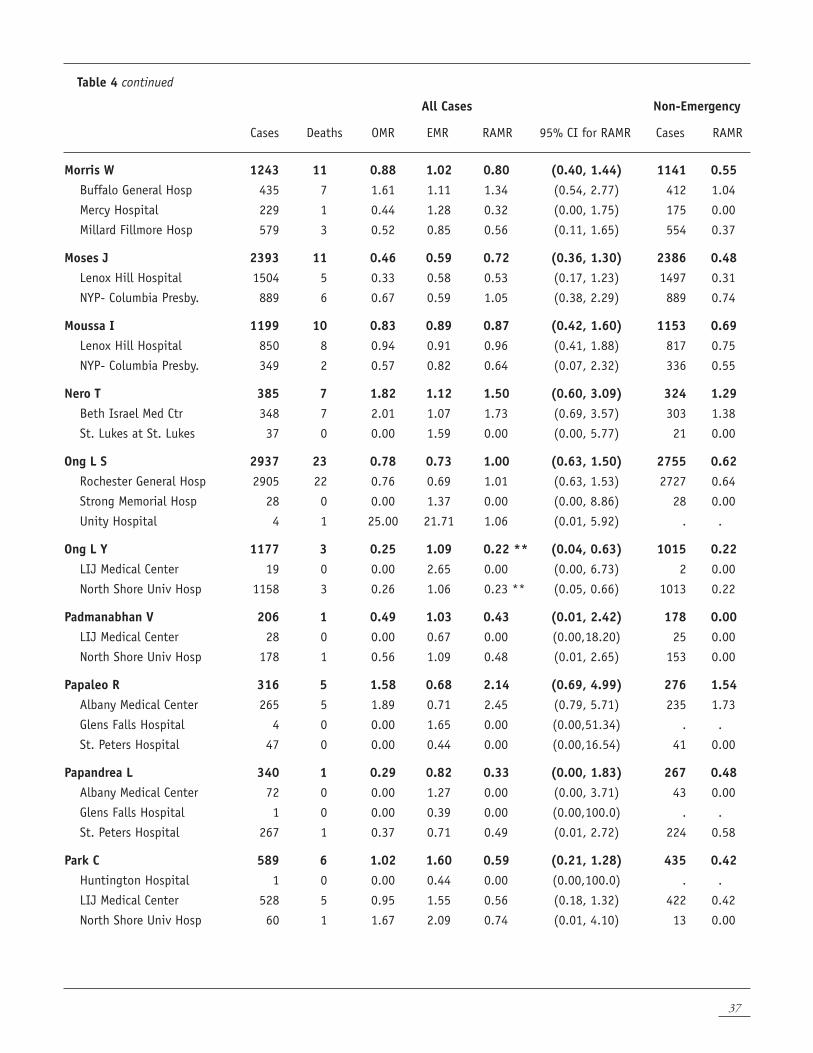
37
Table 4 continued
All Cases Non-Emergency
Cases Deaths OMR EMR RAMR 95% CI for RAMR Cases RAMR
Morris W 1243 11 0.88 1.02 0.80 (0.40, 1.44) 1141 0.55 Buffalo General Hosp 435 7 1.61 1.11 1.34 (0.54, 2.77) 412 1.04
Mercy Hospital 229 1 0.44 1.28 0.32 (0.00, 1.75) 175 0.00
Millard Fillmore Hosp 579 3 0.52 0.85 0.56 (0.11, 1.65) 554 0.37
Moses J 2393 11 0.46 0.59 0.72 (0.36, 1.30) 2386 0.48 Lenox Hill Hospital 1504 5 0.33 0.58 0.53 (0.17, 1.23) 1497 0.31
NYP- Columbia Presby. 889 6 0.67 0.59 1.05 (0.38, 2.29) 889 0.74
Moussa I 1199 10 0.83 0.89 0.87 (0.42, 1.60) 1153 0.69 Lenox Hill Hospital 850 8 0.94 0.91 0.96 (0.41, 1.88) 817 0.75
NYP- Columbia Presby. 349 2 0.57 0.82 0.64 (0.07, 2.32) 336 0.55
Nero T 385 7 1.82 1.12 1.50 (0.60, 3.09) 324 1.29 Beth Israel Med Ctr 348 7 2.01 1.07 1.73 (0.69, 3.57) 303 1.38
St. Lukes at St. Lukes 37 0 0.00 1.59 0.00 (0.00, 5.77) 21 0.00
Ong L S 2937 23 0.78 0.73 1.00 (0.63, 1.50) 2755 0.62 Rochester General Hosp 2905 22 0.76 0.69 1.01 (0.63, 1.53) 2727 0.64
Strong Memorial Hosp 28 0 0.00 1.37 0.00 (0.00, 8.86) 28 0.00
Unity Hospital 4 1 25.00 21.71 1.06 (0.01, 5.92) . .
Ong L Y 1177 3 0.25 1.09 0.22 ** (0.04, 0.63) 1015 0.22 LIJ Medical Center 19 0 0.00 2.65 0.00 (0.00, 6.73) 2 0.00
North Shore Univ Hosp 1158 3 0.26 1.06 0.23 ** (0.05, 0.66) 1013 0.22
Padmanabhan V 206 1 0.49 1.03 0.43 (0.01, 2.42) 178 0.00 LIJ Medical Center 28 0 0.00 0.67 0.00 (0.00,18.20) 25 0.00
North Shore Univ Hosp 178 1 0.56 1.09 0.48 (0.01, 2.65) 153 0.00
Papaleo R 316 5 1.58 0.68 2.14 (0.69, 4.99) 276 1.54 Albany Medical Center 265 5 1.89 0.71 2.45 (0.79, 5.71) 235 1.73
Glens Falls Hospital 4 0 0.00 1.65 0.00 (0.00,51.34) . .
St. Peters Hospital 47 0 0.00 0.44 0.00 (0.00,16.54) 41 0.00
Papandrea L 340 1 0.29 0.82 0.33 (0.00, 1.83) 267 0.48 Albany Medical Center 72 0 0.00 1.27 0.00 (0.00, 3.71) 43 0.00
Glens Falls Hospital 1 0 0.00 0.39 0.00 (0.00,100.0) . .
St. Peters Hospital 267 1 0.37 0.71 0.49 (0.01, 2.72) 224 0.58
Park C 589 6 1.02 1.60 0.59 (0.21, 1.28) 435 0.42 Huntington Hospital 1 0 0.00 0.44 0.00 (0.00,100.0) . .
LIJ Medical Center 528 5 0.95 1.55 0.56 (0.18, 1.32) 422 0.42
North Shore Univ Hosp 60 1 1.67 2.09 0.74 (0.01, 4.10) 13 0.00
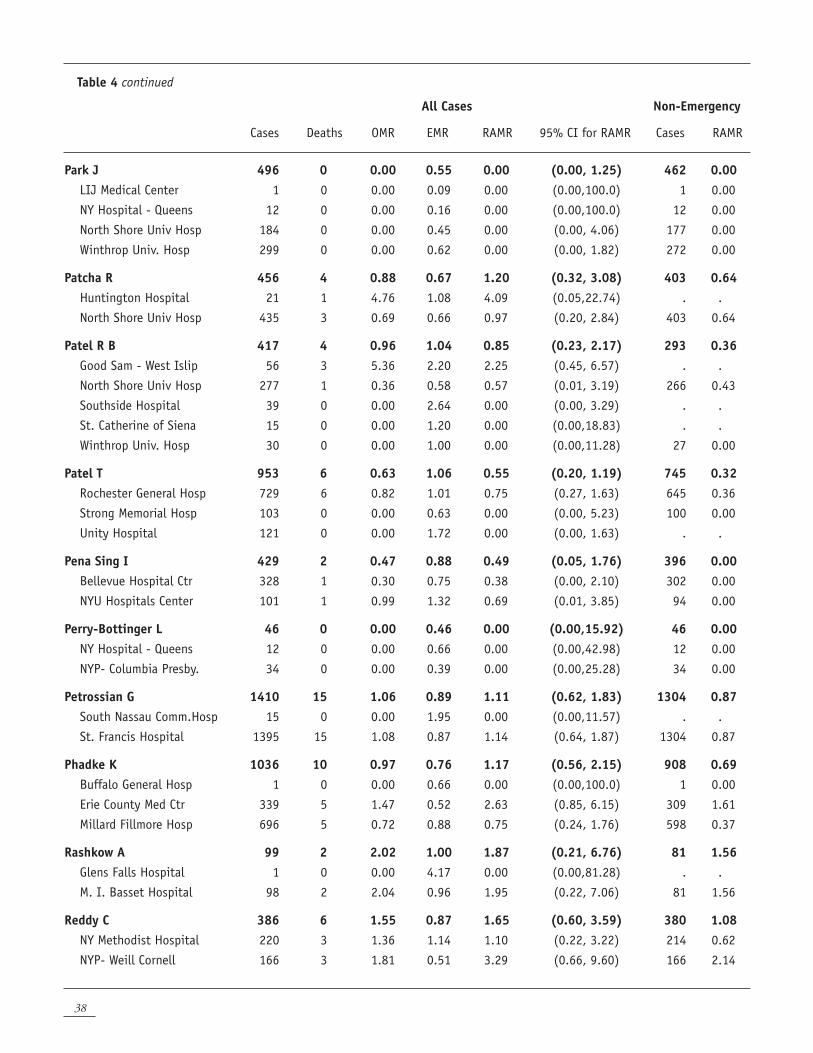
38
Table 4 continued
All Cases Non-Emergency
Cases Deaths OMR EMR RAMR 95% CI for RAMR Cases RAMR
Park J 496 0 0.00 0.55 0.00 (0.00, 1.25) 462 0.00 LIJ Medical Center 1 0 0.00 0.09 0.00 (0.00,100.0) 1 0.00
NY Hospital - Queens 12 0 0.00 0.16 0.00 (0.00,100.0) 12 0.00
North Shore Univ Hosp 184 0 0.00 0.45 0.00 (0.00, 4.06) 177 0.00
Winthrop Univ. Hosp 299 0 0.00 0.62 0.00 (0.00, 1.82) 272 0.00
Patcha R 456 4 0.88 0.67 1.20 (0.32, 3.08) 403 0.64 Huntington Hospital 21 1 4.76 1.08 4.09 (0.05,22.74) . .
North Shore Univ Hosp 435 3 0.69 0.66 0.97 (0.20, 2.84) 403 0.64
Patel R B 417 4 0.96 1.04 0.85 (0.23, 2.17) 293 0.36 Good Sam - West Islip 56 3 5.36 2.20 2.25 (0.45, 6.57) . .
North Shore Univ Hosp 277 1 0.36 0.58 0.57 (0.01, 3.19) 266 0.43
Southside Hospital 39 0 0.00 2.64 0.00 (0.00, 3.29) . .
St. Catherine of Siena 15 0 0.00 1.20 0.00 (0.00,18.83) . .
Winthrop Univ. Hosp 30 0 0.00 1.00 0.00 (0.00,11.28) 27 0.00
Patel T 953 6 0.63 1.06 0.55 (0.20, 1.19) 745 0.32 Rochester General Hosp 729 6 0.82 1.01 0.75 (0.27, 1.63) 645 0.36
Strong Memorial Hosp 103 0 0.00 0.63 0.00 (0.00, 5.23) 100 0.00
Unity Hospital 121 0 0.00 1.72 0.00 (0.00, 1.63) . .
Pena Sing I 429 2 0.47 0.88 0.49 (0.05, 1.76) 396 0.00 Bellevue Hospital Ctr 328 1 0.30 0.75 0.38 (0.00, 2.10) 302 0.00
NYU Hospitals Center 101 1 0.99 1.32 0.69 (0.01, 3.85) 94 0.00
Perry-Bottinger L 46 0 0.00 0.46 0.00 (0.00,15.92) 46 0.00 NY Hospital - Queens 12 0 0.00 0.66 0.00 (0.00,42.98) 12 0.00
NYP- Columbia Presby. 34 0 0.00 0.39 0.00 (0.00,25.28) 34 0.00
Petrossian G 1410 15 1.06 0.89 1.11 (0.62, 1.83) 1304 0.87 South Nassau Comm.Hosp 15 0 0.00 1.95 0.00 (0.00,11.57) . .
St. Francis Hospital 1395 15 1.08 0.87 1.14 (0.64, 1.87) 1304 0.87
Phadke K 1036 10 0.97 0.76 1.17 (0.56, 2.15) 908 0.69 Buffalo General Hosp 1 0 0.00 0.66 0.00 (0.00,100.0) 1 0.00
Erie County Med Ctr 339 5 1.47 0.52 2.63 (0.85, 6.15) 309 1.61
Millard Fillmore Hosp 696 5 0.72 0.88 0.75 (0.24, 1.76) 598 0.37
Rashkow A 99 2 2.02 1.00 1.87 (0.21, 6.76) 81 1.56 Glens Falls Hospital 1 0 0.00 4.17 0.00 (0.00,81.28) . .
M. I. Basset Hospital 98 2 2.04 0.96 1.95 (0.22, 7.06) 81 1.56
Reddy C 386 6 1.55 0.87 1.65 (0.60, 3.59) 380 1.08 NY Methodist Hospital 220 3 1.36 1.14 1.10 (0.22, 3.22) 214 0.62
NYP- Weill Cornell 166 3 1.81 0.51 3.29 (0.66, 9.60) 166 2.14
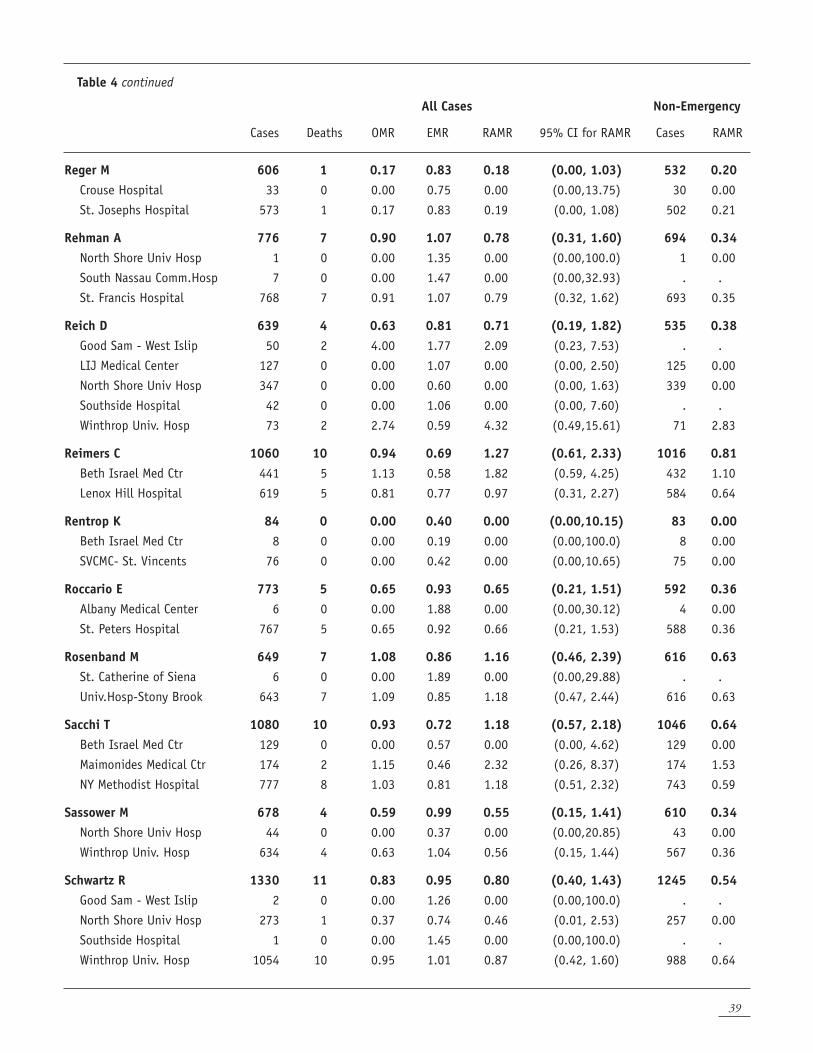
39
Table 4 continued
All Cases Non-Emergency
Cases Deaths OMR EMR RAMR 95% CI for RAMR Cases RAMR
Reger M 606 1 0.17 0.83 0.18 (0.00, 1.03) 532 0.20 Crouse Hospital 33 0 0.00 0.75 0.00 (0.00,13.75) 30 0.00
St. Josephs Hospital 573 1 0.17 0.83 0.19 (0.00, 1.08) 502 0.21
Rehman A 776 7 0.90 1.07 0.78 (0.31, 1.60) 694 0.34 North Shore Univ Hosp 1 0 0.00 1.35 0.00 (0.00,100.0) 1 0.00
South Nassau Comm.Hosp 7 0 0.00 1.47 0.00 (0.00,32.93) . .
St. Francis Hospital 768 7 0.91 1.07 0.79 (0.32, 1.62) 693 0.35
Reich D 639 4 0.63 0.81 0.71 (0.19, 1.82) 535 0.38 Good Sam - West Islip 50 2 4.00 1.77 2.09 (0.23, 7.53) . .
LIJ Medical Center 127 0 0.00 1.07 0.00 (0.00, 2.50) 125 0.00
North Shore Univ Hosp 347 0 0.00 0.60 0.00 (0.00, 1.63) 339 0.00
Southside Hospital 42 0 0.00 1.06 0.00 (0.00, 7.60) . .
Winthrop Univ. Hosp 73 2 2.74 0.59 4.32 (0.49,15.61) 71 2.83
Reimers C 1060 10 0.94 0.69 1.27 (0.61, 2.33) 1016 0.81 Beth Israel Med Ctr 441 5 1.13 0.58 1.82 (0.59, 4.25) 432 1.10
Lenox Hill Hospital 619 5 0.81 0.77 0.97 (0.31, 2.27) 584 0.64
Rentrop K 84 0 0.00 0.40 0.00 (0.00,10.15) 83 0.00 Beth Israel Med Ctr 8 0 0.00 0.19 0.00 (0.00,100.0) 8 0.00
SVCMC- St. Vincents 76 0 0.00 0.42 0.00 (0.00,10.65) 75 0.00
Roccario E 773 5 0.65 0.93 0.65 (0.21, 1.51) 592 0.36 Albany Medical Center 6 0 0.00 1.88 0.00 (0.00,30.12) 4 0.00
St. Peters Hospital 767 5 0.65 0.92 0.66 (0.21, 1.53) 588 0.36
Rosenband M 649 7 1.08 0.86 1.16 (0.46, 2.39) 616 0.63 St. Catherine of Siena 6 0 0.00 1.89 0.00 (0.00,29.88) . .
Univ.Hosp-Stony Brook 643 7 1.09 0.85 1.18 (0.47, 2.44) 616 0.63
Sacchi T 1080 10 0.93 0.72 1.18 (0.57, 2.18) 1046 0.64 Beth Israel Med Ctr 129 0 0.00 0.57 0.00 (0.00, 4.62) 129 0.00
Maimonides Medical Ctr 174 2 1.15 0.46 2.32 (0.26, 8.37) 174 1.53
NY Methodist Hospital 777 8 1.03 0.81 1.18 (0.51, 2.32) 743 0.59
Sassower M 678 4 0.59 0.99 0.55 (0.15, 1.41) 610 0.34 North Shore Univ Hosp 44 0 0.00 0.37 0.00 (0.00,20.85) 43 0.00
Winthrop Univ. Hosp 634 4 0.63 1.04 0.56 (0.15, 1.44) 567 0.36
Schwartz R 1330 11 0.83 0.95 0.80 (0.40, 1.43) 1245 0.54 Good Sam - West Islip 2 0 0.00 1.26 0.00 (0.00,100.0) . .
North Shore Univ Hosp 273 1 0.37 0.74 0.46 (0.01, 2.53) 257 0.00
Southside Hospital 1 0 0.00 1.45 0.00 (0.00,100.0) . .
Winthrop Univ. Hosp 1054 10 0.95 1.01 0.87 (0.42, 1.60) 988 0.64
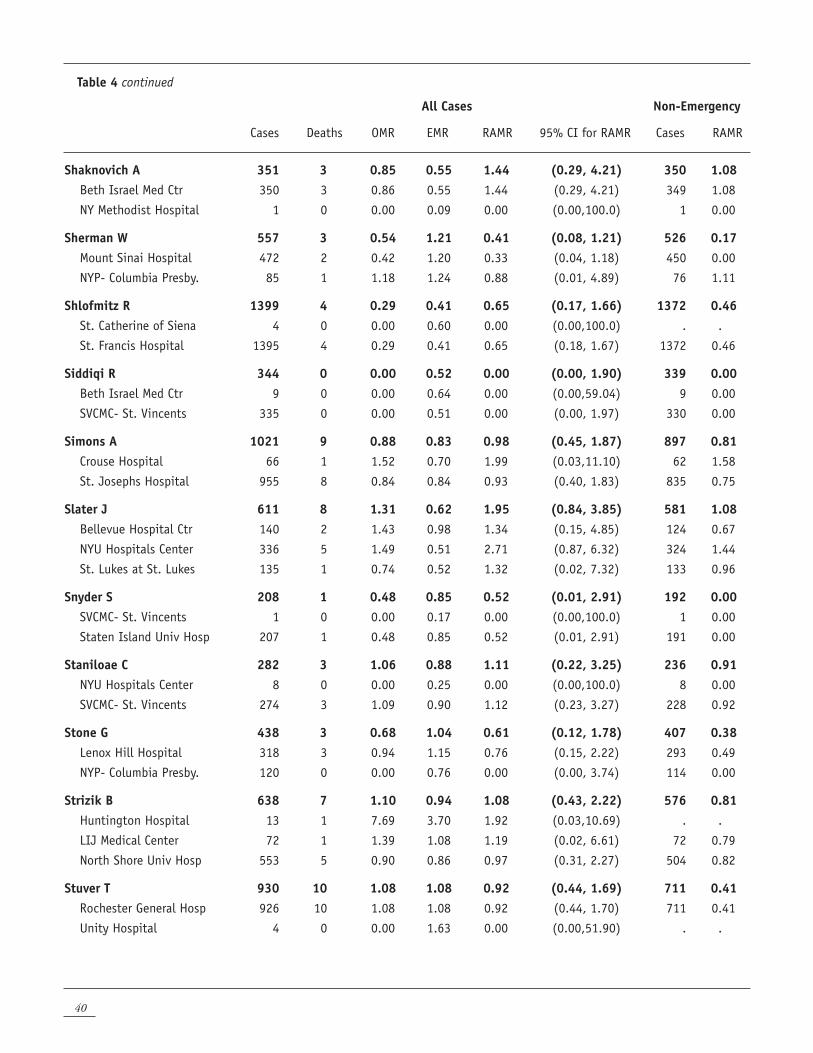
40
Table 4 continued
All Cases Non-Emergency
Cases Deaths OMR EMR RAMR 95% CI for RAMR Cases RAMR
Shaknovich A 351 3 0.85 0.55 1.44 (0.29, 4.21) 350 1.08 Beth Israel Med Ctr 350 3 0.86 0.55 1.44 (0.29, 4.21) 349 1.08
NY Methodist Hospital 1 0 0.00 0.09 0.00 (0.00,100.0) 1 0.00
Sherman W 557 3 0.54 1.21 0.41 (0.08, 1.21) 526 0.17 Mount Sinai Hospital 472 2 0.42 1.20 0.33 (0.04, 1.18) 450 0.00
NYP- Columbia Presby. 85 1 1.18 1.24 0.88 (0.01, 4.89) 76 1.11
Shlofmitz R 1399 4 0.29 0.41 0.65 (0.17, 1.66) 1372 0.46 St. Catherine of Siena 4 0 0.00 0.60 0.00 (0.00,100.0) . .
St. Francis Hospital 1395 4 0.29 0.41 0.65 (0.18, 1.67) 1372 0.46
Siddiqi R 344 0 0.00 0.52 0.00 (0.00, 1.90) 339 0.00 Beth Israel Med Ctr 9 0 0.00 0.64 0.00 (0.00,59.04) 9 0.00
SVCMC- St. Vincents 335 0 0.00 0.51 0.00 (0.00, 1.97) 330 0.00
Simons A 1021 9 0.88 0.83 0.98 (0.45, 1.87) 897 0.81 Crouse Hospital 66 1 1.52 0.70 1.99 (0.03,11.10) 62 1.58
St. Josephs Hospital 955 8 0.84 0.84 0.93 (0.40, 1.83) 835 0.75
Slater J 611 8 1.31 0.62 1.95 (0.84, 3.85) 581 1.08 Bellevue Hospital Ctr 140 2 1.43 0.98 1.34 (0.15, 4.85) 124 0.67
NYU Hospitals Center 336 5 1.49 0.51 2.71 (0.87, 6.32) 324 1.44
St. Lukes at St. Lukes 135 1 0.74 0.52 1.32 (0.02, 7.32) 133 0.96
Snyder S 208 1 0.48 0.85 0.52 (0.01, 2.91) 192 0.00 SVCMC- St. Vincents 1 0 0.00 0.17 0.00 (0.00,100.0) 1 0.00
Staten Island Univ Hosp 207 1 0.48 0.85 0.52 (0.01, 2.91) 191 0.00
Staniloae C 282 3 1.06 0.88 1.11 (0.22, 3.25) 236 0.91 NYU Hospitals Center 8 0 0.00 0.25 0.00 (0.00,100.0) 8 0.00
SVCMC- St. Vincents 274 3 1.09 0.90 1.12 (0.23, 3.27) 228 0.92
Stone G 438 3 0.68 1.04 0.61 (0.12, 1.78) 407 0.38 Lenox Hill Hospital 318 3 0.94 1.15 0.76 (0.15, 2.22) 293 0.49
NYP- Columbia Presby. 120 0 0.00 0.76 0.00 (0.00, 3.74) 114 0.00
Strizik B 638 7 1.10 0.94 1.08 (0.43, 2.22) 576 0.81 Huntington Hospital 13 1 7.69 3.70 1.92 (0.03,10.69) . .
LIJ Medical Center 72 1 1.39 1.08 1.19 (0.02, 6.61) 72 0.79
North Shore Univ Hosp 553 5 0.90 0.86 0.97 (0.31, 2.27) 504 0.82
Stuver T 930 10 1.08 1.08 0.92 (0.44, 1.69) 711 0.41 Rochester General Hosp 926 10 1.08 1.08 0.92 (0.44, 1.70) 711 0.41
Unity Hospital 4 0 0.00 1.63 0.00 (0.00,51.90) . .
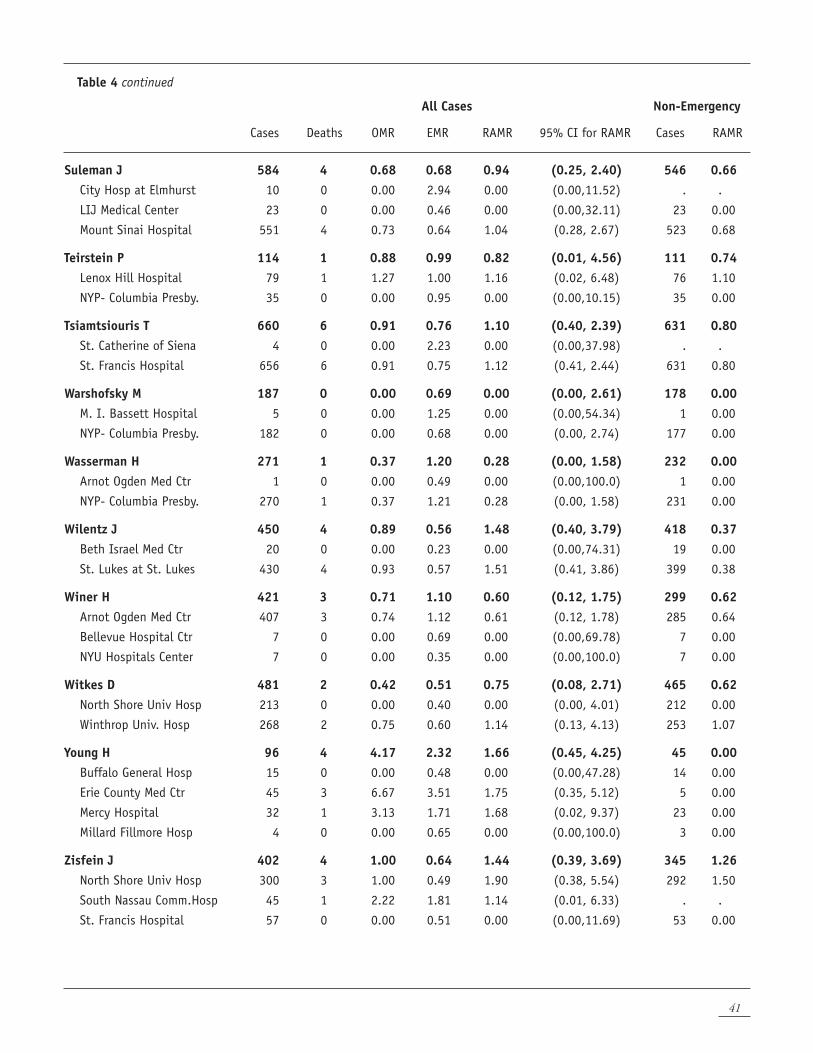
41
Table 4 continued
All Cases Non-Emergency
Cases Deaths OMR EMR RAMR 95% CI for RAMR Cases RAMR
Suleman J 584 4 0.68 0.68 0.94 (0.25, 2.40) 546 0.66 City Hosp at Elmhurst 10 0 0.00 2.94 0.00 (0.00,11.52) . .
LIJ Medical Center 23 0 0.00 0.46 0.00 (0.00,32.11) 23 0.00
Mount Sinai Hospital 551 4 0.73 0.64 1.04 (0.28, 2.67) 523 0.68
Teirstein P 114 1 0.88 0.99 0.82 (0.01, 4.56) 111 0.74 Lenox Hill Hospital 79 1 1.27 1.00 1.16 (0.02, 6.48) 76 1.10
NYP- Columbia Presby. 35 0 0.00 0.95 0.00 (0.00,10.15) 35 0.00
Tsiamtsiouris T 660 6 0.91 0.76 1.10 (0.40, 2.39) 631 0.80 St. Catherine of Siena 4 0 0.00 2.23 0.00 (0.00,37.98) . .
St. Francis Hospital 656 6 0.91 0.75 1.12 (0.41, 2.44) 631 0.80
Warshofsky M 187 0 0.00 0.69 0.00 (0.00, 2.61) 178 0.00 M. I. Bassett Hospital 5 0 0.00 1.25 0.00 (0.00,54.34) 1 0.00
NYP- Columbia Presby. 182 0 0.00 0.68 0.00 (0.00, 2.74) 177 0.00
Wasserman H 271 1 0.37 1.20 0.28 (0.00, 1.58) 232 0.00 Arnot Ogden Med Ctr 1 0 0.00 0.49 0.00 (0.00,100.0) 1 0.00
NYP- Columbia Presby. 270 1 0.37 1.21 0.28 (0.00, 1.58) 231 0.00
Wilentz J 450 4 0.89 0.56 1.48 (0.40, 3.79) 418 0.37 Beth Israel Med Ctr 20 0 0.00 0.23 0.00 (0.00,74.31) 19 0.00
St. Lukes at St. Lukes 430 4 0.93 0.57 1.51 (0.41, 3.86) 399 0.38
Winer H 421 3 0.71 1.10 0.60 (0.12, 1.75) 299 0.62 Arnot Ogden Med Ctr 407 3 0.74 1.12 0.61 (0.12, 1.78) 285 0.64
Bellevue Hospital Ctr 7 0 0.00 0.69 0.00 (0.00,69.78) 7 0.00
NYU Hospitals Center 7 0 0.00 0.35 0.00 (0.00,100.0) 7 0.00
Witkes D 481 2 0.42 0.51 0.75 (0.08, 2.71) 465 0.62 North Shore Univ Hosp 213 0 0.00 0.40 0.00 (0.00, 4.01) 212 0.00
Winthrop Univ. Hosp 268 2 0.75 0.60 1.14 (0.13, 4.13) 253 1.07
Young H 96 4 4.17 2.32 1.66 (0.45, 4.25) 45 0.00 Buffalo General Hosp 15 0 0.00 0.48 0.00 (0.00,47.28) 14 0.00
Erie County Med Ctr 45 3 6.67 3.51 1.75 (0.35, 5.12) 5 0.00
Mercy Hospital 32 1 3.13 1.71 1.68 (0.02, 9.37) 23 0.00
Millard Fillmore Hosp 4 0 0.00 0.65 0.00 (0.00,100.0) 3 0.00
Zisfein J 402 4 1.00 0.64 1.44 (0.39, 3.69) 345 1.26 North Shore Univ Hosp 300 3 1.00 0.49 1.90 (0.38, 5.54) 292 1.50
South Nassau Comm.Hosp 45 1 2.22 1.81 1.14 (0.01, 6.33) . .
St. Francis Hospital 57 0 0.00 0.51 0.00 (0.00,11.69) 53 0.00
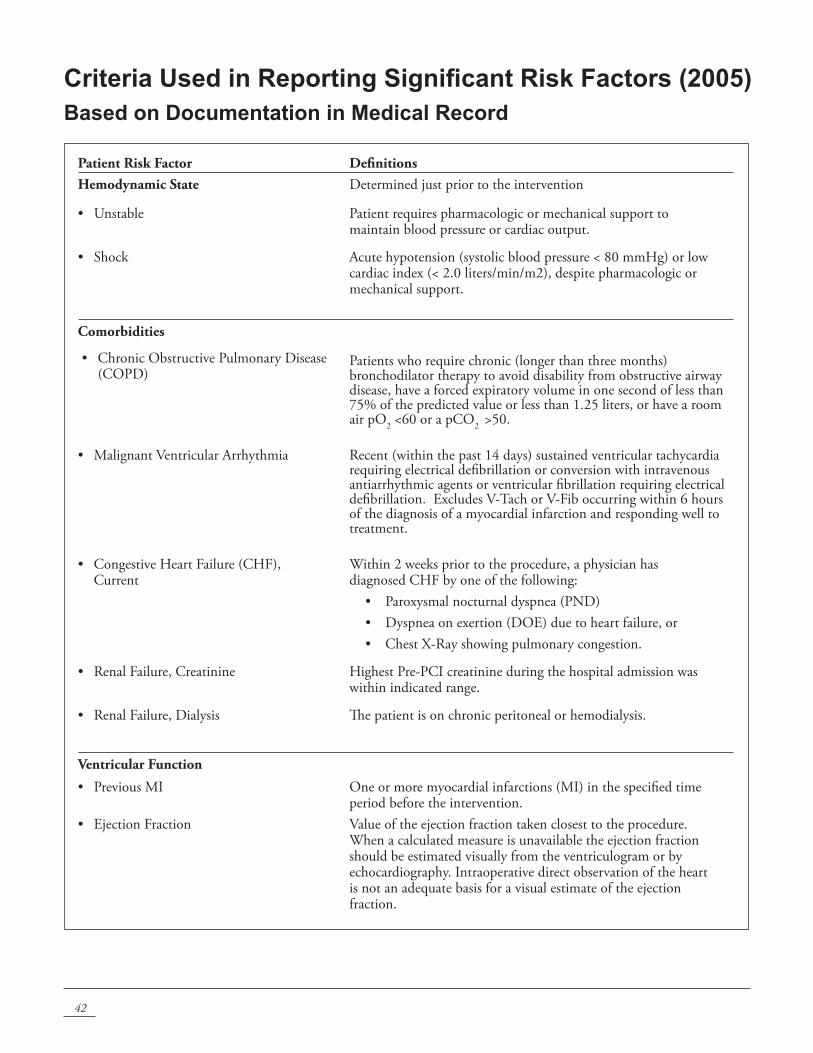
42
Criteria Used in Reporting Significant Risk Factors (2005)Based on Documentation in Medical Record
Patient Risk Factor DefinitionsHemodynamic State Determined just prior to the intervention
• Unstable Patient requires pharmacologic or mechanical support to maintain blood pressure or cardiac output.
• Shock Acute hypotension (systolic blood pressure < 80 mmHg) or low cardiac index (< 2.0 liters/min/m2), despite pharmacologic or mechanical support.
Comorbidities
• ChronicObstructivePulmonaryDisease(COPD)
Patients who require chronic (longer than three months) bronchodilator therapy to avoid disability from obstructive airway disease, have a forced expiratory volume in one second of less than 75% of the predicted value or less than 1.25 liters, or have a room air pO2 <60 or a pCO2 >50.
• Malignant Ventricular Arrhythmia Recent (within the past 14 days) sustained ventricular tachycardia requiring electrical defibrillation or conversion with intravenous antiarrhythmic agents or ventricular fibrillation requiring electrical defibrillation. Excludes V-Tach or V-Fib occurring within 6 hours of the diagnosis of a myocardial infarction and responding well to treatment.
• CongestiveHeartFailure(CHF), Current
Within 2 weeks prior to the procedure, a physician has diagnosed CHF by one of the following:
• Paroxysmalnocturnaldyspnea(PND)• Dyspneaonexertion(DOE)duetoheartfailure,or• ChestX-Rayshowingpulmonarycongestion.
• RenalFailure,Creatinine Highest Pre-PCI creatinine during the hospital admission was within indicated range.
• RenalFailure,Dialysis The patient is on chronic peritoneal or hemodialysis.
Ventricular Function
• PreviousMI One or more myocardial infarctions (MI) in the specified time period before the intervention.
• EjectionFraction Value of the ejection fraction taken closest to the procedure. When a calculated measure is unavailable the ejection fraction should be estimated visually from the ventriculogram or by echocardiography. Intraoperative direct observation of the heart is not an adequate basis for a visual estimate of the ejection fraction.
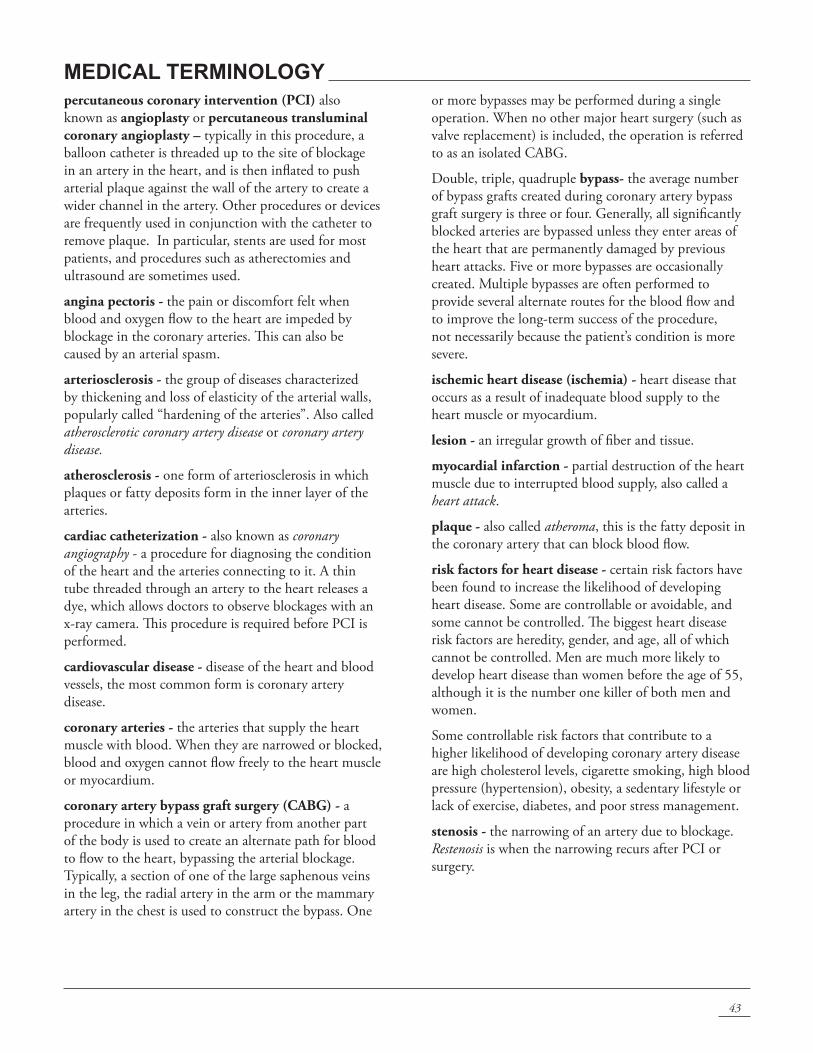
43
MEDICAL TERMINOLOgY percutaneous coronary intervention (PCI) also known as angioplasty or percutaneous transluminal coronary angioplasty – typically in this procedure, a balloon catheter is threaded up to the site of blockage in an artery in the heart, and is then inflated to push arterial plaque against the wall of the artery to create a wider channel in the artery. Other procedures or devices are frequently used in conjunction with the catheter to remove plaque. In particular, stents are used for most patients, and procedures such as atherectomies and ultrasound are sometimes used.
angina pectoris - the pain or discomfort felt when blood and oxygen flow to the heart are impeded by blockage in the coronary arteries. This can also be caused by an arterial spasm.
arteriosclerosis - the group of diseases characterized by thickening and loss of elasticity of the arterial walls, popularly called “hardening of the arteries”. Also called atherosclerotic coronary artery disease or coronary artery disease.
atherosclerosis - one form of arteriosclerosis in which plaques or fatty deposits form in the inner layer of the arteries.
cardiac catheterization - also known as coronary angiography - a procedure for diagnosing the condition of the heart and the arteries connecting to it. A thin tube threaded through an artery to the heart releases a dye, which allows doctors to observe blockages with an x-ray camera. This procedure is required before PCI is performed.
cardiovascular disease - disease of the heart and blood vessels, the most common form is coronary artery disease.
coronary arteries - the arteries that supply the heart muscle with blood. When they are narrowed or blocked, blood and oxygen cannot flow freely to the heart muscle or myocardium.
coronary artery bypass graft surgery (CABG) - a procedure in which a vein or artery from another part of the body is used to create an alternate path for blood to flow to the heart, bypassing the arterial blockage. Typically, a section of one of the large saphenous veins in the leg, the radial artery in the arm or the mammary artery in the chest is used to construct the bypass. One
or more bypasses may be performed during a single operation. When no other major heart surgery (such as valve replacement) is included, the operation is referred to as an isolated CABG.
Double, triple, quadruple bypass- the average number of bypass grafts created during coronary artery bypass graft surgery is three or four. Generally, all significantly blocked arteries are bypassed unless they enter areas of the heart that are permanently damaged by previous heart attacks. Five or more bypasses are occasionally created. Multiple bypasses are often performed to provide several alternate routes for the blood flow and to improve the long-term success of the procedure, not necessarily because the patient’s condition is more severe.
ischemic heart disease (ischemia) - heart disease that occurs as a result of inadequate blood supply to the heart muscle or myocardium.
lesion - an irregular growth of fiber and tissue.
myocardial infarction - partial destruction of the heart muscle due to interrupted blood supply, also called a heart attack.
plaque - also called atheroma, this is the fatty deposit in the coronary artery that can block blood flow.
risk factors for heart disease - certain risk factors have been found to increase the likelihood of developing heart disease. Some are controllable or avoidable, and some cannot be controlled. The biggest heart disease risk factors are heredity, gender, and age, all of which cannot be controlled. Men are much more likely to develop heart disease than women before the age of 55, although it is the number one killer of both men and women.
Some controllable risk factors that contribute to a higher likelihood of developing coronary artery disease are high cholesterol levels, cigarette smoking, high blood pressure (hypertension), obesity, a sedentary lifestyle or lack of exercise, diabetes, and poor stress management.
stenosis - the narrowing of an artery due to blockage. Restenosis is when the narrowing recurs after PCI or surgery.
44
Appendix 12005 Risk Factors For PCI In-Hospital/30-Day Mortality (ALL CASES)The significant pre-procedural risk factors for in-hospital/30-day mortality following PCI in 2005 are presented in the table that follows.
Roughly speaking, the odds ratio for a risk factor represents the number of times more likely a patient with that risk factor is to die in the hospital during or after PCI or after hospital discharge but within 30 days of the PCI than a patient without the risk factor, all other risk factors being the same. For example, the odds ratio for the risk factor “COPD” is 1.799. This means that a patient with COPD is approximately 1.799 times as likely to die in the hospital during the same admission as PCI or after hospital discharge but within 30 days of the PCI as a patient without COPD who has the same other significant risk factors. The risk factors Malignant Ventricular Arrhythmia and CHF-Current are interpreted in the same way.
With regard to age, the odds ratio roughly represents the number of times more likely a patient who is over age 65 is to die in the hospital or after discharge but within 30 days than another patient who is one year younger, all other significant risk factors being the same. Thus, a patient undergoing PCI who is 68 years old has approximately 1.056 times the chance of dying in the hospital or within 30 days that a 67 year-old patient has, all other risk factors being the same. All patients aged 65 years or younger have roughly the same odds of dying in the hospital or after discharge but within 30 days if their other risk factors are identical.
The odds ratio for the variable “Female Gender” is 1.602, meaning that a female undergoing PCI is 1.602 times more likely to die in the hospital or after discharge but within 30 days than a male with all of the same other significant risk factors.
The variables for Hemodynamic State are relative to patients that are not hemodynamically unstable or in shock. So, for example, a patient that is unstable has 10.623 times the odds of death of a hemodynamically stable patient, all of the other significant risk factors being the same.
Ejection fraction, which is the percentage of blood in the heart’s left ventricle that is expelled when it contracts (with more denoting a healthier heart), is subdivided into five ranges (<20%, 20% to 29%, 30% to 39%, 40% to 49% and 50% or more). The last range is referred to as the reference category. This means that the odds ratio that appears for the other ejection fraction categories in the table is relative to patients with an ejection fraction of 50% or more. Thus, a PCI patient with an ejection fraction of <20% is about 3.682 times as likely to die in the hospital or within 30 days as a patient with an ejection fraction of 50% or higher, all other significant risk factors being the same.
Previous MI is subdivided into five ranges (occurring less than 6 hours prior, 6 to 11 hours prior, 12 to 23 hours prior, 1 to 14 days prior and no MI within 14 days prior to the procedure.) The last range is referred to as the reference category. The odds ratios for the Previous MI ranges are relative to patients who have not had an MI within 14 days prior to PCI.
Renal failure is subdivided into five groups. Four categories represent patients with various levels of elevated creatinine, but no dialysis. The fifth category includes patients with renal failure on dialysis. All groups are relative to patients who are not on dialysis and had no pre-PCI creatinine values greater than 1.5 mg/dl.
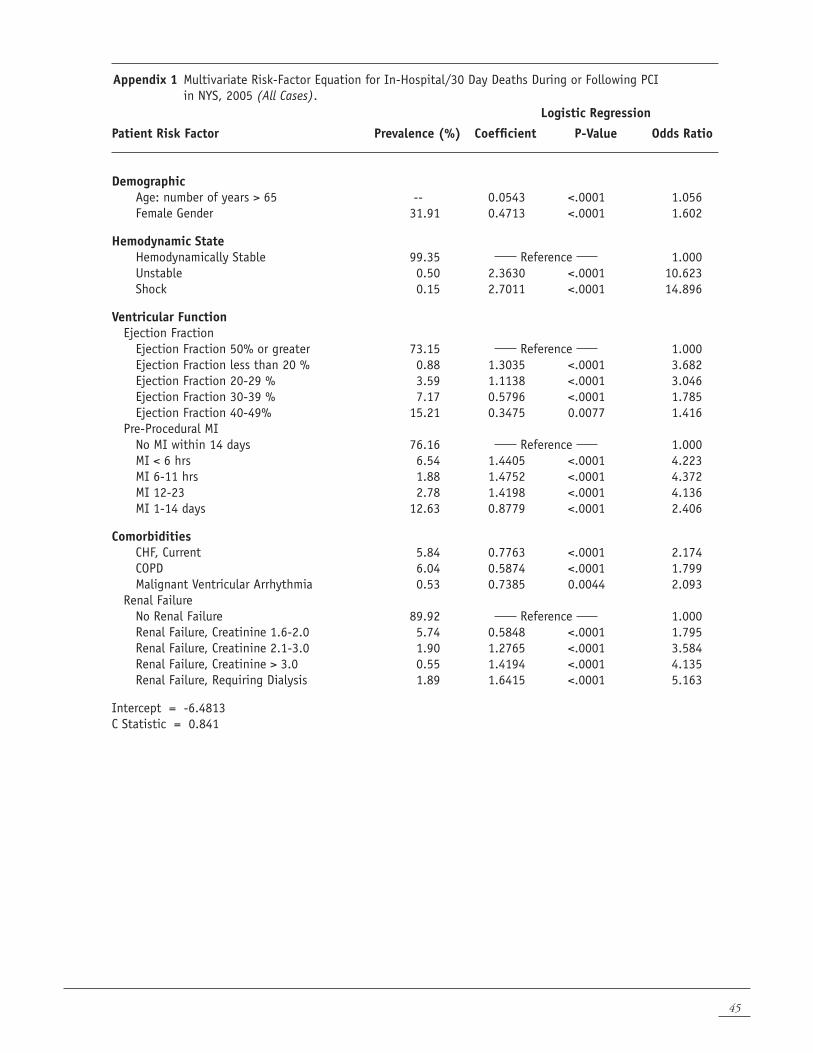
45
Appendix 1 Multivariate Risk-Factor Equation for In-Hospital/30 Day Deaths During or Following PCI in NYS, 2005 (All Cases).
Logistic Regression
Patient Risk Factor Prevalence (%) Coefficient P-Value Odds Ratio
Demographic Age: number of years > 65 -- 0.0543 <.0001 1.056 Female Gender 31.91 0.4713 <.0001 1.602
Hemodynamic State Hemodynamically Stable 99.35 Reference 1.000 Unstable 0.50 2.3630 <.0001 10.623 Shock 0.15 2.7011 <.0001 14.896
Ventricular Function Ejection Fraction Ejection Fraction 50% or greater 73.15 Reference 1.000 Ejection Fraction less than 20 % 0.88 1.3035 <.0001 3.682 Ejection Fraction 20-29 % 3.59 1.1138 <.0001 3.046 Ejection Fraction 30-39 % 7.17 0.5796 <.0001 1.785 Ejection Fraction 40-49% 15.21 0.3475 0.0077 1.416 Pre-Procedural MI No MI within 14 days 76.16 Reference 1.000 MI < 6 hrs 6.54 1.4405 <.0001 4.223 MI 6-11 hrs 1.88 1.4752 <.0001 4.372 MI 12-23 2.78 1.4198 <.0001 4.136 MI 1-14 days 12.63 0.8779 <.0001 2.406
Comorbidities CHF, Current 5.84 0.7763 <.0001 2.174 COPD 6.04 0.5874 <.0001 1.799 Malignant Ventricular Arrhythmia 0.53 0.7385 0.0044 2.093 Renal Failure No Renal Failure 89.92 Reference 1.000 Renal Failure, Creatinine 1.6-2.0 5.74 0.5848 <.0001 1.795 Renal Failure, Creatinine 2.1-3.0 1.90 1.2765 <.0001 3.584 Renal Failure, Creatinine > 3.0 0.55 1.4194 <.0001 4.135 Renal Failure, Requiring Dialysis 1.89 1.6415 <.0001 5.163
Intercept = -6.4813C Statistic = 0.841
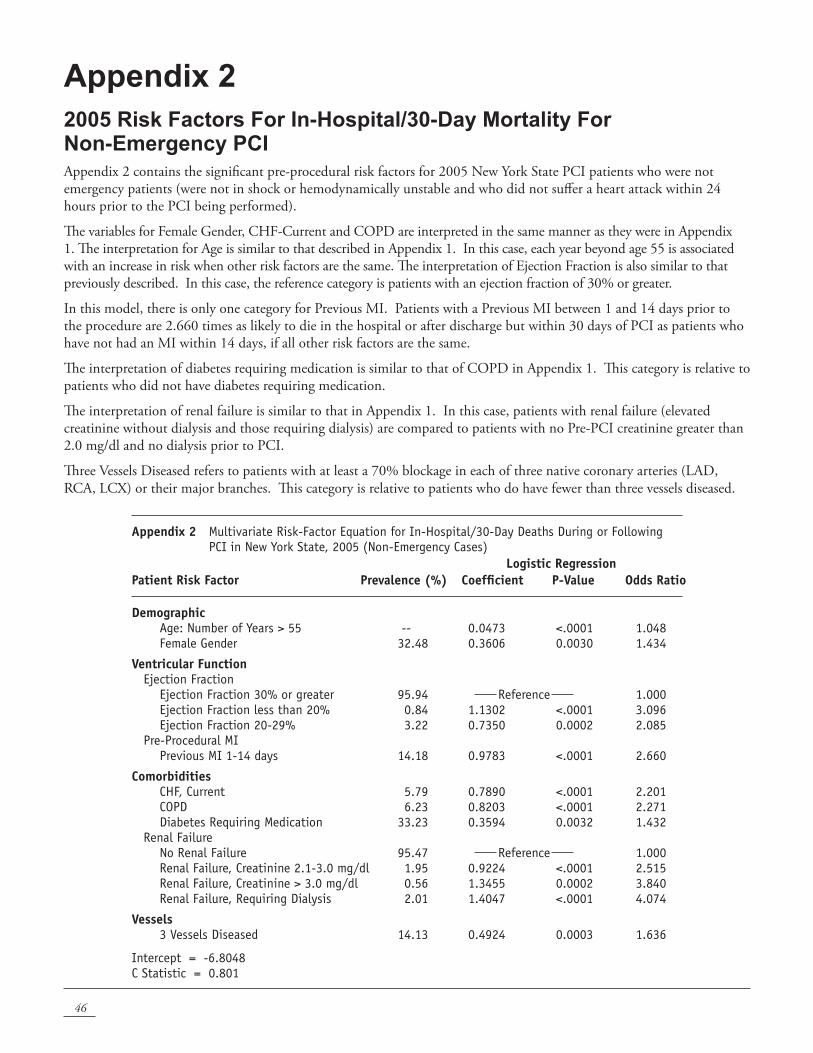
46
Appendix 22005 Risk Factors For In-Hospital/30-Day Mortality For Non-Emergency PCIAppendix 2 contains the significant pre-procedural risk factors for 2005 New York State PCI patients who were not emergency patients (were not in shock or hemodynamically unstable and who did not suffer a heart attack within 24 hours prior to the PCI being performed).
The variables for Female Gender, CHF-Current and COPD are interpreted in the same manner as they were in Appendix 1. The interpretation for Age is similar to that described in Appendix 1. In this case, each year beyond age 55 is associated with an increase in risk when other risk factors are the same. The interpretation of Ejection Fraction is also similar to that previously described. In this case, the reference category is patients with an ejection fraction of 30% or greater.
In this model, there is only one category for Previous MI. Patients with a Previous MI between 1 and 14 days prior to the procedure are 2.660 times as likely to die in the hospital or after discharge but within 30 days of PCI as patients who have not had an MI within 14 days, if all other risk factors are the same.
The interpretation of diabetes requiring medication is similar to that of COPD in Appendix 1. This category is relative to patients who did not have diabetes requiring medication.
The interpretation of renal failure is similar to that in Appendix 1. In this case, patients with renal failure (elevated creatinine without dialysis and those requiring dialysis) are compared to patients with no Pre-PCI creatinine greater than 2.0 mg/dl and no dialysis prior to PCI.
Three Vessels Diseased refers to patients with at least a 70% blockage in each of three native coronary arteries (LAD, RCA, LCx) or their major branches. This category is relative to patients who do have fewer than three vessels diseased.
Appendix 2 Multivariate Risk-Factor Equation for In-Hospital/30-Day Deaths During or Following PCI in New York State, 2005 (Non-Emergency Cases)
Logistic RegressionPatient Risk Factor Prevalence (%) Coefficient P-Value Odds Ratio
Demographic Age: Number of Years > 55 -- 0.0473 <.0001 1.048 Female Gender 32.48 0.3606 0.0030 1.434
Ventricular Function Ejection Fraction Ejection Fraction 30% or greater 95.94 Reference 1.000 Ejection Fraction less than 20% 0.84 1.1302 <.0001 3.096 Ejection Fraction 20-29% 3.22 0.7350 0.0002 2.085 Pre-Procedural MI Previous MI 1-14 days 14.18 0.9783 <.0001 2.660
Comorbidities CHF, Current 5.79 0.7890 <.0001 2.201 COPD 6.23 0.8203 <.0001 2.271 Diabetes Requiring Medication 33.23 0.3594 0.0032 1.432 Renal Failure No Renal Failure 95.47 Reference 1.000 Renal Failure, Creatinine 2.1-3.0 mg/dl 1.95 0.9224 <.0001 2.515 Renal Failure, Creatinine > 3.0 mg/dl 0.56 1.3455 0.0002 3.840 Renal Failure, Requiring Dialysis 2.01 1.4047 <.0001 4.074
Vessels 3 Vessels Diseased 14.13 0.4924 0.0003 1.636
Intercept = -6.8048C Statistic = 0.801
47
Appendix 32003-2005 Risk Factors for PCI In-Hospital/30-Day Mortality (ALL CASES)The significant pre-procedural risk factors for in-hospital/30-day mortality following PCI in the 2003-2005 time period are presented in the table that follows. The interpretation of this table is similar to the interpretation of Appendices 1 and 2 that are described previously. The variables Female Gender, Peripheral Vascular Disease, COPD, Malignant Ventricular Arrhythmia and Diabetes Requiring Medication are interpreted in the same manner as COPD in Appendix 1. For example, patients with COPD have odds of dying in the hospital or after discharge but within 30 days that are 3.081 times the odds of patients without COPD dying in the hospital or after discharge but within 30 days, all other risk factors being the same. The variables for Hemodynamic State, and Ejection Fraction are interpreted in the same manner as they are in Appendix 1.
The interpretation for Age is the same as in Appendix 2. The interpretation for Renal Failure is similar to Appendix 1, except in this case the reference category is patients with no Pre-PCI dialysis and no Pre-PCI creatinine greater than 2.5 mg/dl.
The interpretation for Previous MI is very similar to that in Appendix 1. In this case, the reference category is patients who have not had an MI within 14 days prior to the procedure.
In this model, there are three categories for Congestive Heart Failure (CHF); Current, Past and No CHF within 6 months. The odds ratio for CHF-Current compares patients diagnosed with CHF within 2 weeks prior to the procedure to those who have not had CHF diagnosed within 6 months of the PCI. CHF-Past compares patients with CHF diagnosed between 2 weeks to 6 months prior to the procedure to those who have not had CHF in the past 6 months.
Three Vessels Diseased refers to patient with at least a 70% blockage in each of three native coronary arteries (LAD, RCA, LCx), or their major branches. Two Vessels Diseased refers to patient with at least a 70% blockage in two of the native coronary arteries (LAD, RCA, LCx), or their major branches. The reference category for these two groups includes patients who have fewer than two vessels diseased.
Left Main Disease refers to patients with a blockage of at least 50% in their Left Main Coronary Artery. This group is compared to patients who do not have a blockage of at least 50% in their Left Main Coronary Artery.
The Number of Risk Factors Squared term is merely the square of the number of risk factors in Appendix 3 that a patient has (not counting age), and is used to improve the ability of the model to predict mortality.
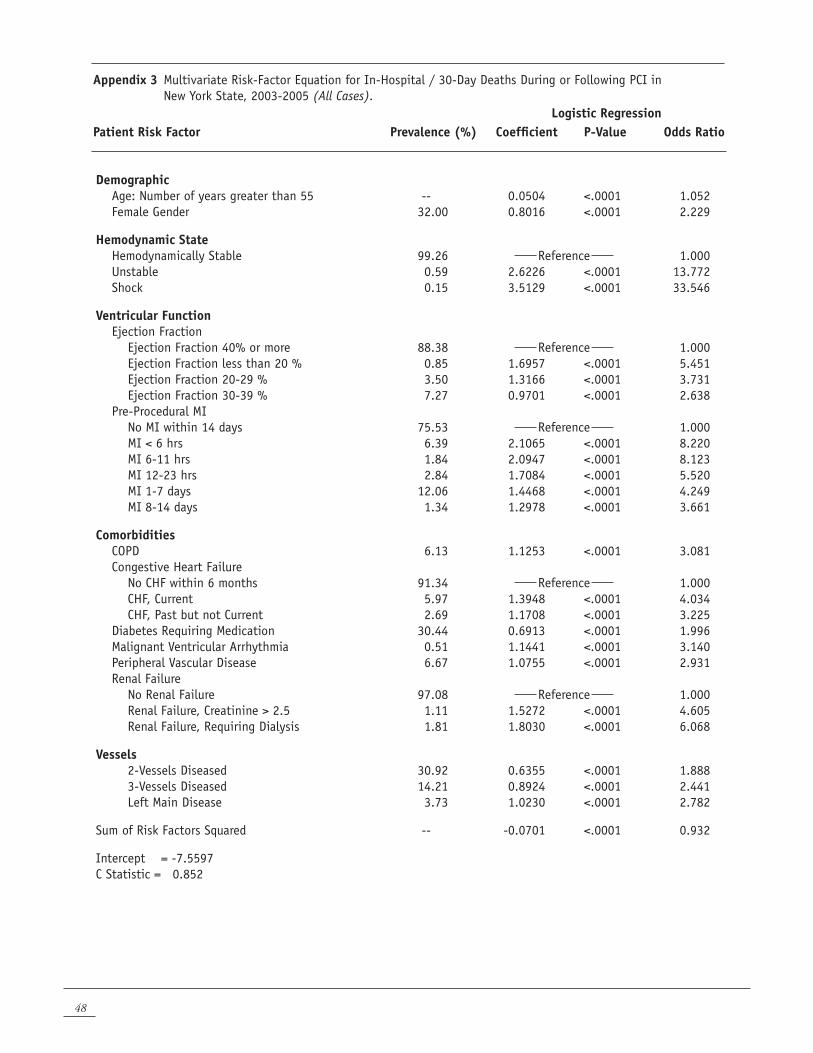
48
Appendix 3 Multivariate Risk-Factor Equation for In-Hospital / 30-Day Deaths During or Following PCI in New York State, 2003-2005 (All Cases).
Logistic RegressionPatient Risk Factor Prevalence (%) Coefficient P-Value Odds Ratio
Demographic Age: Number of years greater than 55 -- 0.0504 <.0001 1.052 Female Gender 32.00 0.8016 <.0001 2.229
Hemodynamic State Hemodynamically Stable 99.26 Reference 1.000 Unstable 0.59 2.6226 <.0001 13.772 Shock 0.15 3.5129 <.0001 33.546
Ventricular Function Ejection Fraction Ejection Fraction 40% or more 88.38 Reference 1.000 Ejection Fraction less than 20 % 0.85 1.6957 <.0001 5.451 Ejection Fraction 20-29 % 3.50 1.3166 <.0001 3.731 Ejection Fraction 30-39 % 7.27 0.9701 <.0001 2.638 Pre-Procedural MI No MI within 14 days 75.53 Reference 1.000 MI < 6 hrs 6.39 2.1065 <.0001 8.220 MI 6-11 hrs 1.84 2.0947 <.0001 8.123 MI 12-23 hrs 2.84 1.7084 <.0001 5.520 MI 1-7 days 12.06 1.4468 <.0001 4.249 MI 8-14 days 1.34 1.2978 <.0001 3.661
Comorbidities COPD 6.13 1.1253 <.0001 3.081 Congestive Heart Failure No CHF within 6 months 91.34 Reference 1.000 CHF, Current 5.97 1.3948 <.0001 4.034 CHF, Past but not Current 2.69 1.1708 <.0001 3.225 Diabetes Requiring Medication 30.44 0.6913 <.0001 1.996 Malignant Ventricular Arrhythmia 0.51 1.1441 <.0001 3.140 Peripheral Vascular Disease 6.67 1.0755 <.0001 2.931 Renal Failure No Renal Failure 97.08 Reference 1.000 Renal Failure, Creatinine > 2.5 1.11 1.5272 <.0001 4.605 Renal Failure, Requiring Dialysis 1.81 1.8030 <.0001 6.068
Vessels 2-Vessels Diseased 30.92 0.6355 <.0001 1.888 3-Vessels Diseased 14.21 0.8924 <.0001 2.441 Left Main Disease 3.73 1.0230 <.0001 2.782
Sum of Risk Factors Squared -- -0.0701 <.0001 0.932
Intercept = -7.5597 C Statistic = 0.852
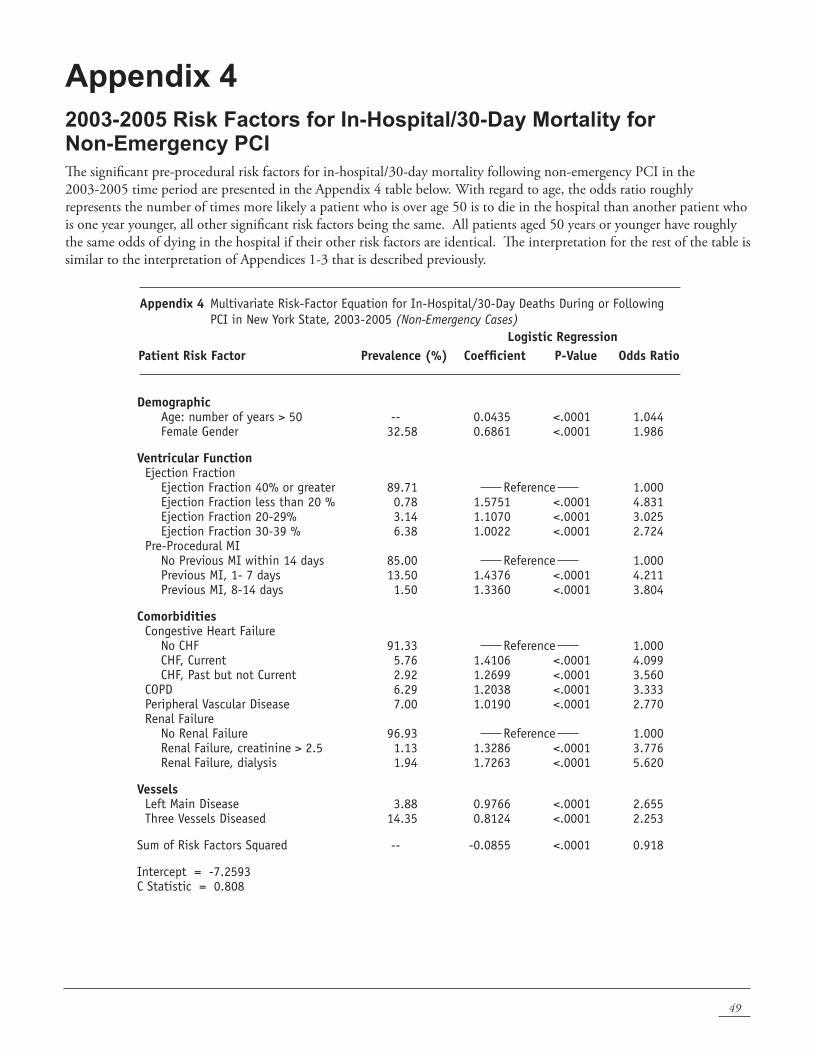
49
Appendix 42003-2005 Risk Factors for In-Hospital/30-Day Mortality for Non-Emergency PCIThe significant pre-procedural risk factors for in-hospital/30-day mortality following non-emergency PCI in the 2003-2005 time period are presented in the Appendix 4 table below. With regard to age, the odds ratio roughly represents the number of times more likely a patient who is over age 50 is to die in the hospital than another patient who is one year younger, all other significant risk factors being the same. All patients aged 50 years or younger have roughly the same odds of dying in the hospital if their other risk factors are identical. The interpretation for the rest of the table is similar to the interpretation of Appendices 1-3 that is described previously.
Appendix 4 Multivariate Risk-Factor Equation for In-Hospital/30-Day Deaths During or Following PCI in New York State, 2003-2005 (Non-Emergency Cases)
Logistic RegressionPatient Risk Factor Prevalence (%) Coefficient P-Value Odds Ratio
Demographic Age: number of years > 50 -- 0.0435 <.0001 1.044 Female Gender 32.58 0.6861 <.0001 1.986
Ventricular Function Ejection Fraction Ejection Fraction 40% or greater 89.71 Reference 1.000 Ejection Fraction less than 20 % 0.78 1.5751 <.0001 4.831 Ejection Fraction 20-29% 3.14 1.1070 <.0001 3.025 Ejection Fraction 30-39 % 6.38 1.0022 <.0001 2.724 Pre-Procedural MI No Previous MI within 14 days 85.00 Reference 1.000 Previous MI, 1- 7 days 13.50 1.4376 <.0001 4.211 Previous MI, 8-14 days 1.50 1.3360 <.0001 3.804
Comorbidities Congestive Heart Failure No CHF 91.33 Reference 1.000 CHF, Current 5.76 1.4106 <.0001 4.099 CHF, Past but not Current 2.92 1.2699 <.0001 3.560 COPD 6.29 1.2038 <.0001 3.333 Peripheral Vascular Disease 7.00 1.0190 <.0001 2.770 Renal Failure No Renal Failure 96.93 Reference 1.000 Renal Failure, creatinine > 2.5 1.13 1.3286 <.0001 3.776 Renal Failure, dialysis 1.94 1.7263 <.0001 5.620
Vessels Left Main Disease 3.88 0.9766 <.0001 2.655 Three Vessels Diseased 14.35 0.8124 <.0001 2.253
Sum of Risk Factors Squared -- -0.0855 <.0001 0.918
Intercept = -7.2593C Statistic = 0.808
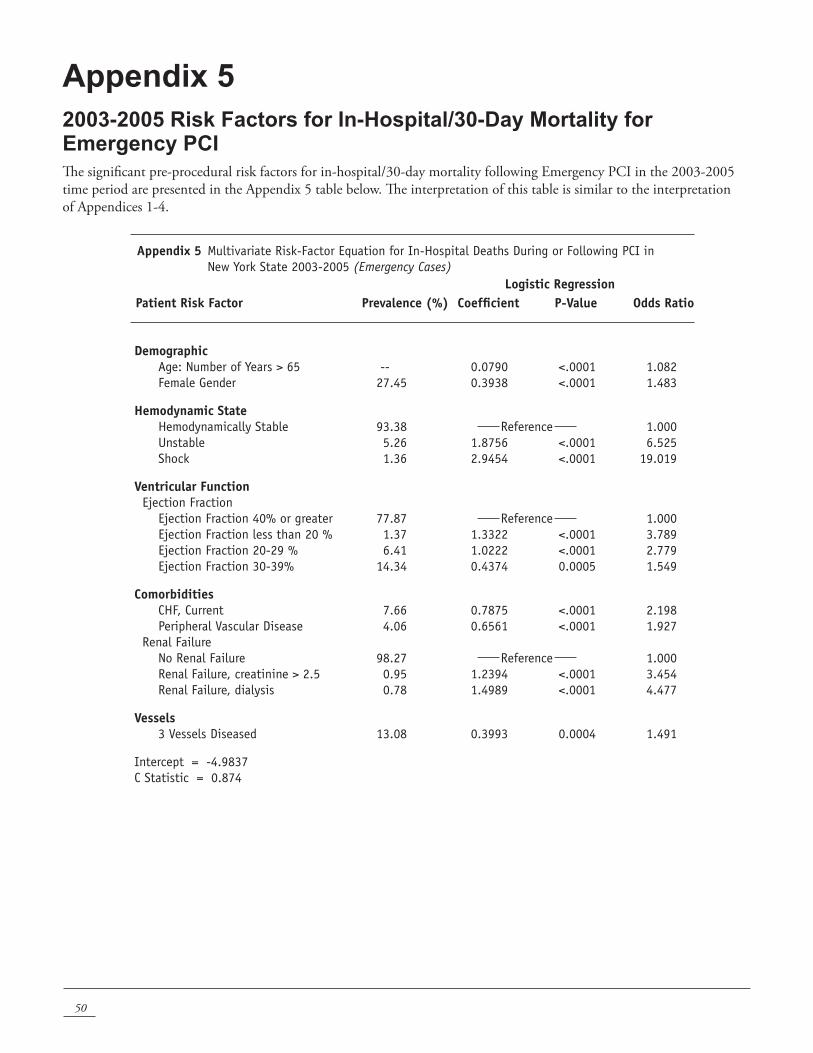
50
Appendix 5 2003-2005 Risk Factors for In-Hospital/30-Day Mortality for Emergency PCIThe significant pre-procedural risk factors for in-hospital/30-day mortality following Emergency PCI in the 2003-2005 time period are presented in the Appendix 5 table below. The interpretation of this table is similar to the interpretation of Appendices 1-4.
Appendix 5 Multivariate Risk-Factor Equation for In-Hospital Deaths During or Following PCI in New York State 2003-2005 (Emergency Cases)
Logistic RegressionPatient Risk Factor Prevalence (%) Coefficient P-Value Odds Ratio
Demographic Age: Number of Years > 65 -- 0.0790 <.0001 1.082 Female Gender 27.45 0.3938 <.0001 1.483
Hemodynamic State Hemodynamically Stable 93.38 Reference 1.000 Unstable 5.26 1.8756 <.0001 6.525 Shock 1.36 2.9454 <.0001 19.019
Ventricular Function Ejection Fraction Ejection Fraction 40% or greater 77.87 Reference 1.000 Ejection Fraction less than 20 % 1.37 1.3322 <.0001 3.789 Ejection Fraction 20-29 % 6.41 1.0222 <.0001 2.779 Ejection Fraction 30-39% 14.34 0.4374 0.0005 1.549
Comorbidities CHF, Current 7.66 0.7875 <.0001 2.198 Peripheral Vascular Disease 4.06 0.6561 <.0001 1.927 Renal Failure No Renal Failure 98.27 Reference 1.000 Renal Failure, creatinine > 2.5 0.95 1.2394 <.0001 3.454 Renal Failure, dialysis 0.78 1.4989 <.0001 4.477
Vessels 3 Vessels Diseased 13.08 0.3993 0.0004 1.491
Intercept = -4.9837C Statistic = 0.874
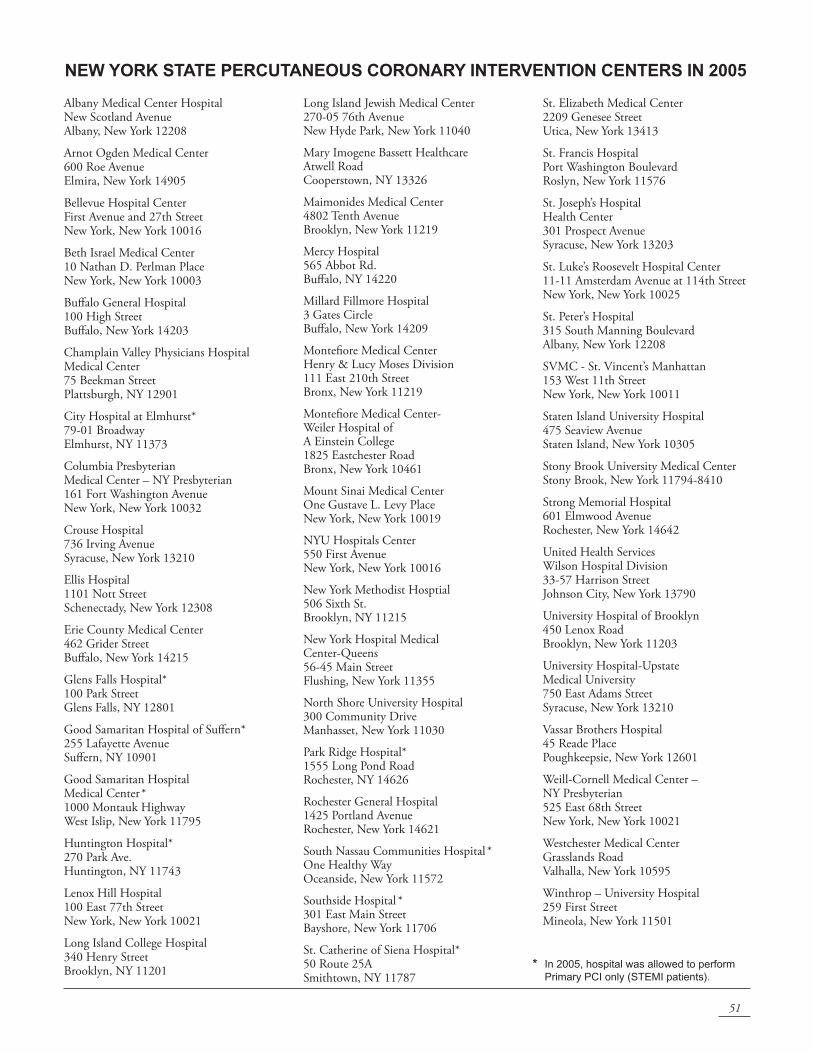
51
Albany Medical Center Hospital New Scotland Avenue Albany, New York 12208
Arnot Ogden Medical Center 600 Roe Avenue Elmira, New York 14905
Bellevue Hospital Center First Avenue and 27th Street New York, New York 10016
Beth Israel Medical Center 10 Nathan D. Perlman Place New York, New York 10003
Buffalo General Hospital 100 High Street Buffalo, New York 14203
Champlain Valley Physicians Hospital Medical Center75 Beekman StreetPlattsburgh, NY 12901
City Hospital at Elmhurst*79-01 BroadwayElmhurst, NY 11373
Columbia Presbyterian Medical Center – NY Presbyterian 161 Fort Washington Avenue New York, New York 10032
Crouse Hospital 736 Irving Avenue Syracuse, New York 13210
Ellis Hospital 1101 Nott Street Schenectady, New York 12308
Erie County Medical Center 462 Grider Street Buffalo, New York 14215
Glens Falls Hospital*100 Park StreetGlens Falls, NY 12801
Good Samaritan Hospital of Suffern*255 Lafayette AvenueSuffern, NY 10901
Good Samaritan Hospital Medical Center * 1000 Montauk Highway West Islip, New York 11795
Huntington Hospital*270 Park Ave.Huntington, NY 11743
Lenox Hill Hospital 100 East 77th Street New York, New York 10021
Long Island College Hospital340 Henry StreetBrooklyn, NY 11201
Long Island Jewish Medical Center 270-05 76th Avenue New Hyde Park, New York 11040
Mary Imogene Bassett HealthcareAtwell RoadCooperstown, NY 13326
Maimonides Medical Center 4802 Tenth Avenue Brooklyn, New York 11219
Mercy Hospital565 Abbot Rd.Buffalo, NY 14220
Millard Fillmore Hospital 3 Gates Circle Buffalo, New York 14209
Montefiore Medical Center Henry & Lucy Moses Division 111 East 210th Street Bronx, New York 11219
Montefiore Medical Center- Weiler Hospital of A Einstein College 1825 Eastchester Road Bronx, New York 10461
Mount Sinai Medical Center One Gustave L. Levy Place New York, New York 10019
NYU Hospitals Center 550 First Avenue New York, New York 10016
New York Methodist Hosptial506 Sixth St.Brooklyn, NY 11215
New York Hospital Medical Center-Queens 56-45 Main Street Flushing, New York 11355
North Shore University Hospital 300 Community Drive Manhasset, New York 11030
Park Ridge Hospital*1555 Long Pond RoadRochester, NY 14626
Rochester General Hospital 1425 Portland Avenue Rochester, New York 14621
South Nassau Communities Hospital * One Healthy Way Oceanside, New York 11572
Southside Hospital * 301 East Main Street Bayshore, New York 11706
St. Catherine of Siena Hospital*50 Route 25ASmithtown, NY 11787
St. Elizabeth Medical Center 2209 Genesee Street Utica, New York 13413
St. Francis Hospital Port Washington Boulevard Roslyn, New York 11576
St. Joseph’s Hospital Health Center 301 Prospect Avenue Syracuse, New York 13203
St. Luke’s Roosevelt Hospital Center 11-11 Amsterdam Avenue at 114th Street New York, New York 10025
St. Peter’s Hospital 315 South Manning Boulevard Albany, New York 12208
SVMC - St. Vincent’s Manhattan 153 West 11th Street New York, New York 10011
Staten Island University Hospital 475 Seaview Avenue Staten Island, New York 10305
Stony Brook University Medical Center Stony Brook, New York 11794-8410
Strong Memorial Hospital 601 Elmwood Avenue Rochester, New York 14642
United Health Services Wilson Hospital Division 33-57 Harrison Street Johnson City, New York 13790
University Hospital of Brooklyn 450 Lenox Road Brooklyn, New York 11203
University Hospital-Upstate Medical University 750 East Adams Street Syracuse, New York 13210
Vassar Brothers Hospital 45 Reade Place Poughkeepsie, New York 12601
Weill-Cornell Medical Center – NY Presbyterian 525 East 68th Street New York, New York 10021
Westchester Medical Center Grasslands Road Valhalla, New York 10595
Winthrop – University Hospital 259 First Street Mineola, New York 11501
NEW YORK STATE PERCUTANEOUS CORONARY INTERVENTION CENTERS IN 2005
* In2005,hospitalwasallowedtoperformPrimaryPCIonly(STEMIpatients).

52
53
Additional copies of this report may be obtained through the Department of Health web site at http://www.health.state.ny.usor by writing to: Cardiac Box 2000 New York State Department of Health Albany, New York 12220

State of New YorkDepartment of Health
2/08