Embed Size (px)
DESCRIPTION
This report, from the group Communities for Excellent Public Schools, lists schools around the nation that are eligible for turnaround interventions under the School Improvement Grants program.
Citation preview

Our CommunitiesLeft Behind:
An AnAlysis of the AdministrAtion’s school turnAround Policies
July 2010
Communities for exCellent PubliC sChools
EmbagroEd until7/28/2010 at 11:00 a.m. Edt.

2 our CommunitiEs lEft bEhind
Acknowledgements
We want to acknowledge the leadership role of the annenberg institute for school reform at brown university in the preparation of this report, including the data analysis and writing. specifically, we want to thank Christina mokhtar, ivonne garcia, sara mcalister, leigh dingerson, michelle renee and Eric Zachary for their contributions.
communitiesforexcellentPublicschools is supported by Communities for Public Education reform (CPEr), a collaboration of over 50 foundations working to support the field of education organizing. through grants and technical assistance, CPEr infuses education organizing campaigns with the resources they need to address educational inequities at scale. specifically, CPEr helps equip community-based, democratically led organizations to push for policies—at the local, state, and national levels—that improve the quality of education provided to low-income students and students of color.
communitiesforexcellentPublicschoolsParticipatingandsupportingorganizations
action now—Chicago, illinoisaction north Carolina*
aCtion unitEd—Pennsylvania* alliance for Quality Education—new York*
alliance of Californians for Community Empowerment—California*arkansas Community organizations—arkansas*
brighton Park neighborhood Council—Chicago, illinoisCitizen action of new York*
Communities united—Washington, d.C.delawareans for social and Economic Justice—delaware*
Kenwood oakland Community organization—Chicago, illinoislogan square neighborhood association—Chicago, illinois
living united for Change america (luCha)—Phoenix, arizonaminnesota neighborhoods organizing for Change*
missourians organized for reform & Equality— missouri* make the road new York—new York, new York
nYC Coalition for Educational Justice—new York, new York new York Communities for Change*
organizers in the land of Enchantment—albuquerque, new mexicoour Washington*
PiCo national network--oakland, California**us action—Washington, d.C.**
Virginia organizing Project— Virginia* Youth on board—somerville, massachusetts
*state-wide organizations**national organizations

our CommunitiEs lEft bEhind 1
no onE disPutEs thE CritiCal nEEd for action to improve low-performing schools. there is no question that thousands of schools across the country can and should do better—that both internal and external obstacles get in the way of delivering what we have always promised to all our nation’s young people: a free and excellent public education.
the obama administration and Congress are currently debating the details of the reauthorization of the Elementary and secondary Education act (EsEa). as part of that process, the department of Education (Ed) is revisiting old territory through its school improvement grants (sig) program, hoping that adding teeth to the largely unsuccessful turnaround strategies of no Child left behind will somehow result in different outcomes for struggling schools.
We believe that the school turnaround strategies being implemented through the sig program are time-tested and flawed. While the administration is right to call for dramatic action and to recognize that significant progress is not possible without added resources to support school improvement, it’s time to look at new directions. the critical questions we must ask are:
• whatdoresearchandexperiencetellusaboutthemostpromisingmodelsofschoolchange?
• howcanweimplementreformthatissustainableovertime,and
• whomustbeatthetabletoensuresuccessfulreform?
Communities for Excellent Public schools (CEPs), a new national coalition of community-based organizations composed of parents and students in low-income communities, is entering the debate. for too long, our communities have been the targets of top-down school improvement efforts. under no Child left behind unilateral schools closings, staff firings and charter conversions were tried—and failed to deliver the widespread and sustainable improvements that our students and schools need and deserve. the school turnaround proposals
outlined in the administration’s “blueprint for reform: the reauthorization of the Elementary and secondary Education act” and being tested through the school improvement grants program are not new—only more prescriptive. they continue a practice of rigid, top-down solutions that are not supported by research, and that exclude meaningful input by parents, students and local communities, despite a growing body of research that demonstrates parent and community participation are critical to improving low-performing schools.1
it is not enough to “welcome input” from parents, or to invite parents to the table to help choose from a pre-determined list of options for their schools. We want to help create a new vision for our schools.
today, we are releasing, for the first time in one document, the list of all the “tier i” and “tier ii” schools that have been identified as eligible for federal intervention under the administration’s “school improvement grants” program. as outlined in this report, the analysis of the demographic composition of these schools confirms that low-income communities and communities of color will be disproportionately affected by federally-stimulated intervention. Parents and students in these communities must be at the table when decisions are made that so dramatically affect our schools. Consider the following data:
• there are currently 2,136 schools on the list of schools targeted for sig grants. nearly 1.5 million students attend these schools;
• 81% of students in these schools are students of color;
• 85% of the most urgently targeted schools (tier i) have high concentrations of poverty (defined as more than 50% of students eligible for federal free and reduced priced meals);
Introduction
We believe that the school turnaround strategies being implemented through the SIG program are time-tested and flawed.

2 our CommunitiEs lEft bEhind
• black and hispanic students are overrepresented in sig schools.black students are 72 times more likely to be in a
sig-eligible school than white students.hispanic students are 42 times more likely to be in
a sig-eligible school than white students.
top-down turnaround—defying the researchthrough the school improvement grants program, the department is sending formula aid to states. in turn, the states will then distribute that aid to districts to intervene in these schools based on a prioritized list (not every school that is eligible will receive the additional federal support).
the sig program strictly limits how states and districts use turnaround funds. the program gives districts four options for utilizing federal dollars to help struggling tier i and tier ii schools:
• turnaround:the school’s principal and all of its teachers are fired. a new principal may rehire up to 50% of the former teachers, and must then implement department-outlined strategies to improve student academic and graduation rates.
• restart:the district must either convert the school to a charter, or close it and reopen it under outside management—a charter operator, charter management organization, or education management organization.
• schoolclosure: schools may be closed, with students being transferred to “other, higher achieving schools.”
• transformation: this model requires that the school principal be replaced (if s/he has been at the school longer than two years), and that schools must choose from an Ed-determined set of strategies. under the sig program, any district with more than nine tier i and tier ii schools in improvement status may not use the “transformation” model in more than 50% of its schools.
all 50 states, the district of Columbia and the us department of Education are currently in the first stage of this process—identifying schools for immediate interventions. the next step—which many states have
already begun—is determining which schools receive funding, and which of the strategies they will implement.
many education experts and advocates have expressed concern over the narrow range of options for school turnaround.2 others have decried the lack of mandated public involvement in determining and implementing the interventions. Communities for Excellent Public schools concurs. although we wholeheartedly agree with the need for dramatic and meaningful improvements, we believe there are several reasons why the administration’s limited, top-down mandates are both bad policy and bad educational strategy:
• the interventions are imposed on the school, rather than being developed with the school community;
• they focus primarily on structural, rather than educational change—in fact, two of the four options (closure and “restart”) are silent on any strategies relating directly to teaching and learning;
• they are “one-size-fits-all,” rigidly assuming that these models will work in any context—urban, rural or suburban. there is no acknowledgement of local political, cultural and fiscal considerations, no mention of the availability of new teachers or leadership, the presence or absence of educational options should schools close. under the sig rules, if a district demonstrates that a targeted school cannot viably implement one of the four strategies, the school is not funded;
“…it is recommended that policymakers refrain from relying on restructuring sanctions (takeovers, private management, charters, and reconstitutions) to effect school improvement. They have produced negative by-products without yielding systemic positive effects.”
mathis, W.,“NCLB’s ultimate restructuring alternatives: Do they improve the quality of education?” East lansing, mi: the great lakes Center for Education research and Practice, 2009.

our CommunitiEs lEft bEhind 3
• the administration’s interventions lay the burden of failure on the schools themselves, and do not encourage an analysis of other factors that may be contributing to poor performance—factors such as funding inequities in the district, enrollment practices that lead to concentrations of high-needs students, district staffing patterns and others;3
• none of the four options is premised on gaining collaboration and investment from stakeholders including parents, students and communities, teachers and school leadership;
• they are refuted by evidence and research on what types of reform effectively impact student academic success.4
We agree with the administration that dramatic action, backed by federal resources, is necessary to improve low-performing schools. however, we are troubled that the administration continues the policies of no Child left behind (nClb), promoting unproven strategies for educational transformation. in fact, the school turnaround model embedded in sig is even more rigid than earlier nClb “corrective action” provisions.
the reportCommunities for Excellent Public schools (CEPs), with support from the annenberg institute for school reform at brown university, examined the schools that are being targeted for these turnaround interventions. the national list of schools has not been released by the department of Education. our compilation of the targeted schools, by name, is the first effort to identify and assess the characteristics of the schools identified for turnaround.
nearly 1.5 million students currently attend these targeted schools. some of the schools will be shut down, with no monitoring to ensure that displaced students will receive
a better education at their new schools.5 We profile one of these schools in our report (see page 6). many of them will be forced to fire their principals (see our profile of brooklyn Center high school on page 4) and some schools will be required to fire their entire teaching staff (under the “turnaround” option, every teacher must be fired, and no more than 50% can be rehired).
if research and experience can be relied upon, few of the schools will see significant academic gains as a result of these interventions.6 and even fewer of these gains will be sustained over a period of years.7
these are our communities. We know the strengths and the challenges that our schools face. responsible school change is a process of collaboration and partnership between external experts and the school community, including students, parents and educators. successful school change must employ research-based strategies that have the greatest likelihood of actually improving conditions for learning. sustainable school change must be owned and accountable to parents, students and communities.
simultaneous with the release and analysis of this list, we are proposing a new approach to school intervention called “sustainable school transformation.” our proposal emphasizes the importance of a comprehensive, inclusive process in partnership with parents and communities, research-based strategies, and a broader look at both schools’ and students’ unique and individual needs.
Sustainable school change must be owned and accountable to parents, students and communities.

4 our CommunitiEs lEft bEhind
cAse study
BrooKlyn center hiGh school—Brooklyn center, minnesota
in June, 2010, bryan bass, the principal of brooklyn Center high school in suburban minneapolis, was fired.
brooklyn Center is one of 34 schools on minnesota’s list of “persistently lowest achieving” schools. the state education commissioner says that the federal school improvement grants (sig) program will give the state the opportunity to “really dig deep and try to solve the educational issues” in their failing schools. for brooklyn Center, like all schools targeted under the sig program, receiving federal funding for reform efforts required firing the current principal.
brooklyn Center high school enrolls about 800 students, three-quarters of whom are low-income and children of color. roughly 14% of the students have learning disabilities, and about 20% are English language learners. the school offers a strong arts magnet program, and an international baccalaureate program, making it a popular open-enrollment school. though 82% of students who enroll, graduate, the
school has some of the lowest assessment scores in the state.
bryan bass has been principal at brooklyn Center for four years. under his leadership, the number of suspensions each month fell from 45 to about 10. the number of graduates who went on to college doubled from 35% to 70%. student mobility dropped from 33% to 26%.
bass and superintendent Keith lester also worked tirelessly on meeting another need of the school community. one wing of the school was recently turned into a one-stop medical and social service center. the center is equipped to care for any student or school-age resident in the area. With or without health insurance, students have access to dental, vision, mental health and medical services right in the building. the need for wrap-around supports for students immediately became apparent: in the first year, 70% of students who were tested were found to have untreated vision problems. by building a network of existing providers and agencies, identified needs were met. Children who needed glasses were given them. the clinic offers a therapist to help students work through emotional issues.
a social service agency has an office in the clinic that helps students’ families find health insurance.
“overnight — overnight, it absolutely decreased the amount of behavioral issues,” principal bass told a local reporter about the new school-based center. “by eliminating barriers, you start to really understand what’s in the way of students getting to learn.”
the future of brooklyn Center high school’s health and social services center is not guaranteed under the federal grant program. one thing was guaranteed, though. the school’s energetic principal had to go, as a condition for participation in the sig program. superintendent lester is frustrated with the rigidity of the federal grants program: “i think that’s the dumbest thing i’ve seen coming out of education in my years in education,” he said.
sources: “turning around minnesota’s worst schools,” by Emily Johns and norman draper, minneapolis star-tribune, may 26, 2010. retrieved from http://www.startribune.com/templates/fdcp?1278962100937 on July 12, 2010.
“an unfortunate case study in what’s wrong with inflexible education reform: brooklyn Center”by beth hawkins, thursday, June 10, 2010. retrieved from http://www.minnpost.com/stories/2010/06/10/18819/an_unfortunate_case_study_in_whats_wrong_with_inflexible_education_reform_brooklyn_center on July 13, 2010
“Overnight—overnight,it absolutely decreased the amount of behavioral issues.” Brian Bass

our CommunitiEs lEft bEhind 5
analYsEs of sig-EligiblE sChools have been impeded by the absence of a comprehensive national data base of these schools. We constructed a database of tiers i and ii of sig-eligible schools based on states’ applications to the department of Education (Ed). to the extent possible, we used the version of states’ applications made public by Ed on their website, subsequent to approval. for the twelve states whose applications had not been approved as of July 9, 2010, we located final applications submitted or lists of identified schools on the state education agency websites. While the findings for these states (see Appendix III for a list of these states and the data sources used) must be considered preliminary, we are confident that the lists of eligible schools will not change or will change very little in the approved applications.
We used the u.s. department of Education’s national Center for Education statistics Common Core of data Public Elementary/secondary school universe survey for the 2007-08 school year to construct a unique data set, with demographic and economic data on sig-eligible schools, to begin to examine the demographics of sig schools nationwide.
the non-fiscal element of the Common Core of data (CCd) consists of survey data submitted annually to the national Center for Education statistics (nCEs) by state education agencies (sEas) in the fifty states, the district of Columbia, Puerto rico, the four outlying areas, the department of defense dependents schools (overseas and domestic), and the bureau of indian Education. We chose to rely on the CCd because its data items and definitions are comparable across states, and because it is a well respected data source used by the federal government and the education research community.
We constructed our data set to include selected demographic, economic and geographic information on all 102,012 schools in all fifty states plus d.C., merging in flags for 2,136 sig schools. sig schools that were too
new to appear in the 2008 CCd were stripped out of our analyses. We matched all 2,136 sig schools to the schools in the 2008 CCd by a unique nCEs id number called a local Education agency id number.
the requirements for school improvement grants specify that each state submit an application to the department of Education identifying three tiers of schools eligible for grants. our analysis includes only tier i and ii schools, since they are prioritized for funding and are the only schools bound by the four turnaround models. as of July 13, 2010, in the nine states8 which had publicly announced their school improvement grants, 92% of grants had been made to tier i and tier ii schools. throughout this report, we use the terms “sig eligible” and “sig schools” to refer to those schools included by states in tiers i and ii.
tier i consists of the “persistently lowest achieving” 5% (or 5, whichever is greater) of title i participating schools in improvement, corrective action or restructuring status, plus any title i participating secondary school in improvement, corrective action or restructuring with a graduation rate below 60% for a “number of years.”
tier ii consists of the “persistently lowest achieving” 5% (or 5) of secondary schools that are eligible for but not participating in title i, plus any secondary school eligible for but not participating in title i with a graduation rate below 60% for a “number of years”.
states have discretion in determining what constitutes an appropriate “number of years” for identifying schools with low graduation rates and/or persistent low achievement. optionally, states can add to each tier any title i eligible school that is in the lowest achieving 20% of schools statewide or has missed adequate Yearly Progress for two consecutive years, and is no higher achieving than the highest-achieving school already identified in each tier.9 thus, the proportion of schools identified as eligible in each state varies.
Methodology

6 our CommunitiEs lEft bEhind
cAse study
christoPher columBus hiGh school—new york city
one of the schools on new York state’s target list is Christopher Columbus high school in the bronx. the new York City department of Education announced last december that the school would close, under the federal sig guidelines.
the federal sig program is data driven, meaning that schools are targeted on the basis of their test scores and graduation rates. there is no opportunity, within the federal intervention program, to assess external factors such as district assignment policies, funding inequities or others, that can wreak havoc in local schools.
over the last several years, new York City’s department of Education has closed a significant number of comprehensive high schools. in their place, the department has opened up new, small schools that are intended to offer a more optimal learning environment. the small schools, however, cannot accommodate all the students displaced by a big school closure. some of the most disadvantaged children from the closed high schools have been bumped instead, to other large, comprehensive schools—like Columbus high school.
the school closings across new York have shifted the city’s student population dramatically. Columbus has borne the brunt of this demographic shift, with rapidly-increasing numbers of very high-needs students. today, nearly in 1 in 5 students at Columbus are English language learners, and nearly 1 in every 4 are special Education students, many of them severely disabled. last year’s seniors entered Columbus in 2004 with only 6% meeting English language arts standards and only 14% meeting math standards. a large percentage of Columbus students are transient, entering the school mid-year. in short, Columbus high
school has one of the largest percentages of high-needs students in the city.
Columbus is also overcrowded. When last year’s seniors entered Columbus in the fall of 2004, the school was operating at 180% capacity. to manage the overcrowding, the school was forced to implement “back-to-back” schedules, with juniors and seniors attending school from 7:30a.m.–12:30p.m., and freshmen and sophomores coming for a second “shift” from 12:30p.m.–6:00p.m. the academic program was stripped down to the absolutely essential, and extra-curricular activities were decimated.
the new York City department of Education has acknowledged the difficulties of such high concentrations of need in individual schools. a study commissioned by the department a few years ago found that there was a “tipping point” in schools, at which the concentration of high needs students became so overwhelming that it created an obstacle virtually no school could completely overcome. a separate report, by the Center for new York City affairs, also identified the significant “collateral damage” that has resulted from the department of Education’s school closings and new small schools creation. the report acknowledged that the concentration of high-needs students has been one such impact. though teachers have pleaded for new policies that would help take some of the load off Columbus, no relief has been offered.
A study commissioned by the Department a few years ago found that there was a “tipping point” in schools, at which the concentration of high needs students became so overwhelming that it created an obstacle virtually no school could completely overcome.

our CommunitiEs lEft bEhind 7
cAse study
christoPher columBus hiGh school—new york city (continued)
but Columbus high school has strong leadership, and an on-site “teachers Center” that provides support to the school staff. the staff has worked tirelessly to come up with solutions. the school reorganized into four small learning communities in the 9th and 10th grades, and created another program focused on career and educational future in the 11th and 12th grades. special programs were created for students with particular challenges: boys to men for male students with severe behavioral issues, Women’s Empowerment for analogously situated female students and renaissance academy for students with substance abuse, teen pregnancy and physical abuse issues. they put together a special program to support the large numbers of English language learners at the school.
in its justification for its decision to close Columbus, the department of Education points to absolute measures such as four year graduation rates and student test scores. but being “data driven” does not tell the whole story, or provide a context for those statistics. the department of Education cites the fact that only 50% of last year’s graduation cohort met standards for English language acquisition, but it neglects to point out that the school made dramatic progress, given that only 6% of that cohort met Ela standards when they entered the school. it makes much of the four-year graduation rate, but fails to note that Columbus sticks by its high needs students as long as it takes and graduates large numbers in five, six and seven years. indeed, the latest seven-year graduation rates shows Columbus at 81.5%, nearly ten percentage points better than the citywide average of 72.2%.
Closing Columbus will not improve the educational opportunities of the school’s students. instead, it will simply disburse them across the city to other comprehensive high schools, contributing to more overcrowding and more difficult teaching and learning conditions at those schools. sustainable school transformation, including a comprehensive and inclusive process of identifying the school’s and students’ needs, holds more promise for real change.
sources: “the Closing of new York City Public schools: a Case of “Persistently failing doE management’” by leo Casey, december 13, 2009. retrieved from http://www.edwize.org/the-closing-of-new-york-city-public-schools-a-case-of-persistently-failing-doe-management on July 13, 2010.
“Christopher Columbus high school: a Context for accountability,” by Christine rowland, in gothamschools.org. retrieved from http://gothamschools.org/2009/12/11/christopher-columbus-high-school-a-context-for-accountability/ on July 13, 2010

8 our CommunitiEs lEft bEhind
based on federal guidelines, 51 jurisdictions (each state, plus the district of Columbia) have identified 2,136 schools as most in need of intervention and school improvement grants. approximately half of the schools are identified as tier i and the other half as tier ii. together, schools identified for tier i and tier ii of the sig program make up 2% of the schools in the nation.
nearly 1.5 million students attend these targeted schools. While every state has sig-eligible schools, 61% of the students attending sig-eligible schools are concentrated in just nine states (mississippi, massachusetts, texas, michigan, new York, florida, illinois, Pennsylvania, and California).10
the demographics of sig-eligible schools are not representative of schools across the nation. black, hispanic and low-income students are disproportionally served by these schools. nationally, 81% of students in sig schools
are students of color—the largest proportions being black students (44%) followed by hispanic students (32%).
as seen in graph 1, while 44% of students in the targeted schools are black, only 16% of the students in the rest of the schools in the nation are black. While 32% of students in sig-eligible schools are hispanic, only 21% of students attending the rest of the schools in the nation are hispanic.
Proportionally, black students are 72 times more likely to be in a sig-eligible school than white students; and hispanic students are 42 times more likely to be in a sig-eligible school than white students.
What We Found
source: u.s. department of Education, national Center for Education statistics. Common Core of data Public Elementary/secondary school universe survey: school Year 2007-08.note: the race and ethnicity labels used throughout this report reflect those of the national Center for Education statistics in order to maintain consistency with data collection methods.
0
10
20
30
40
50
60
70
80
90
100
Black Hispanic American Indian/Alaska Native
White Asian Pacific Islander
■ SIG-eligible Schools ■ Rest of Schools in Nation
% of
stud
ents
43.8
2.1 1.2
19.0
56.4
3.0 4.9
16.1
32.0
20.7
GrAPh 1. distributions of students by race, 2008
Proportionally, Black students are 7 2 times more likely to be in a SIG-eligible school than white students; and Hispanic students are 4 2 times more likely to be in a SIG-eligible school than white students.

our CommunitiEs lEft bEhind 9
similarly, low-income students are overrepresented in sig-eligible schools (see graph 2). While this is not surprising, since only schools receiving or eligible for title i funding can receive sig funds, it is still noteworthy to see the high concentrations of poverty among the students at these schools.
nationally, 69% of students in sig-eligible schools are poor (defined by eligibility for free and reduced price lunch) compared to 42.5% of students attending the rest of the schools in the nation.
the income discrepancies between students attending sig-eligible schools and students attending other schools in the nation are even more pronounced when analyzing the concentration of poor students at sig-eligible schools. schools in which more than half of students are eligible for free and reduced price lunch are considered high concentration poverty schools. schools in which more than 90% of the students are eligible for free and reduced priced lunch are considered to have extreme concentrations of poverty.11
as graph 3 shows, 76% of sig-eligible schools face high concentrations of poverty, compared to 36% in the rest of the schools in the nation.
18% of sig schools face extreme concentrations of poverty, compared to 6% of non-sig schools.
across the country, sig-eligible schools are located in urban, suburban, and rural areas. however, sig-eligible schools are disproportionally located in cities—54% of sig-eligible schools are in urban areas while only 26% of schools nationally, are in urban communities (see graph 4).
the nearly 1.5 million students in 2,136 sig-eligible schools across the country are disproportionately black and hispanic, and are overwhelmingly poor. through the obama administration’s school improvement grants Program, theirs are the schools that have been targeted for closure, conversion to charters, reconstitution or other mandated interventions.
source: u.s. department of Education, national Center for Education statistics. Common Core of data Public Elementary/secondary school universe survey: school Year 2007-08.note: “high poverty schools “are defined as those schools in which more than 50% of students are eligible for frPl, “Extremely poor schools” are defined as those schools in which more than 90% of students are eligible for frPl.
0 20 40 60 80 100
0
10
20
30
40
50
60
70
80
90
100
SIG-eligible Schools
Rest ofSchoolsin Nation
% of students
69.0
42.5%
of sc
hool
s
SIG-eligible Schools Rest of Schools in Nation
76.0% high poverty
36.2% high poverty
18.4%extremely poor
5.5% extremely poor
GrAPh 3. Poor schools, 2008
source: u.s. department of Education, national Center for Education statistics. Common Core of data Public Elementary/secondary school universe survey: school Year 2007-08.
0 20 40 60 80 100
0
10
20
30
40
50
60
70
80
90
100
SIG-eligible Schools
Rest ofSchoolsin Nation
% of students
69.0
42.5
% of
scho
ols
SIG-eligible Schools Rest of Schools in Nation
76.0% high poverty
36.2% high poverty
18.4%extremely poor
5.5% extremely poor
GrAPh 2. students eligible for free and reduced Price lunch, 2008

10 our CommunitiEs lEft bEhind
the administration’s chosen interventions have not required input from the students, parents, communities and educators who learn, work and send their children to these schools every day. Even the secretary of Education’s recent commitment12 to bring communities to the table provides for their input only on which of the four models to implement in their schools—not on whether these models are the right ones to begin with. Without their investment from the beginning, the response to these sweeping interventions will often be anger, confusion, mistrust and demoralization. instead, students, parents and communities must be offered a real and meaningful role in determining what their schools and students need and what the research shows about how to get there. Change that is built by those closest to the ground is change most likely to be relevant and sustained.
the administration’s “school turnaround” policies do not provide for that engagement. for that reason, Communities for Excellent Public schools has developed a proposal for a new approach to school turnaround.
We want dramatic and sustainable change in our schools. but our communities want to be part of building that change, not the targets of it.
source: u.s. department of Education, national Center for Education statistics. Common Core of data Public Elementary/secondary school universe survey: school Year 2007-08.note: Percentages do not add up to 100% as we did not include the distribution of schools in “towns”City/urban—includes large (250,000 or more), midsize (less than 250,000 and greater or equal to 100,000), and small (less than 100,000)territories inside an urbanized area and inside a principal city.suburban—includes large (250,000 or more), midsize (less than 250,000 and greater or equal to 100,000), and small (less than 100,000) territories outside a principal city and inside an urbanized area.rural—includes fringe (less than or equal to 5 miles from an urbanized area, as well as less than or equal to 2.5 miles from an urban cluster), distant (more than 5 miles but less than or equal to 25 miles from an urbanized area, as well as more than 2.5 miles but less than or equal to 10 miles from an urban cluster), and remote (more than 25 miles from an urbanized area, and more than 10 miles from an urban cluster) Census-defined rural territories.
0
10
20
30
40
50
60
70
80
90
100
■ City/Urban Areas ■ Suburban Areas ■ Rural Areas
% of
scho
ols
Rest of Schools in Nation SIG-eligible Schools
54.1
17.8 18.825.6 27.8 31.5
GrAPh 4. Geographical distribution of schools, 2008
The Secretary of Education’s recent commitment13 to bring communities to the table provides for their input only on which of the four models to implement in their schools—not on whether these models are the right ones to begin with.

our CommunitiEs lEft bEhind 11
the interventions required by the administration’s school improvement grants (sig) program are looming for nearly 1.5 million students in 2,136 schools across the country. but the dramatic interventions being imposed through this program—and proposed as the foundation of the reauthorization of the Elementary and secondary Education act (EsEa)—will, in many cases, undermine, rather than strengthen schools in our communities and will not lead to sustained reform.
communitiesforexcellentPublicschoolshasanewapproachtoschoolturnaround.We call it “sustainable school transformation.” at its core, our proposal places priority on three components:
• theimplementationofresearch-basedstrategieswiththebesttrackrecordofpositivelyimpactinginstruction,culture,curriculumandstaffingwithinschools;
• wrap-aroundsupportstomeetthenon-academicneedsofextremelydisadvantagedstudentsinthesecommunities;
• Acarefullycraftedassessmentandplan,developedincollaborationwitheducators,parents,students,communitiesandoutsideexperts.
What is sustainable school transformation?many of the best education researchers in the country have expressed concern over the types of punitive sanctions that the administration is employing through its school improvement grants program. top-down mandates like school closure, staff firings and outside management in and of themselves have no research-based justification and have not proven successful in generating lasting improvement in public schools.14 there is a better approach.
three elements of successful, sustainable school transformation1.Astrongfocusonschoolinstruction,culture,curriculumandstaffingWhile in some circumstances, structural or staffing changes may be necessary to ensure real improvement at a school, these changes are not sufficient to turn around a school, in and of themselves. successful schools feature a highly qualified staff, high expectations and a challenging and engaging curriculum that prepares all students for higher education and meaningful work and civic participation. a school’s academic program must be comprehensive and research-based, and supported with the necessary resources.
our Sustainable School Transformation proposal outlines the types of strategies and supports necessary to build school cultures conducive to high quality teaching and learning, and academic programs that are challenging and hold high expectations for all students.
2.wrap-Aroundsupportsforourstudentsas critical as good teachers are to improving student achievement, students cannot learn to their full potential when they are hungry, exhausted or ill, when their parents cannot support them at home, or when they feel unsafe or disrespected in school. a comprehensive turnaround plan must assess and address student needs and organize the supports necessary for them to succeed academically.
across the country, many schools that have constructed the social service scaffolding necessary to ensure that all students have their basic health and emotional needs met, have witnessed significant changes in student academic performance. our Sustainable School Transformation plan makes the development of these structures for wrap-around support an integral part of the transformation effort.
A Call for Sustainable School Transformation

12 our CommunitiEs lEft bEhind
3.collaborationtoensurelocalownershipandAccountabilityfamilies, students, communities and school staff, must play a meaningful role in designing and implementing a school transformation plan. the process of planning and implementing a school transformation is a key element in its success.
We support an inclusive process to assess a school’s strengths, challenges and needs. a visioning process should then be utilized to design a transformation plan to address those needs. district or state support should be provided to ensure that this process is rigorous and efficient, and adequate time should be dedicated to it. We also believe that where possible, districts should establish networks of schools in transition, so that leaders and educators can work together, share best practices and learn from each other.
the Best opportunity for sustainable school transformationrather than requiring districts to choose one of four highly prescriptive options, federal policy should support and guide districts through three key elements—a collaborative and inclusive process, comprehensive instructional and school culture reform, and coordinating services to meet student needs—to transforming low-performing schools. this set of approaches allows local flexibility, while still requiring dramatic and comprehensive action. it also increases accountability, by creating community ownership of the reform plan and establishing clear interim milestones and goals for the transformation.
a more detailed description of CEPs’ sustainable school transformation Proposal is available at www.ceps-ourschools.org.
endnotes1 mintrop, h. and g. sunderman. 2009. “Predictable failure of federal sanctions-Driven accountability for school improvement and why we may retain it anyway,” Educational researcher 38:353. online at http://edr.sagepub.com/cgi/content/abstract/38/5/3532 mathis, W. 2009. “NCLB’s ultimate restructuring alternatives: Do they improve the quality of education?”, the great lakes Center for Education research and Practice, East lansing, mi.3 Cohen, d. and s. moffitt. 2009. “The ordeal of equality: Did federal regulation fix the Schools?”4 Center on Education Policy. 2009. “Improving low performing schools: Lessons from five years of studying school restructuring under No Child Left Behind.” http://www.cep-dc.org/.5 indeed, school closings in Chicago have been widely documented as being detrimental to displaced students. see lipman, P. 2007. “students as collateral damage?: a preliminary study of renaissance 2010 school closings in the midsouth,” university of illinois, Chicago. see also duffrin, E. 2006. “Slow progress amid strife,” Catalyst. on-line http://www.catalystchicago.org/news/index.php?item=1935&cat=23 6 mathis, W. 2009. NCLB’s ultimate restructuring alternatives: Do they improve the quality of education?. boulder and tempe: Education and the Public interest Center & Education Policy research unit. online at http://epicpolicy.org/files/mathis-sanCtions.pdf 7 mintrop, h. and g.l. sunderman. 2009. “Predictable failure of federal sanctions-Driven accountability for school improvement and why we may retain it anyway,” Educational researcher 38:353. online at http://edr.sagepub.com/cgi/content/abstract/38/5/3538 alabama, iowa, indiana, north Carolina, new Jersey, ohio, oregon, utah, and Washington. of 127 schools funded by these states, 117 are tier i or tier ii schools. for a list of schools funded by these states, along with their tier and selected intervention model, see “summary of sig-funded schools, 7/13/10,” national Education association http://neapriorityschools.org/2010/06/24/schools-awarded-sig-by-state/9 for a detailed explanation of the schools eligible for inclusion in each tier, see appendix iV.10 recall that states have flexibility in how broadly or narrowly they define eligibility, and that the number of schools that receive grants will depend on states’ allocations determined by formula. see appendix iV.11 We based our definition of high poverty and extreme poverty on the work of the uCla (formerly harvard) Civil rights Project. see orfield, g. and C. lee. 2005. “Why segregation matters: Poverty and educational inequality.” Cambridge: Civil rights Project, harvard university.12 mcneil. m. 2010. “Want turnaround money? Involve parents, Duncan proposes,” EdWeek Politics K-12 blog. July 14, 2010. online at http://blogs.edweek.org/edweek/campaign-k-12/.13 ibid. 14 mathis, W. 2009.

our CommunitiEs lEft bEhind 13
APPENDICES
i. list of siG schools, By stAte And conGressionAl district (with enrollment)
State Cong.Dist. SIG School Name Tier Total # of
Students*Alabama 01 Monroeville Jr High School 1 470 Alabama 01 Augusta Evans School 2 243 Alabama 01 Continuous Learning Ctr 2 58 Alabama 02 Merritt Elem School 1 118 Alabama 02 Samson Middle School 1 120 Alabama 02 Calhoun High School 1 317 Alabama 02 Jackson-Steele Elem School 1 225 Alabama 02 Hayneville Middle School 1 247 Alabama 02 Lowndes Co Middle School 1 213 Alabama 02 Hayneville Road Elem School 1 315 Alabama 02 Barbour County Middle School 2 318 Alabama 02 Capitol Heights Jr High School 2 703 Alabama 02 Childrens Ctr 2 68 Alabama 03 Anniston Middle School 1 522 Alabama 03 Lafayette Eastside Elem School 1 374 Alabama 03 Five Points Elem School 1 201 Alabama 03 Central High School 1 431 Alabama 03 Central Middle School 1 413 Alabama 03 Bellingrath Jr High School 1 508 Alabama 03 Southlawn Middle School 1 503 Alabama 03 John P Powell Middle School 2 196 Alabama 03 Notasulga High School 2 393 Alabama 04 Asbury School 1 854 Alabama 04 Cullman Child Dev Ctr 2 88 Alabama 04 Litchfield Middle School 2 294 Alabama 05 Edward White Middle School 1 476 Alabama 05 West Mastin Lake Elem School 1 307 Alabama 05 Westlawn Middle School 1 223 Alabama 05 Chapman Middle School 1 328 Alabama 05 The Seldon Ctr 2 212 Alabama 07 Bush Middle Sch-Magnet 1 396 Alabama 07 Hill Elem School 1 242 Alabama 07 Lewis Elem School 1 324 Alabama 07 Whatley Elem School 1 310 Alabama 07 Gaston Kinderg-Eighth School 1 333
State Cong.Dist. SIG School Name Tier Total # of
Students*Alabama 07 Brantley Elem School 1 309 Alabama 07 Five Points Elem School 1 205 Alabama 07 Keith Middle-High School 1 331 Alabama 07 William R Martin Middle School 1 329 Alabama 07 Forest Hills Middle School 1 560 Alabama 07 Robinson Elem School 1 266 Alabama 07 John Essex High School 1 213 Alabama 07 Midfield Elem School 1 439 Alabama 07 Eastwood Middle School 1 887 Alabama 07 Westlawn Middle School 1 539 Alabama 07 Holt Elem School 1 418 Alabama 07 Davis-Emerson Middle School 1 393 Alabama 07 Camden Sch of Arts & Tech 2 305
Total Number of SIG-eligible Students in State 16,537 Alaska 00 Chaputnguak School 1 168 Alaska 00 William Miller Memorial School 1 89 Alaska 00 Ket’acik/Aapalluk Memorial School 1 256 Alaska 00 Kuinerrarmiut Elitnaurviat 1 196 Alaska 00 Nightmute School 1 85 Alaska 00 Hooper Bay School 1 405 Alaska 00 Russian Mission School 1 105 Alaska 00 Kotlik School 1 202 Alaska 00 Sheldon Point School 1 59 Alaska 00 Akiachak School 1 211 Alaska 00 Tuluksak School 1 157 Alaska 00 Akiak School 1 99 Alaska 00 Chevak School 1 329 Alaska 00 Gambell School 1 184 Alaska 00 Koyuk-Malemute School 1 111 Alaska 00 Hogarth Kingeekuk Memorial School 1 226 Alaska 00 Aniguiin School 1 76 Alaska 00 Anthony A. Andrews School 1 143 Alaska 00 Tukurngailnguq School 1 188 Alaska 00 Dillingham Middle/High School 1 275 Alaska 00 Whaley School 1 560

14 our CommunitiEs lEft bEhind
State Cong.Dist. SIG School Name Tier Total # of
Students*Alaska 00 Midvalley High 1 208 Alaska 00 Burchell High School 1 216 Alaska 00 Davis-Ramoth School 1 255 Alaska 00 Joann A. Alexie Memorial School 2 89 Alaska 00 Dick R Kiunya Memorial School 2 128 Alaska 00 Nelson Island Area School 2 238 Alaska 00 Emmonak School 2 250 Alaska 00 Pace Correspondence 2 413 Alaska 00 Effie Kokrine Charter School 2 151 Alaska 00 McQueen School 2 107
Total Number of SIG-eligible Students in State 6,179
Arizona 01 Shonto Preparatory Technology High School 1 146
Arizona 01 Mountain English Spanish Academy of Flagstaff (M.E.) 1 27
Arizona 01 White Cone High School 1 137 Arizona 01 Laugharn Elementary School 1 103 Arizona 01 Valley High School 1 399 Arizona 01 San Carlos Junior High School 1 267 Arizona 01 San Carlos Intermediate 1 276 Arizona 01 Alchesay High School 1 707 Arizona 01 Canyon Day Junior High School 1 289 Arizona 01 Seven Mile School 1 452 Arizona 01 Rimrock Public High School 2 51 Arizona 01 Seligman High School 2 43 Arizona 02 La Puerta High School 1 100 Arizona 02 Mt Tipton Elementary School 1 350 Arizona 02 Peach Springs School 1 140 Arizona 04 Crittenton Youth Academy 1 189 Arizona 04 Academy of Arizona - Main 1 267 Arizona 04 Premier Charter High School 1 292 Arizona 04 Imagine Elementary at Camelback 1 295
Arizona 04 James Sandoval Preparatory High School 2 176
Arizona 06 East Valley High School 2 136 Arizona 07 Calli Ollin Academy 1 57 Arizona 07 Calli Ollin Academy 1 71 Arizona 07 Ira H. Hayes High School 1 97 Arizona 07 Pima Partnership School The 1 137 Arizona 07 Toltecali Academy 1 144 Arizona 07 Gadsden Elementary School 1 408 Arizona 07 Baboquivari High School 1 278 Arizona 07 Howenstine High School 2 217 Arizona 07 Project More High School 2 248
Total Number of SIG-eligible Students in State 6,499
State Cong.Dist. SIG School Name Tier Total # of
Students*Arkansas 01 Earle High School 1 291 Arkansas 01 Central High School 1 798 Arkansas 01 Hughes High School 1 252 Arkansas 01 Marvell High School 1 326 Arkansas 01 Osceola Middle School 1 170 Arkansas 01 Osceola High School 1 397 Arkansas 01 Turrell High School 1 144 Arkansas 01 Palestine-Wheatley Senior High 2 193 Arkansas 02 Cloverdale Middle School 1 773 Arkansas 02 Lynch Drive Elementary School 1 340 Arkansas 02 Rose City Middle School 1 175 Arkansas 02 Hall High School 2 1,500 Arkansas 02 J.A. Fair High School 2 1,024 Arkansas 02 Jacksonville High School 2 1,089 Arkansas 03 Trusty Elementary School 1 362 Arkansas 04 Dermott High School 1 268 Arkansas 04 Dollarway Middle School 1 411 Arkansas 04 Dollarway High School 1 601 Arkansas 04 Pine Bluff High School 2 1,034
Total Number of SIG-eligible Students in State 10,148 California 01 Hoopa Valley Elementary 1 442 California 01 Castle Rock 2 412 California 02 Ella Elementary 1 555 California 04 Bijou Community 1 480 California 05 Oak Ridge Elementary 1 437
California 05 Highlands Academy of Arts and Design 2 1,484
California 05 Encina Preparatory High 2 744 California 06 Kawana Elementary 1 387 California 07 Bel Air Elementary 1 458 California 07 Shore Acres Elementary 1 531 California 07 Rio Vista Elementary 1 428 California 07 Lincoln Elementary 1 407 California 07 Glenbrook Middle 2 690 California 07 De Anza Senior High 2 1,019 California 07 Helms Middle 2 685 California 07 Hogan High 2 1,538 California 07 Vallejo High 2 1,774 California 08 Brown, Jr., (Willie L.) Elementary 1 238 California 08 Bryant Elementary 1 223
California 08 George Washington Carver Elementary 1 244
California 08 Cesar Chavez Elementary 1 421 California 08 Horace Mann Middle 1 427

our CommunitiEs lEft bEhind 15
State Cong.Dist. SIG School Name Tier Total # of
Students*California 08 John Muir Elementary 1 214 California 08 Paul Revere Elementary 1 412 California 08 Everett Middle 1 497 California 08 Mission High 2 912 California 08 John O’Connell Alternative High 2 735 California 09 Explore Middle 1 209 California 09 Roots International Academy 1 321 California 09 United For Success Academy 1 371 California 09 Elmhurst Community Prep 1 347 California 09 Alliance Academy 1 338 CalifornIa 09 Hillside Elementary 1 489 California 10 Meadow Homes Elementary 1 847 California 10 Oak Grove Middle 1 667 California 11 Sutherland Elementary 1 400 California 11 Lawrence Elementary 1 545 California 13 Burbank Elementary 1 677 California 13 Longwood Elementary 1 726 California 13 Tennyson High 2 1,695 California 14 Pescadero Elementary and Middle 1 179 California 14 Costano Elementary 1 369 California 14 Edison-Ronald Mcnair Intermediate 1 403 California 14 Stanford New School 1 504 California 16 Cesar Chavez Elementary 1 602
California 16 Escuela Popular Accelerated Family Learning 1 281
California 17 Bardin Elementary 1 734
California 17 Dr. Martin Luther King, Jr., Elementary Academy 1 491
California 17 Chualar Elementary 1 325 California 17 Greenfield Elementary 1 531 California 17 Vista Verde Middle 1 759 California 17 Greenfield High 1 1,014 California 17 Highland Elementary 1 430 California 17 Martin Luther King 1 744 California 17 Castroville Elementary 1 586 California 17 Calabasas Elementary 1 699 California 17 Hall District Elementary 1 559 California 17 T. S. Macquiddy Elementary 1 582 California 17 Rose Ferrero Elementary 1 405 California 17 San Juan 1 422 California 17 Seaside High 2 1,259 California 17 E. A. Hall Middle 2 647 California 17 Watsonville High 2 2,130 California 18 Robertson Road Elementary 1 451
State Cong.Dist. SIG School Name Tier Total # of
Students*California 18 Harrison Elementary 1 663 California 18 Nightingale Elementary 1 498 California 18 Roosevelt Elementary 1 564 California 18 Taylor Skills Elementary 1 621 California 18 Richard A. Pittman Elementary 1 709 California 18 Wilhelmina Henry Elementary 1 935 California 18 John C. Fremont Elementary 1 784 California 20 Sierra Vista Elementary 1 828 California 20 Bear Mountain Elementary 1 1,043 California 20 Buttonwillow Elementary 1 371 California 20 Carver Academy 1 309 California 20 Webster Elementary 1 471 California 20 Yosemite Middle 1 738 California 20 Lakeside Elementary 1 193 California 20 McFarland High 1 827 California 20 Martinez (John C.) Elementary 1 460 California 20 Parlier Junior High 1 554 California 20 Avenal Elementary 1 768 California 20 Semitropic Elementary 1 241 California 20 Palm Avenue Elementary 1 730 California 21 George L. Snowden Elementary 1 376 California 21 Alta Vista Elementary 1 470 California 21 Jefferson Elementary 1 697 California 21 Highland Elementary 1 574 California 21 Waukena Joint Union Elementary 1 225 California 21 Farmersville High 2 609 California 21 Lindsay Senior High 2 1,109 California 22 Beardsley Intermediate 1 394 California 22 Shirley Lane Elementary 1 712 California 22 Maricopa Elementary 1 210 California 22 Kern County Community 1 1,571 California 22 Littlerock High 2 2,001 California 23 Adam (William Laird) Elementary 1 636 California 23 Alvin Elementary 1 669 California 23 Calvin C. Oakley Elementary 1 809
California 23 Cesar Estrada Chavez Dual Language Immersion Chart 1 240
California 25 Tumbleweed Elementary 1 982 California 25 Antelope Valley High 2 2,080 California 25 Eastside High 2 1,949 California 25 Cactus Middle 2 1,064
California 27 Robert Fulton College Preparatory School 1 2,047
California 27 East Valley Senior High 1 1,099

16 our CommunitiEs lEft bEhind
State Cong.Dist. SIG School Name Tier Total # of
Students*California 28 San Fernando Senior High 2 3,338 California 28 Sun Valley Middle 2 2,544 California 28 Sylmar Senior High 2 3,605 California 31 Thomas Jefferson Senior High 1 1,971 California 31 William Jefferson ClInton Middle 1 1,181 California 32 Valleydale Elementary 1 397 California 33 Angeles Mesa Elementary 1 486 California 33 Audubon Middle 1 1,322 California 33 Crenshaw Senior High 1 2,075 California 33 Hillcrest Drive Elementary 1 919 California 33 Manual Arts Senior High 1 3,447 California 33 Today’s Fresh Start Charter 1 548 California 33 Los Angeles Senior High 2 3,348 California 34 Henry T. Gage Middle 1 3,343 California 34 Robert Louis Stevenson Middle 1 2,468 California 34 Belmont Senior High 1 4,178
California 34 Miguel Contreras Learning Complex 1 1,316
California 34 Maywood Academy High 2 1,337 California 35 Lane (Warren) Elementary 1 604 California 35 Century Academy for Excellence 1 244 California 35 George Washington Carver Middle 1 2,174 California 35 Henry Clay Middle 1 1,580 California 35 Charles Drew Middle 1 2,324 California 35 Gardena Senior High 1 3,181 California 35 Samuel Gompers Middle 1 1,711 California 35 John Muir Middle 1 2,165 California 35 Florence Griffith Joyner Elementary 1 990
California 35 George Washington Preparatory High 1 2,603
California 35 Woodcrest Elementary 1 974 California 35 Crozier (George W.) Middle 2 1,243 California 35 Monroe (Albert F.) Middle 2 1,115 California 37 Centennial High 1 1,442 California 37 Dominguez High 1 2,630 California 37 Walton Middle 1 607 California 37 Whaley Middle 1 1,089 California 37 Davis Middle 1 1,414 California 37 Edwin Markham Middle 1 1,570 California 37 Vanguard Learning Center 2 472 California 37 Willowbrook Middle 2 602 California 37 Carson Senior High 2 3,405 California 38 William Workman High 2 1,204 California 38 Emerson Middle 2 927
State Cong.Dist. SIG School Name Tier Total # of
Students*California 38 Fremont Middle 2 763 California 38 Pomona Senior High 2 1,565 California 39 Martin Luther King Elementary 1 551
California 39 International Studies Learning Center 1 700
California 39 Lynwood High 1 4,087 California 39 Lynwood Middle 1 1,751 California 39 Pharis F. Fedde Middle 2 503 California 39 South East High 2 2,734 California 41 Desert Hot Springs High 1 1,969 California 41 Serrano Middle 2 1,130 California 43 Barton Elementary 1 489 California 43 Davidson Elementary 1 534 California 43 Hunt Elementary 1 797 California 43 Marshall Elementary 1 612 California 43 Rio Vista Elementary 1 631 California 43 Wilson Elementary 1 693 California 43 Pacific High 1 2,199 California 43 Fontana A. B. Miller High 2 3,155 California 43 San Gorgonio High 2 3,070 California 43 Shandin Hills Middle 2 1,460 California 43 Arroyo Valley High 2 3,027 California 44 Riverside County Community 1 1,239 California 44 Norte Vista High 2 2,370 California 45 March Mountain High 2 746 California 45 Palo Verde High 2 915 California 47 Valley High 1 2,638 California 47 Willard Intermediate 1 1,270 California 47 Century High 1 2,537 California 47 Saddleback High 2 2,278 California 47 Santa Ana High 2 3,675 California 48 Sierra Intermediate 2 907 California 49 Good Hope Elementary 1 853 California 49 Perris High 2 2,800 California 50 Felicita Elementary 1 703 California 51 West Shores High 1 399 California 53 Burbank Elementary 1 352 California 53 San Diego Business 1 488 California 53 San Diego MVP Arts 1 494 California 53 King/Chavez Arts Academy 1 155 California 53 Charter School of San Diego 2 1,857
Total Number of SIG-eligible Students in State 205,551 Colorado 01 Gilpin K-8 School 1 401 Colorado 01 Greenlee K-8 School 1 550

our CommunitiEs lEft bEhind 17
State Cong.Dist. SIG School Name Tier Total # of
Students*Colorado 01 Philips Elementary School 1 210 Colorado 01 Montbello High School 1 1,580 Colorado 01 Fort Logan Elementary School 1 272 Colorado 01 Vanguard Classical School 2 314 Colorado 01 Lake Middle School 2 603 Colorado 01 North High School 2 1,080 Colorado 01 Rishel Middle School 2 532 Colorado 01 P.S.1 Charter School 2 280 Colorado 01 Noel Middle School 2 749 Colorado 01 Academy of Urban Learning 2 69 Colorado 01 Skyland Community High School 2 140
Colorado 01 Colorado’s Finest Alternative High School 2 540
Colorado 02 Boulder Prep Charter High School 2 156 Colorado 02 Justice High Charter School 2 81 Colorado 02 Global Leadership Academy 2 353 Colorado 02 Achieve Academy 2 385 Colorado 02 Clayton Partnership School 2 399 Colorado 02 Meadow Community School 2 403 Colorado 02 Vantage Point 2 260
Colorado 02 Arapahoe Ridge Elementary School 2 644
Colorado 02 Crossroad Alternative School 2 52 Colorado 02 Colorado Virtual Academy (Cova) 2 3,341 Colorado 02 New America School 2 255 Colorado 02 Hidden Lake High School 2 161 Colorado 03 Haskin Elementary School 1 289 Colorado 03 Clifton Elementary School 1 446 Colorado 03 Freed Middle School 1 480 Colorado 03 Youth & Family Academy Charter 1 222 Colorado 03 Archuleta County High School 2 53 Colorado 03 Southwest Open Charter School 2 159 Colorado 03 Delta County Opportunity School 2 49 Colorado 03 Central High School 2 1,697 Colorado 03 R-5 High School 2 246 Colorado 03 Tiger Learning Center 2 23 Colorado 03 Byron Syring Delta Center 2 78 Colorado 03 Vista Charter School 2 171 Colorado 03 James H Risley Middle School 2 316 Colorado 03 Lemuel Pitts Middle School 2 583 Colorado 03 Roncalli Middle School 2 632 Colorado 03 Jefferson Middle School 2 189 Colorado 04 Liberty Junior-Senior High School 2 48 Colorado 04 Centennial High School 2 133
State Cong.Dist. SIG School Name Tier Total # of
Students*Colorado 04 Polaris Expeditionary Learning School 2 191 Colorado 04 Lincoln High School 2 48 Colorado 04 John Evans Middle School 2 605 Colorado 04 Colorado High School of Greeley 2 107 Colorado 04 Olde Columbine High School 2 108 Colorado 04 Smith High School 2 24 Colorado 05 Community Prep Chart Er School 2 187 Colorado 05 Bijou Alternative Program 2 131 Colorado 05 Lorraine Secondary School 2 75 Colorado 05 New Horizons Day School 2 209 Colorado 05 Discovery High School 2 95 Colorado 07 Hanson Elementary School 1 425
Colorado 07 Colorado Distance & Electronic Learning Academy 2 317
Colorado 07 Lester R Arnold High School 2 213 Colorado 07 Aurora Central High School 2 2,247 Colorado 07 William Smith High School 2 198 Colorado 07 Brighton Heritage Academy 2 288 Colorado 07 Jefferson County Open Secondary 2 355 Colorado 07 Brady Exploration School 2 189 Colorado 07 New America School 2 224 Colorado 07 McLain High School 2 475 Colorado 07 Johnson Intervention 2 52
Total Number of SIG-eligible Students in State 26,387 Connecticut 01 Sanchez School 1 580 Connecticut 01 Burns School 1 533 Connecticut 01 Quirk Middle School 1 575 Connecticut 01 Sand School 1 366 Connecticut 01 Milner School 1 360 Connecticut 01 Weaver High School 1 1,260 Connecticut 01 Dr. Ramon E. Betances School 1 403 Connecticut 02 Natchaug School 1 310
Connecticut 03 Collaborative Alternative Magnet School 1 99
Connecticut 03 Hill Central Music Academy 1 433 Connecticut 03 Katherine Brennan School 1 206 Connecticut 03 Hyde Leadership School 2 204 Connecticut 03 James Hillhouse High School 2 1,087 Connecticut 03 Wilbur Cross High School 2 1,795 Connecticut 04 Stamford Academy 1 132 Connecticut 04 Barnum School 1 279 Connecticut 04 Roosevelt School 1 727 Connecticut 04 Dunbar School 1 363 Connecticut 04 Bassick High School 2 1,287

18 our CommunitiEs lEft bEhind
State Cong.Dist. SIG School Name Tier Total # of
Students*Connecticut 04 Harding High School 2 1,722 Connecticut 05 Chamberlain School 1 582 Connecticut 05 Northend School 1 287 Connecticut 05 Smalley Academy 1 671
Total Number of SIG-eligible Students in State 14,261 Delaware 00 Positive Outcomes Charter School 1 116
Delaware 00 Frederick Douglass Stubbs Elementary School 1 293
Delaware 00 Casimir Pulaski Elementary School 1 272 Delaware 00 Bancroft Elementary School 1 703 Delaware 00 Warner Elementary School 1 673 Delaware 00 William Penn High School 2 2,282 Delaware 00 Calvin R. McCullough Middle School 2 815 Delaware 00 Mount Pleasant High School 2 959 Delaware 00 Thomas McKean High School 2 985 Delaware 00 John Dickinson High School 2 874 Delaware 00 Seaford Senior High School 2 810
Total Number of SIG-eligible Students in State 8,782 DC 98 Options PCS 1 297 DC 98 Eastern SHS 1 992 DC 98 Dunbar SHS 1 913 DC 98 Anacostia SHS 1 1,087 DC 98 Prospect LC 1 149 DC 98 Spingarn SHS 1 717 DC 98 Browne JHS 1 248 DC 98 Kenilworth ES 1 260 DC 98 Moore Academy SHS 1 381
DC 98 Hamilton Center Special Ed at Hamilton School 1 53
Total Number of SIG-eligible Students in State 5,097 Florida 01 Warrington Middle School 1 897 Florida 02 West Gadsden High School 1 561 Florida 02 East Gadsden High School 1 1,088 Florida 02 Amos P. Godby High School 1 1,298
Florida 03 Charles W. Duval Elementary School 1 466
Florida 03 Marjorie Kinnan Rawlings Elementary School 1 439
Florida 03 Andrew Jackson High School 1 1,611 Florida 03 North Shore Elementary School 1 373 Florida 03 Paxon Middle School 1 805 Florida 03 Jean Ribault High School 1 953 Florida 03 Long Branch Elementary School 1 295 Florida 03 Smart Pope Livingston Elementary 1 546
State Cong.Dist. SIG School Name Tier Total # of
Students*Florida 03 Northwestern Middle School 1 570 Florida 03 William M. Raines High School 1 1,249 Florida 03 A. Philip Randolph Academies 1 970 Florida 03 Memorial Middle School 1 704 Florida 03 Hawthorne Middle/High School 2 436 Florida 03 Evans High School 2 1,983 Florida 04 Central Hamilton Elementary School 1 480
Florida 04 Jefferson County Middle/High School 1 481
Florida 04 Madison County High School 1 724 Florida 04 Columbia High School 2 1,929 Florida 04 Hamilton County High School 2 812 Florida 05 Hernando High School 2 1,480 Florida 05 Central High School 2 2,056 Florida 06 Nathan B. Forrest High School 1 1,870 Florida 06 Edward H. WhIte High School 1 2,190 Florida 06 Leesburg High School 2 1,750 Florida 06 Williston High School 2 649 Florida 07 St. Johns Technical High School 1 253 Florida 08 Oak Ridge High School 2 2,074 Florida 08 Celebration High School 2 1,731 Florida 09 Ridgewood High School 2 1,993 Florida 10 Boca Ciega High School 2 2,007 Florida 10 Dixie M. Hollins High School 2 1,800 Florida 11 Franklin Middle Magnet School 1 633 Florida 11 Middleton High School 1 1,667 Florida 11 Gibbs High School 2 2,115 Florida 11 Lakewood High School 2 1,651 Florida 12 Oscar J. Pope Elementary School 1 425 Florida 13 Hardee Senior High School 2 1,303 Florida 15 Gateway High School 2 2,406 Florida 15 Poinciana High School 2 1,517 Florida 16 Clewiston High School 2 1,010 Florida 17 Frederick R. Douglass Elementary 1 541 Florida 17 Holmes Elementary School 1 368 Florida 17 Little River Elementary School 1 602 Florida 17 North County Elementary School 1 395
Florida 17 Dr. Henry W. Mack/West Little River Elementary School 1 383
Florida 17 Charles R. Drew Middle School 1 707 Florida 17 Miami Edison Middle School 1 529 Florida 17 North Miami Middle School 1 917 Florida 17 Miami Carol City Senior High 1 2,469 Florida 17 Miami Central Senior High School 1 2,086

our CommunitiEs lEft bEhind 19
State Cong.Dist. SIG School Name Tier Total # of
Students*Florida 17 Miami Edison Senior High School 1 1,150 Florida 17 Miami Norland Senior High School 1 1,852 Florida 17 Miami Northwestern Senior High 1 2,442 Florida 17 North Miami Senior High School 1 2,823 Florida 17 Booker T. Washington Senior High 1 1,349 Florida 18 Pine Villa Elementary School 1 609 Florida 18 Miami Jackson Senior High School 1 1,555 Florida 19 Coconut Creek High School 1 2,416 Florida 23 Sunland Park Elementary School 1 438 Florida 23 Larkdale Elementary School 1 498 Florida 23 Lake Worth High School 1 2,200 Florida 23 Glades Central High School 1 1,213 Florida 23 Rosenwald Elementary School 1 301 Florida 25 Immokalee High School 1 1,437 Florida 25 Homestead Senior High School 1 2,527 Florida 25 Miami Southridge Senior High 1 3,459
Total Number of SIG-eligible Students in State 87,516 Georgia 02 Dooly County High School 1 375 Georgia 02 Albany High School 1 813
Georgia 02 Dougherty Comprehensive High School 1 983
Georgia 02 Spencer High School 1 983 Georgia 02 Jordan Vocational High School 1 960 Georgia 02 Stewart-Quitman High School 1 211 Georgia 02 Central Elementary/High School 1 683 Georgia 02 Taylor County High School 1 450 Georgia 02 Cairo High School 2 1,205 Georgia 02 Peach County High School 2 1,220 Georgia 03 Griffin High School 1 1,596 Georgia 03 Henry County High School 2 940 Georgia 04 Atlanta Area School for the Deaf 1 195 Georgia 04 Clarkston High School 1 1,045 Georgia 04 Southwest Dekalb High School 2 1,832 Georgia 05 Douglass High School 1 1,852 Georgia 05 Crim High School 1 664 Georgia 05 McNair High School 1 1,277 Georgia 05 Open Campus High School 2 843 Georgia 08 Northeast High School 1 878 Georgia 08 Southwest High School 1 942 Georgia 08 William S. Hutchings Career Center 1 391 Georgia 08 Rutland High School 1 1,189 Georgia 08 Hawkinsville High School 2 476 Georgia 09 Ridgeland High School 1 1,284 Georgia 09 Dade County High School 2 762
State Cong.Dist. SIG School Name Tier Total # of
Students*Georgia 10 Towns County High School 2 339 Georgia 11 Georgia School for the Deaf 1 99 Georgia 11 Harpst Academy 1 51 Georgia 11 Temple High School 2 688 Georgia 12 Burke County High School 1 1,347 Georgia 12 Beach High School 1 1,045 Georgia 12 Josey High School 1 905 Georgia 12 Glenn Hills High School 1 961 Georgia 12 Laney High School 1 624
Total Number of SIG-eligible Students in State 30,108
Hawaii 01 Hawaii Center for the Deaf and Blind 1 79
Hawaii 02 Naalehu Elementary & Intermediate School 1 422
Hawaii 02 Waianae Elementary School 1 595Hawaii 02 Nanakuli Elementary School 1 476Hawaii 02 Maili Elementary School 1 795Hawaii 02 Kamaile Elementary School 1 660
Total Number of SIG-eligible Students in State 3,027 Idaho 01 Jefferson Middle School 1 746 Idaho 01 Lakeside Elementary School 1 234 Idaho 01 Holmes Elementary School 1 215 Idaho 01 Melba Middle School 2 185 Idaho 02 Aberdeen Middle School 1 205 Idaho 02 Fort Hall Elementary School 1 130 Idaho 02 Blackfoot Community Learning 1 120 Idaho 02 West Elementary School 1 506 Idaho 02 Shoshone Elementary School 1 320 Idaho 02 Hacker Middle School 2 889 Idaho 02 Murtaugh Middle School 2 35 Idaho 02 Shoshone Middle School 2 129 Idaho 02 Snake River Jr High School 2 273
Total Number of SIG-eligible Students in State 3,987 Illinois 01 Harper High School 1 1,258 Illinois 01 Julian High School 1 1,646 Illinois 01 Robeson High School 1 1,271 Illinois 01 Dyett High School 1 598 Illinois 01 Entrepreneurship High School 1 513 Illinois 01 School of Technology High School 1 466 Illinois 01 School of Leadership High School 1 441 Illinois 01 DD Eisenhower High School (Campus) 2 1,768
Illinois 01 Simeon Career Academy High School 2 1,566
Illinois 01 Youth Connections Charter HS 2 2,842

20 our CommunitiEs lEft bEhind
State Cong.Dist. SIG School Name Tier Total # of
Students*Illinois 02 Fenger Academy High School 1 1,189
Illinois 02 Chicago Vocational Career Academy HS 1 1,874
Illinois 02 Corliss High School 1 1,249 Illinois 02 Bowen Environmental Studies HS 1 317 Illinois 02 Chicago Discovery Academy HS 1 391 Illinois 02 New Millenium Health High School 1 367 Illinois 02 Global Visions High School 1 330 Illinois 02 Bloom High School 2 1,669 Illinois 02 Bloom Trail High School 2 1,603 Illinois 02 Hillcrest High School 2 1,248 Illinois 02 Carver Military Academy HS 2 495 Illinois 02 Harlan Community Academy HS 2 1,415 Illinois 02 Hyde Park Academy High School 2 2,313 Illinois 02 Washington G High School 2 1,565 Illinois 02 Rich South Campus High School 2 1,352
Illinois 02 Thornton Fractional North High School 2 1,671
Illinois 02 Thornridge High School 2 1,862 Illinois 02 Thornton Township High School 2 2,407 Illinois 02 Thornwood High School 2 2,333 Illinois 03 Bogan High School 1 2,002 Illinois 03 Richards Career Academy HS 1 594 Illinois 03 Hancock College Preparatory HS 1 913 Illinois 03 Hubbard High School 2 1,702 Illinois 03 Kennedy High School 2 1,637 Illinois 03 J Sterling Morton West High School 2 3,184 Illinois 04 Juarez Community Academy HS 1 1,547 Illinois 04 Farragut Career Academy HS 1 2,114 Illinois 04 Gage Park High School 1 1,591 Illinois 04 Kelvyn Park High School 1 1,559
Illinois 04 Clemente Community Academy High School 1 2,183
Illinois 04 Roosevelt High School 1 1,595 Illinois 04 Wells Community Academy HS 1 919 Illinois 04 North-Grand High School 1 907 Illinois 04 Kelly High School 2 3,195 Illinois 04 J Sterling Morton East High School 2 3,496 Illinois 04 Proviso West High School 2 2,711 Illinois 05 Amundsen High School 2 1,611 Illinois 05 Foreman High School 2 1,948 Illinois 05 Mather High School 2 1,800 Illinois 05 Schurz High School 2 2,034 Illinois 05 Steinmetz Academic Centre HS 2 1,947
State Cong.Dist. SIG School Name Tier Total # of
Students*Illinois 05 Chicago Academy High School 2 499
Illinois 07 Dunbar Vocational Career Academy HS 1 1,575
Illinois 07 Crane Technical Prep High School 1 981 Illinois 07 Marshall Metropolitan High School 1 1,270 Illinois 07 Phillips Academy High School 1 800
Illinois 07 Manley Career Academy High School 1 1,221
Illinois 07 Tilden Career Communty Academy HS 1 1,332
Illinois 07 Best Practice High School 1 289
Illinois 07 Ace Technical Charter High School 1 462
Illinois 07 Raby High School 1 543 Illinois 07 North Lawndale Charter HS 2 463 Illinois 07 Hope College Prep High School 2 1,056 Illinois 07 Phoenix Military Academy HS 2 311 Illinois 07 Douglass Academy High School 2 561 Illinois 07 Proviso East High School 2 1,872 Illinois 09 Senn High School 1 1,190 Illinois 09 Sullivan High School 1 884
Illinois 10 North Chicago Community High School 2 897
Illinois 10 Waukegan High School 2 4,278 Illinois 11 Depue High School 2 87 Illinois 11 Kankakee High School 2 1,296 Illinois 11 St Anne Comm High School 2 244 Illinois 12 SIU Charter School of East St Louis 1 106 Illinois 12 East St Louis Senior High School 1 1,969 Illinois 12 Madison Senior High School 1 241 Illinois 12 Cahokia High School 2 1,227 Illinois 12 Dongola High School 2 90 Illinois 12 Egyptian Sr High School 2 197 Illinois 12 Meridian High School 2 197 Illinois 14 East High School 2 2,816 Illinois 15 Eldorado High School 2 345 Illinois 16 Jefferson High School 2 2,085 Illinois 16 Rockford East High School 2 1,525 Illinois 17 Astoria High School 2 116 Illinois 17 Eisenhower High School 2 1,222 Illinois 17 Lanphier High School 2 1,288 Illinois 18 Bluffs High School 2 70 Illinois 18 Manual High School 2 588 Illinois 18 Peoria High School 2 934 Illinois 18 Woodruff High School 2 959

our CommunitiEs lEft bEhind 21
State Cong.Dist. SIG School Name Tier Total # of
Students*Illinois 19 Patoka Sr High School 2 90 Illinois 19 Sandoval Sr High School 2 157
Total Number of SIG-eligible Students in State 117,541 Indiana 01 Campagna Academy Charter School 1 105
Indiana 01 21st Century Charter School of Gary 1 315
Indiana 01 Gary Lighthouse Charter School 1 553 Indiana 01 East Chicago Lighthouse 1 204 Indiana 01 Kipp Lead High School 1 148 Indiana 01 West Gary Lighthouse 1 420 Indiana 01 East Chicago Central High School 2 1,532 Indiana 01 Lew Wallace High School 2 920 Indiana 01 Theodore Roosevelt High School 2 786 Indiana 01 West Side High School 2 1,336 Indiana 01 George Rogers Clark MD/HS 2 1,593 Indiana 01 Hammond High School 2 1,098 Indiana 02 Hawthorne Elementary School 1 621 Indiana 02 Beck Elementary School 1 528 Indiana 02 Madison Primary Center 1 627 Indiana 02 Dickinson Intermediate Center 1 555 Indiana 02 Marshall Intermediate Center 1 535 Indiana 02 Lafayette Early Childhood Center 1 535 Indiana 02 Brown Intermediate Center 1 674 Indiana 02 Bendix School 2 251 Indiana 03 Timothy L Johnson Academy 1 187 Indiana 03 Prince Chapman Academy 1 431 Indiana 03 Osolo Elementary School 1 662 Indiana 03 Miami Middle School 1 802 Indiana 05 Options Charter School Noblesville 2 129 Indiana 06 Galileo Charter School 1 221 Indiana 06 Anderson High School 2 1,495 Indiana 06 Paul Harding High School 2 563 Indiana 06 Wayne High School 2 1,048 Indiana 06 Youth Opportunity Center 2 114
Indiana 07 21st Century Charter School Fall Creek 1 321
Indiana 07 21st Century Fountain Square School 1 237
Indiana 07 Monument Lighthouse Charter School 1 316
Indiana 07 The Challenge Foundation Academy 1 338
Indiana 07 John Marshall Middle School 1 425 Indiana 07 George Washington Community 1 858 Indiana 07 Pacers Academy 1 55
State Cong.Dist. SIG School Name Tier Total # of
Students*Indiana 07 Key Learning Community II 1 174 Indiana 07 Decatur Discovery Academy 2 135
Indiana 07 Indianapolis Metropolitan High School 2 343
Indiana 07 Arlington High School 2 1,326 Indiana 07 Arsenal Technical High School 2 1,887 Indiana 07 Broad Ripple High School 2 1,179 Indiana 07 Emmerich Manual High School 2 1,217 Indiana 07 Northwest High School 2 975 Indiana 07 Thomas Carr Howe Academy 2 912 Indiana 07 New Horizons Alternative School 2 655 Indiana 07 The Renaissance School 2 202 Indiana 08 Glenwood Middle School 1 194 Indiana 08 John M Culver Elem School 1 330 Indiana 08 The Learning Center 1 80 Indiana 08 Christa McAuliffe Alt Mid School 1 28 Indiana 08 Henry Reis Educ Cntr-Alt High School 2 67 Indiana 08 McLean Education Center (Alt) 2 212 Indiana 08 Booker T Washington Alt School 2 100
Indiana 09 The Childrens Acad of New Albany 1 297
Indiana 09 Aurora Alternative School 2 101 Indiana 09 Cannelton Elem & High School 2 280
Total Number of SIG-eligible Students in State 32,232 Iowa 01 Jack M Logan Middle School 1 366 Iowa 01 Lincoln Elementary School 1 461 Iowa 01 Olin Junior-Senior High School 2 113 Iowa 01 Bunger Middle School 2 539 Iowa 01 East High School 2 1,284 Iowa 01 Central Middle School 2 525 Iowa 02 Oak Street Middle School 2 439 Iowa 02 Cardinal Middle-Senior High School 2 359 Iowa 02 Roosevelt Middle School 2 565 Iowa 02 Metro High School 2 577 Iowa 02 Wilson Middle School 2 276 Iowa 02 Columbus Community High School 2 307
Iowa 02 Columbus Community Middle School 2 240
Iowa 02 Louisa-Muscatine Jr-Sr High School 2 482
Iowa 02 Wapello Junior High School 2 117 Iowa 03 Edmunds Fine Arts Academy 1 175 Iowa 03 Hoyt Middle School 1 591 Iowa 03 North High School 1 1,143

22 our CommunitiEs lEft bEhind
State Cong.Dist. SIG School Name Tier Total # of
Students*Iowa 03 Weeks Middle School 1 749 Iowa 03 Colfax-Mingo Middle School 2 197 Iowa 03 East High School 2 2,219 Iowa 03 Hoover High School 2 1,191 Iowa 03 Lincoln High School 2 2,200 Iowa 03 McCombs Middle School 2 592 Iowa 03 Meredith Middle School 2 659 Iowa 03 Woodside Middle School 2 307 Iowa 03 South Tama County Middle School 2 348 Iowa 04 Grand Junction High School 2 196 Iowa 04 B R Miller Middle School 2 828 Iowa 05 Thomas Jefferson High School 2 1,272 Iowa 05 Lewis Central Middle School 2 657 Iowa 05 North Middle School 2 1,118 Iowa 05 West High School 2 1,218 Iowa 05 West Middle School 2 920 Iowa 05 West Monona Middle School 2 162
Total Number of SIG-eligible Students in State 23,392 Kansas 01 Liberal South Middle 1 350Kansas 01 Liberal Sr High 2 1,235Kansas 02 South East High 2 250Kansas 02 Highland Park High 2 860Kansas 03 Emerson Elem 1 293Kansas 03 Mark Twain Elem 1 168Kansas 03 Northwest Middle 1 272Kansas 03 Wyandotte High 2 1,175Kansas 03 J C Harmon High 2 1,218Kansas 03 F L Schlagle High 2 988Kansas 03 Washington High 2 949Kansas 03 Fairfax Campus 2 179Kansas 04 Curtis Middle School 1 712Kansas 04 North High 2 1,795Kansas 04 South High 2 1,674Kansas 04 Southeast High 2 1,806Kansas 04 West High 2 1,161Kansas 04 Metro Midtown Alt High 2 130
Total Number of SIG-eligible Students in State 15,215 Kentucky 01 Metcalfe County High School 2 539 Kentucky 02 Robert Frost Middle School 1 331 Kentucky 02 Caverna High School 2 231 Kentucky 03 Valley Traditional High School 1 859 Kentucky 03 Western Mst Magnet High School 1 941
Kentucky 03 Shawnee High School Magnet Career Academy 1 729
State Cong.Dist. SIG School Name Tier Total # of
Students*Kentucky 03 Western Middle School 1 466 Kentucky 03 Fern Creek Traditional High School 2 1,493 Kentucky 05 Lawrence County High School 2 818 Kentucky 05 Leslie County High School 2 555
Total Number of SIG-eligible Students in State 6,962 Louisiana 01 Alfred Bonnabel High School 1 1,421 Louisiana 01 Riverdale High School 1 807 Louisiana 01 West Jefferson High School 1 1,398 Louisiana 02 Joseph S. Clark Senior High School 1 592
Louisiana 02 John McDonogh Senior High School 1 513
Louisiana 02 Fredrick A. Douglass High School 1 411
Louisiana 02 Rabouin Career Magnet High School 1 667
Louisiana 02 Albert Wicker Elementary School 1 378
Louisiana 02 Sarah Towles Reed Senior High School 1 581
Louisiana 02 John Ehret High School 1 1,899 Louisiana 03 Ellender Memorial High School 1 983 Louisiana 03 Assumption High School 2 1,138 Louisiana 03 Jeanerette Senior High School 2 318 Louisiana 04 Fair Park High School 1 737 Louisiana 04 Green Oaks High School 1 483 Louisiana 04 Booker T. Washington High School 1 398 Louisiana 04 Woodlawn High School 1 809 Louisiana 04 Huntington High School 2 1,110 Louisiana 04 Natchitoches Central High School 2 1,310
Louisiana 05 Louisiana School for the Agricultural Sciences 1 310
Louisiana 05 Madison High School 1 417 Louisiana 05 Carroll High School 1 625 Louisiana 05 Delhi High School 1 168 Louisiana 05 Marksville High School 2 559 Louisiana 05 Livonia High School 2 614 Louisiana 06 Baker High School 1 483 Louisiana 06 Belaire High School 1 978 Louisiana 06 Istrouma Senior High School 1 831 Louisiana 06 Tara High School 1 891
Louisiana 06 East Iberville Elementary/High School 1 492
Louisiana 07 Northside High School 1 913 Louisiana 07 Crowley High School 2 629
Total Number of SIG-eligible Students in State 23,863 Maine 01 Riverton School 1 449 Maine 01 Lake Region High School 2 661

our CommunitiEs lEft bEhind 23
State Cong.Dist. SIG School Name Tier Total # of
Students*Maine 02 Deer Isle-Stonington High School 1 178 Maine 02 Sumner Memorial High School 1 312
Maine 02 Governor James B Longley Elem School 1 296
Maine 02 Houlton High School 1 383 Maine 02 Livermore Falls High School 2 361 Maine 02 Madison Area Memorial HS 2 303 Maine 02 Sad 70 Hodgdon High School 2 211 Maine 02 Carrabec High School 2 263
Total Number of SIG-eligible Students in State 3,417 Maryland 02 Benjamin Franklin Jr. Middle 2 306Maryland 02 Cherry Hill Elementary/Middle 2 386Maryland 03 Chinquapin Middle 1 637Maryland 04 Drew Freeman Middle 2 751Maryland 04 G. James Gholson Middle 2 759Maryland 04 Benjamin Stoddert Middle 2 690Maryland 04 Thurgood Marshall Middle School 2 720Maryland 07 Booker T. Washington Middle 1 505Maryland 07 Calverton 1 811Maryland 07 Garrison Middle 1 640Maryland 07 Harford Heights Middle 1 432
Maryland 07 Commodore John Rogers Elementary 2 303
Maryland 07 Frederick Douglass High 2 973Maryland 07 Francis M. Wood Alternative High 2 357
Maryland 07 Augusta Fells Savage Institute of Visual Arts 2 453
Maryland 07 Institute of Business and Entrepreneurship 2 560
Total Number of SIG-eligible Students in State 9,283 Massachusetts 01 Morgan Elem 1 495 Massachusetts 01 Wm J Dean Voc Tech High 1 750 Massachusetts 01 Athol-Royalston Middle School 2 432 Massachusetts 02 High School/Science-Tech 1 1,622 Massachusetts 02 Brightwood 1 422 Massachusetts 02 Elias Brookings 1 464 Massachusetts 02 High School of Commerce 1 1,445 Massachusetts 02 Homer Street 1 389 Massachusetts 02 Alfred G Zanetti 1 508 Massachusetts 02 Gerena 1 639 Massachusetts 02 White Street 1 366 Massachusetts 02 Springfield Academy for Excellence 1 373 Massachusetts 02 Chestnut Street Middle 1 1,224 Massachusetts 02 John F Kennedy Middle 1 778
State Cong.Dist. SIG School Name Tier Total # of
Students*Massachusetts 02 M Marcus Kiley Middle 1 829 Massachusetts 02 Primavera Jr/Sr HS 2 28 Massachusetts 02 Bellamy Middle 2 964 Massachusetts 02 Chicopee Academy 2 98 Massachusetts 02 Van Sickle Middle School 2 935 Massachusetts 02 John J Duggan Middle 2 437 Massachusetts 02 Forest Park Middle 2 914 Massachusetts 02 Bartlett Jr Sr High School 2 897 Massachusetts 03 Chandler Elem Community 1 312 Massachusetts 03 Union Hill School 1 280 Massachusetts 03 Claremont Academy 2 364 Massachusetts 03 Sullivan Middle 2 871 Massachusetts 04 John J Doran 1 407 Massachusetts 04 John Avery Parker 1 360 Massachusetts 04 West Side Jr-Sr HS 1 129 Massachusetts 04 Morton Middle 2 638 Massachusetts 04 Keith Middle School 2 1,108 Massachusetts 04 Normandin Middle School 2 1,068 Massachusetts 04 Roosevelt Middle School 2 772 Massachusetts 04 James L Mulcahey 2 538 Massachusetts 04 John F Parker Middle 2 447
Massachusetts 04 Wareham Cooperative Junior/Senior High School 2 105
Massachusetts 05 Lowell Community Charter Public School 1 923
Massachusetts 05 Arlington Elementary School 1 468
Massachusetts 05 South Lawrence East Middle School 1 532
Massachusetts 05 School For Exceptional Studies 1 222
Massachusetts 05 Business Management & Finance High School 1 484
Massachusetts 05 International High School 1 479
Massachusetts 05 Humanities & Leadership Development High School 1 494
Massachusetts 05 Charlotte M Murkland Elem 1 489
Massachusetts 05 Lowell Middlesex Academy Charter School 2 94
Massachusetts 05 Dr Paul Nettle 2 371 Massachusetts 05 Haverhill Alternative School 2 45 Massachusetts 06 E J Harrington 1 607 Massachusetts 06 Wm P Connery 1 493 Massachusetts 06 Thurgood Marshall Mid 2 795 Massachusetts 06 Breed Middle School 2 1,126 Massachusetts 06 Lynn Voc Tech Institute 2 1,200 Massachusetts 06 Collins Middle 2 664

24 our CommunitiEs lEft bEhind
State Cong.Dist. SIG School Name Tier Total # of
Students*Massachusetts 07 Seacoast School 1 107 Massachusetts 07 Fuller Middle 2 534 Massachusetts 07 Curtis-Tufts 2 36 Massachusetts 07 Rumney Marsh Academy 2 429
Massachusetts 08 Boston Day and Evening Academy Charter School 1 267
Massachusetts 08 Agassiz 1 562 Massachusetts 08 Blackstone 1 597 Massachusetts 08 Brighton High 1 1,305 Massachusetts 08 Charlestown High 1 1,226 Massachusetts 08 Dearborn 1 360 Massachusetts 08 East Boston High 1 1,491 Massachusetts 08 Elihu Greenwood 1 345 Massachusetts 08 Jeremiah E Burke High 1 730 Massachusetts 08 John F Kennedy 1 376 Massachusetts 08 John P Holland 1 660 Massachusetts 08 Madison Park High 1 1,574 Massachusetts 08 The English High 1 820 Massachusetts 08 William Mckinley 1 430 Massachusetts 08 William Monroe Trotter 1 377 Massachusetts 08 Harbor School 1 261
Massachusetts 08 Community Academy of Science and Health 1 388
Massachusetts 08 The Engineering School 1 344 Massachusetts 08 Social Justice Academy 1 343 Massachusetts 08 Orchard Gardens 1 669 Massachusetts 08 Boston International High School 1 164 Massachusetts 08 Chelsea High 1 1,477
Massachusetts 08 Smith Leadership Academy Charter Public School 2 200
Massachusetts 08 Phoenix Charter Academy 2 123 Massachusetts 08 Mario Umana Middle School Acad 2 600 Massachusetts 08 Egleston Comm High School 2 118 Massachusetts 08 Quincy Upper School 2 488 Massachusetts 08 Boston Adult Academy 2 280 Massachusetts 08 Community Academy 2 75 Massachusetts 08 Eugene Wright School 2 473 Massachusetts 08 Joseph A. Browne School 2 406 Massachusetts 08 Full Circle High School 2 51 Massachusetts 09 Paul A Dever 1 480 Massachusetts 09 Excel High School 1 393 Massachusetts 09 Monument High School 1 359 Massachusetts 09 Odyssey High School 1 360 Massachusetts 09 Lincoln Alternative School 1 56
State Cong.Dist. SIG School Name Tier Total # of
Students*Massachusetts 09 Patrick F Gavin Middle 2 460 Massachusetts 09 Washington Irving Middle 2 684 Massachusetts 09 North Junior High 2 501 Massachusetts 09 West Junior High 2 528 Massachusetts 09 B B Russell Alternative School 2 92 Massachusetts 10 Point Webster Middle 2 343
Total Number of SIG-eligible Students in State 54,836 Michigan 01 Whittemore-Prescott Area HS 2 338 Michigan 02 Muskegon Heights High School 1 519 Michigan 02 Grant High School 2 667 Michigan 03 Lee High School 2 392 Michigan 03 Alger Middle School 2 519 Michigan 03 Gerald R. Ford Middle School 2 470 Michigan 03 Lincoln School 2 222 Michigan 03 Ottawa Hills High School 2 950 Michigan 03 Union High School 2 1,043 Michigan 03 Westwood Middle School 2 366 Michigan 05 Buena Vista High School 2 343
Michigan 05 Northwestern Commencement Academy 2 529
Michigan 05 Northern Commencement Academy 2 644
Michigan 05 E.A. Johnson Memorial HS 2 862
Michigan 05 Ruben Daniels Alt. Middle School-Central 2 4
Michigan 05 Arthur Hill High School 2 1,418 Michigan 05 Saginaw High School 2 1,060 Michigan 05 Hamady Community High School 2 371 Michigan 06 Benton Harbor High School 2 776 Michigan 06 Buchanan High School 2 541 Michigan 06 Covert High School 2 237 Michigan 06 Milwood Middle School 2 566
Michigan 06 Maple Street Magnet School for the Arts 2 575
Michigan 07 Adrian High School 2 1,179 Michigan 07 Springport High School 2 343 Michigan 07 Waldron Middle School 2 74 Michigan 08 New City Academy 2 170 Michigan 09 Pontiac Academy for Excellence 2 1,106 Michigan 09 Pontiac Northern High School 2 1,318
Michigan 11 Michigan Technical Academy High School 2 396
Michigan 11 Burger Development Center 2 327 Michigan 11 Elem. Day Treatment 2 115 Michigan 12 Academy of Oak Park-High School 2 526

our CommunitiEs lEft bEhind 25
State Cong.Dist. SIG School Name Tier Total # of
Students*Michigan 12 Conner Creek Academy East-High 2 235 Michigan 12 Conner Creek Academy-High 2 444 Michigan 12 University High School 2 363 Michigan 12 Fitzgerald Senior High School 2 1,086 Michigan 12 Mt. Clemens High School 2 671 Michigan 12 Oak Park High School 2 1,623 Michigan 12 Roseville Junior High School 2 989
Michigan 12 Southfield Regional Academic Campus 2 369
Michigan 12 Lincoln High School 2 973 Michigan 13 Kettering West Wing 1 244 Michigan 13 Denby High School 1 1,576 Michigan 13 Fleming Elementary School 1 613 Michigan 13 Southwestern High School 1 767 Michigan 13 Phoenix Elementary 1 654 Michigan 13 Ross/Hill Academy-Elementary 2 157 Michigan 13 Crockett High School 2 791 Michigan 13 Scott Brenda Middle School 2 696 Michigan 13 Detroit High School for Technology 2 197 Michigan 13 Keidan Special Education School 2 255 Michigan 13 Holmes A.L. Elementary School 2 637 Michigan 13 Earhart Middle School 2 644 Michigan 13 Central High School 2 1,253 Michigan 13 Duffield Elementary School 2 518 Michigan 13 Farwell Middle School 2 591 Michigan 13 Finney High School 2 1,000 Michigan 13 Hutchinson Elementary School 2 415 Michigan 13 Kettering High School 2 1,142 Michigan 13 Law Elementary School 2 955 Michigan 13 Northwestern High School 2 1,605 Michigan 13 Osborn High School 2 1,450 Michigan 13 Pershing High School 2 1,436 Michigan 13 Pulaski Elementary School 2 750 Michigan 13 Southeastern High School 2 2,519 Michigan 13 Fisher Magnet 2 581 Michigan 13 Trix Elementary School 2 427 Michigan 13 Western International High School 2 1,625 Michigan 13 White Elementary School 2 667 Michigan 13 Harper Woods Middle School 2 198 Michigan 13 Lincoln Park Middle School 2 747 Michigan 13 River Rouge High School 2 382
Michigan 14 Detroit Community Schools-High School 1 596
Michigan 14 West Side Academy Alt. Ed 1 599
State Cong.Dist. SIG School Name Tier Total # of
Students*Michigan 14 Cooley North Wing 1 165
Michigan 14 Lessenger Elementary-Middle School 1 480
Michigan 14 Aisha Shule/Web Dubois Prep. Academy School 2 268
Michigan 14 Michigan Health Academy 2 188
Michigan 14 Academy For Business and Technology High School 2 379
Michigan 14 Weston Technical Academy 2 445 Michigan 14 Old Redford Academy - High 2 600
Michigan 14 George Washington Carver Academy 2 527
Michigan 14 Jemison School of Choice 2 687
Michigan 14 Communication and Media Arts High School 2 511
Michigan 14 Vetal Elementary School 2 561 Michigan 14 Barbara Jordan Elementary 2 757 Michigan 14 Cody High School 2 1,282 Michigan 14 Coffey Elementary/Middle School 2 506 Michigan 14 Cooley High School 2 1,530 Michigan 14 Fitzgerald Elementary School 2 576 Michigan 14 Bethune Academy 2 691 Michigan 14 Ford High School 2 1,949 Michigan 14 Mumford High School 2 2,137
Michigan 14 Murphy Elementary-Middle School 2 493
Michigan 14 Nolan Elementary School 2 717 Michigan 14 Parker Elementary School 2 649 Michigan 14 Schulze Elementary School 2 627 Michigan 14 Taft Middle School 2 599 Michigan 14 Drew Middle School 2 432 Michigan 14 Highland Park Community HS 2 1,385 Michigan 15 Robichaud Senior High School 2 702 Michigan 15 Inkster High School 2 1,110 Michigan 15 Romulus Middle School 2 607 Michigan 15 Beacon Day Treatment Center 2 169 Michigan 15 Truman High School 2 1,777 Michigan 15 Willow Run High School 2 658
Total Number of SIG-eligible Students in State 76,570 Minnesota 01 Rochester Off-Campus Charter High 1 117
Minnesota 01 Worthington Area Language Academy 1 103
Minnesota 01 Riverway Secondary 2 55 Minnesota 01 Butterfield Secondary 2 94 Minnesota 03 Brooklyn Center Secondary 2 724

26 our CommunitiEs lEft bEhind
State Cong.Dist. SIG School Name Tier Total # of
Students*Minnesota 03 North View IB World School 2 951 Minnesota 04 New Spirit Primary School 1 227 Minnesota 04 High School for Recording Arts 1 176 Minnesota 04 Urban Academy Charter School 1 261 Minnesota 04 Humboldt Senior High 1 868 Minnesota 04 Maxfield Magnet Elementary 1 317 Minnesota 05 New Visions Charter School 1 236 Minnesota 05 Transitions Sr. High 1 267 Minnesota 05 Four Directions Charter Schools 1 99 Minnesota 05 English Academy Campus 1 214 Minnesota 05 Unity Campus 1 105 Minnesota 05 Bethune Elementary 1 365 Minnesota 05 Edison Senior High 1 1,020 Minnesota 05 Lucy Laney@Cleveland Park Elem 1 586 Minnesota 05 Cityview Pam Magnet 1 590 Minnesota 05 Broadway Arts & Technology 1 190 Minnesota 05 Wellstone International High 1 152 Minnesota 05 Hmong International Academy 1 273 Minnesota 05 Hmong Academy 2 330 Minnesota 07 Ponemah Elementary 1 185 Minnesota 07 Red Lake Senior High 1 345 Minnesota 07 Greenbush-Middle River Senior High 2 151 Minnesota 07 Waubun Secondary 2 263 Minnesota 08 Orr Secondary 2 142 Minnesota 08 Braham Area Secondary 2 407 Minnesota 08 Cass Lake-Bena Secondary 2 218 Minnesota 08 East Central Senior Secondary 2 196 Minnesota 08 Isle Secondary 2 260 Minnesota 08 Ogilvie Secondary 2 327
Total Number of SIG-eligible Students in State 10,814 Mississippi 01 Shivers Junior High School 2 270 Mississippi 01 Ashland High School 2 194 Mississippi 01 Coffeeville High School 2 240 Mississippi 01 Columbus High School 2 1,279 Mississippi 01 Holly Springs High School 2 521 Mississippi 01 Holly Springs Intermediate School 2 497 Mississippi 01 Plantersville Middle School 2 332 Mississippi 01 West Lowndes High School 2 211 Mississippi 01 Byhalia High School 2 517 Mississippi 01 North Panola High School 2 467 Mississippi 01 Okolona High School 2 321 Mississippi 01 Independence High School 2 473 Mississippi 01 West Point High School 2 1,081 Mississippi 02 Coahoma Agricultural High School 1 286
State Cong.Dist. SIG School Name Tier Total # of
Students*Mississippi 02 Hazlehurst High School 1 471 Mississippi 02 Williams Sullivan High School 1 525 Mississippi 02 J J McClain High School 1 858 Mississippi 02 Wingfield High School 1 1,159 Mississippi 02 West Bolivar Dist High School 2 304 Mississippi 02 Ray Brooks School 2 289 Mississippi 02 Broad Street High School 2 303 Mississippi 02 East Side High School 2 420 Mississippi 02 D. M. Smith Middle 2 216 Mississippi 02 McEvans School 2 376 Mississippi 02 Shaw High School 2 257 Mississippi 02 Canton Public High School 2 985 Mississippi 02 Port Gibson High School 2 543 Mississippi 02 Clarksdale High School 2 851 Mississippi 02 W A Higgins Middle School 2 397 Mississippi 02 Coahoma County Jr/Sr High School 2 620 Mississippi 02 Crystal Springs High School 2 514 Mississippi 02 Drew High School 2 192 Mississippi 02 Hunter Middle School 2 173 Mississippi 02 Charleston High School 2 410 Mississippi 02 Greenville Weston High School 2 1,736 Mississippi 02 Greenwood High School 2 781 Mississippi 02 Hazlehurst Middle School 2 473 Mississippi 02 Hinds County Agricultural HS 2 257 Mississippi 02 Carver Middle School 2 220 Mississippi 02 Raymond High School 2 569 Mississippi 02 Chambers Middle School 2 149 Mississippi 02 Simmons High School 2 258 Mississippi 02 S V Marshall High School 2 524 Mississippi 02 Humphreys Jr High School 2 291 Mississippi 02 Gentry High School 2 668 Mississippi 02 Forest Hill High School 2 1,150 Mississippi 02 Jim Hill High School 2 1,260 Mississippi 02 Provine High School 2 1,117 Mississippi 02 Jefferson Co High 2 434 Mississippi 02 Jefferson Co Jr High 2 241 Mississippi 02 Thomastown Attendance Center 2 368 Mississippi 02 East Elementary School 2 329 Mississippi 02 Leflore County High School 2 479 Mississippi 02 Amanda Elzy High School 2 684 Mississippi 02 Velma Jackson High School 2 369 Mississippi 02 M. S. Palmer High School 2 561 Mississippi 02 South Delta High School 2 336 Mississippi 02 Ruleville Central High School 2 331

our CommunitiEs lEft bEhind 27
State Cong.Dist. SIG School Name Tier Total # of
Students*Mississippi 02 Rosa Fort High School 2 570 Mississippi 02 Vicksburg High School 2 1,112 Mississippi 02 Warren Central High School 2 1,291 Mississippi 02 West Tallahatchie High School 2 482 Mississippi 02 O’Bannon High School 2 423 Mississippi 02 Yazoo City High School 2 774 Mississippi 03 South Pike Senior High School 1 589 Mississippi 03 Liberty Elementary School 2 558 Mississippi 03 Amite County High School 2 361 Mississippi 03 Collins High School 2 437 Mississippi 03 Bailey Magnet School 2 474 Mississippi 03 Bassfield High School 2 422 Mississippi 03 Prentiss Senior High School 2 591 Mississippi 03 Kemper County High School 2 578 Mississippi 03 South Leake High School 2 283 Mississippi 03 West Marion High School 2 418 Mississippi 03 Mccomb High School 2 824 Mississippi 03 Meridian High School 2 1,231 Mississippi 03 Natchez High School 2 1,165 Mississippi 03 Newton High School 2 338 Mississippi 03 Noxubee County High School 2 627 Mississippi 03 B F Liddell Middle School 2 520 Mississippi 03 West Oktibbeha County High 2 162 Mississippi 03 East Oktibbeha County High 2 237 Mississippi 03 Mendenhall High School 2 773 Mississippi 03 Dexter High School 2 261 Mississippi 03 Bay Springs High School 2 302 Mississippi 03 Wilkinson County High 2 420 Mississippi 04 Heidelberg High School 2 369 Mississippi 04 George County High School 2 1,198 Mississippi 04 Laurel High School 2 741 Mississippi 04 Lumberton High School 2 285 Mississippi 04 East Marion High School 2 285 Mississippi 04 Moss Point High School 2 948 Mississippi 04 Picayune Memorial High School 2 1,129
Total Number of SIG-eligible Students in State 51,315 Missouri 01 College Hill Campus 1 222 Missouri 01 Ashland Elem. and Br. 1 344 Missouri 01 Dunbar And Br. 1 232 Missouri 01 Hamilton Elem. Community Ed. 1 214 Missouri 01 Jefferson Elem. 1 286 Missouri 01 L’Ouverture Middle 1 207 Missouri 01 Langston Middle 1 311 Missouri 01 Stevens Middle Community Ed. 1 257
State Cong.Dist. SIG School Name Tier Total # of
Students*Missouri 01 Vashon High 1 713 Missouri 01 Walbridge Elem. Community Ed. 1 276 Missouri 01 Columbia Elem. Comm. Ed. Ctr. 1 193 Missouri 01 Central Elem. 1 221 Missouri 01 Eskridge High 1 195 Missouri 01 Construction Careers Center 2 434 Missouri 01 Berkeley Middle 2 364 Missouri 01 McCluer South-Berkeley High 2 742 Missouri 01 East Middle 2 490 Missouri 01 Jennings Jr. High 2 540 Missouri 01 Normandy Middle 2 740 Missouri 01 Normandy High 2 1,325 Missouri 01 Riverview Gardens Sr. High 2 1,976 Missouri 01 R. G. Central Middle 2 646 Missouri 01 Westview Middle 2 574 Missouri 01 Carr Lane VPA Middle 2 480 Missouri 01 Gateway Middle 2 375 Missouri 01 Sumner High 2 1,016 Missouri 01 Yeatman-Liddell Prep. Jr. High 2 317 Missouri 01 Bishop Middle 2 121 Missouri 03 Fanning Middle Community Ed. 1 289 Missouri 03 Mann Elem. 1 210 Missouri 03 Sigel Elem. Comm. Ed. Ctr. 1 200 Missouri 03 Lift for Life Academy 2 279 Missouri 03 Bunche International Studies 2 244 Missouri 03 Compton-Drew LLC Middle 2 439 Missouri 03 Long Middle Community Ed. Ctr. 2 294 Missouri 03 Roosevelt High 2 982 Missouri 03 Central Visual/Perf. Arts High 2 688 Missouri 05 B. Banneker Academy 1 177 Missouri 05 Genesis School Inc. 1 105 Missouri 05 Urban Com. Leadership Academy 1 249 Missouri 05 Richardson Elem. 1 237 Missouri 05 Alta Vista Charter School 2 176 Missouri 05 Ervin Jr. High 2 779 Missouri 05 Smith-Hale Jr. High 2 722 Missouri 05 Central High 2 966 Missouri 05 N.E. Law & Public Serv. Magnet 2 1,114 Missouri 05 Van Horn High 2 1,118 Missouri 05 K C Middle School of the Arts 2 506 Missouri 05 Westport High 2 659 Missouri 07 Ethel Hedgeman Lyle Academy 1 663 Missouri 08 Caruthersville Middle 2 306 Missouri 08 Hayti High 2 330
Total Number of SIG-eligible Students in State 25,543

28 our CommunitiEs lEft bEhind
State Cong.Dist. SIG School Name Tier Total # of
Students*Montana 00 Lame Deer High School 1 177Montana 00 Frazer High School 1 39Montana 00 Plenty Coups High School 1 65Montana 00 Hays-Lodge Pole High School 1 99Montana 00 Lodge Grass High School 1 132Montana 00 Pryor Elem School 1 32Montana 00 Pryor 7-8 1 13
Total Number of SIG-eligible Students in State 557 Nebraska 01 Umo N Ho N Nation High School 1 94 Nebraska 01 Elliott Elementary School 1 419 Nebraska 01 Madison Elementary School 1 202 Nebraska 01 Walthill High School 1 116 Nebraska 01 Winnebago High School 1 132 Nebraska 01 David City Secondary School 2 299 Nebraska 01 High School At Brainard 2 179 Nebraska 01 North Star High School 2 1,749 Nebraska 01 Lincoln High School 2 1,691 Nebraska 01 Lincoln Northeast High School 2 1,459 Nebraska 01 Wahoo High School 2 299 Nebraska 02 Bellevue East Sr High School 2 1,559 Nebraska 02 Benson Magnet High School 2 1,504 Nebraska 02 Central High School 2 2,549 Nebraska 02 Omaha North Magnet High School 2 2,039 Nebraska 02 Omaha South Magnet High School 2 1,733 Nebraska 03 Crawford Elementary School 1 124 Nebraska 03 Minatare Elementary School 1 118 Nebraska 03 Santee Elementary School 1 109 Nebraska 03 Santee High School 1 57 Nebraska 03 Cross County Hs-Stromsburg 2 126 Nebraska 03 Ainsworth Middle School 2 159 Nebraska 03 Alliance High School 2 580 Nebraska 03 Alliance Middle School 2 470 Nebraska 03 Hay Springs Middle School 2 31 Nebraska 03 PierCe Jr/Sr High School 2 364 Nebraska 03 Ravenna Senior High 2 224 Nebraska 03 Sidney High School 2 358
Total Number of SIG-eligible Students in State 18,743 Nevada 01 Doris Hancock Elementary School 1 504 Nevada 01 Kit Carson Elementary School 1 262 Nevada 01 Rancho High School 1 3,549 Nevada 01 Western High School 1 2,374 Nevada 01 H P Fitzgerald Elementary School 1 461 Nevada 01 Mojave High School 1 2,184 Nevada 01 Cheyenne High School 2 2,401
State Cong.Dist. SIG School Name Tier Total # of
Students*Nevada 02 Echo Loder Elementary School 1 593 Nevada 02 Glenn Duncan Elementary School 1 489 Nevada 02 Smithridge Elementary School 1 660
Nevada 02 Veterans Memorial Elementary School 1 456
Nevada 02 Adobe Middle School 2 692 Nevada 02 Eagle Valley Middle School 2 852 Nevada 02 Archie Clayton Middle School 2 706 Nevada 02 George L Dilworth Middle School 2 603 Nevada 02 William O’BrIen Middle School 2 774 Nevada 03 Desert Pines High School 1 2,941 Nevada 03 Chaparral High School 2 2,780 Nevada 03 Eldorado High School 2 3,153
Total Number of SIG-eligible Students in State 26,434 New Hampshire 01 Henry Wilson Memorial School 1 568New Hampshire 01 Bakersville School 1 318New Hampshire 01 Beech Street School 1 583New Hampshire 01 Gossler Park School 1 409New Hampshire 01 Parker-Varney School 1 477New Hampshire 01 Wilson School 1 445New Hampshire 01 Nute High School 2 221New Hampshire 01 Farmington Senior High School 2 479New Hampshire 02 Franklin Middle School 1 440New Hampshire 02 Franklin High School 2 440New Hampshire 02 Littleton High School 2 281New Hampshire 02 Pittsfield High School 2 193
Total Number of SIG-eligible Students in State 4,854 New Jersey 01 So Camden Alternative School 1 55 New Jersey 01 Camden High 1 1,339 New Jersey 01 Pyne Poynt Family School 1 381 New Jersey 01 Cramer 1 568 New Jersey 01 Hatch Middle 1 359 New Jersey 01 Morgan Village Middle 1 423 New Jersey 01 U S Wiggins 1 450 New Jersey 01 Riletta Cream Elem School 1 589 New Jersey 01 Woodrow Wilson High 2 1,117 New Jersey 04 Grace A Dunn Middle School 1 590 New Jersey 04 Trenton Central High 2 2,478 New Jersey 06 Asbury Park Middle School 1 672 New Jersey 06 Asbury Park High 2 456 New Jersey 08 Number 4 1 396 New Jersey 08 Number 6 1 431 New Jersey 10 Patrick F. Healy Middle 1 314 New Jersey 10 Avon Ave 1 509

our CommunitiEs lEft bEhind 29
State Cong.Dist. SIG School Name Tier Total # of
Students*New Jersey 10 Dayton St 1 340 New Jersey 10 Martin Luther King Jr 1 475 New Jersey 10 Academy of Voc Careers 1 225 New Jersey 10 George Washington Carver 1 743 New Jersey 10 Irvington High School 2 1,634 New Jersey 10 Henry Snyder 2 1,183 New Jersey 10 Renaissance Academy 2 470 New Jersey 10 Newark Vocational HS 2 253 New Jersey 10 Malcolm X Shabazz High 2 1,262 New Jersey 10 Abraham Clark High 2 1,030 New Jersey 11 Essex Cty Voc-West Caldw 2 276 New Jersey 12 Emily Fisher CS of Adv. Studies 1 360 New Jersey 13 Fred W. Martin #41 1 526 New Jersey 13 Barringer 2 2,012 New Jersey 13 Central 2 787
Total Number of SIG-eligible Students in State 22,703 New Mexico 1 Ernie Pyle Middle 1 636 New Mexico 1 El Camino Real Academy 1 617 New Mexico 1 Del Norte High 2 1,503 New Mexico 1 Manzano High 2 2,064 New Mexico 1 Valley High 2 1,729 New Mexico 1 Los Lunas High 2 1,868 New Mexico 1 Moriarty High 2 1,088 New Mexico 2 Bell Elementary 1 170 New Mexico 2 Laguna-Acoma High 1 343 New Mexico 2 R. Sarracino Middle 1 382 New Mexico 2 Alamogordo High 2 1,765 New Mexico 2 Santa Teresa High 2 1,301 New Mexico 2 Silver High 2 787 New Mexico 3 Naschitti Elementary 1 141 New Mexico 3 Newcomb High 1 324 New Mexico 3 Cuba High 1 365 New Mexico 3 Dulce Middle 1 146 New Mexico 3 Church Rock Elem 1 236 New Mexico 3 Crownpoint Elem 1 240 New Mexico 3 Crownpoint High 1 491 New Mexico 3 Navajo Elementary 1 263 New Mexico 3 Navajo Pine High 1 222 New Mexico 3 Tohatchi Middle 1 210 New Mexico 3 Stagecoach Elem 1 308 New Mexico 3 Lybrook Elementary 1 102 New Mexico 3 Valley Middle 1 66 New Mexico 3 Pecos Middle 1 165 New Mexico 3 Ramirez Thomas Elem 1 507
State Cong.Dist. SIG School Name Tier Total # of
Students*New Mexico 3 Farmington High 2 1,498
Total Number of SIG-eligible Students in State 19,537 New York 4 Roosevelt High School 1 799 New York 5 Newtown High School 1 3,377 New York 5 Flushing High School 1 2,613 New York 6 Jamaica High School 1 1,804 New York 6 August Martin High School 1 1,382 New York 6 Richmond Hill High School 2 3,602 New York 7 Christopher Columbus High School 1 1,560 New York 8 Unity Center for Urban Technologies 1 205
New York 8 Chelsea Career and Technical Education High School 1 952
New York 8 High School of Communication Graphic Art 1 1,855
New York 8 Franklin D Roosevelt High School 1 3,621
New York 8 William E Grady Vocational High School 1 1,457
New York 8 John Dewey High School 1 3,240 New York 9 Beach Channel High School 1 1,804 New York 9 John Adams High School 1 3,276 New York 9 Sheepshead Bay High School 2 2,673 New York 10 Metropolitan Corporate Academy 1 405 New York 10 Boys & Girls High School 1 3,710
New York 10 W H Maxwell Career and Technical Education High School 1 1,127
New York 11 School For Global Studies 1 643
New York 11 Cobble Hill School for American Studies 1 782
New York 11 Paul Robeson High School 1 1,377 New York 12 Grover Cleveland High School 1 2,957
New York 12 Queens Vocational and Technical High School 1 1,182
New York 12 Automotive High School 1 1,132 New York 14 Norman Thomas High School 1 2,143 New York 14 Washington Irving High School 1 2,432 New York 14 Long Island City High School 1 3,352
New York 15 Bread & Roses Integrated Arts High School 1 552
New York 15 John F Kennedy High School 1 2,090 New York 16 PS 65 Mother Hale Academy 1 504
New York 16 Jane Addams High School for Academic Careers 1 1,720
New York 16 Grace H Dodge Career and Technical High School 1 1,454
New York 16 Fordham Leadership Academy 1 541

30 our CommunitiEs lEft bEhind
State Cong.Dist. SIG School Name Tier Total # of
Students*
New York 16 Monroe Academy for Business & Law 1 614
New York 18 Emerson Middle School 1 680 New York 18 Roosevelt High School 1 1,403 New York 21 Albany High School 2 2,840 New York 25 Delaware Elementary School 1 481 New York 25 Hughes Elementary School 1 423 New York 25 George Fowler High School 2 1,086 New York 27 International School 1 862 New York 27 Lafayette High School 2 752 New York 27 Riverside Institute of Technology 2 1,070 New York 27 South Park High School 2 859 New York 28 Burgard Vocational High School 1 523
New York 28 Dr Martin Luther King, Jr Multi-cultural Institute 1 864
New York 28 East High School 1 1,891 New York 28 John Marshall High School 1 1,194
New York 28 Bioscience & Health Career HS at Franklin 1 530
New York 28 Global Media Arts HS at Franklin 1 540
New York 28 International Finance & Economic Development HS 1 489
New York 28 School For Business, Finance and Entrepreneurship 1 382
New York 28 School of Engineering and Manufacturing at Edison 1 378
New York 28 Skilled Trades at Edison 1 347
New York 28 School of Imaging and Information Technology at Edison 1 425
New York 28 Bennett High School 2 921 Total Number of SIG-eligible Students in State 81,877
North Carolina 01 Haliwa-Saponi Tribal School 1 150 North Carolina 01 Enfield Middle 1 207 North Carolina 01 Southeast Halifax High 1 494 North Carolina 01 Farmville Central High 2 793 North Carolina 01 North Pitt High 2 930 North Carolina 01 Goldsboro High 2 613 North Carolina 02 South Campus Community High 2 55 North Carolina 02 W L Greene Alternative 2 83 North Carolina 03 South Central High 2 1,222 North Carolina 03 Dare Co Alternative High 2 42 North Carolina 03 Columbia High 2 180 North Carolina 03 Beddingfield High 2 927 North Carolina 05 Yadkin Success Academy 2 62 North Carolina 06 Davidson County Ext Day 2 133
State Cong.Dist. SIG School Name Tier Total # of
Students*North Carolina 06 Pinckney Academy 2 45 North Carolina 07 Walker-Spivey 2 109 North Carolina 07 Brunswick Learning Center 2 132 North Carolina 07 Fairmont High 2 727 North Carolina 07 Lumberton Senior High 2 2,078 North Carolina 08 Anson Challenge Academy 2 68 North Carolina 09 Warlick School 2 120 North Carolina 09 South Providence 2 129 North Carolina 10 Catawba Valley High 1 61 North Carolina 10 Burke Alternative School 2 112 North Carolina 11 Buncombe Community-East 2 149 North Carolina 11 Mountain Youth School 2 67 North Carolina 11 Central Haywood High 2 77 North Carolina 11 Balfour Education Center 2 148 North Carolina 11 Jackson Co School of Alt 2 99 North Carolina 11 Rutherford Opportunity Center 2 83 North Carolina 11 Davidson River School 2 96 North Carolina 12 C G Woodson Sch of Challenge 1 449 North Carolina 12 Kennedy Learning 1 260 North Carolina 12 Petree Elementary 1 403 North Carolina 12 Oak Hill Elementary 1 410 North Carolina 12 Gateway Education Center 2 215 North Carolina 12 West Mecklenburg High 2 2,019 North Carolina 12 E E Waddell High 2 1,062 North Carolina 12 Henderson Independent High 2 158 North Carolina 13 C D McIver Special Education 2 130 North Carolina 13 Durham’s Performance Learning 2 83
Total Number of SIG-eligible Students in State 15,380 North Dakota 00 Four Winds Community High School 1 156North Dakota 00 Fort Yates Middle School 1 159North Dakota 00 Mandaree High School 1 41North Dakota 00 Solen High School 1 44North Dakota 00 Warwick High School 1 114North Dakota 00 White Shield High School 1 59North Dakota 00 North Border-Walhalla High School 2 89North Dakota 00 Kensal High School 2 25North Dakota 00 Pingree-Buchanan High School 2 69North Dakota 00 Sawyer High School 2 62North Dakota 00 Des Lacs-Burlington High School 2 195
Total Number of SIG-eligible Students in State 1,013 Ohio 01 George Hays - Jennie Porter 1 485 Ohio 01 Rothenberg Preparatory Academy 1 415
Ohio 01 South Avondale Elementary School 1 347

our CommunitiEs lEft bEhind 31
State Cong.Dist. SIG School Name Tier Total # of
Students*Ohio 01 Virtual High School 2 235
Ohio 01 Woodward Career Technical High School 2 1,196
Ohio 03 Academy of Dayton 1 110 Ohio 03 New City School 1 102 Ohio 03 Summit Academy Dayton 1 61 Ohio 03 Belmont High School 2 1,041 Ohio 03 Dunbar High School 2 715 Ohio 03 Meadowdale High School 2 1,037 Ohio 04 Goal Digital Academy 1 256 Ohio 04 Mansfield Elective Academy 1 37 Ohio 04 Progressive Academy 2 449 Ohio 04 Alternative High School 2 41 Ohio 07 Virtual Community School of Ohio 1 1,208 Ohio 07 Keifer Alternative Center 1 167 Ohio 08 Hamilton Education Center 2 362 Ohio 09 Victory Academy of Toledo 1 116 Ohio 09 George A. Phillips Academy 1 104 Ohio 09 Alternative Education Academy 1 2,364 Ohio 09 Toledo Preparatory Academy 1 100
Ohio 09 Summit Academy Community School-Toledo 1 111
Ohio 09 Robinson Middle School 1 560 Ohio 11 Lion of Judah Academy 1 106 Ohio 11 Audubon Elementary School 1 511
Ohio 11 Carl & Louis Stokes Central Academy 1 544
Ohio 11 Collinwood High School 1 1,040 Ohio 11 East High School 1 753 Ohio 11 East Technical High School 1 899 Ohio 11 Glenville High School 1 1,426 Ohio 11 John F Kennedy High School 1 932 Ohio 11 Luis Munoz Marin School 1 874 Ohio 11 Lincoln-West High School 1 1,522
Ohio 11 Franklin D. Roosevelt Elementary School 1 296
Ohio 11 Mary B Martin Elementary School 1 388
Ohio 11 Patrick Henry School @ Howe Elementary 1 354
Ohio 11 South High School 1 1,036 Ohio 11 Woodland Hills Elementary School 1 368
Ohio 11 Martin Luther King Jr Career Campus 1 591
Ohio 11 Option Complex 1 232 Ohio 11 Bellefaire 2 81
State Cong.Dist. SIG School Name Tier Total # of
Students*Ohio 12 Crittenton Community School 1 80 Ohio 12 Summit Academy Columbus 1 30 Ohio 12 Champion Middle School 1 316 Ohio 12 Linden-McKinley High School 1 534 Ohio 12 Southmoor Middle School 1 384 Ohio 12 Weinland Park Elementary School 1 398 Ohio 12 Alum Crest High School 2 119 Ohio 13 Summit Academy-Lorain 1 133 Ohio 13 Akron Digital Academy 1 615
Ohio 13 Summit Academy Middle School - Lorain 1 43
Ohio 14 Summit Academy Community School - Painesville 1 54
Ohio 15 Electronic Classroom of Tomorrow 1 7,035 Ohio 15 Scholarts Preparatory School 1 84 Ohio 15 West High School 1 1,075 Ohio 15 Welcome Center HS @ North 1 229 Ohio 16 Summit Academy-Canton 1 77 Ohio 16 Opportunity 2 39 Ohio 17 Mollie Kessler 1 58
Ohio 17 Summit Academy Middle School - Youngstown 1 89
Ohio 17 Mahoning Valley Opportunity Center 1 123 Ohio 17 Akron Opportunity Center 1 96 Ohio 17 East High School 2 1,125 Ohio 17 Odyssey: School of Possibilities 2 78 Ohio 18 Newark Digital Academy 1 79
Total Number of SIG-eligible Students in State 36,811 Oklahoma 01 Clinton MS 1 452 Oklahoma 01 East Central HS 1 1,304 Oklahoma 01 Nathan Hale HS 1 813 Oklahoma 01 Daniel Webster HS 1 517 Oklahoma 01 Will Rogers HS 1 1,084 Oklahoma 01 Gilcrease MS 1 524 Oklahoma 01 Kiefer HS 2 111 Oklahoma 01 Memorial HS 2 1,328 Oklahoma 02 Atoka HS 2 375 Oklahoma 02 Colcord HS 2 276 Oklahoma 02 Jay HS 2 550 Oklahoma 02 Porum HS 2 171 Oklahoma 02 Wetumka HS 2 129 Oklahoma 03 Central HS 1 701 Oklahoma 05 Crutcho ES 1 237 Oklahoma 05 F.D. Moon Academy 1 324

32 our CommunitiEs lEft bEhind
State Cong.Dist. SIG School Name Tier Total # of
Students*Oklahoma 05 U. S. Grant HS 1 1,566 Oklahoma 05 Douglass MS 1 228 Oklahoma 05 Millwood HS 2 277 Oklahoma 05 Wewoka HS 2 184
Total Number of SIG-eligible Students in State 11,151 Oregon 01 Community School 2 215 Oregon 02 Marshall High School 2 182 Oregon 02 Madras High School 2 901 Oregon 02 Eagleridge High School 2 98 Oregon 02 Ontario High School 2 844
Oregon 03 Arts, Communication & Technology School 1 279
Oregon 03 Spanish-English International School 1 222
Oregon 03 Pursuit of Wellness Education at Roosevelt Campus 1 229
Oregon 03 Biztech High School 1 262 Oregon 04 Network Charter School 2 130 Oregon 04 Willamette Leadership Academy 2 82 Oregon 05 McKay High School 1 1,916 Oregon 05 Hallman Elementary School 1 447 Oregon 05 New Urban High School 2 248
Oregon 05 Oregon City Service Learning Academy 2 104
Oregon 05 Early College High School 2 350 Oregon 05 Roberts High School 2 693
Total Number of SIG-eligible Students in State 7,202
Pennsylvania 01 Community Academy of Philadelphia CS 1 1,219
Pennsylvania 01 Hope CS 1 329 Pennsylvania 01 Philadelphia Montessori CS 1 162 Pennsylvania 01 Columbus Elementary School 1 719 Pennsylvania 01 Chester HS 1 1,781
Pennsylvania 01 Kensington Intern Business, Finance & Entrep 1 553
Pennsylvania 01 Olney HS West 1 859 Pennsylvania 01 Bryant William C School 1 679 Pennsylvania 01 Dunbar Paul L School 1 264 Pennsylvania 01 Elkin Lewis School 1 992 Pennsylvania 01 Sheppard Isaac School 1 288 Pennsylvania 01 Pennell Joseph School 1 489 Pennsylvania 01 Birney Gen Davis B School 1 648 Pennsylvania 01 Edmunds Henry R School 1 986 Pennsylvania 01 Feltonville Intermediate School 1 723 Pennsylvania 01 Taylor Bayard School 1 634
State Cong.Dist. SIG School Name Tier Total # of
Students*Pennsylvania 01 Bluford Guion Elementary School 1 558 Pennsylvania 01 Harrison William High School 1 227 Pennsylvania 01 Fels Samuel HS 1 1,577 Pennsylvania 01 Bartram John - Main 1 1,494 Pennsylvania 01 Edison HS/Fareira Skills 1 2,362 Pennsylvania 01 Frankford HS 1 1,832 Pennsylvania 01 Penn William HS 1 765 Pennsylvania 01 South Philadelphia HS 1 1,501 Pennsylvania 01 Clymer George School 1 529 Pennsylvania 01 Potter-Thomas School 1 553 Pennsylvania 01 Hartranft John F School 1 508 Pennsylvania 01 Bethune Mary Mcleod School 1 700 Pennsylvania 01 McKinley William School 1 405 Pennsylvania 01 Morton Thomas G School 1 782 Pennsylvania 01 Daroff Samuel School 1 799 Pennsylvania 01 Deburgos Bilingual Magnet MS 1 808 Pennsylvania 01 Park Lane Elementary School 1 388 Pennsylvania 01 Wakisha CS 2 359 Pennsylvania 01 Nueva Esperanza Academy CS 2 711 Pennsylvania 01 Mariana Bracetti Academy CS 2 1,089 Pennsylvania 01 Richard Allen Preparatory CS 2 401 Pennsylvania 01 Philadelphia Electrical & Tech CHS 2 629 Pennsylvania 01 Truebright Science Academy CS 2 183
Pennsylvania 01 Feltonville School of Arts & Sciences 2 761
Pennsylvania 01 Communications Technology HS 2 465 Pennsylvania 01 Lamberton Robert HS 2 381
Pennsylvania 01 Philadelphia HS for Business & Tech 2 143
Pennsylvania 01 Kensington Creative & Performing Arts HS 2 522
Pennsylvania 01 Olney HS East 2 856 Pennsylvania 01 Kensington Culinary Arts 2 393 Pennsylvania 01 Widener Memorial School 2 165 Pennsylvania 01 Douglas Stephen A School 2 237 Pennsylvania 01 Cooke Jay MS 2 506 Pennsylvania 01 Furness Horace HS 2 796 Pennsylvania 01 Jones John Paul MS 2 831 Pennsylvania 01 Penn Treaty MS 2 695 Pennsylvania 01 Stetson John B MS 2 690 Pennsylvania 01 Mastbaum Jules E AVTS 2 1,147 Pennsylvania 01 Franklin Benjamin HS 2 710 Pennsylvania 01 Overbrook HS 2 1,786 Pennsylvania 01 Carroll Charles School 2 297

our CommunitiEs lEft bEhind 33
State Cong.Dist. SIG School Name Tier Total # of
Students*Pennsylvania 01 Turner John P MS 2 295 Pennsylvania 01 Clemente Roberto MS 2 858 Pennsylvania 01 Pepper George MS 2 790 Pennsylvania 01 Penn Wood MS 2 749 Pennsylvania 02 Renaissance Advantage CS 1 865 Pennsylvania 02 West Phila. Achievement CES 1 375 Pennsylvania 02 Drew Charles R School 1 363 Pennsylvania 02 Harrity William F School 1 652 Pennsylvania 02 McMichael Morton School 1 437 Pennsylvania 02 Alcorn James School 1 565 Pennsylvania 02 Douglass Frederick School 1 510 Pennsylvania 02 Kelley William D School 1 372 Pennsylvania 02 Meade Gen George C School 1 456 Pennsylvania 02 Reynolds Gen John F School 1 467 Pennsylvania 02 Smith Walter G School 1 482 Pennsylvania 02 Blaine James G School 1 408 Pennsylvania 02 Mann William B School 1 457 Pennsylvania 02 Peirce Thomas M School 1 436 Pennsylvania 02 Whittier John G School 1 501 Pennsylvania 02 Mifflin Thomas School 1 324 Pennsylvania 02 Pastorius Francis P School 1 672 Pennsylvania 02 Wister John School 1 442 Pennsylvania 02 Kenderton School 1 430 Pennsylvania 02 Sayre William L MS 1 597 Pennsylvania 02 Vaux Roberts HS 1 417 Pennsylvania 02 Roxborough HS 1 913 Pennsylvania 02 Germantown HS 1 1,262 Pennsylvania 02 Gratz Simon HS 1 1,460 Pennsylvania 02 West Philadelphia HS 1 968 Pennsylvania 02 Locke Alain School 1 420 Pennsylvania 02 Duckrey Tanner School 1 464 Pennsylvania 02 Wright Richard R School 1 408 Pennsylvania 02 Allen Dr Ethel School 1 354 Pennsylvania 02 University City HS 1 1,379 Pennsylvania 02 Lea Henry C School 1 439 Pennsylvania 02 Stanton M Hall School 1 445 Pennsylvania 02 King Martin Luther HS 1 1,821 Pennsylvania 02 Barry Comm John School 1 259 Pennsylvania 02 Multi-Cultural Academy CS 2 154 Pennsylvania 02 Delaware Valley CHS 2 616 Pennsylvania 02 New Media Technology CS 2 435
Pennsylvania 02 Paul Robeson HS for Human Services 2 286
Pennsylvania 02 Randolph, A. Philip AVT HS 2 370
State Cong.Dist. SIG School Name Tier Total # of
Students*Pennsylvania 02 School of the Future 2 311 Pennsylvania 02 Beeber Dimner MS 2 516 Pennsylvania 02 Fitzsimons Thomas HS 2 537 Pennsylvania 02 Gillespie Eliz D MS 2 320 Pennsylvania 02 Shaw Anna H MS 2 417 Pennsylvania 02 Vare Edwin H MS 2 420 Pennsylvania 02 Dobbins Avt HS 2 977 Pennsylvania 02 Rhodes E Washington MS 2 556 Pennsylvania 02 Longstreth William C School 2 620 Pennsylvania 02 Parkway Northwest 2 291 Pennsylvania 03 Perseus House CS of Excellence 1 384 Pennsylvania 03 PEACE School of Excellence 1 101 Pennsylvania 03 Keystone Education Center CS 2 237 Pennsylvania 03 Corry Area HS 2 863 Pennsylvania 03 AEP/Transition School 2 289 Pennsylvania 03 Strong Vincent HS 2 945 Pennsylvania 03 Youngsville HS 2 380 Pennsylvania 04 Aliquippa SHS 2 366 Pennsylvania 04 Farrell Area HS/UMS 2 435 Pennsylvania 04 South Side HS 2 438 Pennsylvania 05 Sugar Valley Rural CS 2 227 Pennsylvania 06 Achievement House CS 1 304 Pennsylvania 06 Southern MS 2 749 Pennsylvania 07 Norristown Area HS 2 1,878 Pennsylvania 07 Academy Park HS 2 1,284 Pennsylvania 07 Penn Wood SHS 2 1,220 Pennsylvania 09 Tuscarora Blended Learning CS 2 197 Pennsylvania 09 Harmony Area HS 2 94 Pennsylvania 09 Mount Union Area SHS 2 451 Pennsylvania 09 Turkeyfoot Valley Area JSHS 2 146 Pennsylvania 11 Hazleton Area HS 2 3,648 Pennsylvania 11 Panther Valley SHS 2 532 Pennsylvania 12 Brownsville Area HS 2 600 Pennsylvania 12 Lafayette MS 2 210 Pennsylvania 12 West Greene HS 2 309 Pennsylvania 13 Sheridan West 1 229 Pennsylvania 13 Smedley Franklin School 1 617 Pennsylvania 13 Lincoln HS 1 1,828 Pennsylvania 13 Swenson Arts & Technology HS 2 762 Pennsylvania 13 Harding Warren G MS 2 978 Pennsylvania 13 Washington George HS 2 2,041 Pennsylvania 14 Duquesne Consolidated School 1 444 Pennsylvania 14 Faison Helen S Arts Academy 1 757 Pennsylvania 14 Northview Elementary School 1 378

34 our CommunitiEs lEft bEhind
State Cong.Dist. SIG School Name Tier Total # of
Students*Pennsylvania 14 Arsenal Elementary School 1 272 Pennsylvania 14 Murray Elementary School 1 404 Pennsylvania 14 King M L Elementary School 1 613 Pennsylvania 14 Career Connections CHS 2 269 Pennsylvania 14 Academy CS 2 97 Pennsylvania 14 Clairton MS 2 199 Pennsylvania 14 Clairton HS 2 243 Pennsylvania 14 Cornell SHS 2 240 Pennsylvania 14 East Allegheny JSHS 2 786 Pennsylvania 14 McKeesport Area SHS 2 1,441 Pennsylvania 14 Langley HS 2 512 Pennsylvania 14 Perry Traditional Academy 2 824 Pennsylvania 14 Westinghouse HS 2 353 Pennsylvania 14 Oliver HS 2 638 Pennsylvania 14 Peabody HS 2 466 Pennsylvania 14 Arsenal MS 2 424 Pennsylvania 14 Rooney Arthur J MS 2 216 Pennsylvania 14 Brashear HS 2 1,100 Pennsylvania 14 Sto-Rox HS 2 470 Pennsylvania 15 Central El School 1 757 Pennsylvania 15 Roberto Clemente CS 2 311 Pennsylvania 15 Harrison-Morton MS 2 749 Pennsylvania 15 Francis D Raub MS 2 1,072 Pennsylvania 15 William Allen HS 2 3,539 Pennsylvania 15 Louis E Dieruff HS 2 1,847 Pennsylvania 15 Trexler MS 2 1,037 Pennsylvania 16 La Academia CS 1 94 Pennsylvania 16 Hand MS 2 492 Pennsylvania 16 Reynolds MS 2 591 Pennsylvania 16 McCaskey Campus 2 2,825 Pennsylvania 16 Southwest MS 2 610 Pennsylvania 17 Pennsylvania Distance Learning CS 1 639 Pennsylvania 17 Scott Sch Early Childhood Ctr 1 527 Pennsylvania 17 Career Technology Academy 1 389 Pennsylvania 17 Hamilton School 1 319 Pennsylvania 17 Lincoln School 1 335 Pennsylvania 17 Marshall School 1 458 Pennsylvania 17 Foose School 1 638 Pennsylvania 17 Melrose School 1 398 Pennsylvania 17 Camp Curtin School 1 735 Pennsylvania 17 Steele School 1 275 Pennsylvania 17 Central Dauphin East SHS 2 1,609 Pennsylvania 17 Rowland School 2 635 Pennsylvania 17 Harrisburg HS 2 1,506
State Cong.Dist. SIG School Name Tier Total # of
Students*Pennsylvania 17 Lebanon SHS 2 1,106 Pennsylvania 17 Steelton-Highspire HS 2 564 Pennsylvania 18 Dr Robert Ketterer CS 2 209 Pennsylvania 18 Penn Hills SHS 2 1,350 Pennsylvania 19 Mckinley School 1 373 Pennsylvania 19 New Hope Academy CS 2 164 Pennsylvania 19 Hannah Penn MS 2 709 Pennsylvania 19 Edgar Fahs Smith MS 2 549 Pennsylvania 19 William Penn SHS 2 1,266
Total Number of SIG-eligible Students in State 134,769 Rhode Island 01 Central Falls Senior High School 1 948 Rhode Island 01 Rhode Island School for the Deaf 2 85 Rhode Island 01 Mount Pleasant High School 2 1,383 Rhode Island 02 Feinstein High School 1 367
Rhode Island 02 Charlotte Woods Elementary School 1 305
Rhode Island 02 William B. Cooley/Health and Science Tech. Academy 1 396
Rhode Island 02 Roger Williams Middle School 1 801
Rhode Island 02 Lillian Feinstein Elementary, Sackett Street 1 454
Rhode Island 02 The R.Y.S.E. School 2 51
Rhode Island 02 Providence Academy of International Studies 2 413
Rhode Island 02 Central High School 2 1,236 Total Number of SIG-eligible Students in State 6,439
South Carolina 01 R B Stall High 1 901Souh Carolina 01 Greg Mathis Charter High 1 83South Carolina 01 St Johns High 2 346South Carolina 02 Fairfax Elem 1 301South Carolina 02 Allendale-Fairfax Middle 1 346South Carolina 02 Estill Middle 1 261South Carolina 02 Ridgeland Middle 1 482South Carolina 02 Estill High 2 420South Carolina 02 Hardeeville Middle/High 2 478South Carolina 03 Aiken Performing Arts Charter 1 43South Carolina 04 Whitlock Jr High 1 361South Carolina 04 Carolina High 2 726South Carolina 04 Carver Jr High 2 646South Carolina 05 West Lee El 1 193South Carolina 05 Mary L. Dinkins Charter 1 93South Carolina 05 Darlington High 2 1239South Carolina 05 J V Martin Jr High 2 536South Carolina 06 Morningside Middle 1 567

our CommunitiEs lEft bEhind 35
State Cong.Dist. SIG School Name Tier Total # of
Students*South Carolina 06 N Charleston High 1 854South Carolina 06 Susan G. Boykin Charter 1 183South Carolina 06 Johnson Middle 1 210South Carolina 06 Denmark Olar High 2 256South Carolina 06 Denmark-Olar Middle 2 224South Carolina 06 Burke High 2 823South Carolina 06 Manning Junior High 2 493South Carolina 06 Eau Claire High 2 805South Carolina 06 C A Johnson Prepatory Academy 2 512South Carolina 06 Kingstree Jr High 2 468
Total Number of SIG-eligible Students in State 12,850
South Dakota 00 Shannon County Alternative School - 09 1 19
South Dakota 00 Family Immersion Center Middle - 53 1 24
South Dakota 00 He Dog Elementary - 05 1 134South Dakota 00 Spring Creek Elementary - 07 1 53South Dakota 00 Todd County High School - 01 1 446
South Dakota 00 Belle Fourche Education Connection - 09 2 0
South Dakota 00 Frederick High School - 01 2 69South Dakota 00 Grant-Deuel High School - 01 2 64South Dakota 00 Gregory High School - 01 2 121South Dakota 00 McLaughlin High School - 01 2 118South Dakota 00 New Underwood High School - 01 2 114South Dakota 00 Waverly High School - 01 2 46
Total Number of SIG-eligible Students in State 1,208Tennessee 01 Parkway Academy 2 44 Tennessee 02 Austin East High/Magnet School 1 761 Tennessee 02 Everett Lrn Oppt Cnt 2 76
Tennessee 03 Howard Academy of Academics Technology 1 999
Tennessee 03 Hixson High School 2 970 Tennessee 04 Mount Pleasant High School 2 444 Tennessee 05 Harris Hillman Special 2 291 Tennessee 08 Frayser Middle/High School 1 978 Tennessee 08 Raleigh Egypt Middle School 1 906 Tennessee 08 Trezevant High School 1 1,072 Tennessee 09 Hamilton High School 1 1,581 Tennessee 09 Kingsbury Middle/High School 1 889 Tennessee 09 Manassas High School 1 567 Tennessee 09 Northside High School 1 909 Tennessee 09 Sheffield High School 1 923
Total Number of SIG-eligible Students in State 11,410
State Cong.Dist. SIG School Name Tier Total # of
Students*Texas 01 Azleway Charter School 1 92 Texas 01 Pride Alter School 2 59 Texas 01 St Louis Sp Ed El 2 89 Texas 02 Jamie’s House Charter School 1 84 Texas 02 Paul A Brown Alternative Center 2 205 Texas 03 Alpha Charter School 1 218 Texas 03 Coop Behavioral Ctr 2 27 Texas 03 GISD Evening School 2 263 Texas 04 New Horizons Learning Center 1 185 Texas 04 Holy Highway Pickton 2 18 Texas 04 Alter School 2 33 Texas 04 Douglass Learning Ctr 2 60 Texas 05 Bryan Adams HS 1 1,667 Texas 05 Ranch Academy 2 38 Texas 05 S Garland HS 2 2,117
Texas 05 Van Zandt Co Youth Multi-Service Ctr 2 12
Texas 05 Alternative Learning Center 2 55 Texas 05 North Mesquite High School 2 2,450 Texas 06 Venture Alter HS 2 384 Texas 07 Spring Branch School of Choice 1 262 Texas 08 Raven School 1 171 Texas 08 W L Hauke Alter Ed 2 139
Texas 08 Stars (Southeast Texas Academic Recovery School) 2 38
Texas 09 Alphonso Crutch’s-Life Support Center 1 311
Texas 09 Lee HS 1 1,924 Texas 09 Sharpstown HS 1 1,528 Texas 09 Community Education Partners SW 2 477 Texas 09 New Aspirations 2 48 Texas 10 Reagan HS 1 940 Texas 10 Settlement Home 2 30 Texas 10 Phoenix High School 2 31 Texas 11 Fairview Accelerated 2 10 Texas 11 Monahans Ed Ctr 2 34 Texas 12 River Oaks 1 362
Texas 12 Richard Milburn Academy– Fort Worth 1 187
Texas 12 Int’l Newcomer Academy 1 367 Texas 12 Chico High School 2 216 Texas 12 Metro Opportunity 2 116 Texas 12 Jo Kelly Sp Ed 2 58 Texas 12 Success HS 2 186

36 our CommunitiEs lEft bEhind
State Cong.Dist. SIG School Name Tier Total # of
Students*Texas 12 Mesa High School 2 57 Texas 13 North Heights Alter 2 113 Texas 13 Starr Academy 2 NA Texas 13 ELectra HS 2 144
Texas 13 Top of Texas Accelerated Education Center 2 38
Texas 13 Harrell Accelerated Learning Center 2 78
Texas 13 Wichita Falls Sp Ed Ctr 2 115 Texas 14 Ed White Memorial High School 1 91 Texas 14 Trinity Charter School 2 58 Texas 14 Profit Magnet High School 2 140 Texas 15 One Stop Multiservice 1 214 Texas 15 One Stop Multiservice 1 212 Texas 15 Mid-Valley Academy-McAllen 1 253 Texas 15 Alice HS 1 1,485 Texas 15 Mid-Valley Academy 2 70 Texas 15 Learning Resource Center 2 47 Texas 15 Juvenile Detention Ctr 2 34 Texas 15 Keys Academy 2 161 Texas 15 Karnes County Academy 2 15 Texas 15 La Feria Alternative School 2 60 Texas 15 Mercedes Alter Academy 2 58 Texas 15 Taft HS 2 354 Texas 15 Three Rivers HS 2 203 Texas 16 Paso Del Norte Academy 1 179 Texas 16 Sunset HS 2 180 Texas 16 School-Age Parent Ctr 2 140 Texas 16 Telles Academy J J A E P 2 4 Texas 16 Plato Academy 2 227 Texas 17 Granbury 2 - Texas 17 Methodist Children’s Home 2 125 Texas 17 Center for Alternative Learning 2 64 Texas 17 B-E Achievement Ctr 2 30 Texas 17 Team School 2 87 Texas 17 Connally High School 2 691 Texas 17 Alter Learning Ctr 2 21 Texas 17 La Vega HS 2 650
Texas 18 Houston Can! Academy Charter School 1 489
Texas 18 Benji’s Special Educational Academy Charter School 1 560
Texas 18 Richard Milburn Academy–Suburban Houston 1 210
Texas 18 Contemporary Lrn Ctr HS 1 522
State Cong.Dist. SIG School Name Tier Total # of
Students*Texas 18 Jones HS 1 846 Texas 18 Kashmere HS 1 531 Texas 18 H P Carter Career Center 1 109 Texas 18 Forest Brook HS 1 896
Texas 18 Harris County Juvenile Detention Center 2 192
Texas 18 Highpoint North 2 98 Texas 19 South Plains Academy 1 133 Texas 19 Estacado HS 1 860 Texas 19 P E P 2 2 Texas 19 Cisco J H 2 184 Texas 19 Graham Learning Ctr 2 36 Texas 19 Matthews Lrn Ctr/New Directions 2 222 Texas 19 Lubbock Co Juvenile Justice Ctr 2 69 Texas 19 P E P 2 8 Texas 19 Houston School 2 127 Texas 19 Plainview High School 2 1,432
Texas 19 Garza Co Detention & Resident Facility 2 84
Texas 20 Por Vida Academy Charter HS 1 193 Texas 20 Positive Solutions Charter 1 150
Texas 20 Southwest Preparatory School-Northwest 1 288
Texas 20 George I Sanchez Charter HS San Antonio Branch 1 118
Texas 20 Academy of Careers and Technologies Charter School 1 161
Texas 20 San Antonio School for Inquiry & Creativity 1 272
Texas 20 Fox Technical H S 1 1,545 Texas 20 Lanier H S 1 1,459 Texas 20 Navarro Academy 1 199 Texas 20 Cesar E Chavez Academy 2 121
Texas 21 American Youthworks Charter School 1 168
Texas 21 Southwest Preparatory School 1 370
Texas 21 Southwest Preparatory Southeast Campus 1 255
Texas 21 Houston HS 1 889
Texas 21 John H Wood Jr Charter School at Afton Oaks 2 23
Texas 21 Hill Country Youth Ranch 2 57
Texas 21 Azleway Charter School Pine Mountain 2 41
Texas 21 K C J D C 2 3
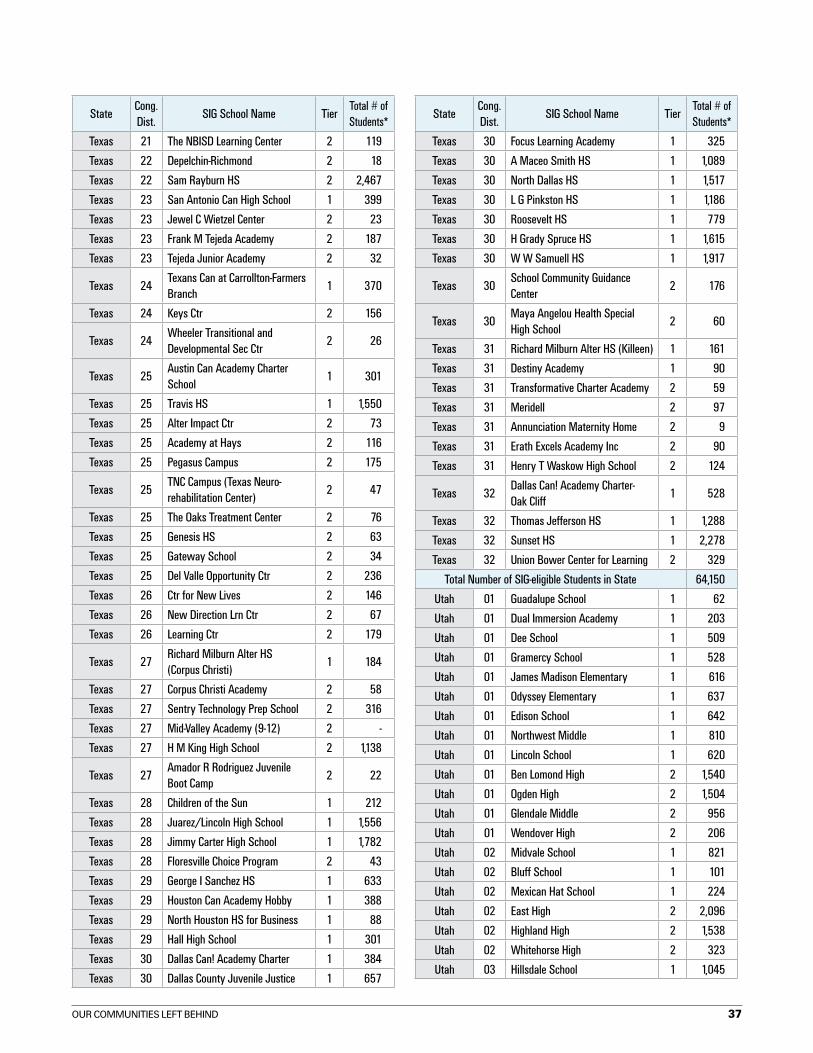
our CommunitiEs lEft bEhind 37
State Cong.Dist. SIG School Name Tier Total # of
Students*Texas 21 The NBISD Learning Center 2 119 Texas 22 Depelchin-Richmond 2 18 Texas 22 Sam Rayburn HS 2 2,467 Texas 23 San Antonio Can High School 1 399 Texas 23 Jewel C Wietzel Center 2 23 Texas 23 Frank M Tejeda Academy 2 187 Texas 23 Tejeda Junior Academy 2 32
Texas 24 Texans Can at Carrollton-Farmers Branch 1 370
Texas 24 Keys Ctr 2 156
Texas 24 Wheeler Transitional and Developmental Sec Ctr 2 26
Texas 25 Austin Can Academy Charter School 1 301
Texas 25 Travis HS 1 1,550 Texas 25 Alter Impact Ctr 2 73 Texas 25 Academy at Hays 2 116 Texas 25 Pegasus Campus 2 175
Texas 25 TNC Campus (Texas Neuro- rehabilitation Center) 2 47
Texas 25 The Oaks Treatment Center 2 76 Texas 25 Genesis HS 2 63 Texas 25 Gateway School 2 34 Texas 25 Del Valle Opportunity Ctr 2 236 Texas 26 Ctr for New Lives 2 146 Texas 26 New Direction Lrn Ctr 2 67 Texas 26 Learning Ctr 2 179
Texas 27 Richard Milburn Alter HS (Corpus Christi) 1 184
Texas 27 Corpus Christi Academy 2 58 Texas 27 Sentry Technology Prep School 2 316 Texas 27 Mid-Valley Academy (9-12) 2 - Texas 27 H M King High School 2 1,138
Texas 27 Amador R Rodriguez Juvenile Boot Camp 2 22
Texas 28 Children of the Sun 1 212 Texas 28 Juarez/Lincoln High School 1 1,556 Texas 28 Jimmy Carter High School 1 1,782 Texas 28 Floresville Choice Program 2 43 Texas 29 George I Sanchez HS 1 633 Texas 29 Houston Can Academy Hobby 1 388 Texas 29 North Houston HS for Business 1 88 Texas 29 Hall High School 1 301 Texas 30 Dallas Can! Academy Charter 1 384 Texas 30 Dallas County Juvenile Justice 1 657
State Cong.Dist. SIG School Name Tier Total # of
Students*Texas 30 Focus Learning Academy 1 325 Texas 30 A Maceo Smith HS 1 1,089 Texas 30 North Dallas HS 1 1,517 Texas 30 L G Pinkston HS 1 1,186 Texas 30 Roosevelt HS 1 779 Texas 30 H Grady Spruce HS 1 1,615 Texas 30 W W Samuell HS 1 1,917
Texas 30 School Community Guidance Center 2 176
Texas 30 Maya Angelou Health Special High School 2 60
Texas 31 Richard Milburn Alter HS (Killeen) 1 161 Texas 31 Destiny Academy 1 90 Texas 31 Transformative Charter Academy 2 59 Texas 31 Meridell 2 97 Texas 31 Annunciation Maternity Home 2 9 Texas 31 Erath Excels Academy Inc 2 90 Texas 31 Henry T Waskow High School 2 124
Texas 32 Dallas Can! Academy Charter-Oak Cliff 1 528
Texas 32 Thomas Jefferson HS 1 1,288 Texas 32 Sunset HS 1 2,278 Texas 32 Union Bower Center for Learning 2 329
Total Number of SIG-eligible Students in State 64,150 Utah 01 Guadalupe School 1 62 Utah 01 Dual Immersion Academy 1 203 Utah 01 Dee School 1 509 Utah 01 Gramercy School 1 528 Utah 01 James Madison Elementary 1 616 Utah 01 Odyssey Elementary 1 637 Utah 01 Edison School 1 642 Utah 01 Northwest Middle 1 810 Utah 01 Lincoln School 1 620 Utah 01 Ben Lomond High 2 1,540 Utah 01 Ogden High 2 1,504 Utah 01 Glendale Middle 2 956 Utah 01 Wendover High 2 206 Utah 02 Midvale School 1 821 Utah 02 Bluff School 1 101 Utah 02 Mexican Hat School 1 224 Utah 02 East High 2 2,096 Utah 02 Highland High 2 1,538 Utah 02 Whitehorse High 2 323 Utah 03 Hillsdale School 1 1,045

38 our CommunitiEs lEft bEhind
State Cong.Dist. SIG School Name Tier Total # of
Students*Utah 03 Oquirrh Hills School 1 478 Utah 03 Redwood School 1 785 Utah 03 Orchard Hills Elementary 1 729 Utah 03 Granger High 2 1,806 Utah 03 Kearns High 2 1,894
Total Number of SIG-eligible Students in State 20,673 Vermont 00 Wheeler School 1 241Vermont 00 Johnson Elementary School 1 246Vermont 00 Northfield Elementary School 1 308Vermont 00 St. Johnsbury Schools 1 705Vermont 00 Winooski High School 1 211Vermont 00 Fair Haven UHSD #16 2 521Vermont 00 Lamoille UHSD #18 2 624Vermont 00 Rutland Senior High School 2 1074Vermont 00 Mount Abraham UHSD #28 2 926Vermont 00 Windsor High School 2 371
Total Number of SIG-eligible Students in State 5,227 Virginia 01 Caroline High 2 1,202 Virginia 01 Colonial Beach High 2 242 Virginia 01 Central High 2 317 Virginia 02 Lake Taylor Middle 1 839 Virginia 03 New Bridge School 1 64 Virginia 03 Ruffner Middle 1 828 Virginia 03 Thomas C. Boushall Middle 1 473 Virginia 03 Armstrong High School 2 1,158 Virginia 04 Peabody Middle 1 Na Virginia 04 Sussex Central Middle 1 294 Virginia 04 Ellen W. Chambliss Elem. 1 258 Virginia 05 James S. Russell Middle 1 539 Virginia 05 Langston Focus School 2 133 Virginia 05 Prince Edward County High 2 831 Virginia 06 Westside Elem. 1 585 Virginia 06 Patrick Henry High 2 1,908 Virginia 07 Fred D. Thompson Middle 1 601 Virginia 07 Va. Randolph Comm. High 2 281 Virginia 08 T. C. Williams High 2 2,867 Virginia 09 Fries Middle 1 160 Virginia 09 Hurley High 2 254 Virginia 09 George Wythe High 2 467
Total Number of SIG-eligible Students in State 14,301 Washington 02 West View Elementary 1 422 Washington 02 Tulalip Elementary 1 231 Washington 02 Marysville Middle School 2 971 Washington 03 Long Beach Elementary School 1 274
State Cong.Dist. SIG School Name Tier Total # of
Students*Washington 03 Monticello Middle School 2 581 Washingt on 03 Jason Lee Middle School 2 819 Washington 03 Discovery Middle School 2 739 Washington 04 Granger Middle School 1 489 Washington 04 Harrah Elementary School 1 585 Washington 04 White Swan High School 1 252 Washington 04 Mount Adams Middle School 1 145 Washington 04 Emerson Elementary 1 569 Washington 04 Robert Frost Elementary 1 567 Washington 04 Rowena Chess Elementary 1 651 Washington 04 Ellen Ochoa Middle School 1 860 Washington 04 Virgie Robinson Elementary 1 636 Washington 04 Sunnyside High School 1 1,558 Washington 04 Valley View Elementary 1 369 Washington 04 Morris Schott Middle School 1 552 Washington 04 Adams Elementary School 1 715 Washington 04 Barge-Lincoln Elementary School 1 537 Washington 04 Washington Middle School 1 717 Washington 04 Stanton Alternative School 1 519 Washington 04 Grandview Middle School 2 742 Washington 04 Columbia Basin Secondary School 2 257 Washington 04 Stevens Middle School 2 804 Washington 04 Quincy Junior High 2 359 Washington 04 Wapato Middle School 2 777 Washington 05 Blue Ridge Elementary 1 305 Washington 05 Wellpinit Elementary School 1 177 Washington 05 Rogers High School 2 1,667 Washington 06 Oakville Elementary 1 136 Washington 06 Lake Quinault High School 1 138 Washington 06 Perry G Keithley Middle School 2 832 Washington 06 Oakville High School 2 138 Washington 06 Oakland Bay Junior High School 2 732 Washington 06 Hunt 2 429 Washington 06 Jason Lee 2 438 Washington 06 Stewart 2 542 Washington 06 Angelo Giaudrone Middle School 2 674 Washington 07 Hawthorne Elementary School 1 237 Washington 07 Cascade Middle School 2 550 Washington 07 Cleveland High School 2 664 Washington 07 Foster Senior High School 2 899 Washington 08 Robinswood High School 1 226 Washington 09 Chinook Middle School 2 477
Total Number of SIG-eligible Students in State 25,958

our CommunitiEs lEft bEhind 39
*Note: NA=Total enrollment not included in common core 07-08 survey data
State Cong.Dist. SIG School Name Tier Total # of
Students*
West Virginia 01 Doddridge County Elementary School 1 453
West Virginia 01 Franklin Elementary Center 1 334 West Virginia 02 Malden Elementary School 1 250 West Virginia 02 Martinsburg North Middle School 2 551 West Virginia 02 East Bank Middle School 2 451 West Virginia 02 Hayes Middle School 2 570 West Virginia 02 Riverside High School 2 1,266 West Virginia 02 Cedar Grove Middle School 2 191 West Virginia 02 Stonewall Jackson Middle School 2 542 West Virginia 02 Geary Elementary School 2 310 West Virginia 03 West Hamlin Elementary 1 468 West Virginia 03 Cherry River Elementary School 1 229 West Virginia 03 Mount Hope High School 2 365 West Virginia 03 Hamlin Pk-8 2 545 West Virginia 03 Guyan Valley Middle 2 296 West Virginia 03 Sandy River Middle School 2 293 West Virginia 03 Mount View High School 2 830
Total Number of SIG-eligible Students in State 7,944 Wisconsin 04 Custer High 1 1,048 Wisconsin 04 Vincent High 1 1,500 Wisconsin 04 Dubois High 1 308
Wisconsin 04 WHS Law Education & Public Service 1 284
Wisconsin 04 Milwaukee African American Immersion 1 413
Wisconsin 04 Bay View High 2 1,471 Wisconsin 04 Bradley Technology High 2 1,565
State Cong.Dist. SIG School Name Tier Total # of
Students*Wisconsin 04 South Division High 2 1,464
Wisconsin 04 Downtown Institute of Arts & Letters 2 177
Wisconsin 04 Marshall Montessori IB High 2 Na
Wisconsin 04 James Madison Academic Campus 2 1,061
Wisconsin 05 Foster & Williams 2 Na Total Number of SIG-eligible Students in State 9,291
Wyoming 00 Arapahoe Elementary 1 277 Wyoming 00 Arapaho Charter High School 1 65 Wyoming 00 Pershing Elementary 1 233 Wyoming 00 Cooperative High 1 32 Wyoming 00 Ft. Washakie Charter High School 1 44 Wyoming 00 Pathfinder High School 1 41 Wyoming 00 Wyoming Indian Elementary 1 253 Wyoming 00 Wyoming Indian Middle School 1 131 Wyoming 00 Mountain View Elementary 1 208 Wyoming 00 Whiting High School 2 41 Wyoming 00 Hem Junior/Senior High School 2 122 Wyoming 00 Triumph High School 2 243 Wyoming 00 Glenrock High School 2 227 Wyoming 00 Horizon Alternative School 2 69 Wyoming 00 Swift Creek Learning Center 2 28 Wyoming 00 Roosevelt High School 2 224 Wyoming 00 Expedition Academy 2 60 Wyoming 00 Summit High School 2 50
Total Number of SIG-eligible Students in State 2,348 Total Number of SIG-eligible Students in Nation 1,437,892

40 our CommunitiEs lEft bEhind
ii. distriBution of siG schools And students By conGressionAl district
NCES Cong.
District Code
State Cong.District
SIG Schools
(N)
Students in SIG Schools
(N)
Students in Cong. Districts
(N)
% of all Students in Dist. Enrolled in SIG
Schools 0101 Alabama 01 3 771 106,419 0.7%0102 Alabama 02 10 2,644 100,913 2.6%0103 Alabama 03 9 3,541 106,186 3.3%0104 Alabama 04 3 1,236 105,696 1.2%0105 Alabama 05 5 1,546 109,634 1.4%0107 Alabama 07 18 6,799 91,986 7.4%0200 Alaska 00 31 6,179 131,029 4.7%0401 Arizona 01 12 2,897 121,906 2.4%0402 Arizona 02 3 590 165,024 0.4%0404 Arizona 04 5 1,219 146,284 0.8%0406 Arizona 06 1 136 177,357 0.1%0407 Arizona 07 9 1,657 159,606 1.0%0501 Arkansas 01 8 2,571 119,008 2.2%0502 Arkansas 02 6 4,901 113,430 4.3%0503 Arkansas 03 1 362 134,209 0.3%0504 Arkansas 04 4 2,314 112,369 2.1%0601 California 01 2 854 100,273 0.9%0602 California 02 1 555 113,392 0.5%0604 California 04 1 480 125,175 0.4%0605 California 05 3 2,665 103,363 2.6%0606 California 06 1 387 83,452 0.5%0607 California 07 9 7,530 88,979 8.5%0608 California 08 10 4,323 38,502 11.2%0609 California 09 6 2,075 74,399 2.8%0610 California 10 2 1,514 118,962 1.3%0611 California 11 2 945 144,367 0.7%0613 California 13 3 3,098 98,700 3.1%0614 California 14 4 1,455 81,282 1.8%0616 California 16 2 883 105,964 0.8%0617 California 17 17 12,317 107,361 11.5%0618 California 18 8 5,225 148,674 3.5%0620 California 20 13 7,533 154,546 4.9%0621 California 21 7 4,060 160,248 2.5%0622 California 22 5 4,888 154,542 3.2%0623 California 23 4 2,354 101,315 2.3%0625 California 25 4 6,075 170,518 3.6%0627 California 27 2 3,146 102,065 3.1%0628 California 28 3 9,487 86,460 11.0%0631 California 31 2 3,152 90,024 3.5%
NCES Cong.
District Code
State Cong.District
SIG Schools
(N)
Students in SIG Schools
(N)
Students in Cong. Districts
(N)
% of all Students in Dist. Enrolled in SIG
Schools 0632 California 32 1 397 121,975 0.3%0633 California 33 7 12,145 83,317 14.6%0634 California 34 5 12,642 138,319 9.1%0635 California 35 13 20,908 113,449 18.4%0637 California 37 9 13,231 111,654 11.9%0638 California 38 4 4,459 127,803 3.5%0639 California 39 6 10,326 128,872 8.0%0641 California 41 2 3,099 139,204 2.2%0643 California 43 11 16,667 162,194 10.3%0644 California 44 2 3,609 160,304 2.3%0645 California 45 2 1,661 161,840 1.0%0647 California 47 5 12,398 114,775 10.8%0648 California 48 1 907 93,039 1.0%0649 California 49 2 3,653 140,222 2.6%0650 California 50 1 703 120,457 0.6%0651 California 51 1 399 144,328 0.3%0653 California 53 5 3,346 72,461 4.6%0801 Colorado 01 14 7,320 78,883 9.3%0802 Colorado 02 12 6,490 110,598 5.9%0803 Colorado 03 16 5,633 112,238 5.0%0804 Colorado 04 8 1,264 113,975 1.1%0805 Colorado 05 5 697 120,579 0.6%0807 Colorado 07 11 4,983 116,470 4.3%0901 Connecticut 01 7 4,077 115,104 3.5%0902 Connecticut 02 1 310 114,169 0.3%0903 Connecticut 03 6 3,824 102,487 3.7%0904 Connecticut 04 6 4,510 115,846 3.9%0905 Connecticut 05 3 1,540 120,799 1.3%1000 Delaware 00 11 8,782 122,574 7.2%1198 DC 98 10 5,097 78,108 6.5%1201 Florida 01 1 897 107,823 0.8%1202 Florida 02 3 2,947 100,776 2.9%1203 Florida 03 14 11,400 119,549 9.5%1204 Florida 04 5 4,426 104,435 4.2%1205 Florida 05 2 3,536 122,999 2.9%1206 Florida 06 4 6,459 109,545 5.9%1207 Florida 07 1 253 110,260 0.2%1208 Florida 08 2 3,805 132,351 2.9%1209 Florida 09 1 1,993 114,390 1.7%

our CommunitiEs lEft bEhind 41
NCES Cong.
District Code
State Cong.District
SIG Schools
(N)
Students in SIG Schools
(N)
Students in Cong. Districts
(N)
% of all Students in Dist. Enrolled in SIG
Schools 1210 Florida 10 2 3,807 65,049 5.9%1211 Florida 11 4 6,066 109,605 5.5%1212 Florida 12 1 425 132,949 0.3%1213 Florida 13 1 1,303 92,907 1.4%1215 Florida 15 2 3,923 119,873 3.3%1216 Florida 16 1 1,010 108,889 0.9%1217 Florida 17 15 18,613 105,489 17.6%1218 Florida 18 2 2,164 72,805 3.0%1219 Florida 19 1 2,416 93,558 2.6%1223 Florida 23 5 4,650 115,710 4.0%1225 Florida 25 3 7,423 131,307 5.7%1302 Georgia 02 10 7,883 109,877 7.2%1303 Georgia 03 2 2,536 151,397 1.7%1304 Georgia 04 3 3,072 108,827 2.8%1305 Georgia 05 4 4,636 80,128 5.8%1308 Georgia 08 5 3,876 128,033 3.0%1309 Georgia 09 2 2,046 144,188 1.4%1310 Georgia 10 1 339 118,964 0.3%1311 Georgia 11 3 838 141,523 0.6%1312 Georgia 12 5 4,882 113,988 4.3%1501 Hawaii 01 1 79 79,741 0.1%1502 Hawaii 02 5 2,948 100,156 2.9%1601 Idaho 01 4 1,380 144,369 1.0%1602 Idaho 02 9 2,607 127,533 2.0%1701 Illinois 01 10 12,369 99,248 12.5%1702 Illinois 02 19 25,650 112,691 22.8%1703 Illinois 03 6 10,032 93,846 10.7%1704 Illinois 04 11 21,817 120,831 18.1%1705 Illinois 05 6 9,839 80,250 12.3%1707 Illinois 07 14 12,736 96,506 13.2%1709 Illinois 09 2 2,074 73,358 2.8%1710 Illinois 10 2 5,175 125,696 4.1%1711 Illinois 11 3 1,627 131,096 1.2%1712 Illinois 12 7 4,027 108,732 3.7%1714 Illinois 14 1 2,816 148,285 1.9%1715 Illinois 15 1 345 103,544 0.3%1716 Illinois 16 2 3,610 128,775 2.8%1717 Illinois 17 3 2,626 98,757 2.7%1718 Illinois 18 4 2,551 101,531 2.5%1719 Illinois 19 2 247 106,932 0.2%1801 Indiana 01 12 9,010 124,249 7.3%
NCES Cong.
District Code
State Cong.District
SIG Schools
(N)
Students in SIG Schools
(N)
Students in Cong. Districts
(N)
% of all Students in Dist. Enrolled in SIG
Schools 1802 Indiana 02 8 4,326 109,055 4.0%1803 Indiana 03 4 2,082 115,032 1.8%1805 Indiana 05 1 129 144,248 0.1%1806 Indiana 06 5 3,441 106,072 3.2%1807 Indiana 07 18 11,555 94,016 12.3%1808 Indiana 08 7 1,011 102,771 1.0%1809 Indiana 09 3 678 115,907 0.6%1901 Iowa 01 6 3,288 90,849 3.6%1902 Iowa 02 9 3,362 95,774 3.5%1903 Iowa 03 12 10,371 101,817 10.2%1904 Iowa 04 2 1,024 97,456 1.1%1905 Iowa 05 6 5,347 96,308 5.6%2001 Kansas 01 2 1,585 113,647 1.4%2002 Kansas 02 2 1,110 112,136 1.0%2003 Kansas 03 8 5,242 123,240 4.3%2004 Kansas 04 6 7,278 119,486 6.1%2101 Kentucky 01 1 539 107,346 0.5%2102 Kentucky 02 2 562 119,524 0.5%2103 Kentucky 03 5 4,488 93,597 4.8%2105 Kentucky 05 2 1,373 116,111 1.2%2201 Louisiana 01 3 3,626 89,179 4.1%2202 Louisiana 02 7 5,041 50,027 10.1%2203 Louisiana 03 3 2,439 106,075 2.3%2204 Louisiana 04 6 4,847 113,676 4.3%2205 Louisiana 05 6 2,693 109,765 2.5%2206 Louisiana 06 5 3,675 104,084 3.5%2207 Louisiana 07 2 1,542 108,105 1.4%2301 Maine 01 2 1,110 94,668 1.2%2302 Maine 02 8 2,307 96,069 2.4%2402 Maryland 02 2 692 96,364 0.7%2403 Maryland 03 1 637 88,772 0.7%2404 Maryland 04 4 2,920 110,677 2.6%2407 Maryland 07 9 5,034 101,845 4.9%2501 Massachusetts 01 3 1,677 95,965 1.7%2502 Massachusetts 02 19 13,332 111,632 11.9%2503 Massachusetts 03 4 1,827 105,860 1.7%2504 Massachusetts 04 10 5,572 102,917 5.4%2505 Massachusetts 05 11 4,601 116,503 3.9%2506 Massachusetts 06 6 4,885 98,779 4.9%2507 Massachusetts 07 4 1,106 81,611 1.4%2508 Massachusetts 08 32 17,580 64,194 27.4%
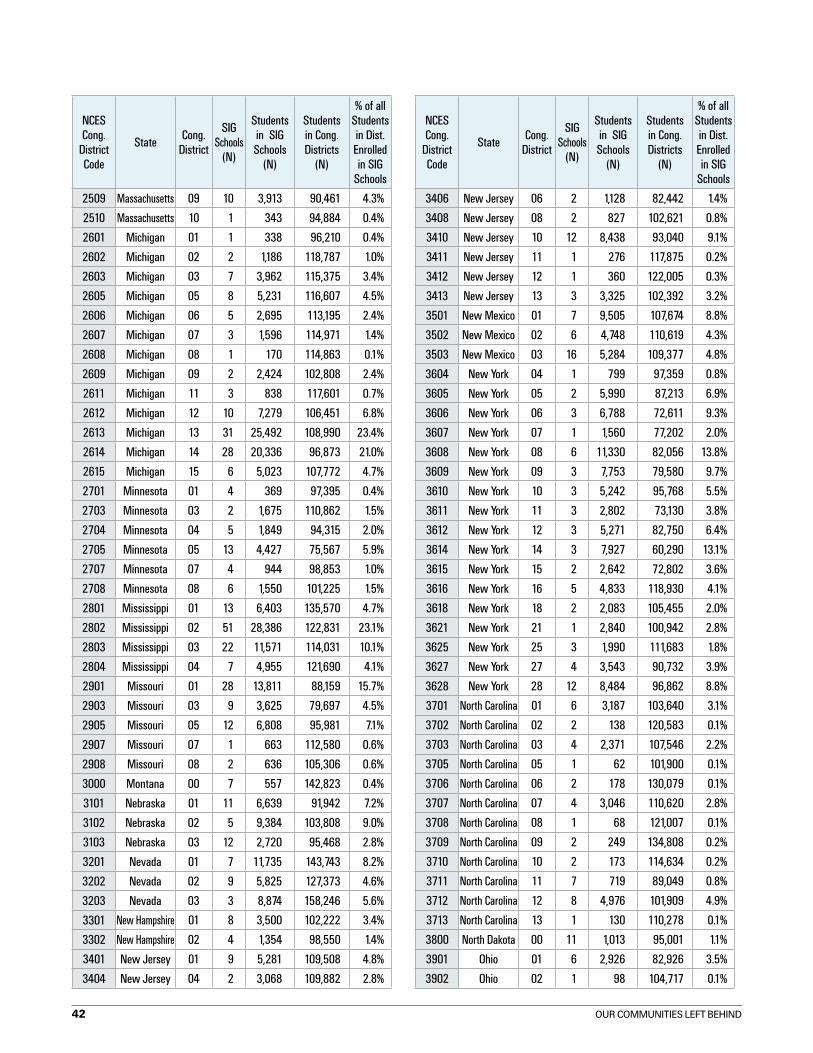
42 our CommunitiEs lEft bEhind
NCES Cong.
District Code
State Cong.District
SIG Schools
(N)
Students in SIG Schools
(N)
Students in Cong. Districts
(N)
% of all Students in Dist. Enrolled in SIG
Schools 2509 Massachusetts 09 10 3,913 90,461 4.3%2510 Massachusetts 10 1 343 94,884 0.4%2601 Michigan 01 1 338 96,210 0.4%2602 Michigan 02 2 1,186 118,787 1.0%2603 Michigan 03 7 3,962 115,375 3.4%2605 Michigan 05 8 5,231 116,607 4.5%2606 Michigan 06 5 2,695 113,195 2.4%2607 Michigan 07 3 1,596 114,971 1.4%2608 Michigan 08 1 170 114,863 0.1%2609 Michigan 09 2 2,424 102,808 2.4%2611 Michigan 11 3 838 117,601 0.7%2612 Michigan 12 10 7,279 106,451 6.8%2613 Michigan 13 31 25,492 108,990 23.4%2614 Michigan 14 28 20,336 96,873 21.0%2615 Michigan 15 6 5,023 107,772 4.7%2701 Minnesota 01 4 369 97,395 0.4%2703 Minnesota 03 2 1,675 110,862 1.5%2704 Minnesota 04 5 1,849 94,315 2.0%2705 Minnesota 05 13 4,427 75,567 5.9%2707 Minnesota 07 4 944 98,853 1.0%2708 Minnesota 08 6 1,550 101,225 1.5%2801 Mississippi 01 13 6,403 135,570 4.7%2802 Mississippi 02 51 28,386 122,831 23.1%2803 Mississippi 03 22 11,571 114,031 10.1%2804 Mississippi 04 7 4,955 121,690 4.1%2901 Missouri 01 28 13,811 88,159 15.7%2903 Missouri 03 9 3,625 79,697 4.5%2905 Missouri 05 12 6,808 95,981 7.1%2907 Missouri 07 1 663 112,580 0.6%2908 Missouri 08 2 636 105,306 0.6%3000 Montana 00 7 557 142,823 0.4%3101 Nebraska 01 11 6,639 91,942 7.2%3102 Nebraska 02 5 9,384 103,808 9.0%3103 Nebraska 03 12 2,720 95,468 2.8%3201 Nevada 01 7 11,735 143,743 8.2%3202 Nevada 02 9 5,825 127,373 4.6%3203 Nevada 03 3 8,874 158,246 5.6%3301 New Hampshire 01 8 3,500 102,222 3.4%3302 New Hampshire 02 4 1,354 98,550 1.4%3401 New Jersey 01 9 5,281 109,508 4.8%3404 New Jersey 04 2 3,068 109,882 2.8%
NCES Cong.
District Code
State Cong.District
SIG Schools
(N)
Students in SIG Schools
(N)
Students in Cong. Districts
(N)
% of all Students in Dist. Enrolled in SIG
Schools 3406 New Jersey 06 2 1,128 82,442 1.4%3408 New Jersey 08 2 827 102,621 0.8%3410 New Jersey 10 12 8,438 93,040 9.1%3411 New Jersey 11 1 276 117,875 0.2%3412 New Jersey 12 1 360 122,005 0.3%3413 New Jersey 13 3 3,325 102,392 3.2%3501 New Mexico 01 7 9,505 107,674 8.8%3502 New Mexico 02 6 4,748 110,619 4.3%3503 New Mexico 03 16 5,284 109,377 4.8%3604 New York 04 1 799 97,359 0.8%3605 New York 05 2 5,990 87,213 6.9%3606 New York 06 3 6,788 72,611 9.3%3607 New York 07 1 1,560 77,202 2.0%3608 New York 08 6 11,330 82,056 13.8%3609 New York 09 3 7,753 79,580 9.7%3610 New York 10 3 5,242 95,768 5.5%3611 New York 11 3 2,802 73,130 3.8%3612 New York 12 3 5,271 82,750 6.4%3614 New York 14 3 7,927 60,290 13.1%3615 New York 15 2 2,642 72,802 3.6%3616 New York 16 5 4,833 118,930 4.1%3618 New York 18 2 2,083 105,455 2.0%3621 New York 21 1 2,840 100,942 2.8%3625 New York 25 3 1,990 111,683 1.8%3627 New York 27 4 3,543 90,732 3.9%3628 New York 28 12 8,484 96,862 8.8%3701 North Carolina 01 6 3,187 103,640 3.1%3702 North Carolina 02 2 138 120,583 0.1%3703 North Carolina 03 4 2,371 107,546 2.2%3705 North Carolina 05 1 62 101,900 0.1%3706 North Carolina 06 2 178 130,079 0.1%3707 North Carolina 07 4 3,046 110,620 2.8%3708 North Carolina 08 1 68 121,007 0.1%3709 North Carolina 09 2 249 134,808 0.2%3710 North Carolina 10 2 173 114,634 0.2%3711 North Carolina 11 7 719 89,049 0.8%3712 North Carolina 12 8 4,976 101,909 4.9%3713 North Carolina 13 1 130 110,278 0.1%3800 North Dakota 00 11 1,013 95,001 1.1%3901 Ohio 01 6 2,926 82,926 3.5%3902 Ohio 02 1 98 104,717 0.1%

our CommunitiEs lEft bEhind 43
NCES Cong.
District Code
State Cong.District
SIG Schools
(N)
Students in SIG Schools
(N)
Students in Cong. Districts
(N)
% of all Students in Dist. Enrolled in SIG
Schools 3903 Ohio 03 6 3,066 104,885 2.9%3904 Ohio 04 4 783 106,224 0.7%3907 Ohio 07 2 1,375 114,637 1.2%3908 Ohio 08 1 362 111,936 0.3%3909 Ohio 09 6 3,355 99,263 3.4%3911 Ohio 11 18 11,953 88,516 13.5%3912 Ohio 12 7 1,861 119,252 1.6%3913 Ohio 13 3 791 102,715 0.8%3914 Ohio 14 1 54 103,843 0.1%3915 Ohio 15 4 8,423 108,948 7.7%3916 Ohio 16 2 116 106,470 0.1%3917 Ohio 17 6 1,569 89,867 1.7%3918 Ohio 18 1 79 98,045 0.1%4001 Oklahoma 01 8 6,133 126,219 4.9%4002 Oklahoma 02 5 1,501 134,451 1.1%4003 Oklahoma 03 1 701 122,344 0.6%4005 Oklahoma 05 6 2,816 122,678 2.3%4101 Oregon 01 1 215 119,639 0.2%4102 Oregon 02 4 2,025 118,289 1.7%4103 Oregon 03 4 992 99,717 1.0%4104 Oregon 04 2 212 101,425 0.2%4105 Oregon 05 6 3,758 119,750 3.1%4201 Pennsylvania 01 61 44,558 105,172 42.4%4202 Pennsylvania 02 49 27,646 73,195 37.8%4203 Pennsylvania 03 7 3,199 93,377 3.4%4204 Pennsylvania 04 3 1,239 107,660 1.2%4205 Pennsylvania 05 1 227 87,348 0.3%4206 Pennsylvania 06 2 1,053 108,670 1.0%4207 Pennsylvania 07 3 4,382 92,896 4.7%4209 Pennsylvania 09 4 888 88,242 1.0%4211 Pennsylvania 11 2 4,180 99,913 4.2%4212 Pennsylvania 12 3 1,119 81,888 1.4%4213 Pennsylvania 13 6 6,455 80,281 8.0%4214 Pennsylvania 14 22 11,146 58,904 18.9%4215 Pennsylvania 15 7 9,312 108,733 8.6%4216 Pennsylvania 16 5 4,612 105,610 4.4%4217 Pennsylvania 17 15 10,133 99,050 10.2%4218 Pennsylvania 18 2 1,559 98,216 1.6%4219 Pennsylvania 19 5 3,061 106,689 2.9%4401 Rhode Island 01 3 2,416 68,956 3.5%4402 Rhode Island 02 8 4,023 77,272 5.2%
NCES Cong.
District Code
State Cong.District
SIG Schools
(N)
Students in SIG Schools
(N)
Students in Cong. Districts
(N)
% of all Students in Dist. Enrolled in SIG
Schools 4501 South Carolina 01 3 1,330 119,256 1.1%4502 South Carolina 02 6 2,288 126,272 1.8%4503 South Carolina 03 1 43 113,022 0.0%4504 South Carolina 04 3 1,733 120,657 1.4%4505 South Carolina 05 4 2,061 124,988 1.6%4506 South Carolina 06 11 5,395 108,124 5.0%4600 South Dakota 00 12 1,208 120,191 1.0%4701 Tennessee 01 1 44 99,680 0.0%4702 Tennessee 02 2 837 100,175 0.8%4703 Tennessee 03 2 1,969 97,538 2.0%4704 Tennessee 04 1 444 107,927 0.4%4705 Tennessee 05 1 291 85,154 0.3%4708 Tennessee 08 3 2,956 108,705 2.7%4709 Tennessee 09 5 4,869 106,511 4.6%4801 Texas 01 3 240 124,823 0.2%4802 Texas 02 2 289 151,725 0.2%4803 Texas 03 3 508 145,579 0.3%4804 Texas 04 4 296 160,284 0.2%4805 Texas 05 6 6,339 135,622 4.7%4806 Texas 06 1 384 158,709 0.2%4807 Texas 07 1 262 136,678 0.2%4808 Texas 08 3 348 144,160 0.2%4809 Texas 09 5 4,288 126,917 3.4%4810 Texas 10 3 1,001 169,026 0.6%4811 Texas 11 2 44 125,440 0.0%4812 Texas 12 8 1,549 145,498 1.1%4813 Texas 13 6 488 119,162 0.4%4814 Texas 14 3 289 152,587 0.2%4815 Texas 15 13 3,166 180,415 1.8%4816 Texas 16 5 730 160,011 0.5%4817 Texas 17 8 1,668 125,802 1.3%4818 Texas 18 10 4,453 129,188 3.4%4819 Texas 19 11 3,157 123,218 2.6%4820 Texas 20 10 4,506 137,109 3.3%4821 Texas 21 9 1,925 139,821 1.4%4822 Texas 22 2 2,485 173,663 1.4%4823 Texas 23 4 641 160,273 0.4%4824 Texas 24 3 552 139,241 0.4%4825 Texas 25 10 2,671 126,125 2.1%4826 Texas 26 3 392 165,112 0.2%4827 Texas 27 6 1,718 158,074 1.1%

44 our CommunitiEs lEft bEhind
NCES Cong.
District Code
State Cong.District
SIG Schools
(N)
Students in SIG Schools
(N)
Students in Cong. Districts
(N)
% of all Students in Dist. Enrolled in SIG
Schools 4828 Texas 28 4 3,593 205,722 1.7%4829 Texas 29 4 1,410 146,325 1.0%4830 Texas 30 11 9,705 133,616 7.3%4831 Texas 31 7 630 166,867 0.4%4832 Texas 32 4 4,423 106,618 4.1%4901 Utah 01 13 8,833 191,831 4.6%4902 Utah 02 6 5,103 181,609 2.8%4903 Utah 03 6 6,737 202,755 3.3%5000 Vermont 00 10 5,227 91,440 5.7%5101 Virginia 01 3 1,761 134,939 1.3%5102 Virginia 02 1 839 98,654 0.9%5103 Virginia 03 4 2,523 108,779 2.3%5104 Virginia 04 3 552 128,677 0.4%5105 Virginia 05 3 1,503 97,733 1.5%5106 Virginia 06 2 2,493 96,574 2.6%5107 Virginia 07 2 882 119,663 0.7%
NCES Cong.
District Code
State Cong.District
SIG Schools
(N)
Students in SIG Schools
(N)
Students in Cong. Districts
(N)
% of all Students in Dist. Enrolled in SIG
Schools 5108 Virginia 08 1 2,867 75,452 3.8%5109 Virginia 09 3 881 94,685 0.9%5302 Washington 02 3 1,624 117,504 1.4%5303 Washington 03 4 2,413 130,639 1.8%5304 Washington 04 21 12,660 144,912 8.7%5305 Washington 05 3 2,149 109,269 2.0%5306 Washington 06 9 4,059 104,013 3.9%5307 Washington 07 4 2,350 59,058 4.0%5308 Washington 08 1 226 133,565 0.2%5309 Washington 09 1 477 119,888 0.4%5401 West Virginia 01 2 787 88,185 0.9%5402 West Virginia 02 8 4,131 102,968 4.0%5403 West Virginia 03 7 3,026 91,359 3.3%5504 Wisconsin 04 11 9,291 101,571 9.1%5505 Wisconsin 05 1 n/a 110,301 n/a 5600 Wyoming 00 18 2,348 86,364 2.7%

our CommunitiEs lEft bEhind 45
iii. dAtA sources for stAtes unAPProved As of July 9, 2010 By the dePArtment of educAtion
the 12 states, and url we used to access their applications or lists of eligible schools, are as follows:
arkansas http://recovery.arkansas.gov/ade/pdf/lowest_achieving_061010.pdf
hawaii http://www.googlesyndicatedsearch.com/u/hidoE?hl=en&sitesearch=k12.hi.us&ie=iso-8859- 1&q=school+improvement+grant&sitesearch=k12.hi.us
idaho http://www.sde.idaho.gov/site/title_one/
illinois http://www.isbe.state.il.us/sfsf/default.htm
maine http://www.maine.gov/tools/whatsnew/index.php?topic=doEnews&id=93364&v=article
massachusetts http://finance1.doe.mass.edu/grants/grants11/rfp/doc/511_e.xls
mississippi http://www.mde.k12.ms.us/innovative_support/school_improvement_1003g.html
montana http://opi.mt.gov/Programs/titlePrgms/titleia/index.html#gpm1_10
nebraska list provided by nebraska department of Education pursuant to request
new hampshire http://www.education.nh.gov/instruction/integrated/documents/title_i_per_low_ach2009-10.pdf
tennessee http://tennessee.gov/education/fedprog/fpschlimprove.shtml
Wyoming http://www.k12.wy.us/fP/sig_Pla.asp

46 our CommunitiEs lEft bEhind
the school improvement grants program was established under no Child left behind in 2001. sig funds are awarded to states based on the title i funding formula, which reflects the number and concentration of low income students, state spending on education, and other factors. the grants are to be used to support reform in schools that have missed adequate Yearly Progress and are in improvement, corrective action or restructuring status. the state makes grants to districts, which in turn makes grants to schools. the obama administration and Congress have greatly expanded the program, using Congressional allocations for title i as well as a $3 billion infusion from the american recovery and reinvestment act. in total, $3.546 billion will be allocated to states this year under the program, compared with $125 million in fiscal year 2007. (http://www2.ed.gov/programs/sif/index.html)
in addition to greatly increasing the total amount of sig grants available, the administration has outlined four specific reforms that must be used in the lowest performing schools that are receiving or eligible for title i funds. the four models are, according to the department of Education:
• turnaroundmodel—this would include among other actions, replacing the principal and at least 50 percent of the school’s staff, adopting a new governance structure and implementing a new or revised instructional program.
• restartmodel—school districts would close failing schools and reopen them under the management of a charter school operator, a charter management organization or an educational management organization selected through a rigorous review process. a restart school would be required to admit, within the grades it serves, any former student who wishes to attend.
• schoolclosure—the district would close a failing school and enroll the students who attended that school in other higher-achieving schools in the district.
• transformationalmodel—districts would address four specific areas: 1) developing new measures
of teacher and school leader effectiveness, which includes replacing the principal who led the school prior to commencement of the transformational model, 2) implementing comprehensive instructional reform strategies, 3) extending learning and teacher planning time and creating community-oriented schools, and 4) providing operating flexibility and sustained support. “i
so far, districts that have been allocated school improvement grants have largely chosen the less radical transformation model.ii the department of Education, though, conceived of the transformation model as a model of last resort, and has limited the number of schools that can select that model in each district. in any district allocating grants to more than nine persistently-low performing schools, the transformation model can be used in no more than half of schools.
eligibleschoolsthe department of Education has identified three tiers of schools eligible for school improvement grants. the tiers are defined as follows:
tieri: the lowest 5% (or 5, whichever is greater) of title i participating schools in improvement, corrective action or restructuring and all title i participating secondary schools with graduation rates below 60% for a number of years.tierii: the lowest 5% (or 5, whichever is greater) of title i eligible but not participating secondary schools and all title i eligible but not participating secondary schools with graduation rates below 60% over a number of years.
tieriii: all other title i schools in improvement, corrective action or restructuring.
in the Consolidated appropriations act of 2010, Congress expanded the definition of schools that states may define as eligible for school improvement grants. at their option, states may now add new classes of schools to the three tiers. Essentially, these schools consist of all title i eligible and/or participating schools that have missed aYP for two consecutive years and are in the lowest-performing 20% of schools statewide. the Consolidated appropriations act of 2010 defines the following newly eligible schools that states may choose to include in the three tiers:
iv. exPAnded exPlAnAtion of siG ProGrAm

our CommunitiEs lEft bEhind 47
newlyeligibletierischools:title i eligible, whether participating or not, elementary schools that are no higher achieving than the highest achieving school already identified in tier i, and are in the lowest achieving 20% of schools or have missed aYP for two consecutive years.
newlyeligibletieriischools:title i eligible, whether participating or not, secondary schools that are no higher achieving than the highest achieving school already identified in tier ii or have graduation rates below 60% over a number of years; and are in the lowest achieving 20% of schools or have missed aYP for two consecutive years.
newlyeligibletieriiischools:all remaining title i eligible, whether participating or not, schools that are in the lowest achieving 20% of schools or have missed aYP for two consecutive years.
states may decide to identify some, but not all, of the newly eligible schools, for example those in the lowest achieving 10% of schools, or newly eligible tier i and ii schools but not newly eligible tier iii schools. once identified, newly eligible schools are not treated differently than those schools already identified in each tier and are prioritized equally for funding.
tier i and tier ii schools are bound by the four turnaround models specified by the Education department. districts may specify a set of appropriate interventions for tier iii schools. (guidance on school improvement grants under section 1003(g) of the Elementary and secondary Education act of 1965, Ed 2010, sections a20-30)
identifYingeligibleschoolsstates must identify schools eligible for sig grants on the basis of the reading/language arts and math assessments it uses for assessing students under the Elementary and secondary Education act (reauthorized as no Child left behind in 2001). the state must rank students in terms of percent proficient in the “all students” subgroup, which includes English language learners and students with disabilities. states must identify the lowest achieving
schools in terms of absolute performance and lack of progress, but have flexibility in determining how many years to consider in assessing progress and in whether to weigh absolute performance and lack of progress equally or differently. states can also choose to use a standard four-year graduation rate or an extended graduation rate.
states may exclude schools for which it lacks sufficient data to determine whether they are persistently low performing (for example, new schools with too few years of data), schools it has already taken steps to close, and, on a case-by-case basis, schools that are specifically designed to serve over-age, under-credited students who by definition cannot graduate on time. states may also apply for a waiver to exclude very small schools for which achievement results may be unreliable based on the small number of students in the “all students” group.
“title i eligible” refers to schools eligible to receive funding under title i, Part a of the Elementary and secondary Education act. any school with a higher percentage of students living in poverty than the district-wide average (or the district-wide average for the relevant grade span) is considered eligible to receive funds; districts may alternatively designate as eligible all schools with more than 35% of students living in poverty. because there are not enough funds available to serve all eligible schools, districts must first serve, in rank order, those schools with more than 75% poverty. if funds remain after serving all such schools, districts may then serve, in rank order, schools with lower concentrations of poverty. districts have discretion in setting the per-pupil allocation of title i funds to schools they serve, with some limitations for districts electing to serve schools with less than 35% poverty. (us department of Education, office of Elementary and secondary Education, “non-regulatory guidance: local Education agency identification of school attendance areas and schools and allocation of title i funds to those areas and schools.” august 2003.) the schools that states must include in tier ii are the lowest performing of those secondary schools that are eligible for, but to do not receive, title i, Part a funds.
i u.s. department of Education, office of Elementary and secondary Education. 2010. “obama administration announces historic opportunity to turn around nation’s lowest performing school.” Press release august 29, 2010. http://www2.ed.gov/news/pressreleases/2009/08/08262009.html
ii maxwell, l. 2010. “Transformation: Most popular school improvement model.” Education Week, state EdWatch blog. July 9, 2010.

48 our CommunitiEs lEft bEhind
notes

our CommunitiEs lEft bEhind 49

Communities for exCellent PubliC sChools1825 K street, nW
suite 400Washington, d.C. 20006
www.ceps-ourschools.org