Embed Size (px)
Citation preview
ORR’s Annual Health and Safety Report of Performance on Britain’s Railways: 2015-16
July 2016
Contents
Foreword 4
1. Chief Inspector’s review 6
2. Health and safety across the railway sector: The regulator’s view 11
Introduction 11
Overall mainline health and safety risk management maturity 12
Mainline: Network Rail 13
Occupational health performance 22
Mainline: train operating companies 23
Occupational health: train and freight operators 32
Progress on High Speed 2 33
Tramways 33
Transport for London, including London Underground 34
Crossrail 37
Our non-safety accessibility work 37
Our work in Europe 38
The safety of the Channel Tunnel 39
3. Overview of health and safety performance on Britain’s railways in 2015-1641
Introduction 41
How we assess harm and risk performance 41
Putting the common causes of harm into context 42
Our safety statistical release 42
Our use of mainline data and data quality 43
Mainline passenger and public fatalities in 2015-16 43
Mainline passenger and public fatalities and weighted injuries 44
Mainline workforce fatalities and weighted injuries 45
Mainline infrastructure worker fatalities and weighted injuries 46
Trends in mainline potentially high risk train accidents 47
Comparison with railways in the European Union 50
Trends in SPAD numbers and underlying risk, September 2006 to March 2016 51
Track geometry 52
Suicides and attempted suicides 52
Trespass 53
Vandalism 53
Level crossings 53
Objects on the line 54
Bridge strikes 54
Transport for London 54
Tramways 56
4. Roles of key industry bodies 58
Rail Accident Investigation Branch 58
Our relationship with RSSB 60
5. Our enforcement activities 61
Improvement notices in 2015-16 61
Prohibition notices in 2014-15 62
Prosecutions in 2015-16 62
Changes to fines in the Magistrates Courts and new Sentencing Guidelines for health and safety offences 63
Annex 1 - Glossary 64
Office of Rail and Road | 18 July 2016 Annual Health and Safety Report 2016 | 4
Foreword 1. Britain’s railways are currently the safest they have ever been, but there is still room
for improvement. We saw a broadly consistent level of safety performance in 2015-16, building on the results of the last few years. For the first year ever, there were no workforce fatalities.
2. There was evidence of top-level safety improvements, particularly around reductions in harm at level crossings and among the workforce, but also a few slightly worsening trends, including high levels of earthwork failures and an increase in harm to passengers at stations.
3. The progress of the last decade has been built on a shared commitment by industry leaders, managers, workers, trade unions, government and ourselves to improve risk management. This year saw the publication of a unified mainline railway health and safety strategy1, a key milestone which we endorsed fully. It identifies improvements to the maturity of the industry’s collective risk management including important health issues, such as worker health and wellbeing.
4. Underpinning this shared commitment to improve risk management is a tried and tested regulatory framework which allows us to: ensure industry duty holders identify, predict and prevent risks so far as is
reasonably practicable; and take proportionate and targeted action to protect workers, passengers and the
public, if safety falls below required standards.5. Our enforcement activities serve as a reminder that inconsistencies in health and
safety standards mean that we are still required to step in to ensure compliance with the law or to deal with an immediate risk. The serious incident at Wotton Basset junction involving a train operated by West Coast Railway Company passing a red signal and which led to a swift and wide ranging response by our inspectors, is one such example.
6. We now need to see further evidence of industry improvement. The industry’s safety leadership has strengthened and broadened, but now must ensure that initiatives to control risk are cascaded consistently and implemented on the front line as well as providing additional focus on improving occupational health management.Building on the industry’s successes in recent years in relation to health and safety also requires continuous energy and commitment. We are ready and resourced to
play our part.
.
Joanna Whittington Ian Prosser Chief Executive, ORR Director of Railway Safety, ORR
1 http://www.rssb.co.uk/Library/improving-industry-performance/2016-04-leaflet-rail-health-and-safety-strategy.pdf

Office of Rail and Road | 18 July 2016 Annual Health and Safety Report 2016 | 5
Office of Rail and Road | 18 July 2016 Annual Health and Safety Report 2016 | 6
1. Chief Inspector’s review 1.1 Keeping Britain's railways amongst the very safest comparable systems in the world,
and the safest form of land transport in Britain, requires sustained focus and continued drive to deliver effective, efficient excellence in risk management.
1.2 This relies primarily on those women and men who work on the railways. It is a real testament to those who do what can undoubtedly be at times a difficult job at the sharp end that in 2015-16, for the first time ever, there were no worker fatalities on Britain's railways. This was a landmark achievement, of which everyone should be rightly very proud. Of course, it is right that everyone should go home safe from work every day and I see this is an important milestone, but there's still more to improve occupational health and safety performance and to reduce the future harm it causes.
1.3 For the ninth year in a row, we saw no passenger fatalities in train accidents - a tangible indicator of a decade of progress - but built on some hard-learnt lessons that we must never forget as we achieve our 'zero-industry caused fatalities' vision. Passenger safety, particularly at stations, and workforce safety will remain central to our work over 2016-17.
1.4 Fatal incidents like the one at Bad Aibling in Germany in February 2016 bring into sharp focus our goal to strive for excellence and continuous improvements in health and safety risk management.
1.5 The need to maintain a focus on risk control is underpinned by this year's data. Although overall levels of harm reduced 4%, the actual harm to passengers and public in stations and on train increased by 8%. When normalised by the 2% growth in passenger journeys is factored in, overall harm to passengers increased 7%. This was largely due to an increase in fatalities at stations and although none were the fault of the industry, it is still an area we all need to focus on. Similarly, while the risk Precursor Indicator Model PIM) showed a notable 9% risk reduction on the mainline railway, there was an increase in the number of low-speed passenger train collisions at stations.
1.6 Also, the underlying results of our Rail Management Maturity Model (RM3) analysis showed duty holders have further to go on the road to excellence; we definitely cannot be complacent.
1.7 Over the last 10 years, passenger growth on the mainline network has increased 57%; there were 1.69 billion passenger journeys in 2015-16. Managing the demands this growth places on an ageing infrastructure and ever busier stations, particularly during train dispatch, whilst also building future infrastructure, will be critical in managing future health and safety performance. Therefore, ensuring infrastructure is maintained in a safe, efficient and sustainable way and ensuring safety at the
Office of Rail and Road | 18 July 2016 Annual Health and Safety Report 2016 | 7
Platform-Train Interface (PTI) so that passengers get on and off trains safely, are high priority areas for us now and in the future.
1.8 Over my almost eight years as HM Chief Inspector for Railways, I have been proud to see a transformation in in how risk is managed at level crossings. We have moved from a tacit acceptance of 'there's not much more we can do', to proactively targeted commitment and investment in risk reduction, which is delivering significant benefits.
1.9 In 2008, in collaboration with us, Network Rail started closing high risk level crossings. With government support, over 1,000 crossings have been closed since 2009-10 and the new level crossing manager role has improved the risk assessment process.
1.10 The benefits of that long-term commitment can be seen with a 69% reduction in actual harm at level crossings, excluding suicides. There were three fatalities at crossings and while each of these was tragic, it was the lowest number on record. There were four collisions between trains and road vehicles on crossings, also a low number. Together the actual harm reduction achieved in 2015-16 was without parallel. However, the data shows near-miss incidents involving pedestrians at level crossings increased 7% last year, probably due to improved reporting, but again showing there is little room for complacency.
1.11 Looking forward, I believe the four key challenges facing the industry are:
the on-going challenge of managing growth and change: the growth in passenger numbers and managing massive transformative railway construction projects puts additional pressure on the industry. Network Rail must also manage resource constraints and pressures to deliver economic efficiencies; at the end of 2015-16, these are not where we would expect them to be. We are also working with the industry to improve safety by design, as ever busier stations are upgraded and modified. We entered a new agreement with the Health and Safety Executive (HSE), which delegates enforcement functions to us for health and safety law at the design stage of new-build railway infrastructure projects . This enables us to ensure the industry takes opportunities to eradicate and reduce risk at the design stage, which is when such risk management interventions are most effective and provide the best value for money. We use our Railway Management Maturity Model (RM3) to identify weaknesses in duty holders' safety management systems.
developing, maintaining and renewing a safe and sustainable infrastructure: undoubtedly, improvements have been made by Network Rail - as discussed in Section 2 - but we found evidence of a lack of coordination in how the company's strategies and procedures set at the centre are implemented at route and site level. Across ORR, we are pushing Network Rail to improve this so that
Office of Rail and Road | 18 July 2016 Annual Health and Safety Report 2016 | 8
it can better manage the increased pressure the deferrals of asset renewals puts on its local maintenance teams to manage the risks.
translating strategic intent into practical delivery on the ground. While there have been some welcome strategic initiatives within Network Rail, implementation at the point of delivery has been uneven. Examples of this are within occupational health and the planning and delivery of safe work. We are looking for consistent and comprehensive follow-through of initiatives, conveying concrete results for the benefit of the industry at the front line.
we see wider benefits from a thriving health management culture and while some progress has been made, there remains more for the industry to do to improve the sectors' management of occupational health. Our report on the industry's occupational health performance set out our five year agenda to 2019 for excellence in health risk management; greater employee engagement; minimising ill-health costs; and the need for the sector managers to improve their health management competencies.
1.12 Other particular risk areas we are scrutinising include:
earthworks, structures and drainage on the mainline railway: poor drainage management can cause embankment instability and track quality weaknesses. Risks from earthworks increased 16% over 2015-16, due to a 195% increase to 118 cutting failures and a 95% increase to 41 in embankment failures, mostly due to wet weather since December 2015. We took enforcement action in 2012 requiring enhanced and targeted contingency arrangements for managing the impacts of severe weather. The evidence of Network Rail’s management of the winter 2015-16 storms shows that its processes are not consistently effective.
signals passed at danger: there were 277 mainline signals passed at danger (SPADs) – a 7% reduction compared to 2014-15 and overall risk from SPADs reduced by 10 percentage points from 64% to 54%. The industry agreed on its SPAD reduction outline strategy in 2015. We continue to monitor SPAD performance closely, especially high risk SPADs, because of the clear risks they pose.
track: building on improvements since the start of CP5 many of the track geometry measures improved in 2015-16, but keeping the right balance between maintenance and renewal activity remains essential. We found evidence of weaknesses in Network Rail’s assurance activity, including in its management and supervisory functions, which must addressed.
harm to the mainline workforce: major injury harm amongst the workforce reduced 14% and minor injuries reduced 3%. Of the 157 major injuries, 37% involved on-track infrastructure workers. While these improvements are
Office of Rail and Road | 18 July 2016 Annual Health and Safety Report 2016 | 9
commendable, the sector lags behind other comparable industries who better manage harm to their infrastructure workers. Important workforce safety initiatives – discussed in section 2 – progressed slowly or suffered from poor implementation; they require long-term commitment. We took significant levels of enforcement in 2015-16 due to poor manual handling arrangements.
electrical safety: There were no major injuries caused to workers in 2015-16, but Britain’s railways are still some way off achieving compliance with the Electricity at Work Regulations 1989 and taking a safety by design approach to managing electrical risks.
1.13 This year saw a 12% reduction, to 252, in suicides and suspected suicides on Britain’s mainline railway. This is a difficult and sensitive issue and commendably Network Rail has led, with its industry partners and the Samaritans, the sector’s attempts to reduce the numbers further, including the 1,100-proactive industry suicide prevention interventions in 2015-16.
1.14 Taking a wider view, the mainline industry issued its first railway health and safety strategy in April 20162. This was a significant step forward which we wholeheartedly endorsed. It sets out a collective cross-industry risk management maturity agenda for the future. It highlights important areas, such as worker health and wellbeing. We pushed for it for some time as the industry can do much more to collaborate, learn from other sectors, identify good practice and improve, with real scope to improve company efficiencies and the health and wellbeing of all employees.
1.15 We continue to monitor the industry’s changing risk profile and landscape and will consider any necessary changes to our regulatory approach and business plans to meet our corporate strategic objective to ‘drive for a safer railway’3’. The equivalent of 109.7 full-time workers were devoted to our health and safety work in 2015-164.
1.16 Transport for London has maintained a high level of safety for its passengers and workforce, as passenger numbers grew, infrastructure was modernised and rolling stock was replaced. However, levels of harm to passengers from incidents at the platform edge increased, a trend that has gradually increased with passenger growth. Performance by London Overground’s operator was of good standard, as the West Anglia Route integrated into its network.
1.17 Internationally, we maintained our reputation as an effective railway health and safety regulator, as evidenced by continuing requests for our advice. We provided counsel and assistance to safety regulators in Canada, USA, Singapore, Hong Kong, Greece, South Korea and Dubai and discussed similar work with other countries.
2 http://www.rssb.co.uk/industry-news/leading-health-and-safety-on-britains-railway 3 http://orr.gov.uk/careers/about-us/strategic-objectives 4 http://orr.gov.uk/__data/assets/pdf_file/0013/11731/business-plan-2014-15.pdf
Office of Rail and Road | 18 July 2016 Annual Health and Safety Report 2016 | 10
1.18 In May 2015, we assisted in setting up the health and safety regulators’ network, which I chair, as a forum for all other health and safety enforce bodies to discuss good practice and procedures and share our experience of common issues, such as how to measure the impact of regulatory activities.
1.19 This report covers the period 2015-16 and therefore does not deal with any of the potential implications from the UK’s ‘Brexit ‘vote to leave the European Union.
1.20 This report brings to a close our celebration of our 175th year as Her Majesty’s Railway inspectorate, within ORR. To celebrate this historic landmark we have contributed to a book which details our long history, to be published later this year. Sifting through the photos and reading the documents from our archive to assemble the book reiterated why our role has endured over time: the importance of making sure all of Britain’s railways protect the health and safety of passengers, workforce and the public.
Ian Prosser Director of Railway Safety, ORR HM Chief Inspector of Railways
Office of Rail and Road | 18 July 2016 Annual Health and Safety Report 2016 | 11
2. Health and safety across the railway sector: The regulator’s view
Introduction 2.1 In this section we provide an overview of our key findings across key risk areas and
set out the evidence leading to our conclusions about each duty holders’ risk management effectiveness, including the results of our Railway Management Maturity Model (RM3) assessments.
2.2 RM3 is one of our key assessment tools. It measures an organisation’s risk management maturity and ability to achieve excellence in risk control. It looks at the areas of policy, monitoring, audit and review, planning and implementing, securing cooperation and confidence and organising for control and communication. It uses a five level scale to assess performance and identify areas for improvement:
level 1 ‘ad hoc’: processes that are typically undocumented and in a state of dynamic change, tending to be driven in an ad-hoc, uncontrolled and reactive manner by users or events. This provides a chaotic or unstable environment for the processes.
level 2 ‘managed’: processes are repeatable, possibly with consistent results. Process discipline is unlikely to be rigorous but where it exists it may help to ensure that existing processes are maintained during times of stress.
level 3 ‘standardised’: there are sets of defined and documented standard processes established and subject to some degree of improvement over time. These standard processes are in place and are used to establish consistency of process performance across the organisation.
level 4 ‘predictable’: use of process metrics. In particular management can identify ways to adjust and adapt the process to particular projects without measureable losses of quality or deviations from specifications. Process capability is established from this level.
level 5 ‘excellence’: a focus on continual improvement through both innovative and incremental technological changes/improvements.
2.3 This section covers Britain’s:
Mainline railway: Network Rail (pages 13-15), train operating companies (pages 24-31) and freight operating companies (pages 32-33);
Heritage railways (page 33);
Office of Rail and Road | 18 July 2016 Annual Health and Safety Report 2016 | 12
Tramways (page 34);
Transport for London’s operations, including London Underground (pages 34-37);
Our non-safety accessibility work (pages 38);
Our work in Europe (pages 38-40); and
The safety of the Chanel Tunnel (page 40).
Overall mainline health and safety risk management maturity Overview: our rounded assessment of duty holders’ maturity in managing risk is based on the full breadth of our interactions and interventions with individual duty holders. It showed, as in recent years, a consistent performance with some areas of improvements. Train accident-related risk, as modelled by the mainline Precursor Indicator Model (PIM), reduced 9% between 31 March 2015 and 31 March 2016. Most risk categories which make up the PIM reduced, but risk from earthwork failures increased following the wet weather since December 2015.
There is scope across the industry to improve on how it manages its growth and change challenges, particularly around station safety and at the platform edge when trains are not present. Harm to passengers and public in stations and on train increased 8%, or 6% when normalised by the 2% increase in mainline passenger journeys.
However, whilst overall harm levels notably reduced amongst the workforce last year, we found insufficiently effective arrangements to manage some fairly basic worker construction health and safety risks, such as manual handling, and delays to the planned roll-out of potential safety enhancements to infrastructure workers.
2.4 Evidence: the overall results of our inspections, interventions and assessment of duty holders’ health and safety risk management maturity using RM3 found a largely unchanged performance in Network Rail, with mostly level 2 ’managed’ and level 3 ‘standardised’ scores, and a slightly improved and predominantly level 3 ‘standardised’ in train operators’ overall scores compared to 2014-15.
2.5 Our activities: However, we found progress in specific areas: Network Rail’s management of auditing and governance arrangements and broader improvements to around a third of assessments of train operators. Our RM3 assessments produced a range of scores, around level 2 ‘managed’ and level 3 ‘standardised’, but with a few consistently showing at level 4 ‘predictable’.
Office of Rail and Road | 18 July 2016 Annual Health and Safety Report 2016 | 13
2.6 We found improvements to how Network Rail managed level crossings risks and asset stewardship. Although they are heavily affected by periods of wet weather, there remains scope for Network Rail to accelerate further the way it improves the stewardship of its earthworks, bridges, tunnels and viaducts.
2.7 There was an overall 19% reduction in harm to the workforce, or 21% when normalised by the 3% increase in workforce hours worked and a 7% increase in actual harm to public. There was a 48% increase in overall harm to passengers and the public from platform edge incidents, which was driven by increases in fatalities. While none of these fatal incidents were industry-caused or involved crowded platforms, they highlight starkly the complexities of future growth challenges for the sector, particularly around the risks at the platform edge in ever busier stations.
2.8 We welcome Network Rail’s senior management’s recognition of the significant potential risk from attempting to deliver too many change initiatives at the same time. Change must be targeted, managed, resourced and realistic to avoid unintended consequences. Network Rail’s trial of the new safe work leader role on the East Midland route failed at the implementation stage because of insufficient resourcing, an insufficiently mature IT platform, the culture and competences of existing frontline managers and unnecessary self-imposed deadlines.
2.9 Our specific plans for 2016-17 and beyond are: ensuring the sector maturely manages growth and change safely, especially: infrastructure safety; station safety; driver management; safety-critical communication; the potential risk of and from SPADs; workforce safety, and; further improvements in the management of occupational health issues.
Mainline: Network Rail Overview: there were some discrete areas of improvement in 2015-16 around ‘governance’ and ‘audit’, but some aspects worsened. Overall our RM3 ratings of Network Rail were static between ‘managed’ and ‘standardised’ levels. We had hoped to see more elements of the Safety Management System (SMS) shift toward the higher ‘predictable’ and ‘excellent’ ratings. These indications of enhanced management maturity would have provided us with assurance that risk management and resilience are embedded in Network Rail’s long-term capabilities.
Two themes emerged from our RM3 evaluations:
better safety leadership and governance at a senior level within Network Rail, though this often fails to translate into implemented improvement on the front line; and
a great variation across the network in levels of management maturity, with assessments ranging from 1‘ad hoc’ to 5 ‘excellent’.
Office of Rail and Road | 18 July 2016 Annual Health and Safety Report 2016 | 14
Network Rail reduced by 30% the number of Reporting of Injuries, Diseases and Dangerous Occurrences Regulations 20135 (RIDDOR) reported injuries to 70 in 2015-16. infrastructure operations risks measured under the Precursor Indicator Model (PIM) reduced 21%, despite significant weather-related increases in earthworks, and particularly cutting failures, since December 2015.
Network Rail made significant revisions to its Business Plan in the second half of 2015-16 due to financial constraints, which led to deferral of many planned renewals. We scrutinised these proposals closely to ensure sensible risk-based prioritisation. However, the deferrals lead to an increased reliance on maintenance activities and dependence on the knowledge, competence and expertise of (often individual) staff members to effectively manage track geometry risks. This reliance could amplify the vulnerability of assets to future risk control weakness.
Our inspections found that risk controls were not always consistent, or reliably achieved by compliance with standards and procedures. Indeed, we found too many examples of Network Rail’s staff not complying with its own rules, requiring us to take enforcement action to drive improvements on areas such as ineffective manual handling, slip, trip and falls management and weaknesses in risk controls at some level crossings.
2015-16 saw the introduction of a number of initiatives with the potential to significantly improve risk control on the network. Planning and Delivering Safe Work (PDSW) met with numerous problems within the maintenance function, causing its trial roll-out to be paused. Business Critical Rules and associated role-based competence regimes have been frustratingly slow to embrace all asset areas, and disappointingly ineffective where they have been implemented. Network Rail’s implementation of these potentially transformative changes at route level was not consistent and sometimes proved ineffective.
2.10 Evidence: Network Rail must now look at the evidence from our RM3 assessment, particularly where it received only a level 1 ‘ad hoc’ or level 2 ‘managed’ and target improvements.
2.11 Our activities: we saw several potentially very serious incidents, including some where the cause related to Network Rail’s management of aging infrastructure – see page 7. These incidents highlighted the need for a precautionary approach to deal with uncertainties. We identified the improvements needed in staff training and the monitoring of training.
Level crossings Overview: the harm posed by and from level crossings to their users and railway operations represents about 8% of overall system harm (excluding railways suicides). This 5 http://www.hse.gov.uk/riddor/
Office of Rail and Road | 18 July 2016 Annual Health and Safety Report 2016 | 15
has reduced gradually since 2010-11 following consistent focus by us, the industry and investment by the Government. There were the lowest levels of serious events at crossings in 2015-16: there were three fatalities, all pedestrians (the lowest level of fatalities since 1996-97) and four collisions between trains and road vehicles, the lowest level in the past decade. The last level crossing fatality involving a road vehicle user was in May 2014.
As a consequence of the significant reduction in fatalities, overall harm reduced by a notable 69% compared to 2014-15 and harm at level crossings was at its lowest level on record. However, there was a 7% increase (to 296) in near misses involving pedestrians at crossings.
Since 2009-10, Network Rail has closed over 1,000 crossings, including 76 in 2015-16, but there is evidence that crossings are becoming more difficult to close as local communities make the case for their amenity value as a right of way.
At a strategic-level, we are working with the Department for Transport (DfT) to consider options for reforming the legal framework around level crossings, including recommendations from the Law Commission’s 2013 level crossing safety report6.
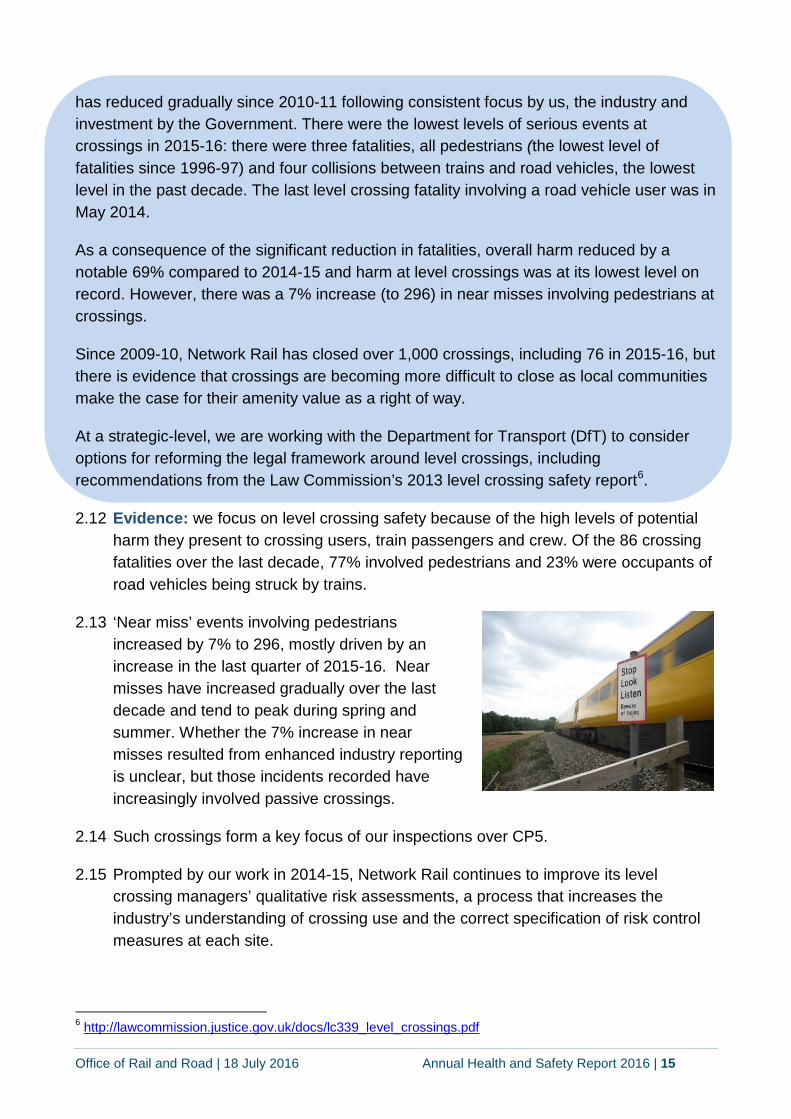
2.12 Evidence: we focus on level crossing safety because of the high levels of potential harm they present to crossing users, train passengers and crew. Of the 86 crossing fatalities over the last decade, 77% involved pedestrians and 23% were occupants of road vehicles being struck by trains.
2.13 ‘Near miss’ events involving pedestrians increased by 7% to 296, mostly driven by an increase in the last quarter of 2015-16. Near misses have increased gradually over the last decade and tend to peak during spring and summer. Whether the 7% increase in near misses resulted from enhanced industry reporting is unclear, but those incidents recorded have increasingly involved passive crossings.
2.14 Such crossings form a key focus of our inspections over CP5.
2.15 Prompted by our work in 2014-15, Network Rail continues to improve its level crossing managers’ qualitative risk assessments, a process that increases the industry’s understanding of crossing use and the correct specification of risk control measures at each site.
6 http://lawcommission.justice.gov.uk/docs/lc339_level_crossings.pdf
Office of Rail and Road | 18 July 2016 Annual Health and Safety Report 2016 | 16
2.16 Following discussions with us, Network Rail produced a level crossings risk improvement strategy which includes:
upgrading all passive crossings with the installation of active warning systems, which will take significant time and investment;
prioritising the elimination of passive crossings on high speed lines or at stations;
improving underfoot conditions and signage including the marking of danger zones to raise user’s knowledge and situational awareness, reducing human error;
developing and rolling out a full barrier automatic crossing with obstacle detection to reduce pedestrian error and road vehicle user violations; and
prioritising the removal of automatic half barrier crossings near to stations and schools.
2.17 Our activities: we are working with Network Rail and DfT to implement improvements to signage and warning systems at both private and public level crossings. This work arises from RSSB’s research to which we contributed.
2.18 Our focus in 2015-16 was on passive crossings and particularly foot crossings where the sighting is inadequate and users rely on hearing a train horn to know that a train is approaching. This pushed Network Rail to improve its asset data and led it to a better understanding of the risks such crossings pose and the relevant controls needed.
2.19 We continue to monitor the ring-fenced CP5 funding which Network Rail is using to reduce risks at crossings, primarily by closing or upgrading the controls used at crossings, but also by commissioning new technologies aimed at reducing risks at user-worked and footpath crossings.
2.20 We processed almost 100 Level Crossing Orders from Network Rail in 2015-16, as crossings were renewed or upgraded during new signalling schemes, a high number. These should deliver sustained long-term benefits. We are also processing an additional 150 Orders.
Road vehicle incursions 2.21 There were 56 unauthorised vehicle incursions on to railway infrastructure in 2015-
16, compared to 60 in 2014-15. Of these 56, three caused collisions with trains and 32 were through boundary fences. These incidents created the potential for road vehicles to collide with and derail trains.
Office of Rail and Road | 18 July 2016 Annual Health and Safety Report 2016 | 17
Infrastructure risks Overview: Network Rail’s management of its assets, including track geometry – a focus of our recent inspections – has improved, but we still find examples of inconsistent application of processes across the routes. Challenges remain in the longer term for Network Rail to make its assets more resilient to adverse weather and manage the risks from asset renewals deferrals and any shortfalls in high–output mechanised maintenance.
We took enforcement action in 2012 requiring better contingency arrangements for managing the impacts of severe weather, such as winter wet weather and summer heat. However, the evidence we collected from Network Rail’s management of the winter 2015-16 storms shows that its processes are not consistently effective.
Drainage: challenges remain to improve the management of drainage assets. The appointment of a Head of Drainage was positive, and we have recently secured planned improvements to the management of the highest risks critical drainage assets in soil cuttings, following Network Rail’s compliance with our improvement notice. This should deliver future improvements. However, Network Rail still has work to do to deliver effective inspection and maintenance of all drainage assets. Implementation of its ‘Ten Point Plan’ would make significant steps towards that goal.
Earthworks: earthworks failures, such as landslips, increased over 2015-16, due to some very wet weather in parts of the country, but effective consequence management resulted in no train derailments. Improved system-level risk management of earthworks is needed to minimise the likelihood of future failures; Network Rail must also minimise the safety impact of planned earthworks renewals deferral.
Track: many of the track geometry measures (a measure of different aspects of track quality) improved in 2015-16, building on enhancements seen since the start of CP5. We scrutinised the potential impact of renewal deferrals, but found that the revisions made to Network Rail’s Business Plan were sensible and risk-based. These have the potential to increase reliance on maintenance activities and dependence on the knowledge, competence and expertise of (often individual) staff members to manage track geometry risks effectively. Keeping the right balance between maintenance and renewal activity remains essential.
While we are currently satisfied that the immediate safety risks arising from poor track geometry are being controlled, our examination of track-related incidents since 2008 showed how well-functioning assurance arrangements could reduce the likelihood and consequences of such incidents.
Switches and crossings: we continue to monitor the installation of a new tubular stretcher bar design. This is an important infrastructure investment that will deliver future service reliability and safety risk management benefits. Our November 2014 enforcement action focused on ensuring the implementation of technical solutions was supported in the
Office of Rail and Road | 18 July 2016 Annual Health and Safety Report 2016 | 18
field by suitable mentoring and monitoring activity. Our inspection will continue to monitor this, as well as the increased pressures this puts on maintenance teams as a result of renewals deferral and shortfalls in mechanised maintenance, such as tamping and stone blowing.
Structures: recent incidents highlighted the risk to structures from river scour and flooding effects. These risks must be managed alongside the on-going work to ensure that bridges and tunnels are properly examined and maintained. Network Rail must improve its use of effective evaluation examination outputs, to decide what remedial work is needed and when.
Evidence:
2.22 Drainage: in March 2016, Network Rail complied with our February 2015 national improvement notice which included the development of a Drainage Decision Support Tool. Network Rail appointed a new Head of Drainage. We found evidence of improvements in drainage management in the Routes, particularly in delivering their ‘Ten Point Plan’, but, more work is needed to align standard jobs with their organisational structure and to help define the completeness of the drainage asset register.
2.23 Earthworks: as a result of on-going investigations into landslip incidents, we are beginning to develop an ‘infrastructure system risk management’ strategy, as we repeatedly see examples of a multi-discipline approach not being delivered in a co-ordinated and timely way. Consideration of the causes of these incidents involved assessments by elements of track, geotechnical, drainage, and structures (for culverts) expert disciplines. We are scrutinising closely the planned deferred earthworks renewals proposals due to the potential safety impact of Network Rail's decisions.
2.24 Track: we saw evidence of sustained improvements to track geometry since the start of CP5, with best-ever levels achieved at the end of 2015-16. Track geometry has improved nationally since the start of CP5. Broken rails and fishplates remain at historically low rates. There was a 14% reduction in track faults that required immediate intervention and all twist faults reduced 18%. Repeat twist faults, a subset of twist faults, have reduced by 22% since the start of CP5. Our inspection found the benefits from the Business Critical Rules for plain line track lacked engagement and were not yet sufficiently embedded to realise their potential benefits.
2.25 Rise in speed restrictions: the imposition of speed restrictions, principally to manage the derailment risks posed by the most serious type of 'cyclic top' track condition, increased by around a half over 2015-16. This followed earlier failures by Network Rail staff to apply risk controls fully where cyclic top is found and before it can be repaired properly.
Office of Rail and Road | 18 July 2016 Annual Health and Safety Report 2016 | 19
2.26 Switches and crossings: we continue to monitor the installation of a new tubular stretcher bar design - see photo opposite. This is an important infrastructure investment that will deliver future service reliability and safety benefits. Phase 1 of Network Rail's tubular stretcher bar installation was completed in December 2015 and resulted in 2,700 bars being fitted. At the end of 2015-16, the on-going phase 2 of the programme had resulted in 1,600 bar fitments (746-point ends).
2.27 Structures: we are scrutinising Network Rail's management of water scour factors following the significant damage to Lamington Viaduct in Scotland on 5 January 2016. Network Rail's own review identified significant deficiencies that must be rectified. There were a series of failures from Network Rail's management of ancillary assets, such as signal posts, overhead line equipment and station signs. We are concerned that these may indicate a bow-wave of potential failures and a clear safety risk that such assets are not receiving adequate attention, particularly as structures reach the end of their serviceable life. In addition, the risk posed by internal corrosion is not well understood. Improvements to the examination regime for these structures are imminent and we will check these changes are effectively implemented.
2.28 Electrification: Network Rail continues to upgrade and install new design traction power assets. It dealt positively, if not always consistently, with the challenges these pose including using a cooperative approach to finding solutions and shifting away from using the same ineffective approach. Electrical clearance issues remain and we encourage Network Rail to identify evidence to justify their design judgements and pragmatic solutions. Network Rail's centre-led production of AC electrification principles was pragmatic, realistic and achievable.
Safety by design Overview: our long-term focus has been on ensuring Network Rail takes opportunities to eliminate or reduce risks at the design stage. Our early engagement with new build projects is important, as some safety enhancements are more realistic if designed in at the starting point of an infrastructure's life-cycle. Our enforcement in 2014-15 showed the industry remained some way off the pace in applying the safety by design principles.
2.29 Our activities: we continue to push Network Rail and other infrastructure managers, such as Transport for London, to ensure their major infrastructure projects use a safety by design approach to risk elimination and reduction.
Infrastructure worker safety risk Overview: overall infrastructure harm declined 21%, mostly due to the absence of fatalities and a 28% reduction in major injuries - the lowest overall harm level for a decade. This is a potentially volatile dataset, and the reduction in harm levels were mainly due to reductions in fatality harm. Undoubtedly, the industry's challenge is now building on this,
Office of Rail and Road | 18 July 2016 Annual Health and Safety Report 2016 | 20
through cultural and behavioural change and implementing and embedding planned safety improvement initiatives.
2.30 Evidence: Overall harm to infrastructure workers reduced 21%, with a 28% reduction to 58 in major injuries; this is the lowest for a decade. There was also a 3% reduction to 1,323 minor injuries. Of the overall risk to infrastructure workers, 46% comes from slip, trip and fall and almost a third from contact with objects events. There was an 18% reduction in slip, trip and fall harm and a 17% reduction in harm from contact with objects in 2015-16.
2.31 There was a general overall reduction in harm to infrastructure workers from falls from height, electric shocks and other incidents, but increases in major harm from machinery and tool usage and manual handling.
2.32 It is estimated that around 70% of the fatality risk to infrastructure workers is from being struck by a train.
2.33 As mentioned earlier, the unsuccessful and now paused implementation of PDSW via the East Midlands trial and the slow implementation of Business Critical Rules on plain line track was frustrating because of their potential to significantly drive cultural transformation and risk control on the network. We continue to focus our efforts on their development and implementation. Network Rail must learn the lessons from these for its future roll-outs of initiatives.
2.34 Our activities: we found evidence of Network Rail finding solutions to some deep-seated problems on the network around the planning of safe systems of work, such as the Safe and Efficient Worksites initiative in the London and North East route. An update on the taking of electrical isolations safely and efficiently to reduce risk to workers is provided below.
2.35 As a result of our inspection findings we are challenging Network Rail to strengthen aspects of its assurance activities at a tactical level (administrative, physical and process) to improve its performance measures. We will work with Network Rail to target improvements in these areas in order to raise the effectiveness of its safety management system and realise more consistent, reliable and predictable risk controls.
2.36 Taking safer and faster electrical isolations: we have seen good progress on assuring the security of taking electrical isolations - we agreed ring-fenced funding to improve this over CP5 - but the efficiency benefits have not yet materialised. Trials of the remote disconnect device and signal-controlled warning systems to earth AC isolations are underway in the North West and Scotland and are planned on Great Western in 2016-17. We look forward to the case being made for their extensive deployment in CP6. In addition, the routes are establishing what hardware they need to take safer and faster electrical isolations.
Office of Rail and Road | 18 July 2016 Annual Health and Safety Report 2016 | 21
2.37 The way forward to improve DC isolation is more advanced with three trials providing valuable feedback on the benefits of the different kit being tested. Improved safety around third-rail usage looks likely to be achieved by the end of CP5.
Occupational road safety Overview: over recent years the sector has rightly focused on reducing occupational road safety risks, which have led to a proportionate increase in occupational driving incidents reported. Occupational road driving represents only 1% of the overall mainline system harm, but its potential consequences to individual workers can range widely from high frequency and low consequence to multiple fatalities. Historically, it is suspected that worker occupational driving related fatalities have been under-reported, but the industry’s focus has led to enhanced reporting arrangements over recent years. There have been six railway worker occupational driving related fatalities reported since 2011-12.
There’s a general recognition that these risks are currently too high and can be better managed. The Road Risk Group, formed in December 2015, provides a forum for strategic-level industry collaboration. The industry vision to improve occupational road safety –as set out Leading health and safety on Britain's railway’ strategy document – is focused on better understanding the risk and enhanced incident reporting and analysis. An output of this work was a planned code of practice aimed at reducing the risks to workers while driving.
2.38 Evidence: this is the second year where RSSB has included more detailed analysis of occupational road safety performance in its annual report. The reporting level of such incidents increased over the last five years via an enhanced focus. There were no occupational road fatalities in 2015-16 compared to two in 2014-15. Infrastructure workers suffered seven major injuries (an increase of three compared to 2014-15) and 113 minor injuries, an increase of six compared to 2014-15, in occupational road accidents.
2.39 With the absence of any fatalities, overall harm to workers from road driving reduced 59%, but the number of road driving injuries increased 16% to 142 in 2015-16. Most occupational road incidents involved Network Rail’s infrastructure workers and contractors, but also included signallers and other roles, such as mobile operations managers. Of all railway worker road driving injuries over the last decade, 67% involved Network Rail, 18% train operators, 8% other railway industry support sectors, 5% contractors and 2% freight operators.

Office of Rail and Road | 18 July 2016 Annual Health and Safety Report 2016 | 22
2.40 RSSB and wider industry partners have been active in promoting good practice7. Their work and the Health and Safety Executive’s Driving at Work8 guidance provide useful risk management resources.
Occupational health performance Overview: Our inspection has targeted sector compliance with occupational health law, identifying the key areas requiring further work, such as the risks from Hand Arm Vibration Syndrome (HAVS) from the misuse of power tools, musculoskeletal risks from poor manual handling arrangements and avoiding exposure to silica dusts. Our frontline inspections continue to target cases of basic non-compliance with occupational health law, such as poor manual handling arrangements and risk from silica dust in ballast material.
2.41 Evidence: we served three prohibition and two improvement notices as a result of Network Rail’s failure to safely manage manual handling risks ranging from infrastructure workers lifting and carrying heavy materials, tools, and heavy levers in a signal box – a high level of enforcement activity. All cases were preventable and exposed workers to potentially damaging harm.
2.42 While served at specific locations, these had potentially network–wide implications; and only add to the trail of historic evidence of a continued tacit acceptance across the network that staff routinely lift heavy items, which have the potential to cause musculoskeletal damage, despite the existence of practical alternatives. There was a 17% increase in actual harm from manual handling injuries, while harm from using machinery and tools and from awkward movements increased in 2015-16.
2.43 It is currently unclear why the number of RIDDOR-reportable health cases reported to us has reduced from 87 in 2014-15 to a record low of 30 in 2015-16. Network Rail changed its health provider in 2015-16, which introduced new doctor and medical assessment arrangements. This may have impacted on the number of health reports. To date, we have no specific evidence to suggest the reduction is a result of a significant improvement in the management of HAVS by the sector.
2.44 Our activities: we identified the need to improve railway line managers’ occupational health management capability and consequently ran three successful ‘health risk management for managers’ courses. Following the publication of our ‘Better Health is happening’ report9 in June 2015, the Health Programme has been updated. We supported the launch of Institute of Occupational Safety and Health’s ‘No Time To Lose’ campaign focused on reducing risk by avoiding exposure to fine silica dust.
7 http://www.rssb.co.uk/Library/improving-industry-performance/2013-good-practice-guide-t997-managing-
occupational-road-risk.pdf 8 http://www.hse.gov.uk/pubns/indg382.pdf 9 http://orr.gov.uk/what-and-how-we-regulate/health-and-safety/occupational-health/better-health-is-
happening
Office of Rail and Road | 18 July 2016 Annual Health and Safety Report 2016 | 23
2.45 Network Rail’s development of an asbestos management team to produce route and site-specific asbestos risk management plans was positive, but we needed to step in after identifying serious risk management weaknesses in how potential risks from asbestos were being managed on a daily basis on the Northern City Line and work on the Keeper’s Cottage at Wadbrough.
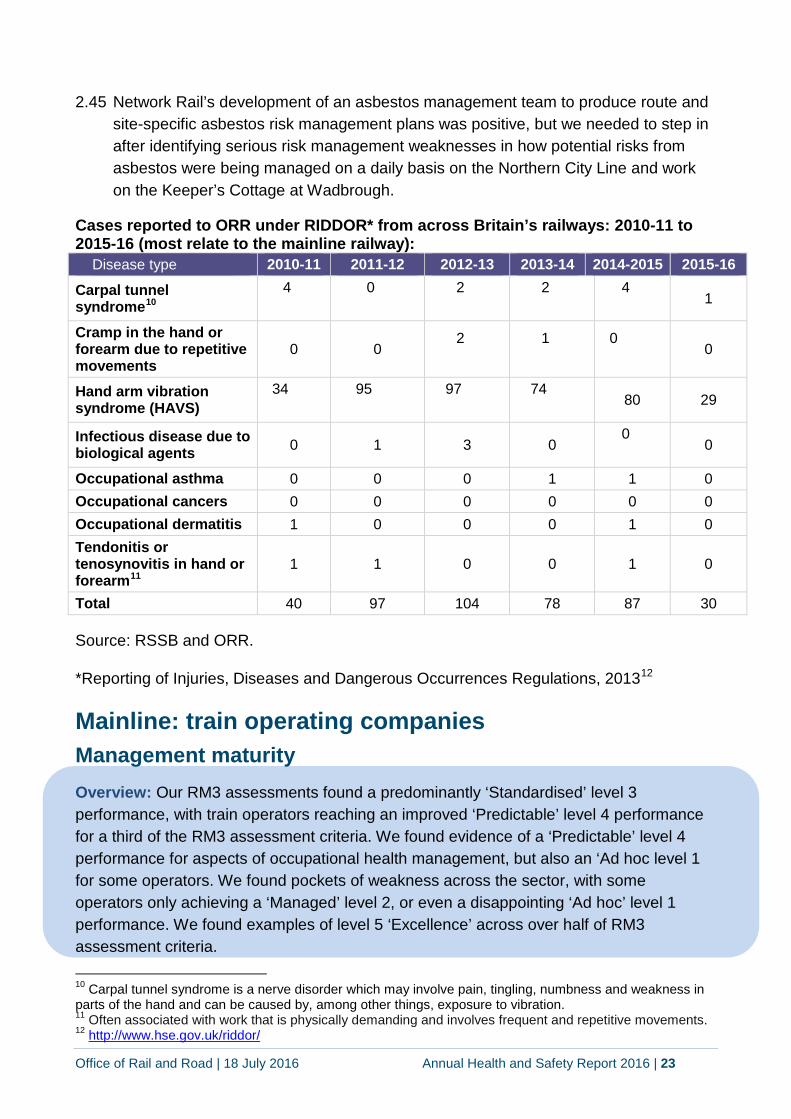
Cases reported to ORR under RIDDOR* from across Britain’s railways: 2010-11 to 2015-16 (most relate to the mainline railway):
Disease type
2010-11 2011-12 2012-13 2013-14 2014-2015 2015-16
Carpal tunnel syndrome10
4
0
2
2
4
1
Cramp in the hand or forearm due to repetitive movements
0 0 2
1
0
0
Hand arm vibration syndrome (HAVS)
34
95
97
74
80 29
Infectious disease due to biological agents 0 1 3 0
0
0
Occupational asthma 0 0 0 1 1 0 Occupational cancers 0 0 0 0 0 0 Occupational dermatitis 1 0 0 0 1 0 Tendonitis or tenosynovitis in hand or forearm11
1 1 0 0 1 0
Total 40 97 104 78 87 30
Source: RSSB and ORR.
*Reporting of Injuries, Diseases and Dangerous Occurrences Regulations, 201312
Mainline: train operating companies Management maturity Overview: Our RM3 assessments found a predominantly ‘Standardised’ level 3 performance, with train operators reaching an improved ‘Predictable’ level 4 performance for a third of the RM3 assessment criteria. We found evidence of a ‘Predictable’ level 4 performance for aspects of occupational health management, but also an ‘Ad hoc level 1 for some operators. We found pockets of weakness across the sector, with some operators only achieving a ‘Managed’ level 2, or even a disappointing ‘Ad hoc’ level 1 performance. We found examples of level 5 ‘Excellence’ across over half of RM3 assessment criteria. 10 Carpal tunnel syndrome is a nerve disorder which may involve pain, tingling, numbness and weakness in parts of the hand and can be caused by, among other things, exposure to vibration. 11 Often associated with work that is physically demanding and involves frequent and repetitive movements. 12 http://www.hse.gov.uk/riddor/
Office of Rail and Road | 18 July 2016 Annual Health and Safety Report 2016 | 24
We served no enforcement on train operators in 2015-16, but took one prosecution case relating to an incident in 2012 – see page 62.
2.46 Evidence: the growth in passenger journeys and train services operated has been significant: passenger journeys travelled increased 57%, passenger kilometres travelled increased 49% and train kilometres increased 19% over the last 10 years.
2.47 When compared to 2014-15, overall harm to passengers and public in stations and on trains increased 8% or 6% when normalised by the 2% growth in passenger journeys. This was due to:
a 48% increase in harm at the platform edge for passengers and the public. This increase in harm was driven by six fatalities: five passengers and one member of the public; and
a 21% increase in harm from falls between the train and platform and a 67% increase in harm from passengers being trapped in train doors, which included six major injury events. Actual harm to the workforce from passenger train operations (on trains and stations) increased 10% due to a 64% increase in slip, trip and fall-related major injuries, from 11 in 2014-15 to 18 in 2015-16. This was the second highest figure over the last decade.
2.48 Most incidents involved falls on platforms and stairs and escalators. Minor injuries to the workforce from passenger train operations (on trains and stations) reduced by 6%. On-board crew and station staff account for 66% of actual harm and the level of harm for station staff was at its highest level for five years; it increased by 47% compared to 2014-15.
2.49 Our activities: we have restructured ourselves so that all our train operator teams are managed by one senior manager. We introduced a more consistent process to our RM3 assessments by merging our activity reporting on operators, which has helped operators better understand our processes. Most operators now use RM3 to help prioritise and target weaknesses in their safety management systems.
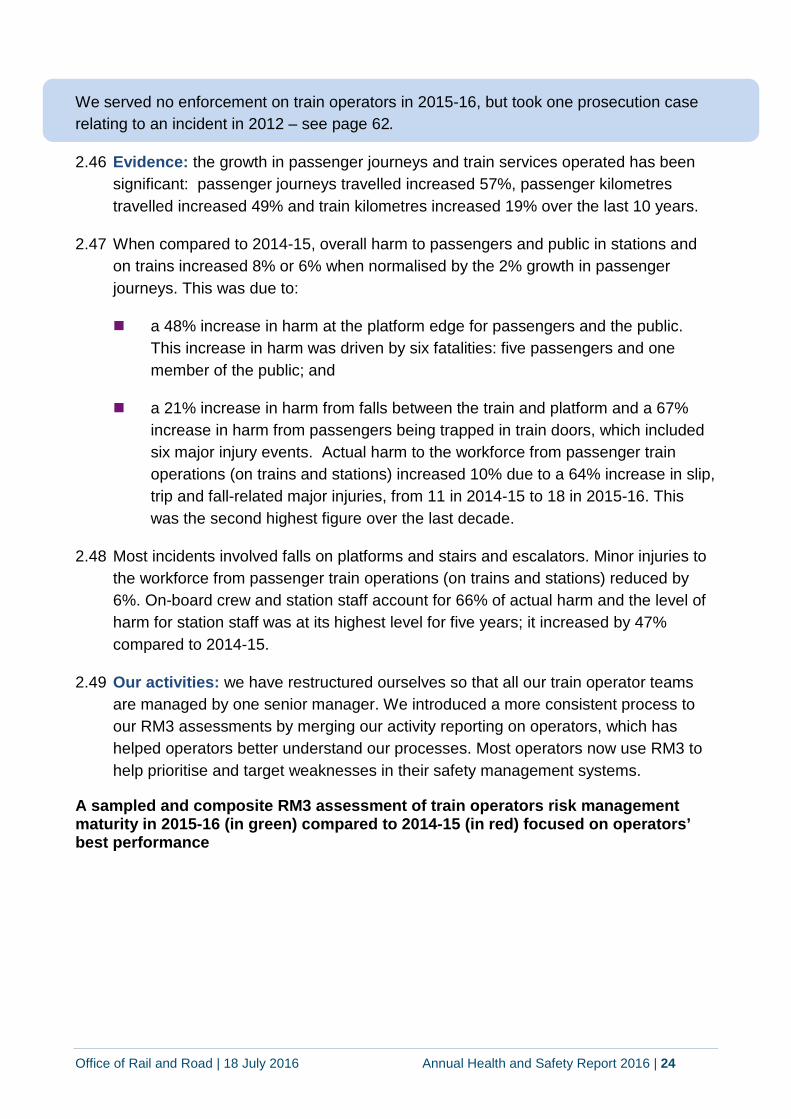
A sampled and composite RM3 assessment of train operators risk management maturity in 2015-16 (in green) compared to 2014-15 (in red) focused on operators’ best performance
Office of Rail and Road | 18 July 2016 Annual Health and Safety Report 2016 | 25
SP1 - Leadership. SP2 – Safety policy (not including a written safety management system). SP3 – Board governance. SP4 – Written safety management system. OC1 – Allocation of responsibilities. OC2 – Management credibility and Supervisory performance. OC3 – Organisational structure (management cascade). OC4 – Communications arrangements. OC5 – System safety and interface arrangements. OC6 – Culture management. OC7 – Record keeping. OP1 – Worker involvement and internal cooperation. OP2 – Competency management system. PI1 – Risk assessment and management. PI2 – Objective target setting. PI3 – Workload planning. RCS1 – Safe systems of work including safety critical work. RCS2 – Management of assets (including safe design of plant). RCS3 - Change management processes, engineering and organisational). RCS4 - Control – of contractors. RCS5 - Emergency planning. MRA1 – Proactive management arrangements. MRA2 – Audit. MRA3 -Incident investigation and management. MRA4 – Review at appropriate levels. MRA5 – Corrective action/change management.
2.50 We have a collaborative arrangement with the Health and Safety Laboratory to further develop our RM3 model, particularly its competency management elements. Other tools to make better and easier use of RM3 are being developed, including a RM3 mobile phone application for use in the field. We hosted a successful industry workshop with the Association of Train Operating Companies (ATOC) on the use of proactive indicators with the aim of encouraging operators to roll-out a more balance suite of indicators by 2018.
Train protection and warning system Overview: we continue to push operators to enhance their Train Protection and Warning Systems (TPWS) where reasonably practicable, to enhance its reliability, including its in-service monitoring functionality, while other refurbishment work is planned.
We continue to monitor industry plans to roll out the European Train Control System, which includes the European Rail Traffic Management System (ERTMS), including on the core section of Crossrail when it is operational in 2017-18. However, until ERTMS is fitted
Office of Rail and Road | 18 July 2016 Annual Health and Safety Report 2016 | 26
network wide, which is a long way off, the residual risk of and from SPADs remains one of the highest potential catastrophic hazards facing train operators.
2.51 Evidence: Angel Trains has begun an engineering change programme and trial of Mark III TPWS fitment to its fleets, which will enable a simple upgrade, either when scheduled work is planned or as old equipment fails. A trial fitment is planned for a high-speed fleet. We encourage other rolling stock leasing companies to adopt a similar approach.
2.52 Our activities: we continue to monitor the development of the RSSB-led Strategy Project Group's 10 year SPAD mitigation strategy to ensure its momentum is maintained.
Driver management
Overview: while risks of SPADs and failure to call at stations risk reduced in 2015-16, SPADs from station overruns increased. There was an increase in numbers of incidents involving driver instructors and driver managers while they are driving or supervising trainees. Our inspections found strong safety leadership, board-level governance and safety policies in some companies with strong clear safety messages being provided to staff and with follow up actions. We also found strong safety management arrangements with clear responsibilities and arrangements. Our short-term focus remains on improving driver management.
2.53 Evidence: we continue to encourage operators to widen their competency management systems to look at non-technical skills-based approaches - they can learn from other industry sectors. The mainline railway, led by ATOC, is rolling out improvements to train crew management, including new competency management system for workers' non-technical skills; improvements to driver instructors' arrangements; a review of management workloads and a new competency assessment records for all management staff.
2.54 Our activities: we do not believe in prescriptive driver to manager ratios, but we found evidence that the workload planning for some driver managers was excessive and potentially inadequately resourced. We found that differences in such ratios exist between different depots run by the same operator.
2.55 We found evidence of weaknesses in assurance activity, including in management and supervisory functions. There was significant evidence of driver performance monitoring, but not of how supervisors retain their competencies; train operators cannot always show a clear picture of this through their internal assurance processes.
Office of Rail and Road | 18 July 2016 Annual Health and Safety Report 2016 | 27
Low Adhesion
Overview: overall we found improvements to industry rail-head low adhesion enhancement work. The leaf-fall season started late in autumn 2015 and there was a significant reduction in category A SPADs, station overruns and wrong side track circuit failures compared to the last five years. However, this resulted in only a slightly better service performance.
2.56 Evidence: route devolution has the potential to make changes to the use of rail-head treatment trains and in how multiple purpose vehicles (MPVs) are used to reduce rail-head low adhesion risks. The MPVs are effectively obsolete and will need to be replaced by CP6. The 'super site' initiative to reduce low adhesion risk at high risk sites is not being adopted across all routes because of financing issues, despite evidence it could significantly reduce schedule 8 compensation payments made by Network Rail to operators due to infrastructure disruption.
2.57 Our activities: we found evidence of increasing collaboration between train operators and Network Rail’s routes, particularly around improved detail in leaf-fall forecasting. The industry’s understanding of leaf-fall forecasting can improve and challenges remain, but practical and potentially beneficial research projects are underway.
Station management, train dispatch and the platform train interface Overview: most operators now have good platform-train interface (PTI) risk management arrangements in place with good workforce engagement for dealing with the various train dispatch processes across the network. Our inspections generally found strong and consistent train dispatch management processes. However, passenger platform crowding puts pressures on train dispatch, especially at curved platforms, or where station furniture obscures good train dispatch sighting lines. These require regular risk assessment and review of the controls used, staff behaviours, the resourcing applied and proactive monitoring.
The broader network shift with the introduction of new forms of rolling stock and use of driver-only door operation requires a careful assessment of the different risks caused and controls needed to dispatch trains safely and efficiently.
2.58 Evidence: there were ten fatalities at stations: eight involved passengers and two involved members of the public. This is significantly high number, but none were industry-caused or involved boarding and alighting incidents. Overall harm to passengers and the public at stations increased 8% compared to 2014-15.
2.59 As passenger numbers and congestion at the PTI grows, risk reduction solutions, including platform edge fillers and other novel engineering solutions, will prove
Office of Rail and Road | 18 July 2016 Annual Health and Safety Report 2016 | 28
increasingly important. This will provide a focus for our inspections in 2016-17, as new rolling stock and train dispatch procedures are introduced. The future passenger crowding challenge means we must keep driving operators’ day-to-day responsiveness to crowding.
2.60 Our activities: we continue to press the industry to implement its January 2015 platform train interface risk reduction strategy13 as the impact of passenger numbers and infrastructure investment grow. The increase in platform edge harm, not involving passenger boarding and alighting incidents, in 2015-16 puts the spotlight on a potentially emerging risk trend.
2.61 We inspected train dispatch processes at five train operators and found good practice in the use of an electronic competency management system to manage train drivers’ train competency to dispatch trains and specific consideration of the non-technical skills needed. The value of non-technical skills is now assessed by most companies along with the application of the ten PTI strategy factors. We found unobtrusive staff monitoring was used positively, with a strong safety culture which included good practice communications between managers and health and safety representatives.
2.62 We identified weaknesses in the timeliness and adequacy of competency assessments carried by some companies and found some company’s audit arrangements were at a ’Managed’ or ‘Standardised’ level. We expect all operators to have proactive train dispatch indicators by 2016-17; these must form a crucial future focus for all operators.
Rolling stock risks Overview: we found rolling stock maintenance was generally of a high standard. Most operators use a risk-based approach to maintenance focused on fleet availability, reliability and safety, which applies the right demands to ensure reasonable workload planning procedures. We found weaknesses in how operators control their rolling stock maintenance contractors, specifically the assurance processes used to check vehicles returning to service after maintenance overhaul, and their change management procedures were not quite where they needed to be to address future risks.
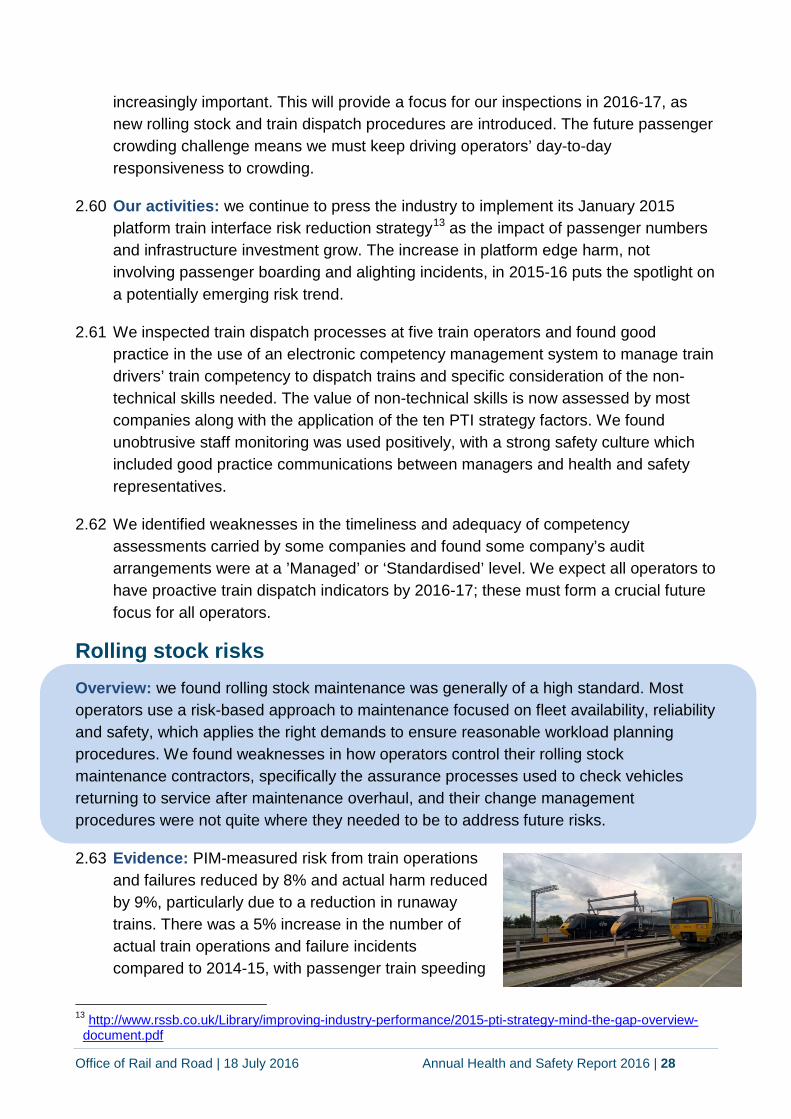
2.63 Evidence: PIM-measured risk from train operations and failures reduced by 8% and actual harm reduced by 9%, particularly due to a reduction in runaway trains. There was a 5% increase in the number of actual train operations and failure incidents compared to 2014-15, with passenger train speeding
13 http://www.rssb.co.uk/Library/improving-industry-performance/2015-pti-strategy-mind-the-gap-overview-
document.pdf
Office of Rail and Road | 18 July 2016 Annual Health and Safety Report 2016 | 29
being the primary cause. The number of incidents of displaced or insecure loads fell by 50% from 32 in 2014-15 to 16 in 2015-16.
2.64 Our activities: we reviewed four operators and found a variety of asset maintenance methods; some maintain their own assets and other use a maintenance partner of contractor. Our inspection identified no significant weaknesses, but one operator experienced a serious deterioration in critical rolling stock components, which had required them to impose additional controls to maintain fleet operational safety.
2.65 We noted the challenges in replacing scarce spare parts and in getting access to original design drawings as fleets age. Also, as fleets are progressively replaced, some smaller operators can struggle if they have previously relied on larger operators to inform their rolling stock maintenance decisions.
2.66 The use of technologies in maintenance activities varied; some use system defect prioritisation, management and fault-reporting software, yet others still relied on traditional paper-based systems.
2.67 We found weaknesses in change management procedures and a lack of robust contractor control procedures: two operators’ maintenance contractors then sub-contracted their work to third-parties. We have noted this issue before and believe the sector must do more to ensure vehicles overhauled by third parties do not return to service with defects or incorrectly fitted component parts.
2.68 We have begun a programme to visit third-party maintenance providers to test their design, manufacturing and maintenance duties under section 6 duties of the Health and Safety at Work Act, 197414. Nonetheless, train operators, as the primary duty holder, have a legal duty to have suitable monitoring arrangement in place to ensure the rolling stock they use is fit-for-traffic after overhaul. This area will provide a focus for our work in 2016-17.
Depot safety 2.69 The overall harm at yards, depots and sidings was at its lowest level since consistent
recording began in 2007-08 due to reductions in contact with object/persons and slip, trip and fall major injury events. This was primarily due to improvements made by train operating companies.
2.70 Our activities: our inspection of depots found working at height needed to be better managed; where introduced, engineering-related solutions proved effective in managing risk to the workforce. We inspected two operators’ depot safety arrangements and found a wide variety in the level of safety standards. While we found strong working at height controls and arrangements at some depots they were
14 http://www.legislation.gov.uk/ukpga/1974/37/part/I/crossheading/general-duties
Office of Rail and Road | 18 July 2016 Annual Health and Safety Report 2016 | 30
weak in others, particularly after fleet maintenance bay changes. We found depots developed their own individual safety culture and at one this was poor with only ad hoc risk control arrangements.
2.71 One depot had strong interlocking arrangements to prevent human error-led unauthorised access to overhead line equipment access, but another had no visual or audible warning to alert workers of vehicle movements to and from sheds. We found strong contractor monitoring arrangements, but weaknesses in slip, trip and fall risk management and in the maintenance and renewal of building and facilities that required cooperation with landlords.
Emergency planning 2.72 Our activities: we inspected five train operators’ emergency planning procedures in
2015-16 and found them satisfactory, including good practice participation with external bodies in joint events. We found good field practice, including in employee engagement and internal cooperation, communication arrangements, change management and incident investigation. We identified some weaknesses in procedures and arrangements for some specific types of rolling stock and training of particular roles, such as drivers and service controllers.
2.73 More recent events identified the need to ensure staff react appropriately after an incident or when using degraded working. We recognise that it is unrealistic for large groups of staff to participate in live exercises, but we see value in the use of simulations, such as table-top emergency exercises, to test key staff’s reactions to emergencies or unusual situations.
Change management 2.74 Our activities: we examined five train operators’ change management procedures
focusing on recent changes to evaluate the effectiveness of their arrangements. We found most operators’ leadership as being effective and good use of risk assessment processes, effective record keeping and written safety management systems. However, we found weaknesses around board governance, worker involvement and internal cooperation and organisational structures. We found a lack of evidence in the use of change management audit processes and recommended an audit of safety management change management arrangements when significant change happens; often smaller changes receive insufficient senior management focus.
Infrastructure maintainer and train operator alliancing 2.75 The Wessex Alliance ended, but a new alliance between Abellio Scotrail and
Network Rail Scotland route was formed, with the two legal entities integrating.
Office of Rail and Road | 18 July 2016 Annual Health and Safety Report 2016 | 31
Train operators’ maintenance of stations 2.76 Train operators are increasingly taking on station management activities and we
inspected two operators’ management of station assets in 2015-16.
2.77 Our activities: we found good practice in the allocation of responsibilities with a clear asset management chain of roles and business objectives and evidence of individual’s skills and qualification within a management framework. We found weaknesses in one train operator’s arrangements to review job descriptions during periods of change, risk assessment and incident investigation, but notable strengths in leadership, contractor control and proactive management arrangements.
Violence to staff 2.78 Our activities: we inspected two operators’ violence to staff prevention
arrangements and both acknowledged the significance of the issue to their operations. Both operators’ Managing Directors had endorsed their violence to staff prevention policies. However, we found no assessment of local risks, despite their significance and a failure to review risk assessments – some were last reviewed in 2007. We pushed the operators to improve arrangements, which led one operator to focus on training their frontline staff, supplemented with additional specialist training. However, another operator relies on the British Transport Police to investigate the causes of incidents, which means important preventative lessons may be missed.
2.79 Charter operators
2.80 Our activities: we took a significant level of enforcement around West Coast Railway Company over 2015-16 following the serious SPAD at Wotton Bassett in March 2015. This included two prohibition notices – of which one prevented the charter operator from running train services on the mainline railway – and three improvement notices (see page 63).
Mainline: Freight operating companies Overview: Britain’s freight operators continue to exercise robust control over their safety management activities whilst striving to improve the health and safety culture. We were generally satisfied with freight operators’ safety management systems, with performance at consistently acceptable levels. It has been a challenging year for all freight operators, with significant reductions in traditional freight flows, such as coal and steel. The amount of freight train kilometres travelled reduced 15%, to 34.9 million kilometres and the volume of freight tonnes carried has reduced 18% over the last 10 years.
Our inspection of loading and unloading arrangements across the freight sector showed that established operators continue to exercise robust controls, but new market entrants need to improve their competence management processes.
Office of Rail and Road | 18 July 2016 Annual Health and Safety Report 2016 | 32
2.81 Evidence: there were eight Potentially High Risk Train Accidents PHRTAs involving freight trains in 2015-16: six involved derailments and two were collisions between freight trains and road vehicles; one at a level crossing and one not. This represents an improvement in the freight train derailment trend of recent years. A cross-industry working group is focused on improving current risk reduction priorities. Recent freight train derailments were due to the interaction of common factors; sub-optimal track geometry (particularly track twist), weaknesses in wagon suspension sensitivity to poor track and asymmetrically loaded wagons.
2.82 PHRTA events such as derailments have disproportionately involved freight trains; they comprise of 9% of all train movements, but 32% of all PHRTA over the last decade. In comparison, non-PHRTA incidents involving freight trains, such as striking animals and objects, only represent 8% of all non-PHRTA incidents.
2.83 Actual harm from freight operations to the workforce reduced 56% due to a 67% reduction in major injury harm, of which the primary risks are from electric shocks and the platform edge. There were four major and 173 minor injuries in the freight sector in 2015-16.
2.84 Our activities: our inspections in 2015-16 focused on freight operators’ arrangements for managing loading and unloading of trains effectively, and compliance with the Railways and Other Guided Transport Systems (Safety Regulations) 2006 (ROGS). This included analysing the ability of freight operators to deliver excellence in leadership, written safety management systems and supporting standards, competence management, risk assessment, safe systems of work and monitoring, and incident management. Our assessment of operators using RM3 assessment criteria found consistent level 3 ‘standardised’ to level 4 ‘predictable’ scores. We found most operators generally complied with ROGS.
2.85 We used our RM3 assessments of operator’s performance to push operators’ systematic analysis of their safety management systems, and to identify areas for improvement, examples of good practice and commitments to continuous improvement. To that end, we continue to work with the cross-industry freight derailment working group and the National Freight Safety Group and Rail Freight Operators Group.
Occupational health: train and freight operators Overview: we saw some evidence of the benefits of robust and proactively applied occupational health strategies across passenger and freight operating companies.
Heritage railways Overview: the heritage sector in liaison with Heritage Rail Association (HRA), strive to maintain high safety standards in all their operations whilst ensuring that staff training and
Office of Rail and Road | 18 July 2016 Annual Health and Safety Report 2016 | 33
preserving traditional skills remain a key priority in improving their health and safety culture. We have continued to encourage the HRA to take a greater leadership role over its sector, particularly maintaining and achieving compliance with HRA’s core guidance and standards for the industry. We continue to liaise with the HRA’s committees, such as, the operating and safety committee, who produced many new and revised guidance notes during 2015.
Other committees within the HRA are also developing guidance notes in appropriate specialist subject areas. This was an important step and significant progress has been made; however, operator’s board governance and staff competency are still not where they need to be.
We will seek opportunities to collaborate further with HRA. For example, we will continue to promote the use of RM3 assessments of operators’ safety management systems (SMSs) to identify weaknesses and target improvement. We will work to ensure all heritage operators have strong and effective safety management systems, staff competence and board governance arrangements in place.
2.86 Our activities: we maintained our focus on getting heritage operators to maintain, develop and comply with their own customised SMSs. More remains to be done to bring operators’ SMSs up to an appropriate standard. Crucially, our focus is on getting operators to develop and maintain strong board governance and staff competency arrangements themselves. We continue to maintain our support to the sector by hosting workshops to communicate new initiatives. We took no enforcement on heritage operators in 2015-16.
Progress on High Speed 2 2.87 Our activities: we continue to monitor the health and safety aspects of the planned
HS2 project by looking at the progress of specification development and assurance, its approach to occupational health and early work on their approach to electrification standards. Currently, the government anticipates the debate over HS2 will conclude by December 2016 with the High Speed Rail (London - West Midlands) Bill becoming an Act in late 2016, or more likely, in early 2017.
Tramways Overview: The UK’s tramways continue to improve the health and safety culture within their organisations. Safety performance on tramways remains consistent and fairly strong.
2.88 Evidence: an assessment of an incident on Britain’s tramways is provided on page 57.
Office of Rail and Road | 18 July 2016 Annual Health and Safety Report 2016 | 34
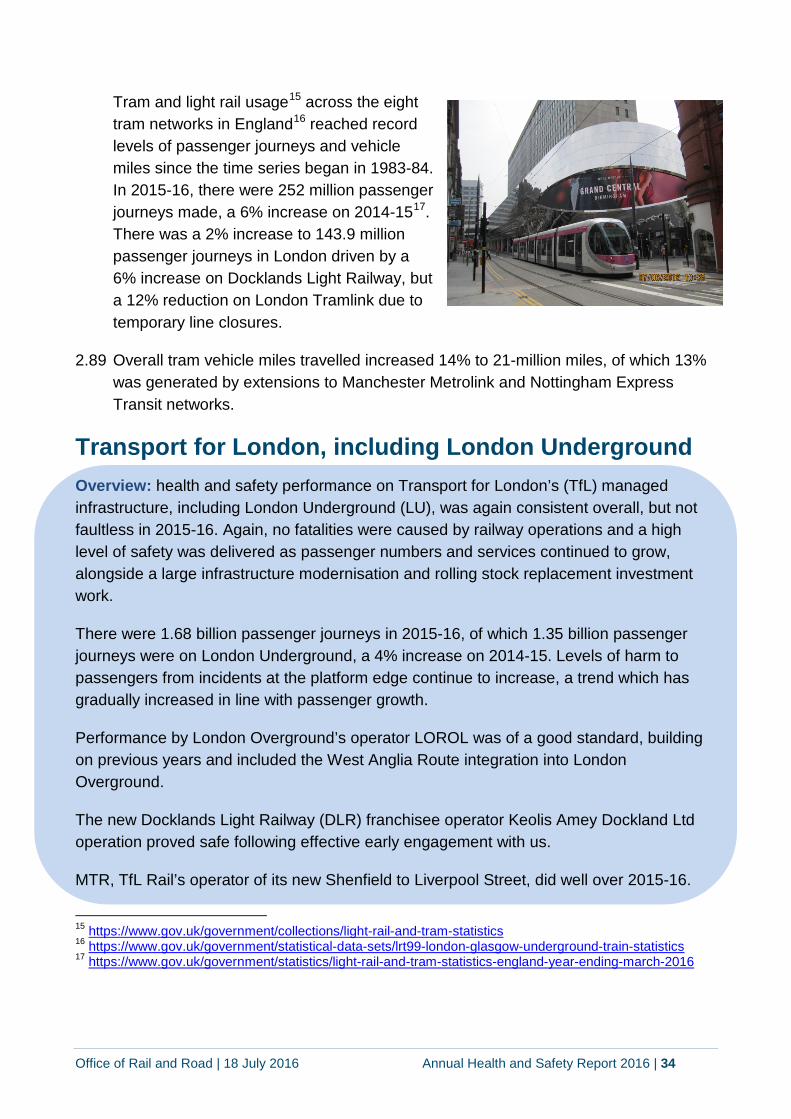
Tram and light rail usage15 across the eight tram networks in England16 reached record levels of passenger journeys and vehicle miles since the time series began in 1983-84. In 2015-16, there were 252 million passenger journeys made, a 6% increase on 2014-1517. There was a 2% increase to 143.9 million passenger journeys in London driven by a 6% increase on Docklands Light Railway, but a 12% reduction on London Tramlink due to temporary line closures.
2.89 Overall tram vehicle miles travelled increased 14% to 21-million miles, of which 13% was generated by extensions to Manchester Metrolink and Nottingham Express Transit networks.
Transport for London, including London Underground Overview: health and safety performance on Transport for London’s (TfL) managed infrastructure, including London Underground (LU), was again consistent overall, but not faultless in 2015-16. Again, no fatalities were caused by railway operations and a high level of safety was delivered as passenger numbers and services continued to grow, alongside a large infrastructure modernisation and rolling stock replacement investment work.
There were 1.68 billion passenger journeys in 2015-16, of which 1.35 billion passenger journeys were on London Underground, a 4% increase on 2014-15. Levels of harm to passengers from incidents at the platform edge continue to increase, a trend which has gradually increased in line with passenger growth.
Performance by London Overground’s operator LOROL was of a good standard, building on previous years and included the West Anglia Route integration into London Overground.
The new Docklands Light Railway (DLR) franchisee operator Keolis Amey Dockland Ltd operation proved safe following effective early engagement with us.
MTR, TfL Rail’s operator of its new Shenfield to Liverpool Street, did well over 2015-16.
15 https://www.gov.uk/government/collections/light-rail-and-tram-statistics 16 https://www.gov.uk/government/statistical-data-sets/lrt99-london-glasgow-underground-train-statistics 17 https://www.gov.uk/government/statistics/light-rail-and-tram-statistics-england-year-ending-march-2016
Office of Rail and Road | 18 July 2016 Annual Health and Safety Report 2016 | 35
A summary of Crossrail’s progress is set out in a separate section – see page 37.
2.90 Evidence: there were three passenger fatalities and 26 suicides on London Underground in 2015-16. The three passenger fatalities all occurred at stations. They involved a passenger who bent down to pick something up at the platform edge and was struck and killed by a train; a passenger who when alighting from a train fell back between the platform and train and was killed; and a passenger who lost their balance and fell down steps and later died from their injuries.
2.91 LU uses a model to measure the time between potentially preventable major incidents which either resulted in an industry-caused fatality, saw more than three people were hospitalised, or caused more than £1million in damage. As of the end of 2015-16, LU has gone the longest period (over 2,500 days) without such an incident; the last was a LU contractor who was electrocuted at a Crossrail construction site at Tottenham Court Road station in 2008.
2.92 Harm to passengers, as calculated by TfL, when normalised by the 4% growth in passengers journeys was broadly unchanged compared to 2014-15 and has reduced only very slightly over the last few years. Of the largest risks of harm to passengers, 40% is due to escalators, 20% from stairs and 20% at the platform edge. LU's mass transport system is different to the mainline, but its strong station crowding risk management arrangements hold lessons for the operators of busy stations.
2.93 The actual harm trend to LU workers from major and minor injuries was at its lowest since recording began in 2001. LU’s Capital Projects Directorate delivered several high-profile projects safely in 2015-16, including the ‘upgrade 2’ of the Victoria line; the Walthamstow engineering blockade; the introduction of the 150th S-class rolling stock; the Baker Street to Bond Street tunnel re-lining; the Tottenham Court Road and Victoria line station upgrades; the new Northern line extension to Battersea Power station; on-going civils, track and bridge heavy maintenance, and four line-modernisation programmes.
2.94 These resulted in around 10,000 construction and maintenance workers working overnight on LU’s assets, with a notable low level of accident failure rate (0.14 accidents per 100k workforce hours worked). This was better than that achieved by the Olympic Development Authority, often regarded as the best practice exemplar (with 0.17 accidents per 100k workforce hours works). LU’s health and wellbeing steering group is developing a long-term strategy to reduce lost-time injuries with a three year plan, which includes initiatives to reduce violence in the workplace and better manage trauma-causing events.
2.95 Our activities: we focus on the risks at platform edge and at the platform-train interface during train dispatch because of their potential to cause significant harm to passengers. There were 593 ‘passenger caught in train door’ incidents, 306
Office of Rail and Road | 18 July 2016 Annual Health and Safety Report 2016 | 36
passenger falls between the platform-train interface events, 40 passenger falls from platform incidents and 76 passenger contacts with train incidents in 2015-16. Overall, of the potentially serious risks at the platform edge: 58% are due to ‘passenger caught in train door’ incidents, 30% falls between the platform-train events, 7% from contacts between passengers and trains and 4% from passenger falls from the platform edge.
2.96 Our five enforcement notices served on LU in 2014-15 were aimed at substandard infrastructure construction activities and highlighted starkly the challenge of operating and modernising a busy infrastructure. We took no enforcement or prosecutions of TfL or its contractors in 2015-16. We received no worker-related ill health reports from TfL. Levels of lost time injury to staff and harm to passengers at the platform edge reduced, but missed LU’s own target by 5%: 478 lost time injuries occurred, typically due to violence to staff, trauma-causing incidents and slip, trip and fall.
2.97 Our inspections found that on the whole LU’s health and safety procedures managed its operational risks well. In 2015-16, we focused on depot electrical safety, risks posed by passengers’ use of escalators, the controls around construction lifting operations (following our 2014-15 enforcement) and operators’ emergency preparedness. This included monitoring a live mass emergency preparedness event with the emergency services in February 2016.
2.98 For a second year, we continued to monitor LU’s management of escalator safety; LU’s evidence gathering process will help direct future escalator design and usage. Breaking with tradition to enhance escalator capacity, in March 2016 LU trialled getting passengers to stand on both sides of escalator at Holborn station during passenger peaks, as evidence from earlier trials showed it enhanced capacity by 25%.
2.99 Our inspection found good practice in LU’s management of its contractors and supply chain, illustrated by the development of forums and improvement groups at all levels including with front-line staff. In 2015-16, there was a focus on individual’s responsibility for behavioural safety which challenged the traditional controls used: site best practice guides used pictures, not words, to communicate key safety messages during work planning and construction phases – a shift in the way key safety messages are delivered – and something from which other sectors might benefit.
2.100 Currently LU uses nightly overnight ‘engineering hours’ when passenger services are suspended to maintain its infrastructure. Looking ahead, we have monitored closely LU’s plans to operate 24-hour Night Tube passenger services on some of its lines on Friday and Saturday nights, planned to start from Friday 19 August on Central and Victoria lines. These will change and potentially increase risks. We
Office of Rail and Road | 18 July 2016 Annual Health and Safety Report 2016 | 37
continue to work closely with LU, as we did over 2015-16, to ensure these new and additional risks are suitably and sufficiently controlled.
2.101 We will continue to look at electrical safety issues in 2016-17 due to their potential to cause serious harm. We also plan to look at MTR’s management of driver competency in 2016-17.
Crossrail 2.102 We are now ramping up our engagement with Crossrail as the project moves
towards becoming a fully operational railway in 2018-19. We managed a bespoke, detailed exemption case to allow the running of Crossrail’s trains without automatic train protection (and with alternative train protection arrangements) between Paddington Station and Heathrow Tunnel Junction for a defined period. We approved and granted the exemption application in December 2015, with conditions.
2.103 Our activities: we are now looking at the:
forthcoming changes to TfL Rail’s (MTR) safety management system, which anticipates the introduction of new rolling stock; and eventual authorisation of the new infrastructure manager for Crossrail’s central section;
transfer of agreed mainline western London services to TfL Rail; and
working with the Health and Safety Executive (HSE), on the seamless transfer of responsibility for the safety regulation of Crossrail’s core section from HSE, as it’s still effectively a construction site, to ORR, when it becomes an operational railway that involves train movements.
Our non-safety accessibility work 2.104 The UK’s passenger trains are required to meet the accessibility requirements
defined in The Rail Vehicle Accessibility (Non-Interoperable Rail System) Regulations 2010 (RVAR) and The Railways (Interoperability) Regulations 2011 by 2020. A recently issued DfT report18, states that now over 60% of rolling stock on Britain’s railways has been built or refurbished to be accessible to disabled passengers: 6,275 heavy rail vehicles (49% of the national fleet) and almost 2,100-non-heavy vehicles (42% of the fleet). These cover specific aspects of rolling stock, such as seat, door and passageway dimensions, the provision of boarding aids for wheelchair users, contrasting colours to improve visibility of doorways, grab handles and controls, and passenger information.
18 https://www.gov.uk/government/uploads/system/uploads/attachment_data/file/525720/rvar-2015-annual-
report-web.pdf
Office of Rail and Road | 18 July 2016 Annual Health and Safety Report 2016 | 38
2.105 By 2015 there were 192,445-disabled persons’ railcards in circulation, up 9.6% since 2014 and up 33% since 2012-1319. This compares to a 2% annual increase in passenger growth in 2015-16 and 4% increase in 2014-15.
2.106 Our activities: in addition to our routine health and safety work, we have enforcement responsibility for operators’ compliance with RVAR and the Technical Specification for Interoperability for ‘persons with disabilities and persons with reduced mobility’ (PRM TSI). The PRM TSI is now a well-established standard for new main line railway vehicles and is checked by the Notified Body (NoBo) as part of the authorisation process when introducing vehicles into service. We have been working with Network Rail to clarify the application of the PRM TSI when stations are redesigned, as TSI compliance is required when major work takes place.
2.107 We continue to work closely with DfT about applications for exemptions from elements of RVAR, in order to ensure that proposals do not affect safety or our ability to use our enforcement powers.
2.108 Most of the accessibility matters we dealt with in 2015-16 were raised by members of the public and required a cross-office approach to fully consider the application of the Disabled Persons Protection Policy and our duties under the Equality Act 2010 to promote equal treatment. Cases have included the obstruction of wheelchair spaces within trains by standing passengers, obstruction of wheelchair-accessible routes within trains by bicycles, non-compliant passenger information systems and the application of accessibility standards when construction work takes place at stations.
Our work in Europe 2.109 Our priorities in Europe continue to be:
ensuring the use of a risk-based approach to the assessment and supervision of safety management systems are at the heart of the European safety framework;
encouraging consistent and full implementation throughout Europe of the obligations and responsibilities in the Railway Safety Directive, including developing practical arrangements to deliver changes resulting from the fourth railway package; and
developing working arrangements between national safety authorities (NSAs) to achieve a more harmonised approach to certification, supervision, and enforcement.
2.110 We have worked constructively with the European Commission and European Rail Agency (ERA) throughout 2015-16, which has concluded with the adoption of the
19 http://orr.gov.uk/__data/assets/pdf_file/0004/22189/DPRC-factsheet-2015-16.pdf
Office of Rail and Road | 18 July 2016 Annual Health and Safety Report 2016 | 39
most significant changes in the European regulatory framework for safety in a decade. Key aspects of our engagement included:
preparing for the major changes to safety legislation and responsibilities which have been adopted in the technical pillar of the fourth railway package. The changes will give ERA responsibility for issuing single safety certificates for cross-border operators, and for issuing vehicle authorisations for cross-border services. Applicants for domestic-only safety certificates, or vehicle authorisations will have the choice of applying to the NSA of that country, or to ERA. Specific work this year included:
- continuing to lead an initiative by NSAs to work with ERA in developing the cooperation agreements necessary for ERA’s new responsibilities;
- being among the first group of NSAs to enter into a written collaboration arrangement with ERA to help it prepare for its new roles;
- taking a prominent and robust role in the European working groups developing further detailed implementing regulations; and
- setting up an implementation project for the necessary changes to UK’s regulations. We will work closely with DfT and industry stakeholders on our proposals.
chairing the governance group which oversees the transition from cross-audits of NSAs to a ‘monitoring’ approach as envisaged in the fourth railway package; and
Influencing the development of changes to the common safety methods (CSM) on conformity assessment and supervision. These changes are designed to ensure a more harmonised approach by NSAs and to align the CSMs with industry’s safety management systems and with the structure of International Organisation for Standardization (ISO) management standards.
The safety of the Channel Tunnel 2.111 We regulate the health and safety of the Channel Tunnel and the companies that
use it, via the Channel Tunnel Intergovernmental Commission (IGC) and the Channel tunnel Safety Authority (CTSA), jointly with our French counterparts. The key principles of our health and safety vision and strategy for the railway in Britain apply equally to the Channel Tunnel. We continue to provide leadership, expert advice and secretariat support to the Channel Tunnel’s IGC and CTSA. Our inspectors are appointed to lead and deliver CTSA’s inspection plan, which aims to provide assurance that Eurotunnel and train operators’ management systems are capable of managing the specific risks associated with the operation of the Channel Tunnel.
Office of Rail and Road | 18 July 2016 Annual Health and Safety Report 2016 | 40
2.112 The past 12 months have been very challenging for Channel Tunnel operations, mainly due to the well-publicised migration problems around the French terminal. In August 2015, for the first time, we served improvement notices on Eurotunnel, the operator of the Channel Tunnel. This followed an inspection where we found their risk assessments did not take adequate account of the heightened risks arising from the activities of people attempting to gain unauthorised access to their lorry shuttles. Eurotunnel subsequently complied with our notices which led to improved risk controls being put in place.
2.113 The present challenges for the Channel Tunnel market make it all the more important that regulation of the Tunnel supports the safe development and growth of the cross-Channel railway usage. In November 2015, our inspectors, experts and officials were instrumental in ensuring that Eurostar’s new fleet of Siemens Velaro passenger trains, which offer 20% more passenger capacity than the original fleet, were authorised into service in a timely manner. Working through the Channel Tunnel IGC, we led the effective collaboration of a group of four railway safety authorities – ensuring a positive outcome for the industry and passengers, and setting a model of co-operation for future projects.
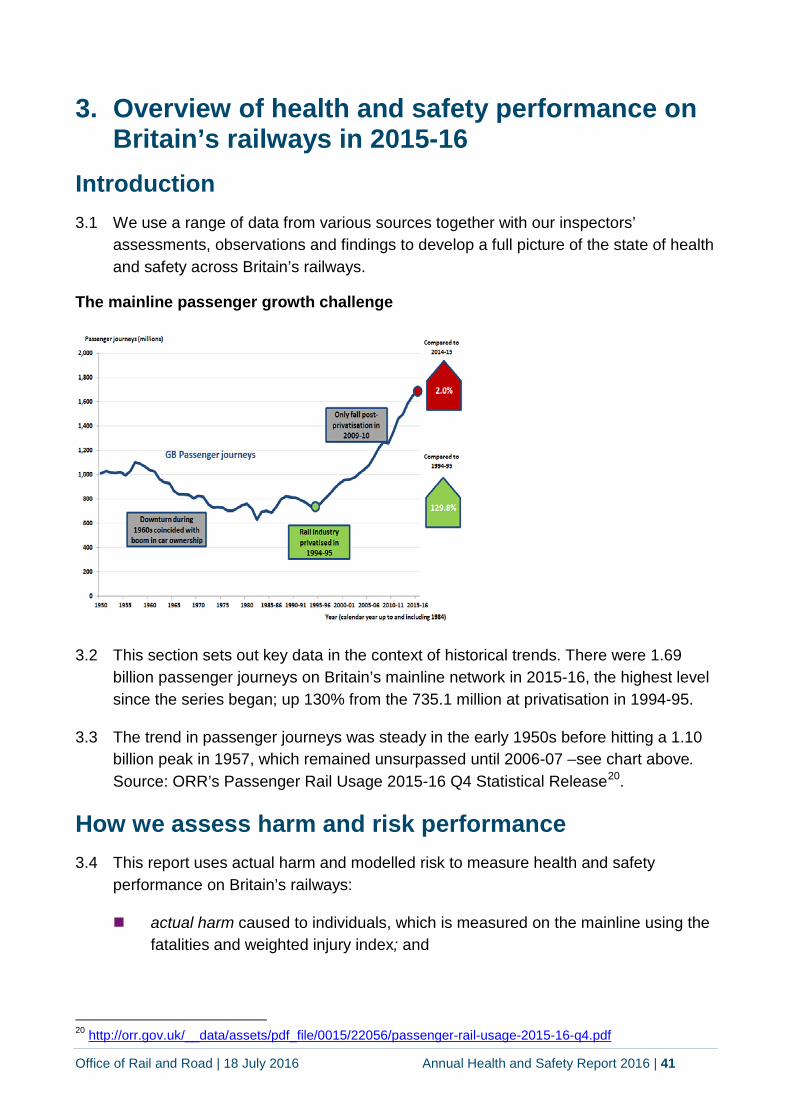
Office of Rail and Road | 18 July 2016 Annual Health and Safety Report 2016 | 41
3. Overview of health and safety performance on Britain’s railways in 2015-16
Introduction 3.1 We use a range of data from various sources together with our inspectors’
assessments, observations and findings to develop a full picture of the state of health and safety across Britain’s railways.
The mainline passenger growth challenge
3.2 This section sets out key data in the context of historical trends. There were 1.69 billion passenger journeys on Britain’s mainline network in 2015-16, the highest level since the series began; up 130% from the 735.1 million at privatisation in 1994-95.
3.3 The trend in passenger journeys was steady in the early 1950s before hitting a 1.10 billion peak in 1957, which remained unsurpassed until 2006-07 –see chart above. Source: ORR’s Passenger Rail Usage 2015-16 Q4 Statistical Release20.
How we assess harm and risk performance 3.4 This report uses actual harm and modelled risk to measure health and safety
performance on Britain’s railways:
actual harm caused to individuals, which is measured on the mainline using the fatalities and weighted injury index; and
20 http://orr.gov.uk/__data/assets/pdf_file/0015/22056/passenger-rail-usage-2015-16-q4.pdf

Office of Rail and Road | 18 July 2016 Annual Health and Safety Report 2016 | 42
modelled risk, which uses historic mainline data to periodically quantify the frequency and potential average consequence from a particular set of circumstances that could lead to a safety incident. The Safety Model (SRM) periodically takes a snapshot of all significant risks on the mainline and the monthly Precursor Indicator Model (PIM) tracks trends in key catastrophic precursor train accident risk.
3.5 However, these measures rely on and are limited by being outcome-based incident indicators: they measure harm-causing incidents to quantify current catastrophic train accident risk trends, but are not necessarily good as future predictive or underlying risk indicators. We overcome this through use of our RM3 assessment to ‘triangulate’ our view of industry performance using a broad range of data and intelligence sources, such as performance indicators: for example, near-miss events, which had the potential to cause harm; content indicators, such as asset management performance and context indicators, such as measures of safety management culture and duty holders’ risk management values.
Putting the common causes of harm into context 3.6 Britain’s railways are now commonly characterised by having high frequency but low
consequence events; train accidents have become increasingly infrequent. Most common are high frequency and relatively low consequence events, such as passenger slip, trip and fall injuries. While annual reports such as these tend to over-focus on year-on-year comparisons, it’s important to keep in mind how trends in individual harm-causing events fit into the overall level of system harm.
3.7 Using the 2014 SRM (the last time it was done), the two biggest harm-causing events are from passenger and worker slip, trip and fall events – a typically high frequency, but mainly low consequence events which represent 20% of the overall system risk. Public trespass, a relatively low frequency but potentially very high consequence event, accounts for 24% of the overall system risk. Together, public trespass and slip, trip and fall events represent nearly half of the overall harm caused on Britain’s mainline railways.
Our safety statistical release 3.8 The collection of good data from across Britain’s railways is critical in identifying
trends and quantifying risk, and in setting the correct risk control priorities and measuring performance. This report uses final and some provisional railway data. Confirmed 2015-16 safety data from mainline, LUL and non-mainline operators will be issued in our key safety statistics release on 22 September 201621. It will contain finalised numbers from both mainline and non-mainline operators.
21 http://orr.gov.uk/statistics/published-stats/statistical-releases
Office of Rail and Road | 18 July 2016 Annual Health and Safety Report 2016 | 43
Our use of mainline data and data quality 3.9 SMIS is the way the mainline railway collects safety-related and other event data. It is
mandatory for mainline railway infrastructure managers, train operators and others to record such events. When compared to 2014, in 2015 the mainline industry’s national data quality score mark was 100%, up 2%, but data input timeliness was down 2% to 98%. The reduction in data input timeliness was due to staff changes and resourcing issues. RSSB’s annual quality health check of SMIS data quality and timeliness22 are important to ensure the quality of data the sector collects and uses is reliable and robust, including for its safety risk modelling.
Mainline passenger and public fatalities in 2015-16
3.10 A total of 45 passengers and members of the public were killed on the mainline railway in 2015-16, the same as in 2014-15 and the third-lowest total for 10 years. These included 37 members of the public of whom 30 were trespassing, three were pedestrians at level crossings, two members of the public who fell and were killed on railway infrastructure, and eight passengers and two members of the public fatalities at or near stations, up four compared to 2014-15. There were no worker fatalities for the first time since reliable records began.
3.11 There were eight passenger fatalities – a high number and the highest since 2006-07. None were industry-caused and all occurred at stations:
a passenger fell on to the track from the station platform and caused fatal injuries with no train present;
a passenger fell on to the track and was then struck and killed by a train;
a passenger fell on to the track and was electrocuted by the third-rail;
two passengers fell between the platform-train interface, but not during boarding or alighting incidents;
one passenger was murdered and another died in a violent assault, both at stations; and
a passenger was struck and killed by a road sign blown off in high winds.
3.12 In addition, two members of the public were killed at stations: one was a teenage girl involved in her mother’s suicide and the second, a member of the public, who fell from the platform on to the track and was struck and killed by a passing train.
22 http://www.rssb.co.uk/Library/about-rssb/2016-01-14-board-paper-data-quality-health-check.pdf
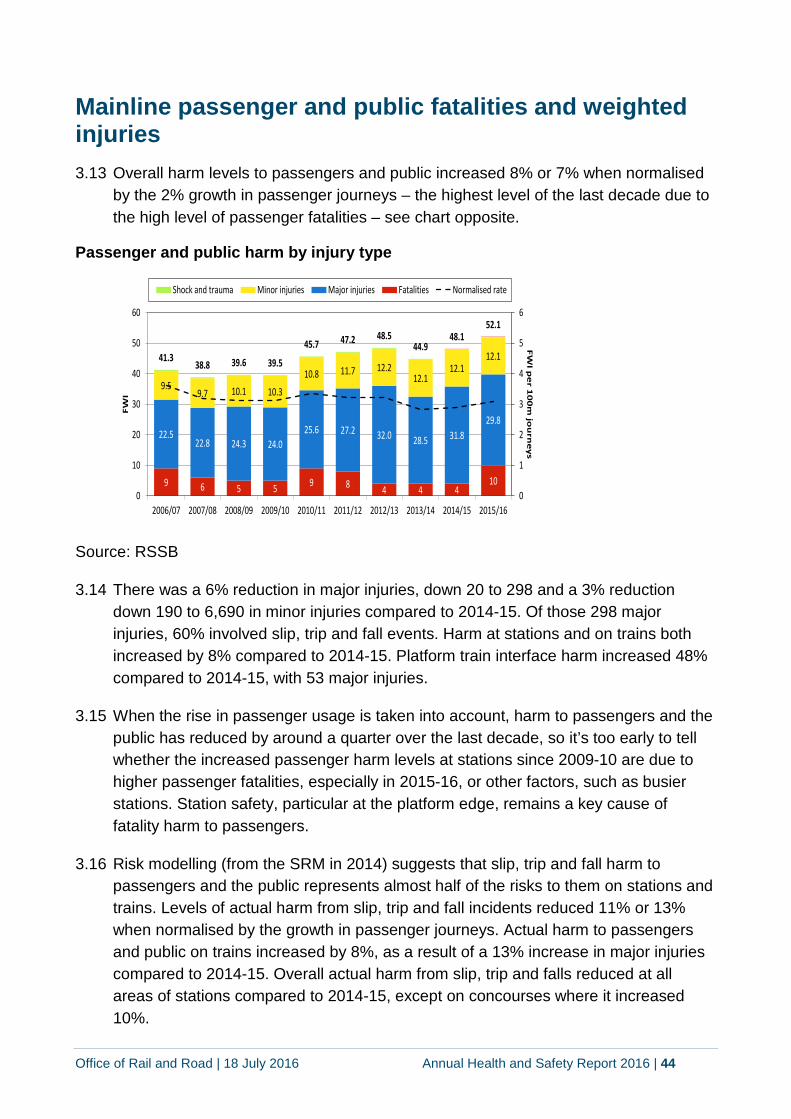
Office of Rail and Road | 18 July 2016 Annual Health and Safety Report 2016 | 44
Mainline passenger and public fatalities and weighted injuries 3.13 Overall harm levels to passengers and public increased 8% or 7% when normalised
by the 2% growth in passenger journeys – the highest level of the last decade due to the high level of passenger fatalities – see chart opposite.
Passenger and public harm by injury type
Source: RSSB
3.14 There was a 6% reduction in major injuries, down 20 to 298 and a 3% reduction down 190 to 6,690 in minor injuries compared to 2014-15. Of those 298 major injuries, 60% involved slip, trip and fall events. Harm at stations and on trains both increased by 8% compared to 2014-15. Platform train interface harm increased 48% compared to 2014-15, with 53 major injuries.
3.15 When the rise in passenger usage is taken into account, harm to passengers and the public has reduced by around a quarter over the last decade, so it’s too early to tell whether the increased passenger harm levels at stations since 2009-10 are due to higher passenger fatalities, especially in 2015-16, or other factors, such as busier stations. Station safety, particular at the platform edge, remains a key cause of fatality harm to passengers.
3.16 Risk modelling (from the SRM in 2014) suggests that slip, trip and fall harm to passengers and the public represents almost half of the risks to them on stations and trains. Levels of actual harm from slip, trip and fall incidents reduced 11% or 13% when normalised by the growth in passenger journeys. Actual harm to passengers and public on trains increased by 8%, as a result of a 13% increase in major injuries compared to 2014-15. Overall actual harm from slip, trip and falls reduced at all areas of stations compared to 2014-15, except on concourses where it increased 10%.
9 6 5 5 9 8 4 4 410
22.522.8 24.3 24.0
25.6 27.2 32.0 28.5 31.829.8
9.59.7 10.1 10.3
10.8 11.7 12.212.1
12.112.141.3
38.8 39.6 39.5
45.7 47.2 48.544.9
48.152.1
0
1
2
3
4
5
6
0
10
20
30
40
50
60
2006/07 2007/08 2008/09 2009/10 2010/11 2011/12 2012/13 2013/14 2014/15 2015/16
FW
I pe
r 10
0m
jou
rne
ys
FW
I
Shock and trauma Minor injuries Major injuries Fatalities Normalised rate
Office of Rail and Road | 18 July 2016 Annual Health and Safety Report 2016 | 45
3.17 Overall harm at the PTI increased by 48%, due to the higher than usual numbers of fatalities: five passengers and one member of the public, but none of these incidents involved the boarding or alighting of trains. Also, harm for passenger boarding and alighting incidents increased 7%, but platform edge incidents not involving passenger boarding or alighting, which often cause serious harm, increased 108% – a high number compared to recent years – due to five passenger and one member of the public fatalities at the platform edge.
Assaults on passenger and the public at station and on trains 3.18 Assaults on the public and passengers on stations and trains, as reported to the
BTP’s CRIME database increased 24%, or 22% when normalised by the 2% growth in passenger journeys – the first growth in normalised passenger and public assault in the last five years. BTP recorded a total of 3,737 assaults on trains and stations; harassment up 67% and common assaults up 21% compared to 2014-15. Enhanced BTP reporting processes over 2015-16 may be a part of reason for these increases.
Harm to the public not involving suicide, trespass or level crossings 3.19 There were four incidents where members of the public died on railway infrastructure
– the highest for a decade. Two involved falls from height; one involved a teenage girl who was killed while her mother was committing suicide; and one involved a member of the public who fell from a platform on to the track and was struck and killed by a train.
Mainline workforce fatalities and weighted injuries 3.20 Overall mainline industry workforce fatalities and injuries harm reduced 19%,
including a 21% reduction in harm to infrastructure workers – the lowest level for a decade – when normalised by the 3% increase in the 219 million workers’ hours worked, compared to 2014-15.
3.21 There were 157 major injuries to all workers and a 14% reduction in actual major injury harm compared to 2014-15; and of those, 52 occurred in stations or on trains – a 30% increase.
3.22 Harm to workers from manual handling injuries increased significantly due to six major injuries – the highest for a decade. It coincides with increase in manual handling-related enforcement – see page 48. These six events resulted in back and shoulder injuries due to workers assisting passengers on and off trains, lifting wheelchair ramps for train access, lifting luggage and rubbish clearance.
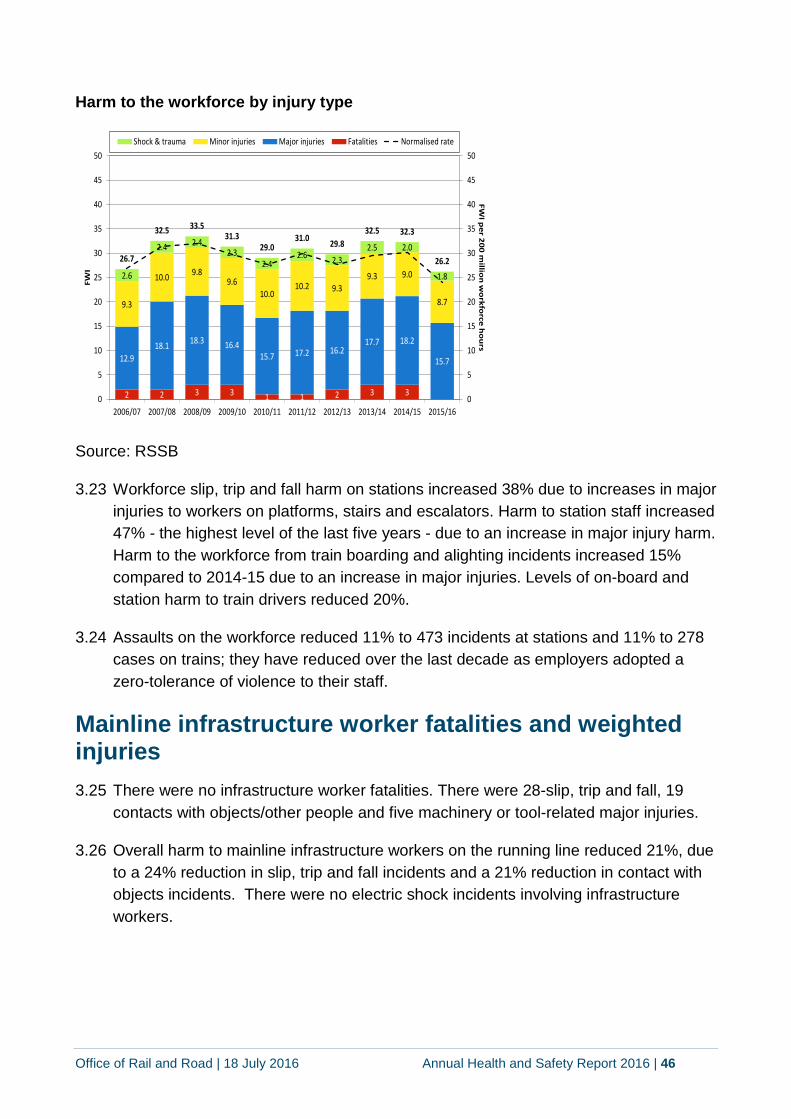
Office of Rail and Road | 18 July 2016 Annual Health and Safety Report 2016 | 46
Harm to the workforce by injury type
Source: RSSB
3.23 Workforce slip, trip and fall harm on stations increased 38% due to increases in major injuries to workers on platforms, stairs and escalators. Harm to station staff increased 47% - the highest level of the last five years - due to an increase in major injury harm. Harm to the workforce from train boarding and alighting incidents increased 15% compared to 2014-15 due to an increase in major injuries. Levels of on-board and station harm to train drivers reduced 20%.
3.24 Assaults on the workforce reduced 11% to 473 incidents at stations and 11% to 278 cases on trains; they have reduced over the last decade as employers adopted a zero-tolerance of violence to their staff.
Mainline infrastructure worker fatalities and weighted injuries 3.25 There were no infrastructure worker fatalities. There were 28-slip, trip and fall, 19
contacts with objects/other people and five machinery or tool-related major injuries.
3.26 Overall harm to mainline infrastructure workers on the running line reduced 21%, due to a 24% reduction in slip, trip and fall incidents and a 21% reduction in contact with objects incidents. There were no electric shock incidents involving infrastructure workers.
2 2 3 3 1 1 2 3 3
12.918.1 18.3 16.4
15.7 17.2 16.217.7 18.2
15.7
9.3
10.0 9.89.6
10.010.2 9.3
9.3 9.0
8.7
2.6
2.4 2.42.3
2.42.6 2.3
2.5 2.0
1.8
26.7
32.5 33.531.3
29.031.0 29.8
32.5 32.3
26.2
0
5
10
15
20
25
30
35
40
45
50
0
5
10
15
20
25
30
35
40
45
50
2006/07 2007/08 2008/09 2009/10 2010/11 2011/12 2012/13 2013/14 2014/15 2015/16
FWI p
er 200 millio
n w
orkfo
rce ho
urs
FWI
Shock & trauma Minor injuries Major injuries Fatalities Normalised rate
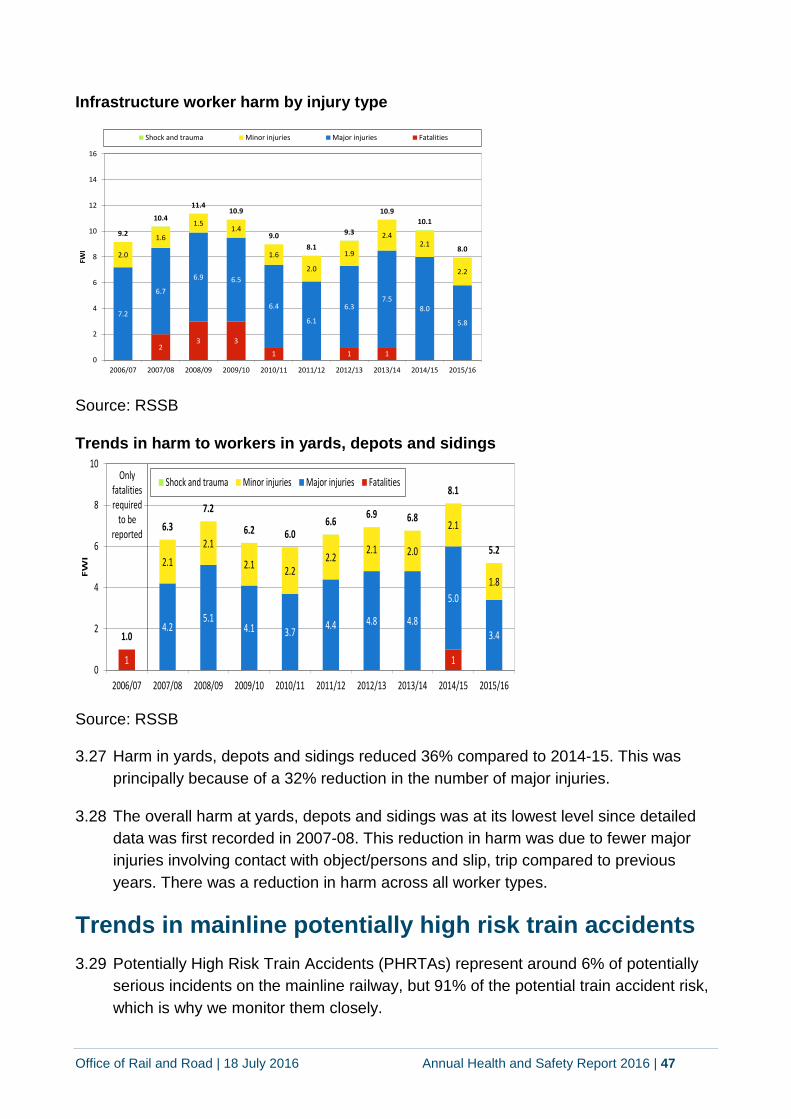
Office of Rail and Road | 18 July 2016 Annual Health and Safety Report 2016 | 47
Infrastructure worker harm by injury type
Source: RSSB
Trends in harm to workers in yards, depots and sidings
Source: RSSB
3.27 Harm in yards, depots and sidings reduced 36% compared to 2014-15. This was principally because of a 32% reduction in the number of major injuries.
3.28 The overall harm at yards, depots and sidings was at its lowest level since detailed data was first recorded in 2007-08. This reduction in harm was due to fewer major injuries involving contact with object/persons and slip, trip compared to previous years. There was a reduction in harm across all worker types.
Trends in mainline potentially high risk train accidents 3.29 Potentially High Risk Train Accidents (PHRTAs) represent around 6% of potentially
serious incidents on the mainline railway, but 91% of the potential train accident risk, which is why we monitor them closely.
23 3
1 1 1
7.2
6.7
6.9 6.5
6.4
6.1
6.37.5
8.0
5.8
2.0
1.6
1.51.4
1.6
2.0
1.9
2.42.1
2.2
9.2
10.4
11.410.9
9.08.1
9.3
10.910.1
8.0
0
2
4
6
8
10
12
14
16
2006/07 2007/08 2008/09 2009/10 2010/11 2011/12 2012/13 2013/14 2014/15 2015/16
FWI
Shock and trauma Minor injuries Major injuries Fatalities
1 1
4.25.1
4.1 3.7 4.4 4.8 4.8
5.0
3.4
2.12.1
2.1 2.22.2
2.1 2.0
2.1
1.8
1.0
6.37.2
6.2 6.06.6 6.9 6.8
8.1
5.2
0
2
4
6
8
10
2006/07 2007/08 2008/09 2009/10 2010/11 2011/12 2012/13 2013/14 2014/15 2015/16
FW
I
Shock and trauma Minor injuries Major injuries FatalitiesOnly fatalities required
to be reported
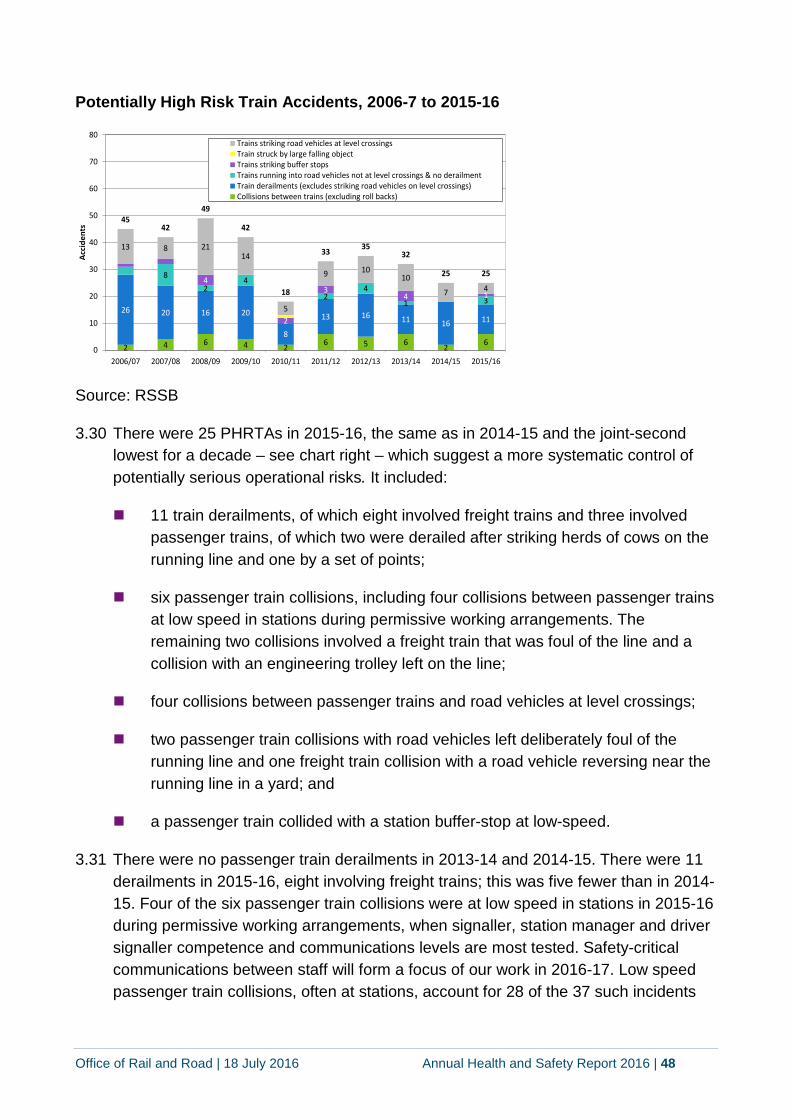
Office of Rail and Road | 18 July 2016 Annual Health and Safety Report 2016 | 48
Potentially High Risk Train Accidents, 2006-7 to 2015-16
Source: RSSB
3.30 There were 25 PHRTAs in 2015-16, the same as in 2014-15 and the joint-second lowest for a decade – see chart right – which suggest a more systematic control of potentially serious operational risks. It included:
11 train derailments, of which eight involved freight trains and three involved passenger trains, of which two were derailed after striking herds of cows on the running line and one by a set of points;
six passenger train collisions, including four collisions between passenger trains at low speed in stations during permissive working arrangements. The remaining two collisions involved a freight train that was foul of the line and a collision with an engineering trolley left on the line;
four collisions between passenger trains and road vehicles at level crossings;
two passenger train collisions with road vehicles left deliberately foul of the running line and one freight train collision with a road vehicle reversing near the running line in a yard; and
a passenger train collided with a station buffer-stop at low-speed.
3.31 There were no passenger train derailments in 2013-14 and 2014-15. There were 11 derailments in 2015-16, eight involving freight trains; this was five fewer than in 2014-15. Four of the six passenger train collisions were at low speed in stations in 2015-16 during permissive working arrangements, when signaller, station manager and driver signaller competence and communications levels are most tested. Safety-critical communications between staff will form a focus of our work in 2016-17. Low speed passenger train collisions, often at stations, account for 28 of the 37 such incidents
2 4 6 4 2 6 5 6 2 6
26 20 16 20
8
13 16 11 16 11
82
4
24
1 3
4
2
34 1
13 8 2114
5
9 1010
7 4
4542
49
42
18
33 3532
25 25
0
10
20
30
40
50
60
70
80
2006/07 2007/08 2008/09 2009/10 2010/11 2011/12 2012/13 2013/14 2014/15 2015/16
Acci
dent
s
Trains striking road vehicles at level crossingsTrain struck by large falling objectTrains striking buffer stopsTrains running into road vehicles not at level crossings & no derailmentTrain derailments (excludes striking road vehicles on level crossings)Collisions between trains (excluding roll backs)
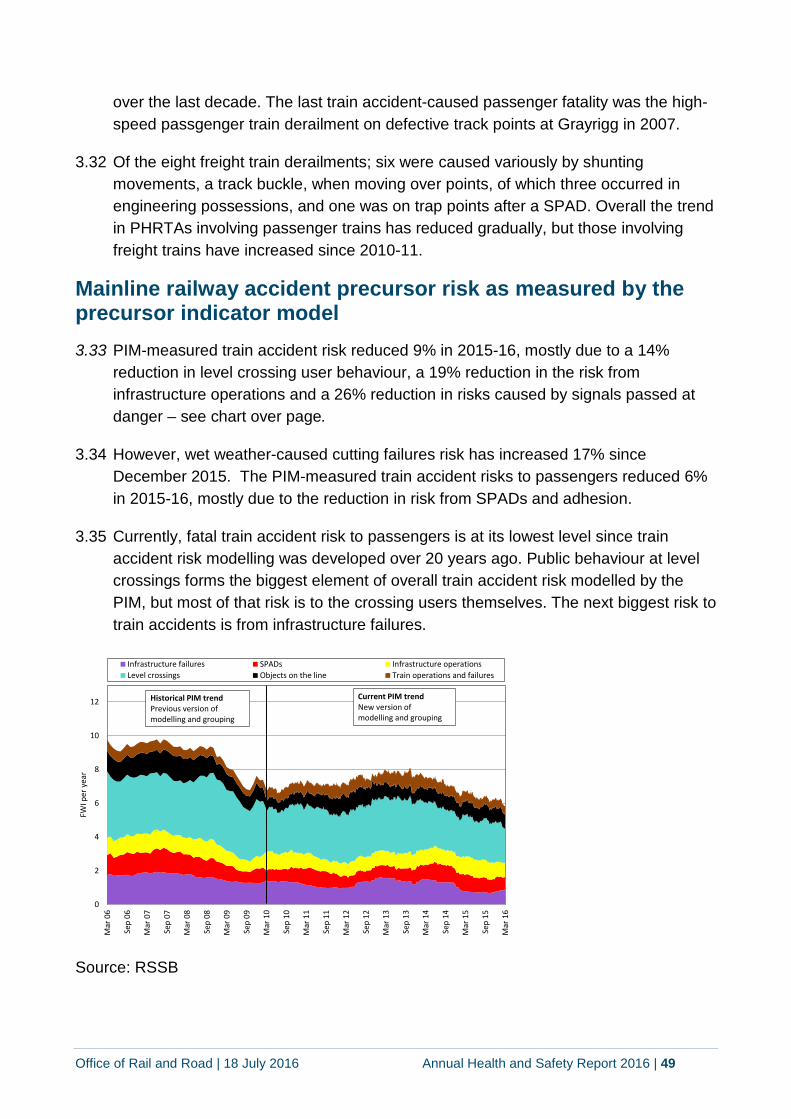
Office of Rail and Road | 18 July 2016 Annual Health and Safety Report 2016 | 49
over the last decade. The last train accident-caused passenger fatality was the high-speed passgenger train derailment on defective track points at Grayrigg in 2007.
3.32 Of the eight freight train derailments; six were caused variously by shunting movements, a track buckle, when moving over points, of which three occurred in engineering possessions, and one was on trap points after a SPAD. Overall the trend in PHRTAs involving passenger trains has reduced gradually, but those involving freight trains have increased since 2010-11.
Mainline railway accident precursor risk as measured by the precursor indicator model 3.33 PIM-measured train accident risk reduced 9% in 2015-16, mostly due to a 14%
reduction in level crossing user behaviour, a 19% reduction in the risk from infrastructure operations and a 26% reduction in risks caused by signals passed at danger – see chart over page.
3.34 However, wet weather-caused cutting failures risk has increased 17% since December 2015. The PIM-measured train accident risks to passengers reduced 6% in 2015-16, mostly due to the reduction in risk from SPADs and adhesion.
3.35 Currently, fatal train accident risk to passengers is at its lowest level since train accident risk modelling was developed over 20 years ago. Public behaviour at level crossings forms the biggest element of overall train accident risk modelled by the PIM, but most of that risk is to the crossing users themselves. The next biggest risk to train accidents is from infrastructure failures.
Source: RSSB
0
2
4
6
8
10
12
Mar
06
Sep
06
Mar
07
Sep
07
Mar
08
Sep
08
Mar
09
Sep
09
Mar
10
Sep
10
Mar
11
Sep
11
Mar
12
Sep
12
Mar
13
Sep
13
Mar
14
Sep
14
Mar
15
Sep
15
Mar
16
FWI p
er y
ear
Infrastructure failures SPADs Infrastructure operationsLevel crossings Objects on the line Train operations and failures
Historical PIM trendPrevious version ofmodelling and grouping
Current PIM trendNew version ofmodelling and grouping
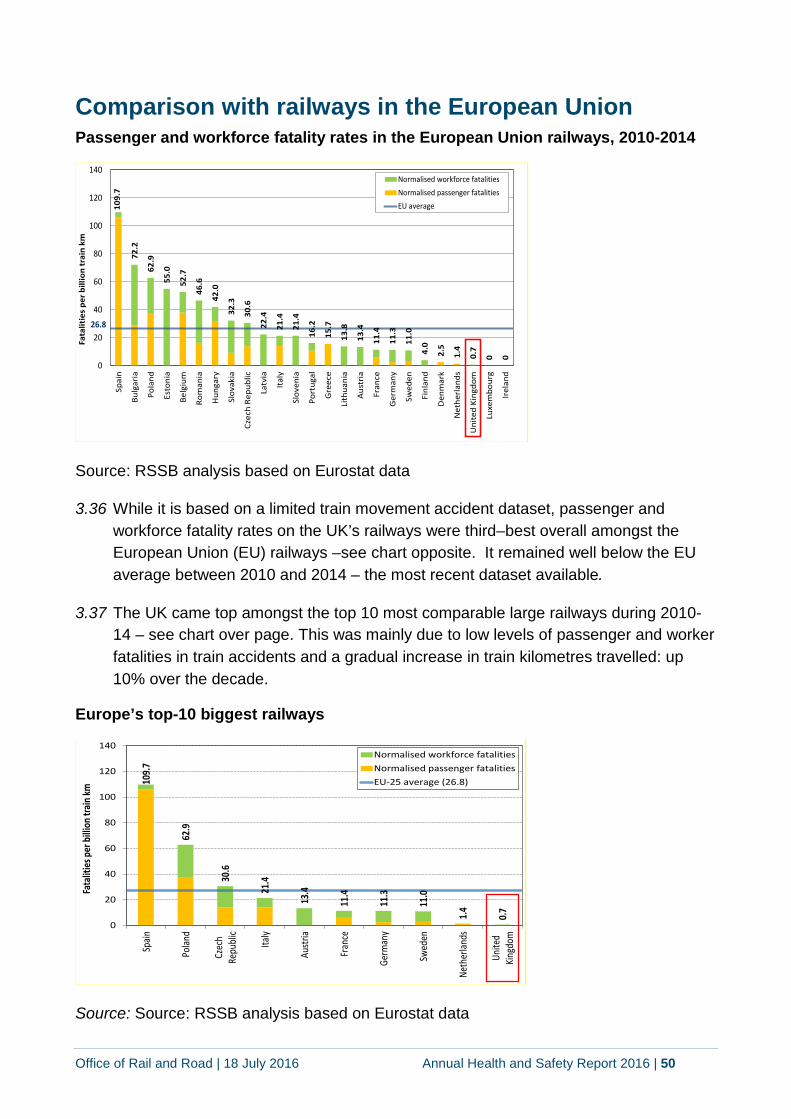
Office of Rail and Road | 18 July 2016 Annual Health and Safety Report 2016 | 50
Comparison with railways in the European Union Passenger and workforce fatality rates in the European Union railways, 2010-2014
Source: RSSB analysis based on Eurostat data
3.36 While it is based on a limited train movement accident dataset, passenger and workforce fatality rates on the UK’s railways were third–best overall amongst the European Union (EU) railways –see chart opposite. It remained well below the EU average between 2010 and 2014 – the most recent dataset available.
3.37 The UK came top amongst the top 10 most comparable large railways during 2010-14 – see chart over page. This was mainly due to low levels of passenger and worker fatalities in train accidents and a gradual increase in train kilometres travelled: up 10% over the decade.
Europe’s top-10 biggest railways
Source: Source: RSSB analysis based on Eurostat data
109.
7
72.2
62.9
55.0
52.7
46.6
42.0
32.3
30.6
22.4
21.4
21.4
16.2
15.7
13.8
13.4
11.4
11.3
11.0
4.0
2.5
1.4
0.7
0 0
26.8
0
20
40
60
80
100
120
140
Spai
n
Bulg
aria
Pola
nd
Esto
nia
Belg
ium
Rom
ania
Hun
gary
Slov
akia
Czec
h Re
publ
ic
Latv
ia
Italy
Slov
enia
Port
ugal
Gre
ece
Lith
uani
a
Aust
ria
Fran
ce
Ger
man
y
Swed
en
Finl
and
Den
mar
k
Net
herla
nds
Uni
ted
King
dom
Luxe
mbo
urg
Irel
and
Fata
litie
s pe
r bill
ion
trai
n km
Normalised workforce fatalitiesNormalised passenger fatalitiesEU average
109.
7
62.9
30.6
21.4
13.4
11.4
11.3
11.0
1.4
0.7
0
20
40
60
80
100
120
140
Spain
Polan
d
Czec
hRe
publi
c
Italy
Austr
ia
Fran
ce
Germ
any
Swed
en
Neth
erlan
ds
Unite
dKin
gdom
Fata
lities
per b
illion
train
km
Normalised workforce fatalitiesNormalised passenger fatalitiesEU-25 average (26.8)
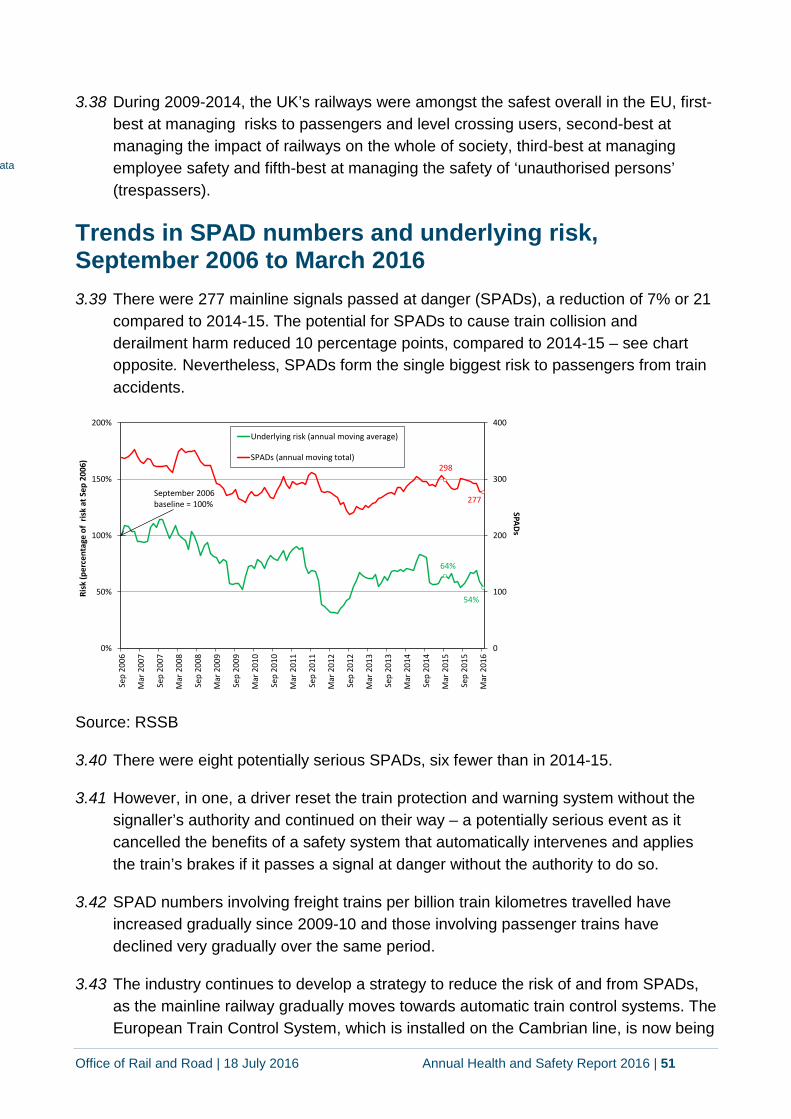
Office of Rail and Road | 18 July 2016 Annual Health and Safety Report 2016 | 51
3.38 During 2009-2014, the UK’s railways were amongst the safest overall in the EU, first-best at managing risks to passengers and level crossing users, second-best at managing the impact of railways on the whole of society, third-best at managing employee safety and fifth-best at managing the safety of ‘unauthorised persons’ (trespassers).
Trends in SPAD numbers and underlying risk, September 2006 to March 2016 3.39 There were 277 mainline signals passed at danger (SPADs), a reduction of 7% or 21
compared to 2014-15. The potential for SPADs to cause train collision and derailment harm reduced 10 percentage points, compared to 2014-15 – see chart opposite. Nevertheless, SPADs form the single biggest risk to passengers from train accidents.
Source: RSSB
3.40 There were eight potentially serious SPADs, six fewer than in 2014-15.
3.41 However, in one, a driver reset the train protection and warning system without the signaller’s authority and continued on their way – a potentially serious event as it cancelled the benefits of a safety system that automatically intervenes and applies the train’s brakes if it passes a signal at danger without the authority to do so.
3.42 SPAD numbers involving freight trains per billion train kilometres travelled have increased gradually since 2009-10 and those involving passenger trains have declined very gradually over the same period.
3.43 The industry continues to develop a strategy to reduce the risk of and from SPADs, as the mainline railway gradually moves towards automatic train control systems. The European Train Control System, which is installed on the Cambrian line, is now being
64%
54%
277
298
0
100
200
300
400
0%
50%
100%
150%
200%
Sep
2006
Mar
200
7
Sep
2007
Mar
200
8
Sep
2008
Mar
200
9
Sep
2009
Mar
201
0
Sep
2010
Mar
201
1
Sep
2011
Mar
201
2
Sep
2012
Mar
201
3
Sep
2013
Mar
201
4
Sep
2014
Mar
201
5
Sep
2015
Mar
201
6
SPADs
Risk
(per
cent
age
of r
isk
at S
ep 2
006)
Underlying risk (annual moving average)
SPADs (annual moving total)
September 2006baseline = 100%
ata

Office of Rail and Road | 18 July 2016 Annual Health and Safety Report 2016 | 52
Source: Network Rail
trialled on the network and will be used on the Crossrail’s core section. We continue to monitor this closely to ensure the sector manages SPAD risk and service growth safely, including the future risks from the necessary in-service shifts between different train control systems.
Track geometry 3.44 While not necessarily a direct safety indicator, we monitor
immediate action levels and intervention track geometry faults, such as track twist amongst others, as they provide a useful precursor indicator to track condition. The trend in track twist faults, a particular type of higher risk track geometry fault, reduced 11% nationally over 2015-16, which compares to a 12% reduction in 2014-15. However, these reductions hide some variations across the network’s routes.
Mainline repeat track twist faults, 2011-12 to 2015-16
3.45 National levels of ‘repeat twist fault’ - where initial work to rectify track twist faults failed – has improved by 22% since the start of CP5, but again performance varied between routes. We keep a close watch on additional infrastructure renewal deferrals by challenging Network Rail to assure us of how their delivery units plan to manage the potentially elevated levels of risk these could pose
Suicides and attempted suicides 3.46 The causes of suicide are often a complex mix of societal and psychological factors
and are both a challenging and sensitive matter for all those affected, whether family, friends, passengers, or to those who work on Britain’s railways.
3.47 There were 252 suicides, a reduction of 12% or 35 on 2014-15 – but still a high number – and 71 attempted suicides, an increase of 22% or 13 compared to 2014-15.

Office of Rail and Road | 18 July 2016 Annual Health and Safety Report 2016 | 53
3.48 The mainline industry has shown considerable and commendable leadership and concerted efforts, including working closely with the Samaritans23 for the last five years, to prevent railways suicide and reduce their impact on the workforce and other witnesses. Over 10,000 have been trained in suicide prevention work and train industry staff made over 1,100 interventions in 2015-16 to prevent events that may have led to a suicide.
Trends in suspected/confirmed suicides since 2005-06
Source: RSSB
Trespass 3.49 There were 30 trespass fatalities, an increase of three compared to 2014-15, but the
fourth-lowest in the last decade. There were 22 major injuries caused to members of the public while trespassing. Trespass represents around 30% of the overall harm to the public on the mainline railway.
Vandalism 3.50 Reported vandalism levels have declined 62% over the last decade, with a notable
reduction in cable theft since 2013-14, but vandalism-caused delay minutes increased 87% to nearly 50,000 compared to the very low levels of 2014-15.
Level crossings 3.51 There were three fatalities at level crossings in 2015-16; two involved pedestrians at
passive crossings and one involved a pedestrian at a manually controlled barrier crossing with closed circuit television.
23 http://www.samaritans.org/your-community/reducing-railway-deaths-0/samaritans-and-network-rail-
partnership
225 207 219 243208
250 245276 287
252
4338
5240
51
44 51
80 5871268
245271 283
259294 296
356 345323
0
50
100
150
200
250
300
350
400
450
2006/07 2007/08 2008/09 2009/10 2010/11 2011/12 2012/13 2013/14 2014/15 2015/16
Inju
ries
Non-fatal injuries from attempted suicideSuicide fatalitiesWorkforce cases of shock/trauma arising from suicide/attempted suicide
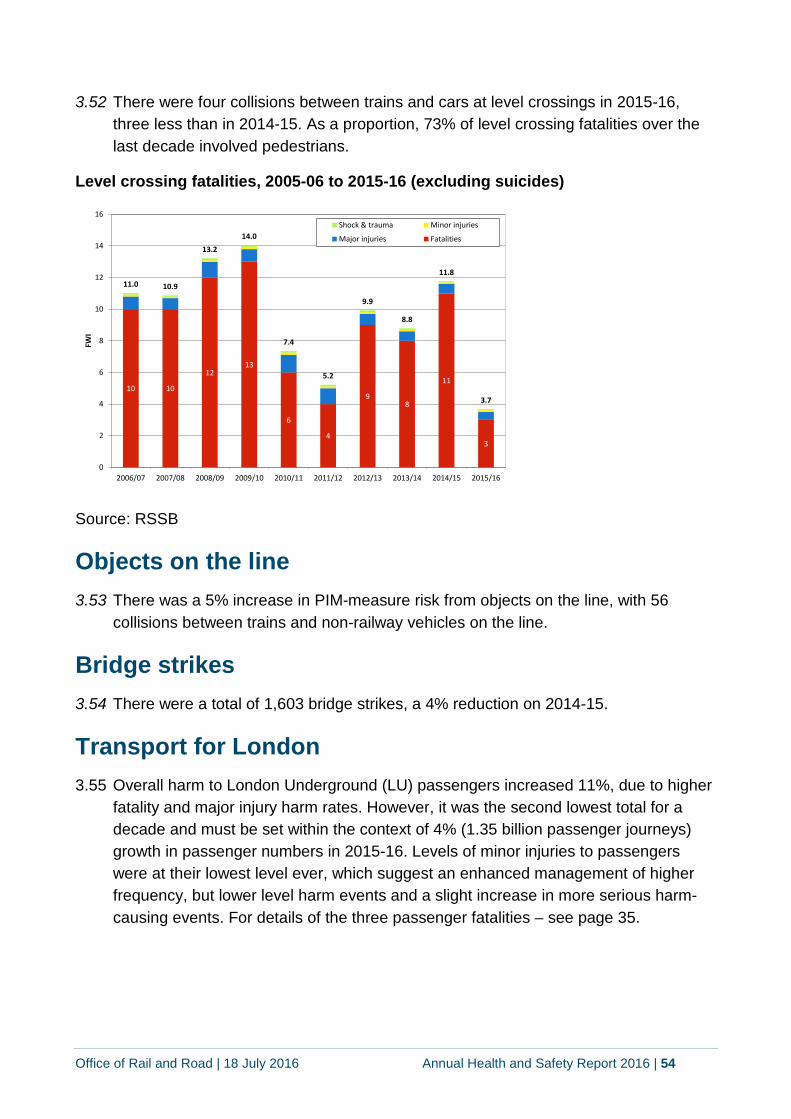
Office of Rail and Road | 18 July 2016 Annual Health and Safety Report 2016 | 54
3.52 There were four collisions between trains and cars at level crossings in 2015-16, three less than in 2014-15. As a proportion, 73% of level crossing fatalities over the last decade involved pedestrians.
Level crossing fatalities, 2005-06 to 2015-16 (excluding suicides)
Source: RSSB
Objects on the line 3.53 There was a 5% increase in PIM-measure risk from objects on the line, with 56
collisions between trains and non-railway vehicles on the line.
Bridge strikes 3.54 There were a total of 1,603 bridge strikes, a 4% reduction on 2014-15.
Transport for London 3.55 Overall harm to London Underground (LU) passengers increased 11%, due to higher
fatality and major injury harm rates. However, it was the second lowest total for a decade and must be set within the context of 4% (1.35 billion passenger journeys) growth in passenger numbers in 2015-16. Levels of minor injuries to passengers were at their lowest level ever, which suggest an enhanced management of higher frequency, but lower level harm events and a slight increase in more serious harm-causing events. For details of the three passenger fatalities – see page 35.
10 10
1213
6
4
98
11
3
11.0 10.9
13.214.0
7.4
5.2
9.9
8.8
11.8
3.7
0
2
4
6
8
10
12
14
16
2006/07 2007/08 2008/09 2009/10 2010/11 2011/12 2012/13 2013/14 2014/15 2015/16
FWI
Shock & trauma Minor injuries
Major injuries Fatalities
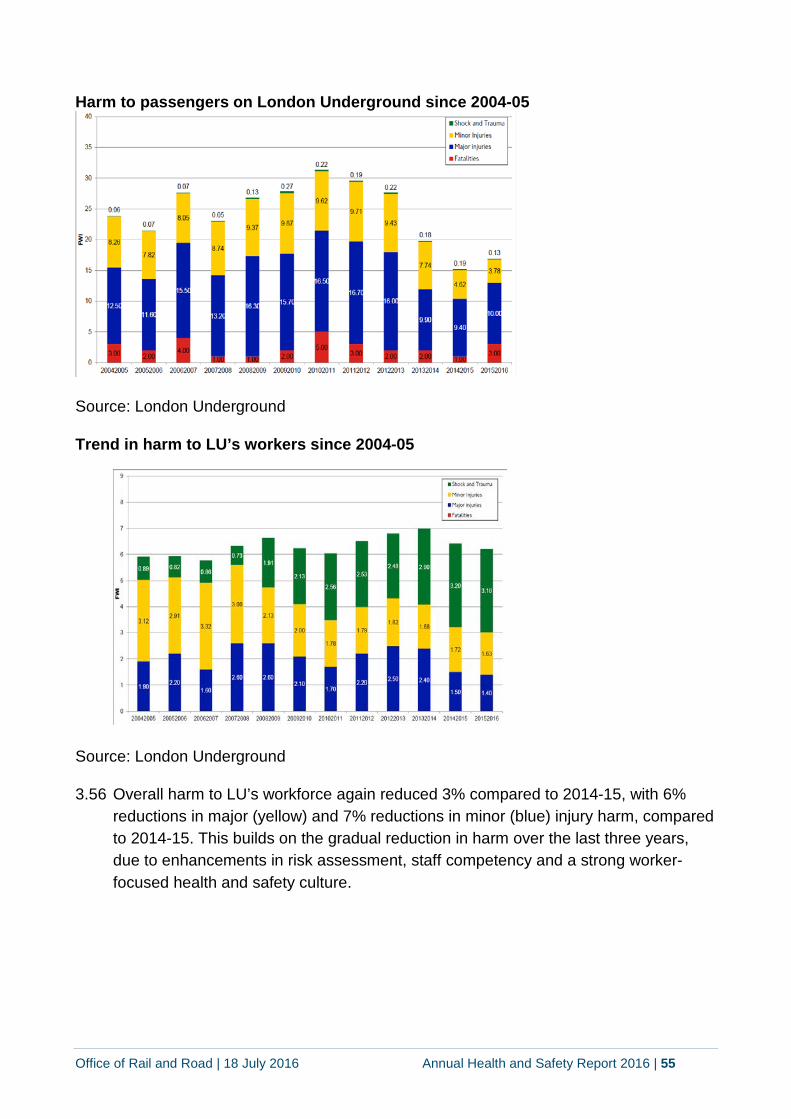
Office of Rail and Road | 18 July 2016 Annual Health and Safety Report 2016 | 55
Harm to passengers on London Underground since 2004-05
Source: London Underground
Trend in harm to LU’s workers since 2004-05
Source: London Underground
3.56 Overall harm to LU’s workforce again reduced 3% compared to 2014-15, with 6% reductions in major (yellow) and 7% reductions in minor (blue) injury harm, compared to 2014-15. This builds on the gradual reduction in harm over the last three years, due to enhancements in risk assessment, staff competency and a strong worker-focused health and safety culture.
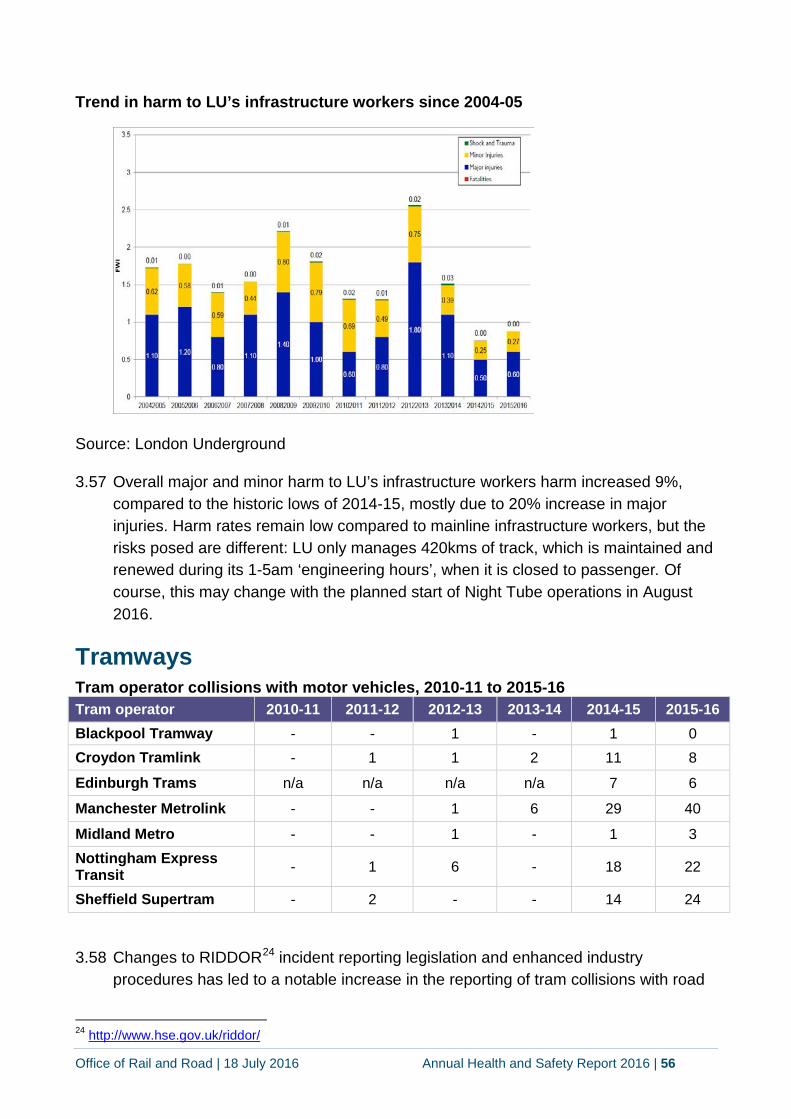
Office of Rail and Road | 18 July 2016 Annual Health and Safety Report 2016 | 56
Trend in harm to LU’s infrastructure workers since 2004-05
Source: London Underground
3.57 Overall major and minor harm to LU’s infrastructure workers harm increased 9%, compared to the historic lows of 2014-15, mostly due to 20% increase in major injuries. Harm rates remain low compared to mainline infrastructure workers, but the risks posed are different: LU only manages 420kms of track, which is maintained and renewed during its 1-5am ‘engineering hours’, when it is closed to passenger. Of course, this may change with the planned start of Night Tube operations in August 2016.
Tramways Tram operator collisions with motor vehicles, 2010-11 to 2015-16 Tram operator 2010-11 2011-12 2012-13 2013-14 2014-15 2015-16 Blackpool Tramway - - 1 - 1 0 Croydon Tramlink - 1 1 2 11 8
Edinburgh Trams n/a n/a n/a n/a 7 6
Manchester Metrolink - - 1 6 29 40
Midland Metro - - 1 - 1 3 Nottingham Express Transit - 1 6 - 18 22
Sheffield Supertram - 2 - - 14 24
3.58 Changes to RIDDOR24 incident reporting legislation and enhanced industry procedures has led to a notable increase in the reporting of tram collisions with road
24 http://www.hse.gov.uk/riddor/
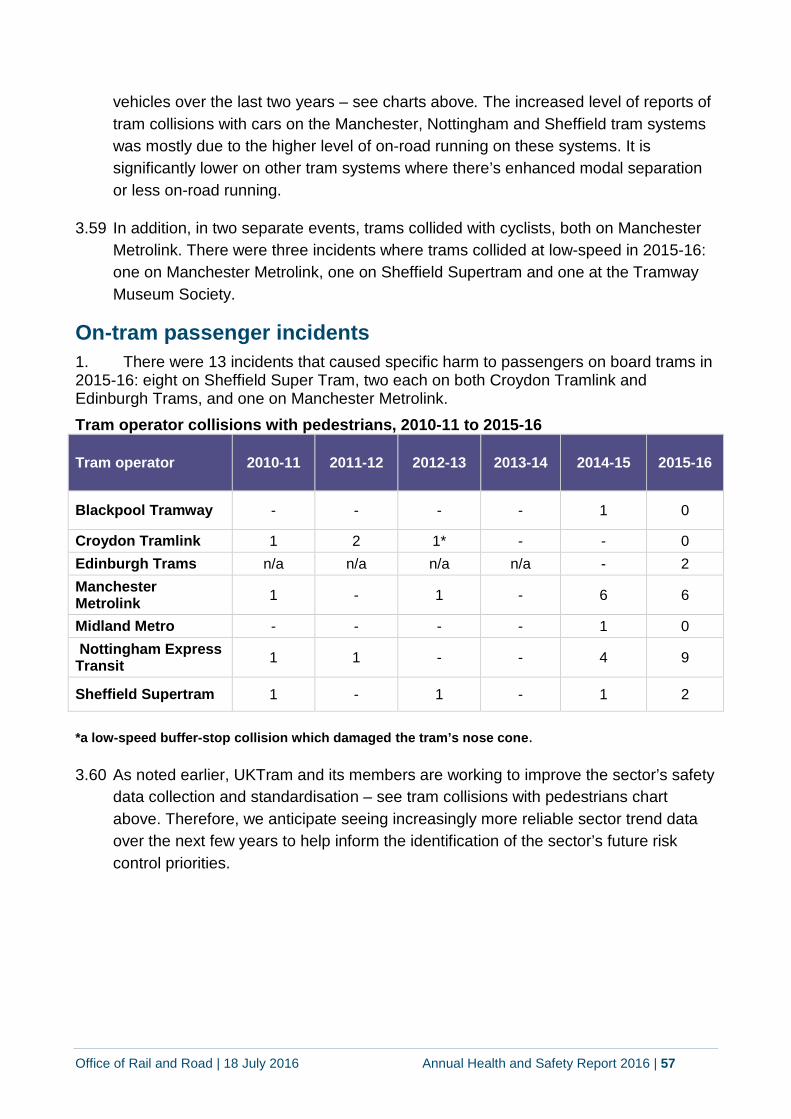
Office of Rail and Road | 18 July 2016 Annual Health and Safety Report 2016 | 57
vehicles over the last two years – see charts above. The increased level of reports of tram collisions with cars on the Manchester, Nottingham and Sheffield tram systems was mostly due to the higher level of on-road running on these systems. It is significantly lower on other tram systems where there’s enhanced modal separation or less on-road running.
3.59 In addition, in two separate events, trams collided with cyclists, both on Manchester Metrolink. There were three incidents where trams collided at low-speed in 2015-16: one on Manchester Metrolink, one on Sheffield Supertram and one at the Tramway Museum Society.
On-tram passenger incidents 1. There were 13 incidents that caused specific harm to passengers on board trams in 2015-16: eight on Sheffield Super Tram, two each on both Croydon Tramlink and Edinburgh Trams, and one on Manchester Metrolink. Tram operator collisions with pedestrians, 2010-11 to 2015-16
Tram operator 2010-11 2011-12 2012-13 2013-14 2014-15 2015-16
Blackpool Tramway - - - - 1 0
Croydon Tramlink 1 2 1* - - 0 Edinburgh Trams n/a n/a n/a n/a - 2 Manchester Metrolink 1 - 1 - 6 6
Midland Metro - - - - 1 0 Nottingham Express Transit 1 1 - - 4 9
Sheffield Supertram 1 - 1 - 1 2
*a low-speed buffer-stop collision which damaged the tram’s nose cone.
3.60 As noted earlier, UKTram and its members are working to improve the sector’s safety data collection and standardisation – see tram collisions with pedestrians chart above. Therefore, we anticipate seeing increasingly more reliable sector trend data over the next few years to help inform the identification of the sector’s future risk control priorities.
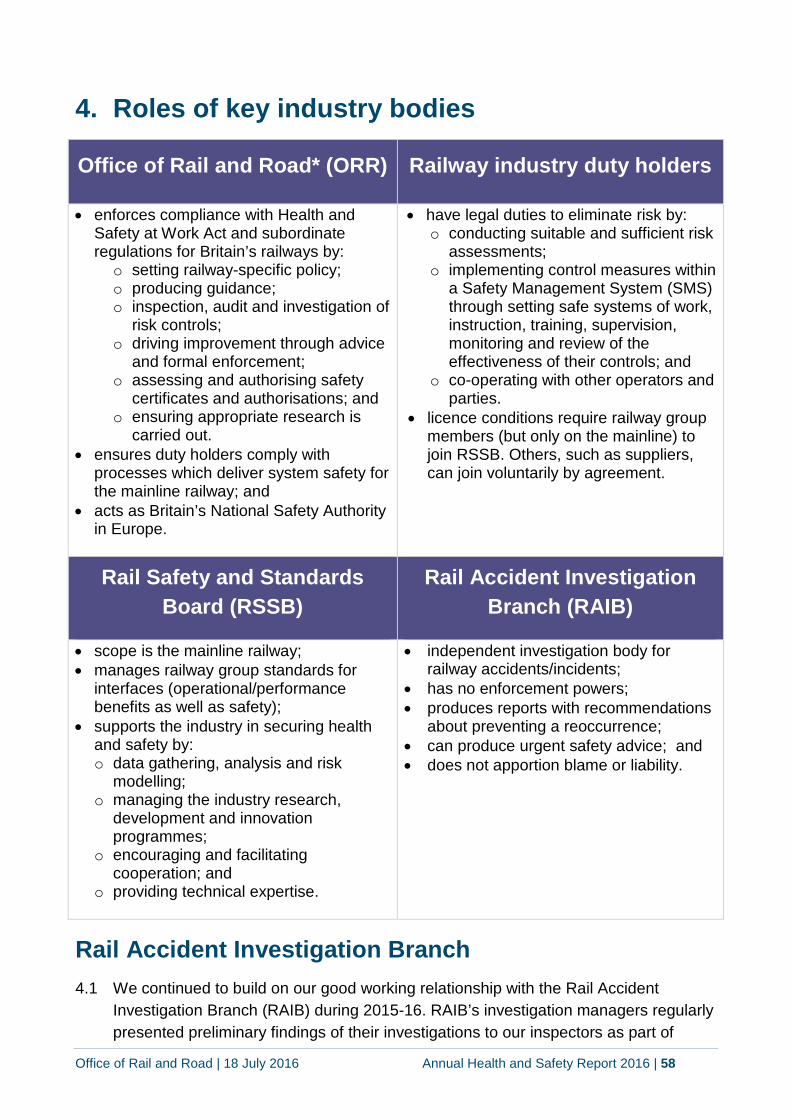
Office of Rail and Road | 18 July 2016 Annual Health and Safety Report 2016 | 58
4. Roles of key industry bodies
Office of Rail and Road* (ORR) Railway industry duty holders
• enforces compliance with Health and Safety at Work Act and subordinate regulations for Britain’s railways by: o setting railway-specific policy; o producing guidance; o inspection, audit and investigation of
risk controls; o driving improvement through advice
and formal enforcement; o assessing and authorising safety
certificates and authorisations; and o ensuring appropriate research is
carried out. • ensures duty holders comply with
processes which deliver system safety for the mainline railway; and
• acts as Britain’s National Safety Authority in Europe.
• have legal duties to eliminate risk by: o conducting suitable and sufficient risk
assessments; o implementing control measures within
a Safety Management System (SMS) through setting safe systems of work, instruction, training, supervision, monitoring and review of the effectiveness of their controls; and
o co-operating with other operators and parties.
• licence conditions require railway group members (but only on the mainline) to join RSSB. Others, such as suppliers, can join voluntarily by agreement.
Rail Safety and Standards Board (RSSB)
Rail Accident Investigation Branch (RAIB)
• scope is the mainline railway; • manages railway group standards for
interfaces (operational/performance benefits as well as safety);
• supports the industry in securing health and safety by: o data gathering, analysis and risk
modelling; o managing the industry research,
development and innovation programmes;
o encouraging and facilitating cooperation; and
o providing technical expertise.
• independent investigation body for railway accidents/incidents;
• has no enforcement powers; • produces reports with recommendations
about preventing a reoccurrence; • can produce urgent safety advice; and • does not apportion blame or liability.
Rail Accident Investigation Branch 4.1 We continued to build on our good working relationship with the Rail Accident
Investigation Branch (RAIB) during 2015-16. RAIB’s investigation managers regularly presented preliminary findings of their investigations to our inspectors as part of
Office of Rail and Road | 18 July 2016 Annual Health and Safety Report 2016 | 59
RAIB’s consultation process and there were a number of joint meetings to clarify their draft recommendations and ORR’s proposed responses to them. Having a good working relationship with RAIB has helped us deliver our duty to influence and monitor actions, considering recommendations and reporting to RAIB the action being taken to address each recommendation within 12 months of a report being published.
4.2 We held quarterly working-level liaison meetings separately with RAIB and Network Rail to exchange information on current issues. We continued our regular high-level meetings with RAIB’s senior executives. In January 2016, a high-level meeting was held to introduce ORR’s and RAIB’s new senior management teams and discuss key issues and future plans. During the year we also held a series of workshops with Network Rail to identify:
groupings of older recommendations that may be progressed or closed-out due to new Network Rail’s health and safety initiatives; and
any areas of concern that can be addressed through closer working and/or changes in process.
4.3 In 2015-16, we received 23 RAIB reports containing 82 recommendations and reported to RAIB action on 153 recommendations: 78 as implemented25; 41 as implementation on-going26; 28 were in progress or progressing27; three as non-implementation28; one as receiving an insufficient response29; and two as being addressed to ‘another public body’.
4.4 At the end of 2015-16, we had:
42 recommendations less than 12-months old; and
136 recommendations where we had previously reported to RAIB that actions were in hand, or incomplete information had been provided by recommendation ‘end-implementers’. We will continue to work with ‘end-implementers’ to address this. There were 49 recommendations reported as ‘in progress’, or ‘progressing’ and 45 where implementation is still on-going that are over two years old. We will continue to work with the industry to address these remaining recommendations.
25 all actions were complete and the recommendation addressed fully. 26 an appropriate action plan with completion dates was received from the end-implementer. 27 discussions are on-going with the end-implementer to agree actions and timescales to address the
recommendations. 28 valid reasons have been accepted by us as to why the recommendations should not be subject to
implementation. 29 no response provided or we are not adequately satisfied that sufficient action is being taken to address a
recommendation.
Office of Rail and Road | 18 July 2016 Annual Health and Safety Report 2016 | 60
4.5 During the year we revised our RAIB recommendation handling process which introduced a new status description of ‘Insufficient response’, to reflect where no response has been provided by an ‘end-implementer’, or we are not satisfied that sufficient action is being taken to address the recommendation. A full list of current recommendation status descriptions can be found on our website30.
Our relationship with RSSB 4.6 We continue to participate as an observer on RSSB’s board, which annually reviews
mainline railway safety risks to passengers, the workforce and public31 and monitors the completeness of the data it collects – see page 43.
4.7 We continue to participate as observers on various RSSB-facilitated groups that work to collaboratively manage risk effectively within the industry. These oversee, or make decisions about, the mainline industry’s standards and research.
4.8 Like the industry, we use RSSB’s safety risk and precursor indicator models, and periodic safety reports to help inform our view of the mainline industry’s safety performance and to provide data for mandatory European reporting requirements.
4.9 In January 2016, RSSB issued ‘Leading health and safety on Britain's railway’, an important document which we support fully. It sets an agenda for collaborative working in the sector to help meet its increasing growth and change management safety challenges and to improve workforce health and wellbeing. We now look to the industry’s leaders and managers to help deliver it.
4.10 Key documents RSSB published over 2015-16 included:
Leading health and safety on Britain's railway’ strategy document32;
Overview of safety performance for 201533; and
Annual health and safety performance in 2015-1634.
30 http://orr.gov.uk/what-and-how-we-regulate/health-and-safety/investigating-health-and-safety-
incidents/handling-raib-recommendations 31 http://www.rssb.co.uk/risk-analysis-and-safety-reporting/safety-intelligence/safety-performance-reports 32 http://www.rssb.co.uk/improving-industry-performance/leading-health-and-safety-on-britains-railway 33 http://www.rssb.co.uk/Library/risk-analysis-and-safety-reporting/2016-03-09-overview-of-safety-
performance-for-2015.pdf 34 http://www.rssb.co.uk/Library/risk-analysis-and-safety-reporting/2016-07-annual-safety-performance-
report-2015-2016.pdf
Office of Rail and Road | 18 July 2016 Annual Health and Safety Report 2016 | 61
5. Our enforcement activities 5.1 In most cases, we secure improvements in health and safety for passengers, the
workforce and public through evidence-based advice and encouragement to duty holders to improve and adapt their risk management. But occasionally, we use our formal powers to ensure compliance with the law or deal with immediate risk. Mostly, we use enforcement notices to stop an activity involving serious risk, or to rectify serious gaps in duty holders’ risk control. Our enforcement policy statement35 sets out how we ensure rigour and consistency in our enforcement decisions by using our enforcement management model.
5.2 We reviewed and revised our enforcement policy statement in 2015-16. Following consultation with stakeholders, we issued our health and safety compliance and enforcement policy statement36.
Improvement notices in 2015-16 (a full list is available on our website37)
5.3 We served 11 improvement notices, compared to 17 in 2014-15. Of those 11, six were on Network Rail, which compares to 13 in 2014-15; three were on the West Coast Railway Company; and one each were on Eurotunnel and France Manche. The reasons for our notices (the first two of which had potentially network-wide implications), included:
poor management of manually handling of heavy concrete signal troughing;
insufficiently robust maintenance of a gas fire-suppression system in a signalling centre;
a charter train operator’s safety management system being unsuitable and insufficient;
a charter train operator’s insufficiently robust driver training and management arrangements;
inappropriate measures to ensure the safety of all users, particularly pedestrians, at a user-worked crossing;
an unsuitable and insufficient risk assessment at level crossing;
35 http://orr.gov.uk/__data/assets/pdf_file/0016/5650/hswa-enforcement-policy-statement.pdf 36 http://orr.gov.uk/__data/assets/pdf_file/0005/18797/orr-health-and-safety-compliance-and-enforcement-
policy-statement-2015.pdf 37 http://orr.gov.uk/publications/notices/legal-notices/improvement-notices
Office of Rail and Road | 18 July 2016 Annual Health and Safety Report 2016 | 62
poor road surface conditions at a level crossing, which posed vehicle grounding-out risks;
an unsuitable safety management system to manage risks associated with third parties attempting to gain unauthorised access to infrastructure; and
failure to manage the manual handling risks to staff using a point lever frame signalling system.
Prohibition notices in 2014-15 (for a full list on our website38)
5.4 We served 6 prohibition notices: four on Network Rail and two on West Coast Railway Company. This compared to the 10 prohibition notices we served in 2014-15. The reasons for our six notices included:
a failure to manage the risks from manually handling heavy concrete signal troughing and switch grinder tools;
a failure to manage slip, trip and falls risks to on-track infrastructure workers;
a failure to manage basic workplace health and safety risks;
a failure to have an on-train train protection system turned on; and
a failure to have suitably robust train driver management competences.
Review of our enforcement in 2015-16 5.5 Of our 17 enforcement notices in 2015-16, several were focused on basic manual
handling and workplace health and safety risks, insufficient controls at level crossings, unsuitable arrangement to manage unauthorised access by third parties to railway infrastructure and charter operator’s insufficiently robust management of its drivers.
Prosecutions in 2015-16 5.6 In England and Wales, we successfully completed prosecutions against four
defendants during 2015-16 resulting in a total of £802k fines - see table below. This compares to four in 2014-15 and seven in 2013-14. All our prosecutions this year were on historic events. They related to a driver’s failure to follow safety procedure after a SPAD, a failure to plan and manage risk to on-track infrastructure workers with adjacent lines running and from on-track vehicle operations, and a failure to
38 http://orr.gov.uk/publications/notices/legal-notices/prohibition-notices
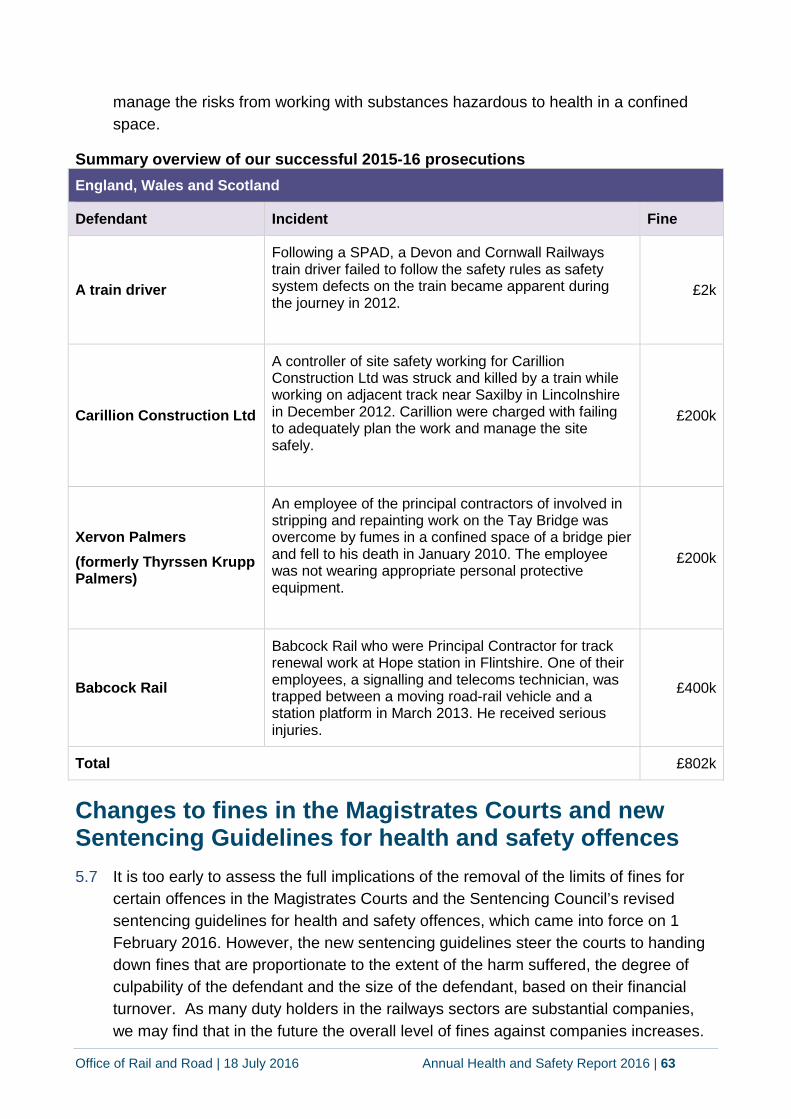
Office of Rail and Road | 18 July 2016 Annual Health and Safety Report 2016 | 63
manage the risks from working with substances hazardous to health in a confined space.
Summary overview of our successful 2015-16 prosecutions England, Wales and Scotland
Defendant Incident Fine
A train driver
Following a SPAD, a Devon and Cornwall Railways train driver failed to follow the safety rules as safety system defects on the train became apparent during the journey in 2012.
£2k
Carillion Construction Ltd
A controller of site safety working for Carillion Construction Ltd was struck and killed by a train while working on adjacent track near Saxilby in Lincolnshire in December 2012. Carillion were charged with failing to adequately plan the work and manage the site safely.
£200k
Xervon Palmers (formerly Thyrssen Krupp Palmers)
An employee of the principal contractors of involved in stripping and repainting work on the Tay Bridge was overcome by fumes in a confined space of a bridge pier and fell to his death in January 2010. The employee was not wearing appropriate personal protective equipment.
£200k
Babcock Rail
Babcock Rail who were Principal Contractor for track renewal work at Hope station in Flintshire. One of their employees, a signalling and telecoms technician, was trapped between a moving road-rail vehicle and a station platform in March 2013. He received serious injuries.
£400k
Total £802k
Changes to fines in the Magistrates Courts and new Sentencing Guidelines for health and safety offences 5.7 It is too early to assess the full implications of the removal of the limits of fines for
certain offences in the Magistrates Courts and the Sentencing Council’s revised sentencing guidelines for health and safety offences, which came into force on 1 February 2016. However, the new sentencing guidelines steer the courts to handing down fines that are proportionate to the extent of the harm suffered, the degree of culpability of the defendant and the size of the defendant, based on their financial turnover. As many duty holders in the railways sectors are substantial companies, we may find that in the future the overall level of fines against companies increases.
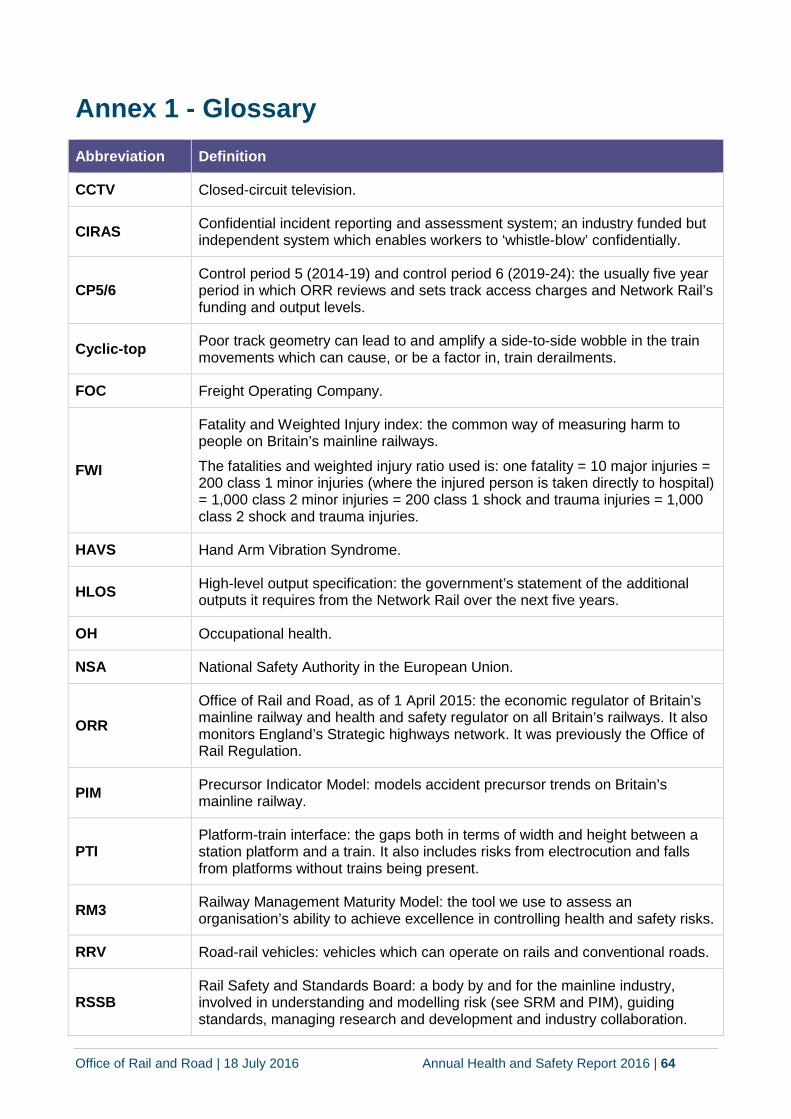
Office of Rail and Road | 18 July 2016 Annual Health and Safety Report 2016 | 64
Annex 1 - Glossary Abbreviation Definition
CCTV Closed-circuit television.
CIRAS Confidential incident reporting and assessment system; an industry funded but independent system which enables workers to ‘whistle-blow’ confidentially.
CP5/6 Control period 5 (2014-19) and control period 6 (2019-24): the usually five year period in which ORR reviews and sets track access charges and Network Rail’s funding and output levels.
Cyclic-top Poor track geometry can lead to and amplify a side-to-side wobble in the train movements which can cause, or be a factor in, train derailments.
FOC Freight Operating Company.
FWI
Fatality and Weighted Injury index: the common way of measuring harm to people on Britain’s mainline railways.
The fatalities and weighted injury ratio used is: one fatality = 10 major injuries = 200 class 1 minor injuries (where the injured person is taken directly to hospital) = 1,000 class 2 minor injuries = 200 class 1 shock and trauma injuries = 1,000 class 2 shock and trauma injuries.
HAVS Hand Arm Vibration Syndrome.
HLOS High-level output specification: the government’s statement of the additional outputs it requires from the Network Rail over the next five years.
OH Occupational health.
NSA National Safety Authority in the European Union.
ORR Office of Rail and Road, as of 1 April 2015: the economic regulator of Britain’s mainline railway and health and safety regulator on all Britain’s railways. It also monitors England’s Strategic highways network. It was previously the Office of Rail Regulation.
PIM Precursor Indicator Model: models accident precursor trends on Britain’s mainline railway.
PTI Platform-train interface: the gaps both in terms of width and height between a station platform and a train. It also includes risks from electrocution and falls from platforms without trains being present.
RM3 Railway Management Maturity Model: the tool we use to assess an organisation’s ability to achieve excellence in controlling health and safety risks.
RRV Road-rail vehicles: vehicles which can operate on rails and conventional roads.
RSSB Rail Safety and Standards Board: a body by and for the mainline industry, involved in understanding and modelling risk (see SRM and PIM), guiding standards, managing research and development and industry collaboration.
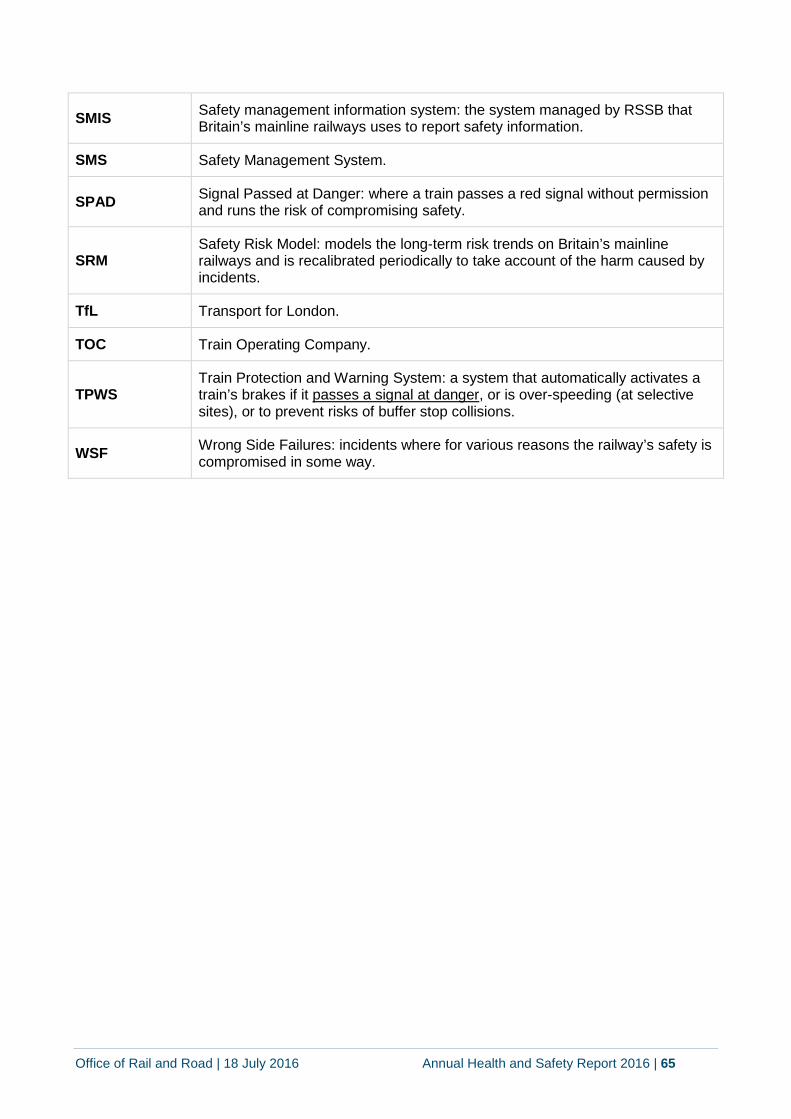
Office of Rail and Road | 18 July 2016 Annual Health and Safety Report 2016 | 65
SMIS Safety management information system: the system managed by RSSB that Britain’s mainline railways uses to report safety information.
SMS Safety Management System.
SPAD Signal Passed at Danger: where a train passes a red signal without permission and runs the risk of compromising safety.
SRM Safety Risk Model: models the long-term risk trends on Britain’s mainline railways and is recalibrated periodically to take account of the harm caused by incidents.
TfL Transport for London.
TOC Train Operating Company.
TPWS Train Protection and Warning System: a system that automatically activates a train’s brakes if it passes a signal at danger, or is over-speeding (at selective sites), or to prevent risks of buffer stop collisions.
WSF Wrong Side Failures: incidents where for various reasons the railway’s safety is compromised in some way.

© Crown copyright 2016
This publication is licensed under the terms of the Open Government Licence v3.0 except where otherwise stated. To view this licence, visit nationalarchives.gov.uk/doc/open-government-licence/version/3 or write to the Information Policy Team, The National Archives, Kew, London TW9 4DU, or email: [email protected].
Where we have identified any third party copyright information you will need to obtain permission from the copyright holders concerned.
This publication is available at orr.gov.uk
Any enquiries regarding this publication should be sent to us at orr.gov.uk