Embed Size (px)
Citation preview
Safety Performance Management
Presented by: George Merritt, FHWAAmy Schick, NHTSA
Est. Dec. 2014

Webinar Logistics
• Duration is 11:00 AM - 12:30 PM Mountain
• Webinar – recorded and archived on website. For quality of recording, phone will be muted during presentation
• If listening on the phone, please mute your computer
• To maximize the presentation on your screen click the 4 arrows in the top right of the presentation
• At the end of each section, there will be time for Q&A
• There is a handout pod at the bottom of the screen
• Please complete follow-up surveys; they are vital to assessing the webinar quality
2

Today’s Presenters
3
Amy SchickNHTSA
George MerrittFHWA
Once you have completed this webinar, you will:
Goals of this Webinar
Have an overview of the Safety Performance Management requirements for State Departments of Transportation (DOTs), Metropolitan Planning Organizations (MPOs), State Highway Safety Offices (SHSOs) and the role of local partners in achieving compliance with the Safety Performance Management regulations.
To achieve the webinar goal, you will learn to:
Learning Outcomes
5
•Identify FHWA’s Safety Performance Management requirements.
List ways local partners can help achieve compliance with these requirements.
Identify the three critical roles locals play in crash reporting.
Identify behavioral highway Safety Performance Management Requirements for State Highway Safety Offices and their impacts for a local agency audience.
Identify FHWA’s Safety Performance Management requirements.
List ways local partners can help achieve compliance with these requirements.
Identify the three critical roles locals play in crash reporting.
Identify behavioral highway Safety Performance Management requirements for State Highway Safety Offices and their impacts for a local agency audience.
6
George Merritt, FHWA
Why was TPM Introduced?
• TPM is a key component of MAP-21 which established a performance and outcome based Federal –aid highway program
• TPM represents the opportunity to:o Prioritize needso Align resources for optimizing system performance in a
collaborative mannero Report outcomes
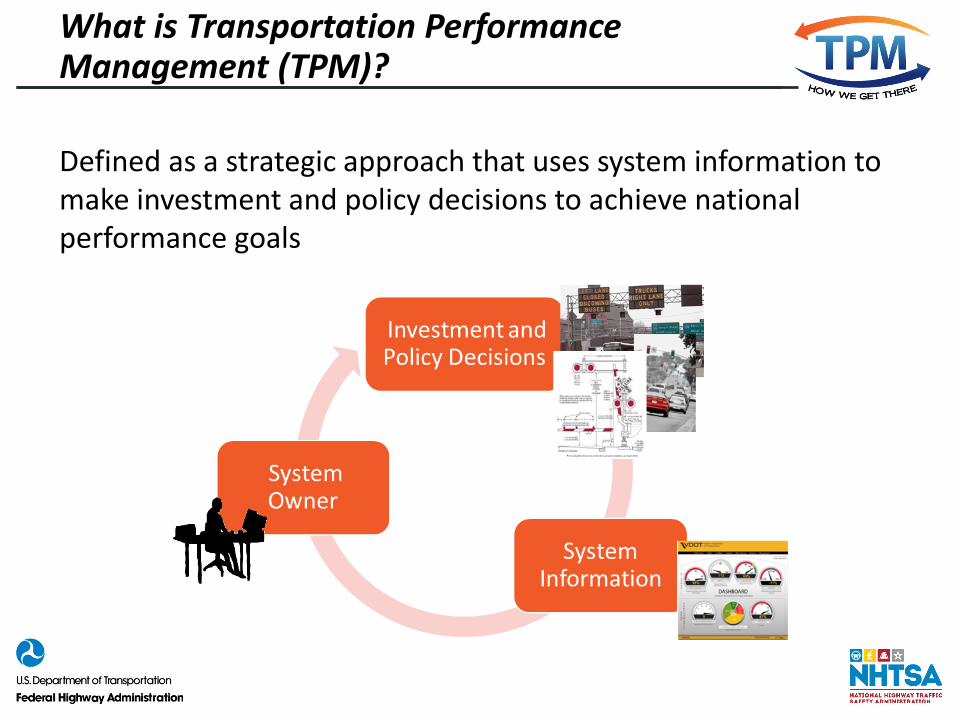
What is Transportation Performance Management (TPM)?
Defined as a strategic approach that uses system information to make investment and policy decisions to achieve national performance goals
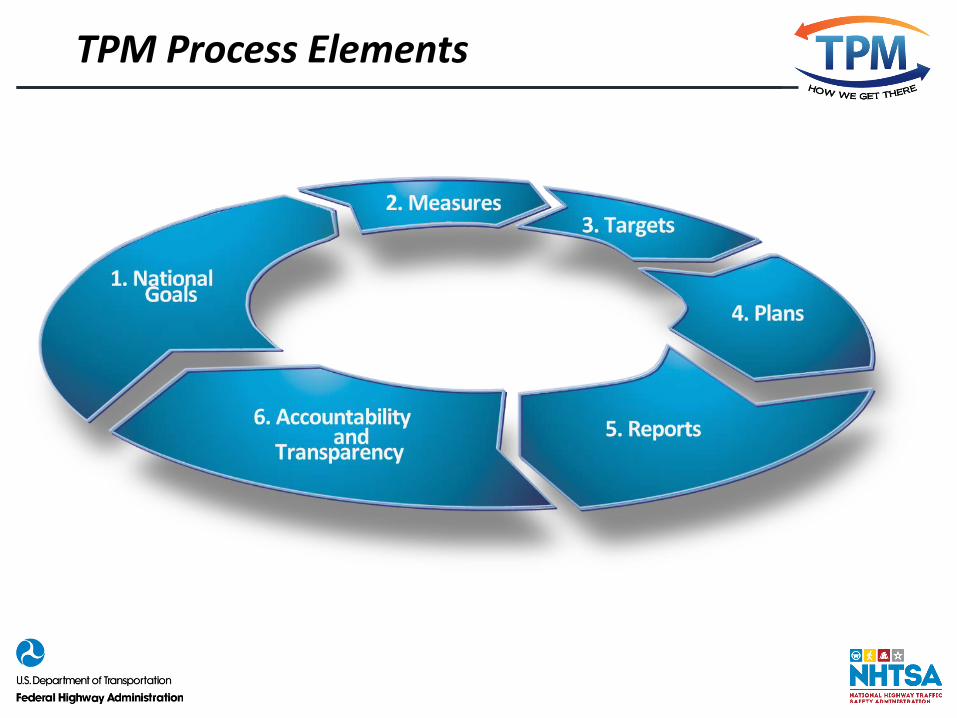
TPM Process Elements
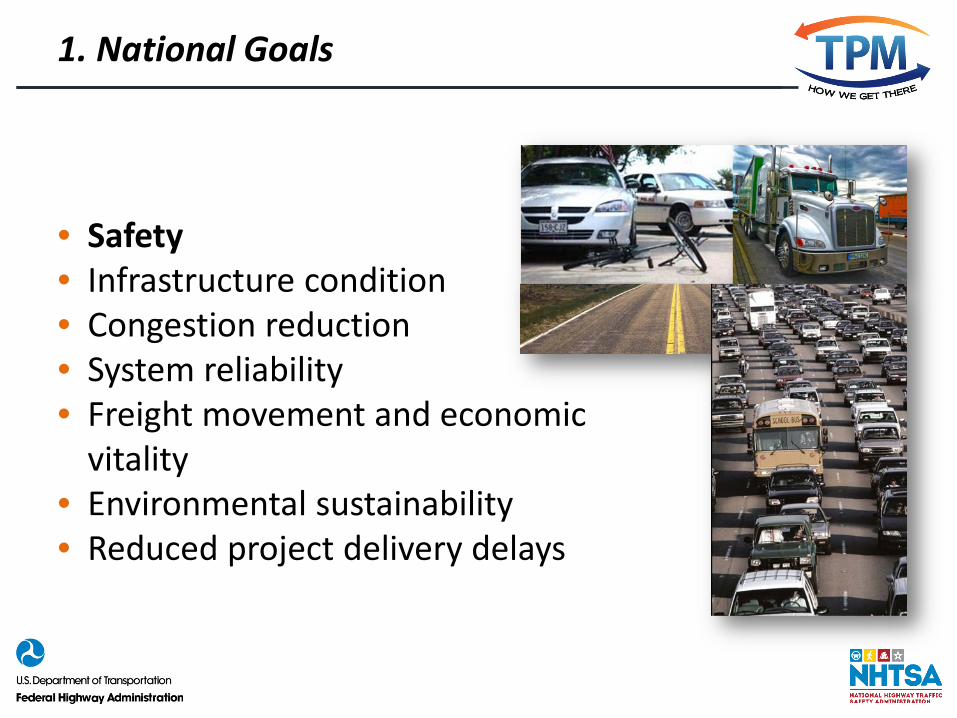
1. National Goals
• Safety• Infrastructure condition• Congestion reduction• System reliability• Freight movement and economic
vitality• Environmental sustainability• Reduced project delivery delays
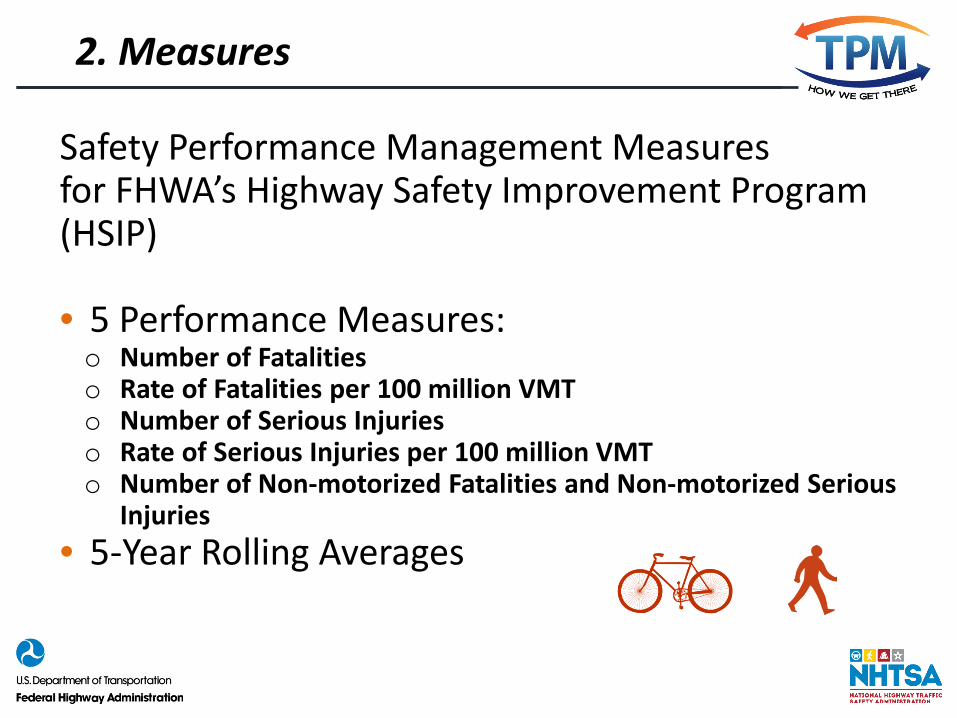
2. Measures
Safety Performance Management Measures for FHWA’s Highway Safety Improvement Program (HSIP)
• 5 Performance Measures:o Number of Fatalitieso Rate of Fatalities per 100 million VMTo Number of Serious Injurieso Rate of Serious Injuries per 100 million VMTo Number of Non-motorized Fatalities and Non-motorized Serious
Injuries• 5-Year Rolling Averages
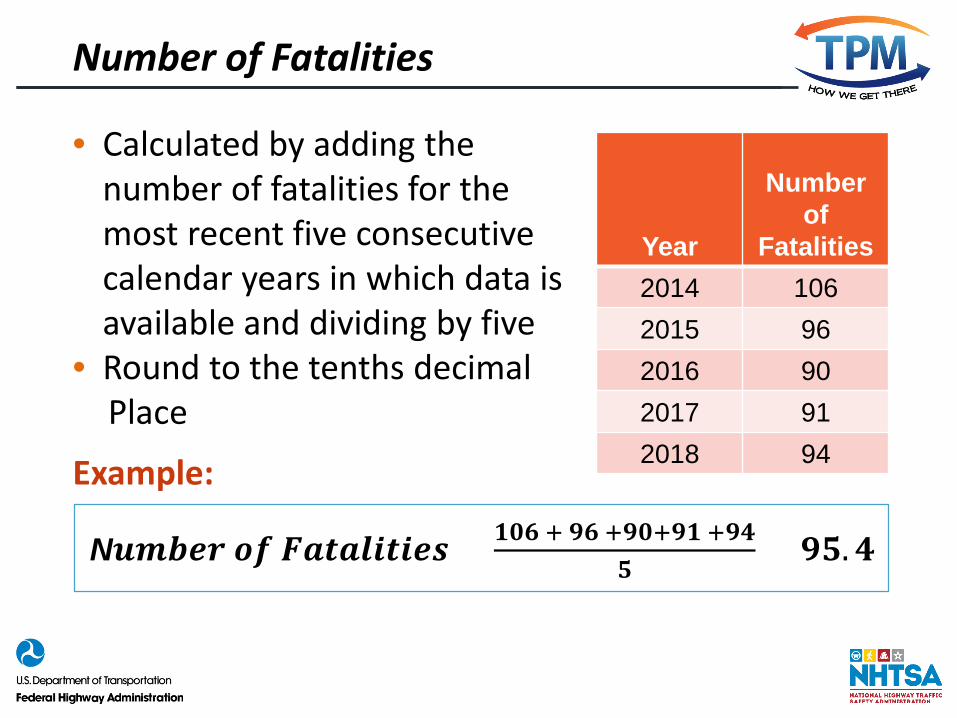
Number of Fatalities
• Calculated by adding the number of fatalities for the most recent five consecutive calendar years in which data is available and dividing by five
• Round to the tenths decimal Place
Example:
Year
Number of
Fatalities2014 1062015 962016 902017 912018 94
N𝒖𝒖𝒖𝒖𝒖𝒖𝒖𝒖𝒖𝒖 𝒐𝒐𝒐𝒐 𝑭𝑭𝑭𝑭𝑭𝑭𝑭𝑭𝑭𝑭𝑭𝑭𝑭𝑭𝑭𝑭𝒖𝒖𝑭𝑭 = 𝟏𝟏𝟏𝟏𝟏𝟏 + 𝟗𝟗𝟏𝟏 +𝟗𝟗𝟏𝟏+𝟗𝟗𝟏𝟏 +𝟗𝟗𝟗𝟗𝟓𝟓
= 𝟗𝟗𝟓𝟓.𝟗𝟗
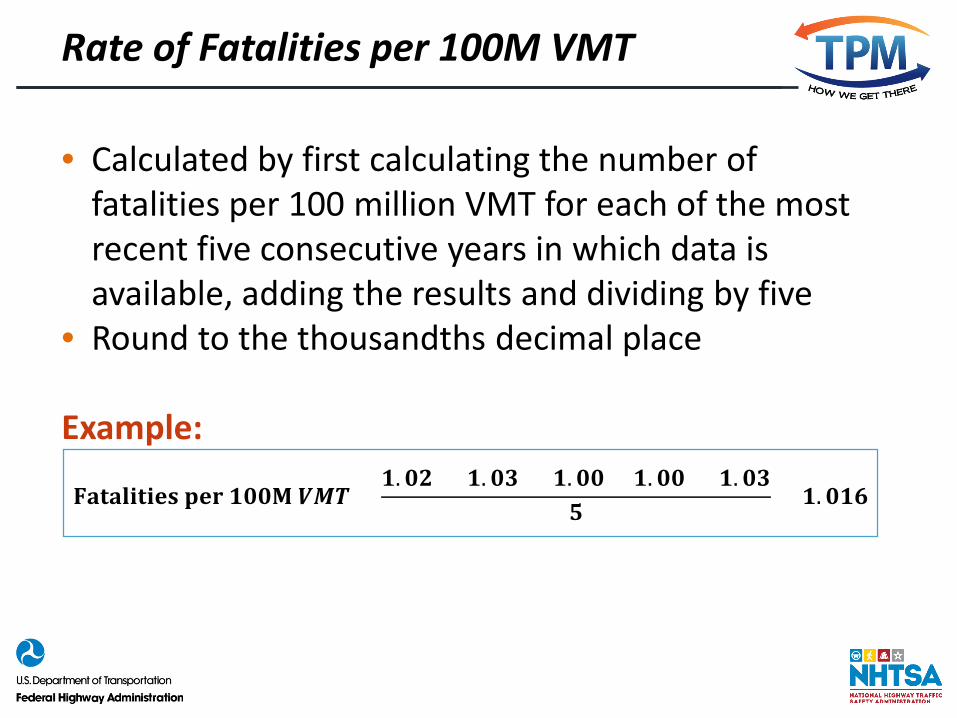
Rate of Fatalities per 100M VMT
• Calculated by first calculating the number of fatalities per 100 million VMT for each of the most recent five consecutive years in which data is available, adding the results and dividing by five
• Round to the thousandths decimal place
Example:
𝐅𝐅𝐚𝐚𝐚𝐚𝐚𝐚𝐚𝐚𝐚𝐚𝐚𝐚𝐚𝐚𝐚𝐚𝐚𝐚 𝐩𝐩𝐚𝐚𝐩𝐩 𝟏𝟏𝟏𝟏𝟏𝟏𝟏𝟏 𝑽𝑽𝑽𝑽𝑽𝑽 =𝟏𝟏.𝟏𝟏𝟎𝟎 + 𝟏𝟏.𝟏𝟏𝟎𝟎 + 𝟏𝟏.𝟏𝟏𝟏𝟏 + 𝟏𝟏.𝟏𝟏𝟏𝟏 + 𝟏𝟏.𝟏𝟏𝟎𝟎
𝟓𝟓 = 𝟏𝟏.𝟏𝟏𝟏𝟏𝟏𝟏
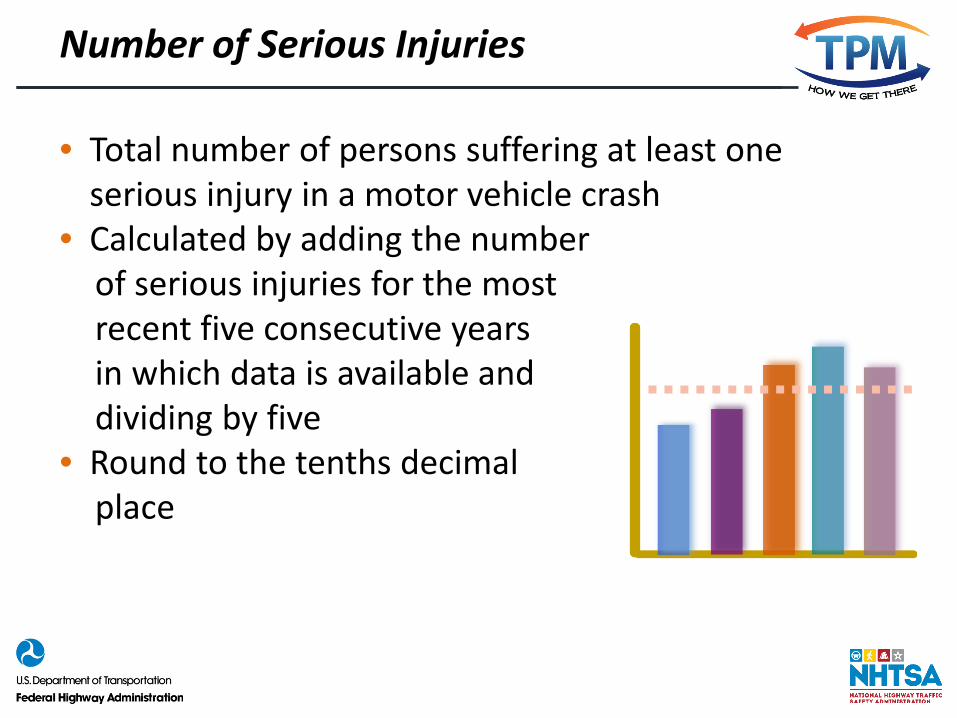
Number of Serious Injuries
• Total number of persons suffering at least one serious injury in a motor vehicle crash
• Calculated by adding the number of serious injuries for the most recent five consecutive years in which data is available and dividing by five
• Round to the tenths decimal place
Rate of Serious Injuries
• Serious injuries per 100 million VMT• Calculated by first calculating the number of
serious injuries per 100 million VMT for each of the most recent five consecutive years in which data is available, adding the results and dividing by five
• Round to the thousandths decimal place
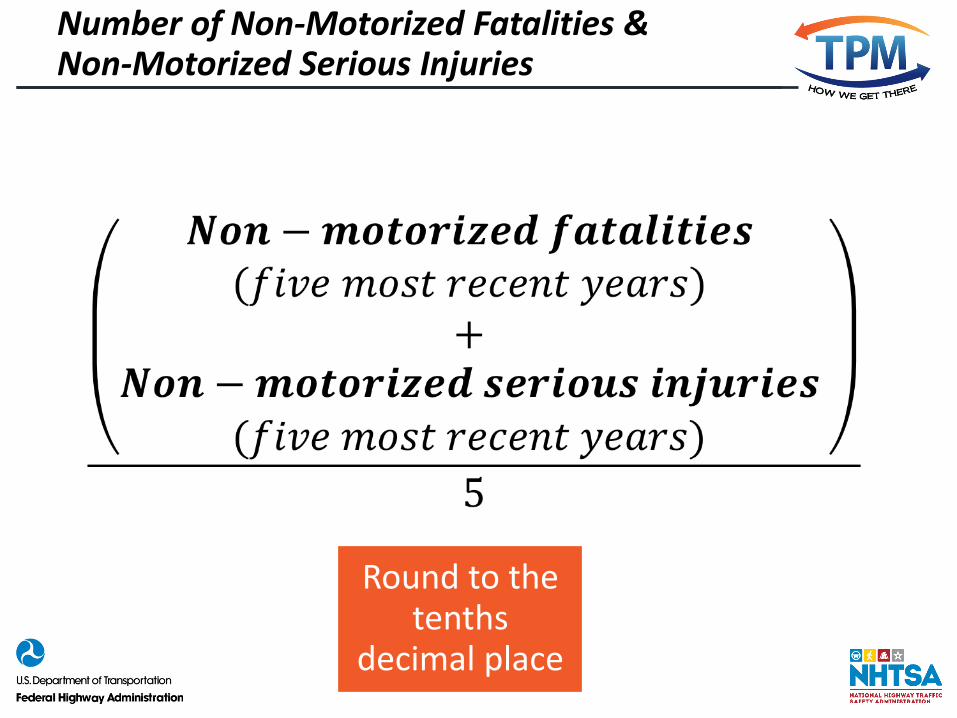
Number of Non-Motorized Fatalities & Non-Motorized Serious Injuries
Round to the tenths
decimal place
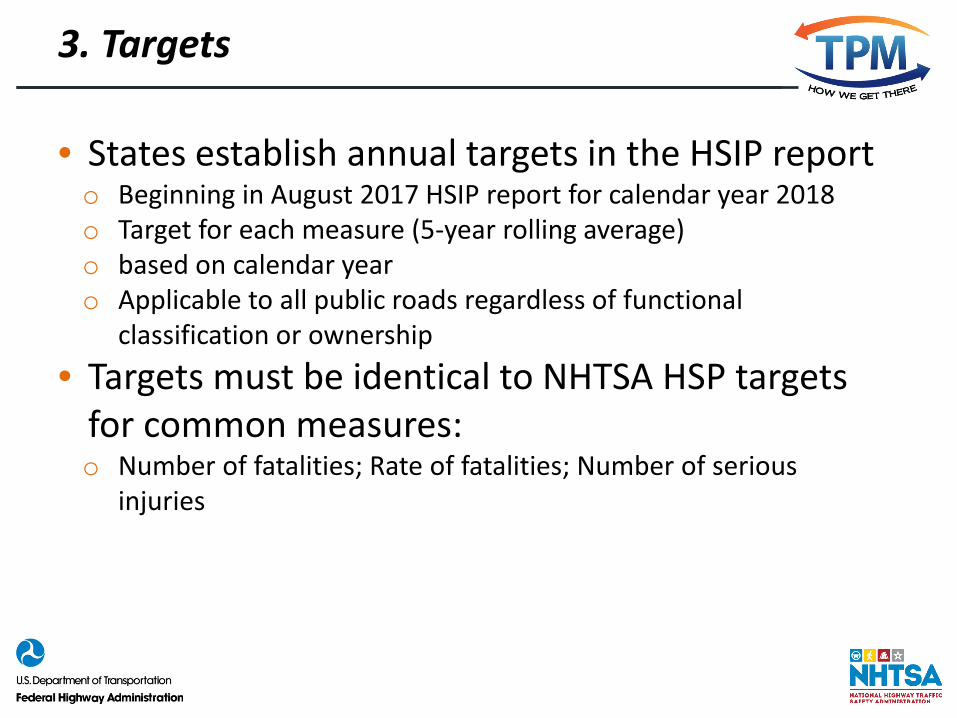
3. Targets
• States establish annual targets in the HSIP reporto Beginning in August 2017 HSIP report for calendar year 2018o Target for each measure (5-year rolling average)o based on calendar yearo Applicable to all public roads regardless of functional
classification or ownership• Targets must be identical to NHTSA HSP targets
for common measures:o Number of fatalities; Rate of fatalities; Number of serious
injuries
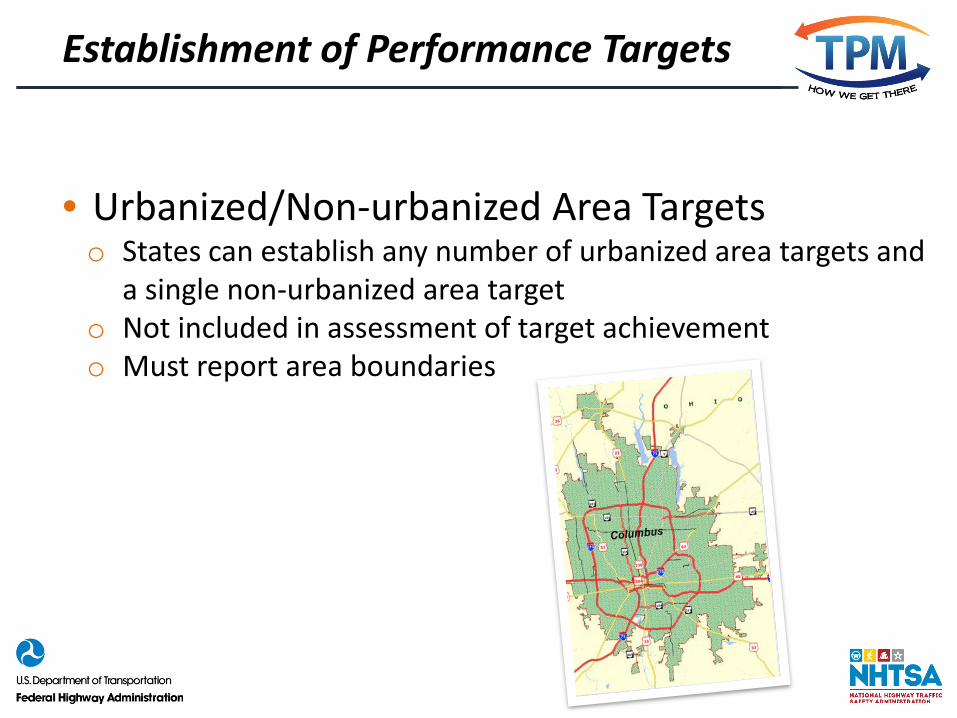
Establishment of Performance Targets
• Urbanized/Non-urbanized Area Targetso States can establish any number of urbanized area targets and
a single non-urbanized area targeto Not included in assessment of target achievemento Must report area boundaries
MPO Targets
• MPOs establish targets 180 days after Stateo Target for each measure required
• Two options to establish targetso MPOs can agree to support the State DOT target; ORo MPOs can establish a numerical target specific to the MPO
planning area• Targets are applicable to all public roads in the
MPO• Report the VMT estimate used for rate targets
and the methodology used to develop the estimate
Identical Targets
• State HSP performance targets must be identical to the State DOT targets for common performance measures, as coordinated through the State Strategic Highway Safety Plan
Number of FatalitiesFatality Rate
Number of Serious Injuries
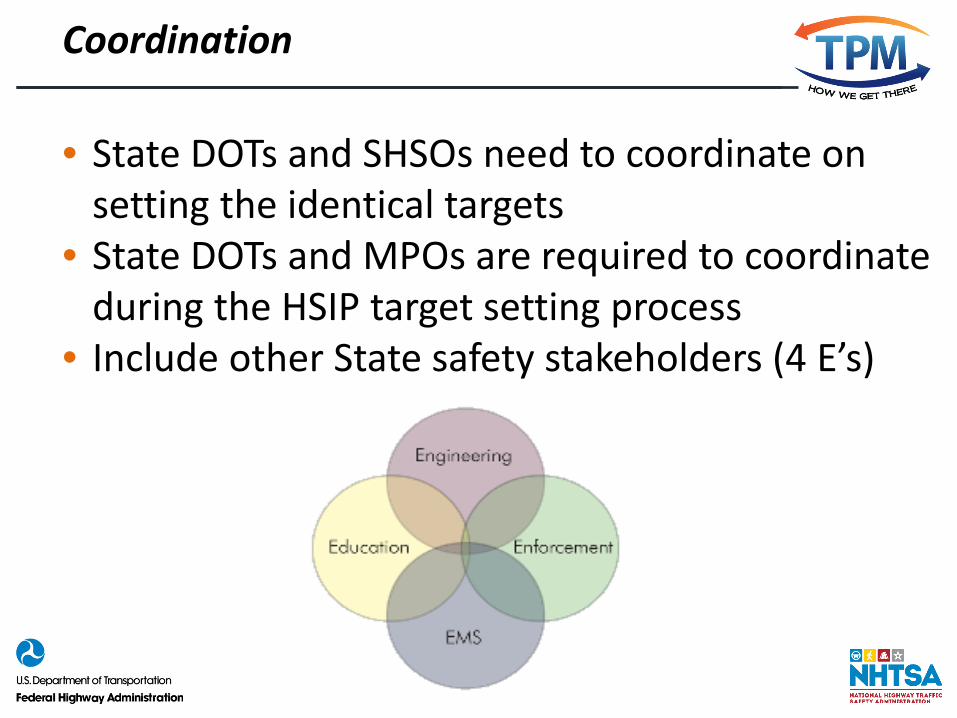
Coordination
• State DOTs and SHSOs need to coordinate on setting the identical targets
• State DOTs and MPOs are required to coordinate during the HSIP target setting process
• Include other State safety stakeholders (4 E’s)
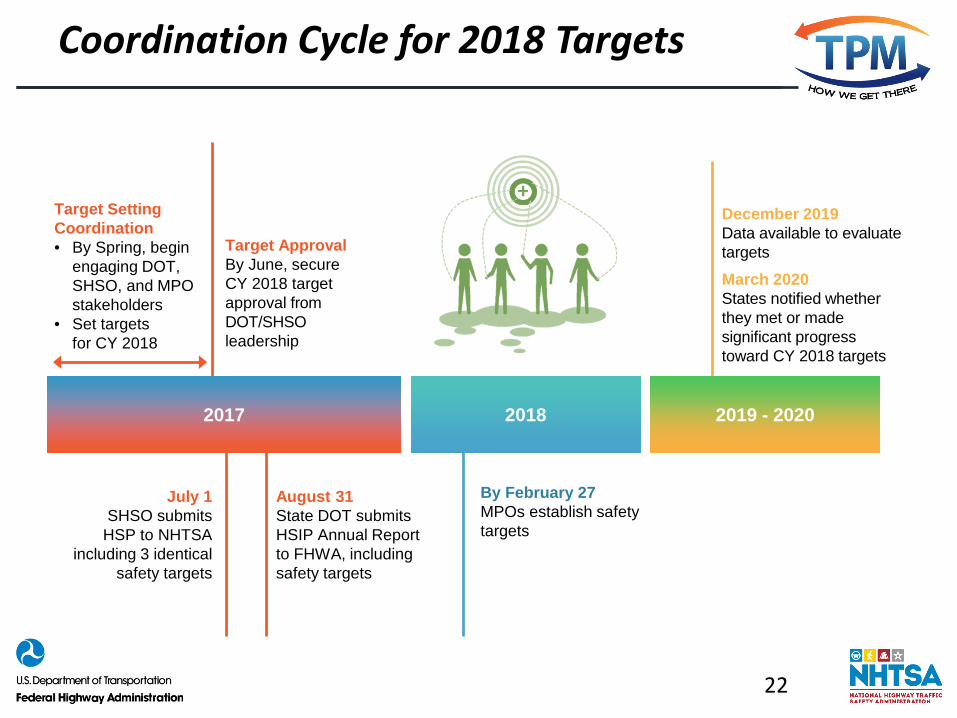
Coordination Cycle for 2018 Targets
22
2017 2018 2019 - 2020
July 1SHSO submits
HSP to NHTSA including 3 identical
safety targets
Target Setting Coordination• By Spring, begin
engaging DOT, SHSO, and MPO stakeholders
• Set targets for CY 2018
August 31State DOT submits HSIP Annual Report to FHWA, including safety targets
Target ApprovalBy June, secure CY 2018 target approval from DOT/SHSO leadership
By February 27MPOs establish safety targets
December 2019Data available to evaluate targets
March 2020States notified whether they met or made significant progress toward CY 2018 targets
Forums for Coordination
• Strategic Highway Safety Plan (SHSP) Collaboration Structures o Technical Committeeo Leadership Committee
• Performance-Based Planning and Programming (PBPP) Collaboration Structures
• Highway Safety Plan Development Structures
• Traffic Safety Summits
23
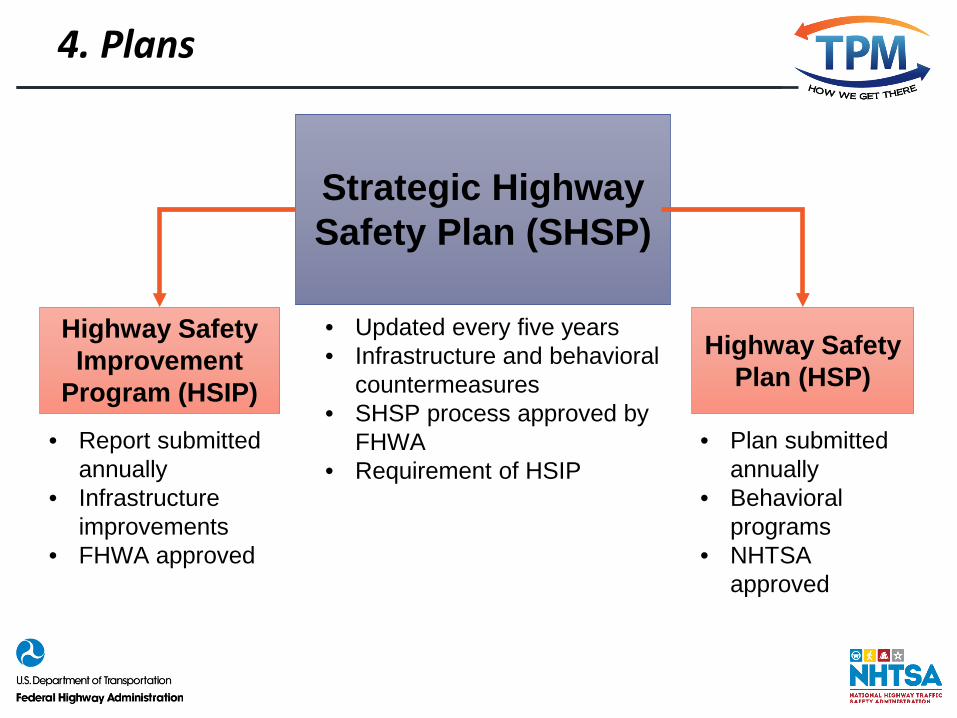
4. Plans
Strategic Highway Safety Plan (SHSP)
Highway Safety Plan (HSP)
Highway Safety Improvement
Program (HSIP)
• Updated every five years• Infrastructure and behavioral
countermeasures• SHSP process approved by
FHWA• Requirement of HSIP
• Plan submitted annually
• Behavioral programs
• NHTSA approved
• Report submitted annually
• Infrastructure improvements
• FHWA approved
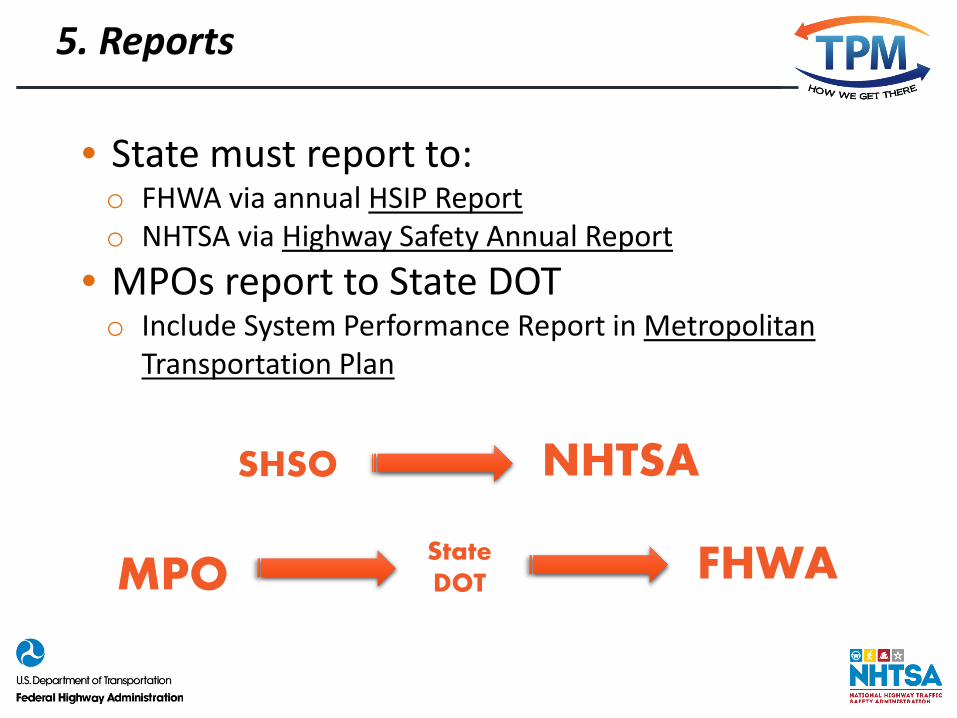
5. Reports
• State must report to:o FHWA via annual HSIP Reporto NHTSA via Highway Safety Annual Report
• MPOs report to State DOTo Include System Performance Report in Metropolitan
Transportation Plan
NHTSASHSO
MPO FHWAState DOT
Reporting Targets for HSIP
• Overview of general highway safety trends• Document safety performance targets
established and• Reasons for differences in actual outcomes
and targets
Reporting MPO Targets
• Reported to State DOT• System Performance Report in Metropolitan
Transportation Plan (MTP)
Transportation Plans
Update on or After May 27, 2018
• Long Range Statewide Transportation Plans and Metropolitan Transportation Plans (MTPs) must include safety performance measures and targets
• Statewide Transportation Improvement Programs(STIPs) and Transportation Improvement Programs (TIPs) must include a description of how the STIP & TIP contributes to achieving the targets in the LRSTP & MTP
6. Accountability and Transparency
• FHWA will assess whether a State met or made significant progress toward achieving targets
• Improve visibility and transparency of State fatal and serious injury data
• Better understanding of Federal transportation investment needs
• FHWA’s new public website will display safety targets and results
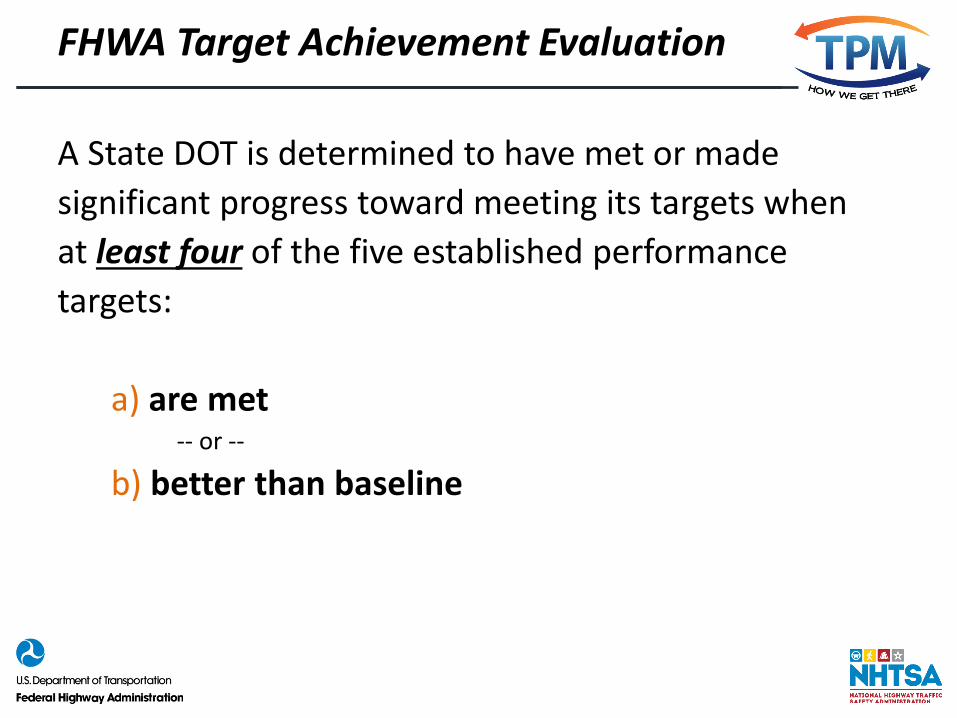
FHWA Target Achievement Evaluation
A State DOT is determined to have met or made significant progress toward meeting its targets when at least four of the five established performance targets:
a) are met -- or --
b) better than baseline
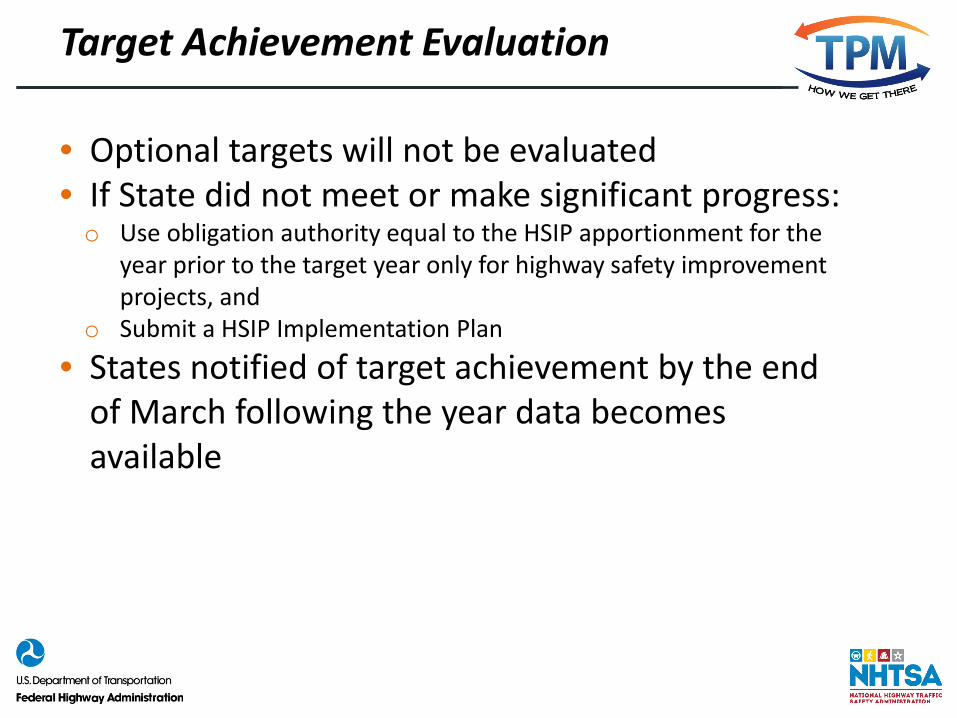
Target Achievement Evaluation
• Optional targets will not be evaluated• If State did not meet or make significant progress:o Use obligation authority equal to the HSIP apportionment for the
year prior to the target year only for highway safety improvement projects, and
o Submit a HSIP Implementation Plan• States notified of target achievement by the end
of March following the year data becomes available
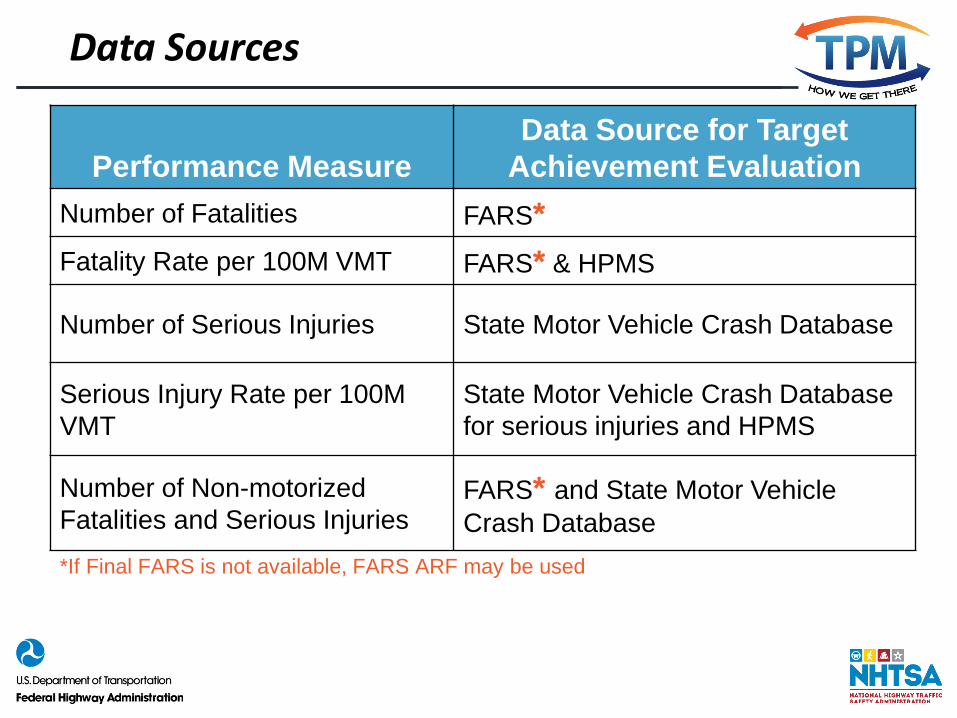
Performance MeasureData Source for Target
Achievement EvaluationNumber of Fatalities FARS*Fatality Rate per 100M VMT FARS* & HPMS
Number of Serious Injuries State Motor Vehicle Crash Database
Serious Injury Rate per 100M VMT
State Motor Vehicle Crash Databasefor serious injuries and HPMS
Number of Non-motorized Fatalities and Serious Injuries
FARS* and State Motor Vehicle Crash Database
Data Sources
*If Final FARS is not available, FARS ARF may be used
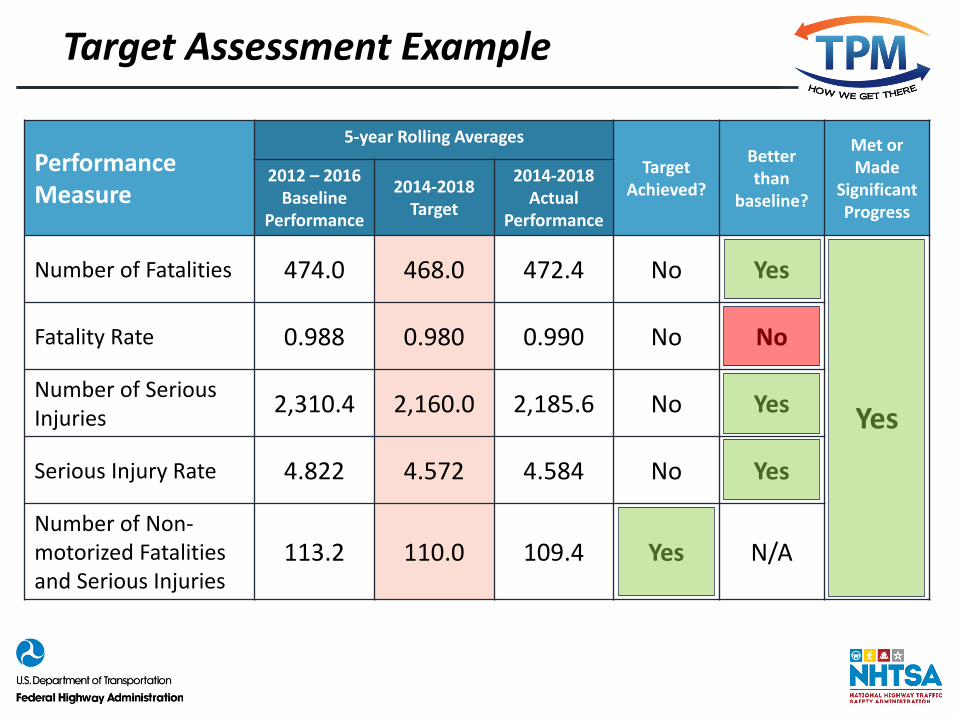
Target Assessment Example
Performance Measure
5-year Rolling Averages
Target Achieved?
Better than
baseline?
Met or Made
Significant Progress
2012 – 2016 Baseline
Performance
2014-2018 Target
2014-2018Actual
Performance
Number of Fatalities 474.0 468.0 472.4 No Yes
Yes
Fatality Rate 0.988 0.980 0.990 No No
Number of Serious Injuries 2,310.4 2,160.0 2,185.6 No Yes
Serious Injury Rate 4.822 4.572 4.584 No Yes
Number of Non-motorized Fatalities and Serious Injuries
113.2 110.0 109.4 Yes N/A
MPO Target Achievement Evaluation
• Transportation Management Area (TMA) Planning Certification
• Federal Planning Findings
HSP Assessment/Accountability
• SHSOs submit an annual report to NHTSA 90-days after the end of the Federal fiscal yearo The annual report provides an assessment of the State’s
progress in achieving performance targets identified in the previous HSPs and a description of how the projects funded under the prior year HSP contributed to meeting the State’s highway safety performance targets

Directing Your Questions via the Chat Pod
1. Chat pod is on left side of screen between attendees pod & closed
caption pod
2. Type your question or
comment here
3. Answers will appear here unless addressed
verbally
Identify FHWA’s Safety Performance Management requirements.
List ways local partners can help achieve compliance with these requirements.
Identify the three critical roles locals play in crash reporting.
Identify behavioral highway Safety Performance Management requirements for State Highway Safety Offices and their impacts for a local agency audience.
37
George Merritt, FHWA
What Can Local Agencies Do?
• States are held accountable for safety performance on all roads open to public travel
• Contribute to the overall safety performance target achievemento Be familiar with statewide and local safety problems,
strategies, and targetso Seek training and info on things like: Low cost safety improvements Systemic safety improvements Roundabouts etc.
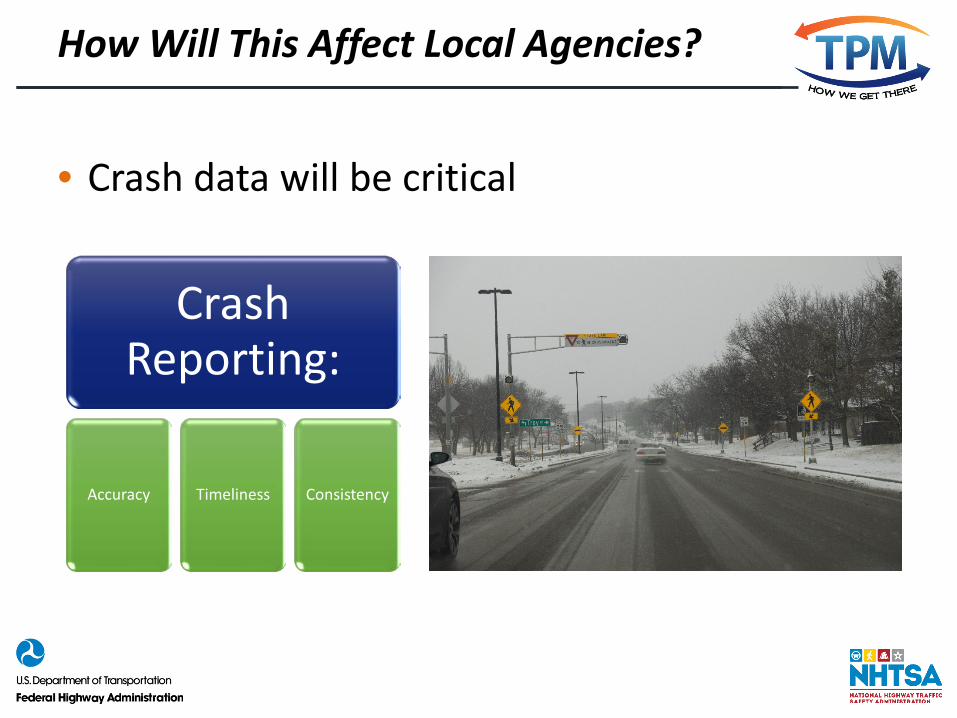
How Will This Affect Local Agencies?
• Crash data will be critical
Crash Reporting:
Accuracy Timeliness Consistency
Safety PM Resources
• Target Settingo Methodology Reports, Peer Exchange, Noteworthy Practiceso Target Setting Coordination Workshops & Report
• Fact Sheets o Safety Performance Measures o Significant Progresso MPOo Timelineo FAQs
• Guidanceo MPO VMT Technical Guidanceo Serious Injury Conversion Tables
FHWA’s Safety PM website: http://safety.fhwa.dot.gov/hsip/spm/
Additional Training Available:
• NHI-138006 Transportation Performance Management for Safety o This course walks participants through various provisions of the
Safety Performance Measures Final Rule and provides options for setting evidence based targets
41
www.nhi.fhwa.dot.gov
For More Information
• Safety Performance Management http://safety.fhwa.dot.gov/hsip/spm/
• Highway Safety Improvement Programhttp://safety.fhwa.dot.gov/hsip/
• Highway Safety Planwww.nhtsa.gov/About+NHTSA/Highway+Safety+Grant+Programs
• FHWA Transportation Performance Management www.fhwa.dot.gov/TPM/

Directing Your Questions via the Chat Pod
1. Chat pod is on left side of screen between attendees pod & closed
caption pod
2. Type your question or
comment here
3. Answers will appear here unless addressed
verbally
Identify FHWA’s Safety Performance Management requirements.
List ways local partners can help achieve compliance with these requirements.
Identify the three critical roles locals play in crash reporting.
Identify behavioral highway Safety Performance Management requirements for State Highway Safety Offices and their impacts for a local agency audience.
44
Amy Schick, NHTSA
Over view
• About NHTSA
• Crash data overview
• State highway safety programs & planning processes
• Behavioral highway Safety Performance Management requirements for State Highway Safety Offices (SHSOs)– Impacts for local agency audiences
• NHTSA grant funding
• Stakeholder involvement & coordination
45
National Highway Traffic Safety Administration
• The National Highway Traffic Safety Administration (NHTSA) is responsible for keeping people safe on America’s roadways
• Through enforcing vehicle standards and partnerships with State and local governments, NHTSA’S mission is to reduce deaths, injuries and economic losses from motor vehicle crashes
46
On the Road to Zero…
• In 2016, NHTSA moved forward in our three lanes on the Road to Zero to save lives across America:
– Proactive Vehicle Safety
– Advanced Safety Technologies
– Addressing Human Factors
See: https://one.nhtsa.gov/nhtsa/accomplishments/2016/
47
12351b_051616_v1
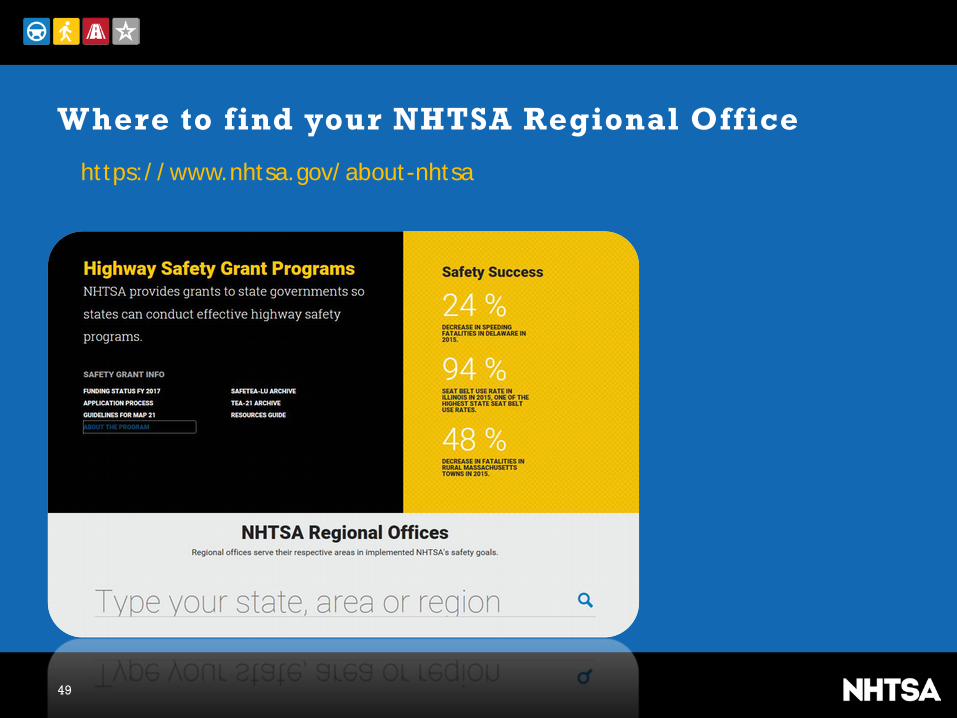
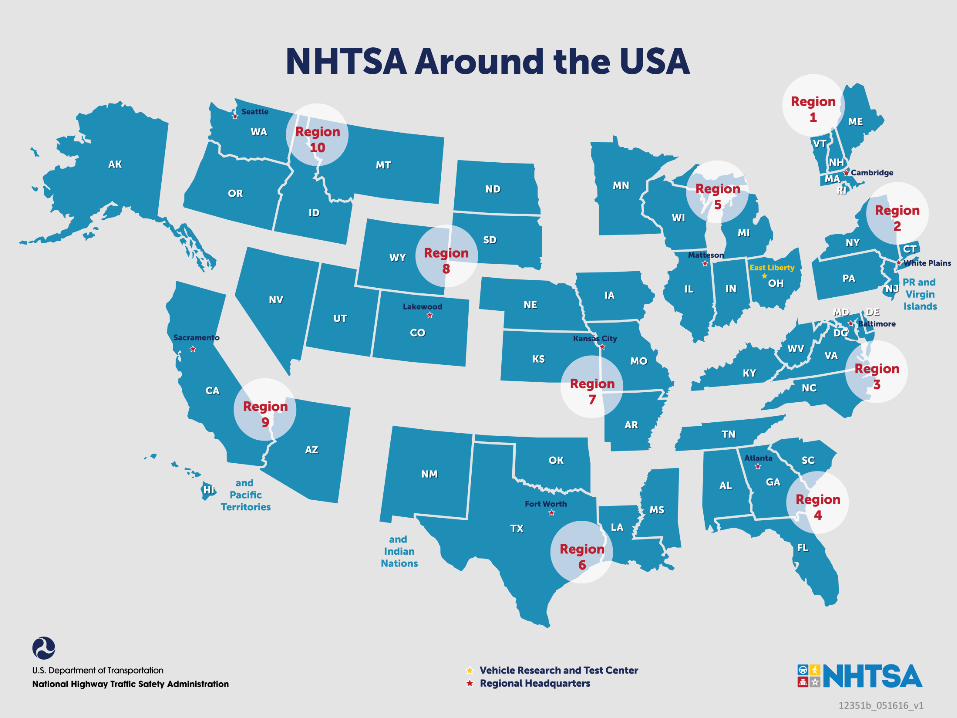
Where to find your NHTSA Regional Office
https://www.nhtsa.gov/about-nhtsa
49
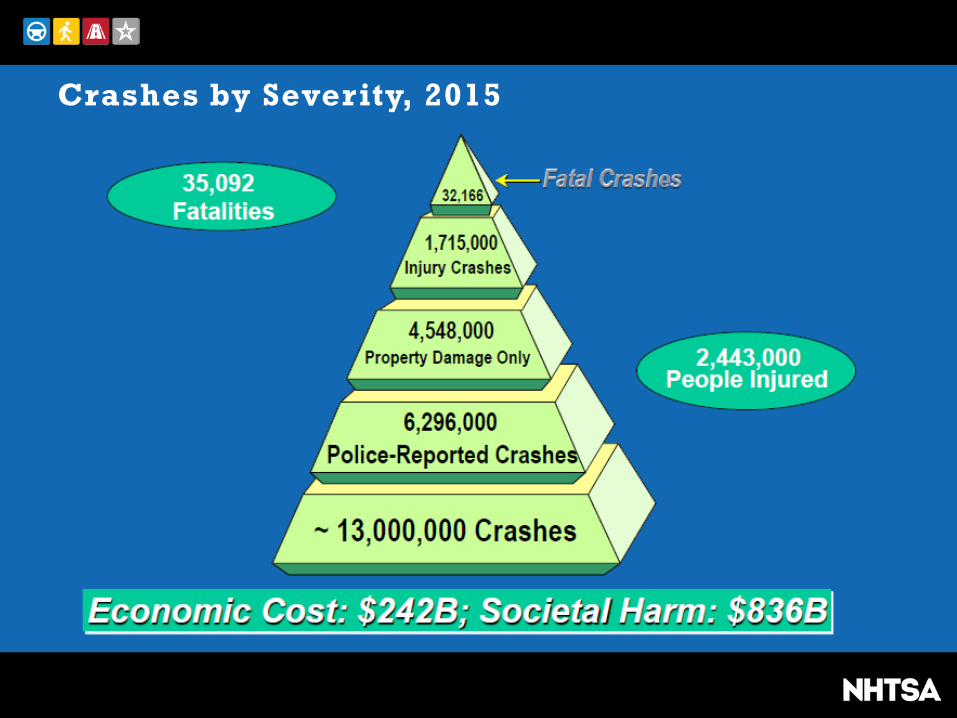
Crashes by Severity, 2015
50
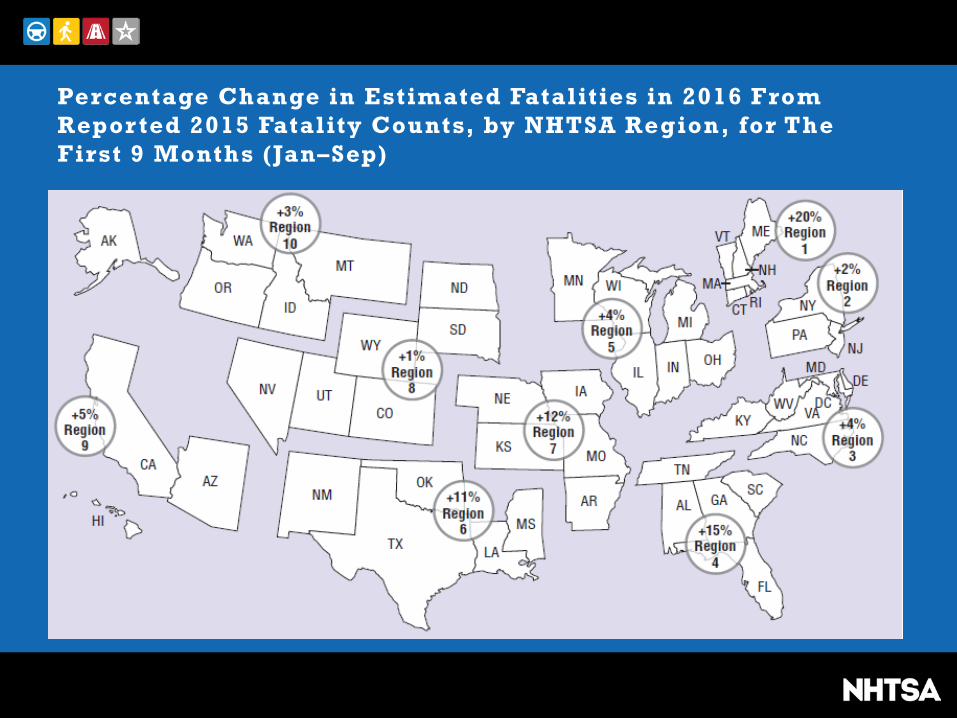
Percentage Change in Estimated Fatalities in 2016 From Repor ted 2015 Fatality Counts, by NHTSA Region, for The First 9 Months (Jan–Sep)
51
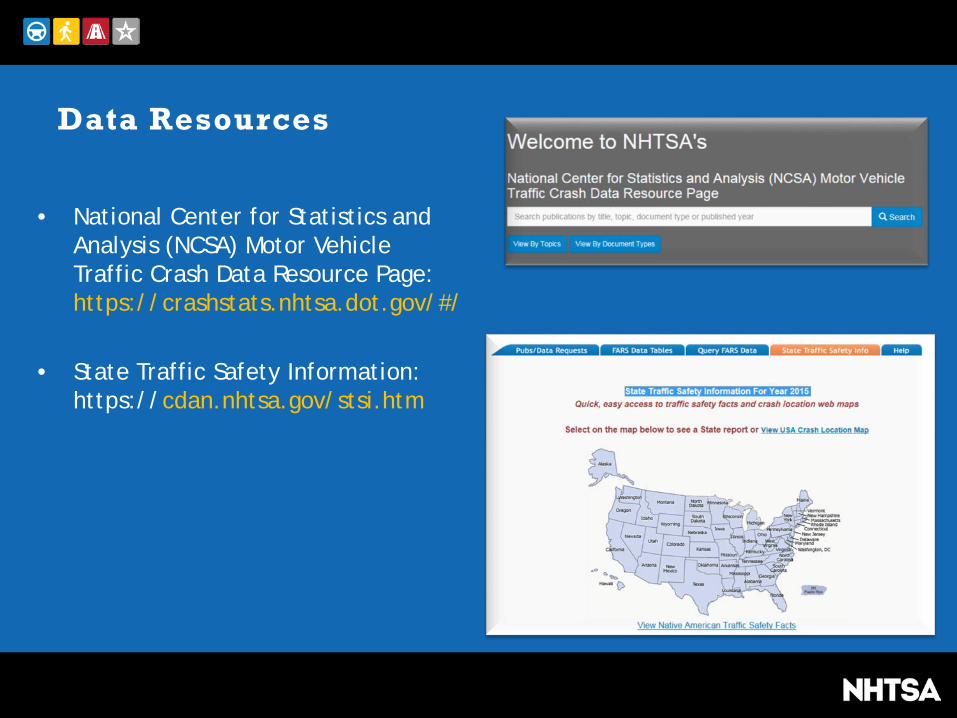
Data Resources
• National Center for Statistics and Analysis (NCSA) Motor Vehicle Traffic Crash Data Resource Page: https://crashstats.nhtsa.dot.gov/#/
• State Traffic Safety Information: https://cdan.nhtsa.gov/stsi.htm
52
State Highway Safety Programs
• All States have a highway safety program designed to reduce traffic crashes and deaths, injuries and property damage
• A State Governor, through an appointed Governor’s Representative (GR) for highway safety, is responsible administering the behavioral highway safety program through the State Highway Safety Office (SHSO)
• Each year, SHSOs conduct extensive planning, beginning with comprehensive problem identification and ending with resource allocations
53
54
55
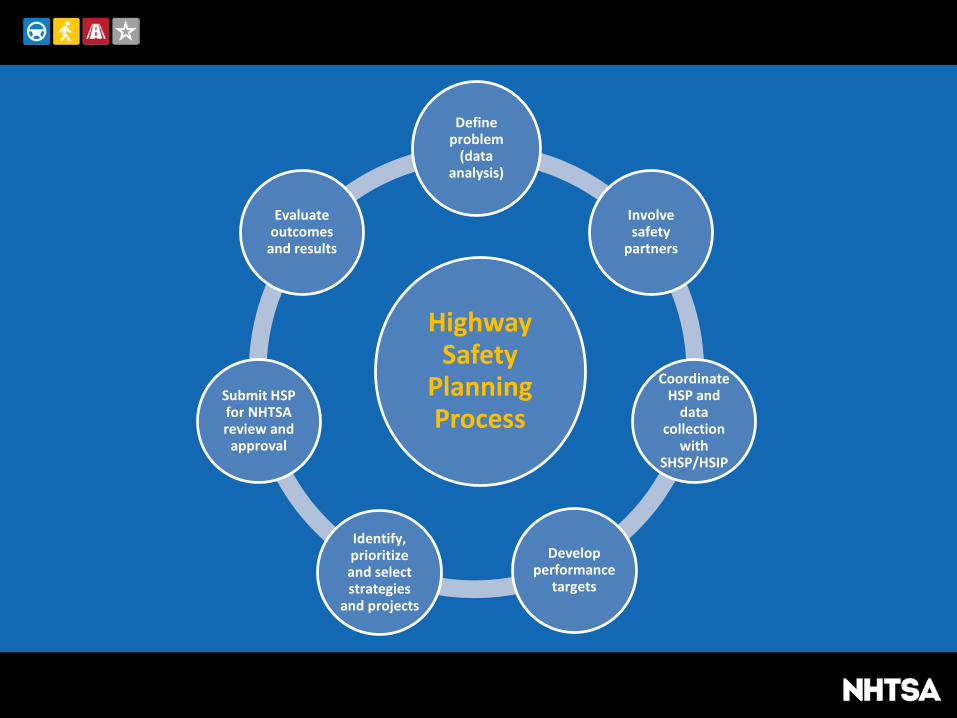
Highway Safety
Planning Process
Define problem
(data analysis)
Involve safety
partners
Coordinate HSP and
data collection
with SHSP/HSIP
Develop performance
targets
Identify, prioritize and select strategies
and projects
Submit HSP for NHTSA review and
approval
Evaluate outcomes
and results
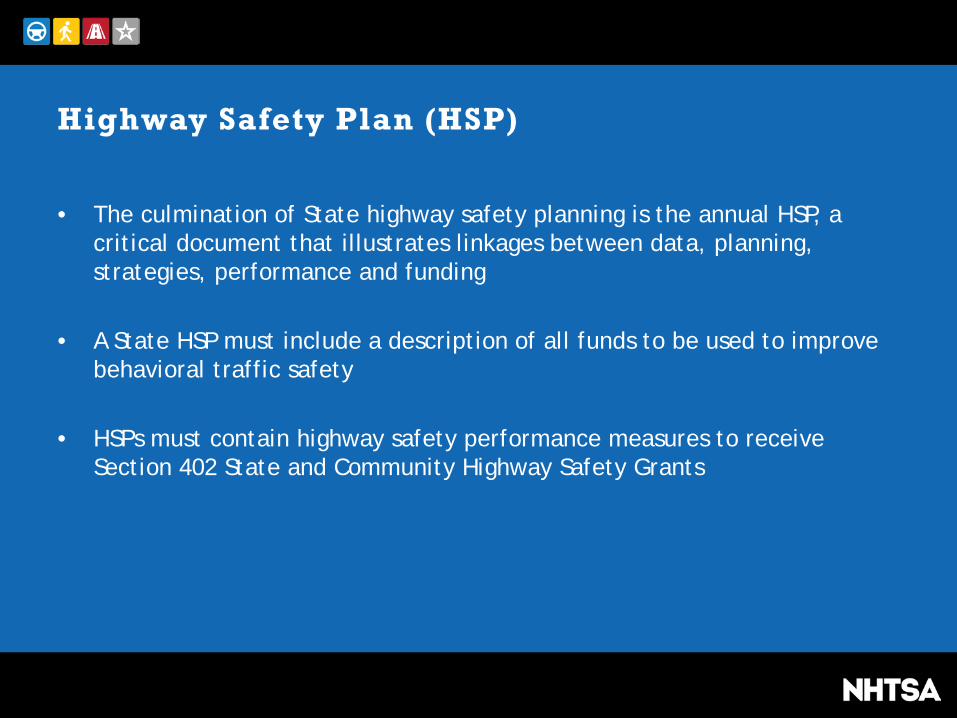
Highway Safety Plan (HSP)
• The culmination of State highway safety planning is the annual HSP, a critical document that illustrates linkages between data, planning, strategies, performance and funding
• A State HSP must include a description of all funds to be used to improve behavioral traffic safety
• HSPs must contain highway safety performance measures to receive Section 402 State and Community Highway Safety Grants
56
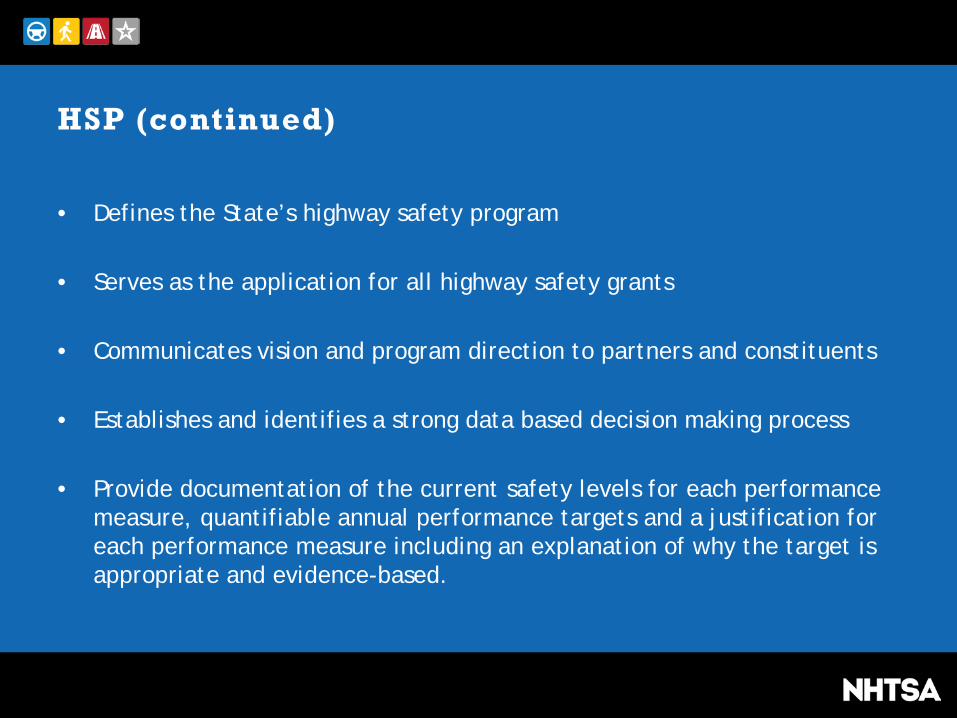
HSP (continued)
• Defines the State’s highway safety program
• Serves as the application for all highway safety grants
• Communicates vision and program direction to partners and constituents
• Establishes and identifies a strong data based decision making process
• Provide documentation of the current safety levels for each performance measure, quantifiable annual performance targets and a justification for each performance measure including an explanation of why the target is appropriate and evidence-based.
57
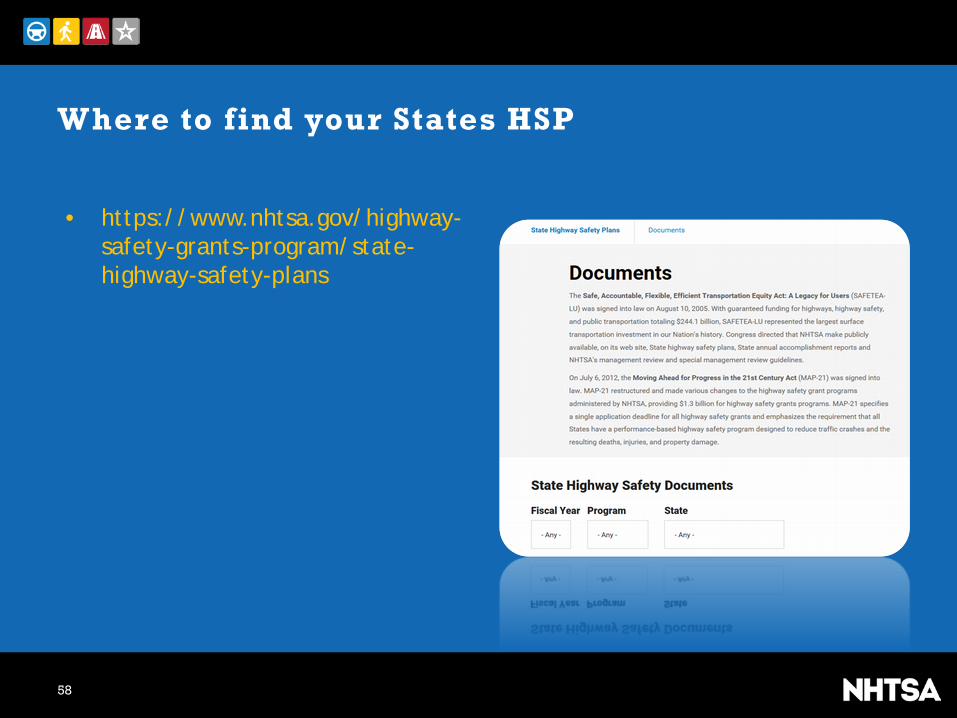
Where to find your States HSP
58
• https://www.nhtsa.gov/highway-safety-grants-program/state-highway-safety-plans
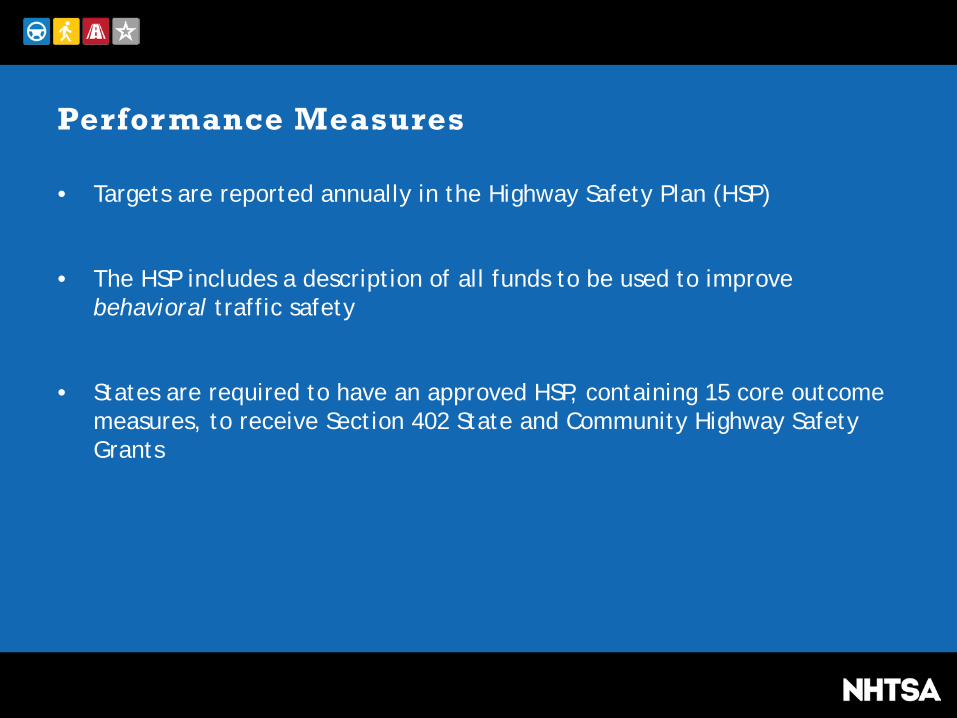
Performance Measures
• Targets are reported annually in the Highway Safety Plan (HSP)
• The HSP includes a description of all funds to be used to improve behavioral traffic safety
• States are required to have an approved HSP, containing 15 core outcome measures, to receive Section 402 State and Community Highway Safety Grants
59
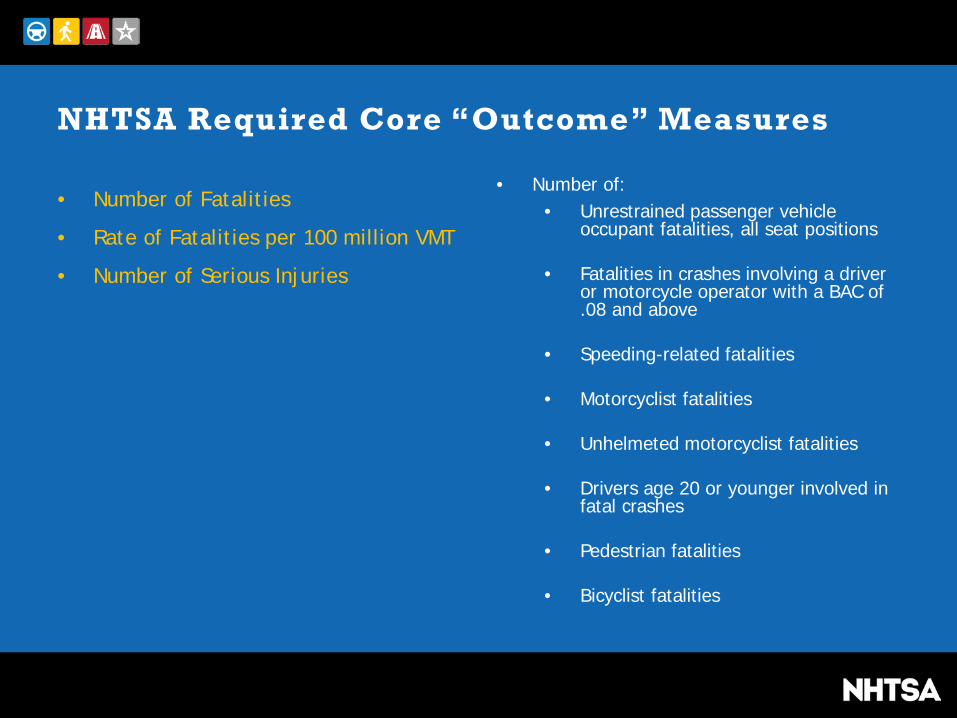
NHTSA Required Core “Outcome” Measures
• Number of Fatalities
• Rate of Fatalities per 100 million VMT
• Number of Serious Injuries
• Number of:• Unrestrained passenger vehicle
occupant fatalities, all seat positions
• Fatalities in crashes involving a driver or motorcycle operator with a BAC of .08 and above
• Speeding-related fatalities
• Motorcyclist fatalities
• Unhelmeted motorcyclist fatalities
• Drivers age 20 or younger involved in fatal crashes
• Pedestrian fatalities
• Bicyclist fatalities
60
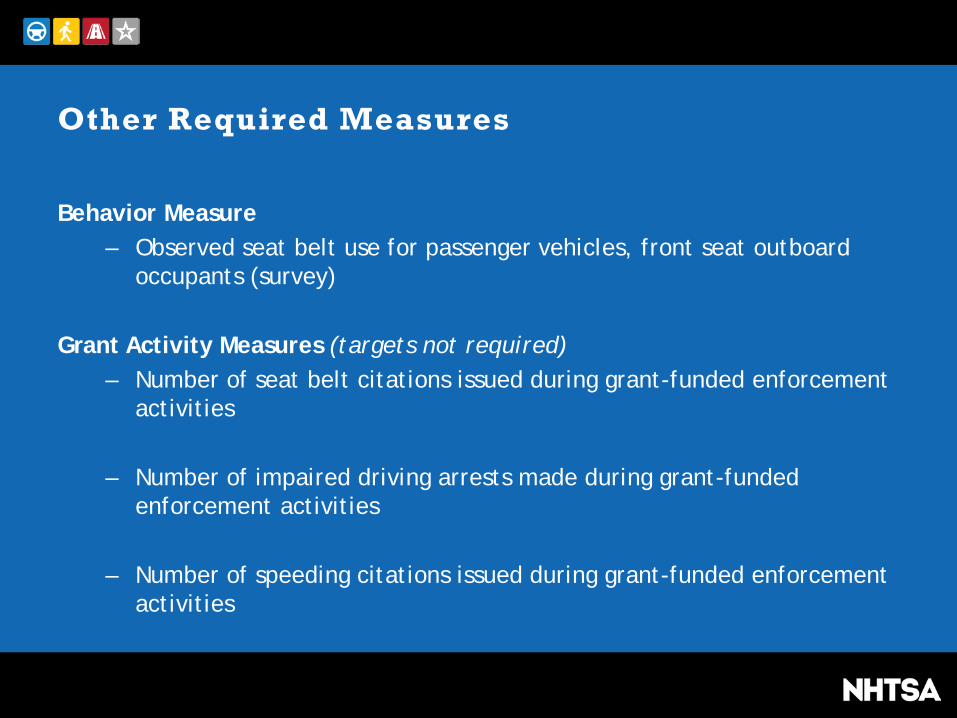
Other Required Measures
Behavior Measure– Observed seat belt use for passenger vehicles, front seat outboard
occupants (survey)
Grant Activity Measures (targets not required)– Number of seat belt citations issued during grant-funded enforcement
activities
– Number of impaired driving arrests made during grant-funded enforcement activities
– Number of speeding citations issued during grant-funded enforcement activities
61
Setting Safety Targets
• Prior to setting highway safety targets, States begin by documenting currently known safety levels (baseline)
• This serves as points of reference by which States measure progress
– States have the flexibility and discretion to select baseline periods that are most appropriate for them
*Note: Baselines submitted in the HSP are not the same as the official baselines used for FHWA target assessment
62
Setting Safety Targets
• State targets must be data-driven
• Evidence-based targets are established in part from trend analysis, anticipated levels of effort and situational factors such as economic conditions, demographics, vehicle miles traveled, legislative changes and other factors
• This information guides States to focus on areas likely to have meaningful impacts on highway safety
• Performance measures guide investments in programs to achieve State goals
63
Additional Performance Measures
• The minimum set of performance measures developed by NHTSA and the Governors Highway Safety Association (GHSA) addresses core highway safety areas, but not all of the possible highway safety problem areas
• NHTSA works with States to develop supplemental measurements of performance for emerging highway safety areas such as drugged and distracted driving.
64
NHTSA Performance Measure Requirements
• Performance measures must include…
– Documentation of current safety levels;– Quantifiable performance targets; and– Justification for each target that explains how the target is data-
driven, including a discussion of the factors that influenced the performance target selection
• The process for selecting countermeasure strategies and projects should allow the State to meet its targets
65
SHSO & DOT Identical Targets
• NHTSA and FHWA collaborated to harmonize common performance measures (fatalities, fatality rate, and serious injuries) to ensure the highway safety community is provided uniform measures of progress
• Performance targets for the three common performance measures be identical to the State DOT targets reported in the Highway Safety Improvement Program (HSIP) annual report, as coordinated through the SHSP
66
NHTSA Grant Funding§ 402 State and Community Highway Safety Grant Program
67
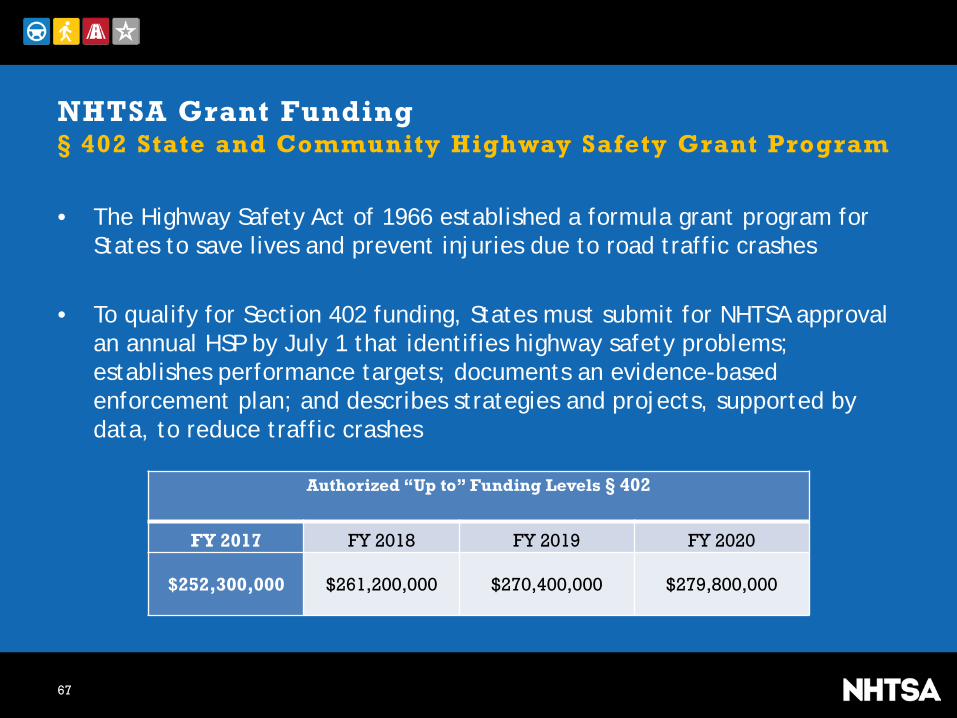
• The Highway Safety Act of 1966 established a formula grant program for States to save lives and prevent injuries due to road traffic crashes
• To qualify for Section 402 funding, States must submit for NHTSA approval an annual HSP by July 1 that identifies highway safety problems; establishes performance targets; documents an evidence-based enforcement plan; and describes strategies and projects, supported by data, to reduce traffic crashes
Authorized “Up to” Funding Levels § 402
FY 2017 FY 2018 FY 2019 FY 2020
$252,300,000 $261,200,000 $270,400,000 $279,800,000
NHTSA Grant Funding§ 405 National Priority Safety Programs
68
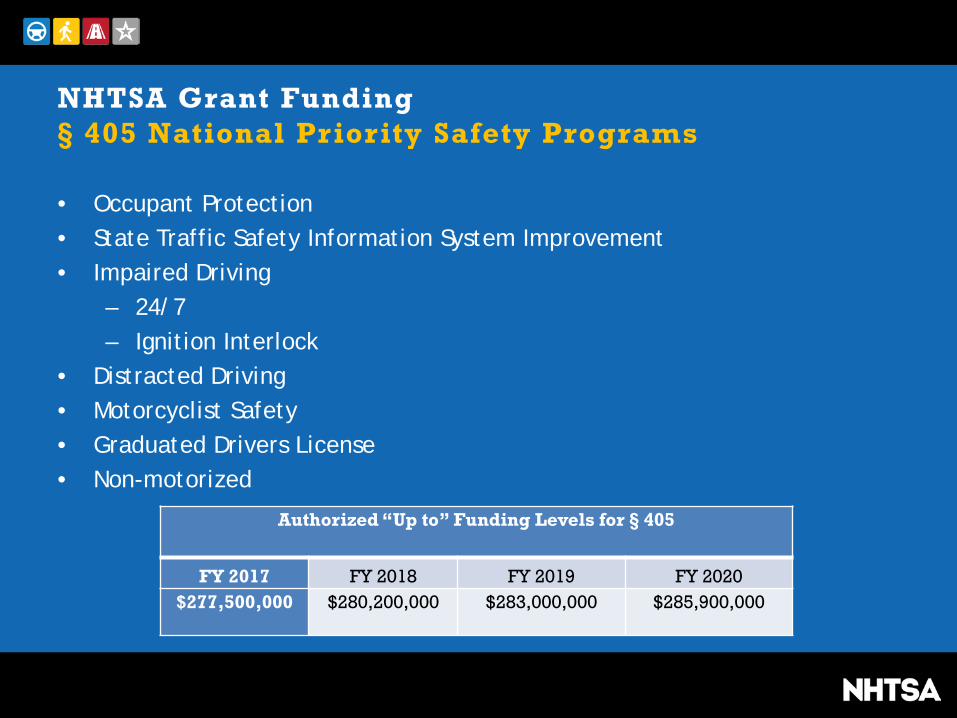
• Occupant Protection • State Traffic Safety Information System Improvement• Impaired Driving
– 24/7– Ignition Interlock
• Distracted Driving • Motorcyclist Safety• Graduated Drivers License • Non-motorized
Authorized “Up to” Funding Levels for § 405
FY 2017 FY 2018 FY 2019 FY 2020$277,500,000 $280,200,000 $283,000,000 $285,900,000
Coordination & Collaboration
• State DOTs and SHSOs must coordinate on targets for common measures
• Coordination and collaboration increases likelihood of making progress
• Collaboration enables individuals to work together to achieve a common purpose
69
Performance Measures:
• Augment State highway safety planning
• Direct resources to where most needed
• Connect targets to action
• Cultivate increased accountability and transparency
• Evaluate safety program progress
• Communicate priorities, results and the importance of traffic safety
70
Uniform Procedures for State Highway Safety Grant Programs
https://www.nhtsa.gov/staticfiles/nti/pdf/FAST-Act-NHTSA-grants-IFR.pdf
71

Directing Your Questions via the Chat Pod
1. Chat pod is on left side of screen between attendees pod & closed
caption pod
2. Type your question or
comment here
3. Answers will appear here unless addressed
verbally
In this webinar, you have learned to:
Learning Outcomes
73
Identify FHWA’s Safety Performance Management requirements.
List ways local partners can help achieve compliance with these requirements.
Identify the three critical roles locals play in crash reporting.
Identify behavioral highway safety performance management requirements for State Highway Safety Offices and their impacts for a local agency audience.

Upcoming 2017 Webinars
Converting Paved Roads to Unpaved Roads
April 4, 2017 11:00-12:30 AM Mountain
74
Archived Webinars
Access the webinar archives
Training Videos
• Introduction to Road Safety Audits on Tribal Lands
• Introduction to Road Safety Culture
Watch these videos
75
Contact Information
If you have any questions related to this presentation, please contact:
George Merritt - [email protected]
Amy Schick - [email protected]
Or contact the National Center for Rural Road Safety Help Desk at:
(844) 330-2200 or [email protected]
http://ruralsafetycenter.org/
76