Embed Size (px)
DESCRIPTION
Safety Performance Measures. Numbers? Rates? Trends?. ATSIP July 2009. Thomas M. Welch, P.E. State Transportation Safety Engineer Office of Traffic and Safety Iowa Department of Transportation 515 239-1267 [email protected]. Reduce the national fatality rate from 1.48 to 1.0 - PowerPoint PPT Presentation
Citation preview
Safety Performance Safety Performance MeasuresMeasures
Numbers?Numbers?
Rates?Rates?
Trends?Trends?
ATSIPATSIPJuly 2009July 2009
Thomas M. Welch, P.E.Thomas M. Welch, P.E.State Transportation Safety EngineerState Transportation Safety Engineer
Office of Traffic and SafetyOffice of Traffic and SafetyIowa Department of Transportation Iowa Department of Transportation
515 239-1267515 [email protected]@dot.iowa.gov
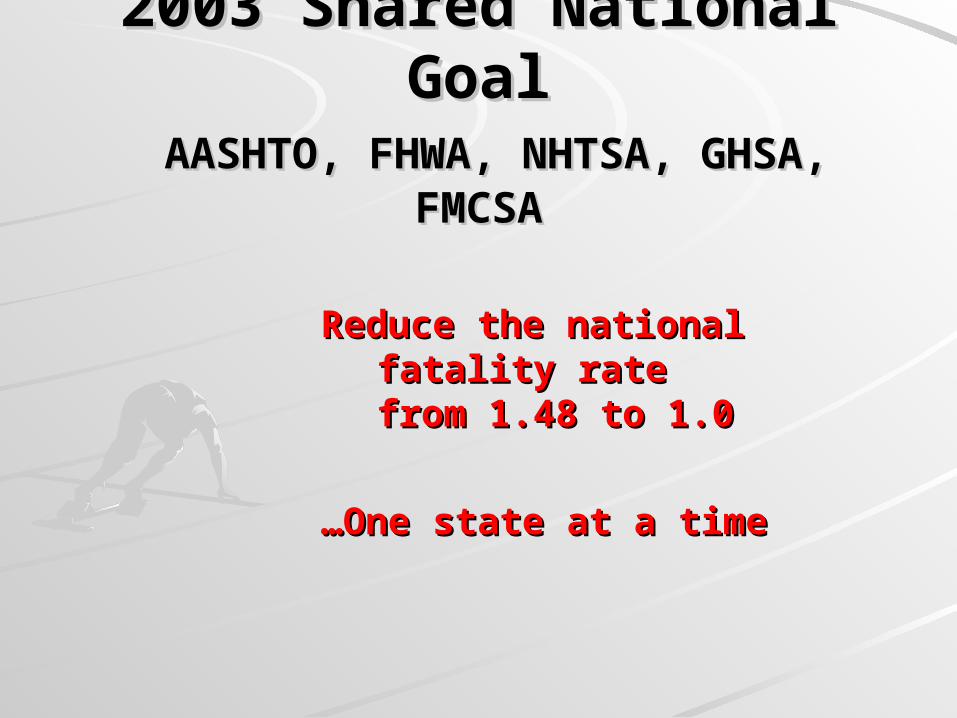
2003 Shared National Goal2003 Shared National Goal AASHTO, FHWA, NHTSA, GHSA, FMCSAAASHTO, FHWA, NHTSA, GHSA, FMCSA
Reduce the national Reduce the national fatality rate fatality rate from 1.48 to 1.0from 1.48 to 1.0
……One state at a timeOne state at a time
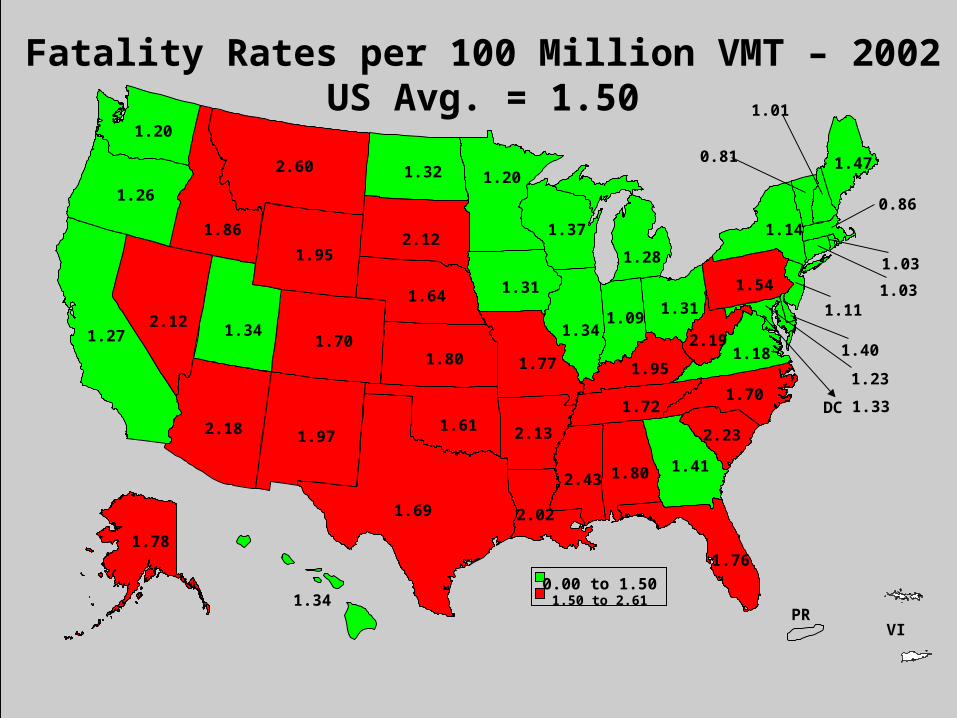
Fatality Rates per 100 Million VMT – 2002US Avg. = 1.50
PRVI
0.81
0.86
1.01
1.03
1.03
1.09 1.11
1.14
1.18
1.20
1.20
1.23
1.26
1.27
1.28
1.311.31
1.32
1.33
1.34 1.34
1.34
1.37
1.40
1.41
1.47
1.54
1.61
1.64
1.69
1.70
1.70
1.72
1.76
1.77
1.78
1.80
1.80
1.86
1.95
1.95
1.97
2.02
2.12
2.12
2.132.18
2.19
2.23
2.43
2.60
0.00 to 1.501.50 to 2.61
DC
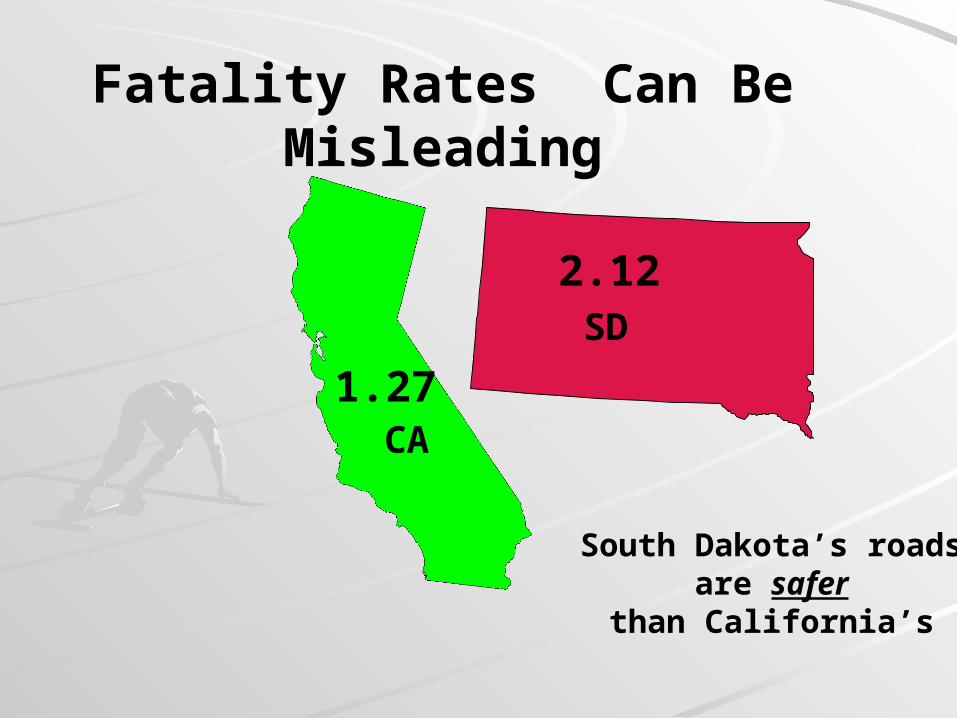
1.27
2.12
Fatality Rates Can Be Misleading
CA
SD
South Dakota’s roads are safer
than California’s
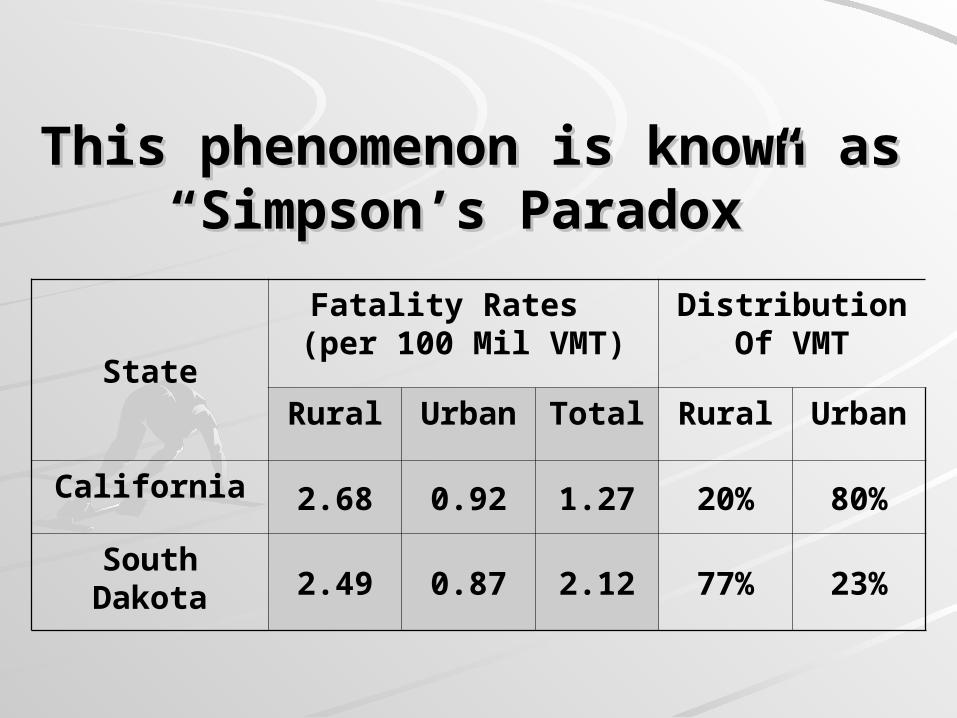
This phenomenon is known asThis phenomenon is known as“Simpson’s Paradox”“Simpson’s Paradox”
State
Fatality Rates (per 100 Mil VMT)
Distribution Of VMT
Rural Urban Total Rural Urban
California 2.68 0.92 1.27 20% 80%
South Dakota 2.49 0.87 2.12 77% 23%
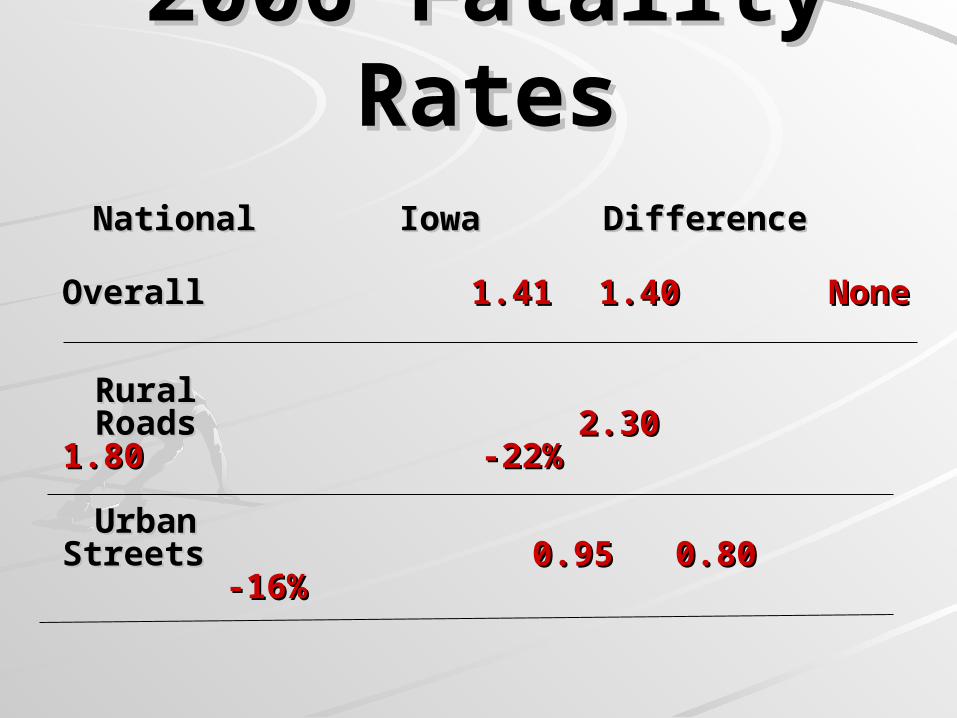
2006 Fatality 2006 Fatality RatesRates
National Iowa National Iowa DifferenceDifference
Overall Overall 1.411.41 1.401.40 NoneNone
Rural Rural Roads Roads 2.30 1.802.30 1.80 - -
22%22%
Urban Urban Streets Streets 0.950.95 0.800.80 - -16%16%
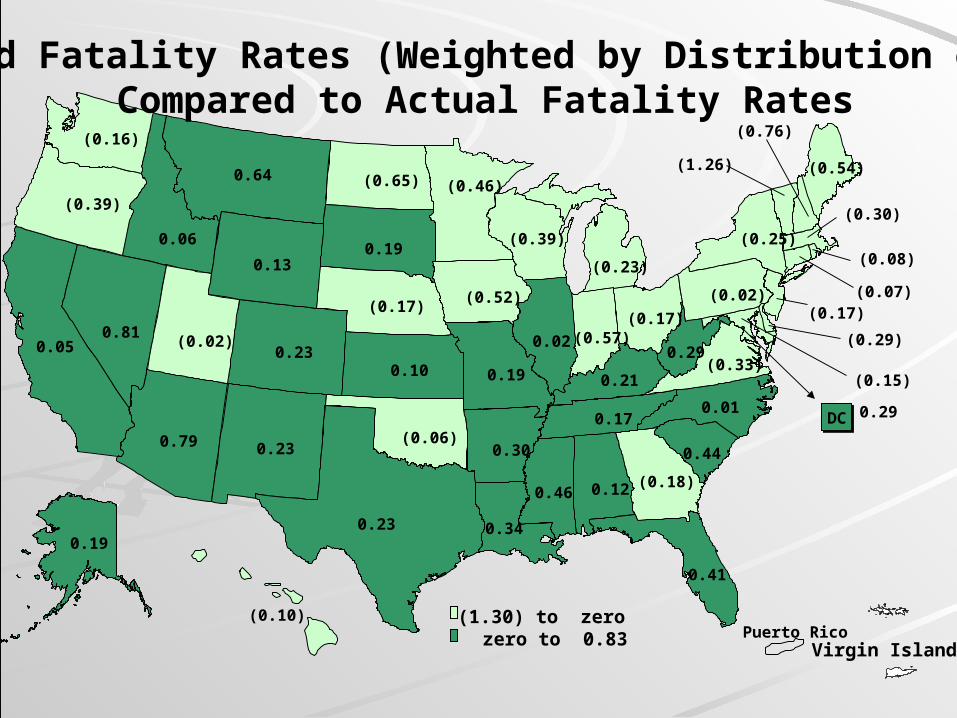
Expected Fatality Rates (Weighted by Distribution of VMT) Compared to Actual Fatality Rates
Puerto RicoVirgin Islands
(1.26)
(0.76)
(0.65)
(0.57)
(0.54)
(0.52)
(0.46)
(0.39)
(0.39)
(0.33)
(0.30)
(0.29)
(0.25)
(0.23)
(0.18)
(0.17) (0.17)(0.17)
(0.16)
(0.15)
(0.10)
(0.08)
(0.07)
(0.06)
(0.02)
(0.02)
0.01
0.02 0.05
0.06
0.10
0.12
0.13
0.17
0.19
0.19
0.19
0.21
0.23
0.23
0.23
0.29
0.29
0.30
0.34
0.41
0.44
0.46
0.64
0.79
0.81
(1.30) to zero zero to 0.83
DCDC
Reduce fatalities Reduce fatalities by 1/3 by 1/3
from from ~~ 43,000 43,000 to 29,000/ yearto 29,000/ year
Current GoalCurrent Goal
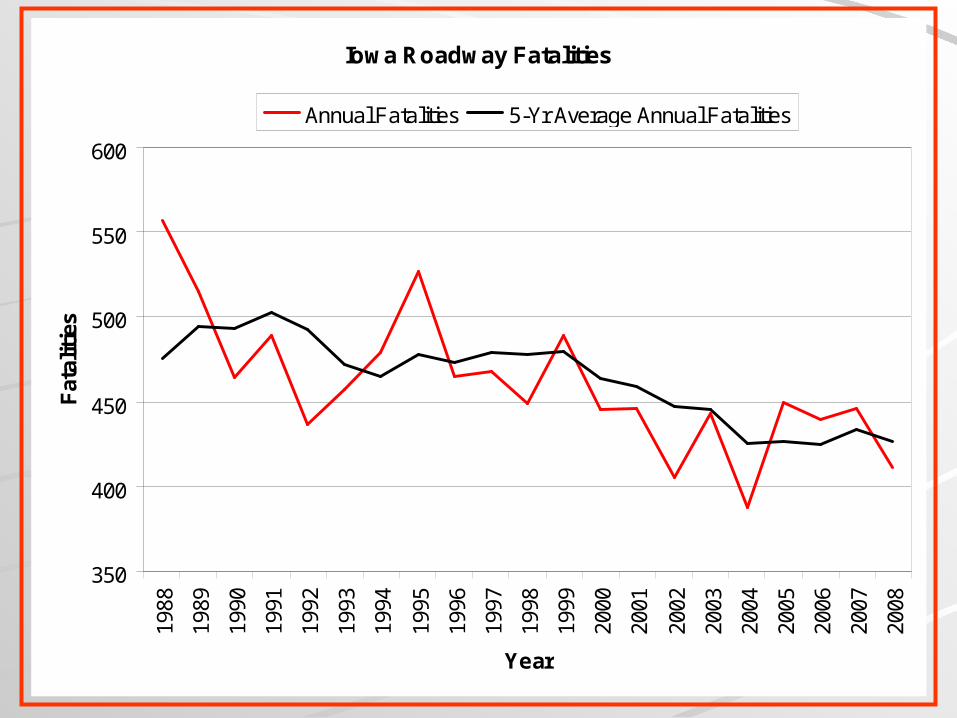
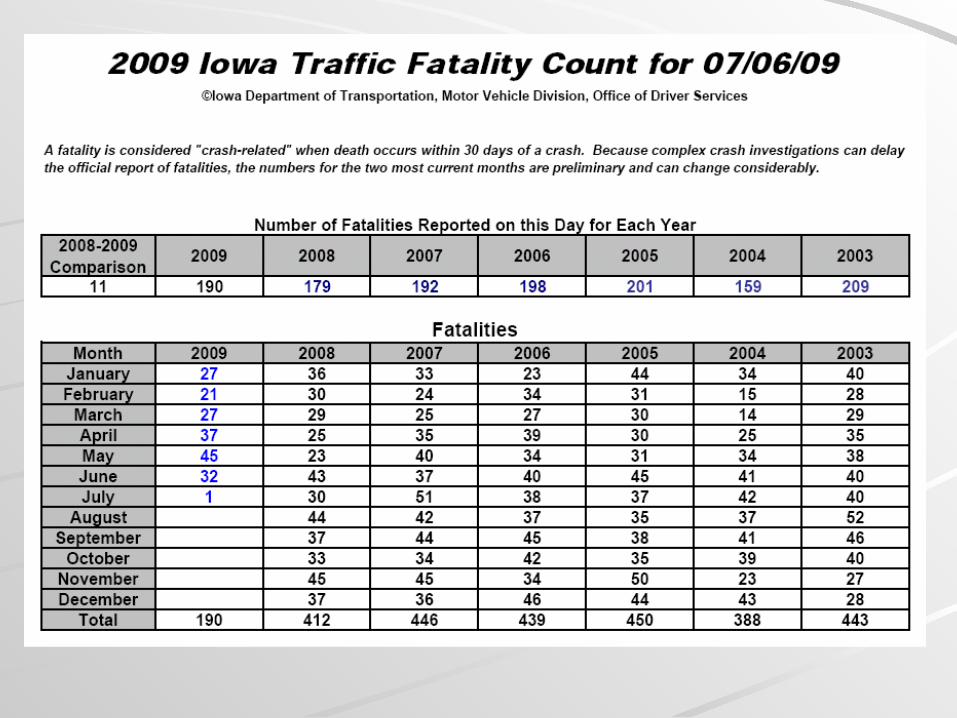
Iowa Roadway Fatalities
350
400
450
500
550
60019
88
1989
1990
1991
1992
1993
1994
1995
1996
1997
1998
1999
2000
2001
2002
2003
2004
2005
2006
2007
2008
Year
Fat
alit
ies
Annual Fatalities 5-Yr Average Annual Fatalities
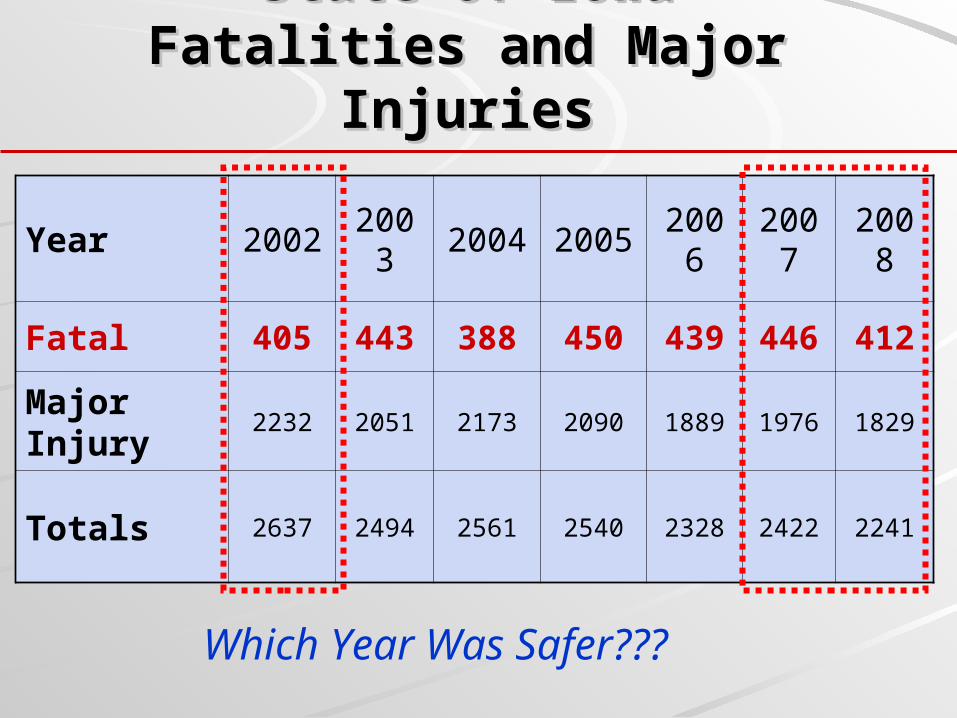
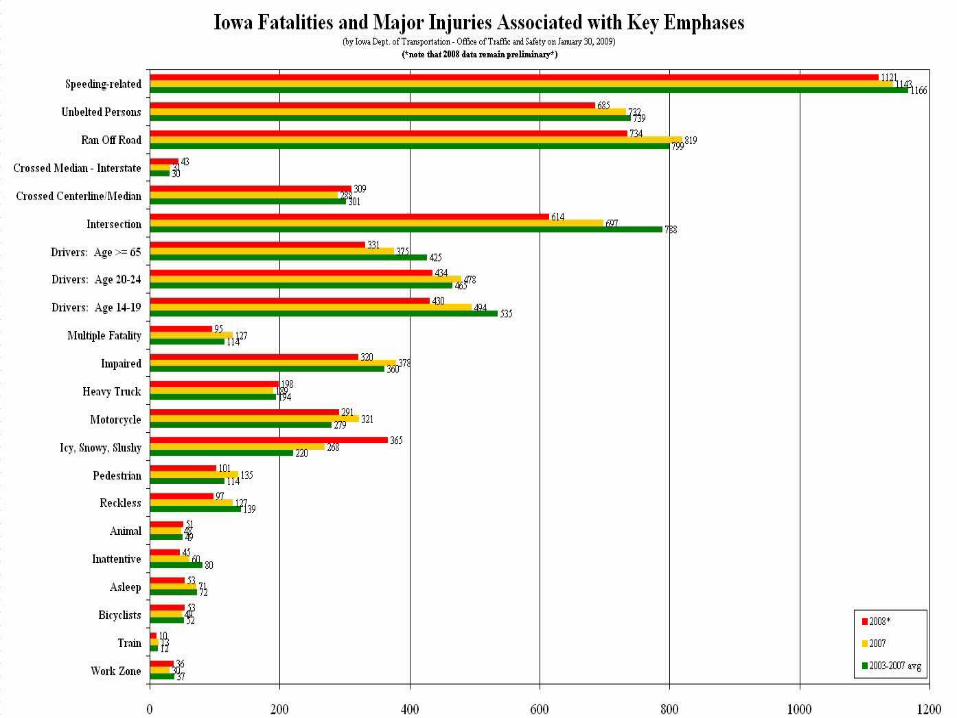
State of IowaState of IowaFatalities and Major InjuriesFatalities and Major Injuries
Year 2002 2003 2004 2005 2006 2007 2008
Fatal 405 443 388 450 439 446 412
Major Injury
2232 2051 2173 2090 1889 1976 1829
Totals 2637 2494 2561 2540 2328 2422 2241
Which Year Was Safer???

Safety Performance Safety Performance Measures Safety Measures Safety
Performance MeasuresPerformance MeasuresNumbers?Numbers?
Rates?Rates?
Trends?Trends?
ATSIPATSIPJuly 2009July 2009
Thomas M. Welch, P.E.Thomas M. Welch, P.E.State Transportation Safety State Transportation Safety
EngineerEngineerOffice of Traffic and SafetyOffice of Traffic and Safety
Iowa Department of Iowa Department of Transportation Transportation 515 239-1267515 239-1267
[email protected]@dot.iowa.gov