Embed Size (px)
Citation preview
ORR’s annual report on HS1 Ltd 2015-2016 July 2016
Contents Foreword 3
Background 4
1. Performance and data monitoring 5
Overview 5
Performance 5
Traffic volume 8
2. Asset management 12
Overview 12
Asset planning 12
Asset performance and condition 13
Renewals programme 15
3. Finance and efficiency 16
Overview 16
Financial overview 17
Net income / (Expenditure) 18
Income 18
Costs 18
Efficiency 21
Financial overview of HS1 Ltd’s statutory financial statements 22
Route escrow account 23
4. Track access 24
Overview 24
Eurostar International Limited 24
London & South Eastern Railway Limited 24
Ripple Lane Exchange Sidings 24
5. Safety 25
Overview 25
Safety activities during 2015-16 25
Proposed health and safety regulation activities for 2016-17 26
Office of Rail and Road | July 2016 Annual Report on HS1 Ltd 2015-2016 | 3
Foreword This report focuses on key areas of HS1 Ltd’s work and on ORR’s regulation of it. In it we outline the work we have done under the terms of the HS1 Concession Agreement and under the Railways Infrastructure (Access & Management) Regulations 2005, and health and safety legislation.
HS1 Ltd has operated well in 2015-16, and HS1 Ltd’s performance during the year has remained good, with only 0.44% of services being delayed by HS1 Ltd-attributable incidents. Whilst we know that a number of passengers have had bad experiences in the past year, especially on international services, these delays largely stem from issues non-attributable to HS1 Ltd, and performance this year by HS1 Ltd remains significantly better than the performance floor target. The overall average seconds delay per train in 2015-16 was 10.12, above HS1 Ltd’s internal target for the year of 5.5 seconds. However, of the total delay, around half was attributable to 4 major trespass incidents. Excluding these incidents, the average seconds delay per train for the year would be 5.1 seconds.
Traffic volume on the HS1 network increased in 2015-16, in part due to an increase on the St Pancras-Ashford domestic route.
In 2015-16, HS1 Ltd generated regulated income of £70.5m, which is £4.6m higher than assumed in our periodic review, PR14. Of this increase £2.1m was income recovered from NR(HS) in relation to performance related payments, for payment to operators. The remainder was driven by more domestic train paths than we assumed in PR14. Likewise HS1 Ltd spent £66.8m operating, maintaining and renewing its rail infrastructure in the year, which is £0.5m lower than we assumed in PR14. Overall, HS1 Ltd’s income exceeded expenditure by £1.6m, which represents £3.0m of financial outperformance relative to our determination.
The report also contains a section detailing our approval of a number of amendments to track access agreements during the year, including approval of further domestic and international services, and sections on asset management and health and safety, including details of our proposed health and safety regulation activities for 2016-17.
Graham Richards
Interim Director, Railway Planning and Performance
July 2016
Office of Rail and Road | July 2016 Annual Report on HS1 Ltd 2015-2016 | 4
Background This document comprises ORR’s annual report on HS1 Ltd for the year 2015-16. Previous reports on HS1 Ltd are available from the HS1 regulation page of our website.
HS1 Ltd has a 30 year concession from the Secretary of State to operate and manage the HS1 network. ORR is the health and safety regulator for HS1 Ltd, and has economic regulation responsibilities through the Concession Agreement and the Railways Infrastructure (Access and Management) Regulations 2005 (“the Regulations”).
While HS1 Ltd is responsible for the overall management and operation of the HS1 network, the responsibility for the infrastructure itself is subcontracted to Network Rail (High Speed) Ltd (“NR(HS)”). NR(HS) is also the safety duty holder for the HS1 network.
This report focuses on key areas of HS1 Ltd’s work, and our regulation of HS1 Ltd. Areas covered are:
performance and data monitoring;
asset management;
finance and efficiency;
track access; and
safety.
This document is primarily a report to the Secretary of State setting out how HS1 Ltd has performed against the requirements we monitor under the Concession Agreement, and how we have carried out our duties under the Concession Agreement in the last year. We also set out the work we have done in regulating safety on the HS1 network.
We monitor train performance through quarterly and annual data returns that set out train service performance against key performance floor targets. Asset management is monitored in line with HS1 Ltd’s Asset Management Strategy. The Annual Asset Management Statement, along with asset stewardship key performance indicators, is used to assess HS1 Ltd’s performance in maintaining its assets.
Further questions or comments on this report should be directed to:
David Reed Senior Executive, Access and Licensing Office of Rail and Road One Kemble Street London, WC2B 4AN E: [email protected]
Office of Rail and Road | July 2016 Annual Report on HS1 Ltd 2015-2016 | 5
1. Performance and data monitoring Overview ORR holds HS1 Ltd to account for the performance of its network for train services by monitoring its operational performance measures.
HS1 Ltd’s performance during 2015-16 has remained good, with only 0.44% of services (332 trains) being delayed by HS1-attributable incidents. Around three-quarters (76.2%) of the services delayed attributable to HS1 Ltd were due to non-track assets, with point failures affecting 95 trains in 2015-16. The overall average seconds delay per train was 10.12, above HS1 Ltd’s internal stretch target of 5.5 seconds. However, of the total delay, around half was attributable to 4 major trespass incidents – one of which resulted in a fatality. Excluding the trespass incidents, the average seconds delay per train for the year would be 5.1 seconds.
Traffic volume on the HS1 network increased in 2015-16, mainly brought about by an increase on the St Pancras – Ashford domestic route.
Please note that some of the figures included in this chapter are subject to revisions due to various factors including the re-classification of some delay incidents.
Performance 1.1 We monitor HS1 Ltd’s operational performance against the performance floor
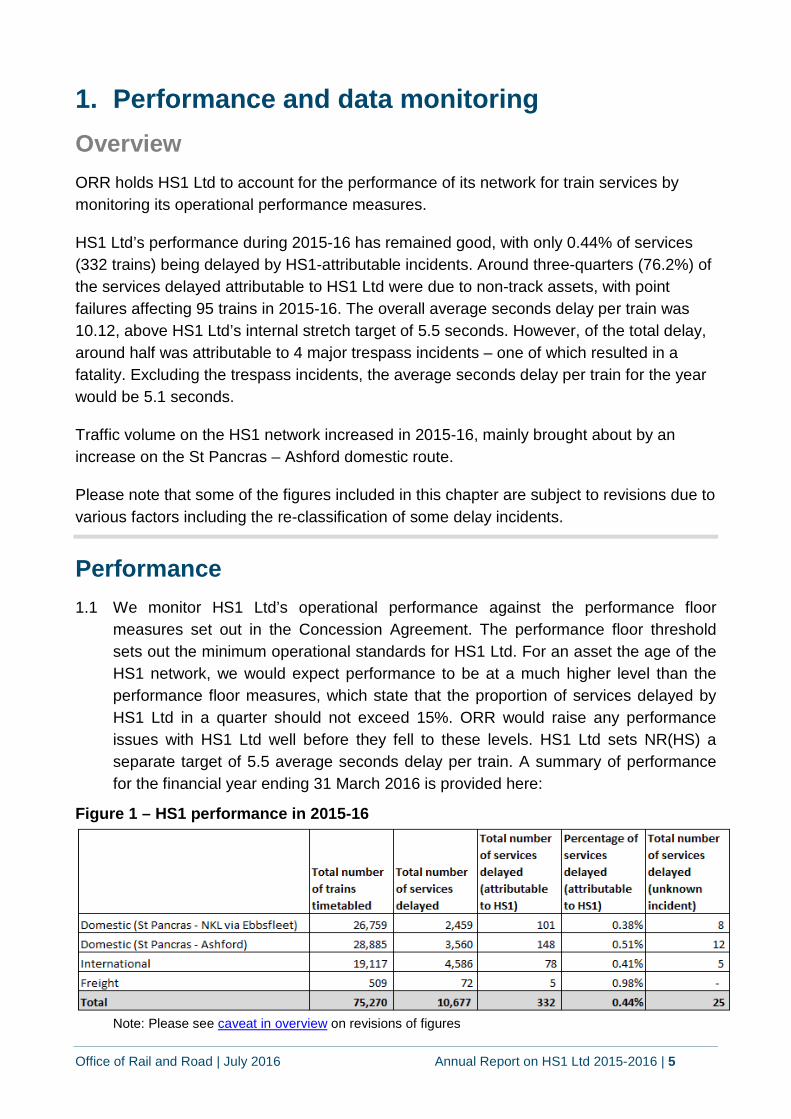
measures set out in the Concession Agreement. The performance floor threshold sets out the minimum operational standards for HS1 Ltd. For an asset the age of the HS1 network, we would expect performance to be at a much higher level than the performance floor measures, which state that the proportion of services delayed by HS1 Ltd in a quarter should not exceed 15%. ORR would raise any performance issues with HS1 Ltd well before they fell to these levels. HS1 Ltd sets NR(HS) a separate target of 5.5 average seconds delay per train. A summary of performance for the financial year ending 31 March 2016 is provided here:
Figure 1 – HS1 performance in 2015-16
Note: Please see caveat in overview on revisions of figures
Office of Rail and Road | July 2016 Annual Report on HS1 Ltd 2015-2016 | 6
1.2 The proportion of trains delayed by HS1 Ltd-attributable incidents in 2015-16 was 0.44%, which is an increase from the low percentage (0.16%) achieved last year. Whilst we know that a number of passengers have had bad experiences in the past year, especially on international services, these delays still largely stem from issues off the HS1 network or non-attributable to HS1 Ltd in calculation of the performance floor measure, and performance this year by HS1 Ltd remains significantly better than the performance floor target.
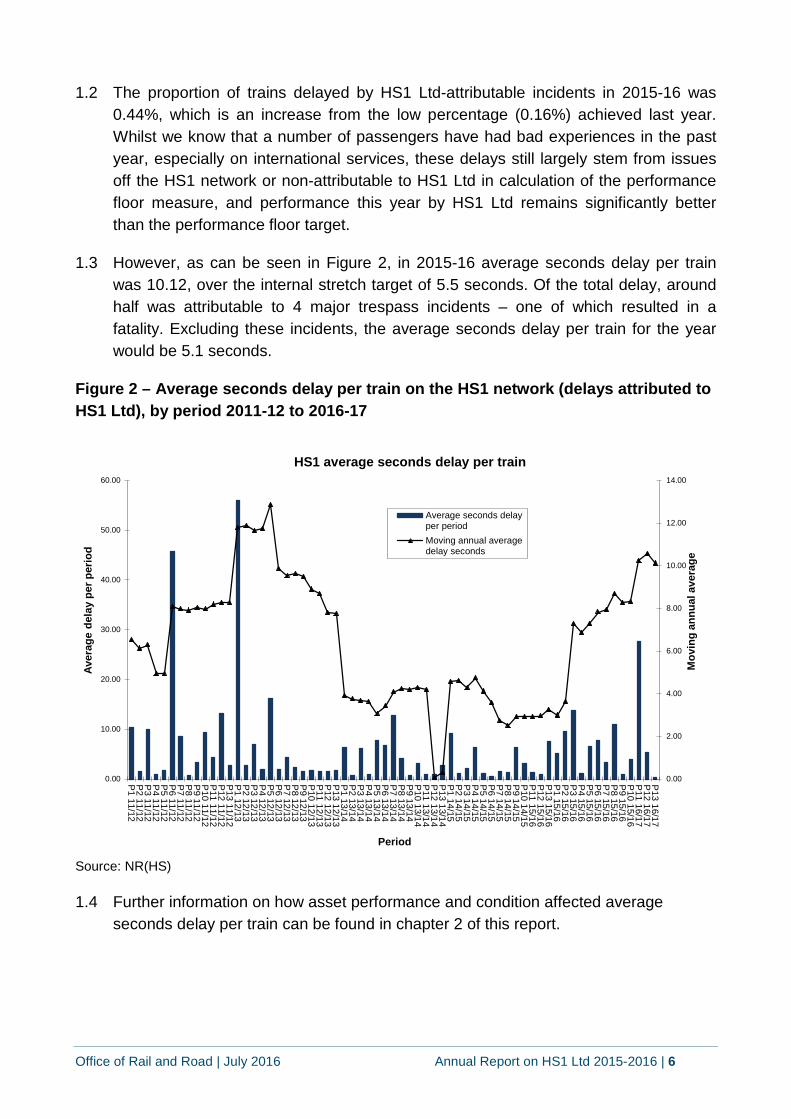
1.3 However, as can be seen in Figure 2, in 2015-16 average seconds delay per train was 10.12, over the internal stretch target of 5.5 seconds. Of the total delay, around half was attributable to 4 major trespass incidents – one of which resulted in a fatality. Excluding these incidents, the average seconds delay per train for the year would be 5.1 seconds.
Figure 2 – Average seconds delay per train on the HS1 network (delays attributed to HS1 Ltd), by period 2011-12 to 2016-17
Source: NR(HS)
1.4 Further information on how asset performance and condition affected average seconds delay per train can be found in chapter 2 of this report.
0.00
2.00
4.00
6.00
8.00
10.00
12.00
14.00
0.00
10.00
20.00
30.00
40.00
50.00
60.00
P1 11/12
P2 11/12
P3 11/12
P4 11/12
P5 11/12
P6 11/12
P7 11/12
P8 11/12
P9 11/12
P10 11/12
P11 11/12
P12 11/12
P13 11/12
P1 12/13
P2 12/13
P3 12/13
P4 12/13
P5 12/13
P6 12/13
P7 12/13
P8 12/13
P9 12/13
P10 12/13
P11 12/13
P12 12/13
P13 12/13
P1 13/14
P2 13/14
P3 13/14
P4 13/14
P5 13/14
P6 13/14
P7 13/14
P8 13/14
P9 13/14
P10 13/14
P11 13/14
P12 13/14
P13 13/14
P1 14/15
P2 14/15
P3 14/15
P4 14/15
P5 14/15
P6 14/15
P7 14/15
P8 14/15
P9 14/15
P10 14/15
P11 15/16
P12 15/16
P13 15/16
P1 15/16
P2 15/16
P3 15/16
P4 15/16
P5 15/16
P6 15/16
P7 15/16
P8 15/16
P9 15/16
P10 15/16
P11 16/17
P12 16/17
P13 16/17
Mov
ing
annu
al a
vera
ge
Aver
age
dela
y pe
r per
iod
Period
HS1 average seconds delay per train
Average seconds delayper periodMoving annual averagedelay seconds
Office of Rail and Road | July 2016 Annual Report on HS1 Ltd 2015-2016 | 7
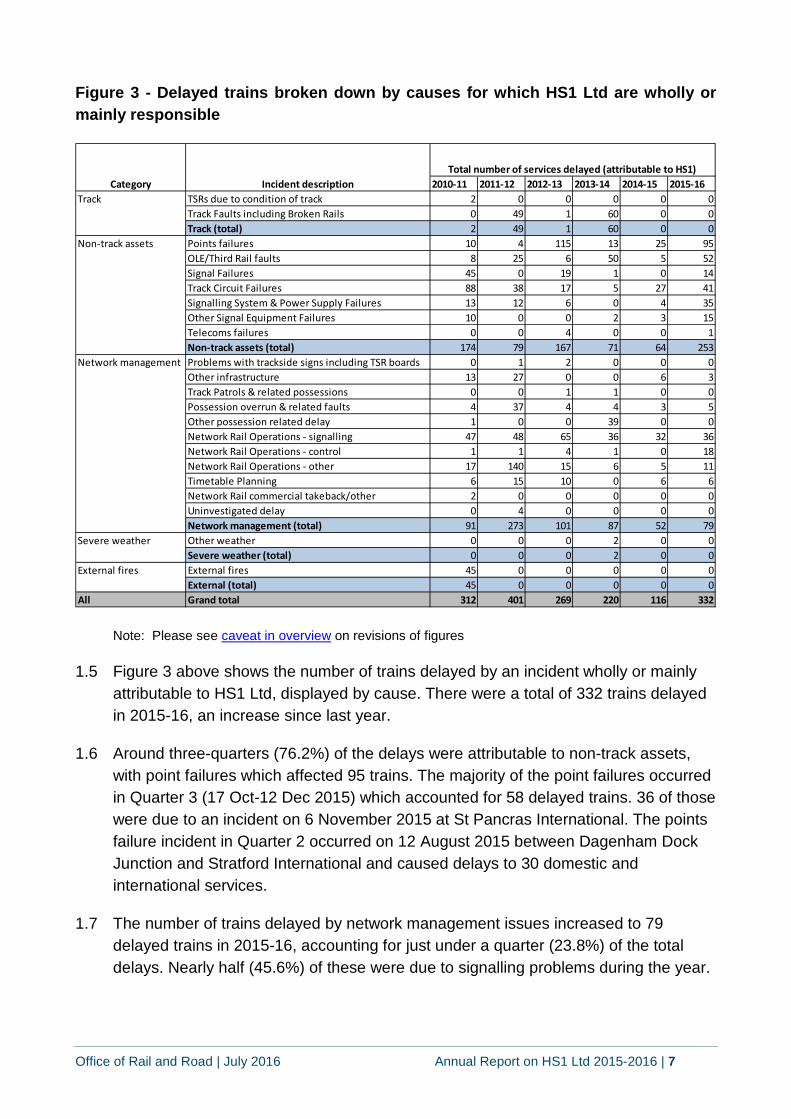
Figure 3 - Delayed trains broken down by causes for which HS1 Ltd are wholly or mainly responsible
Note: Please see caveat in overview on revisions of figures
1.5 Figure 3 above shows the number of trains delayed by an incident wholly or mainly attributable to HS1 Ltd, displayed by cause. There were a total of 332 trains delayed in 2015-16, an increase since last year.
1.6 Around three-quarters (76.2%) of the delays were attributable to non-track assets, with point failures which affected 95 trains. The majority of the point failures occurred in Quarter 3 (17 Oct-12 Dec 2015) which accounted for 58 delayed trains. 36 of those were due to an incident on 6 November 2015 at St Pancras International. The points failure incident in Quarter 2 occurred on 12 August 2015 between Dagenham Dock Junction and Stratford International and caused delays to 30 domestic and international services.
1.7 The number of trains delayed by network management issues increased to 79 delayed trains in 2015-16, accounting for just under a quarter (23.8%) of the total delays. Nearly half (45.6%) of these were due to signalling problems during the year.
2010-11 2011-12 2012-13 2013-14 2014-15 2015-16TSRs due to condition of track 2 0 0 0 0 0Track Faults including Broken Rails 0 49 1 60 0 0Track (total) 2 49 1 60 0 0Points failures 10 4 115 13 25 95OLE/Third Rail faults 8 25 6 50 5 52Signal Failures 45 0 19 1 0 14Track Circuit Failures 88 38 17 5 27 41Signalling System & Power Supply Failures 13 12 6 0 4 35Other Signal Equipment Failures 10 0 0 2 3 15Telecoms failures 0 0 4 0 0 1Non-track assets (total) 174 79 167 71 64 253Problems with trackside signs including TSR boards 0 1 2 0 0 0Other infrastructure 13 27 0 0 6 3Track Patrols & related possessions 0 0 1 1 0 0Possession overrun & related faults 4 37 4 4 3 5Other possession related delay 1 0 0 39 0 0Network Rail Operations - signalling 47 48 65 36 32 36Network Rail Operations - control 1 1 4 1 0 18Network Rail Operations - other 17 140 15 6 5 11Timetable Planning 6 15 10 0 6 6Network Rail commercial takeback/other 2 0 0 0 0 0Uninvestigated delay 0 4 0 0 0 0Network management (total) 91 273 101 87 52 79Other weather 0 0 0 2 0 0Severe weather (total) 0 0 0 2 0 0External fires 45 0 0 0 0 0External (total) 45 0 0 0 0 0
All Grand total 312 401 269 220 116 332
Total number of services delayed (attributable to HS1)
Severe weather
External fires
Category Incident descriptionTrack
Non-track assets
Network management
Office of Rail and Road | July 2016 Annual Report on HS1 Ltd 2015-2016 | 8
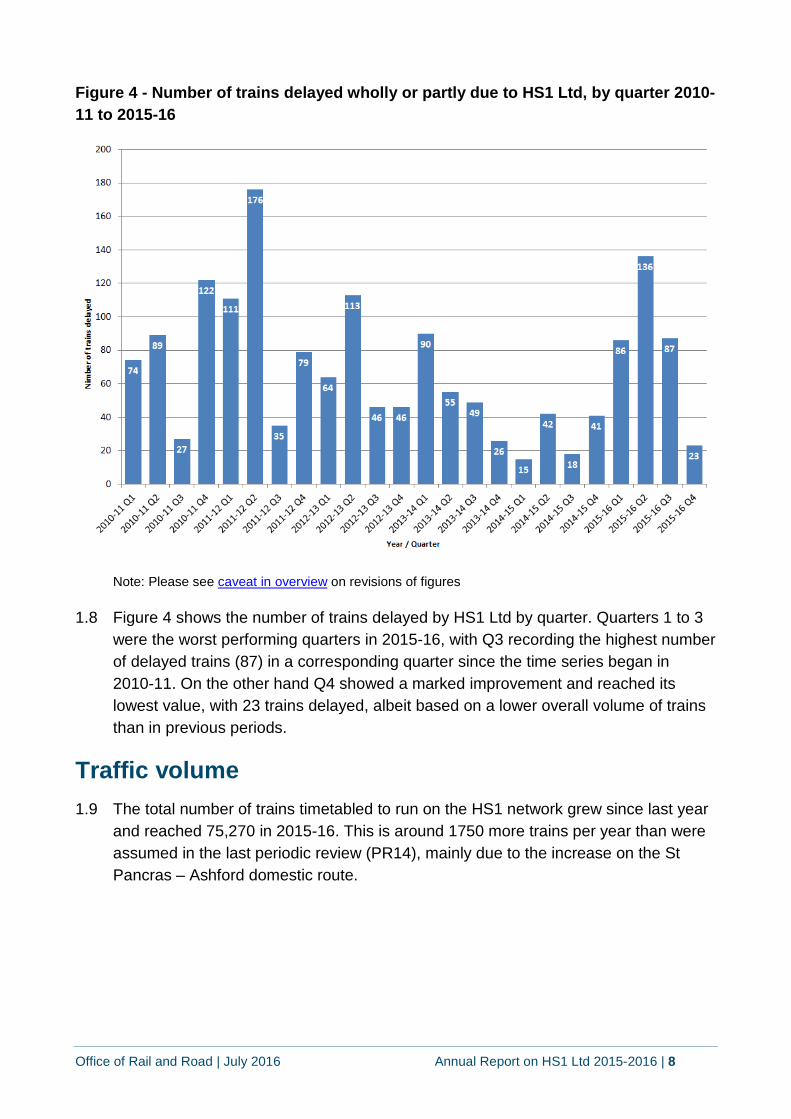
Figure 4 - Number of trains delayed wholly or partly due to HS1 Ltd, by quarter 2010-11 to 2015-16
Note: Please see caveat in overview on revisions of figures
1.8 Figure 4 shows the number of trains delayed by HS1 Ltd by quarter. Quarters 1 to 3 were the worst performing quarters in 2015-16, with Q3 recording the highest number of delayed trains (87) in a corresponding quarter since the time series began in 2010-11. On the other hand Q4 showed a marked improvement and reached its lowest value, with 23 trains delayed, albeit based on a lower overall volume of trains than in previous periods.
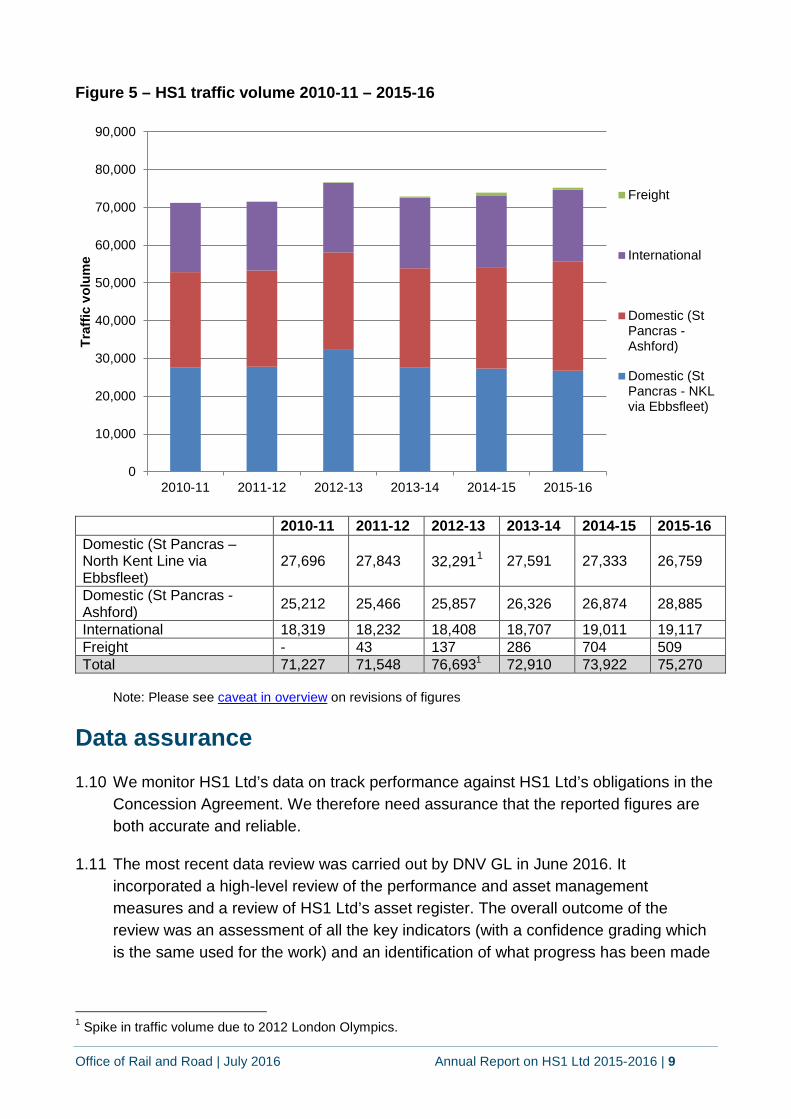
Traffic volume 1.9 The total number of trains timetabled to run on the HS1 network grew since last year
and reached 75,270 in 2015-16. This is around 1750 more trains per year than were assumed in the last periodic review (PR14), mainly due to the increase on the St Pancras – Ashford domestic route.
Office of Rail and Road | July 2016 Annual Report on HS1 Ltd 2015-2016 | 9
Figure 5 – HS1 traffic volume 2010-11 – 2015-16
2010-11 2011-12 2012-13 2013-14 2014-15 2015-16 Domestic (St Pancras – North Kent Line via Ebbsfleet)
27,696 27,843 32,2911 27,591 27,333 26,759
Domestic (St Pancras - Ashford) 25,212 25,466 25,857 26,326 26,874 28,885
International 18,319 18,232 18,408 18,707 19,011 19,117 Freight - 43 137 286 704 509 Total 71,227 71,548 76,6931 72,910 73,922 75,270
Note: Please see caveat in overview on revisions of figures
Data assurance 1.10 We monitor HS1 Ltd’s data on track performance against HS1 Ltd’s obligations in the
Concession Agreement. We therefore need assurance that the reported figures are both accurate and reliable.
1.11 The most recent data review was carried out by DNV GL in June 2016. It incorporated a high-level review of the performance and asset management measures and a review of HS1 Ltd’s asset register. The overall outcome of the review was an assessment of all the key indicators (with a confidence grading which is the same used for the work) and an identification of what progress has been made
1 Spike in traffic volume due to 2012 London Olympics.
0
10,000
20,000
30,000
40,000
50,000
60,000
70,000
80,000
90,000
2010-11 2011-12 2012-13 2013-14 2014-15 2015-16
Traf
fic v
olum
e
Freight
International
Domestic (StPancras -Ashford)
Domestic (StPancras - NKLvia Ebbsfleet)
Office of Rail and Road | July 2016 Annual Report on HS1 Ltd 2015-2016 | 10
since the 2014 review, together with a set of recommendations for further improvements.
1.12 The review was composed of three areas:
i. a high-level assessment of the following quarterly operational performance data:
a) Total number of trains timetabled
b) Total number of trains delayed
c) Number of trains delayed by an incident wholly or mainly attributable to HS1
d) Number of trains delayed by an unidentifiable incident
ii. A high-level assessment of the following quarterly asset management data:
a) Plan attainment (backlog)
b) Overall fault levels
c) Track quality-induced speed restrictions
d) Broken rails
e) Service-affecting defective rails
iii. A review of the asset register - to provide assurance that the high level of quality is maintained and is continually improving.
1.13 All the performance measures were assigned the highest confidence rating A1*, similar to previous review, with the exception of “Total Number of Trains Delayed” which received the rating B4. A shortcoming in the processing of the “Total number of trains delayed” was identified, which resulted in a 14% over-estimate of the Key Performance Indicator (KPI), meaning that the number of trains delayed was recorded at a level significantly higher than it actually was. A recommendation to correct for this multi-counting has been made.
1.14 NR(HS) has already acted on the above recommendation and the 2015-16 figures presented in this report are accurate.
1.15 Other improvements identified to increase the robustness of the performance measures is to add cross-checks to:
i. make timetable counts independent of the service code groups input table; and
Office of Rail and Road | July 2016 Annual Report on HS1 Ltd 2015-2016 | 11
ii. check to detect whether the list of delay-causing incidents is correctly time-ordered.
1.16 All the asset management measures were assigned the highest confidence rating A1* and no recommendations were made. Four technical observations were made in the report in view of continually improving the process.
1.17 The asset register was reviewed, especially with respect to data specifications, change management processes and the methodologies used to generate the data necessary for KPI reporting. These were well-specified, well-implemented and the processes governing the data contained in the register were considered to be appropriate and robust.
1.18 All HS1 Ltd data assurance reviews are available on our website.
Office of Rail and Road | July 2016 Annual Report on HS1 Ltd 2015-2016 | 12
2. Asset management Overview The Concession Agreement requires HS1 Ltd to secure the operation, maintenance, renewal, replacement and planning and carrying out of upgrades in accordance with best practice and in a timely, efficient and economical manner, to the greatest extent reasonably practicable having regard to all circumstances.
Whilst good progress is being made in developing HS1 Ltd’s asset management capability and delivery of renewal activities, overall asset performance has declined in a number of key areas based on performance relative to the prior year. However, these are still within the targets declared in their CP2 plans.
Asset planning 2.1 HS1 Ltd has initiated its CP3 development programme which incorporates its Asset
Management System, Asset Information and competence framework in order to become a more ‘intelligent client’ in respect of its partner organisations.
2.2 HS1 Ltd is focussing on its asset information systems and between now and March 2017 will continue with its improvement programme to improve data quality. HS1 Ltd recognises that having good data quality is the foundation of best practice asset management. This assists an organisation to predict and prevent asset failures before they result in costly delays.
2.3 To accomplish this HS1 Ltd recognises that it needs people with the right competence and with the right behaviours. In order to make sure that asset policies remain aligned to the HS1 Ltd’s objectives NR(HS) has initiated a programme of training in Reliability Centred Maintenance (RCM) for all of its technical and engineering staff.
2.4 HS1 Ltd has continued to work on its Whole Life Cost models which can be manipulated to test a range of asset policy scenarios in terms of cost and risk in order to find an optimum balance between cost, risk and performance.
2.5 The renewal plans are continuing to evolve as NR(HS) seeks to clarify the exact scope of work along with associated costs. In a number of instances, there have been some inconsistencies found in the cost estimates for a number of projects. The ORR expects that initial estimates are as robust as possible, that overheads and risk contingencies are being included and that there is a good assurance process in place to control changes.
2.6 The ORR attended the recent CP2/CP3 planning workshop where HS1 Ltd presented its review of 2015-16 as well as its initial views on CP3. ORR has
Office of Rail and Road | July 2016 Annual Report on HS1 Ltd 2015-2016 | 13
welcomed the approach and will continue to work with HS1 Ltd as it develops its plans going forward.
2.7 ORR understands that HS1 Ltd will continue to review its asset management capabilities by undertaking a gap analysis against the ISO550002 series of asset management standards. This will provide a useful insight into HS1 Ltd’s and NR(HS)’s existing asset management capability and will help identify possible areas for improvement. In addition, in the run up to CP3 this would also serve to inform the ORR as well as other stakeholders about how effective HS1 Ltd and NR(HS) is in managing its asset base.
2.8 HS1 Ltd is continuing its work on benchmarking with a number of other similar high speed rail networks. Consultant Leigh Fisher is leading this work on behalf of HS1 Ltd, which should provide some insight, along with a number of other measures, into whether its asset management approach is in line with best practice and that its maintenance and renewals operations are economic and efficient.
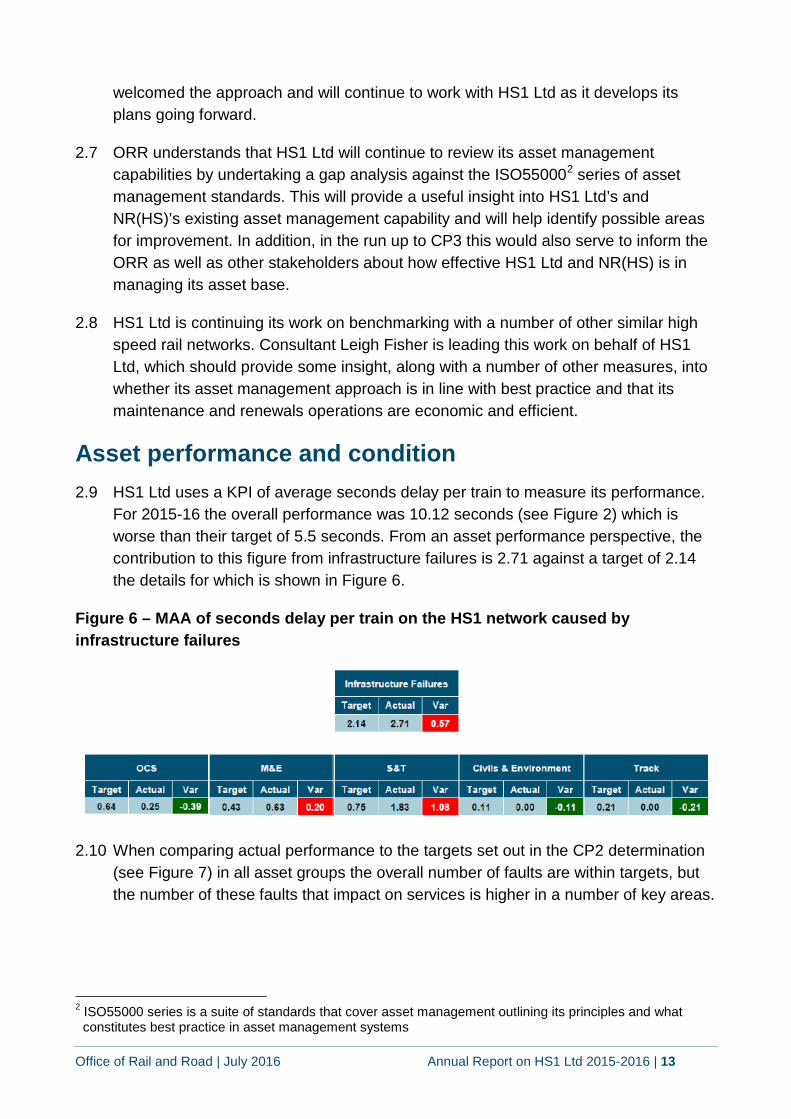
Asset performance and condition 2.9 HS1 Ltd uses a KPI of average seconds delay per train to measure its performance.
For 2015-16 the overall performance was 10.12 seconds (see Figure 2) which is worse than their target of 5.5 seconds. From an asset performance perspective, the contribution to this figure from infrastructure failures is 2.71 against a target of 2.14 the details for which is shown in Figure 6.
Figure 6 – MAA of seconds delay per train on the HS1 network caused by infrastructure failures
2.10 When comparing actual performance to the targets set out in the CP2 determination (see Figure 7) in all asset groups the overall number of faults are within targets, but the number of these faults that impact on services is higher in a number of key areas.
2 ISO55000 series is a suite of standards that cover asset management outlining its principles and what
constitutes best practice in asset management systems
Office of Rail and Road | July 2016 Annual Report on HS1 Ltd 2015-2016 | 14
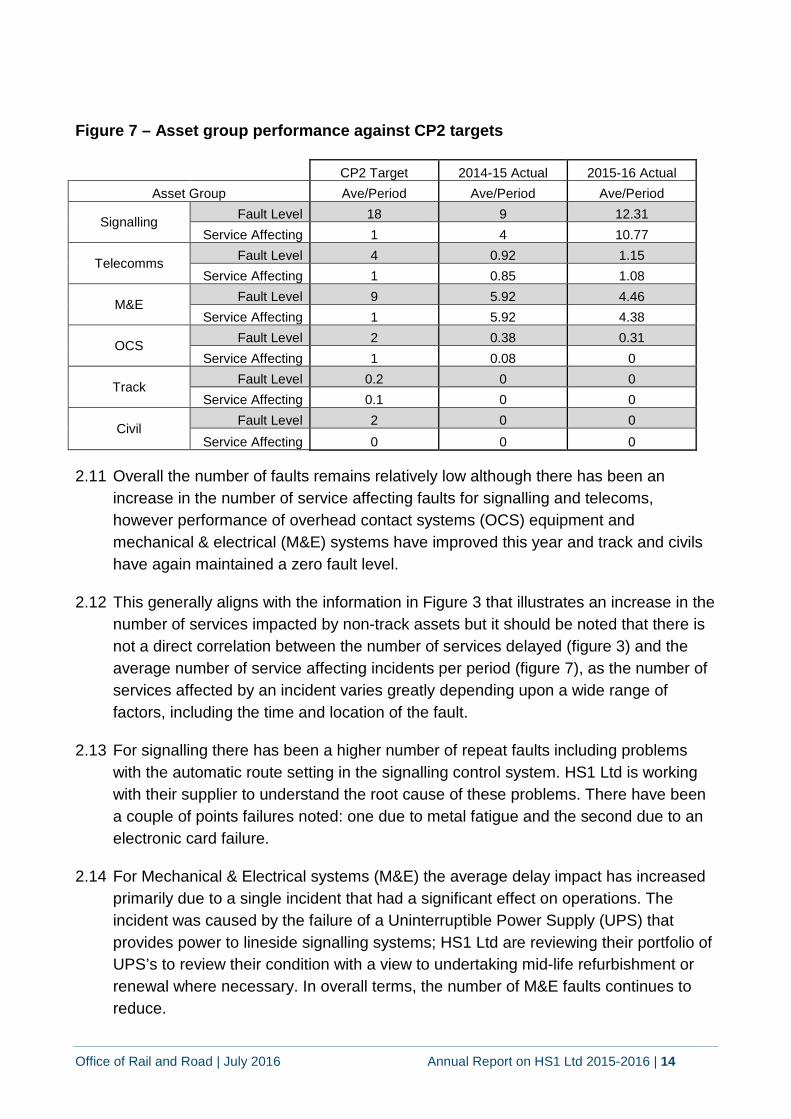
Figure 7 – Asset group performance against CP2 targets
CP2 Target 2014-15 Actual 2015-16 Actual Asset Group Ave/Period Ave/Period Ave/Period
Signalling Fault Level 18 9 12.31 Service Affecting 1 4 10.77
Telecomms Fault Level 4 0.92 1.15 Service Affecting 1 0.85 1.08
M&E Fault Level 9 5.92 4.46 Service Affecting 1 5.92 4.38
OCS Fault Level 2 0.38 0.31 Service Affecting 1 0.08 0
Track Fault Level 0.2 0 0 Service Affecting 0.1 0 0
Civil Fault Level 2 0 0 Service Affecting 0 0 0
2.11 Overall the number of faults remains relatively low although there has been an increase in the number of service affecting faults for signalling and telecoms, however performance of overhead contact systems (OCS) equipment and mechanical & electrical (M&E) systems have improved this year and track and civils have again maintained a zero fault level.
2.12 This generally aligns with the information in Figure 3 that illustrates an increase in the number of services impacted by non-track assets but it should be noted that there is not a direct correlation between the number of services delayed (figure 3) and the average number of service affecting incidents per period (figure 7), as the number of services affected by an incident varies greatly depending upon a wide range of factors, including the time and location of the fault.
2.13 For signalling there has been a higher number of repeat faults including problems with the automatic route setting in the signalling control system. HS1 Ltd is working with their supplier to understand the root cause of these problems. There have been a couple of points failures noted: one due to metal fatigue and the second due to an electronic card failure.
2.14 For Mechanical & Electrical systems (M&E) the average delay impact has increased primarily due to a single incident that had a significant effect on operations. The incident was caused by the failure of a Uninterruptible Power Supply (UPS) that provides power to lineside signalling systems; HS1 Ltd are reviewing their portfolio of UPS’s to review their condition with a view to undertaking mid-life refurbishment or renewal where necessary. In overall terms, the number of M&E faults continues to reduce.
Office of Rail and Road | July 2016 Annual Report on HS1 Ltd 2015-2016 | 15
2.15 There was an Overhead Line Equipment (OLE) dewirement at Stratford International station in October which was caused by a faulty vacuum breaker on board a train. Whilst this was not a direct infrastructure failure, HS1 Ltd is reviewing the resilience of contact wire and its management procedures to prevent this type of failure occurring in the future.
2.16 For track, HS1 Ltd has found that excessive vibration can cause electrical connection problems within points which impacts the signalling assets. NR(HS) has initiated an independent study to look at this failure mechanism. HS1 Ltd has successfully trialled two new pieces of plant: high output grinding machine (RR48 stone machine) for long tunnels and a Dynamic Track Stabiliser for use across switches and crossings.
2.17 In addition to its core activities, HS1 Ltd has supported the testing and introduction of the Eurostar Class 374 “e320” trains. HS1 Ltd is monitoring the impact that these trains are having on the system to assess whether they will have a detrimental impact on asset degradation rates.
Renewals programme 2.18 There have been two renewal projects initiated this year; Stratford dewatering system
software and the boom replacement on a road-rail vehicle. Both these projects are due to be completed in 2016/17.
2.19 HS1 Ltd has developed its budget for renewals work across the second control period (“CP2”) with a proposed escrow withdrawal schedule of £3.3m for 2016-17. The bulk of this budget relates to signalling and telecoms work.
2.20 In relation to the GSM-R (Global System for Mobile Communications – Railway) specified upgrade, HS1 Ltd has successfully upgraded the S8000 base stations to the new S9000 version. Network Rail Infrastructure Ltd, Freight Operating Companies and the London and South Eastern Railway (LSER) fleet of Class 395’s are now successfully using the GSM-R system. Work is due to be completed in August 2016 to commission the system for international trains.
Office of Rail and Road | July 2016 Annual Report on HS1 Ltd 2015-2016 | 16
3. Finance and efficiency Overview 2015-16 is the first year of the second control period (CP2), and is the first year in which HS1 Ltd’s operating, maintenance and renewals (OMR) track access charge was set by ORR, following the conclusion of PR14.
In 2015-16, HS1 Ltd generated regulated income3 of £70.5m, which is £4.6m higher than assumed in PR14. Of this increase £2.1m was income recovered from NR(HS) in relation to performance related payments, for payment to operators. The remainder was driven by more domestic train paths than we assumed in PR14. HS1 Ltd spent £66.8m operating, maintaining and renewing its rail infrastructure in the year, which is £0.5m lower than we assumed in PR14. Overall, HS1 Ltd’s income exceeded expenditure by £1.6m, which represents £3.0m of financial outperformance relative to our determination.
HS1 Ltd underspend by £3.2m (43%) on the GSM-R capital upgrade due to a different delivery timetable than assumed in our determination.
Our report in 2015-16 improves our analysis of HS1 Ltd by providing a more detailed breakdown of the costs HS1 Ltd and NR(HS) incurs and by providing further details on its financial position.
HS1 Ltd paid £12.0m into the route escrow account in 2015-16, and the total balance in the escrow account is £45.5m at 31 March 2016. HS1 Ltd improved its management of the escrow account, which has increased the return generated to 0.7% for 2015-16, an increase of 0.5 percentage points. In cash terms, the escrow account generated £200k interest income in 2015-16, an increase of £100k compared to 2014-15.
3 In this section, we refer to HS1 Ltd’s financial performance with respect to the high speed rail network. It
does not include, for example, HS1 Ltd’s income and expenditure with respect to stations.
Office of Rail and Road | July 2016 Annual Report on HS1 Ltd 2015-2016 | 17
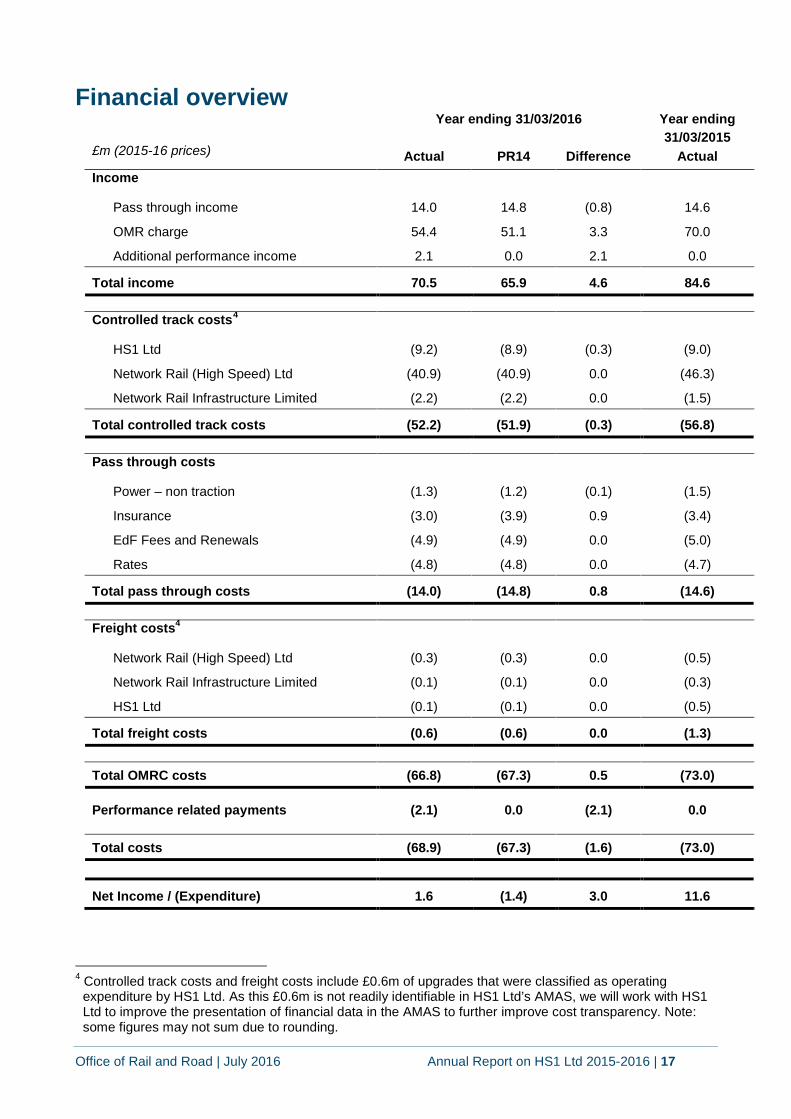
Financial overview
£m (2015-16 prices)
Year ending 31/03/2016 Year ending 31/03/2015
Actual PR14 Difference Actual Income
Pass through income 14.0 14.8 (0.8) 14.6
OMR charge 54.4 51.1 3.3 70.0
Additional performance income 2.1 0.0 2.1 0.0
Total income 70.5 65.9 4.6 84.6
Controlled track costs4
HS1 Ltd (9.2) (8.9) (0.3) (9.0)
Network Rail (High Speed) Ltd (40.9) (40.9) 0.0 (46.3)
Network Rail Infrastructure Limited (2.2) (2.2) 0.0 (1.5)
Total controlled track costs (52.2) (51.9) (0.3) (56.8)
Pass through costs
Power – non traction (1.3) (1.2) (0.1) (1.5)
Insurance (3.0) (3.9) 0.9 (3.4)
EdF Fees and Renewals (4.9) (4.9) 0.0 (5.0)
Rates (4.8) (4.8) 0.0 (4.7)
Total pass through costs (14.0) (14.8) 0.8 (14.6)
Freight costs4
Network Rail (High Speed) Ltd (0.3) (0.3) 0.0 (0.5)
Network Rail Infrastructure Limited (0.1) (0.1) 0.0 (0.3)
HS1 Ltd (0.1) (0.1) 0.0 (0.5)
Total freight costs (0.6) (0.6) 0.0 (1.3)
Total OMRC costs (66.8) (67.3) 0.5 (73.0)
Performance related payments (2.1) 0.0 (2.1) 0.0
Total costs (68.9) (67.3) (1.6) (73.0)
Net Income / (Expenditure) 1.6 (1.4) 3.0 11.6
4 Controlled track costs and freight costs include £0.6m of upgrades that were classified as operating
expenditure by HS1 Ltd. As this £0.6m is not readily identifiable in HS1 Ltd’s AMAS, we will work with HS1 Ltd to improve the presentation of financial data in the AMAS to further improve cost transparency. Note: some figures may not sum due to rounding.
Office of Rail and Road | July 2016 Annual Report on HS1 Ltd 2015-2016 | 18
Net income / (Expenditure) 3.1 In 2015-16, HS1 Ltd’s income exceeded expenditure by £1.6m, but in our
determination we assumed HS1 Ltd’s expenditure would exceed income by £1.4m. This financial outperformance of £3.0m is largely due to additional income as more passenger trains ran than we assumed in PR14 (£3.3m).
Income 3.2 In 2015-16, HS1 Ltd recovered £14.0m of pass through income5, compared to
£14.8m assumed in our determination, a difference of £0.8m (5.4%). In the year, HS1 also recovered £54.4m of income through charges for operating and maintaining the Network. This compares to £51.1m assumed in PR14, and represents a positive difference of £3.3m (6.5%). This is mainly due to more London & South Eastern Rail trains paths than assumed in our determination, which have increased by 2.5% in 2015-16.
3.3 HS1 Ltd also recovered £2.1m additional income from NR(HS) as part of an incentive mechanism. The additional income was subsequently paid on to operators as performance related payments and are analysed in the ‘Performance related payments’ section below.
Costs 3.4 HS1 Ltd’s costs are split into those it incurs operating and maintaining track, pass
through costs, freight-specific costs, performance related payments and the costs of upgrades.
Controlled track costs
3.5 Controlled track costs are costs incurred on the route and includes both HS1 Ltd’s and NR(HS)’s costs.
3.6 These costs include the cost of NR(HS) operating and maintaining track, HS1 Ltd’s own staff costs, and related back office costs. In 2015-16, HS1 Ltd incurred £52.2m controlled track costs, compared to £51.9m assumed in our determination, a difference of £0.3m (0.6%).
3.7 As NR(HS) are responsible for operations and maintenance of all track we have broken down in the following tables the actual costs that it has incurred. However, the financial overview presents separately the ‘controlled track costs’ and ‘freight costs’
5 HS1 Ltd’s charges to train operators include an element relating to pass through costs HS1 Ltd incur
running the railway that are largely uncontrollable by HS1 Ltd. These include non-traction electricity, electrical infrastructure costs, insurance and business rates. We review these costs in ‘Pass through costs’ on page 20.
Office of Rail and Road | July 2016 Annual Report on HS1 Ltd 2015-2016 | 19
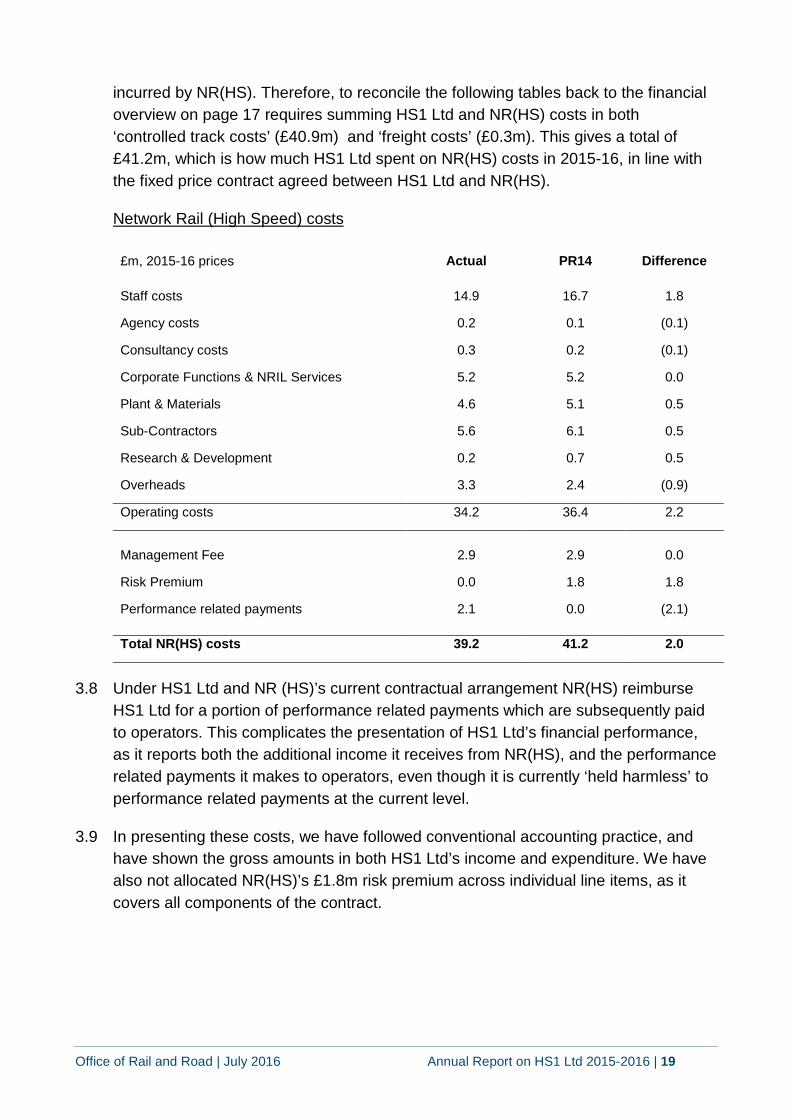
incurred by NR(HS). Therefore, to reconcile the following tables back to the financial overview on page 17 requires summing HS1 Ltd and NR(HS) costs in both ‘controlled track costs’ (£40.9m) and ‘freight costs’ (£0.3m). This gives a total of £41.2m, which is how much HS1 Ltd spent on NR(HS) costs in 2015-16, in line with the fixed price contract agreed between HS1 Ltd and NR(HS).
Network Rail (High Speed) costs
£m, 2015-16 prices Actual PR14 Difference
Staff costs 14.9 16.7 1.8
Agency costs 0.2 0.1 (0.1)
Consultancy costs 0.3 0.2 (0.1)
Corporate Functions & NRIL Services 5.2 5.2 0.0
Plant & Materials 4.6 5.1 0.5
Sub-Contractors 5.6 6.1 0.5
Research & Development 0.2 0.7 0.5
Overheads 3.3 2.4 (0.9)
Operating costs 34.2 36.4 2.2
Management Fee 2.9 2.9 0.0
Risk Premium 0.0 1.8 1.8
Performance related payments 2.1 0.0 (2.1)
Total NR(HS) costs 39.2 41.2 2.0
3.8 Under HS1 Ltd and NR (HS)’s current contractual arrangement NR(HS) reimburse HS1 Ltd for a portion of performance related payments which are subsequently paid to operators. This complicates the presentation of HS1 Ltd’s financial performance, as it reports both the additional income it receives from NR(HS), and the performance related payments it makes to operators, even though it is currently ‘held harmless’ to performance related payments at the current level.
3.9 In presenting these costs, we have followed conventional accounting practice, and have shown the gross amounts in both HS1 Ltd’s income and expenditure. We have also not allocated NR(HS)’s £1.8m risk premium across individual line items, as it covers all components of the contract.
Office of Rail and Road | July 2016 Annual Report on HS1 Ltd 2015-2016 | 20
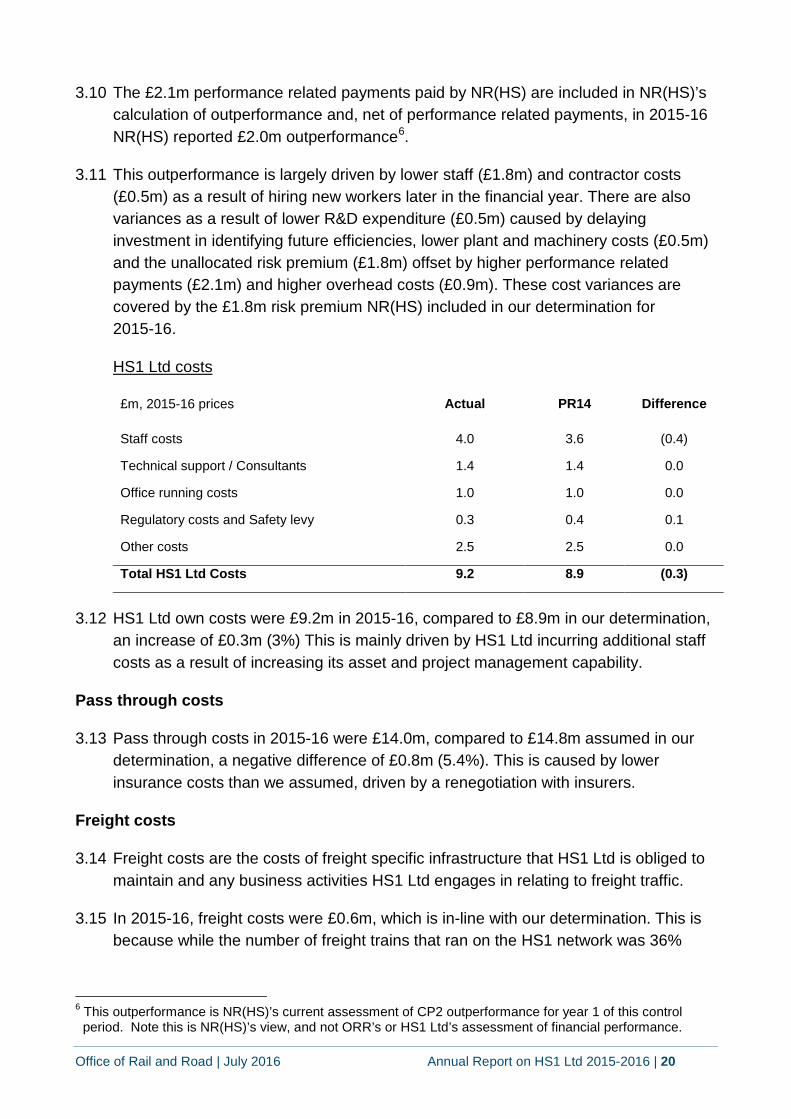
3.10 The £2.1m performance related payments paid by NR(HS) are included in NR(HS)’s calculation of outperformance and, net of performance related payments, in 2015-16 NR(HS) reported £2.0m outperformance6.
3.11 This outperformance is largely driven by lower staff (£1.8m) and contractor costs (£0.5m) as a result of hiring new workers later in the financial year. There are also variances as a result of lower R&D expenditure (£0.5m) caused by delaying investment in identifying future efficiencies, lower plant and machinery costs (£0.5m) and the unallocated risk premium (£1.8m) offset by higher performance related payments (£2.1m) and higher overhead costs (£0.9m). These cost variances are covered by the £1.8m risk premium NR(HS) included in our determination for 2015-16.
HS1 Ltd costs
£m, 2015-16 prices Actual PR14 Difference
Staff costs 4.0 3.6 (0.4)
Technical support / Consultants 1.4 1.4 0.0
Office running costs 1.0 1.0 0.0
Regulatory costs and Safety levy 0.3 0.4 0.1
Other costs 2.5 2.5 0.0
Total HS1 Ltd Costs 9.2 8.9 (0.3)
3.12 HS1 Ltd own costs were £9.2m in 2015-16, compared to £8.9m in our determination, an increase of £0.3m (3%) This is mainly driven by HS1 Ltd incurring additional staff costs as a result of increasing its asset and project management capability.
Pass through costs
3.13 Pass through costs in 2015-16 were £14.0m, compared to £14.8m assumed in our determination, a negative difference of £0.8m (5.4%). This is caused by lower insurance costs than we assumed, driven by a renegotiation with insurers.
Freight costs
3.14 Freight costs are the costs of freight specific infrastructure that HS1 Ltd is obliged to maintain and any business activities HS1 Ltd engages in relating to freight traffic.
3.15 In 2015-16, freight costs were £0.6m, which is in-line with our determination. This is because while the number of freight trains that ran on the HS1 network was 36%
6 This outperformance is NR(HS)’s current assessment of CP2 outperformance for year 1 of this control
period. Note this is NR(HS)’s view, and not ORR’s or HS1 Ltd’s assessment of financial performance.
Office of Rail and Road | July 2016 Annual Report on HS1 Ltd 2015-2016 | 21
lower than ORR assumed, the costs of freight assets operated and maintained by HS1 Ltd are largely fixed costs that do not vary with the number of trains that run.
Performance related payments
3.16 Performance related payments are payments made to train operators by HS1 Ltd to compensate operators for lateness caused by HS1 Ltd or where HS1 Ltd takes possession of the network to undertake maintenance.
3.17 In 2015-16, performance related payments included £2.3m paid by HS1 Ltd to operators for lateness caused by trespass, offset by £0.2m received by HS1 Ltd when it exceeded its performance benchmarks. The £2.3m for 2015-16 includes £0.8m relating to March 2015 (part of 2014-15).
Upgrades
3.18 In addition to the day-to-day operation of its rail network, HS1 Ltd also performs upgrades to ensure its network continues to meet the needs of customers.
3.19 HS1 Ltd spent £4.1m on capital7 upgrades in 2015-16 on GSM-R, compared to £7.3m assumed in CP2, a difference of £3.2m (43%). This underspend is due to a different delivery timetable than assumed in our determination. In addition, HS1 Ltd also spent £0.6m on ‘opex’ upgrades on GSM-R, which were upgrades to the network that did not meet the criteria for capitalisation in HS1 Ltd’s statutory accounts.
Efficiency 3.20 HS1 Ltd does not currently report on efficiency. However, it is important that we
understand how efficient HS1 Ltd is both to confirm how HS1 Ltd is doing compared to the efficiency challenge that we set it and to inform our next review of its charges.
3.21 In this report, we have calculated a very simple8 measure of efficiency for 2015-16 for both NR(HS) and HS1 Ltd’s own costs. In 2015-16 NR(HS) efficiency was 4.9% on its own costs, while HS1 Ltd had negative efficiency of 3% on its own costs9.
3.22 We will work with HS1 Ltd to develop its Cost Efficiency Plan in the coming year as it prepares for the next periodic review (PR19), and will develop the way we monitor efficiency accordingly.
7 HS1 Ltd capitalise their costs when the expenditure creates an economic resource from which they expect
to derive economic benefits. 8 In line with our approach to monitoring efficiency in Network Rail, our simple measure of efficiency expresses the variance between actual expenditure and the actual CP1 exit costs as a percentage of the assumption of the CP1 exit costs. In other words, if HS1 Ltd were to report actual costs of £80 against a CP1 exit cost of £100, the reported efficiency would be 100 – 80 = 20 / 100 = 20%. 9 Our approach only includes those costs HS1 Ltd both controls and bears. This therefore excludes the
impact of movements in pass through costs, as these costs are paid for by operators.
Office of Rail and Road | July 2016 Annual Report on HS1 Ltd 2015-2016 | 22
Financial overview of HS1 Ltd’s statutory financial statements 3.23 In addition to considering specific efficiency measures, we need to understand HS1’s
broader financial position and understand its approach to risk. This section includes a description of the movements in HS1 Ltd’s net assets and the debt service cover ratio for HS1 Ltd10 based on recent credit rating agency reports on the bonds issued by the HS1 group.
3.24 As reported in its statutory accounts for 2015-16 HS1 Ltd reported an accounting loss of £94.6m. As discussed in the introduction, this loss is not directly comparable with the financial performance discussed above. This is because of a number of factors:
statutory turnover in HS1 Ltd includes income received from the investment recovery charge as well as ancillary services;
the costs of HS1 Ltd also include finance payments made by HS1 to external debt creditors and other companies in the group; and
the statutory accounts includes a charge for depreciation, which is not aligned to the renewals expenditure incurred by HS1 Ltd.
3.25 HS1 Ltd reported £180.5m earnings before interest, tax, depreciation and amortisation (EBITDA).
3.26 As at 31 March 2016 HS1 Ltd’s net liabilities were £78.2m, a decrease of £85.5m since 31 March 2015, largely caused by the accounting loss HS1 Ltd reported in the year. Over the same period, HS1 Ltd’s current assets were £330m, and exceeded its current liabilities by £91m.
3.27 This means that while HS1 Ltd has sufficient assets to pay its liabilities due in the next 12 months, HS1 Ltd does not have sufficient assets to pay all its creditors in the event it ceased trading. However this position is mitigated by the going concern factors set out by the directors of HS1 Ltd in Note 1 to the company’s statutory accounts, in particular the sufficiency of future cash flows and the considerable certainty HS1 Ltd has over its short and medium term revenue levels.
3.28 In analysing HS1 Ltd’s financial position to understand the risks it is exposed to, we recognise that it is important to consider the position of the wider group of companies of which it is part. For example, debt for HS1 Ltd is raised at the group level by High Speed Rail Finance 1 Plc and High Speed Rail Finance Plc (subsidiaries of HS1’s immediate parent company, Helix Acquisition Ltd). High Speed Rail Finance 1 Plc
10 Although HS1 Ltd operates the concession, High Speed Rail Finance 1 Plc and High Speed Rail Finance Plc are the subsidiaries of Helix Acquisition Limited (the immediate parent company of HS1 Limited) that raise debt in the group.
Office of Rail and Road | July 2016 Annual Report on HS1 Ltd 2015-2016 | 23
and High Speed Rail Finance Plc then provide finance to HS1 Ltd, which then pays finance charges.
3.29 Based on recent credit rating agency reports on High Speed Rail Finance 1 Plc, the debt service cover ratio for 2015-16 was 2.1x (2.0x in 2014-15), which means in 2015-16 it generated sufficient earnings to service its interest costs.
Route escrow account 3.30 As specified in the Concession Agreement, HS1 Ltd collects access charges from
train operators and pays some of the money into the route escrow account each year to fund the renewal and replacement of the railway line in the future. This helps to protect intergenerational equity, and fulfils a similar function to the Regulated Asset Base (RAB) in Network Rail and other infrastructure providers.
3.31 In 2015-16 HS1 Ltd paid £12.0m into the escrow account, compared to our determination assumption of £11.7m, a difference of £0.3m (3%) because as the Escrow charge is calculated on a per-train basis there were more trains run than planned. It withdrew £0.3m in 2015-16 to fund the renewal of its rail network, and it earned £0.2m interest, compared to £0.4m assumed in PR14. This is because the effective interest rate on the escrow account was 0.7%, compared to 1.1% assumed in PR14, and is mostly caused by lower interest rates than assumed in our determination.
3.32 In the year, the average interest rate on funds in the escrow account improved from 0.3% to 0.7%. This is because changes in the governance arrangements of the escrow account improved in the year, permitting HS1 Ltd to invest in longer duration investment products.
Office of Rail and Road | July 2016 Annual Report on HS1 Ltd 2015-2016 | 24
4. Track access Overview All new framework track access agreements for the HS1 network, and amendments to them, need our approval. These are contracts between HS1 Ltd and train operators which allow access to the HS1 network and provide for the reservation of capacity for more than one timetable period.
Train operators can appeal to us in respect of the terms for track access and more generally under the Regulations.
Throughout the year we have continued to deal in a timely manner with all access applications whilst working with HS1 Ltd to ensure that appropriate policies and associated documentation are in place. Against this background, HS1 Ltd continues to progress access arrangements to encourage utilisation of the network by both passenger operators (national and international) and freight operators.
Eurostar International Limited 4.1 On 6 November 2015 ORR approved the 5th Supplemental Agreement to the track
access contract between HS1 Ltd and Eurostar International Ltd. This agreement granted Eurostar the rights necessary to allow use of the new Class 374 “e320” rolling stock from 20 November 2015.
London & South Eastern Railway Limited 4.2 On 4 December 2015 ORR approved the 4th Supplemental Agreement to the track
access contract between HS1 Ltd and London & South Eastern Railway Limited (“LSER”). The purpose of this agreement was to remove LSER’s firm rights for 26 December of each year.
Ripple Lane Exchange Sidings 4.3 HS1 Ltd is the infrastructure manager of the Ripple Lane sidings. These sidings are
predominantly used by freight services coming off the Network Rail network. In our 2014 Periodic Review of HS1 (“PR14”) Approval Document we advised that HS1 Ltd must either transfer the ownership of these sidings to Network Rail Infrastructure Ltd, or begin charging for access in CP2. HS1 Ltd consulted in January 2016 in order to start charging freight trains for access, and began charging for access in April 2016.
Office of Rail and Road | July 2016 Annual Report on HS1 Ltd 2015-2016 | 25
5. Safety Overview Under the Railways and Other Guided Transport Systems (Safety) Regulations 2006, the infrastructure manager, NR(HS), has duties to establish and maintain a safety management system as set out in the Regulations. NR(HS) was issued with a safety authorisation in accordance with the Regulations in October 2009, which was renewed in March 2012 for a period of five years.
Safety activities during 2015-16 5.1 During 2015-16 we carried out the following supervision activities;
ORR held regular liaison meetings with NR(HS) managers to discuss on-going safety performance.
Following an increase in the number of incidents of unauthorised persons travelling on freight trains on both the Channel Tunnel concession and HS1, we reviewed NR(HS)’s arrangements for managing this type of incident.
We visited the HS1 signalling and control centre at Ashford. As part of the visit, inspectors examined the arrangements for switching and isolation of overhead line equipment by the Electrical and Mechanical Management and Information System (EMMIS) controller.
The daily HS1 operations log is also monitored for any incidents that may require further investigation.
5.2 We have encouraged HS1 Ltd and NR(HS) to adopt the ORR risk management maturity model (RM3) as a tool to improve the capability of health and safety management on the HS1 network. Further information on RM3 can be found on the ORR website.
5.3 Further information on health and safety performance on all of Britain’s railways in 2015-16 can be found in ORR’s health and safety annual report for 2015-16 and on the mainline railway (which includes the HS1 network) can be found in the Rail Safety and Standards Board (RSSB) Annual Safety Performance Report 2015-16.
© Crown copyright 2016
This publication is licensed under the terms of the Open Government Licence v3.0 except where otherwise stated. To view this licence, visit nationalarchives.gov.uk/doc/open-government-licence/version/3 or write to the Information Policy Team, The National Archives, Kew, London TW9 4DU, or email: [email protected].
Where we have identified any third party copyright information you will need to obtain permission from the copyright holders concerned.
This publication is available at orr.gov.uk
Any enquiries regarding this publication should be sent to us at orr.gov.uk
5.4 Further information on our approach to regulating health and safety risks created and managed by businesses in the railway industry can be found in our strategic risk priorities document.
Proposed health and safety regulation activities for 2016-17 5.5 The following health and safety regulation activities are proposed for 2016-17;
The assessment of NR(HS)’s application to renew their safety authorisation for
HS1;
The assessment of Babcock Rail’s application to renew their safety certificate to
operate on HS1;
An inspection of NR(HS)’s arrangements for the inspection and monitoring of
track condition, to be carried out with the support of ORR’s specialist track
inspection team;
Regular liaison meetings with NR(HS) throughout the year; and
The investigation of incidents in accordance with ORR’s processes.