Embed Size (px)
Citation preview

1
2

On average 126 people die from extreme heat in Arizona each year. Heat-related illness (HRI) can affect anyone, even healthy individuals. People who are exposed to excessive natural heat, such as individuals who hike on an excessive heat warning are at increased risk for HRI. Recently a few hikers passed away hiking this summer. Additionally, small children/infants left in cars are at risk. Heat- related illness can even occur indoors. People who may not use their air conditioning during the summer in Arizona may also be at risk. In summary, vulnerable populations include older adults, young children, people who exercise/play outdoors, people with a chronic medical condition, outdoor occupation, low income, and the homeless.
3
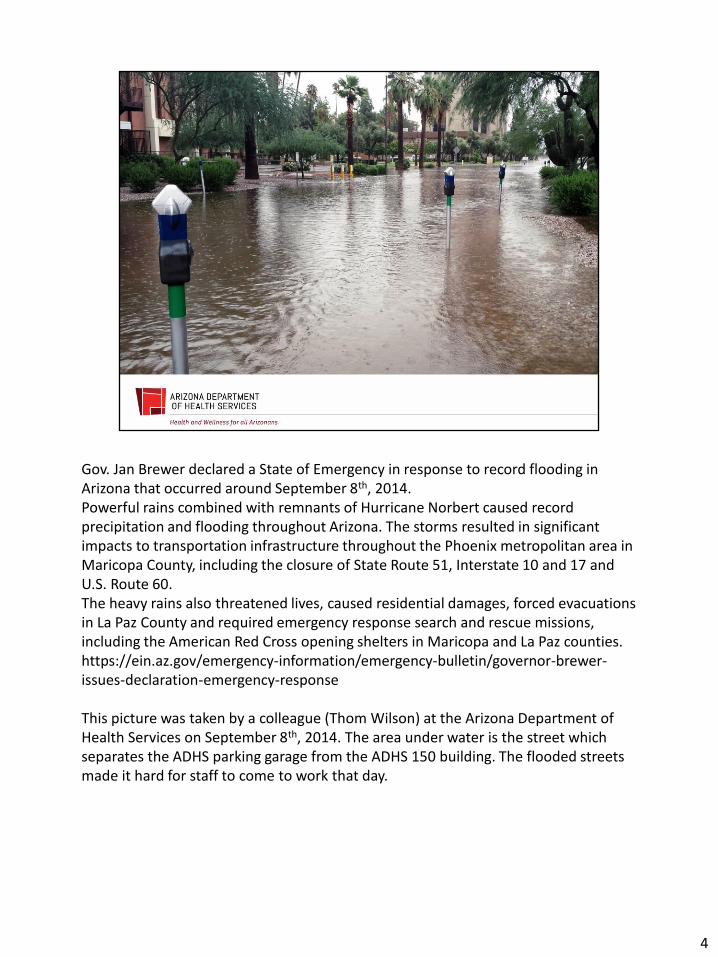
Gov. Jan Brewer declared a State of Emergency in response to record flooding in Arizona that occurred around September 8th, 2014. Powerful rains combined with remnants of Hurricane Norbert caused record precipitation and flooding throughout Arizona. The storms resulted in significant impacts to transportation infrastructure throughout the Phoenix metropolitan area in Maricopa County, including the closure of State Route 51, Interstate 10 and 17 and U.S. Route 60. The heavy rains also threatened lives, caused residential damages, forced evacuations in La Paz County and required emergency response search and rescue missions, including the American Red Cross opening shelters in Maricopa and La Paz counties. https://ein.az.gov/emergency-information/emergency-bulletin/governor-brewer-issues-declaration-emergency-response This picture was taken by a colleague (Thom Wilson) at the Arizona Department of Health Services on September 8th, 2014. The area under water is the street which separates the ADHS parking garage from the ADHS 150 building. The flooded streets made it hard for staff to come to work that day.
4

This picture was taken on September 8th, 2014 when record rainfall flooded the I-10 Highway in Phoenix. 128 fatalities from flooding occurred in Arizona between 1964 and 2012, according to the 2013 State of Arizona Hazard Mitigation Plan
5

During a dust storm, wind gusts over 40 mph can occur and visibility below ¼ mile. These walls of dust can possibly nearly 5,000 feet tall. You could possibly have visibility near zero driving through a dust storm. If you encounter blowing dust on the roadway pull off the road as far as possible and put your vehicle in park. Turn the lights off and keep your food off the brake pedal. Remember pull aside, stay alive. Driving through a dust storm can raise the risk of a motor vehicle accident and injury. Dust storms can also exacerbate respiratory illness in those sensitive to particulate matter in the air.
6

http://cals.arizona.edu/backyards/sites/cals.arizona.edu.backyards/files/p16.pdf Nine lightning related deaths were recorded in Arizona between 1997 and 2006.
7

Yarnell Hill Fire June 2013 in Yavapai County. 19 Firefighters from lost their lives. It was caused by lightning.
8

9

This graphic was developed by the CDC Climate and Health Program. Climate hazards impact a wide-range of health outcomes, this slide (when animated) illustrates the most salient climate impacts, their effect on exposures, and the subsequent health outcomes that result from these changes in exposures. For Arizona, we can disregard the sea level risk exposure, due to being a landlocked state.
10

There are 16 states and 2 cities working on building resilience against climate effects in the public health sector. Arizona is one of the funded states by the CDC’s Climate Ready States and Cities Initiative to work on challenges related to climate and health such as extreme heat, flooding, and drought.
11

The CDC’s BRACE Framework. http://www.cdc.gov/climateandhealth/BRACE.htm
12

ADHS has 2 reports which describe climate and health issues in Arizona and implementation of the BRACE Framework. There is a long version (60+ pages) and a short version (synthesis report) 10 pages which highlights key points. The reports can be found here: http://www.azdhs.gov/preparedness/epidemiology-disease-control/extreme-weather/index.php#news-publications
13

Less than 10 inches of rain in usually in northern and southern AZ. Some areas as low as less than 3 inches of rain.
14

The pictures indicate a few of the challenges we face regarding extreme weather in AZ. The pictures illustrate extreme heat, extreme cold, flooding, and dust storms.
15

Using data from 2005-2015, climate scientists at Arizona State University created a map which shows the daily maximum temperature on the 10th hottest day of the year in Arizona. The 10th hottest day is equivalent to being a severely hot day in a given year or roughly the 97th percentile. The darker orange colors indicate a hotter temperature (~115) and the green indicates cooler temperatures (~75).
16

Climate scientists at ASU used the maximum temperature of the 10th hottest day of the year as the exposure metric for heat. The choice of maximum temperature (versus mean or minimum temperature) is guided by epidemiological analysis conducted in Maricopa County that shows that maximum temperature is among the variables most closely related to adverse heat-health events (Petitti et al. 2015). The choice of the 10th hottest day (versus the hottest, or the 30th hottest) is based on the intention to identify relatively severe heat events in most places in the state without using the upper-most end of the temperature distribution where climate model projections have more uncertainty. For reference, the temperature of the 10th hottest day of the year is equivalent to approximately the 97th percentile annual temperature or the 90th percentile temperature of a summer season that lasts 100 days; these values fall within the ranges commonly used in epidemiological analyses of heat-health impacts (e.g., Anderson and Bell 2009, D’Ippoloiti et al. 2010). Downscaled and bias-corrected climate model projections for the period 2005–2015 were used to characterize the heat hazard in Arizona .The maximum temperature of the 10th hottest day of the year in the state varies from a minimum of 75.5°F in southern Apache County (observed approximately halfway between Whiteriver and Eagar) to a maximum of 114.9°F in southwestern Mohave County (observed approximately halfway between Lake Havasu City and Bullhead City). The statewide average daily maximum temperature on the 10th hottest day of the year is 100.1°F. La Paz and Yuma Counties have the highest average temperatures on the 10th hottest day (both above 110°F), while Apache and Greenelee have the coolest 10th hottest
17

days (92.0°F and 94.0°F, respectively).
17

Most heat-related deaths in Arizona occur between May and September. The highest amount of deaths occurs in July.
18

In 2015, there were 582 inpatient admissions in Arizona hospitals for a heat-related illness. There were also 2,434 ED visits. These include cases of heat exhaustion and heat stroke. Heat stroke is a life threatening medical emergency.
19

The table on the right is an example of an air quality alert which looks at air pollutants such as ozone, carbon monoxide, PM 2.5 , and PM 10. The 2.5 means less than 2.5 microns and 10 means less than 10 microns. Particulates in the air can cause exacerbations of symptoms of respiratory illness. The smaller the particle, the deeper it can also can get into the lungs and cause more harm. Today’s air quality forecast can be viewed here http://www.azdeq.gov/node/661.
20
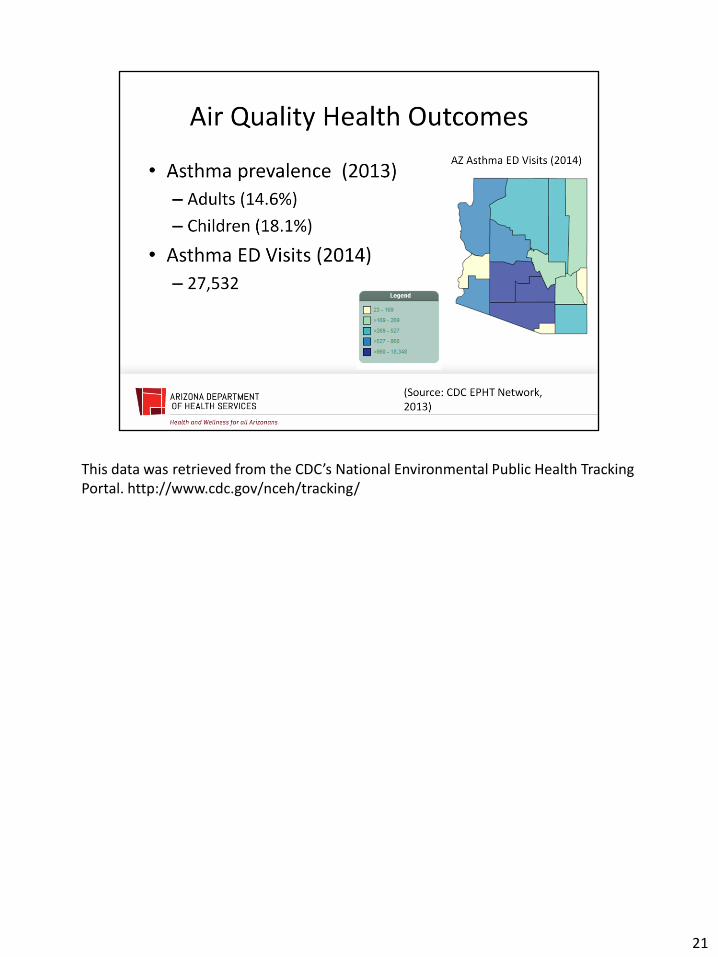
This data was retrieved from the CDC’s National Environmental Public Health Tracking Portal. http://www.cdc.gov/nceh/tracking/
21

Unhealthy and very unhealthy days apply to everyone in the area.
22

The dark red color indicates a higher percent of days where the air quality index is above 100 and is unhealthy for sensitive groups.
23

The map on the left shows areas of extreme precipitation in the dark blue color using data from 2005-2015. The map on the right shows wildfire areas occurring in Arizona between 1980-2013. More of the wildfires are clustered in the orange areas.
24

25

26

Steady increase over time, interrupted by a massive increase and decrease between reporting and test changes in late 2000s. May be back to the earlier increasing trend, as shown by the 2015 data
27

The abundance and distribution of mosquitoes are dictated by the climate they experience. Immature stages of mosquitoes require aquatic environments to complete development. Speed of development, survival, and host-seeking and dispersal behavior of adults are driven by temperature (though there are thresholds for temperature). Warming is usually associated with faster development. Disease occurs with greater abundance of mosquitoes. A greater abundance of mosquitoes increases the probability of bites from infectious vectors.
28

29

Social vulnerability takes into account social factors which could hinder a community’s ability to prepare for, respond to, and recover from hazards. SoVI or the social vulnerability index are a composite of scores taken together on factors such as percentage of the population in poverty, population percentage over 65, and population percentage living alone. Several climate ready states and cities initiative states are using the SoVI to help understand risk to climate hazards. This tool was developed by the hazards and vulnerability research institute at the University of South Carolina. http://webra.cas.sc.edu/hvri/products/sovi.aspx
30

31

32

The maps and tables of climate projections described in this report will be published in the next few months as a report developed with support by Arizona State University and the University of Arizona.
33

Projected change in temperature of the 10th hottest day of the year across the State of Arizona over time. The maroon areas on the figure detail the range of temperatures of the 10th hottest projected by different climate models for the RCP8.5 emissions scenario across time (a more worst case scenario). The gold areas show the range of temperatures projected by climate models for the RCP 4.5 emissions scenario across time (middle range scenario).
34
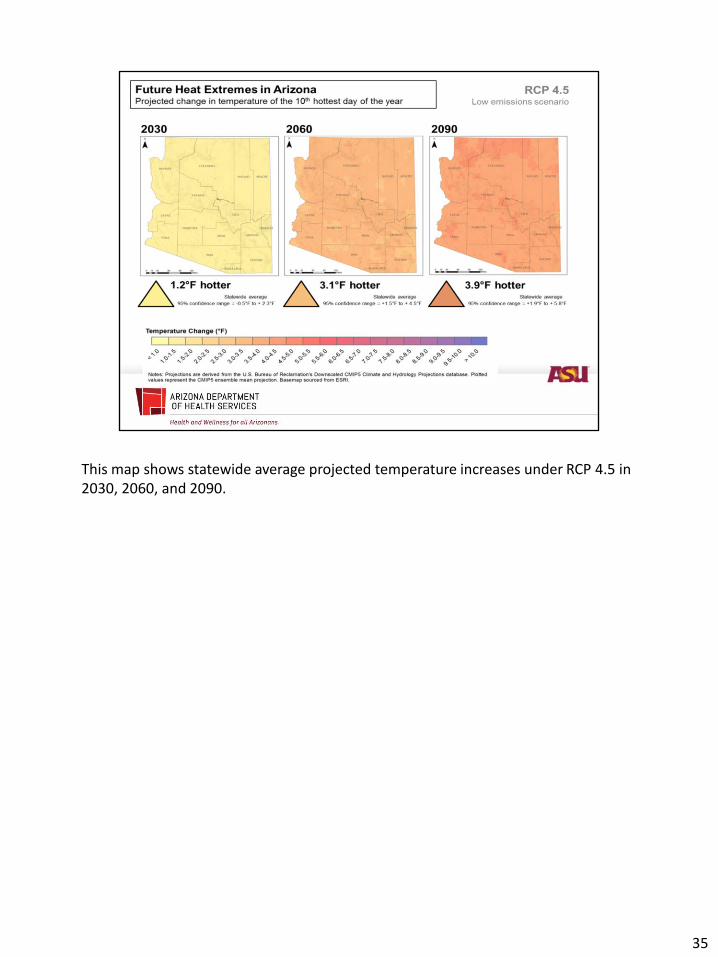
This map shows statewide average projected temperature increases under RCP 4.5 in 2030, 2060, and 2090.
35

This map shows statewide average projected temperature increases under RCP 8.5 in 2030, 2060, and 2090.
36

This graph shows mosquito abundance. The green line represents mosquito abundance in Arizona now and the blue line represents projected changes in the future mid-century. Earlier abundance due to a milder winter can be seen on the left hand side of the graph. An extension of the season for mosquito abundance can be seen on the right side of the graph. Figure 6. Schematic of vector abundance over a year. This figure provides a generic annual abundance of mosquitoes under current and future climate. Using empirically derived temperature dependent growth rates coupled with daily temperature and precipitation, Dynamic Mosquito Simulation Model (DyMSiM) estimates the abundance of three West Nile virus and one dengue vectors (Morin and Comrie 2010; Brown et al. 2015). Morin, C. W., Comrie, A. C. (2010). “Modeled response of the West Nile virus vector Culex quinquefasciatus to changing climate using dynamic mosquito simulation model.” Int J Biometeorol 54: 517-529.
37

38

To learn more about EPA’s Air Quality Notification System visit here. https://airnow.gov/
39

The CDC has a drought communication toolkit for drought and health issues. The toolkit can be found here http://www.cdc.gov/nceh/drought/toolkit/industry.htm. One of the resources for drought and mental health is a disaster distress helpline. http://www.samhsa.gov/find-help/disaster-distress-helpline
40

Educational materials such as heat-related illness brochures can provide details on how to prevent, recognize, and treat heat-related illness. Cooling centers are locations people can go to get out of the heat during the hottest part of the day. In Maricopa County, these buildings are air-conditioned and are available from May through September. It is free for anyone to go to these places. Most locations also offer free bottles of water. A map of these centers in Maricopa as well as in other parts of the state can be found here. http://www.azdhs.gov/preparedness/epidemiology-disease-control/extreme-weather/index.php#heat-illness
41

Real-time data and surveillance, such as syndromic surveillance provide public health officials with the knowledge of recent heat-related illness cases in hospitals from a recent or current heat warning. Heat alert systems are valuable because it provides the general public with knowledge about upcoming extreme heat days. National Weather Service issues heat alerts. Currently ADHS relays these alerts through email distribution lists to the general public and school officials. ADHS adds public health safety messages to the alert to help people be prepared.
42

43

44

45

46
ADHS is currently in the process of applying for CDC’s Climate and Health Adaptation and Monitoring Program (CHAMP) Grant. This grant aims to help AZ implement interventions to reduce the impacts of climate hazards.
47

48

49