Embed Size (px)
Citation preview

Oil Crops Situation and Outlook Yearbook. Market and Trade Economics Division, Economic Research Service,U.S. Department of Agriculture, October 2003, OCS-2003.
Contents
Summary . . . . . . . . . . . . . . . . . . . . . . . . . . . . . . . . . . . . . . . . . . . . . . . . . . . .2
Outlook for 2003/04 . . . . . . . . . . . . . . . . . . . . . . . . . . . . . . . . . . . . . . . . . . . .3
U.S. Soybean Review, 2002/03 . . . . . . . . . . . . . . . . . . . . . . . . . . . . . . . . . . .7
Situation for Other U.S. Oil Crops . . . . . . . . . . . . . . . . . . . . . . . . . . . . . . .11Cottonseed . . . . . . . . . . . . . . . . . . . . . . . . . . . . . . . . . . . . . . . . . . . . . . . . .11Peanuts . . . . . . . . . . . . . . . . . . . . . . . . . . . . . . . . . . . . . . . . . . . . . . . . . . . .11Sunflowerseed . . . . . . . . . . . . . . . . . . . . . . . . . . . . . . . . . . . . . . . . . . . . . .12Other Oilseeds . . . . . . . . . . . . . . . . . . . . . . . . . . . . . . . . . . . . . . . . . . . . . .13
Other Fats and Oils Highlights . . . . . . . . . . . . . . . . . . . . . . . . . . . . . . . . .14
World Oilseed and Protein Meal Situation . . . . . . . . . . . . . . . . . . . . . . . .15
World Vegetable Oil Situation . . . . . . . . . . . . . . . . . . . . . . . . . . . . . . . . . .21
List of Tables . . . . . . . . . . . . . . . . . . . . . . . . . . . . . . . . . . . . . . . . . . . . . . . .23
Report CoordinatorMark Ash
(202) 694-5289E-mail: [email protected]
Principal ContributorsMark Ash (Soybeans, Other Oilseeds, Vegetable Oils)
Erik Dohlman (202) 694-5308 (Peanuts)Wilma Davis (202) 694-5304 (Statistics)
EditorDana Rayl West
Graphics, Table Design & LayoutWynnice Pointer-Napper
Approved by the World Agricultural Outlook Board.Summary released October 23, 2003. Summaries andfull text of Situation and Outlook reports may beaccessed electronically via the ERS website at
www.ers.usda.gov/. To order, call 1-800-999-6779 inthe United States or Canada. Other areas please call(703) 605-6220. Or write ERS-NASS, 5285 Port RoyalRoad, Springfield, VA 22161.
Excel spreadsheet versions of the tables printed herein can be downloaded from the ERS website athttp://www.ers.usda.gov/publications/so/view.asp?f=field/ocs-bb/
Note: Due to a change in the report schedule, the next Oil Crops Yearbook will be published in March 2005.

The 2002 soybean harvest was determined to be 2,749million bushels from 72.4 million acres harvested.Record levels for domestic crushing and exports in thepreceding year had reduced 2002/03 beginning stocksto 208 million bushels, compared with 248 million ayear earlier. Together, they cut the 2002/03 supply by179 million bushels from 2001/02 to 2,962 million.
U.S. soybean exports to most countries (excludingChina) declined in 2002/03, slipping to 1,045 millionbushels from the record 2001/02 exports of 1,063 mil-lion. Processors could defend profit margins from ris-ing soybean costs only by scaling back operating timeat oil mills, which reduced the 2002/03 crush to 1,615million bushels from 1,700 million in 2001/02. Evenwith use rationed in the final quarter, season-endingstocks dropped to 169 million bushels from 208 mil-lion in 2001/02. The depletion of supplies strengthenedthe 2002/03 national average farm price to $5.53 perbushel from $4.38 in 2001/02.
The season average price for soybean meal rose to$182 per short ton versus $168 per short ton in2001/02. Heavier use of distillers’ grains and corngluten helped limit the domestic consumption of soy-bean meal in 2002/03, which fell 3 percent to 32.2million short tons. Greater domestic consumption andforeign production of soybean meal depressed U.S.soybean meal exports to 6.05 million tons in 2002/03from 7.5 million in 2001/02.
Even with a smaller output of soybean oil, large carry-over stocks allowed U.S. soybean oil exports to remainrelatively high at 2,250 million pounds. Total soybeanoil demand remained constant in 2002/03. However, areduction in the supply by nearly 1 billion poundssharply cut the ending stocks from 2,359 million to1,486 million pounds for the smallest carryout in 4years. The season average price strengthened to 22.0cents per pound compared with a 2001/02-average of16.5 cents.
Domestic cottonseed output for 2002 dropped 17 per-cent from the previous year to 6.2 million short tons.The shortfall raised the season average farm price forcottonseed to $100 per ton from $93 in 2001/02.Consequently, cottonseed crushing fell to 2.5 millionshort tons in 2002/03 from 2.8 million in 2001/02.Domestic cottonseed oil output slumped in 2002/03 toa modern era low of 725 million pounds. A large pricepremium stifled both domestic and export demand forcottonseed oil, which plummeted to 636 million and110 million pounds, respectively.
U.S. sunflowerseed production in 2002 fell more thanone-fourth to 2,490 million pounds. Although sun-flower planting declined only 2 percent in 2002, har-vested acreage fell 15 percent. The season averagefarm price for sunflowerseed (all types) climbed to12.2 cents per pound, its highest level in 9 years. Asevere 805-million pound reduction in the oil-type sun-flowerseed supply led to domestic processors consum-ing only 703 million pounds, the least since 1978/79.Sunflowerseed oil exports, which dropped by three-fourths to 110 million pounds, bore the brunt of thesupply shortage, although domestic consumption alsofell to 268 million pounds, down 28 percent from2001/02.
World oilseed production rose to 328.9 million metrictons for 2002/03, from 324.4 million the previous year.Soybean production gained 11.9 million metric tons to196.4 million, more than offsetting production declinesfor other oilseeds. Larger crops from Brazil andArgentina accounted for nearly all of the soybeanincrease. Brazilian soybean production surged to 52.5million tons in 2002/03, up from 43.5 million the yearbefore. Argentine soybean production rose to 35.5 mil-lion tons in 2002/03 from 30.0 million in 2001/02.China’s 2002/03 soybean imports soared to 20.3 mil-lion tons from 10.4 million in 2001/02 after an exten-sion of the transition period for its import regulationson biotech crops.
2 l Oil Crop Situation and Outlook Yearbook / OCS-2003 / October 2003 Economic Research Service/USDA
Summary

More Serious Damage to the U.S.Soybean Crop Discovered
The October Crop Production report indicated that theimpact of last summer’s drought was significantly worsethan first thought. New survey data for many Statesfound lower counts of pods with beans. Crop prospectswere also diminished in many areas by disease and pestproblems. The U.S. Department of Agriculture (USDA)forecast the 2003 soybean yield at just 34.0 bushels peracre, down from the September forecast of 36.4 bushelsand well below last year’s yield of 38.0 bushels. Thiswould be the smallest yield since 1993. The harvestedarea estimate was shaved to 72.5 million acres based on2003-crop preliminary USDA administrative data,which (when combined with the lower yield) cut theOctober soybean production forecast to 2,468 millionbushels. That crop is 175 million bushels smaller thanthe previous month’s estimate. If realized, it would be281 million bushels less than the 2002 harvest and thesmallest soybean crop since 1996. As of October 26, 85percent of the U.S. soybean harvest had been complet-ed, which is on par with the 5-year average.
Total soybean supplies for 2003/04 were buoyedslightly by findings from the latest Grain Stocks reportthat beginning stocks (at 169 million bushels) were 29million bushels higher than the previous forecast. Thatreport also indicated a larger final estimate (up 19 mil-lion bushels to 2,749 million) for the 2002 soybeancrop. However, those results were dwarfed by the mag-nitude of the reduction in the 2003 crop.
U.S. export sales of soybeans are strong this fall asforeign buyers are securing their near-term supplyrequirements. As of October 16, exporters had sold470 million bushels of soybeans, up from 360 milliona year earlier. However, future sales should slow as ris-ing U.S. prices prompt foreign buyers to look for signsof better buying opportunities next year from SouthAmerica. In addition, an unusually rapid rise in oceanfreight costs, particularly to Asia (which is escalatingbecause of heavy demand by other types of bulkcargo), may encourage foreign importers to postponesome near-term buying. The U.S. export forecast for2003/04 was lowered to 870 million bushels, down 70million from the September forecast.
As in 2002/03, the rapid commitment of soybean sup-plies to foreign buyers is exacerbating the plight of
domestic crushers. Compelled to bid more aggressive-ly for this season’s smaller domestic supply, U.S.processors must receive higher prices for soybean mealand oil to maintain profitability. While values in thevegetable oil market are strengthening, for soybeanmeal there could be greater resistance to a higherprice. Greater availability of protein feed substitutes,both here and abroad, will make them more favorablyvalued against U.S.-produced soybean meal. Thesewere reasons for another reduction in the 2003/04crush forecast to 1,510 million bushels.
Year-ending stocks of soybeans could get very tighteven with a large reduction in use. The 2003/04 carry-out is seen slipping to just 130 million bushels. Theonly way to insure that there will be even a minimalsoybean carryover is for prices to increase. BetweenAugust and September, soybean prices in centralIllinois rose sharply about 80 cents per bushel. Bymid-October, prices were still rising to about $7.25 perbushel, their highest level in 6 years. The expected sea-son average soybean price was raised to $6.05-$6.95per bushel from $5.25-$6.15 previously.
The number of U.S. hogs and pigs on September 1was 2 percent lower than it was a year earlier. Thereshould be some increase in pig crops over the nextyear, however, as farrowing intentions are down just 1percent for the fall and they are even with last year forthe winter quarter. Poultry producers are likely toincrease the number of birds fed next year, also. Whilethese factors should help support total feed demand,the comparatively higher cost of soybean meal couldrestrict its consumption in 2003/04. Central Illinoissoybean meal prices are expected to rise to $185-$215per short ton. Domestic disappearance of soybean mealis again forecast lower for 2003/04 at 31.3 milliontons. Foreign end users have even more options andU.S. exports of soybean meal are seen sliding 17 per-cent to 5.0 million tons. The lack of domestic output isalso anticipated encouraging a record volume of soy-bean meal imports near 340,000 tons.
Soybean oil prices have risen sharply since August (tonearly 28 cents per pound) because of the threats topotential supplies. The reduced crush and stock carry-over is expected to slash 2003/04 soybean oil supplies by2.15 billion pounds. Apart from the impact of last sum-mer’s drought on the expected availability of soybeansfor crushing, a freeze in early October may have hurt
Economic Research Service/USDA Oil Crop Situation and Outlook Yearbook / OCS-2003 / October 2003 l 3
Outlook for 2003/04

some late-planted fields in the northern Midwest andOhio River valley. This event may ultimately reduce oilyields and quality for soybeans that did not fully matureby that time. Average soybean oil prices in 2003/04 are projected to rise to 23.5-26.5 cents per pound. Thelast time that soybean oil prices were as high was in1997/98, although the reasons then were primarily relat-ed to strong demand rather than a short supply.
Prices at this level will severely constrain the potentialfor U.S. soybean oil exports in 2003/04, which wouldbe down more than 60 percent from the previous sea-son. Ending stocks of soybean oil do not have as muchroom to fall as they did in 2002/03, when nearly 800million pounds were consumed from storage. The pro-jected 2003/04 carryout of 1,218 million pounds wouldbe less than a month’s rate of use. Therefore, the tight-ening supply will most likely impose a reduction on thedomestic use of soybean oil, as well. U.S. disappearanceis forecast declining in 2003/04 to 16,600 millionpounds, which would be down more than 2 percentfrom the preceding year. Greater use of canola oil, cornoil, sunflowerseed oil, and cottonseed oil next yearshould offset the loss of demand for soybean oil.
Soybean Shortage To Boost DomesticDemand for Other Oilseeds
As with soybeans, a dry summer in North Dakota andSouth Dakota in 2003 also curtailed production of sun-flowerseed. For the second consecutive year, sunflow-erseed yields were hurt by a lack of rain. The nationalaverage yield was forecast at 1,152 pounds per acre, aslight improvement from 2002’s 1,142 pounds, but stillbelow average. Yields improved from last year in allStates except North Dakota (the national productionleader). Based on an expected harvested area of 2.3million acres (up 4 percent from 2002), production forboth oil type and confection type sunflowerseed wouldtotal 2,619 million pounds. Progress of the sunflowerharvest in North Dakota was advancing more quicklythan usual, with about one-third complete by mid-October. Despite the disappointing yields, quality ofthe crop is reported to be generally good.
A comparatively comfortable level of carryover stocks(mostly held by processors) will help boost total sup-plies. With a very strong market anticipated for the oil,the 2003/04 sunflowerseed crush is expected to nearlydouble to 1,370 million pounds. Yet, exports of sun-flowerseed oil are unlikely to expand greatly becauseof an acute need to retain domestic sources of veg-etable oil. Although sunflowerseed oil exports could
recover to around 200 million pounds in 2003/04, thiswould still be far below annual volumes shippedabroad during the last decade. In contrast, domesticdisappearance could grow by 44 percent to a recordhigh 385 million pounds. A greater sunflowerseedcrush will also contribute more sunflowerseed meal tothe country’s protein meal supply.
Recent prices for sunflowerseed oil and oil-type sun-flowerseed have been pulled up along with soybeanoil. Current bids for oil-type seed range from $10.50 to$11.00 per hundredweight, which is now only margin-ally lower than a year ago. At current values of nearly33 cents per pound, sunflowerseed oil prices are stillvery high. But, once processors are replenished withnew crop supplies, the likely crush resurgence shouldsomewhat narrow the premium for sunflowerseed oilagainst soybean oil by next year.
Domestic output of canola seed is estimated down just0.4 percent in 2003 to 1,546 million pounds. In theupper Midwest, there was a recovery from below-aver-age 2002 canola yields, but these were offset by a lossof 190,000 harvested acres. While acreage abandon-ment was considerably lower in 2003, farmers plantedonly 1.1 million acres versus 1.5 million last year.Producers are likely to see 2003/04 canola pricesabove the previous year and again well above the mar-keting loan rate.
The most prominent change to the 2003/04 canola out-look, however, will be the improved supply availabilityfrom Canada. A much better Canadian crop will allowdomestic crushing to climb back near full capacity.U.S. canola seed imports are expected to increasenearly 50 percent to 639 million pounds. Even thatrebound in domestic oil production may not be suffi-cient, however. A deficit of soybean oil supplies willlikely prompt a steady stream of canola oil importsfrom Canada, which encounter no import duty. U.S.canola oil imports could exceed 1,200 million pounds.Domestic disappearance of canola oil could climb to arecord high 1,687 million pounds.
U.S. production of cottonseed is forecast up 4 percentin 2003 to 6.4 million short tons. The cotton area har-vested is down 0.3 million acres from 2002 but animproved yield is responsible for the bigger crop esti-mate. A larger Australian harvest should boost U.S.imports of cottonseed, also. This extension of suppliesshould help revive the domestic cottonseed crushingindustry. Processors have suffered from a lack offavorably priced seed in recent years as cattle feeders
4 l Oil Crop Situation and Outlook Yearbook / OCS-2003 / October 2003 Economic Research Service/USDA

have used increasingly more cottonseed in theirrations. But there should be enough good quality cot-tonseed available in 2003/04 to permit growth in cot-tonseed feeding as well as a recovery in crushing toaround 2.75 million tons. Like other oilseeds, strongdomestic demand for cottonseed oil will encourage asmuch production of it as practical.
Stable Outlook for U.S. Peanuts in 2003/04
On the strength of good growing conditions through-out the main peanut producing regions, U.S. peanutproduction in 2003 is projected at 3.95 million pounds,up 631 million (19 percent) from 2002. Althoughplanted acreage was down about 3 percent from 2002,production will rebound on the basis of a recordnational average yield and a drop in abandoned acresfrom 61,300 acres in 2002 to an estimated 38,000 thisyear. The national average yield is projected at 3,095pounds per acre, an improvement of 21 percent com-pared with 2002.
Despite a 631-million pound production gain, overall2003/04 supplies are projected just 20 million poundshigher, largely due to lower carryover stocks that fellto 875 million pounds from the previous year’s recordlevel of 1,476 million. Projected 2003/04 peanut use isdown 180 million pounds to 3,817 million. Slightlyincreased domestic food use and exports are more thanoffset by a lower crush and residual use. The 2003/04season average farm price is projected to range from16.25 to 19.25 cents per pound, compared with 18.24cents in 2002/03.
Strong Expansion of South AmericanSoybean Area Anticipated
The disappointing outcome from the 2003 U.S. soy-bean harvest makes the world even more dependent onthe success of the next crop in South America. Thestrong price rally already underway is encouragingfarmers in Brazil and Argentina to expand their planti-ng intentions. In Brazil, internal prices for soybeansare generally equivalent to a year ago, when producersincreased area by 13 percent. USDA now projects thatBrazilian soybean area will expand by 14 percent in2003/04 to 21.0 million hectares, up from the previousforecast of 20.0 million. A soybean area that highwould also raise projected output for Brazil to 60.0million metric tons, compared with the previous fore-cast of 56.0 million and 2002/03 production of 52.5million. Although better prospects for the new
Brazilian soybean crop are doing little to calm currentmarket prices, they are moderating the rise of futuresprices, particularly for March and May 2004.
As output heads in opposite directions for the twocountries, Brazil could surpass the United States insoybean exports for the first time with projected2003/04 shipments rising to 26.0 million tons. Brazilhad long ago outstripped U.S. exports of soybean mealand is projected to widen that gap by exporting 16.5million tons over the next year.
Smaller Domestic Harvest Expected ToBuoy China’s Soybean Imports
The USDA estimate of China’s 2003 soybean productionwas lowered to 16.2 million tons from 16.5 million pre-viously. Although 2003 soybean area in China expandedby 8 percent, yields in the northeast were knocked belowaverage during a difficult growing season.
Soybean imports by China for 2002/03 were expected toabout double from the previous year’s 10.4 million tons.Many shipments had been scheduled to arrive beforeSeptember 20, when interim regulations on biotechimports were set to expire. Early in September 2003, thegovernment formally announced that the interim periodwould be extended to April 20, 2004. But, exporterscould not apply for safety certificates on cargoes boughtfor fall shipment until after September 20. So, theinability to obtain the required documents in a timelymanner forced some contracts to be cancelled ordeferred and will once again interrupt China’s soybeanimports during October and November.
Yet, China’s soybean imports should resume soon asconsumption remains brisk. While there have been min-imal shipments over the last few weeks, U.S. exportsales to China are up about one-third from a year ago.USDA has projected 2003/04 soybean imports by Chinaup to 20.5 million tons, compared with the Septemberforecast of 19.0 million. A smaller domestic soybeanharvest will support import needs and the unpredictableadministration of China’s import regulations is encour-aging processors to accumulate stocks whenever possi-ble. Although China’s 2003/04 ending stocks shouldstay relatively high in historic terms at 4.0 million tons,they could decline moderately from the estimated2002/03 carryout of 4.5 million tons.
Imports of soybean oil by China have been accelerat-ing for several months and should stay active for sometime because of the higher cost for obtaining soybeans.
Economic Research Service/USDA Oil Crop Situation and Outlook Yearbook / OCS-2003 / October 2003 l 5

USDA raised its forecasts of China’s soybean oilimports to 1.5 million tons in 2002/03 and 1.3 millionin 2003/04.
Favorable Outlook for Indian Oilseed Harvests
Firm prices and favorable weather are also encourag-ing Indian farmers to seed more area to rapeseed start-ing this month. Indian rapeseed area is expected toreach 6.6 million hectares, which would be up 20 per-cent from the previous forecast. With normal yields,Indian producers could be expected to harvest 5.5 mil-
lion tons in 2003/04, up from just 3.6 million tons theyear before. Production gains from other summer-sown crops would increase total oilseeds in India by 7million tons to 25.8 million. As a consequence, domes-tic production of vegetable oil could expand in2003/04 by 1.4 million tons. While Indian vegetableoil consumption could rebound by a robust 7 percent,improved domestic supplies should curb importrequirements. Indian imports of palm oil in 2003/04are forecast declining 7 percent to 3.7 million tons,while soybean oil imports are seen slipping 5 percentto 1.5 million.
6 l Oil Crop Situation and Outlook Yearbook / OCS-2003 / October 2003 Economic Research Service/USDA
Summer Drought and Heat Cut 2002 U.S.Soybean Yield
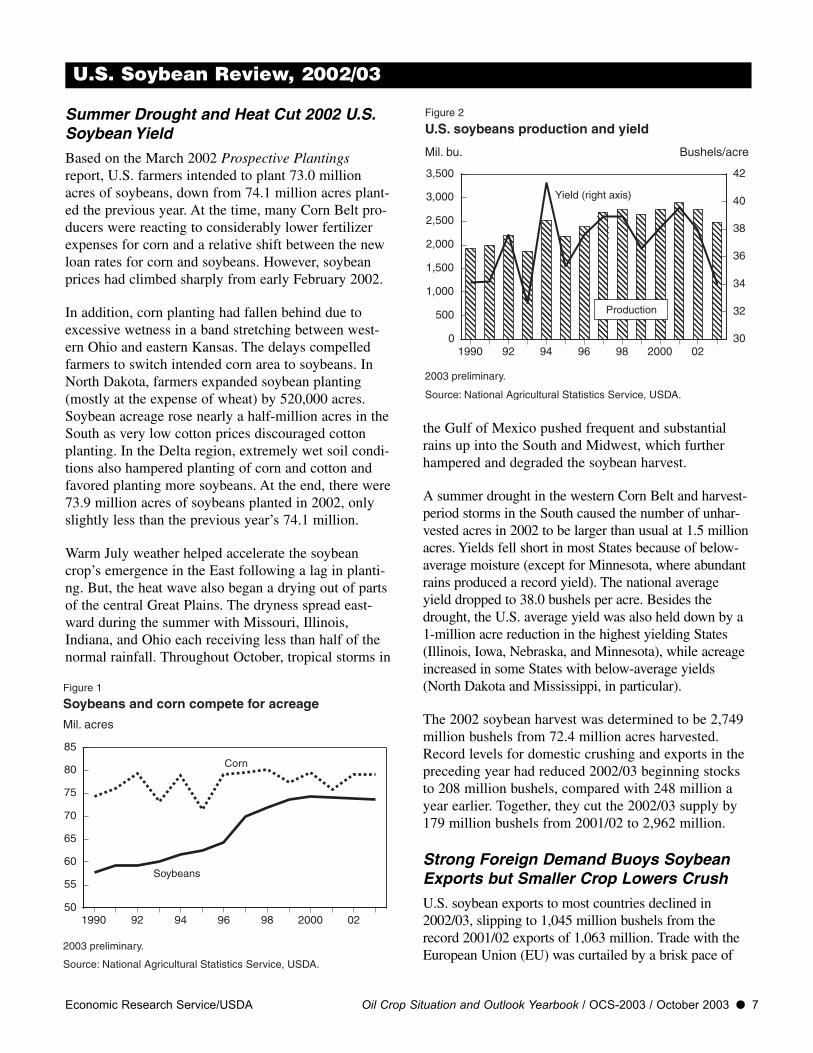
Based on the March 2002 Prospective Plantingsreport, U.S. farmers intended to plant 73.0 millionacres of soybeans, down from 74.1 million acres plant-ed the previous year. At the time, many Corn Belt pro-ducers were reacting to considerably lower fertilizerexpenses for corn and a relative shift between the newloan rates for corn and soybeans. However, soybeanprices had climbed sharply from early February 2002.
In addition, corn planting had fallen behind due toexcessive wetness in a band stretching between west-ern Ohio and eastern Kansas. The delays compelledfarmers to switch intended corn area to soybeans. InNorth Dakota, farmers expanded soybean planting(mostly at the expense of wheat) by 520,000 acres.Soybean acreage rose nearly a half-million acres in theSouth as very low cotton prices discouraged cottonplanting. In the Delta region, extremely wet soil condi-tions also hampered planting of corn and cotton andfavored planting more soybeans. At the end, there were73.9 million acres of soybeans planted in 2002, onlyslightly less than the previous year’s 74.1 million.
Warm July weather helped accelerate the soybeancrop’s emergence in the East following a lag in planti-ng. But, the heat wave also began a drying out of partsof the central Great Plains. The dryness spread east-ward during the summer with Missouri, Illinois,Indiana, and Ohio each receiving less than half of thenormal rainfall. Throughout October, tropical storms in
the Gulf of Mexico pushed frequent and substantialrains up into the South and Midwest, which furtherhampered and degraded the soybean harvest.
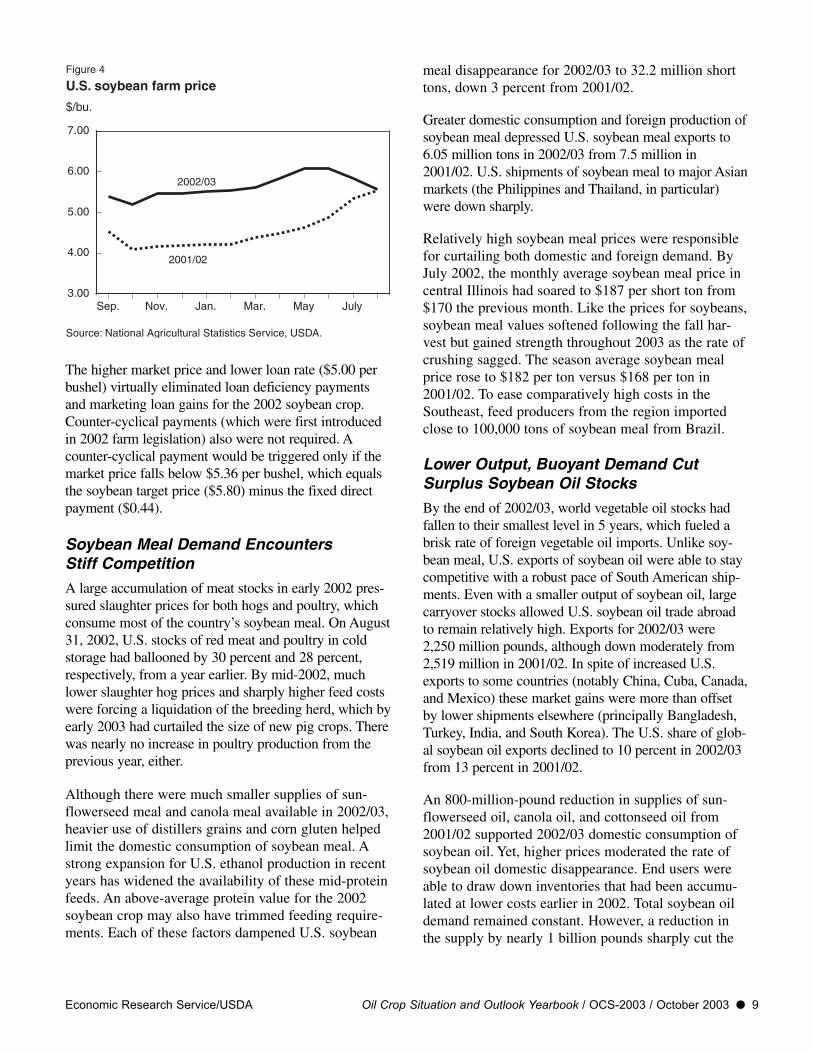
A summer drought in the western Corn Belt and harvest-period storms in the South caused the number of unhar-vested acres in 2002 to be larger than usual at 1.5 millionacres. Yields fell short in most States because of below-average moisture (except for Minnesota, where abundantrains produced a record yield). The national averageyield dropped to 38.0 bushels per acre. Besides thedrought, the U.S. average yield was also held down by a1-million acre reduction in the highest yielding States(Illinois, Iowa, Nebraska, and Minnesota), while acreageincreased in some States with below-average yields(North Dakota and Mississippi, in particular).
The 2002 soybean harvest was determined to be 2,749million bushels from 72.4 million acres harvested.Record levels for domestic crushing and exports in thepreceding year had reduced 2002/03 beginning stocksto 208 million bushels, compared with 248 million ayear earlier. Together, they cut the 2002/03 supply by179 million bushels from 2001/02 to 2,962 million.
Strong Foreign Demand Buoys SoybeanExports but Smaller Crop Lowers Crush
U.S. soybean exports to most countries declined in2002/03, slipping to 1,045 million bushels from therecord 2001/02 exports of 1,063 million. Trade with theEuropean Union (EU) was curtailed by a brisk pace of
Economic Research Service/USDA Oil Crop Situation and Outlook Yearbook / OCS-2003 / October 2003 l 7
U.S. Soybean Review, 2002/03
Figure 1
Soybeans and corn compete for acreage
2003 preliminary.
Source: National Agricultural Statistics Service, USDA.
Mil. acres
Soybeans
Corn
1990 92 94 96 98 2000 0250
55
60
65
70
75
80
85
Figure 2
U.S. soybeans production and yield
2003 preliminary.
Source: National Agricultural Statistics Service, USDA.
1990 92 94 96 98 2000 020
500
1,000
1,500
2,000
2,500
3,000
3,500
30
32
34
36
38
40
42
Mil. bu.
Yield (right axis)
Bushels/acre
Production

South American soybean meal shipments. U.S. soybeanexports to the EU dropped 76 million bushels from theprevious year and were the smallest in two decades.Sluggish growth in EU livestock production and largeimports of feed wheat from the Black Sea region (aswell as greater domestic supplies of damaged wheat)also limited EU feed requirements for protein meal.
China was the conspicuous exception to the contractionof U.S. exports. China’s strong crush margins and a lackof rapeseed supplies largely countered the losses fromsoybean markets elsewhere in the world. U.S. soybeanexports to China almost doubled in 2002/03 to 284 mil-lion bushels to account for more than one-fourth of totalU.S. trade. U.S. shipments were also supported bydelayed harvests in Brazil and Argentina. Even with asoybean supply that was nearly 200 million bushelslower than the previous year, exports started strongly andkept up with the record 2001/02 pace as late as July.
Eventually, higher U.S. prices began to ration demandeverywhere, although more so for the domestic thanthe export market. The comparatively resilient exportdemand bled away even more supplies from thedomestic market. Competition with foreign crushersfor U.S. soybeans forced domestic processors to bid upprices for soybeans, which put crushing margins undergreat pressure. On average, the soybean price paid byIllinois processors ballooned by $1.11 per bushel overthe previous year. Thus, processors could defend profitmargins only by scaling back operating time at oilmills, which reduced the 2002/03 crush to 1,615 mil-lion bushels from 1,700 million in 2001/02.
At the same time that supplies were tight, an abundanceof foreign soybean meal production crowded out U.S.meal exports and a contraction in hog feeding sup-pressed domestic consumption. While comparativelyfirm soybean oil demand helped support processors, alarge stock carryover and a high oil extraction rate werealso tempering the incentives to crush. Capacity utiliza-tion rates had already begun a steep decline by January2003, although there was a temporary recovery forprocessors in July. July was marked by waning soybeanexports and seemingly good prospects for the 2003 cropthat helped to weaken farm prices and bolster crush mar-gins. In addition, there was a brief resurgence of farmsales when 9-month marketing assistance loans began tomature for soybeans placed under loan in late 2002.
In line with the worsening crop conditions, soybeanprices started to rally strongly by July 2002. Priceswere pushed back down in October by harvest pres-sure, but relatively brisk export sales soon signaledthat stocks would rapidly tighten. Soybean stocks as ofJune 1 (at 602.3 million bushels) were the smallestsince 1998 and significantly below the 684.9 million instocks the previous year. Even with use rationed thefinal quarter, season-ending stocks dropped to 169 mil-lion bushels from 208 million in 2001/02. In absoluteterms, this carryout was the smallest since 1997. Sucha carryout did not leave much of a cushion for theprice impact of a disappointing 2003 harvest.
The depletion of supplies strengthened the 2002/03national average farm price to $5.53 per bushel from$4.38 in 2001/02. Total use outpaced total production,but a low level of U.S. soybean stocks has less influ-ence on the overall price level than it used to. Themain reason is the growing influence of SouthAmerican supplies, which no longer allow prices torise to the same level of a decade or more ago. U.S.stocks comprised just 12 percent of the world carry-over, compared with the early 1980s when U.S. stocksroutinely accounted for approximately three-fourths ofworld stocks. To illustrate the price impact of thatchange, the ratio of soybean ending stocks to use fellto 6 percent in 2002/03, which was comparable to the1996/97 ratio but at an average price far lower than the$7.35 per bushel seen for that season. Other factors,such as delivery time improvements, are contributingto lower storage needs. U.S. producers have been ableto lock in farm commodity prices through expandeduse of loan deficiency payments and futures optionsand thereby minimize their use of physical storage.
8 l Oil Crop Situation and Outlook Yearbook / OCS-2003 / October 2003 Economic Research Service/USDA
Figure 3
U.S. soybean demand
2003 preliminary.
Source: Census Bureau.
Mil. bu.
Exports
Crush
1990 92 94 96 98 2000 020
200
400
600
800
1,000
1,200
1,400
1,600
1,800
The higher market price and lower loan rate ($5.00 perbushel) virtually eliminated loan deficiency paymentsand marketing loan gains for the 2002 soybean crop.Counter-cyclical payments (which were first introducedin 2002 farm legislation) also were not required. Acounter-cyclical payment would be triggered only if themarket price falls below $5.36 per bushel, which equalsthe soybean target price ($5.80) minus the fixed directpayment ($0.44).
Soybean Meal Demand Encounters Stiff Competition
A large accumulation of meat stocks in early 2002 pres-sured slaughter prices for both hogs and poultry, whichconsume most of the country’s soybean meal. On August31, 2002, U.S. stocks of red meat and poultry in coldstorage had ballooned by 30 percent and 28 percent,respectively, from a year earlier. By mid-2002, muchlower slaughter hog prices and sharply higher feed costswere forcing a liquidation of the breeding herd, which byearly 2003 had curtailed the size of new pig crops. Therewas nearly no increase in poultry production from theprevious year, either.
Although there were much smaller supplies of sun-flowerseed meal and canola meal available in 2002/03,heavier use of distillers grains and corn gluten helpedlimit the domestic consumption of soybean meal. Astrong expansion for U.S. ethanol production in recentyears has widened the availability of these mid-proteinfeeds. An above-average protein value for the 2002soybean crop may also have trimmed feeding require-ments. Each of these factors dampened U.S. soybean
meal disappearance for 2002/03 to 32.2 million shorttons, down 3 percent from 2001/02.
Greater domestic consumption and foreign production ofsoybean meal depressed U.S. soybean meal exports to6.05 million tons in 2002/03 from 7.5 million in2001/02. U.S. shipments of soybean meal to major Asianmarkets (the Philippines and Thailand, in particular)were down sharply.
Relatively high soybean meal prices were responsiblefor curtailing both domestic and foreign demand. ByJuly 2002, the monthly average soybean meal price incentral Illinois had soared to $187 per short ton from$170 the previous month. Like the prices for soybeans,soybean meal values softened following the fall har-vest but gained strength throughout 2003 as the rate ofcrushing sagged. The season average soybean mealprice rose to $182 per ton versus $168 per ton in2001/02. To ease comparatively high costs in theSoutheast, feed producers from the region importedclose to 100,000 tons of soybean meal from Brazil.
Lower Output, Buoyant Demand CutSurplus Soybean Oil Stocks
By the end of 2002/03, world vegetable oil stocks hadfallen to their smallest level in 5 years, which fueled abrisk rate of foreign vegetable oil imports. Unlike soy-bean meal, U.S. exports of soybean oil were able to staycompetitive with a robust pace of South American ship-ments. Even with a smaller output of soybean oil, largecarryover stocks allowed U.S. soybean oil trade abroadto remain relatively high. Exports for 2002/03 were2,250 million pounds, although down moderately from2,519 million in 2001/02. In spite of increased U.S.exports to some countries (notably China, Cuba, Canada,and Mexico) these market gains were more than offsetby lower shipments elsewhere (principally Bangladesh,Turkey, India, and South Korea). The U.S. share of glob-al soybean oil exports declined to 10 percent in 2002/03from 13 percent in 2001/02.
An 800-million-pound reduction in supplies of sun-flowerseed oil, canola oil, and cottonseed oil from2001/02 supported 2002/03 domestic consumption ofsoybean oil. Yet, higher prices moderated the rate ofsoybean oil domestic disappearance. End users wereable to draw down inventories that had been accumu-lated at lower costs earlier in 2002. Total soybean oildemand remained constant. However, a reduction inthe supply by nearly 1 billion pounds sharply cut the
Economic Research Service/USDA Oil Crop Situation and Outlook Yearbook / OCS-2003 / October 2003 l 9
Figure 4
U.S. soybean farm price
Source: National Agricultural Statistics Service, USDA.
$/bu.
2001/02
2002/03
Sep. Nov. Jan. Mar. May July3.00
4.00
5.00
6.00
7.00
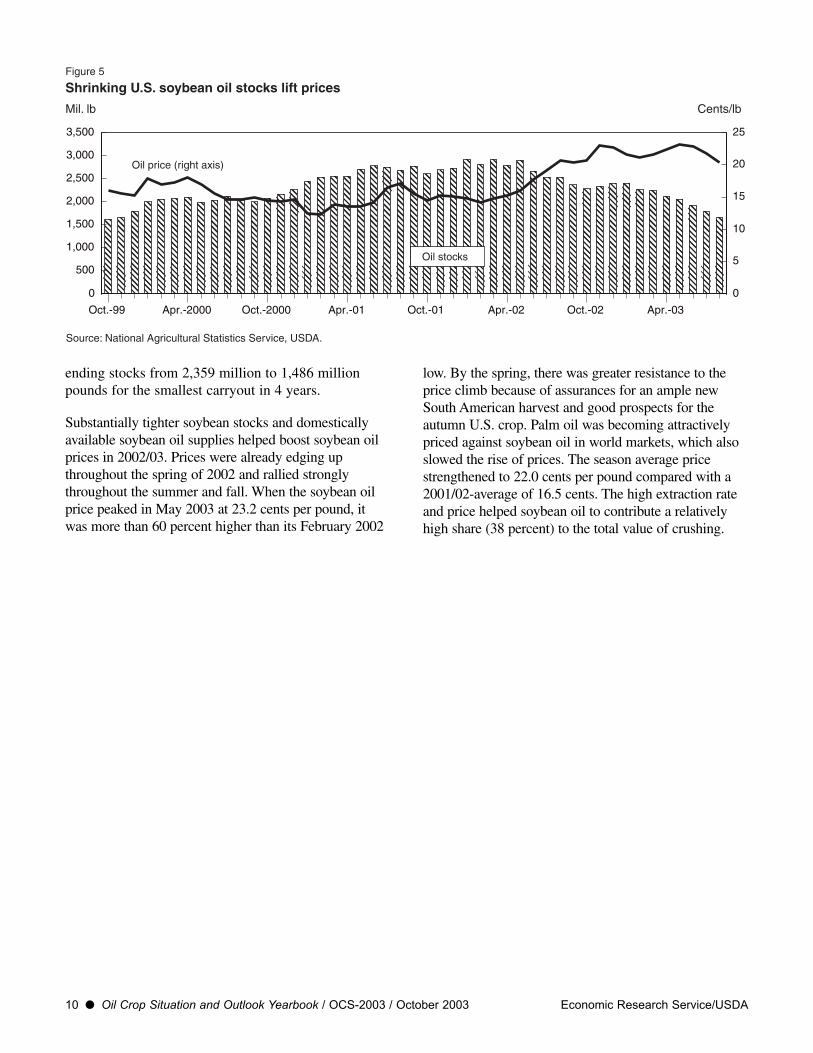
ending stocks from 2,359 million to 1,486 millionpounds for the smallest carryout in 4 years.
Substantially tighter soybean stocks and domesticallyavailable soybean oil supplies helped boost soybean oilprices in 2002/03. Prices were already edging upthroughout the spring of 2002 and rallied stronglythroughout the summer and fall. When the soybean oilprice peaked in May 2003 at 23.2 cents per pound, itwas more than 60 percent higher than its February 2002
low. By the spring, there was greater resistance to theprice climb because of assurances for an ample newSouth American harvest and good prospects for theautumn U.S. crop. Palm oil was becoming attractivelypriced against soybean oil in world markets, which alsoslowed the rise of prices. The season average pricestrengthened to 22.0 cents per pound compared with a2001/02-average of 16.5 cents. The high extraction rateand price helped soybean oil to contribute a relativelyhigh share (38 percent) to the total value of crushing.
10 l Oil Crop Situation and Outlook Yearbook / OCS-2003 / October 2003 Economic Research Service/USDA
Figure 5
Shrinking U.S. soybean oil stocks lift prices
Mil. lb
Oct.-99 Apr.-2000 Oct.-2000 Apr.-01 Oct.-01 Apr.-02 Oct.-02 Apr.-03
0
500
1,000
1,500
2,000
2,500
3,000
3,500
0
5
10
15
20
25
Cents/lb
Oil price (right axis)
Oil stocks
Source: National Agricultural Statistics Service, USDA.

Cottonseed
The harvested acreage of U.S. cotton declined 10 per-cent in 2002. In addition, adverse weather damaged cot-ton yields in 2002 throughout the Southeast. Domesticcottonseed output for 2002 dropped 17 percent from theprevious year to 6.2 million short tons. North Carolina,Georgia, Alabama, and South Carolina accounted for 57percent of the reduction in the national cottonseed crop.The seed-to-lint ratio continued a 20-year descent byslipping to 718 pounds per bale.
After the previous year’s near-record output, the small-er 2002 cottonseed crop tightened available suppliesfor processors. In addition, U.S. cottonseed importswere scaled back with a drought-reduced Australianharvest. Domestic crushers also lacked access to sup-plies because of the unrelenting autumn rains thatdelayed marketing and damaged quality of the U.S.harvest. The shortfall raised the season average farmprice for cottonseed to $100 per ton from $93 in2001/02. Consequently, cottonseed crushing fell to 2.5million tons in 2002/03 from 2.8 million in 2001/02.This was the smallest volume of cottonseed crushed inthe last century. Not only was there a lower rate ofcrush, but the extraction rate for cottonseed oildropped to 294 pounds per ton, among the poorestyields in U.S. history. With these poor fundamentals,domestic cottonseed oil output slumped in 2002/03 toa modern era low of 725 million pounds.
By February 2003, the output losses were driving cot-tonseed oil prices up to nearly 50 cents per pound,more than 3 times higher than a year earlier. The largeprice premium stifled both domestic and exportdemand for cottonseed oil, which plummeted to 636million and 110 million pounds, respectively.
Peanuts
2002/03 Peanut Market Highlighted byPolicy Change
In May 2002, the passage of the Farm Security andRural Investment Act (2002 Farm Act) substantiallyoverhauled the U.S. peanut program by replacing amarketing quota system with a set of supports similarto those available to producers of other program cropssuch as grains and cotton. The previous system—basedon marketing quotas and nonrecourse loans—support-
ed domestic prices of peanuts destined for domesticedible consumption (quota peanuts), and required non-quota (“additional”) peanuts to be exported or crushed.Production for domestic edible consumption was con-strained by an annually established marketing quota—set at 1.18 million short tons (2.36 billion pounds) forthe 2001/02 crop year. Quota peanuts were eligible forthe quota loan rate of $610 per ton (30.5 cents perpound) in 2001/02. Marketings of nonquota (addition-al) peanut production were permitted only for exportor domestic crush, and were eligible for a lower loanrate of $132 per ton (6.6 cents per pound) in 2001/02.
Under provisions of the 2002 Farm Act, all producerschoosing to grow peanuts are now eligible for marketingassistance loans at a loan rate of $355 per ton (17.75cents per pound) and face no restrictions on marketingtheir peanuts for domestic edible consumption.Producers with a history of peanut production are alsoeligible for direct payments of $36 per ton and counter-cyclical payments tied to a $495 per ton target price.Direct and counter-cyclical payments are both based onhistorical acres and yields. Historic peanut producershad until March 31, 2003, to assign average peanut baseand yield to cropland on a farm in the same or contigu-ous State. In addition, quota holders were eligible for apeanut quota buyout amounting to $1,100 per ton (55cents per pound), to be paid out in five annual install-ments during fiscal years 2002-06, or the outstandingamount taken as a lump sum at any time.
2002 Peanut Production Drops 22 Percent
Under the 2002 Farm Act, former quota owners pro-ducing peanuts face lower prices and increased com-petition, whereas non-quota owners and potentialentrants would be eligible for increased governmentsupport from the marketing assistance loan rate of$355 per ton. At 3,320 million pounds, U.S. produc-tion of peanuts in 2002 was down 22 percent from2001, but slightly above the 2000 crop of 3,266 mil-lion pounds. Given the timing of the 2002 Farm Act’spassage in mid-May 2002, it is unclear to what extentthe program changes affected planting decisions.However, the outcome was that planted acreagedeclined 12 percent from 2001 to 1.36 million acresand was the smallest area since 1982. Harvested areatotaled 1.30 million acres, down 8 percent from 2001.The U.S. yield averaged 2,561 pounds per harvested
Economic Research Service/USDA Oil Crop Situation and Outlook Yearbook / OCS-2003 / October 2003 l 11
Situation for Other U.S. Oil Crops

acre, down 468 pounds from the record national aver-age yield of 2001.
In the largest producing region, the Southeast (Alabama,Florida, Georgia, and South Carolina), planted area of806,000 acres was down only 1 percent from the previ-ous year, but average yields dropped 702 pounds to2,433 pounds per acre. That resulted in the Southeastproducing 1,909 million pounds of peanuts, 24 percentbelow the 2001 level. Production from the Virginia-North Carolina area totaled 330 million pounds, down44 percent from 2001. Planted acres, at 159,000, weredown 20 percent from 2001 and the average yield of2,100 pounds per acre was down 894 pounds from 2001.
Southwest peanut producers (New Mexico, Oklahoma,and Texas) planted 25 percent fewer acres in 2002 thanthe previous year, for a total of 393,000 acres. In con-trast to the other producing regions, yields in the Tri-State area were strong, averaging 3,047 pounds peracre, 210 pounds above 2001. Production totaled 1.08billion pounds, down 7 percent from the previous year.
Peanut Exports Plunge but Overall UseRelatively Steady
Although production in 2002/03 declined by nearly 1billion pounds from the previous year—and importsdropped 63 percent to 75 million pounds—supplieswere bolstered by record beginning stocks of 1,476 mil-lion pounds. Overall use remained relatively steady at3,997 million pounds compared with 4,100 millionpounds in 2001/02. Imports, which normally filled thetariff-rate quota level of approximately 57,000 metrictons (shelled basis) fell sharply as a result of lowerdomestic prices following the passage of the 2002 FarmAct. Domestic food use rose to 2.224 billion pounds, up13 million pounds (less than 1 percent) from 2001/02,and processors crushed 779 million pounds of peanuts,88 million pounds more than the previous year and thehighest level since 1995/96. The most notable change inuse came in the export category, with shipments drop-ping to 490 million pounds, down 223 million pounds(31 percent) from the previous year, and the lowest levelsince 1975. Despite strong prices in export markets(Rotterdam)—up more than one-third from 2001/02—lower exports partly reflected reduced domestic produc-tion, but also the first opportunity since the 1930’s forall peanut producers to market their crop for domesticfood use without restriction.
Although a tighter supply situation in 2002/03 wouldnormally indicate strengthening prices, the elimination
of marketing quotas increased the availability ofpeanuts for domestic food use. The season averagefarm price in 2002/03 was 18.24 cents per pound, thelowest nominal level since 1974, and down from 23.4cents per pound in 2001/02. In 2002/03, about 668,000short tons (1.34 billion pounds) of peanuts were placedunder loan, with less than 1,000 tons being forfeited.This indicates that, for most producers, prevailing oranticipated market prices exceeded loan repaymentrates (the lower of the marketing loan rate plus inter-est, or the weekly repayment rate established byUSDA). Marketing loan gains amounted to $23.7 mil-lion, with an average marketing loan gain of $36.21per ton. In addition, loan deficiency payments (LDPs)averaging $28.83 per ton were taken on 909,000 tonsof peanuts, for a total of $26.2 million in LDP rev-enue. Based on the season average farm price, the final2002-crop counter-cyclical payment rate for peanutswas $95 per ton of eligible base production.
With the increased crush, U.S. peanut oil productionrose to 259 million pounds, up from 230 millionpounds the year before. Imports also climbed nearly90 percent to 73 million pounds, but peanut oil pricesstill strengthened to 46.7 cents per pound (up 45 per-cent) because of higher values throughout the veg-etable oil complex. Peanut oil exports rose to 44 mil-lion pounds in 2002/03, up from 8 million pounds in2001/02 and the largest since 1995/96. Similarly,peanut meal production increased 29,000 short tons to177,000. In spite of the larger output, the 2002/03average price climbed by $20 to $128 per ton alongwith other protein meal prices.
Sunflowerseed
U.S. farmers planted 2.58 million acres of sunflowersin 2002, or 73,000 less than the year before. Althoughthe plantings of oil-type sunflowers were up 280,000acres in North Dakota, that was offset by declines inoil-type and confection sunflower acreage for nearlyevery other State. Confection-type sunflowers, whichtend to have lower yields than oil-type varieties,accounted for 80 percent of the acreage reduction.
U.S. sunflowerseed production in 2002 fell more thanone-fourth to 2,490 million pounds. Although sun-flower planting declined only 2 percent in 2002, har-vested acreage fell 15 percent. Most of the severereduction in output was due to a drought that hit yieldsvery hard. Yields were hurt badly in much of theCentral Plains region despite higher production by
12 l Oil Crop Situation and Outlook Yearbook / OCS-2003 / October 2003 Economic Research Service/USDA

North Dakota and Minnesota farmers. A widespreadpest infestation by the spotted stem weevil also dam-aged sunflowers. These factors reduced the 2002national average yield to 1,133 pounds per acre, whichwas the poorest since 1993. To further complicate mat-ters, the sunflowerseed harvest was also slowed byuntimely wet weather.
Despite firm foreign demand, U.S. exports of sunflow-erseed and products fared poorly in 2002/03 because ofa lack of domestic supplies. The season average farmprice for sunflowerseed (all types) climbed to 12.2 centsper pound, its highest level in 9 years. A severe 805-mil-lion-pound reduction in the oil-type sunflowerseed sup-ply led to domestic processors consuming only 703 mil-lion pounds, the least since 1978/79.
At the end of December 2002, U.S. stocks of sunflow-erseed oil had peaked for the season but were already40 percent lower than a year earlier. Sunflowerseed oilexports, which dropped by three-fourths to 110 millionpounds, bore the brunt of the supply shortage. The lossof foreign markets was most severe for Algeria,Netherlands, Turkey, and Mexico. The tightness main-tained a very large (11 cents per pound) price premiumfor sunflowerseed oil versus soybean oil. That alsocurtailed domestic consumption to 268 million pounds,down 28 percent from 2001/02.
Other Oilseeds
U.S. farmers planted 1.46 million acres of canola in2002, which were 96,000 less than the 2000 recordhigh. Despite a 19,000-acre increase in canola planti-ng, 2002 harvested area fell by 77,000 acres to 1.38million acres. In North Dakota, which accounts for 91
percent of national acreage, the average canola yieldfell to 1,230 pounds per acre versus 1,400 pounds in2001. The 2002 domestic harvest dropped 22 percentto 1,553 million pounds. Cash market prices for canolaseed strengthened to $10.60 per hundredweight.
Similarly, a poor Canadian canola crop also restrictedavailability of imported seed to 434 million pounds.Consequently, the supply shortage scaled back 2002/03domestic canola seed crushing by 22 percent to 1,291million pounds. A reduction in the Canadian crush alsotrimmed U.S. imports of canola oil to 929 millionpounds. Therefore, aggregate U.S. canola oil suppliesdeclined nearly 300 million pounds in 2002/03. Thathiked up the Midwest average canola oil price from23.5 cents per pound in 2001/02 to 29.3 cents.
The only minor U.S. oilseed that had much of an expan-sion in acreage for 2002 was flaxseed, for which planti-ngs surged 200,000 acres to 785,000. This was thelargest U.S. flaxseed area since 1979, with nearly all ofthe acreage in North Dakota. U.S. flaxseed productionincreased to 12.6 million bushels from 11.5 million in2001. Although flaxseed plantings increased 34 percent,harvested acreage rose just 22 percent and yields fell toa disappointing 17.9 bushels per acre because of poormoisture conditions. Like the previous year, U.S.flaxseed exports benefited from a poor Canadian harvestand increased to a record high 2.9 million bushels.
The acreage planted to safflowers nationally rose 16percent in 2002 to 219,000 acres. A 16-percent increasein acreage and better yields improved 2002 safflow-erseed production (to 298 million pounds) by 23 percentfrom the previous year. However, the crop still fell wellshort of the average output level during the 1990s.
Economic Research Service/USDA Oil Crop Situation and Outlook Yearbook / OCS-2003 / October 2003 l 13

Corn Oil
Domestic consumption of corn oil expanded stronglythroughout 2003 as users sought an alternative for thedeficit of oils derived from sunflowerseed, canola, andcottonseed. Total disappearance for corn oil in 2002/03soared from 1,363 million to 1,625 million pounds.However, there was no growth in corn oil productioneither, which slipped 8 million pounds to 2,453 mil-lion. Thus, that stopgap in domestic needs limited thevolume of corn oil that could be exported. U.S. cornoil exports dropped to 890 million pounds from 1,172million in 2001/02. Lower shipments to Turkey, Italy,and Mexico were largely responsible. Prices for cornoil followed the rise in soybean oil prices during thelast half of 2002 and averaged 28 cents per pound.
Imported Oils
Despite a 2-percent decline of world coconut oil pro-duction in 2002/03 to 3.17 million metric tons, pricespeaked early in 2003 and subsequently declined. Theimport unit value for coconut oil in fiscal 2003 was$334 per metric ton, down from $361 in fiscal 2002.An 8-percent increase in global output of palm kerneloil (the other major lauric oil) to 3.36 million tons pro-vided the price resistance. U.S. coconut oil imports fellsharply from 1,093 million pounds in 2001/02 to 860million. However, this was largely offset by a rise inU.S. palm kernel oil imports from 330 million to 470million pounds.
World output of olive oil fell 22 percent in 2002/03 to2.16 million tons. The reduction in global use was cush-ioned by a substantial shrinkage of stocks. Therefore,there was a more moderate 7-percent reduction in inter-national olive oil trade to 0.38 million tons. Still, aftertwo decades of strong growth, U.S. olive oil imports
registered a marginal 5-million pound increase in2002/03 to 485 million pounds. This happened partlybecause olive oil imports became more costly in2002/03, with the unit value rising 6 percent to 88 centsper pound. A weakening of the dollar against the euro in2003 also helped imports become more expensive.
Animal Fats
Output of edible tallow expanded 7 percent in 2002/03to 2,075 million pounds. Nearly all of that productionincrease was domestically consumed. Although exportsto Mexico (the leading buyer of U.S. tallow) fell mod-estly, total shipments increased by 10 million poundsto 485 million based on larger trade with Turkey,Taiwan, and Russia.
Edible tallow prices began a strong climb by the fall of2002. In the spring, prices receded a bit but spikedagain in June after a Canadian cow had tested positivefor BSE (mad cow disease). Imports of tallow fromthat country were temporarily banned by most coun-tries. That included the United States, althoughimports account for a negligible part of the total sup-ply. However, the discovery of no more cases helped tosettle the market. The marketing year average for edi-ble tallow prices was 17.5 cents per pound, comparedwith 13.9 cents in 2001/02.
U.S. lard production dipped by 5 million pounds in2002/03 to 1,075 million. Consequently, total use oflard also changed minimally. Lard exports improvedslightly to 105 million pounds, which was offset by anequivalent decline in domestic consumption to 985million pounds. Like tallow, lard prices benefited froma rally in vegetable oil prices, increasing sharply in2002/03 to 18.1 cents per pound from 13.6 cents theprevious marketing year.
14 l Oil Crop Situation and Outlook Yearbook / OCS-2003 / October 2003 Economic Research Service/USDA
Other Fats and Oils Highlights
South American Exporters BeginDominance of World Soybean Trade
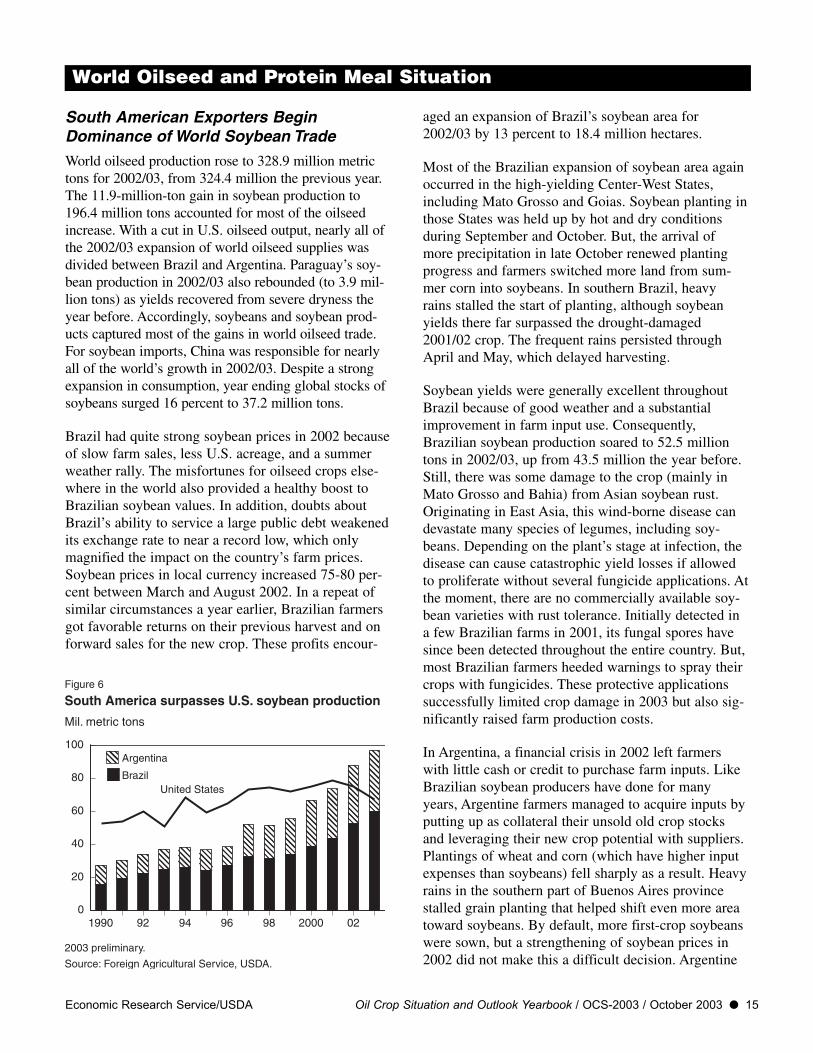
World oilseed production rose to 328.9 million metrictons for 2002/03, from 324.4 million the previous year.The 11.9-million-ton gain in soybean production to196.4 million tons accounted for most of the oilseedincrease. With a cut in U.S. oilseed output, nearly all ofthe 2002/03 expansion of world oilseed supplies wasdivided between Brazil and Argentina. Paraguay’s soy-bean production in 2002/03 also rebounded (to 3.9 mil-lion tons) as yields recovered from severe dryness theyear before. Accordingly, soybeans and soybean prod-ucts captured most of the gains in world oilseed trade.For soybean imports, China was responsible for nearlyall of the world’s growth in 2002/03. Despite a strongexpansion in consumption, year ending global stocks ofsoybeans surged 16 percent to 37.2 million tons.
Brazil had quite strong soybean prices in 2002 becauseof slow farm sales, less U.S. acreage, and a summerweather rally. The misfortunes for oilseed crops else-where in the world also provided a healthy boost toBrazilian soybean values. In addition, doubts aboutBrazil’s ability to service a large public debt weakenedits exchange rate to near a record low, which onlymagnified the impact on the country’s farm prices.Soybean prices in local currency increased 75-80 per-cent between March and August 2002. In a repeat ofsimilar circumstances a year earlier, Brazilian farmersgot favorable returns on their previous harvest and onforward sales for the new crop. These profits encour-
aged an expansion of Brazil’s soybean area for2002/03 by 13 percent to 18.4 million hectares.
Most of the Brazilian expansion of soybean area againoccurred in the high-yielding Center-West States,including Mato Grosso and Goias. Soybean planting inthose States was held up by hot and dry conditionsduring September and October. But, the arrival ofmore precipitation in late October renewed plantingprogress and farmers switched more land from sum-mer corn into soybeans. In southern Brazil, heavyrains stalled the start of planting, although soybeanyields there far surpassed the drought-damaged2001/02 crop. The frequent rains persisted throughApril and May, which delayed harvesting.
Soybean yields were generally excellent throughoutBrazil because of good weather and a substantialimprovement in farm input use. Consequently,Brazilian soybean production soared to 52.5 milliontons in 2002/03, up from 43.5 million the year before.Still, there was some damage to the crop (mainly inMato Grosso and Bahia) from Asian soybean rust.Originating in East Asia, this wind-borne disease candevastate many species of legumes, including soy-beans. Depending on the plant’s stage at infection, thedisease can cause catastrophic yield losses if allowedto proliferate without several fungicide applications. Atthe moment, there are no commercially available soy-bean varieties with rust tolerance. Initially detected ina few Brazilian farms in 2001, its fungal spores havesince been detected throughout the entire country. But,most Brazilian farmers heeded warnings to spray theircrops with fungicides. These protective applicationssuccessfully limited crop damage in 2003 but also sig-nificantly raised farm production costs.
In Argentina, a financial crisis in 2002 left farmerswith little cash or credit to purchase farm inputs. LikeBrazilian soybean producers have done for manyyears, Argentine farmers managed to acquire inputs byputting up as collateral their unsold old crop stocksand leveraging their new crop potential with suppliers.Plantings of wheat and corn (which have higher inputexpenses than soybeans) fell sharply as a result. Heavyrains in the southern part of Buenos Aires provincestalled grain planting that helped shift even more areatoward soybeans. By default, more first-crop soybeanswere sown, but a strengthening of soybean prices in2002 did not make this a difficult decision. Argentine
Economic Research Service/USDA Oil Crop Situation and Outlook Yearbook / OCS-2003 / October 2003 l 15
World Oilseed and Protein Meal Situation
Figure 6
South America surpasses U.S. soybean production
2003 preliminary.
Source: Foreign Agricultural Service, USDA.
Mil. metric tons
United States
1990 92 94 96 98 2000 020
20
40
60
80
100Argentina
Brazil
soybean area soared (as in Brazil) by 11 percent to12.6 million hectares.
Despite a shortage of inputs, a record-high Argentineyield was achieved through mostly favorable weather.A spell of hot and dry weather during January stressedcrops in southern regions. But, October-December pre-cipitation had been 50 percent above normal and therain returned in February to ease the heat wave.Productivity was also enhanced by a larger proportion(82 percent) of first-crop soybeans (which tend to yieldabout 30-percent more than soybeans that are double-cropped following wheat). Argentine soybean produc-tion rose to 35.5 million tons in 2002/03 from 30.0million in 2001/02.
Brisk trade by both Brazil and Argentina developed in2002/03 because of a lag in old crop marketing, recordnew crops, lower U.S. supplies, and still competitiveexchange rates. This was the first year that soybeanexports from South America had exceeded U.S. ship-ments. Brazil’s soybean exports increased sharply from15.0 million to 21.1 million tons. Likewise, Argentineexporters used their advantages to ship a record 10.1 mil-lion tons of soybeans. Most of the export gains by Braziland Argentina came not from their traditional market inWestern Europe, but instead featured the emerging mar-kets in Asia, the Middle East, and North Africa.
However, shipments from both countries could havebeen even larger. By mid-2003, Brazil’s currency hadgained to its strongest level against the dollar sinceJuly 2002, and the Argentine peso was at a 12-monthhigh. Soybean prices in Brazil plunged after January,yet mid-2003 cash values were still about 30 percenthigher than they were a year earlier. Farmers had cap-tured very attractive terms on forward sales made in2002 and their needs for cash flow were being met bysales of other commodities. Thus, both Brazilian andArgentine producers postponed sales to let pricesstrengthen prior to the U.S. harvest. That turned out tobe a sound strategy when the difficulties for the U.S.crop after August 2003 spiked prices again. SouthAmerican farmers took advantage of that price wind-fall to resume old-crop marketing. However, the back-log of stocks from the region carried over was about18 percent higher than the previous year.
Argentina is predominantly an exporter of soybeanproducts and its crushing expanded by 12 percent in2002/03 to 23.4 million tons. Even with robust gains inboth exports and domestic use, Argentina has accruedmuch larger soybean stocks in recent years. September
2003 ending soybean stocks in Argentina were approx-imately 11.2 million tons, or double the level just 3years earlier. The financial crisis made soybean stocksa far more secure store of value for farmers than anybank account. Formerly, there had always been a con-straint on Argentine grain storage that forced produc-ers to accept lower prices for newly harvested crops.Now, however, Argentine farmers can exploit betterpricing opportunities by their use of relatively inexpen-sive plastic storage bags for soybeans. With elimina-tion of the peso’s peg to the dollar in early 2002, theirability to hedge against unpredictable economic andpolitical events has become even more valuable.
China’s Soybean Imports Surge Following Trade Disruptions
Unlike the previous season, China did not head into2002/03 with a large cushion of oilseed stocks. Thesestocks had allowed China to maintain consumption dur-ing a stoppage of soybean imports in early 2002, but thecarryover was quickly reduced to mere pipeline supplies.
Domestic crops of soybeans, peanuts, and sunflow-erseed increased minimally in 2002 and could notmaterially ease a growing supply deficit. In spite ofefforts by China’s Government to encourage domesticsoybean production, most of the country’s farmershave responded more to revenues from their last cropthan from planting-time prices. Farmers in China hadalready sold the 2001 soybean crop before the spring2002 price rally. Because corn planting was moreattractive, the 2002 soybean area declined 8 percent to8.7 million hectares. With a return of more favorableweather to the main growing region in northeasternChina, improved yields lifted 2002 production to 16.5million tons from 15.4 million. Another key factor forthe robust soybean imports by China was a lack ofrapeseed supplies to crush. The domestic rapeseed har-vest was disappointing and poor harvests by Canadaand Australia depressed rapeseed imports.
Soybean purchases by China accelerated rapidly dur-ing 2002/03 because there was still rebuilding of sup-plies drawn down previously by a shutdown ofimports. Importers were also likely expanding theirsoybean stocks prior to December 20, 2002, whenChina’s safety certificate regime was to take effect.Importers are still obtaining provisional safety certifi-cates issued by the Ministry of Agriculture that arebased on assessments of the biotech crops by foreigngovernments. After December 20, 2002, China’sGovernment was to issue safety certificates for biotech
16 l Oil Crop Situation and Outlook Yearbook / OCS-2003 / October 2003 Economic Research Service/USDA

crops based on its own field trials. Yet, there wasuncertainty about how long China’s approval processwould take. The interim policy allowed just 30 daysfor approvals, but after December 20 the new policywas to extend the approval period up to 270 workingdays. Thus, importers were being prompted to securestocks to postpone the same kind of shortages experi-enced in prior months.
Shortly before the December 2002 deadline, China’sagriculture ministry extended its interim rules throughSeptember 2003 but was recognizing only safety certifi-cates from the country of origin, not third countries.Soybean exporters from the United States and Argentina(which have both officially approved biotech varieties)were able to obtain certificates from China. But, Brazilhad not sanctioned production of such crops at that timeand had no documented safety claims for them. TheBrazilian Government would later agree with China ona protocol for its supplies that were grown illegally andthat ended up in export shipments.
Temporarily unimpeded by any disruptions from regu-lations on biotech imports, China bought soybeans at arapid pace between March and early September.Switching between U.S. and South American originsbegan by late spring. Speculative buying had accelerat-ed in the spring because China’s Government hadmade no official announcement on an extension ofinterim policies for biotech imports beyond theSeptember 20, 2003, expiration. Also, the Ministry ofAgriculture had not been accepting safety certificateapplications for forward purchases. Bookings slowedin the summer because of the uncertainty of takingdelivery before the September 20, 2003, deadline.
Citing phytosanitary problems, the Government ofChina’s inspection bureau stepped up its scrutiny ofthe quality of soybean imports. Difficulties in obtain-ing inspection permits caused a number of strandedcargoes at Chinese ports. Without these permits fromthe government’s Administration of Quality,Supervision, Inspection, and Quarantine, ships cannotdischarge any biotech soybeans at ports. Most of thestranded cargoes were from Brazil, as U.S. soybeanexports to China had already come to a seasonal end.
Yet, crushers in China were generally able to securesoybean imports better than they did in 2001/02 becauseof the extension of the transition period for its importregulations on biotech crops. China’s soybean importssoared to 20.3 million tons for 2002/03 from 10.4 mil-lion in 2001/02. This was the first year that China’s soy-bean imports exceeded domestic production. Despitedisruptions in the inspection process, the late surge ofshipments had approximately doubled China’s soybeanstocks from the previous year’s carryout.
Higher Prices Moderate Global Soybean Meal Demand
Consumption of soybean meal grew solidly in 2002/03throughout Asia, the Middle East, Eastern Europe,Mexico, and Russia. In contrast, there was limiteddemand growth for the three markets (the UnitedStates, EU, and Japan) that account for about half ofworld soybean meal consumption. Global soybean
Economic Research Service/USDA Oil Crop Situation and Outlook Yearbook / OCS-2003 / October 2003 l 17
Figure 7
Growth in U.S. soybean exports to China resumes
Source: Census Bureau.
Mil. bu.
1991 93 95 97 99 20010
50
100
150
200
250
300
Figure 8
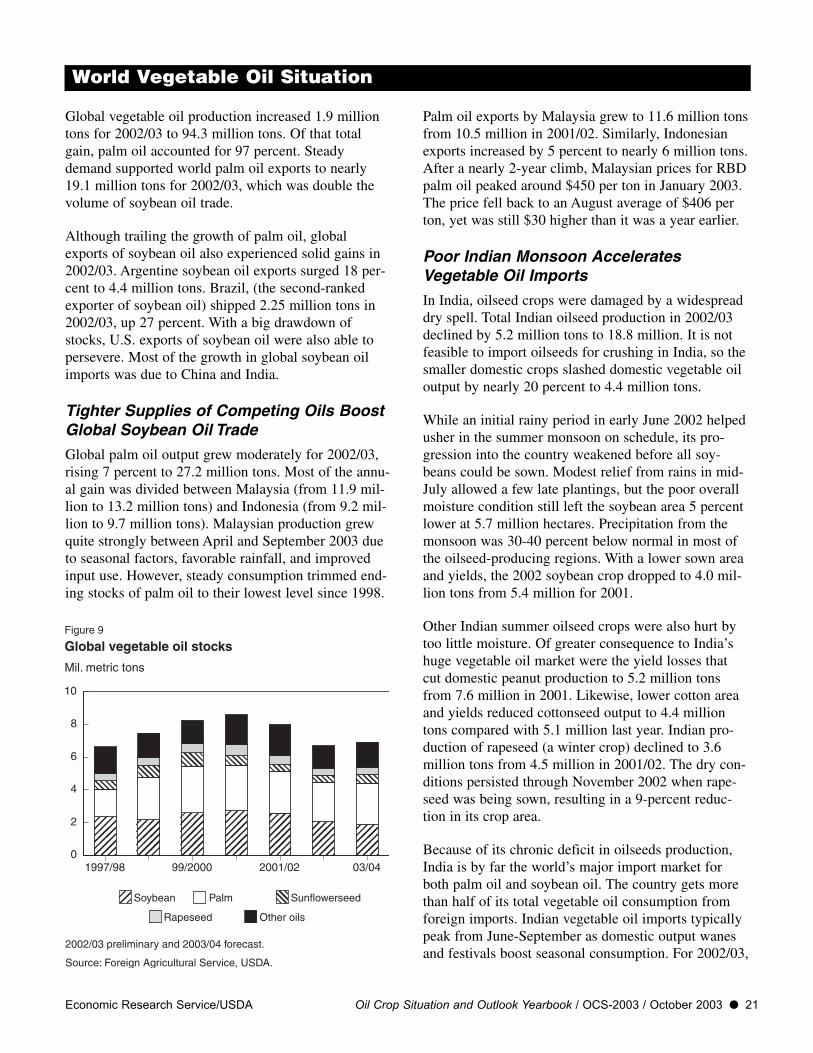
Global oilseed stocks
Mil. metric tons
1997/98 99/2000 2001/02 03/040
5
10
15
20
25
30
35
40
45
Sunflowerseed
Rapeseed
Soybeans
Other seeds
Cottonseed
2002/03 preliminary and 2003/04 forecast.
Source: Foreign Agricultural Service, USDA.

meal exports for 2002/03 increased 1.5 million tons for2002/03 to 43.8 million, with South American suppli-ers accounting for all of the increase. Greater crushingboosted soybean meal exports from Argentina to 18.2million tons from 16.1 million in 2001/02. The rise inBrazilian soybean meal exports (from 12.0 million to13.8 million tons) was more moderate because ofstrong competition from Argentina and rapidlyexpanding consumption by domestic livestock.
Conversely, India had a production shortfall for bothsoybeans and peanuts in 2002. Indian crushers hadtrouble obtaining soybeans from farmers at a price thatcould guarantee a profit. To compensate for lost peanutmeal production, India also needed to consume moreof its own soybean meal for its rapidly growing poul-try sector. This further cut into India’s 2002/03 soy-bean meal exports, which were nearly halved to 1.3million tons.
Although China is a relative newcomer to the worldexport market for soybean meal, it remained an activeparticipant again in 2002/03. China has many relative-ly new coastal processing plants that are well situatedto crush imported soybeans into meal for eitherdomestic users or for re-export to nearby Asian buyers.While exports by China’s processors declined from1.05 million to 0.8 million tons, they benefited fromthe decline in Indian soybean meal shipments.
In May, Japan temporarily banned imports of poultryfrom China after authorities detected the avian influen-za virus in a shipment of duck products. This highlyinfectious disease can inflict serious economic damageon a country’s poultry producers. Domestic meatdemand in China was also being subdued by the dead-ly virus causing Severe Acute Respiratory Syndrome(SARS), which for months ruined tourism and mini-mized visits to public places such as restaurants andfood markets. In spite of any proof, some consumersalso feared that they could contract the disease by eat-ing poultry. That far into the marketing year, China’ssoybean meal consumption was only marginally affect-ed, which increased nearly 30 percent from 2001/02 to19.7 million tons.
Demand for soybean meal was also growing stronglyin other Asian countries. China’s exclusion from theJapanese poultry market provided a windfall to otherexporting nations, particularly Thailand. The rapidexpansion of Thailand’s poultry sector raised its soy-bean imports in 2002/03 by 15 percent to 1.8 milliontons while soybean meal imports rose 4 percent to 1.9
million. In Latin America, Brazil and Mexico account-ed for nearly all of the region’s growth in soybeanmeal consumption. Mexico imported nearly two-thirdsmore soybean meal, but as much of its supply increasecame from crushing soybeans that were imported.Brazil relied entirely on its own vast output to fulfillits 2002/03 domestic meal requirements, which grew 4percent to 8.3 million tons.
In Europe, the euro had strengthened by early 2003 toaround 1.1 euros to the dollar, compared with 0.86 perdollar in February 2002. The boost to European Union(EU) purchasing power supported imports of soybeansand soybean meal. Lower soybean area within the EUalso cut the domestic crop by 0.2 million tons. But, inspite of these factors, a record-large wheat supply ledto a slowing of EU soybean meal consumption.Excessive rains (particularly in Germany) in 2002harmed the milling quality of EU wheat that forced a larger consumption of it as feed. Consequently,greater substitution of higher protein wheat for barley and corn dampened supplementary needs for soybean meal.
European Union crush margins were also put undergreater pressure by strong bidding for soybeans byChina and a rising tide of South American soybeanmeal. Likewise, expanded crushing capacity through-out North Africa and the Middle East were also cuttinginto EU exports of soybean meal and soybean oil. Inaddition, Russia approved (for 9 months beginning inApril 2003) new quotas on meat and poultry imports.The Russian trade restrictions curbed feed consump-tion by primarily European exporters of livestockproducts. European Union soybean imports for2002/03 (excluding intra-trade) slipped to 17.6 milliontons from 18.3 million. But with the weak consump-tion gains, EU soybean meal imports increased by ameager 0.2 million tons to 19.7 million.
Adverse Weather Curtails World Rapeseed Trade
Poor weather for some major rapeseed growing countriesin 2002/03 aborted a recovery in world production of thecrop. In fact, 2002/03 rapeseed output dropped even fur-ther to 32.3 million tons (from 36.0 million in 2001/02)and was the smallest in the previous 6 years.
In the Canadian prairies, spring moisture conditionsstill had not recovered from the 2001 drought; andcanola plantings were up just 2 percent. Drought wors-ened throughout the summer, particularly in central
18 l Oil Crop Situation and Outlook Yearbook / OCS-2003 / October 2003 Economic Research Service/USDA

Saskatchewan. Heavy rains came to the southeasternPrairie region in late August, but they were too late tohelp yields and added damage to the crop’s quality.Abandonment of canola acreage and drought-damagedyields slashed the Canadian harvest to 4.2 million tons.The crop was even worse than the drought-reduced2001 crop of 4.9 million tons. It was Canada’s smallestcrop since 1990, when harvested area that year wasmore than one-fourth less than in 2002. Consequently,Winnipeg canola prices surged 25 percent betweenMay and August and have since remained high. Thesevere crop losses rationed Canadian exports anddomestic crushing. Canadian exports of canolaslumped to 2.4 million tons, the least in 11 years. Alabor dispute at the major western Canadian ports lastfall also impeded loading of rapeseed shipments toAsia. Carryout stocks shrank to 0.9 million tons.
Since early 2002, Australia was gripped by one of thatcountry’s worst droughts in a century, which reducedthe sown rapeseed area sharply and slashed yields.Australian rapeseed production plunged to 0.6 milliontons from 1.8 million. Typically about three-fourths ofAustralia’s rapeseed production is exported so the poorcrop nearly halved Australian 2002/03 exports to 0.4million tons. Together, Canada and Australia normallyaccount for 50-60 percent of world rapeseed exports.
Producers from the EU were some of the few thatincreased their rapeseed output in 2002, up to 9.3 milliontons from 8.8 million in 2001. Most of the area expan-sion occurred in Germany, which is rapidly growing itsbiodiesel industry. There were better yields in 2002 but,like the year before, heavy rains damaged the Germancrop in early August just as the pods were ready for har-vest. In satisfying the biodiesel market, it meant that thevegetable oil supplies available for food use in the EUwould remain tight through 2002/03. Trade with EasternEuropean countries, which had smaller rapeseed harvestsof their own, could not help ease EU oilseed require-ments. Consequently, EU rapeseed imports declinedfrom 0.9 million to 0.6 million tons.
As a result of crop shortfalls for the major producingcountries, world rapeseed imports fell from 5.6 milliontons in 2001/02 to 4.4 million. Japan secured its nor-mal supply, so the short crops exacerbated supplyavailability for other major importers, primarily Chinaand Mexico. China had prospects for another bumperrapeseed crop in 2002 with a record sown area.However, spring flooding in central China damagedthe crop, which fell to 10.6 million tons from 11.3 mil-
lion in 2001. But foreign shortages curtailed China’srapeseed imports to just 150,000 tons from 775,000 in2001/02 and 2.4 million in 2000/01. For Mexico (thesecond-ranked importing country last year), the world-wide rapeseed shortage cut its imports nearly in half to0.5 million tons.
Global sunflowerseed output recovered to 24.0 milliontons in 2002 from the poor yields that depressed 2001production to 21.4 million. Most of the output gainswere by countries that process the seed mainly fortheir own domestic use. Therefore, there was only amodest increase in international sunflowerseed tradefrom 1.8 million to 2.3 million tons.
Russian sunflower area was modestly higher in 2002because of relatively attractive prices following thepoor 2001 crop. Even so, area harvested was downfrom sowings in 1999 and 2000 because a 20-percentRussian export tax continues to dampen farm returns.Compared with last year’s drought, Russia had amplerains in August 2002 during the main flowering period.
Similarly, Ukraine sunflower area expanded 14 percentto 2.7 million hectares. Ukraine sunflowerseed yieldsalso improved, raising the country’s 2002 production by45 percent to a record 3.3 million tons. As both countrieshave maintained export tax policies intended to retaincrops for their domestic crushing industries, it lessensthe seed available for export to the rest of Europe.
Better yields and larger area also boosted output inTurkey and eastern Europe. In contrast, the EU sun-flowerseed crop was lower, although yields had alsoimproved there. Because of continued erosion in itsprofitability in Italy, France, and Spain, EU sunflow-erseed production declined 9 percent to 2.8 millionlargely from a 13-percent drop in harvested area.Improved foreign harvests did allow EU sunflowerseedimports to rebound to 1.7 million tons, however.
In Argentina, sunflowerseed is a cheaper crop to growthan corn, so the financial crisis expanded its area to2.35 million hectares. However, high temperatures dur-ing flowering cut yields in the southern part of BuenosAires province. This trimmed Argentine output to 3.7million tons and stalled any growth in demand.
Poor prices for cotton in 2002 cut cultivated areathroughout the world. Smaller crops, particularly in theUnited States and China, reduced 2002/03 world cot-tonseed output to 32.8 million tons from 36.6 millionin 2001/02. Indian cotton area also fell, but improved
Economic Research Service/USDA Oil Crop Situation and Outlook Yearbook / OCS-2003 / October 2003 l 19

yields stabilized that country’s cottonseed output at 4.4million tons.
World peanut production dropped 9 percent for2002/03 to 30.6 million tons, largely because of severedroughts in India, Senegal, and the United States. InIndia, rainfall during August 2002 provided somerelief for its soybean crop, although the western andsouthern regions that grow peanuts were not as fortu-nate. The failure of the summer monsoon to reach
these areas prevented an expansion of peanut areaplanted and stressed yields on the land where it wassown. Indian peanut production was cut to 5.2 milliontons compared with last year’s harvest of 7.6 million.Smaller crops in both India and Senegal sharply scaledback crushing and production of peanut oil. Senegalforfeited a lot of its capability to export peanut oil, butIndia lost more of its primary source for domestic oilconsumption. In contrast, peanut production in Chinaimproved to 14.9 million tons in 2002.
20 l Oil Crop Situation and Outlook Yearbook / OCS-2003 / October 2003 Economic Research Service/USDA
Global vegetable oil production increased 1.9 milliontons for 2002/03 to 94.3 million tons. Of that totalgain, palm oil accounted for 97 percent. Steadydemand supported world palm oil exports to nearly19.1 million tons for 2002/03, which was double thevolume of soybean oil trade.
Although trailing the growth of palm oil, globalexports of soybean oil also experienced solid gains in2002/03. Argentine soybean oil exports surged 18 per-cent to 4.4 million tons. Brazil, (the second-rankedexporter of soybean oil) shipped 2.25 million tons in2002/03, up 27 percent. With a big drawdown ofstocks, U.S. exports of soybean oil were also able topersevere. Most of the growth in global soybean oilimports was due to China and India.
Tighter Supplies of Competing Oils BoostGlobal Soybean Oil Trade
Global palm oil output grew moderately for 2002/03,rising 7 percent to 27.2 million tons. Most of the annu-al gain was divided between Malaysia (from 11.9 mil-lion to 13.2 million tons) and Indonesia (from 9.2 mil-lion to 9.7 million tons). Malaysian production grewquite strongly between April and September 2003 dueto seasonal factors, favorable rainfall, and improvedinput use. However, steady consumption trimmed end-ing stocks of palm oil to their lowest level since 1998.
Palm oil exports by Malaysia grew to 11.6 million tonsfrom 10.5 million in 2001/02. Similarly, Indonesianexports increased by 5 percent to nearly 6 million tons.After a nearly 2-year climb, Malaysian prices for RBDpalm oil peaked around $450 per ton in January 2003.The price fell back to an August average of $406 perton, yet was still $30 higher than it was a year earlier.
Poor Indian Monsoon AcceleratesVegetable Oil Imports
In India, oilseed crops were damaged by a widespreaddry spell. Total Indian oilseed production in 2002/03declined by 5.2 million tons to 18.8 million. It is notfeasible to import oilseeds for crushing in India, so thesmaller domestic crops slashed domestic vegetable oiloutput by nearly 20 percent to 4.4 million tons.
While an initial rainy period in early June 2002 helpedusher in the summer monsoon on schedule, its pro-gression into the country weakened before all soy-beans could be sown. Modest relief from rains in mid-July allowed a few late plantings, but the poor overallmoisture condition still left the soybean area 5 percentlower at 5.7 million hectares. Precipitation from themonsoon was 30-40 percent below normal in most ofthe oilseed-producing regions. With a lower sown areaand yields, the 2002 soybean crop dropped to 4.0 mil-lion tons from 5.4 million for 2001.
Other Indian summer oilseed crops were also hurt bytoo little moisture. Of greater consequence to India’shuge vegetable oil market were the yield losses thatcut domestic peanut production to 5.2 million tonsfrom 7.6 million in 2001. Likewise, lower cotton areaand yields reduced cottonseed output to 4.4 milliontons compared with 5.1 million last year. Indian pro-duction of rapeseed (a winter crop) declined to 3.6million tons from 4.5 million in 2001/02. The dry con-ditions persisted through November 2002 when rape-seed was being sown, resulting in a 9-percent reduc-tion in its crop area.
Because of its chronic deficit in oilseeds production,India is by far the world’s major import market forboth palm oil and soybean oil. The country gets morethan half of its total vegetable oil consumption fromforeign imports. Indian vegetable oil imports typicallypeak from June-September as domestic output wanesand festivals boost seasonal consumption. For 2002/03,
Economic Research Service/USDA Oil Crop Situation and Outlook Yearbook / OCS-2003 / October 2003 l 21
World Vegetable Oil Situation
Figure 9
Global vegetable oil stocks
Mil. metric tons
Sunflowerseed
Rapeseed
Soybean
Other oils
Palm
2002/03 preliminary and 2003/04 forecast.
Source: Foreign Agricultural Service, USDA.
1997/98 99/2000 2001/02 03/040
2
4
6
8
10
Indian palm oil imports rose to 3.95 million from 3.4million, while soybean oil imports increased marginal-ly to 1.6 million tons. Yet, vegetable oil imports wereonly able to partially replace (and not supplement) theloss of domestic output in 2002/03. The much higherprices trimmed Indian consumption of all oils by 1percent, a stark contrast with the rapid consumptiongains of the late 1990s.
Soybean oil imports surged after the IndianGovernment’s new budget in March 2003 failed toreduce import duties on palm oil as anticipated. Thatkept in place a comparatively favorable lower boundtariff for imports of crude soybean oil at 45 percent.Despite this advantage, the Government has counteredit by its setting of a reference price for crude soybeanoil imports. This price becomes the basis for calcula-tion of the ad valorem import tariff. The measure wasdesigned to avoid tariff losses caused by importersunder-reporting the import price level. However, thereference price for soybean oil was set considerablyhigher than actual price quotes, raising the effectivetariff above its basic rate of 45 percent. So, althoughIndia had imposed a higher basic tariff rate of 65 per-cent on crude palm oil, its considerably lower refer-ence price evened the competition with soybean oil.
The Indian reference price for crude soybean oil wasraised to $542 per metric ton in September 2002 andto $600 by December. A hike in the reference pricesfor crude palm oil and refined palm olein (to $432 and$470 per ton, respectively) was delayed untilNovember. By May 2003, a tight domestic oil supplyled the government to lower the duty rates on importsfor refined palm oil and palm olein as well as the ref-erence import prices for crude soybean oil (to $537)and crude palm oil (to $390). Regulations requiring aminimum percentage of the more expensive domesticoils in blended oil products were also eased. However,
for the year reference prices were generally higher,which contributed to stronger interior prices in thecountry that suppressed consumption.
China had a disappointing 2002 rapeseed harvest.Unlike India, China was willing to import a massiveamount of oilseeds to meet its vegetable oil needs. Thecountry would have been a very good import marketfor rapeseed in 2002/03 except for production short-falls by Canada and Australia. Thus, Chinese output ofrapeseed oil failed to keep up with demand growth.That encouraged a strong resumption of China’s soy-bean imports after mid-2002. Domestic soybean crush-ing still provided most of the country’s protein mealrequirements. But, despite the surge in soybean crush-ing, the comparatively low yield of oil left a tight bal-ance for total vegetable oils. To avoid a domestic glutof soybean meal, China’s vegetable oil deficit requireda supplement of oil imports.
Vegetable oil prices climbed steadily in China during2003. The SARS crisis spurred many Chinese con-sumers to expand their at-home stocks of bottled cook-ing oil. A bureaucratic backlog for the documents tounload soybeans during the summer may have alsoprompted more orders for soybean oil. As a result,China’s palm oil imports rose to a record 2.5 milliontons in 2002/03, while soybean oil imports expandedto 1.5 million tons.
Mexican imports of soybean oil (nearly all from theUnited States) increased to 198,000 tons to make upfor the inaccessibility of rapeseed and cottonseed sup-plies to crush. For Russia, a bumper sunflowerseedharvest lessened that country’s 2002/03 imports ofsoybean oil and palm oil. Russian imports of both oilshad surged in 2001/02 because of a large drop indomestic oil production.
22 l Oil Crop Situation and Outlook Yearbook / OCS-2003 / October 2003 Economic Research Service/USDA
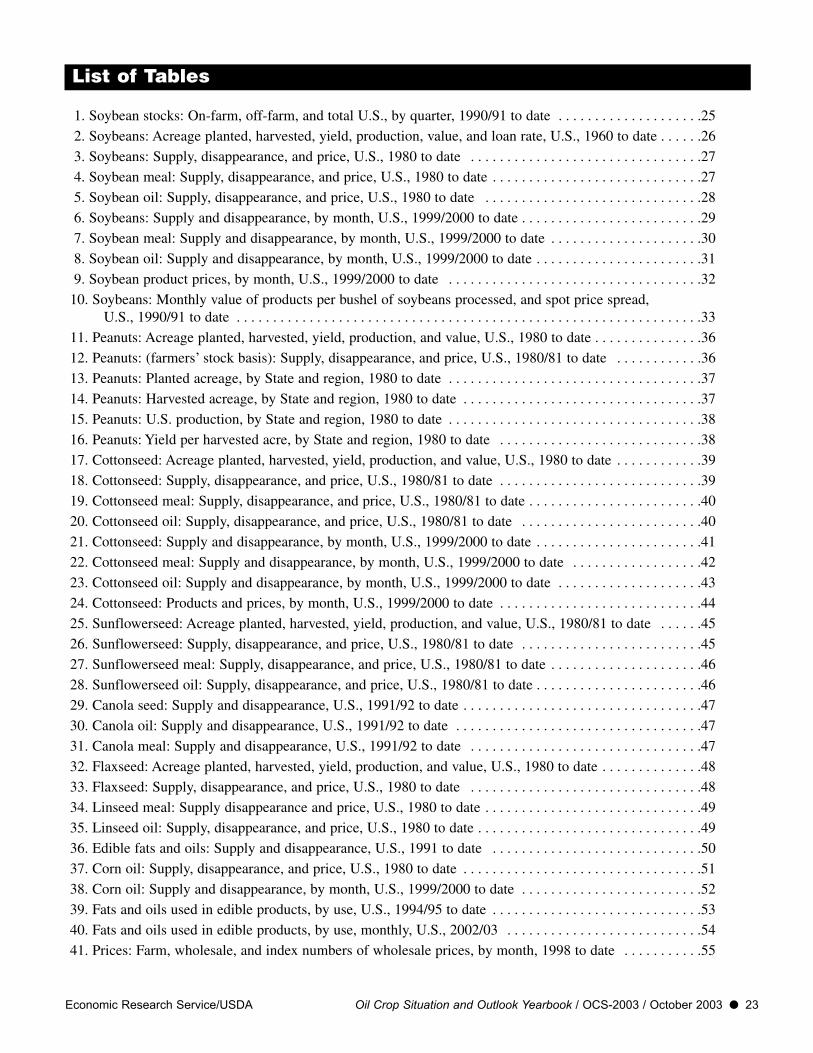
1. Soybean stocks: On-farm, off-farm, and total U.S., by quarter, 1990/91 to date . . . . . . . . . . . . . . . . . . . .25
2. Soybeans: Acreage planted, harvested, yield, production, value, and loan rate, U.S., 1960 to date . . . . . .26
3. Soybeans: Supply, disappearance, and price, U.S., 1980 to date . . . . . . . . . . . . . . . . . . . . . . . . . . . . . . . .27
4. Soybean meal: Supply, disappearance, and price, U.S., 1980 to date . . . . . . . . . . . . . . . . . . . . . . . . . . . . .27
5. Soybean oil: Supply, disappearance, and price, U.S., 1980 to date . . . . . . . . . . . . . . . . . . . . . . . . . . . . . .28
6. Soybeans: Supply and disappearance, by month, U.S., 1999/2000 to date . . . . . . . . . . . . . . . . . . . . . . . . .29
7. Soybean meal: Supply and disappearance, by month, U.S., 1999/2000 to date . . . . . . . . . . . . . . . . . . . . .30
8. Soybean oil: Supply and disappearance, by month, U.S., 1999/2000 to date . . . . . . . . . . . . . . . . . . . . . . .31
9. Soybean product prices, by month, U.S., 1999/2000 to date . . . . . . . . . . . . . . . . . . . . . . . . . . . . . . . . . . .32
10. Soybeans: Monthly value of products per bushel of soybeans processed, and spot price spread,U.S., 1990/91 to date . . . . . . . . . . . . . . . . . . . . . . . . . . . . . . . . . . . . . . . . . . . . . . . . . . . . . . . . . . . . . . . .33
11. Peanuts: Acreage planted, harvested, yield, production, and value, U.S., 1980 to date . . . . . . . . . . . . . . .36
12. Peanuts: (farmers’ stock basis): Supply, disappearance, and price, U.S., 1980/81 to date . . . . . . . . . . . .36
13. Peanuts: Planted acreage, by State and region, 1980 to date . . . . . . . . . . . . . . . . . . . . . . . . . . . . . . . . . . .37
14. Peanuts: Harvested acreage, by State and region, 1980 to date . . . . . . . . . . . . . . . . . . . . . . . . . . . . . . . . .37
15. Peanuts: U.S. production, by State and region, 1980 to date . . . . . . . . . . . . . . . . . . . . . . . . . . . . . . . . . . .38
16. Peanuts: Yield per harvested acre, by State and region, 1980 to date . . . . . . . . . . . . . . . . . . . . . . . . . . . .38
17. Cottonseed: Acreage planted, harvested, yield, production, and value, U.S., 1980 to date . . . . . . . . . . . .39
18. Cottonseed: Supply, disappearance, and price, U.S., 1980/81 to date . . . . . . . . . . . . . . . . . . . . . . . . . . . .39
19. Cottonseed meal: Supply, disappearance, and price, U.S., 1980/81 to date . . . . . . . . . . . . . . . . . . . . . . . .40
20. Cottonseed oil: Supply, disappearance, and price, U.S., 1980/81 to date . . . . . . . . . . . . . . . . . . . . . . . . .40
21. Cottonseed: Supply and disappearance, by month, U.S., 1999/2000 to date . . . . . . . . . . . . . . . . . . . . . . .41
22. Cottonseed meal: Supply and disappearance, by month, U.S., 1999/2000 to date . . . . . . . . . . . . . . . . . .42
23. Cottonseed oil: Supply and disappearance, by month, U.S., 1999/2000 to date . . . . . . . . . . . . . . . . . . . .43
24. Cottonseed: Products and prices, by month, U.S., 1999/2000 to date . . . . . . . . . . . . . . . . . . . . . . . . . . . .44
25. Sunflowerseed: Acreage planted, harvested, yield, production, and value, U.S., 1980/81 to date . . . . . .45
26. Sunflowerseed: Supply, disappearance, and price, U.S., 1980/81 to date . . . . . . . . . . . . . . . . . . . . . . . . .45
27. Sunflowerseed meal: Supply, disappearance, and price, U.S., 1980/81 to date . . . . . . . . . . . . . . . . . . . . .46
28. Sunflowerseed oil: Supply, disappearance, and price, U.S., 1980/81 to date . . . . . . . . . . . . . . . . . . . . . . .46
29. Canola seed: Supply and disappearance, U.S., 1991/92 to date . . . . . . . . . . . . . . . . . . . . . . . . . . . . . . . . .47
30. Canola oil: Supply and disappearance, U.S., 1991/92 to date . . . . . . . . . . . . . . . . . . . . . . . . . . . . . . . . . .47
31. Canola meal: Supply and disappearance, U.S., 1991/92 to date . . . . . . . . . . . . . . . . . . . . . . . . . . . . . . . .47
32. Flaxseed: Acreage planted, harvested, yield, production, and value, U.S., 1980 to date . . . . . . . . . . . . . .48
33. Flaxseed: Supply, disappearance, and price, U.S., 1980 to date . . . . . . . . . . . . . . . . . . . . . . . . . . . . . . . .48
34. Linseed meal: Supply disappearance and price, U.S., 1980 to date . . . . . . . . . . . . . . . . . . . . . . . . . . . . . .49
35. Linseed oil: Supply, disappearance, and price, U.S., 1980 to date . . . . . . . . . . . . . . . . . . . . . . . . . . . . . . .49
36. Edible fats and oils: Supply and disappearance, U.S., 1991 to date . . . . . . . . . . . . . . . . . . . . . . . . . . . . .50
37. Corn oil: Supply, disappearance, and price, U.S., 1980 to date . . . . . . . . . . . . . . . . . . . . . . . . . . . . . . . . .51
38. Corn oil: Supply and disappearance, by month, U.S., 1999/2000 to date . . . . . . . . . . . . . . . . . . . . . . . . .52
39. Fats and oils used in edible products, by use, U.S., 1994/95 to date . . . . . . . . . . . . . . . . . . . . . . . . . . . . .53
40. Fats and oils used in edible products, by use, monthly, U.S., 2002/03 . . . . . . . . . . . . . . . . . . . . . . . . . . .54
41. Prices: Farm, wholesale, and index numbers of wholesale prices, by month, 1998 to date . . . . . . . . . . .55
Economic Research Service/USDA Oil Crop Situation and Outlook Yearbook / OCS-2003 / October 2003 l 23
List of Tables
42. Fats and oils: Domestic consumption in food products, U.S., 1980 to date . . . . . . . . . . . . . . . . . . . . . . .61
43. Fats and oils: Use in selected industrial products, U.S., 1980 to date . . . . . . . . . . . . . . . . . . . . . . . . . . . .62
44. Salad and cooking oils: Supply and disappearance, U.S., 1980 to date . . . . . . . . . . . . . . . . . . . . . . . . . . .62
45. Salad and cooking oils: Fats and oils used in manufacturing, U.S., 1980 to date . . . . . . . . . . . . . . . . . . .63
46. Baking and frying fats: Supply and disappearance, U.S., 1980 to date . . . . . . . . . . . . . . . . . . . . . . . . . . .63
47. Baking and frying fats: Fats and oils used in manufacturing, U.S., 1980 to date . . . . . . . . . . . . . . . . . . .64
48. Margarine (actual weight): Supply, disappearance, and price, U.S., 1980 to date . . . . . . . . . . . . . . . . . . .64
49. Margarine: Fats and oils used in manufacturing, U.S., 1980 to date . . . . . . . . . . . . . . . . . . . . . . . . . . . . .65
50. Lard: Supply, disappearance, and price, U.S., 1980 to date . . . . . . . . . . . . . . . . . . . . . . . . . . . . . . . . . . . .65
51. Butter (actual weight): Supply, disappearance, and price, U.S., 1980 to date . . . . . . . . . . . . . . . . . . . . . .66
52. Edible tallow: Supply, disappearance, and price, U.S., 1980 to date . . . . . . . . . . . . . . . . . . . . . . . . . . . . .66
53. Supply and use: Soybeans, soybean meal, and soybean oil, U.S., major foreign exporters,importers, and world, 2000/01 to date . . . . . . . . . . . . . . . . . . . . . . . . . . . . . . . . . . . . . . . . . . . . . . . . . . .67
54. World oilseed production, 1996/97 to date . . . . . . . . . . . . . . . . . . . . . . . . . . . . . . . . . . . . . . . . . . . . . . . . .68
55. World vegetable oils production, 1996/97 to date . . . . . . . . . . . . . . . . . . . . . . . . . . . . . . . . . . . . . . . . . . .68
56. World protein meal production, 1996/97 to date . . . . . . . . . . . . . . . . . . . . . . . . . . . . . . . . . . . . . . . . . . . .68
24 l Oil Crop Situation and Outlook Yearbook / OCS-2003 / October 2003 Economic Research Service/USDA
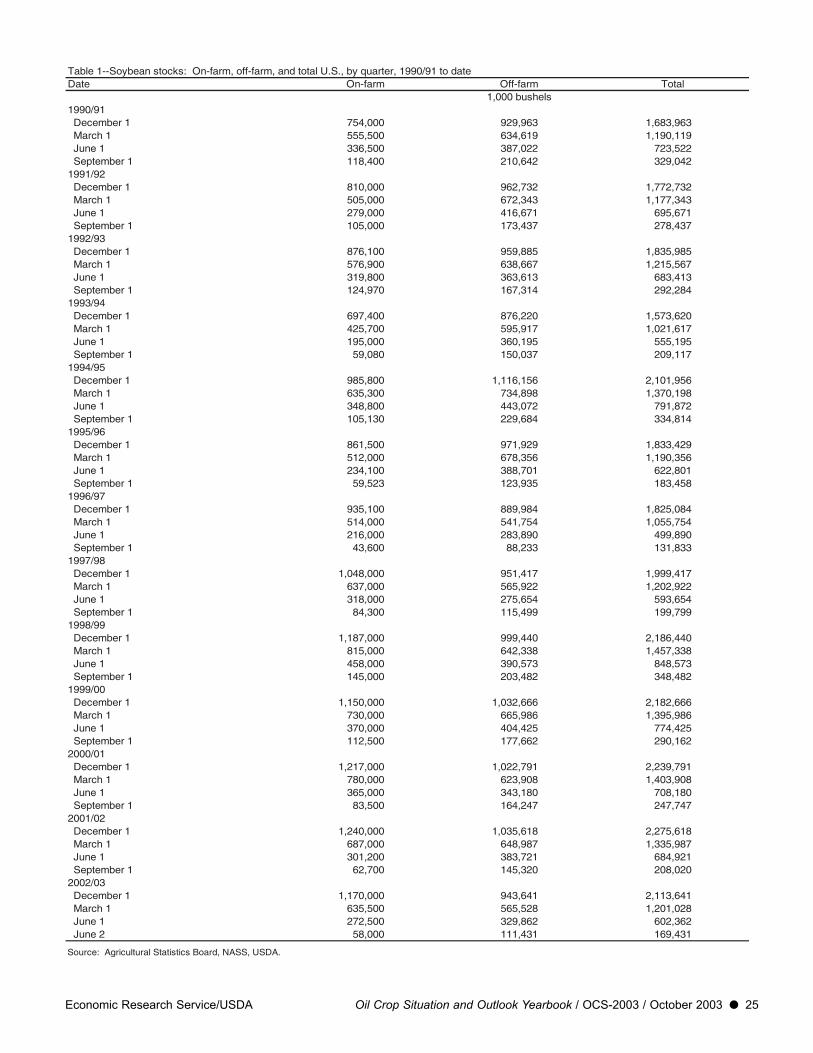
Economic Research Service/USDA Oil Crop Situation and Outlook Yearbook / OCS-2003 / October 2003 l 25
Table 1--Soybean stocks: On-farm, off-farm, and total U.S., by quarter, 1990/91 to dateDate On-farm Off-farm Total
1,000 bushels1990/91 December 1 754,000 929,963 1,683,963 March 1 555,500 634,619 1,190,119 June 1 336,500 387,022 723,522 September 1 118,400 210,642 329,0421991/92 December 1 810,000 962,732 1,772,732 March 1 505,000 672,343 1,177,343 June 1 279,000 416,671 695,671 September 1 105,000 173,437 278,4371992/93 December 1 876,100 959,885 1,835,985 March 1 576,900 638,667 1,215,567 June 1 319,800 363,613 683,413 September 1 124,970 167,314 292,2841993/94 December 1 697,400 876,220 1,573,620 March 1 425,700 595,917 1,021,617 June 1 195,000 360,195 555,195 September 1 59,080 150,037 209,1171994/95 December 1 985,800 1,116,156 2,101,956 March 1 635,300 734,898 1,370,198 June 1 348,800 443,072 791,872 September 1 105,130 229,684 334,8141995/96 December 1 861,500 971,929 1,833,429 March 1 512,000 678,356 1,190,356 June 1 234,100 388,701 622,801 September 1 59,523 123,935 183,4581996/97 December 1 935,100 889,984 1,825,084 March 1 514,000 541,754 1,055,754 June 1 216,000 283,890 499,890 September 1 43,600 88,233 131,8331997/98 December 1 1,048,000 951,417 1,999,417 March 1 637,000 565,922 1,202,922 June 1 318,000 275,654 593,654 September 1 84,300 115,499 199,7991998/99 December 1 1,187,000 999,440 2,186,440 March 1 815,000 642,338 1,457,338 June 1 458,000 390,573 848,573 September 1 145,000 203,482 348,4821999/00 December 1 1,150,000 1,032,666 2,182,666 March 1 730,000 665,986 1,395,986 June 1 370,000 404,425 774,425 September 1 112,500 177,662 290,1622000/01 December 1 1,217,000 1,022,791 2,239,791 March 1 780,000 623,908 1,403,908 June 1 365,000 343,180 708,180 September 1 83,500 164,247 247,7472001/02 December 1 1,240,000 1,035,618 2,275,618 March 1 687,000 648,987 1,335,987 June 1 301,200 383,721 684,921 September 1 62,700 145,320 208,0202002/03 December 1 1,170,000 943,641 2,113,641 March 1 635,500 565,528 1,201,028 June 1 272,500 329,862 602,362 June 2 58,000 111,431 169,431
Source: Agricultural Statistics Board, NASS, USDA.

26 l Oil Crop Situation and Outlook Yearbook / OCS-2003 / October 2003 Economic Research Service/USDA
Table 2--Soybeans: Acreage planted, harvested, yield, production, value, and loan rate, U.S., 1960 to dateYear Planted Harvested Yield Production Value Loan
per acre rate 1/----------------1,000 acres--------------------- Bushels 1,000 bushels $1,000 $/bu.
1960 24,440 23,655 23.5 555,085 1,184,910 1.851961 27,787 27,003 25.1 678,554 1,543,909 2.301962 28,418 27,608 24.2 669,186 1,564,352 2.251963 29,462 28,615 24.4 699,165 1,755,076 2.251964 31,721 30,793 22.8 700,921 1,836,441 2.251965 35,227 34,449 24.5 845,608 2,151,305 2.251966 37,294 36,546 25.4 928,481 2,553,612 2.501967 40,819 39,805 24.5 976,439 2,433,519 2.501968 42,265 41,391 26.7 1,106,958 2,688,571 2.501969 42,534 41,337 27.4 1,133,120 2,664,204 2.25
1970 43,082 42,249 26.7 1,127,100 3,214,710 2.251971 43,476 42,705 27.5 1,176,101 3,560,022 2.251972 46,866 45,683 27.8 1,270,608 5,550,074 2.251973 56,549 55,667 27.8 1,547,543 8,790,042 2.251974 52,479 51,341 23.7 1,216,287 8,078,943 2.251975 54,590 53,617 28.9 1,548,344 7,622,493 N.A.1976 50,269 49,401 26.1 1,288,608 8,775,761 2.501977 58,978 57,830 30.6 1,767,267 10,383,377 3.501978 64,708 63,663 29.4 1,868,754 12,449,679 4.501979 71,411 70,343 32.1 2,260,665 14,203,660 4.50
1980 69,930 67,813 26.5 1,797,543 13,601,112 5.021981 67,543 66,163 30.1 1,989,110 12,004,638 5.021982 70,884 69,442 31.5 2,190,297 12,483,481 5.021983 63,779 62,525 26.2 1,635,772 12,978,513 5.021984 67,755 66,113 28.1 1,860,863 10,864,686 5.021985 63,145 61,599 34.1 2,099,056 10,583,535 5.021986 60,405 58,312 33.3 1,942,558 9,274,487 4.771987 58,180 57,172 33.9 1,937,722 11,391,000 4.771988 58,840 57,373 27.0 1,548,841 11,487,742 4.771989 60,820 59,538 32.3 1,923,666 10,916,145 4.53
1990 57,795 56,512 34.1 1,925,947 11,042,010 4.501991 59,180 58,011 34.2 1,986,539 11,091,996 4.921992 59,180 58,233 37.6 2,190,354 12,167,564 4.921993 60,085 57,307 32.6 1,869,718 12,167,564 4.921994 61,620 60,809 41.4 2,514,869 13,756,328 4.921995 62,495 61,544 35.3 2,174,254 14,616,758 4.921996 64,195 63,349 37.6 2,380,274 17,439,971 4.971997 70,005 69,110 38.9 2,688,750 17,372,628 5.261998 72,025 70,441 38.9 2,741,014 13,493,831 5.261999 73,730 72,446 36.6 2,653,758 12,205,532 5.26
2000 74,266 72,408 38.1 2,757,810 12,466,572 5.262001 74,075 72,975 39.6 2,890,682 12,605,757 5.262002 73,923 72,437 38.0 2,749,340 15,203,850 5.002003 2/ 73,585 72,538 34.0 2,468,390 16,044,535 5.00
N.A. = Not applicable.
1/ A marketing loan program replaced the nonrecourse loan of previous years beginning with the 1991 crop. Effective marketing loan value is $4.92 ($5.02 less
2-percent origination fee) for crop years 1991-1993. 2/ Forecast.
Source: National Agricultural Statistics Service, and FSA, USDA.
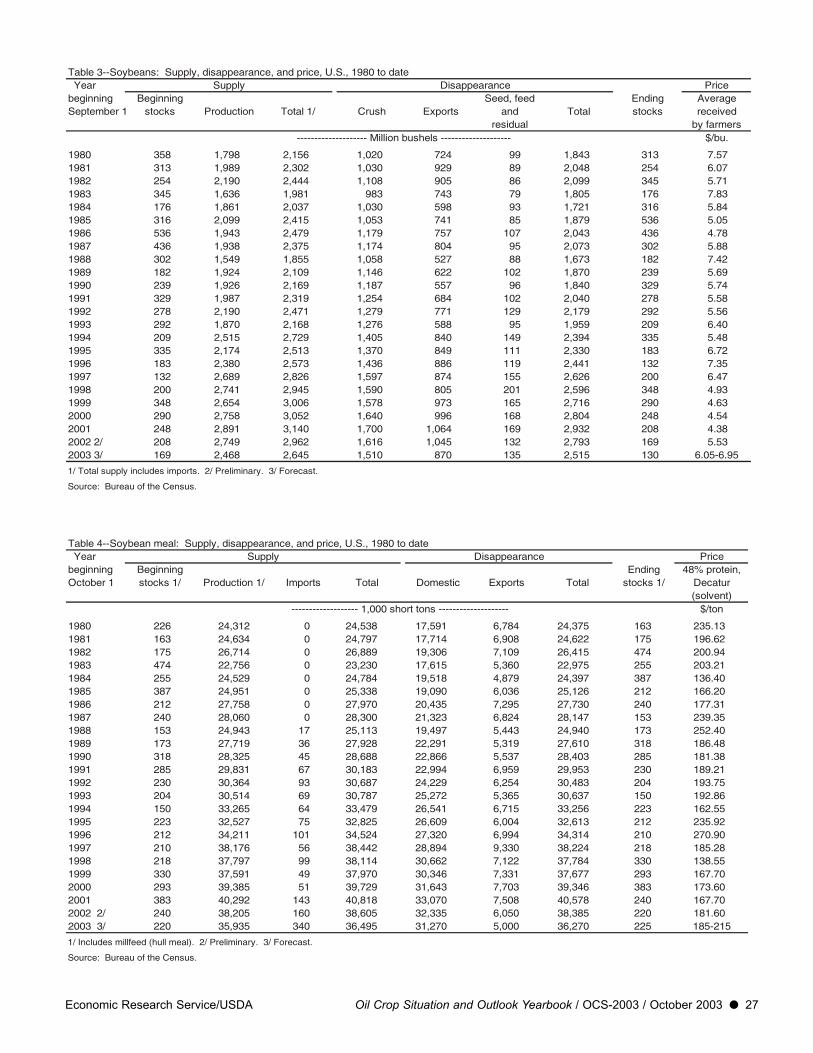
Economic Research Service/USDA Oil Crop Situation and Outlook Yearbook / OCS-2003 / October 2003 l 27
Table 3--Soybeans: Supply, disappearance, and price, U.S., 1980 to date Year Supply Disappearance Pricebeginning Beginning Seed, feed Ending AverageSeptember 1 stocks Production Total 1/ Crush Exports and Total stocks received
residual by farmers-------------------- Million bushels -------------------- $/bu.
1980 358 1,798 2,156 1,020 724 99 1,843 313 7.571981 313 1,989 2,302 1,030 929 89 2,048 254 6.071982 254 2,190 2,444 1,108 905 86 2,099 345 5.711983 345 1,636 1,981 983 743 79 1,805 176 7.831984 176 1,861 2,037 1,030 598 93 1,721 316 5.841985 316 2,099 2,415 1,053 741 85 1,879 536 5.051986 536 1,943 2,479 1,179 757 107 2,043 436 4.781987 436 1,938 2,375 1,174 804 95 2,073 302 5.881988 302 1,549 1,855 1,058 527 88 1,673 182 7.421989 182 1,924 2,109 1,146 622 102 1,870 239 5.691990 239 1,926 2,169 1,187 557 96 1,840 329 5.741991 329 1,987 2,319 1,254 684 102 2,040 278 5.581992 278 2,190 2,471 1,279 771 129 2,179 292 5.561993 292 1,870 2,168 1,276 588 95 1,959 209 6.401994 209 2,515 2,729 1,405 840 149 2,394 335 5.481995 335 2,174 2,513 1,370 849 111 2,330 183 6.721996 183 2,380 2,573 1,436 886 119 2,441 132 7.351997 132 2,689 2,826 1,597 874 155 2,626 200 6.471998 200 2,741 2,945 1,590 805 201 2,596 348 4.931999 348 2,654 3,006 1,578 973 165 2,716 290 4.632000 290 2,758 3,052 1,640 996 168 2,804 248 4.542001 248 2,891 3,140 1,700 1,064 169 2,932 208 4.382002 2/ 208 2,749 2,962 1,616 1,045 132 2,793 169 5.532003 3/ 169 2,468 2,645 1,510 870 135 2,515 130 6.05-6.95
1/ Total supply includes imports. 2/ Preliminary. 3/ Forecast.
Source: Bureau of the Census.
Table 4--Soybean meal: Supply, disappearance, and price, U.S., 1980 to date Year Supply Disappearance Pricebeginning Beginning Ending 48% protein,October 1 stocks 1/ Production 1/ Imports Total Domestic Exports Total stocks 1/ Decatur
(solvent)------------------- 1,000 short tons -------------------- $/ton
1980 226 24,312 0 24,538 17,591 6,784 24,375 163 235.131981 163 24,634 0 24,797 17,714 6,908 24,622 175 196.621982 175 26,714 0 26,889 19,306 7,109 26,415 474 200.941983 474 22,756 0 23,230 17,615 5,360 22,975 255 203.211984 255 24,529 0 24,784 19,518 4,879 24,397 387 136.401985 387 24,951 0 25,338 19,090 6,036 25,126 212 166.201986 212 27,758 0 27,970 20,435 7,295 27,730 240 177.311987 240 28,060 0 28,300 21,323 6,824 28,147 153 239.351988 153 24,943 17 25,113 19,497 5,443 24,940 173 252.401989 173 27,719 36 27,928 22,291 5,319 27,610 318 186.481990 318 28,325 45 28,688 22,866 5,537 28,403 285 181.381991 285 29,831 67 30,183 22,994 6,959 29,953 230 189.211992 230 30,364 93 30,687 24,229 6,254 30,483 204 193.751993 204 30,514 69 30,787 25,272 5,365 30,637 150 192.861994 150 33,265 64 33,479 26,541 6,715 33,256 223 162.551995 223 32,527 75 32,825 26,609 6,004 32,613 212 235.921996 212 34,211 101 34,524 27,320 6,994 34,314 210 270.901997 210 38,176 56 38,442 28,894 9,330 38,224 218 185.281998 218 37,797 99 38,114 30,662 7,122 37,784 330 138.551999 330 37,591 49 37,970 30,346 7,331 37,677 293 167.702000 293 39,385 51 39,729 31,643 7,703 39,346 383 173.602001 383 40,292 143 40,818 33,070 7,508 40,578 240 167.702002 2/ 240 38,205 160 38,605 32,335 6,050 38,385 220 181.602003 3/ 220 35,935 340 36,495 31,270 5,000 36,270 225 185-215
1/ Includes millfeed (hull meal). 2/ Preliminary. 3/ Forecast.
Source: Bureau of the Census.
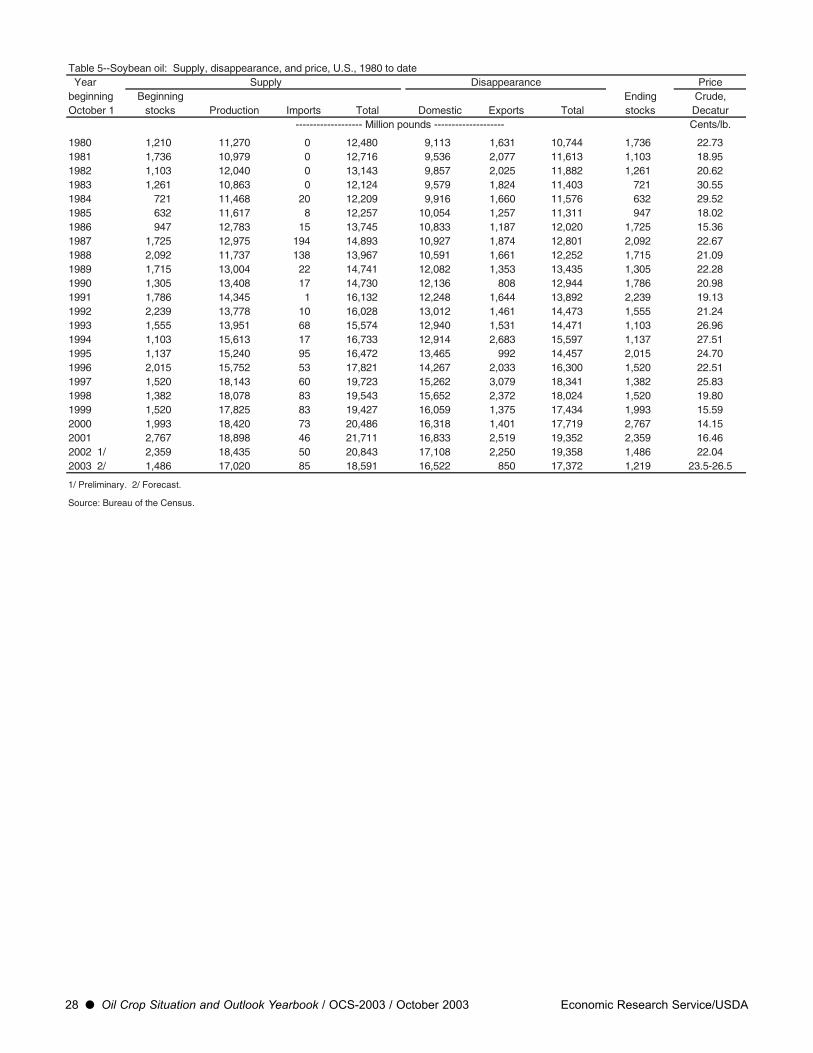
28 l Oil Crop Situation and Outlook Yearbook / OCS-2003 / October 2003 Economic Research Service/USDA
Table 5--Soybean oil: Supply, disappearance, and price, U.S., 1980 to date Year Supply Disappearance Pricebeginning Beginning Ending Crude,October 1 stocks Production Imports Total Domestic Exports Total stocks Decatur
------------------- Million pounds -------------------- Cents/lb.
1980 1,210 11,270 0 12,480 9,113 1,631 10,744 1,736 22.731981 1,736 10,979 0 12,716 9,536 2,077 11,613 1,103 18.951982 1,103 12,040 0 13,143 9,857 2,025 11,882 1,261 20.621983 1,261 10,863 0 12,124 9,579 1,824 11,403 721 30.551984 721 11,468 20 12,209 9,916 1,660 11,576 632 29.521985 632 11,617 8 12,257 10,054 1,257 11,311 947 18.021986 947 12,783 15 13,745 10,833 1,187 12,020 1,725 15.361987 1,725 12,975 194 14,893 10,927 1,874 12,801 2,092 22.671988 2,092 11,737 138 13,967 10,591 1,661 12,252 1,715 21.091989 1,715 13,004 22 14,741 12,082 1,353 13,435 1,305 22.281990 1,305 13,408 17 14,730 12,136 808 12,944 1,786 20.981991 1,786 14,345 1 16,132 12,248 1,644 13,892 2,239 19.131992 2,239 13,778 10 16,028 13,012 1,461 14,473 1,555 21.241993 1,555 13,951 68 15,574 12,940 1,531 14,471 1,103 26.961994 1,103 15,613 17 16,733 12,914 2,683 15,597 1,137 27.511995 1,137 15,240 95 16,472 13,465 992 14,457 2,015 24.701996 2,015 15,752 53 17,821 14,267 2,033 16,300 1,520 22.511997 1,520 18,143 60 19,723 15,262 3,079 18,341 1,382 25.831998 1,382 18,078 83 19,543 15,652 2,372 18,024 1,520 19.801999 1,520 17,825 83 19,427 16,059 1,375 17,434 1,993 15.592000 1,993 18,420 73 20,486 16,318 1,401 17,719 2,767 14.152001 2,767 18,898 46 21,711 16,833 2,519 19,352 2,359 16.462002 1/ 2,359 18,435 50 20,843 17,108 2,250 19,358 1,486 22.042003 2/ 1,486 17,020 85 18,591 16,522 850 17,372 1,219 23.5-26.5
1/ Preliminary. 2/ Forecast.
Source: Bureau of the Census.

Economic Research Service/USDA Oil Crop Situation and Outlook Yearbook / OCS-2003 / October 2003 l 29
Table 6--Soybeans: Supply and disappearance, by month, U.S., 1999/2000 to date Year Supply Disappearance Ending stocksbeginning Beginning stocks Imports Crush Exports at millSeptember 1 at mill
1,000 bushels
1999/2000 September 41,715 58 133,780 69,399 70,752 October 70,752 707 150,193 122,762 162,874 November 162,874 245 142,773 104,505 144,703 December 144,703 248 142,977 109,139 144,193 January 144,193 284 139,230 104,001 140,310 February 140,310 338 125,440 103,076 137,750 March 137,750 549 130,447 109,703 129,597 April 129,597 178 121,500 50,580 98,673 May 98,673 302 120,980 45,560 78,667 June 78,667 501 117,943 45,962 78,417 July 78,417 398 130,210 50,276 52,146 August 52,146 365 122,177 58,441 48,457Total 4,171 1,577,650 973,4052000/01 September 52,146 117 128,887 51,358 56,763 October 56,763 521 149,130 141,379 179,446 November 179,446 263 143,120 123,031 166,764 December 166,764 243 142,280 106,553 137,797 January 137,797 263 146,727 103,255 143,270 February 143,270 293 128,930 126,484 127,037 March 127,037 379 141,763 135,203 120,557 April 120,557 183 131,053 52,757 94,927 May 94,927 251 132,670 39,770 86,117 June 86,117 362 128,010 39,528 79,277 July 79,277 406 133,630 33,114 68,977 August 68,977 286 133,470 43,440 56,453Total 3,568 1,639,670 995,8712001/02 September 68,977 61 128,227 31,730 41,343 October 41,343 395 150,233 158,905 152,803 November 152,803 389 149,080 157,984 137,087 December 137,087 173 153,443 133,248 121,357 January 121,357 266 155,123 157,172 129,632 February 129,632 198 139,030 132,029 128,240 March 128,240 262 149,793 63,774 112,859 April 112,859 141 139,200 45,951 104,243 May 104,243 59 140,618 45,573 88,230 June 88,230 100 134,589 43,239 67,889 July 67,889 148 129,829 55,997 65,400 August 65,400 127 130,567 38,048 46,371Total 2,320 1,699,733 1,063,6512002/03 September 46,371 57 122,342 30,878 36,287 October 36,287 831 149,467 136,677 114,534 November 114,534 525 145,694 152,848 113,492 December 113,492 327 150,169 114,677 106,043 January 106,043 307 142,691 156,998 109,182 February 109,182 461 129,166 154,031 103,466 March 103,466 347 142,730 91,488 91,536 April 91,536 428 126,994 66,351 91,600 May 91,600 466 130,477 38,604 76,125 June 76,125 510 121,377 30,794 64,870 July 64,870 272 129,262 38,971 55,590 August 55,590 129 125,092 32,724 35,324Total 4,661 1,615,461 1,045,040
Source: Bureau of the Census.

30 l Oil Crop Situation and Outlook Yearbook / OCS-2003 / October 2003 Economic Research Service/USDA
Table 7--Soybean meal: Supply and disappearance, by month, U.S., 1999/2000 to dateSupply 1/ Disappearance 1/
Year Beginning Domestic Endingbeginning stocks Production Imports Total use Exports Total stocksOctober 1
1,000 short tons
1999/2000 October 330.2 3,573.4 3.3 3,906.9 2,687.7 751.5 3,439.3 467.6 November 467.6 3,400.4 3.5 3,871.6 2,740.8 670.6 3,411.4 460.2 December 460.2 3,413.5 3.8 3,877.4 2,619.7 821.2 3,441.0 436.5 January 436.5 3,332.8 4.4 3,773.6 2,539.4 744.4 3,283.8 489.8 February 489.8 2,998.2 5.2 3,493.2 2,454.7 556.0 3,010.7 482.5 March 482.5 3,123.6 7.2 3,613.3 2,380.9 882.2 3,263.1 350.2 April 350.2 2,906.1 7.2 3,263.5 2,348.6 473.7 2,822.3 441.2 May 441.2 2,882.5 3.8 3,327.5 2,596.0 406.5 3,002.5 325.0 June 325.0 2,845.4 2.4 3,172.8 2,423.6 488.9 2,912.6 260.2 July 260.2 3,118.8 1.5 3,380.5 2,614.1 460.6 3,074.7 305.8 August 305.8 2,906.8 2.4 3,214.9 2,556.0 433.0 2,989.1 225.9 September 225.9 3,089.7 4.5 3,320.1 2,384.5 642.6 3,027.2 292.9 Total 2/ 37,591.2 49.1 38,002.6 30,346.2 7,331.4 37,677.62000/01 October 292.9 3,573.9 2.5 3,869.3 2,926.0 625.9 3,551.9 317.4 November 317.4 3,432.8 2.2 3,752.3 2,802.5 606.0 3,408.5 343.8 December 343.8 3,399.4 3.0 3,746.2 2,739.7 582.8 3,322.5 423.7 January 423.7 3,521.6 6.2 3,951.5 2,789.9 827.6 3,617.5 333.9 February 333.9 3,083.0 4.5 3,421.5 2,351.0 744.6 3,095.6 325.8 March 325.8 3,412.5 4.9 3,743.2 2,530.3 903.8 3,434.1 309.1 April 309.1 3,152.3 4.5 3,465.9 2,486.5 666.1 3,152.6 313.3 May 313.3 3,181.0 5.8 3,500.1 2,630.2 582.9 3,213.1 286.9 June 286.9 3,091.6 6.6 3,385.2 2,503.7 540.1 3,043.9 341.3 July 341.3 3,256.6 2.8 3,600.7 2,755.1 507.6 3,262.7 338.1 August 338.1 3,203.6 6.1 3,547.7 2,721.1 552.7 3,273.8 273.9 September 273.9 3,076.8 2.1 3,352.8 2,406.6 562.9 2,969.5 383.3 Total 39,385.1 51.1 38,002.6 31,642.6 7,703.1 39,345.72001/02 October 383.3 3,534.4 7.0 3,924.7 2,901.7 717.5 3,619.2 305.5 November 305.5 3,538.7 5.7 3,849.9 2,874.7 672.3 3,547.0 302.9 December 302.9 3,655.3 4.6 3,962.8 2,969.6 599.5 3,569.1 393.7 January 393.7 3,703.1 7.3 4,104.1 3,033.5 780.9 3,814.4 289.7 February 289.7 3,313.2 4.6 3,607.5 2,384.7 950.7 3,335.5 272.0 March 272.0 3,589.7 5.3 3,867.1 2,670.5 860.1 3,530.6 336.5 April 336.5 3,315.7 6.8 3,658.9 2,946.1 459.0 3,405.2 253.8 May 253.8 3,344.2 6.3 3,604.2 2,929.8 461.7 3,391.5 212.7 June 212.7 3,194.1 5.0 3,411.9 2,434.5 634.0 3,068.5 343.3 July 343.3 3,085.4 7.0 3,435.8 2,701.4 532.0 3,233.4 202.4 August 202.4 3,106.7 40.3 3,349.3 2,730.8 362.0 3,092.8 256.5 September 256.5 2,911.3 43.2 3,211.1 2,492.7 478.4 2,971.1 240.0 Total 40,291.8 143.2 38,002.6 33,070.0 7,508.3 40,578.32002/03 October 240.0 3,499.3 41.5 3,780.8 3,150.4 345.3 3,495.6 285.2 November 285.2 3,424.7 7.5 3,717.4 2,747.4 598.3 3,345.6 371.7 December 371.7 3,526.8 8.7 3,907.2 2,897.2 673.0 3,570.2 337.0 January 337.0 3,358.4 11.7 3,707.2 2,545.2 862.9 3,408.0 299.1 February 299.1 3,048.4 12.7 3,360.3 2,552.9 547.8 3,100.7 259.5 March 259.5 3,360.1 8.5 3,628.0 2,661.5 630.9 3,292.4 335.7 April 335.7 2,994.7 6.2 3,336.6 2,630.1 443.0 3,073.1 263.5 May 263.5 3,072.4 5.0 3,340.9 2,647.8 381.3 3,029.1 311.8 June 311.8 2,873.4 4.4 3,189.6 2,519.4 398.6 2,918.0 271.6 July 271.6 3,064.4 5.5 3,341.4 2,743.3 369.8 3,113.1 228.4 August 228.4 2,966.6 46.4 3,241.4 2,590.6 383.8 2,974.5 266.9 September 266.9 3,015.7 NA 3,282.5 NA NA 3,062.1 220.4 Total 2/ 38,205.1 157.9 38,002.6 29,685.7 5,634.7 38,382.6
1/ Includes millfeed (hull meal). 2/ Imports, domestic disappearance, and export totals through August.
Source: Bureau of the Census.
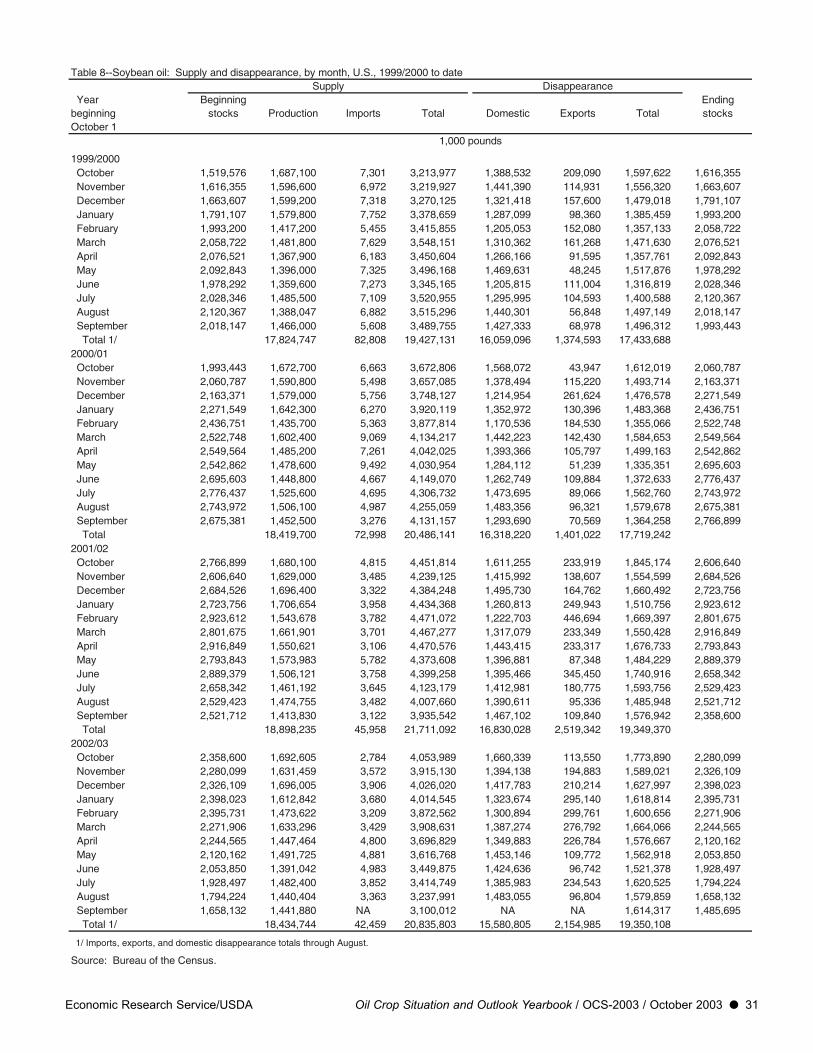
Economic Research Service/USDA Oil Crop Situation and Outlook Yearbook / OCS-2003 / October 2003 l 31
Table 8--Soybean oil: Supply and disappearance, by month, U.S., 1999/2000 to dateSupply Disappearance
Year Beginning Endingbeginning stocks Production Imports Total Domestic Exports Total stocksOctober 1
1,000 pounds
1999/2000 October 1,519,576 1,687,100 7,301 3,213,977 1,388,532 209,090 1,597,622 1,616,355 November 1,616,355 1,596,600 6,972 3,219,927 1,441,390 114,931 1,556,320 1,663,607 December 1,663,607 1,599,200 7,318 3,270,125 1,321,418 157,600 1,479,018 1,791,107 January 1,791,107 1,579,800 7,752 3,378,659 1,287,099 98,360 1,385,459 1,993,200 February 1,993,200 1,417,200 5,455 3,415,855 1,205,053 152,080 1,357,133 2,058,722 March 2,058,722 1,481,800 7,629 3,548,151 1,310,362 161,268 1,471,630 2,076,521 April 2,076,521 1,367,900 6,183 3,450,604 1,266,166 91,595 1,357,761 2,092,843 May 2,092,843 1,396,000 7,325 3,496,168 1,469,631 48,245 1,517,876 1,978,292 June 1,978,292 1,359,600 7,273 3,345,165 1,205,815 111,004 1,316,819 2,028,346 July 2,028,346 1,485,500 7,109 3,520,955 1,295,995 104,593 1,400,588 2,120,367 August 2,120,367 1,388,047 6,882 3,515,296 1,440,301 56,848 1,497,149 2,018,147 September 2,018,147 1,466,000 5,608 3,489,755 1,427,333 68,978 1,496,312 1,993,443 Total 1/ 17,824,747 82,808 19,427,131 16,059,096 1,374,593 17,433,6882000/01 October 1,993,443 1,672,700 6,663 3,672,806 1,568,072 43,947 1,612,019 2,060,787 November 2,060,787 1,590,800 5,498 3,657,085 1,378,494 115,220 1,493,714 2,163,371 December 2,163,371 1,579,000 5,756 3,748,127 1,214,954 261,624 1,476,578 2,271,549 January 2,271,549 1,642,300 6,270 3,920,119 1,352,972 130,396 1,483,368 2,436,751 February 2,436,751 1,435,700 5,363 3,877,814 1,170,536 184,530 1,355,066 2,522,748 March 2,522,748 1,602,400 9,069 4,134,217 1,442,223 142,430 1,584,653 2,549,564 April 2,549,564 1,485,200 7,261 4,042,025 1,393,366 105,797 1,499,163 2,542,862 May 2,542,862 1,478,600 9,492 4,030,954 1,284,112 51,239 1,335,351 2,695,603 June 2,695,603 1,448,800 4,667 4,149,070 1,262,749 109,884 1,372,633 2,776,437 July 2,776,437 1,525,600 4,695 4,306,732 1,473,695 89,066 1,562,760 2,743,972 August 2,743,972 1,506,100 4,987 4,255,059 1,483,356 96,321 1,579,678 2,675,381 September 2,675,381 1,452,500 3,276 4,131,157 1,293,690 70,569 1,364,258 2,766,899 Total 18,419,700 72,998 20,486,141 16,318,220 1,401,022 17,719,2422001/02 October 2,766,899 1,680,100 4,815 4,451,814 1,611,255 233,919 1,845,174 2,606,640 November 2,606,640 1,629,000 3,485 4,239,125 1,415,992 138,607 1,554,599 2,684,526 December 2,684,526 1,696,400 3,322 4,384,248 1,495,730 164,762 1,660,492 2,723,756 January 2,723,756 1,706,654 3,958 4,434,368 1,260,813 249,943 1,510,756 2,923,612 February 2,923,612 1,543,678 3,782 4,471,072 1,222,703 446,694 1,669,397 2,801,675 March 2,801,675 1,661,901 3,701 4,467,277 1,317,079 233,349 1,550,428 2,916,849 April 2,916,849 1,550,621 3,106 4,470,576 1,443,415 233,317 1,676,733 2,793,843 May 2,793,843 1,573,983 5,782 4,373,608 1,396,881 87,348 1,484,229 2,889,379 June 2,889,379 1,506,121 3,758 4,399,258 1,395,466 345,450 1,740,916 2,658,342 July 2,658,342 1,461,192 3,645 4,123,179 1,412,981 180,775 1,593,756 2,529,423 August 2,529,423 1,474,755 3,482 4,007,660 1,390,611 95,336 1,485,948 2,521,712 September 2,521,712 1,413,830 3,122 3,935,542 1,467,102 109,840 1,576,942 2,358,600 Total 18,898,235 45,958 21,711,092 16,830,028 2,519,342 19,349,3702002/03 October 2,358,600 1,692,605 2,784 4,053,989 1,660,339 113,550 1,773,890 2,280,099 November 2,280,099 1,631,459 3,572 3,915,130 1,394,138 194,883 1,589,021 2,326,109 December 2,326,109 1,696,005 3,906 4,026,020 1,417,783 210,214 1,627,997 2,398,023 January 2,398,023 1,612,842 3,680 4,014,545 1,323,674 295,140 1,618,814 2,395,731 February 2,395,731 1,473,622 3,209 3,872,562 1,300,894 299,761 1,600,656 2,271,906 March 2,271,906 1,633,296 3,429 3,908,631 1,387,274 276,792 1,664,066 2,244,565 April 2,244,565 1,447,464 4,800 3,696,829 1,349,883 226,784 1,576,667 2,120,162 May 2,120,162 1,491,725 4,881 3,616,768 1,453,146 109,772 1,562,918 2,053,850 June 2,053,850 1,391,042 4,983 3,449,875 1,424,636 96,742 1,521,378 1,928,497 July 1,928,497 1,482,400 3,852 3,414,749 1,385,983 234,543 1,620,525 1,794,224 August 1,794,224 1,440,404 3,363 3,237,991 1,483,055 96,804 1,579,859 1,658,132 September 1,658,132 1,441,880 NA 3,100,012 NA NA 1,614,317 1,485,695 Total 1/ 18,434,744 42,459 20,835,803 15,580,805 2,154,985 19,350,108
1/ Imports, exports, and domestic disappearance totals through August.
Source: Bureau of the Census.

32 l Oil Crop Situation and Outlook Yearbook / OCS-2003 / October 2003 Economic Research Service/USDA
Table 9--Soybean product prices, by month, U.S., 1999/2000 to date Year Price Soybean meal Soybean oil,beginning received 48-percent crude,October 1 by farmers Decatur Decatur
$/bu. $/ton Cents/lb.
1999/2000 October 4.48 153.57 16.08 November 4.45 154.70 15.63 December 4.43 154.00 15.30 January 4.62 163.41 15.63 February 4.79 170.49 15.09 March 4.91 175.50 16.21 April 5.00 177.45 17.52 May 5.19 189.34 16.75 June 4.93 177.45 15.65 July 4.53 163.38 14.70 August 4.45 157.48 14.34 September 4.57 174.60 14.24Simple average 4.70 167.61 15.602000/01 October 4.45 171.52 13.50 November 4.55 179.95 13.37 December 4.78 195.65 13.12 January 4.68 183.17 12.53 February 4.46 166.09 12.38 March 4.39 156.32 13.90 April 4.22 158.48 13.53 May 4.33 165.14 13.53 June 4.46 172.60 14.20 July 4.79 184.43 16.49 August 4.85 178.46 17.08 September 4.53 171.67 15.46Simple average 4.54 173.62 14.092001/02 October 4.09 165.45 14.38 November 4.16 166.10 15.23 December 4.20 154.18 15.10 January 4.22 158.01 14.82 February 4.21 153.11 14.15 March 4.38 160.49 14.75 April 4.47 161.57 15.30 May 4.64 164.28 15.98 June 4.88 170.33 17.69 July 5.35 187.45 19.12 August 5.53 186.25 20.61 September 5.39 185.45 20.32Simple average 4.63 167.72 16.452002/03 October 5.20 168.20 20.75 November 5.46 163.20 23.00 December 5.46 163.60 22.60 January 5.51 167.40 21.50 February 5.55 176.80 21.20 March 5.59 175.40 21.55 April 5.82 182.10 22.40 May 6.07 195.40 23.20 June 6.09 191.90 22.90 July 5.82 187.30 21.80 August 5.68 189.70 20.40 September 6.04 217.95 23.22Simple average 5.69 181.58 22.04
Source: National Agricultural Statistics Service and Agricultural Marketing Service.
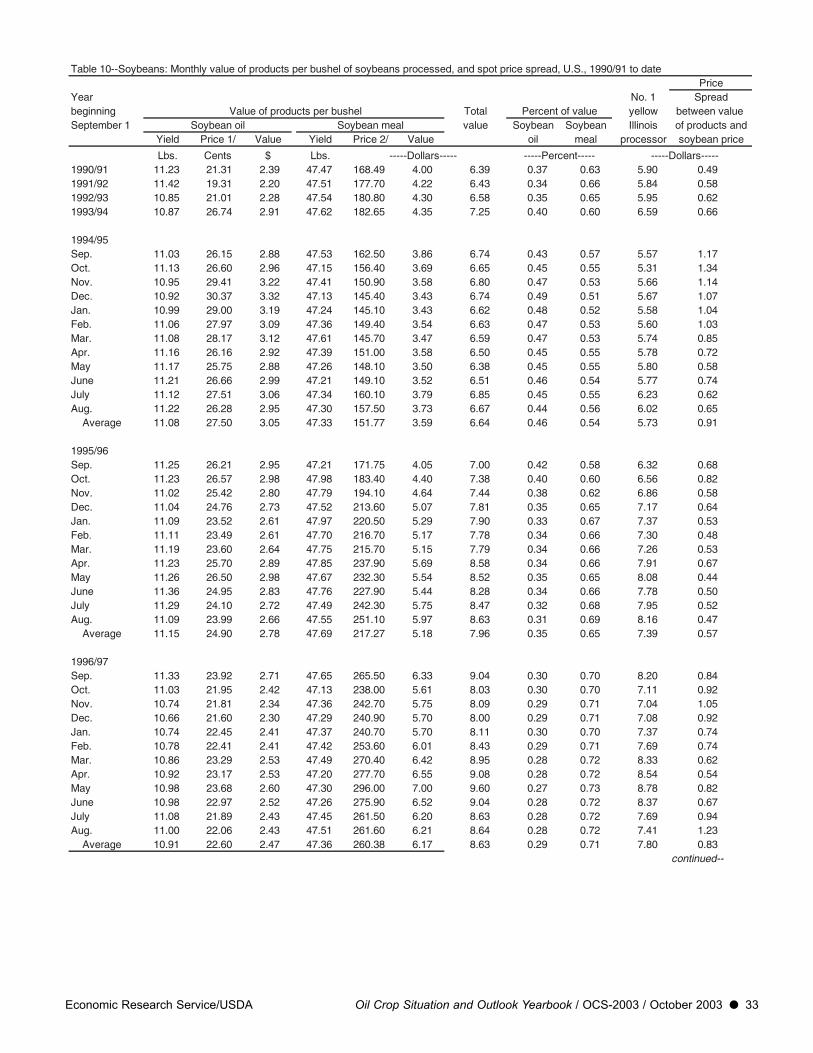
Economic Research Service/USDA Oil Crop Situation and Outlook Yearbook / OCS-2003 / October 2003 l 33
Table 10--Soybeans: Monthly value of products per bushel of soybeans processed, and spot price spread, U.S., 1990/91 to datePrice
Year No. 1 Spreadbeginning Value of products per bushel Total Percent of value yellow between value September 1 Soybean oil Soybean meal value Soybean Soybean Illinois of products and
Yield Price 1/ Value Yield Price 2/ Value oil meal processor soybean price
Lbs. Cents $ Lbs. -----Dollars----- -----Percent----- -----Dollars-----1990/91 11.23 21.31 2.39 47.47 168.49 4.00 6.39 0.37 0.63 5.90 0.491991/92 11.42 19.31 2.20 47.51 177.70 4.22 6.43 0.34 0.66 5.84 0.581992/93 10.85 21.01 2.28 47.54 180.80 4.30 6.58 0.35 0.65 5.95 0.621993/94 10.87 26.74 2.91 47.62 182.65 4.35 7.25 0.40 0.60 6.59 0.66
1994/95Sep. 11.03 26.15 2.88 47.53 162.50 3.86 6.74 0.43 0.57 5.57 1.17Oct. 11.13 26.60 2.96 47.15 156.40 3.69 6.65 0.45 0.55 5.31 1.34Nov. 10.95 29.41 3.22 47.41 150.90 3.58 6.80 0.47 0.53 5.66 1.14Dec. 10.92 30.37 3.32 47.13 145.40 3.43 6.74 0.49 0.51 5.67 1.07Jan. 10.99 29.00 3.19 47.24 145.10 3.43 6.62 0.48 0.52 5.58 1.04Feb. 11.06 27.97 3.09 47.36 149.40 3.54 6.63 0.47 0.53 5.60 1.03Mar. 11.08 28.17 3.12 47.61 145.70 3.47 6.59 0.47 0.53 5.74 0.85Apr. 11.16 26.16 2.92 47.39 151.00 3.58 6.50 0.45 0.55 5.78 0.72May 11.17 25.75 2.88 47.26 148.10 3.50 6.38 0.45 0.55 5.80 0.58June 11.21 26.66 2.99 47.21 149.10 3.52 6.51 0.46 0.54 5.77 0.74July 11.12 27.51 3.06 47.34 160.10 3.79 6.85 0.45 0.55 6.23 0.62Aug. 11.22 26.28 2.95 47.30 157.50 3.73 6.67 0.44 0.56 6.02 0.65 Average 11.08 27.50 3.05 47.33 151.77 3.59 6.64 0.46 0.54 5.73 0.91
1995/96Sep. 11.25 26.21 2.95 47.21 171.75 4.05 7.00 0.42 0.58 6.32 0.68Oct. 11.23 26.57 2.98 47.98 183.40 4.40 7.38 0.40 0.60 6.56 0.82Nov. 11.02 25.42 2.80 47.79 194.10 4.64 7.44 0.38 0.62 6.86 0.58Dec. 11.04 24.76 2.73 47.52 213.60 5.07 7.81 0.35 0.65 7.17 0.64Jan. 11.09 23.52 2.61 47.97 220.50 5.29 7.90 0.33 0.67 7.37 0.53Feb. 11.11 23.49 2.61 47.70 216.70 5.17 7.78 0.34 0.66 7.30 0.48Mar. 11.19 23.60 2.64 47.75 215.70 5.15 7.79 0.34 0.66 7.26 0.53Apr. 11.23 25.70 2.89 47.85 237.90 5.69 8.58 0.34 0.66 7.91 0.67May 11.26 26.50 2.98 47.67 232.30 5.54 8.52 0.35 0.65 8.08 0.44June 11.36 24.95 2.83 47.76 227.90 5.44 8.28 0.34 0.66 7.78 0.50July 11.29 24.10 2.72 47.49 242.30 5.75 8.47 0.32 0.68 7.95 0.52Aug. 11.09 23.99 2.66 47.55 251.10 5.97 8.63 0.31 0.69 8.16 0.47 Average 11.15 24.90 2.78 47.69 217.27 5.18 7.96 0.35 0.65 7.39 0.57
1996/97Sep. 11.33 23.92 2.71 47.65 265.50 6.33 9.04 0.30 0.70 8.20 0.84Oct. 11.03 21.95 2.42 47.13 238.00 5.61 8.03 0.30 0.70 7.11 0.92Nov. 10.74 21.81 2.34 47.36 242.70 5.75 8.09 0.29 0.71 7.04 1.05Dec. 10.66 21.60 2.30 47.29 240.90 5.70 8.00 0.29 0.71 7.08 0.92Jan. 10.74 22.45 2.41 47.37 240.70 5.70 8.11 0.30 0.70 7.37 0.74Feb. 10.78 22.41 2.41 47.42 253.60 6.01 8.43 0.29 0.71 7.69 0.74Mar. 10.86 23.29 2.53 47.49 270.40 6.42 8.95 0.28 0.72 8.33 0.62Apr. 10.92 23.17 2.53 47.20 277.70 6.55 9.08 0.28 0.72 8.54 0.54May 10.98 23.68 2.60 47.30 296.00 7.00 9.60 0.27 0.73 8.78 0.82June 10.98 22.97 2.52 47.26 275.90 6.52 9.04 0.28 0.72 8.37 0.67July 11.08 21.89 2.43 47.45 261.50 6.20 8.63 0.28 0.72 7.69 0.94Aug. 11.00 22.06 2.43 47.51 261.60 6.21 8.64 0.28 0.72 7.41 1.23 Average 10.91 22.60 2.47 47.36 260.38 6.17 8.63 0.29 0.71 7.80 0.83
continued--

34 l Oil Crop Situation and Outlook Yearbook / OCS-2003 / October 2003 Economic Research Service/USDA
Table 10--Soybeans: Monthly value of products per bushel of soybeans processed, and spot price spread, U.S., 1990/91 to date-continuedPrice
Year No. 1 Spreadbeginning Value of products per bushel Total Percent of value yellow between value September 1 Soybean oil Soybean meal value Soybean Soybean Illinois of products and
Yield Price 1/ Value Yield Price 2/ Value oil meal processor soybean price
Lbs. Cents $ Lbs. -----Dollars----- -----Percent----- -----Dollars-----1997/98Sep. 11.11 22.88 2.54 47.13 265.70 6.26 8.80 0.29 0.71 7.03 1.77Oct. 11.18 24.31 2.72 47.03 216.00 5.08 7.80 0.35 0.65 6.84 0.96Nov. 11.06 25.73 2.85 47.49 231.60 5.50 8.35 0.34 0.66 7.27 1.08Dec. 11.04 25.08 2.77 47.36 214.90 5.09 7.86 0.35 0.65 6.99 0.87Jan. 11.10 25.10 2.79 47.34 193.10 4.57 7.36 0.38 0.62 6.79 0.57Feb. 11.27 26.51 2.99 47.44 182.10 4.32 7.31 0.41 0.59 6.80 0.51Mar. 11.26 27.09 3.05 47.41 165.30 3.92 6.97 0.44 0.56 6.62 0.35Apr. 11.39 28.09 3.20 47.37 152.75 3.62 6.82 0.47 0.53 6.49 0.33May 11.44 28.27 3.23 47.71 150.30 3.59 6.82 0.47 0.53 6.49 0.33June 11.38 25.83 2.94 47.59 157.80 3.75 6.69 0.44 0.56 6.40 0.29July 11.39 24.88 2.83 47.52 173.30 4.12 6.95 0.41 0.59 6.42 0.53Aug. 11.48 23.99 2.76 47.62 135.70 3.23 5.99 0.46 0.54 5.56 0.43 Average 11.25 25.65 2.88 47.41 186.55 4.42 7.31 0.39 0.61 6.64 0.67
1998/99Sep. 11.38 25.13 2.86 47.31 126.90 3.00 5.86 0.49 0.51 5.33 0.53Oct. 11.23 25.21 2.83 47.27 129.40 3.06 5.89 0.48 0.52 5.36 0.53Nov. 11.17 25.20 2.82 47.10 139.30 3.28 6.10 0.46 0.54 5.72 0.38Dec. 11.14 23.99 2.67 47.33 139.60 3.30 5.98 0.45 0.55 5.58 0.40Jan. 11.20 22.88 2.56 47.14 131.00 3.09 5.65 0.45 0.55 5.32 0.33Feb. 11.27 19.96 2.25 47.44 124.40 2.95 5.20 0.43 0.57 4.90 0.30Mar. 11.34 18.54 2.10 47.19 127.20 3.00 5.10 0.41 0.59 4.75 0.35Apr. 11.31 18.78 2.12 47.40 128.60 3.05 5.17 0.41 0.59 4.80 0.37May 11.33 17.85 2.02 47.24 127.00 3.00 5.02 0.40 0.60 4.68 0.34June 11.42 16.50 1.88 46.95 131.70 3.09 4.98 0.38 0.62 4.62 0.36July 11.40 15.29 1.74 47.30 125.70 2.97 4.72 0.37 0.63 4.25 0.47Aug. 11.44 16.50 1.89 47.33 135.90 3.22 5.10 0.37 0.63 4.65 0.45 Average 11.30 20.49 2.31 47.25 130.56 3.08 5.40 0.43 0.57 5.00 0.40
1999/2000Sep. 11.42 16.79 1.92 47.36 144.05 3.41 5.33 0.36 0.64 4.85 0.48Oct. 11.23 16.08 1.81 47.58 147.20 3.50 5.31 0.34 0.66 4.70 0.61Nov. 11.18 15.63 1.75 47.63 148.10 3.53 5.28 0.33 0.67 4.64 0.64Dec. 11.19 15.30 1.71 47.75 145.40 3.47 5.18 0.33 0.67 4.60 0.58Jan. 11.35 15.63 1.77 47.87 154.96 3.71 5.48 0.32 0.68 4.73 0.75Feb. 11.30 15.09 1.70 47.80 163.55 3.91 5.61 0.30 0.70 5.00 0.61Mar. 11.36 16.21 1.84 47.89 166.57 3.99 5.83 0.32 0.68 5.13 0.70Apr. 11.26 17.52 1.97 47.84 168.11 4.02 5.99 0.33 0.67 5.29 0.70May 11.54 16.74 1.93 47.65 180.10 4.29 6.22 0.31 0.69 5.42 0.80June 11.53 15.65 1.80 48.25 170.18 4.11 5.91 0.31 0.69 5.10 0.81July 11.41 14.69 1.68 47.90 156.84 3.76 5.43 0.31 0.69 4.74 0.69Aug. 11.39 14.34 1.63 47.71 151.38 3.61 5.25 0.31 0.69 4.63 0.62 Average 11.34 15.81 1.79 47.76 158.04 3.77 5.57 0.32 0.68 4.90 0.66
2000/01Sep. 11.37 14.24 1.62 47.94 168.00 4.03 5.65 0.29 0.71 4.84 0.81Oct. 11.22 13.50 1.51 47.93 163.61 3.92 5.44 0.28 0.72 4.68 0.76Nov. 11.12 13.37 1.49 47.97 171.43 4.11 5.60 0.27 0.73 4.83 0.77Dec. 11.10 13.12 1.46 47.78 187.90 4.49 5.95 0.24 0.76 5.06 0.89Jan. 11.19 12.53 1.40 48.00 175.60 4.21 5.62 0.25 0.75 4.77 0.85Feb. 11.14 12.38 1.38 47.82 158.34 3.79 5.16 0.27 0.73 4.57 0.59Mar. 11.30 13.90 1.57 48.14 149.06 3.59 5.16 0.30 0.70 4.51 0.65Apr. 11.33 13.53 1.53 48.11 149.73 3.60 5.13 0.30 0.70 4.41 0.72May 11.14 13.53 1.51 47.95 155.58 3.73 5.24 0.29 0.71 4.57 0.67June 11.32 14.20 1.61 48.30 163.10 3.94 5.55 0.29 0.71 4.74 0.81July 11.42 16.49 1.88 48.74 174.19 4.25 6.13 0.31 0.69 5.17 0.96Aug. 11.28 17.08 1.93 48.00 170.63 4.10 6.02 0.32 0.68 5.10 0.92 Average 11.24 13.99 1.57 48.06 165.60 3.98 5.55 0.28 0.72 4.77 0.78
continued--

Economic Research Service/USDA Oil Crop Situation and Outlook Yearbook / OCS-2003 / October 2003 l 35
Table 10--Soybeans: Monthly value of products per bushel of soybeans processed, and spot price spread, U.S., 1990/91 to date-continuedPrice
Spreadbetween
Year No. 1 value ofbeginning Value of products per bushel Total Percent of value yellow products &Sep.1 Soybean oil Soybean meal Soybean hulls value Soybean Soybean Illinois soybean
Yield Price 1/ Value Yield Price 2/ Value Yield Price 3/ Value oil meal + hulls processor price
Lbs. Cents $ Lbs. $/ton $ Lbs. $/ton -----Dollars----- -----Percent----- -----Dollars-----2001/02Sep. 11.33 15.46 1.75 44.72 171.49 3.83 3.27 75.00 0.12 5.71 0.31 0.69 4.69 1.02Oct. 11.18 14.38 1.61 44.00 165.45 3.64 3.05 83.75 0.13 5.38 0.30 0.70 4.30 1.08Nov. 10.93 15.23 1.66 44.17 166.10 3.67 3.30 81.25 0.13 5.47 0.30 0.70 4.41 1.06Dec. 11.06 15.10 1.67 44.28 154.18 3.41 3.36 76.00 0.13 5.21 0.32 0.68 4.38 0.83Jan. 11.00 14.80 1.63 44.40 158.01 3.51 3.34 56.00 0.09 5.23 0.31 0.69 4.37 0.86Feb. 11.10 14.15 1.57 44.30 153.11 3.39 3.36 52.80 0.09 5.05 0.31 0.69 4.40 0.65Mar. 11.09 14.75 1.64 44.54 160.49 3.57 3.39 49.00 0.08 5.29 0.31 0.69 4.64 0.65Apr. 11.14 15.30 1.70 44.28 161.57 3.58 3.36 47.50 0.08 5.36 0.32 0.68 4.71 0.65May 11.19 16.00 1.79 44.18 164.28 3.63 3.38 42.40 0.07 5.49 0.33 0.67 4.92 0.57June 11.19 17.70 1.98 44.13 170.33 3.76 3.33 45.37 0.08 5.81 0.34 0.66 5.19 0.62July 11.25 19.12 2.15 44.10 187.45 4.13 3.43 58.08 0.10 6.38 0.34 0.66 5.75 0.63Aug. 11.29 20.60 2.33 44.14 186.25 4.11 3.44 68.84 0.12 6.56 0.35 0.65 5.67 0.89 Average 11.14 16.05 1.79 44.27 166.56 3.69 3.33 61.33 0.10 5.58 0.32 0.68 4.79 0.792002/03Sep. 11.56 20.32 2.35 44.01 185.45 4.08 3.58 72.83 0.13 6.56 0.36 0.64 5.79 0.77Oct. 11.32 20.75 2.35 43.60 168.20 3.67 3.23 75.39 0.12 6.14 0.38 0.62 5.41 0.73Nov. 11.20 23.00 2.58 43.77 163.20 3.57 3.24 75.54 0.12 6.27 0.41 0.59 5.75 0.52Dec. 11.29 22.60 2.55 43.82 163.60 3.58 3.15 78.19 0.12 6.26 0.41 0.59 5.66 0.60Jan. 11.30 21.50 2.43 43.84 167.40 3.67 3.24 83.28 0.13 6.23 0.39 0.61 5.70 0.53Feb. 11.41 21.20 2.42 43.96 176.80 3.89 3.25 69.63 0.11 6.42 0.38 0.62 5.90 0.52Mar. 11.44 21.55 2.47 43.84 175.40 3.85 3.24 58.86 0.10 6.41 0.38 0.62 5.80 0.61Apr. 11.40 22.40 2.55 43.94 182.10 4.00 3.23 53.23 0.09 6.64 0.38 0.62 6.11 0.53May 11.43 23.20 2.65 43.81 195.40 4.28 3.28 52.93 0.09 7.02 0.38 0.62 6.40 0.62June 11.46 22.90 2.62 44.11 191.90 4.23 3.24 54.00 0.09 6.94 0.38 0.62 6.35 0.59July 11.47 21.80 2.50 44.11 187.30 4.13 3.30 57.07 0.09 6.73 0.37 0.63 6.01 0.72Aug. 11.51 20.40 2.35 44.12 189.70 4.18 3.31 61.08 0.10 6.63 0.35 0.65 5.89 0.74 Average 11.39 21.80 2.48 43.90 178.87 3.93 3.27 66.00 0.11 6.52 0.38 0.62 5.90 0.62 1/ Crude, tanks, f.o.b. central Illinois. 2/ 44 percent (solvent), Decatur, based on Sept.- Aug. year. Beginning 2001/02, 48 percent solvent.
2/ 44 percent (solvent), Decatur, based on Sept.- Aug. year. Beginning 2001/02, 48 percent solvent.
3/ Central Illinois, bulk.
Source: Bureau of the Census and Agricultural Marketing Service.

36 l Oil Crop Situation and Outlook Yearbook / OCS-2003 / October 2003 Economic Research Service/USDA
Table 11--Peanuts: Acreage planted, harvested, yield, production, and value, U.S., 1980 to dateGovernment Support
Year Planted 1/ Harvested 2/ Yield per acre Production Value 3/ Quota Loan rate 4/ add'l----------1,000 acres--------- Pounds Million pounds $ million -----------Cents/lb.-----------
1980 1,521.4 1,399.8 1,645 2,302.8 579 22.8 12.51981 1,514.0 1,488.7 2,675 3,981.9 1,070 22.8 12.51982 1,311.4 1,277.4 2,693 3,440.3 863 27.5 10.01983 1,411.0 1,373.5 2,399 3,295.5 815 27.5 9.31984 1,558.6 1,528.0 2,883 4,405.9 1,231 27.5 9.31985 1,490.4 1,467.4 2,810 4,122.8 1,003 28.0 7.41986 1,564.7 1,535.2 2,408 3,697.1 1,073 30.4 7.51987 1,567.4 1,547.4 2,337 3,616.0 1,022 30.4 7.51988 1,657.4 1,628.4 2,445 3,980.9 1,115 30.8 7.51989 1,665.2 1,644.7 2,426 3,990.0 1,117 30.8 7.51990 1,846.0 1,815.5 1,985 3,603.7 1,257 31.6 7.51991 2,039.2 2,015.7 2,444 4,926.6 1,394 32.1 7.51992 1,686.6 1,669.1 2,567 4,284.4 1,285 33.8 6.61993 1,733.5 1,689.8 2,008 3,392.4 1,031 33.8 6.61994 1,641.0 1,618.5 2,624 4,247.5 1,228 33.9 6.61995 1,537.5 1,517.0 2,282 3,461.5 1,014 33.9 6.61996 1,401.5 1,380.0 2,653 3,661.2 1,029 30.5 6.61997 1,434.0 1,413.8 2,503 3,539.4 1,002 30.5 6.61998 1,521.0 1,467.0 2,702 3,963.4 1,126 30.5 6.61999 1,534.5 1,436.0 2,667 3,829.5 973 30.5 6.62000 1,536.8 1,336.0 2,444 3,265.5 895 30.5 6.62001 1,541.2 1,411.9 3,029 4,276.7 1,001 30.5 6.62002 1,358.0 1,296.7 2,561 3,320.5 606 N.A. 17.8 N.A.2003 5/ 1,315.0 1,277.0 3,095 3,951.9 701 N.A. 17.8 N.A. N.A.= Not applicable. 1/ Area planted for all peanuts. 2/ Area harvested peanuts for nuts. 3/ Crop value is peanuts for nuts. Prior to 2002,
includes both quota and nonquota peanuts. 4/ Loan rate established by the 2002 Farm Act. 5/ Forecast.
Source: National Agricultural Statistics Service, USDA
Table 12--Peanuts (farmers' stock basis): Supply, disappearance, and price, U.S., 1980/81 to dateSupply Disappearance Price
Year Begin- Seed, loss, Averagebeginning ning Production Imports Total Crush Exports Food shrinkage, Total receivedAugust 1 stocks and by
residual 1/ farmers---------------------------------------- Million pounds ---------------------------------------- Cents/lb.
1980/81 628 2,303 401 3,332 446 503 1,465 505 2,919 25.11981/82 413 3,982 1 4,396 573 576 1,696 795 3,639 26.91982/83 757 3,440 2 4,199 342 681 1,849 463 3,335 25.11983/84 864 3,296 2 4,162 387 744 1,856 564 3,551 24.71984/85 611 4,406 2 5,019 625 860 1,911 199 3,595 27.91985/86 1,424 4,123 2 5,549 812 1,043 2,023 826 4,704 24.31986/87 845 3,697 2 4,544 514 663 2,073 291 3,541 29.21987/88 1,003 3,616 2 4,621 560 618 2,071 539 3,788 28.01988/89 833 3,981 3 4,817 814 688 2,254 217 3,974 27.91989/90 843 3,990 4 4,837 624 989 2,312 211 4,136 28.01990/91 701 3,604 27 4,332 689 652 2,020 288 3,649 34.71991/92 683 4,927 5 5,615 1,103 1,002 2,207 254 4,560 28.31992/93 1,055 4,284 2 5,341 891 951 2,122 27 3,991 30.01993/94 1,350 3,392 2 4,744 670 533 2,088 372 3,683 30.41994/95 1,061 4,247 74 5,382 982 878 2,009 315 4,184 28.91995/96 1,198 3,461 153 4,812 999 826 1,993 238 4,054 29.31996/97 758 3,661 127 4,545 692 668 2,029 363 3,750 28.11997/98 795 3,539 141 4,475 544 682 2,099 303 3,627 28.31998/99 848 3,963 155 4,967 460 562 2,153 374 3,575 28.41999/2000 1,392 3,829 180 5,401 713 743 2,233 479 4,168 25.42000/01 1,233 3,266 216 4,715 548 527 2,179 364 3,618 27.42001/02 1,097 4,277 203 5,576 693 713 2,211 483 4,100 23.42002/03 1,476 3,320 75 4,872 857 490 2,228 422 3,997 18.22003/04 2/ 875 3,952 65 4,892 656 500 2,283 378 3,817 16.25-19.25
1/ Estimates for farm use and local sales are not available, so these are now included in residual use. 2/ Forecast.
Sources: National Agricultural Statistics Service, USDA and the Department of Commerce.
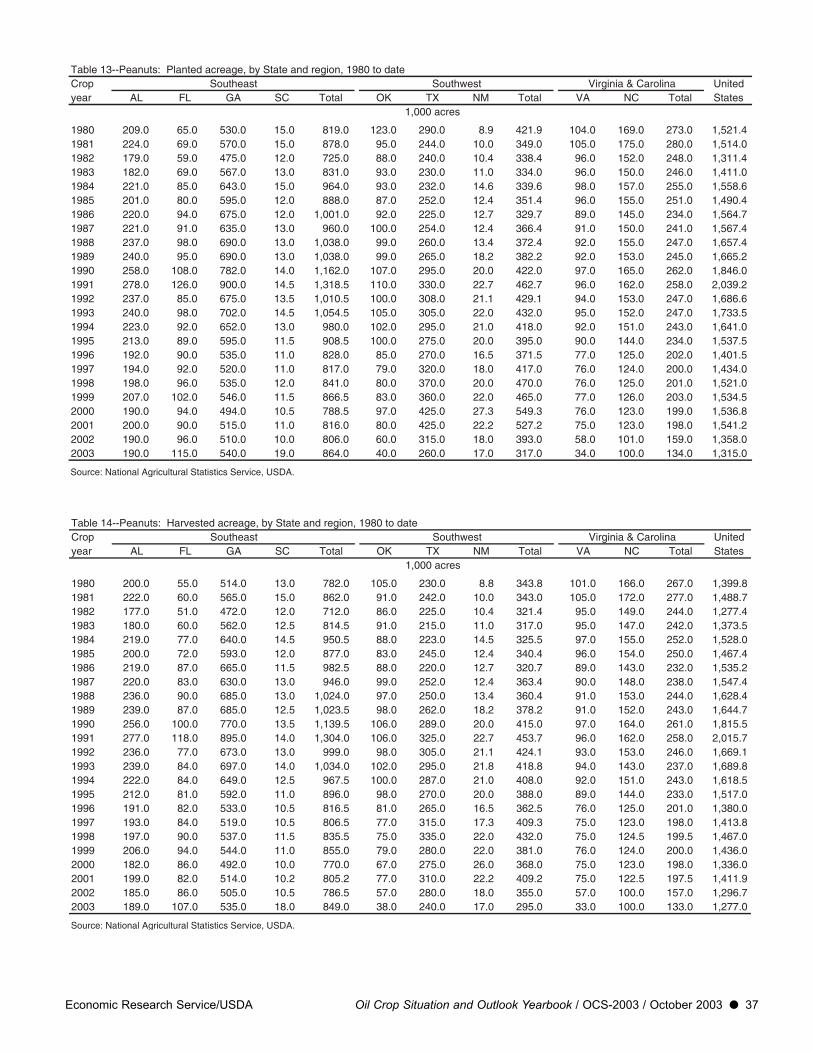
Economic Research Service/USDA Oil Crop Situation and Outlook Yearbook / OCS-2003 / October 2003 l 37
Table 13--Peanuts: Planted acreage, by State and region, 1980 to date Crop Southeast Southwest Virginia & Carolina Unitedyear AL FL GA SC Total OK TX NM Total VA NC Total States 1,000 acres
1980 209.0 65.0 530.0 15.0 819.0 123.0 290.0 8.9 421.9 104.0 169.0 273.0 1,521.41981 224.0 69.0 570.0 15.0 878.0 95.0 244.0 10.0 349.0 105.0 175.0 280.0 1,514.01982 179.0 59.0 475.0 12.0 725.0 88.0 240.0 10.4 338.4 96.0 152.0 248.0 1,311.41983 182.0 69.0 567.0 13.0 831.0 93.0 230.0 11.0 334.0 96.0 150.0 246.0 1,411.01984 221.0 85.0 643.0 15.0 964.0 93.0 232.0 14.6 339.6 98.0 157.0 255.0 1,558.61985 201.0 80.0 595.0 12.0 888.0 87.0 252.0 12.4 351.4 96.0 155.0 251.0 1,490.41986 220.0 94.0 675.0 12.0 1,001.0 92.0 225.0 12.7 329.7 89.0 145.0 234.0 1,564.71987 221.0 91.0 635.0 13.0 960.0 100.0 254.0 12.4 366.4 91.0 150.0 241.0 1,567.41988 237.0 98.0 690.0 13.0 1,038.0 99.0 260.0 13.4 372.4 92.0 155.0 247.0 1,657.41989 240.0 95.0 690.0 13.0 1,038.0 99.0 265.0 18.2 382.2 92.0 153.0 245.0 1,665.21990 258.0 108.0 782.0 14.0 1,162.0 107.0 295.0 20.0 422.0 97.0 165.0 262.0 1,846.01991 278.0 126.0 900.0 14.5 1,318.5 110.0 330.0 22.7 462.7 96.0 162.0 258.0 2,039.21992 237.0 85.0 675.0 13.5 1,010.5 100.0 308.0 21.1 429.1 94.0 153.0 247.0 1,686.61993 240.0 98.0 702.0 14.5 1,054.5 105.0 305.0 22.0 432.0 95.0 152.0 247.0 1,733.51994 223.0 92.0 652.0 13.0 980.0 102.0 295.0 21.0 418.0 92.0 151.0 243.0 1,641.01995 213.0 89.0 595.0 11.5 908.5 100.0 275.0 20.0 395.0 90.0 144.0 234.0 1,537.51996 192.0 90.0 535.0 11.0 828.0 85.0 270.0 16.5 371.5 77.0 125.0 202.0 1,401.51997 194.0 92.0 520.0 11.0 817.0 79.0 320.0 18.0 417.0 76.0 124.0 200.0 1,434.01998 198.0 96.0 535.0 12.0 841.0 80.0 370.0 20.0 470.0 76.0 125.0 201.0 1,521.01999 207.0 102.0 546.0 11.5 866.5 83.0 360.0 22.0 465.0 77.0 126.0 203.0 1,534.52000 190.0 94.0 494.0 10.5 788.5 97.0 425.0 27.3 549.3 76.0 123.0 199.0 1,536.82001 200.0 90.0 515.0 11.0 816.0 80.0 425.0 22.2 527.2 75.0 123.0 198.0 1,541.22002 190.0 96.0 510.0 10.0 806.0 60.0 315.0 18.0 393.0 58.0 101.0 159.0 1,358.02003 190.0 115.0 540.0 19.0 864.0 40.0 260.0 17.0 317.0 34.0 100.0 134.0 1,315.0
Source: National Agricultural Statistics Service, USDA.
Table 14--Peanuts: Harvested acreage, by State and region, 1980 to date Crop Southeast Southwest Virginia & Carolina Unitedyear AL FL GA SC Total OK TX NM Total VA NC Total States 1,000 acres
1980 200.0 55.0 514.0 13.0 782.0 105.0 230.0 8.8 343.8 101.0 166.0 267.0 1,399.81981 222.0 60.0 565.0 15.0 862.0 91.0 242.0 10.0 343.0 105.0 172.0 277.0 1,488.71982 177.0 51.0 472.0 12.0 712.0 86.0 225.0 10.4 321.4 95.0 149.0 244.0 1,277.41983 180.0 60.0 562.0 12.5 814.5 91.0 215.0 11.0 317.0 95.0 147.0 242.0 1,373.51984 219.0 77.0 640.0 14.5 950.5 88.0 223.0 14.5 325.5 97.0 155.0 252.0 1,528.01985 200.0 72.0 593.0 12.0 877.0 83.0 245.0 12.4 340.4 96.0 154.0 250.0 1,467.41986 219.0 87.0 665.0 11.5 982.5 88.0 220.0 12.7 320.7 89.0 143.0 232.0 1,535.21987 220.0 83.0 630.0 13.0 946.0 99.0 252.0 12.4 363.4 90.0 148.0 238.0 1,547.41988 236.0 90.0 685.0 13.0 1,024.0 97.0 250.0 13.4 360.4 91.0 153.0 244.0 1,628.41989 239.0 87.0 685.0 12.5 1,023.5 98.0 262.0 18.2 378.2 91.0 152.0 243.0 1,644.71990 256.0 100.0 770.0 13.5 1,139.5 106.0 289.0 20.0 415.0 97.0 164.0 261.0 1,815.51991 277.0 118.0 895.0 14.0 1,304.0 106.0 325.0 22.7 453.7 96.0 162.0 258.0 2,015.71992 236.0 77.0 673.0 13.0 999.0 98.0 305.0 21.1 424.1 93.0 153.0 246.0 1,669.11993 239.0 84.0 697.0 14.0 1,034.0 102.0 295.0 21.8 418.8 94.0 143.0 237.0 1,689.81994 222.0 84.0 649.0 12.5 967.5 100.0 287.0 21.0 408.0 92.0 151.0 243.0 1,618.51995 212.0 81.0 592.0 11.0 896.0 98.0 270.0 20.0 388.0 89.0 144.0 233.0 1,517.01996 191.0 82.0 533.0 10.5 816.5 81.0 265.0 16.5 362.5 76.0 125.0 201.0 1,380.01997 193.0 84.0 519.0 10.5 806.5 77.0 315.0 17.3 409.3 75.0 123.0 198.0 1,413.81998 197.0 90.0 537.0 11.5 835.5 75.0 335.0 22.0 432.0 75.0 124.5 199.5 1,467.01999 206.0 94.0 544.0 11.0 855.0 79.0 280.0 22.0 381.0 76.0 124.0 200.0 1,436.02000 182.0 86.0 492.0 10.0 770.0 67.0 275.0 26.0 368.0 75.0 123.0 198.0 1,336.02001 199.0 82.0 514.0 10.2 805.2 77.0 310.0 22.2 409.2 75.0 122.5 197.5 1,411.92002 185.0 86.0 505.0 10.5 786.5 57.0 280.0 18.0 355.0 57.0 100.0 157.0 1,296.72003 189.0 107.0 535.0 18.0 849.0 38.0 240.0 17.0 295.0 33.0 100.0 133.0 1,277.0
Source: National Agricultural Statistics Service, USDA.

38 l Oil Crop Situation and Outlook Yearbook / OCS-2003 / October 2003 Economic Research Service/USDA
Table 15--Peanuts: U.S. production, by State and region, 1980 to date Crop Southeast Southwest Virginia & Carolina Unitedyear AL FL GA SC Total OK TX NM Total VA NC Total States 1,000 pounds (in-shell)
1980 265,000 144,480 994,590 14,300 1,418,370 140,175 293,250 22,352 455,777 136,350 291,330 427,680 2,302,7621981 602,730 178,200 1,655,450 39,000 2,475,380 189,280 393,250 24,900 607,430 330,750 555,560 886,310 3,981,8501982 522,150 153,000 1,517,480 30,000 2,222,630 174,580 325,125 25,220 524,925 275,500 417,200 692,700 3,440,2551983 454,500 166,800 1,567,980 25,000 2,214,280 176,540 362,275 25,630 564,445 198,550 318,255 516,805 3,295,5301984 648,550 246,400 2,160,000 39,150 3,094,100 189,200 371,295 32,190 592,685 269,660 449,500 719,160 4,405,9451985 590,000 216,000 1,921,320 34,200 2,761,520 170,980 422,625 31,992 625,597 283,680 451,990 735,670 4,122,7871986 494,940 233,160 1,632,575 25,530 2,386,205 180,840 385,000 28,700 594,540 275,900 440,440 716,340 3,697,0851987 465,300 215,800 1,575,000 31,200 2,287,300 222,750 441,000 29,760 693,510 243,000 392,200 635,200 3,616,0101988 561,680 228,600 1,801,550 32,110 2,623,940 225,040 417,500 30,552 673,092 263,900 419,985 683,885 3,980,9171989 537,750 214,890 1,849,500 32,500 2,634,640 210,700 484,700 43,680 739,080 246,155 370,120 616,275 3,989,9951990 386,560 234,000 1,347,500 30,105 1,998,165 235,320 534,650 50,000 819,970 309,915 475,600 785,515 3,603,6501991 638,485 279,660 2,228,550 33,600 3,180,295 243,800 682,500 51,075 977,375 307,200 461,700 768,900 4,926,5701992 591,180 202,510 1,820,465 32,500 2,646,655 236,180 680,150 58,236 974,566 256,215 406,980 663,195 4,284,4161993 473,220 194,880 1,383,545 24,500 2,076,145 233,580 550,175 56,680 840,435 176,250 299,585 475,835 3,392,4151994 446,220 207,480 1,862,630 36,250 2,552,580 261,000 605,570 51,660 918,230 291,180 485,465 776,645 4,247,4551995 483,360 193,590 1,414,880 30,800 2,122,630 201,880 540,000 43,000 784,880 206,925 347,040 553,965 3,461,4751996 449,805 236,160 1,433,770 32,550 2,152,285 195,210 689,000 37,950 922,160 219,260 367,500 586,760 3,661,2051997 372,490 228,060 1,333,830 30,450 1,964,830 184,800 822,150 46,710 1,053,660 191,250 329,640 520,890 3,539,3801998 432,415 233,100 1,511,655 28,175 2,205,345 159,750 917,900 62,040 1,139,690 221,250 397,155 618,405 3,963,4401999 448,050 260,380 1,400,800 25,300 2,134,530 189,600 926,800 61,600 1,178,000 218,120 298,840 516,960 3,829,4902000 271,180 213,710 1,328,400 29,500 1,842,790 120,600 698,500 54,990 874,090 210,375 338,250 548,625 3,265,5052001 532,325 250,100 1,711,620 30,600 2,524,645 197,890 895,900 67,044 1,160,834 234,750 356,475 591,225 4,276,7042002 379,250 197,800 1,313,000 19,140 1,909,190 159,600 868,000 54,000 1,081,600 119,700 210,000 329,700 3,320,4902003 548,100 310,300 1,712,000 57,600 2,628,000 110,200 792,000 49,300 951,500 92,400 280,000 372,400 3,951,900
Source: National Agricultural Statistics Service, USDA.
Table 16--Peanuts: Yield per harvested acre, by State and region, 1980 to date Crop Southeast Southwest Virginia & Carolina Unitedyear AL FL GA SC Total OK TX NM Total VA NC Total States Pounds
1980 1,325 2,600 1,935 1,100 1,812 1,335 1,275 2,540 1,326 1,350 1,755 1,602 1,6451981 2,715 2,970 2,930 2,600 2,872 2,080 1,625 2,490 1,771 3,150 3,230 3,200 2,6751982 2,950 3,000 3,215 2,500 3,122 2,030 1,445 2,425 1,633 2,900 2,800 2,839 2,6931983 2,525 2,780 2,790 2,000 2,719 1,940 1,685 2,330 1,781 2,090 2,165 2,136 2,3991984 2,961 3,200 3,375 2,700 3,255 2,150 1,665 2,220 1,821 2,780 2,900 2,854 2,8831985 2,950 3,000 3,240 2,850 3,149 2,060 1,725 2,580 1,838 2,955 2,935 2,943 2,8101986 2,260 2,680 2,455 2,220 2,429 2,055 1,750 2,260 1,854 3,100 3,080 3,088 2,4081987 2,115 2,600 2,500 2,400 2,418 2,250 1,750 2,400 1,908 2,700 2,650 2,669 2,3371988 2,380 2,540 2,630 2,470 2,562 2,320 1,670 2,280 1,868 2,900 2,745 2,803 2,4451989 2,250 2,470 2,700 2,600 2,574 2,150 1,850 2,400 1,954 2,705 2,435 2,536 2,4261990 1,510 2,340 1,750 2,230 1,754 2,220 1,850 2,500 1,976 3,195 2,900 3,010 1,9851991 2,305 2,370 2,490 2,400 2,439 2,300 2,100 2,250 2,154 3,200 2,850 2,980 2,4441992 2,505 2,630 2,705 2,500 2,641 2,410 2,230 2,747 2,297 2,755 2,660 2,696 2,5671993 1,980 2,320 1,985 1,750 2,008 2,290 1,865 2,600 2,007 1,875 2,095 2,008 2,0081994 2,010 2,470 2,870 2,900 2,638 2,610 2,110 2,460 2,251 3,165 3,215 3,196 2,6241995 2,280 2,390 2,390 2,800 2,369 2,060 2,000 2,150 2,023 2,325 2,410 2,378 2,2821996 2,355 2,880 2,690 3,100 2,636 2,410 2,600 2,300 2,544 2,885 2,940 2,919 2,6531997 1,930 2,715 2,570 2,900 2,436 2,400 2,610 2,700 2,574 2,550 2,680 2,631 2,5031998 2,195 2,590 2,815 2,450 2,640 2,130 2,740 2,820 2,638 2,950 3,190 3,100 2,7021999 2,175 2,770 2,575 2,300 2,497 2,400 3,310 2,800 3,092 2,870 2,410 2,585 2,6672000 1,490 2,485 2,700 2,950 2,393 1,800 2,540 2,115 2,375 2,805 2,750 2,771 2,4442001 2,675 3,050 3,330 3,000 3,135 2,570 2,890 3,020 2,837 3,130 2,910 2,994 3,0292002 2,050 2,300 2,600 1,823 2,427 2,800 3,100 3,000 3,047 2,100 2,100 2,100 2,5612003 2,900 2,900 3,200 3,200 3,095 2,900 3,300 2,900 3,225 2,800 2,800 2,800 3,095
Source: National Agricultural Statistics Service, USDA.

Economic Research Service/USDA Oil Crop Situation and Outlook Yearbook / OCS-2003 / October 2003 l 39
Table 17--Cottonseed: Acreage planted, harvested, yield, production, and value, U.S., 1980 to date Year Planted Harvested Yield Production Value
-----------1,000 acres-------- Pounds/acre 1,000 short tons $1,000
1980 14,534 13,215 677 4,471 574,5111981 14,330 13,841 924 6,397 549,0411982 11,345 9,734 975 4,744 366,2401983 7,926 7,348 837 3,076 511,4501984 11,145 10,379 992 5,149 511,9531985 10,685 10,229 1,032 5,279 348,3421986 10,045 8,468 898 3,801 303,9651987 10,397 10,030 1,150 5,769 474,7031988 12,515 11,948 1,015 6,062 718,2551989 10,587 9,538 981 4,677 492,6831990 12,348 11,732 1,018 5,969 722,3131991 14,052 12,960 1,069 6,926 492,2611992 13,240 11,123 1,120 6,230 608,4381993 13,438 12,783 992 6,343 714,3891994 13,720 13,322 1,142 7,604 771,3151995 16,931 16,007 856 6,849 731,0051996 14,653 12,888 1,109 7,144 914,5641997 13,898 13,406 1,035 6,935 835,3711998 13,393 10,684 1,004 5,365 687,1791999 14,874 13,425 947 6,354 565,4622000 15,517 13,053 986 6,436 675,7382001 15,769 13,828 1,078 7,452 689,3292002 13,958 12,427 995 6,184 618,3902003 1/ 13,631 12,107 1,065 6,446 657,492
1/ Forecast.
Source: National Agricultural Statistics Service, USDA.
Table 18--Cottonseed: Supply, disappearance, and price, U.S., 1980/81 to date Year Supply Disappearance Pricebeginning Beginning Production Imports Total Crush Exports Other Total Ending AverageAugust 1 stocks stocks received
by farmers--------1,000 short tons-------- $/short ton
1980 1,058 4,471 0 5,529 4,076 133 923 5,132 398 129.001981 398 6,397 0 6,795 4,585 45 1,384 6,013 781 86.001982 781 4,744 0 5,525 3,800 12 1,343 5,155 371 77.001983 371 3,076 0 3,447 2,583 50 698 3,331 116 166.001984 116 5,149 0 5,265 3,514 60 1,285 4,859 406 100.001985 406 5,279 0 5,685 3,417 9 1,913 5,338 347 66.001986 347 3,801 0 4,148 2,520 17 1,422 3,959 189 80.001987 189 5,769 0 5,958 3,396 50 2,153 5,599 359 83.001988 359 6,062 0 6,421 3,730 39 1,987 5,756 665 118.001989 665 4,677 0 5,342 2,974 46 1,956 4,976 366 105.001990 366 5,969 3 6,338 3,369 53 2,265 5,687 651 121.001991 651 6,926 2 7,579 3,981 161 2,977 7,119 460 71.001992 460 6,230 0 6,690 3,629 192 2,504 6,325 365 97.501993 365 6,343 0 6,709 3,470 157 2,649 6,276 432 113.001994 432 7,604 0 8,036 3,947 232 3,308 7,488 549 101.001995 549 6,849 2 7,399 3,882 114 2,908 6,904 495 106.001996 495 7,144 20 7,659 3,860 116 3,160 7,136 523 126.001997 523 6,935 96 7,553 3,889 149 2,952 6,990 563 121.001998 563 5,365 207 6,135 2,719 68 2,955 5,742 393 129.001999 393 6,354 308 7,055 3,064 198 3,519 6,781 274 89.002000 274 6,436 374 7,084 2,753 235 3,669 6,657 427 105.002001 427 7,452 327 8,206 2,791 274 4,742 7,807 400 92.502002 1/ 400 6,184 104 6,687 2,495 371 3,476 6,341 347 100.002003 2/ 347 6,446 225 7,018 2,750 300 3,638 6,688 330 87-117
1/ Estimated. 2/ Forecast.
Sources: National Agricultural Statistics Service, USDA and the Bureau of the Census.

40 l Oil Crop Situation and Outlook Yearbook / OCS-2003 / October 2003 Economic Research Service/USDA
Table 19--Cottonseed meal: Supply, disappearance, and price, U.S., 1980/81 to date Year Supply Disappearance Pricebeginning Beginning Production Imports Total Domestic Exports Total Ending Average,October 1 stocks stocks Memphis
(solvent)---------1,000 short tons--------- $/short ton
1980 53 1,786 0 1,838 1,631 99 1,730 108 197.061981 108 2,190 0 2,298 2,037 107 2,144 154 156.151982 154 1,588 0 1,742 1,648 1 1,649 93 176.551983 93 1,134 0 1,227 1,126 1 1,127 100 190.201984 100 1,732 0 1,832 1,758 6 1,763 68 99.401985 68 1,526 0 1,595 1,521 5 1,526 69 134.301986 69 1,112 0 1,180 1,131 18 1,149 32 148.551987 32 1,647 0 1,679 1,590 45 1,635 44 178.501988 44 1,689 3 1,736 1,634 22 1,655 81 185.001989 81 1,327 22 1,430 1,366 16 1,383 48 163.301990 48 1,696 7 1,751 1,625 32 1,657 94 130.751991 94 1,765 2 1,861 1,746 72 1,818 43 140.501992 43 1,533 0 1,576 1,418 128 1,546 29 161.781993 29 1,563 0 1,592 1,419 120 1,539 53 164.301994 53 1,830 0 1,883 1,748 88 1,836 47 112.021995 47 1,748 0 1,795 1,633 111 1,744 51 190.741996 51 1,752 4 1,807 1,649 132 1,781 26 192.001997 26 1,769 0 1,795 1,598 109 1,707 88 145.001998 88 1,232 27 1,346 1,201 121 1,322 24 110.001999 24 1,390 0 1,414 1,294 105 1,393 21 127.332000 21 1,338 0 1,359 1,165 154 1,319 40 143.352001 40 1,294 0 1,334 1,160 111 1,271 62 136.162002 1/ 62 1,114 0 1,176 1,083 60 1,143 33 146.122003 2/ 33 1,240 0 1,273 1,153 85 1,238 35 150-170
1/ Estimated. 2/ Forecast.
Sources: The Bureau of the Census and Agricultural Marketing Service, USDA.
Table 20--Cottonseed oil: Supply, disappearance, and price, U.S., 1980/81 to date Year Supply Disappearance Price 1/beginning Beginning Production Imports Total Domestic Exports Total Ending Average,October 1 stocks stocks Valley
Points---------Million pounds--------- Cents/lb.
1980 122 1,191 0 1,313 523 710 1,233 80 25.861981 80 1,551 0 1,631 680 848 1,528 104 20.101982 104 1,133 2 1,239 604 546 1,149 90 21.801983 90 777 18 884 532 303 834 50 32.801984 50 1,174 0 1,224 685 432 1,117 107 29.201985 107 1,070 0 1,177 658 433 1,092 85 16.911986 85 781 11 877 572 214 787 90 17.671987 90 1,204 26 1,320 751 409 1,159 160 21.671988 160 1,242 0 1,403 849 407 1,256 147 19.711989 147 1,040 13 1,199 783 336 1,119 80 23.301990 80 1,154 3 1,238 866 235 1,101 137 22.301991 137 1,280 18 1,434 1,088 269 1,357 78 20.101992 78 1,126 38 1,241 975 184 1,160 81 30.071993 81 1,119 26 1,226 873 248 1,121 106 30.301994 106 1,312 0 1,417 1,007 329 1,335 82 29.231995 82 1,229 0 1,311 996 221 1,217 94 26.531996 94 1,216 0 1,310 1,012 232 1,244 66 25.581997 66 1,224 0 1,291 1,004 208 1,212 79 28.841998 79 832 48 958 772 111 882 76 27.321999 76 939 8 1,023 833 141 974 49 21.562000 49 847 0 896 672 131 803 93 15.982001 93 876 0 969 780 150 930 39 17.982002 2/ 39 725 22 786 636 110 746 40 37.752003 3/ 40 865 0 905 750 115 865 40 27.5-30.5
1/ PBSY, basis Greenwood, MS, beginning 1992. 2/ Estimated. 3/ Forecast.
Sources: The Bureau of the Census and Agricultural Marketing Service, USDA.

Economic Research Service/USDA Oil Crop Situation and Outlook Yearbook / OCS-2003 / October 2003 l 41
Table 21--Cottonseed: Supply and disappearance, by month, U.S., 1999/2000 to dateSupply Disappearance Ending
Year Beginning stocks Imports Crush Exports stocks1,000 short tons
1999/2000 August 393.2 75.7 166.8 9.5 340.3 September 340.3 23.2 230.7 3.5 563.4 October 563.4 0.7 281.6 25.7 1,247.0 November 1,247.0 0.0 302.5 17.1 1,686.1 December 1,686.1 0.0 296.4 20.1 1,754.5 January 1,754.5 0.0 300.2 15.7 1,574.2 February 1,574.2 0.0 299.4 11.3 1,367.7 March 1,367.7 0.0 297.7 23.9 1,098.6 April 1,098.6 27.4 263.5 27.2 864.6 May 864.6 23.5 250.3 15.5 611.0 June 611.0 50.0 221.3 12.4 370.5 July 370.5 108.0 153.5 16.4 274.4 Total 308.5 3,063.9 198.2
2000/01 August 274.4 69.3 170.8 33.0 220.2 September 220.2 65.7 141.1 13.8 535.6 October 535.6 24.0 265.9 14.0 1,317.0 November 1,317.0 0.0 252.3 16.2 1,754.1 December 1,754.1 0.0 241.5 15.7 1,957.2 January 1,957.2 0.0 295.2 16.6 1,811.2 February 1,811.2 0.0 268.7 17.5 1,591.0 March 1,591.0 0.0 261.9 18.9 1,323.9 April 1,323.9 0.0 186.0 21.9 1,167.4 May 1,167.4 69.6 228.3 21.9 902.1 June 902.1 41.8 241.9 34.7 649.5 July 649.5 103.3 199.2 10.7 427.1 Total 373.7 2,752.8 234.8
2001/02 August 427.1 119.8 186.8 23.7 356.1 September 356.1 19.3 147.6 14.7 360.5 October 360.5 0.0 267.5 28.8 1,116.4 November 1,116.4 0.0 287.0 33.0 1,821.5 December 1,821.5 0.0 273.1 28.1 1,953.5 January 1,953.5 0.0 281.3 22.3 1,806.9 February 1,806.9 0.0 253.2 22.8 1,574.5 March 1,574.5 23.8 251.8 19.5 1,315.2 April 1,315.2 0.1 243.0 18.0 1,086.7 May 1,086.7 50.9 233.3 14.2 820.2 June 820.2 30.9 200.3 25.4 548.5 July 548.5 82.2 166.3 23.0 399.6 Total 327.0 2,791.2 273.6
2002/03 August 399.6 53.6 195.1 39.0 294.1 September 294.1 24.4 131.4 29.0 330.0 October 330.0 25.8 207.8 40.8 881.7 November 881.7 0.1 242.5 36.1 1,341.5 December 1,341.5 0.0 236.6 42.7 1,540.0 January 1,540.0 0.0 274.5 28.8 1,471.6 February 1,471.6 0.0 224.5 23.2 1,311.4 March 1,311.4 0.0 230.4 41.5 1,093.2 April 1,093.2 0.0 241.5 24.8 862.6 May 862.6 0.0 203.6 23.4 665.9 June 665.9 0.0 179.4 21.6 448.8 July 448.8 0.0 127.4 19.5 346.6 Total 103.9 2,494.7 370.6
Source: Bureau of the Census.
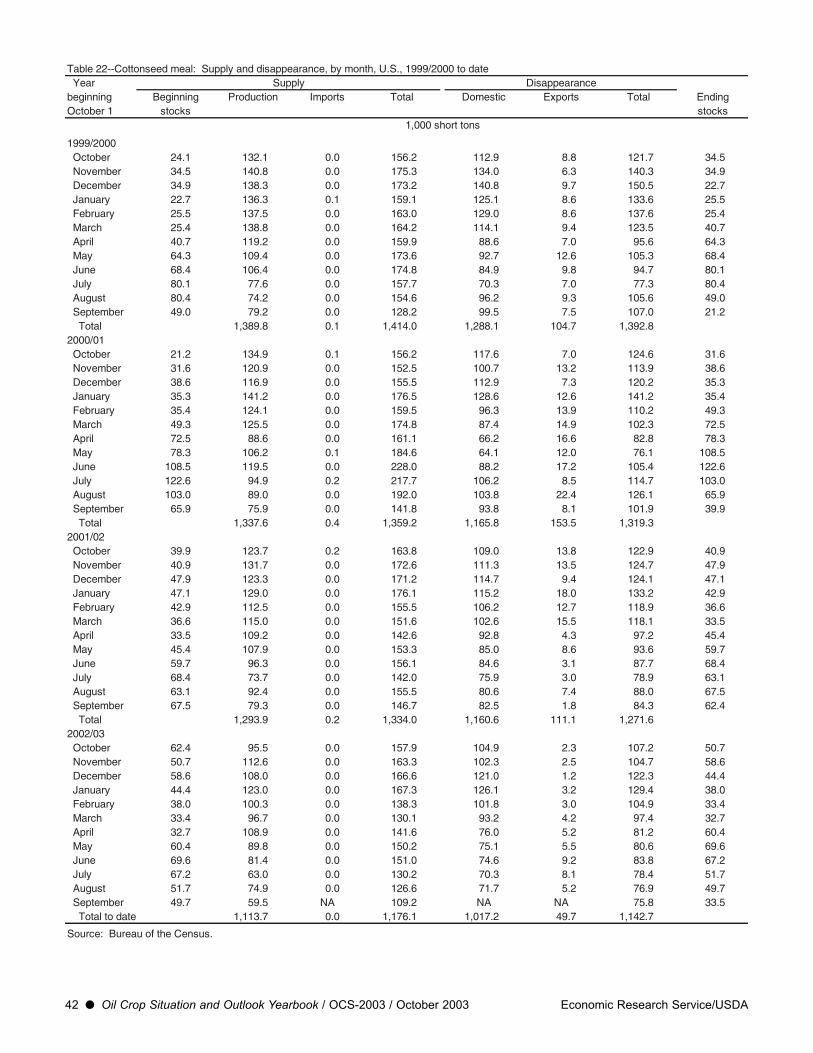
42 l Oil Crop Situation and Outlook Yearbook / OCS-2003 / October 2003 Economic Research Service/USDA
Table 22--Cottonseed meal: Supply and disappearance, by month, U.S., 1999/2000 to date Year Supply Disappearancebeginning Beginning Production Imports Total Domestic Exports Total EndingOctober 1 stocks stocks
1,000 short tons
1999/2000 October 24.1 132.1 0.0 156.2 112.9 8.8 121.7 34.5 November 34.5 140.8 0.0 175.3 134.0 6.3 140.3 34.9 December 34.9 138.3 0.0 173.2 140.8 9.7 150.5 22.7 January 22.7 136.3 0.1 159.1 125.1 8.6 133.6 25.5 February 25.5 137.5 0.0 163.0 129.0 8.6 137.6 25.4 March 25.4 138.8 0.0 164.2 114.1 9.4 123.5 40.7 April 40.7 119.2 0.0 159.9 88.6 7.0 95.6 64.3 May 64.3 109.4 0.0 173.6 92.7 12.6 105.3 68.4 June 68.4 106.4 0.0 174.8 84.9 9.8 94.7 80.1 July 80.1 77.6 0.0 157.7 70.3 7.0 77.3 80.4 August 80.4 74.2 0.0 154.6 96.2 9.3 105.6 49.0 September 49.0 79.2 0.0 128.2 99.5 7.5 107.0 21.2 Total 1,389.8 0.1 1,414.0 1,288.1 104.7 1,392.82000/01 October 21.2 134.9 0.1 156.2 117.6 7.0 124.6 31.6 November 31.6 120.9 0.0 152.5 100.7 13.2 113.9 38.6 December 38.6 116.9 0.0 155.5 112.9 7.3 120.2 35.3 January 35.3 141.2 0.0 176.5 128.6 12.6 141.2 35.4 February 35.4 124.1 0.0 159.5 96.3 13.9 110.2 49.3 March 49.3 125.5 0.0 174.8 87.4 14.9 102.3 72.5 April 72.5 88.6 0.0 161.1 66.2 16.6 82.8 78.3 May 78.3 106.2 0.1 184.6 64.1 12.0 76.1 108.5 June 108.5 119.5 0.0 228.0 88.2 17.2 105.4 122.6 July 122.6 94.9 0.2 217.7 106.2 8.5 114.7 103.0 August 103.0 89.0 0.0 192.0 103.8 22.4 126.1 65.9 September 65.9 75.9 0.0 141.8 93.8 8.1 101.9 39.9 Total 1,337.6 0.4 1,359.2 1,165.8 153.5 1,319.32001/02 October 39.9 123.7 0.2 163.8 109.0 13.8 122.9 40.9 November 40.9 131.7 0.0 172.6 111.3 13.5 124.7 47.9 December 47.9 123.3 0.0 171.2 114.7 9.4 124.1 47.1 January 47.1 129.0 0.0 176.1 115.2 18.0 133.2 42.9 February 42.9 112.5 0.0 155.5 106.2 12.7 118.9 36.6 March 36.6 115.0 0.0 151.6 102.6 15.5 118.1 33.5 April 33.5 109.2 0.0 142.6 92.8 4.3 97.2 45.4 May 45.4 107.9 0.0 153.3 85.0 8.6 93.6 59.7 June 59.7 96.3 0.0 156.1 84.6 3.1 87.7 68.4 July 68.4 73.7 0.0 142.0 75.9 3.0 78.9 63.1 August 63.1 92.4 0.0 155.5 80.6 7.4 88.0 67.5 September 67.5 79.3 0.0 146.7 82.5 1.8 84.3 62.4 Total 1,293.9 0.2 1,334.0 1,160.6 111.1 1,271.62002/03 October 62.4 95.5 0.0 157.9 104.9 2.3 107.2 50.7 November 50.7 112.6 0.0 163.3 102.3 2.5 104.7 58.6 December 58.6 108.0 0.0 166.6 121.0 1.2 122.3 44.4 January 44.4 123.0 0.0 167.3 126.1 3.2 129.4 38.0 February 38.0 100.3 0.0 138.3 101.8 3.0 104.9 33.4 March 33.4 96.7 0.0 130.1 93.2 4.2 97.4 32.7 April 32.7 108.9 0.0 141.6 76.0 5.2 81.2 60.4 May 60.4 89.8 0.0 150.2 75.1 5.5 80.6 69.6 June 69.6 81.4 0.0 151.0 74.6 9.2 83.8 67.2 July 67.2 63.0 0.0 130.2 70.3 8.1 78.4 51.7 August 51.7 74.9 0.0 126.6 71.7 5.2 76.9 49.7 September 49.7 59.5 NA 109.2 NA NA 75.8 33.5 Total to date 1,113.7 0.0 1,176.1 1,017.2 49.7 1,142.7
Source: Bureau of the Census.

Economic Research Service/USDA Oil Crop Situation and Outlook Yearbook / OCS-2003 / October 2003 l 43
Table 23--Cottonseed oil: Supply and disappearance, by month, U.S., 1999/2000 to date Year Supply Disappearancebeginning Beginning Production, Imports Total Domestic Exports Total EndingOctober 1 stocks crude stocks
1,000 pounds
1999/00 October 76,001 88,266 0 164,267 72,150 11,060 83,210 81,057 November 81,057 95,406 62 176,525 75,513 12,313 87,825 88,700 December 88,700 94,196 0 182,896 72,715 23,025 95,740 87,156 January 87,156 94,100 0 181,256 86,997 10,628 97,624 83,632 February 83,632 93,100 657 177,389 89,732 9,447 99,179 78,210 March 78,210 92,700 0 170,910 47,508 13,181 60,689 110,221 April 110,221 82,000 3 192,224 61,318 8,214 69,531 122,693 May 122,693 75,800 2,205 200,698 69,332 7,446 76,779 123,919 June 123,919 68,400 5,071 197,390 88,929 7,550 96,479 100,911 July 100,911 48,000 68 148,979 58,435 11,546 69,982 78,997 August 78,997 55,225 0 134,222 63,670 10,604 74,274 59,948 September 59,948 52,000 0 111,948 46,488 16,467 62,955 48,993 Total 939,193 8,066 1,023,260 832,786 141,481 974,2672000/01 October 48,993 84,800 0 133,793 54,018 13,300 67,318 66,475 November 66,475 76,500 0 142,975 56,167 11,653 67,820 75,155 December 75,155 73,300 0 148,455 46,436 9,089 55,525 92,930 January 92,930 89,100 72 182,102 61,117 14,684 75,802 106,300 February 106,300 81,600 193 188,093 53,455 6,638 60,093 128,000 March 128,000 79,600 4 207,604 67,868 7,237 75,104 132,500 April 132,500 57,100 0 189,600 53,923 10,595 64,518 125,082 May 125,082 70,000 0 195,082 67,551 12,722 80,273 114,809 June 114,809 69,800 0 184,609 50,168 7,525 57,693 126,916 July 126,916 58,900 0 185,816 61,436 10,325 71,761 114,055 August 114,055 60,700 0 174,755 56,161 20,809 76,970 97,785 September 97,785 45,400 0 143,185 43,728 6,439 50,167 93,018 Total 846,800 270 896,063 672,028 131,016 803,0452001/02 October 93,018 82,600 0 175,618 41,265 19,892 61,157 114,461 November 114,461 89,400 0 203,861 85,171 5,662 90,833 113,028 December 113,028 84,900 121 198,049 68,360 19,832 88,192 109,857 January 109,857 87,491 0 197,348 59,562 12,905 72,467 124,881 February 124,881 78,280 0 203,161 65,304 17,550 82,854 120,307 March 120,307 78,217 0 198,524 79,462 12,137 91,599 106,925 April 106,925 74,561 0 181,486 62,876 8,319 71,195 110,291 May 110,291 74,524 7 184,822 66,149 21,013 87,162 97,660 June 97,660 61,764 0 159,424 67,323 9,444 76,767 82,657 July 82,657 50,559 0 133,216 65,103 7,863 72,966 60,250 August 60,250 60,245 0 120,495 65,651 8,727 74,378 46,117 September 46,117 53,690 0 99,807 53,484 6,831 60,315 39,492 Total 876,231 127 969,376 779,710 150,175 929,8842002/03 October 39,492 62,813 0 102,305 57,584 12,698 70,282 32,023 November 32,023 71,700 100 103,823 52,527 11,105 63,632 40,191 December 40,191 67,926 0 108,117 59,691 10,761 70,452 37,665 January 37,665 80,836 7 118,508 65,403 7,012 72,415 46,093 February 46,093 65,553 95 111,741 44,478 8,483 52,961 58,780 March 58,780 66,678 14,492 139,950 57,323 10,413 67,736 72,214 April 72,214 71,015 0 143,229 51,632 8,262 59,894 83,335 May 83,335 59,851 6,745 149,931 56,014 9,706 65,720 84,211 June 84,211 52,769 0 136,980 37,492 8,134 45,626 91,354 July 91,354 39,940 0 131,294 60,687 6,620 67,307 63,987 August 63,987 44,950 0 108,937 49,856 8,613 58,469 50,468 September 50,468 40,690 NA NA NA NA NA NA Total to date 724,721 21,438 806,409 592,686 101,807 694,493
Source: Bureau of the Census.
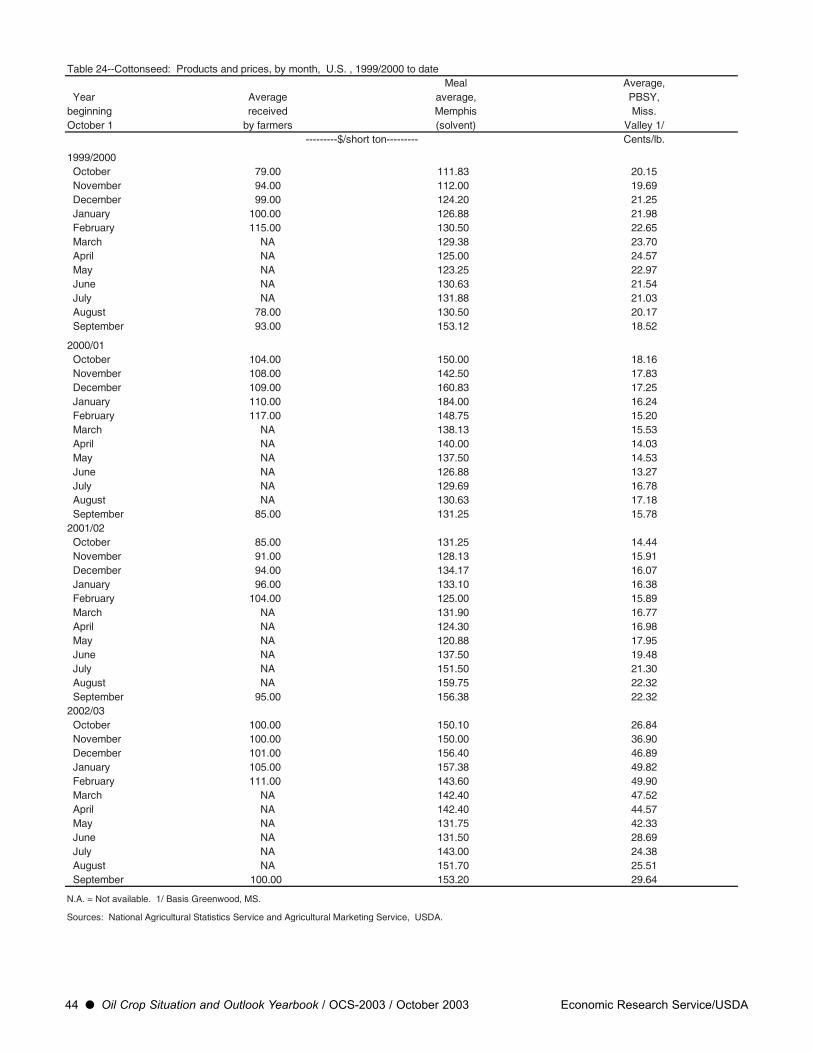
44 l Oil Crop Situation and Outlook Yearbook / OCS-2003 / October 2003 Economic Research Service/USDA
Table 24--Cottonseed: Products and prices, by month, U.S. , 1999/2000 to dateMeal Average,
Year Average average, PBSY,beginning received Memphis Miss.October 1 by farmers (solvent) Valley 1/
---------$/short ton--------- Cents/lb.
1999/2000 October 79.00 111.83 20.15 November 94.00 112.00 19.69 December 99.00 124.20 21.25 January 100.00 126.88 21.98 February 115.00 130.50 22.65 March NA 129.38 23.70 April NA 125.00 24.57 May NA 123.25 22.97 June NA 130.63 21.54 July NA 131.88 21.03 August 78.00 130.50 20.17 September 93.00 153.12 18.52
2000/01 October 104.00 150.00 18.16 November 108.00 142.50 17.83 December 109.00 160.83 17.25 January 110.00 184.00 16.24 February 117.00 148.75 15.20 March NA 138.13 15.53 April NA 140.00 14.03 May NA 137.50 14.53 June NA 126.88 13.27 July NA 129.69 16.78 August NA 130.63 17.18 September 85.00 131.25 15.782001/02 October 85.00 131.25 14.44 November 91.00 128.13 15.91 December 94.00 134.17 16.07 January 96.00 133.10 16.38 February 104.00 125.00 15.89 March NA 131.90 16.77 April NA 124.30 16.98 May NA 120.88 17.95 June NA 137.50 19.48 July NA 151.50 21.30 August NA 159.75 22.32 September 95.00 156.38 22.322002/03 October 100.00 150.10 26.84 November 100.00 150.00 36.90 December 101.00 156.40 46.89 January 105.00 157.38 49.82 February 111.00 143.60 49.90 March NA 142.40 47.52 April NA 142.40 44.57 May NA 131.75 42.33 June NA 131.50 28.69 July NA 143.00 24.38 August NA 151.70 25.51 September 100.00 153.20 29.64
N.A. = Not available. 1/ Basis Greenwood, MS.
Sources: National Agricultural Statistics Service and Agricultural Marketing Service, USDA.
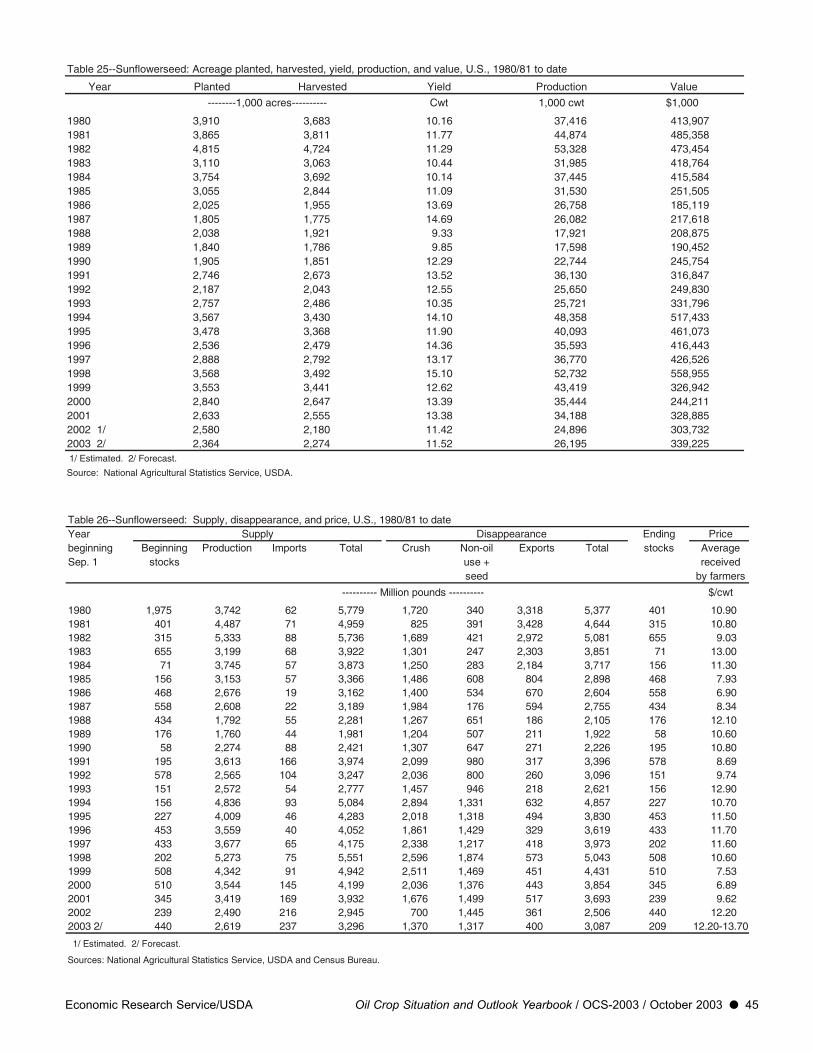
Economic Research Service/USDA Oil Crop Situation and Outlook Yearbook / OCS-2003 / October 2003 l 45
Table 25--Sunflowerseed: Acreage planted, harvested, yield, production, and value, U.S., 1980/81 to date
Year Planted Harvested Yield Production Value
--------1,000 acres---------- Cwt 1,000 cwt $1,000
1980 3,910 3,683 10.16 37,416 413,9071981 3,865 3,811 11.77 44,874 485,3581982 4,815 4,724 11.29 53,328 473,4541983 3,110 3,063 10.44 31,985 418,7641984 3,754 3,692 10.14 37,445 415,5841985 3,055 2,844 11.09 31,530 251,5051986 2,025 1,955 13.69 26,758 185,1191987 1,805 1,775 14.69 26,082 217,6181988 2,038 1,921 9.33 17,921 208,8751989 1,840 1,786 9.85 17,598 190,4521990 1,905 1,851 12.29 22,744 245,7541991 2,746 2,673 13.52 36,130 316,8471992 2,187 2,043 12.55 25,650 249,8301993 2,757 2,486 10.35 25,721 331,7961994 3,567 3,430 14.10 48,358 517,4331995 3,478 3,368 11.90 40,093 461,0731996 2,536 2,479 14.36 35,593 416,4431997 2,888 2,792 13.17 36,770 426,5261998 3,568 3,492 15.10 52,732 558,9551999 3,553 3,441 12.62 43,419 326,9422000 2,840 2,647 13.39 35,444 244,2112001 2,633 2,555 13.38 34,188 328,8852002 1/ 2,580 2,180 11.42 24,896 303,7322003 2/ 2,364 2,274 11.52 26,195 339,225 1/ Estimated. 2/ Forecast.
Source: National Agricultural Statistics Service, USDA.
Table 26--Sunflowerseed: Supply, disappearance, and price, U.S., 1980/81 to dateYear Supply Disappearance Ending Pricebeginning Beginning Production Imports Total Crush Non-oil Exports Total stocks AverageSep. 1 stocks use + received
seed by farmers
---------- Million pounds ---------- $/cwt
1980 1,975 3,742 62 5,779 1,720 340 3,318 5,377 401 10.901981 401 4,487 71 4,959 825 391 3,428 4,644 315 10.801982 315 5,333 88 5,736 1,689 421 2,972 5,081 655 9.031983 655 3,199 68 3,922 1,301 247 2,303 3,851 71 13.001984 71 3,745 57 3,873 1,250 283 2,184 3,717 156 11.301985 156 3,153 57 3,366 1,486 608 804 2,898 468 7.931986 468 2,676 19 3,162 1,400 534 670 2,604 558 6.901987 558 2,608 22 3,189 1,984 176 594 2,755 434 8.341988 434 1,792 55 2,281 1,267 651 186 2,105 176 12.101989 176 1,760 44 1,981 1,204 507 211 1,922 58 10.601990 58 2,274 88 2,421 1,307 647 271 2,226 195 10.801991 195 3,613 166 3,974 2,099 980 317 3,396 578 8.691992 578 2,565 104 3,247 2,036 800 260 3,096 151 9.741993 151 2,572 54 2,777 1,457 946 218 2,621 156 12.901994 156 4,836 93 5,084 2,894 1,331 632 4,857 227 10.701995 227 4,009 46 4,283 2,018 1,318 494 3,830 453 11.501996 453 3,559 40 4,052 1,861 1,429 329 3,619 433 11.701997 433 3,677 65 4,175 2,338 1,217 418 3,973 202 11.601998 202 5,273 75 5,551 2,596 1,874 573 5,043 508 10.601999 508 4,342 91 4,942 2,511 1,469 451 4,431 510 7.532000 510 3,544 145 4,199 2,036 1,376 443 3,854 345 6.892001 345 3,419 169 3,932 1,676 1,499 517 3,693 239 9.622002 239 2,490 216 2,945 700 1,445 361 2,506 440 12.202003 2/ 440 2,619 237 3,296 1,370 1,317 400 3,087 209 12.20-13.70
1/ Estimated. 2/ Forecast.
Sources: National Agricultural Statistics Service, USDA and Census Bureau.

46 l Oil Crop Situation and Outlook Yearbook / OCS-2003 / October 2003 Economic Research Service/USDA
Table 27--Sunflowerseed meal: Supply, disappearance, and price, U.S., 1980/81 to date Year Supply Disappearance Ending Pricebeginning Beginning Production Imports Total 1/ Domestic Exports Total stocks Average,October 1 stocks 28 percent
protein ---------- 1,000 short tons ---------- $/short ton
1980 4 484 4 492 489 0 489 3 1111981 3 222 3 228 220 0 220 8 1061982 8 478 4 491 485 0 485 6 1001983 6 292 6 303 270 28 298 6 1111984 6 354 6 365 344 15 359 6 521985 6 394 6 405 351 49 399 6 681986 6 336 6 347 295 47 342 6 761987 6 470 0 475 419 51 471 4 1031988 4 321 14 339 329 7 336 3 1201989 3 291 14 308 299 3 303 5 971990 5 323 20 348 337 6 343 5 881991 5 549 8 562 496 59 555 7 771992 7 485 5 497 442 53 495 2 901993 2 360 5 366 321 41 361 5 951994 5 720 0 725 623 98 720 5 631995 5 505 0 510 478 27 505 5 1241996 5 485 0 490 462 23 485 5 1111997 5 545 0 550 531 14 545 5 841998 5 680 0 685 635 45 680 5 651999 5 605 0 610 582 23 605 5 752000 5 505 0 510 496 9 505 5 912001 5 395 28 428 395 28 423 5 872002 2/ 5 175 14 194 186 3 189 5 952003 3/ 5 340 0 345 330 10 340 5 102-132
N.A. = Not available. 1/ Total supply includes imports. 2/ Estimated. 3/ Forecast.
Sources: Bureau of Census and Agricultural Marketing Service, USDA.
Table 28--Sunflowerseed oil: Supply, disappearance, and price, U.S., 1980/81 to date Year Supply Disappearance Ending Pricebeginning Beginning Production Imports Total 1/ Domestic Exports Total stocks Average,October 1 stocks crude
Minneapolis ---------- Million pounds ---------- Cents/lb.
1980 161 657 0 818 64 664 728 90 26.951981 90 302 0 392 139 227 366 26 24.891982 26 668 0 694 95 505 600 95 21.381983 95 450 0 545 117 414 531 13 32.331984 13 483 0 496 143 287 430 66 30.011985 66 584 0 650 143 452 595 55 19.101986 55 587 0 642 187 343 530 112 15.991987 112 831 0 943 84 703 787 156 23.491988 156 518 1 675 126 468 594 81 22.661989 81 475 5 560 173 350 522 38 24.371990 38 536 33 607 201 359 560 47 23.671991 47 911 9 967 340 527 867 100 21.631992 100 730 0 830 188 586 774 56 25.371993 56 580 7 643 129 450 579 65 31.081994 65 1,165 1 1,231 171 978 1,149 82 28.101995 82 860 2 943 168 628 796 147 25.421996 147 840 22 1,009 207 709 916 93 22.581997 93 959 8 1,060 186 815 1,000 60 27.001998 60 1,177 5 1,242 320 800 1,120 121 20.151999 121 1,046 4 1,172 385 630 1,015 157 16.682000 157 873 8 1,038 357 545 901 136 15.882001 136 673 36 845 370 453 823 23 23.252002 2/ 23 320 60 403 268 110 378 25 33.112003 3/ 25 595 5 625 385 200 585 40 27.5-30.5
1/ Total supply includes imports. 2/ Estimated. 3/ Forecast.
Sources: Bureau of the Census and Agricultural Marketing Service, USDA.
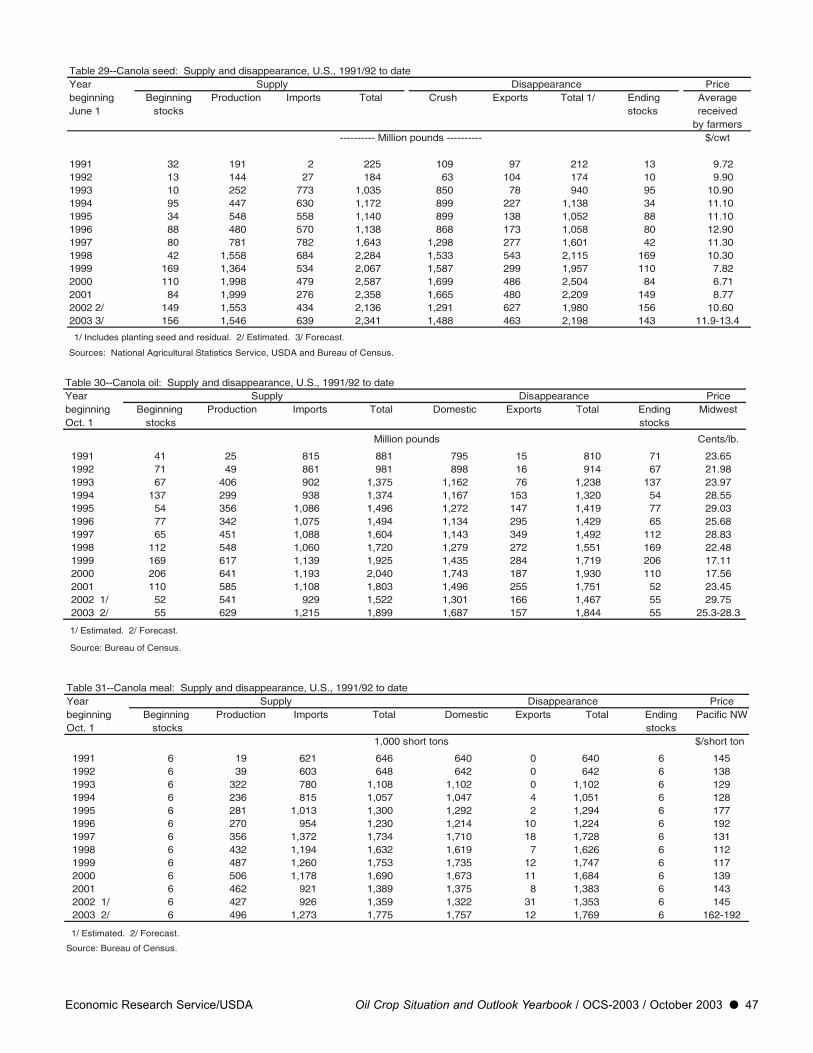
Economic Research Service/USDA Oil Crop Situation and Outlook Yearbook / OCS-2003 / October 2003 l 47
Table 29--Canola seed: Supply and disappearance, U.S., 1991/92 to dateYear Supply Disappearance Pricebeginning Beginning Production Imports Total Crush Exports Total 1/ Ending AverageJune 1 stocks stocks received
by farmers ---------- Million pounds ---------- $/cwt
1991 32 191 2 225 109 97 212 13 9.721992 13 144 27 184 63 104 174 10 9.901993 10 252 773 1,035 850 78 940 95 10.901994 95 447 630 1,172 899 227 1,138 34 11.101995 34 548 558 1,140 899 138 1,052 88 11.101996 88 480 570 1,138 868 173 1,058 80 12.901997 80 781 782 1,643 1,298 277 1,601 42 11.301998 42 1,558 684 2,284 1,533 543 2,115 169 10.301999 169 1,364 534 2,067 1,587 299 1,957 110 7.822000 110 1,998 479 2,587 1,699 486 2,504 84 6.712001 84 1,999 276 2,358 1,665 480 2,209 149 8.772002 2/ 149 1,553 434 2,136 1,291 627 1,980 156 10.602003 3/ 156 1,546 639 2,341 1,488 463 2,198 143 11.9-13.4
1/ Includes planting seed and residual. 2/ Estimated. 3/ Forecast.
Sources: National Agricultural Statistics Service, USDA and Bureau of Census.
Table 30--Canola oil: Supply and disappearance, U.S., 1991/92 to dateYear Supply Disappearance Pricebeginning Beginning Production Imports Total Domestic Exports Total Ending MidwestOct. 1 stocks stocks
Million pounds Cents/lb.
1991 41 25 815 881 795 15 810 71 23.65 1992 71 49 861 981 898 16 914 67 21.98 1993 67 406 902 1,375 1,162 76 1,238 137 23.97 1994 137 299 938 1,374 1,167 153 1,320 54 28.55 1995 54 356 1,086 1,496 1,272 147 1,419 77 29.03 1996 77 342 1,075 1,494 1,134 295 1,429 65 25.68 1997 65 451 1,088 1,604 1,143 349 1,492 112 28.83 1998 112 548 1,060 1,720 1,279 272 1,551 169 22.48 1999 169 617 1,139 1,925 1,435 284 1,719 206 17.11 2000 206 641 1,193 2,040 1,743 187 1,930 110 17.56 2001 110 585 1,108 1,803 1,496 255 1,751 52 23.45 2002 1/ 52 541 929 1,522 1,301 166 1,467 55 29.75 2003 2/ 55 629 1,215 1,899 1,687 157 1,844 55 25.3-28.3
1/ Estimated. 2/ Forecast.
Source: Bureau of Census.
Table 31--Canola meal: Supply and disappearance, U.S., 1991/92 to dateYear Supply Disappearance Pricebeginning Beginning Production Imports Total Domestic Exports Total Ending Pacific NWOct. 1 stocks stocks
1,000 short tons $/short ton
1991 6 19 621 646 640 0 640 6 145 1992 6 39 603 648 642 0 642 6 138 1993 6 322 780 1,108 1,102 0 1,102 6 129 1994 6 236 815 1,057 1,047 4 1,051 6 128 1995 6 281 1,013 1,300 1,292 2 1,294 6 177 1996 6 270 954 1,230 1,214 10 1,224 6 192 1997 6 356 1,372 1,734 1,710 18 1,728 6 131 1998 6 432 1,194 1,632 1,619 7 1,626 6 112 1999 6 487 1,260 1,753 1,735 12 1,747 6 117 2000 6 506 1,178 1,690 1,673 11 1,684 6 139 2001 6 462 921 1,389 1,375 8 1,383 6 143 2002 1/ 6 427 926 1,359 1,322 31 1,353 6 145 2003 2/ 6 496 1,273 1,775 1,757 12 1,769 6 162-192
1/ Estimated. 2/ Forecast.
Source: Bureau of Census.

48 l Oil Crop Situation and Outlook Yearbook / OCS-2003 / October 2003 Economic Research Service/USDA
Table 33--Flaxseed: Supply, disappearance, and price, U.S., 1980 to date Year Supply Disappearance Pricebeginning Beginning Average June 1 stocks Production Imports Total Crush Exports Seed Residual Total received
by farmers --------------- 1,000 bushels --------------- $/bu.
1980 5,018 7,728 2,510 15,256 11,927 76 547 -27 12,523 7.20 1981 2,733 7,289 3,502 13,524 11,231 11 691 -359 11,574 6.67 1982 1,950 10,278 1,921 14,149 8,722 638 486 1,091 10,937 5.17 1983 3,212 6,903 4,756 14,871 12,733 52 438 -68 13,155 6.84 1984 1,716 7,022 3,796 12,534 9,935 238 511 201 10,885 6.09 1985 1,649 8,293 2,927 12,869 10,313 250 517 160 11,240 5.05 1986 1,629 11,538 2,224 15,391 10,000 1,448 362 280 12,090 3.47 1987 3,301 7,444 2,925 13,670 10,800 156 223 167 11,346 3.39 1988 2,325 1,615 6,730 10,670 8,500 764 158 -59 9,363 7.56 1989 1,307 1,215 7,260 9,782 8,250 1,054 211 23 9,538 7.20 1990 244 3,812 6,715 10,771 8,800 549 288 163 9,800 5.27 1991 971 6,200 4,371 11,542 9,050 541 139 256 9,986 3.52 1992 1,556 3,288 6,035 10,879 8,600 230 167 337 9,334 4.12 1993 1,545 3,482 5,118 10,145 8,650 126 144 69 8,990 4.25 1994 1,155 2,922 6,005 10,082 8,550 72 134 156 8,912 4.63 1995 1,170 2,212 7,248 10,630 9,000 119 78 203 9,400 5.25 1996 1,230 1,602 8,390 11,222 10,000 144 122 503 10,769 6.21 1997 453 2,420 9,636 12,509 10,500 174 272 382 11,328 5.75 1998 1,181 6,708 5,992 13,881 10,600 476 313 333 11,723 5.25 1999 2,158 7,864 6,629 16,651 11,500 215 434 2,735 14,884 3.79 2000 1,767 10,730 2,850 15,347 12,000 1,015 474 572 14,039 3.30 2001 1,308 11,455 1,903 14,666 10,000 2,386 636 751 13,773 4.29 2002 1/ 893 12,569 2,650 16,112 10,300 2,900 472 890 14,562 5.80
1/ Preliminary.
Source: National Agricultural Statistics Service, USDA.
Table 32--Flaxseed: Acreage planted, harvested, yield, production, and value, U.S., 1980 to dateYear Planted Harvested Yield per acre Production Value
--------1,000 acres--------- Bushels 1,000 bushels $1,000
1980 759 663 11.7 7,728 55,6151981 605 577 12.6 7,289 48,6151982 780 735 14.0 10,278 53,1391983 605 580 11.9 6,903 46,9251984 555 538 13.1 7,022 42,7391985 620 584 14.2 8,293 41,9121986 720 683 16.9 11,538 39,9621987 470 463 16.1 7,444 25,1881988 275 226 7.1 1,615 12,2001989 195 163 7.5 1,215 8,7241990 260 253 15.1 3,812 21,1081991 356 342 18.1 6,200 21,8451992 171 165 19.9 3,288 13,5431993 206 191 18.2 3,482 14,7991994 178 171 17.1 2,922 13,5291995 165 147 15.0 2,212 11,5021996 96 92 17.4 1,602 10,2051997 151 146 16.6 2,420 14,0601998 336 329 20.4 6,708 33,8751999 387 382 20.6 7,864 29,8052000 536 517 20.8 10,730 35,4092001 585 578 19.8 11,455 49,1422002 785 704 17.9 12,569 72,9002003 1/ 583 572 NA NA NA 1/ Prelininary.
Source: National Agricultural Statistics Service, USDA.

Economic Research Service/USDA Oil Crop Situation and Outlook Yearbook / OCS-2003 / October 2003 l 49
Table 34--Linseed meal: Supply disappearance and price, U.S., 1980 to date Year Supply Disappearance Pricebeginning Beginning Ending Minneapolis June 1 stocks Production Imports Total Exports Domestic Total stocks 34% protein
---------------1,000 short tons --------------- $/ton
1980 7 225 2 234 129 103 232 2 162.801981 2 220 2 224 152 70 222 2 150.001982 2 170 2 174 79 93 172 2 143.401983 2 249 2 253 125 125 250 3 155.251984 3 179 1 183 60 120 180 3 99.001985 3 184 3 190 75 110 185 5 102.601986 5 185 2 192 63 127 190 2 112.001987 2 198 2 202 59 140 199 3 130.251988 3 156 11 170 63 102 165 5 178.451989 5 153 9 167 23 139 162 5 139.301990 5 162 3 170 41 124 165 5 130.101991 5 167 0 172 40 127 167 5 127.571992 5 159 2 166 55 106 161 5 133.601993 5 160 2 167 49 113 162 5 139.551994 5 158 5 168 58 105 163 5 91.961995 5 167 2 174 35 134 169 5 133.601996 5 185 13 203 44 154 198 5 169.751997 5 189 15 209 19 185 204 5 131.401998 5 191 4 200 26 169 195 5 91.631999 5 207 4 216 26 185 211 5 93.772000 5 216 4 225 27 193 220 5 116.232001 5 180 4 189 28 156 184 5 121.292002 1/ 5 185 4 194 29 160 189 5 125.00
1/ Preliminary.
Source: Bureau of the Census and Agricultural Marketing Service.
Table 35--Linseed oil: Supply, disappearance, and price, U.S., 1980 to date Year Supply Disappearancebeginning Beginning Ending Price June 1 stocks Production Total Exports Domestic Total stocks Minneapolis
-------------------- Million pounds -------------------- Cents/lb.
1980 54 251 305 51 198 249 56 30.021981 56 237 293 54 189 243 50 30.501982 50 182 232 21 176 197 35 25.201983 35 265 300 51 201 252 48 30.101984 48 194 242 15 194 209 33 32.001985 33 205 238 15 184 199 39 30.801986 39 201 240 6 183 189 51 26.301987 51 217 268 8 219 227 41 24.701988 41 170 211 12 151 163 48 39.401989 48 165 213 12 164 176 37 40.201990 37 176 213 6 167 173 40 38.001991 40 182 222 12 170 182 40 32.001992 40 172 212 8 150 158 54 31.501993 54 174 228 3 162 165 63 31.801994 63 172 235 24 166 190 45 33.701995 45 180 225 26 149 175 50 36.501996 50 200 250 66 149 215 35 36.001997 35 205 240 58 140 198 42 37.801998 42 207 249 63 138 201 48 37.501999 48 224 272 76 147 223 49 37.752000 49 234 293 100 150 250 43 36.002001 43 195 238 90 103 193 45 36.002002 1/ 45 201 246 92 109 201 45 33.00
1/ Preliminary.
Source: Bureau of the Census.

50 l Oil Crop Situation and Outlook Yearbook / OCS-2003 / October 2003 Economic Research Service/USDA
Table 36--Edible fats and oils: U.S. Supply and disappearance, 1991 to date Item 1991 1992 1993 1994 1995 1996 1997 1998 1999 2000 2001 2002 1/ 2003 2/
Million poundsStocks October 1 Coconut 277 188 251 164 163 84 150 393 152 136 260 227 148 Corn 138 196 150 118 241 116 129 102 135 267 117 104 114 Cottonseed 137 78 81 106 82 94 66 79 76 49 93 39 40 Lard 24 27 26 34 24 23 20 40 21 18 14 10 5 Palm 53 44 33 35 15 31 46 35 48 48 61 70 42 Palm kernel 53 49 88 73 55 22 51 64 73 49 155 128 50 Peanut 3/ 25 51 50 25 40 65 86 41 40 32 31 32 50 Safflower 28 28 18 31 21 44 27 38 48 36 21 17 19 Soybean 1,786 2,239 1,555 1,103 1,137 2,015 1,520 1,382 1,520 1,993 2,767 2,359 1,486 Sunflower 47 100 56 65 82 147 93 60 121 157 136 23 25 Canola 41 71 67 137 54 77 65 112 169 206 110 52 55 Tallow, edible 41 33 41 36 52 34 48 46 43 40 49 24 35Imports Coconut 841 1,163 999 1,100 874 1,188 1,438 791 926 1,115 1,093 860 970 Corn 5 7 7 10 11 14 28 42 18 27 61 65 65 Cottonseed 18 38 26 0 0 0 0 48 8 0 0 22 0 Lard 2 3 3 2 2 1 2 2 2 3 6 10 10 Olive 216 253 262 260 227 304 333 355 397 455 455 485 540 Palm 220 267 368 218 236 322 282 284 345 399 490 425 440 Palm kernel 342 302 304 280 262 392 359 401 393 351 330 470 475 Peanut 3/ 1 0 11 4 5 14 10 73 12 79 39 70 70 Canola 815 861 902 938 1,086 1,075 1,088 1,060 1,139 1,193 1,108 929 1,215 Safflower 22 15 16 26 35 30 51 51 33 34 40 43 45 Soybean 1 10 68 17 95 53 60 83 83 73 46 50 85 Sunflower 9 0 7 1 2 22 8 5 4 8 36 60 5 Tallow, edible 6 10 15 18 8 5 2 3 10 32 7 11 10Production Corn 1,821 1,878 1,906 2,227 2,139 2,231 2,335 2,374 2,501 2,403 2,461 2,453 2,650 Cottonseed 1,280 1,126 1,119 1,312 1,229 1,216 1,224 832 939 847 876 725 865 Lard 1,016 1,011 1,015 1,052 1,013 979 1,065 1,106 1,069 1,050 1,080 1,075 1,100 Peanut 3/ 356 286 212 314 321 221 176 145 229 179 230 286 219 Canola 32 49 406 299 355 342 451 548 617 641 585 541 629 Safflower 69 87 111 115 127 103 115 111 91 88 76 89 91 Soybean 14,345 13,778 13,951 15,613 15,240 15,752 18,143 18,078 17,825 18,420 18,898 18,435 17,020 Sunflower 911 730 580 1,165 860 840 959 1,177 1,046 873 673 320 595 Tallow, edible 1,515 1,414 1,535 1,550 1,559 1,407 1,517 1,677 1,792 1,764 1,932 2,075 2,000Exports Coconut 22 0 19 18 12 12 6 11 14 8 7 8 10 Corn 566 712 717 865 977 988 1,118 989 970 951 1,172 890 900 Cottonseed 269 184 248 329 221 232 208 111 141 131 150 110 115 Lard 131 129 119 140 94 103 122 140 189 93 90 105 100 Olive 20 15 11 21 24 21 19 15 12 9 10 12 12 Palm kernel 2 9 4 2 2 2 2 2 2 2 2 2 2 Palm 7 7 7 13 20 9 11 11 11 11 10 11 10 Peanut 3/ 151 52 61 97 108 21 13 10 18 14 8 42 19 Canola 15 16 76 153 147 295 349 272 284 187 255 166 157 Safflower 73 65 75 93 122 83 83 92 51 35 37 37 40 Soybean 1,644 1,461 1,531 2,683 992 2,033 3,079 2,372 1,375 1,401 2,519 2,250 850 Sunflower 471 586 450 978 628 709 815 800 630 545 453 110 200 Tallow, edible 333 306 316 277 241 181 236 322 224 338 475 485 490Domestic disappearance Coconut 910 1,084 1,067 1,083 941 1,111 1,189 1,021 927 983 1,119 930 958 Corn 1,202 1,220 1,228 1,250 1,298 1,244 1,271 1,394 1,417 1,630 1,363 1,618 1,804 Cottonseed 1,088 975 873 1,007 996 1,012 1,004 772 833 672 780 636 750 Lard 885 886 890 924 922 880 925 987 886 964 1,000 985 990 Olive 216 253 262 260 227 304 333 355 397 455 455 473 528 Palm 223 271 359 225 201 298 282 260 335 375 471 425 427 Palm kernel 344 254 315 295 293 362 344 390 414 243 355 511 458 Peanut 179 236 187 206 193 194 217 208 233 244 260 296 275 Canola 801 898 1,162 1,165 1,271 1,134 1,143 1,287 1,435 1,744 1,496 1,301 1,687 Safflower 15 47 40 57 17 67 73 59 86 102 89 93 95 Soybean 12,248 13,012 12,939 12,913 13,465 14,267 15,262 15,652 16,059 16,318 16,833 17,108 16,522 Sunflower 396 188 129 171 168 207 186 320 385 357 370 268 385 Tallow, edible 1,197 1,109 1,239 1,275 1,345 1,218 1,286 1,360 1,581 1,449 1,488 1,590 1,515
1/ Preliminary and estimated. 2/ ERS and WAOB forecast. 3/ August-July year beginning 1982.
Source: Bureau of the Census.

Economic Research Service/USDA Oil Crop Situation and Outlook Yearbook / OCS-2003 / October 2003 l 51
Table 37--Corn oil: Supply, disappearance, and price, U.S., 1980 to date Year Supply Disappearance Ending Pricebeginning Beginning Production Imports Total Domestic Exports Total stocks AverageOctober 1 stocks Chicago
--------------- Million pounds --------------- Cents/lb.
1980 66 864 0 930 673 181 854 76 25.221981 76 873 0 949 692 202 894 55 23.421982 55 981 1 1,037 724 223 947 90 23.821983 90 1,054 0 1,144 763 311 1,074 70 28.621984 70 1,194 0 1,264 931 260 1,191 74 29.141985 74 1,253 0 1,326 862 344 1,206 120 18.461986 120 1,400 0 1,520 1,143 268 1,411 109 21.431987 109 1,435 2 1,547 1,066 370 1,436 111 23.271988 111 1,415 1 1,527 1,064 364 1,428 99 21.011989 99 1,470 0 1,569 1,111 414 1,525 44 24.821990 44 1,656 2 1,702 1,065 498 1,563 138 27.501991 138 1,821 5 1,965 1,202 566 1,768 196 25.821992 196 1,878 7 2,081 1,220 712 1,932 150 20.901993 150 1,906 7 2,063 1,228 717 1,944 118 27.171994 118 2,227 10 2,356 1,250 865 2,115 241 26.471995 241 2,139 11 2,391 1,298 977 2,275 116 25.241996 116 2,231 14 2,361 1,244 988 2,232 129 24.051997 129 2,335 28 2,492 1,271 1,118 2,390 102 28.941998 102 2,374 42 2,519 1,394 989 2,383 135 25.301999 135 2,501 18 2,654 1,417 970 2,387 267 17.812000 267 2,403 27 2,698 1,630 951 2,581 117 13.542001 117 2,461 61 2,639 1,363 1,172 2,535 104 19.142002 1/ 104 2,453 65 2,622 1,618 890 2,508 114 27.252003 1/ 114 2,650 65 2,829 1,804 900 2,704 125 2/
1/ Forecast. 2/ Corn oil price is not forecast.
Source: Bureau of the Census and Agricultural Marketing Service.
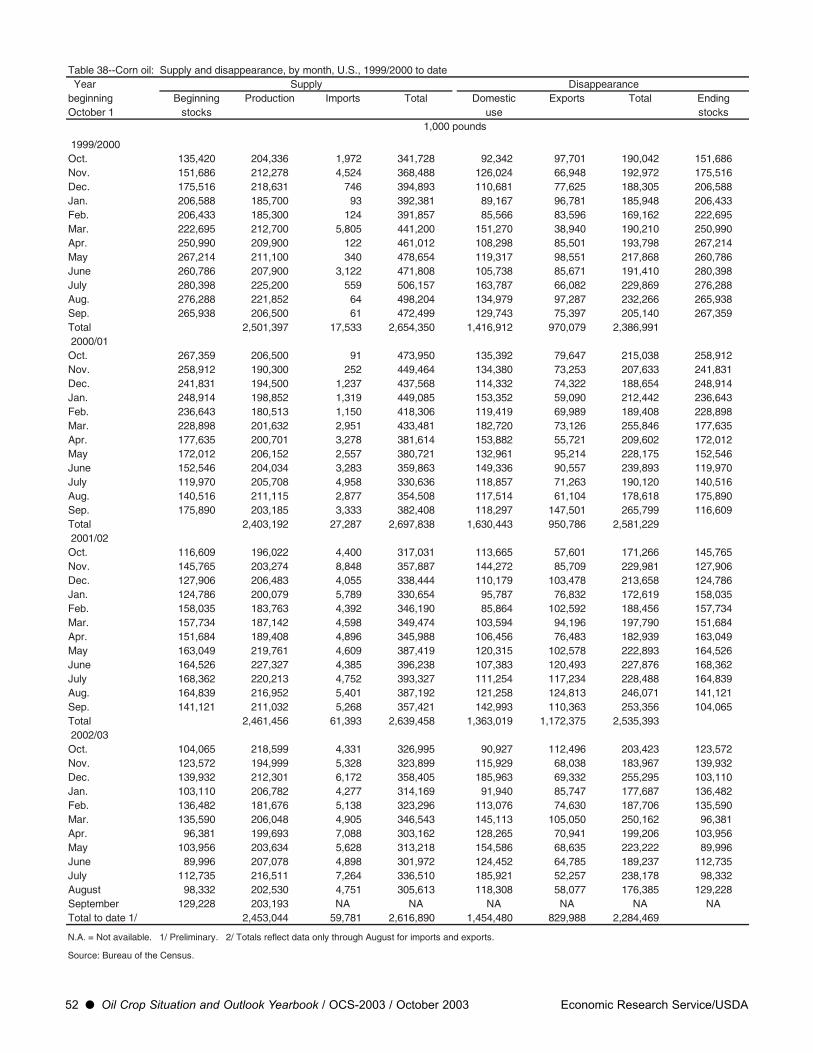
52 l Oil Crop Situation and Outlook Yearbook / OCS-2003 / October 2003 Economic Research Service/USDA
Table 38--Corn oil: Supply and disappearance, by month, U.S., 1999/2000 to date Year Supply Disappearancebeginning Beginning Production Imports Total Domestic Exports Total EndingOctober 1 stocks use stocks
1,000 pounds
1999/2000Oct. 135,420 204,336 1,972 341,728 92,342 97,701 190,042 151,686Nov. 151,686 212,278 4,524 368,488 126,024 66,948 192,972 175,516Dec. 175,516 218,631 746 394,893 110,681 77,625 188,305 206,588Jan. 206,588 185,700 93 392,381 89,167 96,781 185,948 206,433Feb. 206,433 185,300 124 391,857 85,566 83,596 169,162 222,695Mar. 222,695 212,700 5,805 441,200 151,270 38,940 190,210 250,990Apr. 250,990 209,900 122 461,012 108,298 85,501 193,798 267,214May 267,214 211,100 340 478,654 119,317 98,551 217,868 260,786June 260,786 207,900 3,122 471,808 105,738 85,671 191,410 280,398July 280,398 225,200 559 506,157 163,787 66,082 229,869 276,288Aug. 276,288 221,852 64 498,204 134,979 97,287 232,266 265,938Sep. 265,938 206,500 61 472,499 129,743 75,397 205,140 267,359Total 2,501,397 17,533 2,654,350 1,416,912 970,079 2,386,991 2000/01Oct. 267,359 206,500 91 473,950 135,392 79,647 215,038 258,912Nov. 258,912 190,300 252 449,464 134,380 73,253 207,633 241,831Dec. 241,831 194,500 1,237 437,568 114,332 74,322 188,654 248,914Jan. 248,914 198,852 1,319 449,085 153,352 59,090 212,442 236,643Feb. 236,643 180,513 1,150 418,306 119,419 69,989 189,408 228,898Mar. 228,898 201,632 2,951 433,481 182,720 73,126 255,846 177,635Apr. 177,635 200,701 3,278 381,614 153,882 55,721 209,602 172,012May 172,012 206,152 2,557 380,721 132,961 95,214 228,175 152,546June 152,546 204,034 3,283 359,863 149,336 90,557 239,893 119,970July 119,970 205,708 4,958 330,636 118,857 71,263 190,120 140,516Aug. 140,516 211,115 2,877 354,508 117,514 61,104 178,618 175,890Sep. 175,890 203,185 3,333 382,408 118,297 147,501 265,799 116,609Total 2,403,192 27,287 2,697,838 1,630,443 950,786 2,581,229 2001/02Oct. 116,609 196,022 4,400 317,031 113,665 57,601 171,266 145,765Nov. 145,765 203,274 8,848 357,887 144,272 85,709 229,981 127,906Dec. 127,906 206,483 4,055 338,444 110,179 103,478 213,658 124,786Jan. 124,786 200,079 5,789 330,654 95,787 76,832 172,619 158,035Feb. 158,035 183,763 4,392 346,190 85,864 102,592 188,456 157,734Mar. 157,734 187,142 4,598 349,474 103,594 94,196 197,790 151,684Apr. 151,684 189,408 4,896 345,988 106,456 76,483 182,939 163,049May 163,049 219,761 4,609 387,419 120,315 102,578 222,893 164,526June 164,526 227,327 4,385 396,238 107,383 120,493 227,876 168,362July 168,362 220,213 4,752 393,327 111,254 117,234 228,488 164,839Aug. 164,839 216,952 5,401 387,192 121,258 124,813 246,071 141,121Sep. 141,121 211,032 5,268 357,421 142,993 110,363 253,356 104,065Total 2,461,456 61,393 2,639,458 1,363,019 1,172,375 2,535,393 2002/03Oct. 104,065 218,599 4,331 326,995 90,927 112,496 203,423 123,572Nov. 123,572 194,999 5,328 323,899 115,929 68,038 183,967 139,932Dec. 139,932 212,301 6,172 358,405 185,963 69,332 255,295 103,110Jan. 103,110 206,782 4,277 314,169 91,940 85,747 177,687 136,482Feb. 136,482 181,676 5,138 323,296 113,076 74,630 187,706 135,590Mar. 135,590 206,048 4,905 346,543 145,113 105,050 250,162 96,381Apr. 96,381 199,693 7,088 303,162 128,265 70,941 199,206 103,956May 103,956 203,634 5,628 313,218 154,586 68,635 223,222 89,996June 89,996 207,078 4,898 301,972 124,452 64,785 189,237 112,735July 112,735 216,511 7,264 336,510 185,921 52,257 238,178 98,332August 98,332 202,530 4,751 305,613 118,308 58,077 176,385 129,228September 129,228 203,193 NA NA NA NA NA NATotal to date 1/ 2,453,044 59,781 2,616,890 1,454,480 829,988 2,284,469
N.A. = Not available. 1/ Preliminary. 2/ Totals reflect data only through August for imports and exports.
Source: Bureau of the Census.

Economic Research Service/USDA Oil Crop Situation and Outlook Yearbook / OCS-2003 / October 2003 l 53
Table 39--Fats and oils used in edible products, by use, U.S., 1994/95 to date 1/
Year beginning October 1 1994/95 1995/96 1996/97 1997/98 1998/99 1999/2000 2000/01 2001/02
Million pounds
Coconut oil: Total edible 247 221 120 141 144 239 260 294Corn oil: Baking or frying fats 100 82 73 D D D D D Margarine D 79 68 D D D D D Salad or cooking oil 446 434 386 375 384 800 956 Total edible 636 595 527 492 496 953 1,298 950Cottonseed oil: Baking or frying fats 217 218 271 208 170 183 178 200 Margarine D D D D D D D D Salad or cooking oil 262 235 265 184 262 320 205 317 Other edible D D D D D D D D Total edible 532 497 556 414 457 554 426 539Lard: Baking or frying fats 332 296 262 285 250 234 D D Margarine 2/ 43 33 15 17 26 14 5 14 Total edible 365 327 276 300 274 238 D 238Palm oil: Baking or frying fats D D D D D D D D Total edible D D D D D D D DPeanut oil: Salad or cooking oil D D D D D D D D Total edible 108 129 138 123 188 242 D DEdible rapeseed oil: Baking or frying fats D D D D D D D D Salad and cooking oil 244 217 273 351 360 480 566 732 Total edible 337 319 390 466 476 617 730 904Soybean oil: Baking or frying fats 4,714 4,702 4,578 4,688 4,842 7,153 8,044 8,572 Margarine 1,693 1,699 1,667 1,623 1,589 1,481 1,294 1,242 Salad or cooking oil 5,546 5,317 6,119 6,188 6,191 7,075 7,310 7,880 Other edible 222 159 68 78 120 132 125 125 Total edible 12,175 11,877 12,432 12,576 12,743 15,841 16,772 17,818Sunflower oil: Total edible & inedible D 90 101 110 132 158 D 269Tallow, edible: Baking or frying fats 374 335 321 268 256 286 D D Total edible 382 341 327 274 262 293 314 252Total fats and oils: Baking or frying fats 6,063 5,995 5,750 5,727 5,753 8,208 9,208 9,704 Margarine 1,863 1,835 1,759 1,704 1,681 1,565 1,380 1,333 Salad or cooking oil 6,883 6,511 7,400 7,435 7,609 9,284 9,861 10,924 Other edible 428 395 296 349 403 436 408 403 Total edible 15,238 14,736 15,205 15,214 15,446 19,494 20,602 22,365
D = Withheld to avoid disclosing figures for individual companies. 1/ Includes lard and edible tallow.
Source: Bureau of the Census.
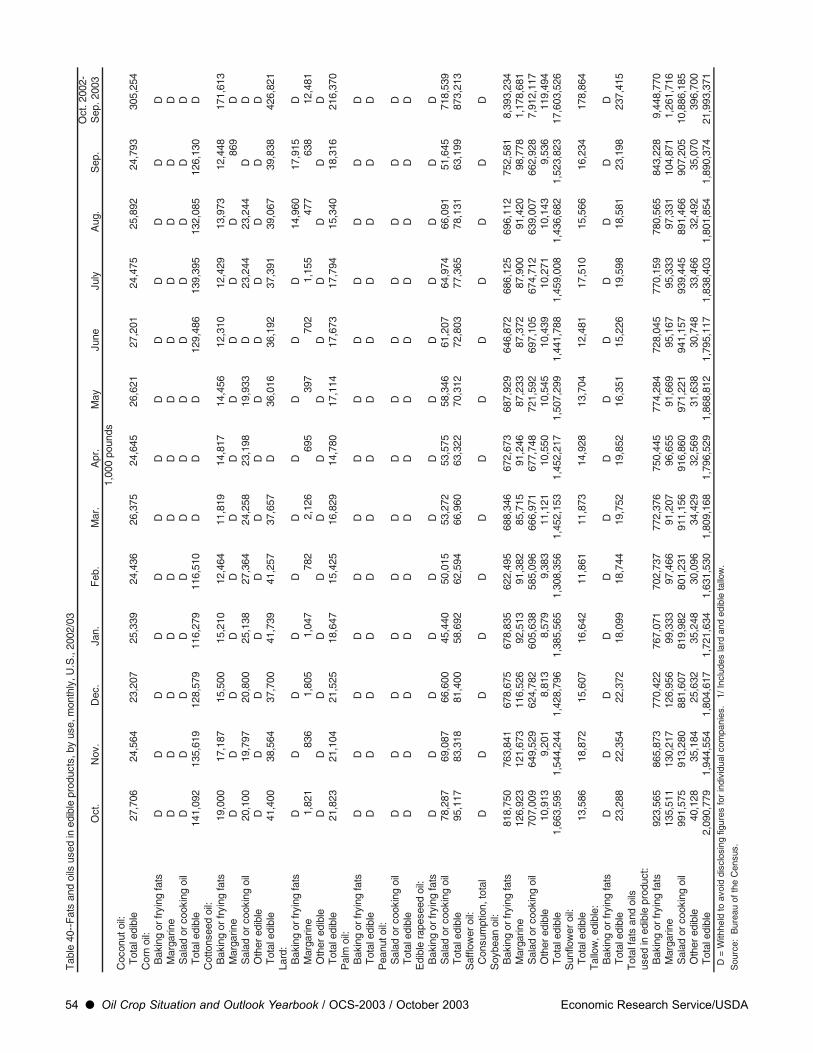
54 l Oil Crop Situation and Outlook Yearbook / OCS-2003 / October 2003 Economic Research Service/USDA
Tab
le40
--F
ats
and
oils
used
ined
ible
prod
ucts
,by
use,
mon
thly
,U.S
.,20
02/0
3O
ct.2
002-
Oct
.N
ov.
Dec
.Ja
n.F
eb.
Mar
.A
pr.
May
June
July
Aug
.S
ep.
Sep
.200
31,
000
poun
dsC
ocon
utoi
l:T
otal
edib
le27
,706
24,5
6423
,207
25,3
3924
,436
26,3
7524
,645
26,6
2127
,201
24,4
7525
,892
24,7
9330
5,25
4C
orn
oil:
Bak
ing
or fr
ying
fats
DD
DD
DD
DD
DD
DD
DM
arga
rine
DD
DD
DD
DD
DD
DD
DS
alad
or c
ooki
ngoi
lD
DD
DD
DD
DD
DD
DD
Tot
aled
ible
141,
092
135,
619
128,
579
116,
279
116,
510
DD
D12
9,48
613
9,39
513
2,08
512
6,13
0D
Cot
tons
eed
oil:
Bak
ing
or fr
ying
fats
19,0
0017
,187
15,5
0015
,210
12,4
6411
,819
14,8
1714
,456
12,3
1012
,429
13,9
7312
,448
171,
613
Mar
garin
eD
DD
DD
DD
DD
DD
869
DS
alad
or c
ooki
ngoi
l20
,100
19,7
9720
,800
25,1
3827
,364
24,2
5823
,198
19,9
33D
23,2
4423
,244
DD
Oth
er e
dibl
eD
DD
DD
DD
DD
DD
DD
Tot
aled
ible
41,4
0038
,564
37,7
0041
,739
41,2
5737
,657
D36
,016
36,1
9237
,391
39,0
6739
,838
426,
821
Lard
:B
akin
gor
fryi
ngfa
tsD
DD
DD
DD
DD
D14
,960
17,9
15D
Mar
garin
e1,
821
836
1,80
51,
047
782
2,12
669
539
770
21,
155
477
638
12,4
81O
ther
edi
ble
DD
DD
DD
DD
DD
DD
DT
otal
edib
le21
,823
21,1
0421
,525
18,6
4715
,425
16,8
2914
,780
17,1
1417
,673
17,7
9415
,340
18,3
1621
6,37
0P
alm
oil:
Bak
ing
or fr
ying
fats
DD
DD
DD
DD
DD
DD
DT
otal
edib
leD
DD
DD
DD
DD
DD
DD
Pea
nuto
il:S
alad
or c
ooki
ngoi
lD
DD
DD
DD
DD
DD
DD
Tot
aled
ible
DD
DD
DD
DD
DD
DD
DE
dibl
era
pese
edoi
l:B
akin
gor
fryi
ngfa
tsD
DD
DD
DD
DD
DD
DD
Sal
ador
coo
king
oil
78,2
8769
,087
66,6
0045
,440
50,0
1553
,272
53,5
7558
,346
61,2
0764
,974
66,0
9151
,645
718,
539
Tot
aled
ible
95,1
1783
,318
81,4
0058
,692
62,5
9466
,960
63,3
2270
,312
72,8
0377
,365
78,1
3163
,199
873,
213
Saf
flow
er o
il:C
onsu
mpt
ion,
tota
lD
DD
DD
DD
DD
DD
DD
Soy
bean
oil:
Bak
ing
or fr
ying
fats
818,
750
763,
841
678,
675
678,
835
622,
495
688,
346
672,
673
687,
929
646,
872
686,
125
696,
112
752,
581
8,39
3,23
4M
arga
rine
126,
923
121,
673
116,
526
92,5
1391
,382
85,7
1591
,246
87,2
3387
,372
87,9
0091
,420
98,7
781,
178,
681
Sal
ador
coo
king
oil
707,
009
649,
529
624,
782
605,
638
585,
096
666,
971
677,
748
721,
592
697,
105
674,
712
639,
007
662,
928
7,91
2,11
7O
ther
edi
ble
10,9
139,
201
8,81
38,
579
9,38
311
,121
10,5
5010
,545
10,4
3910
,271
10,1
439,
536
119,
494
Tot
aled
ible
1,66
3,59
51,
544,
244
1,42
8,79
61,
385,
565
1,30
8,35
61,
452,
153
1,45
2,21
71,
507,
299
1,44
1,78
81,
459,
008
1,43
6,68
21,
523,
823
17,6
03,5
26S
unflo
wer
oil:
Tot
aled
ible
13,5
8618
,872
15,6
0716
,642
11,8
6111
,873
14,9
2813
,704
12,4
8117
,510
15,5
6616
,234
178,
864
Tal
low
,edi
ble:
Bak
ing
or fr
ying
fats
DD
DD
DD
DD
DD
DD
DT
otal
edib
le23
,288
22,3
5422
,372
18,0
9918
,744
19,7
5219
,852
16,3
5115
,226
19,5
9818
,581
23,1
9823
7,41
5T
otal
fats
and
oils
used
ined
ible
prod
uct:
Bak
ing
or fr
ying
fats
923,
565
865,
873
770,
422
767,
071
702,
737
772,
376
750,
445
774,
284
728,
045
770,
159
780,
565
843,
228
9,44
8,77
0M
arga
rine
135,
511
130,
217
126,
956
99,3
3397
,466
91,2
0796
,655
91,6
6995
,167
95,3
3397
,331
104,
871
1,26
1,71
6S
alad
or c
ooki
ngoi
l99
1,57
591
3,28
088
1,60
781
9,98
280
1,23
191
1,15
691
6,86
097
1,22
194
1,15
793
9,44
589
1,46
690
7,20
510
,886
,185
Oth
er e
dibl
e40
,128
35,1
8425
,632
35,2
4830
,096
34,4
2932
,569
31,6
3830
,748
33,4
6632
,492
35,0
7039
6,70
0T
otal
edib
le2,
090,
779
1,94
4,55
41,
804,
617
1,72
1,63
41,
631,
530
1,80
9,16
81,
796,
529
1,86
8,81
21,
795,
117
1,83
8,40
31,
801,
854
1,89
0,37
421
,993
,371
D=
With
held
toav
oid
disc
losi
ngfig
ures
for
indi
vidu
alco
mpa
nies
.1/
Incl
udes
lard
and
edib
leta
llow
.
Sou
rce:
Bur
eau
ofth
eC
ensu
s.
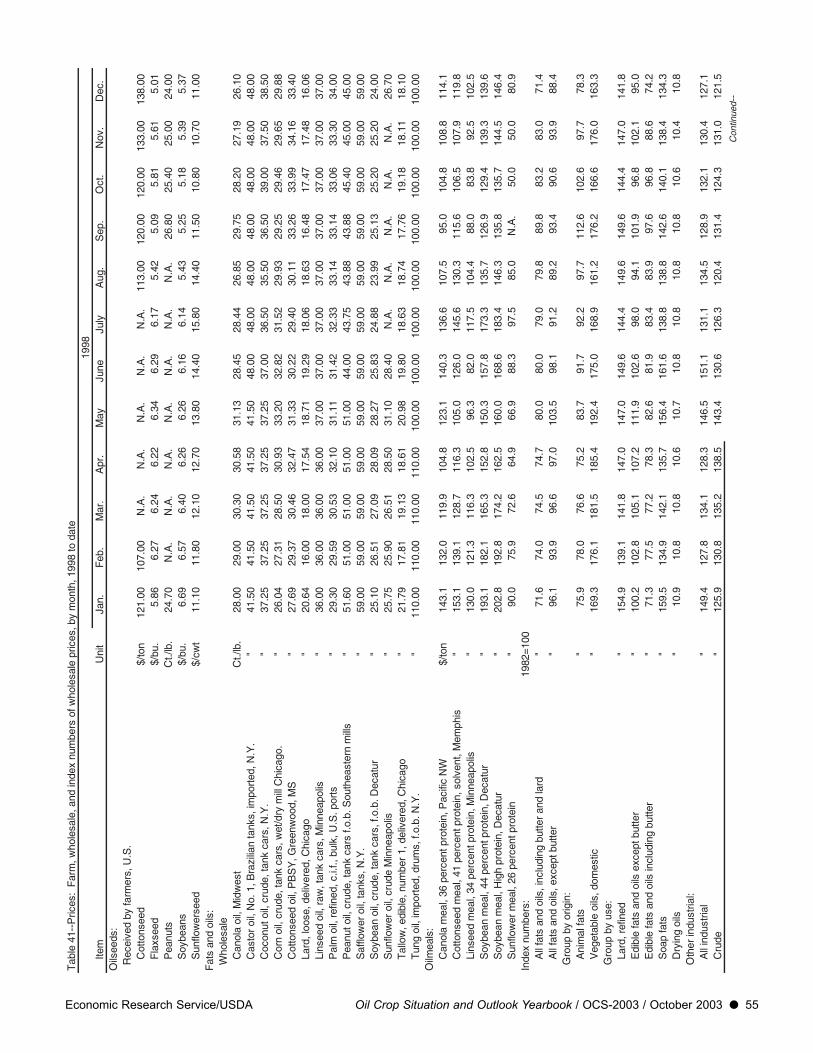
Economic Research Service/USDA Oil Crop Situation and Outlook Yearbook / OCS-2003 / October 2003 l 55
Tab
le41
--P
rices
:F
arm
,who
lesa
le,a
ndin
dex
num
bers
ofw
hole
sale
pric
es,b
ym
onth
,199
8to
date
1998
Item
Uni
tJa
n.F
eb.
Mar
.A
pr.
May
June
July
Aug
.S
ep.
Oct
.N
ov.
Dec
.O
ilsee
ds:
Rec
eive
dby
farm
ers,
U.S
.C
otto
nsee
d$/
ton
121.
0010
7.00
N.A
.N
.A.
N.A
.N
.A.
N.A
.11
3.00
120.
0012
0.00
133.
0013
8.00
Fla
xsee
d$/
bu.
5.86
6.27
6.24
6.22
6.34
6.29
6.17
5.42
5.09
5.81
5.61
5.01
Pea
nuts
Ct./
lb.
24.7
0N
.A.
N.A
.N
.A.
N.A
.N
.A.
N.A
.N
.A.
26.8
025
.40
25.0
024
.00
Soy
bean
s$/
bu.
6.69
6.57
6.40
6.26
6.26
6.16
6.14
5.43
5.25
5.18
5.39
5.37
Sun
flow
erse
ed$/
cwt
11.1
011
.80
12.1
012
.70
13.8
014
.40
15.8
014
.40
11.5
010
.80
10.7
011
.00
Fat
san
doi
ls:
Who
lesa
leC
anol
aoi
l,M
idw
est
Ct./
lb.
28.0
029
.00
30.3
030
.58
31.1
328
.45
28.4
426
.85
29.7
528
.20
27.1
926
.10
Cas
tor
oil,
No.
1,B
razi
lian
tank
s,im
port
ed,N
.Y.
"41
.50
41.5
041
.50
41.5
041
.50
48.0
048
.00
48.0
048
.00
48.0
048
.00
48.0
0C
ocon
utoi
l,cr
ude,
tank
cars
,N.Y
."
37.2
537
.25
37.2
537
.25
37.2
537
.00
36.5
035
.50
36.5
039
.00
37.5
038
.50
Cor
noi
l,cr
ude,
tank
cars
,wet
/dry
mill
Chi
cago
."
26.0
427
.31
28.5
030
.93
33.2
032
.82
31.5
229
.93
29.2
529
.46
29.6
529
.88
Cot
tons
eed
oil,
PB
SY
,Gre
enw
ood,
MS
"27
.69
29.3
730
.46
32.4
731
.33
30.2
229
.40
30.1
133
.26
33.9
934
.16
33.4
0La
rd,l
oose
,del
iver
ed,C
hica
go"
20.6
416
.00
18.0
017
.54
18.7
119
.29
18.0
618
.63
16.4
817
.47
17.4
816
.06
Lins
eed
oil,
raw
,tan
kca
rs,M
inne
apol
is"
36.0
036
.00
36.0
036
.00
37.0
037
.00
37.0
037
.00
37.0
037
.00
37.0
037
.00
Pal
moi
l,re
fined
,c.i.
f.,bu
lk,U
.S.p
orts
"29
.30
29.5
930
.53
32.1
031
.11
31.4
232
.33
33.1
433
.14
33.0
633
.30
34.0
0P
eanu
toil,
crud
e,ta
nkca
rsf.o
.b.S
outh
east
ern
mill
s"
51.6
051
.00
51.0
051
.00
51.0
044
.00
43.7
543
.88
43.8
845
.40
45.0
045
.00
Saf
flow
er o
il,ta
nks,
N.Y
."
59.0
059
.00
59.0
059
.00
59.0
059
.00
59.0
059
.00
59.0
059
.00
59.0
059
.00
Soy
bean
oil,
crud
e,ta
nkca
rs,f
.o.b
.Dec
atur
"25
.10
26.5
127
.09
28.0
928
.27
25.8
324
.88
23.9
925
.13
25.2
025
.20
24.0
0S
unflo
wer
oil,
crud
eM
inne
apol
is"
25.7
525
.90
26.5
128
.50
31.1
028
.40
N.A
.N
.A.
N.A
.N
.A.
N.A
.26
.70
Tal
low
,edi
ble,
num
ber
1,de
liver
ed,C
hica
go"
21.7
917
.81
19.1
318
.61
20.9
819
.80
18.6
318
.74
17.7
619
.18
18.1
118
.10
Tun
goi
l,im
port
ed,d
rum
s,f.o
.b.N
.Y.
"11
0.00
110.
0011
0.00
110.
0010
0.00
100.
0010
0.00
100.
0010
0.00
100.
0010
0.00
100.
00O
ilmea
ls:
Can
ola
mea
l,36
perc
entp
rote
in,P
acifi
cN
W$/
ton
143.
113
2.0
119.
910
4.8
123.
114
0.3
136.
610
7.5
95.0
104.
810
8.8
114.
1C
otto
nsee
dm
eal,
41pe
rcen
tpro
tein
,sol
vent
,Mem
phis
"15
3.1
139.
112
8.7
116.
310
5.0
126.
014
5.6
130.
311
5.6
106.
510
7.9
119.
8Li
nsee
dm
eal,
34pe
rcen
tpro
tein
,Min
neap
olis
"13
0.0
121.
311
6.3
102.
596
.382
.011
7.5
104.
488
.083
.892
.510
2.5
Soy
bean
mea
l,44
perc
entp
rote
in,D
ecat
ur"
193.
118
2.1
165.
315
2.8
150.
315
7.8
173.
313
5.7
126.
912
9.4
139.
313
9.6
Soy
bean
mea
l,H
igh
prot
ein,
Dec
atur
"20
2.8
192.
817
4.2
162.
516
0.0
168.
618
3.4
146.
313
5.8
135.
714
4.5
146.
4S
unflo
wer
mea
l,26
perc
entp
rote
in"
90.0
75.9
72.6
64.9
66.9
88.3
97.5
85.0
N.A
.50
.050
.080
.9In
dex
num
bers
:19
82=1
00A
llfa
tsan
doi
ls,i
nclu
ding
butte
r an
dla
rd"
71.6
74.0
74.5
74.7
80.0
80.0
79.0
79.8
89.8
83.2
83.0
71.4
All
fats
and
oils
,exc
eptb
utte
r"
96.1
93.9
96.6
97.0
103.
598
.191
.289
.293
.490
.693
.988
.4G
roup
byor
igin
:A
nim
alfa
ts"
75.9
78.0
76.6
75.2
83.7
91.7
92.2
97.7
112.
610
2.6
97.7
78.3
Veg
etab
leoi
ls,d
omes
tic"
169.
317
6.1
181.
518
5.4
192.
417
5.0
168.
916
1.2
176.
216
6.6
176.
016
3.3
Gro
upby
use:
Lard
,ref
ined
"15
4.9
139.
114
1.8
147.
014
7.0
149.
614
4.4
149.
614
9.6
144.
414
7.0
141.
8E
dibl
efa
tsan
doi
lsex
cept
butte
r "
100.
210
2.8
105.
110
7.2
111.
910
2.6
98.0
94.1
101.
996
.810
2.1
95.0
Edi
ble
fats
and
oils
incl
udin
gbu
tter
"71
.377
.577
.278
.382
.681
.983
.483
.997
.696
.888
.674
.2S
oap
fats
"15
9.5
134.
914
2.1
135.
715
6.4
161.
613
8.8
138.
814
2.6
140.
113
8.4
134.
3D
ryin
goi
ls"
10.9
10.8
10.8
10.6
10.7
10.8
10.8
10.8
10.8
10.6
10.4
10.8
Oth
er in
dust
rial:
All
indu
stria
l"
149.
412
7.8
134.
112
8.3
146.
515
1.1
131.
113
4.5
128.
913
2.1
130.
412
7.1
Cru
de"
125.
913
0.8
135.
213
8.5
143.
413
0.6
126.
312
0.4
131.
412
4.3
131.
012
1.5
Con
tinue
d--
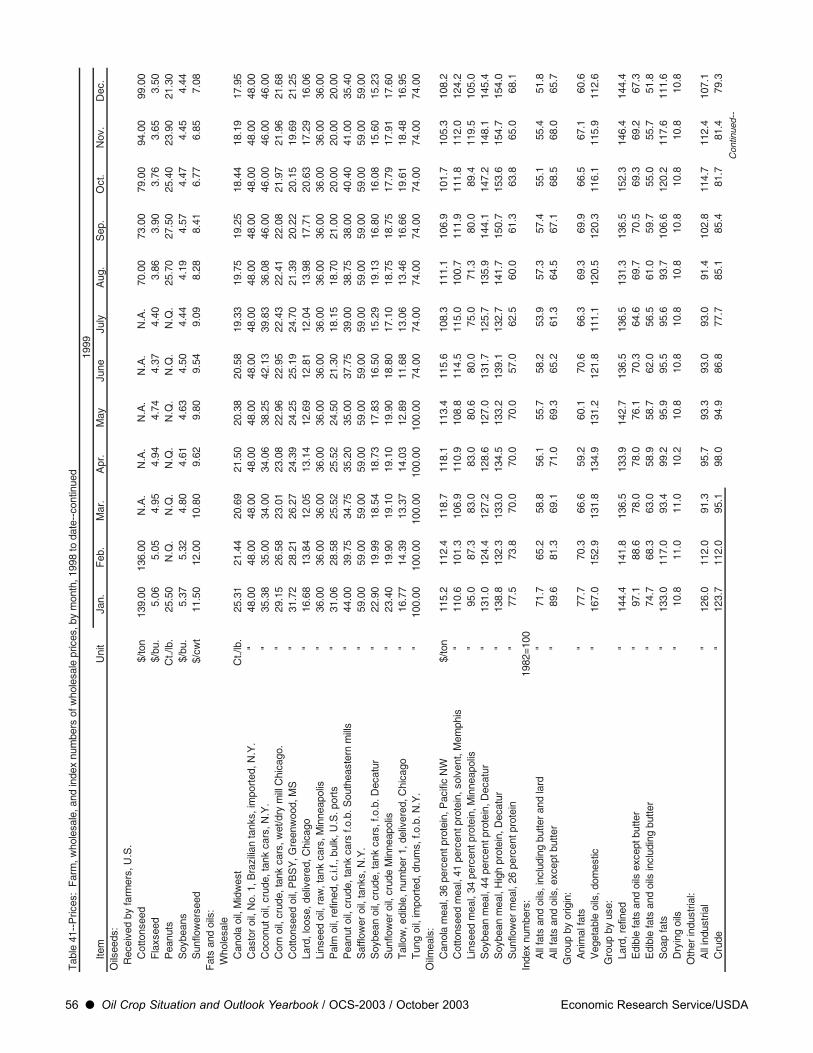
56 l Oil Crop Situation and Outlook Yearbook / OCS-2003 / October 2003 Economic Research Service/USDA
Tab
le41
--P
rices
:F
arm
,who
lesa
le,a
ndin
dex
num
bers
ofw
hole
sale
pric
es,b
ym
onth
,199
8to
date
--co
ntin
ued
1999
Item
Uni
tJa
n.F
eb.
Mar
.A
pr.
May
June
July
Aug
.S
ep.
Oct
.N
ov.
Dec
.O
ilsee
ds:
Rec
eive
dby
farm
ers,
U.S
.C
otto
nsee
d$/
ton
139.
0013
6.00
N.A
.N
.A.
N.A
.N
.A.
N.A
.70
.00
73.0
079
.00
94.0
099
.00
Fla
xsee
d$/
bu.
5.06
5.05
4.95
4.94
4.74
4.37
4.40
3.86
3.90
3.76
3.65
3.50
Pea
nuts
Ct./
lb.
25.5
0N
.Q.
N.Q
.N
.Q.
N.Q
.N
.Q.
N.Q
.25
.70
27.5
025
.40
23.9
021
.30
Soy
bean
s$/
bu.
5.37
5.32
4.80
4.61
4.63
4.50
4.44
4.19
4.57
4.47
4.45
4.44
Sun
flow
erse
ed$/
cwt
11.5
012
.00
10.8
09.
629.
809.
549.
098.
288.
416.
776.
857.
08F
ats
and
oils
:W
hole
sale
Can
ola
oil,
Mid
wes
tC
t./lb
.25
.31
21.4
420
.69
21.5
020
.38
20.5
819
.33
19.7
519
.25
18.4
418
.19
17.9
5C
asto
r oi
l,N
o.1,
Bra
zilia
nta
nks,
impo
rted
,N.Y
."
48.0
048
.00
48.0
048
.00
48.0
048
.00
48.0
048
.00
48.0
048
.00
48.0
048
.00
Coc
onut
oil,
crud
e,ta
nkca
rs,N
.Y.
"35
.38
35.0
034
.00
34.0
638
.25
42.1
339
.83
36.0
846
.00
46.0
046
.00
46.0
0C
orn
oil,
crud
e,ta
nkca
rs,w
et/d
rym
illC
hica
go.
"29
.15
26.5
823
.01
23.0
822
.96
22.9
522
.43
22.4
122
.08
21.9
721
.96
21.6
8C
otto
nsee
doi
l,P
BS
Y,G
reen
woo
d,M
S"
31.7
228
.21
26.2
724
.39
24.2
525
.19
24.7
021
.39
20.2
220
.15
19.6
921
.25
Lard
,loo
se,d
eliv
ered
,Chi
cago
"16
.68
13.8
412
.05
13.1
412
.69
12.8
112
.04
13.9
817
.71
20.6
317
.29
16.0
6Li
nsee
doi
l,ra
w,t
ank
cars
,Min
neap
olis
"36
.00
36.0
036
.00
36.0
036
.00
36.0
036
.00
36.0
036
.00
36.0
036
.00
36.0
0P
alm
oil,
refin
ed,c
.i.f.,
bulk
,U.S
.por
ts"
31.0
628
.58
25.5
225
.52
24.5
021
.30
18.1
518
.70
21.0
020
.00
20.0
020
.00
Pea
nuto
il,cr
ude,
tank
cars
f.o.b
.Sou
thea
ster
nm
ills
"44
.00
39.7
534
.75
35.2
035
.00
37.7
539
.00
38.7
538
.00
40.4
041
.00
35.4
0S
afflo
wer
oil,
tank
s,N
.Y.
"59
.00
59.0
059
.00
59.0
059
.00
59.0
059
.00
59.0
059
.00
59.0
059
.00
59.0
0S
oybe
anoi
l,cr
ude,
tank
cars
,f.o
.b.D
ecat
ur"
22.9
019
.99
18.5
418
.73
17.8
316
.50
15.2
919
.13
16.8
016
.08
15.6
015
.23
Sun
flow
er o
il,cr
ude
Min
neap
olis
"23
.40
19.9
019
.10
19.1
019
.90
18.8
017
.10
18.7
518
.75
17.7
917
.91
17.6
0T
allo
w,e
dibl
e,nu
mbe
r 1,
deliv
ered
,Chi
cago
"16
.77
14.3
913
.37
14.0
312
.89
11.6
813
.06
13.4
616
.66
19.6
118
.48
16.9
5T
ung
oil,
impo
rted
,dru
ms,
f.o.b
.N.Y
."
100.
0010
0.00
100.
0010
0.00
100.
0074
.00
74.0
074
.00
74.0
074
.00
74.0
074
.00
Oilm
eals
:C
anol
am
eal,
36pe
rcen
tpro
tein
,Pac
ific
NW
$/to
n11
5.2
112.
411
8.7
118.
111
3.4
115.
610
8.3
111.
110
6.9
101.
710
5.3
108.
2C
otto
nsee
dm
eal,
41pe
rcen
tpro
tein
,sol
vent
,Mem
phis
"11
0.6
101.
310
6.9
110.
910
8.8
114.
511
5.0
100.
711
1.9
111.
811
2.0
124.
2Li
nsee
dm
eal,
34pe
rcen
tpro
tein
,Min
neap
olis
"95
.087
.383
.083
.080
.680
.075
.071
.380
.089
.411
9.5
105.
0S
oybe
anm
eal,
44pe
rcen
tpro
tein
,Dec
atur
"13
1.0
124.
412
7.2
128.
612
7.0
131.
712
5.7
135.
914
4.1
147.
214
8.1
145.
4S
oybe
anm
eal,
Hig
hpr
otei
n,D
ecat
ur"
138.
813
2.3
133.
013
4.5
133.
213
9.1
132.
714
1.7
150.
715
3.6
154.
715
4.0
Sun
flow
er m
eal,
26pe
rcen
tpro
tein
"77
.573
.870
.070
.070
.057
.062
.560
.061
.363
.865
.068
.1In
dex
num
bers
:19
82=1
00A
llfa
tsan
doi
ls,i
nclu
ding
butte
r an
dla
rd"
71.7
65.2
58.8
56.1
55.7
58.2
53.9
57.3
57.4
55.1
55.4
51.8
All
fats
and
oils
,exc
eptb
utte
r"
89.6
81.3
69.1
71.0
69.3
65.2
61.3
64.5
67.1
68.5
68.0
65.7
Gro
upby
orig
in:
Ani
mal
fats
"77
.770
.366
.659
.260
.170
.666
.369
.369
.966
.567
.160
.6V
eget
able
oils
,dom
estic
"16
7.0
152.
913
1.8
134.
913
1.2
121.
811
1.1
120.
512
0.3
116.
111
5.9
112.
6G
roup
byus
e:La
rd,r
efin
ed"
144.
414
1.8
136.
513
3.9
142.
713
6.5
136.
513
1.3
136.
515
2.3
146.
414
4.4
Edi
ble
fats
and
oils
exce
ptbu
tter
"97
.188
.678
.078
.076
.170
.364
.669
.770
.569
.369
.267
.3E
dibl
efa
tsan
doi
lsin
clud
ing
butte
r"
74.7
68.3
63.0
58.9
58.7
62.0
56.5
61.0
59.7
55.0
55.7
51.8
Soa
pfa
ts"
133.
011
7.0
93.4
99.2
95.9
95.5
95.6
93.7
106.
612
0.2
117.
611
1.6
Dry
ing
oils
"10
.811
.011
.010
.210
.810
.810
.810
.810
.810
.810
.810
.8O
ther
indu
stria
l:A
llin
dust
rial
"12
6.0
112.
091
.395
.793
.393
.093
.091
.410
2.8
114.
711
2.4
107.
1C
rude
"12
3.7
112.
095
.198
.094
.986
.877
.785
.185
.481
.781
.479
.3C
ontin
ued-
-

Economic Research Service/USDA Oil Crop Situation and Outlook Yearbook / OCS-2003 / October 2003 l 57
Tab
le41
--P
rices
:F
arm
,who
lesa
le,a
ndin
dex
num
bers
ofw
hole
sale
pric
es,b
ym
onth
,199
8to
date
--co
ntin
ued
2000
Item
Uni
tJa
n.F
eb.
Mar
.A
pr.
May
June
July
Aug
.S
ep.
Oct
.N
ov.
Dec
.O
ilsee
ds:
Rec
eive
dby
farm
ers,
U.S
.C
otto
nsee
d$/
ton
100.
0011
5.00
N.A
.N
.A.
N.A
.N
.A.
N.A
.78
.00
93.0
010
4.00
108.
0010
9.00
Fla
xsee
d$/
bu.
3.75
3.43
3.70
3.66
3.77
3.64
3.25
3.05
3.10
3.22
3.39
3.45
Pea
nuts
Ct./
lb.
14.9
0N
.A.
N.A
.N
.A.
N.A
.N
.A.
N.A
.N
.A.
28.6
027
.70
26.1
027
.30
Soy
bean
s$/
bu.
4.62
4.79
4.91
5.00
5.19
4.93
4.53
4.45
4.57
4.45
4.55
4.78
Sun
flow
erse
ed$/
cwt
7.34
8.72
8.53
7.93
9.63
8.09
8.16
7.82
6.31
5.76
6.20
6.49
Fat
san
doi
ls:
Who
lesa
leC
anol
aoi
l,M
idw
est
Ct./
lb.
17.3
116
.50
17.2
518
.69
17.7
516
.45
15.5
015
.69
15.6
015
.00
15.3
115
.50
Cas
tor
oil,
No.
1,B
razi
lian
tank
s,im
port
ed,N
.Y.
"47
.00
47.0
047
.00
47.0
047
.00
47.0
047
.00
48.0
048
.00
48.0
048
.00
48.0
0C
ocon
utoi
l,cr
ude,
tank
cars
,N.Y
."
40.8
832
.94
28.8
126
.63
24.2
521
.90
19.6
318
.58
16.4
016
.81
17.5
015
.70
Cor
noi
l,cr
ude,
tank
cars
,wet
/dry
mill
Chi
cago
."
20.8
120
.06
19.2
818
.32
16.6
314
.57
13.5
513
.03
11.8
510
.52
10.3
710
.54
Cot
tons
eed
oil,
PB
SY
,Gre
enw
ood,
MS
"21
.98
22.6
523
.70
24.5
722
.97
21.5
421
.03
20.1
718
.52
18.1
617
.83
17.2
5La
rd,l
oose
,del
iver
ed,C
hica
go"
15.6
512
.38
12.2
311
.94
13.0
412
.64
10.1
910
.35
11.3
413
.04
12.0
612
.14
Lins
eed
oil,
raw
,tan
kca
rs,M
inne
apol
is"
36.0
035
.00
35.0
036
.00
36.0
036
.00
36.0
036
.00
36.0
036
.00
36.0
036
.00
Pal
moi
l,re
fined
,c.i.
f.,bu
lk,U
.S.p
orts
"18
.65
17.6
617
.73
18.2
118
.12
16.5
216
.85
16.2
315
.90
13.1
913
.56
12.7
5P
eanu
toil,
crud
e,ta
nkca
rsf.o
.b.S
outh
east
ern
mill
s"
33.0
032
.50
31.6
033
.00
36.2
536
.00
35.6
335
.00
34.9
034
.63
35.5
036
.40
Saf
flow
er o
il,ta
nks,
N.Y
."
80.0
078
.00
78.0
078
.00
78.0
080
.00
80.0
080
.00
80.0
080
.00
80.0
080
.00
Soy
bean
oil,
crud
e,ta
nkca
rs,f
.o.b
.Dec
atur
"15
.63
15.0
916
.21
17.5
216
.75
15.6
514
.70
14.3
414
.24
13.5
013
.37
13.1
2S
unflo
wer
oil,
crud
eM
inne
apol
is"
17.9
116
.85
17.3
118
.07
16.9
315
.59
14.6
814
.64
14.9
314
.40
14.2
514
.54
Tal
low
,edi
ble,
num
ber
1,de
liver
ed,C
hica
go"
14.1
912
.59
12.3
111
.50
11.6
810
.81
9.58
9.78
11.0
011
.98
10.8
813
.59
Tun
goi
l,im
port
ed,d
rum
s,f.o
.b.N
.Y.
"59
.00
59.0
059
.00
59.0
059
.00
59.0
059
.00
59.0
059
.00
59.0
059
.00
59.0
0O
ilmea
ls:
Can
ola
mea
l,36
perc
entp
rote
in,P
acifi
cN
W$/
ton
119.
012
3.7
122.
911
6.9
121.
912
2.5
118.
911
5.6
128.
212
2.6
132.
314
2.3
Cot
tons
eed
mea
l,41
perc
entp
rote
in,s
olve
nt,M
emph
is"
126.
913
0.5
129.
412
5.0
123.
313
0.6
131.
913
0.5
153.
115
0.0
141.
916
0.8
Lins
eed
mea
l,34
perc
entp
rote
in,M
inne
apol
is"
91.8
92.6
108.
811
1.0
101.
010
6.3
115.
110
6.5
95.7
110.
011
3.8
121.
3S
oybe
anm
eal,
44pe
rcen
tpro
tein
,Dec
atur
"15
5.0
163.
616
6.6
168.
118
0.1
170.
215
6.8
151.
416
6.9
166.
017
3.7
187.
9S
oybe
anm
eal,
Hig
hpr
otei
n,D
ecat
ur"
163.
417
0.5
175.
517
7.5
189.
317
7.5
163.
415
7.5
174.
617
1.5
180.
019
5.7
Sun
flow
er m
eal,
26pe
rcen
tpro
tein
"73
.870
.277
.578
.470
.287
.587
.579
.080
.083
.085
.088
.8In
dex
num
bers
:19
82=1
00A
llfa
tsan
doi
ls,i
nclu
ding
butte
r an
dla
rd"
49.6
47.5
49.3
52.1
54.2
55.4
51.4
49.4
50.9
50.4
57.9
53.8
All
fats
and
oils
,exc
eptb
utte
r"
62.4
59.0
59.9
62.3
62.3
60.2
56.5
53.2
56.5
55.8
52.1
51.9
Gro
upby
orig
in:
Ani
mal
fats
"57
.752
.955
.757
.863
.268
.763
.061
.961
.061
.881
.973
.9V
eget
able
oils
,dom
estic
"10
8.7
108.
911
1.2
119.
811
8.8
113.
010
6.4
99.2
108.
110
4.8
97.8
95.5
Gro
upby
use:
Lard
,ref
ined
"14
4.4
131.
312
6.6
126.
012
6.0
126.
012
8.6
128.
612
8.6
128.
612
6.0
126.
0E
dibl
efa
tsan
doi
lsex
cept
butte
r "
64.3
63.2
64.4
68.8
68.3
65.0
61.7
57.7
62.5
61.0
56.8
55.6
Edi
ble
fats
and
oils
incl
udin
gbu
tter
"49
.949
.251
.555
.558
.059
.455
.453
.355
.154
.264
.558
.8S
oap
fats
"10
3.9
87.2
87.9
84.1
86.3
87.0
78.0
75.7
76.1
78.2
73.4
76.7
Dry
ing
oils
"10
.810
.810
.810
.810
.810
.810
.89.
39.
69.
69.
09.
3O
ther
indu
stria
l:A
llin
dust
rial
"10
0.4
85.7
86.3
83.0
84.9
85.5
77.6
74.3
74.9
76.8
72.0
75.2
Cru
de"
76.1
76.0
77.6
84.2
83.1
78.3
72.6
67.0
74.3
71.7
65.9
63.8
Con
tinue
d--
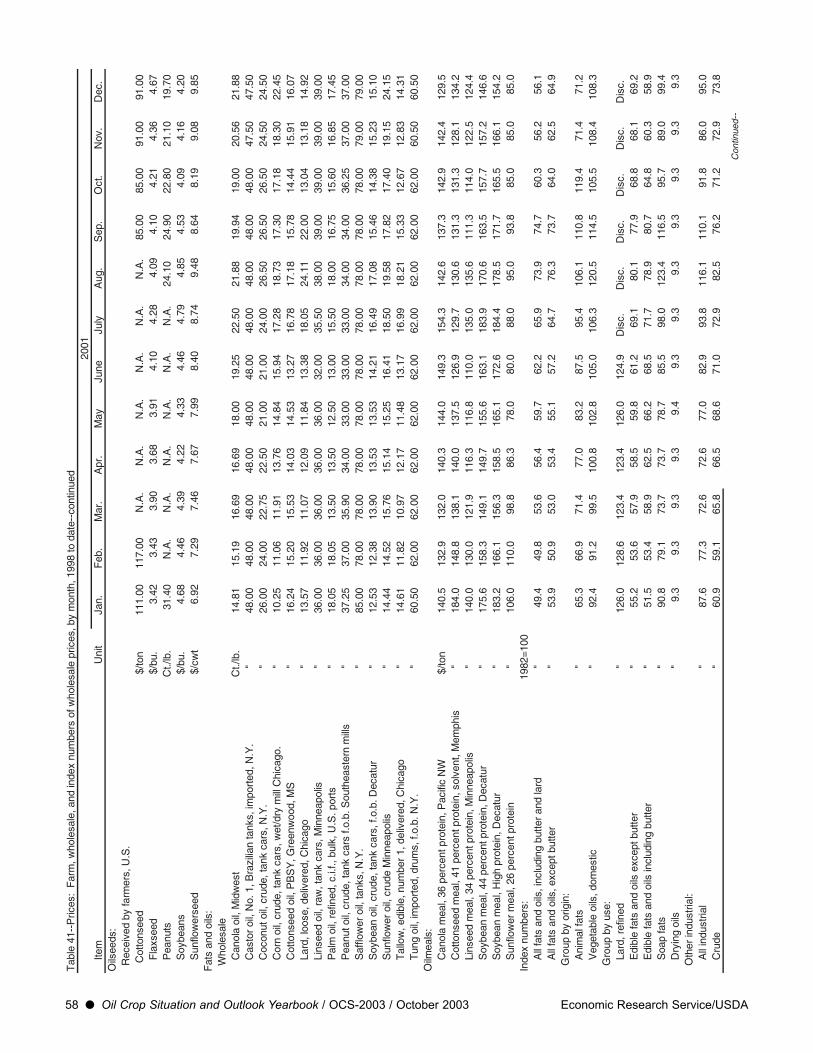
58 l Oil Crop Situation and Outlook Yearbook / OCS-2003 / October 2003 Economic Research Service/USDA
Tab
le41
--P
rices
:F
arm
,who
lesa
le,a
ndin
dex
num
bers
ofw
hole
sale
pric
es,b
ym
onth
,199
8to
date
--co
ntin
ued
2001
Item
Uni
tJa
n.F
eb.
Mar
.A
pr.
May
June
July
Aug
.S
ep.
Oct
.N
ov.
Dec
.O
ilsee
ds:
Rec
eive
dby
farm
ers,
U.S
.C
otto
nsee
d$/
ton
111.
0011
7.00
N.A
.N
.A.
N.A
.N
.A.
N.A
.N
.A.
85.0
085
.00
91.0
091
.00
Fla
xsee
d$/
bu.
3.42
3.43
3.90
3.68
3.91
4.10
4.28
4.09
4.10
4.21
4.36
4.67
Pea
nuts
Ct./
lb.
31.4
0N
.A.
N.A
.N
.A.
N.A
.N
.A.
N.A
.24
.10
24.9
022
.80
21.1
019
.70
Soy
bean
s$/
bu.
4.68
4.46
4.39
4.22
4.33
4.46
4.79
4.85
4.53
4.09
4.16
4.20
Sun
flow
erse
ed$/
cwt
6.92
7.29
7.46
7.67
7.99
8.40
8.74
9.48
8.64
8.19
9.08
9.85
Fat
san
doi
ls:
Who
lesa
leC
anol
aoi
l,M
idw
est
Ct./
lb.
14.8
115
.19
16.6
916
.69
18.0
019
.25
22.5
021
.88
19.9
419
.00
20.5
621
.88
Cas
tor
oil,
No.
1,B
razi
lian
tank
s,im
port
ed,N
.Y.
"48
.00
48.0
048
.00
48.0
048
.00
48.0
048
.00
48.0
048
.00
48.0
047
.50
47.5
0C
ocon
utoi
l,cr
ude,
tank
cars
,N.Y
."
26.0
024
.00
22.7
522
.50
21.0
021
.00
24.0
026
.50
26.5
026
.50
24.5
024
.50
Cor
noi
l,cr
ude,
tank
cars
,wet
/dry
mill
Chi
cago
."
10.2
511
.06
11.9
113
.76
14.8
415
.94
17.2
818
.73
17.3
017
.18
18.3
022
.45
Cot
tons
eed
oil,
PB
SY
,Gre
enw
ood,
MS
"16
.24
15.2
015
.53
14.0
314
.53
13.2
716
.78
17.1
815
.78
14.4
415
.91
16.0
7La
rd,l
oose
,del
iver
ed,C
hica
go"
13.5
711
.92
11.0
712
.09
11.8
413
.38
18.0
524
.11
22.0
013
.04
13.1
814
.92
Lins
eed
oil,
raw
,tan
kca
rs,M
inne
apol
is"
36.0
036
.00
36.0
036
.00
36.0
032
.00
35.5
038
.00
39.0
039
.00
39.0
039
.00
Pal
moi
l,re
fined
,c.i.
f.,bu
lk,U
.S.p
orts
"18
.05
18.0
513
.50
13.5
012
.50
13.0
015
.50
18.0
016
.75
15.6
016
.85
17.4
5P
eanu
toil,
crud
e,ta
nkca
rsf.o
.b.S
outh
east
ern
mill
s"
37.2
537
.00
35.9
034
.00
33.0
033
.00
33.0
034
.00
34.0
036
.25
37.0
037
.00
Saf
flow
er o
il,ta
nks,
N.Y
."
85.0
078
.00
78.0
078
.00
78.0
078
.00
78.0
078
.00
78.0
078
.00
79.0
079
.00
Soy
bean
oil,
crud
e,ta
nkca
rs,f
.o.b
.Dec
atur
"12
.53
12.3
813
.90
13.5
313
.53
14.2
116
.49
17.0
815
.46
14.3
815
.23
15.1
0S
unflo
wer
oil,
crud
eM
inne
apol
is"
14.4
414
.52
15.7
615
.14
15.2
516
.41
18.5
019
.58
17.8
217
.40
19.1
524
.15
Tal
low
,edi
ble,
num
ber
1,de
liver
ed,C
hica
go"
14.6
111
.82
10.9
712
.17
11.4
813
.17
16.9
918
.21
15.3
312
.67
12.8
314
.31
Tun
goi
l,im
port
ed,d
rum
s,f.o
.b.N
.Y.
"60
.50
62.0
062
.00
62.0
062
.00
62.0
062
.00
62.0
062
.00
62.0
060
.50
60.5
0O
ilmea
ls:
Can
ola
mea
l,36
perc
entp
rote
in,P
acifi
cN
W$/
ton
140.
513
2.9
132.
014
0.3
144.
014
9.3
154.
314
2.6
137.
314
2.9
142.
412
9.5
Cot
tons
eed
mea
l,41
perc
entp
rote
in,s
olve
nt,M
emph
is"
184.
014
8.8
138.
114
0.0
137.
512
6.9
129.
713
0.6
131.
313
1.3
128.
113
4.2
Lins
eed
mea
l,34
perc
entp
rote
in,M
inne
apol
is"
140.
013
0.0
121.
911
6.3
116.
811
0.0
135.
013
5.6
111.
311
4.0
122.
512
4.4
Soy
bean
mea
l,44
perc
entp
rote
in,D
ecat
ur"
175.
615
8.3
149.
114
9.7
155.
616
3.1
183.
917
0.6
163.
515
7.7
157.
214
6.6
Soy
bean
mea
l,H
igh
prot
ein,
Dec
atur
"18
3.2
166.
115
6.3
158.
516
5.1
172.
618
4.4
178.
517
1.7
165.
516
6.1
154.
2S
unflo
wer
mea
l,26
perc
entp
rote
in"
106.
011
0.0
98.8
86.3
78.0
80.0
88.0
95.0
93.8
85.0
85.0
85.0
Inde
xnu
mbe
rs:
1982
=100
All
fats
and
oils
,inc
ludi
ngbu
tter
and
lard
"49
.449
.853
.656
.459
.762
.265
.973
.974
.760
.356
.256
.1A
llfa
tsan
doi
ls,e
xcep
tbut
ter
"53
.950
.953
.053
.455
.157
.264
.776
.373
.764
.062
.564
.9G
roup
byor
igin
:A
nim
alfa
ts"
65.3
66.9
71.4
77.0
83.2
87.5
95.4
106.
111
0.8
119.
471
.471
.2V
eget
able
oils
,dom
estic
"92
.491
.299
.510
0.8
102.
810
5.0
106.
312
0.5
114.
510
5.5
108.
410
8.3
Gro
upby
use:
Lard
,ref
ined
"12
6.0
128.
612
3.4
123.
412
6.0
124.
9D
isc.
Dis
c.D
isc.
Dis
c.D
isc.
Dis
c.E
dibl
efa
tsan
doi
lsex
cept
butte
r"
55.2
53.6
57.9
58.5
59.8
61.2
69.1
80.1
77.9
68.8
68.1
69.2
Edi
ble
fats
and
oils
incl
udin
gbu
tter
"51
.553
.458
.962
.566
.268
.571
.778
.980
.764
.860
.358
.9S
oap
fats
"90
.879
.173
.773
.778
.785
.598
.012
3.4
116.
595
.789
.099
.4D
ryin
goi
ls"
9.3
9.3
9.3
9.3
9.4
9.3
9.3
9.3
9.3
9.3
9.3
9.3
Oth
er in
dust
rial:
All
indu
stria
l"
87.6
77.3
72.6
72.6
77.0
82.9
93.8
116.
111
0.1
91.8
86.0
95.0
Cru
de"
60.9
59.1
65.8
66.5
68.6
71.0
72.9
82.5
76.2
71.2
72.9
73.8
Con
tinue
d--

Economic Research Service/USDA Oil Crop Situation and Outlook Yearbook / OCS-2003 / October 2003 l 59
Tab
le41
--P
rices
:F
arm
,who
lesa
le,a
ndin
dex
num
bers
ofw
hole
sale
pric
es,b
ym
onth
,199
8to
date
--co
ntin
ued
2002
Item
Uni
tJa
n.F
eb.
Mar
.A
pr.
May
June
July
Aug
.S
ep.
Oct
.N
ov.
Dec
.O
ilsee
ds:
Rec
eive
dby
farm
ers,
U.S
.C
otto
nsee
d$/
ton
96.0
010
4.00
N.A
.N
.A.
N.A
.N
.A.
N.A
.N
.A.
95.0
010
0.00
100.
0010
1.00
Fla
xsee
d$/
bu.
4.22
4.75
4.75
4.80
5.02
5.29
5.38
5.27
5.55
5.76
6.04
5.99
Pea
nuts
Ct./
lb.
13.7
010
.70
N.A
.N
.A.
N.A
.N
.A.
N.A
.N
.A.
19.9
017
.90
18.0
017
.20
Soy
bean
s$/
bu.
4.22
4.22
4.38
4.47
4.64
4.88
5.35
5.53
5.39
5.20
5.46
5.46
Sun
flow
erse
ed$/
cwt
9.52
10.0
010
.20
10.5
010
.50
11.8
013
.80
12.9
013
.10
12.0
012
.00
12.4
0F
ats
and
oils
:W
hole
sale
Can
ola
oil,
Mid
wes
tC
t./lb
.20
.81
21.3
127
.44
21.9
421
.95
23.1
925
.06
28.4
529
.81
30.7
534
.19
41.1
9C
asto
r oi
l,N
o.1,
Indi
anta
nks,
impo
rted
,N.Y
."
47.5
047
.50
47.5
047
.50
47.5
047
.50
47.0
047
.00
47.0
047
.00
47.0
047
.00
Coc
onut
oil,
crud
e,ta
nkca
rs,N
.Y.
"16
.38
17.3
817
.25
18.7
520
.05
21.1
321
.06
21.3
528
.50
28.2
527
.13
26.0
0C
orn
oil,
crud
e,ta
nkca
rs,w
et/d
rym
illC
hica
go.
"20
.54
18.3
518
.37
17.7
017
.00
17.6
019
.10
21.7
021
.40
22.4
526
.90
28.2
5C
otto
nsee
doi
l,P
BS
Y,G
reen
woo
d,M
S"
16.3
815
.89
16.7
716
.98
17.9
519
.48
21.3
022
.32
22.3
226
.84
36.9
046
.89
Lard
,loo
se,d
eliv
ered
,Chi
cago
"12
.69
12.5
013
.07
12.4
211
.38
14.6
414
.60
15.0
015
.21
14.3
916
.28
18.4
2Li
nsee
doi
l,ra
w,t
ank
cars
,Min
neap
olis
"39
.00
39.0
039
.00
39.0
039
.65
40.3
540
.00
38.0
041
.00
31.7
541
.00
41.0
0P
alm
oil,
refin
ed,c
.i.f.,
bulk
,U.S
.por
ts"
17.7
517
.06
17.3
017
.75
18.8
521
.44
20.5
021
.85
32.0
031
.75
31.7
531
.75
Pea
nuto
il,cr
ude,
tank
cars
f.o.b
.Sou
thea
ster
nm
ills
"35
.00
30.2
528
.20
28.7
528
.80
31.0
034
.25
35.2
036
.25
36.2
537
.00
37.0
0S
afflo
wer
oil,
tank
s,N
.Y.
"79
.00
79.0
079
.00
79.0
079
.00
79.0
079
.00
79.0
079
.00
79.0
079
.00
79.0
0S
oybe
anoi
l,cr
ude,
tank
cars
,f.o
.b.D
ecat
ur"
14.8
214
.15
14.7
515
.30
15.9
817
.69
19.1
220
.61
20.3
220
.75
23.0
022
.60
Sun
flow
er o
il,cr
ude
Min
neap
olis
"23
.64
23.4
223
.54
23.3
023
.44
25.1
8N
.A.
N.A
.29
.28
29.8
233
.90
33.6
0T
allo
w,e
dibl
e,nu
mbe
r 1,
deliv
ered
,Chi
cago
"12
.49
13.0
013
.96
13.2
612
.38
16.1
415
.45
15.1
014
.82
14.7
317
.02
19.2
5T
ung
oil,
impo
rted
,dru
ms,
f.o.b
.N.Y
."
60.5
044
.50
44.5
042
.00
40.0
040
.00
40.0
040
.00
40.0
043
.75
45.0
045
.00
Oilm
eals
:C
anol
am
eal,
36pe
rcen
tpro
tein
,Pac
ific
NW
$/to
n13
5.3
137.
315
0.2
146.
614
1.9
142.
115
3.4
149.
114
9.3
131.
513
4.7
143.
1C
otto
nsee
dm
eal,
41pe
rcen
tpro
tein
,sol
vent
,Mem
phis
"13
3.1
125.
013
1.9
124.
312
0.9
137.
515
1.5
159.
815
6.4
150.
115
0.0
156.
4Li
nsee
dm
eal,
34pe
rcen
tpro
tein
,Min
neap
olis
"12
3.7
119.
211
4.5
112.
811
2.5
113.
512
7.5
143.
812
7.1
114.
011
3.1
112.
5S
oybe
anm
eal,
Hig
hpr
otei
n,D
ecat
ur"
158.
015
3.1
160.
516
1.6
164.
317
0.3
187.
518
6.3
185.
516
8.2
163.
216
3.6
Sun
flow
er m
eal,
26pe
rcen
tpro
tein
"83
.081
.785
.088
.090
.090
.010
0.0
N.A
.N
.A.
N.A
.95
.095
.0In
dex
num
bers
:19
82=1
00A
llfa
tsan
doi
ls,i
nclu
ding
butte
r an
dla
rd"
57.1
53.4
55.0
54.3
N.A
.57
.558
.561
.062
.563
.466
.971
.0A
llfa
tsan
doi
ls,e
xcep
tbut
ter
"63
.560
.762
.562
.5N
.A.
71.4
74.1
78.9
82.9
82.4
89.0
94.0
Gro
upby
orig
in:
Ani
mal
fats
"72
.667
.170
.268
.6N
.A.
67.0
68.8
67.7
67.0
69.2
70.4
77.6
Veg
etab
leoi
ls,d
omes
tic"
109.
910
3.7
105.
010
5.3
N.A
.12
1.0
121.
813
4.6
142.
114
1.9
154.
715
9.1
Gro
upby
use:
Edi
ble
fats
and
oils
exce
ptbu
tter
"69
.565
.266
.966
.9N
.A.
75.9
77.9
85.2
89.7
89.9
97.3
100.
4E
dibl
efa
tsan
doi
lsin
clud
ing
butte
r"
61.3
56.5
58.0
57.3
N.A
.59
.459
.763
.164
.366
.069
.472
.6S
oap
fats
"87
.488
.694
.093
.0N
.A.
111.
812
0.4
118.
512
4.5
118.
912
8.7
146.
5D
ryin
goi
ls"
9.3
9.7
9.3
9.6
N.A
.9.
39.
49.
39.
310
.010
.010
.6O
ther
indu
stria
l:A
llin
dust
rial
"84
.886
.390
.490
.0N
.A.
105.
511
3.1
111.
211
6.5
112.
312
0.7
136.
6C
rude
"75
.170
.171
.272
.373
.884
.384
.593
.598
.497
.90
110.
3011
4.10
Con
tinue
d--

60 l Oil Crop Situation and Outlook Yearbook / OCS-2003 / October 2003 Economic Research Service/USDA
Tab
le41
--P
rices
:F
arm
,who
lesa
le,a
ndin
dex
num
bers
ofw
hole
sale
pric
es,b
ym
onth
,199
8to
date
--co
ntin
ued
2003
Item
Uni
tJa
n.F
eb.
Mar
.A
pr.
May
June
July
Aug
.S
ep.
Oct
.N
ov.
Dec
.O
ilsee
ds:
Rec
eive
dby
farm
ers,
U.S
.C
otto
nsee
d$/
ton
105.
0011
1.00
N.A
.N
.A.
N.A
.N
.A.
N.A
.N
.A.
100.
00N
.A.
N.A
.N
.A.
Fla
xsee
d$/
bu.
5.70
6.19
6.48
6.58
6.04
6.04
6.38
5.30
5.45
N.A
.N
.A.
N.A
.P
eanu
tsC
t./lb
.19
.10
19.0
022
.60
18.4
019
.60
17.7
0N
.A.
N.A
.N
.A.
N.A
.N
.A.
N.A
.S
oybe
ans
$/bu
.5.
515.
555.
595.
826.
076.
095.
825.
686.
04N
.A.
N.A
.N
.A.
Sun
flow
erse
ed$/
cwt
12.1
012
.50
12.5
012
.50
12.2
012
.00
11.8
010
.90
11.4
0N
.A.
N.A
.N
.A.
Fat
san
doi
ls:
Who
lesa
leC
anol
aoi
l,M
idw
est
Ct./
lb.
24.3
028
.88
27.6
327
.44
28.1
327
.13
26.5
626
.30
28.4
4N
.A.
N.A
.N
.A.
Cas
tor
oil,
No.
1,In
dian
tank
s,im
port
ed,N
.Y.
"47
.00
47.0
047
.00
47.0
047
.00
47.0
047
.00
47.0
047
.00
N.A
.N
.A.
N.A
.C
ocon
utoi
l,cr
ude,
tank
cars
,N.Y
."
26.0
026
.00
24.6
024
.50
24.5
025
.00
25.0
025
.00
25.0
0N
.A.
N.A
.N
.A.
Cor
noi
l,cr
ude,
tank
cars
,wet
/dry
mill
Chi
cago
."
29.3
028
.90
27.2
027
.50
29.1
030
.15
29.9
030
.68
27.7
1N
.A.
N.A
.N
.A.
Cot
tons
eed
oil,
PB
SY
,Gre
enw
ood,
MS
"49
.82
49.9
047
.52
44.5
742
.33
28.6
924
.38
25.5
129
.64
N.A
.N
.A.
N.A
.La
rd,l
oose
,del
iver
ed,C
hica
go"
18.6
117
.11
16.8
516
.72
17.2
918
.90
18.9
320
.08
23.9
8N
.A.
N.A
.N
.A.
Lins
eed
oil,
raw
,tan
kca
rs,M
inne
apol
is"
41.0
041
.00
41.0
041
.00
41.1
941
.75
41.7
541
.75
42.0
0N
.A.
N.A
.N
.A.
Pal
moi
l,re
fined
,c.i.
f.,bu
lk,U
.S.p
orts
"31
.75
31.7
531
.35
31.2
531
.25
31.7
532
.25
32.2
532
.25
N.A
.N
.A.
N.A
.P
eanu
toil,
crud
e,ta
nkca
rsf.o
.b.S
outh
east
ern
mill
s"
45.7
546
.00
47.0
050
.25
52.7
556
.60
58.2
560
.00
60.6
7N
.A.
N.A
.N
.A.
Saf
flow
er o
il,ta
nks,
N.Y
."
79.0
079
.00
79.0
079
.00
79.0
079
.00
79.0
079
.00
79.0
0N
.A.
N.A
.N
.A.
Soy
bean
oil,
crud
e,ta
nkca
rs,f
.o.b
.Dec
atur
"21
.50
21.2
021
.55
22.4
023
.20
22.9
021
.80
20.4
023
.22
N.A
.N
.A.
N.A
.S
unflo
wer
oil,
crud
eM
inne
apol
is"
32.5
032
.60
33.1
033
.70
34.4
033
.64
33.5
032
.65
33.9
2N
.A.
N.A
.N
.A.
Tal
low
,edi
ble,
num
ber
1,de
liver
ed,C
hica
go"
19.2
217
.38
17.4
517
.48
17.4
118
.58
17.4
817
.57
20.0
5N
.A.
N.A
.N
.A.
Tun
goi
l,im
port
ed,d
rum
s,f.o
.b.N
.Y.
"45
.00
45.0
052
.80
84.7
585
.00
85.0
085
.00
85.0
085
.00
N.A
.N
.A.
N.A
.O
ilmea
ls:
Can
ola
mea
l,36
perc
entp
rote
in,P
acifi
cN
W$/
ton
154.
115
5.8
147.
614
5.6
148.
514
7.0
137.
113
5.5
159.
2N
.A.
N.A
.N
.A.
Cot
tons
eed
mea
l,41
perc
entp
rote
in,s
olve
nt,M
emph
is"
157.
414
3.6
142.
414
2.4
131.
813
1.5
143.
015
1.7
153.
2N
.A.
N.A
.N
.A.
Lins
eed
mea
l,34
perc
entp
rote
in,M
inne
apol
is"
118.
412
0.1
133.
012
6.7
125.
012
7.3
129.
113
0.6
125.
2N
.A.
N.A
.N
.A.
Soy
bean
mea
l,H
igh
prot
ein,
Dec
atur
"16
7.4
176.
817
5.4
182.
119
5.4
191.
918
7.3
189.
721
8.0
N.A
.N
.A.
N.A
.S
unflo
wer
mea
l,26
perc
entp
rote
in"
85.0
N.A
.N
.A.
N.A
.N
.A.
N.A
.N
.A.
N.A
.N
.A.
N.A
.N
.A.
N.A
.In
dex
num
bers
:19
82=1
00A
llfa
tsan
doi
ls,i
nclu
ding
butte
r an
dla
rd"
72.8
69.8
71.7
69.2
69.6
78.8
87.6
N.A
.N
.A.
N.A
.N
.A.
N.A
.A
llfa
tsan
doi
ls,e
xcep
tbut
ter
"97
.493
.095
.691
.191
.810
7.6
119.
0N
.A.
N.A
.N
.A.
N.A
.N
.A.
Gro
upby
orig
in:
Ani
mal
fats
"79
.675
.978
.076
.174
.978
.277
.1N
.A.
N.A
.N
.A.
N.A
.N
.A.
Veg
etab
leoi
ls,d
omes
tic"
157.
216
3.3
161.
115
4.1
157.
919
1.2
232.
1N
.A.
N.A
.N
.A.
N.A
.N
.A.
Gro
upby
use:
Edi
ble
fats
and
oils
exce
ptbu
tter
"10
3.3
99.7
101.
797
.599
.711
9.9
141.
2N
.A.
N.A
.N
.A.
N.A
.N
.A.
Edi
ble
fats
and
oils
incl
udin
gbu
tter
"73
.971
.572
.970
.972
.082
.596
.3N
.A.
N.A
.N
.A.
N.A
.N
.A.
Soa
pfa
ts"
156.
114
3.9
152.
014
1.3
135.
914
7.3
130.
1N
.A.
N.A
.N
.A.
N.A
.N
.A.
Dry
ing
oils
"10
.010
.010
.010
.010
.010
.09.
0N
.A.
N.A
.N
.A.
N.A
.N
.A.
Oth
er in
dust
rial:
All
indu
stria
l"
144.
313
3.8
140.
813
1.5
126.
913
6.7
121.
0N
.A.
N.A
.N
.A.
N.A
.N
.A.
Cru
de"
117.
811
2.8
110.
210
9.9
112.
813
9.5
137.
8N
.A.
N.A
.N
.A.
N.A
.N
.A.
N.Q
.=N
oqu
ota.
N.A
.=N
otav
aila
ble.
Sou
rces
:Che
mic
alM
arke
ting
Rep
orte
r,W
allS
tree
tJou
rnal
,and
repo
rts
ofth
eN
atio
nalA
gric
ultu
ralS
tatis
tics
Ser
vice
,Agr
icul
tura
lMar
ketin
gS
ervi
ce,a
ndB
urea
uof
Labo
rS
tatis
tics.
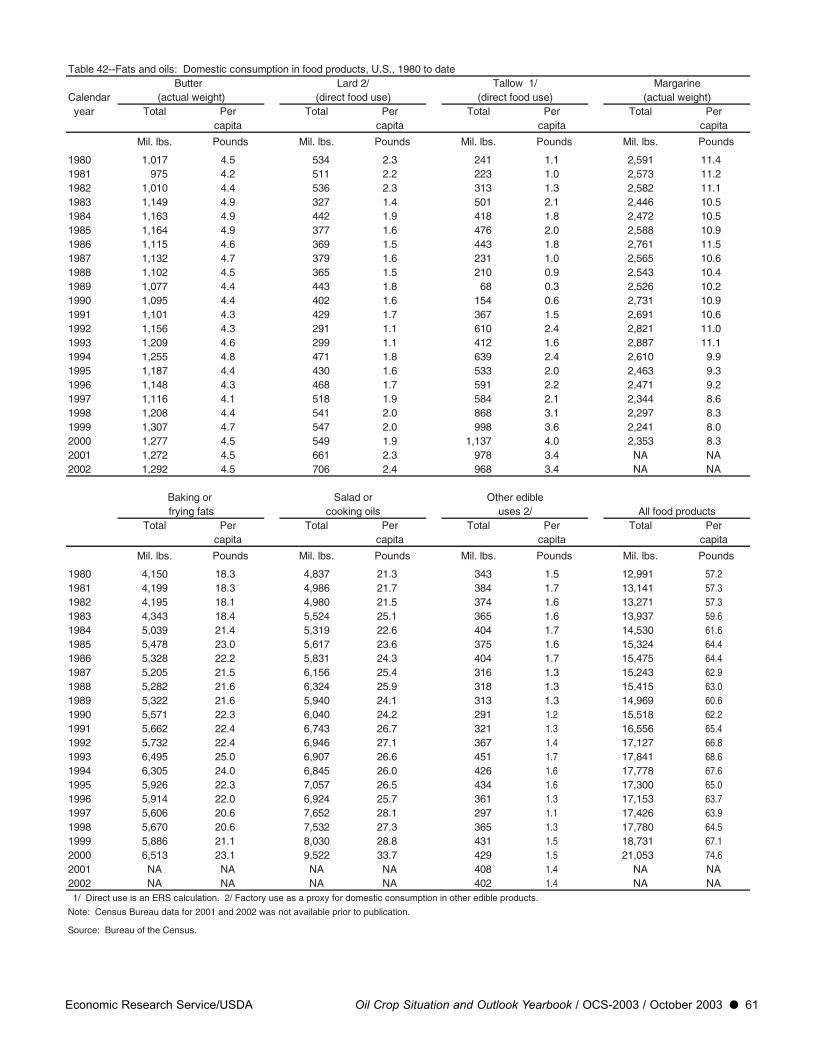
Economic Research Service/USDA Oil Crop Situation and Outlook Yearbook / OCS-2003 / October 2003 l 61
Table 42--Fats and oils: Domestic consumption in food products, U.S., 1980 to dateButter Lard 2/ Tallow 1/ Margarine
Calendar (actual weight) (direct food use) (direct food use) (actual weight) year Total Per Total Per Total Per Total Per
capita capita capita capita
Mil. lbs. Pounds Mil. lbs. Pounds Mil. lbs. Pounds Mil. lbs. Pounds
1980 1,017 4.5 534 2.3 241 1.1 2,591 11.41981 975 4.2 511 2.2 223 1.0 2,573 11.21982 1,010 4.4 536 2.3 313 1.3 2,582 11.11983 1,149 4.9 327 1.4 501 2.1 2,446 10.51984 1,163 4.9 442 1.9 418 1.8 2,472 10.51985 1,164 4.9 377 1.6 476 2.0 2,588 10.91986 1,115 4.6 369 1.5 443 1.8 2,761 11.51987 1,132 4.7 379 1.6 231 1.0 2,565 10.61988 1,102 4.5 365 1.5 210 0.9 2,543 10.41989 1,077 4.4 443 1.8 68 0.3 2,526 10.21990 1,095 4.4 402 1.6 154 0.6 2,731 10.91991 1,101 4.3 429 1.7 367 1.5 2,691 10.61992 1,156 4.3 291 1.1 610 2.4 2,821 11.01993 1,209 4.6 299 1.1 412 1.6 2,887 11.11994 1,255 4.8 471 1.8 639 2.4 2,610 9.91995 1,187 4.4 430 1.6 533 2.0 2,463 9.31996 1,148 4.3 468 1.7 591 2.2 2,471 9.21997 1,116 4.1 518 1.9 584 2.1 2,344 8.61998 1,208 4.4 541 2.0 868 3.1 2,297 8.31999 1,307 4.7 547 2.0 998 3.6 2,241 8.02000 1,277 4.5 549 1.9 1,137 4.0 2,353 8.32001 1,272 4.5 661 2.3 978 3.4 NA NA2002 1,292 4.5 706 2.4 968 3.4 NA NA
Baking or Salad or Other ediblefrying fats cooking oils uses 2/ All food products
Total Per Total Per Total Per Total Percapita capita capita capita
Mil. lbs. Pounds Mil. lbs. Pounds Mil. lbs. Pounds Mil. lbs. Pounds
1980 4,150 18.3 4,837 21.3 343 1.5 12,991 57.21981 4,199 18.3 4,986 21.7 384 1.7 13,141 57.31982 4,195 18.1 4,980 21.5 374 1.6 13,271 57.31983 4,343 18.4 5,524 25.1 365 1.6 13,937 59.61984 5,039 21.4 5,319 22.6 404 1.7 14,530 61.61985 5,478 23.0 5,617 23.6 375 1.6 15,324 64.41986 5,328 22.2 5,831 24.3 404 1.7 15,475 64.41987 5,205 21.5 6,156 25.4 316 1.3 15,243 62.91988 5,282 21.6 6,324 25.9 318 1.3 15,415 63.01989 5,322 21.6 5,940 24.1 313 1.3 14,969 60.61990 5,571 22.3 6,040 24.2 291 1.2 15,518 62.21991 5,662 22.4 6,743 26.7 321 1.3 16,556 65.41992 5,732 22.4 6,946 27.1 367 1.4 17,127 66.81993 6,495 25.0 6,907 26.6 451 1.7 17,841 68.61994 6,305 24.0 6,845 26.0 426 1.6 17,778 67.61995 5,926 22.3 7,057 26.5 434 1.6 17,300 65.01996 5,914 22.0 6,924 25.7 361 1.3 17,153 63.71997 5,606 20.6 7,652 28.1 297 1.1 17,426 63.91998 5,670 20.6 7,532 27.3 365 1.3 17,780 64.51999 5,886 21.1 8,030 28.8 431 1.5 18,731 67.12000 6,513 23.1 9,522 33.7 429 1.5 21,053 74.62001 NA NA NA NA 408 1.4 NA NA2002 NA NA NA NA 402 1.4 NA NA 1/ Direct use is an ERS calculation. 2/ Factory use as a proxy for domestic consumption in other edible products.
Note: Census Bureau data for 2001 and 2002 was not available prior to publication.
Source: Bureau of the Census.
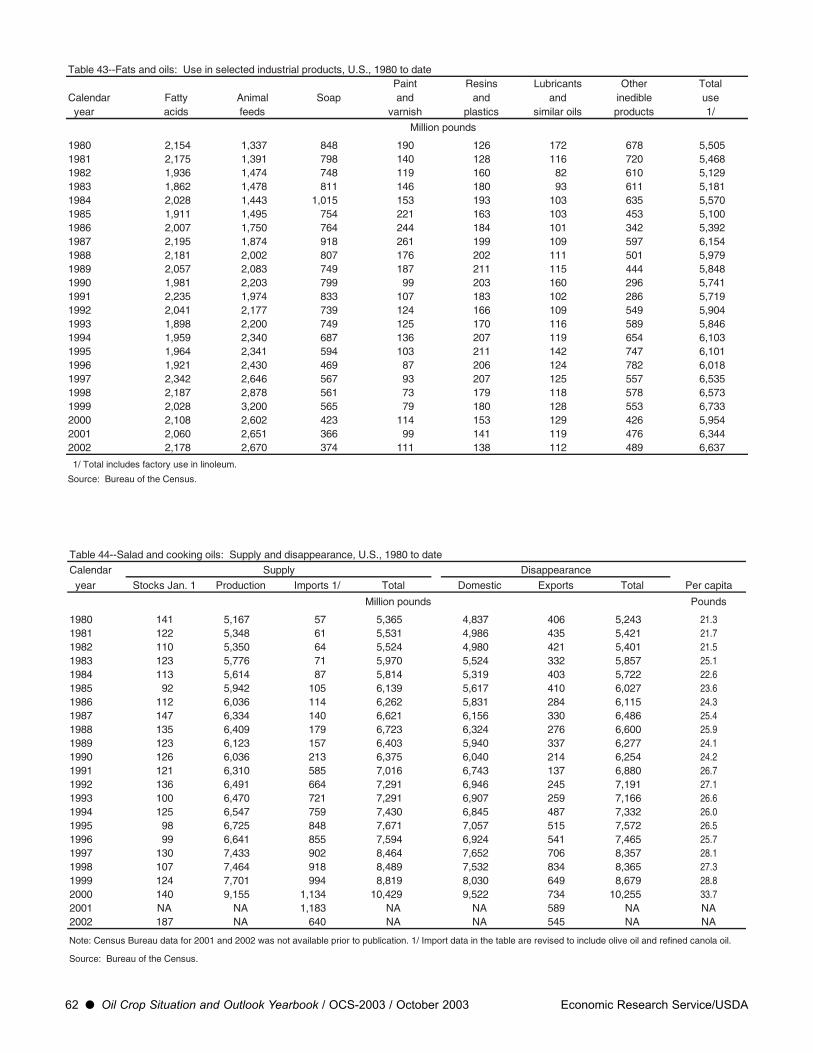
62 l Oil Crop Situation and Outlook Yearbook / OCS-2003 / October 2003 Economic Research Service/USDA
Table 43--Fats and oils: Use in selected industrial products, U.S., 1980 to datePaint Resins Lubricants Other Total
Calendar Fatty Animal Soap and and and inedible use year acids feeds varnish plastics similar oils products 1/
Million pounds
1980 2,154 1,337 848 190 126 172 678 5,5051981 2,175 1,391 798 140 128 116 720 5,4681982 1,936 1,474 748 119 160 82 610 5,1291983 1,862 1,478 811 146 180 93 611 5,1811984 2,028 1,443 1,015 153 193 103 635 5,5701985 1,911 1,495 754 221 163 103 453 5,1001986 2,007 1,750 764 244 184 101 342 5,3921987 2,195 1,874 918 261 199 109 597 6,1541988 2,181 2,002 807 176 202 111 501 5,9791989 2,057 2,083 749 187 211 115 444 5,8481990 1,981 2,203 799 99 203 160 296 5,7411991 2,235 1,974 833 107 183 102 286 5,7191992 2,041 2,177 739 124 166 109 549 5,9041993 1,898 2,200 749 125 170 116 589 5,8461994 1,959 2,340 687 136 207 119 654 6,1031995 1,964 2,341 594 103 211 142 747 6,1011996 1,921 2,430 469 87 206 124 782 6,0181997 2,342 2,646 567 93 207 125 557 6,5351998 2,187 2,878 561 73 179 118 578 6,5731999 2,028 3,200 565 79 180 128 553 6,7332000 2,108 2,602 423 114 153 129 426 5,9542001 2,060 2,651 366 99 141 119 476 6,3442002 2,178 2,670 374 111 138 112 489 6,637
1/ Total includes factory use in linoleum.
Source: Bureau of the Census.
Table 44--Salad and cooking oils: Supply and disappearance, U.S., 1980 to date
Calendar Supply Disappearance
year Stocks Jan. 1 Production Imports 1/ Total Domestic Exports Total Per capita
Million pounds Pounds
1980 141 5,167 57 5,365 4,837 406 5,243 21.31981 122 5,348 61 5,531 4,986 435 5,421 21.71982 110 5,350 64 5,524 4,980 421 5,401 21.51983 123 5,776 71 5,970 5,524 332 5,857 25.11984 113 5,614 87 5,814 5,319 403 5,722 22.61985 92 5,942 105 6,139 5,617 410 6,027 23.61986 112 6,036 114 6,262 5,831 284 6,115 24.31987 147 6,334 140 6,621 6,156 330 6,486 25.41988 135 6,409 179 6,723 6,324 276 6,600 25.91989 123 6,123 157 6,403 5,940 337 6,277 24.11990 126 6,036 213 6,375 6,040 214 6,254 24.21991 121 6,310 585 7,016 6,743 137 6,880 26.71992 136 6,491 664 7,291 6,946 245 7,191 27.11993 100 6,470 721 7,291 6,907 259 7,166 26.61994 125 6,547 759 7,430 6,845 487 7,332 26.01995 98 6,725 848 7,671 7,057 515 7,572 26.51996 99 6,641 855 7,594 6,924 541 7,465 25.71997 130 7,433 902 8,464 7,652 706 8,357 28.11998 107 7,464 918 8,489 7,532 834 8,365 27.31999 124 7,701 994 8,819 8,030 649 8,679 28.82000 140 9,155 1,134 10,429 9,522 734 10,255 33.72001 NA NA 1,183 NA NA 589 NA NA2002 187 NA 640 NA NA 545 NA NA
Note: Census Bureau data for 2001 and 2002 was not available prior to publication. 1/ Import data in the table are revised to include olive oil and refined canola oil.
Source: Bureau of the Census.
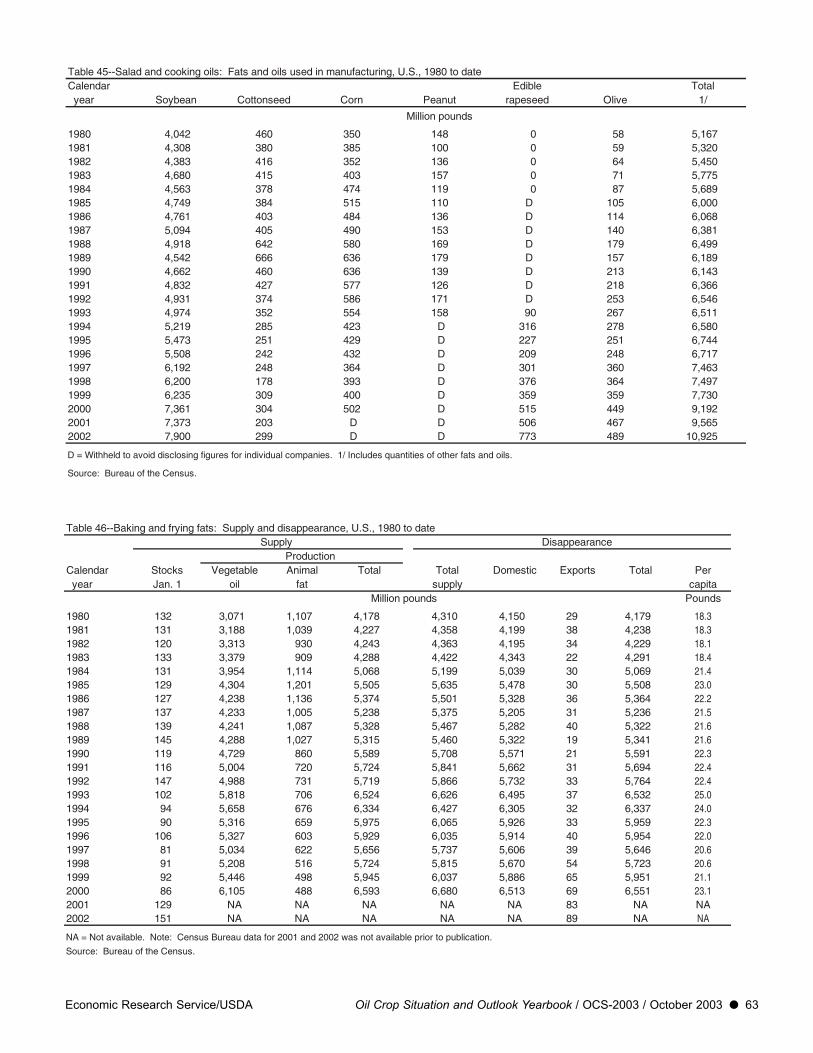
Economic Research Service/USDA Oil Crop Situation and Outlook Yearbook / OCS-2003 / October 2003 l 63
Table 45--Salad and cooking oils: Fats and oils used in manufacturing, U.S., 1980 to dateCalendar Edible Total year Soybean Cottonseed Corn Peanut rapeseed Olive 1/
Million pounds
1980 4,042 460 350 148 0 58 5,1671981 4,308 380 385 100 0 59 5,3201982 4,383 416 352 136 0 64 5,4501983 4,680 415 403 157 0 71 5,7751984 4,563 378 474 119 0 87 5,6891985 4,749 384 515 110 D 105 6,0001986 4,761 403 484 136 D 114 6,0681987 5,094 405 490 153 D 140 6,3811988 4,918 642 580 169 D 179 6,4991989 4,542 666 636 179 D 157 6,1891990 4,662 460 636 139 D 213 6,1431991 4,832 427 577 126 D 218 6,3661992 4,931 374 586 171 D 253 6,5461993 4,974 352 554 158 90 267 6,5111994 5,219 285 423 D 316 278 6,5801995 5,473 251 429 D 227 251 6,7441996 5,508 242 432 D 209 248 6,7171997 6,192 248 364 D 301 360 7,4631998 6,200 178 393 D 376 364 7,4971999 6,235 309 400 D 359 359 7,7302000 7,361 304 502 D 515 449 9,1922001 7,373 203 D D 506 467 9,5652002 7,900 299 D D 773 489 10,925
D = Withheld to avoid disclosing figures for individual companies. 1/ Includes quantities of other fats and oils.
Source: Bureau of the Census.
Table 46--Baking and frying fats: Supply and disappearance, U.S., 1980 to date Supply Disappearance
ProductionCalendar Stocks Vegetable Animal Total Total Domestic Exports Total Per year Jan. 1 oil fat supply capita
Million pounds Pounds
1980 132 3,071 1,107 4,178 4,310 4,150 29 4,179 18.31981 131 3,188 1,039 4,227 4,358 4,199 38 4,238 18.31982 120 3,313 930 4,243 4,363 4,195 34 4,229 18.11983 133 3,379 909 4,288 4,422 4,343 22 4,291 18.41984 131 3,954 1,114 5,068 5,199 5,039 30 5,069 21.41985 129 4,304 1,201 5,505 5,635 5,478 30 5,508 23.01986 127 4,238 1,136 5,374 5,501 5,328 36 5,364 22.21987 137 4,233 1,005 5,238 5,375 5,205 31 5,236 21.51988 139 4,241 1,087 5,328 5,467 5,282 40 5,322 21.61989 145 4,288 1,027 5,315 5,460 5,322 19 5,341 21.61990 119 4,729 860 5,589 5,708 5,571 21 5,591 22.31991 116 5,004 720 5,724 5,841 5,662 31 5,694 22.41992 147 4,988 731 5,719 5,866 5,732 33 5,764 22.41993 102 5,818 706 6,524 6,626 6,495 37 6,532 25.01994 94 5,658 676 6,334 6,427 6,305 32 6,337 24.01995 90 5,316 659 5,975 6,065 5,926 33 5,959 22.31996 106 5,327 603 5,929 6,035 5,914 40 5,954 22.01997 81 5,034 622 5,656 5,737 5,606 39 5,646 20.61998 91 5,208 516 5,724 5,815 5,670 54 5,723 20.61999 92 5,446 498 5,945 6,037 5,886 65 5,951 21.12000 86 6,105 488 6,593 6,680 6,513 69 6,551 23.12001 129 NA NA NA NA NA 83 NA NA2002 151 NA NA NA NA NA 89 NA NA
NA = Not available. Note: Census Bureau data for 2001 and 2002 was not available prior to publication.
Source: Bureau of the Census.
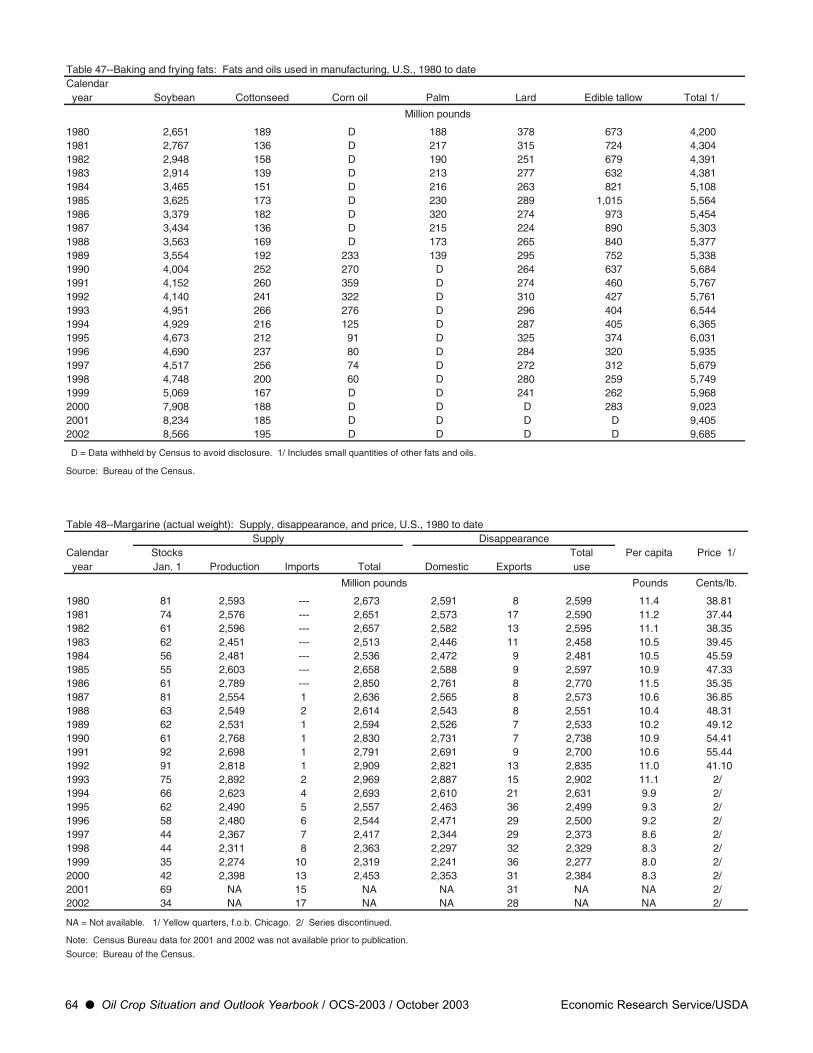
64 l Oil Crop Situation and Outlook Yearbook / OCS-2003 / October 2003 Economic Research Service/USDA
Table 47--Baking and frying fats: Fats and oils used in manufacturing, U.S., 1980 to dateCalendar year Soybean Cottonseed Corn oil Palm Lard Edible tallow Total 1/
Million pounds
1980 2,651 189 D 188 378 673 4,2001981 2,767 136 D 217 315 724 4,3041982 2,948 158 D 190 251 679 4,3911983 2,914 139 D 213 277 632 4,3811984 3,465 151 D 216 263 821 5,1081985 3,625 173 D 230 289 1,015 5,5641986 3,379 182 D 320 274 973 5,4541987 3,434 136 D 215 224 890 5,3031988 3,563 169 D 173 265 840 5,3771989 3,554 192 233 139 295 752 5,3381990 4,004 252 270 D 264 637 5,6841991 4,152 260 359 D 274 460 5,7671992 4,140 241 322 D 310 427 5,7611993 4,951 266 276 D 296 404 6,5441994 4,929 216 125 D 287 405 6,3651995 4,673 212 91 D 325 374 6,0311996 4,690 237 80 D 284 320 5,9351997 4,517 256 74 D 272 312 5,6791998 4,748 200 60 D 280 259 5,7491999 5,069 167 D D 241 262 5,9682000 7,908 188 D D D 283 9,0232001 8,234 185 D D D D 9,4052002 8,566 195 D D D D 9,685
D = Data withheld by Census to avoid disclosure. 1/ Includes small quantities of other fats and oils.
Source: Bureau of the Census.
Table 48--Margarine (actual weight): Supply, disappearance, and price, U.S., 1980 to dateSupply Disappearance
Calendar Stocks Total Per capita Price 1/ year Jan. 1 Production Imports Total Domestic Exports use
Million pounds Pounds Cents/lb.
1980 81 2,593 --- 2,673 2,591 8 2,599 11.4 38.811981 74 2,576 --- 2,651 2,573 17 2,590 11.2 37.441982 61 2,596 --- 2,657 2,582 13 2,595 11.1 38.351983 62 2,451 --- 2,513 2,446 11 2,458 10.5 39.451984 56 2,481 --- 2,536 2,472 9 2,481 10.5 45.591985 55 2,603 --- 2,658 2,588 9 2,597 10.9 47.331986 61 2,789 --- 2,850 2,761 8 2,770 11.5 35.351987 81 2,554 1 2,636 2,565 8 2,573 10.6 36.851988 63 2,549 2 2,614 2,543 8 2,551 10.4 48.311989 62 2,531 1 2,594 2,526 7 2,533 10.2 49.121990 61 2,768 1 2,830 2,731 7 2,738 10.9 54.411991 92 2,698 1 2,791 2,691 9 2,700 10.6 55.441992 91 2,818 1 2,909 2,821 13 2,835 11.0 41.101993 75 2,892 2 2,969 2,887 15 2,902 11.1 2/1994 66 2,623 4 2,693 2,610 21 2,631 9.9 2/1995 62 2,490 5 2,557 2,463 36 2,499 9.3 2/1996 58 2,480 6 2,544 2,471 29 2,500 9.2 2/1997 44 2,367 7 2,417 2,344 29 2,373 8.6 2/1998 44 2,311 8 2,363 2,297 32 2,329 8.3 2/1999 35 2,274 10 2,319 2,241 36 2,277 8.0 2/2000 42 2,398 13 2,453 2,353 31 2,384 8.3 2/2001 69 NA 15 NA NA 31 NA NA 2/2002 34 NA 17 NA NA 28 NA NA 2/
NA = Not available. 1/ Yellow quarters, f.o.b. Chicago. 2/ Series discontinued.
Note: Census Bureau data for 2001 and 2002 was not available prior to publication.
Source: Bureau of the Census.

Economic Research Service/USDA Oil Crop Situation and Outlook Yearbook / OCS-2003 / October 2003 l 65
Table 49--Margarine: Fats and oils used in manufacturing, U.S., 1980 to dateCalendar year Soybean Cottonseed Corn Animal fats 1/ Total 2/
Million pounds
1980 1,653 25 223 104 2,0391981 1,685 25 213 78 2,0171982 1,718 22 220 29 1,9971983 1,549 34 212 41 1,8501984 1,544 26 196 38 1,8421985 1,628 8 220 65 1,9461986 1,741 24 204 48 2,0411987 1,615 28 248 22 1,9311988 1,619 D 210 35 1,8941989 1,573 D 214 32 1,8751990 1,749 D 208 35 2,1021991 1,853 25 196 43 2,1601992 1,926 24 176 37 2,1741993 2,013 26 161 31 2,2391994 1,793 D D 42 2,0031995 1,684 D D 41 1,8471996 1,694 D 77 28 1,8161997 1,650 D 61 14 1,7331998 1,606 D 55 22 1,6921999 1,574 D D 21 1,6642000 1,465 D 56 12 1,5472001 1,298 D D 7 1,3942002 1,212 D D 16 1,300
D =Data withheld by Census to avoid disclosure. 1/ Includes lard and edible tallow. 2/ Includes small quantities of other fats and oils.
Source: Bureau of the Census.
Table 50--Lard: Supply, disappearance, and price, U.S., 1980 to datePer capita
Supply Disappearance domestic Price 1/Calendar Stocks Production Direct disappear- year Jan. 1 2/ Total Domestic Exports Total food use ance
Million pounds Pounds Cents/lb.
1980 50 1,207 1,257 1,116 92 1,208 534 2.3 20.701981 49 1,159 1,208 1,021 150 1,171 511 2.2 20.301982 37 1,011 1,048 908 103 1,011 536 2.3 21.401983 38 973 1,011 887 89 976 327 1.4 17.601984 34 939 975 848 89 937 442 1.9 28.231985 39 927 968 827 105 932 377 1.6 19.551986 35 876 913 787 104 891 369 1.5 13.691987 22 863 886 746 107 853 379 1.6 14.791988 33 932 966 802 127 929 365 1.5 16.311989 37 935 974 832 110 942 443 1.8 14.091990 32 919 954 832 97 929 402 1.6 13.301991 25 952 980 822 121 943 429 1.7 13.471992 37 1,025 1,065 906 136 1,042 291 1.1 13.301993 23 1,005 1,031 879 114 993 299 1.1 15.421994 38 1,034 1,074 896 137 1,033 471 1.8 17.531995 41 1,040 1,082 920 124 1,044 430 1.6 20.261996 38 998 1,038 918 101 1,019 468 1.7 21.901997 19 993 1,013 901 90 991 518 1.9 23.421998 22 1,091 1,116 956 131 1,087 541 2.0 17.861999 28 1,097 1,127 953 147 1,100 547 2.0 14.912000 27 1,058 1,087 895 174 1,069 549 1.9 12.252001 18 1,058 1,080 963 103 1,066 661 2.3 14.932002 18 1,083 1,109 1,012 84 1,096 706 2.4 14.22
1/ Loose, average wholesale, tanks, Chicago. 2/ ERS estimate after 1989, Census Bureau ended publication of lard production in July 1989.
Source: Bureau of the Census.
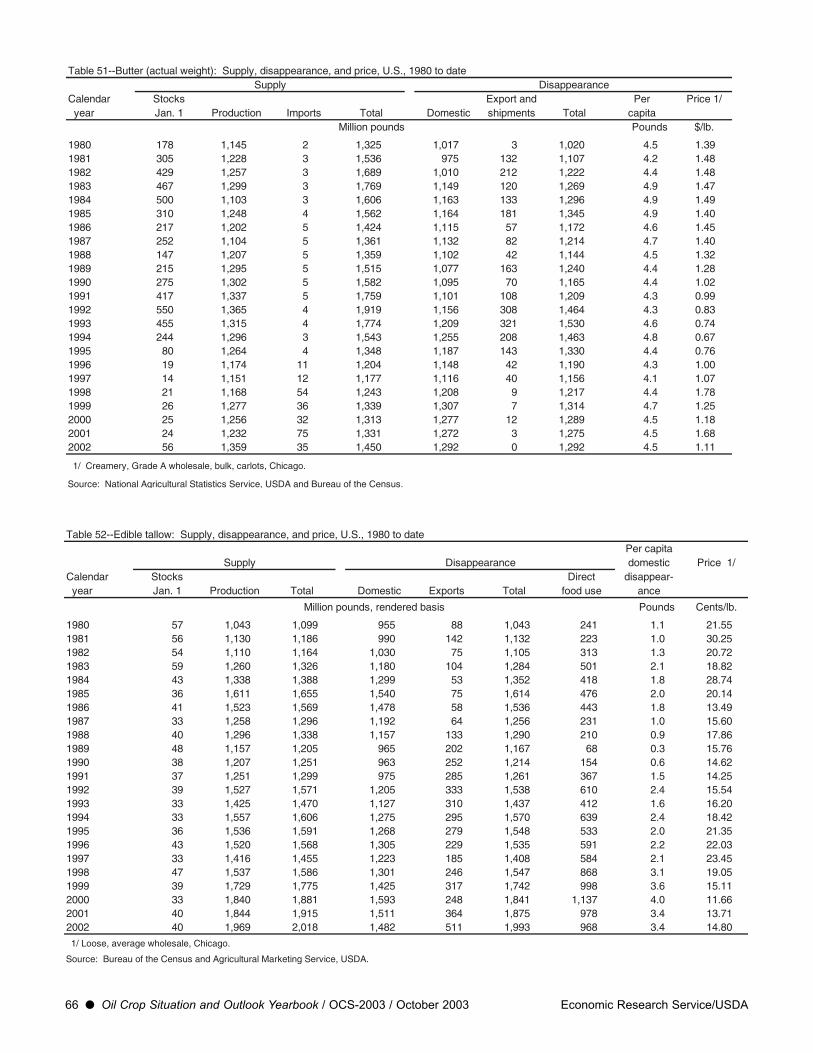
66 l Oil Crop Situation and Outlook Yearbook / OCS-2003 / October 2003 Economic Research Service/USDA
Table 51--Butter (actual weight): Supply, disappearance, and price, U.S., 1980 to dateSupply Disappearance
Calendar Stocks Export and Per Price 1/ year Jan. 1 Production Imports Total Domestic shipments Total capita
Million pounds Pounds $/lb.
1980 178 1,145 2 1,325 1,017 3 1,020 4.5 1.391981 305 1,228 3 1,536 975 132 1,107 4.2 1.481982 429 1,257 3 1,689 1,010 212 1,222 4.4 1.481983 467 1,299 3 1,769 1,149 120 1,269 4.9 1.471984 500 1,103 3 1,606 1,163 133 1,296 4.9 1.491985 310 1,248 4 1,562 1,164 181 1,345 4.9 1.401986 217 1,202 5 1,424 1,115 57 1,172 4.6 1.451987 252 1,104 5 1,361 1,132 82 1,214 4.7 1.401988 147 1,207 5 1,359 1,102 42 1,144 4.5 1.321989 215 1,295 5 1,515 1,077 163 1,240 4.4 1.281990 275 1,302 5 1,582 1,095 70 1,165 4.4 1.021991 417 1,337 5 1,759 1,101 108 1,209 4.3 0.991992 550 1,365 4 1,919 1,156 308 1,464 4.3 0.831993 455 1,315 4 1,774 1,209 321 1,530 4.6 0.741994 244 1,296 3 1,543 1,255 208 1,463 4.8 0.671995 80 1,264 4 1,348 1,187 143 1,330 4.4 0.761996 19 1,174 11 1,204 1,148 42 1,190 4.3 1.001997 14 1,151 12 1,177 1,116 40 1,156 4.1 1.071998 21 1,168 54 1,243 1,208 9 1,217 4.4 1.781999 26 1,277 36 1,339 1,307 7 1,314 4.7 1.252000 25 1,256 32 1,313 1,277 12 1,289 4.5 1.182001 24 1,232 75 1,331 1,272 3 1,275 4.5 1.682002 56 1,359 35 1,450 1,292 0 1,292 4.5 1.11
1/ Creamery, Grade A wholesale, bulk, carlots, Chicago.
Source: National Agricultural Statistics Service, USDA and Bureau of the Census.
Table 52--Edible tallow: Supply, disappearance, and price, U.S., 1980 to datePer capita
Supply Disappearance domestic Price 1/Calendar Stocks Direct disappear- year Jan. 1 Production Total Domestic Exports Total food use ance
Million pounds, rendered basis Pounds Cents/lb.
1980 57 1,043 1,099 955 88 1,043 241 1.1 21.551981 56 1,130 1,186 990 142 1,132 223 1.0 30.251982 54 1,110 1,164 1,030 75 1,105 313 1.3 20.721983 59 1,260 1,326 1,180 104 1,284 501 2.1 18.821984 43 1,338 1,388 1,299 53 1,352 418 1.8 28.741985 36 1,611 1,655 1,540 75 1,614 476 2.0 20.141986 41 1,523 1,569 1,478 58 1,536 443 1.8 13.491987 33 1,258 1,296 1,192 64 1,256 231 1.0 15.601988 40 1,296 1,338 1,157 133 1,290 210 0.9 17.861989 48 1,157 1,205 965 202 1,167 68 0.3 15.761990 38 1,207 1,251 963 252 1,214 154 0.6 14.621991 37 1,251 1,299 975 285 1,261 367 1.5 14.251992 39 1,527 1,571 1,205 333 1,538 610 2.4 15.541993 33 1,425 1,470 1,127 310 1,437 412 1.6 16.201994 33 1,557 1,606 1,275 295 1,570 639 2.4 18.421995 36 1,536 1,591 1,268 279 1,548 533 2.0 21.351996 43 1,520 1,568 1,305 229 1,535 591 2.2 22.031997 33 1,416 1,455 1,223 185 1,408 584 2.1 23.451998 47 1,537 1,586 1,301 246 1,547 868 3.1 19.051999 39 1,729 1,775 1,425 317 1,742 998 3.6 15.112000 33 1,840 1,881 1,593 248 1,841 1,137 4.0 11.662001 40 1,844 1,915 1,511 364 1,875 978 3.4 13.712002 40 1,969 2,018 1,482 511 1,993 968 3.4 14.80
1/ Loose, average wholesale, Chicago.
Source: Bureau of the Census and Agricultural Marketing Service, USDA.

Economic Research Service/USDA Oil Crop Situation and Outlook Yearbook / OCS-2003 / October 2003 l 67
Table 53--Supply and use: Soybeans, soybean meal, and soybean oil, U.S., major foreign exporters, importers, and world, 2000/01 to date 1/World less United States World less United States
United Major Major Total World United Major Major Total WorldStates exporters importers foreign 4/ States exporters importers foreign 4/
2/ 3/ 2/ 3/Million metric tons
2000/01 5/ 2002/03 6/Soybeans-- Soybeans-- Supply-- Supply-- Beg. stocks 7.90 14.18 5.16 20.12 28.02 Beg. stocks 5.66 21.25 4.30 26.40 32.06 Production 75.06 70.32 18.12 100.04 175.10 Production 74.83 91.90 18.71 121.53 196.36 Imports 0.10 1.32 44.83 54.84 54.94 Imports 0.11 1.75 52.02 64.28 64.39 Use-- Use-- Crush 44.62 40.80 45.99 102.34 146.96 Crush 43.98 51.86 54.08 121.98 165.96 Total 49.20 44.06 59.49 122.87 172.07 Total 47.68 55.87 68.03 143.91 191.59 Exports 27.10 25.44 1.48 27.97 55.07 Exports 28.30 33.96 0.36 35.62 63.92 Ending stocks 6.74 16.32 6.82 23.88 30.62 Ending stocks 4.61 25.06 6.64 32.68 37.29
Soybean meal-- Soybean meal-- Supply-- Supply-- Beg. stocks 0.27 1.17 1.34 3.95 4.22 Beg. stocks 0.22 0.99 1.42 3.82 4.04 Production 35.73 35.13 30.04 80.74 116.47 Production 34.56 42.90 36.26 96.60 131.16 Imports 0.05 0.18 27.34 41.30 41.35 Imports 0.15 0.33 27.89 45.34 45.49 Use-- Use-- Domestic 28.71 8.99 51.37 88.36 117.07 Domestic 29.21 9.95 61.36 103.91 133.12 Exports 6.99 26.63 6.05 34.08 41.07 Exports 5.49 33.25 3.08 38.26 43.75 Ending stocks 0.35 0.86 1.14 3.40 3.75 Ending stocks 0.23 1.02 1.13 3.58 3.81
Soybean oil-- Soybean oil-- Supply-- Supply-- Beg. stocks 0.91 0.82 0.29 1.61 2.52 Beg. stocks 1.07 0.50 0.41 1.50 2.57 Production 8.36 10.53 4.08 18.44 26.80 Production 8.35 12.61 5.21 22.11 30.46 Imports 0.03 0.69 1.66 7.55 7.58 Imports 0.02 0.11 3.18 9.34 9.36 Use-- Use-- Domestic 7.35 5.00 5.69 19.01 26.36 Domestic 7.71 5.28 8.20 23.16 30.87 Exports 0.64 6.55 0.06 7.31 7.95 Exports 1.02 7.60 0.06 8.45 9.47 Ending stocks 1.26 0.47 0.46 1.46 2.72 Ending stocks 0.71 0.35 0.53 1.34 2.05
2001/02 5/ 2003/04 6/Soybeans-- Soybeans-- Supply-- Supply-- Beg. stocks 6.74 16.32 6.82 23.88 30.62 Beg. stocks 4.61 25.06 6.64 32.68 37.29 Production 78.67 76.60 18.12 105.75 184.42 Production 67.18 101.25 18.22 132.97 200.15 Imports 0.06 1.40 42.29 54.29 54.35 Imports 0.20 1.90 53.64 66.37 66.57 Use-- Use-- Crush 46.26 46.41 48.65 111.78 158.04 Crush 41.10 57.91 57.52 133.52 174.62 Total 50.87 49.96 62.54 133.10 183.97 Total 44.78 62.44 72.05 156.89 201.67 Exports 28.95 23.12 0.39 24.42 53.37 Exports 23.68 40.63 0.39 42.66 66.34 Ending stocks 5.66 21.25 4.30 26.40 32.06 Ending stocks 3.53 25.15 6.05 32.47 36.00
Soybean meal-- Soybean meal-- Supply-- Supply-- Beg. stocks 0.35 0.86 1.14 3.40 3.75 Beg. stocks 0.23 1.02 1.13 3.58 3.81 Production 36.55 39.67 32.37 88.77 125.32 Production 32.60 48.79 38.68 105.54 138.14 Imports 0.13 0.33 27.79 43.91 44.04 Imports 0.31 0.33 29.27 47.84 48.15 Use-- Use-- Domestic 30.00 9.38 56.53 96.79 126.79 Domestic 28.40 10.75 64.74 109.68 138.08 Exports 6.81 30.49 3.34 35.46 42.27 Exports 4.54 38.32 3.10 43.46 48.00 Ending stocks 0.22 0.99 1.42 3.82 4.04 Ending stocks 0.20 1.07 1.24 3.83 4.03
Soybean oil-- Soybean oil-- Supply-- Supply-- Beg. stocks 1.26 0.47 0.46 1.46 2.72 Beg. stocks 0.71 0.35 0.53 1.34 2.05 Production 8.57 11.70 4.48 20.28 28.85 Production 7.72 13.87 5.89 24.16 31.88 Imports 0.02 0.17 2.00 8.30 8.32 Imports 0.04 0.14 2.91 9.40 9.44 Use-- Use-- Domestic 7.64 5.24 6.48 21.08 28.72 Domestic 7.53 5.62 8.83 24.41 31.94 Exports 1.14 6.60 0.06 7.45 8.59 Exports 0.39 8.29 0.06 9.18 9.57 Ending stocks 1.07 0.50 0.41 1.50 2.57 Ending stocks 0.55 0.45 0.44 1.32 1.87
1/ Data based on local marketing years except for Argentina and Brazil, which are adjusted to an October-September year. 2/ Major exporters include Brazil,
Argentina, and Paraguay for soybeans plus India for soybean meal and EU-15 for soybean oil. 3/ EU-15, China, and Japan. 4/ World imports and exports
will not balance because of differences in local marketing years and time lags between reported exports and imports. Therefore, world supply may not
equal world use. 5/ Estimated. 6/ Projected.
Source: World Agricultural Supply and Demand Estimates, USDA.
Million metric tons

68 l Oil Crop Situation and Outlook Yearbook / OCS-2003 / October 2003 Economic Research Service/USDA
Table 54--World oilseed production, 1996/97 to dateCrop year
Item 1996/97 1997/98 1998/99 1999/00 2000/01 2001/02 2002/03 1/ 2003/04 1/
Million metric tonsProduction Soybeans 132.22 158.07 159.82 159.91 175.19 184.42 196.36 200.15 Cottonseed 33.65 34.35 32.57 32.96 33.48 36.59 32.84 35.71 Peanuts 28.96 27.30 29.77 29.07 31.18 33.63 30.55 33.21 Sunflowerseed 23.80 23.24 26.63 27.26 23.17 21.41 24.01 26.99 Rapeseed 31.53 33.23 35.89 42.45 37.56 35.99 32.32 37.33 Copra 6.05 5.33 4.37 5.45 5.77 5.19 5.11 5.38 Palm kernel 5.21 5.05 5.62 6.41 7.03 7.20 7.77 8.08
Total 261.42 286.57 294.67 303.50 313.39 324.43 328.95 346.85
1/ Forecast.
Source: Foreign Agricultural Service, USDA.
Table 55--World vegetable oils production, 1996/97 to dateCrop year
Item 1996/97 1997/98 1998/99 1999/00 2000/01 2001/02 2002/03 1/ 2003/04 1/Million metric tons
Production Soybean 20.53 22.57 24.65 24.64 26.73 28.85 30.46 31.88 Palm 17.64 16.97 19.25 21.80 24.28 25.42 27.23 28.13 Sunflowerseed 8.61 8.29 9.18 9.64 8.46 7.61 8.34 9.49 Rapeseed 10.52 11.43 11.81 13.70 13.03 12.68 11.75 13.05 Cottonseed 3.70 3.70 3.57 3.55 3.50 3.82 3.49 3.92 Peanut 4.38 4.18 4.44 4.22 4.34 4.88 4.33 4.81 Coconut 3.69 3.29 2.71 3.34 3.64 3.23 3.17 3.33 Olive 2.46 2.53 2.50 2.37 2.48 2.78 2.16 2.81 Palm Kernel 2.22 2.20 2.43 2.79 3.06 3.12 3.36 3.50
Total 73.75 75.16 80.54 86.05 89.53 92.38 94.30 100.92
1/ Forecast.
Source: Foreign Agricultural Service, USDA.
Table 56--World protein meal production, 1996/97 to dateCrop year
Item 1996/97 1997/98 1998/99 1999/00 2000/01 2001/02 2002/03 1/ 2003/04 1/Million metric tons
Soybeans 90.82 98.84 107.54 107.53 116.49 125.32 131.16 138.14 Cottonseed 11.89 11.79 11.36 11.41 11.25 12.08 11.19 12.47 Rapeseed 17.53 18.85 19.12 22.41 21.17 20.06 18.73 20.98 Sunflowerseed 10.06 9.51 10.51 10.72 9.40 8.31 9.10 10.31 Fish 6.64 5.08 5.80 6.33 5.80 5.70 5.62 5.75 Peanut 6.01 5.41 5.76 5.33 5.53 6.20 5.41 6.04 Copra 1.97 1.74 1.44 1.77 1.88 1.68 1.66 1.75 Palm Kernel 2.70 2.67 2.93 3.32 3.64 3.71 4.00 4.17
Total 147.62 153.89 164.46 168.81 175.16 183.05 186.86 199.61
1/ Forecast.
Source: Foreign Agricultural Service, USDA.