Embed Size (px)
Citation preview
Capital Markets Day: Westex
25 January 2017
Objective: to create wealth for shareholders
Geoff Wilding, Executive Chairman
Mike Scott, Group Finance Director
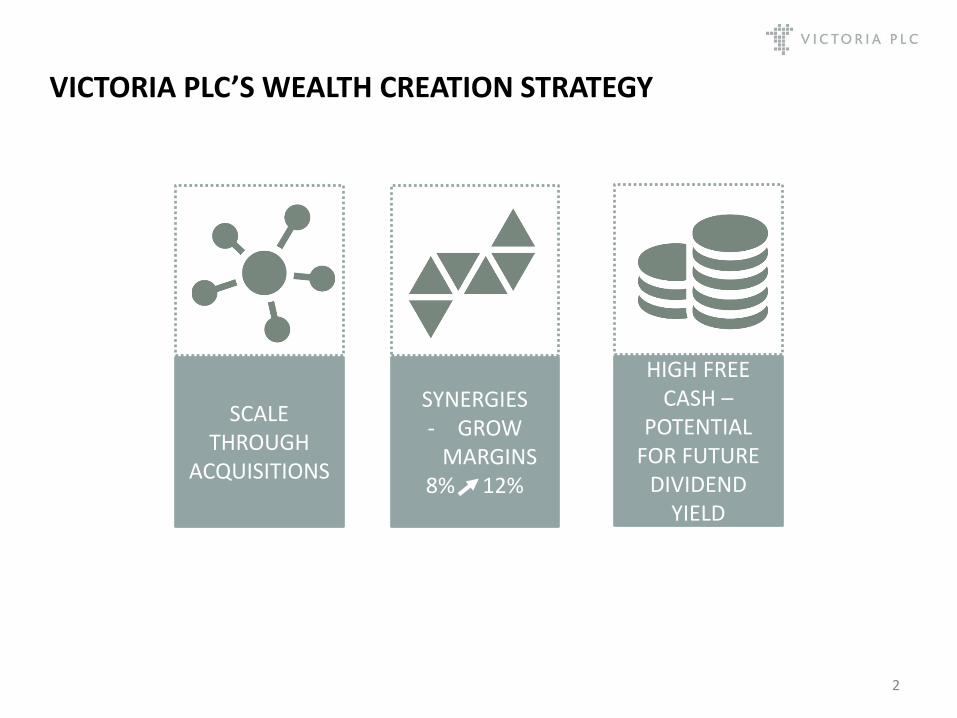
VICTORIA PLC’S WEALTH CREATION STRATEGY
2
SCALE THROUGH
ACQUISITIONS
SYNERGIES - GROW
MARGINS 8% 12%
HIGH FREE CASH –
POTENTIAL FOR FUTURE
DIVIDEND YIELD

Flooring is a HUGE market – every building has at least one floor
• Massive global market US$325bn – 19.4bn sqm - in 2018 (Freedonia Market Research)
• €73bn – 4.7bn sqm - in Western Europe (including the UK)
• > 250 UK and European flooring manufacturers ‘in frame’
Consolidator in a highly-fragmented, inefficient industry
• Many retiring owners with no succession planning
• Too small for IPO, aging trade buyers not interested, slow growth = overlooked by PE
• VCP perceived as ideal buyer – one of only a few buyers
Highly selective acquisitions
• Competitive advantage (channels, distribution, product)
• Growing
• Sustainable, above average margins
• Committed management
• Broad distribution channels
• Modern plant
• Fair price
SCALE via ACQUISITIONS
3

SYNERGIES – use scale to drive margins
4
Customer-facing (design, branding, sales, marketing) retains independence • Benefits:
• Product and brand differentiation
• Customer responsiveness
• Manageable size
Operational (procurement, production, logistics, IT) integration drives ‘hard’ synergies
• Benefits:
• Lower raw material inputs
• SKU reduction
• Logistics
• Improved financial reporting / controls
• Manufacturing efficiency
Commercial synergies (bundling of underlay with carpet, product cross-selling)
• Benefits:
• Sales growth
• SKU reduction
4
• These are broadly in order of ease / timing
• Significant progress on the first two; have started on the third and fourth
• Manufacturing efficiency to be addressed

FREE CASH FLOW = POTENTIAL FOR FUTURE DIVIDEND YIELD
Warren Buffet acquired Shaw Industries (world’s 2nd largest carpet manufacturer) for its free cash flow
Victoria PLC • Operating cash flow: before interest and tax: £32.8 million (full year FY16)
• Free cash flow before exceptional items: £17.2 million (full year FY16)
High cash conversion • Plant longevity
• Plant relatively inexpensive
• Consolidate production capability = increased utilisation
• Product rationalisation (SKU reduction, increased stock turn)
Benefit • Rapid debt reduction during acquisition phase
• High dividend yield once ‘steady state’
5
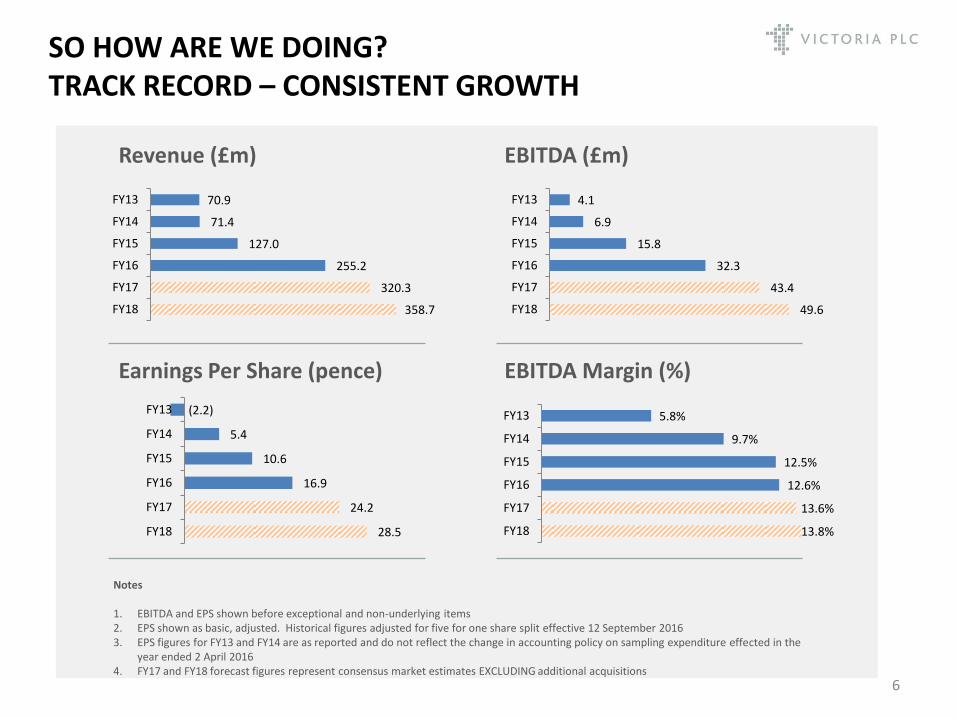
SO HOW ARE WE DOING? TRACK RECORD – CONSISTENT GROWTH
6
Notes
1. EBITDA and EPS shown before exceptional and non-underlying items 2. EPS shown as basic, adjusted. Historical figures adjusted for five for one share split effective 12 September 2016 3. EPS figures for FY13 and FY14 are as reported and do not reflect the change in accounting policy on sampling expenditure effected in the
year ended 2 April 2016 4. FY17 and FY18 forecast figures represent consensus market estimates EXCLUDING additional acquisitions
Revenue (£m) EBITDA (£m)
Earnings Per Share (pence) EBITDA Margin (%)
358.7
320.3
255.2
127.0
71.4
70.9
FY18
FY17
FY16
FY15
FY14
FY13
49.6
43.4
32.3
15.8
6.9
4.1
FY18
FY17
FY16
FY15
FY14
FY13
28.5
24.2
16.9
10.6
5.4
(2.2)
FY18
FY17
FY16
FY15
FY14
FY13
13.8%
13.6%
12.6%
12.5%
9.7%
5.8%
FY18
FY17
FY16
FY15
FY14
FY13

OUTLOOK Brexit impact Revenue drivers Strength in a recession Competitive strengths
8
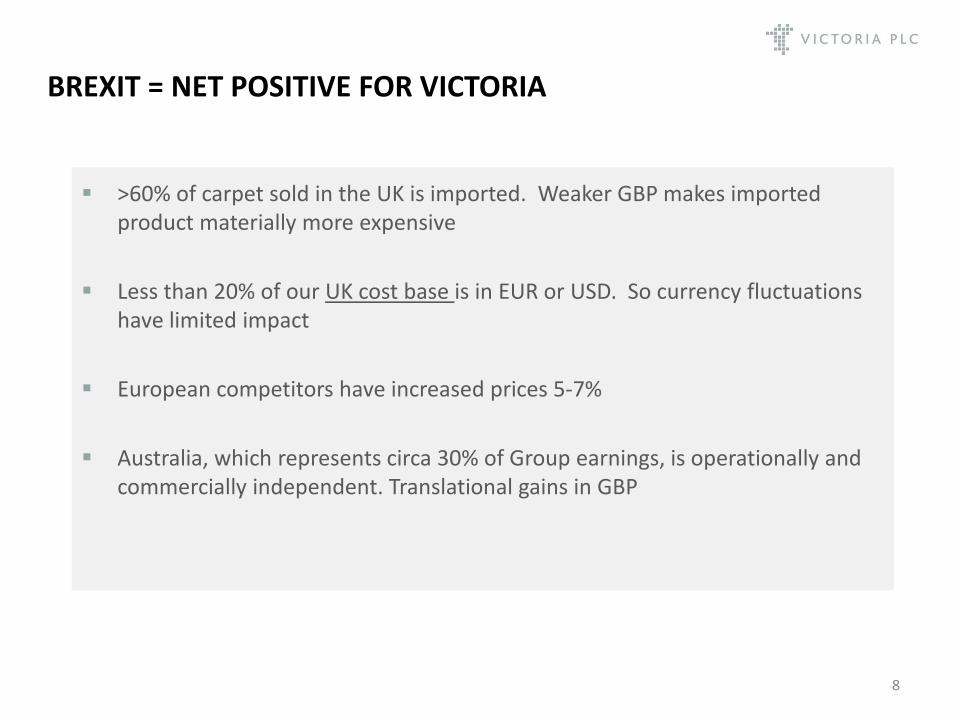
BREXIT = NET POSITIVE FOR VICTORIA
>60% of carpet sold in the UK is imported. Weaker GBP makes imported product materially more expensive
Less than 20% of our UK cost base is in EUR or USD. So currency fluctuations have limited impact
European competitors have increased prices 5-7%
Australia, which represents circa 30% of Group earnings, is operationally and commercially independent. Translational gains in GBP

REVENUE DRIVERS
9 Note 1. H1 year-on-year organic growth normalised for full impact of acquisitions and adjusted for 26 week period versus 27 weeks in the prior year
Steady market in the UK (+3.5% lfl H1 17)
Strong market in Australia (+8.9% lfl H1 17) Redecorating
• UK: 28 million households (2/3 owner-occupied)
• Australia: 8.1 million households
• Households replace carpet on average every 9 years
Housing transactions
• Steady growth in UK and Australia
• Leading indicator: 12-18 months delay
New builds
• UK: Building c.200,000 new houses pa
• Australia: Building c.100,000 new houses pa
Insurance replacement
• Economic cycle irrelevant
H1 like-for-like organic growth of 8% (5% on a constant currency basis)1
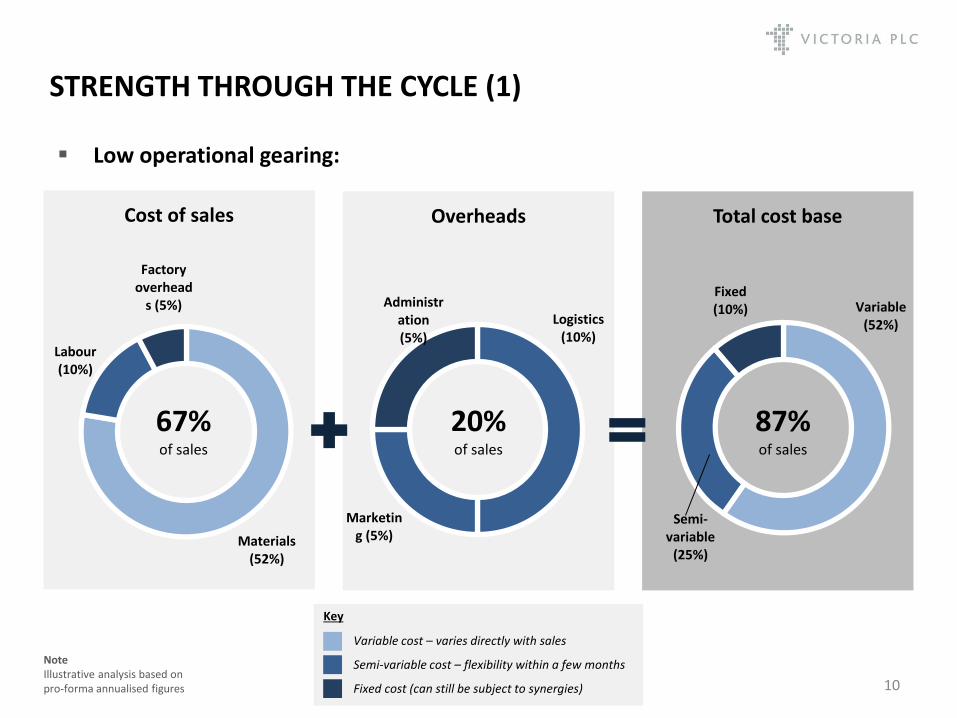
STRENGTH THROUGH THE CYCLE (1)
Low operational gearing:
10
Key
Cost of sales
Materials (52%)
Labour (10%)
Factory overhead
s (5%)
67% of sales
Overheads Total cost base
Logistics (10%)
Marketing (5%)
Administration (5%)
Variable (52%)
Semi-variable
(25%)
Fixed (10%)
20% of sales
87% of sales
Variable cost – varies directly with sales
Semi-variable cost – flexibility within a few months
Fixed cost (can still be subject to synergies)
Note Illustrative analysis based on pro-forma annualised figures
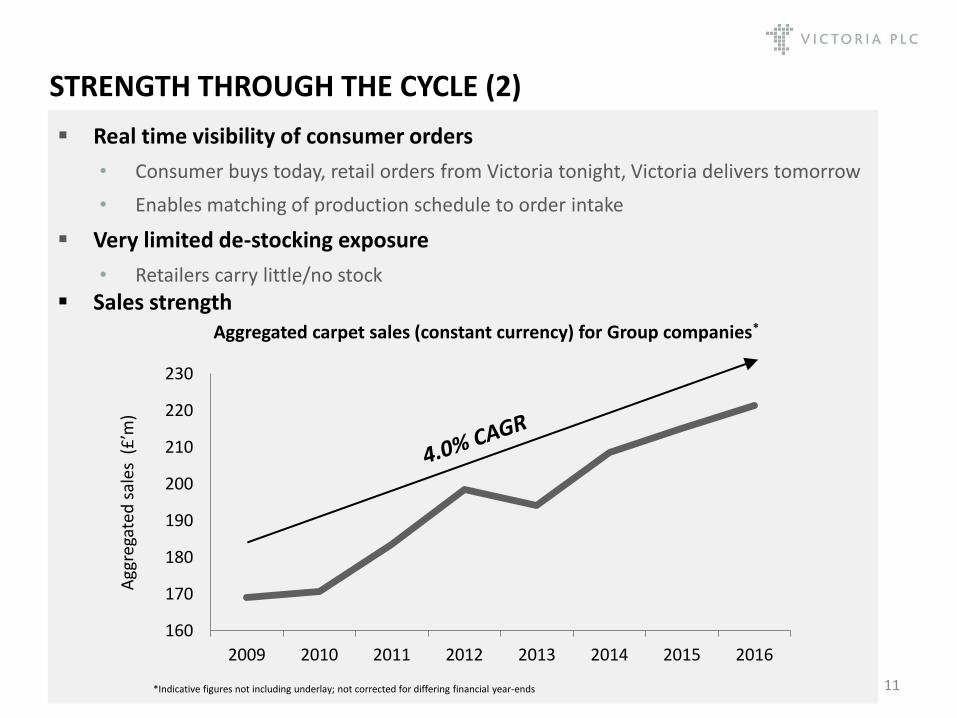
STRENGTH THROUGH THE CYCLE (2)
11
Real time visibility of consumer orders
• Consumer buys today, retail orders from Victoria tonight, Victoria delivers tomorrow
• Enables matching of production schedule to order intake
Very limited de-stocking exposure
• Retailers carry little/no stock
Sales strength Aggregated carpet sales (constant currency) for Group companies*
*Indicative figures not including underlay; not corrected for differing financial year-ends
160
170
180
190
200
210
220
230
2009 2010 2011 2012 2013 2014 2015 2016
Agg
rega
ted
sal
es (
£’m
)
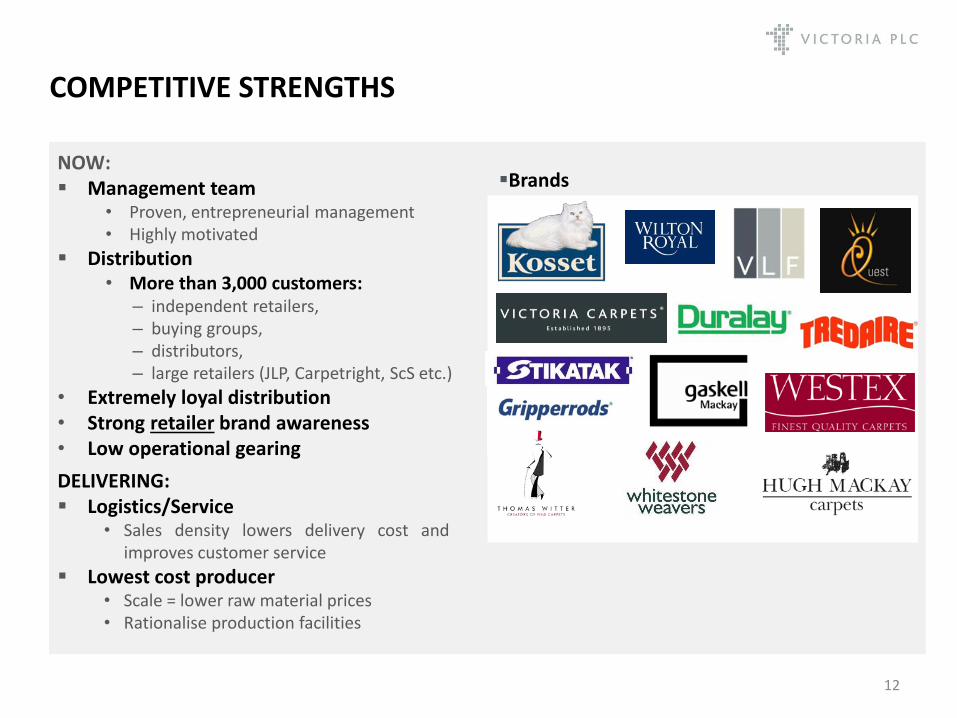
COMPETITIVE STRENGTHS
NOW: Management team
• Proven, entrepreneurial management • Highly motivated
Distribution • More than 3,000 customers:
– independent retailers, – buying groups, – distributors, – large retailers (JLP, Carpetright, ScS etc.)
• Extremely loyal distribution • Strong retailer brand awareness • Low operational gearing
12
Brands
DELIVERING: Logistics/Service
• Sales density lowers delivery cost and improves customer service
Lowest cost producer • Scale = lower raw material prices • Rationalise production facilities

APPENDICES Financial overview H1 2017 Shareholder register Business overview

Financial overview – H1 2017
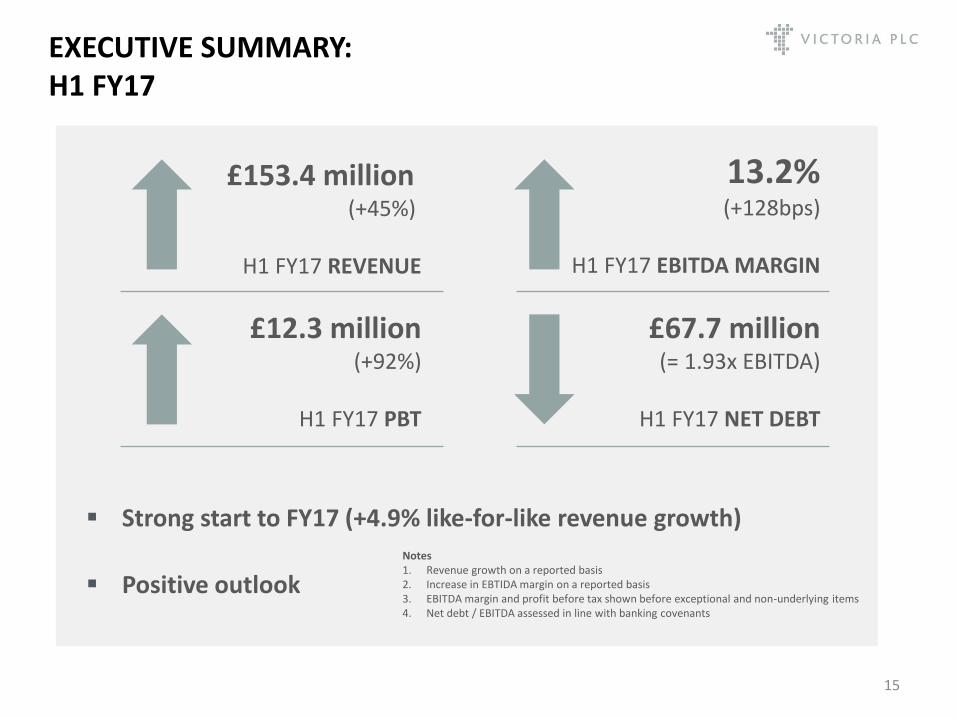
EXECUTIVE SUMMARY: H1 FY17
Strong start to FY17 (+4.9% like-for-like revenue growth)
Positive outlook
15
Notes 1. Revenue growth on a reported basis 2. Increase in EBTIDA margin on a reported basis 3. EBITDA margin and profit before tax shown before exceptional and non-underlying items 4. Net debt / EBITDA assessed in line with banking covenants
£153.4 million
(+45%)
H1 FY17 REVENUE
13.2% (+128bps)
H1 FY17 EBITDA MARGIN
£12.3 million (+92%)
H1 FY17 PBT
£67.7 million (= 1.93x EBITDA)
H1 FY17 NET DEBT

INCOME STATEMENT
16
Income Statement £m
H1 FY17 H1 FY16
Continuing operations
Revenue 153.4 105.6
Gross profit 50.4 35.2
EBITDA 20.2 12.6
Depreciation (5.8) (4.7)
Underlying operating profit 14.4 7.9
Underlying finance costs (2.1) (1.5)
Underlying profit before tax 12.3 6.4
Amortisation of acquired intangibles (1.9) (0.2)
Exceptional and non-underlying items (2.0) (2.3)
Reported profit before tax 8.4 3.9
Earnings per share (basic adjusted) (pence) 10.43 6.59
Underlying operating profit margin (%) 9.4% 7.5%
Underlying EBITDA margin (%) 13.2% 11.9%
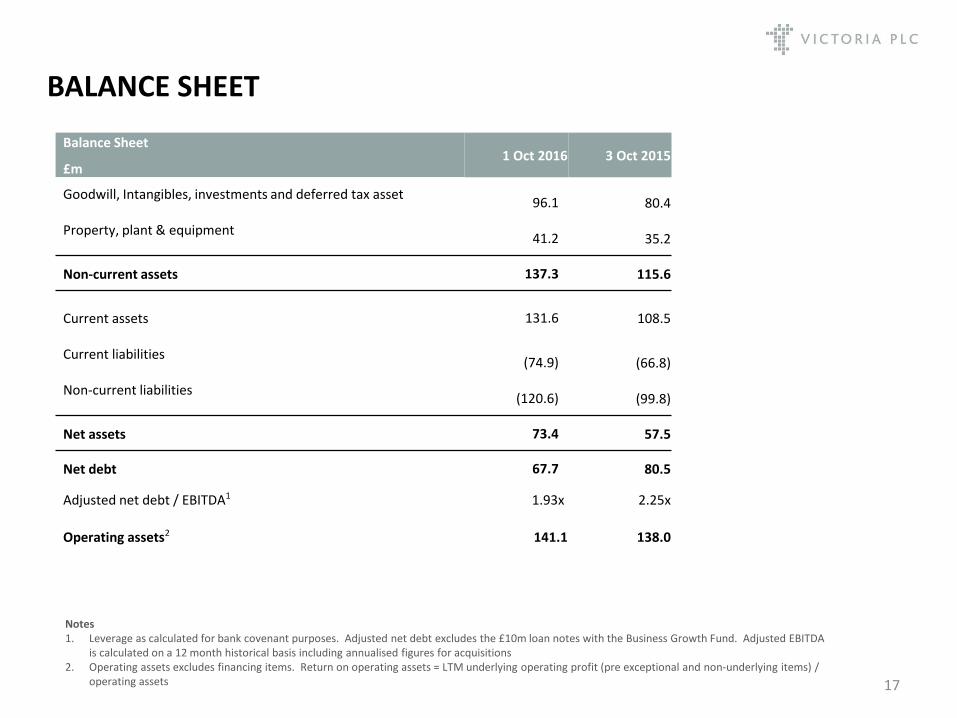
BALANCE SHEET
17
Balance Sheet
£m 1 Oct 2016 3 Oct 2015
Goodwill, Intangibles, investments and deferred tax asset
96.1 80.4
Property, plant & equipment
41.2 35.2
Non-current assets 137.3 115.6
Current assets
131.6 108.5
Current liabilities
(74.9) (66.8)
Non-current liabilities
(120.6) (99.8)
Net assets 73.4 57.5
Net debt 67.7 80.5
Adjusted net debt / EBITDA1 1.93x 2.25x
Operating assets2 141.1 138.0
Notes 1. Leverage as calculated for bank covenant purposes. Adjusted net debt excludes the £10m loan notes with the Business Growth Fund. Adjusted EBITDA
is calculated on a 12 month historical basis including annualised figures for acquisitions 2. Operating assets excludes financing items. Return on operating assets = LTM underlying operating profit (pre exceptional and non-underlying items) /
operating assets
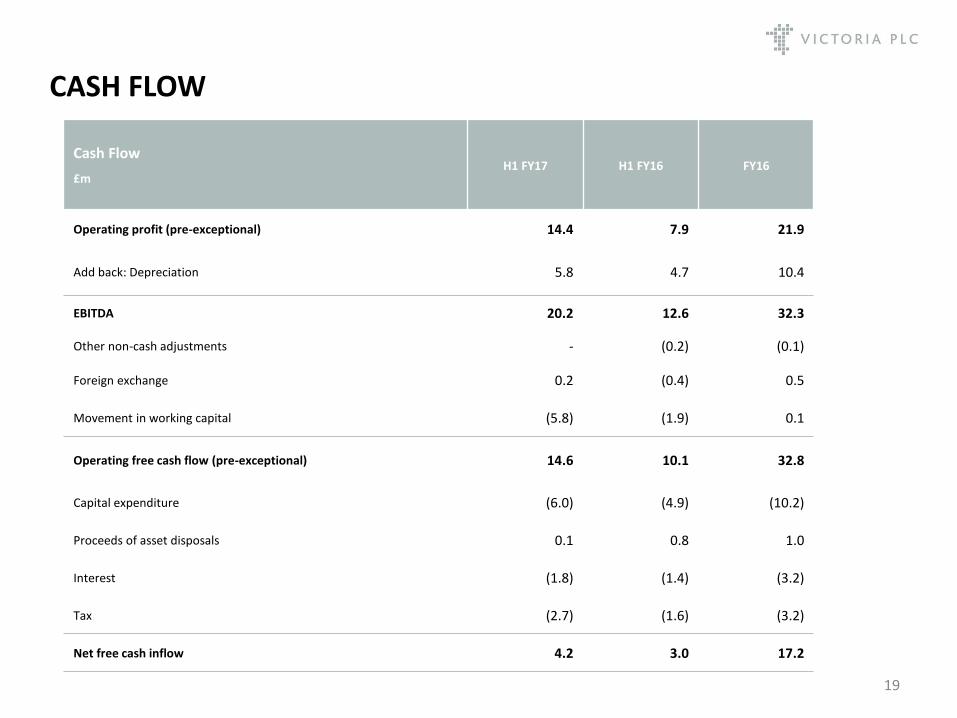
CASH FLOW
Cash Flow
£m H1 FY17 H1 FY16
FY16
Operating profit (pre-exceptional) 14.4 7.9 21.9
Add back: Depreciation 5.8 4.7 10.4
EBITDA 20.2 12.6 32.3
Other non-cash adjustments - (0.2) (0.1)
Foreign exchange 0.2 (0.4) 0.5
Movement in working capital (5.8) (1.9) 0.1
Operating free cash flow (pre-exceptional) 14.6 10.1 32.8
Capital expenditure (6.0) (4.9) (10.2)
Proceeds of asset disposals 0.1 0.8 1.0
Interest (1.8) (1.4) (3.2)
Tax (2.7) (1.6) (3.2)
Net free cash inflow 4.2 3.0 17.2
19

SEGMENTAL PERFORMANCE
First Half Revenue EBITDA EBIT
£m
FY16
FY17
FY16
FY17
FY16
FY17
UK 81.1 112.1 10.2 15.7 6.4 11.1
Australia (A$m) 50.2 75.1 5.9 9.7 4.1 7.5
Australia (£m) 24.5 41.3 2.9 5.3 2.0 4.1
PLC - - (0.5) (0.8) (0.5) (0.8)
Total 105.6 153.4 12.6 20.2 7.9 14.4
Note 1. All numbers are underlying and pre-exceptional
20

DEBT POSITION
Supportive banks – Barclays and HSBC
£200m club facility (including accordion)
Net debt
• £80.5m at 3 Oct 2015
• £67.7m at 1 Oct 2016
Net debt / EBITDA1
• H1 FY16 2.25x
• H1 FY17 1.93x
Interest cover1
• H1 FY16 7.08x
• H1 FY17 9.84x
20
Note 1. Assessed in line with banking covenants

Shareholder register

Rank Investor Name Holding as of 30 DEC 2016 %
22
SHAREHOLDER REGISTER
1 Mr Geoffrey Wilding 30,438,650 33.46 2 Schroder Investment Mgt 5,373,347 5.91 3 Hargreave Hale 4,953,680 5.45 4 BlackRock Investment Mgt 2,996,670 3.29 5 Old Mutual Global Investors 2,921,629 3.21 6 River & Mercantile Asset Mgt 2,707,410 2.98 7 JPMorgan Asset Mgt 2,326,525 2.56 8 Shore Capital Stockbrokers 1,829,275 2.01 9 Hargreaves Lansdown Asset Mgt 1,760,370 1.94 10 Mr Charles Anton 1,613,775 1.77 11 AXA Investment Mgrs 1,508,475 1.66 12 TD Direct Investing 1,487,352 1.64 13 Henderson Volantis 1,315,155 1.45 14 Mr Rodney Style 1,280,000 1.41 15 Broadwalk Asset Mgt 1,109,300 1.22 16 Miss Georgina Anton 1,006,500 1.11 17 Miss Francesca Anton 1,000,000 1.10 18 Halifax Share Dealing 915,323 1.01 19 Mr Peter Anton 882,300 0.97 20 Rowan Dartington & Co 840,810 0.91 TOTAL 68,266,546 75.04

Business overview

Key products
Tufted broadloom carpet
Carpet tiles
Victoria is an international designer, manufacturer and distributor of innovative floorcoverings
Established in 1895, it listed on the London Stock Exchange in 1963.
It has 1800 employees in the UK and Australia
It set up its first factory in Australia in 1954. It now operates from three sites in the state of Victoria and one in Sydney
The largest carpet manufacturer in the UK and second-largest in Australia, the Victoria Group is a major supplier to the independent retail sector, the insurance replacement market, and national retail chains such as Carpetright, ScS, and the John Lewis Partnership
The Group manufactures broadloom carpets, carpet tiles, underlay and flooring accessories
Also markets and distributes a complementary range of third-party manufactured carpets, luxury vinyl tiles and hardwood flooring
Products are primarily within the mid-to-upper end of the market in terms of retail price
The Group owns a large number of strong, well known flooring brands
Victoria Carpets was awarded the Queen’s Royal Warrant in January 2013
FAST FACTS
24
Underlay
Woven broadloom carpet
Luxury Vinyl Tile (LVT) and hardwood flooring
Accessories
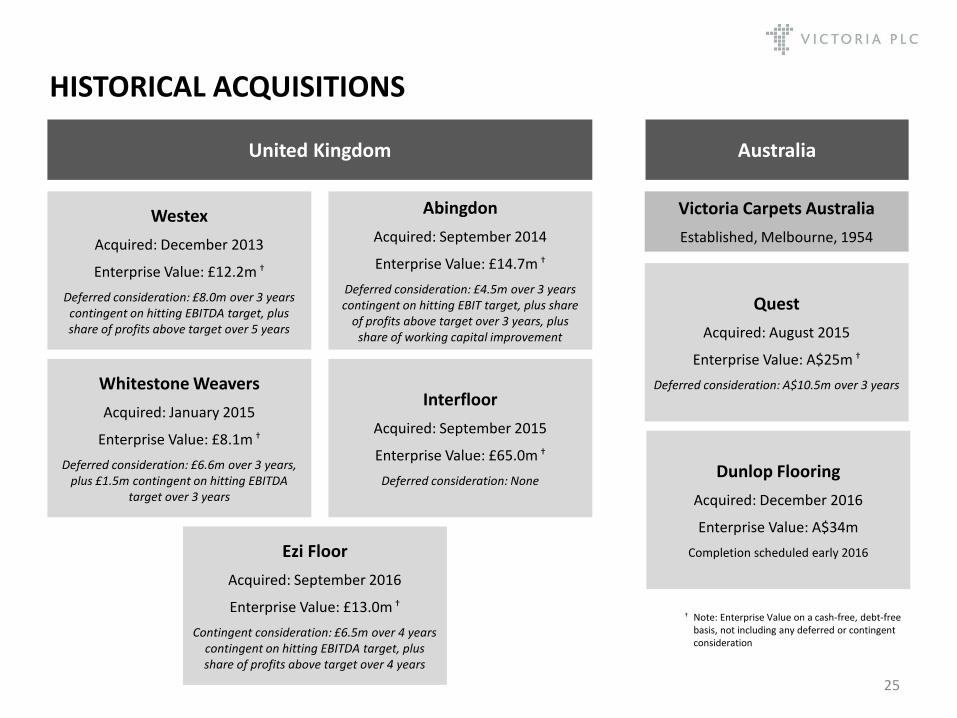
HISTORICAL ACQUISITIONS
25
Whitestone Weavers
Acquired: January 2015
Enterprise Value: £8.1m †
Deferred consideration: £6.6m over 3 years, plus £1.5m contingent on hitting EBITDA
target over 3 years
Westex
Acquired: December 2013
Enterprise Value: £12.2m †
Deferred consideration: £8.0m over 3 years contingent on hitting EBITDA target, plus share of profits above target over 5 years
Abingdon
Acquired: September 2014
Enterprise Value: £14.7m †
Deferred consideration: £4.5m over 3 years contingent on hitting EBIT target, plus share
of profits above target over 3 years, plus share of working capital improvement
Interfloor
Acquired: September 2015
Enterprise Value: £65.0m †
Deferred consideration: None
United Kingdom
Victoria Carpets Australia
Established, Melbourne, 1954
Australia
Quest
Acquired: August 2015
Enterprise Value: A$25m †
Deferred consideration: A$10.5m over 3 years
† Note: Enterprise Value on a cash-free, debt-free basis, not including any deferred or contingent consideration
Ezi Floor
Acquired: September 2016
Enterprise Value: £13.0m †
Contingent consideration: £6.5m over 4 years contingent on hitting EBITDA target, plus share of profits above target over 4 years
Dunlop Flooring
Acquired: December 2016
Enterprise Value: A$34m
Completion scheduled early 2016

GROUP COMPANIES AND BRANDS OVERVIEW Company Key Brands Market Position
UK
Mid level
Mid – Upper
High End
Mid – Upper
Underlay
Underlay
Underlay
Australia & New Zealand
Mid level (Aus)
Underlay and hard flooring (Aus) 26
SITE OVERVIEW
27
County Durham Sales & marketing, Distribution
West Yorkshire Production Sales & marketing, Distribution
Lancashire Underlay production Sales & marketing, Distribution
Kidderminster, West Midlands Head office Production Sales & marketing, Distribution (two sites)
Newport, Wales Production Sales & marketing, Distribution
Melbourne (four sites) Production Sales & marketing, Distribution
Dumfries Accessories production, Distribution
Employees UK: 1,400 Australia: 400
Keighly Underlay production Sales & marketing, Distribution
Sydney (one site) Production Sales & marketing, Distribution
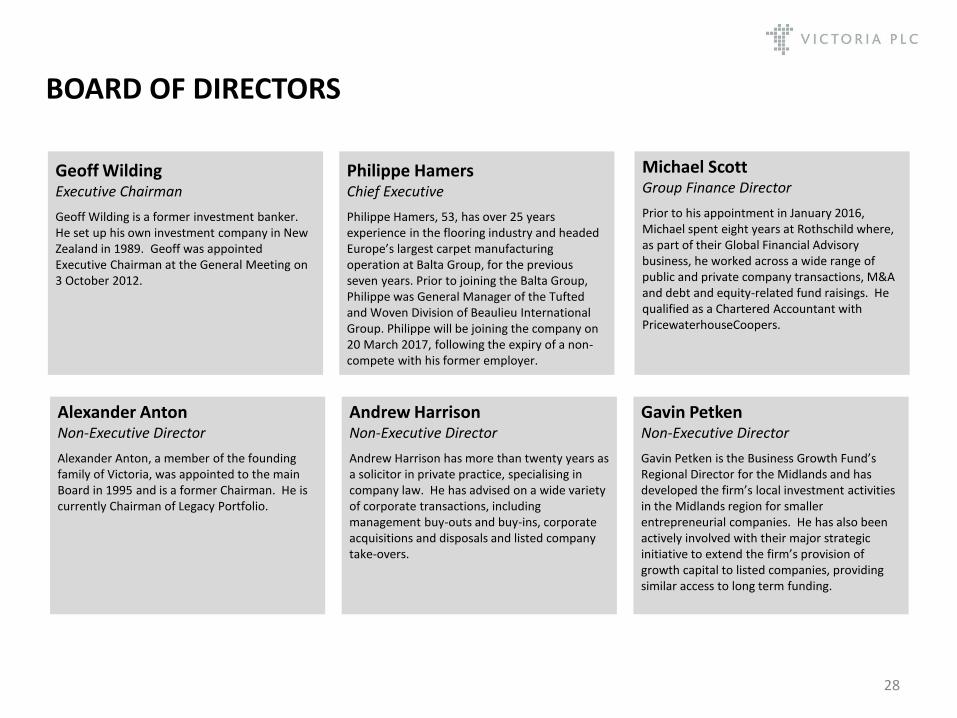
BOARD OF DIRECTORS
28
Geoff Wilding Executive Chairman
Geoff Wilding is a former investment banker. He set up his own investment company in New Zealand in 1989. Geoff was appointed Executive Chairman at the General Meeting on 3 October 2012.
Michael Scott Group Finance Director
Prior to his appointment in January 2016, Michael spent eight years at Rothschild where, as part of their Global Financial Advisory business, he worked across a wide range of public and private company transactions, M&A and debt and equity-related fund raisings. He qualified as a Chartered Accountant with PricewaterhouseCoopers.
Alexander Anton Non-Executive Director
Alexander Anton, a member of the founding family of Victoria, was appointed to the main Board in 1995 and is a former Chairman. He is currently Chairman of Legacy Portfolio.
Andrew Harrison Non-Executive Director
Andrew Harrison has more than twenty years as a solicitor in private practice, specialising in company law. He has advised on a wide variety of corporate transactions, including management buy-outs and buy-ins, corporate acquisitions and disposals and listed company take-overs.
Gavin Petken Non-Executive Director
Gavin Petken is the Business Growth Fund’s Regional Director for the Midlands and has developed the firm’s local investment activities in the Midlands region for smaller entrepreneurial companies. He has also been actively involved with their major strategic initiative to extend the firm’s provision of growth capital to listed companies, providing similar access to long term funding.
Philippe Hamers Chief Executive
Philippe Hamers, 53, has over 25 years experience in the flooring industry and headed Europe’s largest carpet manufacturing operation at Balta Group, for the previous seven years. Prior to joining the Balta Group, Philippe was General Manager of the Tufted and Woven Division of Beaulieu International Group. Philippe will be joining the company on 20 March 2017, following the expiry of a non-compete with his former employer.
Enquiries: +44 (0) 1562 749 300 Geoff Wilding, Chairman Michael Scott, Group Finance Director
www.victoriaplc.com
Worcester Road, Kidderminster, Worcestershire DY10 1JR England Registered in England No. 282204
29
DISCLAIMER
30
• The information contained in this confidential document (“Presentation”) has been prepared by Victoria PLC (the “Company”). It has not been fully verified and is subject to material updating, revision and further amendment. This Presentation has not been approved by an authorised person in accordance with Section 21 of the Financial Services and Markets Act 2000 and therefore it is being delivered for information purposes only to a very limited number of persons and companies who are persons who have professional experience in matters relating to investments and who fall within the category of person set out in Article 19 of the Financial Services and Markets Act 2000 (Financial Promotion) Order 2005 (the “Order”) or are high net worth companies within the meaning set out in Article 49 of the Order or are otherwise permitted to receive it. Any other person who receives this Presentation should not rely or act upon it. By accepting this Presentation and not immediately returning it, the recipient represents and warrants that they are a person who falls within the above description of persons entitled to receive the Presentation. This Presentation is not to be disclosed to any other person or used for any other purpose.
• While the information contained herein has been prepared in good faith, neither the Company nor any of its shareholders, directors, officers, agents, employees or advisers give, have given or have authority to give, any representations or warranties (express or implied) as to, or in relation to, the accuracy, reliability or completeness of the information in this Presentation, or any revision thereof, or of any other written or oral information made or to be made available to any interested party or its advisers (all such information being referred to as “Information”) and liability therefore is expressly disclaimed. Accordingly, neither the Company nor any of its shareholders, directors, officers, agents, employees or advisers take any responsibility for, or will accept any liability whether direct or indirect, express or implied, contractual, tortious, statutory or otherwise, in respect of, the accuracy or completeness of the Information or for any of the opinions contained herein or for any errors, omissions or misstatements or for any loss, howsoever arising, from the use of this Presentation.
• Neither the issue of this Presentation nor any part of its contents is to be taken as any form of commitment on the part of the Company to proceed with any transaction and the right is reserved to terminate any discussions or negotiations with any prospective investors. In no circumstances will the Company be responsible for any costs, losses or expenses incurred in connection with any appraisal or investigation of the Company. In furnishing this Presentation, the Company does not undertake or agree to any obligation to provide the recipient with access to any additional information or to update this Presentation or to correct any inaccuracies in, or omissions from, this Presentation which may become apparent
• This Presentation should not be considered as the giving of investment advice by the Company or any of its shareholders, directors, officers, agents, employees or advisers. In particular, this Presentation does not constitute an offer or invitation to subscribe for or purchase any securities and neither this Presentation nor anything contained herein shall form the basis of any contract or commitment whatsoever. Each party to whom this Presentation is made available must make its own independent assessment of the Company after making such investigations and taking such advice as may be deemed necessary. In particular, any estimates or projections or opinions contained herein necessarily involve significant elements of subjective judgment, analysis and assumptions and each recipient should satisfy itself in relation to such matters
• Neither this Presentation nor any copy of it may be (a) taken or transmitted into Australia, Canada, Japan, the Republic of Ireland, the Republic of South Africa or the United States of America (each a “Restricted Territory”), their territories or possessions; (b) distributed to any U.S. person (as defined in Regulation S under the United States Securities Act of 1933 (as amended)) or (c) distributed to any individual outside a Restricted Territory who is a resident thereof in any such case for the purpose of offer for sale or solicitation or invitation to buy or subscribe any securities or in the context where its distribution may be construed as such offer, solicitation or invitation, in any such case except in compliance with any applicable exemption. The distribution of this document in or to persons subject to other jurisdictions may be restricted by law and persons into whose possession this document comes should inform themselves about, and observe, any such restrictions. Any failure to comply with these restrictions may constitute a violation of the laws of the relevant jurisdiction.