Embed Size (px)
Citation preview
THE EFFECT OF DIVIDEND POLICY ON THE SHAREHOLDERS WEALTH
OF FIRMS LISTED ON THE NAIROBI SECURITIES EXCHANGE
ROSE NJERI NDIRANGU
A RESEARCH PROJECT SUBMITTED IN PARTIAL FULFILLMENT OF THE
REQUIREMENTS FOR THE AWARD OF MASTERS OF SCIENCE IN
FINANCE, SCHOOL OF BUSINESS, UNIVERSITY OF NAIROBI
NOVEMBER, 2019

ii
DECLARATION
This research project is my original work and has not been presented for a degree in any
other University.
Signature ………………………………. Date…………………………………….
NAME: ROSE NJERI NDIRANGU
REG NO: D63/77616/2015
This research project has been submitted for examination with my approval as the
University Supervisor.
Signature ………………………………. Date…………………………………….
SUPERVISOR: DR. WINNIE NYAMUTE
UNIVERSITY OF NAIROBI

iii
DEDICATION
I dedicate this project to my parents Andrew Ndirangu and Rebecca Ndirangu, and my
brother Antony Wambugu.

iv
ACKNOWLEDGMENT
First, I would like to thank God for enabling me to come this far and for giving me the
strength, grace and mercy as I did my research work.
I wish to also thank my family for their support and patience with me as I pursued my
Masters degree and especially in the course of my research.
I would also like to appreciate my supervisor, Dr. Winnie Nyamute for her guidance,
positive criticism and support in the course of my research work.
v
TABLE OF CONTENTS
DECLARATION............................................................................................................... ii
DEDICATION.................................................................................................................. iii
ACKNOWLEDGMENT ................................................................................................. iv
ACRONYMS & ABBREVIATIONS ............................................................................ vii
CHAPTER ONE ................................................................................................................1
INTRODUCTION..............................................................................................................1
1.1 Background of the study ................................................................................................1
1.1.1 Dividend Policy .....................................................................................................2
1.1.2 Shareholders’ wealth .............................................................................................3
1.1.3 Dividend Policy and shareholder wealth ...............................................................4
1.1.4 Nairobi Securities Exchange .................................................................................5
1.2Research Problem………………………………………………………………………7
1.3 ResearchObjective .........................................................................................................9
1.4Valueof the Study………………………………………………………………………9
CHAPTER TWO .............................................................................................................10
LITERATURE REVIEW ...............................................................................................10
2.1 Introduction ..................................................................................................................10
2.2 Theoretical Review ......................................................................................................10
2.2.1 Dividend Irrelevance Theory .................................................................................10
2.2.2 Dividend Relevance Theory ..................................................................................11
2.2.3 Agency Theory ......................................................................................................12
2.3 Determinant of Shareholders Wealth ...........................................................................13
2.3.1 Profitability of the Firm .........................................................................................13
2.3.2 Size of the Firm .....................................................................................................14
2.3.3 Leverage Levels .....................................................................................................14
2.4 Empirical Studies .........................................................................................................15
2.5 Conceptual Framework ................................................................................................19
2.6 Summary of the literature review ................................................................................19
CHAPTER THREE .........................................................................................................21
RESEARCH METHODOLOGY ...................................................................................21
vi
3.1 Introduction ..................................................................................................................21
3.2 Research Design...........................................................................................................21
3.3 Population ....................................................................................................................22
3.4 Sample..........................................................................................................................22
3.5 Data Collection ............................................................................................................22
3.6 Data Analysis ...............................................................................................................22
3.6.1 Analytical Model ...................................................................................................23
3.6.2 Diagnostic Tests ....................................................................................................23
CHAPTER FOUR ............................................................................................................25
DATA ANALYSIS, INTERPRETATION AND DISCUSSION .................................25
4.1 Introduction ..................................................................................................................25
4.2 Descriptive statistics ....................................................................................................25
4.3 Regression Analysis .....................................................................................................27
4.4 Interpretation and discussion of Random effects model results ..................................29
4.5 Diagonistic Tests ..........................................................................................................31
4.6 Cross - market segments analysis ................................................................................34
CHAPTER FIVE .............................................................................................................37
SUMMARY, CONCLUSION AND POLICY IMPLICATIONS ................................37
5.1 Introduction ..................................................................................................................37
5.2 Summary of the findings ..............................................................................................37
5.3 Conclusion and Recommendations ..............................................................................39
5.4 Limitation of the study. ................................................................................................41
5.5 Areas for further studies...............................................................................................42
REFERENCES .................................................................................................................44
APPENDICES ..................................................................................................................47

vii
ACRONYMS & ABBREVIATIONS
CMA Capital Markets Authority
DPS Dividend Per Share
DY Dividend Yield
GEMS Growth Enterprise Market Segment
GLS Generalized Least Squares
IFS International Finance Corporation
M&M Modigliani and Miller
MSMEs Middle Small and Medium Enterprises
NSE Nairobi Securities Exchange
REPS Retained Earnings Per Share
OLS Ordinary Least Square
viii
ABSTRACT
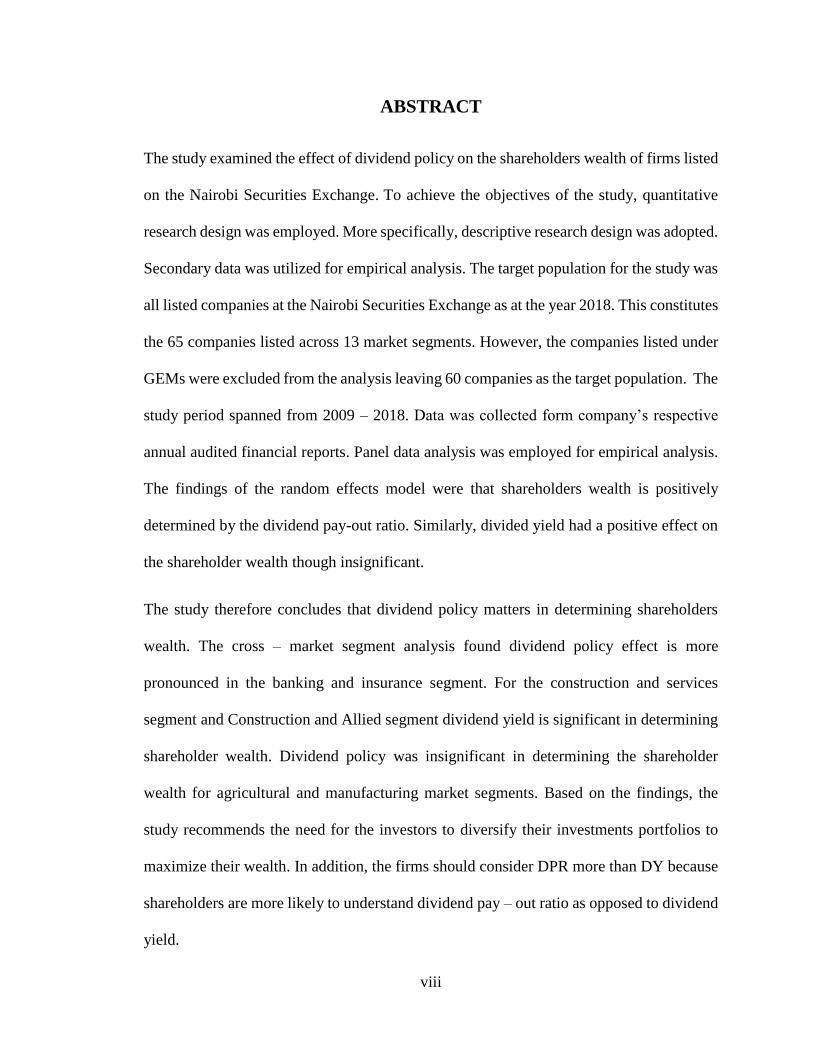
The study examined the effect of dividend policy on the shareholders wealth of firms listed
on the Nairobi Securities Exchange. To achieve the objectives of the study, quantitative
research design was employed. More specifically, descriptive research design was adopted.
Secondary data was utilized for empirical analysis. The target population for the study was
all listed companies at the Nairobi Securities Exchange as at the year 2018. This constitutes
the 65 companies listed across 13 market segments. However, the companies listed under
GEMs were excluded from the analysis leaving 60 companies as the target population. The
study period spanned from 2009 – 2018. Data was collected form company’s respective
annual audited financial reports. Panel data analysis was employed for empirical analysis.
The findings of the random effects model were that shareholders wealth is positively
determined by the dividend pay-out ratio. Similarly, divided yield had a positive effect on
the shareholder wealth though insignificant.
The study therefore concludes that dividend policy matters in determining shareholders
wealth. The cross – market segment analysis found dividend policy effect is more
pronounced in the banking and insurance segment. For the construction and services
segment and Construction and Allied segment dividend yield is significant in determining
shareholder wealth. Dividend policy was insignificant in determining the shareholder
wealth for agricultural and manufacturing market segments. Based on the findings, the
study recommends the need for the investors to diversify their investments portfolios to
maximize their wealth. In addition, the firms should consider DPR more than DY because
shareholders are more likely to understand dividend pay – out ratio as opposed to dividend
yield.
1
CHAPTER ONE
INTRODUCTION
1.1 Background of the study
Dividend policy is one major financial puzzle that has received substantial attention insofar
as empirical examination is concerned. The puzzle arises amid two theoretical strands in
which one asserts that dividend policy does not matter and the other theory that asserts
dividend policy matters. Dividend relevance model was developed by Gordon’s (1959)
insisting importance of dividend policy in a firm. Dividend payment - shareholders value
nexus has been widely researched even of to date. Abdul (2017), asserts that in the absence
of dividends payment, a 43 percent decline in earnings per share is recorded in Nigerian
capital market. Khan (2018) concludes that the dividend irrelevancy model does not hold
in the case of insurance industry of Pakistan. Gul et al. (2012) studied the how dividend
distribution decision affects shareholders’ wealth and concluded that investor preferred
current dividend as opposed to future retention policy and capital appreciation hence
supporting dividend relevance theory. However, Omodero (2017) concludes that value of
shareholders equity is not determined by the dividend payment.
This study was hinged on three core theories. First is the Dividend Irrelevance Theory
(Modigliani and Miller, 1961). According to this theory, shareholders value is dependent
majorly on the capacity of the firm to earn. Secondly, is the dividend relevance model was
developed by Gordon (1959) which insists on the importance of dividend payment for a
firm. Thirdly is the Agency theory developed by Jensen and Meckling (1976). The model
2
asserts that the agency relationship between shareholders and mangers of the firm can only
be obviated by managers paying shareholders dividend.
A global review on the performance of the dividend policy reveals that nowadays dividend
payout is a second order priority for the firms. The first priority of a firm would be
investments and liquidity management which are considered core for firm’s stability. With
the occurrence of the global financial crises of 2007 / 2008, that led to policy
pronouncements towards adoption of Basel III mainly within the financial sector, more
companies have shifted their attention towards liquidity management and asset quality in
attempt to cushion themselves from potential crisis in future.
1.1.1 Dividend Policy
Kapoor (2009) defines dividend policy as a rule or a strategy that a company uses to
structure its dividend payout to shareholders. The managers use dividend policy for
distributing proportions of profits to the firm shareholders. Further, Moyer (2001) defines
dividend policy as a distribution formula that managers apply in distributing earnings to
shareholders. A third definition of dividend policy is given by Van Horne (2001) who
defines the policy as the division guideline between how much earnings are retained for
future expansion and what is paid out to the shareholders as dividends. The definition
concurs with the definition by Paramasivan and Subramanian (2009).
Different studies have applied different and similar measures of dividend policy in their
analysis. Ordu, Enekwe and Anyanwaokoro (2014) in examining the effect of dividend
payment on the shareholders wealth of quoted firms in Nigeria measured dividend policy
by three measures namely: payout ratio, dividend paid for every share, and the yield on the
3
dividend. Omodero (2017) in analyzing shareholders value – dividend payment nexus in
brewery firms listed at the Nigerian stock exchange measured dividend policy by dividend
per share. Abdul (2017) studied the impact of Dividend Policy on Shareholders’ Wealth
within the agricultural sector in Nigeria. In the study dividend policy was measured by
dividend paid for every share and dividend payout.
1.1.2 Shareholders’ wealth
Shareholders’ wealth is the present value of the expected future returns to the owners. It is
what the shareholders earn from their equity invested in a firm. Akit, Hamzah, & Ahmad,
(2015) asserts that any dividend pay out to the shareholders or a rise in the stock price is
beneficial to shareholder. The latter is the capital gain from share while the former is simply
dividend. A general measure of the shareholders wealth is the current market value of the
common stock of the firm. The market price of the firm’s stock at the capital market reveals
the wealth of the shareholders at any given time period. According to Azhagaiah & Priya
(2008) it is this market price of the firm’s common stock that informs the company
investment, financing and dividend decision. In financial theory, it is always assumed that
firm managers are always concerned with the maximization of shareholders’ wealth as their
primary goal. However, this is not always the reality given that principal – agency problem
is a life fact (Azhagaiah & Priya, 2008).
In the company, financial managers are working as agent of owners’ (equity holders) in the
company. Therefore, the first objective of financial managers in a company is to maximize
value of shareholders which is demonstrated by the share market value. According to
Sharfman (2012), shareholders’ wealth maximization can therefore be viewed as a
4
corporate governance issue. This concern should spurn from shareholder compensation
policy (dividend policy), new investments policy as well as the firm’s strategic direction.
Different studies have applied different and similar measures of shareholder wealth in their
analysis. Ordu, Enekwe and Anyanwaokoro (2014) in examining the effect of dividend
payment on the shareholder wealth of quoted firms in Nigeria measured shareholder wealth
by market prices of shares. Omodero (2017) measured shareholders value by market value
per share in Nigerian firms with a focus on the brewery industry. Khan (2018) measured
shareholders wealth using earning per share in his study focusing on insurance industry in
Pakistan. Abdul (2017) used by price earning per share to measure shareholders’ wealth in
his study focusing the agricultural sector in Nigeria.
1.1.3 Dividend Policy and shareholder wealth
The linkage between dividend policy and shareholders wealth has been one of top – ten
financial puzzles in the financial literature. According to Khan (2018) dividend payout, the
ratio of retention and the dividend paid for every share positively affects shareholder’s
wealth thus supporting the dividend relevance theory in Pakistan. Similar relationship in
the same market is reported by Ansar, et al. (2015). However, seminal work by
Litzenberger and Ramaswamy (1979) assert that shareholders prefer capital gains on their
equity as opposed to getting dividends. According to tax preference theory, lower dividend
payouts are preferred by risk averse shareholders in order to avoid current taxation.
In addition, the clientele effect theory asserts that the relationship between dividend policy
and shareholders wealth is dependent on the type of the investors and shareholders. Some
shareholders prefer to plough back profits as opposed to dividend payout. This will
therefore lead to a lower dividend payout and consequently reduce the shareholders wealth.
5
These differences based on different theoretical propositions warrant the need to reexamine
the relationship between the two in different markets as time changes (Litzenberger and
Ramaswamy, 1979)
The relationship between dividend policy and shareholders wealth has wide research
coverage. Abdul (2017) asserts that in the absence of dividends payment, firms’ earning
per share will fall by 43 percent of the firms in Nigerian stock market. Khan (2018) in
analyzing the impact of dividend policy on shareholders’ wealth among the listed insurance
companies in Pakistan conclude the theory of dividend irrelevancy does not hold in the
case of insurance industry of Pakistan. Gul et al. (2012) studied the dividend policy -
stockholders’ wealth nexus concluded that investor preferred current dividend as opposed
to future retention policy and capital appreciation hence supporting dividend relevance
theory. However, Omodero (2017) concludes that shareholders’ wealth is not determined
by the dividend payment.
1.1.4 Nairobi Securities Exchange
Nairobi Stock Exchange can be traced back to 1920’s before creation of the Kenyan state.
In 1954 the Nairobi Securities Exchange was registered under the Societies Act as a
voluntary association of stock brokers without participation of Africans and Indians until
after independence in 1963. In 1980’s the Kenyan government embarked on policy
formulation that will enhance private sector’s contribution to the economy. This led to
formation of the Capital Markets Authority in 1989 whose mission is to facilitate the
development of orderly, fair and efficient capital markets in Kenya through effective
regulation (NSE, 2012).
6
In 1991 the NSE was registered under the Companies Act as a private company limited by
shares. The NSE has come a long way to being rated best performing market by IFC
globally in 1994. In January 2014 the NSE closed the year as the top performing African
market signaling best performance in shareholder wealth, putting the Kenyan bourse on the
international investor spotlight. In May 2015 the NSE slipped to second position in Africa
according to African Alliance market data. It however continues to record and exhibit
strong performance as economic growth resulting in high corporate earnings continue to
positively impact equity markets in the region (NSE, 2012).
Looking at the dividend performance at the NSE, in June 2019, 20 NSE firms paid investors
a record Sh135bn dividend for the 2018 financial year. This was a 42 percent increase
compared to total dividends paid by the top 20 blue chip companies in the year 2017.
However, it’s notable that the record payout was hugely supported by Safaricom and bank
dividends, which helped to soften the blow on shareholders who incurred Sh419 billion
paper losses from last year’s bearish performance of the stock market. In terms of the
market size, the value of the bourse was 1,556,598.00 thousand rising to 1,786,376
thousand in 2015 and further 1,876,049 thousand at end of year 2016 (NSE, 2016).
However, the earning per share for the bourse has been on a decline trend falling from Ksh.
2.30 in year 2014 to Ksh. 1.18 and Ksh 0.71 in year 2015 and 2016 respectively (NSE,
2016). Regarding the payout ratio, the market pay – out ratio averaged at 16.52 rising to
41.53 in 2015 but falling to 38.03 as at end of year 2016. In year 2014, NSE market
recorded a dividend yield of 1.85 percent which marginally improved to 1.98 as at year
2015 before slightly falling to 1.84 percent as at end of year 2016 (NSE, 2016). This
7
performance evidence mixed results for the bourse hence the need for firm level analysis
with regard to individual listed firms.
1.2 Research Problem
Dividend policy has been one of the financial puzzles that has received substantial attention
insofar as empirical examination is concerned. The puzzle arises amid two theoretical
strands in which one assert that dividend policy does not matter and the other theory that
assert dividend policy matters. Modigliani and Miller (1961) dividend irrelevant theory
urges that the corporate’s dividend policy does not influence its value thus shareholders
wealth remains unchanged. On the other hand, Gordon’s (1959) urges on the contrary by
asserting that dividend policy in deed matters. This therefore calls for the studies into the
puzzle to validate or challenge dividend payment- shareholders wealth nexus.
In the recent past, the occurrence of the global financial crises of 2007 / 2008 has led to the
management of the corporates focusing on liquidity management for stability. Corporates
have shifted their attention towards liquidity management and asset quality in an attempt
to cushion themselves from potential crisis in future (Alqahtani and Mayes, 2018). This
therefore could seem to validate the dividend irrelevance theory from the management
point of view with the management’s main goal being corporates stability. However, this
sets the ground for the agency problem since the focus towards liquidity management by
the management may not be in tandem with the shareholders goal of wealth maximization.
This would mean the management still must take into consideration dividend payout since
as postulated by the agency theory, the dividend payout is a good remedy in solving agency
problem.
8
Vast empirical literature does exist globally on dividend policy - shareholders wealth
nexus. Khan (2018) and Ansar, et al. (2015) found that theory of dividend irrelevancy does
not hold in the Pakistan market. Gul et al. (2012) found that investor preferred current
dividend as opposed to future retention policy and capital appreciation hence supporting
dividend relevance theory. Abdul (2017), concluded that in absence of dividends payment,
firms’ earning per share will fall by 43 percent for firms listed at the Nigerian stock market.
The study concluded that payment of dividends by agricultural firms is likely to attract
investments to the sector thus enhancing their profitability. Khan (2018) concluded that the
theory of dividend irrelevancy does not hold in the case of insurance industry of Pakistan.
In Kenyan context, Wanjohi (2017) analyzed insurance firms in the Kenya with reference
to dividend policy - shareholders wealth. A sampled 9 insurance firms was drawn from 49
firms for 2008 – 2015 period. Random effects model of panel data analysis was employed
and found dividend payment to have a positive impact on shareholders’ value. On the
contrary, Muriithi (2015) examined the effect of dividend policy on shareholders’ value
for companies listed at the Nairobi securities exchange. The study found weak effect of
rate, dividend yield and shareholders’ value.
Given the conflicting results in the two studies, the question would be, what is the linkage
between dividend payment and shareholders’ value across different market segments in
Kenya? This is informed by the failure of the local studies to offer grounds for comparison
across different market segments. This study sought to fill in this gap by adopting a cross
- market segments’ analysis thus enabling conclusion on the dividend irrelevancy theory
across different market segments at the Nairobi securities exchange. As such the study
9
sought to unearth, how is the shareholders’ wealth affected by the dividend policy of the
respective firms across different market segments in Kenya?
1.3 Research Objective
The objective of the study was to examine the effect of dividend policy on the shareholders’
wealth in Nairobi Securities Exchange.
1.4 Value of the Study
The value of this study is three – fold. First, is contribution to policy makers. The finding
of the study would be of importance to policy makers such as the national treasury and
capital market authority. The findings of the study will be essential in determining the
significance of the dividend payment among the Kenyan firms. This will inform policy
pronouncements with regard to taxation of the dividend by the relevant policy makers.
Secondly, is the benefit to investors. The findings of the study would be of significance to
the investors in informing them on how dividend policy influences the value for their
equity. This will be core in informing the investors as to whether to advocate dividend
payment or to consider re-investing the earnings for future gains.
Lastly, the study findings would be core in validating the theories underpinning this study
namely: dividend irrelevant theory, dividend relevant theory and the agency theory in so
far as the Kenya capital market is concerned.
10
CHAPTER TWO
LITERATURE REVIEW
2.1 Introduction
This chapter covers literature review around the dividend policy and shareholders’ wealth.
The chapter takes an account of various theories underpinning the study around this area
of study. Further, it examines the determinants of the shareholder’s wealth from an
empirical perspective. The chapter further review the empirical studies in the area of
dividend policy and shareholders’ wealth and concludes summarizing literature coting the
research gaps that the study will seek to fill in.
2.2 Theoretical Review
This section covers the theories upon which the study was underpinned. More specifically,
the section covers the Dividend Irrelevant Theory, Dividend Relevant Theory and the
Agency theory. The models together with their critique and applicable in the study are
discussed below as follow:
2.2.1 Dividend Irrelevance Theory
Modigliani and Miller (1961), developed dividend Irrelevance Theory in 1961. The theory
states that the shareholders wealth is not increased by the dividend policy of the firm.
According to the theory, the firm’s payment of dividend to the shareholders matters. The
theory however based this argument on the assumption of perfectly competitive markets.
The price of the firm’s common market is deemed to be of great importance in determining
the value of the firm which in turn informs the decision towards dividend payment.
11
However, the Dividend Irrelevance Theory has been greatly criticized on the ground of its
assumptions. First is the assumption of a perfect market structure which is unrealistic given
that perfect markets are an ideal situation and not a reality (Black, 1976). Secondly, the
theory assumes that there is no difference between stock dividends and capital gains which
is not realistic. Further, the theory assumes zero transaction costs which is not the reality.
Lastly is the assumption of information symmetry across all market participants, which
does not hold given that markets portray high levels of information asymmetry (Allen,
Bernardo and Welch (2000). The Dividend Irrelevance Theory is relevant in this study in
the conceptualization of the study. By applying the Dividend Irrelevance Theory, the study
was capable in conceptualizing testing significance of dividend payment in a firm.
2.2.2 Dividend Relevance Theory
Gordon (1959) developed the dividend relevance theory in 1959. Dividend relevance
theory asserts the importance of the dividend payment policy as far as the determination of
shareholders wealth is concerned. The theory proponents further argue that the
shareholders wealth can be critically influenced by the dividend policy at hand that the
managers of the firm assumes. According to Gordon (1959), given that majority of the
investors are mainly risk averse, they therefore place preference on the value for money
today as opposed to the value for money in the future. As such they therefore prefer to be
paid dividends as opposed to reinvesting the money and awaiting the future returns from
such investments.
However, the theory is criticized on a number of accounts. The assertion by the theory that
dividend payment trades – off investors’ uncertainty and risk averse nature of the investors
is not valid (Fama and French, 2001). This assertion is not valid since different investors
12
have different risk appetite and different investment time horizons. Therefore, it is not
necessarily the case that dividend payout will reduce investor’s uncertainty. The Dividend
Relevance Theory is relevant in this study in the conceptualization of the study. By
applying the Dividend Irrelevance Theory the study was capable in conceptualizing testing
whether dividend policy of a firm is relevant or not.
2.2.3 Agency Theory
Jensen and Meckling (1976) proposed agency theory in 1976. The theory asserts agency
relationship between owners of the company and managers of the firm can only be obviated
by managers paying shareholders dividend. The agency – principal problem is generally
deemed to occur given that the owners of the firm may not always be in constant monitoring
of the actions by the managers. At sometimes, the managers may pursue some decisions
which are of their own benefits as opposed to the benefits of the shareholders. The agency
theory therefore comes in from the argument that the managers result into paying dividends
to the shareholders in order to deal with the agency – principal problem.
However, the theory is criticized in that it is not always the case that higher agency cost
will imply high dividend payment. The company's management have quite frequently
access to insider information on the company’s operations hence the existence of market
information asymmetry. This could lead to the collapse of the agency theory (Stiglitz,
1985). The Agency theory is relevant in this study in the conceptualization of the study.
By applying the Agency theory, the study was capable in conceptualizing testing the
significance of dividend payment for a firm. From the conceptualization of the agency
theory, dividend payment is mainly used to trade – off the agency problem an argument
that can be validated through empirical analysis in this study.
13
2.3 Determinant of Shareholders Wealth
2.3.1 Profitability of the Firm
The value of the shareholder is deemed to be positively determined by the profit levels of
the firm. Pandey (2005) reports a positive significant relationship between firm profit
levels and shareholder value for all Kuala Lumpur Stock Exchange listed firms. Similarly,
while analyzing what determines shareholders’ value for Nigerian listed firms, Asogwa
(2009) found a positive profit – shareholder value nexus. However, Ramezani et al (2001)
found that though firm profit has positive effect on the shareholders wealth, the effect is
not necessarily significant. Their argument here is that firm growth is always core to make
the effect of profit levels on shareholder wealth significant.
A significant positive correlation exists between accounting profit and shareholder wealth
(Ghasemi and Sarhadi, 2014). The study by Gharaibeh and Dawud (1998) discussed the
effect of the content of the accounting statements and their informational contents
published about the public companies of Jordan, as it concluded that the variable (return
on the equity) helps to explain more than 60% of the changes in the market value of the
companies’ stocks. The relationship between the profitability and shareholder wealth in
Amman Stock Exchange shows insignificant relationship, it showed also that the investors'
tendency to play speculative role rather than long term investment (Al Ajlouni, 2011 and
2008). Another study proved the low coefficient of determination and the lack of a
statistically significant relationship between the return on assets and return on equity on
one hand and between the added market value on the other hand (Zureiqat, 2011).
14
2.3.2 Size of the Firm
The size of the firm is generally optimally measured by the value of the firm’s assets. The
higher the value of the firm’s assets, the larger the size of the firm and the opposite is
always true. Generally, larger firms are assumed to be experiencing growth over years.
Larger firms have higher potential of being listed at the capital markets compared to
smaller firms. This in turn is likely to attract more investors in investing in such firms from
the fact that they are viewed to have potential for growth in so far as shareholder value is
concerned.
According to early work by Agrawal (1996) a negative link between the size of the firm
and the value of the firm is expected. The argument here is that large firms are majorly
faced with the agency – principal problem thus leading to the deterioration of the
shareholders’ value. In addition, large firms are more likely to be sophisticated and
diversified in their operations thus have a negative effect to their respective shareholders
value. This is further supported by Lang and Stulz (1994) who assert that diversification
arising from large firm size causes shareholder wealth destruction. However, Taswan
(2003) reports the contrary by reporting that firm size has a positive influence on the value
of the firm.
2.3.3 Leverage Levels
The financing mix of the firm has a major contribution to the shareholders value. As cited
in the capital structure theory by Modigliani and Miller (1961) the debt – equity ratio of a
firm is core in determining the value of the firm at any point in time. Seunghyun Yoon,
Jaemin, Seoki (2015) a highly levered firm is likely to benefit from the tax shield, which
15
is viewed as a tax saving thus positively influencing the value of the firm positively.
However, it is notable that this comes with the risk of bankruptcy thus indicating that high
leverage levels can be counterproductive leading to decline in the shareholder wealth.
In support to the benefits of the firm debt through tax shield the works by Bowman (1979),
Christie (1982), Mandelker and Rhee (1984) and Bhandari (1988) can be clearly cited as
good examples. Their works allude to the fact that increased leverage levels improves
shareholders’ wealth among the Russian firms. According to the work by Jensen (1986)
the value of the firm will definitely surge up with the firms leverage levels. The argument
behind this conclusion is that high debt levels act as a limiting factor for managers to
undertake decisions at their discretion.
2.4 Empirical Studies
A vast empirical literature does exist in as much as linkage between dividend payment and
shareholders value is concerned. Abdul (2017), studied the impact of Dividend Policy on
the shareholders’ value within the agricultural sector in Nigeria. The study applied an ex –
post facto research design in its undertaking. The population and the sample for the study
were the firms listed under the agricultural segment of Nigeria stock market. Multiple
regression of ordinary least square (OLS) was applied for empirical model estimation
where the earning per share was regressed on dividend per share, dividend payout and price
earning. The finding of the study were that in absence of dividends payment, firms’ earning
per share will fall by 43 percent for firms listed at the Nigerian stock market. The study
concluded that payment of dividends by agricultural firms is likely to attract investments
to the sector thus enhancing their profitability. However, this study fell short of modelling
16
since it relied on Multiple regression of ordinary least square as opposed to panel analysis
thus unable to capture individual heterogeneity of the firms.
Khan (2018) studied insurance industry in Pakistan in attempt to elicit facts on the dividend
payment – shareholder wealth nexus. Analysis was hinged on the need to reconcile the two
strands in literature on the positive effect dividend payment on shareholder value and those
supporting the positive effect dividend policy on shareholder wealth. The sample for the
study was 17 listed insurance companies in Pakistan drawn using non-probability
convenience sampling for 2012-2015. The conclusion of the study was that the theory of
dividend irrelevancy does not hold in the case of insurance industry of Pakistan. However,
this study fell short of modelling since it relied on Multiple regression of ordinary least
square as opposed to panel analysis thus unable to capture individual heterogeneity of the
firms.
Ansar, et al. (2015) investigated the link between dividend policy and shareholders’ value
in Pakistan market. Study used 30 firms as a sample from such sectors, textile, chemical
and cement with the multiple regression model being employed for empirical analysis. The
market price per share was used as measure of shareholders’ wealth with the return on
equity, retained earnings per share, lagged price, dividend per share being adopted as the
explanatory variables to the model. The finding indicated positive and robust relationship
of dividend policy with stockholders’ wealth. The conclusion of the study was that the
theory of dividend irrelevancy does not hold for the industries in the sampled sectors in
Pakistan. However, this study fell short of modelling since it relied on Multiple regression
as opposed to panel analysis thus unable to capture individual heterogeneity of the firms.
17
Gul et al. (2012) studied the dividend policy - stockholders’ wealth nexus. In drawing the
sample for the study, quota random sampling tool was applied to select 10 listed companies
out of 216 companies from different sectors during period of 2015. Questionnaires were
applied in data collection from the sampled companies. The study found that dividend
payment had a positive influence on the shareholders’ value. In conclusion, the findings
concluded that investor preferred current dividend as opposed to future retention policy
and capital appreciation. The critique is that the study used primary data as opposed to
secondary data thus possibility of subjectivity in the responses.
Within the brewery industry in Nigeria, Omodero (2017) examined shareholders wealth
maximization from the focus of dividend payment policy of the companies. The study
adopted a cross-survey research design in its undertaking. The market value per share
which measured shareholders’ wealth was regressed on dividend per share and the earnings
per share. The study findings were that dividend policy has no effect on the shareholders
wealth. The conclusion was that shareholders’ wealth is not determined by the dividend
payment. However, this study fell short of modelling since it relied on Multiple regression
as opposed to panel analysis thus unable to capture individual heterogeneity of the firms.
Ordu, Enekwe and Anyanwaokoro (2014) examined dividend payment – shareholders’
value among the Nigerian quoted firms in Nigeria. The study involved 17 listed firms in
the Nigerian bourse for 2000 to 2011 period. By applying the ordinary least squares
estimation techniques the study found that dividend per share causes a rise in the value of
the rise in market price per share of quoted firms in Nigeria. However, this study fell short
of modelling since it relied on ordinary least square estimation model as opposed to panel
analysis thus unable to capture individual heterogeneity of the firms.
18
An analysis of UK retail industry was conducted by Chenchehene and Mensah (2015) with
regard to shareholder value drawing inferences from 25 firms operating in the retail
industry. The study reported significant effect of dividend payout on shareholder wealth.
Further, Akit, Hamzah, and Ahmad (2015) focused on the Shariah compliant versus non –
shariah compliant firms in Malysia 2004 – 2013 period. Fixed-Effect Generalized Least
Squares estimation techniques was relied for empirical analysis. The finding was that
dividend policy significantly determines shareholders’ value for Shariah and non-Shariah
compliance companies.
In Kenyan context, Wanjohi (2017) analyzed insurance firms in the Kenya with reference
to dividend policy - shareholders wealth. A sampled 9 insurance firms was drawn from 49
firms for 2008 – 2015 period. Random effects model of panel data analysis was employed.
A positive effect of dividend payment on shareholders’ value was found. However, the
study concluded that a negative significant linkage of the two. However, the study was
silent on the fixed effects model and the pooled regression model of the panel analysis but
only reported the findings of the random effects model.
Wanje and Otinga (2019) studied the influence of dividend policy on stock performance
among banking sector firms listed in Nairobi securities exchange, Kenya. They concluded
dividend policy is a significant predictor of stock performance, thus trading firms that craft
and implement viable dividend policies can boost their stock performance. The study
recommended that trading companies should craft and implement viable dividend policies
that will attract a positive yield on their stock performance.
19
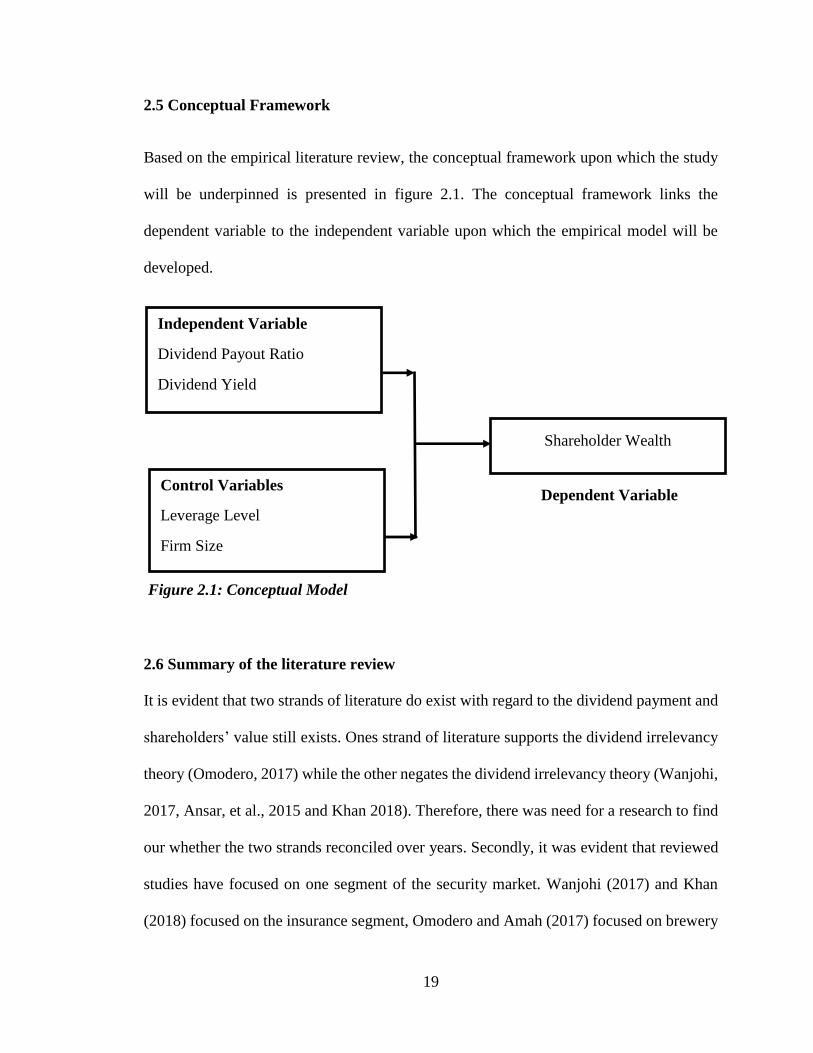
2.5 Conceptual Framework
Based on the empirical literature review, the conceptual framework upon which the study
will be underpinned is presented in figure 2.1. The conceptual framework links the
dependent variable to the independent variable upon which the empirical model will be
developed.
2.6 Summary of the literature review
It is evident that two strands of literature do exist with regard to the dividend payment and
shareholders’ value still exists. Ones strand of literature supports the dividend irrelevancy
theory (Omodero, 2017) while the other negates the dividend irrelevancy theory (Wanjohi,
2017, Ansar, et al., 2015 and Khan 2018). Therefore, there was need for a research to find
our whether the two strands reconciled over years. Secondly, it was evident that reviewed
studies have focused on one segment of the security market. Wanjohi (2017) and Khan
(2018) focused on the insurance segment, Omodero and Amah (2017) focused on brewery
Independent Variable
Dividend Payout Ratio
Dividend Yield
Shareholder Wealth
Control Variables
Leverage Level
Firm Size
Dependent Variable
Figure 2.1: Conceptual Model

20
industry while Abdul (2017) focused on the agricultural sector. Therefore, they failed to
offer grounds for comparison across different market segments. A cross - market segments’
analysis was considered thus enabling conclusion on the dividend irrelevancy theory across
different market segments of the Nairobi Securities Exchange.
21
CHAPTER THREE
RESEARCH METHODOLOGY
3.1 Introduction
The methodology that was used in the execution of the study in pursuit of the study
objectives is covered in this chapter. More specifically, the chapter covers the research
design that was employed in the study, study target population study sample, how the data
for the study was collected as well as the data analysis.
3.2 Research Design
The research design is the study framework by definition. Research design can be either
quantitative or qualitative. Quantitative research design entails measuring of specific
research objectives by applying objective or specified statistical procedures. On the other
hand, qualitative research design involves studying human behavior, opinions, themes and
motivations with limited use of statistical data analysis. The study employed quantitative
research design. This is because the study was based on secondary data from the Nairobi
Securities Exchange. Descriptive research design was employed. The adoption of the
descriptive research design was informed by its ability to explore and offer detailed
explanation on the study’s unit of analysis. In this case, the study sought to explore and
explain how dividend policy affects shareholder wealth in listed companies across market
segments. The selection of the descriptive research design was informed by the research
objective. In addition, descriptive research design is a structured research process and relies
more on probability sampling in drawing a sample from the target population.
22
3.3 Population
The target population for the study was all listed companies at the Nairobi Securities
Exchange as at the year 2018. This constitutes the 65 companies listed across 13 market
segments.
3.4 Sample
First the study used simple random cluster sampling in drawing the sample from the target
population. First, from the target population of 65 companies, 5 companies listed under the
Growth Enterprise Market Segments (GEMs) were eliminated since they are new entrant
in the market and dividend policy was not likely to be of significance in them leaving the
target population of 60 listed firms. Then the 60 firms remaining in the target population
were organized in the market segments under which they are listed. The market segments
were therefore the clusters.
3.5 Data Collection
Secondary data was employed for empirical analysis in the study. Company’s respective
annual audited financial reports was the main source of the secondary data. The reports
were obtained from the Capital Markets Authority (CMA). The study period was 10 years
ranging from year 2009 to 2018.
3.6 Data Analysis
Panel data analysis was employed for empirical analysis. This was informed by the fact
that the data for the study includes both the cross sectional aspect (listed companies) and
the time series aspect of the data (2009 – 2018). More specifically, pooled model was
23
employed for analysis. Further to the overall regression analysis, inferential statistics
analysis was employed to examine whether the shareholder wealth changes across the
market segments with the changes in the dividend policy. In addition, data analysis
entailed generation of the descriptive statistics for the model variables.
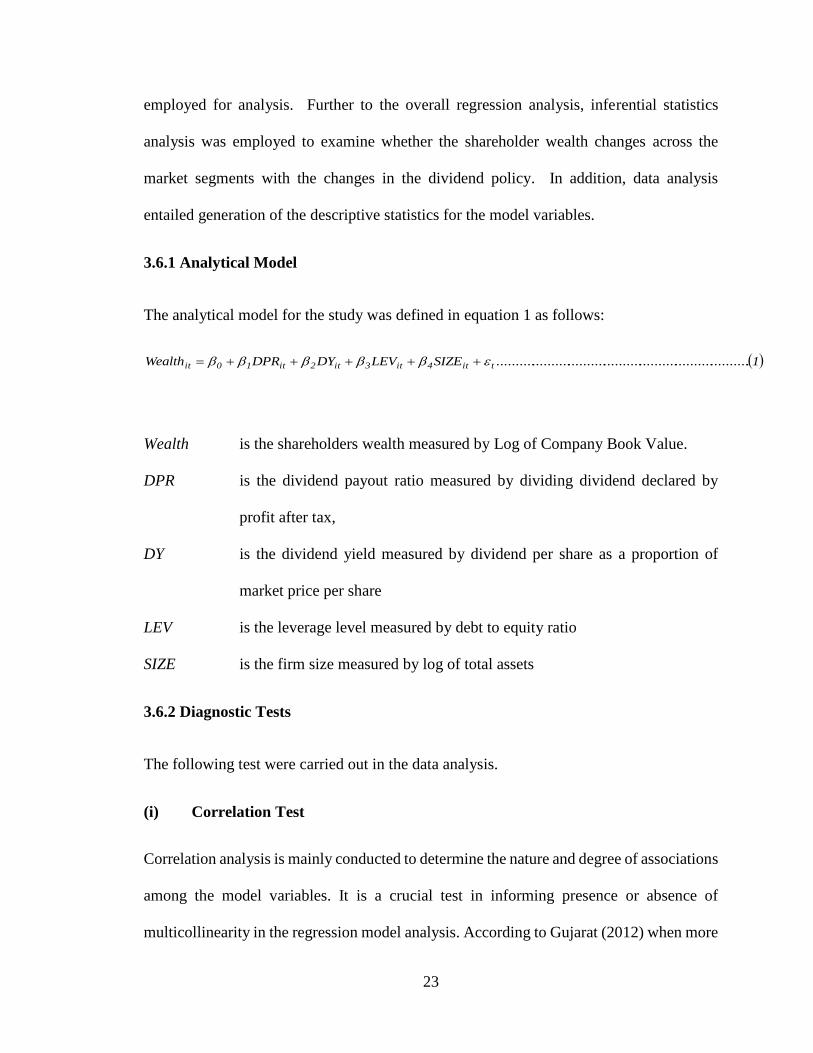
3.6.1 Analytical Model
The analytical model for the study was defined in equation 1 as follows:
1.......................................................................SIZELEVDYDPRWealth tit4it3it2it10it
Wealth is the shareholders wealth measured by Log of Company Book Value.
DPR is the dividend payout ratio measured by dividing dividend declared by
profit after tax,
DY is the dividend yield measured by dividend per share as a proportion of
market price per share
LEV is the leverage level measured by debt to equity ratio
SIZE is the firm size measured by log of total assets
3.6.2 Diagnostic Tests
The following test were carried out in the data analysis.
(i) Correlation Test
Correlation analysis is mainly conducted to determine the nature and degree of associations
among the model variables. It is a crucial test in informing presence or absence of
multicollinearity in the regression model analysis. According to Gujarat (2012) when more
24
than two predictor variables in a multiple regression have a high relationship then that
phenomenon is called multicollinearity (Gujarat, 2012). In this study, the Pearson
correlation coefficient was applied to test for the level of correlation among the model
variables.
(ii) Multicollinearity Test
Multicollinearity is a regression problem that arises from interrelation between the
independent variables in a model. To test for multicollinearity, the Variance Inflation
Factors (VIF) is usually applied. Generally, the VIF is equal to 1.0 if no factors are
correlated, which implies that there is no multicollinearity. If the VIF is greater than 1.0,
the predictors may be moderately correlated but still below the multicollinearity threshold
(Gujarat, 2012). A VIF of more than 10 would invalidate the estimated model implying
the presence of multicollinearity the regression model.
(iii) Heteroscedasticity Test
Heteroscedasticity is an econometric problem of not constant but rather keeps on changing.
The presence of heteroscedasticity problem implies that the estimated model coefficients
are not Best, Linear and Unbiased Estimators (BLUE). This further implies that any
hypothesis testing carried out using such coefficients and their respective standard errors
would be inconsistent. To test for the heteroscedasticity problem, Breusch-Pagan-Godfrey
test was used.
25
CHAPTER FOUR
DATA ANALYSIS, INTERPRETATION AND DISCUSSION
4.1 Introduction
This chapter entails presentations of the data analysis outcome. In addition to results
presentation, the chapter takes into account interpretation of the results and the discussion
of the results in line with the study objectives.
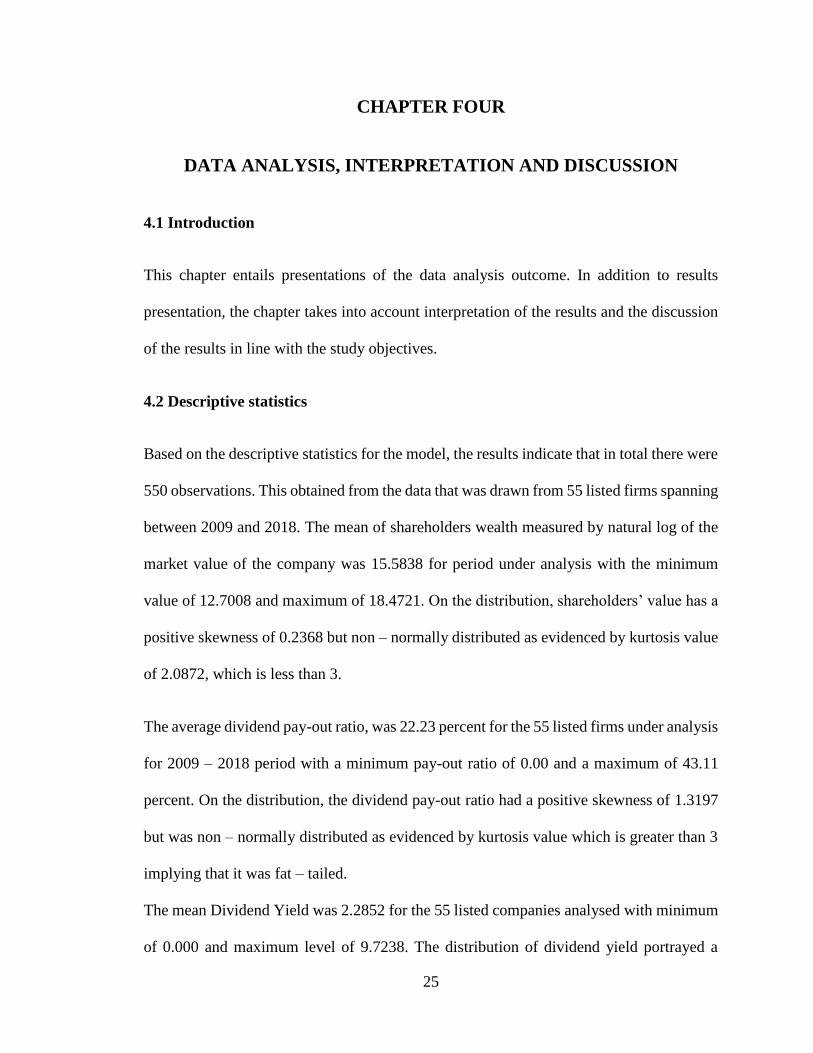
4.2 Descriptive statistics
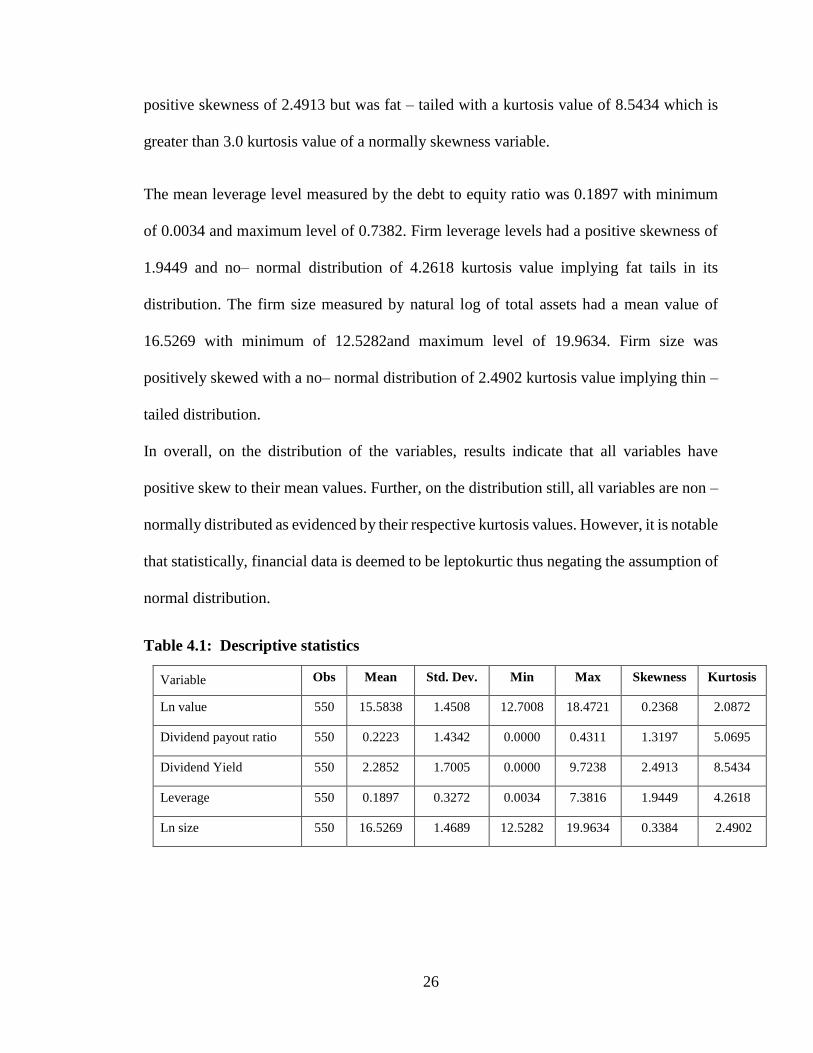
Based on the descriptive statistics for the model, the results indicate that in total there were
550 observations. This obtained from the data that was drawn from 55 listed firms spanning
between 2009 and 2018. The mean of shareholders wealth measured by natural log of the
market value of the company was 15.5838 for period under analysis with the minimum
value of 12.7008 and maximum of 18.4721. On the distribution, shareholders’ value has a
positive skewness of 0.2368 but non – normally distributed as evidenced by kurtosis value
of 2.0872, which is less than 3.
The average dividend pay-out ratio, was 22.23 percent for the 55 listed firms under analysis
for 2009 – 2018 period with a minimum pay-out ratio of 0.00 and a maximum of 43.11
percent. On the distribution, the dividend pay-out ratio had a positive skewness of 1.3197
but was non – normally distributed as evidenced by kurtosis value which is greater than 3
implying that it was fat – tailed.
The mean Dividend Yield was 2.2852 for the 55 listed companies analysed with minimum
of 0.000 and maximum level of 9.7238. The distribution of dividend yield portrayed a
26
positive skewness of 2.4913 but was fat – tailed with a kurtosis value of 8.5434 which is
greater than 3.0 kurtosis value of a normally skewness variable.
The mean leverage level measured by the debt to equity ratio was 0.1897 with minimum
of 0.0034 and maximum level of 0.7382. Firm leverage levels had a positive skewness of
1.9449 and no– normal distribution of 4.2618 kurtosis value implying fat tails in its
distribution. The firm size measured by natural log of total assets had a mean value of
16.5269 with minimum of 12.5282and maximum level of 19.9634. Firm size was
positively skewed with a no– normal distribution of 2.4902 kurtosis value implying thin –
tailed distribution.
In overall, on the distribution of the variables, results indicate that all variables have
positive skew to their mean values. Further, on the distribution still, all variables are non –
normally distributed as evidenced by their respective kurtosis values. However, it is notable
that statistically, financial data is deemed to be leptokurtic thus negating the assumption of
normal distribution.
Table 4.1: Descriptive statistics
Variable Obs Mean Std. Dev. Min Max Skewness Kurtosis
Ln value 550 15.5838 1.4508 12.7008 18.4721 0.2368 2.0872
Dividend payout ratio 550 0.2223 1.4342 0.0000 0.4311 1.3197 5.0695
Dividend Yield 550 2.2852 1.7005 0.0000 9.7238 2.4913 8.5434
Leverage 550 0.1897 0.3272 0.0034 7.3816 1.9449 4.2618
Ln size 550 16.5269 1.4689 12.5282 19.9634 0.3384 2.4902
27
4.3 Regression Analysis
4.3.1 Diagnostic Tests for Random Effects, Fixed Effects or Pooled OLS Models
The diagnostic tests are used to identify the best model of study. Various estimation
approaches can be applied to panel data, including; fixed effects, random effects and the
pooled OLS model. The researcher carried out carried the following panel data diagnostics
to identify the best model for the current study.
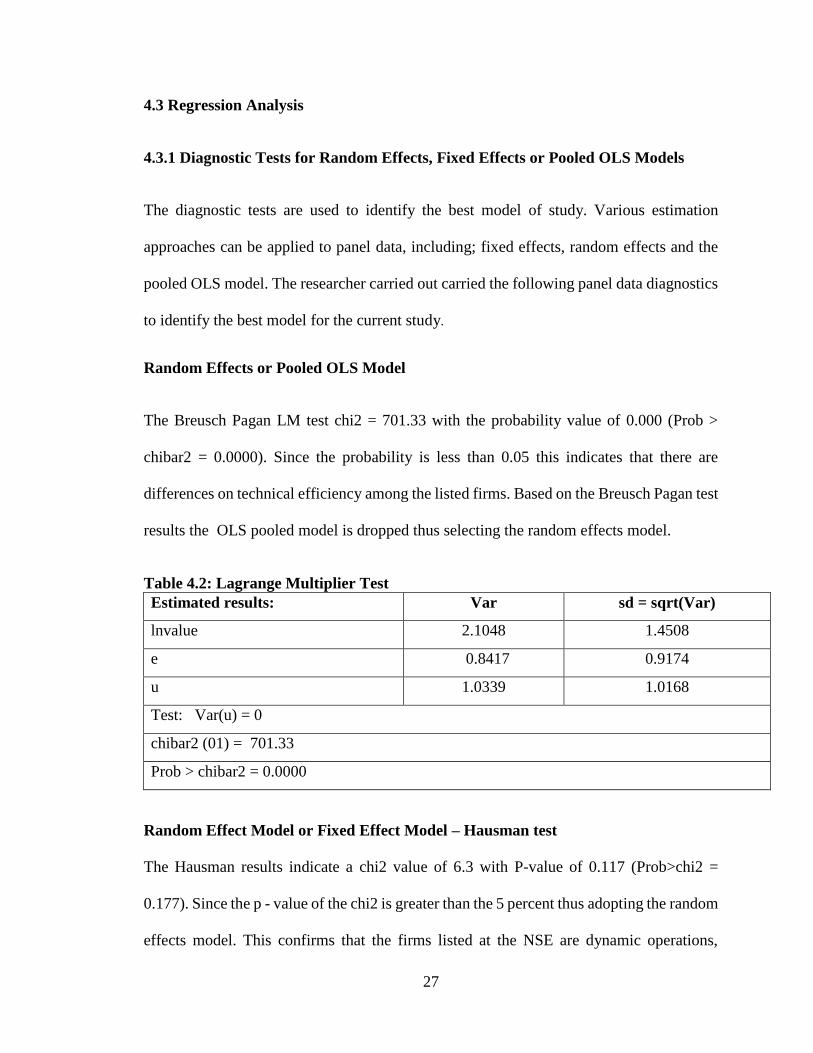
Random Effects or Pooled OLS Model
The Breusch Pagan LM test chi2 = 701.33 with the probability value of 0.000 (Prob >
chibar2 = 0.0000). Since the probability is less than 0.05 this indicates that there are
differences on technical efficiency among the listed firms. Based on the Breusch Pagan test
results the OLS pooled model is dropped thus selecting the random effects model.
Table 4.2: Lagrange Multiplier Test
Estimated results: Var sd = sqrt(Var)
lnvalue 2.1048 1.4508
e 0.8417 0.9174
u 1.0339 1.0168
Test: Var(u) = 0
chibar2 (01) = 701.33
Prob > chibar2 = 0.0000
Random Effect Model or Fixed Effect Model – Hausman test
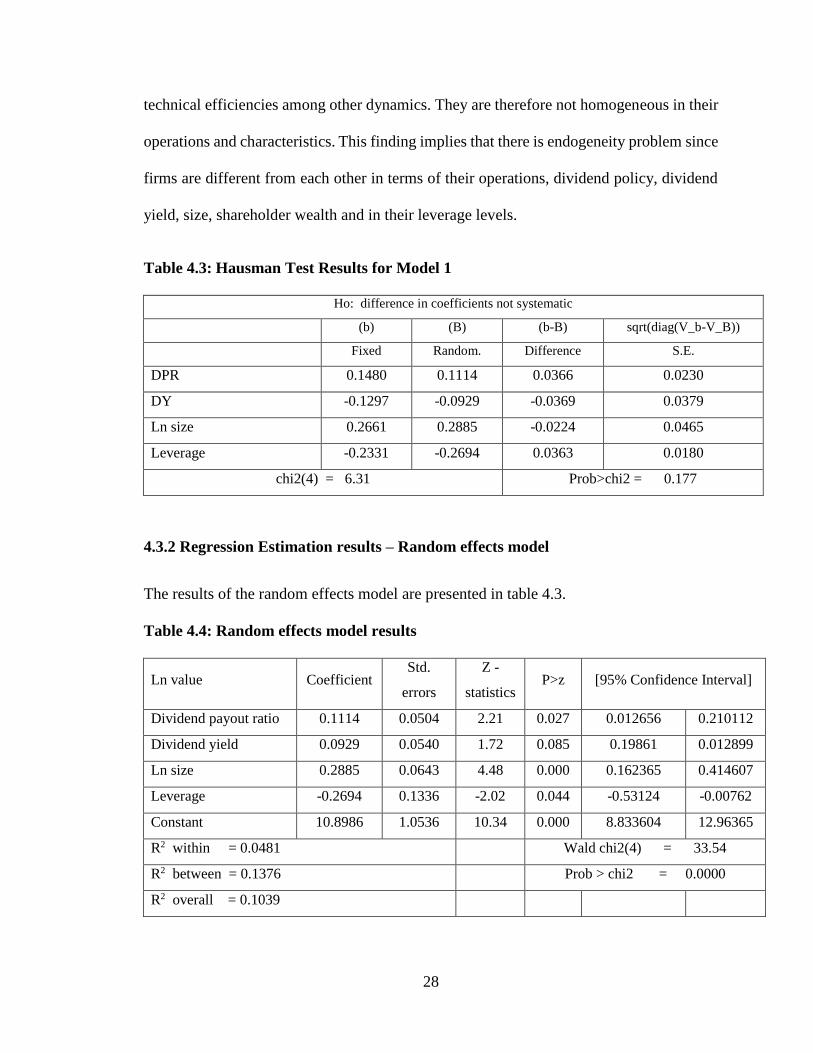
The Hausman results indicate a chi2 value of 6.3 with P-value of 0.117 (Prob>chi2 =
0.177). Since the p - value of the chi2 is greater than the 5 percent thus adopting the random
effects model. This confirms that the firms listed at the NSE are dynamic operations,
28
technical efficiencies among other dynamics. They are therefore not homogeneous in their
operations and characteristics. This finding implies that there is endogeneity problem since
firms are different from each other in terms of their operations, dividend policy, dividend
yield, size, shareholder wealth and in their leverage levels.
Table 4.3: Hausman Test Results for Model 1
Ho: difference in coefficients not systematic
(b) (B) (b-B) sqrt(diag(V_b-V_B))
Fixed Random. Difference S.E.
DPR 0.1480 0.1114 0.0366 0.0230
DY -0.1297 -0.0929 -0.0369 0.0379
Ln size 0.2661 0.2885 -0.0224 0.0465
Leverage -0.2331 -0.2694 0.0363 0.0180
chi2(4) = 6.31 Prob>chi2 = 0.177
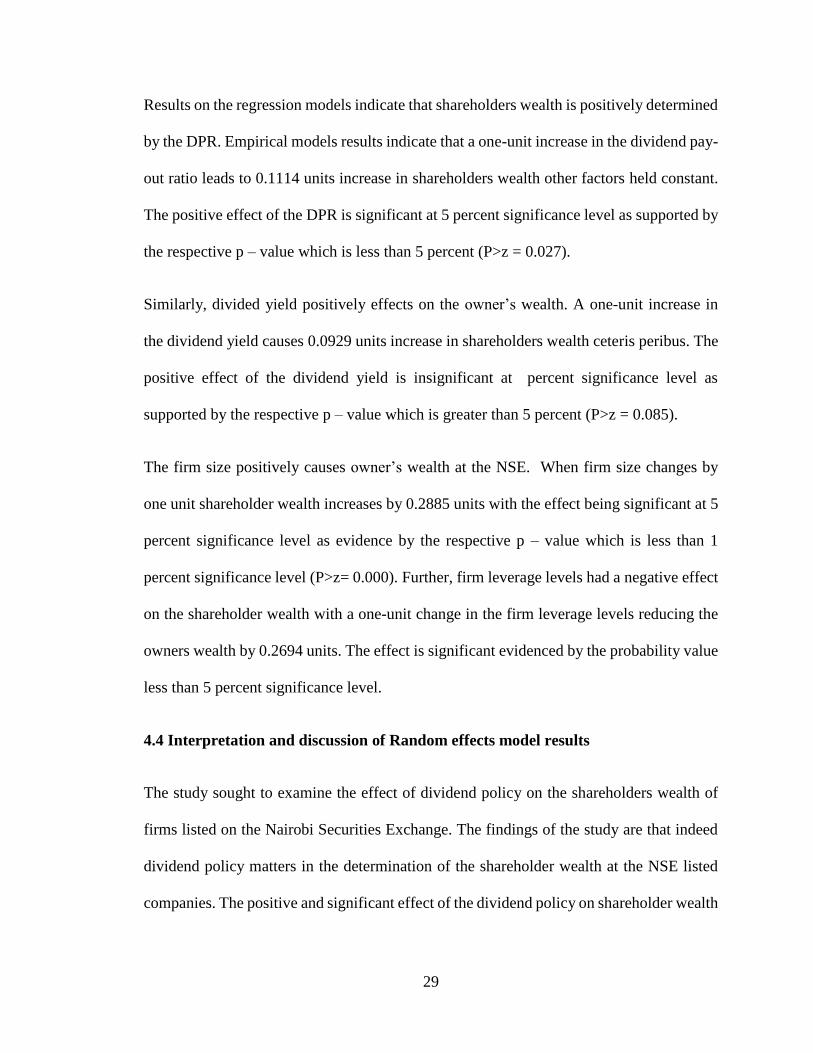
4.3.2 Regression Estimation results – Random effects model
The results of the random effects model are presented in table 4.3.
Table 4.4: Random effects model results
Ln value Coefficient Std.
errors
Z -
statistics P>z [95% Confidence Interval]
Dividend payout ratio 0.1114 0.0504 2.21 0.027 0.012656 0.210112
Dividend yield 0.0929 0.0540 1.72 0.085 0.19861 0.012899
Ln size 0.2885 0.0643 4.48 0.000 0.162365 0.414607
Leverage -0.2694 0.1336 -2.02 0.044 -0.53124 -0.00762
Constant 10.8986 1.0536 10.34 0.000 8.833604 12.96365
R2 within = 0.0481 Wald chi2(4) = 33.54
R2 between = 0.1376 Prob > chi2 = 0.0000
R2 overall = 0.1039
29
Results on the regression models indicate that shareholders wealth is positively determined
by the DPR. Empirical models results indicate that a one-unit increase in the dividend pay-
out ratio leads to 0.1114 units increase in shareholders wealth other factors held constant.
The positive effect of the DPR is significant at 5 percent significance level as supported by
the respective p – value which is less than 5 percent (P>z = 0.027).
Similarly, divided yield positively effects on the owner’s wealth. A one-unit increase in
the dividend yield causes 0.0929 units increase in shareholders wealth ceteris peribus. The
positive effect of the dividend yield is insignificant at percent significance level as
supported by the respective p – value which is greater than 5 percent (P>z = 0.085).
The firm size positively causes owner’s wealth at the NSE. When firm size changes by
one unit shareholder wealth increases by 0.2885 units with the effect being significant at 5
percent significance level as evidence by the respective p – value which is less than 1
percent significance level (P>z= 0.000). Further, firm leverage levels had a negative effect
on the shareholder wealth with a one-unit change in the firm leverage levels reducing the
owners wealth by 0.2694 units. The effect is significant evidenced by the probability value
less than 5 percent significance level.
4.4 Interpretation and discussion of Random effects model results
The study sought to examine the effect of dividend policy on the shareholders wealth of
firms listed on the Nairobi Securities Exchange. The findings of the study are that indeed
dividend policy matters in the determination of the shareholder wealth at the NSE listed
companies. The positive and significant effect of the dividend policy on shareholder wealth
30
in the Kenyan listed firms is a manifestation that the investors in these firms value divided
as a return to their investments.
From the findings, the payment of dividends plays a crucial role in determining the value
of the firm. This is majorly reflected through the changes in the share prices. Based on the
findings, it is expected that the dividend paying firm is more likely to have the highest
value in the market arising from share price. Given that the results imply that dividend
matters, the implication here would be that shareholders would be reluctant to sell their
shares cum dividend but rather hold on and earn the dividend after which they could sell
the shares ex – dividend. Further, there is an implication that investors may not be much
keen on the capital gain but rather prefer dividend as a return to their equity.
The findings of the study are in agreement with the findings by Gul et al. (2012) studied
the dividend policy - stockholders’ wealth nexus. In drawing the sample for the study,
quota random sampling tool was applied to select 10 listed companies out of 216
companies from different sectors during period of 2015. Questionnaires were applied in
data collection from the sampled companies. The study found that dividend payment had
a positive influence on the shareholders’ value. In conclusion, the findings concluded that
investor preferred current dividend as opposed to future retention policy and capital
appreciation.
Similar findings were reported by Ordu, Enekwe and Anyanwaokoro (2014) who examined
dividend payment – shareholders’ value among the Nigerian quoted firms in Nigeria. The
study involved 17 listed firms in the Nigerian bourse for 2000 to 2011 period. By applying
31
the ordinary least squares estimation techniques the study found that dividend per share
causes a rise in the value of the rise in market price per share of quoted firms in Nigeria.
However, the study findings were in contrary to the findings by Khan (2018) studied
insurance industry in Pakistan in attempt to elicit facts on the dividend payment –
shareholder wealth nexus and concluded that the theory of dividend irrelevancy does not
hold in the case of insurance industry of Pakistan.
Within the brewery industry in Nigeria, Omodero (2017) shareholders wealth
maximization from the focus of dividend payment policy of the companies. The market
value per share which measured shareholders’ wealth was regressed on dividend per share
and the earnings per share. The study findings were that dividend has no effect on the
shareholders wealth. The conclusion was that owner’s wealth is not determined by the
dividend payment. However, this study fell short of modelling since it relied on Multiple
regression as opposed to panel analysis thus unable to capture individual heterogeneity of
the firms.
4.5 Diagonistic Tests
The following diagonistic tests were carried out in the data analysis.
Correlation Test
Correlation analysis is mainly conducted to examine the degree of associations among the
model variables. It is a crucial test in informing presence or absence of multicollinearity in
the regression model analysis. According to Gujarat (2012) when more than two predictor
variables in a multiple regression have a high relationship then that phenomenon is called
32
multicollinearity (Gujarat, 2012). In this study, the Pearson correlation was applied to test
for the level of correlation among the model variables.
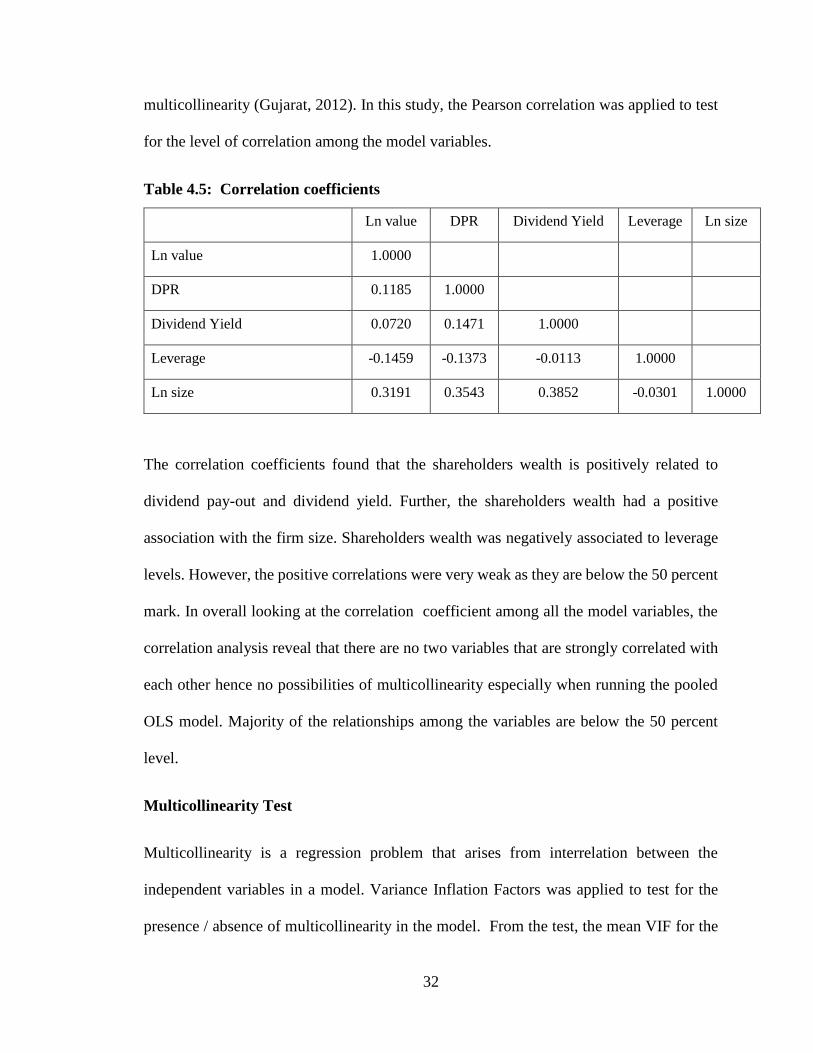
Table 4.5: Correlation coefficients
The correlation coefficients found that the shareholders wealth is positively related to
dividend pay-out and dividend yield. Further, the shareholders wealth had a positive
association with the firm size. Shareholders wealth was negatively associated to leverage
levels. However, the positive correlations were very weak as they are below the 50 percent
mark. In overall looking at the correlation coefficient among all the model variables, the
correlation analysis reveal that there are no two variables that are strongly correlated with
each other hence no possibilities of multicollinearity especially when running the pooled
OLS model. Majority of the relationships among the variables are below the 50 percent
level.
Multicollinearity Test
Multicollinearity is a regression problem that arises from interrelation between the
independent variables in a model. Variance Inflation Factors was applied to test for the
presence / absence of multicollinearity in the model. From the test, the mean VIF for the
Ln value DPR Dividend Yield Leverage Ln size
Ln value 1.0000
DPR 0.1185 1.0000
Dividend Yield 0.0720 0.1471 1.0000
Leverage -0.1459 -0.1373 -0.0113 1.0000
Ln size 0.3191 0.3543 0.3852 -0.0301 1.0000
33
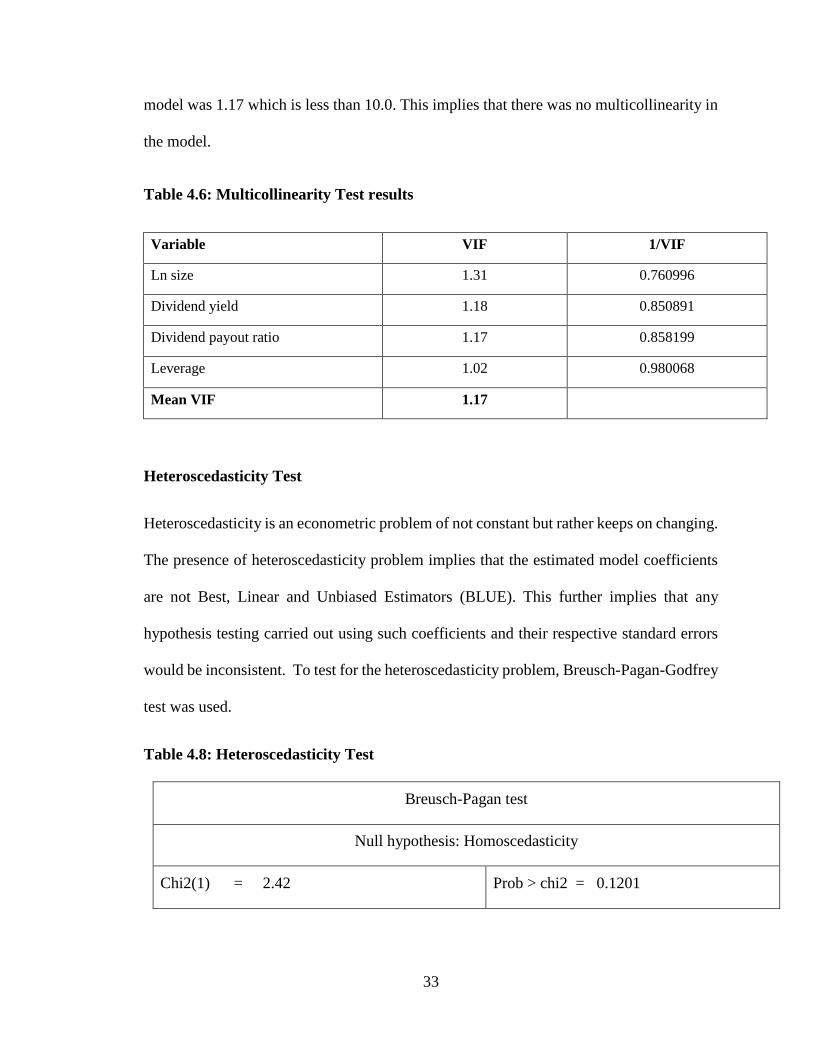
model was 1.17 which is less than 10.0. This implies that there was no multicollinearity in
the model.
Table 4.6: Multicollinearity Test results
Variable VIF 1/VIF
Ln size 1.31 0.760996
Dividend yield 1.18 0.850891
Dividend payout ratio 1.17 0.858199
Leverage 1.02 0.980068
Mean VIF 1.17
Heteroscedasticity Test
Heteroscedasticity is an econometric problem of not constant but rather keeps on changing.
The presence of heteroscedasticity problem implies that the estimated model coefficients
are not Best, Linear and Unbiased Estimators (BLUE). This further implies that any
hypothesis testing carried out using such coefficients and their respective standard errors
would be inconsistent. To test for the heteroscedasticity problem, Breusch-Pagan-Godfrey
test was used.
Table 4.8: Heteroscedasticity Test
Breusch-Pagan test
Null hypothesis: Homoscedasticity
Chi2(1) = 2.42 Prob > chi2 = 0.1201
34
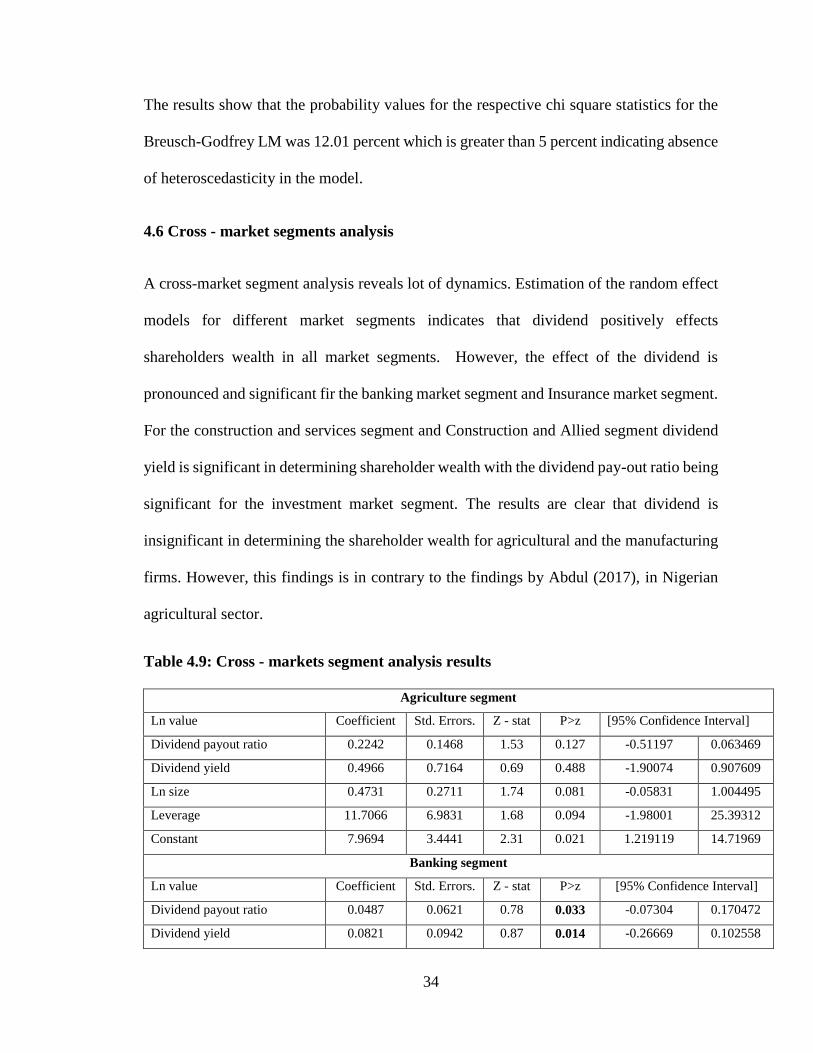
The results show that the probability values for the respective chi square statistics for the
Breusch-Godfrey LM was 12.01 percent which is greater than 5 percent indicating absence
of heteroscedasticity in the model.
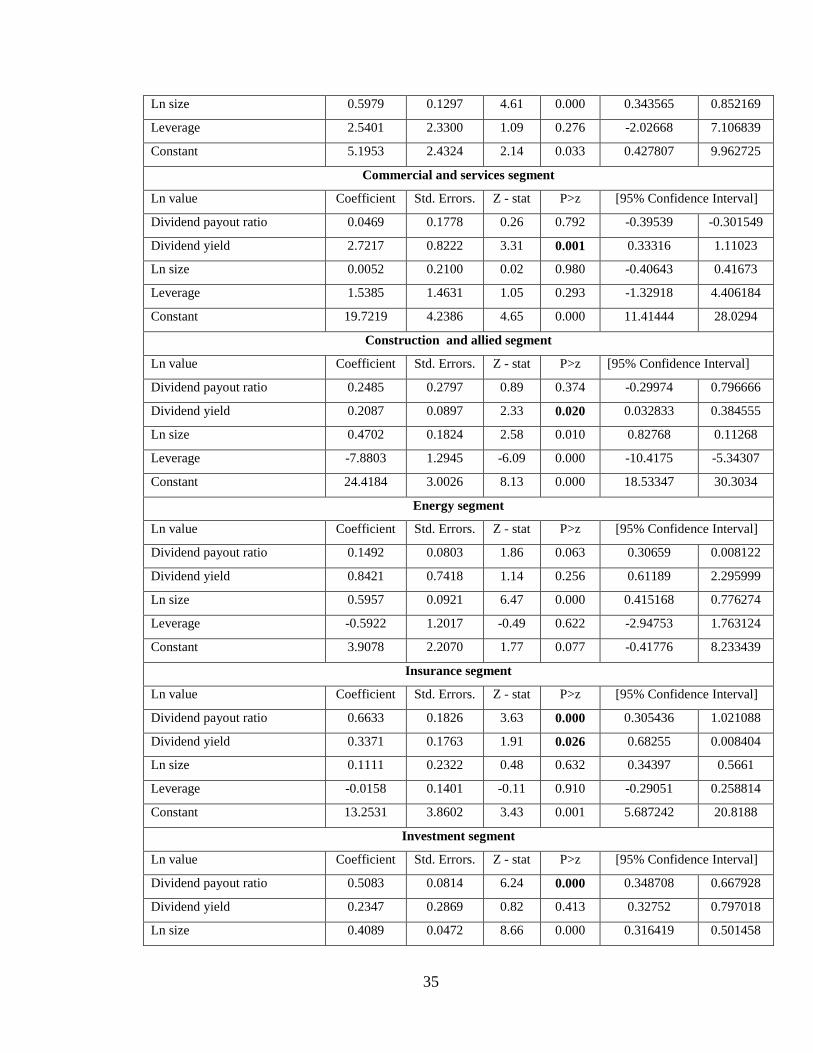
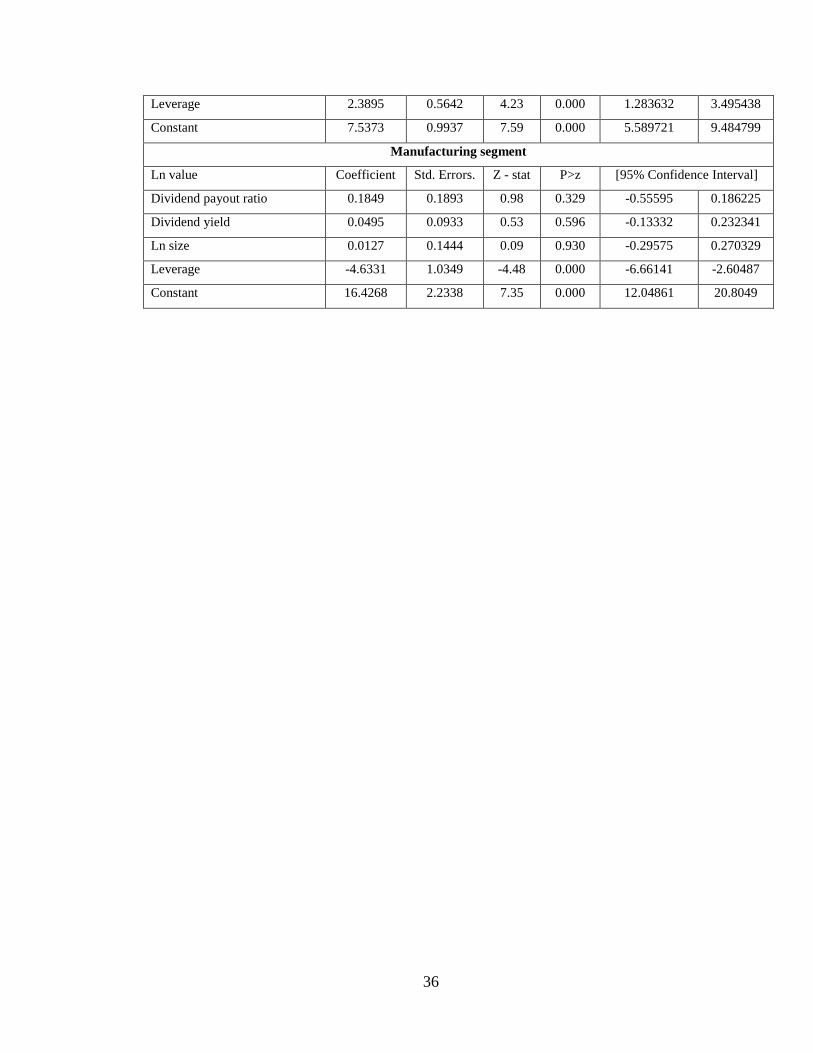
4.6 Cross - market segments analysis
A cross-market segment analysis reveals lot of dynamics. Estimation of the random effect
models for different market segments indicates that dividend positively effects
shareholders wealth in all market segments. However, the effect of the dividend is
pronounced and significant fir the banking market segment and Insurance market segment.
For the construction and services segment and Construction and Allied segment dividend
yield is significant in determining shareholder wealth with the dividend pay-out ratio being
significant for the investment market segment. The results are clear that dividend is
insignificant in determining the shareholder wealth for agricultural and the manufacturing
firms. However, this findings is in contrary to the findings by Abdul (2017), in Nigerian
agricultural sector.
Table 4.9: Cross - markets segment analysis results
Agriculture segment
Ln value Coefficient Std. Errors. Z - stat P>z [95% Confidence Interval]
Dividend payout ratio 0.2242 0.1468 1.53 0.127 -0.51197 0.063469
Dividend yield 0.4966 0.7164 0.69 0.488 -1.90074 0.907609
Ln size 0.4731 0.2711 1.74 0.081 -0.05831 1.004495
Leverage 11.7066 6.9831 1.68 0.094 -1.98001 25.39312
Constant 7.9694 3.4441 2.31 0.021 1.219119 14.71969
Banking segment
Ln value Coefficient Std. Errors. Z - stat P>z [95% Confidence Interval]
Dividend payout ratio 0.0487 0.0621 0.78 0.033 -0.07304 0.170472
Dividend yield 0.0821 0.0942 0.87 0.014 -0.26669 0.102558
35
Ln size 0.5979 0.1297 4.61 0.000 0.343565 0.852169
Leverage 2.5401 2.3300 1.09 0.276 -2.02668 7.106839
Constant 5.1953 2.4324 2.14 0.033 0.427807 9.962725
Commercial and services segment
Ln value Coefficient Std. Errors. Z - stat P>z [95% Confidence Interval]
Dividend payout ratio 0.0469 0.1778 0.26 0.792 -0.39539 -0.301549
Dividend yield 2.7217 0.8222 3.31 0.001 0.33316 1.11023
Ln size 0.0052 0.2100 0.02 0.980 -0.40643 0.41673
Leverage 1.5385 1.4631 1.05 0.293 -1.32918 4.406184
Constant 19.7219 4.2386 4.65 0.000 11.41444 28.0294
Construction and allied segment
Ln value Coefficient Std. Errors. Z - stat P>z [95% Confidence Interval]
Dividend payout ratio 0.2485 0.2797 0.89 0.374 -0.29974 0.796666
Dividend yield 0.2087 0.0897 2.33 0.020 0.032833 0.384555
Ln size 0.4702 0.1824 2.58 0.010 0.82768 0.11268
Leverage -7.8803 1.2945 -6.09 0.000 -10.4175 -5.34307
Constant 24.4184 3.0026 8.13 0.000 18.53347 30.3034
Energy segment
Ln value Coefficient Std. Errors. Z - stat P>z [95% Confidence Interval]
Dividend payout ratio 0.1492 0.0803 1.86 0.063 0.30659 0.008122
Dividend yield 0.8421 0.7418 1.14 0.256 0.61189 2.295999
Ln size 0.5957 0.0921 6.47 0.000 0.415168 0.776274
Leverage -0.5922 1.2017 -0.49 0.622 -2.94753 1.763124
Constant 3.9078 2.2070 1.77 0.077 -0.41776 8.233439
Insurance segment
Ln value Coefficient Std. Errors. Z - stat P>z [95% Confidence Interval]
Dividend payout ratio 0.6633 0.1826 3.63 0.000 0.305436 1.021088
Dividend yield 0.3371 0.1763 1.91 0.026 0.68255 0.008404
Ln size 0.1111 0.2322 0.48 0.632 0.34397 0.5661
Leverage -0.0158 0.1401 -0.11 0.910 -0.29051 0.258814
Constant 13.2531 3.8602 3.43 0.001 5.687242 20.8188
Investment segment
Ln value Coefficient Std. Errors. Z - stat P>z [95% Confidence Interval]
Dividend payout ratio 0.5083 0.0814 6.24 0.000 0.348708 0.667928
Dividend yield 0.2347 0.2869 0.82 0.413 0.32752 0.797018
Ln size 0.4089 0.0472 8.66 0.000 0.316419 0.501458
36
Leverage 2.3895 0.5642 4.23 0.000 1.283632 3.495438
Constant 7.5373 0.9937 7.59 0.000 5.589721 9.484799
Manufacturing segment
Ln value Coefficient Std. Errors. Z - stat P>z [95% Confidence Interval]
Dividend payout ratio 0.1849 0.1893 0.98 0.329 -0.55595 0.186225
Dividend yield 0.0495 0.0933 0.53 0.596 -0.13332 0.232341
Ln size 0.0127 0.1444 0.09 0.930 -0.29575 0.270329
Leverage -4.6331 1.0349 -4.48 0.000 -6.66141 -2.60487
Constant 16.4268 2.2338 7.35 0.000 12.04861 20.8049
37
CHAPTER FIVE
SUMMARY, CONCLUSION AND POLICY IMPLICATIONS
5.1 Introduction
This chapter presents the summary and conclusions arising from study findings. Further
are the policy implications based on the results of data analysis.
5.2 Summary of the findings
The study sought to examine how dividend policy affects shareholders wealth. The focus
was on all the firms in the Nairobi Securities Exchange. The study was motivated by the
fact that dividend policy is one major financial puzzle that has received substantial attention
insofar as empirical examination is concerned. The puzzle arises amid two theoretical
strands in which one asserts that dividend policy does not matter and the other theory that
asserts dividend policy matters.
The analysis entailed 55 listed firms spanning between 2009 and 2018. The mean of
shareholders wealth measured by natural log of the market value of the company was
15.5838 for period under analysis with the minimum value of 12.7008 and maximum of
18.4721. On the distribution, shareholders’ value has a positive skewness of 0.2368 but
non – normally distributed as evidenced by kurtosis value of 2.0872, which is less than 3.
The average dividend payout ratio was 22.23 percent for the 55 listed firms under analysis
for 2009 – 2018 period with a minimum payout ratio of 0.00 and maximum of 43.11
percent. On the distribution, the dividend pay - out ratio had a positive skewness of 1.3197
38
but was non – normally distributed as evidenced by kurtosis value which is greater than 3
implying that it was fat – tailed.
The mean Dividend Yield was 2.2852 for the 55 listed companies analysed with minimum
of 0.000 and maximum level of 9.7238. The distribution of dividend yield portrayed a
positive skewness of 2.4913 but was fat – tailed with a kurtosis value of 8.5434 which is
greater than 3.0 kurtosis value of a normally skewness variable.
Out of the three panel data models, the random effects model was elected as the most
appropriate model for analysis. This confirms that the firms listed at the NSE are dynamic
operations, technical efficiencies among other dynamics. They are therefore not
homogeneous in their operations and characteristics. This finding implies that there is
endogeneity problem since firms are different from each other in terms of their operations,
dividend policy, dividend yield, size, shareholder wealth and in their leverage levels.
The random effects model results found that shareholders wealth is significantly and
positively determined by the DPR. Similarly, divided yield positively affects the owner’s
wealth though the effect was insignificant. This confirms that indeed dividend policy
matters in the determination of the shareholder wealth at the NSE listed companies. In
addition, the cross – market segment analysis found that, dividend policy effect on
shareholders wealth varies across the different markets segments with effect being
pronounced more in the banking and insurance market segments.
On diagonistic test, the correlation coefficients found that the shareholders wealth is
positively related to dividend pay-out and dividend yield. Further, the shareholders wealth
had a positive association with the firm size. Shareholders wealth was negatively associated
to leverage levels. However, the positive correlations were very weak as they are below
39
the 50 percent mark. Further, multicollinearity problem was found to be absent among the
explanatory variables of the model. Similarly, heteroscedasticity was found to be absent
from the model.
5.3 Conclusion and Recommendations
Random effects model was the most appropriate model as opposed to fixed effects and
pooled effects model. This confirmed dynamics in operations, technical efficiencies among
other dynamics. They are therefore not homogeneous in their operations and
characteristics. This finding implies that there is endogeneity problem. The random effects
model output found that shareholders wealth is positively and significantly determined by
the dividend pay-out ratio. Similarly, divided yield had a positive effect on the shareholder
wealth at the NSE listed firms. The study therefore concludes that dividend policy matters
in determining shareholders wealth in Kenya. Based on this finding, the study recommends
for the firms to take into consideration the DPR more than DY in order to maximize of on
their shareholders’ wealth. From the findings, the effect of the dividend payout ratio
significantly determines shareholders’ wealth compared to dividend yield. This is because
shareholders are more likely to understand dividend pay – out ratio as opposed to dividend
yield.
For the control variables, shareholder wealth is positively affected by firm size. However,
the firm leverage levels was found to have a negative effect on the shareholder wealth. The
cross-market segment analysis reveals lot of dynamics in so far as the relevance or
irrelevance of dividend policy is concerned. Estimation of the random effect models for
40
different market segments indicates that dividend policy has a positive effect on the
shareholders wealth in all market segments.
However, from the cross – market segment, dividend policy effect on shareholders wealth
varies across the different markets segments. The effect of dividend policy on shareholders
wealth is more pronounced and significant for the banking market segment and Insurance
market segment. For the construction and services segment and Construction and Allied
segment dividend yield is significant in determining shareholder wealth with the DPR
being significant for the investment market segment. Results are clear that neither the DPR
nor DY is significant in determining the shareholder wealth for firms listed under the
agricultural segment and the manufacturing market segment.
Based on this finding, the study recommends the need for the investors to consider
diversifications of their investments portfolios in order to maximize their wealth. The
cross-market segments analysis indicates that dividend policy matters in some market
segments while in others it does not matter. It is also notable that within the market segment
where dividend policy matters the effect is likely to be more pronounce in some firms
within that segments than in others. This therefore calls for the need for investors’
diversification of their investments portfolios.
Regarding the leverage levels, listed companies need to enforce prudent policies in
managing their debt levels. Policies on the optimal capital structure are crucial in this case
to ensure that the firm is not highly levered, which would be a source of financial risk that
would adversely affect shareholders wealth. Considerations of internal funding as opposed
41
to external funding in line with the Pecking Order theory of firm financing would be a
worth venture for consideration by these firms.
5.4 Limitation of the study.
With regard to the sample, the study was biased given that it did not take into account the
firms listed at the Growth Enterprise Market Segments (GEMS). This therefore left out the
new market entrants in the market that were listed form the year 2013 upon the
establishments of the GEMs. All the firms listed at GEMs are Small and Medium
Enterprises. As such, their exclusion imply that the study failed to take into accounts the
listed MSMEs in its analysis. Further, In addition, the study fell short of taking into account
the market-related factors such as the market competition. Further, the study did not take
into consideration the macroeconomic environment within which companies operate.
These were the limitations of the study given that the incorporation of market related
factors, macroeconomic environment and more measures of dividend policy would perhaps
have led to different outcomes in the analysis.
On data, the limitation of the study was that the study relied on the data drawn from the
financial statements. The reality is that there is a lot of restatement of financial statements
of the previous financial years in the subsequent financial years. Therefore, this is likely to
have affected the accuracy of data points.
About time aspect, the study period did not take into account the effect of post-election
violence of 2007 / 2008 that had a great effect on the performance of capital market in
Kenya even in subsequent years. Inclusion of such period and introduction of structural
break in the analysis would perhaps lead to different results.
42
Regarding the variable operationalization, the study used one measure for every variable.
Within the study dividend pay – out ratio and dividend yield were the two core measures
of dividend policy applied. Inclusion of such multiple measures would be core for
robustness check. The same limitations apply to control variables of the model.
Regarding the model, the study assumed a linear empirical model in estimating the random
effects model. The study adopted the model that assumes that the dependent variable and
the independent variables are linearly related with the error term being normally
distributed. However, this overlooked the fact that linear dependence between the
dependent variable and the independent variable is not always guaranteed.
5.5 Areas for further studies.
Given that the study failed to take into account the companies listed in GEMs, there is a
need future studies to conduct a cross industry analysis for comparison purposes. By this,
there is the need for the future study to conduct similar studies taking into account the
MSMEs listed under the GEMs. Such studies would offer conclusive findings, which can
be generalized for the entire insurance industry. On data, the limitation further studies in
this area should consider taking keen in the data enumeration to ensure that they try as
much as possible to capture the restated data only for the analysis.
Regarding the time period for the study, the future studies can include the effect of post-
election violence of 2007 / 2008 that had a great effect on the performance of stock market
even in subsequent years. This can be introduced in the analysis as a time dummy with the
model being estimated with the structural breaks. Inclusion of such analysis would perhaps
have led to different results in so far as bad periods or events.
43
Regarding the variable operationalization, future studies could consider using more than
one measures of the model variables for robustness check. Future studies should take into
account other measures of dividend policy such as Dividend per Share and Earnings per
Share in their analysis. In addition, future studies in this area can explore extending the
empirical model to account for macroeconomic environment such as GDP growth, inflation
rate and changes in risk free market interest rates such as interest rate in government short
term securities. Such studies would offer more insights that this study was unable to offer.
Regarding the model, the study assumed a linear empirical model. Future studies can take
into consideration testing for linear dependence in between dependent and independent
variable upon which the selection of the model would be informed. Presence of non –
linearity would inform the adoption of appropriate non – linear models that would be more
realistic.
44
REFERENCES
Agrawal, Z. (2007). The Leverage-Value Relationship Puzzle: An Industry Effects
Resolution, Journal of Economics and Business, 59(4), 286.
Allen, F., Bernardo, A., and Welch, I. (2000). A Theory of Dividends Based on Tax
Clienteles, Journal of Finance, 55, 2499-2536.
Al Ajlouni, A. (2011).The Impact of Profit Performance on the Stock Prices of Commercial
Banks in Jordan. Al-Balqa Journal for Studies, 14 (1), 215-238.
Al Ajlouni, . (2008). Analyzing the Profit Reflection Extend of the Jordanian Industrial
Companies on the Market Price of the Stocks. Egyptian Journal of Commerce.
Egyptian Journal of Commerce. Egyptian, Journal of Commerce, 32 (1), 568-603.
Alqahtani, F., and Mayes, D. 2018. Financial stability of Islamic banking and the global
financial crisis: Evidence from the Gulf Cooperation Council. Economic Systems,
42, 346 – 60
Asogwa C., R. (2009). Measuring the determinants of value creation for listed banks in
Nigeria, a random effects probit (rep) model analysis. African Econometric Society
14, the Annual Conference on Econometric Modelling for Africa.
Bhandari, L. C. (1988). Debt/equity ratio and expected common stock returns: empirical
evidence, Journal of Finance, 2, 507-528.
Black, F. (1976). The Dividend Puzzle, Journal of Portfolio Management, 2, 5-8.
Bowman, R. G. (1979). The theoretical relationship between systematic risk and financial
(accounting) variables, Journal of Finance, 3, 617-630.
Christie, A. (1982). The stochastic behaviour of common stock variances: value, leverage
and interest rate effects, Journal of Financial Economics, 4, 407-432.
Emeni, F. K., & Ogbulu, O. M. (2015). The effect of dividend policy on the market value
of firms in the financial services sector in Nigeria. Archives of Business Research,
3(4), 15-29
Fama, E., and French, K. (2001). Disappearing dividends: changing firm characteristics or
lower propensity to pay? Journal of Financial Economics, 60 (1), 3 - 43.
45
Ghasemi, M., and Sarhadi, M. (2014). The Effect of accounting earnings on stock prices
of firms listed in Tehran stock exchange, International Research Journal of Applied
and Basic Sciences, 8 (12), 2202 - 2209.
Gharaibeh, F., and Dawud, J. (1998). The Content of the accounting numbers of
Information in the Jordanian Public Shareholding Companies. Journal of Abhath
Al-Yarmouk Humanities and Social Sciences, 4 (2), 201- 233.
Georgeta, V., and Stefan, G. (2014). The impact of ownership concentration on firm value.
Empirical study of the Bucharest Stock Exchange listed companies, Procedia
Economics and Finance, 15, 271-279.
Gordon, J. (1959). Dividends, earnings, and stock prices. Review of Economics and
Statistics, 41, 99-105.
Jensen, M. (1986). Agency costs of free cash flow, corporate finance, and takeovers.
American Economic Review, 76 (2), 323-329
Lang, L., & Stulz, R. (1994). Tobin’s q, corporate diversification, and firm performance.
Journal of Political Economy,102 (6), 1248 - 1280.
Lintner, J., (1956). Distribution of incomes of corporations among dividends, retained
earnings, and taxes. American Economic Review, 46, 97-113.
Limungi, M., A. (2011). The ex-dividend day stock price behaviour in the Nairobi
Securities Exchange. Unpublished MBA project, University of Nairobi, Nairobi,
Kenya
Mandelker, G. N., & Rhee, S., G. (1984). The impact of the degrees of operating and
financial leverage on systematic risk of common stock, Journal of Financial and
Quantitative Analysis, 1, 45-57.
Modigliani, F., and Miller, M., H. (1961). Dividend policy, growth, and the valuation of
shares. American Economic Review. 48(3). 261–297.
Mohammed, Z., A. (2010). Relationship between dividend per share and firm value; A case
of companies listed at the Nairobi Stock Exchange. Unpublished MBA project,
University of Nairobi, Nairobi, Kenya.
Mwanje, P., and Otinga, H. (2019). Influence of dividend policy on stock performance
among banking sector firms listed in Nairobi Securities Exchange, Kenya . The
Strategic Journal of Business & Change Management, 6 (2), 1843 –1854.
46
Nyamosi, N., and Omwenga, J. (2016). Effect of dividend policy on stock prices for
manufacturing and allied industry firms listed at the Nairobi securities exchange.
International Academic Journal of Economics and Finance, 2 (2), 25-47
Ordu, M., Enekwe, I., and Anyanwaokoro, M. (2014).Effect of dividend payment on the
market price of shares: A study of quoted firms in Nigeria. IOSR Journal of
Economics and Finance, 5(4), 49-62.
Pandey M. (2005). What drives shareholder value. Asian Academy of Management Journal
and Accounting and Finance, 1, 105-120.
Ramezani, A., Soenen, A., and Jung, R. (2001). Growth, corporate profitability, and
shareholder value creation. Social Science Research Network.
Stiglitz, J. (1985). Information and economic analysis: a perspective. The Economic
Journal, 95, 21- 41.
Seunghyun, K., Yoon, K., Jaemin, C., Seoki, L., (2015). Effects of social media on firm
value for U.S. restaurant companies. International Journal of Hospitality
Management, 49, 40-46.
Zureigat, M. (2011). The relation between internal performance measures and market
performance measures: Evidence from Amman Stock Exchange. Journal of
Administrative and Economics Science, 3 (2), 1-28.

47
APPENDICES
Appendix 1: Data collection template
Year Company
Name
Market segment
code
Company
Code DPR DY LEV Lnsize Lnvalue
2009
2010
2011
2012
2013
2014
2015
2016
2017
2018
Appendix 2: List of listed companies used in the analysis
1 Eaagads Ltd Ord 20 NBK 38 Longhorn Publishers
2 Kapchorua Tea Co. Ltd 21 NIC bank 39 Athi River Mining
3 Kakuzi 22 Standard Chartered bank 40 Bamburi cement
4 Limuru Tea 23 Equity bank 41 Crown Berge
5 Sasini Ltd 24 Cooperative bank 42 EA cable
6 Williamson Tea 25 Express Ltd 43 Portland Cement
7 Car and General 26 Sameer Africa 44 Total
8 Barclays bank 27 Kenya Airways 45 Kengen
9 Stanbic bank 28 National Media Group 46 KPLC
10 I&M bank 29 Scan Group 47 Jubilee insurance
11 Diamond Trust Bank 30 TPS 48 Kenya Re
12 HFCK bank 31 Standard Group 49 Liberty
13 KCB bank 32 Uchumi 50 Britam
14 Centum 33 Unga Ltd 51 CIC Insurance
15 BOC 34 Kenya Orchards 52 Olympia
16 British American Tobacco 35 Safaricom 53 Trans-Century Ltd
17 Carbacid ltd 36 Eveready East Africa 54 Kenol Kobil
18 EABL 37 Flame Tree Group 55 Pan Africa Insurance
19 Mumias