Embed Size (px)
Citation preview
NO13074
The Impact of Diversifying Acquisitions on Shareholders’ Wealth
Elif Akben Selcuk
Department of Business Administration
Kadir Has University
Halil Kiymaz
Crummer Graduate School of Business
Rollins College
NO13074
The Impact of Diversifying Acquisitions on Shareholders’ Wealth
ABSTRACT
This study examines the impact of diversifying acquisitions on acquiring Turkish firms. Using a
sample of 98 acquisitions during 2000-2011, the study finds that acquiring firms experience
statistically significant abnormal returns surrounding the announcement date. The cross-sectional
regression results show that diversifying acquisitions create higher abnormal returns to acquirers
compared with focused acquisitions. We also show that smaller firms experience higher abnormal
returns compared to larger firms in our sample and that acquiring public firms result in higher wealth
gains to acquirers. Finally our results indicate that results differ among group affiliates and
independent firms. If an acquisition is made by an independent firm, diversifying acquisitions generate
higher abnormal returns compared to focused acquisitions. However, if the acquirer is a group
affiliate, there is no significant difference between the two types of acquisition activities in terms of
wealth effects.
Keywords: Shareholders’ value, Wealth Effect, Stock Prices, Turkish Market
JEL Classifications: G14/G20/G34
INTRODUCTION
In recent years, mergers and acquisitions (M&As) attracted the attention of both scholars and
policy makers. The dominant rationale used to explain M&A is that acquiring firms seek improved
financial performance. M&A activities can be considered as a means of corporate diversification. In
finance literature, many theories on benefits and costs associated with diversification have been
developed. In particular, the benefits of corporate diversification, which result in diversification
premium, can originate from the theories of an efficient internal capital market, coinsurance effect,
economies of scope, and market power. On the other hand, the costs arising from corporate
diversification, which cause diversification discount, are theoretically justified by agency arguments,
overinvestment and cross-subsidization problem, and inefficient resource allocation within the firm
NO13074
(Day and Benerjee, 2011; Maksimovic and Phillips, 2007; Martin and Sayrak, 2003; Kiymaz and
Muhkerjee 2000). The average net effect of diversification through M&As is an empirical question.
Several studies conclude that diversification destroys value and cross sectional studies
implicitly assume that single-segment firms are a valid benchmark for valuing the divisions of
conglomerates (Lang and Stulz, 1994; Berger and Ofek, 1995). The excess value method for
estimating the value effects of corporate diversification can be misleading if there are systematic
differences between the divisions of conglomerates and the single-segment firms to which they are
benchmarked. Failure to account for these differences can lead to incorrect inferences regarding the
effect of corporate diversification on firm value.
To assess the extent to which these selection bias issues are important, we examine a sample
of firms that expand via acquisition. Using an event study methodology, we explore the abnormal
returns of the Turkish acquirer on announcing acquisitions. Our objective is to study whether
diversifying and non-diversifying acquisitions differ in terms of acquirer abnormal returns once we
control other factors affecting returns.
We find positive abnormal returns to acquiring firms during various event windows. The
results of the cross-sectional regression analysis show that diversifying acquisitions generate higher
abnormal returns compared to focused acquisitions. Furthermore, we find statistically significant
negative coefficient for size of acquirers, indicating that smaller firms experience higher abnormal
returns compare to larger firms. These findings are in line with the existing literature. We further find
that firms acquiring publicly traded target firms experience higher returns. This finding is contrary to
findings of other studies.
The rest of the paper is organized as follows. The next section provides a review of the
literature. Then, we explain our data collection procedure and present sample description and
methodology. The control variables used in multiple regression analysis is presented in the next
section. The empirical findings for wealth gains and factors explaining wealth gains are reported in the
following section. The final section concludes the paper.
NO13074
LITERATURE REVIEW
Event studies in the diversification literature analyze the value effects of refocusing events
such as spin-offs or diversifying events such as mergers and acquisitions (M&As) on firms involving
these activities. Literature report mixed results with respect to market reactions to diversifying
acquisitions. Morck, Shleifer, and Vishny’s (1990) study is often cited as evidence of a negative
market reaction to diversifying acquisitions. This study analyzed a sample of 327 US acquisitions
between 1975 and 1987 and report negative announcement day returns for bidding firms. Agrawal,
Jaffe, and Mandelker (1992) and Morgan, Nail, and Megginson (2000) also provided evidence of
negative returns of acquiring firms that increase corporate diversification. Examining cross-border
M&A transactions over the period 1990 to 1999, Dos Santos, Errunza, and Miller (2008) found no
evidence that US acquirer firms’ excess values decrease in the two-year period surrounding the
acquisition. They also found that US acquirers experience a significant post-merger drop when they
have been involved in unrelated M&As.
Using a different methodology, Comment and Jarrell (1995) provide complementary evidence
about the valuation of conglomerate firms during the 1978-1989 periods. They find that increases in
focus, subsequent to asset sales, are associated with positive abnormal stock returns in the year in
which focus increases. Similarly, John and Ofek (1995) documented improvements in operating
performance over the three years following a refocusing decision. Daley, Mehrotra, and Sivakumar
(1997) found evidence of adding value by refocusing spin-offs, and Desai and Jain (1999) showed that
long-run returns after a refocusing spin-off are greater than the returns for non-focus-increasing spin-
offs. Sicherman and Pettway (1987) reported in a sample of 147 US M&A announcements, that
related acquisitions enhance the shareholder wealth of acquiring firms whereas the opposite is true for
unrelated acquisitions.
In contrast to studies documenting a diversification discount, there is also contrary empirical
evidence. For instance, Graham, Lemmon, and Wolf (2002) used Compustat data for 356 firms from
1980 to 1995 that have made acquisitions and controlled for the existing characteristics of the acquired
firms. They found that these characteristics explain nearly all of the reduction in the excess value of
the acquiring firm after the merger, regardless of the type of acquisition and type of firm. Walker
NO13074
(2000) also documented that related acquisitions did not generate higher value than unrelated
acquisitions for both targets and acquirers in a sample of 278 US M&A announcements in the time
period 1980-1996.
Finally, there are studies reporting positive market reactions to diversifying acquisitions.
Kaplan and Weisbach (1992) replicated the general result of acquisition event studies that bidder
returns are slightly negative but combined returns to bidder and targets were found to be positive,
which implies that acquisitions increase combined shareholder value. Schipper and Thompson (1983)
found significant positive abnormal performance associated with the announcement of acquisition
programs by diversified firms in 1960s. In a later study, Hubbard and Palia (1999) analyzed 392
acquisitions for the period 1960-1971, where the bidder and target did not share the same two-digit
SIC code. The authors were able to confirm the existence of positive abnormal returns for the bidding
firm. Matsusaka (1993) reported a similar finding for the 1960s while Hyland and Diltz (2002) found
positive abnormal returns for diversifying acquisitions for the 1980s and 1990s.
Among non-US studies, Sudarsanam, Holl, and Salami (1996) analyzed a sample of 429 deals
made by UK companies during 1980-1990. The authors did not find any difference between the gains
to shareholders in related and unrelated acquisitions. In a more recent European study, Martynova and
Renneboog (2004) found that irrespective of the corporate strategy, target shareholders earned positive
abnormal returns. However, the abnormal returns were significantly higher for related M&A
announcements compared to unrelated M&A announcements. Bidders, on the other hand, experienced
significantly higher short-term returns around the announcement of related acquisitions. Kiymaz
(2006) find that both divesting and acquiring firms experience statistically significant wealth gains
during the sell-off announcements. For the matched sample, only divesting firms continue to have
statistically significant wealth gains. Further analysis of the industry affiliation of divesting and
acquiring firms indicates that there are differences in wealth gains with respect to the industry
affiliation. The author also reports direct relationships between wealth gains to divesting firms and
motive announcements related to paying debt and increasing firm focus. Wealth gains are higher for
financially distressed firms and firms with higher bank loans when firms announce divestitures,
supporting both bankruptcy avoidance and bank monitoring arguments. Additionally, wealth gains are
NO13074
higher for firms with higher efficiency, as measured by total asset turnovers, and for firms with higher
profitability.
Only limited studies have dealt with takeover effects on shareholder wealth in emerging
markets. In one of them, Cai (2004) examined the abnormal returns around acquisition announcements
made by public companies in eight East Asian countries from 1993 to 2003. Using data collected from
various sources and the standard event study methodology, the author focused on the impact of
corporate ownership and control structure on the market valuation of acquiring companies in a short
event window. He also tested whether diversifying acquisitions are a manifestation of agency
problems and thus viewed negatively by investors. Although the diversification variable (dummy 1 if
the acquirer and target are not from the same industry) was not significant, the sign was negative as
predicted by the author. Kiymaz and Mukherjee (2000) posit that country diversification via cross-
border mergers creates wealth by providing benefits for firms that are not available to their
shareholders. The authors hypothesize that these benefits are inversely related to the extent of co-
movement in the economies of the bidder and target’s countries. By examining the wealth effects of
U.S. targets and bidders involved in cross-border mergers with firms in other countries during 1982–
1991, they show that wealth effects vary, depending on country affiliations of two merging firms, and
are inversely related to the degree of economic co-movement between the two countries. In a follow
up study, Kiymaz (2004) investigates the impact of mergers and acquisitions on U.S. bidders and
targets involved in cross-border mergers of financial institutions. The findings indicate that while U.S.
targets experience positive significant wealth gains, U.S. bidders encounter insignificant wealth gains
during the merger announcements. There are also differences in wealth gains with respect to industry
classification and to the regional location of foreign targets and bidders. The macroeconomic
variables, including foreign and U.S. economic conditions, level of economic development of target
country, exchange rate volatility along with the effectiveness of foreign government, relative size of
participants, and control of target largely explain the wealth gains to bidders and targets. In a more
recent study, Bhagat, Malhotra, and Zhu (2011) investigated 698 cross-border acquisitions by
emerging country firms during the period between 1991 and 2008. The authors found that emerging

NO13074
country acquirers experience a positive and significant market response of 1.09 percent on the
announcement day in unrelated acquisitions.
This study intends to provide evidence from a rapidly growing emerging market by examining
Turkish acquisitions from corporate diversification perspective.
DATA AND METHODOLOGY
Data
The sample includes acquisition announcements by the firms listed on the Istanbul Stock
Exchange (ISE) during January 2000 and December 2011 period. The list of these transactions was
obtained from Dealwatch database whereas İş Yatırım (İş Investment) provided the daily stock price
data. The official announcement date for each transaction also relies on Dealwatch. We screened the
sample for the following:
i) The transaction was completed.
ii) The acquiring firm is headquartered in Turkey.
iii) The acquiring firm was listed on the ISE with daily stock prices available at least 250
trading days prior and 5 trading days after the announcement date.
iv) There were no contaminating acquisition announcements of acquiring firm during 5
days before and after the given transaction.
In case of clustered takeovers where the same company acquires two or more targets within
the same day, we take the largest one in terms of transaction value. Acquisitions in different years by
the same company are considered separate events as long as estimation and event windows do not
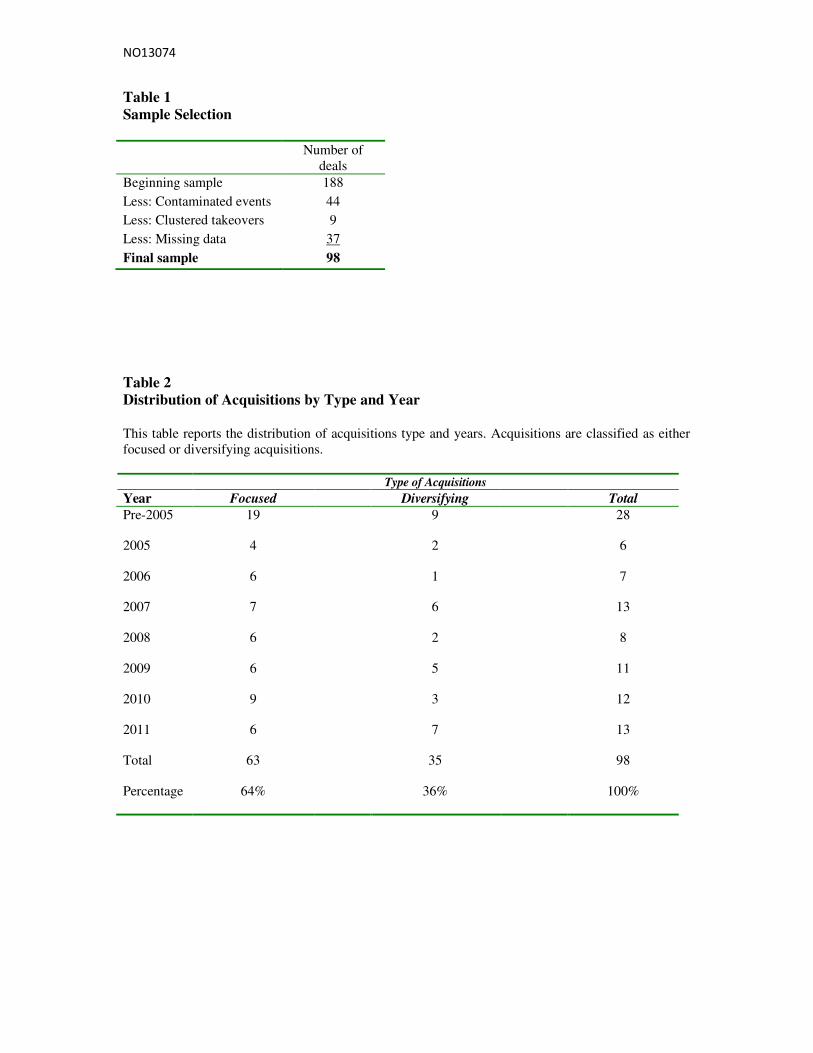
overlap. This sample selection procedure resulted in a total of 98 deals made by 72 companies. Table 1
below provides data on our sample selection procedure.
Insert Table 1 here
NO13074
Acquisitions are defined as “diversifying” when the first two-digits of the main industry code
of the bidder and the target are not the same and “focused” when the first two-digits of the main
industry code of the bidder and target are identical.
Table 2 below presents the frequency distribution of focused and diversifying acquisitions
based on two-digit SIC codes. Of all the acquisitions, about 64 percent were classified as focused
acquisitions while the remaining 36 percent as diversifying acquisitions. This pattern seems to be in
line with the literature that most firms are interested in focusing strategy and are in search of
synergies. The highest number of acquisitions occurred in 2007 and 2011 with 13 acquisitions. The
distribution of sample overtime is even and stable.
Insert Table 2 here
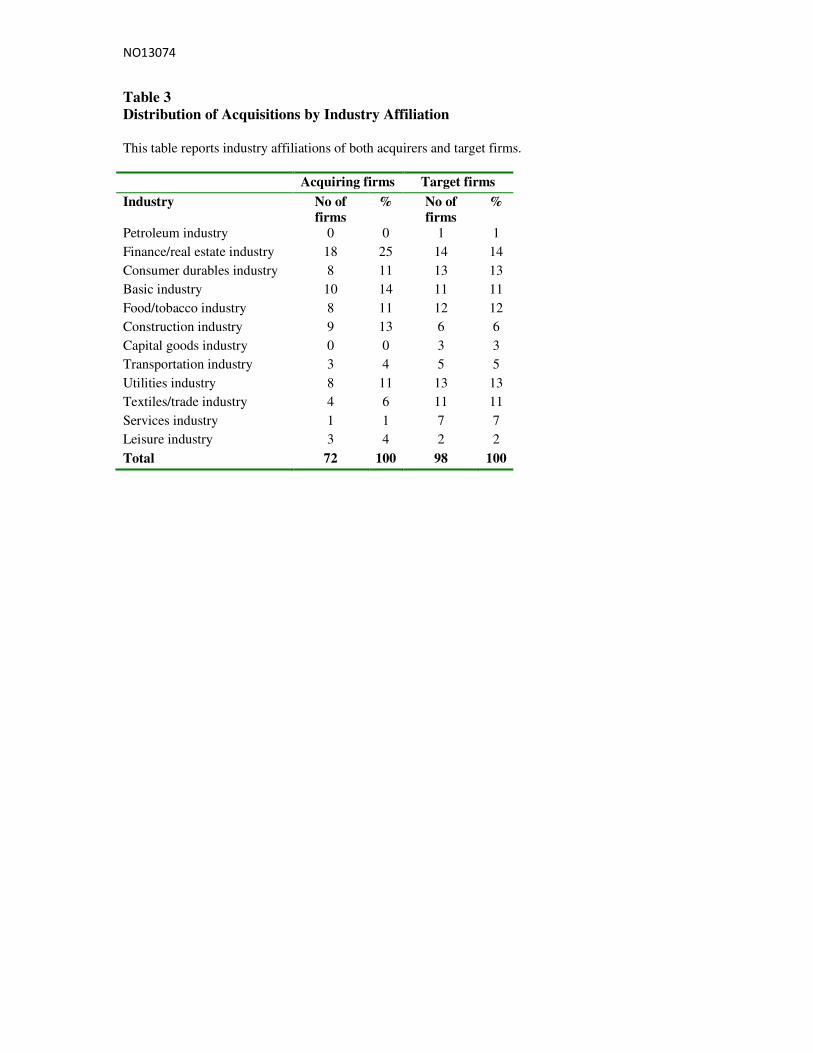
We also report the distribution of sample by industry affiliation in Table 3. We use
Campbell’s (1996) classification to group firms. Among the 72 bidder firms, Finance/Real Estate
industry is on the top with 18 firms, followed by Basic industry (10 firms) and Construction industry
(9 firms). The lowest numbers of acquirers is in Services industry with only one firm. Similarly, the
majority of target firms operate in Finance/Real Estate industry with 14 firms. Consumer Durables and
Utilities industries are in second place with 13 firms each.
Insert Table 3 here
Methodology
Standard event study methodology is used to measure the wealth effect of acquisition
announcements on acquiring firms’ stock prices. The event is the announcement of an acquisition by a
Turkish company listed on the ISE. The following single-market model is employed in parameter
estimation:
)1( + R . + = R ti,tD,Di,iti, εβα
Where:
Ri,t = the rate of return on security i on day t,

NO13074
RD,t = the rate of return on the ISE-All Share Index,
βi,D = the slope of the regression line of the firm i's returns against the returns on the
ISE-All Share Index,
αi = the intercept term,
εi,t = the residuals.
An abnormal return (wealth effect) for common stock of firm i on day t is defined as:
)( R - R = AR ti,ti,ti, 2ˆ
where,
)( R . + = R tD,i,Diti,
3ˆˆˆ βα
in which αi, and βi,D, are estimated market model parameters obtained by using the pre-estimation
period (t = - 250 to t = - 31).1 The expected value of abnormal returns and average abnormal returns is
zero in the absence of abnormal performance. 2 The estimation does not include the 30 days prior to the
announcement date since information leakage within this range may have an effect on the share price,
which can lead to incorrect estimates of the coefficients of the market model.
Factors influencing wealth effects
In order to test whether the CARs differ between diversifying and focusing acquisitions after
controlling for deal and firm specific variables expected to affect acquirer returns, we perform a cross
sectional multiple regression analysis. The CAR for the [-2;+2] period around the announcement date
is used as the dependent variable in the regression. The following independent variables are included
in the model.
Diversifying vs. Focused Acquisitions
1 Most event studies employ a pre-estimation period to estimate the market model parameters. The length of
estimation period varies between 180 and 270 days. This study uses 255 days to estimate model parameters and
60 days for event-window to analyze wealth effects. 2 The test of significance is performed by following Brown and Warner (1985) and is not illustrated here.
NO13074
Since our main objective is to investigate whether diversifying acquisitions create value, we
introduce a dummy variable, DIVERS that is equal to “1” if the first two-digits of the main industry
code of the bidder and the target are different. If there exists a diversification premium, the coefficient
of this variable would be positive. In case of a diversification discount, the coefficient would be
negative.
Cross-Border vs. Domestic Acquisitions
Cross-border M&As may affect acquirer returns in different ways. On the one hand, the
acquisition of a foreign target may provide competitive advantage to the bidder through the acquisition
of valuable and unique resources such as technology management and marketing skills, production
skills, patents etc. that complement and strengthen the firm’s resource base (Barney, 1991). On the
other hand, the main disadvantage of cross-border M&As from the bidder’s perspective is the lack of
country and firm specific knowledge of the foreign target firm that potentially would lead to
unsuccessful acquisitions or wrong valuation of foreign targets. This is especially true in the cases
where the foreign target has high levels of intangible assets (Reuer, Oded, & Ragozzino, 2004).
There are no clear empirical results confirming the shareholder wealth effects of the bidding
firm due to domestic or cross-border takeover announcements. For instance, Doukas and Travlos
(1988) presented evidence of positive abnormal returns to US acquirers for international acquisitions.
However, Datta and Puia (1995) reported no abnormal returns while Fatemi and Furtato (1998)
documented small insignificant negative returns to shareholders of acquiring firms in cross-border
acquisitions. Kiymaz (2000) reports significant returns to acquiring firms’ shareholders.
To investigate whether there is a cross-border effect in our sample, we introduce a dummy
variable INT that is equal to “1” if the target is a foreign company, “0” otherwise.
Payment Type
When one firm acquires another, it can pay for the acquisition with cash (cash in exchange for
shares), equity (a specified number of the acquirer’s shares for each target share), or some combination
NO13074
(loan notes, deferred payment, share and equity). The method of payment in takeovers has been cited
as an important factor for a number of reasons.
From a theoretical point of view, Jensen (1986) argues that acquisitions financed with cash
will generate larger benefits than those accomplished through exchange of stocks because stock
acquisitions are unlikely to motivate managers to use resources more efficiently. This theory is in line
with the signaling hypothesis of information asymmetry presented in Myers and Majluf (1984),
suggesting that the board of the bidder company will fund an acquisition by stock only if they believe
their shares are overvalued. On the contrary, boards who believe that their stocks are undervalued will
fund the takeover by other means such as cash or debt. Since target shareholders know this, and are
not informed about the “true” value of the acquiring firm, an adverse selection arises, and they reduce
their estimate of the acquirer’s value. The result is that target shareholders are not inclined to accept a
stock offer.
In addition, Hansen (1987) argues that bidders, in the case of uncertainty in target valuation,
make stock offers as they have a “contingency pricing effect” i.e. reduce overpayments because target
shareholders share part of the risk if the bidder overpays when evaluating a stock offer.
Finally, an alternative tax-based hypothesis exists that favors stock offers. Cash acquisitions are
considered as immediately taxable for the target firm shareholders. On the other hand, stock
acquisitions in general are tax deferrable until the shares are sold. Consequently, in cash offers a larger
premium is required to compensate for that additional tax burden for the target firm. (Travlos, 1987
and Fuller et al. 2002).
Empirical research generally supports the hypothesis that shareholders of acquiring firms view
cash offers more positively than stock offers. For instance, Travlos (1987), Fuller et al. (2002), and
Moeller et al. (2003) found higher abnormal returns to bidders in cash acquisitions compared to stock
acquisitions.
To investigate whether the method of payment has an impact on CARs, we use a dummy
variable PMT that is equal to “1” for acquisitions paid with cash, “0” otherwise.
Target Type
NO13074
Empirical studies generally report higher returns for private target acquisitions. For example,
Chang (1998) reported higher abnormal returns for companies acquiring privately held targets
compared to those acquiring publicly held targets. Fuller et al. (2002) found positive abnormal returns
for subsidiary acquisitions, which are robust to different forms of payments. Hansen and Lott (1996)
and Moeller et al. (2003) also found positive abnormal returns to bidders acquiring private targets.
Three reasons are given in the previous literature to explain these findings. The first reason involves
the liquidity impact and limited competition. Compared to publicly traded firms, buying and selling
private firms and subsidiaries is more difficult. This lack of liquidity makes these investments less
attractive and hence offers are generally lower for private firms. Thus, shareholders of bidding firms
earn a higher return on such transactions (Fuller et al., 2002).
A second reason relates to the monitoring hypothesis. Firms acquiring privately held targets through
common stock exchanges tend to create outside block holders because a small shareholder group owns
the targets. The creation of outside block holders can serve as an effective monitoring device of
management, which, in turn, can increase bidder returns (Chang, 1998).
A final reason concerns the portfolio preferences of investors. Hansen and Lott (1996)
hypothesize that if investors are diversified, management’s goal should be to maximize the value of
the shareholder’s portfolio, not to maximize shareholder value. Thus, when a public bidder acquires a
public target, diversified shareholders who own stock in both firms should be indifferent to how the
gains from the acquisitions are divided. Hence, the bidding firm’s shareholders should not expect any
abnormal return when acquiring a public firm.
To investigate whether the type of the target has an impact on CARs in our sample, we use a
dummy variable PUBLIC that is equal to “1” for deals involving public targets, and “0” for private
targets.
Cash Reserves of the Acquirer
Cash reserves can provide funds for investment opportunities. Firms often accumulate much more
cash than they require for normal business operations. Jensen (1986) argues that the presence of large
free cash flows can compound a firm’s agency problem by insulating managers from being monitored

NO13074
by external market forces. Managers at firms with more cash have more resources available to them
and are more likely to engage on empire building. Thus, they may use excess cash in making poor
investments such as nonproductive acquisitions instead of distributing it to the firm’s shareholders. As
a result, an acquiring firm with excessive cash reserves may generate lower levels of abnormal returns.
Yet, Moeller et al. (2004) do not find support for this hypothesis in the US context.
On the other hand, higher free cash flows can also proxy for better recent firm performance, which
could be correlated with higher quality managers, who tend to make better acquisition decisions
(Masulis et al. 2007).
To investigate whether acquirer’s cash reserves have an effect on abnormal returns, we use the
variable CASH that is measured by total cash divided by total assets of the acquirer at the year-end
before the acquisition.
Leverage of the Acquirer
Past studies argue that leverage can be used to limit managerial discretion and discourage
managers from conducting empire-building activities when they have excessive free cash flow (Stulz,
1990). Leverage would have a positive impact on the acquirer’s announcement return because
leverage would provide managers with the incentive to make more value maximizing acquisitions.
Leverage also provides incentives for managers to improve firm performance, since managers
have to cede significant control to creditors and often lose their jobs if their firms fall into financial
distress. There is also evidence that leverage is related to a firm’s takeover protection (Garvey &
Hanka, 1999).
Following the existing literature, we include leverage as a control variable, LEV, defined as a
firm’s book value of short-term and long-term debt divided by its total assets at the end of the year
preceding the acquisition.
Pre-bid Performance of the Acquirer
According to empirical studies, pre-bid acquiring firm performance, usually measured by
price-to-earnings (P/E) or market-to-book (MTB) ratios, has a negative impact on abnormal returns.
NO13074
For instance, Rau and Vermaelen (1998) and Sudarsanam and Mahate (2003) use P/E and MTB ratios
prior to the bid and assess their impact on bidder performance and find that high P/E acquirers receive
significantly negative returns. The authors argue that glamour acquirers (i.e. high P/E or MTB) are
overvalued based on superior past performance. Value acquirers (i.e. low P/E or MTB), however, were
subject to poor performance in the past and therefore forced to evaluate acquisitions more carefully.
Taking into account that high P/E or MTB ratios are generally regarded as positive (i.e. that
companies are doing well), it seems surprising that acquirers perform particularly badly if their pre-bid
performance is good. Hence, much research cites Roll (1986), who suggested a “hubris” explanation
for acquisitions, stating that acquiring firm managers are unaware of how bad their acquisitions are.
The main argument is that individual managers seem to become over-optimistic and misguided when
their company has a strong market value.
Even though there seems to be no direct evidence that the hubris hypothesis is true, it remains
the most likely explanation for the bad performance of glamour acquirers. There is evidence that
acquirers with a high market value or bids made when the stock market is booming tend to perform
badly. An alternative explanation could be that executives are under pressure to invest when their
companies have a high market value. Competition among acquirers for targets could also be stronger
during “hot” market periods, therefore allowing management less time for a careful evaluation of bid
decisions.
To investigate whether pre-bid acquirer performance affects abnormal returns, we employ the
variable PE that is equal to the stock price of the acquirer divided by its net income per share at the
end of the year preceding the acquisition.
Size of the Acquirer
Studies such as Banz (1981) and Reinganum (1983, 1992) show that small firms consistently
experience significantly larger risk-adjusted returns compared to larger firms. In a more recent study,
Moeller et al. (2004) found robust evidence that bidder size is negatively correlated with acquirer
return measured by announcement period CAR. They report a two percent higher announcement
NO13074
return for smaller acquiring firms irrespective of the form of financing and target type (public or
private).
There are several possible reasons for such observations. First, managers of larger firms may
suffer from managerial hubris (Roll, 1986) and may overpay. Second, larger firms tend to make
acquisitions by stock, which typically sends a negative signal to the market. Finally, smaller firms are
more likely to acquire private firms, thus having a favorable market reaction (Masulis et al., 2007).
Part of the previous literature also uses relative size of the acquiring firm compared to the target firm.
Since we do not have data on the size of target firms in our sample, we only use SIZE defined as the
natural logarithm of the acquirer’s total assets at the year-end preceding the acquisition.
Group affiliation of the acquirer
Industrial groups (or holdings) consisting of companies with strong cross-shareholdings are
common in Turkey. These groups are somewhat similar to diversified firms since member companies
may support each other economically in potentially profitable projects. Previous studies found that
sensitivity of investment to cash flow is smaller for group member firms (Lins & Servaes, 1999,
2002). Therefore, it is possible that diversification via acquisitions only benefits firms that do not
belong to industrial groups. For firms that have a group affiliation, further diversification via
acquisitions might not be beneficial because some of the benefits of internal capital markets may
already be captured by the group structure (Lins & Servaes, 1999, 2002). Therefore, investors may
have different perceptions of diversifying and focused acquisitions depending on whether the acquirer
is a group affiliate or not. Diversifying acquisions made by group affiliates may not be perceived as
positive as those made by independent firms
To capture this effect, we include the dummy variable GR which is equal to 1 for group
affiliates in the regression equation. We consider a firm to be a group affiliate if the ultimate owner is
a holding company. We also include the interaction between diversification dummy and group
membership dummy.
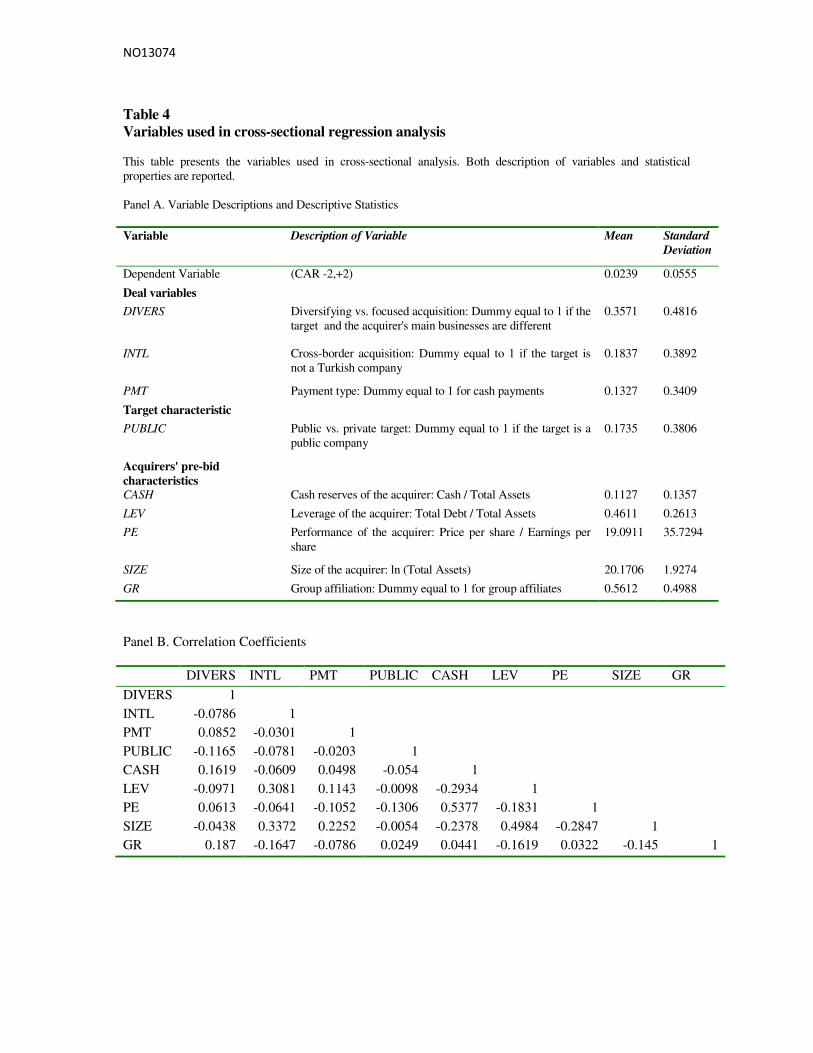
Insert Table 4 here
NO13074
Table 4 describes both dependent and independent variables use in cross sectional regression
analysis. Correlation coefficients among independent variables are also reported. We use (-2,+2) event
window cumulative abnormal returns as our dependent variable. Table 4 also provides descriptive
statistics for the variables. The mean cumulative abnormal return over (-2, 2) event window
surrounding the acquisition is 2.39 percent. About 36 percent of the acquisitions in our sample are
classified as diversifying based on two-digit SIC codes. Around 18 percent of the acquisitions are
cross-border and 13 percent were financed with cash. 17 percent of the target companies in the sample
are public.
The cash reserves of the acquirer firms divided by their total assets has a mean value of 0.11 at
the end of the year preceding the acquisition. The leverage of the acquirer has a mean of 0.46 while the
average P/E ratio for acquirers registers a mean of 19.09. The mean acquirer size measured by the
natural logarithm of its total assets is equal to 20.17. Finally, 56 percent of the acquirer companies in
the sample are group affiliates.
EMPRICAL FINDINGS
Wealth Effect
The wealth gains to acquiring firms are calculated by using a market model. The behavior of
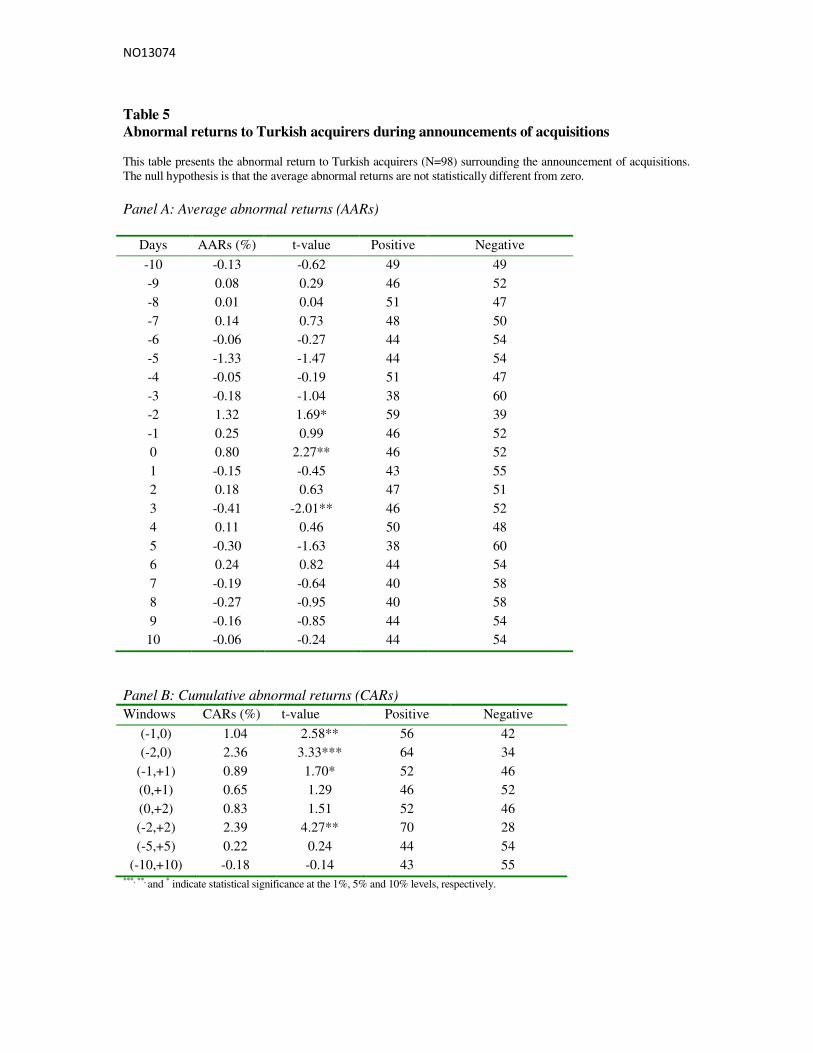
abnormal returns to acquiring firms surrounding the acquisition announcement is reported in Table5.
We both report average abnormal returns (AARs) and cumulative abnormal returns (CARs) to capture
potential news leakage as well as post-announcement market corrections. We use multiple event
windows to report wealth gains.
Insert Table 5 here
As shown on Panel A of Table 5, average abnormal returns (AARs) for days 0 and -2 are
positive and statistically significant. However, the AAR on day +3 is negative and significant. As
shown on Panel B, over the event windows [-1,0], [-2,0], [-1,+1], and [-2,+2], CARs are positive and
NO13074
statistically significant. For example, during [-2,+2] window, the acquiring firms experience abnormal
returns of 2.39 percent. Over the two-day [0,+1], three-day [0,+2] and eleven-day [-5,+5] event
windows surrounding the acquisition, the CAARs are also positive but not statistically significant.
Over the event window [-10,+10], CAAR is negative but not significant
Overall, the evidence suggests that, at the time of the announcement, the Turkish market
considers acquisitions as a value creating strategy as by the fact that abnormal returns are significantly
positive for the majority of event windows considered.
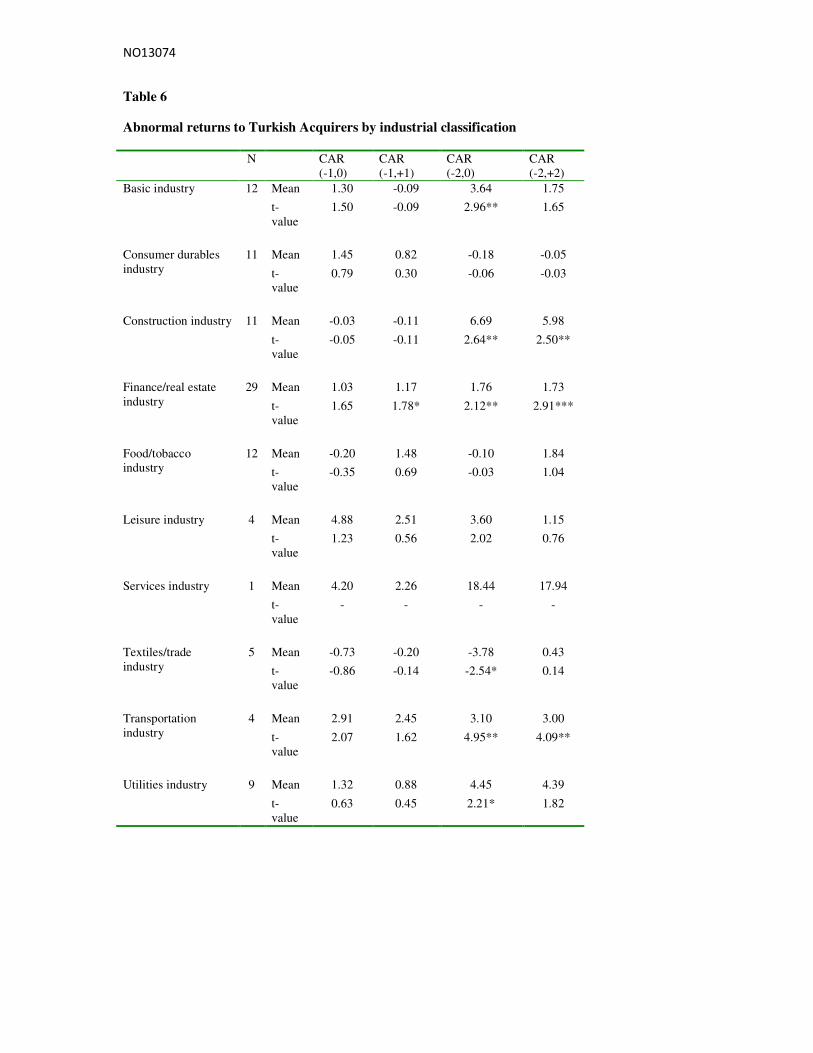
We also report wealth gains to acquirers with respect to industry affiliation on Table 6 that
follows. The results show differences in CARs to acquiring firms based on industry affiliation. The
basic industry, construction industry, finance/real estate industry, textiles/trade industry, transportation
industry and utilities industry subgroups exhibit statistically significant CARs. With the exception of
the average CAR for textiles/trade industry which is negative over the window (-2,0), CAR values are
positive, indicating significant wealth gains. The highest CAR is 6.69 percent for the construction
industry over the event window (-2,0) followed by 5.98 percent for the same industry over the event
window (-2,+2). Six of the ten subgroups display statistically significant wealth gains, indicating that
there is a difference in the impact of M&A activities on acquirers based on industry affiliation.
Insert Table 6 here
Factors Influencing Wealth Effects
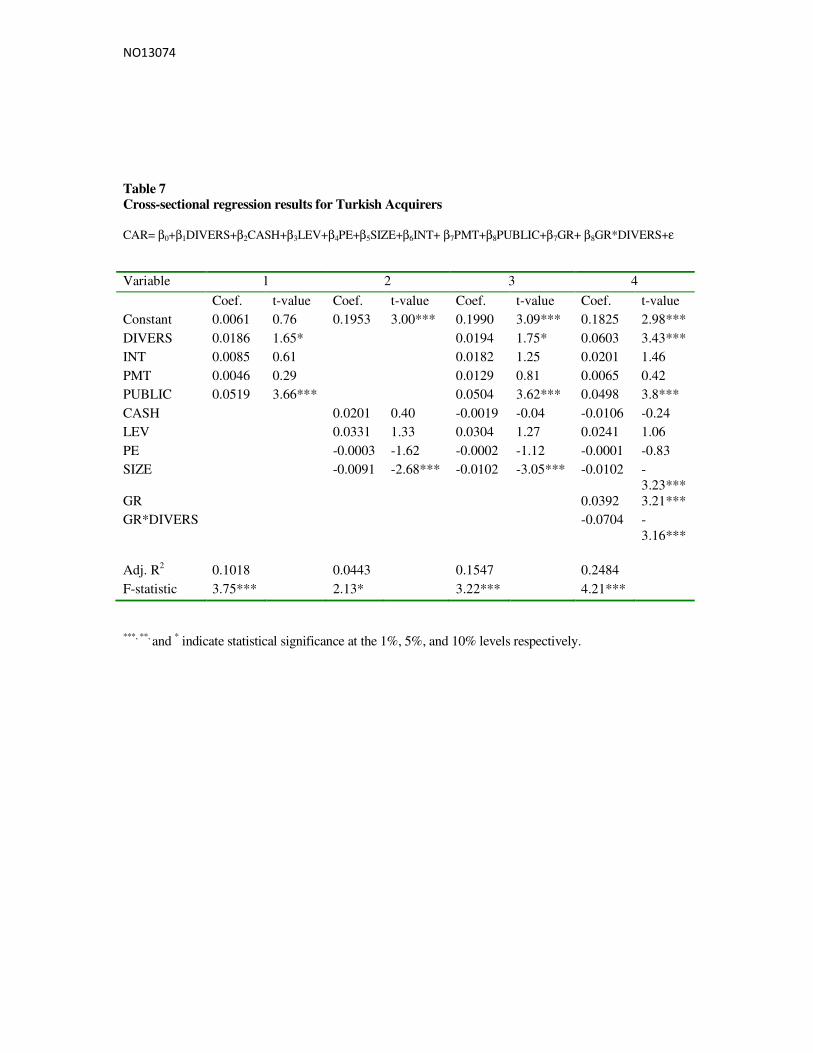
The results of the cross-sectional regression analyses are reported in Table 7. To control
heteroskedasticity problem, variables are normalized by the standard errors of the market model. Table
7 contains results for four separate equations. The first equation uses deal characteristics (DIVERS,
INTL, PMT) and the status of the target (PUBLIC) to explain wealth effects. The second equation
contains acquirer’s pre-bid characteristics (CASH, LEV, PE, SIZE) as independent variables. The
third equation considers deal variables as well as acquirer and target characteristics together. Finally,
the fourth equation adds the group affiliation of the acquirer (GR) and the interaction between group
affiliation and diversification dummy (GR*DIVERS) into the model
NO13074
Insert Table 7 here
The regression results reported on Table 7 have adjusted R-squared values between 4.43
percent and 24.84 percent. The F-statistic values are significant for all four equations.
The first equation tests the impact of deal variables and target status on wealth gains. Among
these variables, the coefficient estimate for the variable DIVERS is positive and statistically significant
at the ten percent level, meaning that diversifying acquisitions generate higher abnormal returns
compared to focused acquisitions. This finding indicates existence of diversification premium in
Turkish market. These findings support the earlier studies on corporate diversification (Schipper and
Thompson, 1983; Hubbard and Palia, 1999; Matsusaka, 1993; and Dyland and Diltz, 2002) and
contradicts more recent studies in this area (Morck, Shleifer, and Vishny, 1990; Agrawal, Jaffe and
Mandelker, 1992; Morgan, Nail, and Megginson, 2000, among others). The coefficient estimate for
the variable PUBLIC is also positive and significant at the one percent level. This indicates that firms
acquiring publicly traded target firms experience higher returns. This finding is contrary to findings of
other studies. For example, Chang (1998), Fuller et al. (2002) and Moeller et al. (2003) report higher
abnormal returns to bidders acquiring private companies. The ownership structure in Turkey is very
concentrated, firms mostly owned by a group or family. Acquiring firms may have to pay excess
premium to convince these firms to sell their entities and it may be easier to buy public companies.
The coefficients of the variables PMT and INTL are positive but not statistically significant.
The second equation tests the impact of the acquirer firm’s pre-bid characteristics using
CASH, LEV, PE and SIZE variables. Among these, the coefficient estimate for the variable SIZE is
negative and statistically significant at the one percent level, indicating that smaller firms experience
higher abnormal returns compare to larger firms. These findings are in line with the existing literature,
reporting consistent higher risk adjusted returns to smaller firms (Banz, 1981; Reinganum, 1992;
Moeller et al. 2004, among others). The variables CASH and LEV have positive coefficient estimates
while the coefficient estimate for the variable PE is negative. However, neither of these is statistically
significant.
NO13074
The third equation considers previous variables together and confirms the results that
diversifying acquisitions generate higher abnormal returns to acquirers compared to focused
acquisitions. We also demonstrate that smaller firms experience higher abnormal returns compare to
larger firms in our sample and that acquiring public firms result in higher wealth gains to acquirers.
Finally the fourth equation investigates whether the perception of diversifying acquisitions by
the investors depends on the group affiliation of the acquirer by adding a group dummy (GR) and the
interaction between the group dummy and diversification dummy (GR*DIVERS) into the equation. In
this specification, the coefficient of the diversification dummy represents difference in abnormal
returns between diversifying and focused acquisitions for non-group affiliates only. Since the
coefficient is equal to 0.06 and significant at one percent level of significance, it can be inferred that,
for the acquisitions made by independent firms, wealth gains to diversifying acquisitions are higher
than wealth gains to focused acquisitions. This result is consistent with the overall sample. However,
for group affiliates, the difference between diversifying and focused acquisitions is captured by the
sum of coefficients of the variables DIVERS and GR*DIVERS. This coefficient is equal to -0.101
(0.060-0.070) and is not statistically significant. Hence, for group affiliates, there is no difference
between diversifying and focused acquisitions in terms of acquirer abnormal returns. It might be the
case that, since group members are already capturing positive effects of diversification such as access
to internal funds or risk reduction, due to their group structure, investors do not perceive any
difference between focused and diversifying acquisitions in terms of value creation.
SUMMARY AND CONCLUSION
Mergers and acquisitions (M&As) continue to receive attention of both scholars and policy
makers. M&A activities could give firm opportunity to diversify to its operations. Diversification can
either destroys value or create value for the acquirers. Most recent studies tend to show that the
diversification at the corporate level is redundant and value destroying
NO13074
We examined this issue by analyzing a group of Turkish firms that expand via acquisitions.
Using an event study methodology, we investigated the abnormal returns of the Turkish acquirer upon
the announcement of acquisitions. Our objective was to investigate whether diversifying and non-
diversifying acquisitions differ in terms of acquirer abnormal returns while controlling other factors.
Our findings indicated that Turkish acquirer enjoy positive abnormal returns during various
event windows. The results of the cross-sectional regression analysis show that diversifying
acquisitions generate higher abnormal returns to acquirers compared to focused acquisitions. We also
demonstrate that smaller firms experience higher abnormal returns compare to larger firms in our
sample. Finally, acquiring public firms result in higher wealth gains to acquirers.
We also analyzed whether results differ among group affiliates and independent firms. Indeed,
estimation results showed that if an acquisition is made by an independent firm, diversifying
acquisitions generate higher abnormal returns compared to focused acquisitions. However, if the
acquirer is a group affiliate, there is no significant difference between the two types of acquisition
activities in terms of wealth effects.
REFERENCES
Agrawal, A., Jaffe, J. F., & Mandelker, G. N. (1992). The post-merger performance of acquiring firms:
A re-examination of an anomaly. The Journal of Finance, 47 (4), 1605-1621.
Banz, R. W. (1981). The relation between return and market value of common stocks. Journal of
Financial Economics, 9 (1), 3-18.
Barney, J. (1991). Firm resources and sustained competitive advantage. Journal of Management, 17,
99-120.
Bhagat, S., Malhotra, S., & Zhu, P.C. (2011). Emerging country cross-border acquisitions:
Characteristics, acquirer returns and cross-sectional determinants. Emerging Markets Review, 12(3),
250-271.
Cai, X.S. (2004). Ownership, control and acquirers’ returns: preliminary evidence from East Asian
companies (Cornell Legal Studies Research Paper No: 04-038). Retrieved April 1, 2012, from
http://ssrn.com/abstract=625684
Campbell, J. Y. (1996). Understanding risk and return. Journal of Political Economy, 104(2), 298-345.
NO13074
Chang, S. (1998). Takeovers of privately held targets, methods of payment, and bidder returns. The
Journal of Finance, 53(2), 773-784.
Chevalier, J. A. (2000). Why do firms undertake diversifying mergers? An examination of the
investment policies of merging firms (University of Chicago Working Paper). Retrieved April 1,
2012, from http://citeseer.ist.psu.edu/viewdoc/summary?doi=10.1.1.37.3779
Comment, R. & Jarrell, G. (1995). Corporate focus and stock returns. Journal of Financial Economics,
37(1), 67-87.
Daley, L., Mehrotra, V., & Sivakumar, R. (1997). Corporate focus and value creation: Evidence from
spinoffs. Journal of Financial Economics, 45(2), 257-281.
Datta, D. K & Puia, G. (1995). Cross-border acquisitions: An examination of the influence of
relatedness and cultural fit on shareholder value creation in the US acquiring firms. Management
International Review, 35(4), 337-359.
Deloitte (2012). Annual Turkish M&A Review. Retrieved December 1, 2012, from
http://www.deloitte.com/assets/Dcom-Turkey/Local%20Assets/Documents/turkey
tr_kf_birlesmesatinalmaraporu_210111.pdf
Desai, H. & Jain, P. C. (1999). Firm performance and focus: Long-run stock market performance
following spinoffs. Journal of Financial Economics, 54(1), 75-101.
Dey, T. & Banerjee, R. (2011). Can corporate diversification promote firm value? A survey
(University of Munich Working Paper No. 28928). Retrieved December 1, 2012, from
http://mpra.ub.uni-muenchen.de/28928/
Dos Santos, M. B., Errunza, V. R., & Miller, D. P. (2008). Does corporate international diversification
destroy value? Evidence from cross-border mergers and acquisitions. Journal of Banking and Finance,
32(12), 2716-2724.
Doukas, J. & Travlos, N. G. (1988). The effect of corporate multinationalism on shareholders’ wealth:
evidence from international acquisitions. The Journal of Finance, 43, 1161–1175.
Fatemi, A. & Furtado, E. P. (1998). An empirical investigation of the wealth effects of foreign
acquisitions. In S. Kouri & A. Ghosh (Eds.), Recent developments in international banking and
finance (pp. 363–379). Cambridge, MA: Blackwell Publishing.
Fuller, K., Netter, J., & Stegemoller, M. (2002). What do returns to acquiring firms tell us? Evidence
from firms that make many acquisitions. The Journal of Finance, 57(4), 1763-1793.
Garvey, G. & Hanka, G. (1999). Capital structure and corporate control: the effect of state
antitakeover laws on firm leverage. The Journal of Finance, 54, 519- 546.
Graham, J. R., Lemmon, M. L., & Wolf, J. G. (2002). Does corporate diversification destroy value?
The Journal of Finance, 57(2), 695–720.
Hansen, R. (1987). A theory for the choice of exchange medium in mergers and acquisitions. Journal
of Business, 60, 75-96.
Hansen, R. G. & Lott, J. R. (1996). Externalities and corporate objectives in a world with diversified
shareholders/consumers. Journal of Financial and Quantitative Analysis, 31(1), 43-68.
Hubbard, R. G. & Palia, D. (1999). A reexamination of the conglomerate merger wave in the 1960s:
An internal capital markets view. The Journal of Finance, 54, 1131–1152.
NO13074
Hyland, D. C. & Diltz, J. D. (2002). Why firms diversify: An empirical examination. Financial
Management, 31(1), 51–80.
Jensen, M. C. (1986). Agency costs of free cash flow, corporate finance, and takeovers. The American
Economic Review, 76(2), 323-329.
John, K. & Ofek, E. (1995). Asset sales and increase in focus. Journal of Financial Economics, 37(1),
105–126.
Kaplan, S. N. & Weisbach, M. S. (1992). The success of acquisitions: Evidence from divestitures. The
Journal of Finance, 47(1), 107–138.
Kiymaz, H. (2004). “Cross-border acquisitions of U.S. financial institutions: Impact of
macroeconomic factors”, Journal of Banking and Finance 28, 2004, 1413-1439.
Kiymaz, H. and T. Mukherjee (2000). “The impact of country diversification on wealth effects in
cross-border mergers”, The Financial Review 35, 2000, 37-58.
Kiymaz, H. and T. Mukherjee (2001). “Parameter shifts when measuring wealth effects in cross-
border mergers”, Global Finance Journal 12, 2001, 249-266.
Kiymaz, H. (2006). “The impact of announced motives, financial distress, and industry affiliation on
shareholders’ wealth: Evidence from large sell-offs”, Quarterly Journal of Business and Economics
45, Fall 2006, 69-90.
Maksimovic, V. & Phillips, G. (2007). Conglomerate firms and internal capital markets. In B.E. Eckbo
(Ed.), Handbook of corporate finance. Amsterdam, North Holland: Elsevier.
Mandacı, P. E. (2004). Şirketlerin birleşme ve satın alma duyurularının hisse senedi fiyatları
üzerine etkileri [The impact of merger and acquisition announcements on stock prices]. İktisat
İşletme ve Finans, 19, 118-124.
Martin, J. D. & Sayrak, A. (2003). Corporate diversification and shareholder value: a survey of recent
literature. Journal of Corporate Finance, 9, 37-57.
Martynova, M. & Renneboog, L. D. R. (2011). The Performance of the European market for
corporate control: Evidence from the 5th takeover wave. European Financial Management, 17, 208-
260.
Matsusaka, J. G. (1993). Takeover motives during the conglomerate merger wave. RAND Journal of
Economics, 24, 357–379.
Moeller, S. B., Schlingemann, F. P., & Stulz, R. M. (2003). Do shareholders of acquiring firms gain
from acquisitions? (Dice Center Working Paper No: 2003-4). Retrieved April 1, 2012, from
http://ssrn.com/abstract=383560
Moeller, S. B., Schlingemann, F. P. & Stulz, R. M. (2004). Firm size and the gains from acquisitions,
Journal of Financial Economics, 73(2), 201-228.
Masulis, R., Wang, C., & Xie, F. (2007). Corporate governance and acquirer returns. The Journal of
Finance, 62(4), 1851-1889.
Morck, R., Shleifer, A., & Vishny, R. W. (1990). Do managerial objectives drive bad acquisitions?
The Journal of Finance, 45(1), 31–48.
Morgan, A., Nail, L. A., & Megginson, W. L. (2000). Changes in corporate focus, ownership
structure, and long-run merger returns (University of Alabama at Birmingham Working Paper).
Retrieved April 1, 2012, from http://ssrn.com/abstract=250993
NO13074
Myers, S. C., & Majluf, N. S. (1984). Corporate financing and investment decisions when firms have
information investors do not have. Journal of Financial Economics, 13(2), 187-221.
Rau, P. R. & Vermaelen, T. (1998). Glamour, value and the post-acquisition performance of acquiring
firms. Journal of Financial Economics, 49(2), 223-253.
Reinganum, M. R. (1983). Portfolio strategies based on market capitalization. Journal of Portfolio
Management, 9(2), 18-28.
Reinganum, M. R. (1992). A revival of the small-firm effect. Journal of Portfolio Management,
18(3), 55-62.
Reuer J, Oded, J. S., & Ragozzino, R. (2004). Mitigating risk in international mergers and
acquisitions: The role of contingent payouts. Journal of International Business Studies, 35, 9-32.
Roll, R. (1986). The hubris hypothesis of corporate takeovers. Journal of Business, 59, 197–216.
Schipper, K. & Thompson, R. (1983). Evidence on the capitalized value of merger activity for
merging firms. Journal of Financial Economics, 11, 85–119.
Schiereck, D. & Oelger, M. (2011). Cross-Border M&A and international stock market integration:
Evidence from Turkey. International Journal of Economic Research, 2(3), 40-55.
Sicherman, N. & Pettway, R. (1987). Acquisition of divested assets and shareholder wealth. The
Journal of Finance, 42, 1261-1273.
Stulz, R. M. (1990). Managerial discretion and optimal financing policies. Journal of Financial
Economics, 26, 3–27.
Sudarsanam, S., Holl, P., & Salami, A. (1996). Shareholders wealth gains in mergers: Effect of
synergy and ownership structure. Journal of Business Finance and Accounting, 23, 673-698.
Travlos, N. G. (1987). Corporate takeover bids, methods of payment and bidding firms’ stock returns.
The Journal of Finance, 42, 943–963.
Walker, M. (2000). Corporate takeovers, strategic objectives and acquiring firm shareholder wealth.
Financial Management, 20, 53–66.
NO13074
Table 1
Sample Selection
Number of
deals
Beginning sample 188
Less: Contaminated events 44
Less: Clustered takeovers 9
Less: Missing data 37
Final sample 98
Table 2
Distribution of Acquisitions by Type and Year
This table reports the distribution of acquisitions type and years. Acquisitions are classified as either
focused or diversifying acquisitions.
Type of Acquisitions
Year Focused Diversifying Total
Pre-2005 19 9 28
2005 4 2 6
2006 6 1 7
2007 7 6 13
2008 6 2 8
2009 6 5 11
2010 9 3 12
2011 6 7 13
Total 63 35 98
Percentage 64% 36% 100%
NO13074
Table 3
Distribution of Acquisitions by Industry Affiliation
This table reports industry affiliations of both acquirers and target firms.
Acquiring firms Target firms
Industry No of
firms
% No of
firms
%
Petroleum industry 0 0 1 1
Finance/real estate industry 18 25 14 14
Consumer durables industry 8 11 13 13
Basic industry 10 14 11 11
Food/tobacco industry 8 11 12 12
Construction industry 9 13 6 6
Capital goods industry 0 0 3 3
Transportation industry 3 4 5 5
Utilities industry 8 11 13 13
Textiles/trade industry 4 6 11 11
Services industry 1 1 7 7
Leisure industry 3 4 2 2
Total 72 100 98 100
NO13074
Table 4
Variables used in cross-sectional regression analysis
This table presents the variables used in cross-sectional analysis. Both description of variables and statistical
properties are reported.
Panel A. Variable Descriptions and Descriptive Statistics
Variable Description of Variable Mean Standard
Deviation
Dependent Variable (CAR -2,+2) 0.0239 0.0555
Deal variables
DIVERS Diversifying vs. focused acquisition: Dummy equal to 1 if the
target and the acquirer's main businesses are different
0.3571 0.4816
INTL Cross-border acquisition: Dummy equal to 1 if the target is
not a Turkish company
0.1837 0.3892
PMT Payment type: Dummy equal to 1 for cash payments 0.1327 0.3409
Target characteristic
PUBLIC Public vs. private target: Dummy equal to 1 if the target is a
public company
0.1735 0.3806
Acquirers' pre-bid
characteristics
CASH Cash reserves of the acquirer: Cash / Total Assets 0.1127 0.1357
LEV Leverage of the acquirer: Total Debt / Total Assets 0.4611 0.2613
PE Performance of the acquirer: Price per share / Earnings per
share
19.0911 35.7294
SIZE Size of the acquirer: ln (Total Assets) 20.1706 1.9274
GR Group affiliation: Dummy equal to 1 for group affiliates 0.5612 0.4988
Panel B. Correlation Coefficients
DIVERS INTL PMT PUBLIC CASH LEV PE SIZE GR
DIVERS 1
INTL -0.0786 1
PMT 0.0852 -0.0301 1
PUBLIC -0.1165 -0.0781 -0.0203 1
CASH 0.1619 -0.0609 0.0498 -0.054 1
LEV -0.0971 0.3081 0.1143 -0.0098 -0.2934 1
PE 0.0613 -0.0641 -0.1052 -0.1306 0.5377 -0.1831 1
SIZE -0.0438 0.3372 0.2252 -0.0054 -0.2378 0.4984 -0.2847 1
GR 0.187 -0.1647 -0.0786 0.0249 0.0441 -0.1619 0.0322 -0.145 1
NO13074
Table 5
Abnormal returns to Turkish acquirers during announcements of acquisitions
This table presents the abnormal return to Turkish acquirers (N=98) surrounding the announcement of acquisitions.
The null hypothesis is that the average abnormal returns are not statistically different from zero.
Panel A: Average abnormal returns (AARs)
Days AARs (%) t-value Positive Negative
-10 -0.13 -0.62 49 49
-9 0.08 0.29 46 52
-8 0.01 0.04 51 47
-7 0.14 0.73 48 50
-6 -0.06 -0.27 44 54
-5 -1.33 -1.47 44 54
-4 -0.05 -0.19 51 47
-3 -0.18 -1.04 38 60
-2 1.32 1.69* 59 39
-1 0.25 0.99 46 52
0 0.80 2.27** 46 52
1 -0.15 -0.45 43 55
2 0.18 0.63 47 51
3 -0.41 -2.01** 46 52
4 0.11 0.46 50 48
5 -0.30 -1.63 38 60
6 0.24 0.82 44 54
7 -0.19 -0.64 40 58
8 -0.27 -0.95 40 58
9 -0.16 -0.85 44 54
10 -0.06 -0.24 44 54
Panel B: Cumulative abnormal returns (CARs)
Windows CARs (%) t-value Positive Negative
(-1,0) 1.04 2.58** 56 42
(-2,0) 2.36 3.33*** 64 34
(-1,+1) 0.89 1.70* 52 46
(0,+1) 0.65 1.29 46 52
(0,+2) 0.83 1.51 52 46
(-2,+2) 2.39 4.27** 70 28
(-5,+5) 0.22 0.24 44 54
(-10,+10) -0.18 -0.14 43 55 ***, **, and * indicate statistical significance at the 1%, 5% and 10% levels, respectively.
NO13074
Table 6
Abnormal returns to Turkish Acquirers by industrial classification
N CAR
(-1,0)
CAR
(-1,+1)
CAR
(-2,0)
CAR
(-2,+2)
Basic industry 12 Mean 1.30 -0.09 3.64 1.75
t-
value
1.50 -0.09 2.96** 1.65
Consumer durables
industry
11 Mean 1.45 0.82 -0.18 -0.05
t-
value
0.79 0.30 -0.06 -0.03
Construction industry 11 Mean -0.03 -0.11 6.69 5.98
t-
value
-0.05 -0.11 2.64** 2.50**
Finance/real estate
industry
29 Mean 1.03 1.17 1.76 1.73
t-
value
1.65 1.78* 2.12** 2.91***
Food/tobacco
industry
12 Mean -0.20 1.48 -0.10 1.84
t-
value
-0.35 0.69 -0.03 1.04
Leisure industry 4 Mean 4.88 2.51 3.60 1.15
t-
value
1.23 0.56 2.02 0.76
Services industry 1 Mean 4.20 2.26 18.44 17.94
t-
value
- - - -
Textiles/trade
industry
5 Mean -0.73 -0.20 -3.78 0.43
t-
value
-0.86 -0.14 -2.54* 0.14
Transportation
industry
4 Mean 2.91 2.45 3.10 3.00
t-
value
2.07 1.62 4.95** 4.09**
Utilities industry 9 Mean 1.32 0.88 4.45 4.39
t-
value
0.63 0.45 2.21* 1.82
NO13074
Table 7
Cross-sectional regression results for Turkish Acquirers
CAR= β0+β1DIVERS+β2CASH+β3LEV+β4PE+β5SIZE+β6INT+ β7PMT+β8PUBLIC+β7GR+ β8GR*DIVERS+ε
Variable 1 2 3 4
Coef. t-value Coef. t-value Coef. t-value Coef. t-value
Constant 0.0061 0.76 0.1953 3.00*** 0.1990 3.09*** 0.1825 2.98***
DIVERS 0.0186 1.65* 0.0194 1.75* 0.0603 3.43***
INT 0.0085 0.61 0.0182 1.25 0.0201 1.46
PMT 0.0046 0.29 0.0129 0.81 0.0065 0.42
PUBLIC 0.0519 3.66*** 0.0504 3.62*** 0.0498 3.8***
CASH 0.0201 0.40 -0.0019 -0.04 -0.0106 -0.24
LEV 0.0331 1.33 0.0304 1.27 0.0241 1.06
PE -0.0003 -1.62 -0.0002 -1.12 -0.0001 -0.83
SIZE -0.0091 -2.68*** -0.0102 -3.05*** -0.0102 -
3.23***
GR 0.0392 3.21***
GR*DIVERS -0.0704 -
3.16***
Adj. R2 0.1018 0.0443 0.1547 0.2484
F-statistic 3.75*** 2.13* 3.22*** 4.21***
***, **,
and * indicate statistical significance at the 1%, 5%, and 10% levels respectively.