Embed Size (px)
Citation preview

US
Building Long-term Wealth by Investing in Private Companies
Annual Report and Accounts 31 January 2018
HV
PE
An
nu
al Rep
ort an
d A
ccou
nts 2018

Investment Objective The Company’s investment objective is to generate superior shareholder returns through long-term capital appreciation by investing primarily in a diversified portfolio of private markets investments.
Why Private Markets?Globally, the opportunity set in private companies greatly exceeds that available in the listed markets. Historically, private equity has delivered strong returns, outperforming listed equity over the long term.1
Why HVPE?HarbourVest Global Private Equity (“HVPE”) provides investors with diversified access to opportunities in private markets through investing into funds managed by HarbourVest Partners, a leading independent global private markets asset manager. HVPE has a strong track record and in the ten years ending 31 January 2018 had more than doubled its net asset value (“NAV”) per share, implying a compound annual growth rate of 7.5% in US dollar terms (equivalent to 11.2% in sterling).2
Why Now? A growing number of mainstream investment managers are now focusing on the opportunities available in private companies. Meanwhile, established specialist funds such as HVPE have been delivering strong returns for many years, whilst the shares continue to trade at a discount to the value of their assets.
1 Globally, private equity funds returned 12.2% annually over the 20 years to 30 September 2017, compared to 6.9% for the MSCI World on a public market equivalent (“PME”) total return basis. Source: Burgiss. Past performance is not necessarily indicative of future returns.
2 Represents the compound annual growth rate of the NAV per share over the last ten years from $10.39 (£5.23) at 31 January 2008 to $21.46 (£15.12) at 31 January 2018.

1 HVPE Annual Report and Accounts 2018
Governance R
eportFinancial S
tatements
Supplem
entary Data
Strateg
ic Rep
ort
NAV per Share ($)
15.86
2015
16.75
2016
18.47
2017
21.46
2018
Share Price ($, converted3)
12.73
2015
12.41
2016
15.03
2017
17.77
2018
Investment Portfolio Growth ($)
128.0
2015
82.1
2016
147.5
2017
248.8
2018
NAV per Share (£, converted3)
10.53
2015
11.76
2016
14.68
2017
15.12
2018
Share Price (£)
8.45
2015
8.71
2016
11.95
2017
12.52
2018
Distribution Proceeds ($)
355.5
2015
362.5
2016
251.0
2017
405.1
2018
Highlights
Year to 31 January 2018
ContentsHighlights 1
Strategic ReportWhat is HVPE? 2The HVPE Difference 3Why Invest in HVPE 4Chairman’s Statement 5Investment Manager’s Review 10Celebrating Ten Years 14Share Price Trading and Liquidity 16Managing the Portfolio: Strategic Asset Allocation and Diversification 17Managing the Company 20Summary of Net Assets 25Recent Events 26Principal Risks and Uncertainties 27Investment Manager About HarbourVest 30The HarbourVest Platform 32HarbourVest Investment Committee 33A Focus on Real Assets 34Global Private Markets: Overview and Outlook 36Investment Portfolio Commitment Phase 38Investment Phase 40Growth Phase 42Mature Phase 44Manager Spotlight 46Companies Spotlight 50Secondaries Case Studies 54
Governance ReportBoard of Directors 58Directors’ Report 60Board Structure and Committees 66Corporate Governance 73Statement of Directors’ Responsibilities 77Directors’ Remuneration Report 78
Financial StatementsIndependent Auditor’s Report to the Members of HarbourVest Global Private Equity Limited 79Independent Auditor’s Report to the Directors of HarbourVest Global Private Equity Limited 85Audited Consolidated Financial Statements 86Notes to the Consolidated Financial Statements 94
Supplementary DataHVPE’s HarbourVest Fund Investments 102Largest Companies and Managers 104Glossary of Private Equity Terms 120Disclosures 123
3 As the Company has a US dollar denominated NAV and a sterling denominated share price (since 9 September 2015) we have shown the performance of the NAV and share price in both currencies for comparative purposes. All figures have been converted at the prevailing currency conversion rate as at 31 January of each year displayed.
2017: +10.3%
+16.2%
2017: +21.1%
+18.2%
$248.8m
2017: +24.8%
+3.0%
2017: +37.2%
+4.8%
$405.1m

2 HVPE Annual Report and Accounts 2018
NAV per Share ($) Movement – Last Ten Years
As at 31 January
7.618.65
10.2411.42
12.4614.38
15.8616.75
18.47
21.46
2009 2010 2011 2012 2013 2014 2015 2016 2017 2018
What is HVPE?Owning shares in HVPE provides investors with a comprehensive and well-managed, ready-made global private equity programme.
Past performance is not necessarily indicative of future returns.
1 HVPE is managed by HarbourVest Advisers L.P. (the “Investment Manager”), an affiliate of HarbourVest Partners, LLC (“HarbourVest”), a private markets asset manager whose history dates back to 1982.
2 As at 31 December 2017.
What is HVPE?HVPE (or the “Company”) is a London listed, FTSE 250 private equity investment company with assets of $1.7 billion and a market capitalisation of £1.0 billion as at 31 January 2018 (ticker: HVPE).
The Company provides access to private companies and portfolios of private companies through funds managed by HarbourVest (the “Investment Manager”)1, an innovative global private markets asset manager with more than $49 billion of assets under management2 and a long history of success.
By committing capital across HarbourVest’s primary, secondary, and direct co-investment programmes (see page 32, “The HarbourVest Platform”), HVPE has created a private markets portfolio that is diversified by geography, strategy, stage of investment, vintage year and sector. As at 31 January 2018, HVPE’s portfolio was made up of 42 HarbourVest funds and two secondary co-investments. The Company’s structure is shown on page 20.
HVPE is structured to provide investors with broad exposure to a carefully selected range of exciting opportunities in private companies around the world, from technology start-ups to mature, established businesses looking for the next phase of growth.
Building Long-term Wealth: Steady NAV Growth Since 2009
Track RecordBy following a consistent and proven investment strategy, HVPE has delivered steady and robust NAV growth and has outperformed the public markets since inception, as measured by the FTSE All-World Total Return (“TR”) Index. This has been achieved whilst running a well-diversified strategy with relatively low volatility and maintaining a prudent balance sheet with ample liquidity to fund new investments.

3 HVPE Annual Report and Accounts 2018
Governance R
eportFinancial S
tatements
Supplem
entary Data
Strateg
ic Rep
ort
The HVPE DifferenceAccess to a Leading Private Markets Manager HarbourVest has been investing in the private markets for over 35 years. Through HVPE’s strategy of committing capital to HarbourVest funds, shareholders benefit from the expertise of HarbourVest’s 100+ investment professionals who aim to select the leading private equity managers or companies from the opportunities available globally. This provides shareholders with access to the best private markets opportunities in the world. See “About HarbourVest” on pages 30 and 31.
Access to Private CompaniesHVPE, in effect, provides part-ownership of thousands of underlying private companies, spanning early venture to large-cap buyouts. This means that shareholders in HVPE have exposure to exciting early stage companies, as well as more mature, established private businesses, prior to public ownership or exit. The most successful of these have the potential to displace established business models and become the corporate giants of tomorrow.
Selective DiversificationHVPE is the most diversified listed private equity investment company in the London market. However, at HarbourVest, each new fund commitment or company investment undergoes a rigorous screening process, with the aim of ensuring that the resulting investments are of the highest possible quality. The result is that HVPE’s portfolio only captures approximately 5% of the opportunities available in private markets, with a focus on proven managers with whom HarbourVest has built strong and enduring relationships through multiple fund cycles. See pages 18 to 19 for more on diversification.
Actively Managed PortfolioHarbourVest believes that active management of a diversified portfolio through the investment lifecycle is the key to successful performance. With reference to its long-term Strategic Asset Allocation targets (see pages 17 to 18), HVPE makes regular commitments to new HarbourVest funds, which in turn drive a steady pace of investment into new private company opportunities. These investments then develop and grow over a period of several years, before being realised. Proceeds from these then provide the fuel for new commitments and the lifecycle continues. See page 4 for more details on the value creation cycle.
Find out more online at www.hvpe.com
An investment of £1,000 in HVPE shares at the December 2007 IPO would have been worth £2,577 on 31 January 2018, equivalent to a compound annual growth rate of 10%.

4 HVPE Annual Report and Accounts 2018
Our Value Creation CycleCommitment Phase
The Investment Manager and the Board consider a number of factors before new commitments are made:/ / Current unfunded commitment levels
(“Investment Pipeline”)/ / Anticipated rate of investment/ / Future expected realisations
/ / The economic environment/ / The available credit facility
/ / Commitment and coverage ratios/ / Existing portfolio and strategy
Read more on p38
Mature Phase Within approximately seven to ten years, managers are
typically realising investments. As a permanent capital vehicle,
HVPE targets approximately 25% of NAV in this phase.
Read more on p44
Investment PhaseThe HarbourVest funds invest HVPE’s commitments over a
period of approximately four years, aiming for a target of 25% of NAV in this phase over the long term.
Read more on p40
Growth Phase During years five to nine, most
HarbourVest funds are fully invested, and managers are actively driving
growth. The majority of NAV accretion takes place during this phase,
where HVPE aims to maintain 50% of NAV over the long term.
Read more on p42
The Value We Create
9Consecutive years of positive
annual NAV returns
+115%NAV per share growth
since inception (US dollars)1
40%Long-run average
uplift on realisation2
1 Refer to table on page 15 for historical returns.2 Uplift on carrying value. Average of figures reported from 31 January 2012, when this analysis began; historical figures range from 30% to 50%.
Why Invest in HVPEInvesting in private markets requires a considered, long-term approach. HVPE provides a complete private equity solution for public investors by managing the portfolio through four phases of the private equity cycle: Commitment, Investment, Growth, and Maturity. HVPE makes regular commitments to new HarbourVest funds, which in turn drive a steady pace of investment into new private company opportunities. These investments then develop and grow over a period of several years before being realised. Proceeds from these then provide the fuel for new commitments and the lifecycle continues.

5 HVPE Annual Report and Accounts 2018
Governance R
eportFinancial S
tatements
Supplem
entary Data
Strateg
ic Rep
ort
Chairman’s Statement
Dear ShareholderHarbourVest Global Private Equity (“HVPE” or the “Company”) continued to make significant progress in the year to 31 January 2018. Since the main market listing in London in September 2015, the Company has established itself as one of the few diversified listed private equity companies with liquidity and scale sufficient to be readily available for investment by all classes of shareholders from large institutions through to individuals. It has assets of over $1.7 billion, a market capitalisation of approximately £1.0 billion, and shares to the value of over £400,000 are regularly traded daily. It is managed by HarbourVest who have 35 years of experience in private markets and manage in excess of $49 billion of investors’ money.
The year was one of significant further progress for the Company’s US dollar denominated Net Asset Value per share.
Performance and Asset ValuesThe Company’s functional currency is the US dollar and the year to 31 January 2018 saw a further year of double digit growth in NAV per share from $18.47 to $21.46, or by 16.2%. In many years in the past, such substantial double-digit growth would have materially outpaced
that of listed markets. However, the year to 31 January 2018 was, once again, an unusually strong one for those listed markets. The Company benchmarks performance against the total return on the FTSE All World Index which amounted to 28.2% for the year.
Investment in private assets requires a long-term horizon and the ability to live through short-term performance comparisons with volatile listed markets. Private assets are typically revalued no more than every three to six months and often those updated valuations lag those of listed markets, particularly when those listed markets are rising rapidly. Despite that lag, from inception of the Company in 2007 to 31 January 2018 HVPE delivered NAV per share total return in US dollars of 114.6% as against 73.6% total return for the FTSE All World Index.
Share Price PerformanceWhat matters to shareholders is share price performance. Since September 2015, the Company’s listing on the Main Market of the London Stock Exchange has been quoted in sterling whilst the Company’s functional currency has remained the US dollar. 55% of HVPE’s assets consist directly of US investments and a further 23% of assets are denominated in US dollars. In consequence, the exchange rate between the US dollar and sterling is
HVPE has established itself as one of the few diversified listed private equity companies with liquidity and scale sufficient to be readily available for investment by all classes of shareholders.

6 HVPE Annual Report and Accounts 2018
critical to the translation of the US dollar NAV per share performance into sterling and it is that sterling figure that is a key determinant in relation to the share price.
In the year to 31 January 2018, sterling made a significant recovery after the shock of the UK Referendum in June 2016. In addition, the US dollar was going through a weak period with the trade weighted index of the currency depreciating by approximately 8.2% during the year. Against sterling the US dollar moved from $1.258 to $1.419, or an appreciation of sterling by 12.8% which depressed the NAV per share when viewed in sterling. Consequently, notwithstanding the substantial double-digit growth of NAV per share in US dollars, in sterling terms that NAV per share grew by a modest 3.0% on account of the currency movement.
The second factor influencing the share price is the discount to NAV at which the Company’s shares trade on the stock market. The reasons for investment companies’ shares trading at discounts are many. The reality is that many companies’ shares, and indeed whole sectors, do trade regularly at discounts and movements in those discounts are often volatile and unpredictable. For the year to 31 January 2018 the discount narrowed from 19% to 17% and the share price rose from £11.95 to £12.52, or by 4.8%. In contrast to the previous year, US dollar shareholders benefitted from the appreciation of sterling with the share price, translated back into US dollars, rising by 18.2%.
Immediately after the Company’s year-end, stock markets suffered a substantial sell-off. HVPE’s shares have been trading recently at a discount to NAV per share of some 20% and there has been significant short-term volatility in the US dollar/sterling exchange rate which has been reflected in some movement in the share price. Although the strongest determinant of shareholder value will continue to be the delivery by the Investment Manager of superior growth in NAV per share, the Board is very mindful of the need to aspire towards a lower discount and regularly reviews options with the Company’s corporate brokers. However, as I have reported in earlier statements, for an ongoing company investing in illiquid assets options that will have a long-term effect are limited. One, though, that will have a long-term effect is
effective spreading of the story to prospective investors as to the merits of listed private equity as an asset class, and of HVPE in particular, and the Board and Investment Manager have dedicated significant additional resources towards marketing and promoting the Company in recent months.
Company Portfolio, Balance Sheet and FeesThe Investment Manager’s report follows this Statement and gives details of the Company’s business and of the market in private assets. In order to generate future growth in NAV per share, in accordance with the strategic plan presented to and approved by the Board annually, the Investment Manager continued to make new commitments to HarbourVest funds. During the year $340 million was committed and at the year end HVPE had yet-to-be funded commitments of $1.2 billion. At every meeting the Board focuses on those commitments and the future funding thereof, including reviewing balance sheet models which assume both the continuation of optimistic scenarios for markets and asset values and, importantly, possibly more difficult times. When reviewing every model, the Board strives to ensure that the Company will be positioned such that it will be able to conduct its business according to plan, as indeed it was able to do through the Global Financial Crisis of 2008/09.
The Company’s balance sheet is strong. At 31 January 2018, the Company had cash balances of $257 million and an undrawn $500 million credit facility provided by Lloyds Bank Plc and Credit Suisse with a repayment date of December 2022. I am pleased to report that during the year the duration of the bank facility was extended by 12 months to 60 months and in the future it is intended that at annual renewal there will always be at least 48 months unexpired on the current facility. In today’s climate the Company considers that the risk of being unable to maintain a facility with at least 48 months unexpired is low and thus it is reasonable to continue to make significant new commitments to HarbourVest funds and be ready to participate in any attractive opportunities that HarbourVest might be able to source for HVPE.
Chairman’s Statement continued

7 HVPE Annual Report and Accounts 2018
Governance R
eportFinancial S
tatements
Supplem
entary Data
Strateg
ic Rep
ort
+16.2%NAV per share growth over the year ($)
I have previously reported that the Investment Manager had expected a reduction in the substantial cash balances that the Company had built up. In fact, in the year to 31 January 2018, strong distributions continued and the Company ended its year with a cash balance which had increased by over $80 million. Movements in cash balances are the residual product of two substantial figures. In the year the Company received distributions of $405 million and subscribed $313 million in calls and relatively small movements in either of these factors can cause significant movement in the cash balances.
In its report the Investment Manager reviews the trend for the increased use of readily available debt throughout the private equity industry. The Investment Manager has taken advantage of that availability to increase the level of debt, particularly in the use of short-term bridging facilities, in some of the HarbourVest funds in which the Company is invested. That increase is directly mirrored in the build-up of cash on the Company’s balance sheet. The Investment Manager does not expect future increases in debt to be material and thus expects that a substantial part of the Company’s cash balance will be drawn over the next two to three years to fund existing and future commitments.
Management fees are a continued area of focus for investors, and the recent introduction of the Key Information Document has led to increased disclosure with respect to the overall costs incurred in managing investment company portfolios. HVPE continues to benefit from a reduction in the fee rates payable on the HarbourVest funds in which it invests, and this has contributed to a reduction in the total ongoing management fees payable to HarbourVest as a percentage of average NAV from 1.1% in the year ending 31 January 2017 to 1.0% in the year ending 31 January 2018.
Strategic AimThe aim for the Company is that NAV per share should continue to outperform that of listed markets materially over the long term. On a number of occasions in earlier Statements I have referred to an aim that NAV per share should outperform public markets by 5% per annum and indeed that figure was achieved from inception in 2007 to
31 January 2016. However, the volatility of public markets makes the calculation at any one year end an uncertain single measurement and that was certainly the case as at 31 January 2018 which was within a few days of several markets’ all-time highs. Nevertheless, on behalf of both the Board and the Investment Manager I reiterate that material long-term outperformance of NAV per share as compared with public markets will continue to be the Company’s objective.
Listed markets have been extraordinarily strong since their nadir in March 2009 and inflation has been subdued. Business conditions in many economies generally remain benign. However, it is my view that investors in most risk assets, and that includes all forms of equity shares, whether listed or not, should not expect such strong performance over the next nine years as has been delivered in the last nine. Interest rates in many developed economies look set to rise. At some point in the future the business cycle will reassert itself. Meanwhile the principal risks to the world’s economy and to markets would appear to be political, both at a geopolitical scale and, in some countries, unpredictable current and future political leadership.
The Board and the Investment ManagerA year ago I indicated that as some long-serving directors reached and indeed surpassed nine years of service, phased retirements from the Board would begin to be implemented and further new directors appointed. Jean-Bernard Schmidt has been a director since the formation of the Company in 2007 and, as announced on 25 April 2018, he will retire from the Board at the conclusion of the Annual General Meeting (“AGM”) to be held on 19 July 2018. Jean-Bernard has been a leading practitioner in the world of private equity for over 40 years. His wealth of experience has been invaluable when guiding the Company through its early years and I pay tribute to him for that guidance and for his many incisive contributions to the deliberations of the Board.
In November 2017, the Company appointed external recruitment consultants to conduct an independent search for a further director. In anticipation of future Board changes the consultants were asked to search

8 HVPE Annual Report and Accounts 2018
for a Chartered Accountant with asset management experience who, if possible, would be a resident of the Channel Islands. The Nomination Committee was pleased to be able to review a very high-quality list of candidates and, after interviewing the four candidates who most closely met the brief, the prospective appointment of Steven Wilderspin was announced on 25 April 2018.
It is intended that Steven will join the Board on 14 May 2018. Steven qualified as a Chartered Accountant with PwC. He is a resident of Jersey and has experience of entities reporting under US GAAP, as HVPE reports, as well as UK GAAP and IFRS. He has substantial experience of the world of private equity, including fund-of-funds. He has recently stepped down after ten years’ service on the Board of 3i Infrastructure plc where he served as Chairman of the Audit & Risk Committee. 3i Infrastructure is a constituent of the FTSE 250 Index, as is HVPE. Steven is also a director of London listed Blackstone/GSO Loan Financing. I am very pleased that Steven has agreed to join the Board and look forward to the Company benefitting from his expertise.
Ten-Year Financial Record
At 31 January 2009 2010 2011 2012 2013 2014 2015 2016 2017 2018
NAV ($ million) 631.3 718.2 849.7 944.0 1,030.2 1,167.0 1,266.3 1,337.3 1,474.9 1,713.9
NAV per Share ($) 7.61 8.65 10.241 11.42 12.46 14.38 15.86 16.75 18.47 21.46
Share Price ($)2 9.25 5.00 6.18 6.37 8.66 10.75 12.73 12.41 15.03 17.77
Share Price (£)2 6.36 3.13 3.86 4.04 5.46 6.54 8.45 8.71 11.95 12.52
Discount to NAV -22% -42% -40% -44% -30% -25% -20% -26% -19% -17%
Gearing (%) 5% 9% 9% 16% 15% 8% 0% 0% 0% 0%
Ongoing Charges ($ million)3 6.8 6.4 8.1 6.5 7.6 9.6 8.3 7.7 9.2 10.6
1 Economic NAV per share.2 Italics denote figures that have been converted from US dollars or sterling.3 Represents the ongoing operating expenses of the Company and excludes management fees and non-recurring expenses ($).
All directors are very aware of the relative lack of diversity on the Board and this was considered carefully before the decision was made to appoint Steven. As it has been in the case of recent appointments, diversity will continue to be an important consideration for the Board in all future appointments.
The relationship between the Board and the Investment Manager remains strong and effective, and no material changes have been made in the structure of the management of the Company. I continue to be actively involved working closely with the team at HarbourVest. That team is led on a day to day basis by Richard Hickman who has recently been promoted within HarbourVest to the rank of Principal, one rung below that of Managing Director. This promotion is well deserved. Richard’s role in relation to HVPE continues to grow and, although in practice an employee of the Investment Manager, his whole focus is on delivering value for the shareholders of HVPE, of which he is one himself.
Chairman’s Statement continued

9 HVPE Annual Report and Accounts 2018
Governance R
eportFinancial S
tatements
Supplem
entary Data
Strateg
ic Rep
ort
I am pleased to report that during the year the duration of the bank facility was extended by 12 months to 60 months and in the future it is intended that at annual renewal there will always be at least 48 months unexpired on the current facility.Company Secretary and AdministratorOn 25 April 2018 the Company announced the appointment, with effect from 11 May 2018, of BNP Paribas Securities Services S.C.A (“BNP”), BNP Paribas House, St Julian’s Avenue, St Peter Port, Guernsey GY1 1WA, to be Company Secretary and Administrator. BNP succeeds the JTC Group which had been in place for a number of years and I take this opportunity to thank the individual members of the JTC team for their support through an eventful period in the Company’s development.
Annual General Meeting and Informal Shareholder MeetingAs in earlier years the Company’s formal AGM will be held in Guernsey on 19 July 2018. Formal notice of the meeting, the agenda and the resolutions are expected to be despatched to shareholders in the week commencing 4 June. In keeping with the AIC Code of Corporate Governance, all directors, save for Jean-Bernard Schmidt who will be retiring, will submit themselves for re-election. The Company’s constitution permits the Investment Manager, HarbourVest, to propose two persons for election to the Board and Peter Wilson and Brooks Zug have been duly proposed. Brooks has served on the Board since the Company was listed in 2007. However, as one of the founders of HarbourVest his deep knowledge of the private equity industry and the fund-of-funds business, makes him an invaluable member of the Board and I hope that shareholders will support both his re-election and that of all ongoing directors.
As was the case last year, the Company has appointed a specialist firm, Boudicca, to assist in the liaison between the Company’s registered shareholders and decision makers so as to facilitate the process of voting at the AGM. The Company hopes that all shareholders will exercise their votes either in person at the AGM or, more likely, by proxy.
In advance of the formal AGM, HVPE will hold an informal meeting for interested shareholders at Sofitel St James, 6 Waterloo Place, London SW1Y 4AN from 8.15am on Wednesday 13 June 2018. The Investment Manager has recently issued invitations and details by email. Any shareholder who would like to attend, but has not yet received an invitation, should contact [email protected].
ConclusionOn behalf of the Board and the Investment Manager I thank shareholders for their continuing support. I look forward to being able to report a continuation of growth in NAV per share in future years and to see that effectively translated into an increased share price. All the directors are shareholders and we look forward to the future with confidence that investment in private assets will deliver superior long-term returns.
I am always happy to receive feedback from shareholders and can be contacted through [email protected].
Michael BunburyChairman10 May 2018
10 HVPE Annual Report and Accounts 2018
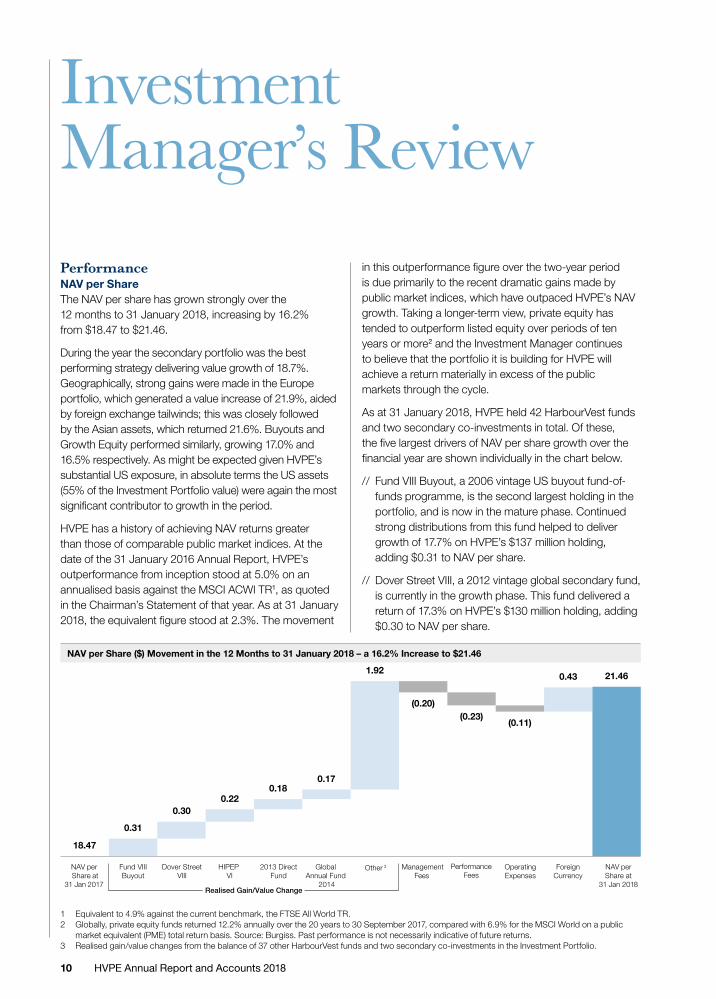
NAV per Share ($) Movement in the 12 Months to 31 January 2018 – a 16.2% Increase to $21.46
(0.11)(0.23)
(0.20)
0.17
1.920.43 21.46
0.180.22
0.30
0.31
18.47
NAV per Share at
31 Jan 2017
Fund VIIIBuyout
HIPEP VI
Dover StreetVIII
2013 DirectFund
Global Annual Fund
2014
Other 3 ManagementFees
ForeignCurrency
NAV perShare at
31 Jan 2018
OperatingExpenses
Realised Gain/Value Change
PerformanceFees
Investment Manager’s ReviewPerformanceNAV per Share The NAV per share has grown strongly over the 12 months to 31 January 2018, increasing by 16.2% from $18.47 to $21.46.
During the year the secondary portfolio was the best performing strategy delivering value growth of 18.7%. Geographically, strong gains were made in the Europe portfolio, which generated a value increase of 21.9%, aided by foreign exchange tailwinds; this was closely followed by the Asian assets, which returned 21.6%. Buyouts and Growth Equity performed similarly, growing 17.0% and 16.5% respectively. As might be expected given HVPE’s substantial US exposure, in absolute terms the US assets (55% of the Investment Portfolio value) were again the most significant contributor to growth in the period.
HVPE has a history of achieving NAV returns greater than those of comparable public market indices. At the date of the 31 January 2016 Annual Report, HVPE’s outperformance from inception stood at 5.0% on an annualised basis against the MSCI ACWI TR1, as quoted in the Chairman’s Statement of that year. As at 31 January 2018, the equivalent figure stood at 2.3%. The movement
in this outperformance figure over the two-year period is due primarily to the recent dramatic gains made by public market indices, which have outpaced HVPE’s NAV growth. Taking a longer-term view, private equity has tended to outperform listed equity over periods of ten years or more2 and the Investment Manager continues to believe that the portfolio it is building for HVPE will achieve a return materially in excess of the public markets through the cycle.
As at 31 January 2018, HVPE held 42 HarbourVest funds and two secondary co-investments in total. Of these, the five largest drivers of NAV per share growth over the financial year are shown individually in the chart below.
/ / Fund VIII Buyout, a 2006 vintage US buyout fund-of-funds programme, is the second largest holding in the portfolio, and is now in the mature phase. Continued strong distributions from this fund helped to deliver growth of 17.7% on HVPE’s $137 million holding, adding $0.31 to NAV per share.
/ / Dover Street VIII, a 2012 vintage global secondary fund, is currently in the growth phase. This fund delivered a return of 17.3% on HVPE’s $130 million holding, adding $0.30 to NAV per share.
1 Equivalent to 4.9% against the current benchmark, the FTSE All World TR.2 Globally, private equity funds returned 12.2% annually over the 20 years to 30 September 2017, compared with 6.9% for the MSCI World on a public
market equivalent (PME) total return basis. Source: Burgiss. Past performance is not necessarily indicative of future returns.3 Realised gain/value changes from the balance of 37 other HarbourVest funds and two secondary co-investments in the Investment Portfolio.

11 HVPE Annual Report and Accounts 2018
Governance R
eportFinancial S
tatements
Supplem
entary Data
Strateg
ic Rep
ort
12 Month Cash Flow ($m) to and from the HarbourVest Funds
1 February 2017 to 31 January 2018
10.3
24.0
25.8
35.0
16.4
1.6
32.1
26.4
22.7
33.1
11.8
28.7
39.8
19.3
35.8
31.9 38
.4
39.7
8.9
55.7 63
.0
61.0
7.7
48.7
Feb2017
Capital calls (investments)
Mar Apr May Jun Jul Aug Sep Oct Nov Dec Jan2018
Distributions
$405.1mDistributions received during the 12-month period
/ / HIPEP VI Partnership, a 2008 vintage international fund-of-funds programme, is nearing the end of the growth phase and contributed $0.22 to NAV per share.
/ / The 2013 Direct Fund, now entering the growth phase, made a solid contribution of $0.18 to NAV per share as several portfolio companies saw strong growth during the year.
/ / The first fund raised under HarbourVest’s Global Fund programme, to which HVPE made a commitment in 2014, delivered the fifth largest increase in NAV per share for HVPE at $0.17. This fund comprises a portfolio of primary, secondary and direct co-investments and was conceived as an efficient vehicle to provide global exposure across the HarbourVest platform.
Outside the top five contributors in absolute terms, several other funds delivered very strong results. Those achieving value growth in excess of 20% included Fund IX Buyout, a 2011 vintage US Buyout fund, both Fund X Buyout and Fund X Venture, 2015 vintage US buyout/venture funds, Dover Street IX, a 2016 vintage global secondary fund, and Real Assets III, also a 2016 vintage secondary fund.
Foreign exchange contributed significantly to NAV per share growth in the period as the US dollar weakened against the euro and other currencies. Translation gains arising on the 25% of the Investment Portfolio denominated in currencies other than the US dollar totalled $0.43 per share.
Subsequent to the financial year end, the Investment Manager has released an estimated NAV per share for 31 March 2018 of $21.29. This represents a reduction of $0.17 from the 31 January 2018 audited figure of $21.46, driven by public market adjustments, FX and operating expenses.
Cash FlowsIn contrast to the year ending 31 January 2017, when capital calls (investments) outpaced distributions, the 12 months to 31 January 2018 has been characterised by a positive net cash flow trend, with HVPE receiving $405.1 million in distributions while investing $312.7 million. This reflects the wider private equity market, where exit activity has outpaced the rate of new investment. The distributions represent HVPE’s largest yearly total to date in absolute terms, though as a percentage of the
+31.0% Realised uplift on carrying value1
1 See page 45 for details.

12 HVPE Annual Report and Accounts 2018
Investment Manager’s Review continued
Investment Portfolio this is in line with the prior record of $362.5 million in the year to 31 January 2016.
At the date of signing of the Semi-Annual Report on 30 September 2017, the Investment Manager expected that capital calls arising from the level of commitments then in place would result in a large part of the cash balance being drawn over the following two to three years. However, in the six months ending 31 January 2018, HVPE’s cash balances moved in the opposite direction due to increased distribution flow, further supported by proceeds from the recapitalisation of a large secondary fund, Dover Street VIII. This, combined with the positive cash flow effect of an increased use of credit facilities by the HarbourVest funds, resulted in HVPE’s cash balance increasing from $200 million at 31 July 2017 to $257 million as at 31 January 2018. As part of an established annual process, the Investment Manager has factored these developments into an updated medium-term cash flow forecast for HVPE, based on refreshed inputs from the individual HarbourVest funds and complemented by a top-down sensitivity analysis, resulting in a revised base case model. Informed by the outputs from this model, a commitment plan for calendar year 2018 has since been agreed with the Board, with a view to ensuring that HVPE moves closer to a fully-invested position over the next two to three years.
In recent years, the pace of capital calls across the private equity industry has been influenced by the growing use of bridging and project finance by private equity fund managers including HarbourVest. In the year ending 31 January 2018, HVPE’s look-through exposure to debt within the underlying HarbourVest funds held by HVPE increased by $109.2 million, from $129.5 million to $238.7 million. This had the effect of delaying capital calls and accelerating distributions, so that, all else being equal, net cash flow to HVPE in the period was $109.2 million greater than would have been the case in the absence of this additional borrowing. The trend toward increased use of bridging debt, both by HarbourVest and by the underlying managers to which the HarbourVest primary and secondary funds provide exposure, has implications for HVPE’s cash flow modelling, and is discussed in more
detail in the “Managing the Company” section which begins on page 20.
In the HVPE portfolio, distributions have been driven by the US primary funds, as well as the global secondary and direct co-investment funds, while investments have been concentrated in the 2016 and 2017 global funds, a recent international fund-of-funds programme, a direct co-vestment fund and recent US primary buyout and venture funds.
Portfolio CompaniesIn the year to 31 January 2018, HVPE saw a number of exits from its top 20 companies, most notably Lightower Fiber Networks (“Lightower”), its largest portfolio company at 31 January 2017 representing 2.1% of the Investment Portfolio. Lightower, a metrofibre network and broadband service provider in Northeastern US markets, was sold in a trade sale to tower operator Crown Castle International for approximately $7 billion. HVPE received proceeds of $33.0 million in November 2017. In the same month, HVPE also received proceeds of $8.5 million from the sale of its 14th largest company, Securus Technologies, to Platinum Equity for $1.5 billion. At 31 January 2017, these two companies, both held in the 2013 Direct Fund, represented a combined 2.8% of the Investment Portfolio value. During their respective holding periods together they added $0.37 to HVPE’s NAV per share.
December was the strongest month of the year for distributions for HVPE as it received total proceeds of $61.0 million – a level only surpassed once before, in December 2015. Contributing to this was the sale of Censeo Health, a home healthcare services provider and HVPE’s 15th largest portfolio company at 31 January 2017. Censeo Health was sold in a secondary transaction to New Mountain Capital, a New York-based investment firm.
During the year, the majority of exits from the HVPE portfolio were via trade sales. Of the 455 liquidity events in the year, 389 of these (85%) were trade sales or sponsor-to-sponsor transactions with the remaining 66 transactions being IPOs. The proportion of exits achieved via IPO fell slightly from the prior year, from 16% to 15%.
HVPE successfully renegotiated its multi-currency credit facility in the financial year, extending it out to five years to December 2022.

13 HVPE Annual Report and Accounts 2018
Governance R
eportFinancial S
tatements
Supplem
entary Data
Strateg
ic Rep
ort
Evaluation of Absolute Investment1
In 2011, alongside HarbourVest, HVPE made an investment in Absolute Private Equity (“Absolute”), a Swiss listed fund-of-funds with net assets of over $1 billion. Absolute was purchased at a 30% discount to NAV. HVPE initially took 14% of the Absolute transaction directly, financing this through drawing $85 million from its $500 million credit facility. It also acquired an indirect interest in Absolute through its investment in the global secondary fund, Dover Street VII, resulting in a total investment of $97 million.
Through the financial year, the assets of Absolute have been fully realised. We are pleased to report the success of this investment which delivered a gross return of 1.54x cost and a gross Internal Rate of Return (“IRR”) of 14.7% over the holding period of six years. This has translated into a $0.55 net increase to HVPE’s NAV per share.
ActivityCredit Facility We are pleased to report that in December 2017 HVPE successfully renegotiated its $500 million multi-currency credit facility with Lloyds Bank plc and Credit Suisse AG. As part of the renewal, the facility was extended out to five years (having been four years at the previous renewal point) and now has an expiry date of December 2022. The lenders have provided an equal commitment of $250 million each.
The commitment fee on the undrawn facility is unchanged at 115 basis points. The LIBOR margin applicable to the current facility is 25 basis points lower than the previous terms at 275 basis points for borrowings of less than $250 million; a further 30 basis points is payable on the total sum drawn if borrowings exceed $250 million (i.e. 305 basis points). Formerly this equated to 330 basis points.
New Fund CommitmentsThe Investment Manager commits capital with reference to a set of agreed Strategic Asset Allocation (“SAA”) targets (as described on page 17). New commitments in the 12 months ending 31 January 2018 of $340 million were focused on the international fund-of-funds programme (HIPEP VIII) and the 2017 Global Fund. During the year, HVPE also made two commitments to deals arising from the Secondary Overflow Fund III. In the first deal, completed in June 2017, HVPE committed $10.2 million to participate, alongside other HarbourVest funds, in the acquisition of a portfolio of seven venture capital funds managed by Asia-based venture managers. The funds in this portfolio span a range of vintage years from 2005 to 2015. In the second deal, in December 2017, the Company committed $9.6 million to participate, alongside other HarbourVest funds, in a secondary transaction to acquire two remaining companies in a 2006 vintage European buyout portfolio.
Post the financial year end, in February 2018, HVPE’s SAA targets were amended with a view to optimising NAV growth over the long term. A review of the current portfolio composition with reference to these targets is included on page 18 of this report. HVPE makes commitments to new HarbourVest funds in such a way that the portfolio composition is expected to converge on these targets over a rolling five-year period.
Market EnvironmentThe private markets saw continued strong growth during 2017. A benign fundraising environment resulted in more than $700 billion of capital being drawn into the industry during the year, contributing to a record $1.7 trillion in “dry powder”2 i.e. funds poised for deployment. Investment activity increased, led by Asia where the amount of capital put to work almost doubled versus the prior year. In the US, buyout investment remained steady while venture investment increased sharply, supported by the trend toward leading venture-backed companies remaining private for longer. Consequently, while M&A was robust, IPO activity did not increase as might have been expected given the growing pipeline of large-cap companies with the potential to go public.
Private markets managers remain cautious in deploying capital in the current environment, and in Europe and the US are tending to remain net sellers of assets. Competition for deals has led to record pricing at the top end of the US market, while pricing in the mid-market and below is somewhat less elevated. Managers have responded to this environment by taking a cautious approach to new investment, focusing on value creation strategies that emphasise buy-and-build, operational improvement and the application of new technology in established industries. At HarbourVest, a high level of scrutiny is applied when evaluating new investment opportunities, with downside risk always a key focus. Continued expansion of the HarbourVest platform into newer areas of the private markets, such as real assets and micro-cap buyouts, provides additional scope to deploy capital into attractive new opportunities.
With 35 years’ experience, HarbourVest has invested through numerous market cycles and through previous episodes of political uncertainty. HVPE commits to a variety of HarbourVest funds which, in turn, invest over multi-year periods thereby ensuring that capital is put to work at a measured pace in a diverse range of investments. This approach has delivered strong returns for HVPE shareholders over a period of more than ten years, and the strategy remains fundamentally unchanged.
1 Referred to as: “HVPE Avalon Co-Investment L.P.” in the consolidated schedule of investments.
2 Bain & Company Global Private Equity Report.

14 HVPE Annual Report and Accounts 2018
Celebrating Ten Years
Over the past ten years the Company has evolved significantly. As at 31 January 2018, HVPE was the third largest listed private equity company in London with a £1.0 billion market capitalisation. Since inception, HVPE’s NAV per share has more than doubled and it is now one of the more actively-traded private equity investment companies on the market.
August 2011HVPE purchases 14% ($85 million) of Absolute Private Equity, a Swiss listed fund-of-funds vehicle
May 2010HVPE is admitted to the London Stock Exchange (Specialist Fund Market) to help increase share trading volume
On 6 December 2017, HVPE celebrated its ten-year anniversary.
Timeline of Key Events
December 2007HVPE lists on the Euronext Amsterdam

15 HVPE Annual Report and Accounts 2018
Governance R
eportFinancial S
tatements
Supplem
entary Data
Strateg
ic Rep
ort
December 2015HVPE joins the FTSE 250 Index
HVPE’s NAV per share has grown by 106.5% over ten yearsTotal return to 31 January 2018
1 Year 3 Years 5 Years 10 YearsSince
Inception
NAV per Share ($) 16.2% 35.3% 72.2% 106.5% 114.6%
Share Price Total Return ($) 18.2% 39.6% 103.7% 85.7% 76.4%
Share Price Total Return (£) 4.8% 48.2% 126.9% 159.2% 151.3%
FTSE All-World TR ($) 28.2% 42.9% 73.8% 93.4% 73.6%
£1.0bnMarket capitalisation at 31 January 2018
$21.46NAV per share at 31 January 2018
December 2012HVPE purchases 8% ($94 million) of Conversus Capital, a listed private equity fund
September 2015The Company lists on the Main Market of the London Stock Exchange
October 2016HVPE de-lists from Euronext Amsterdam

16 HVPE Annual Report and Accounts 2018
Share Price and NAV per Share Movement from 31 January 2013 to 8 May 2018 (£)
Share price NAV
31 Jan2013
31 Jan2014
31 Jan2015
31 Jan2016
31 Jan2017
31 Jan2018
8 May2018
£0.00
£12.52£11.95
£8.71£8.47
£6.53£5.45
£7.86£8.75
£10.53
£11.76
£14.68£15.12
£12.32
£5.00
£10.00
£15.00
Share Price Trading and LiquidityHVPE’s share trading volume has remained broadly consistent over the 12 months to 31 January 2018, with a typical day continuing to see more than 40,000 shares traded1. The share price made steady progress over the financial year, increasing by 4.8%, from £11.95 to £12.52. At 31 January 2018 the discount stood at 17.2%, having narrowed slightly from 18.6% at 31 January 2017.
Period Since 31 January 2018 In the period from 31 January 2018 to 8 May 2018 the share price has moved from £12.52 to £12.32, a decrease of 1.6%. Given the fall in share price and concurrent weakening of sterling against the US dollar since the end of January, the discount has widened from 17.2% at 31 January 2018 to 21.6% as of 8 May (using the most recently published NAV at 31 March 2018 of $21.29,
converted into sterling on 8 May 2018, giving £15.71). A number of factors influence the share price and discount in the short term. The most important of these is investor sentiment, both towards listed private equity as a sector and across the market more generally.
The market capitalisation of the Company as at 8 May 2018 is now £984.4 million, and HVPE is ranked 196th
in the FTSE 250.
£12.32Share Price at 8 May 2018
Share price as reported by the London Stock Exchange. NAV per share converted into sterling at daily closing exchange rates (Bloomberg).
1 Based on the mean average of monthly median trade volumes.

17 HVPE Annual Report and Accounts 2018
Governance R
eportFinancial S
tatements
Supplem
entary Data
Strateg
ic Rep
ort
Managing the PortfolioStrategic Asset Allocation and Diversification
New commitments to HarbourVest funds are made with reference to HVPE’s agreed Strategic Asset Allocation targets, reviewed annually by the Board of directors.
Strategic Asset Allocation Targets HVPE takes a long-term view in building and maintaining its private markets programme. The Board and the Investment Manager have agreed upon a set of rolling five-year portfolio construction targets (“Strategic Asset Allocation” or “SAA”) defined with reference to NAV by investment stage, geography, and strategy. These reflect the Investment Manager’s and the Board’s perspective on the best means of achieving long-term NAV growth. These targets are reviewed annually and were last revised just after the financial year end, in February 2018. The agreed changes were as follows:
Investment Stage/ / Increase allocation for Real Assets and Mezzanine
investments from 5% to 10%.
/ / Reduce allocation to Buyouts from 65% to 60%.
These changes were driven by a desire to capture the uncorrelated returns available from real asset investments alongside the more traditional private equity portfolio. The early performance of Real Assets III, to which HVPE made a $50.0 million commitment in 2016, and Mezzanine Income Fund I, to which HVPE made a $50.0 million commitment in the same year, support the notion that the HarbourVest team is able to deliver attractive performance in these relatively new areas for the firm.
Investment Strategy/ / Increase allocation to Direct Co-Investment from
15% to 20%.
/ / Reduce allocation to Primaries from 60% to 55%.
Direct Co-investments have been a source of strong returns for HVPE in recent years. They represent a low-cost means of accessing private equity opportunities, as the deals are typically negotiated with no management fee or carried interest payable by the HarbourVest direct co-investment funds. Nevertheless, the Primary allocation remains the bedrock of the portfolio as it provides access to a broad range of compelling opportunities not always available by other means and helps to ensure that HVPE’s capital is invested consistently through the cycle.
The changes to the SAA targets were made with reference to macroeconomic and geopolitical considerations, the available opportunity set in private markets, historic performance attribution in the portfolio and, finally, HarbourVest’s specific areas of expertise. The targets are monitored regularly and will be reviewed by the HVPE Board of directors in November 2018. This review will include a reappraisal of investment performance by each of the agreed sub-categories.
Annual Commitment Plan Process In November each year, the HVPE Board of directors approves a plan for making new commitments to HarbourVest funds over the subsequent 12 month period. This plan is prepared by the Investment Manager, with a view to optimising returns for HVPE shareholders over the long term. The total commitment amount for the year is informed by the Investment Manager’s base case forecast for cash flows and investment returns, while the breakdown by fund is decided with reference to the agreed SAA targets described above, and in more detail on page 18.
Once approved by the Board, the commitment plan is executed in such a way as to maximise the benefit of any early-closing fee discounts available on the selected HarbourVest funds, whilst also metering the pace of commitments in line with a set of agreed balance sheet ratios. New commitments to HarbourVest funds are profiled in HVPE’s monthly NAV update reports, released to the market around the 15th calendar day each month and available on the Company’s website at www.hvpe.com.

18 HVPE Annual Report and Accounts 2018
By Stage
Target Buyout 60% Venture and Growth Equity 30% Mezzanine and Real Assets 10%
Actual Buyout 61% Venture and Growth Equity 31% Mezzanine and Real Assets 8%
Actual
Target
By Geography
Target US 65% Europe 18% Asia Pacific 12% Rest of World 5%
Actual US 55% Europe 23% Asia Pacific 15% Rest of World 7%
Actual
Target
By Strategy
Target Primary 55% Secondary 25% Direct Co-Investment 20%
Actual Primary 45% Secondary 32% Direct Co-Investment 23%
Actual
Target
Managing the Portfolio continued
HVPE Portfolio Construction Targets (Revised at 14 February 2018) Vs Actual Diversification (Underlying Partnership Level) at 31 January 2018 (by NAV)
Stage The Buyout market remains the core of global private equity investing and provides a large opportunity set for new commitments over the long term. Venture and Growth Equity forms a key component of HVPE’s portfolio and will continue to do so. Mezzanine and Real Assets funds, meanwhile, offer additional diversification and the potential for returns that are less closely correlated to the broader macroeconomic environment, hence the increase in the allocation from 5% to 10%.
GeographyNo changes have been made to the geographical targets, which were last revised in November 2016 and, HVPE believes, remain appropriate today. The private equity model is well proven in the US and has delivered consistently impressive long run returns. Consequently, US-based investments will continue to form the majority of HVPE’s portfolio.
StrategyThe Board agreed an increase in the Direct Co-investment category from 15% to 20%. The direct co-investment funds are able to access a wide range of potential opportunities offered to them by private equity managers, including deals originated from HarbourVest’s primary fund commitments. Historically, performance in direct co-investments has been strong and as HVPE wishes to maintain exposure to this strategy through coming vintage years, it is prudent to increase our allocation. HVPE currently remains underweight in the Primary category, but, as these are core to HVPE’s strategy, over the long-term we are still striving to reach a majority allocation of 55%.
Diversification is essential to achieving consistently strong returns from the asset class, as the various sub-categories within private markets tend to perform at their best at different stages in the economic cycle. Furthermore, a well-diversified portfolio ensures that the downside risk arising from any single investment is very limited, whilst still offering the potential for notable gains resulting from the very best-performing deals. Careful investment selection, therefore, remains critical.

19 HVPE Annual Report and Accounts 2018
Governance R
eportFinancial S
tatements
Supplem
entary Data
Strateg
ic Rep
ort
0
19
Vintage Year Profile of Investment Portfolio (%)
0 1 0 1 000
1 0 1 12
1
6
15
5
2
9
5 5
3
12 2
4
98
7 7
12
8
10
12
1413 13
19
1
Pre-2000
Vintage Year
2000 2001 2002 2003 2004 2016 201720152014201320122011201020092008200720062005
Year of Investment
Phase
Investment 43% Growth 32% Mature 25%
Industry
Tech & Software 22% Consumer 17% Medical & Biotech 15% Industrial & Transport 12% Financial 12% Business Services & Other 11% Media & Telecom 6% Energy & Cleantech 5%
CurrencyExposure
Underlying partnership funds US dollar 75% Euro 18% Australian dollar 3% Sterling 2% Canadian dollar 1% Other 1%
Actual Diversification (Underlying Partnership Level) at 31 January 2018
Vintage Year (% of Investment Portfolio) HVPE’s vintage year diversification is measured using the year of the initial capital call for primary funds and direct co-investment funds and the year of formation of underlying partnerships for secondary investments.
Year of Investment (% of Investment Portfolio) HVPE also measures diversification over time by the year of initial investment into the underlying portfolio companies. This is more representative when judging HVPE’s real exposure to the market in a given year.
HVPE has built a well-diversified, global portfolio of private equity assets at various stages of maturity. The portfolio is carefully selected with the aim of optimising value growth over the long term. While there were, in total, 7,732 companies in the portfolio at 31 January 2018, the top 100 represent 36% of the Investment Portfolio and the top 1,000 represent 86%.
Note: The diversification by NAV analysis is based on the fair value of the underlying investments, as estimated by the Investment Manager. Diversification by stage, strategy, phase and geography is based on the estimated net asset value of partnership investments within HVPE’s fund-of-funds and company investments within HVPE’s co-investment funds. Industry diversification is based on the reported value of the underlying company investments for both fund-of-funds and co-investment funds. Some of the funds held in HVPE have not been fully invested. By phase, investment includes vintage years 2014 to 2018, growth includes 2009 to 2013 and mature, pre-2008.

20 HVPE Annual Report and Accounts 2018
Managing the Company
Throughout HVPE’s ongoing cycle of Commitment, Investment, Growth, and Maturity, the Board and the Investment Manager use tools and policies to manage the risk and reward for the benefit of the Company’s shareholders.
HVPE’s Structure
Diversification by Strategy (Underlying Partnership Level)
Primary
45%Secondary
32%Direct
23%
42 HarbourVest Funds and 2 Co-Investments
General partner
1
General partner
2
General partner
3
General partner
4
General partner
5
Company Company Company Company Company Company
Total individual company exposures in the portfolio 7,732

21 HVPE Annual Report and Accounts 2018
Governance R
eportFinancial S
tatements
Supplem
entary Data
Strateg
ic Rep
ort
Borrowing and Cash Balance ($m): HVPE had $257 million of cash at 31 January 2018
85.1
154.4 161.7
69.3 106.7
93.9
67.8 130.1 99.721.8
67.3
135.9
204.4
169.0 175.2200.4
257.0
Jan 2012
Jul2012
Jan 2013
Jul2013
Jan2014
Jul2014
Jan2015
Jul2015
Jan2016
Jul2016
Jan2017
Jul2017
Jan2018
Cash balance Borrowings Absolute (secondary co-investment) Conversus (secondary co-investment)
Portfolio LiquidityAn investor in HVPE shares should be aware that, while the shares themselves are traded actively on a daily basis, the underlying portfolio is relatively illiquid. The private equity fund commitments made by HVPE are long term in nature, and the underlying private company investments cannot usually be turned into cash in the short term. The total of the unfunded commitments made by HVPE forms a large investment pipeline. In a normal market environment, approximately 20% of this pipeline is called down to fund investments (capital calls) in a given year, while approximately 20% of HVPE’s invested assets are converted to cash each year as a result of natural exit activity in the portfolio. This cash is used through the year to meet the aforementioned capital calls. In some years the balance of distributions to capital calls is either strongly positive, as in recent years, or negative, as it was in 2008 and 2009. The Board and the Investment Manager seek to ensure that there is always sufficient cash or credit available to meet capital calls, whilst also striving to avoid an excessive build-up of cash on the balance sheet.
HarbourVest funds employ leverage to a limited extent for three main purposes: bridging capital calls and distributions; financing specific investment projects where the use of debt may be advantageous; and recapitalising funds to accelerate distributions to investors. HVPE is exposed to this leverage on a look-through basis as a result of its investments in the HarbourVest funds. As at 31 January 2018, HVPE’s total look-through, or “embedded”, leverage was $238.7 million. The debt is provided to the HarbourVest funds on attractive terms and carries a low rate of interest as it is secured on the commitments made by investors (including HVPE) to those funds. The fund credit facilities are initiated with maturities of one to four years, and the larger facilities are skewed towards the longer maturities. The amount borrowed varies according to the type of fund, but the outstanding debt typically represents between 5% and 30% of a fund’s committed capital, with the majority of funds below 20%. The increase in HVPE’s embedded leverage in recent years, from $46.8 million in December 2015 to $238.7 million in January 2018, has been a significant factor contributing to the increase in the Company’s cash balance over this period.

22 HVPE Annual Report and Accounts 2018
The HVPE team monitors the embedded leverage and ensures that possible changes in the outstanding balance are factored into the scenario tests conducted as part of the annual commitment planning exercise.
Credit FacilityIn an environment where investments exceed distributions for a sustained period, it is important that HVPE is able to access cash as required to fill the gap. As at 31 January 2018 the Company had a cash balance of $257.0 million. Were this to be fully invested, the Company would then have recourse to its $500 million revolving credit facility, provided jointly by Lloyds Bank Plc and Credit Suisse. This facility, currently unused, serves to underpin the commitments made by HVPE to HarbourVest funds.
Under the terms of the credit facility agreement, HVPE may borrow, repay, and re-borrow funds through to the expiry date of the facility in December 2022. The Company has pledged substantially all its assets as collateral for such borrowings. The costs of the facility are outlined on page 13.
The credit facility carries a financial covenant that limits the Company’s indebtedness to 35% of assets (the “Asset Test Covenant”), with the calculated value of the assets subject to certain diversification tests. This ratio is tested and calculated on a quarterly basis. In addition, other covenants confer customary limitations that restrict HVPE’s ability to make unduly concentrated commitments to funds, incur additional indebtedness or liens above the facility level, pay dividends above certain levels, or merge, consolidate, or substantially change its business without bank approval.
HVPE was in compliance with these covenants throughout the 12 months to 31 January 2018 and through the date of publication of this report.
Commitment RatiosThe Board and the Investment Manager make reference to three key ratios when assessing the Company’s commitment levels:
1. Total Commitment Ratio (“TCR”)The TCR provides a view of total exposure to private markets investments as a percentage of NAV. As such, this takes the sum of the current Investment Portfolio and the Investment Pipeline as the numerator. The level of the TCR is a key determinant of the Company’s total commitment capacity for new HarbourVest funds and co-investments within a given time period.
2. Commitment Coverage RatioHVPE and many of its listed peers utilise this metric as a measure of balance sheet risk. This ratio is calculated by taking the sum of cash and available credit, and dividing this by the total Investment Pipeline.
The Company’s listed private equity peers typically have a shorter-term Investment Pipeline than does HVPE, and as a result HVPE’s Commitment Coverage Ratio may appear relatively low in comparison.
3. Rolling Coverage RatioHVPE’s Investment Manager uses this third specific metric to provide greater insight into the Company’s balance sheet position and a more relevant comparison to listed peers. This final measure reflects the sum of cash, the available credit facility, and the distributions expected to be received during the current year, taken as a percentage of the expected cash investment in HarbourVest funds over the current year plus the next two years. In considering forecast investments over a three-year period rather than the total Investment Pipeline, this calculation enables a more useful comparison of HVPE’s coverage ratio relative to its peers.
Total Commitment Ratio(Total exposure to private markets investments as a percentage of NAV)
Investment Portfolio + Investment Pipeline $2,690m
Divided by the NAV $1,714m
157% (169% at 31 January 2017)
Commitment Coverage Ratio(Short-term liquidity as a percentage of total Investment Pipeline)
Cash + Available Credit Facility $757m
Divided by the Investment Pipeline $1,238m
61% (56% at 31 January 2017)
Rolling Coverage Ratio(A measure of medium-term commitment coverage)
Cash + Available Credit Facility (total: $757m) + Current Year Estimated Distributions ($356m) $1,113m
Divided by the Next Three Years’ Estimated Investments $1,305m
85% (105% at 31 January 2017)
Managing the Company continued

23 HVPE Annual Report and Accounts 2018
Governance R
eportFinancial S
tatements
Supplem
entary Data
Strateg
ic Rep
ort
HVPE Total Expense Ratio as a % of Average NAV
2009
0
1
2
3
4
5
2010 2011 2012 2013 2014 2015 2016 2017 2018
HVPE Carried Interest HVPE Management Fee (Funds) HVPE Management Fee (Co-investment)
HVPE Net Recurring Operating Expenses HVPE Total Expense Ratio (TER)
Total Expense Ratio (“TER”)HVPE’s TER reflects the total cost incurred by the Company in assembling and maintaining its portfolio of HarbourVest funds and co-investments. The figure is broken down into four distinct categories of expense.
Firstly there is the cost of running the Company in its own right, encompassing items such as maintenance of the credit facility, Board fees and expenses, professional fees, marketing, financial reporting and compliance costs. These costs, totalling 0.66% of NAV in the 12 months to 31 January 2018, are categorised as recurring operating expenses as shown in the first line in the table overleaf.
Secondly, HVPE pays management fees to HarbourVest with respect to the funds in which it invests, and also for two secondary co-investments (Absolute and Conversus1) made alongside the HarbourVest funds. The total of all management fees in the 12 months to 31 January 2018 was equivalent to 1.01% of average NAV. Fees for Absolute ended in September 2017.
HarbourVest continues to provide improved levels of disclosure of the underlying costs associated with managing HVPE’s portfolio. This year, for the first time, HVPE is able to present figures splitting out operating costs associated with the HarbourVest funds, which amounted to 0.22% of average NAV in the year. This figure is shown as a separate line item in the table overleaf.
Finally, carried interest is charged on secondary investments and direct co-investments (equivalent to a performance fee). In total this accounted for 1.14% of average NAV in the 12 months to 31 January 2018.
This carried interest figure varies from year to year and is driven by the performance achieved by the relevant HarbourVest funds. In the year ending 31 January 2018, the gross IRR performance of these funds, denominated in US dollars, was materially ahead of the prior year, resulting in the allocation of a larger carried interest total.
Together, these four figures add up to give a TER, net of interest income, of 2.90% for the 12 months to 31 January 2018. This reflects the cost of providing a fully comprehensive private equity investment programme. It is important to note that, while the operating expenses and the management fees do not vary greatly from one year to the next, the carried interest figure is based on performance and will vary significantly depending on the returns delivered by the underlying HarbourVest funds.
HVPE’s TER has been trending downwards since inception, with the management fee component in particular having declined steadily from more than 2% of NAV in the early years to 1.01% in the 12 months to 31 January 2018. This reflects the lower fee rates available to HVPE on a number of HarbourVest funds, given the Company’s status as one of the largest investors into the HarbourVest platform. This means that HVPE typically benefits from the lowest available fee rates on its new fund commitments.
1 Referred to as: “HVPE Charlotte Co-Investment L.P. “ in the consolidated schedule of investments.

24 HVPE Annual Report and Accounts 2018
US dollar 78% Euro 16% Australian $ 2% Sterling 2% Canadian $ 1% Other 1%
Assets (including cash and other assets)
US dollar 78% Euro 14% Sterling 3% Australian $ 2% Canadian $ 2% Other 1%
Liabilities (including Investment Pipeline)
Exposure to Foreign Currencies
Managing the Company continued
The figure of 2.90% presented in the table should be regarded as HVPE’s TER for comparison to other investment products. It is equivalent to the Ongoing Charges Figure (“OCF”) for UCITs (“Undertakings for Collective Investment in Transferable Securities”) funds. All performance figures quoted in this report are presented net of all costs except where indicated.
2018 2017
Recurring Operating Expenses1 0.66% 0.65%
HarbourVest Fund Operating Expenses
0.22% 0.19%
Management Fees2 1.01% 1.08%
Operating Expense Ratio
1.89% 1.92%
Interest Income (0.13%) (0.07%)
Net Operating Expense Ratio 1.76% 1.85%
Carried Interest 1.14% 0.51%
Total Expense Ratio1 2.90% 2.36%
Valuation PolicyValuations Represent Fair Value Under US GAAPHVPE’s 31 January 2018 NAV is based on the 31 December 2017 NAV of each HarbourVest fund, Absolute, and Conversus, adjusted for changes in the value of public securities, foreign currency, known material
events, cash flows, and operating expenses during January 2018. The valuation of each HarbourVest fund is presented on a fair value basis in accordance with US generally accepted accounting principles (US GAAP). See Note 4 to the consolidated financial statements on page 98.
The Investment Manager typically obtains financial information from 90% or more of the underlying investments for each of HVPE’s HarbourVest funds to calculate NAV. For each fund, the accounting team reconciles investments, distributions, and unrealised/realised gains and losses to the financials. The team also reviews underlying partnership valuation policies.
Management of Foreign Currency ExposureThe Investment Portfolio includes three euro-denominated HarbourVest funds and a Canadian dollar-denominated fund.
/ / Approximately 18% of underlying portfolio holdings are denominated in euros. The euro-denominated Investment Pipeline is €45 million.
/ / Approximately 3% of underlying portfolio holdings are denominated in Australian dollars. There is no Australian dollar-denominated Investment Pipeline.
/ / Approximately 2% of underlying portfolio holdings are denominated in sterling. There is no sterling- denominated Investment Pipeline.
/ / Approximately 1% of underlying portfolio holdings are denominated in Canadian dollars. The Canadian dollar- denominated Investment Pipeline is C$30 million.
HVPE has exposure to foreign currency movement through foreign currency-denominated assets within the Investment Portfolio and through its Investment Pipeline of unfunded commitments, which are long-term in nature. The Company’s most significant currency exposure is to euros. The Company does not actively use derivatives or other products to hedge the currency exposure.
From an asset perspective, via its partnership holdings at 31 January 2018, HVPE had exposure to the currencies shown below (approximate).
1 TER is calculated over average NAV. Recurring operating expenses in 2017 exclude non-recurring expenses of $12,710.2 Management fees include management fees from HarbourVest Funds in the two secondary co-investments as shown on page 97.

25 HVPE Annual Report and Accounts 2018
Governance R
eportFinancial S
tatements
Supplem
entary Data
Strateg
ic Rep
ort
(In millions except per share and % data)31 January
201831 January
2017
Investment Portfolio $1,452.2 $1,295.8 Cash $257.0 $175.2 Debt $0.0 $0.0 Net other assets (liabilities) $4.7 $3.9
NAV $1,713.9 $1,474.9 NAV per share ($) $21.46 $18.47 FX Rate 1.4191 1.2579 NAV per share (£) £15.12 £14.68Cash + available credit facility $757.0 $675.2
The Private Equity Cycle
(In millions except per share and % data)31 January
201831 January
2017
1. CommitmentsNew commitments to HarbourVest Funds $339.8 $425.0 Investment PipelineAllocated $939.8 $878.6 Unallocated $297.7 $321.9 Total Investment Pipeline $1,237.5 $1,200.5
2. Cash InvestedInvested in HarbourVest Funds $312.7 $269.8 % of Investment Pipeline1 25.7% 24.1%3. GrowthInvestment Portfolio (beginning) $1,295.8 $1,129.5 Cash invested $312.7 $269.8 Investment Portfolio growth $248.8 $147.5 Distributions received ($405.1) ($251.0)Investment Portfolio (end) $1,452.2 $1,295.8 4. Distributions ReceivedCash received from HarbourVest Funds $405.1 $251.0 % of Investment Portfolio2 29.5% 20.7%
1 Percentage of average Investment Pipeline (31 January 2017 and 31 January 2018).2 Percentage of average Investment Portfolio (31 January 2017 and 31 January 2018).
Summary of Net Assets

26 HVPE Annual Report and Accounts 2018
HVPE Published Estimated NAV at 31 March 2018HVPE publishes its estimated NAV on a monthly basis. These reports are available on the Company’s website, generally within 15 calendar days of the month end.
At 31 March 2018, HVPE’s estimated NAV per share was $21.29, a $0.17 decrease from the NAV per share of $21.46 at 31 January 2018. This reduction was driven by public market adjustments, FX and operating expenses.
The Investment Pipeline of unfunded commitments had increased to $1,251 million (based largely on the new HarbourVest fund commitments described opposite). At the end of March, gearing remained at zero. The Company also had $243 million in cash on its balance sheet.
Board ChangesOn 25 April 2018, HVPE announced the appointment of Steven Wilderspin as a non-executive director of the Company with effect from 14 May 2018.
Steven has more than ten years’ experience as a non-executive director on the boards of private equity partnerships and listed investment companies. He has recently retired after ten years’ service on the board of 3i Infrastructure where he served as Chairman of the Audit and Risk Committee. Prior to this, he was a Director at Maples Finance Jersey, with responsibility for their fund administration and fiduciary businesses from 2002-2007.
Steven began his career at PwC in 1990. He is a resident of Jersey, is a qualified Chartered Accountant and has experience of entities reporting under US GAAP as well as UK GAAP and IFRS.
The Company also announced that Jean-Bernard Schmidt, a director of the Company since its listing in 2007, has advised that he does not intend to offer himself for re-election at the Annual General Meeting to be held on 19 July 2018.
Change of AdministratorIn late 2017, the Management Engagement and Service Provider Committee of the Company initiated a tender process for the appointment of the Company’s secretary and administrator. A number of potentially suitable firms were identified. Following this review, meetings were held with a shortlist of suitable firms.
On 25 April 2018, HVPE announced that BNP Paribas Securities Services S.C.A, would be appointed to provide company secretarial, compliance and administration services, effective 11 May 2018. The Company’s existing contract with JTC Fund Solutions (Guernsey) Ltd. will expire on the same date.
HVPE Committed Capital to Newly-Formed HarbourVest FundsDuring the three months to 30 April 2018, HVPE committed $175.0 million to the newly-formed HarbourVest funds profiled (below).
HarbourVest FundDate
CommittedCommitment
($m)
HarbourVest 2018 Global Fund
30 March 2018
20.0
HarbourVest XI Buyout
26 March and 30 April 2018
75.0
HarbourVest XI Micro Buyout
26 March and 30 April 2018
20.0
HarbourVest XI Venture
26 March and 30 April 2018
40.0
Total New Commitments three months to 30 April 2018 (latest available) 155.0
Recent Events

27 HVPE Annual Report and Accounts 2018
Governance R
eportFinancial S
tatements
Supplem
entary Data
Strateg
ic Rep
ort
Principal Risks and UncertaintiesRisk Factors and Internal ControlsThe Board is responsible for the Company’s risk management and internal control systems and actively monitors the risks faced by the Company, taking steps to mitigate and minimise these where possible whilst continuing to achieve an attractive return for shareholders. The Board has performed a robust assessment of principal risks and uncertainties and, together with the Investment Manager, has identified a number of risks to the Company’s business.
A comprehensive risk review process is undertaken on a half-yearly basis. Those risks which have a higher probability and a significant potential impact on performance, strategy, reputation or operations are identified below as principal risks faced by the Company. The risks reviewed are grouped into four categories:
/ / financial risk
/ / operating risk
/ / strategic and investor relations risk
/ / governance and regulatory risk
Risk Description Mitigating FactorBalance Sheet Risks
The Company’s balance sheet strategy and its policy for the utilisation of leverage are described on page 62 of this report. The Company continues to maintain an over-commitment strategy and may draw on its credit facility to bridge periods of negative cash flow when capital calls on investments are greater than distributions. The level of potential borrowing available under the credit facility could be negatively affected by declining NAVs. In a period of declining NAVs, reduced realisations, and rapid substantial cash calls, the Company’s net leverage ratio could increase beyond an appropriate level, resulting in a need to sell assets. A reduction in the availability or utilisation of bridging debt at the HarbourVest fund level could result in an increase in capital calls to a level in excess of the base case forecast.
The Board has put in place a monitoring programme with a defined total commitment ratio cap, determined with reference to portfolio models, in order to mitigate against the requirement to sell assets at a discount during periods of NAV decline. Further, the monitoring programme also considers the level of debt at the HarbourVest fund level. Both the Board and the Investment Manager actively monitor these metrics and will take appropriate action as required to attempt to mitigate these risks. Additionally, the Board intends to renew the credit facility regularly with the aim that there should always be a minimum of 48 months of unexpired facility available.
Risks are assessed and classed according to their probability of occurring and the likely impact upon the Company. Risks are then categorised based on priority, being grouped into primary and secondary risks which are subsequently reviewed.
During the financial year, the Board focused on currency risk and how it might impact future returns, potential future liquidity requirements based on scenario analysis by the Investment Manager, and how to maintain the Company’s NAV and share price growth.

28 HVPE Annual Report and Accounts 2018
Risk Description Mitigating FactorBorrowing Risk
While it is currently undrawn, the Company depends on the availability of its credit facility in order to operate an over-commitment strategy. The Company’s lenders may be unable or unwilling to renew or extend the Company’s credit facility.
The Board monitors developments in credit markets and intends to renew the credit facility regularly with the aim that there should always be a minimum of 48 months of unexpired facility available. The Board is also actively considering options for other sources of financing.
Foreign Exchange Risk
Approximately 22% of the value of HVPE’s total assets are denominated in non-US dollar currencies, primarily euros. Foreign currency movement affects the Company’s investments, borrowings on the multi-currency credit facility, and unfunded commitments.
The Board and the Investment Manager monitor the foreign exchange risk experienced by the Company and will consider implementing hedging arrangements if deemed appropriate.
Popularity of Listed Private Equity Sector
Investor sentiment may change towards the Listed Private Equity Sector, resulting in a widening of the Company’s share price discount to NAV.
The Board has set the Investment Manager the objective of ensuring that the widest possible variety of investors are informed about the Company’s performance and proposition in order to mitigate against this. In addition, the Investment Manager actively participates in the marketing of the sector. The size of the Company means that its own success will contribute to the popularity of the sector as a whole.
Public Market Risks
Public markets in many developed countries are trading close to all-time highs. While economic fundamentals have improved, structural imbalances remain. The Company makes venture capital and buyout investments in companies where operating performance is affected by the broader economic environment within the countries in which those companies operate. While these companies are generally privately owned, their valuations are, in most cases, influenced by public market comparables. In addition, approximately 10% of the Company’s portfolio is made up of publicly traded securities whose values increase or decrease alongside public markets. Should global public markets decline or the economic situation deteriorate, it is likely that the Company’s NAV could be negatively affected.
Both the Board and the Investment Manager actively monitor the Company’s NAV, and exposure to individual public markets is partially mitigated by the geographical diversification of the portfolio. The Board notes that it has limited ability to mitigate public market risk.
Stress testing takes place as part of the portfolio composition process to model the effect of different macroeconomic scenarios to provide comfort to the Board that the balance of risk and reward is appropriate in the event of a downturn in public markets.
Principal Risks and Uncertainties continued

29 HVPE Annual Report and Accounts 2018
Governance R
eportFinancial S
tatements
Supplem
entary Data
Strateg
ic Rep
ort
Risk Description Mitigating FactorReliance on HarbourVest
The Company is dependent on its Investment Manager and HarbourVest’s investment professionals. With the exception of the 2011 Absolute investment and 2012 Conversus investment, nearly all of the Company’s assets, save for cash balances and short-term liquid investments, are invested in HarbourVest funds.
Additionally, HarbourVest employees play key roles in the operation and control of the Company. The departure or reassignment of some or all of HarbourVest’s professionals could prevent the Company from achieving its investment objectives.
This risk is mitigated by the Board monitoring the performance of the Investment Manager on an ongoing basis, including through regular reports and visits to the Investment Manager’s offices, which took place twice in the year under review. In addition, the Audit Committee reviewed a recent ISAE 3402 report from the Investment Manager to assess the controls environment of the Investment Manager. Succession planning at the Investment Manager is monitored by the Board of the Company.
Trading Liquidity and Price
Any ongoing or substantial discount to NAV has the potential to damage the Company’s reputation and to cause shareholder dissatisfaction.
The five largest shareholders represent approximately 47% of the Company’s shares in issue. This may contribute to a lack of liquidity and widening discount. Also, in the event that a substantial shareholder chooses to exit the share register, this may have an effect on the Company’s share price and consequently the discount to NAV.
Since September 2015, the Company’s shares have traded on the Main Market of the London Stock Exchange, which has increased the liquidity of the shares and broadened the appeal to a wide variety of shareholders. In addition, the Board continues to monitor the discount to NAV and will consider appropriate solutions to address any ongoing or substantial discount to NAV. The Board has overseen the allocation of additional investor relations resource in the year under review. The Company has attracted new shareholders. However, the concentration of shares held by the five largest shareholders increased from 45% to 47% in the course of the year under review.

30 HVPE Annual Report and Accounts 2018
About HarbourVest
HarbourVest is a leading global private markets asset manager with a long history of innovation and success. The HarbourVest team has been investing in the private markets for over 35 years, gaining invaluable expertise and developing long-term relationships with sought-after partners.
35Years of private markets experience
$49bn+ Assets under management
400+Professionals
9Global offices
100+Investment professionals
18Languages spoken
31 HVPE Annual Report and Accounts 2018
Governance R
eportFinancial S
tatements
Supplem
entary Data
Strateg
ic Rep
ort
Overview of HarbourVestHarbourVest is one of the industry’s most seasoned private markets investors, with more than $49 billion of assets under management1, a stable and established team, long-term relationships with sought-after partners, and a proven ability to navigate the private markets in even the most challenging economic conditions.
The firm’s founders began making venture capital partnership investments in 1978 and expanded their investment focus in 1981 to include buyout partnerships. In 1982, the HarbourVest team formed its first fund designed to provide institutional investors with an efficient means of investing in private equity partnerships and operating companies. In the 1980s, the firm began investing outside of the US, and in 1990, it began offering programmes dedicated to Europe, Asia Pacific and other emerging markets. To date, HarbourVest has committed approximately $57 billion collectively within these regions through multiple private equity and market cycles.
HarbourVest focuses exclusively on private markets. The firm’s powerful global platform offers clients investment opportunities through primary fund investments, secondary investments, and direct co-investments in commingled funds or separately managed accounts. HarbourVest has deep investment experience and dedicated, on-the-ground teams in key private markets across Europe, Asia Pacific, and other emerging markets. It has over 400 employees, including more than 100 investment professionals across its Beijing, Bogotá, Boston, Hong Kong, London, Seoul, Tel Aviv, Tokyo, and Toronto offices.
Primary InvestingPrimary investments have been a part of HarbourVest’s strategy since the firm’s earliest days. The firm believes there is no replacement for the depth of experience that comes from building relationships with and evaluating fund managers continuously for three decades. Through these years the team has refined its knowledge and ability to assess strong primary investments on a global basis. This global team has committed more than $32 billion to newly-formed (primary) funds.
Secondary InvestingSecondary transactions offer tremendous opportunities for investors and sellers alike. HarbourVest’s longstanding relationships and experience mean it has access to opportunities, insights, and trends that provide investors with an undeniable edge. The firm is a highly credible buyer, having committed $18 billion to secondary markets since 1986.
Direct Co-investmentBecause of its longstanding relationships with top-tier fund managers, HarbourVest provides access to unique global opportunities through its direct co-investment programme. The dedicated team evaluates opportunities alongside leading general partners with the goal of creating a well-diversified portfolio. To date, over $7 billion has been invested in 360 operating companies.
LeadershipHarbourVest has shown leadership in private markets across the globe, forming one of the first fund-of-funds, purchasing some of the first secondary positions, backing developing companies, and pioneering new markets.
Depth of ExperienceThe 45 managing directors of HarbourVest have been with the firm for an average of 13 years. HarbourVest believes the experience and continuity of investment personnel provides a valuable historical base of knowledge. Additionally, many of the most sought-after underlying fund managers are often oversubscribed when they raise new funds, making these funds difficult to access for many investors. The longevity and stability of the HarbourVest team has enabled the firm to cultivate relationships with many of the top-tier and exclusive fund managers, positioning HarbourVest as both a preferred prospective investor and a favoured investment partner.
Responsible InvestingAs a signatory to the Principles for Responsible Investment (“PRI”), HarbourVest considers environmental, social, and governance (“ESG”) factors in its investment evaluation and selection process. This added screen demonstrates its commitment to continually improve the investment process for the benefit of clients. Additionally, the team also ensures that the firm’s culture and internal policies reflect the values of the PRI. This commitment to ESG is based on the belief that responsibility and sustainability are key to generating value for investors, and that both can be accomplished in tandem.
1 As at December 2017.

32 HVPE Annual Report and Accounts 2018
ManagerRelationships
Direct Co-investm
ents
Seco
ndar
y Inv
estm
ents
Primary Investments
The HarbourVest PlatformPrimaries, Secondaries and Direct Co-investments
Primary InvestmentsCommitments to newly-formed funds being raised by experienced managers
/ / Access to leading private equity funds
/ / Comprehensive foundation of a private equity programme
/ / Potential driver of long-term performance
Secondary InvestmentsPurchases of private equity assets in existing funds or portfolios of direct investments
/ / Attractive pricing opportunities
/ / Diversification across prior vintage years
/ / Potential for J-curve mitigation (positive returns may be achieved more rapidly)
Direct Co-investmentsInvestments directly into operating companies alongside other general partners
/ / Direct exposure to private equity-backed companies
/ / Lower cost than obtaining the equivalent interest in a private company through a traditional direct manager via a primary fund
HVPE invests in private companies and portfolios of private companies through funds managed by HarbourVest. The HarbourVest platform encompasses the three complementary strategies described below, which underpin HVPE’s portfolio.

33 HVPE Annual Report and Accounts 2018
Governance R
eportFinancial S
tatements
Supplem
entary Data
Strateg
ic Rep
ort
HarbourVest Investment Committee
The global Investment Committee leads HarbourVest’s 100+ investment professionals who source, evaluate, and close private company investments and investments in private company portfolios around the world.
The global Investment Committee uses a focused, consistent, and comprehensive process to evaluate assets and allow access to the primary funds, secondary investments, and co-investments that it believes offer the strongest potential for returns.
Control EnvironmentIn March 2018, the Investment Manager issued its latest Type II SOC 1 Report – Private Equity Fund Administration
Report on Controls Placed in Operation and Tests of Operating Effectiveness for the period from 1 October 2016 to 30 September 2017, which was conducted by an independent auditor and documents controls across the firm’s operations, including investment policy, reporting to clients, capital calls, distributions, cash management, and financial records. A bridging letter covers the period between 1 October 2017 and 4 May 2018.
Kathleen Bacon Managing DirectorJoined HarbourVest in 1994 from First National Bank of Boston
BVCA Council Board Member and Founding Member of Level 20
Advisory Boards: Sofinnova, Exponent, TDR, Towerbrook, FIMI, Helios
Greg Stento Managing DirectorJoined HarbourVest in 1998 from Comdisco Ventures. Prior experience at Horsely Bridge and NCR.
Advisory Boards: Accel, Garnett & Helfrich, Kleiner Perkins, Silver Lake Partners, Summit, TA, TPG
John Toomey Managing DirectorMember of the Executive Management Committee (“EMC”)
Joined HarbourVest in 1997 from Smith Barney (rejoined in 2001 post-MBA)
Robert Wadsworth Managing DirectorJoined HarbourVest in 1986 from Booz, Allen & Hamilton
Current Company Boards: Free Balance, Earth Networks Healthgrades, Intelex Technologies, Veriato Systems
Prior Private/Public Company Boards: Camstar, Cardiff Software, Concord Communications, Health Dialog, Kinaxis, NEI, Nuera Communications, Trintech, ePresence, Polaris, eHelp

34 HVPE Annual Report and Accounts 2018
A Focus on Real Assets
“Real assets on the rise”, a Q&A with Kevin Warn-Schindel, Managing Director, HarbourVest.
Real assets – including investments in areas such as energy, infrastructure, power, and natural resources – have quickly evolved from a niche market segment to a nearly $6 trillion, and growing, marketplace1. HVPE made a commitment of $50 million to Real Assets Fund III in 2016, and recently increased its target allocation to the strategy. In the following interview, HarbourVest Managing Director Kevin Warn-Schindel explains why now is a good time for HVPE to be investing in this area, the complementary role real assets can play, and why having access to specialised expertise can be a key driver of success.
What are real assets?In simple terms, real assets are physical or tangible assets that can generate returns and provide an effective hedge during periods of inflation. A power plant facility, a company that produces or transports oil and gas, the bridges and tunnels we drive over and through, even the woods behind our homes – are all examples of “hard” assets from which value can be derived. There are several different real assets sub-sectors (see Chart One overleaf), each of which has its own specialised group of managers, valuation metrics, and risk/return drivers. But they also share some important attributes that have made them popular with investors: they are often weakly correlated with the movements of traditional equity and fixed income investments, and the cash flow stability they can provide can support a portfolio through any macroeconomic cycle. This is in part due to relatively predictable and sustainable end-user demand for the goods and services typically produced by real assets-focused businesses.
1 Brookfield, 2017.

35 HVPE Annual Report and Accounts 2018
Governance R
eportFinancial S
tatements
Supplem
entary Data
Strateg
ic Rep
ort
How would you characterise the current investment opportunity? In our view, the rationale for adding real assets exposure to a broader private markets portfolio has never been stronger. The asset class has shown its ability over the past decade to play both offense and defense by providing a mix of stable income, appreciation potential, and capital preservation. Today, the rising demand is being met with a growing supply of good investment opportunities, and all the trends we’re seeing project continued growth. There is a glut of older-vintage real assets capital that is maturing, which is prompting more and more asset owners to either sell or restructure. There is also limited competition for these assets. The amount of capital allocated to purchase real assets hasn’t kept up with the growth in outstanding assets, which has led to fewer practitioners and more opportunities to be selective. The ongoing structural dislocation we’re seeing in the infrastructure and power sub-group is driving more opportunities, and we’re at a point in the commodity price cycle where we’re seeing more favourable valuations for higher-quality assets.
Any key factors that new investors to the asset class should be mindful of?It’s important to be diversified across the real assets spectrum, and to realise that there is no one-size-fits-all solution in this market. The sub-groups perform differently across time periods and cycles, so it’s essential to build a flexible, diverse portfolio structured around your specific needs and objectives. Also, there are risks to consider. Because of their complex nature, real assets can take longer to sell, and could generate higher transaction fees. Finally, specialised expertise is critical. This is a narrow, complex part of the market that requires a unique combination of knowledge, experience, and creativity – so it’s important to work with a partner that meets these criteria.
As you and the team have met with clients, what has been the biggest misconception about real assets?There’s a common belief that the bulk of the return generated by an energy or commodities-focused business is driven by price fluctuations. So we get a lot of questions around where gas or oil prices are at in the current cycle, and what it means for our portfolios. It is important to understand that we are not commodities traders. We’re not buying anything based on our views of where prices will go. We focus on buying quality assets, and then performing due diligence and structuring deals that give us confidence that we can meet target returns without relying on prices. We evaluate the downside, even with a focus on quality defensive assets, and if prices do rise it will likely provide some outperformance though not all companies are the same. We track businesses that have gained value in declining commodity price environments as well as those that have lost value in a rising price environment. It’s critical to understand the underlying assets and value drivers of each opportunity.
Why is HarbourVest well positioned to capitalise on the growth in this market?First and foremost, we have a dedicated team with deep experience across the energy, infrastructure, power, and natural resources sectors which allows us to engage in complex opportunities that others may shy away from. We also have a strong relationship network. HarbourVest has been investing in real assets since 2014 on a dedicated basis, starting with a more targetted approach and moving to our current diversified fund program. Finally, I would point to the consistency of our investment approach – focusing on the transaction dynamics, the management team, the quality of the assets, and the opportunities to optimise structurally – has been and will continue to be a successful formula as the market grows and more competitors enter the picture.
Chart One: What are Real Assets?
Major Sectors Energy Infrastructure/Power Natural Resources
Sub Sectors Upstream: ExplorationUpstream: ProductionMidstreamDownstreamOilfield Services
Power GenerationTransmission/DistributionMidstreamTransportationUtilitiesPorts
Extracted/HarvestedMiningTimberlandFarmland
Cash Flow Profile Positively correlated to inflation. Variable sector sensitivity to price changes and supply shocks.
Largely predictable with low volatility. Long-term contracts, often with inflation-linked pricing.
Positively correlated to inflation. Steady, though mining sensitive to global supply/demand factors.
Business Model Provision, production, and/or sale of essential products or services with inelastic demand.

36 HVPE Annual Report and Accounts 2018
Global Private Markets: Overview and Outlook
While HVPE’s portfolio is carefully selected and actively managed to maximise value growth, performance is necessarily influenced by conditions in the wider private markets. Here, HVPE’s Investment Manager, HarbourVest, provides an update on recent developments in the industry from the standpoint of a global private markets investment specialist.
USPrivate markets fundraising remained strong in 2017, as investors sought access to high quality buyout and venture managers. General partners continued to take advantage of this persistent demand by raising larger funds with accelerated timelines. US buyout fundraising surpassed 2007 peak levels, with over 50% of capital raised concentrated in several mega-cap funds. Venture fundraising fell below the 2016 peak, but remained ahead of the ten-year average, with many managers raising larger funds to reserve capital for later-stage growth financings. New investment activity for buyout managers remained steady but well below pre-crisis peaks, while venture managers put a record amount of capital to work in 2017. Competition for attractive deals has been driven by a growing surplus of dry powder and new entrants to the market, leading to record pricing across the US private markets. Many managers have taken advantage of this pricing dynamic by remaining net sellers of assets, benefitting primarily from strategic acquirers that are looking to buy for growth and as a way to access new markets and geographies. As a result, M&A exit activity has remained robust as managers seek full liquidity while favorable pricing remains. However, IPO activity remained subdued for a third consecutive year for both buyout and venture-backed companies, and the backlog of potential large IPO candidates continued to build. Buyout managers have sought to create value by embracing complex transactions and pursuing buy-and-build strategies, which can also serve to dampen average purchase prices. Venture managers have increasingly sought to maintain ownership of perceived winners through follow-on financing rounds in an effort to achieve

37 HVPE Annual Report and Accounts 2018
Governance R
eportFinancial S
tatements
Supplem
entary Data
Strateg
ic Rep
ort
$272bnTotal fundraising for US private equity in 20171
€72bnTotal private equity investment in Europe in 20172
$115bn Total value of Asian private equity exits in 20173
operating scale and market leadership. Overall, these strategies have continued to emphasise high growth and operational value-add to drive attractive returns in the US market.4
Asia PacificChina’s economy expanded at 6.9% in 2017, above the government’s target. Growth continued to be driven by tertiary industries, predominantly the services sectors, which accounted for 52% of the overall economy. Industrial production, retail sales, and private sector investment also contributed to growth, which was the result of continued supply-side structural reform. Tighter regulatory control on capital outflows and a weakening US dollar reduced depreciation pressures on the Chinese yuan and domestic liquidity throughout 2017. The growth outlook improved as foreign exchange reserves stabilised, credit growth slowed, and corporate profits improved. However, risks remain in the near term due to mixed property market and monetary policy developments, as well as escalating trade friction with the US. An increased focus on China-US trade relations is expected throughout 2018.5
Australian GDP grew 2.4% in 2017, which was below market expectations and flat compared to 2016. The Reserve Bank of Australia expects the economy to grow faster in 2018 than it did in 2017, supported by positive business conditions and increased investment in the non-mining and public infrastructure sectors. Further growth in exports is also expected after temporary weakening at the end of 2017. The outlook for household consumption remains uncertain, due to weak growth in household
incomes and high debt levels. The Reserve Bank of Australia is expected to raise the cash rate in 2018 from a record low of 1.5%.6
India remains the region’s fastest-growing major economy. Indian markets continue to recover from the temporary adverse effects of demonetisation and tax reform, with strong private consumption and services supporting economic activity. Japan is expected to experience improved GDP growth due to external demand generated by a broad-based global recovery. Despite elevated geopolitical tensions, the growth outlook for Korea is also positive with global demand for technology products supporting exports and an increase in private consumption. Southeast Asia is poised to maintain its growth momentum on robust domestic spending and implementation of planned infrastructure activities.7
EuropeEuropean private markets have shown continued strength across fundraising, liquidity, and investment activity, supported by five years of favorable market dynamics. Fundraising grew 8.6% year on year, with almost €61 billion worth of funds raised. As a result of strong investor demand, high-quality managers continue to raise heavily oversubscribed funds, with 68% of 2017 funds (globally) being raised in less than 12 months. A healthy liquidity environment in 2017 was characterised by continued interest from strategic acquirers seeking new growth opportunities, which led to a 17% increase in M&A exits compared to 2016. While volatile public markets forced the value of private equity-backed IPOs in Europe to fall, overall the value of exits in 2017 increased by 12% compared to 2016.
Managers remain cognisant of prior market cycles and selective in the current high valuation environment with the focus on premium assets and operational and strategic improvements.
European-focused investments increased 22% in 2017 from 2016, driven by a rise in investments over €1 billion in size, with over €50 billion of deals completed. In order to generate returns, managers are increasingly focused on formal plans for implementing operational improvements and value creation, particularly systematic execution of commercial excellence in sales in order to drive top-line growth and digital innovations within portfolio companies.8
1 Preqin, Private Equity and Venture Capital Spotlight, February 2018.2 Invest Europe, 2 May 2018.3 Asia Private Equity Report, Bain, 15 March 2018.4 Sources: Bain & Company, PitchBook Data.5 Sources: China National Bureau of Statistics, UBS.6 Sources: Reserve Bank of Australia, Capital Economics.7 Sources: World Bank, International Monetary Fund, Organisation for
Economic Co-operation and Development.8 Sources: Thomson Reuters, Preqin.

38 HVPE Annual Report and Accounts 2018
Commitment PhaseInvestment PhaseGrowth PhaseMature Phase
HVPE makes commitments to HarbourVest funds, which in turn build portfolios of private companies via primary funds, secondary investments, and direct co- investments. Once funded during the Investment Phase, the capital becomes part of the Investment Portfolio.
During the financial year ended 31 January 2018, HVPE committed $339.8 million to newly-formed HarbourVest funds. These commitments are complementary to HVPE’s existing portfolio of HarbourVest funds and highlight the Company’s consistent and ongoing commitments to compelling investment opportunities.
The HarbourVest funds in HVPE’s portfolio, in turn, commit capital to managers over a period of typically four years and call down capital from HVPE over a period of seven to nine years. This extended duration of capital calls requires that HVPE maintains an Investment Pipeline of unfunded commitments to help ensure that the Company’s assets remain fully invested. The Company is able to maintain a higher level of unfunded commitments than some other listed companies based on the timing, duration, and predictability of its cash flows.
The Investment Manager and the Board consider a number of factors before new commitments are made.

39 HVPE Annual Report and Accounts 2018
Governance R
eportFinancial S
tatements
Supplem
entary Data
Strateg
ic Rep
ort
Total $939.8m
Age of the Allocated Investment Pipeline
As at 31 January 2018
1–3 years 64% 4–6 years 20% 7–10 years 7% >10 years 9%
Allocated and Unallocated Investment PipelineIn order to reflect the differences in expected drawdown periods appropriately, the Company divides its Investment Pipeline into “allocated” and “unallocated” commitments. Of the Company’s total Investment Pipeline of $1.2 billion:
/ / 76% has been allocated by HarbourVest funds to underlying investments.
/ / 24% has not yet been allocated by HarbourVest funds to underlying investments, and therefore cannot be drawn down in the short term.
The Investment Manager anticipates that the Company’s allocated commitments will be drawn down over a three to five-year period. All of the Company’s commitments to HarbourVest direct and secondary funds are classified as “allocated” commitments because their drawdown profiles are closer to those of third-party funds.
Allocated Investment PipelineHVPE’s allocated commitments range across a number of vintage years. At 31 January 2018, approximately $153 million of commitments (or 16% of the allocated total) are more than six years old, and only a small portion of this total is likely to be drawn down by the underlying managers. Approximately $185 million or 20% of allocated commitments are between four and six years old and likely to be drawn down in the near term. The remaining $602 million or 64% of allocated commitments are one to three years old and are expected to be called in the medium term. The pace of these drawdowns has been shown to be relatively predictable over time.
Total $1.2bn
Investment Pipeline
$939.8mAllocated
$297.7m Unallocated
$1.2bn Total Investment Pipeline
Commitments Made to HarbourVest Funds in the Year to 31 January 2018
HIPEP VIII (International fund-of-funds) $170.0 million
HIPEP VIII Asia Pacific(Asia-focused fund-of-funds) $50.0 million
HarbourVest 2017 Global Fund$100.0 million
Opportunistic Secondary Investments(Global secondary) $19.8 million
Total: $339.8m(Year to 31 January 2017: $425.0m)
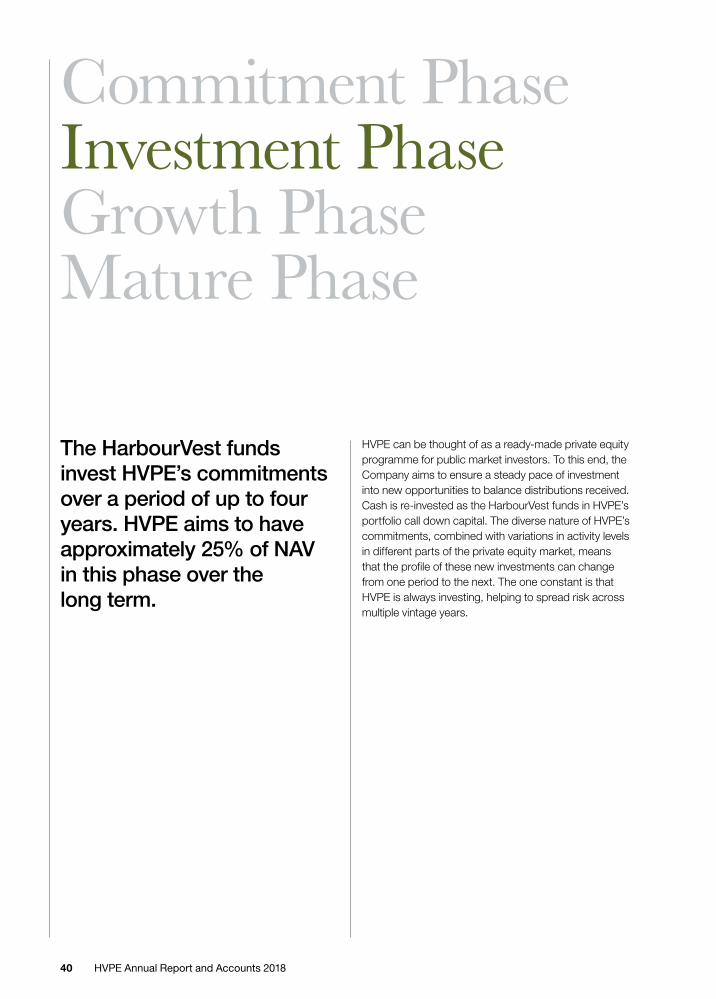
40 HVPE Annual Report and Accounts 2018
Commitment PhaseInvestment PhaseGrowth PhaseMature Phase
HVPE can be thought of as a ready-made private equity programme for public market investors. To this end, the Company aims to ensure a steady pace of investment into new opportunities to balance distributions received. Cash is re-invested as the HarbourVest funds in HVPE’s portfolio call down capital. The diverse nature of HVPE’s commitments, combined with variations in activity levels in different parts of the private equity market, means that the profile of these new investments can change from one period to the next. The one constant is that HVPE is always investing, helping to spread risk across multiple vintage years.
The HarbourVest funds invest HVPE’s commitments over a period of up to four years. HVPE aims to have approximately 25% of NAV in this phase over the long term.

41 HVPE Annual Report and Accounts 2018
Governance R
eportFinancial S
tatements
Supplem
entary Data
Strateg
ic Rep
ort
Amount Invested into HarbourVest funds ($m)
176
212
32
5262
49
HarbourVestPrimary Funds
2017 2018 2017 2018 2017 2018
HarbourVestSecondary Funds
HarbourVestCo-investment Funds
Top 10 Primary Fund Managers by Amount Invested ($m)
Year to 31 January 2018
5.6
4.54.3
4.1 4.0 3.9 3.8 3.7 3.6
3.3
Advent International Corporation
Europe
Buyout
Accel Partners
US
Venture
Harvest Partners
US
Buyout
Lightspeed Venture Partners
US
Venture
Vista Equity Partners
US
Buyout
Battery Ventures
US
Venture
Index Ventures
Europe
Venture/Growth
DCM
Asia
Venture
Berkshire Partners LLC
US
Buyout
Insight Venture Manage-ment, LLC
US
Venture/Growth
$313mTotal invested in the year 2017: $270m
44% Percentage of investments into underlying primary partnerships 2017: 29%
32% Percentage of investments into underlying secondary partnerships 2017: 38%
24%Percentage of investments into direct co-investments2017: 34%
In the year ending 31 January 2018, 44% of new investment was deployed to primary partnerships. This was lower than might be expected given HarbourVest primary funds accounted for 74% of unfunded commitments at 31 January 2017. This can largely be put down to the slower pace at which the primary funds tend to deploy capital. Secondaries and directs were a little above pace at 32% and 24% respectively as they tend to call capital down more quickly. This balance will shift year to year as the mix of unfunded commitments changes over time.
HVPE’s top 10 primary fund managers (by amount invested) between them called down capital totalling $41 million during the financial year. The largest of these exposures for HVPE, Advent International, accounted for $5.6 million of capital calls as it continued to build out its portfolio for its most recent 2016 buyout fund. Six of the top 10 managers by amount invested are venture capital specialists: Accel, Lightspeed, Battery, Index, DCM, and Insight.

42 HVPE Annual Report and Accounts 2018
Commitment PhaseInvestment PhaseGrowth PhaseMature Phase
The foundation of long-term value creation in a private equity portfolio is the growth phase. This is the period in the life of a private equity fund when the majority of the investments have already been made, and the focus shifts to managing the portfolio companies. Company management teams are incentivised so that their interests are aligned with those of their private equity backers, and a coordinated effort is made to grow and develop the companies with a view to a profitable exit. In contrast to the public markets, here the focus is on executing a multi-year value-creation plan rather than paying undue attention to quarterly results.
During years five to nine, most HarbourVest funds are fully invested, and managers are actively driving growth. The majority of value accretion takes place during this phase, to which HVPE targets approximately 50% of NAV over the long term.

43 HVPE Annual Report and Accounts 2018
Governance R
eportFinancial S
tatements
Supplem
entary Data
Strateg
ic Rep
ort
Primary Secondary Direct Co-investment
15.0
18.716.8
Buyout EarlyVenture
Other(inc.
Mezzanine & Real Assets)
GrowthEquity
17.0
14.516.3 16.5
US Europe AsiaPacific
Rest ofWorld
13.8
21.9 21.6
14.0
Growth by Strategy Secondaries (32% of Investment Portfolio NAV) and Direct Co-investments (23% of Investment Portfolio NAV) outperformed the Primary investments over the year to 31 January 2018. Secondaries growth was driven primarily by a number of projects, in particular the Conversus and SVG Capital transactions. The gain in Direct Co-Investments was driven partly by gains from Wayfair, Lightower Fiber Networks, Capsugel, Preston Hollow Capital and Appriss.
Growth by Stage Buyout performance (61% of Investment Portfolio NAV) and Growth Equity (22% of Investment Portfolio NAV) led all other stages, at 17.0% and 16.5% gains respectively. These were driven primarily by rising global public equity values, expanding valuation multiples, strong earnings growth in the more mature companies, and a continuation of the trend of accretive M&A events around the world.
Growth by Geography The European portfolio (23% of Investment Portfolio NAV) was the strongest geographic region driven by FX gains, and in particular, direct investments Kuoni and Profi Rom Food. Asia Pacific (15% of Investment Portfolio NAV) followed closely behind, driven by a mixture of secondary transactions, and direct investments SsangYong Cement, H-Line Shipping and China PnR.
$249mInvestment Portfolio growth2017: $148m
$174m Total growth HarbourVest Primary funds2017: $90m
$38m Total growth HarbourVest Secondary funds2017: $13m
$30m Total growth HarbourVest Direct Co-investment funds2017: $42m
The remaining $7m is the total growth from the secondary co-investments (2017: $3m).
Buyout Portfolio MetricsThese portfolio metrics reflect an analysis of 694 buyout companies in US and international HarbourVest Funds where data is available. This represents 45% of the total buyout NAV and 28% of the total NAV.
/ / Weighted average EBITDA increase over previous year is 11%.
/ / 66% of the underlying companies (by value) profiled here grew EBITDA during the financial year ending 31 January 2018.
/ / Approximately 45% of these companies are growing earnings at a rate greater than 10% per annum.
/ / The overall valuation multiple is 11.8x EBITDA (11.1x at prior financial year end).
/ / The overall debt multiple is 5.2x EBITDA (4.6x at prior financial year end).
Investment Portfolio Growth at the Partnership Level(% gain over the year to 31 January 2018, adjusted for new investments during the period)

44 HVPE Annual Report and Accounts 2018
Commitment PhaseInvestment PhaseGrowth PhaseMature Phase
Every private equity investment is made with a clear exit strategy in place from the very beginning. Once the investment plan has been implemented during the growth phase, managers turn their attention to maximising the value of their investment ahead of a sale. This could take the form of an IPO on a public exchange, or an M&A transaction involving a trade buyer or secondary private equity investor. While IPOs tend to make the headlines, the majority of exits are achieved via trade sales.
Private equity managers have a key advantage over their public market peers in that they are better able to time a sale to maximise value. During significant market corrections, as exemplified by the global financial crisis, managers can simply delay exits and await more favourable conditions in which to realise their investments. The benefits of this are clear to see: for the last six years running, HVPE has benefited from a long-run average uplift on realisation of 40% over carrying value.1
After approximately ten years, managers are typically realising investments. As a permanent capital vehicle, HVPE expects that the remaining 25% of NAV will be accounted for by assets in this phase.
1 Average of figures reported from 31 January 2012, when this analysis began; historical figures range from 30% to 50%.

45 HVPE Annual Report and Accounts 2018
Governance R
eportFinancial S
tatements
Supplem
entary Data
Strateg
ic Rep
ort
Total Buyout Venture M&A IPO
31 32
19
31 34
Weighted average uplift % on the carrying value
Total Buyout Venture M&A IPO
3.8x2.9x
6.8x
3.4x
7.0x
Weighted average multiple on the cost of analysed transactions
Mature phase Growth phase Investment phase
Realisations by Vintage Year
% of realisations during financial year ended 31 January 2018
1
2000and
earlier
2001 2002 2003 2004 2005 2006 2007 2008 2009 2010 2011 2012 2013 2014 2015 2016 2017
1 1 1 24
24
86
10 10 10
6 18
17
8
HVPE received a total of $405 million from HarbourVest funds and co-investments during the financial year ended 31 January 2018. The largest 100 M&A and IPO transactions, which represent approximately 84% of the value of known transactions during the financial year, were achieved at an uplift to carrying value of 31% and at an average multiple of 3.8 times cost.1
Within the largest transactions, the buyout companies achieved
a weighted average uplift of 32% and return multiple of 2.9x, versus 19% for the venture companies with return multiples of 6.8x. Carrying value is defined as the value at the month end prior to the first announcement of a transaction. While private company valuations are subjective based on observable inputs, the realisations experienced within the HVPE portfolio substantially exceed carrying value.
Top 10 Realisations (1 February 2017 to 31 January 2018)
Company Description
HVPE Distributed Value ($m)2
Lightower Fiber Networks Fibre optic telecommunications 33.0Capsugel Drug delivery systems 15.4Wayfair Online home goods retailer 11.0Securus Technologies Inmate telecommunications 8.5Censeo Health Home healthcare services 7.6PlanView Portfolio management solutions 5.5Carlile Bancshares Community bank platform 4.9Tsebo Outsourcing Group Facilities management 4.7US Foods Fresh and frozen packaged foods 4.7Zabka Polska Convenience store chain 4.4
$99.7m
2 HVPE realised value represents HVPE’s share of primary investment, secondary investment, and direct co-investment realisations received during the financial year. Past performance is not necessarily indicative of future returns.
31%Uplift on carrying value 3.8x average multiple
$405m Amount realised during year2017: $251m
$217m Total realised from HarbourVest Primary funds 2017: $149m
$91m Total realised from HarbourVest Secondary funds 2017: $36m
$77m Total realised from Direct Co-investment funds 2017: $23m
$20m Total Co-investments2017: $43m
389Number of M&A events (187 Venture, 202 Buyout)2017: 377 (165 Venture, 212 Buyout)
31% Uplift on Carrying Value at Realisation
1 This analysis represents a subset of the transactions and does not represent the portfolio as a whole. Additionally, this analysis does not reflect management fees, carried interest, and other expenses of the HarbourVest funds or the underlying managers, which will reduce returns. Past performance is not necessarily indicative of future returns. Snapchat, which is currently held at a blended multiple of 149.3x is excluded from the return multiple analysis. If included the total return multiple on the sample is 8.9x and the return multiple on the Venture and IPO is 29.5x and 44.9x, respectively.

46 HVPE Annual Report and Accounts 2018
Manager Spotlight
Buyout Venture Mezzanine and Real Assets
StrategyPrimary
StrategySecondary
StrategySecondary
1.8% $26.7m 2.6% $37.8m 0.5% $7.6m% investment value at 31 Jan 2018
$m investment value at 31 Jan 2018
% investment value at 31 Jan 2018
$m investment value at 31 Jan 2018
% investment value at 31 Jan 2018
$m investment value at 31 Jan 2018
StrategySecondary
StrategyPrimary
StrategySecondary
1.5% $21.6m 1.4% $20.5m 0.5% $7.4m
StrategyPrimary
StrategyPrimary
StrategySecondary
1.4% $20.4m 1.4% $20.0m 0.4% $6.3m
StrategySecondary
StrategyPrimary
StrategySecondary
1.3% $19.4m 1.0% $15.1m 0.4% $6.0m
StrategyPrimary
StrategyPrimary
StrategySecondary
1.1% $16.2m 1.0% $14.6m 0.4% $5.8m
Top five managers in each core strategy/geography at 31 January 2018.
The figures above in $m represent the specific investment value within the defined strategy.

47 HVPE Annual Report and Accounts 2018
Governance R
eportFinancial S
tatements
Supplem
entary Data
Strateg
ic Rep
ort
US Europe Asia and Rest of World
StrategyPrimary
StrategySecondary
StrategySecondary
1.8% $26.8m 1.5% $21.6m 2.6% $37.8m% investment value at 31 Jan 2018
$m investment value at 31 Jan 2018
% investment value at 31 Jan 2018
$m investment value at 31 Jan 2018
% investment value at 31 Jan 2018
$m investment value at 31 Jan 2018
StrategyPrimary
StrategyPrimary
StrategySecondary
1.4% $20.4m 1.3% $19.4m 0.9% $13.7m
StrategyPrimary
StrategySecondary
StrategyPrimary
1.4% $20.0m 1.3% $19.4m 0.9% $13.6m
StrategyPrimary
StrategySecondary
StrategySecondary
1.1% $16.2m 0.9% $13.3m 0.9% $13.0m
StrategyPrimary
StrategyPrimary
StrategyPrimary
1.0% $14.9m 0.8% $12.0m 0.8% $11.0mThe figures above in $m represent the specific investment value within the defined geography.

48 HVPE Annual Report and Accounts 2018
Top 10 Managers at 31 January 2018 held within HVPE’s underlying portfolio.
1 IDG Capital Partners 2 Thoma Bravo
AsiaVenture investment in companies located in China, with a focus on technology-enabled consumer, enterprise solutions, and artificial intelligence sectors. IDG has a strong and consistent investment track record, proven by their funding of Chinese technology firms Baidu and Alibaba.
USPrimarily buyout investment in mid-market companies in the US, with a focus on the software and technology sectors. Thoma Bravo has demonstrated capability to unlock value through various investment types with deep expertise from their focused sector approach.
2.6% $37.8m 1.8% $26.8m% of Investment Portfolio at 31 Jan 2018
Investment value at 31 Jan 2018
% of Investment Portfolio at 31 Jan 2018
Investment value at 31 Jan 2018
3 Compass Partners 4 Index Ventures
EuropeSecondary buyout investment in mid-to-large transaction sizes, primarily in Europe, and within multiple sectors. Compass Partners is a specialist investor in complex or special situations; its portfolio companies include Rodenstock and Infinitas Learning.
EuropeVenture and growth equity investment primarily in companies located in Europe and the US, with a focus on the disruptive technology and online marketplace sectors. Index has a strong investment track record; its portfolio companies include Deliveroo and Funding Circle.
1.5% $21.6m 1.4% $20.5m% of Investment Portfolio at 31 Jan 2018
Investment value at 31 Jan 2018
% of Investment Portfolio at 31 Jan 2018
Investment value at 31 Jan 2018
Manager Spotlight continued

49 HVPE Annual Report and Accounts 2018
Governance R
eportFinancial S
tatements
Supplem
entary Data
Strateg
ic Rep
ort
5 Hellman & Friedman 6 Insight Venture Management
USLarge buyout investment in companies primarily located in the US, and with a broad sector focus. Hellman & Friedman has demonstrated strong performance across multiple economic cycles; its portfolio companies include Verisure and Hub International.
USGrowth equity investment primarily in companies located in the US, with a focus on software-related and internet sectors. Insight has a distinct sector focus, and consistent strong results; its portfolio companies include SolarWinds and Appriss Holdings.
1.4% $20.4m 1.4% $20.0m% of Investment Portfolio at 31 Jan 2018
Investment value at 31 Jan 2018
% of Investment Portfolio at 31 Jan 2018
Investment value at 31 Jan 2018
7 CapVest Equity Partners 8 The Blackstone Group
EuropeInvestment in mid-market companies located in Europe, with a particular focus on consumer food, beverage, and healthcare sectors. HarbourVest purchased CapVest assets in a secondary deal in 2017.
USPrimarily buyout investment in companies located in the US, but also globally, with a diverse sector-based approach. Blackstone is an industry-leader, with an evolving and expanding focus, and has demonstrated the ability to unlock value through multiple economic cycles.
1.3% $19.4m 1.1% $16.2m% of Investment Portfolio at 31 Jan 2018
Investment value at 31 Jan 2018
% of Investment Portfolio at 31 Jan 2018
Investment value at 31 Jan 2018
9 Lightspeed Venture Partners 10 Welsh, Carson, Anderson & Stowe
USVenture investments in companies primarily located in the US, with a focus on the enterprise and consumer-technology sectors. Lightspeed has a global footprint, and has had strong recent performance in a number of investments including Snapchat and The Honest Company.
US Mid-cap buyout investments in companies located in the US, with a focus on the healthcare and technology sectors. The manager has a focused sector approach with deep expertise; its portfolio companies include US Anesthesia Partners and Asurion.
1.0% $15.1m 1.0% $14.8m% of Investment Portfolio at 31 Jan 2018
Investment value at 31 Jan 2018
% of Investment Portfolio at 31 Jan 2018
Investment value at 31 Jan 2018

50 HVPE Annual Report and Accounts 2018
Top 10 disclosable1 direct companies at 31 January 2018 held within HVPE’s underlying portfolio.
Companies Spotlight
Preston Hollow CapitalStrategy: Small buyoutLocation: US
Speciality finance platformSpeciality municipal finance merchant bank focused on niche underwriting and opportunistic investing. HarbourVest is co-invested with Stone Point Capital, a finance-focused general partner (“GP”) with deep experience in the credit underwriting arena. Since initial investment, Preston Hollow Capital has demonstrated strong performance. The Investment Manager likes the investment as the company has an impressive management team track record and operates within a large, fragmented municipal bond market which presents various business opportunities.
1.4%% of Investment Portfolio at 31 Jan 2018
$20.7mInvestment value at 31 Jan 2018
Press Ganey AssociatesStrategy: Large buyoutLocation: US
Healthcare Data ProviderProvider of patient satisfaction surveys, management reports, and comparative databases for healthcare providers. HarbourVest is co-invested with EQT Partners, a strong healthcare investor. Since initial investment, Press Ganey has demonstrated good performance, become the industry standard, and currently has majority market share. The Investment Manager likes the investment as the company has the most comprehensive data set of its competitors and has achieved a market-leading position built on data accuracy and quality, which are the top selection criterion for customers.
1.1%% of Investment Portfolio at 31 Jan 2018
$16.4mInvestment value at 31 Jan 2018
1 Some direct holdings cannot be disclosed due to confidentiality agreements in place.

51 HVPE Annual Report and Accounts 2018
Governance R
eportFinancial S
tatements
Supplem
entary Data
Strateg
ic Rep
ort
AcrisureStrategy: Large buyoutLocation: US
Insurance and Consulting ServicesProvider of insurance-related products and consulting services to personal, small and middle market clients. HarbourVest is co-invested with ABRY Partners, a GP with deep experience and prior success in the insurance industry. Since initial investment, Acrisure has created significant value by increasing acquisition activity, effectively integrating acquired targets, and driving organic growth. The Investment Manager likes the investment as the company is built on a differentiated acquisition platform, which is well-positioned to consolidate a highly fragmented market.
1.1%% of Investment Portfolio at 31 Jan 2018
$15.7mInvestment value at 31 Jan 2018
H-Line ShippingStrategy: Large buyoutLocation: Asia
Marine Bulk ShippingShipping company specialising in dry bulk and liquefied natural gas (“LNG”) delivery under long-term contracts. H-Line Shipping, headquartered in South Korea, currently has a total fleet of 50 vessels. The Investment Manager likes the investment as the company’s financial performance has demonstrated stable operating profitability levels, whilst the long-term shipping contracts generate cash-flows which provide significant forward visibility.
0.9%% of Investment Portfolio at 31 Jan 2018
$12.8mInvestment value at 31 Jan 2018
SolarWindsStrategy: Large buyoutLocation: US
IT Management SoftwareProvider of easy to implement, low-cost enterprise-class IT and infrastructure management software to IT professionals. SolarWinds currently has over 250,000 customers worldwide. HarbourVest is co-invested with Thoma Bravo, a GP with deep experience of the infrastructure software industry. SolarWinds’ software quickly identifies and addresses IT issues, ensuring maximum network uptime and performance, a service well-positioned to benefit from technology-related mega trends within a growing market.
0.9%% of Investment Portfolio at 31 Jan 2018
$12.4mInvestment value at 31 Jan 2018
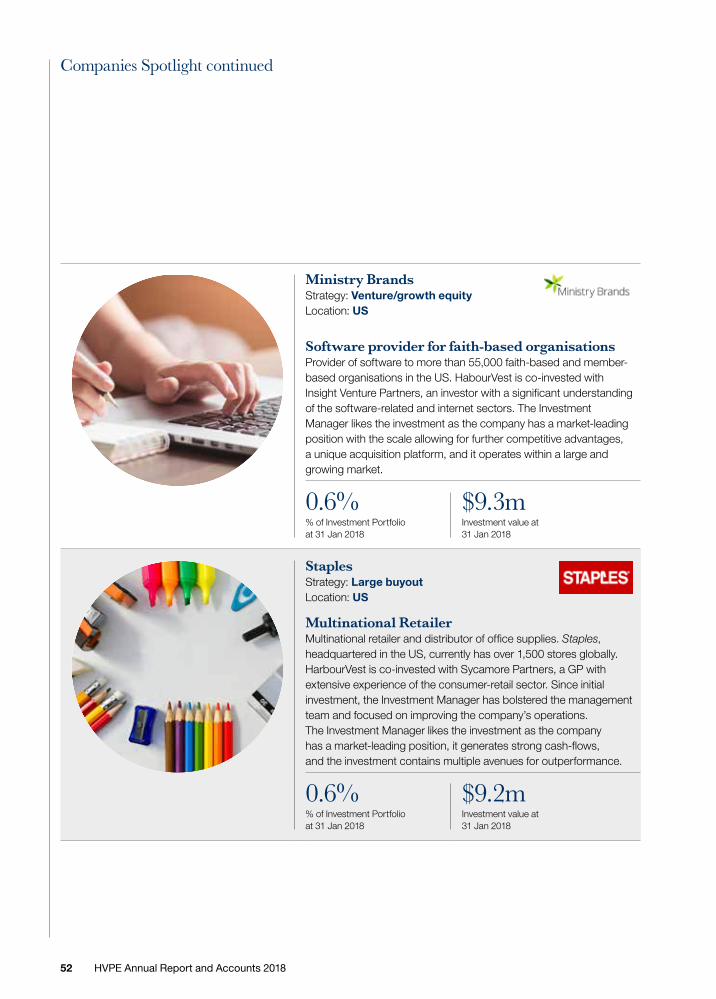
52 HVPE Annual Report and Accounts 2018
Companies Spotlight continued
Ministry BrandsStrategy: Venture/growth equityLocation: US
Software provider for faith-based organisationsProvider of software to more than 55,000 faith-based and member-based organisations in the US. HabourVest is co-invested with Insight Venture Partners, an investor with a significant understanding of the software-related and internet sectors. The Investment Manager likes the investment as the company has a market-leading position with the scale allowing for further competitive advantages, a unique acquisition platform, and it operates within a large and growing market.
0.6%% of Investment Portfolio at 31 Jan 2018
$9.3mInvestment value at 31 Jan 2018
Staples Strategy: Large buyoutLocation: US
Multinational RetailerMultinational retailer and distributor of office supplies. Staples, headquartered in the US, currently has over 1,500 stores globally. HarbourVest is co-invested with Sycamore Partners, a GP with extensive experience of the consumer-retail sector. Since initial investment, the Investment Manager has bolstered the management team and focused on improving the company’s operations. The Investment Manager likes the investment as the company has a market-leading position, it generates strong cash-flows, and the investment contains multiple avenues for outperformance.
0.6%% of Investment Portfolio at 31 Jan 2018
$9.2mInvestment value at 31 Jan 2018

53 HVPE Annual Report and Accounts 2018
Governance R
eportFinancial S
tatements
Supplem
entary Data
Strateg
ic Rep
ort
Albany Molecular Research (AMRI)Strategy: Large buyoutLocation: US
Pharmaceutical Research and ManufacturingProvider of outsourced contract development and manufacturing services for the pharmaceutical industry. HarbourVest is co-invested with GTCR, a GP with a strong track record of investing in pharmaceutical businesses. Since initial investment, AMRI’s management team has acquired companies in the highly fragmented contract development and manufacturing organisation (“CDMO”) industry to drive growth. The Investment Manager views this as an opportunity to invest in a company that is well-positioned to benefit from several industry mega trends such as an aging population, growing healthcare expenditures, and increased outsourcing.
0.6%% of Investment Portfolio at 31 Jan 2018
$9.1mInvestment value at 31 Jan 2018
ApprissStrategy: Venture/growth equityLocation: US
Data and Analytics Solutions ProviderProvider of data and analytics solutions to commercial and government clients to address public safety, regulatory, and compliance needs. HarbourVest is co-invested with Insight Venture Partners, an investor with a significant understanding of the software-related and internet sectors. The Investment Manager likes the investment as the company has a market-leading position, a strong management team, and the company is well-positioned to benefit from the expanding market of reliance on big data and a need for analytics.
0.6%% of Investment Portfolio at 31 Jan 2018
$9.1mInvestment value at 31 Jan 2018
Ssangyong Cement IndustrialStrategy: Medium buyoutLocation: Asia
Integrated Cement Manufacturer and DistributorLargest integrated cement company by production capacity and sales volume in South Korea. Ssangyong, publicly listed on the Korean Stock Exchange, has both coastal and inland production facilities. The Investment Manager likes the investment as the company’s scale and production capabilities give it a competitive advantage in the market, there is good visibility on near-term demand, and potential for further operational improvements.
0.6%% of Investment Portfolio at 31 Jan 2018
$8.9mInvestment value at 31 Jan 2018

54 HVPE Annual Report and Accounts 2018
Key facts/ / Complex secondary transaction in which HarbourVest,
in conjunction with Compass Partners International (“Compass”), facilitated a portfolio liquidity solution for Bridgepoint European Capital.
/ / Proprietary deal, with exclusivity granted to HarbourVest and Compass based on strong long-term relationship with the seller.
/ / HarbourVest platform leveraged to complete due diligence and gain better insight into a portfolio of five assets (the “Portfolio”).
Secondaries Case Studies
Project Penguin
February 2016Date of completion
EuropeGeography
ComplexDeal type
1.38xHVPE gross total value/total cost at 31 January 2018
$18.3mHVPE investment1
5Number of underlying companies
1 Total investment through multiple HarbourVest funds.
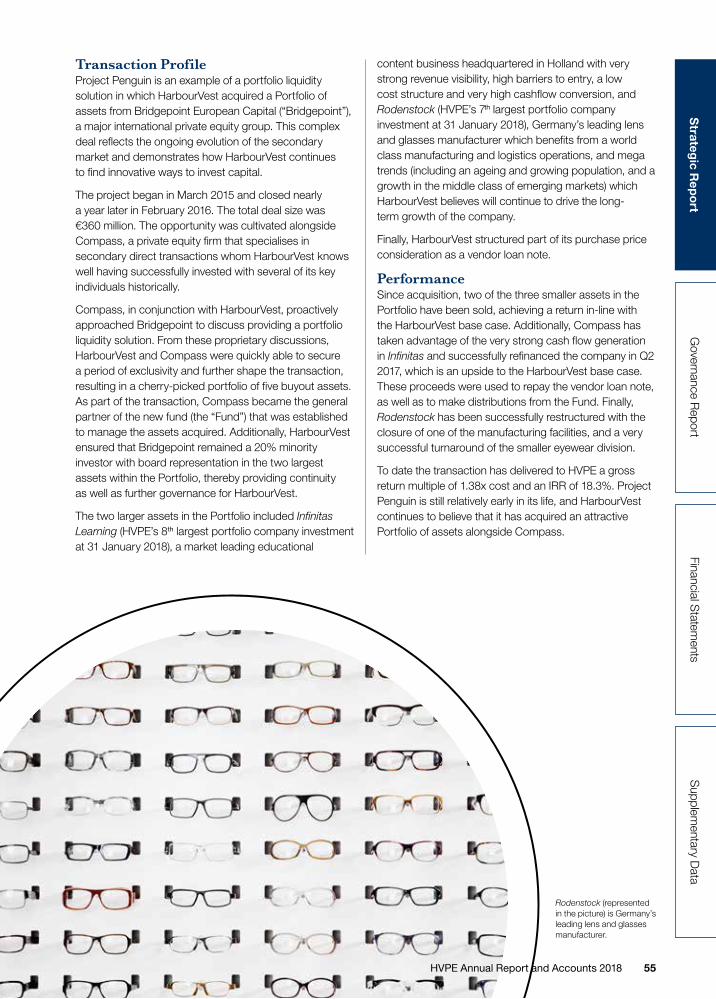
55 HVPE Annual Report and Accounts 2018
Governance R
eportFinancial S
tatements
Supplem
entary Data
Strateg
ic Rep
ort
Transaction ProfileProject Penguin is an example of a portfolio liquidity solution in which HarbourVest acquired a Portfolio of assets from Bridgepoint European Capital (“Bridgepoint”), a major international private equity group. This complex deal reflects the ongoing evolution of the secondary market and demonstrates how HarbourVest continues to find innovative ways to invest capital.
The project began in March 2015 and closed nearly a year later in February 2016. The total deal size was €360 million. The opportunity was cultivated alongside Compass, a private equity firm that specialises in secondary direct transactions whom HarbourVest knows well having successfully invested with several of its key individuals historically.
Compass, in conjunction with HarbourVest, proactively approached Bridgepoint to discuss providing a portfolio liquidity solution. From these proprietary discussions, HarbourVest and Compass were quickly able to secure a period of exclusivity and further shape the transaction, resulting in a cherry-picked portfolio of five buyout assets. As part of the transaction, Compass became the general partner of the new fund (the “Fund”) that was established to manage the assets acquired. Additionally, HarbourVest ensured that Bridgepoint remained a 20% minority investor with board representation in the two largest assets within the Portfolio, thereby providing continuity as well as further governance for HarbourVest.
The two larger assets in the Portfolio included Infinitas Learning (HVPE’s 8th largest portfolio company investment at 31 January 2018), a market leading educational
content business headquartered in Holland with very strong revenue visibility, high barriers to entry, a low cost structure and very high cashflow conversion, and Rodenstock (HVPE’s 7th largest portfolio company investment at 31 January 2018), Germany’s leading lens and glasses manufacturer which benefits from a world class manufacturing and logistics operations, and mega trends (including an ageing and growing population, and a growth in the middle class of emerging markets) which HarbourVest believes will continue to drive the long-term growth of the company.
Finally, HarbourVest structured part of its purchase price consideration as a vendor loan note.
PerformanceSince acquisition, two of the three smaller assets in the Portfolio have been sold, achieving a return in-line with the HarbourVest base case. Additionally, Compass has taken advantage of the very strong cash flow generation in Infinitas and successfully refinanced the company in Q2 2017, which is an upside to the HarbourVest base case. These proceeds were used to repay the vendor loan note, as well as to make distributions from the Fund. Finally, Rodenstock has been successfully restructured with the closure of one of the manufacturing facilities, and a very successful turnaround of the smaller eyewear division.
To date the transaction has delivered to HVPE a gross return multiple of 1.38x cost and an IRR of 18.3%. Project Penguin is still relatively early in its life, and HarbourVest continues to believe that it has acquired an attractive Portfolio of assets alongside Compass.
Rodenstock (represented in the picture) is Germany’s leading lens and glasses manufacturer.

56 HVPE Annual Report and Accounts 2018
Secondaries Case studies continued
Project Laguna
December 2016Date of completion
US/UKGeography
ComplexDeal type
1.61x HVPE gross total value/total cost at 31 January 2018
$12.4mHVPE investment1
8Number of underlying companies
1 Total investment through multiple HarbourVest funds.
Key facts/ / Structured secondary transaction
in which HarbourVest-managed funds restructured the management, distribution waterfall, and overall capital commitment of Health Evolution Partners I, L.P.
/ / Compelling investment opportunity based on the attractive purchase price at a significant discount to the previously reported fair market value and a 12 month deferral of 50% of the purchase price.
/ / Fund primarily comprised of four lower-middle market healthcare companies based in the US and UK with attractive growth profiles and leadership positions within their respective industry niche.

57 HVPE Annual Report and Accounts 2018
Governance R
eportFinancial S
tatements
Supplem
entary Data
Strateg
ic Rep
ort
Transaction ProfileProject Laguna is an example of a structured secondary transaction in which HarbourVest purchased a sole limited partnership interest in Health Evolution Partners I, L.P. (the “Fund”), a 2007 vintage fund managed by Health Evolution Partners (the “Manager”).
The opportunity arose in June 2014. HarbourVest was introduced to the manager and its sole-limited partner, a US public pension fund which was seeking to divest a non-core GP relationship. HarbourVest was viewed as an attractive partner by the seller given its reputation in the market, experience in complex transactions and history of successfully purchasing other assets from the seller. Based on initial due diligence and the indicative offer to the seller, HarbourVest was able to secure exclusivity to complete detailed analysis and negotiate the transaction.
The Fund, which was purchased at a significant discount and with a 12 month deferred payment structure, was primarily comprised of four US and UK lower-middle market companies spanning the healthcare services, medical device, and life sciences sectors (the “Portfolio”). As part of the transaction, HarbourVest simultaneously negotiated a restructured partnership agreement with a new management fee, distribution waterfall, and revised capital commitment for follow-on investments in the existing Portfolio companies.
The top four companies in the Portfolio, which represented 90% of net asset value at the point of purchase, were, or are, industry leaders in their respective niche market (two have since merged with other companies) and had, or have, compelling growth profiles:
/ / CenseoHealth – leading provider of in-home prospective risk assessments to capture real time patient data and identify risk factors and conditions (since merged).
/ / Freedom Innovations – leading developer, manufacturer, and seller of advanced lower-limb prosthetic devices (since merged).
/ / Kisimul Group – leading provider (top five in size) of facility-based education and care services to Special Education Needs children in the UK.
/ / Prolacta Bioscience – only provider of human-milk based FDA regulated nutritional products targeted at high-acuity pre-term infant patients.
PerformanceTo date seven of the eight portfolio companies have been realised resulting in a 21% IRR at 31 December 2017 for HarbourVest funds. In 2017, the Fund exited its largest position, Censeo Health, HVPE’s a 12th largest portfolio company at 31 July 2017, in a sale to New Mountain Partners. The sale represented a 12% increase over the holding value as of 31 July 2017. Over the year to 31 January 2018, Project Laguna was very cash generative to HVPE returning $13 million and gaining 12% over the year. One company, Prolacta Bioscience, remains in the Fund and continues to perform well with good prospects for continued value creation.

58 HVPE Annual Report and Accounts 2018
Board of Directors
Sir Michael BunburyChairman, Independent Non-Executive Director, appointed October 2007
Sir Michael Bunbury (age 71) is an experienced director of listed and private investment, property and financial services companies. He is currently the Chairman of BH Global Limited, a former Director of Foreign & Colonial Investment Trust plc (which has been an investor in numerous HarbourVest funds, including funds in which the Company is invested), and Director of Invesco Perpetual Select Trust plc. Sir Michael began his career in 1968 at Buckmaster & Moore, a member of The Stock Exchange, before joining Smith & Williamson, Investment Managers and Chartered Accountants, in 1974 as a Partner. He later served as Director and Chairman and retired as a consultant to the firm in May 2017.
Committees: Chairman of both the Nomination and Management Engagement and Service Provider Committees.
Keith B. CorbinSenior Independent Non-Executive Director and Chairman of the Audit Committee, appointed October 2007
Keith Corbin (age 65) is an Associate of the Chartered Institute of Bankers (A.C.I.B.) (1976) and Member of the Society of Trust and Estate Practitioners (T.E.P.) (1990). He has been involved in the management of international financial services businesses in various international centres during the last 34 years. Keith is currently the Group Executive Chairman of Nerine International Holdings Limited, Guernsey, which also has operations in the British Virgin Islands, Hong Kong, India, and Switzerland. He serves as a non-executive Director on various regulated financial services businesses, investment funds, and other companies.
Committees: Chairman of the Audit Committee and member of the Nomination Committee.
Francesca BarnesIndependent Non-Executive Director, appointed April 2017
Francesca Barnes (age 59) is a non-executive director of Coutts and Company, Natwest Holdings Limited and the ringfenced banks, and Capvis private equity. She is also the Chair of Trustees for Penny Brohn UK, and is a member of the University of Southampton council. Most recently Francesca sat as a non-executive director on the Board of Electra Private Equity PLC, a FTSE 250 investment trust specialising in private equity investments – a position she held from 2013 to 2016. Previously, Francesca spent 16 years at UBS AG. For the latter seven of these, she served as Global Head of Private Equity, following on from senior positions in restructuring and loan portfolio management. Prior to this, she spent 11 years with Chase Manhattan UK and US, in roles spanning commodity finance, financial institutions, and private equity.
Committees: Member of the Audit, Nomination, and Management Engagement and Service Provider Committees.
Alan C. HodsonIndependent Non-Executive Director, appointed April 2013
Alan Hodson (age 56) is Chairman of JP Morgan Elect and a Director of Woodford Patient Capital Trust. Alan joined Rowe and Pitman (subsequently SG Warburg, SBC and UBS) in 1984 and worked in a range of roles, all related to listed equity markets. He became Global Head of Equities in April 2001 and was a member of the Executive Committee of UBS Investment Bank and of the UBS AG Group Managing Board. He retired from UBS in June 2005 and has since held positions on a variety of commercial and charity Boards.
Committees: Member of the Audit, Nomination, and Management Engagement and Service Provider Committees.

59 HVPE Annual Report and Accounts 2018
Govern
ance Rep
ort
Financial Statem
entsS
upplementary D
ataS
trategic Report
Andrew W. MooreIndependent Non-Executive Director, appointed October 2007
Andrew Moore (age 63) is Group Chairman of Cherry Godfrey Holdings Limited, Chairman of Sumo Limited and a director of Sumo Acquisitions Limited and Sumo Holdings Limited. Andrew joined Williams & Glyns Bank, which subsequently became The Royal Bank of Scotland, after obtaining a diploma in business studies. He moved to Guernsey to establish and act as Managing Director of a trust company for The Royal Bank of Scotland in 1985. During his career, Andrew held a range of senior management positions, including acting as head of corporate trust and fund administration businesses for The Royal Bank of Scotland in Guernsey, Jersey, and Isle of Man, which provided services to many offshore investment structures holding a wide variety of asset classes. Andrew has over 30 years of experience as both an executive and non-executive Director of companies including investment funds and banks.
Committees: Member of the Audit, Nomination, and Management Engagement and Service Provider Committees.
Jean-Bernard SchmidtIndependent Non-Executive Director, appointed October 2007
Jean-Bernard Schmidt (age 72) is a former Managing Partner of Sofinnova Partners, a leading European venture capital firm based in Paris. Jean-Bernard joined Sofinnova in 1973 as an investment manager. In 1981 he became President of Sofinnova Inc. in San Francisco, managing Sofinnova’s US venture capital funds until 1987, when he returned to Paris to head the Sofinnova group. He then began focusing on Sofinnova’s investments in Europe and on technology and early stage projects in information technologies and life sciences. In 1989, he launched the first Sofinnova Capital fund. Jean-Bernard retired from Sofinnova group in September 2010. He is a past and current board member of many technology companies in the US and France. Between 1998 and 2001, he was a board member of AFIC, the French Venture Capital Association. From June 2003 to June 2004, he was Chairman of EVCA (the European Private Equity and Venture Capital Association, now Invest Europe). Jean-Bernard is a graduate of Essec Business School in Paris and holds an MBA from Columbia University in New York.
Committees: Member of the Nomination and Management Engagement and Service Provider Committees.
Peter G. WilsonNon-Executive Director, appointed May 2013
Peter Wilson (age 55) joined HarbourVest’s London-based subsidiary in 1996. He is a member of HarbourVest’s Executive Management Committee and co-leads HarbourVest’s secondary investment activity in Europe. He serves on the advisory committees for partnerships managed by Baring Vostok Capital Partners, CVC Capital Partners, Holtzbrinck Ventures, Index Venture Management, Nordic Capital, and Paragon Partners. Prior to joining HarbourVest, Peter spent three years working for the European Bank for Reconstruction and Development, where he originated and managed two regional venture capital funds in Russia. He served as founding Chairman of the Board of Trustees of City Year London. Peter also spent two years at The Monitor Company, a strategy consulting firm based in Cambridge, Massachusetts. He received a BA (with honours) from McGill University in 1985 and an MBA from Harvard Business School in 1990.
D. Brooks ZugNon-Executive Director, appointed October 2007
Brooks Zug (age 72) is Senior Managing Director Emeritus of HarbourVest Partners, LLC and a founder of HarbourVest. As Senior Managing Director Emeritus, Brooks’ continuing responsibilities include advising the current generation of managing directors and interacting with HarbourVest’s most important global clients, including HVPE. He joined the corporate finance department of John Hancock Mutual Life Insurance Company in 1977, and, in 1982, co-founded Hancock Venture Partners, which later became HarbourVest Partners. Brooks is a past Trustee of Lehigh University and a current Trustee of the Boston Symphony Orchestra. He received a BS from Lehigh University in 1967 and an MBA from Harvard Business School in 1970. Brooks received his CFA designation in 1977.

60 HVPE Annual Report and Accounts 2018
Directors’ Report
The directors present their report and Audited Consolidated Financial Statements (“Financial Statements”) for the year ended 31 January 2018.
A description of important events which have occurred during the financial year, their impact on the performance of the Company as shown in the financial statements (beginning on page 86) and a description of the principal risks and uncertainties facing the Company, together with an indication of important events that have occurred since the end of the financial year and the Company’s likely future development is given in the strategic report, the Chairman’s statement and the notes to the Financial Statements and are incorporated here by reference.
Principal ActivityThe Company is a closed-ended investment company incorporated in Guernsey on 18 October 2007 with an unlimited life. The Company has one class of shares (the “Ordinary Shares”) and its shares are admitted to trading on the Main Market of the London Stock Exchange.
Until 9 September 2015, the Company had two classes of shares in issue being Class A shares of no par value (“Class A shares”) and Class B shares of no par value (“Class B shares”). On 6 December 2007 the Class A shares were admitted to listing and trading on Euronext Amsterdam by NYSE Euronext. On 12 May 2010, the Class A shares were admitted to trading on the Specialist Fund Market of the London Stock Exchange. On 27 August 2015 the Company’s Articles of Incorporation (“Articles”) were amended to permit the repurchase and cancellation of all Class B shares in issue and on 9 September 2015 all Class B Shares were repurchased for a value of $1 per Class B Share and immediately cancelled.
The transition from the Specialist Fund Market of the London Stock Exchange to the Main Market of the London Stock Exchange took effect on 9 September 2015 and the Company joined the FTSE 250 index on 21 December 2015.
In order to reduce administrative and legal costs and complexity, effective 25 October 2016, the Company consolidated its listing on the Main Market of the London
Stock Exchange and its shares were delisted from Euronext Amsterdam. Subsequent to the delisting from Euronext, shareholders who obtained their shares through Euronext Amsterdam will continue to be able to trade these shares on the London Stock Exchange.
Please refer to Note 1 in the Financial Statements for information regarding voting rights.
Investment Objective and Investment PolicyThe Company’s investment objective is to generate superior shareholder returns through long-term capital appreciation by investing primarily in a diversified portfolio of private market investments. The Company may also make investments in private market assets other than private equity where it identifies attractive opportunities.
The Company seeks to achieve its investment objective primarily by investing in investment funds managed by HarbourVest, which invests in or alongside third-party managed investment funds (“HarbourVest Funds”). HarbourVest Funds are broadly of three types: (i) “Primary HarbourVest Funds”, which make limited partner commitments to underlying private market funds prior to final closing; (ii) “Secondary HarbourVest Funds”, which make purchases of private market assets by acquiring positions in existing private market funds or by acquiring portfolios of investments made by such private market funds; and (iii) “Direct HarbourVest Funds”, which invest into operating companies, projects or assets alongside other investors.
In addition, the Company may, on an opportunistic basis, make investments (generally at the same time and on substantially the same terms) alongside HarbourVest Funds (“Co-investments”) and in closed-ended listed private equity funds not managed by HarbourVest (“Third Party Funds”). Co-investments made by the Company may, inter alia, include investments in transactions structured by other HarbourVest vehicles including, but not limited to, commitments to private market funds or operating companies in which other HarbourVest funds have invested.

61 HVPE Annual Report and Accounts 2018
Govern
ance Rep
ort
Financial Statem
entsS
upplementary D
ataS
trategic Report
Cash, at any time not held in such longer term investments is, pending such investment, held in cash, cash equivalents, and money market instruments.
The Company uses an over-commitment strategy in order to remain as fully invested as possible, consistent with the investment guidelines. To achieve this objective, the Company has undrawn capital commitments to HarbourVest Funds and Co-investments which exceed its liquid funding resources, but uses its best endeavours to maintain capital resources which, together with anticipated cash flows, will be sufficient to enable the Company to satisfy such commitments as they are called.
Diversification and Investment GuidelinesThe Company will, by investing in a range of HarbourVest Funds, Co-investments and Third Party Funds, seek to achieve portfolio diversification in terms of:
/ / geography: providing exposure to assets in the United States, Europe, Asia and other markets;
/ / stage of investment: providing exposure to investments at different stages of development such as early stage, balanced and late stage venture capital, small and middle market businesses or projects, large capitalisation investments, mezzanine investments and special situations such as restructuring of funds or distressed debt;
/ / strategy: providing exposure to primary, secondary and direct investment strategies;
/ / vintage year: providing exposure to investments made across many years; and
/ / industry: with investments exposed, directly or indirectly, to a large number of different companies across a broad array of industries.
In addition, the Company will observe the following investment restrictions:
/ / with the exception, at any time, of not more than one HarbourVest Fund or Co-investment to which up to 40% of the Company’s Gross Assets may be committed or in which up to 40% of the Company’s Gross Assets may be invested, no more than 20%
of the Company’s Gross Assets will be invested in or committed at any time to a single HarbourVest Fund or Co-investment;
/ / no more than 10% of the Company’s Gross Assets will be invested (in aggregate) in Third Party Funds;
/ / the Investment Manager will use its reasonable endeavours to ensure that no more than 20% of the Company’s Gross Assets, at the time of making the commitment, will be committed to or invested in, directly or indirectly, whether by way of a Co-investment or through a HarbourVest Fund, to (a) any single ultimate underlying investment, or (b) one or more collective investment undertakings which may each invest more than 20% of the Company’s Gross Assets in other collective investment undertakings (ignoring, for these purposes, appreciations and depreciations in the value of assets, fluctuations in exchange rates and other circumstances affecting every holder of the relevant asset);
/ / any commitment to a single Co-investment which exceeds 5% of the Company’s NAV (calculated at the time of making such commitment) shall require prior Board approval, provided however that no commitment shall be made to any single Co-investment which, at the time of making such commitment, represents more than 10% (or, in the case of a Co-investment that is an investment into an entity which is not itself a collective investment undertaking (a “Direct Investment”), 5%) of the aggregate of: (a) the Company’s NAV at the time of the commitment; and (b) undrawn amounts available to the Company under any credit facilities;
/ / the Company will not, without the prior approval of the Board, acquire any interest in any HarbourVest Fund from a third party in a secondary transaction for a purchase price that:
(i) exceeds 5% of the Company’s NAV; or
(ii) is greater than 105% of the most recently reported net asset value of such interest (adjusted for contributions made to and distributions made by such HarbourVest Fund since such date).

62 HVPE Annual Report and Accounts 2018
Directors’ Report continued
Save for cash awaiting investment which may be invested in temporary investments, the Company will invest only in HarbourVest Funds (either by subscribing for an interest during the initial offering period of the relevant fund or by acquiring such an interest in a secondary transaction), in Co-Investments or in Third Party Funds.
Company’s Right to Invest in HarbourVest FundsPursuant to contractual arrangements with HarbourVest, the Company has the right to invest in each new HarbourVest Fund, subject to the following conditions:
/ / unless the Board agrees otherwise, no capital commitment to any HarbourVest Fund may, at the time of making the commitment, represent more than 35% or less than 5% of the aggregate total capital commitments to such HarbourVest Fund from all its investors;
/ / unless HarbourVest agrees otherwise, the Company shall not have a right to make an investment in, or a commitment to, any HarbourVest Fund to which 10 or fewer investors (investors who are associates being treated as one investor for these purposes) make commitments.
LeverageThe Company does not intend to have aggregate leverage outstanding at Company level for investment purposes at any time in excess of 20% of the Company’s NAV. The Company may, however, have additional borrowings for cash management purposes which may persist for extended periods of time depending on market conditions.
ResultsThe results for the financial year ended 31 January 2018 are set out in the Consolidated Statements of Operations within the Financial Statements that begin on page 87. In accordance with the investment objective of the Company to generate superior shareholder returns through long-term capital appreciation, the directors did not declare any dividends during the year under review and the directors do not recommend the payment of dividends as at the date of this report.
DirectorsThe directors as shown on pages 58 to 59 all held office throughout the reporting period and at the date of signature of these Financial Statements. Brooks Zug is Senior Managing Director Emeritus of HarbourVest Partners, LLC, an affiliate of the Investment Manager. Peter Wilson is Managing Director of HarbourVest Partners (UK) Limited, a subsidiary of HarbourVest Partners, LLC. Jean-Bernard Schmidt is a former Managing Partner of Sofinnova Partners, which manages partnerships into which HarbourVest fund-of-funds invest.
Save as disclosed in these Financial Statements, the Company is not aware of any other potential conflicts of interest between any duty of any of the directors owed to it and their respective private interests. All directors, other than Mr. Zug and Mr. Wilson, are considered to be independent. Mr. Corbin is the Senior Independent Director.
Directors’ Interests in Shares
31 January 2018
31 January 2017
Sir Michael Bunbury 22,863 22,863Keith Corbin 25,000 25,000Alan Hodson 30,000 30,000Andrew Moore 14,400 14,400Jean-Bernard Schmidt 28,500 28,500Peter Wilson 25,000 25,000Brooks Zug 21,000 NilFrancesca Barnes 2,000 Nil
There has been no change in Directors’ interests between 31 January 2018 and the date of signing of this report.
Shareholder InformationThe Company announces the estimated net asset value of an Ordinary Share on a monthly basis together with commentary on the investment performance provided by the Investment Manager. These monthly statements are available on the Company’s website.
The last traded price of Ordinary Shares is available on Reuters, Bloomberg, and the London Stock Exchange.

63 HVPE Annual Report and Accounts 2018
Govern
ance Rep
ort
Financial Statem
entsS
upplementary D
ataS
trategic Report
A copy of the original Prospectus of the Company is available from the Company’s registered office and on the Company’s website.
All Ordinary Shares may be dealt in directly through a stockbroker or professional adviser acting on an investor’s behalf. The buying and selling of Ordinary Shares may be settled through CREST.
Relations with ShareholdersThe Board recognises that it is important to maintain appropriate contact with major shareholders to understand their issues and concerns. Members of the Board have had the opportunity to attend meetings with major shareholders, and the Board accesses major shareholders’ views of the Company via, among other methods, direct face-to-face contact and analyst and broker briefings. The Chairman and other independent directors regularly meet with shareholders.
In addition, the Investment Manager maintains dialogue with institutional shareholders, the feedback from which is reported to the Board. The Company has also appointed J.P. Morgan Cazenove and Jefferies Hoare Govett as its joint corporate brokers to enhance communications with shareholders. Scott Harris has been engaged to report on and to liaise with shareholders. In addition, Scott Harris also arrange shareholder meetings for the Investment Manager.
The Board monitors the Company’s trading activity on a regular basis.
The Company reports formally to shareholders twice a year. In addition, current information is provided to shareholders on an ongoing basis through the Company’s website and monthly factsheet. Shareholders may contact the directors, including the Chairman and the Senior Independent Director through the Company Secretary.
Substantial ShareholdersIn the year ending 31 January 2018, HVPE continued to see a reduction in the proportion of its shares held by US investors, from 30% to 24%. From the time of HVPE’s listing on the Main Market of the London Stock Exchange in September 2015, the upper limit allowable under the prevailing regulatory regime has been 50%. As the
Company is no longer at risk of breaching this limit, the figure is no longer reported in the monthly factsheets. The table below shows the interests of major shareholders based on the best available information received by the Company’s share register analysis provider, incorporating any disclosures provided to the Company in accordance with DTR 5 in the period under review and to 9 May 2018.
% of Total Shares
31 January 2018
% of Total Shares 9 May 2018
State Teachers Retirement System of Ohio 13.57 13.57Old Mutual Global Investors 12.03 12.07M&G (Prudential) 10.79 10.94City of Edinburgh Council 5.72 5.72Lazard Asset Management 5.66 5.30
Total 47.77% 47.60%
Corporate ResponsibilityThe Board of the Company considers the ongoing interests of investors on the basis of open and regular dialogue with the Investment Manager. The Board receives regular updates outlining regulatory and statutory developments and responds as appropriate.
Responsible Investment PolicyThe Company delegates responsibility to its Investment Manager for taking environmental, social and governance (“ESG”) issues into account when considering investments. The Board expects the Investment Manager to engage with investee funds and companies on ESG issues and to promote best practice. The Investment Manager is a signatory to the United Nations’ Principles of Responsible Investing. Further information about this is provided on page 31 of this report.
Anti-Bribery PolicyThe directors have undertaken to operate the business in an honest and ethical manner and accordingly take a zero-tolerance approach to bribery and corruption. The key components of this approach are implemented as follows:

64 HVPE Annual Report and Accounts 2018
Directors’ Report continued
/ / the Board is committed to acting professionally, fairly and with integrity in all its business dealings and relationships;
/ / the Company implements and enforces effective procedures to counter bribery; and
/ / the Company requires all its service providers and advisors to adopt equivalent or similar principles.
Zero Tolerance Policy towards the Facilitation of Tax EvasionFollowing the entry into force of the UK Criminal Finance Act 2017, the Board has reaffirmed its zero tolerance policy towards the facilitation of corporate tax evasion.
Disclosures Required Under LR 9.8.4RThe Financial Conduct Authority’s Listing Rule 9.8.4R, pertaining to the annual report, requires that the Company includes certain information, relating, inter alia, to arrangements made between a controlling shareholder and the Company, waivers of directors’ fees, and long term incentive schemes in force, in a single identifiable section of the annual report or a cross reference table indicating where the information is set out. The directors confirm that there are no disclosures to be made in this regard.
Investment ManagerA description of how the Company has invested its assets, including a quantitative analysis, may be found on pages 1 to 57 of this report, with further information disclosed in the Financial Statements and the Notes to the Financial Statements on pages 94 to 101. The Board has considered the appointment of the Investment Manager and, in the opinion of the directors of the Company, the continuing appointment of the Investment Manager on the terms agreed is in the interests of its shareholders as a whole.
In considering this appointment, the Board has reviewed the past performance of the Investment Manager, the engagement of the Investment Manager with shareholders and the Board, and the strategic plan presented to the Board by the Investment Manager.
The Investment Manager is HarbourVest Advisors L.P. and the principal contents of the Investment Management Agreement are as follows:
/ / to manage the assets of the Company (subject always to control and supervision by the Board and subject to both the investment policy of the Company and any restrictions contained in any prospectuses published by the Company);
/ / to assist the Company with shareholder liaison;
/ / to monitor compliance with the Investment Policy on a regular basis;
/ / to nominate up to two Board representatives for election by shareholders at the Company’s Annual General Meeting.
The Investment Manager is not entitled to any direct remuneration (save expenses incurred in the performance of its duties) from the Company, instead deriving its fees from the management fees and carried interest payable by the Company on its investments in underlying HarbourVest Funds. The investment management agreement, which was amended and restated on 27 August 2015 (the “Investment Management Agreement”), may be terminated by either party by giving 12 months’ notice. In the event of termination within ten years and three months of the date of the listing on the Main Market, the Company would be required to pay a contribution, which would have been $6.3 million at 31 January 2018 and $6.1 million as at 27 April 2018, as reimbursement of the Investment Manager’s remaining unamortised IPO costs. In addition, the Company would be required to pay a fee equal to the aggregate of the management fees for the underlying investments payable over the course of the 12-month period preceding the effective date of such termination to the Investment Manager.

65 HVPE Annual Report and Accounts 2018
Govern
ance Rep
ort
Financial Statem
entsS
upplementary D
ataS
trategic Report
Delegation of ResponsibilitiesUnder the Investment Management Agreement, the Board has delegated to the Investment Manager substantial authority for carrying out the day-to-day management and operations of the Company, including making specific investment decisions, subject at all times to the control of, and review by, the Board. In particular, the Investment Management Agreement provides that the Board and the Investment Manager shall agree a strategy mandate which sets out a five-year plan for the Company.
Directors’ IndemnityUnder the Company’s Articles, the directors, Secretary and officers are indemnified out of the Company’s assets and profits from and against all actions, expenses, and liabilities which they may incur by reason of any contract entered into, or any act in or about the execution of their respective offices or trusts, except as incurred by their own negligence, breach of duty or breach of trust. The Company also maintains directors’ and officers’ insurance cover on the directors’ behalf.
International Tax ReportingThe Company is subject to Guernsey regulations and guidance based on reciprocal information sharing inter-governmental agreements which Guernsey has entered into with a number of jurisdictions. The Board has taken the necessary actions to ensure that the Company is compliant with Guernsey regulations and guidance in this regard.
Risk ManagementThe Board has an ongoing process in place for identifying, evaluating and managing the significant risks faced by the Company. Further details of this process and a description of the principal risks and uncertainties facing the Company is given on pages 27 to 29.
Financial Risk ManagementThe Company is wholly funded from equity balances, comprising issued ordinary share capital as detailed in Note 1 to the Financial Statements and retained earnings. The Company has access to borrowings pursuant to the Credit Facility of up to $500 million.
The Company’s financial risk management objectives and policies are outlined in the Audit Committee report beginning on page 68 and the Principal Risks section of this report beginning on page 27. The Company’s policy on hedging is considered under Foreign Exchange risks in the Principal Risks section of this report. Its approach to leverage is outlined on page 62.
The Investment Manager and the Directors ensure that all investment activity is performed in accordance with the investment guidelines. The Company’s investment activities expose it to various types of risks that are associated with the financial instruments and markets in which it invests. Risk is inherent in the Company’s activities and it is managed through a process of ongoing identification, measurement and monitoring. The financial risks to which the Company is exposed include price risk, liquidity risk and cash flow risk and these risks are explained in greater detail in the Principal Risks section of this report beginning on page 27.
Going ConcernAfter making enquiries, and mindful of the closed-ended nature of the Company with no fixed life and the nature of its investments, the directors are satisfied that it is appropriate to continue to adopt the going concern basis in preparing the Financial Statements, and, after due consideration, the directors consider that the Company is able to continue for a period of at least the next 12 months. In addition, the Board monitors and manages the ongoing commitments via the criteria set out on page 60. When considering the criteria, the Board reviews reports from the Investment Manager detailing ongoing commitments and the Investment Pipeline. Furthermore, the Board, as part of its regular review of the Consolidated Statement of Assets and Liabilities and debt position, considers model scenario outputs that are based on a look-through to the anticipated underlying fund and portfolio cash flows.

66 HVPE Annual Report and Accounts 2018
Board Structure and CommitteesThe activities of the Company are overseen by a majority independent Board of directors. The Board meets at least five times a year, and between these scheduled meetings there is regular contact between directors, the Investment Manager and the administrator and Company Secretary, including a formal strategy meeting and scheduled Board update calls.
The directors are kept fully informed of investment and financial controls and other matters that are relevant to the business of the Company. Such information is brought to the attention of the Board by the Investment Manager and by the administrator and Company Secretary in their quarterly reports to the Board. The directors also have access where necessary, in the furtherance of their duties, to professional advice at the expense of the Company. Committee terms of reference are available on the Company’s website: www.hvpe.com.
Board and Committee Meetings In the financial year ending 31 January 2018, the Board held the following meetings:
Meeting type
Number of meetings
held in the year ending 31 January
2018
Quarterly Board Meeting 4Board Strategy Meeting 1Ad-hoc Board Meeting 4Audit Committee Meeting 4Nomination Committee Meeting 1Management, Engagement and Service Provider Committee Meeting 3Inside Information Committee Meeting 0
Total 17
All directors received notice of the meetings, the agenda and supporting documents and were able to comment on the matters to be raised at the proposed meeting. In addition to the formal quarterly, strategy and ad-hoc meetings, the Board also receives detailed updates from the Investment Manager via update calls.
Audit Committee Inside Information Committee
Management Engagement and Service
Provider CommitteeNomination Committee
Role To oversee the Company’s
financial reporting and controls framework and liaise with and
evaluate the performance of the Company’s Auditor.
Role To consider any developments
which may require an immediate announcement by virtue of being
price sensitive information.
Role To review the Company’s
Investment Manager and service providers to ensure that a good
value service of satisfactory quality is delivered and to manage the appointment process of new or replacement service providers.
Role To oversee succession planning and new director appointment
and induction.
The Board of Directors

67 HVPE Annual Report and Accounts 2018
Govern
ance Rep
ort
Financial Statem
entsS
upplementary D
ataS
trategic Report
Director AttendanceBelow is a summary of the director attendance at the quarterly and strategic Board meetings held in the financial year:
Director
Attendance at Quarterly
and Strategic Board
Meetings
Ms. Francesca Barnes 3/41
Sir Michael Bunbury 5/5Mr. Keith Corbin 5/5Mr. Alan Hodson 5/5Mr. Andrew Moore 5/5Mr. Jean-Bernard Schmidt 5/5Mr. Peter Wilson 5/5Mr. Brooks Zug 5/5
1 Ms Barnes was appointed during the year under review in April 2017. She had a prior engagement which pre-dated her appointment to the Board and hence was unable to attend one meeting.
Board EvaluationThe Board undertakes a formal annual evaluation of its performance and the performance of the Investment Manager and the Company Secretary. Each director’s performance is reviewed annually by the Chairman, and the performance of the Chairman is assessed by the remaining directors by way of a performance evaluation questionnaire and a subsequent scheduled interview. As part of the review, succession planning, the scope of the director’s role including any committee memberships, any training and development requirements, and the ability of the director to devote sufficient time to the Company are considered. In addition to the annual evaluation, in 2016 the Board commissioned an external appraisal by Board Alpha Limited to review its operation and effectiveness.
Board CompositionThe Board has a balance of skills, experience and length of service relevant to the Company, and the directors believe that any changes to the Board’s composition can be managed without undue disruption. With any new director appointment to the Board, the new director will participate in an appropriate, structured induction process.
The Board has carefully considered its composition, with specific reference to the fact that Sir Michael Bunbury, Mr. Corbin, Mr. Moore, Mr. Schmidt and Mr. Zug had served on the Board for ten years in October 2017. The Board is of the view that, with the exception of Mr Schmidt who is retiring from the Board, these directors can continue beyond a tenure of ten years, noting that they will be subject to continuing scrutiny as to their effectiveness and independence, and to annual re-election. The Board confirms that Sir Michael Bunbury, Mr. Corbin, Mr. Moore and Mr. Schmidt remain independent of the Investment Manager, notwithstanding their ten years service.

68 HVPE Annual Report and Accounts 2018
Audit CommitteeAbout the CommitteeThe Audit Committee consists of Mr. Corbin (Chairman), Ms. Barnes, Mr. Hodson and Mr. Moore. All committee members are deemed by the Board to have recent and relevant financial and sector experience. Ms. Barnes, Mr. Hodson and Mr. Moore have each held senior banking roles for a number of years as described in their biographies; Mr. Corbin has extensive experience as a member and chairman of various audit committees, as well holding banking qualifications and having acted as a senior manager of a financial services business for more than 30 years. The terms of reference of the Audit Committee are available on the Company’s website and from the Company Secretary on request.
The Audit Committee is responsible for the review of the Company’s accounting policies, periodic financial statements, auditor engagement and certain regulatory compliance matters.
Additionally, the Audit Committee is responsible for making appropriate recommendations to the Board and ensuring that the Company complies to the best of its ability with applicable laws and regulations and adheres to the tenet of generally-accepted codes of conduct.
The Company does not have an internal audit department. All of the Company’s management and administration functions are delegated to independent third parties or the Investment Manager and it is therefore felt there is no need for the Company to have an internal audit facility. This matter will be reviewed annually.
Activities of the CommitteeAudit Committee ReportIn the year under review, the Audit Committee examined the effectiveness of the Company’s internal control systems, the annual and interim reports and financial statements, the auditor’s remuneration and engagement, as well as the auditor’s independence and any non-audit services provided. Further details about the activities of the committee are set out over the next few pages.
Audit Committee MeetingsIn the financial year ended 31 January 2018, the Audit Committee met four times: twice on a scheduled basis, and twice on an ad-hoc basis. The entire Audit Committee was not required to attend the short notice ad-hoc meetings, which were convened to provide final sign-off on the financial reports, a detailed discussion and review having taken place at an earlier meeting. Below is a summary of director attendance at the committee meetings held in the financial year, compared with those for which they were eligible:
Audit Committee Member
Scheduled meetings
Attendance
Ad-hoc meetings
Attendance
Mr. Keith Corbin 2/2 2/2
Ms. Francesca Barnes1 1/1 1/1
Mr. Alan Hodson 2/2 1/22
Mr. Andrew Moore 2/2 2/2
1 Ms Barnes was appointed to the Audit committee on 18 May 2017.2 As cited above the entire Audit Committee is not required to attend the
ad-hoc meetings. Mr. Hodson had a prior engagement.
Auditor TenderPursuant to best practice, the Audit Committee undertook an audit tender process during 2017 in respect of the audit of the Company’s Financial Statements for the year ending 31 January 2018 and onwards. Four audit firms were approached to participate in the tender process and two firms met with the Audit Committee in May 2017. Following this process, the continued appointment of Ernst and Young LLP was confirmed.
AuditorsThe Audit Committee reviewed the effectiveness of the external audit process during the year, considering performance, objectivity, independence and relevant experience, and concluded that Ernst & Young LLP’s appointment as the Company’s auditor should be continued. The Company’s auditors, Ernst & Young LLP, have been appointed to the Company since 2007. The Company’s auditors performed an audit of the Company’s financial statements in accordance with applicable law, US Generally Accepted Auditing Standards (“GAAS”), and International Standards on Auditing (UK). The audit
Board Structure and Committees continued

69 HVPE Annual Report and Accounts 2018
Govern
ance Rep
ort
Financial Statem
entsS
upplementary D
ataS
trategic Report
approach remained unchanged relative to the prior year and the Audit Committee was informed that a majority of the audit field work would be performed by Ernst & Young in Boston, United States, under the direction and supervision of Ernst & Young LLP Guernsey.
Auditor IndependenceThe Audit Committee understands the importance of auditor independence and, during the year, the Audit Committee reviewed the independence and objectivity of the Company’s auditor, Ernst & Young LLP. The Audit Committee received a report from the external auditor describing its independence, controls and current practices to safeguard and maintain auditor independence. Non-audit fees paid to the auditor by the Company were nil. Ernst & Young was paid non-audit fees of $103,200 by the Investment Manager, in relation to tax services provided for the year ended 31 January 2018, which were reimbursed by the Company. The Investment Manager has informed the Committee that future tax services as described above will be provided by PricewaterhouseCoopers LLP. The Audit Committee considers all non-audit services to be provided to the Company by the auditor prior to their appointment to ensure that the auditor is the most appropriate party to deliver these services and to put in place safeguards, where appropriate, to manage any threats to auditor independence. It is the intention of the Committee that the value of non-audit services provided to the Company will not exceed the audit fee.
Terms of Engagement The Audit Committee reviewed the audit scope and fee proposal set out by the auditors in their audit planning report and discussed the same with the auditors at an Audit Committee meeting. The Audit Committee considered the proposed fee of $135,400 for audit services related to the 31 January 2018 annual accounts. Having been satisfied by the scope of the engagement letter and fee proposal, the Committee recommended to the Board to approve the fee proposal and letter of engagement.
Audited Financial Statements and Significant Reporting MattersAs part of the 31 January 2018 year-end audit, the Audit Committee reviewed and discussed the most relevant issues for the Company, most notably the misstatement or manipulation of the valuation of its investments in underlying HarbourVest funds, and received a report from the auditors. The Committee concluded that the Annual Report and Accounts were fair, balanced and understandable.
Internal Controls The Audit Committee reviewed the Board’s processes for evaluating risk to ensure that the systems covered all the potential risks facing the Company and confirmed to the Board that the risk review was both thorough and rigorous and the Company’s risk management and internal control systems were effective. The Audit Committee confirms that there is an ongoing process for identifying, evaluating, monitoring and managing the significant risks faced by the Company. This process has been in place for the year under review and up to the date of approval of this Annual Report and Financial Statements. It is reviewed by the Board on a regular basis and is in accordance with the internal controls: Guidance on Risk Management, Internal Control and Related Financial and Business Reporting.
The internal control systems are designed to meet the Company’s particular needs and the risks to which it is exposed. Accordingly, the internal control systems are designed to manage rather than eliminate the risk of failure to achieve business objectives and by their nature can only provide reasonable and not absolute assurance against misstatement and loss. The Company places reliance on the control environment of its service providers, including its independent administrator and the Investment Manager. In order to satisfy itself that the controls in place at the Investment Manager are adequate, the Audit Committee has reviewed a Type II SOC I Report – Private Equity Fund Administration Report on Controls Placed in Operation and Tests of Operating Effectiveness for the period from 14 January 2017 to 30 September 2017 (a bridging letter covers the period 1 October 2017 to 4 May 2018), detailing the controls environment in place at the Investment Manager. There were no significant findings disclosed in

70 HVPE Annual Report and Accounts 2018
this report which warranted further investigation by the committee. In addition, the Management Engagement and Service Provider Committee conducted a detailed review of the performance of the Company’s service providers, including the Company’s administrator, and the Audit Committee reviewed their findings to ensure that the Company’s control environment was operating satisfactorily.
The following sections discuss the assessments made by the Audit Committee during the year.
Investment ValuationsThe Audit Committee reviews the monthly NAV statements issued by the Company prior to release. In the year under review members of the Audit Committee met with operations staff of the Investment Manager and satisfied themselves that the Company’s valuations process was conducted in accordance with the process reviewed in detail in the prior year. The Audit Committee remains satisfied that the valuation techniques used are accurate and appropriate for the Company’s investments and consistent with the requirements of US GAAP.
Fees and Expenses The Chairman of the Audit Committee reviewed the calculation of fees and expenses paid by the Company to the Investment Manager on a sample of four HarbourVest funds in which the Company is currently invested. No errors or omissions were noted in these calculations, and this was communicated to the Audit Committee. Discussing the calculation and disclosure of fees paid to the Investment Manager, the Audit Committee noted the enhanced disclosures and presentation in the Annual Report and concluded that the information was in a clear and understandable format. The Audit Committee noted the discussions between the Board and the Investment Manager to ensure that fees charged to the Company were comparable with those charged to other significant investors in HarbourVest funds. The overall percentage rate of fees and expenses paid to the Investment Manager continues to be reduced from the levels of previous financial years, and the Audit Committee also reviewed the information regarding those fees contained in this Annual Report to ensure that it was presented in a clear and consistent manner.
Risk Management The Audit Committee reviewed the Board’s policies and procedures regarding the identification, management, and monitoring of risks that could affect the Company, which were in place for the year under review and up to the date of approval of the Annual Report. No significant failings or weaknesses were identified in the review. The Audit Committee considers that the Board is engaged on an ongoing basis in the process of identifying, evaluating and managing (where possible) the principal risks facing the Company as shown on pages 27 to 29. This is in accordance with relevant best practice detailed in the Financial Reporting Council’s guidance on Risk Management, Internal Control and Related Financial and Business Reporting. In addition, the Audit Committee members participated in the consideration by the Board of the viability of the Company until 31 January 2021, details of which are shown on page 76.
Corporate GovernanceThe Audit Committee continues to monitor the review by the Board of the Company’s compliance with the AIC Code of Corporate Governance for Investment Companies and best practice following the admission to trading of the Company’s Ordinary Shares on the Main Market of the London Stock Exchange which took place on 9 September 2015.
Governance and Effectiveness On 2 May 2018 the Committee conducted a review of its activities against its constitution and terms of reference in respect of the year under review.
Other MattersIn presenting this report, I have set out for the Company’s shareholders the key areas that the Audit Committee focuses on. The Audit Committee advised the Board that the Annual Report and Accounts are fair, balanced, and understandable. If any shareholders would like any further information about how the Audit Committee operates and its review process, I, or any of the other members of the Audit Committee would be pleased to meet with them to discuss this.
Keith CorbinChairman of the Audit Committee 10 May 2018
Board Structure and Committees continued

71 HVPE Annual Report and Accounts 2018
Govern
ance Rep
ort
Financial Statem
entsS
upplementary D
ataS
trategic Report
Nomination CommitteeAbout the CommitteeThe Nomination Committee was established on 24 November 2015 and is chaired by the Chairman of the Company and its members are Ms. Barnes, Mr. Corbin, Mr. Hodson, Mr. Moore and Mr. Schmidt.
All members of the committee attended all meetings held during the year. The mandate of the Nomination Committee is to consider issues related to Board composition and the appointment of directors. The Terms of Reference for this committee may be found on the Company’s website www.hvpe.com.
Activities of the CommitteeChanges to Board CompositionFollowing the decision by the Board that an orderly succession process should take place for the retirement of those directors who had served on the Board for longer than nine years, the committee Chairman and members drew up a person specification cognisant of best practice on ensuring that a diverse range of qualified candidates should be considered and Cornforth Consulting was appointed as external search consultants. Cornforth Consulting does not have any other relationship with the Company. Committee members met with a shortlist of candidates and following this independent process, Ms. Francesca Barnes was appointed as a director of the Company on 3 April 2017.
The members of the committee then met in September and agreed the approach for the appointment of another director as part of the succession process. Again a person specification was drawn up taking into account best practice relating to non-executive director appointments and Cornforth Consulting were engaged as external search consultants. Committee members met with a shortlist of candidates and it was announced on 25 April 2018 that Mr. Steven Wilderspin would be appointed as a director of the Company effective 14 May 2018. It was also announced that Mr. Jean-Bernard Schmidt intended to retire at the Company’s Annual General Meeting in July 2018.
The committee also actively engaged with the Investment Manager and Company Secretary to ensure that Ms. Barnes was given a suitable induction process.
Induction Process and Board Effectiveness ReviewThe committee members reviewed the Company’s induction processes and considered matters relating to the composition of the Board, incorporating these conclusions in the person specifications drawn up as part of the succession process.
Governance and EffectivenessIn February 2018 the committee conducted a review of its activities against its constitution and terms of reference in respect of the year under review and concluded that it had satisfactorily complied with all of its terms of reference.
Management Engagement and Service Provider CommitteeAbout the CommitteeThe Management Engagement and Service Provider Committee (“MESPC”) was established on 24 November 2015 and is chaired by the Chairman of the Company. Its members are Ms. Barnes, Mr. Schmidt, Mr. Hodson and Mr. Moore. The other directors of the Company may attend by invitation of the committee.
The MESPC held two meetings in the year under review and all members of the committee attended those meetings. The Terms of Reference for this committee may be found on the Company’s website www.hvpe.com.
Activities of the CommitteeIn the course of the year under review, the MESPC conducted a review of the Company’s service providers to ensure the safe and accurate management and administration of the Company’s affairs and business on terms which were competitive and reasonable for the shareholders. As part of this process, the Committee additionally oversaw a tender process in 2017 for the appointment of the Company’s secretary and administrator, as detailed later.
72 HVPE Annual Report and Accounts 2018
Investment Manager ReviewThe Board as a whole undertakes annual visits to the Investment Manager’s offices usually alternating between Boston and London. In May and November 2017, the Board visited the Investment Manager’s London office. As part of these visits, the MESPC received presentations from various operational teams and senior management of the Investment Manager regarding investment strategy and other matters relating to the Company’s affairs and discussed the conclusions of this review with the Investment Manager. The Board was satisfied with the performance of the Investment Manager with respect to investment returns and the overall level of service provided to the Company.
Changes of Secretary and AdministratorThe committee conducted a tender process in 2017 for the appointment of the Company’s secretary and administrator, a shortlist of firms which had the potential to meet the requirements identified by the committee was drawn up, and firms invited to tender were assessed against the following criteria:
/ / publicly traded company experience and client base;
/ / familiarity and experience with private equity as an asset class;
/ / regulatory advice and support;
/ / profile of the Company Secretarial team;
/ / any outsourcing arrangements to be utilised in servicing the Company;
/ / proposed Service Level Agreement terms;
/ / IT platform and controls environment; and
/ / fees and pricing structure.
Following this review, BNP Paribas Securities Services S.C.A was selected to provide company secretarial, compliance and administration services effective 11 May 2018.
Management Engagement and Service Provider ReviewThe Committee met in September 2017 and conducted a detailed review of the performance of all key service providers to the Company against the following criteria for the year under review:
/ / scope of service;
/ / key personnel;
/ / key results achieved for the Company;
/ / fees charged to the Company;
/ / breaches and errors in the year under review;
/ / cyber security; and
/ / IT Controls environment.
Governance and EffectivenessIn February 2018 the Committee conducted a review of its activities against its constitution and terms of reference in respect of the year under review.
Inside Information CommitteeAbout the CommitteeThe Committee was formed on 12 July 2016 to consider information which may need to be made public in order for the Company to comply with its obligations under the EU Market Abuse Regulation (“EU MAR”). It had no cause to meet in the year under review since discussion of any announcements which may have been required to be released under EU MAR took place at the Board level.
Board Structure and Committees continued

73 HVPE Annual Report and Accounts 2018
Govern
ance Rep
ort
Financial Statem
entsS
upplementary D
ataS
trategic Report
Statement of Compliance with the AIC Code of Corporate GovernanceThe directors place a large degree of importance on ensuring that high standards of corporate governance are maintained and have therefore chosen to comply with the provisions of the AIC Code of Corporate Governance for Investment Companies published in July 2016 (the “AIC Code”).
The Board of the Company has considered the principles and recommendations of the AIC Code by reference to the AIC Corporate Governance Guide for Investment Companies (“AIC Guide”). The AIC Code, as explained by the AIC Guide, addresses all the principles set out in the UK Corporate Governance Code April 2016 edition (the “UK Code”), as well as setting out additional principles and recommendations on issues that are of specific relevance to the Company.
The Board considers that reporting against the principles and recommendations of the AIC Code, and by reference to the AIC Guide (which incorporates the UK Code), will provide better information to shareholders. Copies of the AIC Code and the AIC Guide can be found at www.theaic.co.uk.
The Board has set out compliance with the AIC Code in the table below.
Principle No. Principle Details of compliance
1 The Chairman should be independent. The Chairman remains independent of the Investment Manager in line with this provision of the AIC Code.
2 A majority of the Board should be independent of the manager.
Six of the eight directors of the Company are independent of the Investment Manager in accordance with the recommendations of the AIC Code.
3 Directors should be submitted for re-election at regular intervals. Nomination for re-election should not be assumed but be based on disclosed procedures and continued satisfactory performance.
All directors submitted themselves for re-election in the year under review pursuant to the recommendations of the AIC Code.
4 The Board should have a policy on tenure, which is disclosed in the annual report.
The Board has not formalised a policy on tenure, which is not in accordance with the AIC code. This is because the Board would like to retain the flexibility to consider the balance of skills and experience of the Board as a whole in order to manage changes to the Board’s composition in accordance with the circumstances of the Company. The Board has agreed to keep the matter under review.
5 There should be full disclosure of information about the Board.
Biographies of all directors are included in this report. All conflicts of interest and remunerated association with any service provider have been disclosed in this report and the Board has a robust process in place to ensure that conflicts of interest are disclosed and appropriately managed.
The Committees recommended by the AIC Code have been established, save for a remuneration committee. The Board consider that given the Company’s structure it is appropriate for these issues to be considered by the full Board.
Corporate Governance

74 HVPE Annual Report and Accounts 2018
Principle No. Principle Details of compliance
6 The Board should aim to have a balance of skills, experience, length of service and knowledge of the Company.
The Board and Nomination Committee considered the composition of the Board and committees carefully in the year under review with a view to enhancing this further. As a result of this, Ms. Barnes was appointed in April 2017. The Board remains confident that the current balance of skills on the Board is appropriate for the Company’s requirements.
7 The Board should undertake a formal and rigorous annual evaluation of its own performance and that of its Committees and individual Directors.
Details of the evaluation of the Board’s performance may be found in the Directors’ Report.
8 Director remuneration should reflect their duties, responsibilities and the value of their time spent.
The Board considered directors remuneration in the year under review and fees were revised effective 1 October 2017.
9 The independent Directors should take the lead in the appointment of new Directors and the process should be disclosed in the annual report.
The independent directors of the Company took the lead in the two director search and selection processes which took place in the year under review.
The Board has not formalised a policy on diversity. The Board has renewed its commitment to appointing the best applicant for any Board positions becoming open and may use external search consultants if required to ensure that there is a strong and varied pool of applicants. The Board’s priority is to ensure that it is composed of directors with a broad balance of skills, experience and opinions.
10 Directors should be offered relevant training and induction.
An induction programme was drawn up following the appointment of Ms. Barnes and was reviewed by the Nomination Committee. All directors are able to request that training be arranged on any relevant subject matter.
11 The Chairman (and the Board) should be brought into the process of structuring a new launch at an early stage.
Not applicable in the year under review.
12 Boards and managers should operate in a supportive, co-operative and open environment.
The Board believes that the Investment Manager engaged in a supportive, co-operative and open way in the year under review.
13 The primary focus at regular Board meetings should be a review of investment performance and associated matters such as gearing, asset allocation, marketing/investor relations, peer group information and industry issues.
Board meetings during the year focussed on these matters.
Corporate Governance continued

75 HVPE Annual Report and Accounts 2018
Govern
ance Rep
ort
Financial Statem
entsS
upplementary D
ataS
trategic Report
Principle No. Principle Details of compliance
14 Boards should give sufficient attention to overall strategy.
A dedicated strategy meeting took place in November 2017.
15 The Board should regularly review the performance of, and contractual arrangements with, the manager (or executives of a self-managed Company).
A dedicated MESPC meeting took place to consider this matter, the conclusions of which are detailed in this report.
16 The Board should agree policies with the manager covering key operational issues.
Policies are in place covering key operational issues and the Investment Management Agreement in place between the Manager and the Board sets out matters which are reserved for the Board’s approval. Due to the structure of the Company it was not necessary to put in place policies on share trades, votes or soft commissions.
17 Boards should monitor the level of the share price discount or premium (if any) and, if desirable, take action to reduce it.
The Board actively monitored the level of the share price discount to NAV in the year under review. It regularly reviews and considers all options available. This is in line with the recommendations of the AIC Code.
18 The Board should monitor and evaluate other service providers.
The Management Engagement and Service Provider Committee conducted a review of all key service providers in the year under review. A process is in place to conduct an in-depth review of all the service providers, and in particular the Investment Manager, at least once a year.
19 The Board should regularly monitor the shareholder profile of the company and put in place a system for canvassing shareholder views and for communicating the Board’s views to shareholders.
The Board considers this at each quarterly meeting.
20 The Board should normally take responsibility for, and have a direct involvement in, the content of communications regarding major corporate issues even if the manager is asked to act as spokesman.
No major corporate issues arose in the year under review. However, communications about major corporate issues are always approved by the Board.
21 The Board should ensure that shareholders are provided with sufficient information for them to understand the risk/reward balance to which they are exposed by holding the shares.
This annual report contains the disclosures recommended in the AIC Code to enable shareholders to understand this.

76 HVPE Annual Report and Accounts 2018
The UK Code includes provisions relating to:
/ / the role of the chief executive;
/ / executive directors’ remuneration; and
/ / the need for an internal audit function.
For the reasons set out in the AIC Guide, and as explained in the UK Code, the Board considers these provisions not relevant to the position of the Company, being an externally-managed investment company. In particular, all of the Company’s day-to-day management and administrative functions are outsourced to third parties. As a result, the Company has no full time executive directors, no direct employees or internal operations. The Company has therefore not reported further in respect of these provisions.
This statement forms part of the directors’ report, starting on page 60.
Viability StatementPursuant to provision C.2.2 of the UK Code and Principle 21 of the AIC Code, the Board has assessed the viability of the Company over a three-year period from 31 January 2018. Whilst the Board has no reason to believe that the Company will not be viable over a longer period, it has chosen this period as this falls within the Board’s strategic horizon and within the Company’s expected investment lifecycle.
The Company’s investment objective is to generate superior shareholder returns through long-term capital appreciation by investing primarily in a diversified portfolio of private equity investments. The majority of the Company’s investments are in HarbourVest-managed private equity fund-of-funds, which have fund lives of 10-14 years.
While the Company’s investment lifecycle spans a time period of ten years or more, the Board focuses on a five-year time horizon when considering the strategic planning of the Company, as discussed on page 17. The strategic planning focuses on building a portfolio of long-term assets through capital allocation into a set of rolling five-year portfolio construction targets defined by investment state, geography, and strategy. While reviewed and updated annually, this rolling five-year process allows the Board a medium-term view of potential growth, projected
cash flow and potential future commitments under various economic scenarios.
As part of its strategic planning, the Board considered a model scenario that replicated the impact of the global financial crisis on the Company’s portfolio, which caused large NAV declines and a material reduction in realisations from underlying company investments. This severe downside scenario included projected returns and cash flows based on certain assumptions at least as significant as HVPE’s experience during 2008 and 2009. The Board concluded that new commitments would need to be materially reduced under this scenario, but that the Company’s cash balance and available credit facility would be sufficient to cover any capital requirements (as it was during the Global Financial Crisis). The results of these model scenarios showed that the Company would be able to withstand the impact of these scenarios occurring over the three year period.
The Board considers that a three-year period to 31 January 2021 is a more appropriate period of time to assess the Company’s viability as this reflects greater predictability of the Company’s cash flow and new commitments over that time period, and also reflects a typical minimum remaining term of the Company’s credit facility, which is a significant component in supporting the Company’s over commitment strategy. This three year period of time is further supported by the Rolling Coverage Ratio metric that the Investment Manager uses, as explained further on page 22.
The Board, in assessing the viability of the Company, has also paid particular attention to the principal risks faced by the Company as disclosed on pages 27 to 29. In addition, the Board has established a risk management framework, reviewed on a quarterly basis, which is intended to identify, measure, monitor, report and, where appropriate, mitigate the risks to the Company’s investment objective, including any liquidity or solvency issues. The Board does not consider any other risks to be principal risks as defined in the UK Code.
Based on its review, the Board has a reasonable expectation that the Company will be able to continue in operation and meet its liabilities as they fall due over a three year period to 31 January 2021.
Corporate Governance continued

77 HVPE Annual Report and Accounts 2018
Govern
ance Rep
ort
Financial Statem
entsS
upplementary D
ataS
trategic Report
Statement of Directors’ Responsibilities in Respect of the Financial StatementsThe directors are required to prepare financial statements for each financial year which give a true and fair view of the assets, liabilities, financial position and profit or loss of the Company in accordance with US GAAP at the end of the financial year and of the gain or loss for that period. In preparing those financial statements, the directors are required to:
/ / select suitable accounting policies and apply them consistently;
/ / make judgements and estimates that are reasonable and prudent;
/ / state whether applicable accounting standards have been followed subject to any material departures disclosed and explained in the financial statements; and
/ / prepare the financial statements on the going concern basis unless it is inappropriate to presume that the Company will continue in business.
The directors are responsible for keeping proper accounting records which disclose with reasonable accuracy at any time the financial position of the Company and to enable them to ensure that the financial statements have been properly prepared in accordance with The Companies (Guernsey) Law, 2008 (as amended). They are also responsible for safeguarding the assets of the Company and hence for taking reasonable steps for the prevention and detection of fraud and other irregularities.
The directors are responsible for ensuring that the Annual Report and Financial Statements include the information required by the Listing Rules and the Disclosure Guidance and Transparency Rules of the Financial Conduct Authority (together “the Rules”). They are also responsible for ensuring that the Company complies with the provisions of the Rules which, with regard to corporate governance, require the Company to disclose how it has applied the principles, and complied with the provisions, of the corporate governance code applicable to the Company.
Disclosure of Information to the AuditorSo far as each of the directors is aware, there is no relevant audit information of which the Company’s auditor is unaware, and each has taken all the steps they ought to have taken as a director to make themself aware of any relevant audit information and to establish that the Company’s auditor is aware of that information.
Responsibility StatementThe Board of directors, as identified on pages 58 and 59, jointly and severally confirm that, to the best of their knowledge:
/ / this report includes a fair review of the development and performance of the business and the position of the Company and the undertakings included in the consolidation taken as a whole, together with a description of the principal risks and uncertainties that they face;
/ / the Financial Statements, prepared in accordance with US GAAP, give a true and fair view of the assets, liabilities, financial position and profits of the Company and its undertakings;
/ / the Annual Report and Financial Statements taken as a whole are fair, balanced and understandable and provide the information necessary for shareholders to assess the Company and its undertaking’s performance, business model and strategy; and
/ / the Annual Report and Financial Statements includes information required by the Financial Conduct Authority for the purpose of ensuring that the Company and its undertakings comply with the provisions of the Listing Rules and the Disclosure Guidance and Transparency Rules of the UK Listing Authority.
By order of the Board
Andrew MooreDirector
Keith CorbinChairman of the Audit Committee 10 May 2018

78 HVPE Annual Report and Accounts 2018
An ordinary resolution for the approval of this Directors’ Remuneration Report will be put to shareholders at the forthcoming Annual General Meeting to be held in 2018. Due to the Company’s domicile and structure there is no requirement to include a remuneration report and this report is provided voluntarily by the Board of the Company.
There are no long term incentive schemes provided by the Company and no performance fees are paid to directors.
No director has a service contract with the Company, however, each director is appointed by a letter of appointment which sets out the terms of the appointment.
Directors are remunerated in the form of fees, payable quarterly in arrears, to the director personally. The table below details the fees paid to each director of the Company for the years ended 31 January 2018 and 31 January 2017. The Company’s Articles limit the aggregate fees payable to directors to a maximum of $750,000 per annum.
Under the Company’s Articles, directors are entitled to additional ad-hoc remuneration for project work outside of the scope of their ordinary duties. No such payments were made in the year ending 31 January 2018.
Director RoleFees paid for the 12 months ended 31 January 2018
Fees paid for the 12 months ended 31 January 2017
Sir Michael Bunbury Chairman, Independent Director
$211,552 $260,000
Keith B. Corbin Audit Committee Chairman, Senior Independent Director
$68,080 $66,000
Francesca Barnes Independent Director $46,642 NilAlan C. Hodson Independent Director $62,266 $60,500Andrew W. Moore Independent Director $62,266 $60,500Jean-Bernard Schmidt Independent Director $62,266 $60,500D. Brooks Zug Director Nil NilPeter G. Wilson Director Nil Nil
Total $513,074 $507,500
Role
Director fees payable with effect from 1 January 2018 (annualised)1
Director fees payable with effect from 1 October 2017 (annualised)1
Director fees payable from 1 February to 30 September 2017 (annualised)
Chairman, Independent Director
£140,000 £160,000 $198,000 plus $12,000 expenses.
Audit Committee Chairman, Senior Independent Director
£55,000 £55,000 $66,000
Independent Director £50,000 £50,000 $60,500
1 The Board resolved to pay directors’ fees in sterling from 1 October 2017 onwards.
Signed on behalf of the Board by:
Andrew Moore Keith CorbinDirector Chairman of the Audit Committee 10 May 2018
Directors’ Remuneration Report

79 HVPE Annual Report and Accounts 2018
Governance R
eportFin
ancial Statem
entsS
upplementary D
ataS
trategic Report
OpinionWe have audited the Financial Statements of HarbourVest Global Private Equity Limited (the “Company”) and its subsidiaries (together the “Group”) for the year ended 31 January 2018, which comprise the Consolidated Statement of Assets and Liabilities, the Consolidated Statement of Operations, Consolidated Statement of Changes in Net Assets, the Consolidated Statement of Cash Flows, the Consolidated Schedule of Investments, and the related notes 1 to 11, including a summary of significant accounting policies. The financial reporting framework that has been applied in their preparation is applicable law and United States Generally Accepted Accounting Principles (“US GAAP”).
In our opinion, the Financial Statements:
/ / give a true and fair view of the state of the Group’s affairs as at 31 January 2018 and of its profit for the year then ended;
/ / have been properly prepared in accordance with US GAAP; and
/ / have been properly prepared in accordance with the requirements of the Companies (Guernsey) Law, 2008.
Basis for OpinionWe conducted our audit in accordance with International Standards on Auditing (UK) (“ISAs (UK)”) and applicable law. Our responsibilities under those standards are further described in the “Auditor’s responsibilities for the audit of the Financial Statements” section of our report below. We are independent of the Group in accordance with the ethical requirements that are relevant to our audit of the Financial Statements in the UK, including the FRC’s Ethical Standard as applied to listed entities, and we have fulfilled our other ethical responsibilities in accordance with these requirements.
We believe that the audit evidence we have obtained is sufficient and appropriate to provide a basis for our opinion.
Use of Our ReportThis report is made solely to the Company’s members, as a body, in accordance with Section 262 of the Companies (Guernsey) Law, 2008. Our audit work has been undertaken so that we might state to the Company’s members those matters we are required to state to them in an auditor’s report and for no other purpose. To the fullest extent permitted by law, we do not accept or
Independent Auditor’s Report To the Members of HarbourVest Global Private Equity Limited
assume responsibility to anyone other than the Company and the Company’s members as a body, for our audit work, for this report, or for the opinions we have formed.
Conclusions Relating to Principal Risks, Going Concern and Viability StatementWe have nothing to report in respect of the following information in the Annual Report, in relation to which the ISAs (UK) require us to report to you whether we have anything material to add or draw attention to:
/ / the disclosures in the Annual Report set out on pages 27 to 29 that describe the principal risks and explain how they are being managed or mitigated;
/ / the directors’ confirmation set out on pages 27 to 29 in the Annual Report that they have carried out a robust assessment of the principal risks facing the entity, including those that would threaten its business model, future performance, solvency or liquidity;
/ / the directors’ statement set out on page 65 in the Financial Statements about whether they considered it appropriate to adopt the going concern basis of accounting in preparing them, and their identification of any material uncertainties to the entity’s ability to continue to do so over a period of at least twelve months from the date of approval of the Financial Statements;
/ / whether the directors’ statement in relation to going concern required under the Listing Rules is materially inconsistent with our knowledge obtained in the audit; or
/ / the Directors’ explanation set out on page 76 in the Annual Report as to how they have assessed the prospects of the entity, over what period they have done so and why they consider that period to be appropriate, and their statement as to whether they have a reasonable expectation that the entity will be able to continue in operation and meet its liabilities as they fall due over the period of their assessment, including any related disclosures drawing attention to any necessary qualifications or assumptions.
Overview of our Audit ApproachRisk of material misstatement:We have determined that misstatement or manipulation of the valuation of the Group’s investments in the underlying funds/HarbourVest Direct Investment funds is the only key audit matter for the current year.

80 HVPE Annual Report and Accounts 2018
Audit Scope:We have audited the Financial Statements of HarbourVest Global Private Equity Limited (the “Company”) and its subsidiaries (together the “Group”) for the year ended 31 January 2018.
The audit was led from Guernsey. The audit team mainly included individuals from the Guernsey office of Ernst & Young LLP and from the Boston office of Ernst & Young LLP in the US, and utilised private equity valuation specialists from the Boston office of Ernst & Young LLP in the US. We operated as an integrated audit team and we performed audit procedures and responded to the risk identified as described below.
Materiality:Overall materiality of $33.6 million (2017: $29.5 million), which is 2 per cent of net assets.
Key Audit MattersKey audit matters are those matters that, in our professional judgment, were of most significance in our audit of the Financial Statements of the current year and include the most significant assessed risks of material misstatement (whether or not due to fraud) that we identified. These matters included those which had the greatest effect on the overall audit strategy, the allocation of resources in the audit and directing the efforts of the engagement team. These matters were addressed in the context of our audit of the Financial Statements as a whole, and in our opinion thereon, and we do not provide a separate opinion on these matters.
Risk Misstatement or manipulation of the valuation of the Group’s investments ($1,452 million; 2017 $1,296 million).
/ / Risk that the valuation of the Group’s investments at 31 January 2018, which comprise 84.7% (2017: 87.9%) of net assets, is materially misstated.
/ / The valuation of the investments is the principal driver of the Group’s net asset value and hence incorrect valuations would have a significant impact on the net asset value of the Group.
Our response to the risk Our response comprised the performance of the following procedures:
/ / Confirmed our understanding of the Group’s processes and methodologies, including the use of the practical expedient per Accounting Standard Codification (ASC) Topic 820 Fair Value Measurement, for valuing investments held by the Group in the underlying investee funds;
/ / Agreeing the individual fair values of each HarbourVest investment fund the Group has invested into to its underlying audited Net Asset Value in the corresponding financial statements as at 31 December 2017 which, prior to adjustments, formed the basis for the Group’s carrying amount as at 31 January 2018 by using the practical expedient;
/ / Obtaining a schedule of all adjustments made to those audited Net Asset Values between 1 January 2018 and 31 January 2018, and:
Independent Auditor’s Report continued
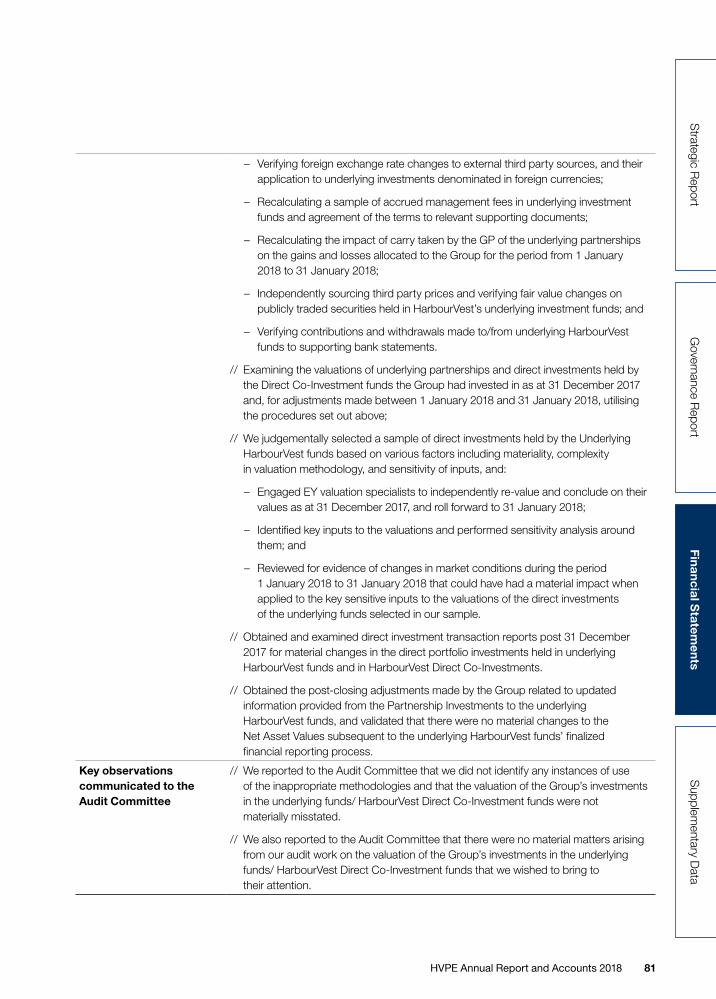
81 HVPE Annual Report and Accounts 2018
Governance R
eportFin
ancial Statem
entsS
upplementary D
ataS
trategic Report
– Verifying foreign exchange rate changes to external third party sources, and their application to underlying investments denominated in foreign currencies;
– Recalculating a sample of accrued management fees in underlying investment funds and agreement of the terms to relevant supporting documents;
– Recalculating the impact of carry taken by the GP of the underlying partnerships on the gains and losses allocated to the Group for the period from 1 January 2018 to 31 January 2018;
– Independently sourcing third party prices and verifying fair value changes on publicly traded securities held in HarbourVest’s underlying investment funds; and
– Verifying contributions and withdrawals made to/from underlying HarbourVest funds to supporting bank statements.
/ / Examining the valuations of underlying partnerships and direct investments held by the Direct Co-Investment funds the Group had invested in as at 31 December 2017 and, for adjustments made between 1 January 2018 and 31 January 2018, utilising the procedures set out above;
/ / We judgementally selected a sample of direct investments held by the Underlying HarbourVest funds based on various factors including materiality, complexity in valuation methodology, and sensitivity of inputs, and:
– Engaged EY valuation specialists to independently re-value and conclude on their values as at 31 December 2017, and roll forward to 31 January 2018;
– Identified key inputs to the valuations and performed sensitivity analysis around them; and
– Reviewed for evidence of changes in market conditions during the period 1 January 2018 to 31 January 2018 that could have had a material impact when applied to the key sensitive inputs to the valuations of the direct investments of the underlying funds selected in our sample.
/ / Obtained and examined direct investment transaction reports post 31 December 2017 for material changes in the direct portfolio investments held in underlying HarbourVest funds and in HarbourVest Direct Co-Investments.
/ / Obtained the post-closing adjustments made by the Group related to updated information provided from the Partnership Investments to the underlying HarbourVest funds, and validated that there were no material changes to the Net Asset Values subsequent to the underlying HarbourVest funds’ finalized financial reporting process.
Key observations communicated to the Audit Committee
/ / We reported to the Audit Committee that we did not identify any instances of use of the inappropriate methodologies and that the valuation of the Group’s investments in the underlying funds/ HarbourVest Direct Co-Investment funds were not materially misstated.
/ / We also reported to the Audit Committee that there were no material matters arising from our audit work on the valuation of the Group’s investments in the underlying funds/ HarbourVest Direct Co-Investment funds that we wished to bring to their attention.

82 HVPE Annual Report and Accounts 2018
Independent Auditor’s Report continued
An Overview of the Scope of Our AuditTailoring the ScopeOur assessment of audit risk, our evaluation of materiality and our allocation of performance materiality determine our audit scope for the Group. This enables us to form an opinion on the Financial Statements. We take into account size, risk profile, the organisation of the Group and effectiveness of controls, including controls and changes in the business environment when assessing the level of work to be performed. All audit work was performed directly by the audit engagement team.
The audit was led from Guernsey and utilised audit team members from the Boston office of Ernst & Young LLP in the US. We operated as an integrated audit team across the two jurisdictions and we performed audit procedures and responded to the risk identified as described above.
The Group comprises the Company and its five wholly owned subsidiaries as explained in note 2 to the financial statements. The Company, each subsidiary and the consolidation are subject to full scope audit procedures. Other than the investments which the Company holds directly, the subsidiaries own the investments, which are set out in the consolidated schedule of investments, and on which we performed our work on valuation.
Our Application of MaterialityWe apply the concept of materiality in planning and performing the audit, in evaluating the effect of identified misstatements on the audit and in forming our audit opinion.
Materiality“Materiality” is the magnitude of omissions or misstatements that, individually or in aggregate, could reasonably be expected to influence the economic decisions of the users of the Financial Statements. Materiality provides a basis for determining the nature and extent of our audit procedures.
We determined planning materiality for the Group to be $33.6 million (2017: $29.5 million), which is 2 per cent (2017: 2 per cent) of net asset value. This provided a basis for determining the nature, timing and extent of risk assessment procedures, identifying and assessing the risk of material misstatement and determining the nature, timing and extent of further audit procedures. We used net asset value as a basis for determining planning materiality because the Group’s primary performance measures for internal and external reporting are based on net asset value.
Performance Materiality“Performance materiality” is the application of materiality at the individual account or balance level. It is set at an amount to reduce to an appropriately low level the probability that the aggregate of uncorrected and undetected misstatements exceeds materiality.
On the basis of our risk assessments, together with our assessment of the Group’s overall control environment, our judgement was that overall performance materiality (i.e. our tolerance for misstatement in an individual account or balance) for the Group should be 75 per cent of materiality, namely $25.2 million (2017: 75 per cent. of materiality, namely $22.1 million). Our objective in adopting this approach was to ensure that total uncorrected and undetected audit differences in the Financial Statements did not exceed our materiality level.
Reporting Threshold“Reporting threshold” is an amount below which identified misstatements are considered as being clearly trivial.
We agreed with the Audit Committee that we would report to them all audit differences in excess of $1.7 million (2017: $1.5 million) which is set at 5 per cent of planning materiality, as well as differences below that threshold that, in our view, warranted reporting on qualitative grounds.
We evaluated any uncorrected misstatements against both the quantitative measures of materiality discussed above and in light of other relevant qualitative considerations in forming our opinion.
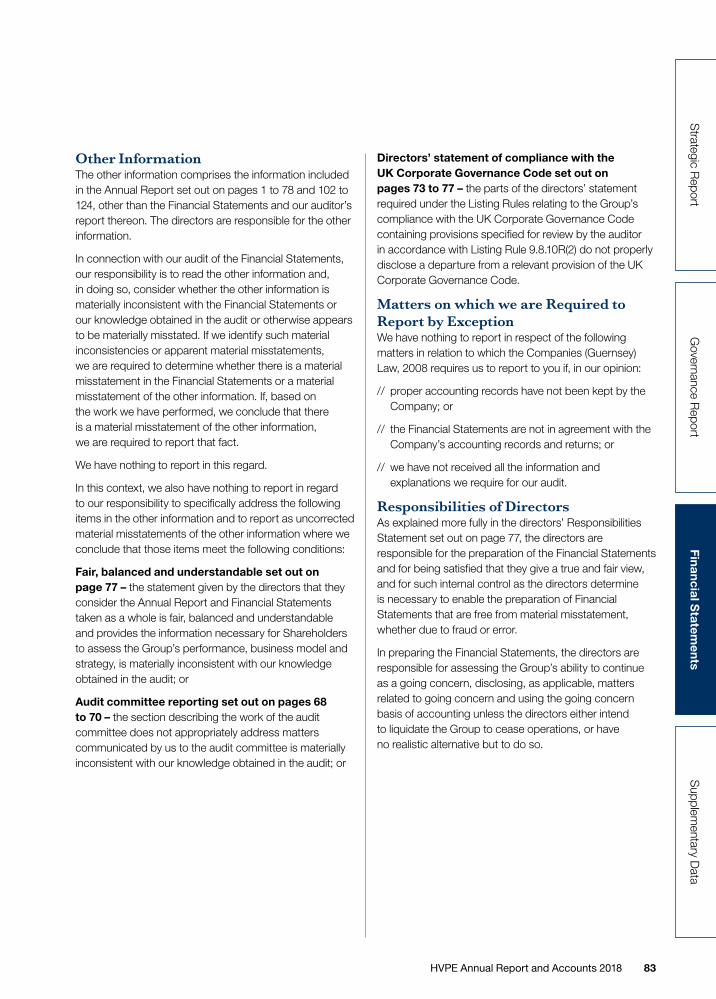
83 HVPE Annual Report and Accounts 2018
Governance R
eportFin
ancial Statem
entsS
upplementary D
ataS
trategic Report
Other Information The other information comprises the information included in the Annual Report set out on pages 1 to 78 and 102 to 124, other than the Financial Statements and our auditor’s report thereon. The directors are responsible for the other information.
In connection with our audit of the Financial Statements, our responsibility is to read the other information and, in doing so, consider whether the other information is materially inconsistent with the Financial Statements or our knowledge obtained in the audit or otherwise appears to be materially misstated. If we identify such material inconsistencies or apparent material misstatements, we are required to determine whether there is a material misstatement in the Financial Statements or a material misstatement of the other information. If, based on the work we have performed, we conclude that there is a material misstatement of the other information, we are required to report that fact.
We have nothing to report in this regard.
In this context, we also have nothing to report in regard to our responsibility to specifically address the following items in the other information and to report as uncorrected material misstatements of the other information where we conclude that those items meet the following conditions:
Fair, balanced and understandable set out on page 77 – the statement given by the directors that they consider the Annual Report and Financial Statements taken as a whole is fair, balanced and understandable and provides the information necessary for Shareholders to assess the Group’s performance, business model and strategy, is materially inconsistent with our knowledge obtained in the audit; or
Audit committee reporting set out on pages 68 to 70 – the section describing the work of the audit committee does not appropriately address matters communicated by us to the audit committee is materially inconsistent with our knowledge obtained in the audit; or
Directors’ statement of compliance with the UK Corporate Governance Code set out on pages 73 to 77 – the parts of the directors’ statement required under the Listing Rules relating to the Group’s compliance with the UK Corporate Governance Code containing provisions specified for review by the auditor in accordance with Listing Rule 9.8.10R(2) do not properly disclose a departure from a relevant provision of the UK Corporate Governance Code.
Matters on which we are Required to Report by ExceptionWe have nothing to report in respect of the following matters in relation to which the Companies (Guernsey) Law, 2008 requires us to report to you if, in our opinion:
/ / proper accounting records have not been kept by the Company; or
/ / the Financial Statements are not in agreement with the Company’s accounting records and returns; or
/ / we have not received all the information and explanations we require for our audit.
Responsibilities of DirectorsAs explained more fully in the directors’ Responsibilities Statement set out on page 77, the directors are responsible for the preparation of the Financial Statements and for being satisfied that they give a true and fair view, and for such internal control as the directors determine is necessary to enable the preparation of Financial Statements that are free from material misstatement, whether due to fraud or error.
In preparing the Financial Statements, the directors are responsible for assessing the Group’s ability to continue as a going concern, disclosing, as applicable, matters related to going concern and using the going concern basis of accounting unless the directors either intend to liquidate the Group to cease operations, or have no realistic alternative but to do so.

84 HVPE Annual Report and Accounts 2018
Independent Auditor’s Report continued
Auditor’s Responsibilities for the Audit of the Financial Statements Our objectives are to obtain reasonable assurance about whether the Financial Statements as a whole are free from material misstatement, whether due to fraud or error, and to issue an auditor’s report that includes our opinion. Reasonable assurance is a high level of assurance, but is not a guarantee that an audit conducted in accordance with ISAs (UK) will always detect a material misstatement when it exists. Misstatements can arise from fraud or error and are considered material if, individually or in the aggregate, they could reasonably be expected to influence the economic decisions of users taken on the basis of these Financial Statements.
A further description of our responsibilities for the audit of the Financial Statements is located on the Financial Reporting Council’s website at https://www.frc.org.uk/auditorsresponsibilities. This description forms part of our auditor’s report.
David Robert John Moore, ACAFor and on behalf of Ernst & Young LLPGuernsey, Channel Islands10 May 2018
Notes:The maintenance and integrity of the Company’s website is the sole responsibility of the Directors; the work carried out by the auditors does not involve consideration of these matters and, accordingly, the auditor accepts no responsibility for any changes that may have occurred to the Financial Statements since they were initially presented on the website. Legislation in Guernsey governing the preparation and dissemination of financial statements may differ from legislation in other jurisdictions.

85 HVPE Annual Report and Accounts 2018
Governance R
eportFin
ancial Statem
entsS
upplementary D
ataS
trategic Report
Independent Auditor’s Report To the Directors of HarbourVest Global Private Equity Limited
We have audited the accompanying consolidated financial statements of HarbourVest Global Private Equity Limited (the “Company”) and its subsidiaries (together the “Group”), which comprise the consolidated statement of assets and liabilities, including the consolidated schedule of investments, as at 31 January 2018, and the related consolidated statements of operations, changes in net assets, and cash flows for the year then ended, and the related notes to the financial statements.
Management’s Responsibility for the Financial StatementsManagement is responsible for the preparation and fair presentation of these financial statements in conformity with United States Generally Accepted Accounting Principles (‘US GAAP’); this includes the design, implementation, and maintenance of internal control relevant to the preparation and fair presentation of financial statements that are free of material misstatement, whether due to fraud or error.
Auditor’s ResponsibilityOur responsibility is to express an opinion on these financial statements based on our audit. We conducted our audit in accordance with auditing standards generally accepted in the United States. Those standards require that we plan and perform the audit to obtain reasonable assurance about whether the financial statements are free of material misstatement.
An audit involves performing procedures to obtain audit evidence about the amounts and disclosures in the financial statements. The procedures selected depend on the auditor’s judgment, including the assessment of the risks of material misstatement of the financial statements, whether due to fraud or error. In making those risk assessments, the auditor considers internal
control relevant to the Company’s preparation and fair presentation of the financial statements in order to design audit procedures that are appropriate in the circumstances, but not for the purpose of expressing an opinion on the effectiveness of the Company’s internal control. Accordingly, we express no such opinion. An audit also includes evaluating the appropriateness of accounting policies used and the reasonableness of significant accounting estimates made by management, as well as evaluating the overall presentation of the financial statements.
We believe that the audit evidence we have obtained is sufficient and appropriate to provide a basis for our audit opinion.
OpinionIn our opinion, the financial statements referred to above present fairly, in all material respects, the consolidated financial position of HarbourVest Global Private Equity Limited at 31 January 2018, and the consolidated results of its operations, changes in its net assets, and its cash flows for the year then ended, in conformity with United States Generally Accepted Accounting Principles.
Ernst & Young LLPGuernsey, Channel Islands10 May 2018

86 HVPE Annual Report and Accounts 2018
In US Dollars 2018 2017
ASSETSInvestments (Note 4) 1,452,215,345 1,295,753,465Cash and equivalents 256,961,145 175,195,209Other assets 6,790,179 5,275,923
Total assets 1,715,966,669 1,476,224,597
LIABILITIESAccounts payable and accrued expenses 1,872,066 1,119,843Accounts payable to HarbourVest Advisers L.P. (Note 9) 227,767 246,933
Total liabilities 2,099,833 1,366,776
Commitments (Note 5)
NET ASSETS $1,713,866,836 $1,474,857,821
NET ASSETS CONSIST OFShares, Unlimited shares authorised, 79,862,486 shares issued and outstanding at 31 January 2018 and 2017, no par value 1,713,866,836 1,474,857,821
NET ASSETS $1,713,866,836 $1,474,857,821
Net asset value per share $21.46 $18.47
The accompanying notes are an integral part of the consolidated financial statements.
The Audited Consolidated Financial Statements on pages 86 to 101 were approved by the Board on 10 May 2018 and were signed on its behalf by:
Andrew Moore Keith CorbinDirector Chairman of the Audit Committee
Consolidated Statements of Assets and LiabilitiesAt 31 January 2018 and 2017

87 HVPE Annual Report and Accounts 2018
Governance R
eportFin
ancial Statem
entsS
upplementary D
ataS
trategic Report
In US Dollars 2018 2017
REALISED AND UNREALISED GAINS (LOSSES) ON INVESTMENTSNet realised gain (loss) on investments 157,395,016 88,816,643Net change in unrealised appreciation (depreciation) on investments 91,527,458 58,688,595
NET GAIN ON INVESTMENTS 248,922,474 147,505,238
INVESTMENT INCOMEInterest from cash and equivalents 2,068,790 982,036
EXPENSESNon-utilisation fees (Note 6) 5,829,861 4,713,889Investment services (Note 3) 1,457,264 1,112,274Management fees (Note 3) 1,410,379 1,735,159Financing expenses 1,300,594 1,237,357Professional fees 658,745 629,155Directors’ fees and expenses (Note 9) 580,491 572,744Tax expenses 67,636 250,546Non-recurring listing expenses (Note 1) – 12,710Other expenses 677,279 671,390
Total expenses 11,982,249 10,935,224
NET INVESTMENT LOSS (9,913,459) (9,953,188)
NET INCREASE IN NET ASSETS RESULTING FROM OPERATIONS $239,009,015 $137,552,050
The accompanying notes are an integral part of the consolidated financial statements.
Consolidated Statements of OperationsFor the Years Ended 31 January 2018 and 2017

88 HVPE Annual Report and Accounts 2018
In US Dollars 2018 2017
INCREASE IN NET ASSETS FROM OPERATIONSNet realised gain (loss) on investments 157,395,016 88,816,643Net change in unrealised appreciation (depreciation) 91,527,458 58,688,595Net investment loss (9,913,459) (9,953,188)
Net increase in net assets resulting from operations 239,009,015 137,552,050
NET ASSETS AT BEGINNING OF YEAR 1,474,857,821 1,337,305,771
NET ASSETS AT END OF YEAR $1,713,866,836 $1,474,857,821
The accompanying notes are an integral part of the consolidated financial statements.
Consolidated Statements of Changes in Net AssetsFor the Years Ended 31 January 2018 and 2017
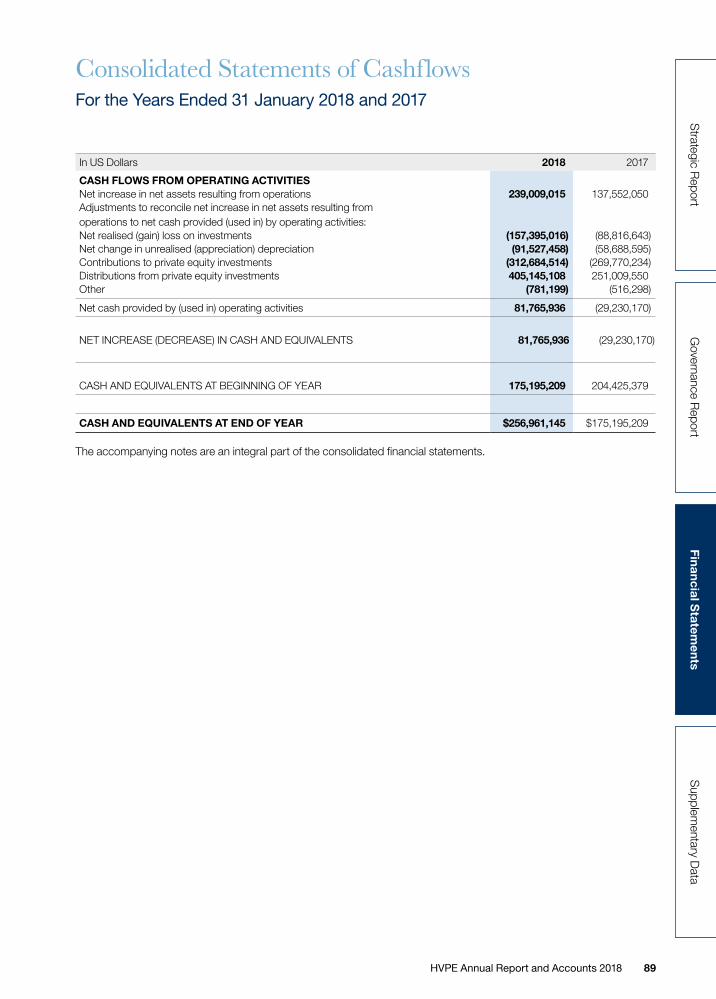
89 HVPE Annual Report and Accounts 2018
Governance R
eportFin
ancial Statem
entsS
upplementary D
ataS
trategic Report
In US Dollars 2018 2017
CASH FLOWS FROM OPERATING ACTIVITIESNet increase in net assets resulting from operations 239,009,015 137,552,050Adjustments to reconcile net increase in net assets resulting from operations to net cash provided (used in) by operating activities:Net realised (gain) loss on investments (157,395,016) (88,816,643)Net change in unrealised (appreciation) depreciation (91,527,458) (58,688,595)Contributions to private equity investments (312,684,514) (269,770,234)Distributions from private equity investments 405,145,108 251,009,550Other (781,199) (516,298)
Net cash provided by (used in) operating activities 81,765,936 (29,230,170)
NET INCREASE (DECREASE) IN CASH AND EQUIVALENTS 81,765,936 (29,230,170)
CASH AND EQUIVALENTS AT BEGINNING OF YEAR 175,195,209 204,425,379
CASH AND EQUIVALENTS AT END OF YEAR $256,961,145 $175,195,209
The accompanying notes are an integral part of the consolidated financial statements.
Consolidated Statements of CashflowsFor the Years Ended 31 January 2018 and 2017
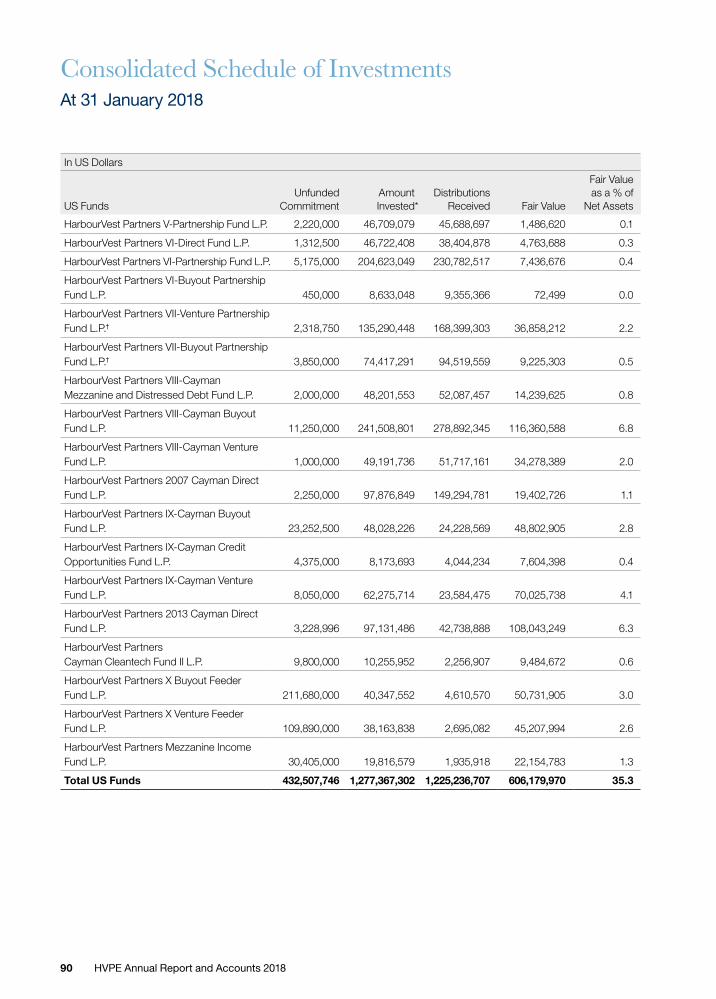
90 HVPE Annual Report and Accounts 2018
In US Dollars
US FundsUnfunded
CommitmentAmount Invested*
Distributions Received Fair Value
Fair Value as a % of
Net Assets
HarbourVest Partners V-Partnership Fund L.P. 2,220,000 46,709,079 45,688,697 1,486,620 0.1
HarbourVest Partners VI-Direct Fund L.P. 1,312,500 46,722,408 38,404,878 4,763,688 0.3
HarbourVest Partners VI-Partnership Fund L.P. 5,175,000 204,623,049 230,782,517 7,436,676 0.4
HarbourVest Partners VI-Buyout Partnership Fund L.P. 450,000 8,633,048 9,355,366 72,499 0.0
HarbourVest Partners VII-Venture Partnership Fund L.P.† 2,318,750 135,290,448 168,399,303 36,858,212 2.2
HarbourVest Partners VII-Buyout Partnership Fund L.P.† 3,850,000 74,417,291 94,519,559 9,225,303 0.5
HarbourVest Partners VIII-Cayman Mezzanine and Distressed Debt Fund L.P. 2,000,000 48,201,553 52,087,457 14,239,625 0.8
HarbourVest Partners VIII-Cayman Buyout Fund L.P. 11,250,000 241,508,801 278,892,345 116,360,588 6.8
HarbourVest Partners VIII-Cayman Venture Fund L.P. 1,000,000 49,191,736 51,717,161 34,278,389 2.0
HarbourVest Partners 2007 Cayman Direct Fund L.P. 2,250,000 97,876,849 149,294,781 19,402,726 1.1
HarbourVest Partners IX-Cayman Buyout Fund L.P. 23,252,500 48,028,226 24,228,569 48,802,905 2.8
HarbourVest Partners IX-Cayman Credit Opportunities Fund L.P. 4,375,000 8,173,693 4,044,234 7,604,398 0.4
HarbourVest Partners IX-Cayman Venture Fund L.P. 8,050,000 62,275,714 23,584,475 70,025,738 4.1
HarbourVest Partners 2013 Cayman Direct Fund L.P. 3,228,996 97,131,486 42,738,888 108,043,249 6.3
HarbourVest Partners Cayman Cleantech Fund II L.P. 9,800,000 10,255,952 2,256,907 9,484,672 0.6
HarbourVest Partners X Buyout Feeder Fund L.P. 211,680,000 40,347,552 4,610,570 50,731,905 3.0
HarbourVest Partners X Venture Feeder Fund L.P. 109,890,000 38,163,838 2,695,082 45,207,994 2.6
HarbourVest Partners Mezzanine Income Fund L.P. 30,405,000 19,816,579 1,935,918 22,154,783 1.3
Total US Funds 432,507,746 1,277,367,302 1,225,236,707 606,179,970 35.3
Consolidated Schedule of InvestmentsAt 31 January 2018
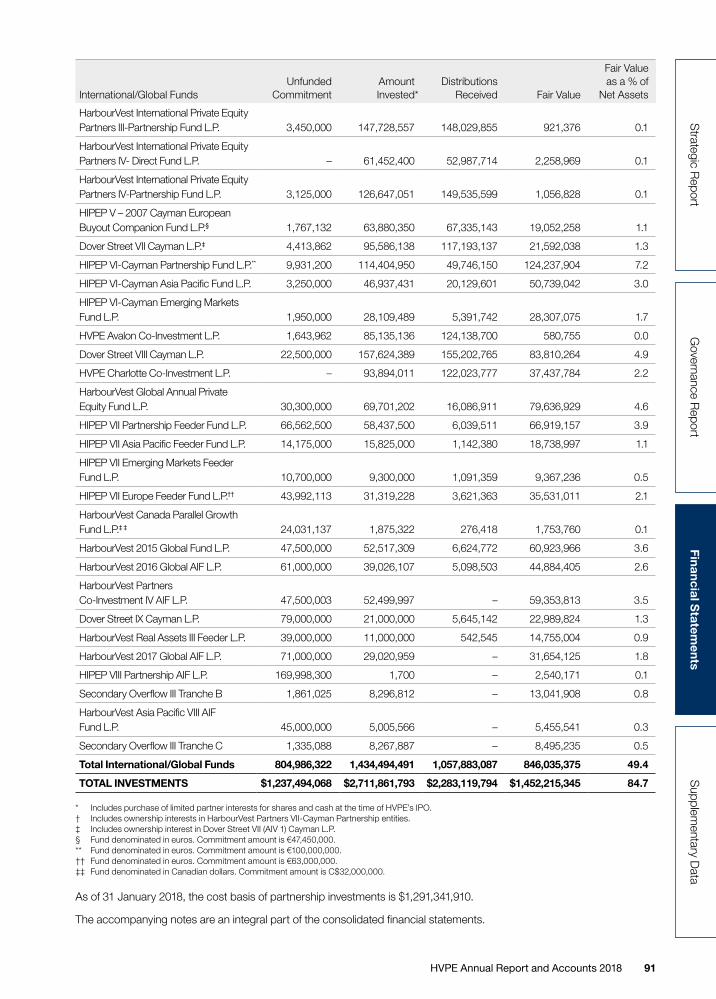
91 HVPE Annual Report and Accounts 2018
Governance R
eportFin
ancial Statem
entsS
upplementary D
ataS
trategic Report
International/Global FundsUnfunded
CommitmentAmount Invested*
Distributions Received Fair Value
Fair Value as a % of
Net Assets
HarbourVest International Private Equity Partners III-Partnership Fund L.P. 3,450,000 147,728,557 148,029,855 921,376 0.1
HarbourVest International Private Equity Partners IV- Direct Fund L.P. – 61,452,400 52,987,714 2,258,969 0.1
HarbourVest International Private Equity Partners IV-Partnership Fund L.P. 3,125,000 126,647,051 149,535,599 1,056,828 0.1
HIPEP V – 2007 Cayman European Buyout Companion Fund L.P.§ 1,767,132 63,880,350 67,335,143 19,052,258 1.1
Dover Street VII Cayman L.P.‡ 4,413,862 95,586,138 117,193,137 21,592,038 1.3
HIPEP VI-Cayman Partnership Fund L.P.** 9,931,200 114,404,950 49,746,150 124,237,904 7.2
HIPEP VI-Cayman Asia Pacific Fund L.P. 3,250,000 46,937,431 20,129,601 50,739,042 3.0
HIPEP VI-Cayman Emerging Markets Fund L.P. 1,950,000 28,109,489 5,391,742 28,307,075 1.7
HVPE Avalon Co-Investment L.P. 1,643,962 85,135,136 124,138,700 580,755 0.0
Dover Street VIII Cayman L.P. 22,500,000 157,624,389 155,202,765 83,810,264 4.9
HVPE Charlotte Co-Investment L.P. – 93,894,011 122,023,777 37,437,784 2.2
HarbourVest Global Annual Private Equity Fund L.P. 30,300,000 69,701,202 16,086,911 79,636,929 4.6
HIPEP VII Partnership Feeder Fund L.P. 66,562,500 58,437,500 6,039,511 66,919,157 3.9
HIPEP VII Asia Pacific Feeder Fund L.P. 14,175,000 15,825,000 1,142,380 18,738,997 1.1
HIPEP VII Emerging Markets Feeder Fund L.P. 10,700,000 9,300,000 1,091,359 9,367,236 0.5
HIPEP VII Europe Feeder Fund L.P.†† 43,992,113 31,319,228 3,621,363 35,531,011 2.1
HarbourVest Canada Parallel Growth Fund L.P.‡ ‡ 24,031,137 1,875,322 276,418 1,753,760 0.1
HarbourVest 2015 Global Fund L.P. 47,500,000 52,517,309 6,624,772 60,923,966 3.6
HarbourVest 2016 Global AIF L.P. 61,000,000 39,026,107 5,098,503 44,884,405 2.6
HarbourVest Partners Co-Investment IV AIF L.P. 47,500,003 52,499,997 – 59,353,813 3.5
Dover Street IX Cayman L.P. 79,000,000 21,000,000 5,645,142 22,989,824 1.3
HarbourVest Real Assets III Feeder L.P. 39,000,000 11,000,000 542,545 14,755,004 0.9
HarbourVest 2017 Global AIF L.P. 71,000,000 29,020,959 – 31,654,125 1.8
HIPEP VIII Partnership AIF L.P. 169,998,300 1,700 – 2,540,171 0.1
Secondary Overflow III Tranche B 1,861,025 8,296,812 – 13,041,908 0.8
HarbourVest Asia Pacific VIII AIF Fund L.P. 45,000,000 5,005,566 – 5,455,541 0.3
Secondary Overflow III Tranche C 1,335,088 8,267,887 – 8,495,235 0.5
Total International/Global Funds 804,986,322 1,434,494,491 1,057,883,087 846,035,375 49.4
TOTAL INVESTMENTS $1,237,494,068 $2,711,861,793 $2,283,119,794 $1,452,215,345 84.7
* Includes purchase of limited partner interests for shares and cash at the time of HVPE’s IPO.† Includes ownership interests in HarbourVest Partners VII-Cayman Partnership entities.‡ Includes ownership interest in Dover Street VII (AIV 1) Cayman L.P.§ Fund denominated in euros. Commitment amount is €47,450,000.** Fund denominated in euros. Commitment amount is €100,000,000.†† Fund denominated in euros. Commitment amount is €63,000,000.‡‡ Fund denominated in Canadian dollars. Commitment amount is C$32,000,000.
As of 31 January 2018, the cost basis of partnership investments is $1,291,341,910.
The accompanying notes are an integral part of the consolidated financial statements.

92 HVPE Annual Report and Accounts 2018
In US Dollars
US FundsUnfunded
CommitmentAmount Invested*
Distributions Received Fair Value
Fair Value as a % of
Net Assets
HarbourVest Partners V-Partnership Fund L.P. 2,220,000 46,709,079 45,688,697 1,617,558 0.1
HarbourVest Partners VI-Direct Fund L.P. 1,312,500 46,722,408 38,404,878 6,541,186 0.4
HarbourVest Partners VI-Partnership Fund L.P. 5,175,000 204,623,049 215,470,151 24,361,699 1.7
HarbourVest Partners VI-Buyout Partnership Fund L.P. 450,000 8,633,048 8,760,808 686,998 0.1
HarbourVest Partners VII-Venture Partnership Fund L.P.† 2,318,750 135,290,448 147,179,691 56,254,486 3.8
HarbourVest Partners VII-Buyout Partnership Fund L.P.† 3,850,000 74,417,291 84,512,312 17,823,287 1.2
HarbourVest Partners VIII-Cayman Mezzanine and Distressed Debt Fund L.P. 2,000,000 48,201,553 46,609,133 18,212,867 1.2
HarbourVest Partners VIII-Cayman Buyout Fund L.P. 15,000,000 237,758,801 232,097,301 137,212,744 9.3
HarbourVest Partners VIII-Cayman Venture Fund L.P. 1,000,000 49,191,736 43,534,496 37,732,362 2.6
HarbourVest Partners 2007 Cayman Direct Fund L.P. 2,250,000 97,876,849 106,746,408 53,571,256 3.6
HarbourVest Partners IX-Cayman Buyout Fund L.P. 28,222,500 43,058,226 11,870,827 46,387,135 3.1
HarbourVest Partners IX-Cayman Credit Opportunities Fund L.P. 4,812,500 7,736,193 2,653,130 7,107,749 0.5
HarbourVest Partners IX-Cayman Venture Fund L.P. 12,250,000 58,075,714 14,317,235 64,720,636 4.4
HarbourVest Partners 2013 Cayman Direct Fund L.P. 5,478,996 94,881,486 9,832,883 125,855,850 8.5
HarbourVest Partners Cayman Cleantech Fund II L.P. 12,750,000 7,305,952 126,588 7,435,728 0.5
HarbourVest Partners X Buyout Feeder Fund L.P. 230,580,000 21,447,552 – 25,047,983 1.7
HarbourVest Partners X Venture Feeder Fund L.P. 133,940,000 14,113,838 – 16,009,714 1.1
HarbourVest Partners Mezzanine Income Fund L.P. 43,655,000 6,566,579 646,022 6,891,243 0.5
Total US Funds 507,265,246 1,202,609,802 1,008,450,560 653,470,481 44.3
Consolidated Schedule of InvestmentsAt 31 January 2017

93 HVPE Annual Report and Accounts 2018
Governance R
eportFin
ancial Statem
entsS
upplementary D
ataS
trategic Report
International/Global FundsUnfunded
CommitmentAmount Invested*
Distributions Received Fair Value
Fair Value as a % of
Net Assets
HarbourVest International Private Equity Partners III-Partnership Fund L.P. 3,450,000 147,728,557 146,925,855 2,024,086 0.1
HarbourVest International Private Equity Partners IV- Direct Fund L.P. – 61,452,400 52,518,672 2,136,113 0.1
HarbourVest International Private Equity Partners IV-Partnership Fund L.P. 3,125,000 126,647,051 139,809,839 11,404,813 0.8
HIPEP V – 2007 Cayman European Buyout Companion Fund L.P.§ 1,537,095 63,880,348 50,056,237 31,273,616 2.1
Dover Street VII Cayman L.P.‡ 4,250,000 95,750,000 108,286,143 29,091,472 2.0
HIPEP VI-Cayman Partnership Fund L.P.** 15,657,100 106,947,200 36,623,365 103,919,679 7.0
HIPEP VI-Cayman Asia Pacific Fund L.P. 6,500,000 43,687,431 13,909,704 45,764,584 3.1
HIPEP VI-Cayman Emerging Markets Fund L.P. 6,225,000 23,834,490 4,818,697 20,679,116 1.4
HVPE Avalon Co-Investment L.P. 1,643,962 85,135,136 117,309,747 7,883,332 0.5
Dover Street VIII Cayman L.P. 29,700,000 150,424,390 78,069,738 130,150,150 8.8
HVPE Charlotte Co-Investment L.P. – 93,894,011 109,170,334 43,265,096 2.9
HarbourVest Global Annual Private Equity Fund L.P. 43,300,000 56,701,202 5,586,910 62,735,835 4.3
HIPEP VII Partnership Feeder Fund L.P. 91,562,500 33,437,500 1,035,117 35,274,466 2.4
HIPEP VII Asia Pacific Feeder Fund L.P. 20,700,000 9,300,000 220,628 10,028,009 0.7
HIPEP VII Emerging Markets Feeder Fund L.P. 15,800,000 4,200,000 152,570 4,126,230 0.3
HIPEP VII Europe Feeder Fund L.P.†† 47,108,975 21,646,444 1,566,975 21,397,109 1.5
HarbourVest Canada Parallel Growth Fund L.P.‡‡ 23,702,325 857,901 – 877,777 0.1
HarbourVest 2015 Global Fund L.P. 61,500,000 38,517,309 2,061,041 41,592,379 2.8
HarbourVest 2016 Global AIF L.P. 90,000,000 10,026,107 – 13,677,257 0.9
HarbourVest Partners Co-Investment IV AIF L.P. 81,500,000 18,500,000 – 18,485,772 1.3
Dover Street IX Cayman L.P. 96,000,000 4,000,000 1,402,554 4,920,061 0.3
HarbourVest Real Assets III Feeder L.P. 50,000,000 – – 1,576,032 0.1
Total International/Global Funds 693,261,957 1,196,567,477 869,524,126 642,282,984 43.5
TOTAL INVESTMENTS $1,200,527,203 $2,399,177,279 $1,877,974,686 $1,295,753,465 87.8
* Includes purchase of limited partner interests for shares and cash at the time of HVPE’s IPO.† Includes ownership interests in HarbourVest Partners VII-Cayman Partnership entities.‡ Includes ownership interest in Dover Street VII (AIV 1) Cayman L.P.§ Fund denominated in euros. Commitment amount is €47,450,000.** Fund denominated in euros. Commitment amount is €100,000,000.†† Fund denominated in euros. Commitment amount is €63,000,000.‡‡ Fund denominated in Canadian dollars. Commitment amount is C$32,000,000.
As of 31 January 2017, the cost basis of partnership investments is $1,226,407,488.
The accompanying notes are an integral part of the consolidated financial statements.

94 HVPE Annual Report and Accounts 2018
Notes to Consolidated Financial Statements
Note 1 Company Organisation and Investment ObjectiveHarbourVest Global Private Equity Limited (the “Company” or “HVPE”) is a closed-end investment company registered with the Registrar of Companies in Guernsey under The Companies (Guernsey) Law, 2008 (as amended). The Company’s registered office is Ground Floor, Dorey Court, Admiral Park, St Peter Port, Guernsey, GY1 2HT.
The Company was incorporated and registered in Guernsey on 18 October 2007. HVPE is designed to offer shareholders long-term capital appreciation by investing in a diversified portfolio of private equity investments. The Company invests in private equity through private equity funds and may make co-investments or other opportunistic investments. The Company is managed by HarbourVest Advisers L.P. (the “Investment Manager”), an affiliate of HarbourVest Partners, LLC (“HarbourVest”), a private equity fund-of-funds manager. The Company is intended to invest in and alongside existing and newly-formed HarbourVest funds. HarbourVest is a global private equity fund-of-funds manager and typically invests capital in primary partnerships, secondary investments, and direct investments across vintage years, geographies, industries, and strategies.
Operations of the Company commenced on 6 December 2007, following the initial global offering of the Class A ordinary shares.
Share CapitalAt 31 January 2018, the Company’s shares were listed on the London Stock Exchange under the symbol “HVPE”. At 31 January 2018, there were 79,862,486 shares issued and outstanding. The shares are entitled to the income and increases and decreases in the net asset value (“NAV”) of the Company, and to any dividends declared and paid, and have full voting rights. Dividends may be declared by the Board of Directors and paid from available assets subject to the directors being satisfied that the Company will, immediately after payment of the dividend, satisfy the statutory solvency test prescribed by The Companies (Guernsey) Law, 2008 (as amended).
Dividends will be paid to shareholders pro rata to their shareholdings.
The shareholders must approve any amendment to the Memorandum and Articles of Incorporation. The approval of 75% of the shares is required in respect of any changes that are administrative in nature, any material change from the investment strategy and/or investment objective of the Company, or any change to the terms of the investment management agreement.
There is no minimum statutory capital requirement under Guernsey law.
Investment Manager, Company Secretary, and AdministratorThe directors have delegated certain day-to-day operations of the Company to the Investment Manager and the Company Secretary and administrator, under advice to the directors, pursuant to service agreements with those parties, within the context of the strategy set by the Board. The Investment Manager is responsible for, among other things, selecting, acquiring, and disposing of the Company’s investments, carrying out financing, cash management, and risk management activities, providing investment advisory services, including with respect to HVPE’s investment policies and procedures, and arranging for personnel and support staff of the Investment Manager to assist in the administrative and executive functions of the Company.
DirectorsThe directors are responsible for the determination of the investment policy of the Company on the advice of the Investment Manager and have overall responsibility for the Company’s activities. This includes the periodic review of the Investment Manager’s compliance with the Company’s investment policies and procedures and the approval of certain investments. A majority of directors must be independent directors and not affiliated with HarbourVest or any affiliate of HarbourVest.
Note 2 Summary of Significant Accounting PoliciesThe following accounting policies have been applied consistently in dealing with items which are considered material in relation to the Company’s consolidated financial position.

95 HVPE Annual Report and Accounts 2018
Governance R
eportFin
ancial Statem
entsS
upplementary D
ataS
trategic Report
Basis of PresentationThe consolidated financial statements include the accounts of HarbourVest Global Private Equity Limited and its five wholly owned subsidiaries: HVGPE – Domestic A L.P., HVGPE – Domestic B L.P., HVGPE – Domestic C L.P., HVGPE – International A L.P., and HVGPE – International B L.P. (together “the undertakings”). Each of the subsidiaries is a Cayman Islands limited partnership formed to facilitate the purchase of certain investments. All intercompany accounts and transactions have been eliminated in consolidation. Certain comparative amounts have been reclassified to conform to the current year presentation.
Method of AccountingThe consolidated financial statements are prepared in conformity with US generally accepted accounting principles (“US GAAP”), The Companies (Guernsey) Law, 2008 (as amended), and the Principal Documents. Under applicable rules of Guernsey law implementing the EU Transparency Directive, the Company is allowed to prepare its financial statements in accordance with US GAAP instead of IFRS.
The Company is an investment company following the accounting and reporting guidance of the Financial Accounting Standards Boards (FASB) Accounting Standards Codification (“ASC”) Topic 946 Financial Services – Investment Companies.
EstimatesThe preparation of the financial statements in conformity with US GAAP requires management to make estimates and assumptions that affect the amounts reported in the consolidated financial statements and accompanying notes. Actual results could differ from those estimates.
InvestmentsInvestments are stated at fair value in accordance with the Company’s investment valuation policy. The inputs used to determine fair value include financial statements provided by the investment partnerships which typically include fair market value capital account balances. In reviewing the underlying financial statements and capital account balances, the Company considers compliance with ASC 820, the currency in which the investment is denominated, and other information deemed appropriate.
The fair value of the Company’s investments is primarily based on the most recently reported NAV provided by the underlying investment manager as a practical expedient under ASC 820. This fair value is then adjusted for known investment operating expenses and subsequent transactions, including investments, realisations, changes in foreign currency exchange rates, and changes in value of private and public securities. This valuation does not necessarily reflect amounts that might ultimately be realised from the investment and the difference can be material.
Securities for which a public market does exist are valued by the Company at quoted market prices at the balance sheet date. Generally, the partnership investments have a defined term and cannot be transferred without the consent of the General Partner of the limited partnership in which the investment has been made.
Foreign Currency TransactionsThe currency in which the Company operates is US dollars, which is also the presentation currency. Transactions denominated in foreign currencies are recorded in the local currency at the exchange rate in effect at the transaction dates. Foreign currency investments, investment commitments, cash and equivalents, and other assets and liabilities are translated at the rates in effect at the balance sheet date. Foreign currency translation gains and losses are included in realised and unrealised gains (losses) on investments as incurred. The Company does not segregate that portion of realised or unrealised gains and losses attributable to foreign currency translation on investments.
Cash and EquivalentsThe Company considers all highly liquid investments with an original maturity of three months or less to be cash equivalents. The carrying amount included in the balance sheet for cash and equivalents approximates their fair value. The Company maintains bank accounts denominated in US dollars, in euros, and in pounds sterling. The Company may invest excess cash balances in highly liquid instruments such as certificates of deposit, sovereign debt obligations of certain countries, and money market funds that are highly rated by the credit rating agencies. The associated credit risk of the cash and equivalents is monitored by the Board and the Investment Manager on a regular basis. The Board has authorised the Investment Manager to manage the cash balances on a daily basis according to the terms set out in the treasury policies created by the Board.
96 HVPE Annual Report and Accounts 2018
Notes to Consolidated Financial Statements continued
Note 2 Summary of Significant Accounting Policies continuedInvestment IncomeInvestment income includes interest from cash and equivalents and dividends. Dividends are recorded when they are declared and interest is recorded when earned.
Operating ExpensesOperating expenses include amounts directly incurred by the Company as part of its operations, and do not include amounts incurred from the operations of the investment entities.
Net Realised Gains and Losses on InvestmentsFor investments in private equity funds, the Company records its share of realised gains and losses as reported by the Investment Manager including fund level related expenses and management fees, and is net of any carry allocation. Realised gains and losses are calculated as the difference between proceeds received and the related cost of the investment.
Net Change in Unrealised Appreciation and Depreciation on InvestmentsFor investments in private equity funds, the Company records its share of change in unrealised gains and losses as reported by the investment manager as an increase or decrease in unrealised appreciation or depreciation of investments and is net of any carry allocation. When an investment is realised, the related unrealised appreciation or depreciation is recognised as realised.
Income TaxesThe Company is registered in Guernsey as a tax exempt company. The States of Guernsey Income Tax Authority has granted the Company exemption from Guernsey income tax under the provision of the Income Tax (Exempt Bodies) (Guernsey) Ordinance 1989 (as amended) and the Company will be charged an annual exemption fee of £1,200 included as other expenses in the Consolidated Statements of Operations.
Income may be subject to withholding taxes imposed by the US or other countries which will impact the Company’s effective tax rate.
Investments made in entities that generate US source income may subject the Company to certain US federal and state income tax consequences. A US withholding tax at the rate of 30% may be applied on the distributive share of any US source dividends and interest (subject to certain exemptions) and certain other income that is
received directly or through one or more entities treated as either partnerships or disregarded entities for US federal income tax purposes. Furthermore, investments made in entities that generate income that is effectively connected with a US trade or business may also subject the Company to certain US federal and state income tax consequences. The US requires withholding on effectively connected income at the highest US rate (generally 35%). In addition, the Company may also be subject to a branch profits tax which can be imposed at a rate of up to 30% of any after-tax, effectively connected income associated with a US trade or business. However, no amounts have been accrued.
The Company accounts for income taxes under the provisions of ASC 740, “Income Taxes.” This standard establishes consistent thresholds as it relates to accounting for income taxes. It defines the threshold for recognising the benefits of tax-return positions in the financial statements as “more-likely-than-not” to be sustained by the taxing authority and requires measurement of a tax position meeting the more-likely-than-not criterion, based on the largest benefit that is more than 50% likely to be realised. For the year ended 31 January 2018, the Investment Manager has analysed the Company’s inventory of tax positions taken with respect to all applicable income tax issues for all open tax years (in each respective jurisdiction), and has concluded that no provision for income tax is required in the Company’s financial statements.
Shareholders in certain jurisdictions may have individual tax consequences from ownership of the Company’s shares. The Company has not accounted for any such tax consequences in these consolidated financial statements.
Market and Other Risk FactorsThe Company’s investments are subject to various risk factors including market, credit, interest rate, and currency risk. Investments are based primarily in the US, Europe and Asia Pacific, and thus have concentrations in such regions. The Company’s investments are also subject to the risks associated with investing in leveraged buyout and venture capital transactions that are illiquid and non-publicly traded. Such investments are inherently more sensitive to declines in revenues and to increases in expenses that may occur due to general downward swings in the world economy or other risk factors including increasingly intense competition, rapid changes in technology, changes in federal, state and foreign regulations, and limited capital investments.

97 HVPE Annual Report and Accounts 2018
Governance R
eportFin
ancial Statem
entsS
upplementary D
ataS
trategic Report
The Company is subject to credit and liquidity risk to the extent any financial institution with which it conducts business is unable to fulfil contracted obligations on its behalf. Management monitors the financial condition of those financial institutions and does not anticipate any losses from these counterparties.
Note 3 Material Agreements and Related FeesAdministrative AgreementThe Company retained JTC Group (“JTC”) as Company Secretary and Administrator for the year. Fees for these services are paid as invoiced by JTC and include an administration fee of £14,372 per annum, a secretarial fee of £30,631 per annum, an additional value fee equal to 1/12 of 0.005% of the net asset value of the Company above $200 million as at the last business day of each month, and reimbursable expenses.
During the year ended 31 January 2018, fees of $130,439 were incurred to JTC and are included as other expenses in the Consolidated Statements of Operations.
RegistrarThe Company has retained Link Asset Services (formerly “Capita”) as share registrar. Fees for this service include a base fee of £22,262, plus other miscellaneous expenses. During the year ended 31 January 2018, registrar fees of $52,608 were incurred and are included as other expenses in the Consolidated Statements of Operations.
Independent Auditor’s FeesFor the year ended 31 January 2018, $135,400 has been accrued for auditor’s fees and is included in professional fees in the Consolidated Statements of Operations. Non-audit fees paid to the Auditor by the Company were nil. Ernst & Young in the US was paid non-audit fees of $103,200 by the Investment Manager, in relation to tax services provided for the year ended 31 January 2018, which were reimbursed by the Company.
Investment Management AgreementThe Company has retained HarbourVest Advisers L.P. as the Investment Manager. The Investment Manager is reimbursed for costs and expenses incurred on behalf of the Company in connection with the management and operation of the Company. The Investment Manager does not directly charge HVPE management fees or performance fees other than with respect to parallel investments. However, as an investor in the HarbourVest funds, HVPE is charged the same management fees and is subject to the same performance allocations as other investors in such HarbourVest funds. During the year ended 31 January 2018, reimbursements for services provided by the Investment Manager were $1,457,264.
During the year ended 31 January 2018, HVPE had two parallel investments: HarbourVest Acquisition S.à.r.l. (via HVPE Avalon Co-Investment L.P.) and HarbourVest Structured Solutions II, L.P. (via HVPE Charlotte Co-Investment L.P.). Management fees paid for the parallel investments made by the Company were consistent with the fees charged by the funds alongside which the parallel investments were made during the years ended 31 January 2018 and 2017. Management fees included in the Consolidated Statements of Operations are shown in the table below:
2018 2017
HVPE Avalon Co-Investment L.P. 622,297 938,238HVPE Charlotte Co-Investment L.P. 788,082 796,921
Total Management Fees $1,410,379 $1,735,159
For the period from 1 February 2017 through 30 September 2017 (termination date of fee), management fees on the HVPE Avalon Co-Investment L.P. investment were calculated based on a weighted average effective annual rate of 1.08% on committed capital to the parallel investment. For the year ended 31 January 2018, management fees on the HVPE Charlotte Co-Investment L.P. investment were calculated based on a weighted average effective annual rate of 0.95% on capital originally committed (0.91% on committed capital net of management fee offsets) to the parallel investment.

98 HVPE Annual Report and Accounts 2018
Notes to Consolidated Financial Statements continued
Note 4 InvestmentsIn accordance with the authoritative guidance on fair value measurements and disclosures under generally accepted accounting principles in the United States, the Company discloses the fair value of its investments in a hierarchy that prioritises the inputs to valuation techniques used to measure the fair value. The hierarchy gives the highest priority to un-adjusted quoted prices in active markets for identical assets or liabilities (Level 1 measurements) and the lowest priority to unobservable inputs (Level 3 measurements). The guidance establishes three levels of the fair value hierarchy as follows:
Level 1 – Inputs that reflect unadjusted quoted prices in active markets for identical assets or liabilities that the Company has the ability to access at the measurement date;
Level 2 – Inputs other than quoted prices that are observable for the asset or liability either directly or indirectly, including inputs in markets that are not considered to be active;
Level 3 – Inputs that are unobservable. Generally, the majority of the Company’s investments are valued utilizing unobservable inputs, and are therefore classified within Level 3.
Level 3 investments include limited partnership interests in HarbourVest funds which report under US generally accepted accounting principles. Inputs used to determine fair value are primarily based on the most recently reported NAV provided by the underlying investment manager as a practical expedient under ASC 820. The fair value is then adjusted for known investment operating expenses and subsequent transactions, including investments, realisations, changes in foreign currency exchange rates, and changes in value of private and public securities.
Income derived from investments in HarbourVest funds is recorded using the equity pick-up method. Under the equity pick-up-method of accounting, the Company’s proportionate share of the net income (loss) and net realised gains (losses), as reported by the HarbourVest funds, is reflected in the consolidated statements of operations as net realised gain (loss) on investments. The Company’s proportionate share of the aggregate increase or decrease in unrealised appreciation (depreciation), as reported by the HarbourVest funds, is reflected in the consolidated statements of operations as net change in unrealised appreciation (depreciation) on investments.
Because of the inherent uncertainty of these valuations, the estimated fair value may differ significantly from the value that would have been used had a ready market for this security existed, and the difference could be material.
The following table summarises the Company’s investments that were accounted for at fair value by level within the fair value hierarchy:
Level 1 Level 2 Level 3 Total
Balance at 31 January 2016 $– $– $1,129,487,543 $1,129,487,543Contributions to investments 269,770,234 269,770,234Net realised gain (loss) on investments 29,438 88,787,205 88,816,643Net change in unrealised appreciation (depreciation) on investments 58,688,595 58,688,595Distributions received from investments (29,438) (250,980,112) (251,009,550)
Balance at 31 January 2017 $– $– $1,295,753,465 $1,295,753,465
Contributions to investments 312,684,514 312,684,514
Net realised gain (loss) on investments 157,395,016 157,395,016Net change in unrealised appreciation (depreciation) on investments 91,527,458 91,527,458Distributions received from investments (405,145,108) (405,145,108)
Balance at 31 January 2018 $– $– $1,452,215,345 $1,452,215,345
Net change in unrealised gain (loss) on investments still held at 31 January 2018 $91,527,458

99 HVPE Annual Report and Accounts 2018
Governance R
eportFin
ancial Statem
entsS
upplementary D
ataS
trategic Report
Note 4 Investments continuedThe Company recognises transfers at the current value at the transfer date. There were no transfers during the year ended 31 January 2018. Investments include limited partnership interests in private equity partnerships, all of which carry restrictions on redemption. The investments are non-redeemable and the Investment Manager estimates an average remaining life of 10 years with a range of 1 to 17 years remaining.
As of 31 January 2018, the Company had invested $2,768,586,847, or 69.1% of the Company’s committed capital in investments and had received $2,335,668,619 in cumulative distributions (including dividends from the formerly held investment HarbourVest Senior Loans Europe).
There were no investment transactions during the year ended 31 January 2018 in which an investment was acquired and disposed of during the year.
Note 5 CommitmentsAs of 31 January 2018, the Company has unfunded investment commitments to other limited partnerships of $1,237,494,068 which are payable upon notice by the partnerships to which the commitments have been made. Unfunded investment commitments of $1,157,772,486 are denominated in US dollars, $55,690,445 are denominated in euros, and $24,031,137 are denominated in Canadian dollars.
Note 6 Debt FacilityOn 4 December 2007, the Company entered into an agreement with Lloyds Bank plc regarding a multi-currency revolving credit facility (“Facility”) for an aggregate amount up to $500 million. As of 28 September 2015, the debt facility was amended to include Credit Suisse as an additional lender to the Company’s Facility Agreement with Lloyds Bank Plc. On 1 December 2017, the debt facility was amended to extend the facility to December 2022 and to adjustment lender commitments. Lloyds Bank plc commitment was amended to $250 million, and Credit Suisse commitment was amended to $250 million.
Amounts borrowed against the Facility accrue interest at an aggregate rate of the LIBOR/EURIBOR, a margin, and, under certain circumstances, a mandatory minimum cost. The Facility was secured by the private equity investments and cash and equivalents of the Company, as defined in the agreement. Availability of funds under the Facility and interim repayments of amounts borrowed are subject to certain covenants and diversity tests applied to the Investment Portfolio of the Company. At 31 January 2018 and 2017, there was no debt outstanding against the Facility. Included in other assets at 31 January 2018 are deferred financing costs of $6,364,430 related to refinancing the facility. The deferred financing costs are amortised on the terms of the facility. The Company is required to pay a non-utilisation fee calculated as 90 basis points per annum from 1 February 2016 to 22 December 2016 and 115 basis points per annum from 23 December 2016 to 31 January 2018. For the year ended 31 January 2018, $5,829,861 in non-utilisation fees have been incurred.

100 HVPE Annual Report and Accounts 2018
Notes to Consolidated Financial Statements continued
Note 7 Financial HighlightsFor the Years Ended 31 January 2018 and 2017
2018 2017
SharesPER SHARE OPERATING PERFORMANCE:Net asset value, beginning of year $18.47 $16.75
Net realised and unrealised gains 3.11 1.85Net investment loss (0.12) (0.13)
Total from investment operations 2.99 1.72
Net asset value, end of year $21.46 $18.47Market value, end of year $17.77* $15.03Total return at net asset value 16.2% 10.3%Total return at market value 18.2% 21.1%
RATIOS TO AVERAGE NET ASSETSExpenses† 0.75% 0.78%Expenses-excluding non-recurring listing expenses 0.75% 0.78%
Net investment loss (0.62)% (0.71)%
PORTFOLIO TURNOVER†† 0.0% 0.0%
* Represents share price of £12.52 converted.† Does not include operating expenses of underlying investments.†† The turnover ratio has been calculated as the number of transactions divided by the average net assets.

101 HVPE Annual Report and Accounts 2018
Governance R
eportFin
ancial Statem
entsS
upplementary D
ataS
trategic Report
Note 8 Publication and Calculation of Net Asset ValueThe NAV of the Company is equal to the value of its total assets less its total liabilities. The NAV per share is calculated by dividing the net asset value by the number of shares in issue on that day. The Company publishes the NAV per share of the shares as calculated, monthly in arrears, at each month-end, generally within 15 days.
Note 9 Related party transactionsOther amounts payable to HarbourVest Advisers L.P. of $227,767 represent expenses of the Company incurred in the ordinary course of business, which have been paid by and are reimbursable to HarbourVest Advisers L.P. at 31 January 2018.
Board-related expenses, primarily compensation, of $580,491 were incurred during the year ended 31 January 2018.
Note 10 IndemnificationsGeneral IndemnificationsIn the normal course of business, the Company may enter into contracts that contain a variety of representations and warranties and which provide for general indemnifications. The Company’s maximum exposure under these arrangements is unknown, as this would involve future claims that may be made against the Company that have not yet occurred. Based on the prior experience of the Investment Manager, the Company expects the risk of loss under these indemnifications to be remote.
Investment Manager IndemnificationsConsistent with standard business practices in the normal course of business, the Company has provided general indemnifications to the Investment Manager, any affiliate of the Investment Manager and any person acting on behalf of the Investment Manager or such affiliate when they act in good faith, in the best interest of the Company. The Company is unable to develop an estimate of the maximum potential amount of future payments that could potentially result from any hypothetical future claim, but expects the risk of having to make any payments under these general business indemnifications to be remote.
Directors and Officers IndemnificationsThe Company’s articles of incorporation provide that the directors, managers or other officers of the Company shall be fully indemnified by the Company from and against all actions, expenses and liabilities which they may incur by reason of any contract entered into or any act in or about the execution of their offices, except such (if any) as they shall incur by or through their own negligence, default, breach of duty or breach of trust respectively.
Note 11 Subsequent EventsIn the preparation of the financial statements, the Company has evaluated the effects, if any, of events occurring after 31 January 2018 to 10 May 2018, the date that the financial statements were issued.
On 26 March 2018, the Company committed $35 million to the HarbourVest XI Buyout, $10 million to HarbourVest XI Micro Buyout and $20 million to HarbourVest XI Venture.
On 30 March 2018, the Company committed $20 million to the HarbourVest 2018 Global Fund.
On 30 April 2018, the Company committed $40 million to Fund XI Buyout, $10 million to Fund XI Micro Buyout, and $20 million to Fund XI Venture.
There were no other events or material transactions subsequent to 31 January 2018 that required recognition or disclosure in the financial statements.

102 HVPE Annual Report and Accounts 2018
Supplementary DataHVPE’s HarbourVest Fund Investments at 31 January 2018
HVPE’s HarbourVest Fund investments and secondary co-investments are profiled below. Financial information for each fund is provided in the Audited Consolidated Financial Statements.
V = Venture, B = Buyout, O = Other
P = Primary, S = Secondary, D = Direct Co-investment
HarbourVest Fund Phase Vintage Year Stage Geography Strategy
Investment Phase
HIPEP VIII Asia Pacific Fund Investment 2017 V, B AP P, S, D
HarbourVest 2017 Global Fund Investment 2017 V, B, O Global P, S, D
HIPEP VIII Partnership Fund Investment 2017 V, B EUR, AP, RoW P, S, D
Secondary Overflow Fund III Investment 2017 V, B, O Global S
HarbourVest Partners Co-Investment IV Investment 2016 V, B Global D
Dover Street IX Investment 2016 V, B Global S
HarbourVest Real Assets III Investment 2016 O Global S
HarbourVest 2016 Global Fund Investment 2016 V, B, O Global P, S, D
HarbourVest 2015 Global Fund Investment 2015 V, B, O Global P, S, D
HarbourVest Canada Growth Fund Investment 2015 V US, CAN P, D
HarbourVest Mezzanine Income Fund Investment 2015 O US D
HarbourVest X Buyout Investment 2015 B US P, S, D
HarbourVest X Venture Investment 2015 V US P, S, D
HarbourVest Global Annual Private Equity Fund Investment 2014 V, B, O Global P, S, D
HIPEP VII Asia Pacific Fund Investment 2014 V, B AP P, S, D
HIPEP VII Emerging Markets Fund Investment 2014 V, B RoW P, S, D
HIPEP VII Europe Fund Investment 2014 V, B EUR P, S, D
HIPEP VII Partnership Fund Investment 2014 V, B EUR, AP, RoW P, S, D
Growth Phase
HarbourVest 2013 Direct Fund Growth 2013 V, B Global D
Dover Street VIII Growth 2012 V, B Global S
HarbourVest Cleantech Fund II Growth 2012 V Global P, S, D
HarbourVest Partners IX Buyout Fund Growth 2011 B US P, S, D
HarbourVest Partners IX Credit Opportunities Fund Growth 2011 O US P, S, D
HarbourVest Partners IX Venture Fund Growth 2011 V US P, S, D
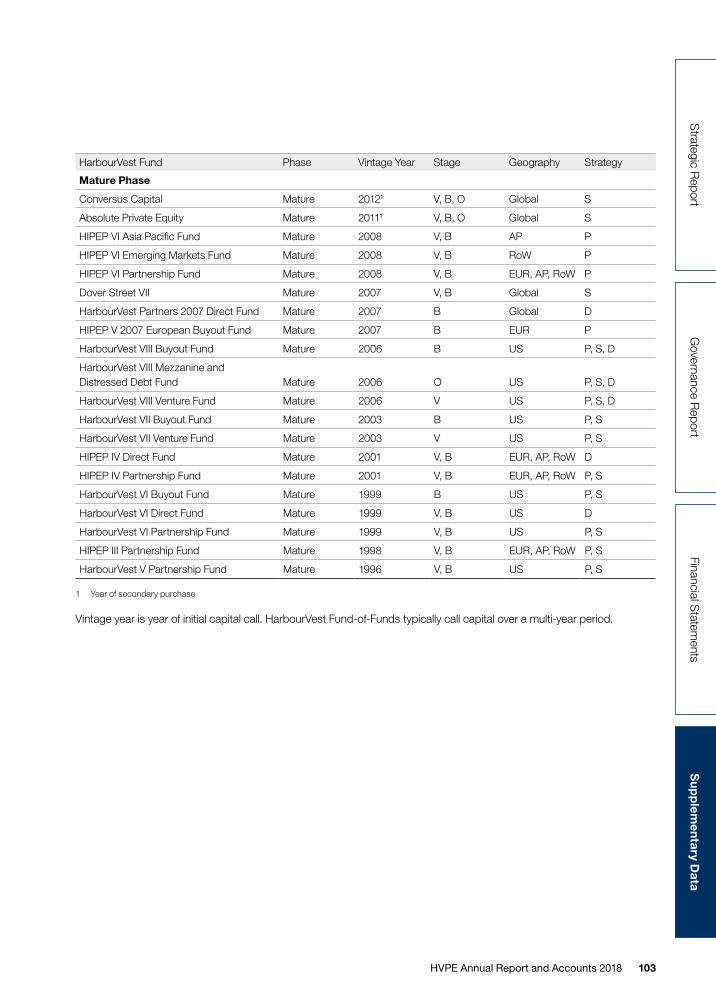
103 HVPE Annual Report and Accounts 2018
Governance R
eportFinancial S
tatements
Su
pp
lementary D
ataS
trategic Report
HarbourVest Fund Phase Vintage Year Stage Geography Strategy
Mature Phase
Conversus Capital Mature 20121 V, B, O Global S
Absolute Private Equity Mature 20111 V, B, O Global S
HIPEP VI Asia Pacific Fund Mature 2008 V, B AP P
HIPEP VI Emerging Markets Fund Mature 2008 V, B RoW P
HIPEP VI Partnership Fund Mature 2008 V, B EUR, AP, RoW P
Dover Street VII Mature 2007 V, B Global S
HarbourVest Partners 2007 Direct Fund Mature 2007 B Global D
HIPEP V 2007 European Buyout Fund Mature 2007 B EUR P
HarbourVest VIII Buyout Fund Mature 2006 B US P, S, D
HarbourVest VIII Mezzanine and Distressed Debt Fund Mature 2006 O US P, S, D
HarbourVest VIII Venture Fund Mature 2006 V US P, S, D
HarbourVest VII Buyout Fund Mature 2003 B US P, S
HarbourVest VII Venture Fund Mature 2003 V US P, S
HIPEP IV Direct Fund Mature 2001 V, B EUR, AP, RoW D
HIPEP IV Partnership Fund Mature 2001 V, B EUR, AP, RoW P, S
HarbourVest VI Buyout Fund Mature 1999 B US P, S
HarbourVest VI Direct Fund Mature 1999 V, B US D
HarbourVest VI Partnership Fund Mature 1999 V, B US P, S
HIPEP III Partnership Fund Mature 1998 V, B EUR, AP, RoW P, S
HarbourVest V Partnership Fund Mature 1996 V, B US P, S
1 Year of secondary purchase
Vintage year is year of initial capital call. HarbourVest Fund-of-Funds typically call capital over a multi-year period.

104 HVPE Annual Report and Accounts 2018
Largest Underlying Companies at 31 January 2018
/ / No single portfolio company represented more than 1.5% of the Investment Portfolio.
/ / The five largest companies represented 6.0% of the Investment Portfolio.
/ / The 25 largest companies represented 17.3% of the Investment Portfolio.
/ / In total, the top 100 companies represented $527 million or 36.3% of the Investment Portfolio.
The 100 largest portfolio company investments based on Investment Portfolio value are listed by percentage of investment value. Some companies below are held at least in part in HarbourVest direct funds (shown in bold). In most cases, HarbourVest has access to more detailed financial and operating information on these companies, and in some cases, HarbourVest representatives sit on the companies’ Board of Directors.
Company Strategy
% of Investment Value at 31 January 2018
Amount of Investment Value at 31 January 2018 (m) Location Status Description
Undisclosed Buyout 1.45% $21.0 Netherlands Private Undisclosed
Preston Hollow Capital
Buyout 1.42% $20.7 US Private Speciality finance platform
Press Ganey Associates
Buyout 1.13% $16.4 US Private Patient satisfaction surveys
Acrisure Buyout 1.08% $15.7 US Private Property and casualty insurance broker
H-Line Shipping Buyout 0.88% $12.8 South Korea Private Marine bulk shipping
SolarWinds Buyout 0.85% $12.4 US Private IT management software
Rodenstock Buyout 0.70% $10.2 Germany Private Opthalmic device manufacturer
Infinitas Learning Buyout 0.67% $9.8 Netherlands Private Online education provider
Ministry Brands Venture 0.64% $9.3 US Private Software provider for faith-based organisations
Staples Buyout 0.63% $9.2 US Private Office supply retailer
Device Technologies Australia
Buyout 0.63% $9.1 Australia Private Medical equipment distributor
Albany Molecular Research (AMRI)
Buyout 0.63% $9.1 US Private Outsourced pharmaceutical contract manufacturer
Appriss Venture 0.63% $9.1 US Private Data and analytics solutions provider
Ssangyong Cement Industrial
Buyout 0.61% $8.9 South Korea Public Integrated cement manufacture and distributor
CareCentrix Venture 0.55% $8.0 US Private Home health benefit management services
San Miguel Industrias
Buyout 0.52% $7.6 Peru Private PET bottles and preforms
TMF Group Buyout 0.51% $7.4 Netherlands Private Outsourced business services
Riverbed Technology Buyout 0.50% $7.3 US Private Network management solutions
Five Star Food Service
Other 0.50% $7.3 US Private Vending food and beverage provider

105 HVPE Annual Report and Accounts 2018
Governance R
eportFinancial S
tatements
Su
pp
lementary D
ataS
trategic Report
Company Strategy
% of Investment Value at 31 January 2018
Amount of Investment Value at 31 January 2018 (m) Location Status Description
AllFunds Bank Buyout 0.49% $7.1 Spain Private Mutual fund distribution platform
Kuoni Buyout 0.47% $6.9 Switzerland Private Travel and tour service provider
Verisure Holdings Buyout 0.46% $6.6 Sweden Private Security solutions provider
Wayfair Venture 0.45% $6.5 US Public Online home goods retailer
Multiasistencia Buyout 0.45% $6.5 Spain Private Business process outsourcing services
Profi Rom Food Group
Buyout 0.44% $6.5 Romania Private Supermarket chain
Hub International Buyout 0.43% $6.3 US Private Commercial insurance brokerage
Intelex Technologies Venture 0.43% $6.3 Canada Private Business management software solutions
Earth Networks Venture 0.42% $6.1 US Private Localised convergent content
Uber Technologies Venture 0.39% $5.6 US Private On-demand personal transportation
Cortefiel Buyout 0.38% $5.5 Spain Private Apparel retailer
Project Arriendo Buyout 0.38% $5.5 Mexico Private Leasing and structured credit provider
Madrigal Pharmaceuticals
Venture 0.36% $5.3 US Public Drug manufacturer
Anhui Three Squirrels Electronic Commerce
Venture 0.36% $5.2 China Private Snack retailer and distributor
Secure-24 Buyout 0.36% $5.2 US Private IT outsourcing and hosting applications
NEW Asurion Corporation
Venture 0.35% $5.0 US Private Provider of consumer product protection programs
Ion Media Networks Other 0.35% $5.0 US Private Television broadcasting
Envirotainer International
Buyout 0.34% $4.9 Sweden Private Air cargo container manufacturer
Undisclosed Buyout 0.34% $4.9 Germany Private Undisclosed
Klarna Holding Venture 0.33% $4.8 Sweden Private Online consumer payment solutions
Undisclosed Buyout 0.32% $4.6 France Private Undisclosed
Project Precision Buyout 0.31% $4.6 US Private Medical device and aerospace equipment
Eaton Towers Buyout 0.31% $4.6 UK Private Telecom tower operator
GetBack Venture 0.31% $4.4 Poland Public Consumer debt collector
Heritage Food Service Group
Buyout 0.30% $4.4 US Private Commercial kitchen supplies
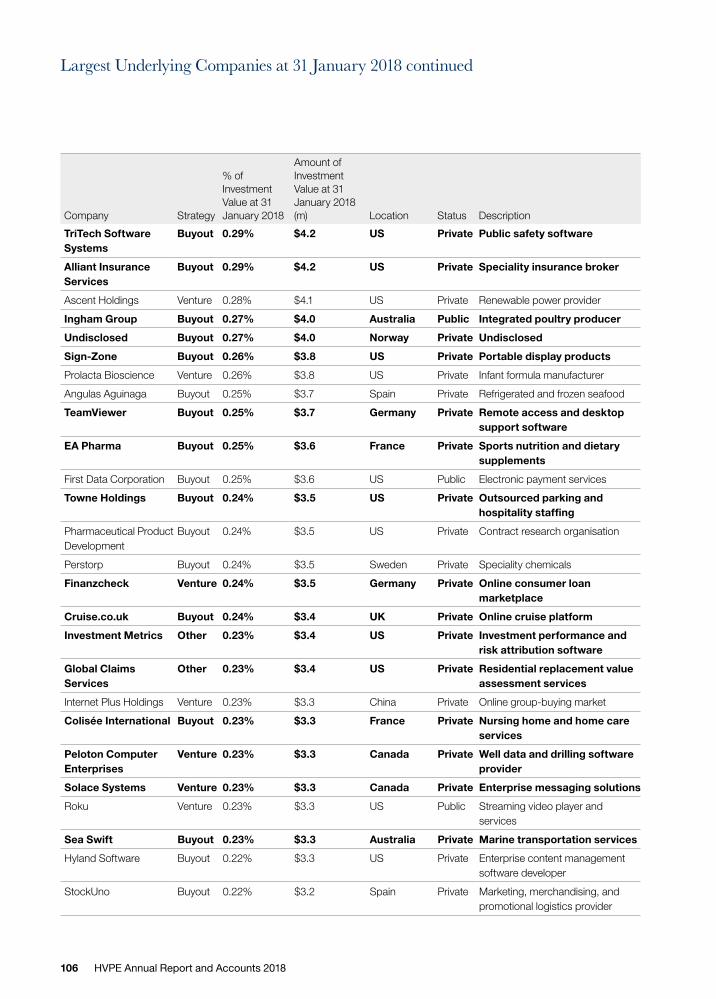
106 HVPE Annual Report and Accounts 2018
Largest Underlying Companies at 31 January 2018 continued
Company Strategy
% of Investment Value at 31 January 2018
Amount of Investment Value at 31 January 2018 (m) Location Status Description
TriTech Software Systems
Buyout 0.29% $4.2 US Private Public safety software
Alliant Insurance Services
Buyout 0.29% $4.2 US Private Speciality insurance broker
Ascent Holdings Venture 0.28% $4.1 US Private Renewable power provider
Ingham Group Buyout 0.27% $4.0 Australia Public Integrated poultry producer
Undisclosed Buyout 0.27% $4.0 Norway Private Undisclosed
Sign-Zone Buyout 0.26% $3.8 US Private Portable display products
Prolacta Bioscience Venture 0.26% $3.8 US Private Infant formula manufacturer
Angulas Aguinaga Buyout 0.25% $3.7 Spain Private Refrigerated and frozen seafood
TeamViewer Buyout 0.25% $3.7 Germany Private Remote access and desktop support software
EA Pharma Buyout 0.25% $3.6 France Private Sports nutrition and dietary supplements
First Data Corporation Buyout 0.25% $3.6 US Public Electronic payment services
Towne Holdings Buyout 0.24% $3.5 US Private Outsourced parking and hospitality staffing
Pharmaceutical Product Development
Buyout 0.24% $3.5 US Private Contract research organisation
Perstorp Buyout 0.24% $3.5 Sweden Private Speciality chemicals
Finanzcheck Venture 0.24% $3.5 Germany Private Online consumer loan marketplace
Cruise.co.uk Buyout 0.24% $3.4 UK Private Online cruise platform
Investment Metrics Other 0.23% $3.4 US Private Investment performance and risk attribution software
Global Claims Services
Other 0.23% $3.4 US Private Residential replacement value assessment services
Internet Plus Holdings Venture 0.23% $3.3 China Private Online group-buying market
Colisée International Buyout 0.23% $3.3 France Private Nursing home and home care services
Peloton Computer Enterprises
Venture 0.23% $3.3 Canada Private Well data and drilling software provider
Solace Systems Venture 0.23% $3.3 Canada Private Enterprise messaging solutions
Roku Venture 0.23% $3.3 US Public Streaming video player and services
Sea Swift Buyout 0.23% $3.3 Australia Private Marine transportation services
Hyland Software Buyout 0.22% $3.3 US Private Enterprise content management software developer
StockUno Buyout 0.22% $3.2 Spain Private Marketing, merchandising, and promotional logistics provider

107 HVPE Annual Report and Accounts 2018
Governance R
eportFinancial S
tatements
Su
pp
lementary D
ataS
trategic Report
Company Strategy
% of Investment Value at 31 January 2018
Amount of Investment Value at 31 January 2018 (m) Location Status Description
Asia Pacific Education Holdings
Buyout 0.22% $3.2 Malaysia Private Tertiary and k-12 education provider
Zayo Group Holdings Buyout 0.21% $3.1 US Public Telecommunications
Exxelia International Buyout 0.21% $3.1 France Private Passive electronic components
Adaptive Insights Venture 0.21% $3.1 US Private Business intelligence software
MultiPlan Buyout 0.21% $3.1 US Private Provider of healthcare cost management solutions
Third Bridge Group Venture 0.21% $3.1 UK Private Expert network provider
Springstone Buyout 0.21% $3.1 US Private Behavioural health treatment
Centric Software Venture 0.21% $3.0 US Private Retail management software provider
Verafin Venture 0.21% $3.0 Canada Private Anti-fraud software provider
CleanSlate Centers Venture 0.21% $3.0 US Private Outpatient addiction treatment centers
Legend Energy Services
Venture 0.21% $3.0 US Private Pressure pumping service specialists
ChinaPnR Venture 0.20% $2.9 China Private Financial services infrastructure provider
Capitol Acquisition Corp
Buyout 0.20% $2.9 US Private Speciality purpose acquisition company
Janalakshmi Financial Services
Venture 0.20% $2.9 India Private Microfinance institution
SambaSafety Other 0.20% $2.8 US Private Risk management solutions
National Stock Exchange of India
Venture 0.19% $2.8 India Private Equity and derivative exchange
Undisclosed Buyout 0.19% $2.8 UK Private Undisclosed
D4C Dental Brands Buyout 0.19% $2.7 US Private Regional dental support organization
Flexera Software Buyout 0.19% $2.7 US Private Enterprise software solutions provider
Doswell Energy Center Venture 0.18% $2.6 US Private Gas-fired power generation facilities
Vestcom International
Buyout 0.18% $2.6 US Private Price communication and marketing
Alert Logic Buyout 0.18% $2.6 US Private Security and compliance software
HealthGrades Venture 0.18% $2.6 US Private Online healthcare provider evaluation
Belcan Buyout 0.18% $2.6 US Private Engineering consulting and technical staffing services
Mediterranea de Catering
Buyout 0.18% $2.6 Spain Private Catering services

108 HVPE Annual Report and Accounts 2018
Largest Underlying Companies at 31 January 2018 continued
Company Strategy
% of Investment Value at 31 January 2018
Amount of Investment Value at 31 January 2018 (m) Location Status Description
Univision Communications
Buyout 0.18% $2.5 US Private US Spanish language media
Avalara Venture 0.17% $2.5 US Private Sales and tax management software
Deliveroo Venture 0.17% $2.5 UK Private Food delivery service
Vishal Retail Buyout 0.17% $2.5 India Private Hypermarket retailer
Slack Technologies Venture 0.17% $2.5 US Private Workplace collaboration software
TOTAL 36.3% $527.2

109 HVPE Annual Report and Accounts 2018
Governance R
eportFinancial S
tatements
Su
pp
lementary D
ataS
trategic Report
Largest US Managers at 31 January 2018
Based on the Investment Portfolio/ / No external manager represented more than 1.9% of the Investment Portfolio.
/ / As the Investment Manager of the HarbourVest direct funds, HarbourVest Partners, LLC is the largest manager held in HVPE, although not listed here.
/ / The five largest managers represented 6.8% of the Investment Portfolio.
/ / The 25 largest managers represented 20.1% of the Investment Portfolio.
/ / In total, the largest managers (0.2% of invested value or larger) represented 38.3% of the Investment Portfolio.
Manager Strategy
Amount of Investment Value at 31 January 2018 ($m)
% of Investment Value at 31 January 2018
Thoma Bravo Primary $26.8 1.85%
Hellman & Friedman Primary $20.4 1.40%
Insight Venture Management Primary $20.0 1.38%
The Blackstone Group Primary $16.2 1.12%
Lightspeed Venture Partners Primary $14.9 1.03%
Welsh, Carson, Anderson & Stowe Secondary $14.8 1.02%
Battery Ventures Primary $13.1 0.91%
TPG Capital Secondary $12.8 0.88%
Redpoint Ventures Primary $12.7 0.88%
GTCR Primary $12.0 0.82%
Accel Partners Primary $11.2 0.77%
Berkshire Partners Primary $10.4 0.71%
Spark Capital Primary $10.3 0.71%
Bain Capital Ventures Primary $10.0 0.69%
Eos Management Secondary $9.0 0.62%
Thomas H. Lee Company Secondary $8.5 0.59%
Pamlico Capital Primary $8.5 0.58%
Vista Equity Partners Primary $8.3 0.57%
Lee Equity Partners Secondary $7.9 0.55%
Kohlberg Kravis Roberts & Co. Secondary $7.7 0.53%
1901 Partners Management Secondary $7.6 0.52%
Andreessen Horowitz Primary $7.4 0.51%
Gridiron Energy Management Secondary $7.4 0.51%
Leonard Green & Partners Primary $7.1 0.49%
Oak Investment Partners Primary $7.0 0.48%
Carlyle US Buyout Secondary $6.9 0.47%
Madison Dearborn Partners Secondary $6.7 0.46%
Silver Lake Management Primary $6.5 0.45%
Sageview Capital Partners Secondary $6.5 0.44%
Kleiner Perkins Caufield & Byers Primary $6.4 0.44%
TA Associates Primary $6.4 0.44%
Providence Equity Partners Secondary $6.4 0.44%
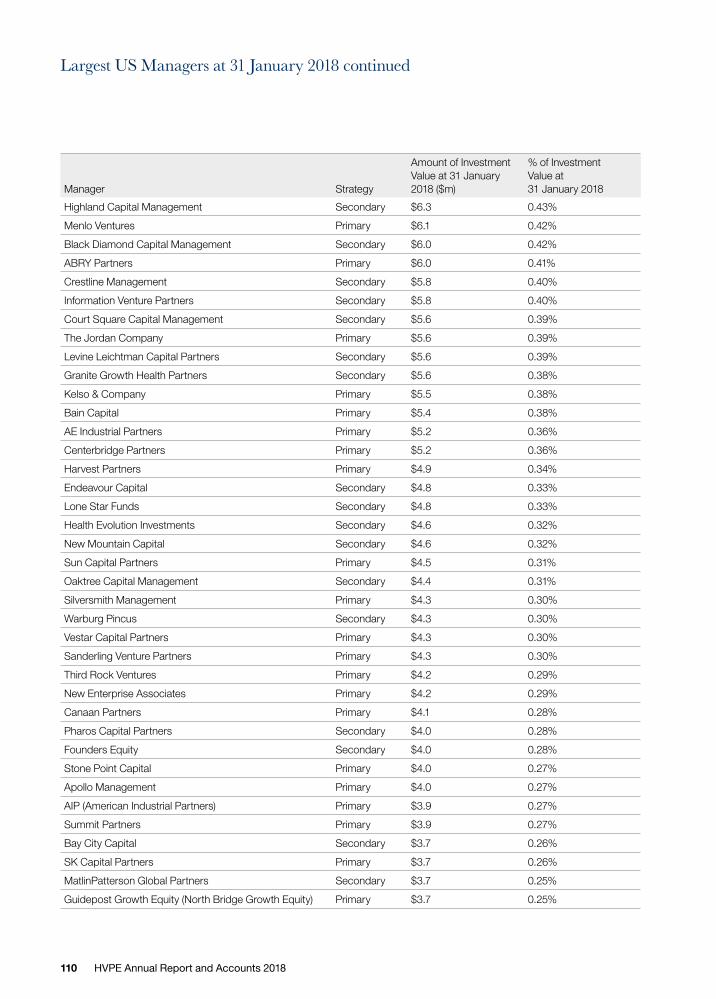
110 HVPE Annual Report and Accounts 2018
Manager Strategy
Amount of Investment Value at 31 January 2018 ($m)
% of Investment Value at 31 January 2018
Highland Capital Management Secondary $6.3 0.43%
Menlo Ventures Primary $6.1 0.42%
Black Diamond Capital Management Secondary $6.0 0.42%
ABRY Partners Primary $6.0 0.41%
Crestline Management Secondary $5.8 0.40%
Information Venture Partners Secondary $5.8 0.40%
Court Square Capital Management Secondary $5.6 0.39%
The Jordan Company Primary $5.6 0.39%
Levine Leichtman Capital Partners Secondary $5.6 0.39%
Granite Growth Health Partners Secondary $5.6 0.38%
Kelso & Company Primary $5.5 0.38%
Bain Capital Primary $5.4 0.38%
AE Industrial Partners Primary $5.2 0.36%
Centerbridge Partners Primary $5.2 0.36%
Harvest Partners Primary $4.9 0.34%
Endeavour Capital Secondary $4.8 0.33%
Lone Star Funds Secondary $4.8 0.33%
Health Evolution Investments Secondary $4.6 0.32%
New Mountain Capital Secondary $4.6 0.32%
Sun Capital Partners Primary $4.5 0.31%
Oaktree Capital Management Secondary $4.4 0.31%
Silversmith Management Primary $4.3 0.30%
Warburg Pincus Secondary $4.3 0.30%
Vestar Capital Partners Primary $4.3 0.30%
Sanderling Venture Partners Primary $4.3 0.30%
Third Rock Ventures Primary $4.2 0.29%
New Enterprise Associates Primary $4.2 0.29%
Canaan Partners Primary $4.1 0.28%
Pharos Capital Partners Secondary $4.0 0.28%
Founders Equity Secondary $4.0 0.28%
Stone Point Capital Primary $4.0 0.27%
Apollo Management Primary $4.0 0.27%
AIP (American Industrial Partners) Primary $3.9 0.27%
Summit Partners Primary $3.9 0.27%
Bay City Capital Secondary $3.7 0.26%
SK Capital Partners Primary $3.7 0.26%
MatlinPatterson Global Partners Secondary $3.7 0.25%
Guidepost Growth Equity (North Bridge Growth Equity) Primary $3.7 0.25%
Largest US Managers at 31 January 2018 continued

111 HVPE Annual Report and Accounts 2018
Governance R
eportFinancial S
tatements
Su
pp
lementary D
ataS
trategic Report
Manager Strategy
Amount of Investment Value at 31 January 2018 ($m)
% of Investment Value at 31 January 2018
Vector Capital Primary $3.6 0.25%
DCM Primary $3.6 0.25%
Nautic Partners Primary $3.6 0.25%
The Wicks Group of Companies Primary $3.6 0.24%
Pfingsten Partners Primary $3.5 0.24%
Arroyo Energy Group Secondary $3.4 0.23%
Sheridan Production Company Secondary $3.2 0.22%
Tenaya Capital Secondary $3.2 0.22%
Marlin Equity Partners Primary $3.1 0.22%
Technology Crossover Ventures Secondary $3.1 0.22%
Bessemer Venture Partners Primary $3.1 0.21%
TOTAL $555.4 38.3%

112 HVPE Annual Report and Accounts 2018
Largest European Managers at 31 January 2018
Based on the Investment Portfolio/ / No external manager represented more than 1.5% of the Investment Portfolio.
/ / As the Investment Manager of the HarbourVest direct funds, HarbourVest Partners, LLC is the largest manager held in HVPE, although not listed here.
/ / The five largest managers represented 5.9% of the Investment Portfolio.
/ / The 25 largest managers represented 15.1% of the Investment Portfolio.
/ / In total, the largest managers (0.2% of invested value or larger) represented 16.8% of the Investment Portfolio.
Manager Strategy
Amount of Investment Value at 31 January 2018 ($m)
% of Investment Value at 31 January 2018
Compass Partners Investments Secondary $21.6 1.49%
Index Ventures Primary $19.4 1.34%
CapVest Equity Partners Secondary $19.4 1.33%
Portobello Capital Secondary $13.3 0.91%
Advent International Corporation Primary $12.0 0.83%
EQT Managers Primary $10.8 0.74%
CVC Capital Partners Primary $10.1 0.70%
Permira Advisers Primary $9.7 0.67%
Inflexion Managers Primary $8.7 0.60%
DH Private Equity Partners (Doughty Hanson & Co.) Secondary $8.5 0.58%
Apax Partners Secondary $8.2 0.57%
Bridgepoint Development Capital Primary $7.3 0.50%
Holtzbrinck Ventures Primary $7.2 0.50%
Waterland Private Equity Investments Primary $6.6 0.45%
Chequers Partenaires Primary $6.5 0.45%
TDR Capital Secondary $6.2 0.42%
PAI Partners Secondary $5.5 0.38%
HitecVision Primary $5.0 0.34%
IK Investment Partners Primary $5.0 0.34%
CGS Management & Co Primary $4.9 0.34%
ECI Partners Primary $4.8 0.33%
Macquarie Capital Funds Secondary $4.6 0.32%
Innova Capital Secondary $4.5 0.31%
Investindustrial Primary $4.5 0.31%
Nordic Capital Primary $4.4 0.31%
Christofferson Robb & Company Secondary $4.0 0.28%
Capvis Equity Partners Primary $4.0 0.28%
Motion Equity Partners (Cognetas) Secondary $4.0 0.27%
Quadriga Capital Primary $3.9 0.27%
AAC Capital Partners Secondary $3.3 0.23%
Cinven Secondary $3.2 0.22%
TowerBrook Capital Partners Primary $3.1 0.22%
TOTAL $244.2 16.83%

113 HVPE Annual Report and Accounts 2018
Governance R
eportFinancial S
tatements
Su
pp
lementary D
ataS
trategic Report
Largest Asia Pacific/Rest of World Managers at 31 January 2018
Based on the Investment Portfolio/ / No external manager represented more than 2.6% of the Investment Portfolio.
/ / As the Investment Manager of the HarbourVest direct funds, HarbourVest Partners, LLC is the largest manager held in HVPE, although not listed here.
/ / The five largest managers represented 6.1% of the Investment Portfolio.
/ / The 25 largest managers represented 14.5% of the Investment Portfolio.
/ / In total, the largest managers (0.2% of invested value or larger) represented 15.8% of the Investment Portfolio.
Manager Strategy
Amount of Investment Value at 31 January 2018 ($m)
% of Investment Value at 31 January 2018
IDG Capital Partners (IDG-Accel China Capital Associates) Secondary $37.8 2.60%
RMB Capital Partners Secondary $13.7 0.94%
Trustbridge Partners Primary $13.6 0.94%
TPG Asia Secondary $13.0 0.90%
DCM Primary $11.0 0.75%
Bain Capital Partners Asia Primary $10.0 0.69%
Helios Investment Partners Primary $9.6 0.66%
Legend Capital Primary $9.5 0.66%
KKR Associates Asia Primary $9.5 0.66%
Advent International (Argentina) Primary $9.2 0.63%
The Abraaj Group Secondary $6.3 0.43%
Mid Europa Partners Secondary $6.1 0.42%
Hahn & Company Primary $5.5 0.38%
IDG Ventures Vietnam Secondary $5.4 0.37%
FIMI Opportunity Funds Primary $5.3 0.36%
Boyu Capital Primary $5.2 0.36%
Clearvue Partners Primary $4.8 0.33%
Archer Capital Primary $4.7 0.32%
CITIC Capital Partners Primary $4.6 0.32%
IDG Ventures India Secondary $4.3 0.30%
CHAMP Ventures Primary $4.3 0.30%
CHAMP Private Equity (Buyout) Primary $4.2 0.29%
ChrysCapital Primary $4.2 0.29%
NewQuest Capital Advisors (HK) Secondary $4.2 0.29%
Everstone Capital Management Primary $4.0 0.28%
Baring Vostok Capital Partners Primary $3.7 0.25%
Actera Partners Primary $3.4 0.24%
Victoria Capital Partners Primary $3.3 0.23%
Turkven Private Equity Primary $3.3 0.22%
Georgian Partners Primary $3.2 0.22%
Capitalworks Equity Partners Primary $3.1 0.21%
TOTAL $230.0 15.84%

114 HVPE Annual Report and Accounts 2018
Largest Buyout Managers at 31 January 2018
Based on the Investment Portfolio/ / No external manager represented more than 1.9% of the Investment Portfolio.
/ / As the Investment Manager of the HarbourVest direct funds, HarbourVest Partners, LLC is the largest manager held in HVPE, although not listed here.
/ / The five largest managers represented 7.2% of the Investment Portfolio.
/ / The 25 largest managers represented 21.8% of the Investment Portfolio.
/ / In total, the largest managers (0.2% of invested value or larger) represented 42.5% of the Investment Portfolio.
Manager Strategy
Amount of Investment Value at 31 January 2018 ($m)
% of Investment Value at 31 January 2018
Thoma Bravo Primary $26.7 1.84%
Compass Partners Investments Secondary $21.6 1.49%
Hellman & Friedman Primary $20.4 1.40%
CapVest Equity Partners Secondary $19.4 1.33%
The Blackstone Group Primary $16.2 1.12%
Welsh, Carson, Anderson & Stowe Secondary $14.8 1.02%
RMB Capital Partners Secondary $13.7 0.94%
Portobello Capital Secondary $13.3 0.91%
TPG Asia Secondary $13.0 0.90%
TPG Capital Secondary $12.8 0.88%
Advent International Primary $12.0 0.83%
GTCR Primary $12.0 0.82%
EQT Managers Primary $10.8 0.74%
Berkshire Partners Primary $10.3 0.71%
CVC Capital Partners Primary $10.1 0.70%
Bain Capital Partners Asia Primary $10.0 0.69%
Permira Advisers Primary $9.7 0.67%
Helios Investment Partners Primary $9.6 0.66%
Advent International (Argentina) Primary $9.2 0.63%
Eos Management Secondary $9.0 0.62%
Inflexion Managers Primary $8.7 0.60%
Thomas H. Lee Company Secondary $8.5 0.59%
DH Private Equity Partners (Doughty Hanson & Co. Ltd.) Secondary $8.5 0.58%
Pamlico Capital Primary $8.5 0.58%
Vista Equity Partners Primary $8.2 0.57%
Apax Partners Secondary $8.2 0.57%
Mid Europa Partners Primary $8.0 0.55%
Lee Equity Partners Secondary $7.9 0.55%
Kohlberg Kravis Roberts & Co. Secondary $7.7 0.53%
Bridgepoint Development Capital Primary $7.3 0.50%
KKR Associates Asia Primary $7.2 0.50%
Leonard Green & Partners Primary $7.1 0.49%

115 HVPE Annual Report and Accounts 2018
Governance R
eportFinancial S
tatements
Su
pp
lementary D
ataS
trategic Report
Manager Strategy
Amount of Investment Value at 31 January 2018 ($m)
% of Investment Value at 31 January 2018
Carlyle US Buyout Secondary $6.9 0.47%
Madison Dearborn Partners Secondary $6.7 0.46%
Waterland Private Equity Investments Primary $6.6 0.45%
Silver Lake Management Primary $6.5 0.45%
Chequers Partenaires Primary $6.5 0.45%
Providence Equity Partners Secondary $6.4 0.44%
The Abraaj Group Secondary $6.3 0.43%
TDR Capital Secondary $6.2 0.42%
Court Square Capital Management Secondary $5.6 0.39%
The Jordan Company Primary $5.6 0.39%
Levine Leichtman Capital Partners Secondary $5.6 0.38%
Kelso & Company Primary $5.5 0.38%
Hahn & Company Primary $5.5 0.38%
PAI Partners Secondary $5.5 0.38%
Bain Capital Primary $5.4 0.38%
FIMI Opportunity Funds Primary $5.3 0.36%
AE Industrial Partners Primary $5.2 0.36%
HitecVision Primary $5.0 0.34%
IK Investment Partners Primary $5.0 0.34%
CGS Management & Co Primary $4.9 0.34%
ECI Partners Primary $4.8 0.33%
Endeavour Capital Secondary $4.8 0.33%
Marlin Equity Partners Primary $4.7 0.33%
Archer Capital Primary $4.7 0.32%
CITIC Capital Partners Primary $4.6 0.32%
Harvest Partners Primary $4.6 0.32%
New Mountain Capital Secondary $4.6 0.32%
Innova Capital Secondary $4.5 0.31%
Investindustrial Primary $4.5 0.31%
Nordic Capital Primary $4.4 0.31%
CHAMP Ventures Primary $4.3 0.30%
Vestar Capital Partners Primary $4.3 0.30%
CHAMP Private Equity (Buyout) Primary $4.2 0.29%
Capvis Equity Partners Primary $4.0 0.28%
Founders Equity Secondary $4.0 0.28%
Apollo Management Primary $4.0 0.27%
Motion Equity Partners (Cognetas) Secondary $4.0 0.27%
AIP (American Industrial Partners) Primary $3.9 0.27%
Quadriga Capital Primary $3.9 0.27%

116 HVPE Annual Report and Accounts 2018
Manager Strategy
Amount of Investment Value at 31 January 2018 ($m)
% of Investment Value at 31 January 2018
SK Capital Partners Primary $3.7 0.26%
Baring Vostok Capital Partners Primary $3.7 0.25%
Vector Capital Primary $3.7 0.25%
ABRY Partners Primary $3.6 0.25%
Nautic Partners Primary $3.6 0.25%
Pfingsten Partners Primary $3.5 0.24%
Nova Capital Management Secondary $3.5 0.24%
Actera Partners Primary $3.5 0.24%
Victoria Capital Partners Primary $3.3 0.23%
AAC Capital Partners Secondary $3.3 0.23%
Turkven Private Equity Primary $3.3 0.22%
Cinven Secondary $3.2 0.22%
TowerBrook Capital Partners Primary $3.2 0.22%
Capitalworks Equity Partners Primary $3.1 0.21%
TOTAL $617.6 42.54%
Largest Buyout Managers at 31 January 2018 continued

117 HVPE Annual Report and Accounts 2018
Governance R
eportFinancial S
tatements
Su
pp
lementary D
ataS
trategic Report
Based on the Investment Portfolio/ / No external manager represented more than 2.6% of the Investment Portfolio.
/ / As the Investment Manager of the HarbourVest direct funds, HarbourVest Partners, LLC is the largest manager held in HVPE, although not listed here.
/ / The five largest managers represented 7.4% of the Investment Portfolio.
/ / The 25 largest managers represented 18.3% of the Investment Portfolio.
/ / In total, the largest managers (0.2% of invested value or larger) represented 23.2% of the Investment Portfolio.
Manager Strategy
Amount of Investment Value at 31 January 2018 ($m)
% of Investment Value at 31 January 2018
IDG Capital Partners (IDG-Accel China Capital Associates) Secondary $37.8 2.60%
Index Ventures Primary $20.5 1.41%
Insight Venture Management Primary $20.0 1.38%
Lightspeed Venture Partners Primary $15.1 1.04%
DCM Primary $14.6 1.00%
Trustbridge Partners Primary $13.6 0.94%
Battery Ventures Primary $13.1 0.91%
Redpoint Ventures Primary $12.7 0.88%
Accel Partners Primary $12.3 0.85%
Spark Capital Primary $10.3 0.71%
Bain Capital Ventures Primary $10.0 0.69%
Legend Capital Primary $9.5 0.66%
Andreessen Horowitz Primary $7.4 0.51%
Holtzbrinck Ventures Primary $7.2 0.50%
Oak Investment Partners Primary $7.0 0.48%
Sageview Capital Partners Secondary $6.5 0.44%
Kleiner Perkins Caufield & Byers Primary $6.4 0.44%
Menlo Ventures Primary $6.1 0.42%
Information Venture Partners Secondary $6.1 0.42%
Granite Growth Health Partners Secondary $5.6 0.38%
IDG Ventures Vietnam Secondary $5.4 0.37%
Boyu Capital Primary $5.2 0.36%
Clearvue Partners Primary $4.9 0.33%
Health Evolution Investments Secondary $4.6 0.32%
Silversmith Management Primary $4.3 0.30%
IDG Ventures India Secondary $4.3 0.30%
Sanderling Venture Partners Primary $4.3 0.30%
Third Rock Ventures Primary $4.2 0.29%
ChrysCapital Primary $4.2 0.29%
New Enterprise Associates Primary $4.2 0.29%
NewQuest Capital Advisors (HK) Secondary $4.2 0.29%
Canaan Partners Primary $4.1 0.28%
Largest Venture Capital/Growth Equity Managers at 31 January 2018

118 HVPE Annual Report and Accounts 2018
Largest Venture Capital/Growth Equity Managers at 31 January 2018 continued
Manager Strategy
Amount of Investment Value at 31 January 2018 ($m)
% of Investment Value at 31 January 2018
Pharos Capital Partners Secondary $4.0 0.28%
Stone Point Capital Primary $4.0 0.27%
TA Associates Primary $3.8 0.26%
Bay City Capital Secondary $3.7 0.26%
Guidepost Growth Equity (North Bridge Growth Equity) Primary $3.7 0.25%
Warburg Pincus Secondary $3.7 0.25%
Summit Partners Primary $3.4 0.23%
Georgian Partners Primary $3.2 0.22%
Tenaya Capital Secondary $3.2 0.22%
Technology Crossover Ventures Secondary $3.1 0.21%
Bessemer Venture Partners Primary $3.1 0.21%
Everstone Capital Management Primary $2.9 0.20%
TOTAL $337.5 23.24%

119 HVPE Annual Report and Accounts 2018
Governance R
eportFinancial S
tatements
Su
pp
lementary D
ataS
trategic Report
Based on the Investment Portfolio/ / No external manager represented more than 0.6% of the Investment Portfolio.
/ / As the Investment Manager of the HarbourVest direct funds, HarbourVest Partners, LLC is the largest manager held in HVPE, although not listed here.
/ / The five largest managers represented 2.3% of the Investment Portfolio.
/ / In total, the largest managers (0.2% of invested value or larger) represented 4.2% of the Investment Portfolio.
Manager Strategy
Amount of Investment Value at 31 January 2018 ($m)
% of Investment Value at 31 January 2018
1901 Partners Management Secondary $7.6 0.52%
Gridiron Energy Management Secondary $7.4 0.51%
Highland Capital Management Secondary $6.3 0.43%
Black Diamond Capital Management Secondary $6.0 0.42%
Crestline Management Secondary $5.8 0.40%
Lone Star Funds Secondary $4.7 0.33%
Macquarie Capital Funds Secondary $4.6 0.32%
Oaktree Capital Management Secondary $4.6 0.31%
Christofferson Robb & Company Secondary $4.0 0.28%
MatlinPatterson Global Partners Secondary $3.7 0.25%
Arroyo Energy Group Secondary $3.4 0.23%
Sheridan Production Company Secondary $3.2 0.22%
TOTAL $61.3 4.22%
Largest Real Assets/Other Managers at 31 January 2018
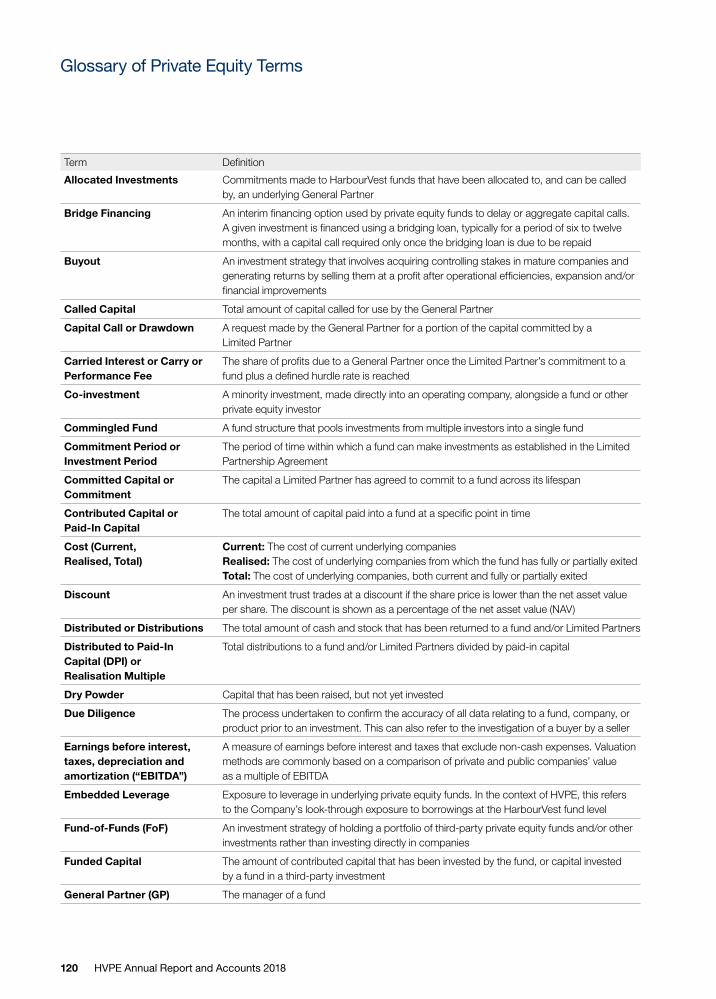
120 HVPE Annual Report and Accounts 2018
Term Definition
Allocated Investments Commitments made to HarbourVest funds that have been allocated to, and can be called by, an underlying General Partner
Bridge Financing An interim financing option used by private equity funds to delay or aggregate capital calls. A given investment is financed using a bridging loan, typically for a period of six to twelve months, with a capital call required only once the bridging loan is due to be repaid
Buyout An investment strategy that involves acquiring controlling stakes in mature companies and generating returns by selling them at a profit after operational efficiencies, expansion and/or financial improvements
Called Capital Total amount of capital called for use by the General Partner
Capital Call or Drawdown A request made by the General Partner for a portion of the capital committed by a Limited Partner
Carried Interest or Carry or Performance Fee
The share of profits due to a General Partner once the Limited Partner’s commitment to a fund plus a defined hurdle rate is reached
Co-investment A minority investment, made directly into an operating company, alongside a fund or other private equity investor
Commingled Fund A fund structure that pools investments from multiple investors into a single fund
Commitment Period or Investment Period
The period of time within which a fund can make investments as established in the Limited Partnership Agreement
Committed Capital or Commitment
The capital a Limited Partner has agreed to commit to a fund across its lifespan
Contributed Capital or Paid-In Capital
The total amount of capital paid into a fund at a specific point in time
Cost (Current, Realised, Total)
Current: The cost of current underlying companiesRealised: The cost of underlying companies from which the fund has fully or partially exitedTotal: The cost of underlying companies, both current and fully or partially exited
Discount An investment trust trades at a discount if the share price is lower than the net asset value per share. The discount is shown as a percentage of the net asset value (NAV)
Distributed or Distributions The total amount of cash and stock that has been returned to a fund and/or Limited Partners
Distributed to Paid-In Capital (DPI) or Realisation Multiple
Total distributions to a fund and/or Limited Partners divided by paid-in capital
Dry Powder Capital that has been raised, but not yet invested
Due Diligence The process undertaken to confirm the accuracy of all data relating to a fund, company, or product prior to an investment. This can also refer to the investigation of a buyer by a seller
Earnings before interest, taxes, depreciation and amortization (“EBITDA”)
A measure of earnings before interest and taxes that exclude non-cash expenses. Valuation methods are commonly based on a comparison of private and public companies’ value as a multiple of EBITDA
Embedded Leverage Exposure to leverage in underlying private equity funds. In the context of HVPE, this refers to the Company’s look-through exposure to borrowings at the HarbourVest fund level
Fund-of-Funds (FoF) An investment strategy of holding a portfolio of third-party private equity funds and/or other investments rather than investing directly in companies
Funded Capital The amount of contributed capital that has been invested by the fund, or capital invested by a fund in a third-party investment
General Partner (GP) The manager of a fund
Glossary of Private Equity Terms

121 HVPE Annual Report and Accounts 2018
Governance R
eportFinancial S
tatements
Su
pp
lementary D
ataS
trategic Report
Term Definition
Growth Capital or Growth Equity
Investment in newly-mature companies looking to raise funds, often to expand or restructure operations, enter new markets, or finance an acquisition
Initial Public Offering (IPO) The first offering of stock by a company to the public on a regulated exchange
Internal Rate of Return (IRR)(Gross, Net, Realised Gross)
A measure of the absolute annual rate of return of an investment that takes both the timing and magnitude of cash flows into account, calculated using contributed capital, distributions, and the value of unrealised investmentsGross: Without fees and carried interest taken into accountNet: With fees and carried interest deductedRealised Gross: The return from underlying holdings from which the fund has already fully or partially exited, without fees and carried interest taken into account
J-Curve A term given to the typical shape adopted by the annual returns from a private equity fund during its lifecycle when graphed. Due to the investment process, capital calls and fees precede value creation and potential distributions
Limited Partner (LP) The investors in a Limited Partnership—the typical structure of a private equity fund. Limited Partners are not involved in the day-to-day management of a fund
Limited Partnership Agreement (LPA)
The document which constitutes and defines a Limited Partnership, the legal structure typically adopted by private equity funds
Management Fee The fee paid to a fund, typically a percentage of the Limited Partner’s commitment
Mergers and Acquisitions (M&A)
The consolidation of companies. For example, where the ownership of a company in the underlying portfolio is transferred to, or combined with, another entity
Mezzanine Finance/Debt An investment strategy that typically includes junior debt and senior equity, often with the option to convert debt into equity in the event of default
Net Asset Value (NAV) or Current Value or Residual Value
The market value of all current/unrealised investments
Preferred Return or Hurdle Rate
A minimum annual rate of return, determined in the Limited Partnership Agreement, that a fund must achieve before the General Partner may receive carried interest
Primary Fund or Primaries A private equity fund that invests directly in privately-held companies rather than in other investment vehicles
Private Markets Investments made in non-public companies through privately negotiated transactions
Real Assets An investment strategy that invests in physical assets that derive value and generate returns from their substance and properties, including infrastructure, real estate, agricultural land, oil and gas, and other commodities
Realised Investment or Exit An underlying holding from which the General Partner has exited
Realised Value or Proceeds The returns generated from the liquidation or realisation of underlying holdings
Realised Value to Total Cost (RV/TC) Multiple
The returns generated from the liquidation or realisation of underlying holdings divided by the cost of all holdings, both remaining and exited
Recapitalisation A refinancing strategy used by private equity funds, typically involving an increase in the level of borrowing to enable an early cash distribution to investors
Secondary Fund or Secondaries
A fund that purchases pre-existing interests in private equity funds or portfolios of operating companies
Special Situations An opportunistic investment strategy that looks to take advantage of market dislocations and unique situations to invest in private companies at discounts to their “fair” market value
Total Value The fund’s total market value plus any capital distributions already made

122 HVPE Annual Report and Accounts 2018
Glossary of Private Equity Terms continued
Term Definition
Total Value/Paid-In (TVPI) or Total Value/ Contributed Multiple
The fund’s total market value plus any capital distributions already made divided by the amount of capital already paid into the fund by investors
Total Value/Total Cost (TV/TC) Multiple
The total value divided by the total cost to date
Unallocated Investments Commitments made to HarbourVest funds that have not been allocated to, and cannot be called by, an underlying General Partner
Unfunded The portion of investors’ capital commitment that has yet to be “drawn down” or called by a fund manager
Uplift Increase in value received upon realisation of an investment relative to its carrying value prior to realisation
Valuation Multiple The market value of an asset relative to a key financial metric
Venture Capital An investment strategy that generates returns by backing startup and early-stage companies that are believed to have long-term growth potential
Vintage Year Usually the year in which capital is first called by a particular fund, though definitions can vary based on the type of fund or investment

123 HVPE Annual Report and Accounts 2018
Governance R
eportFinancial S
tatements
Su
pp
lementary D
ataS
trategic Report
Disclosures
InvestmentsThe companies represented within this report are provided for illustrative purposes only, as example portfolio holdings. There are over 7,700 individual companies in the HVPE portfolio, with no one company comprising more than 1.5% of the entire portfolio.
The deal summaries, general partners (managers), and/or companies shown within the report are intended for illustrative purposes only. While they may represent an actual investment or relationship in the HVPE portfolio, there is no guarantee they will remain in the portfolio in the future.
Past performance is no guarantee of future returns.
Forward-Looking StatementsThis report contains certain forward-looking statements.
Forward-looking statements relate to expectations, beliefs, projections, future plans and strategies, anticipated events or trends and similar expressions concerning matters that are not historical facts. In some cases, for-ward-looking statements can be identified by terms such as “anticipate,” “believe,” “could,” “estimate,” “expect,” “intend,” “may,” “plan,” “potential,” “should,” “will,” and “would,” or the negative of those terms or other comparable terminology. The forward-looking statements are based on the Investment Manager’s beliefs, assumptions, and expectations of future performance and market developments, taking into account all information currently available. These beliefs, assumptions, and expectations can change as a result of many possible events or factors, not all of which are known or are within the Investment Manager’s control. If a change occurs, the Company’s business, financial condition, liquidity, and results of operations may vary materially from those expressed in forward-looking statements.
By their nature, forward-looking statements involve known and unknown risks and uncertainties because they relate to events, and depend on circumstances, that may or may not occur in the future. Forward-looking statements are not guarantees of future performance. Any forward-looking statements are only made as at the date of this document, and the Investment Manager neither intends nor assumes any obligation to update forward-looking statements set forth in this document whether as a result of new information, future events, or otherwise, except as required by law or other applicable regulation.
In light of these risks, uncertainties, and assumptions, the events described by any such forward-looking statements might not occur. The Investment Manager qualifies any and all of its forward-looking statements by these cautionary factors.
Please keep this cautionary note in mind while reading this report.
Some of the factors that could cause actual results to vary from those expressed in forward-looking statements include, but are not limited to:
/ / the factors described in this report;
/ / the rate at which HVPE deploys its capital in investments and achieves expected rates of return;
/ / HarbourVest’s ability to execute its investment strategy, including through the identification of a sufficient number of appropriate investments;
/ / the ability of third-party managers of funds in which the HarbourVest funds are invested and of funds in which the Company may invest through parallel investments to execute their own strategies and achieve intended returns;

124 HVPE Annual Report and Accounts 2018
Disclosures continued
/ / the continuation of the Investment Manager as manager of the Company’s investments, the continued affiliation with HarbourVest of its key investment professionals, and the continued willingness of HarbourVest to sponsor the formation of and capital raising by, and to manage, new private equity funds;
/ / HVPE’s financial condition and liquidity, including its ability to access or obtain new sources of financing at attractive rates in order to fund short-term liquidity needs in accordance with the investment strategy and commitment policy;
/ / changes in the values of, or returns on, investments that the Company makes;
/ / changes in financial markets, interest rates or industry, general economic or political conditions; and
/ / the general volatility of the capital markets and the market price of HVPE’s shares.
Publication and Calculation of Net Asset ValueThe NAV of the Company is equal to the value of its total assets less its total liabilities. The NAV per share of each class is calculated by dividing the net asset value of the relevant class account by the number of shares of the relevant class in issue on that day. The Company intends to publish the estimated NAV per share and the NAV per share for the Ordinary shares as calculated, monthly in arrears, as at each month-end, generally within 15 days.
Regulatory InformationHVPE is required to comply with the Listing, Disclosure Guidance and Transparency Rules of the Financial Conduct Authority in the United Kingdom (the “LPDGT Rules”). It is also authorised by the Guernsey Financial Services Commission as an authorised closed-ended investment scheme under the Protection of Investors (Bailiwick of Guernsey) Law, 1987, as amended (the “POI Law”). HVPE is subject to certain ongoing requirements under the LPDGT Rules and the POI Law and certain rules promulgated thereunder relating to the disclosure of certain information to investors, including the publication of annual and half-yearly financial reports.

Key Information
Exchanges London Stock Exchange (Main Market)
TickerHVPE
Listing date9 September 2015 (LSE Main Market)2 May 2010 (LSE SFM)6 December 2007 (Euronext – since delisted)
Fiscal year end31 January
Base currencyUS dollars
ISINGG00B28XHD63
SEDOL (SFM)BR30MJB
BloombergHVPE LN
ReutersHVPEa.L
Common code032908187
Investment ManagerHarbourVest Advisers L.P. (affiliate of HarbourVest Partners, LLC)
RegistrationFinancial Conduct Authority
Fund consentGuernsey Financial Services Commission
Outstanding shares79,862,486 Ordinary Shares
2018 Calendar
Monthly NAV estimate: Generally within 15 Calendar days of Month End
Semi-annual report and unaudited consolidated financial statements: October 2018
Company Advisors
Investment ManagerHarbourVest Advisers L.P.c/o HarbourVest Partners, LLCOne Financial CenterBoston MA 02111 US Tel +1 617 348 3707
AuditorsErnst & Young LLPRoyal ChambersSt Julian’s AvenueSt Peter PortGuernsey GY1 4AFTel +44 1481 717 400
Company Secretary and AdministratorTo 11 May 2018:JTC Fund Solutions (Guernsey) LimitedGround FloorDorey CourtAdmiral ParkSt Peter PortGuernsey GY1 4EUTel +44 1481 702 400wwww.jtcgroup.com
From 12 May 2018BNP Paribas Securities ServicesBNP Paribas HouseSt Julian’s AvenueSt Peter PortGuernsey GY1 1WATel +44 1481 750 800 www.bnpparibas.je
Swiss RepresentativeHugo Fund Services SA6 Cours de Rive1204 GenevaSwitzerland
Swiss Paying AgentBanque Cantonale De Genève17 Quai de l’Ile1211 Geneva 2Switzerland
Joint Corporate BrokersJefferies Hoare GovettVintners Place 68 Upper Thames StreetLondon EC4V 3BJ UK Tel +44 20 7029 8000
J.P. Morgan Cazenove*25 Bank StreetCanary WharfLondon E14 5JP UK Tel +44 20 7314 7361
* J.P. Morgan Securities Ltd., which conducts its UK investment banking activities as J.P. Morgan Cazenove.
RegistrarLink Asset ServicesThe Registry34 Beckenham RoadBeckenhamKent BR3 4TU UKTel +44 (0)871 664 0300 2260Tel +44 (0)20 8369 3399 (outside UK)
Registered Office
HarbourVest Global Private Equity LimitedCompany Registration Number: 47907To 11 May 2018:Ground FloorDorey CourtAdmiral ParkSt Peter PortGuernsey GY1 2HT
From 12 May 2018:BNP Paribas HouseSt Julian’s AvenueSt Peter PortGuernsey GY1 1WA

US
HV
PE
An
nu
al Rep
ort an
d A
ccou
nts 2018
HarbourVest Global Private Equity LimitedCompany RegistrationNumber: 47907
www.hvpe.com