Embed Size (px)
Citation preview
Retail Investor Presentation
Long Gate S.C.
Ellicott City, MD
North America’s Largest Owner & Operator of
Neighborhood & Community Shopping Centers
The statements in this presentation, including targets and assumptions, state the Company’s and management’s hopes, intentions, beliefs,
expectations or projections of the future and are forward-looking statements. It is important to note that the Company’s actual results could
differ materially from those projected in such forward-looking statements. Factors that could cause actual results to differ materially from
current expectations include the key assumptions contained with this presentation, general economic conditions, local real estate
conditions, increases in interest rates, foreign currency exchange rates, increases in operating costs and real estate taxes. Additional
information concerning factors that could cause actual results to differ materially from those forward-looking statements is contained from
time to time in the Company’s SEC filings, including but not limited to the Company’s report on Form 10-K. Copies of each filing may be
obtained from the Company or the SEC.
Safe Harbor
Mesa Riverview
Mesa, AZ
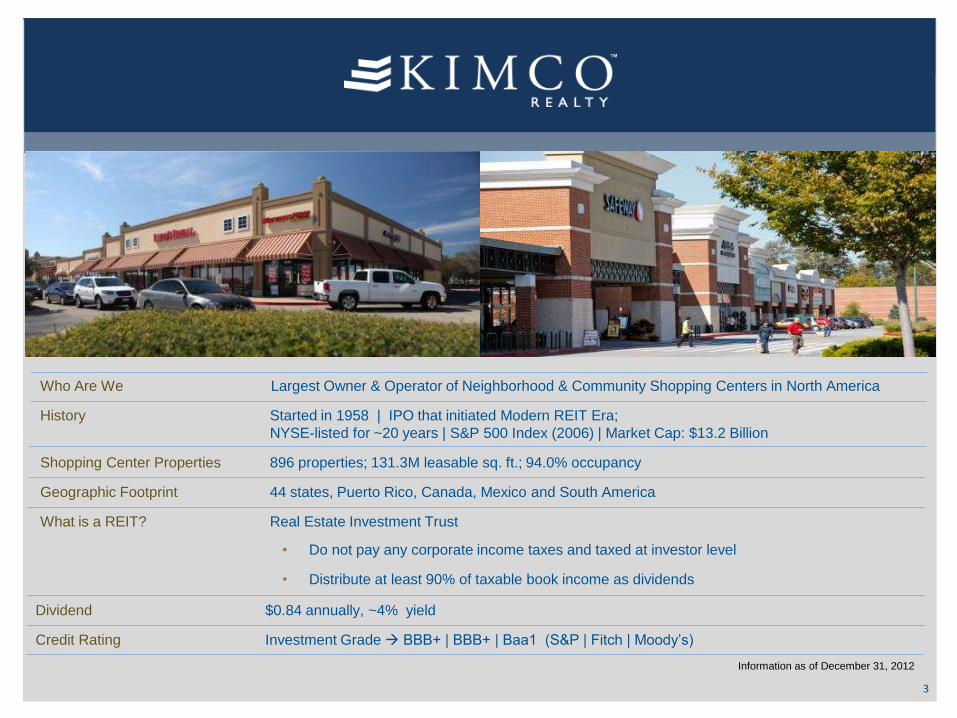
Who Are We Largest Owner & Operator of Neighborhood & Community Shopping Centers in North America
History Started in 1958 | IPO that initiated Modern REIT Era;
NYSE-listed for ~20 years | S&P 500 Index (2006) | Market Cap: $13.2 Billion
Shopping Center Properties 896 properties; 131.3M leasable sq. ft.; 94.0% occupancy
Geographic Footprint 44 states, Puerto Rico, Canada, Mexico and South America
What is a REIT? Real Estate Investment Trust
Information as of December 31, 2012
3
• Do not pay any corporate income taxes and taxed at investor level
• Distribute at least 90% of taxable book income as dividends
Dividend $0.84 annually, ~4% yield
Credit Rating Investment Grade BBB+ | BBB+ | Baa1 (S&P | Fitch | Moody’s)
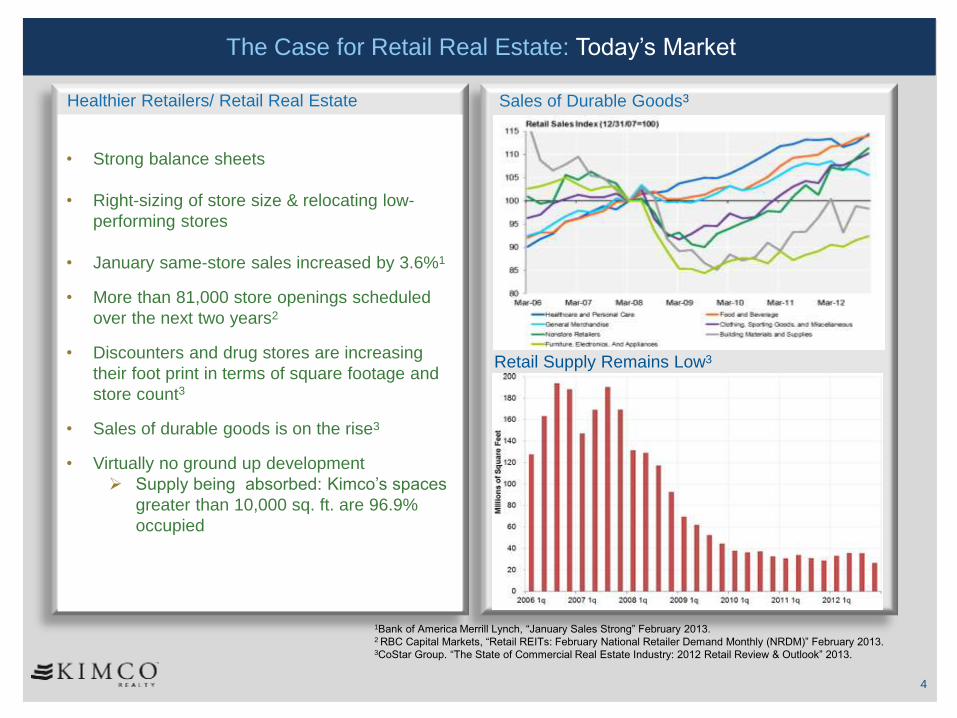
1Bank of America Merrill Lynch, “January Sales Strong” February 2013.
2 RBC Capital Markets, “Retail REITs: February National Retailer Demand Monthly (NRDM)” February 2013.
3CoStar Group. “The State of Commercial Real Estate Industry: 2012 Retail Review & Outlook” 2013.
• Strong balance sheets
• Right-sizing of store size & relocating low-
performing stores
• January same-store sales increased by 3.6%1
• More than 81,000 store openings scheduled
over the next two years2
• Discounters and drug stores are increasing
their foot print in terms of square footage and
store count3
• Sales of durable goods is on the rise3
• Virtually no ground up development
Supply being absorbed: Kimco’s spaces
greater than 10,000 sq. ft. are 96.9%
occupied
Retail Supply Remains Low3
Sales of Durable Goods3
The Case for Retail Real Estate: Today’s Market
Healthier Retailers/ Retail Real Estate
4
Millside Plaza
Delran, New Jersey
5
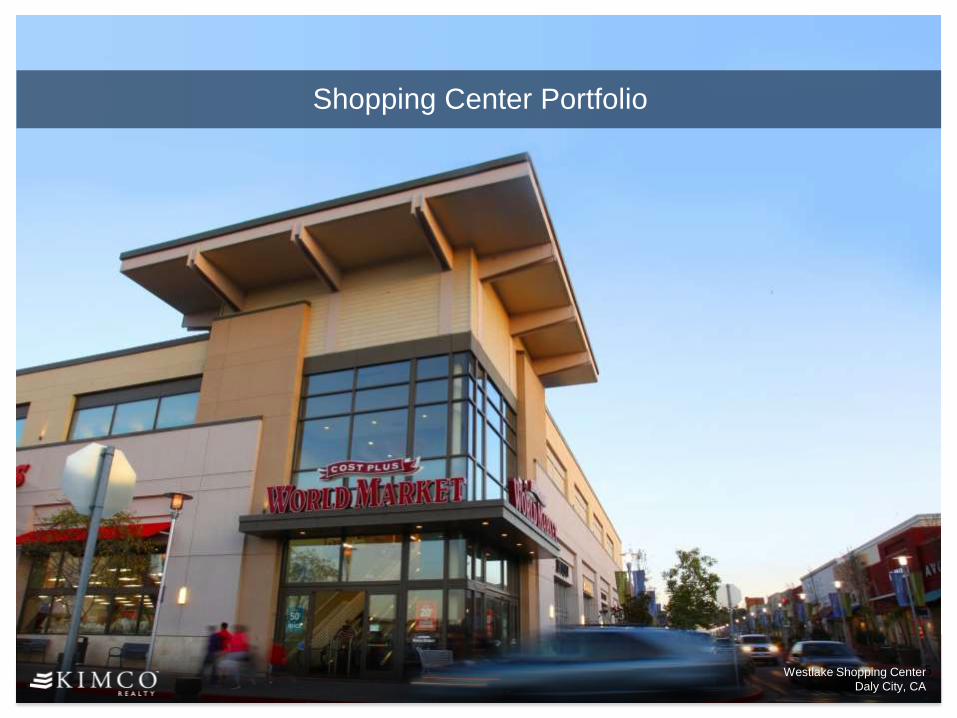
Shopping Center Portfolio
Westlake Shopping Center
Daly City, CA
Note: Amounts are shown on gross basis. Centers & square footage include properties not in
occupancy. Information as of December 31, 2012.
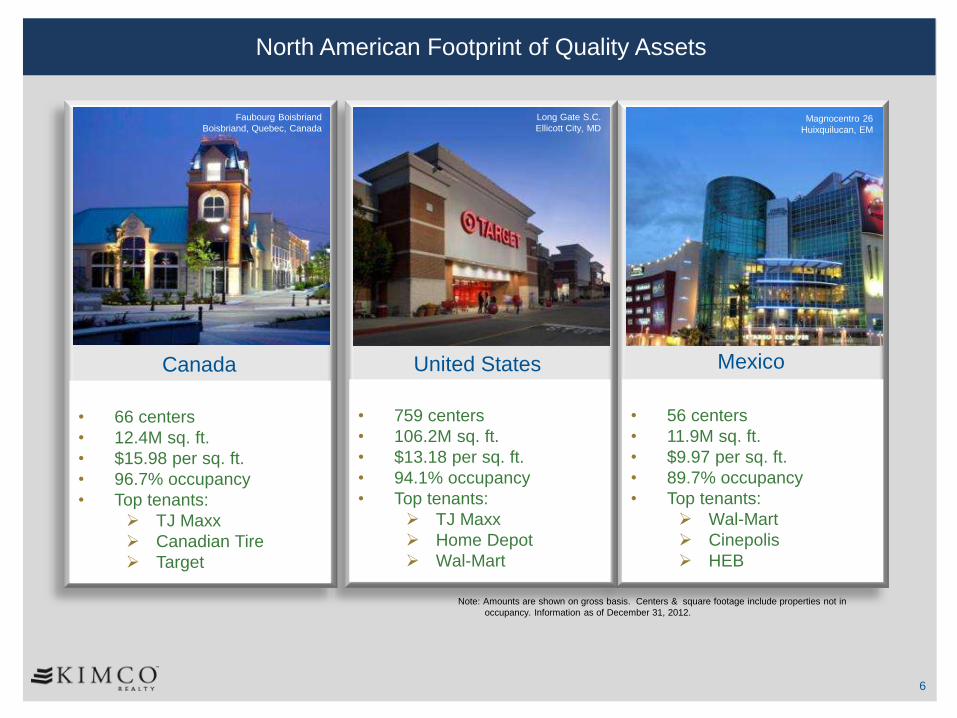
North American Footprint of Quality Assets
Canada United States Mexico
• 66 centers
• 12.4M sq. ft.
• $15.98 per sq. ft.
• 96.7% occupancy
• Top tenants:
TJ Maxx
Canadian Tire
Target
• 759 centers
• 106.2M sq. ft.
• $13.18 per sq. ft.
• 94.1% occupancy
• Top tenants:
TJ Maxx
Home Depot
Wal-Mart
• 56 centers
• 11.9M sq. ft.
• $9.97 per sq. ft.
• 89.7% occupancy
• Top tenants:
Wal-Mart
Cinepolis
HEB
Faubourg Boisbriand
Boisbriand, Quebec, Canada
Long Gate S.C.
Ellicott City, MD Magnocentro 26
Huixquilucan, EM
6
7
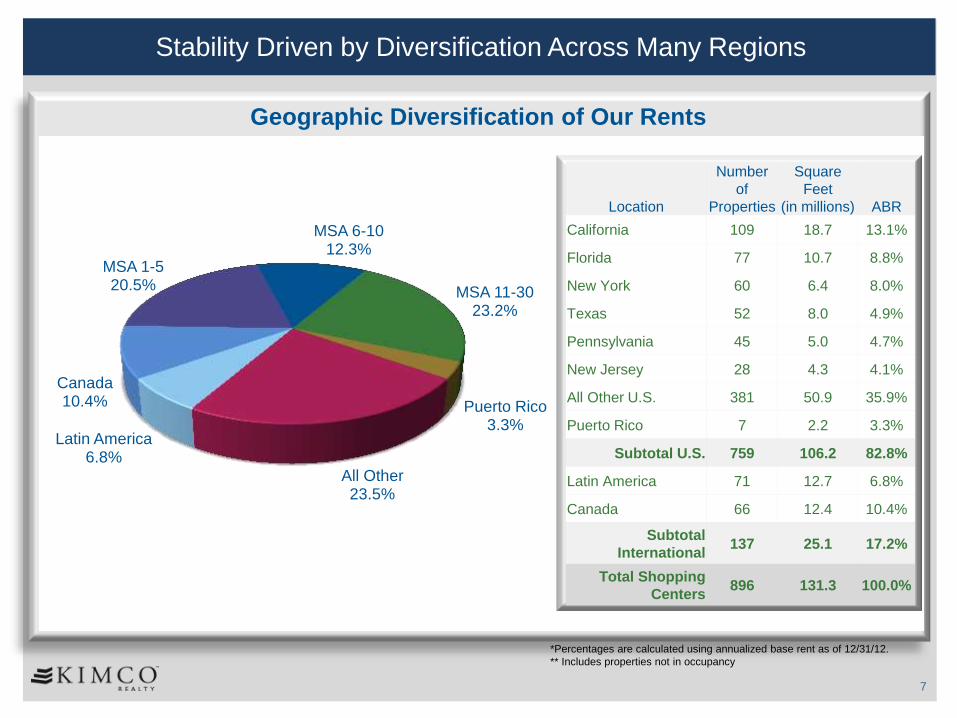
Stability Driven by Diversification Across Many Regions
Geographic Diversification of Our Rents
Latin America 6.8%
Canada 10.4%
MSA 1-5 20.5%
MSA 6-10 12.3%
MSA 11-30 23.2%
Puerto Rico 3.3%
All Other 23.5%
Location
Number
of
Properties
Square
Feet
(in millions) ABR
California 109 18.7 13.1%
Florida 77 10.7 8.8%
New York 60 6.4 8.0%
Texas 52 8.0 4.9%
Pennsylvania 45 5.0 4.7%
New Jersey 28 4.3 4.1%
All Other U.S. 381 50.9 35.9%
Puerto Rico 7 2.2 3.3%
Subtotal U.S. 759 106.2 82.8%
Latin America 71 12.7 6.8%
Canada 66 12.4 10.4%
Subtotal
International 137 25.1 17.2%
Total Shopping
Centers 896 131.3 100.0%
*Percentages are calculated using annualized base rent as of 12/31/12.
** Includes properties not in occupancy
* Percentages are calculated using annualized base rent as of 12/31/12.
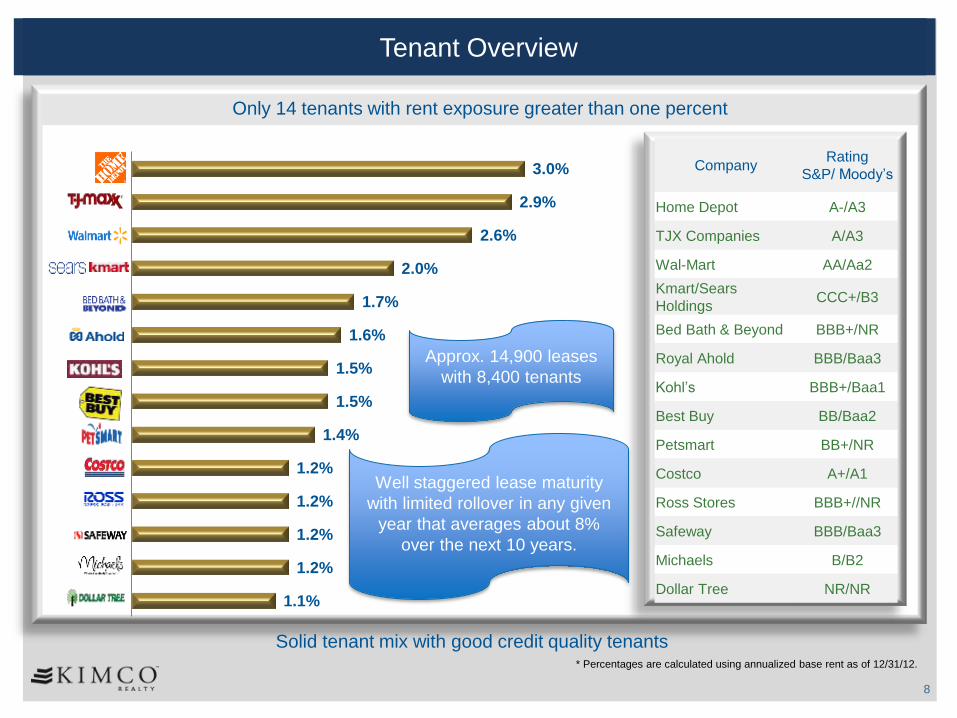
Only 14 tenants with rent exposure greater than one percent
8
Tenant Overview
3.0%
2.9%
2.6%
2.0%
1.7%
1.6%
1.5%
1.5%
1.4%
1.2%
1.2%
1.2%
1.2%
1.1%
Well staggered lease maturity
with limited rollover in any given
year that averages about 8%
over the next 10 years.
Approx. 14,900 leases
with 8,400 tenants
Company Rating
S&P/ Moody’s
Home Depot A-/A3
TJX Companies A/A3
Wal-Mart AA/Aa2
Kmart/Sears
Holdings CCC+/B3
Bed Bath & Beyond BBB+/NR
Royal Ahold BBB/Baa3
Kohl’s BBB+/Baa1
Best Buy BB/Baa2
Petsmart BB+/NR
Costco A+/A1
Ross Stores BBB+//NR
Safeway BBB/Baa3
Michaels B/B2
Dollar Tree NR/NR
Solid tenant mix with good credit quality tenants
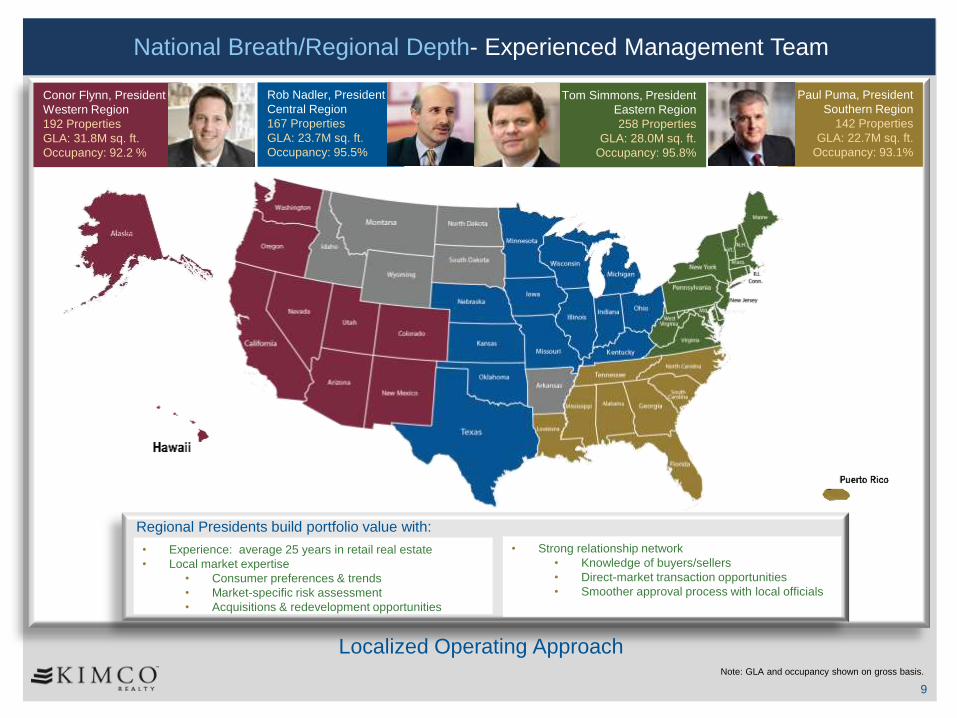
National Breath/Regional Depth- Experienced Management Team
9
Paul Puma, President
Southern Region
142 Properties
GLA: 22.7M sq. ft.
Occupancy: 93.1%
• Strong relationship network
• Knowledge of buyers/sellers
• Direct-market transaction opportunities
• Smoother approval process with local officials
Regional Presidents build portfolio value with:
• Experience: average 25 years in retail real estate
• Local market expertise
• Consumer preferences & trends
• Market-specific risk assessment
• Acquisitions & redevelopment opportunities
Localized Operating Approach
Rob Nadler, President
Central Region
167 Properties
GLA: 23.7M sq. ft.
Occupancy: 95.5%
Tom Simmons, President
Eastern Region
258 Properties
GLA: 28.0M sq. ft.
Occupancy: 95.8%
Conor Flynn, President
Western Region
192 Properties
GLA: 31.8M sq. ft.
Occupancy: 92.2 %
Note: GLA and occupancy shown on gross basis.
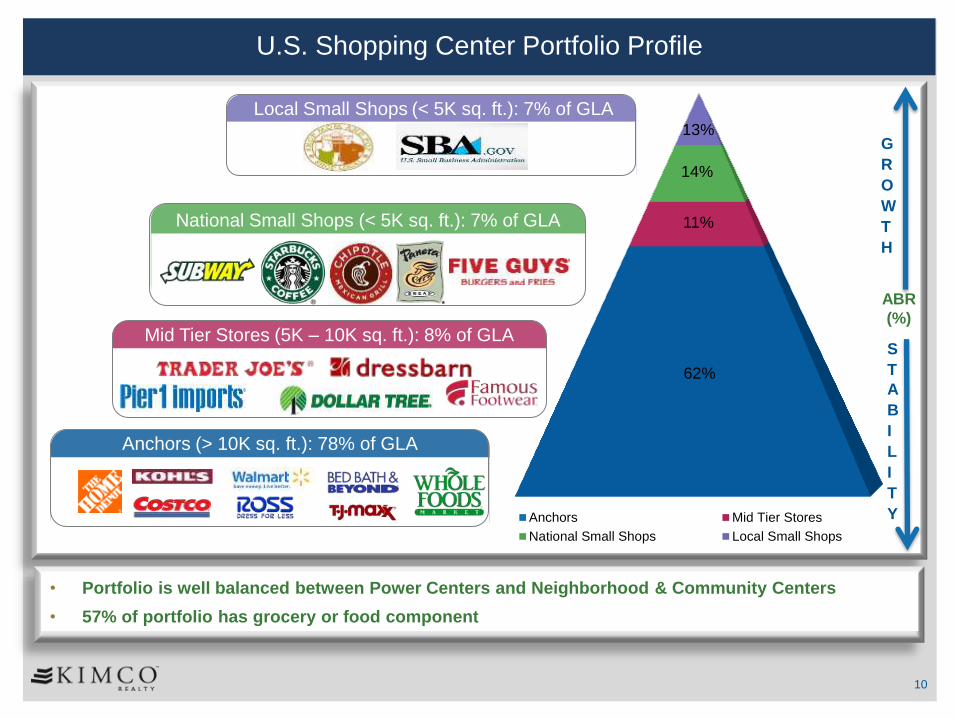
U.S. Shopping Center Portfolio Profile
10
Mid Tier Stores (5K – 10K sq. ft.): 8% of GLA
National Small Shops (< 5K sq. ft.): 7% of GLA
Anchors (> 10K sq. ft.): 78% of GLA
Local Small Shops (< 5K sq. ft.): 7% of GLA
G
R
O
W
T
H
ABR
(%)
• Portfolio is well balanced between Power Centers and Neighborhood & Community Centers
• 57% of portfolio has grocery or food component
S
T
A
B
I
L
I
T
Y
62%
11%
14%
13%
Anchors Mid Tier Stores
National Small Shops Local Small Shops
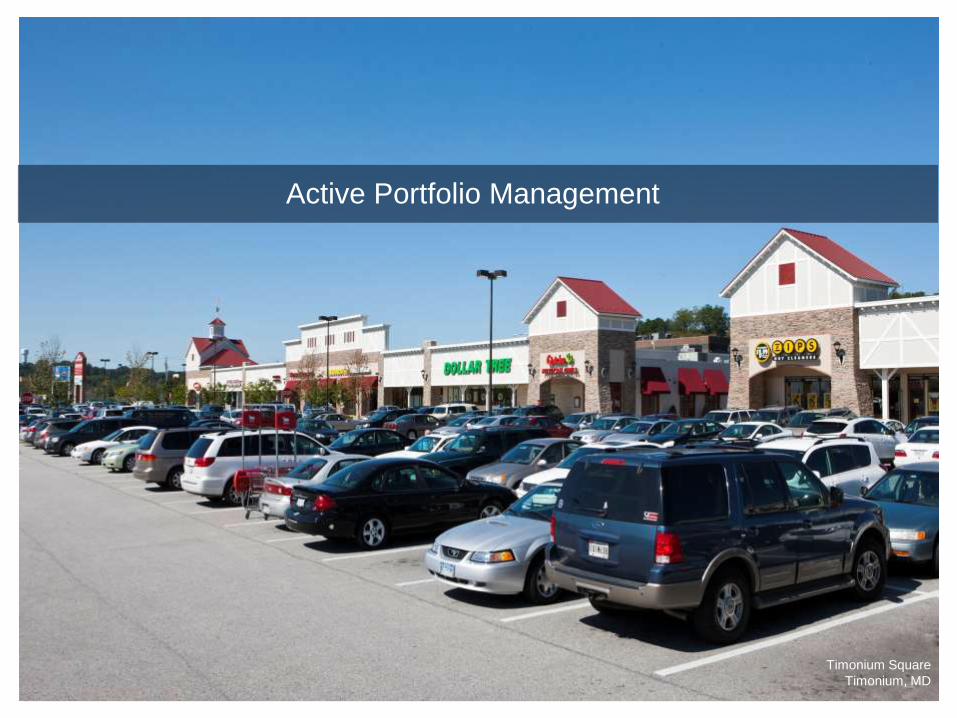
Timonium Square
Timonium, MD
Active Portfolio Management
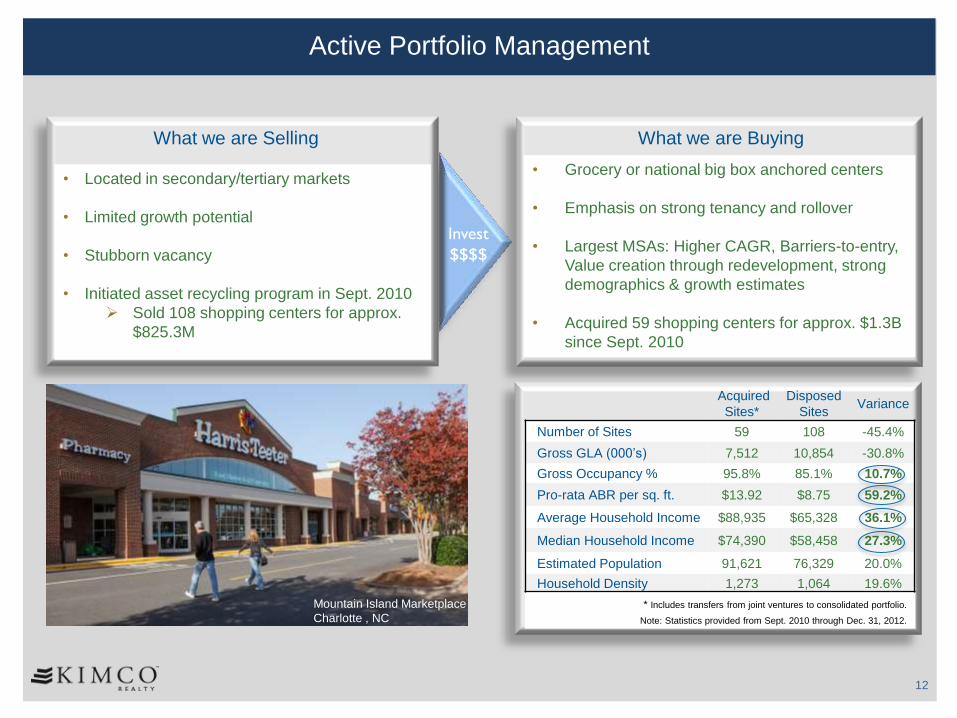
Active Portfolio Management
Invest
$$$$
• Located in secondary/tertiary markets
• Limited growth potential
• Stubborn vacancy
• Initiated asset recycling program in Sept. 2010
Sold 108 shopping centers for approx.
$825.3M
What we are Selling
• Grocery or national big box anchored centers
• Emphasis on strong tenancy and rollover
• Largest MSAs: Higher CAGR, Barriers-to-entry,
Value creation through redevelopment, strong
demographics & growth estimates
• Acquired 59 shopping centers for approx. $1.3B
since Sept. 2010
What we are Buying
Acquired
Sites*
Disposed
Sites Variance
Number of Sites 59 108 -45.4%
Gross GLA (000’s) 7,512 10,854 -30.8%
Gross Occupancy % 95.8% 85.1% 10.7%
Pro-rata ABR per sq. ft. $13.92 $8.75 59.2%
Average Household Income $88,935 $65,328 36.1%
Median Household Income $74,390 $58,458 27.3%
Estimated Population 91,621 76,329 20.0%
Household Density 1,273 1,064 19.6%
12
Mountain Island Marketplace
Charlotte , NC
* Includes transfers from joint ventures to consolidated portfolio.
Note: Statistics provided from Sept. 2010 through Dec. 31, 2012.
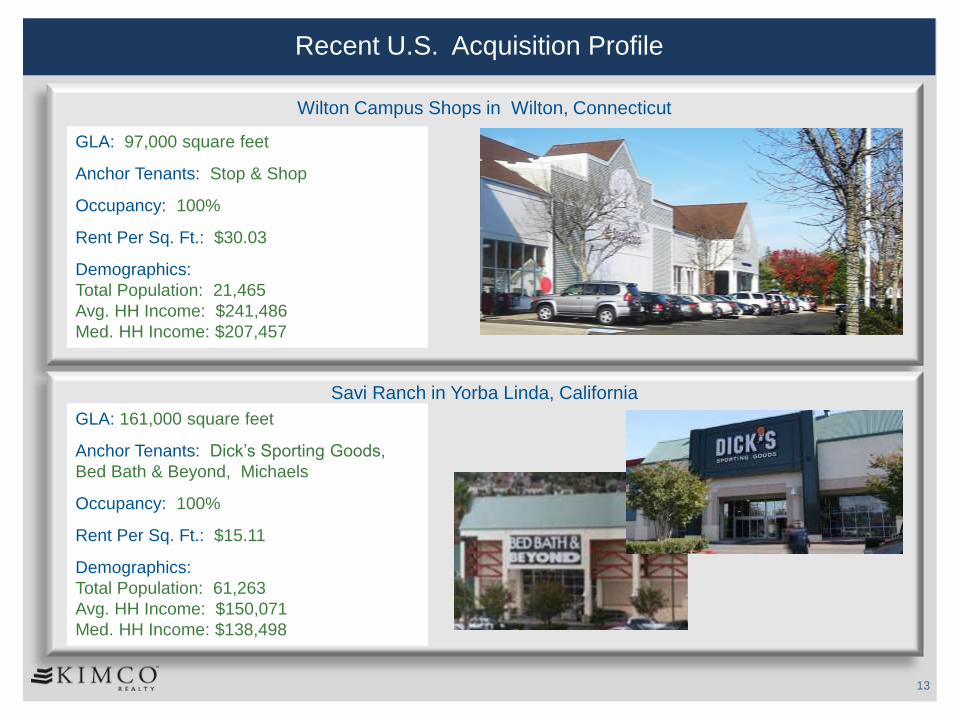
Recent U.S. Acquisition Profile
GLA: 97,000 square feet
Anchor Tenants: Stop & Shop
Occupancy: 100%
Rent Per Sq. Ft.: $30.03
Demographics:
Total Population: 21,465
Avg. HH Income: $241,486
Med. HH Income: $207,457
Wilton Campus Shops in Wilton, Connecticut
Savi Ranch in Yorba Linda, California
GLA: 161,000 square feet
Anchor Tenants: Dick’s Sporting Goods,
Bed Bath & Beyond, Michaels
Occupancy: 100%
Rent Per Sq. Ft.: $15.11
Demographics:
Total Population: 61,263
Avg. HH Income: $150,071
Med. HH Income: $138,498
13
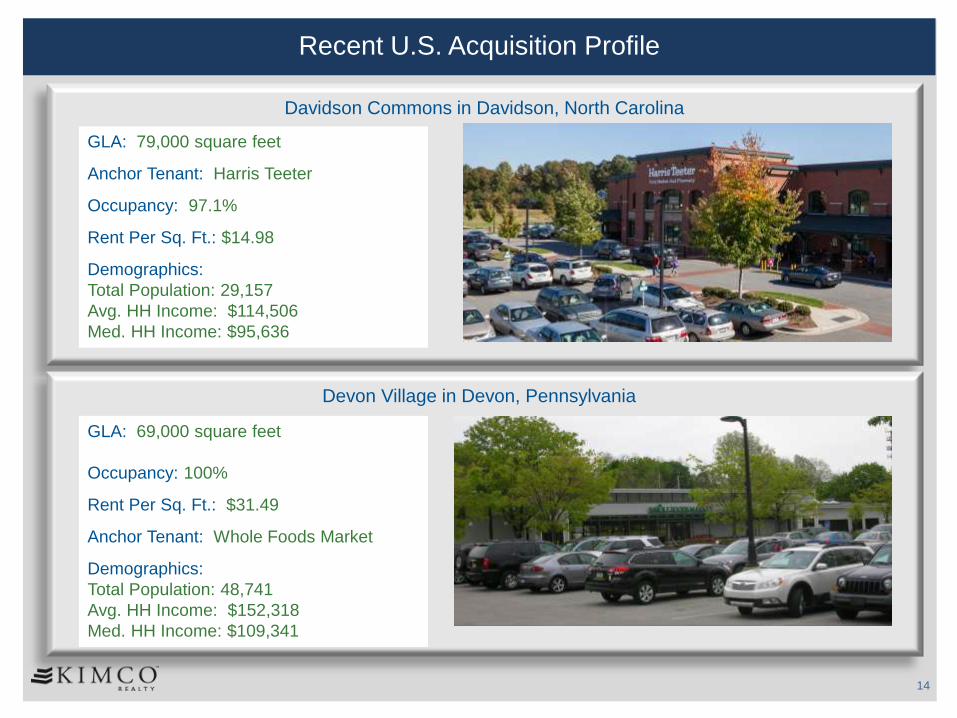
Recent U.S. Acquisition Profile
GLA: 79,000 square feet
Anchor Tenant: Harris Teeter
Occupancy: 97.1%
Rent Per Sq. Ft.: $14.98
Demographics:
Total Population: 29,157
Avg. HH Income: $114,506
Med. HH Income: $95,636
Davidson Commons in Davidson, North Carolina
GLA: 69,000 square feet
Occupancy: 100%
Rent Per Sq. Ft.: $31.49
Anchor Tenant: Whole Foods Market
Demographics:
Total Population: 48,741
Avg. HH Income: $152,318
Med. HH Income: $109,341
14
Devon Village in Devon, Pennsylvania
Redhawk Towne Center
Temecula , CA
U.S. Portfolio Operating Metrics
16
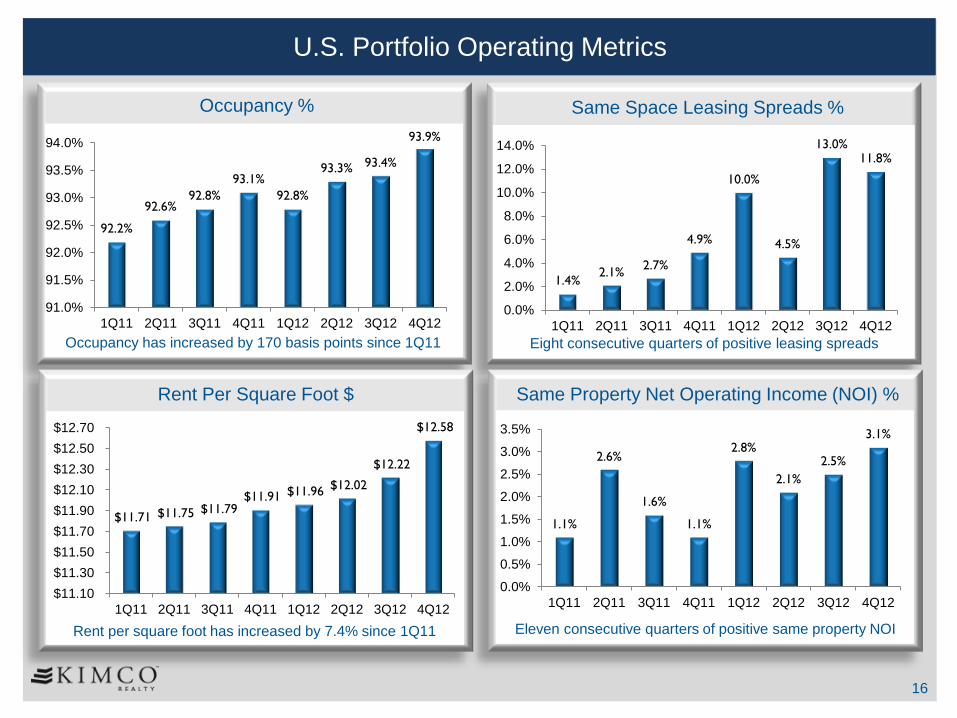
U.S. Portfolio Operating Metrics
Occupancy %
92.2%
92.6% 92.8%
93.1%
92.8%
93.3% 93.4%
93.9%
91.0%
91.5%
92.0%
92.5%
93.0%
93.5%
94.0%
1Q11 2Q11 3Q11 4Q11 1Q12 2Q12 3Q12 4Q12
Rent Per Square Foot $
$11.71 $11.75 $11.79 $11.91 $11.96
$12.02
$12.22
$12.58
$11.10
$11.30
$11.50
$11.70
$11.90
$12.10
$12.30
$12.50
$12.70
1Q11 2Q11 3Q11 4Q11 1Q12 2Q12 3Q12 4Q12
Occupancy has increased by 170 basis points since 1Q11
Same Space Leasing Spreads %
1.4% 2.1%
2.7%
4.9%
10.0%
4.5%
13.0% 11.8%
0.0%
2.0%
4.0%
6.0%
8.0%
10.0%
12.0%
14.0%
1Q11 2Q11 3Q11 4Q11 1Q12 2Q12 3Q12 4Q12
Eight consecutive quarters of positive leasing spreads
Rent per square foot has increased by 7.4% since 1Q11
Same Property Net Operating Income (NOI) %
1.1%
2.6%
1.6%
1.1%
2.8%
2.1%
2.5%
3.1%
0.0%
0.5%
1.0%
1.5%
2.0%
2.5%
3.0%
3.5%
1Q11 2Q11 3Q11 4Q11 1Q12 2Q12 3Q12 4Q12
Eleven consecutive quarters of positive same property NOI
17
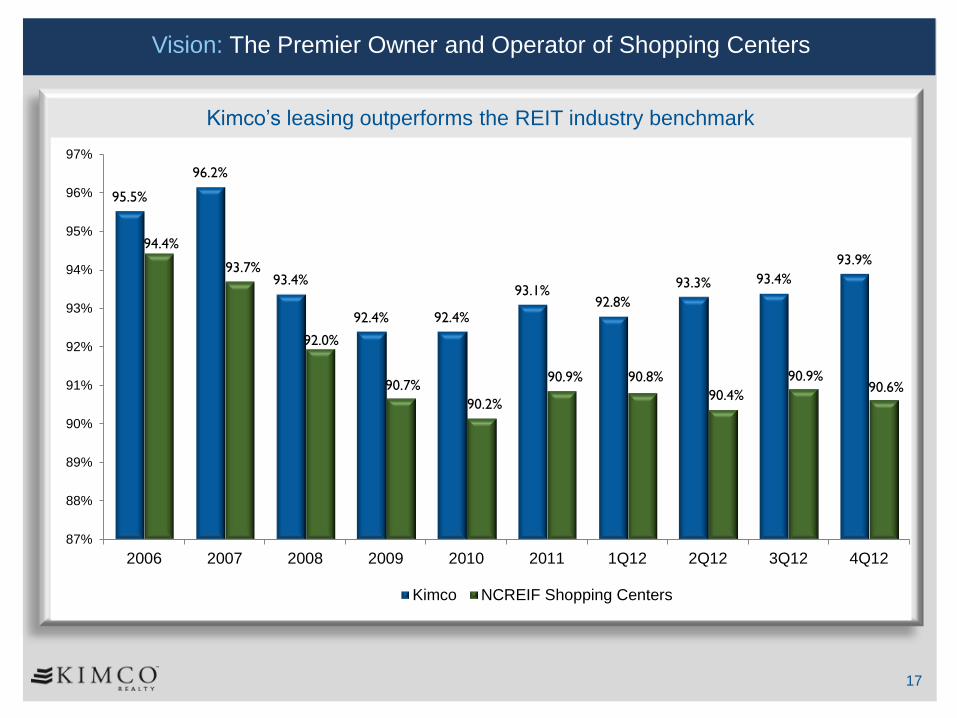
Vision: The Premier Owner and Operator of Shopping Centers
Kimco’s leasing outperforms the REIT industry benchmark
95.5%
96.2%
93.4%
92.4% 92.4%
93.1% 92.8%
93.3% 93.4%
93.9% 94.4%
93.7%
92.0%
90.7%
90.2%
90.9% 90.8%
90.4%
90.9% 90.6%
87%
88%
89%
90%
91%
92%
93%
94%
95%
96%
97%
2006 2007 2008 2009 2010 2011 1Q12 2Q12 3Q12 4Q12
Kimco NCREIF Shopping Centers
Corporate Responsibility Program
Towson Marketplace
Towson, MD
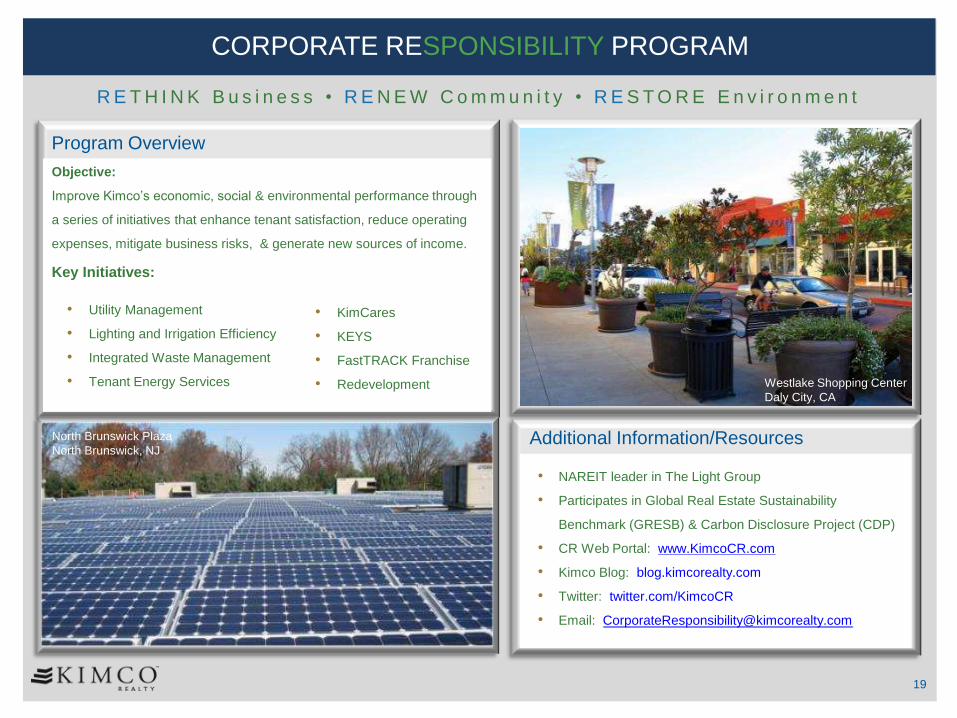
CORPORATE RESPONSIBILITY PROGRAM
R E T H I N K B u s i n e s s • R E N E W C o m m u n i t y • R E S T O R E E n v i r o n m e n t
Objective:
Improve Kimco’s economic, social & environmental performance through
a series of initiatives that enhance tenant satisfaction, reduce operating
expenses, mitigate business risks, & generate new sources of income.
Key Initiatives:
• NAREIT leader in The Light Group
• Participates in Global Real Estate Sustainability
Benchmark (GRESB) & Carbon Disclosure Project (CDP)
• CR Web Portal: www.KimcoCR.com
• Kimco Blog: blog.kimcorealty.com
• Twitter: twitter.com/KimcoCR
• Email: [email protected]
Program Overview
Additional Information/Resources
Westlake Shopping Center
Daly City, CA
North Brunswick Plaza
North Brunswick, NJ
19
• KimCares
• KEYS
• FastTRACK Franchise
• Redevelopment
• Utility Management
• Lighting and Irrigation Efficiency
• Integrated Waste Management
• Tenant Energy Services
Hamden Mart
Hamden, CT
Capital Structure & Dividend Summary
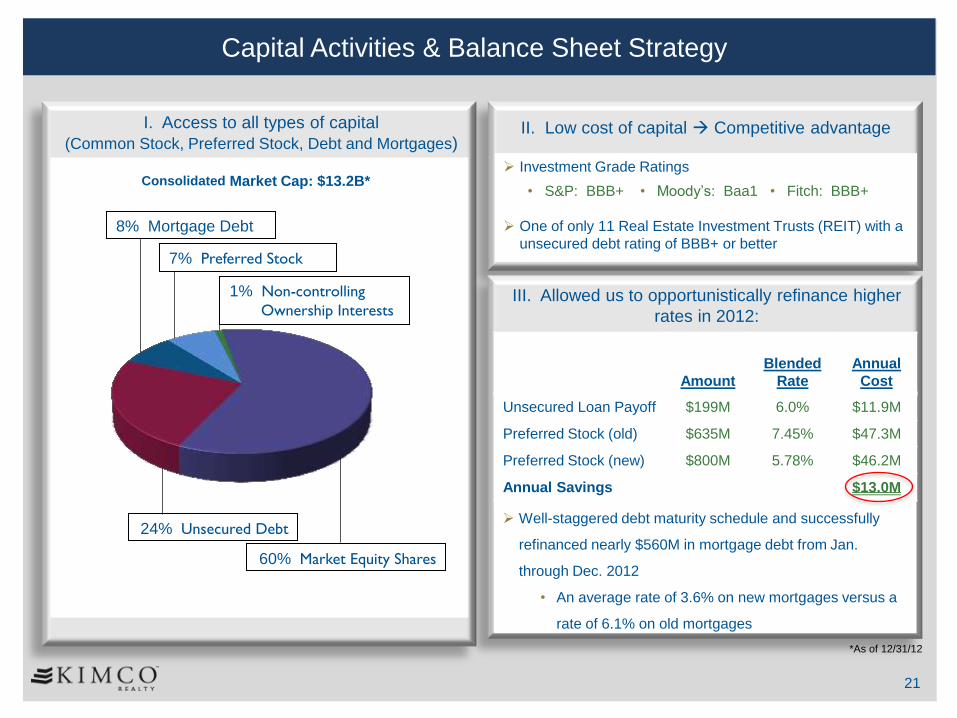
60% Market Equity Shares
24% Unsecured Debt
8% Mortgage Debt
7% Preferred Stock
1% Non-controlling
Ownership Interests
Consolidated Market Cap: $13.2B*
*As of 12/31/12
21
I. Access to all types of capital
(Common Stock, Preferred Stock, Debt and Mortgages)
Capital Activities & Balance Sheet Strategy
II. Low cost of capital Competitive advantage
Investment Grade Ratings
• S&P: BBB+ • Moody’s: Baa1 • Fitch: BBB+
One of only 11 Real Estate Investment Trusts (REIT) with a
unsecured debt rating of BBB+ or better
III. Allowed us to opportunistically refinance higher
rates in 2012:
Well-staggered debt maturity schedule and successfully
refinanced nearly $560M in mortgage debt from Jan.
through Dec. 2012
• An average rate of 3.6% on new mortgages versus a
rate of 6.1% on old mortgages
Amount
Blended
Rate
Annual
Cost
Unsecured Loan Payoff $199M 6.0% $11.9M
Preferred Stock (old) $635M 7.45% $47.3M
Preferred Stock (new) $800M 5.78% $46.2M
Annual Savings $13.0M
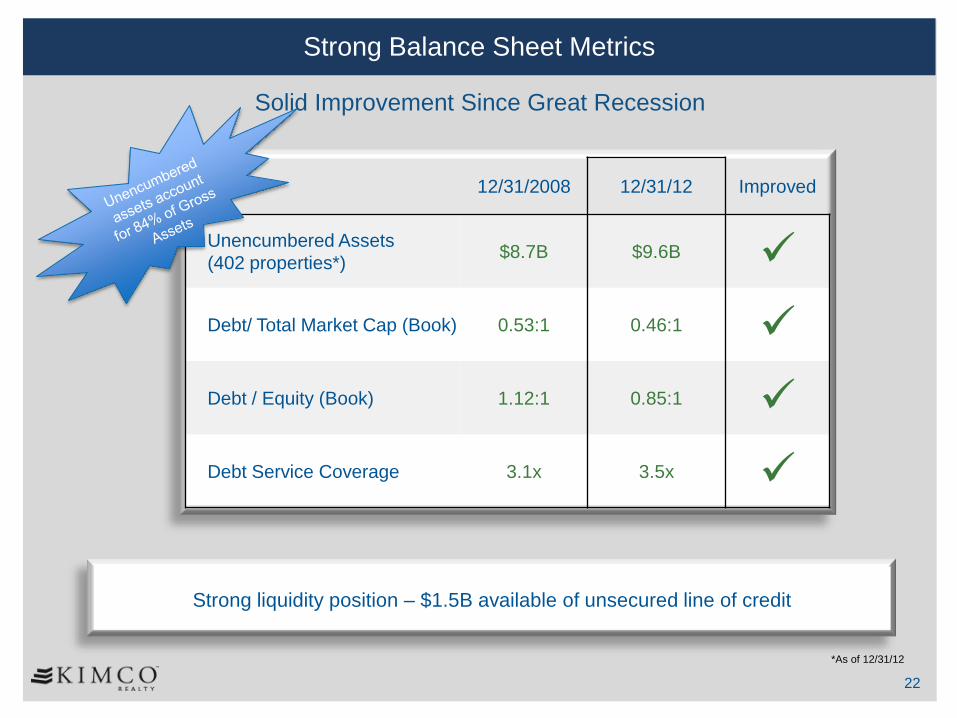
Strong Balance Sheet Metrics
12/31/2008 12/31/12 Improved
Unencumbered Assets
(402 properties*) $8.7B $9.6B
Debt/ Total Market Cap (Book) 0.53:1 0.46:1
Debt / Equity (Book) 1.12:1 0.85:1
Debt Service Coverage 3.1x 3.5x
*As of 12/31/12
22
Strong liquidity position – $1.5B available of unsecured line of credit
Solid Improvement Since Great Recession

23
Dividend & Total Return Thesis
Source: NAREIT and Bloomberg.
*Total return on investment including reinvestment of dividends through Feb. 28, 2013. Statistics for return since IPO are based on closing prices as of Nov. 30, 1991
12.5%
6.0%
$0.14
$0.15
$0.16
$0.17
$0.18
$0.19
$0.20
$0.21
$0.22
Q110 Q210 Q310 Q410 Q111 Q211 Q311 Q411 Q112 Q212 Q312 Q412 Q113
Dividend Growth
Total Return Analysis
$100,000 invested at IPO would be $1.5M today Kimco outperforms these major indices over a one-year period
13.5%
11.7% 10.3%
9.0%
0%
5%
10%
15% Since IPO
KIM NAREIT Equity Index DJIA S&P500
23.1%
15.1%
11.5% 13.4%
0%
5%
10%
15%
20%
25% One Year Period
KIM NAREIT Equity Index DJIA S&P500
• Paid quarterly cash dividend since
Initial Public Offering in Nov. 1991
• Annual dividend of $.084 provides
yield of ~4% (12/31/12)
• In 2012, approximately 23% of our
dividend distribution was treated as
a return of capital
10.5%
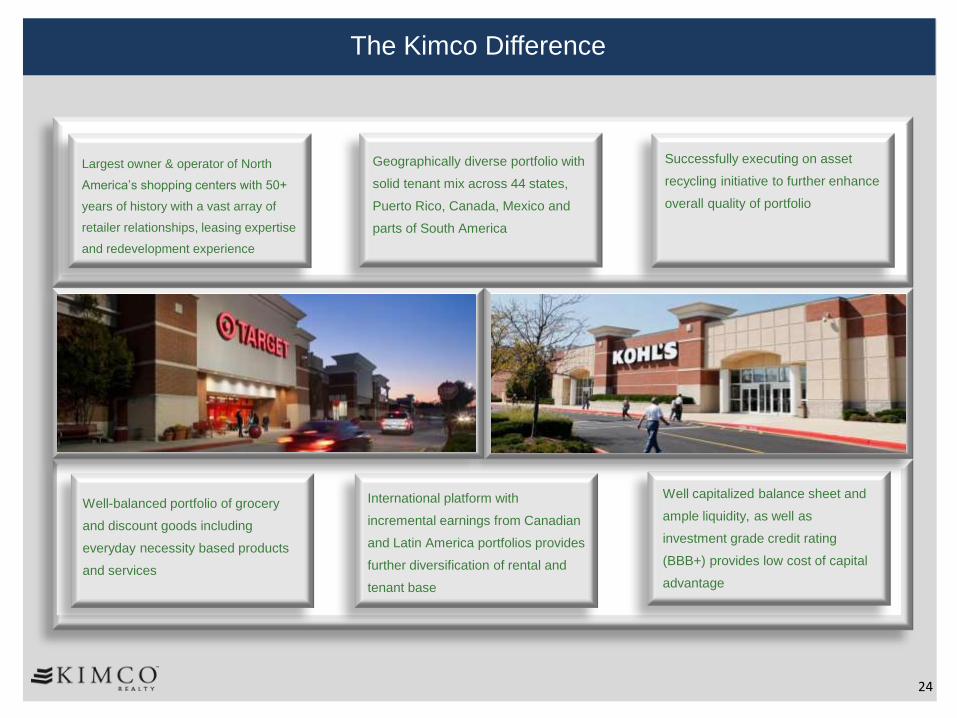
International platform with
incremental earnings from Canadian
and Latin America portfolios provides
further diversification of rental and
tenant base
The Kimco Difference
Well capitalized balance sheet and
ample liquidity, as well as
investment grade credit rating
(BBB+) provides low cost of capital
advantage
Well-balanced portfolio of grocery
and discount goods including
everyday necessity based products
and services
24
Largest owner & operator of North
America’s shopping centers with 50+
years of history with a vast array of
retailer relationships, leasing expertise
and redevelopment experience
Geographically diverse portfolio with
solid tenant mix across 44 states,
Puerto Rico, Canada, Mexico and
parts of South America
Successfully executing on asset
recycling initiative to further enhance
overall quality of portfolio
Q&A