Embed Size (px)
Citation preview
ASSESSORS' HANDBOOK SECTION 513
ASSESSMENT OF SHOPPING CENTERS
JANUARY 1983
CALIFORNIA STATE BOARD OF EQUALIZATION
SEN. GEORGE RUNNER (RET.), LANCASTER FIRST DISTRICT
FIONA MA, CPA, SAN FRANCISCO SECOND DISTRICT
JEROME E. HORTON, LOS ANGELES COUNTY THIRD DISTRICT
DIANE L. HARKEY, ORANGE COUNTY FOURTH DISTRICT
BETTY T. YEE, SACRAMENTO STATE CONTROLLER
CYNTHIA BRIDGES, EXECUTIVE DIRECTOR
REPRINTED JANUARY 2015
AH 513 i January 1983
Reprint Note
This manual has been renumbered from AH 510E, and renamed Assessment of Shopping Centers.
This manual has been reprinted with a new format and minor corrections for spelling and matherrors. The text of the manual has not changed from the prior edition. It has not been edited forchanges in law, court cases or other changes since the original publication date.
AH 513 January 1983ii
TABLE OF CONTENTS
CHAPTER 1: INTRODUCTION............................................................................................1
CHAPTER 2: SHOPPING CENTER BACKGROUND ........................................................2
CLASSES......................................................................................................................................2Neighborhood Shopping Centers.............................................................................................2Community Shopping Centers .................................................................................................2Regional Shopping Centers .....................................................................................................2Super-Regional Shopping Centers...........................................................................................3
DEVELOPMENT ............................................................................................................................3Feasibility ...............................................................................................................................3Financing................................................................................................................................3Size .........................................................................................................................................4Improvements..........................................................................................................................4Parking Requirements .............................................................................................................5Delivery Facilities...................................................................................................................5Improvement Checklist ............................................................................................................5
OWNERSHIP AND ACCESSIBILITY..................................................................................................6Fee Ownership ........................................................................................................................6Sale-Leasebacks......................................................................................................................6Sale-Buyback ..........................................................................................................................6Fixtures...................................................................................................................................7
OPERATION AND MANAGEMENT ..................................................................................................8Leasing and Tenant Relations .................................................................................................8Merchants Association ............................................................................................................9Tenant Mix..............................................................................................................................9
CHAPTER 3: TENANTS ...................................................................................................... 11
LARGE NATIONALLY KNOWN STORES ........................................................................................ 11SMALL NATIONALLY KNOWN STORES ........................................................................................ 11LARGE LOCALLY OWNED STORES .............................................................................................. 11SMALL LOCALLY OWNED STORES.............................................................................................. 11SPECIALTY BUSINESSES ............................................................................................................. 11
CHAPTER 4: VALUATION COMMENTS......................................................................... 12
UNIT TO BE VALUED .................................................................................................................. 12APPROACHES TO VALUE ............................................................................................................ 12LAND VALUE............................................................................................................................. 12EXCESS LAND............................................................................................................................ 13
CHAPTER 5: COST APPROACH ....................................................................................... 14
INTRODUCTION .......................................................................................................................... 14DEFINITION OF COST.................................................................................................................. 14APPRAISAL COST CONCEPTS ...................................................................................................... 14ACCOUNTANT'S CONCEPT OF DEPRECIATION .............................................................................. 14
AH 513 January 1983iii
CAUSES OF DEPRECIATION......................................................................................................... 14Physical Deterioration .......................................................................................................... 15Functional Obsolescence....................................................................................................... 15Economic Obsolescence ........................................................................................................ 15Percent Good Tables............................................................................................................. 15
LAND VALUE............................................................................................................................. 16Entrepreneur's Profit ............................................................................................................ 18
COST APPROACH SUMMARY ...................................................................................................... 18
CHAPTER 6: INCOME APPROACH ................................................................................. 19
GROSS SALES VOLUME .............................................................................................................. 19GROSS INCOME.......................................................................................................................... 20
Minimum Rent....................................................................................................................... 20Percentage Rent .................................................................................................................... 20Other Income ........................................................................................................................ 20
ECONOMIC RENT ....................................................................................................................... 21VACANCY ................................................................................................................................. 21OPERATING EXPENSES ............................................................................................................... 22CAPITALIZATION RATES............................................................................................................. 22
Yield Component................................................................................................................... 23Tax Component ..................................................................................................................... 23Recapture Component ........................................................................................................... 24
CAPITALIZATION METHODS........................................................................................................ 24
CHAPTER 7: SALES COMPARISON APPROACH.......................................................... 27
DIRECT COMPARISON ................................................................................................................ 27Size ....................................................................................................................................... 27Sales ..................................................................................................................................... 27Income .................................................................................................................................. 27Reciprocal Easement Agreements.......................................................................................... 27Expenses—Total Expense for the Entire Center..................................................................... 27Ratios.................................................................................................................................... 27Yield Rate ............................................................................................................................. 28
GROSS RENT MULTIPLIER (GRM) .............................................................................................. 28
CHAPTER 8: SUMMARY.................................................................................................... 29
CHAPTER 9: BIBLIOGRAPHY.......................................................................................... 30
CHAPTER 10: CASE STUDY REGIONAL SHOPPING CENTERS ................................ 31
CHAPTER 11: CASE STUDY NEIGHBORHOOD SHOPPING CENTERS .................... 68
AH 513 1 January 1983
CHAPTER 1: INTRODUCTION
Shopping centers appeared in the United States about 1915. They were located first in theeastern cities and were distinctly different from the shopping centers we know in California today.The early centers were smaller, had fewer stores, and had no parking areas because most of thebuyers either walked or rode streetcars.
The shopping center concept "took root" in California during the late years of World War II. Theinflux of military personnel and defense workers launched a growing demand for goods andservices that has continued to spread during the intervening years. Today approximately fifteenmillion of the twenty million people in California reside in urban areas. This concentration ofpopulation combined with a continually rising economy has resulted in the development of morethan three thousand shopping centers throughout the state.
This handbook deals with the appraisal of shopping centers. It includes a discussion of thedevelopment, operation, and valuation of shopping centers as well as a bibliography and casestudies.
A discussion of the appraisal techniques suitable for the appraisal of property generally may befound in other manuals or sections of the Assessors' Handbook. We recommend that theappraiser be familiar with such techniques before he contemplates the appraisal of shoppingcenters.1
Source material for the handbook has been taken from many places. Assessors' offices in theseveral counties have been especially helpful. Private institutions, agencies of the federalgovernment, and people dealing in the real estate market have contributed basic data.
While it has been our attempt to cover generally the appraisal of all shopping centers, werecognize there is not always a clear distinction between stores that comprise a shopping centerand other stores. The reader is cautioned that this book is not intended as a reference for theappraisal of free-standing stores or stores outside a shopping center.
1 Rates, factors, and dollar amounts contained in this handbook are based upon 1970 price levels.
AH 513 2 January 1983
CHAPTER 2: SHOPPING CENTER BACKGROUND
A shopping center has been defined as:
A group of commercial establishments, planned, developed, owned, and managedas a unit related in location, size, and type of shops to the trade area that the unitserves; it provides on-site parking in definite relationship to the types and sizes ofstores.2
Shopping centers are planned and developed for one reason—profit—profit for the investor andprofit for the merchants. In order for profits to be maximized there must exist, in balance, manyfactors peculiar to the complex business of merchandising. Some of these factors, such asfinancing, size, shape, and rental agreements, may be adjusted, added, deleted, or extended, butone factor must always be present and vigorous. That one is purchasing power. There mustalways be a concentration of people nearby who have money or credit available with which topurchase goods and services.
CLASSES
There are four general classes of shopping centers: neighborhood, community, regional and super-regional. The distinction between each is not absolute, but the appraiser should be able torecognize each one and realize that each class constitutes a slightly different valuation problem.
NEIGHBORHOOD SHOPPING CENTERS
This class sells daily needs such as foods, drugs, sundries, and personal services. It has from 10 to15 stores and will be supported by approximately 5,000 to 30,000 residents. It will be developedon 3 to 5 acres of land, and the most prominent store will be the grocery market.
COMMUNITY SHOPPING CENTERS
This class will sell apparel, hardware, and equipment in addition to the everyday needs of theshoppers. It will include 20 to 40 stores, will be supported by 30,000 to 130,000 people, and willrequire 10 to 30 acres of land. The most prominent store will be a junior department store.
REGIONAL SHOPPING CENTERS
This class of shopping center provides almost the complete spectrum of consumer goods andservices. It usually is designed in strip (mall) fashion with one or both ends anchored by a majordepartment store and smaller shops located along the mall. A more recent design calls for a largemajor department store that serves as a central core with smaller shops clustered about it.
The average regional center contains from 300,000 to over 1,000,000 square feet of grossleasable area. It requires between 35 and 100 acres of land and is supported by about 300,000
2 The Community Builders Handbook, 1968, Urban Land Institute, Washington, D. C.
AH 513 3 January 1983
people. This class of shopping center offers the same goods and services as many commercialcore areas in major cities.
SUPER-REGIONAL SHOPPING CENTERS
A super-regional center is one containing over 1,000,000 square feet of leasable area, and over6,000 parking spaces. It offers the complete spectrum of goods and services to consumers. Thistype center is relatively new in California and few are presently in existence.
DEVELOPMENT
FEASIBILITY
The feasibility of any shopping center depends on the purchasing power in the area and on thetype and amount of competition. The successful developer always depends upon complete andthorough investigations to determine feasibility.
FINANCING
The larger centers are usually financed by insurance companies, pension trusts, banks, and otherlending institutions. In some instances more than one lender will be involved. In the case ofneighborhood centers, local banks or savings and loan associations may be capable of handling thefinancial requirements. Ground leases are becoming more and more important in the financialstructure of shopping centers; and if the ground lease can be subordinated, a very large percentageof the total investment can be financed.
The amount of financing is controlled by government regulations or by lending institutions'policies. Ordinarily only 75 percent of the appraised value will be financed. Lenders usually onlyconsider guaranteed minimum rents in determining the amount to be financed; overages arebelieved to be too speculative, especially with new developments. Loan terms, conditions, andinterest rates vary with the lending institution, the money market, the project, and the developer.The appraiser will need to investigate the current lending conditions applicable to his local areaand study financing terms and conditions common to shopping center lending markets generally.It is not uncommon to find that lending institutions are demanding a share of the profits and eventhe right to participate in the management of a center prior to granting a loan.
Developers have found that the return from land and improvements leased to major departmentstores is usually below an economic return. For this reason land is often sold to department storesat or below market. The developer will compensate for this expenditure by developing a rentalincome from the smaller shops that reflects the advantage of being located near the majordepartment store.
AH 513 4 January 1983
SIZE
The three general classes of shopping centers--neighborhood, community, and regional--havealready been mentioned. However, within each class the size may vary because purchasing powerremains the controlling factor.
The developer strives to develop a shopping center that:
• Is large enough to meet the demands of the shoppers in "his" trade area,
• Leaves no excess demand that might encourage additional shopping center development inhis trade area, and
• Reserves an area, by acquisition or by option, for expansion.
The many studies undertaken to determine the criteria upon which to base the size of a particularcenter have only served to prove that an exact mathematical formula for this purpose does not exist.
IMPROVEMENTS
The goal of the shopping center developer is to present an interesting and functional array ofattractive shops that can be leased to produce an economic return for the investor. The intent isto create an environment in which shoppers will feel comfortable and happy while shopping forgoods and services desired.
In support of the intention noted above, and in addition to the general store areas, the appraiserwill find space used for offices, storage, maintenance, machinery, equipment, and access.Included also will be malls, facades, restrooms, and kiosks. Quality as well as quantity ofconstruction must be noted.
Sometimes the developer will carry the construction only to the building shell stage, leaving thetenant the choice of store front, floor covering, air conditioning, interior decor, and signs. In thiscase the tenant may be given an allowance by the developer to complete this work, or he mayinvest his own capital; in either case the arrangements will be evident in the leasing agreements.The center may be a "turn-key" operation where the developer has carried construction tocompletion and the tenant need only add his sales promotion decor.
The appraiser must determine ownership, quantity, and quality of construction. In most instancesthis information is available from the developer's files, but the appraiser may also check buildingpermit records, consult professional cost estimators, and review the individual leasing agreements.
The quantity of building space, parking, etc., can usually be ascertained from the blue prints.Quality of construction may also be identified from this source, but the appraiser must make athorough inspection of the property. The type of construction may vary from a heavy reinforced-concrete structure to a light wood-frame structure.
AH 513 5 January 1983
PARKING REQUIREMENTS
Shopping center developers capitalize on the demand for "nearby" parking spaces by placingparking under, over, and around the stores. One of the features that distinguishes a shoppingcenter from a commercial core is an ample parking area with good access.
The number of parking spaces needed is one of the problems that must be solved early in thedesign of a center. Many studies have been made by various agencies to determine the optimumamount of parking. Certainly it is not reasonable to design the parking lot to accommodate thepeak load--say at Christmas. On the other hand, ample parking is the key to success. Twogeneral methods of computing necessary parking are used. One bases the number of square feetof parking area on the total number of square feet of building area. This method is not viewedfavorably because the total building area includes administrative offices, maintenance areas,storage space, etc., that do not require customer parking. The second method bases the numberof spaces on the square footage of gross leasable area. The latter method is believed to be best.
While every center has its peculiar parking needs, it has been estimated that 5.5 spaces per 1,000square feet of gross leasable area is a reasonable amount.3 Parking spaces, including maneuveringand access areas, average about 400 square feet, or approximately 100 spaces per acre. Inaddition to considering parking requirements in terms of need, a developer must also comply withlocal city and county planning ordinances that regulate minimum parking facilities. An appraisermust be aware of these ordinance requirements when analyzing planned, existing, and potentialland use.
DELIVERY FACILITIES
Occasionally, truck tunnels are constructed beneath shopping centers (usually directly beneath themall), so that merchandise can be delivered to the stores without interfering with shopper traffic.Complete tunnels are very expensive and are found in only the largest regional centers. However,variations of the tunnel are used in community centers. These variations usually are merely amethod of screening a sub-surface central loading dock that serves all stores—or at least themajor stores.
In almost all neighborhood centers goods are unloaded at the rear of the shops, or are unloadedover the front walkway prior to shopping hours.
IMPROVEMENT CHECKLIST
The following is a checklist of major improvements found in a typical shopping center. For adetailed list of capital cost items see Chapter V, The Cost Approach.
• Utility measuring and transmission systems.
• Parking areas and traffic control improvements.
• Landscaping and miscellaneous outside improvements.
3 Parking Requirements for Shopping Centers, 1965, Urban Land Institute Technical Bulletin #53.
AH 513 6 January 1983
• Store buildings.
• Malls and service areas.
• Equipment and fixtures.
OWNERSHIP AND ACCESSIBILITY
FEE OWNERSHIP
Neighborhood shopping centers may be owned entirely in fee by the developer or investor. Thisis not so with community and regional centers. Often the land and improvements occupied bymajor department stores and sometimes those occupied by junior department stores are owned infee by the store and not by the developer. This type of ownership arises because of the strongbargaining position enjoyed by the large stores. Store executives as well as developers realize thatat least one "anchor" store is absolutely essential for a successful center. As a result, leasingnegotiations favor the department store. To counter his unfavorable bargaining position thedeveloper usually chooses to sell the site and the building, if constructed, to the department store.Often the price will be at or near cost.
Combined ownership, such as just described, necessitates an intricate network of easements andaccess agreements covering individually owned areas used jointly by all owners. The appraiserwill need to discover the fee owner of each portion of the shopping center.
SALE-L 4EASEBACKS
Sale-leasebacks occur where a merchant has a structure built to his specifications on his land andthen sells the land and building to an investor or lending institution with stipulation that theproperty will be immediately leased back to the original merchant. In this situation an appraisercould encounter a structure owned by "A", leased by "B", and located in a shopping centerdeveloped by "C". The obvious advantage of this arrangement is that owner "A" will receive rentsthat include an amount equal to amortization of the cost of the property and a fair return on theinvested capital. Owner "A" will also have the advantage of claiming depreciation on theimprovements as well as receiving any value that accrues to the land by appreciation (capitalgains). The user of the property, "B", frees his capital for merchandising purposes, and he claimsthe rental paid to owner "A" as a business expense. A sale-leaseback transaction may provide theappraiser with good income information that can be analyzed as an indicator or value.
SALE-B 4UYBACK
In a sale-buyback situation a property is sold to an investor and then simultaneously bought backby the developer under long-term financing. In this way the developer obtains 100% financing
4 Sale-leaseback and sale-buyback transactions are primarily methods of financing. While certain usefulinformation may be obtained from such arrangements, the appraiser is cautioned that all terms and conditions ofsuch transactions may not be evident, and those that are evident may be misleading if considered in the absence ofcomplete and accurate data.
AH 513 7 January 1983
and pays for the property using a long-term installment contract. The advantage to the developeris that it frees his capital for development purposes. The investor usually will demand apercentage of the income produced by the property in addition to regularly scheduled contractpayments. In some rare instances the investor will insist that he be allowed to participate in themanagement of the property.
Like the leaseback, the saleback may provide the appraiser with market information that can beutilized as an indicator of value.
FIXTURES
Real property includes land, improvements, and fixtures. A fixture may be defined as a thing thatwas originally personal property but which has been attached to the land or an improvement insuch a way that it is considered as part of the real property. The fixture need not be attacheddirectly to the land but may be attached to an improvement which in turn is attached to the land--akitchen sink for example.
There are tests to determine the class of property but the courts generally view these tests asmerely factors to consider when determining the parties' intent. The tendency of the courts hasled to the formulation of the following three-pronged test for determining if a property is afixture:
• The manner of the property's annexation to the realty,
• The property's adaptability to the use and purpose for which the realty is used, and
• The intention of the parties to make or not to make permanent the annexation of theproperty to the realty.
For the purpose of taxation, the intention of the parties must be determined by the physical factsor the reasonably manifested outward appearances without regard to the annexor's status aslandlord or tenant.
Each item classified as a fixture should be identified according to ownership, appraised accordingto present depreciated value, and added to either the secured roll or the unsecured roll in the nameof the person owning the fixture. Information relative to ownership, costs, age, and location offixtures should be verified by inspecting the records of tenants as well as the developer/owner.This can become a laborious and complicated undertaking unless an organized system ofclassification, identification, and tabulation is developed. Real property appraisers are advised tocoordinate this part of the appraisal with the personal property appraisers so that fixtures will notbe exposed to double taxation or escape taxation altogether. Always read leasing agreementsto determine ownership and property tax liability.
AH 513 8 January 1983
In the event of changes in tenancy several possible situations may develop regarding the valuationof the tenant and owner interests:
• If the shopping center owner owns the building and the fixtures, before and after the changein tenancy, and no changes are made for the new tenant, then no changes are necessary bythe appraiser unless the terms and conditions of the new lease differ from the old lease.
• If the center owner owns only the building and acquires title to improvements installed bythe former tenant--including fixtures--the appraiser must adjust the economic rent to reflectthe change in ownership and shift the value of such improvements from the former ownerto the new owner.
• If the owner of the center clears and remodels a vacated store, the cost of doing so must beprorated as an operating expense to clear the store, and a capital investment to remodel thestore. Value added as a result of remodeling must be picked up in the cost approach, andchanges in income and expense figures must be reflected in the income approach. Theappraiser must also make certain that when the newly created value is added to the costapproach, the value of the removed improvements is likewise deducted.
OPERATION AND MANAGEMENT
The major activity of the owner and/or manager of a shopping center is directed to the threeprimary areas--leasing and tenant relations, day-to-day operation of the center, and salespromotion.
LEASING AND TENANT RELATIONS
A successful leasing program is the economic foundation of a shopping center. Lenders almostalways insist that enough space is leased prior to final commitment to guarantee monthly debtservice and operating expenses, including real estate taxes. Leasing arrangements are usuallyhandled by a representative of the developer or by an experienced real estate firm.5
The terms and conditions of the leases are usually quite standard, but many have mutuallyacceptable amendments. Most leases today are based upon a guaranteed minimum rent plus apercentage of the gross income above a certain amount. This type of lease protects the lessee aswell as the lessor. It is a business contract that provides for the sharing of risks as well as profits.
Usually leases will include paragraphs that cover the following:
• Identification of lessee
• Identification of lessor
• Property description
• Date of lease
5 See leasing costs - page 18.
AH 513 9 January 1983
• Term of lease
• Rental rate and due date
• Extensions
• Cancellations
• Transferability
• Sale of the property
• Parking allowance and arrangements
• Acquisition by condemnation.
The leases further identify the party responsible for:
• Taxes
• Insurance
• Maintenance
• Furnishings
• Damage
• Utilities
• Security and protection, and
• Audit expense
MERCHANTS ASSOCIATION
Each center ordinarily has a merchants association. Such associations are comprised of interestedparties, especially the lessor and lessees. As a matter of fact, membership in the association maybe condition in the leasing agreements.
The purpose of the association is to promote the gross sales volume of the center and to serve asa common meeting ground where lessees, lessors, and others may air their views regarding theoperation of the center. The members usually must contribute financially for mutually beneficialsales promotion programs adopted by the association.
TENANT MIX
Tenant mix is the array of the different types of stores found in a center. Tenant mix dependsupon many factors, but typically the developer attempts to match the tenant mix to the people inthe trade area in order to produce the greatest possible sales volume. Factors such as averageincome, age, climate, basic industry, etc., influence the type of tenant desired.
Generally speaking, the rate of return on invested capital is in proportion to the risk the investor iswilling to accept. This principle holds true for shopping center properties as well as otherinvestments. For example, a "triple A" (prime) tenant may be charged a reduced rent because the
AH 513 10 January 1983
lessor knows that the rent contracted for will be received over the period of the lease. On theother hand a less desirable (marginal) tenant may be charged an increased rent because the lessorknows there is a chance (risk) that all of the rent may not be received.
Tenant mix is an important factor in balancing risk. The developer must have tenants who willprovide the goods and services demanded by the consumers, yet he must maintain a risk balancethat meets his risk limits. An unbalanced tenant mix may be indicated by an abnormal vacancyfactor and an unusually high credit and collection loss.
AH 513 11 January 1983
CHAPTER 3: TENANTS
There are five general types of tenants in shopping centers:
LARGE NATIONALLY KNOWN STORES
This group is comprised of such stores as Macy's, Sears Roebuck & Company, and MontgomeryWard. Usually these stores require more than 100,000 square feet of gross leasable area, andwhere the land and structures are owned by the developer, the total yearly rent will average about$1.25 per square foot. Usually these stores require long-term leases--twenty to thirty years Mostoften these companies will build their own stores on land leased or purchased in the center.
SMALL NATIONALLY KNOWN STORES
This group is comprised of such stores as W. T. Grant Company, F. W. Woolworth, Safeway, andLucky. They usually require about 30,000 square feet of gross leasable area and pay about $1.50total annual rent per square foot. Leases usually run between ten and fifteen years.
LARGE LOCALLY OWNED STORES
This group is comprised of such stores as Breuners, Roos/Atkins, and Desmonds. These storesusually require between 10,000 and 30,000 square feet of gross leasable area. The total yearlyrental averages about $2.00 per square foot, and lease terms run about ten years.
SMALL LOCALLY OWNED STORES
There are a great many types of stores in this group. They require from 1,000 to 5,000 squarefeet of gross leasable area, and total annual rent varies from about $3.00 to $9.00 per square foot.Business mortality is highest in this group, and leases are usually quite short, ranging from one tofive years with mutual cancellation clauses.
SPECIALTY BUSINESSES
Included in this group are such businesses as service stations, auto repair and accessories, motionpicture theaters, car wash facilities, and kiosks. Size, rent, and terms of the leases for specialtybusinesses vary so widely that the appraiser is advised to search his own area for economic data.
AH 513 12 January 1983
CHAPTER 4: VALUATION COMMENTS
As with any valuation problem, the first step in appraising a shopping center is to identify theproperty rights to be valued. Included should be all taxable rights in the land improvements, andfixtures. Such rights may be the sole and separate property of one owner, or they may be dividedamong many owners.
After the appraiser has completed the preliminary survey and planned the appraisal, he shouldproceed with the data collection phase. Any information concerning the cost, income andexpense, or sales of comparable properties attention should be compiled in a logical and usefulmanner. Particular attention should be paid to those data intrinsic to the income approach.
A large shopping center is an extremely complicated type of property that functions properly onlywhen many agents of production are skillfully brought together as a unit. There must always be acandid exchange of information between the developer and the assessor if the property is to beproperly valued for property tax purposes.
UNIT TO BE VALUED
The unit to be valued is the entire shopping center. However, the appraiser must ultimatelyapportion the unit value to the separate ownerships giving full consideration to size, location, andexisting encumbrances that result from the interrelation that each parcel has with every otherparcel, separately and collectively, within the shopping center. For purposes of allocation anappraiser will look to the traditional approaches to value and will use the most reliable data.
APPROACHES TO VALUE
The three classic approaches to value are usable in shopping center appraisals. The cost approachis considered the weakest since it includes no provisions for entrepreneurship and adjustments forappreciation and depreciation are difficult to make. The sales comparison approach may be thestrongest approach if comparable sales data are available; such is usually not the case, and thisapproach is ordinarily subordinate to the income approach. The income approach is generallymost reliable when valuing a seasoned shopping center if reliable sales information is not available.
LAND VALUE
Land value may be estimated by two methods. The subject may be compared with recently soldparcels of land deemed comparable, making due allowances for land preparation; or the estimatemay be made using a land residual technique. The sales comparison approach is straight-forwardand should present no special problems. The land residual technique can be slightly complicated,and several precautions must be taken. In all cases current economic rent and typical expenseitems must be used. Land values vary from location to location and according to size. However,
AH 513 13 January 1983
the usual unit of reference is price per square foot. Land used for parking, store sites, mall, andaccess will normally be appraised at the same unit value.
EXCESS LAND
Excess land is idle land owned by and contiguous to a developed shopping center. Such land maybe unimproved and idle, or it may be improved for parking and idle. In either case excess landdoes not contribute to the shopping center's income stream.
Land under vacant stores is not considered excess. This condition is covered by the vacancyfactor in the income approach.
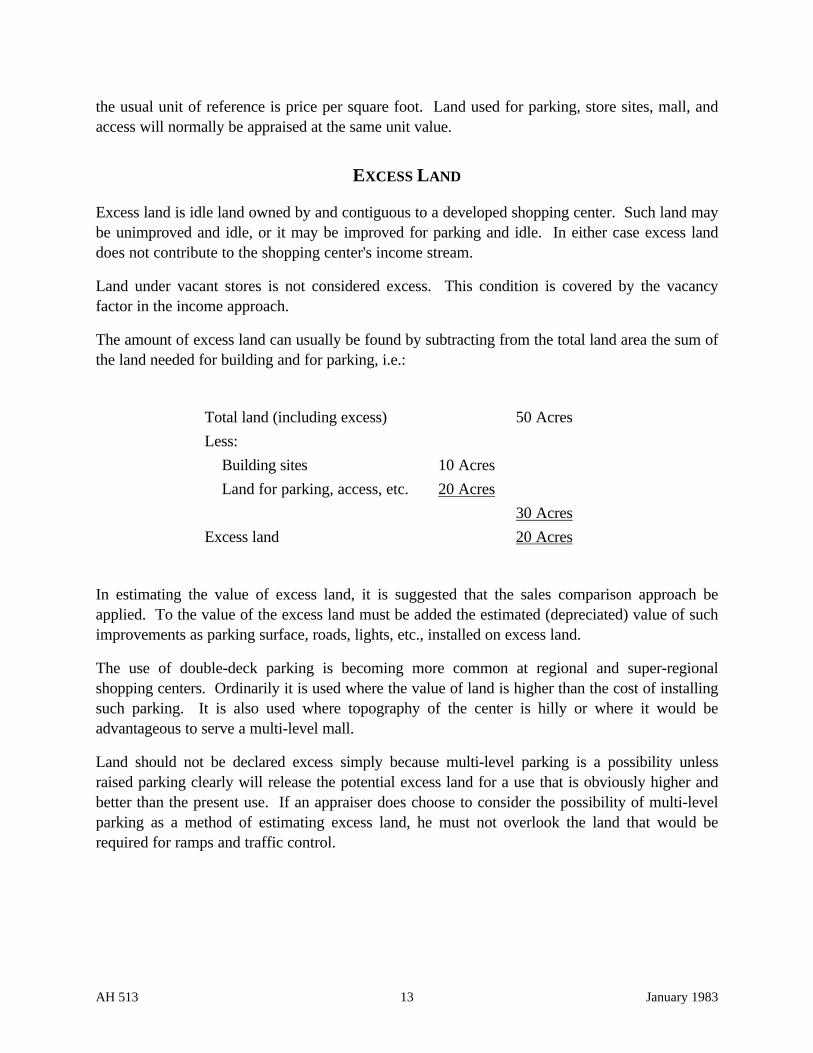
The amount of excess land can usually be found by subtracting from the total land area the sum ofthe land needed for building and for parking, i.e.:
Total land (including excess) 50 Acres
Less:
Building sites 10 Acres
Land for parking, access, etc. 20 Acres
30 Acres
Excess land 20 Acres
In estimating the value of excess land, it is suggested that the sales comparison approach beapplied. To the value of the excess land must be added the estimated (depreciated) value of suchimprovements as parking surface, roads, lights, etc., installed on excess land.
The use of double-deck parking is becoming more common at regional and super-regionalshopping centers. Ordinarily it is used where the value of land is higher than the cost of installingsuch parking. It is also used where topography of the center is hilly or where it would beadvantageous to serve a multi-level mall.
Land should not be declared excess simply because multi-level parking is a possibility unlessraised parking clearly will release the potential excess land for a use that is obviously higher andbetter than the present use. If an appraiser does choose to consider the possibility of multi-levelparking as a method of estimating excess land, he must not overlook the land that would berequired for ramps and traffic control.
AH 513 14 January 1983
CHAPTER 5: COST APPROACH
INTRODUCTION
It is generally recognized that a cost estimate is an important and valuable tool in appraisal work.
Important facts which will be useful in the other approaches to value can be learned about thesubject property while making the cost estimate.
DEFINITION OF COST
It is clear that there is no necessary relation between the cost concept and the actual costsexperienced by any one builder in any specific case. The cost concept for appraisal purposes maybe thought of as the full economic costs. The full economic costs are defined as the necessarypayments that must be made to secure the continued supply of all the agents of production asexperienced by the representative firm.
APPRAISAL COST CONCEPTS
A discussion of cost concepts can be found in Assessors' Handbook, Section 501, GeneralAppraisal Manual.6
ACCOUNTANT'S CONCEPT OF DEPRECIATION
The accountant's definition of depreciation is quite different from the appraiser's, and the appraisershould be aware of this fact. The accountant's depreciation charge consists of writing off oramortizing of some previously incurred outlays that could not properly be written off in a singleaccounting period. The accountant's action in establishing book depreciation is usually influencedby income tax laws.
CAUSES OF DEPRECIATION
Depreciation decreases the utility of an improvement in two different ways. First, and probablymore important, it shortens the remaining life of the property. Instead of yielding benefits for, say40 or more years, the property has only 30 years of service left. Second, it decreases the amountof each net benefit by either yielding smaller total benefits or yielding the same total benefits at ahigher cost. Depreciation decreases the remaining life and efficiency of property.
6 Assessors' Handbook, Section 501, General Appraisal Manual, State Board of Equalization, October 1968.
AH 513 15 January 1983
There are three generally recognized causes of depreciation. They are physical deterioration,functional obsolescence, and economic obsolescence. It is useful to categorize depreciation inthis manner since this knowledge is often helpful in making a percent good estimate.
PHYSICAL DETERIORATION
Physical deterioration is a lessening of value because of some physical change in the structurewhich lowers its utility. The actions of man, pests, and elements cause this depreciation. Peelingof paint, wearing out of water heaters, termite action, flood damage, etc., are all illustrations ofphysical deterioration. Virtually all structures deteriorate with age. Good maintenance will lessenthis factor, while lack of maintenance will increase the amount of physical deterioration a buildingwill experience. The physical factors set a maximum possible life for any structure.
The physical factors have not in general been the major limiting factors for the economic life ofshopping centers in California. Typically, the life of structures has been ended by obsolescenceand not by physical deterioration. With proper and normal maintenance, buildings will have aslow rate of physical deterioration.
FUNCTIONAL OBSOLESCENCE
Functional obsolescence is a lessening of value because of some nonphysical changes in thedesirability of a structure. It is a much more intangible factor than physical deterioration butnonetheless, a more potent one. Functional obsolescence may be attributable to changes in tastesand in the arts or to poor initial design.
ECONOMIC OBSOLESCENCE
Economic obsolescence is a lessening of value because of some adverse factors which decreasethe desirability of the neighborhood, or the loss of revenue to competing centers. These factorsare outside the subject property. The loss of value occurs because of the immobility of real estate.This is an environmental factor and is illustrated by shifting of the basic means of employmentfrom a community or movement into a neighborhood by a different cultural and economic groupor by increased competition. Losses in value which are called economic obsolescence are usuallybeyond the power of any one individual to influence. This depreciation affects both land andbuildings.
PERCENT GOOD TABLES
Percent good tables have validity only to the extent that the subject property has experienced theusual depreciation for one of its age, quality, and use type. Because they are constructed byrelating actual sales prices to replacement cost new for structures of different ages, the tablesreflect normal depreciation, which includes typical physical deterioration and the usual functionalobsolescence. Obsolescence due to poor initial design, and unusual physical deterioration, if any,must be calculated by some other means. No general guides can be provided for the estimation ofeconomic obsolescence.
AH 513 16 January 1983
Any depreciation or percent good table can be used only as a guide in the estimation of value. Apercent good table may reflect more or less depreciation than the market indicates. Whereverpossible, replacement cost new less normal depreciation should be verified by other approachesbefore it is accepted as representing value.
LAND VALUE
In the cost approach, the land value, derived from the market comparison and income approaches,and from the developer's actual land costs, is added to the depreciated cost of the improvements.It is important to note that this addition produces a summation appraisal. This is not consideredto be the best appraisal procedure, because the market usually values the property as a whole or aunit. What must be remembered is that this is just one approach to value and that it should besupported by other approaches.
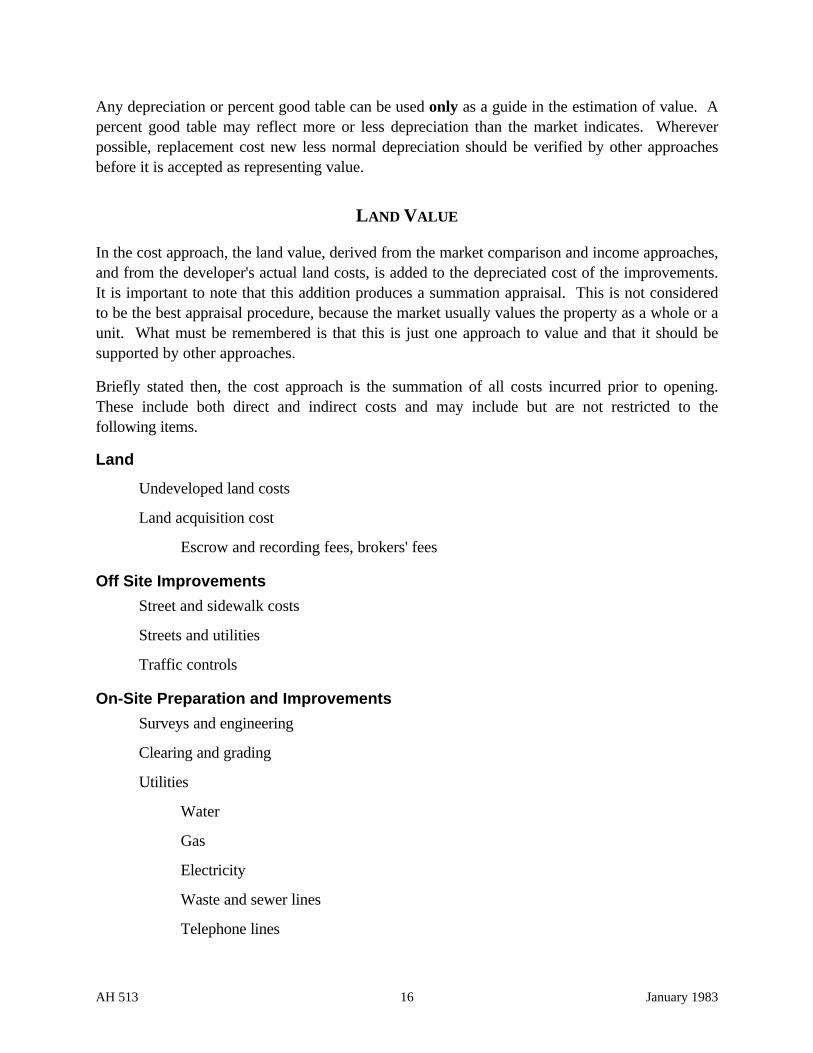
Briefly stated then, the cost approach is the summation of all costs incurred prior to opening.These include both direct and indirect costs and may include but are not restricted to thefollowing items.
Land
Undeveloped land costs
Land acquisition cost
Escrow and recording fees, brokers' fees
Off Site Improvements
Street and sidewalk costs
Streets and utilities
Traffic controls
On-Site Preparation and Improvements
Surveys and engineering
Clearing and grading
Utilities
Water
Gas
Electricity
Waste and sewer lines
Telephone lines
AH 513 17 January 1983
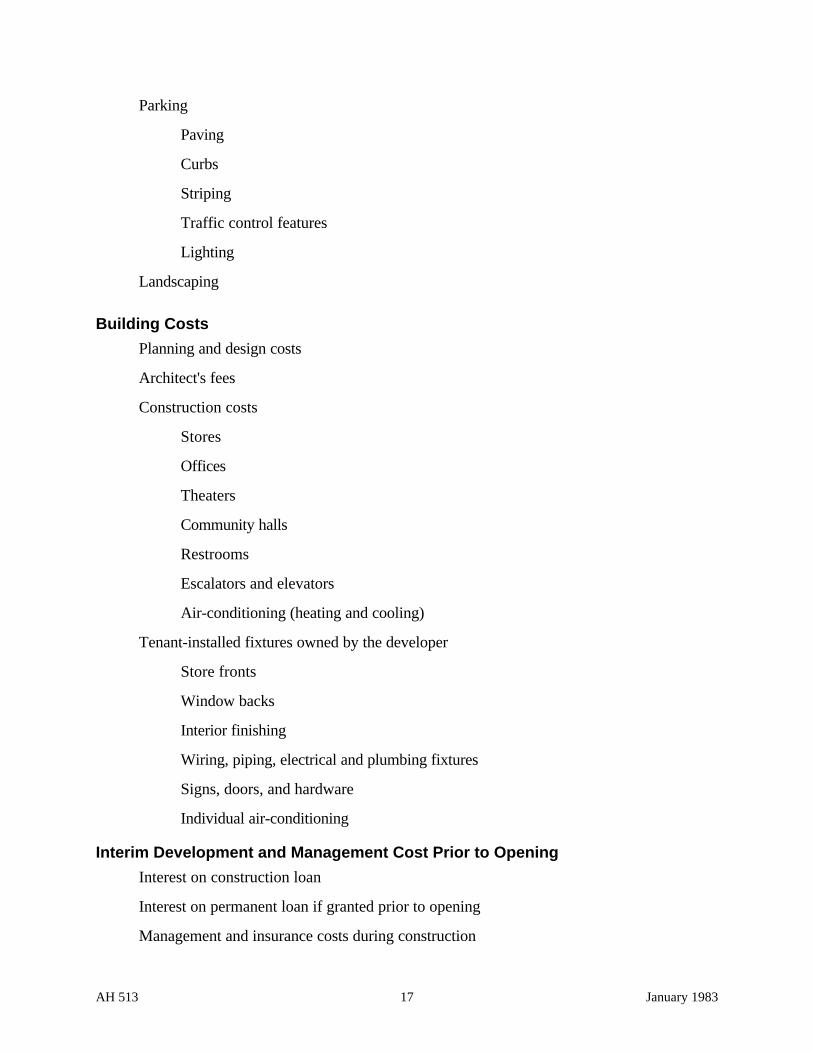
Parking
Paving
Curbs
Striping
Traffic control features
Lighting
Landscaping
Building Costs
Planning and design costs
Architect's fees
Construction costs
Stores
Offices
Theaters
Community halls
Restrooms
Escalators and elevators
Air-conditioning (heating and cooling)
Tenant-installed fixtures owned by the developer
Store fronts
Window backs
Interior finishing
Wiring, piping, electrical and plumbing fixtures
Signs, doors, and hardware
Individual air-conditioning
Interim Development and Management Cost Prior to Opening
Interest on construction loan
Interest on permanent loan if granted prior to opening
Management and insurance costs during construction
AH 513 18 January 1983
Legal fees
Taxes
Miscellaneous
Leasing costs, promotion and publicity7
ENTREPRENEUR'S PROFIT
When using the cost approach to value, an appraiser must not over-look the value added by thedeveloper's skill, knowledge, management, ability, and access to development funds. Thisincrement of value is indicated by the difference between the sum of the foregoing costs and theprice at which the developer would sell the shopping center at any given time.
COST APPROACH SUMMARY
A commercial building record should be completed for each structure in the shopping center. Theappraiser should note all modifying factors and mathematical procedures used. If historical costsare utilized, they must be factored to reflect both appreciation and depreciation. If replacementcosts are used, they also must be factored to compensate for depreciation. The greater portion ofthe depreciation at any center will ordinarily be functional and/or economic obsolescence.Physical depreciation is not of major importance in many shopping center appraisals. Changes inarchitectural design and construction technology coupled with changes in marketing techniquescreate a desire to shop in the newest, most modern centers. Unless the aging centers areperpetually modified to keep abreast of these demands, functional obsolescence will develop at anaccelerated rate.
Economic obsolescence usually cannot be corrected since it originates off the property, beyondthe control of the developer. Occasionally, economic obsolescence is the permanent result ofpoor planning prior to development, but more often it is caused by aggressive competition orchanges in local land-use patterns.
Because loss in value from all sources is very difficult to measure, the cost approach tends toweaken as an indicator of value after the first few years of operation.
7 Leasing costs are necessary to bring a shopping center to a completed and operating condition. Should acompleted center be sold the developer would certainly recover leasing costs in the sale price.
AH 513 19 January 1983
CHAPTER 6: INCOME APPROACH
The income approach is the capitalization of a net income stream into an indication of value. Thedata needed are:
1. Gross income
2. Vacancy factor
3. Operating expenses
4. Land or building value if a residual technique is used
5. Capitalization rate
• Yield component
• Recapture component
• Real estate tax component
We must recognize that the market for shopping centers is made up of investors controlling largeamounts of capital. Included are individuals, corporations, associations, syndicates, and fundmanagers. Such investors purchase shopping centers for one reason--to earn the greatest possiblereturn at a given risk in a given period of time on the capital invested during that period. Thereturn can be in the form of net income, capital gain, and income tax shelter. Since the owners ofshopping centers measure the benefits of ownership in these terms, it seems logical to estimate thecenters' value for property tax purposes using these same terms. However, of the three types ofbenefits noted, the net income is the only one that can be directly capitalized into an indicator ofvalue. Because we always work with economic rent, we must analyze the income informationfrom as many centers as possible in order to insure the accuracy of the projected income stream.Shopping center account records should be inspected and data from a reasonable number of yearsanalyzed.
GROSS SALES VOLUME
The common denominator in the consumer merchandising business is the total annual gross salesper square foot of gross leasable area. This amount usually totals between $40 and $60 but mayreach $100 or more for high-volume markets; it will vary from center to center depending uponsize, age, and overall successfulness of the center.8
8 A more detailed analysis of typical sales volume in all types of shopping centers can be found in Dollars andCents of Shopping Centers, Urban Land Institute, 1972.
AH 513 20 January 1983
GROSS INCOME
The purpose of the income approach is to indicate the present value of future net income expectedfrom the prudent use of the land and existing improvements. This approach can only be usedcorrectly for property tax purposes, if current, and future economic rental information is used.Information taken from rental agreements negotiated prior to the date of appraisal will indicatethe value of the property on the prior date; obviously this would be an improper value to assess
It is often necessary to adjust contract rental information, or to impute current economic rentdiscovered in the market in order for the income approach to be meaningful. To do this, rentalinformation from similar stores and shopping centers should be carefully analyzed.
The total gross income received by the owner of a shopping center comes from several sources.The major portion is rent, minimum and percentage (overage), paid by the tenants who leasethe stores and offices. Additional income is derived from charges made for the use of commonareas and for taxes.
MINIMUM RENT
Minimum rent is a fixed payment in a percentage lease, usually expressed as an amount per squarefoot per year. The amount is negotiated at the beginning of the lease and usually is subject to re-negotiation at predetermined times during the term of the lease. Minimum monthly rent is usuallya function of the supply of, and demand for, retail stores.
PERCENTAGE RENT
Percentage (overage) is rent paid in addition to minimum rent. The amount is computed by takinga prenegotiated percentage of the portion of the monthly gross sales that exceeds a certain salesvolume. The percentage rate and the volume of sales necessary for the percentage rate to applyare negotiable, and like minimum rents may be subject to renegotiation at predetermined timesduring the term of the lease.
OTHER INCOME
Other income is collected to pay for the use of common areas, to pay taxes, and to meet publicityand promotional expenses that benefit the whole center. Income from vending machines andservice contracts should be included.
All of the above types of income should be considered in arriving at a projected long-term incomestream. Total gross incomes vary widely from center to center, but on a leasable square-footbasis there are average figures. According to a recent study conducted by the Urban LandInstitute,9 median annual operating receipts (including percentages and guaranteed minimums) perleasable square foot of store area are as follows:
9 Dollars and Cents of Shopping Centers, Urban Land Institute, 1972.
AH 513 21 January 1983
Regional Centers $2.64
Community Centers $2.38
Neighborhood Centers $2.34
It has been found that a strong relationship exists between the total square foot area of a store andthe square foot rent; the larger the store, the lower the total square foot rent. For example,bowling alleys, furniture stores, and movie theaters are considered low-rent tenants that pay from$1.00 to $2.00 per square foot. Camera shops, tobacco shops, and other small shops areconsidered high-rent stores and pay between $4.00 to $15.00 annually per square foot of grossleasable area. There is also a relationship between the rental rate and the distance between aparticular small store and the anchor store. The greater this distance is, the lower the rent will be.
ECONOMIC RENT
The total gross income earned by an entire center is the contract income which may or may notbe the economic income. If contract income is capitalized and it includes a percentage of thegross earnings of the individual tenants, then the result of extraordinary management skills of theindividual merchants may be inextricably woven into the total capitalized earning ability of thecenter. In order to recognize such unusual circumstances, the appraiser should make a wide-ranging rental survey so that economic rent can be isolated for processing.
An appraiser should be concerned with the identification of tenant-owned improvements whenestimating economic rent. Leasing agreements vary from center to center and even from tenant totenant within the same center. One tenant may lease only the building shell, while the neighboringtenant may lease shell, floor, ceiling, front, etc. Thus, to repeat, when estimating economic rent,it is extremely important to identify the ownership of the improvements involved and to know allof the benefits the tenant receives for his rent money.
Additional income received from a tenant for his use of the common areas (mall, parking,restrooms, etc.) is usually based upon the fraction of the whole center occupied by him. Suchcharges can also be based upon the amount of his gross sales as a percentage of the total grosssales in the center. These same methods may also be followed to recover costs of lighting, air-conditioning, security, etc.
VACANCY
The economic health of any shopping center depends upon the percentage of the total spacerented. Shopping centers are rarely fully occupied, and the appraiser must take this fact intoconsideration when refining gross income into economic gross income. There is no statewideaverage vacancy factor. However, data recently collected show that some of the better centershave approximately three percent of the total leasable area vacant. This figure is not typicalstatewide, but it does prove that vacancies do exist and that they must be recognized in theappraisal process.
AH 513 22 January 1983
OPERATING EXPENSES
Total operating expense is the sum of the monthly expense items incurred by the owner of thecenter during a given year's operation. Individual items of expense are many and varied butgenerally can be associated with one of the following categories.
• Management
• Insurance
• Payroll and employee benefits
• Leasing fees and commissions
• Supplies and materials
• Communication and transportation
• Licenses and permits
• Equipment charges
• Common areas and outside services
• Utilities not paid by tenants
• Promotion and advertising
• Merchants association
• Miscellaneous
The appraiser must know the typical annual expense in order to process gross income into netincome. To ascertain the typical expenses, a number of centers should be studied using some typeof common denominator. Expenses may be expressed per square foot of gross leasable area or asa percentage of the gross income. Studies indicate that expenses (not including real estate taxes)may equal 50¢ to 80¢ per square foot, or about 20 to 25 percent of the gross income. Extremecare must be taken in collecting expense data, since individual centers may follow different leasingpolicies regarding rental rates and expense responsibility. For example, a tenant in center "A"may pay real estate taxes and be charged a lower rent, while in center "B" he may not pay realestate taxes but he pays a higher rate.
CAPITALIZATION RATES
A capitalization rate is composed of several components. If the capitalized earning ability of land,a nondepreciable asset is desired, the rate will be comprised of only a yield component and a realestate tax component. If the capitalized earning ability of a depreciable asset is desired, the ratemust contain components for yield, real estate tax, and recapture.
If capitalization rates are not available because there have been no shopping center sales in thearea, an appraiser may have to search a broader market. Super-regional, regional, and sometimes
AH 513 23 January 1983
community centers are bought by investors who invest on a statewide and even a nationwidebasis. In addition to searching a broader market, an appraiser should also consider informationresulting from the sale of other types of commercial property. This must be done carefullyhowever, because a subject center cannot be compared directly with different types of commercialproperties. The appraiser should analyze rates of return anticipated by investors in commercialproperties that have similar risk and income potential. He must keep in mind that expenses as apercentage of gross income, remaining economic life, and the ratio of land value to improvementvalue will be reflected in such rates.
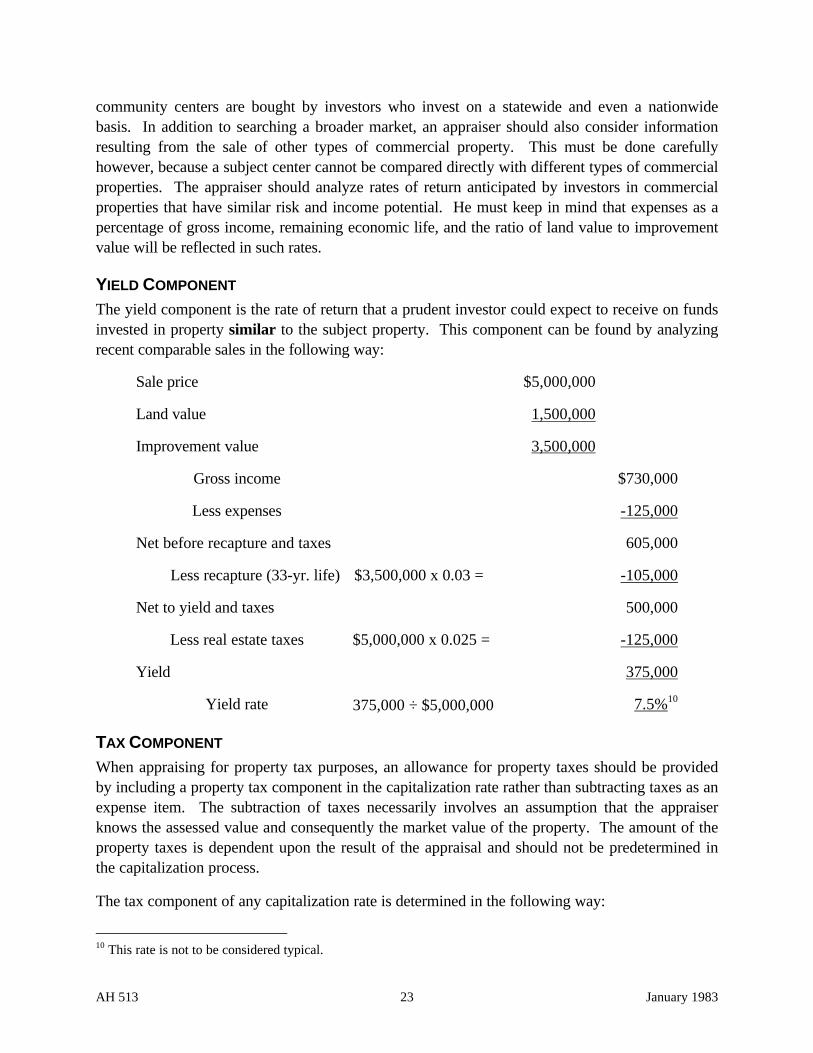
YIELD COMPONENT
The yield component is the rate of return that a prudent investor could expect to receive on fundsinvested in property similar to the subject property. This component can be found by analyzingrecent comparable sales in the following way:
Sale price $5,000,000
Land value 1,500,000
Improvement value 3,500,000
Gross income $730,000
Less expenses -125,000
Net before recapture and taxes 605,000
Less recapture (33-yr. life) $3,500,000 x 0.03 = -105,000
Net to yield and taxes 500,000
Less real estate taxes $5,000,000 x 0.025 = -125,000
Yield 375,000
Yield rate 375,000 ÷ $5,000,000 7.5%10
TAX COMPONENT
When appraising for property tax purposes, an allowance for property taxes should be providedby including a property tax component in the capitalization rate rather than subtracting taxes as anexpense item. The subtraction of taxes necessarily involves an assumption that the appraiserknows the assessed value and consequently the market value of the property. The amount of theproperty taxes is dependent upon the result of the appraisal and should not be predetermined inthe capitalization process.
The tax component of any capitalization rate is determined in the following way:
10 This rate is not to be considered typical.
AH 513 24 January 1983
Tax Rate x Assessment Ratio = Tax Component100
RECAPTURE COMPONENT
The recapture component is the amount of money expressed as a percent that must be recoveredannually in order to recapture the investment in depreciating improvements.
CAPITALIZATION METHODS
Shopping center improvements are relatively long-lived assets that are expected to produce anincome stream throughout their economic life. There are two major points to consider inanalyzing such an income stream. The first point is the quality, or, the risk inherent in the incomestream. The second point is the shape (amount and duration) of the income stream.
An appraiser reflects the quality of a subject income stream by using a capitalization rate derivedfrom sales of shopping centers having tenants whose risk characteristics are similar to thosepossessed by the tenants in the subject shopping center.
The second point is not so easy to handle because the shape of an income stream has twodimensions that vary from center to center and even from time to time in the same center. Anappraiser must estimate the amount of income the center will earn year by year and the economiclife of the center. His decisions on these points can only be based upon the income history of thesubject center, the history of similar shopping centers, and the effect of expected future economicconditions.
Obviously, all centers will not have similarly shaped income streams of similar quality. Therefore,it is not possible to recommend a particular "best shaped" income curve. However, we can pointout that several counties have collected data to indicate that well-planned, well-managed centersgenerally show increasing income streams during the first three to six years, followed by a generalleveling-off period. This could suggest that the capitalization process might be based upon aninclining premise, or upon a constant income premise. But an appraiser must keep in mind thatthe forces of depreciation and competition are always going to be working on the shape of theincome stream, and at some time in the future income may decline. Therefore, an income premiseshould only be selected after carefully considering all available economic data. There are severalcapitalization techniques that may be employed: land residual, building residual, propertyreversion, and an overall rate.
Land Residual
This technique of capitalization assumes that the land is developed to its highest and mostprofitable use. The capitalization process is accomplished by dividing the residual net incomeattributable to the land by a capitalization rate comprised of a current yield component and a realestate tax component. To this quotient must be added the depreciated value of the improvements.This technique is sensitive to small variations in residual net income, and the appraiser mustemploy it cautiously.
AH 513 25 January 1983
Building Residual
This technique is similar to the land residual technique except that in this case the residual netincome attributable to the improvements is divided by a capitalization rate that includescomponents for recapture, yield, and real estate taxes. To this quotient must be added theestimated land value. This technique is usually more reliable than the land residual technique.
Property Reversion
This technique is similar to the residual technique except that the present worth of the total annualnet income earned by both land and improvements is computed for the period of time equal to theestimated remaining economic life of the improvements. To this amount must be added thereversionary value of the land. This technique usually will result in a lower value indicator thanthe residual technique. The reason for the difference lies solely in the fact that the propertyreversion techniques is, through the declining income premise, providing for a decline in theentire income stream while the other methods provide for a constant income from that portion ofthe income imputable to the land.
Overall Rate
An overall rate is "the percentage which combines within itself the interest rate for land and thecapitalization rate for building, and which expresses the relationship between the entire propertyand the net income before recapture imputable to it.11 An overall rate is found by taking thequotient of the net income before recapture and the sales price in terms of cash of recently soldcenters. This rate is then applied to the net income before recapture earned by the subject.
This is an excellent method when comparable sales information is available. It is essential that thecomparable and subject properties have similar remaining economic lives. The method does notsegregate land and improvements values, however, and it will be necessary to do so by some othermethod or approach.
11 The Appraisal of Real Estate, American Institute of Real Estate Appraisers, 1966.
AH 513 26 January 1983
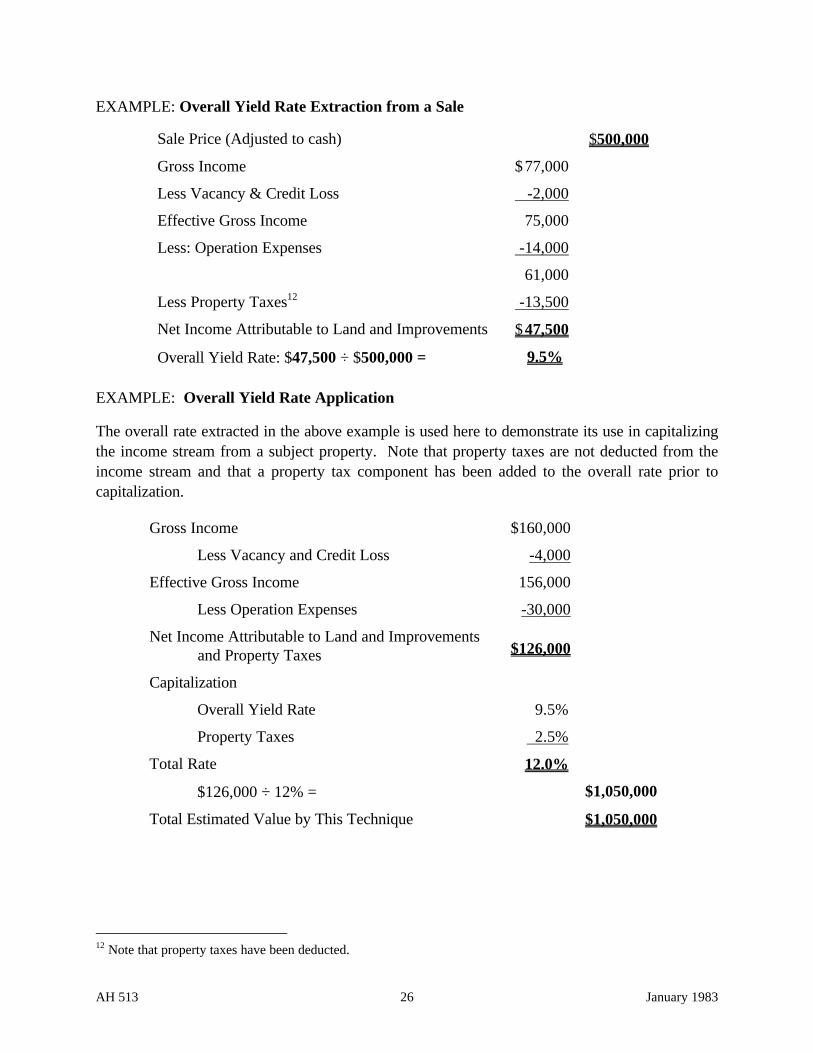
EXAMPLE: Overall Yield Rate Extraction from a Sale
Sale Price (Adjusted to cash) $500,000
Gross Income $77,000
Less Vacancy & Credit Loss -2,000
Effective Gross Income 75,000
Less: Operation Expenses -14,000
61,000
Less Property Taxes12 -13,500
Net Income Attributable to Land and Improvements $ 47,500
Overall Yield Rate: $47,500 ÷ $500,000 = 9.5%
EXAMPLE: Overall Yield Rate Application
The overall rate extracted in the above example is used here to demonstrate its use in capitalizingthe income stream from a subject property. Note that property taxes are not deducted from theincome stream and that a property tax component has been added to the overall rate prior tocapitalization.
Gross Income $160,000
Less Vacancy and Credit Loss -4,000
Effective Gross Income 156,000
Less Operation Expenses -30,000
Net Income Attributable to Land and Improvements$126,000and Property Taxes
Capitalization
Overall Yield Rate 9.5%
Property Taxes 2.5%
Total Rate 12.0%
$126,000 ÷ 12% = $1,050,000
Total Estimated Value by This Technique $1,050,000
12 Note that property taxes have been deducted.
AH 513 27 January 1983
CHAPTER 7: SALES COMPARISON APPROACH
DIRECT COMPARISON
The sales comparison approach is based upon the comparison of like with like, that is, comparisonof the subject center with similar centers that have sold recently. Here are some factors that arehelpful in establishing comparability.
SIZE
• Acres
• Gross leasable area
• Parking Spaces
SALES
• Total gross sales for the entire center
• Average gross sales per square foot of gross leasable area
INCOME
• Total income earned by the center (rent, etc.)
• Average gross income per square foot of gross leasable area
• Total net income earned by the developer
• Average net income per square foot of gross leasable area
RECIPROCAL EASEMENT AGREEMENTS
EXPENSES—TOTAL EXPENSE FOR THE ENTIRE CENTER
• Average expense per square foot of gross leasable area
RATIOS
• Ratio of expense to gross income
• Ratio of expense to net income
• Ratio of gross income to sales price (GRM)
• Ratio of land area to total building area
• Ratio of land area to gross leasable store area
• Ratio of gross income to parking space
AH 513 28 January 1983
YIELD RATE
• Net rate of return after deducting amounts for operating expenses, property taxes, andrecapture.
Where comparability can be established the sales comparison approach must be heavily weightedas an indicator of the final value estimate.
GROSS RENT MULTIPLIER (GRM)
A GRM can be used as a valuation tool as well as an indicator of comparability. It is generallyviewed as a check against the classic approaches to value and is awarded something less than thestatus of a technique. The reliability of a GRM is only as good as the sales from which it isderived. If a sold property, for example, has potential for large capital gains, the value indicatedby using the resulting GRM will include the capital gain potential and will be a poor valueindicator for an appraisal subject that lacks such potential. If a sold property has excess landwhile the subject has none, the use of a GRM from such a sale will indicate a value that includesexcess land value. With these examples we can readily see that the selection and use of gross rentmultipliers must be carefully made to avoid misleading results.
AH 513 29 January 1983
CHAPTER 8: SUMMARY
The factors related to the physical and economic structure of a shopping center are many andvaried. Included are size, location, access, competition, parking area, malls, climate, sales area,tenant mix, leasing agreements, etc. It is the appraiser's job to analyze these factors and any otherpertinent information and to employ approaches to value that individually and/or jointly weighthese factors so that a logical and well-supported opinion of value can be derived.
We believe the most logical method of estimating the value of an income-producing property,such as a shopping center, is to capitalize the net income that the property is capable ofproducing.
It is reasonable to emphasize the use of the cost approach during the early life of a shoppingcenter because during this period the income stream is unstable. To assist with the cost approachthe State Board of Equalization periodically updates and publishes cost factors in Assessors'Handbook Section 532, Commercial Cost Manual. These cost factors are reliable and can beutilized in the appraisal of many kinds of store buildings. The value of land, a "cornerstone" inmost approaches to value and especially important to the cost approach, varies greatly from placeto place and from time to time. There is no way to provide fresh land value data in the same waythat building cost data are supplied. Each appraiser must search the market area in which he isworking to ascertain current land values and to meet his valuation responsibilities. The costapproach is a good and helpful tool and should be attempted in every appraisal unless theimprovements have suffered severe economic obsolescence.
We have found that sellers of shopping centers are often more concerned with tax shelter and/orcapital gains than with cash. It is not uncommon to find sales transactions that include tradedproperty, traded equity, or traded stock. When such conditions are encountered, the sale termsmust be refined to a cash equivalent basis before the sale can be used. Sometimes the terms of anotherwise "good" sale will render that sale unreliable, and on some occasions sales informationwill be so weak that the entire sales comparison approach is meaningless. However, if goodinformation is available, the sales comparison approach should be weighted heavily.
Some knowledgeable appraisers have expressed the opinion that the use of an overall rate is areliable method of estimating the value of a shopping center. We concur, but we buffer ourconcurrence with the knowledge that an overall rate must be derived from sales of fairlycomparable shopping centers, or other commercial properties having similar characteristics.
We believe the appraiser must possess a certain amount of pertinent basic data and the knowledgeto utilize that data correctly in appraising a shopping center. This handbook is not designed toprovide either of these items per se. It is designed only to assist an appraiser in acquiring suchinformation and knowledge for himself.
AH 513 30 January 1983
CHAPTER 9: BIBLIOGRAPHY
California State Board Of Equalization, Assessors' Handbook Section 501, General AppraisalManual, March 1966.
The American Institute of Real Estate Appraisers, The Appraisal of Real Estate, fifth edition,1968.
The Urban Land Institute:
The Community Builders Handbook, 1968.
Dollars and Cents of Shopping Centers, 1969.
Parking Requirements for Shopping Centers, 1965.
Bernard J. La Londe & Paul E. Smith, A Selected and Annotated Bibliography On ShoppingCenter Management, Michigan State University, 1968.
S. O. Kaylin, "Terms of Leases For Space In Centers", Chain Store Age, May 1968.
Homer, Hoyt, "Land Values in Shopping Centers", Traffic Quarterly, July 1968.
National Research Bureau, Inc., Shopping Center Directory, 10th Edition, 1968.
Donald H. Graham, "Shopping Center Real Property Taxes", The Appraisal Journal, October1963.
James A. Lowden, "Valuation of Shopping Centers", The Appraisal Journal, April 1967.
National Institute of Real Estate Brokers, Percentage Leases, 1970.
AH 513 31 January 1983
CHAPTER 10: CASE STUDY
REGIONAL SHOPPING CENTERS
This case study is fictitious.
The dollar amounts, rates, and factors
shown are utilized to demonstrate
appraisal procedures only and should
not be considered typical.
¡ ¡ ¡ ¡ ¡ ¡ ¡ ¡ ¡
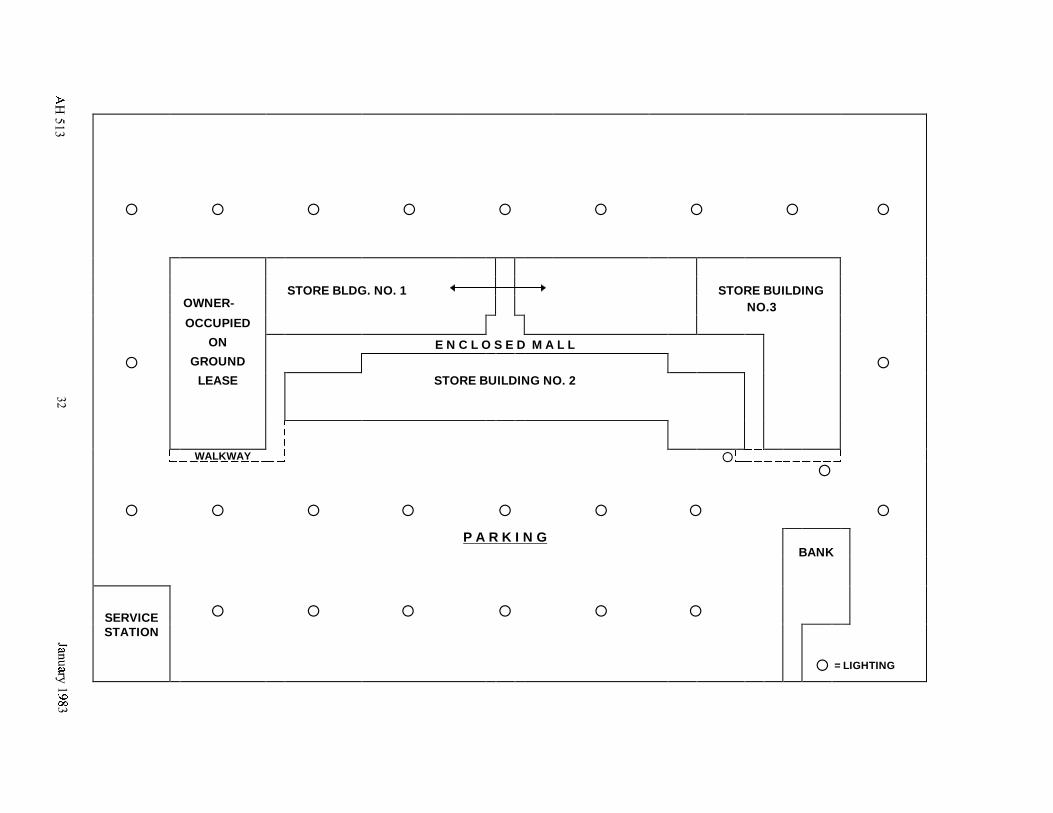
STORE BLDG. NO. 1 STORE BUILDINGOWNER- NO.3OCCUPIED
ON E N C L O S E D M A L L
¡ GROUND ¡LEASE STORE BUILDING NO. 2
WALKWAY ¡
¡ ¡ ¡ ¡ ¡ ¡ ¡
¡
¡
P A R K I N GBANK
SERVICE ¡ ¡ ¡ ¡ ¡ ¡STATION
¡ = LIGHTING
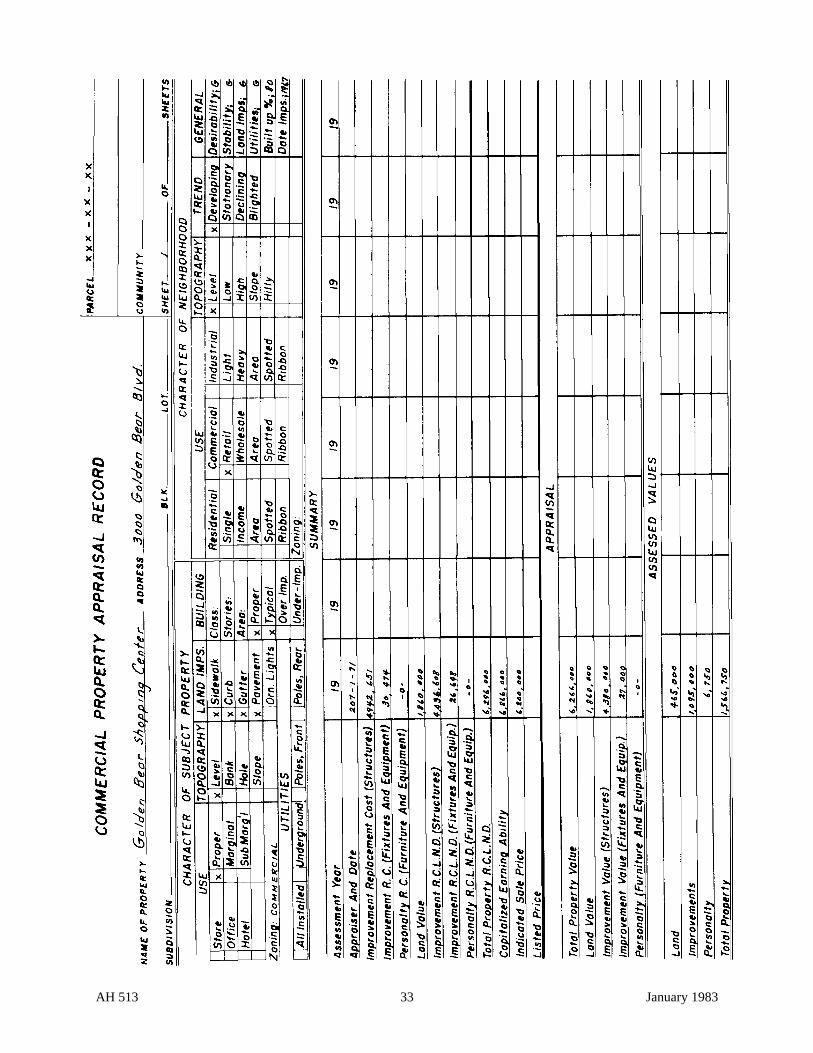
AH 513 33 January 1983
AH 513 34 January 1983
AH 513 35 January 1983
CASE STUDY
INTRODUCTION
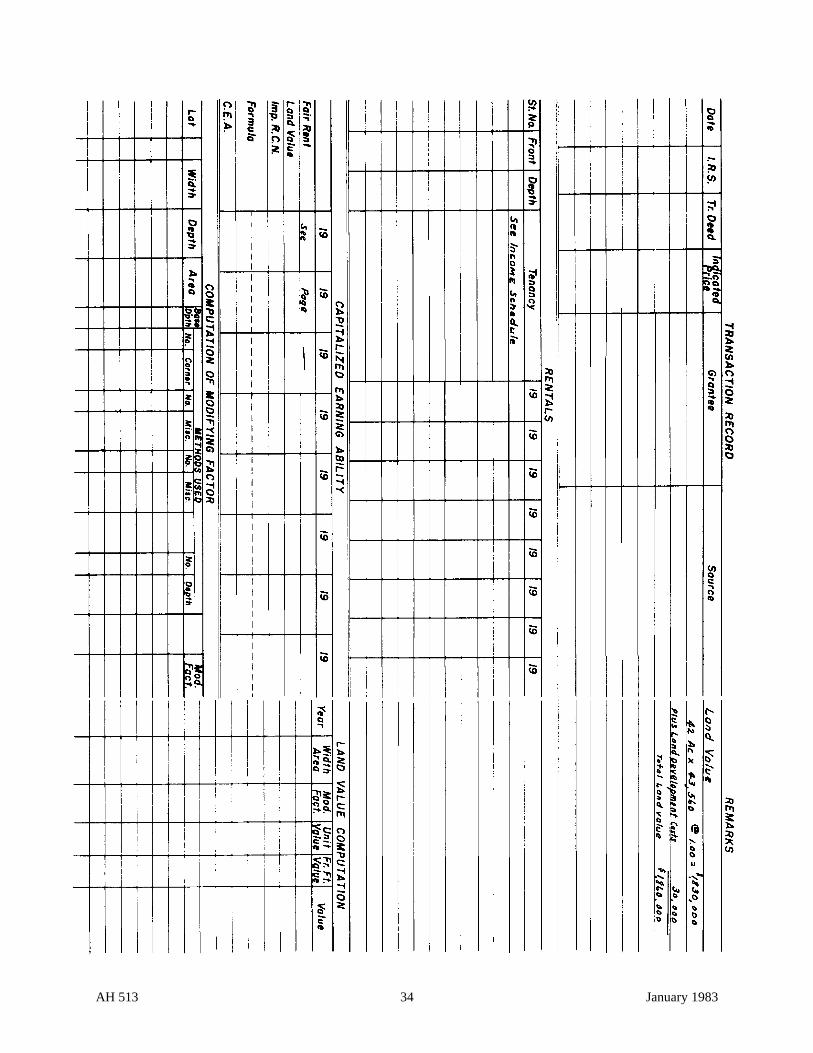
The subject is a regional shopping center located within the limits of a growing California city.The center has two major department stores (one is owner-occupied on land leased from thecenter) that serve jointly as power anchors. There is an enclosed mall, ample parking, and anoverall land-to-building ratio of 2.7 to 1.
The center is five years old and has reached maturity. The annual gross income flows from therent of the department store, department store ground lease, and many smaller stores and shops.A bank and a service station are located in the center but are not owned by the center and are notincluded in this appraisal.
Six community shopping centers are located within the subject's trade area. They appear not tobe expanding and at present do not compete directly with the subject. Also within the trade areaare twelve neighborhood centers featuring everyday needs of the nearby residents. These smallcenters do not detract significantly from the sales volume of the subject.
The subject is well managed and holds a challenging position in the overall scheme of retailmerchandising in the city.
SUBJECT PROPERTY INFORMATION
Description
The taxable property included in this appraisal consists of the following:
• 42 acres of land (1 acre used for bank and Service Station is excluded)
• 3 store buildings containing a total of ± 314,000 square feet of gross leasable area. There isa separately owned department store containing 186,000 square feet.
• An enclosed mall containing 59,900 square feet of useable area.
• Miscellaneous building area containing 22,600 square feet of useable area
• Parking area improvements, including surfacing, wheel blocks, painted lines, landscaping,and lighting
• Miscellaneous improvements
Identification
The subject is identified in the official county records as Assessor's Parcel 123-04-001 and islocated in tax-rate area 23-002.
AH 513 36 January 1983
Owner of Record
John Q. Owner Business Phone
11647 Countryside Lane 111-333-4444
Storetown, California 19999
Address
The subject is located at 3000 Bear Boulevard. This address is the southwesterly corner of theintersection of Interstate 110, a full freeway, and Bear Boulevard, an intra-city street that hasthree lanes of traffic in each direction.
Site Description
The subject land is level and at grade with the adjacent streets. No extraordinary sitedevelopment costs were incurred in development of the center.
Soils
The soils appear to be stable and suitable for shopping center development.
Utilities
The following utilities and services are available to the property
Natural gas Water
Electricity Sewer
Telephone Municipal bus service
Garbage collection (city contract)
Highest and Best Use
The highest and best use of the subject is the present use.
NEIGHBORHOOD
Commercial Development
The neighborhood includes, besides the subject center, four franchise quick-order restaurants,three automobile dealers, two franchised hardware stores, and two theaters. All of thesebusinesses are located opposite the center on Bear Boulevard. The commercial neighborhood is75 percent developed
Residential Development
Residential development extends in all directions away from the commercial development. Stripsimmediately behind the commercial strips are zoned and used for multi-residential purposes.
AH 513 37 January 1983
Beyond the multi-residential zones single-family residences occupy approximately 80 percent ofthe land; the remaining 20 percent is still undeveloped.
Income Level
There is a relatively wide range in annual income levels. A recent study showed (1) 22 percent ofthe residents are retired with annual gross incomes averaging $6,000, (2) 75 percent of theresidents are employed and have an average annual gross income per residence of $11,000, (3) 3percent of the population is unemployed.
If a center is to be successful, sales must average about $60 per square foot of gross leasable areaper year. With a gross sales area of 500,000 square feet, the subject center must take in about$30,000,000 annually.13 Viewed differently, 120,000 people must spend about $250 annually atthe center. These figures appear reasonable when applied to the subject, especially since thesubject is a regional center and is attracting customers from an area containing more than 100,000people.
Access
The subject is accessible via Bear Boulevard, which separates from I-110. It can also be reachedvia Green and Blue Streets, which bound the center on the east and the west.
Public Transportation
The subject is served by a municipal bus line which has "feeder lines" originating in the fourgeneral directions from the center. A recent survey showed that only a small percent of theshoppers arrived by bus, and on this basis no special loading facilities have been arranged.
History
Seven years ago the firm of Population Scientific contracted and completed a feasibility study ofthe subject site for use as a shopping center. The final report was favorable, and zoning wasvaried to meet the conditions of the city plan. One year later the land was acquired from the AceReal Estate Company for $860,000 (43 acres @ $20,000). The seller would only accept 29percent down payment, with the balance due in five equal annual payments plus accrued intereston the unpaid balance.
On August 1, six years ago, Mr. Owner designated the real estate firm of Do, Well, and Good ashis leasing agent. It was agreed that this service would cost 5 percent of the rent for the first 5years of each lease, 3 percent of the rent for the remaining term of each lease, and 3 percent of therent for optional periods.
Mr. Owner then contacted the loan correspondent for the Long Life Insurance Company andsubsequently entered into an agreement whereby Long Life would finance the entire center,
13 Includes separately owned department stores.
AH 513 38 January 1983
including land. Final documents providing for financing would not be signed until 80 percent ofthe total gross leasable space had been leased to reliable tenants and the income therefrom wouldaccommodate loan repayment,, including interest, operating expenses, and real estate taxes.
Leasing arrangements moved along smoothly; final financing documents were signed; andconstruction started. The center opened five years ago.
OPERATION AND MANAGEMENT
Manager
The manager occupies an office in store number one. He employs a secretary and a maintenancesuperintendent. He deals directly with the accounting firm that provides record service for thesubject and that periodically audits the individual stores. He contracts for cleaning services,utilities, and security and takes the lead in coordinating "center" sales promotion and publicity.
The manager usually does not handle leasing arrangements since this is a specialized fieldrequiring the services of a processional leasing agent and/or an attorney.
Staff
As noted above, the staff of the center includes only two people besides the manager. However,many services are acquired from outside sources on a bid or retainer basis.
Tenant Mix and Income Schedule
See the income schedule on page 58.
VALUATION
General
The value indicators employed in this appraisal are the income approach, the sales comparisonapproach, and the cost approach. The subject is a mature commercial property producing a long-term income stream; the income approach is therefore emphasized.
Data analyzed and employed in this appraisal came from the records of the subject and of othercommercial properties. The official public records have also been used. Several peopleconsidered to be entrepreneurs in this shopping center business have been interviewed, and theiropinions ere carefully weighed.
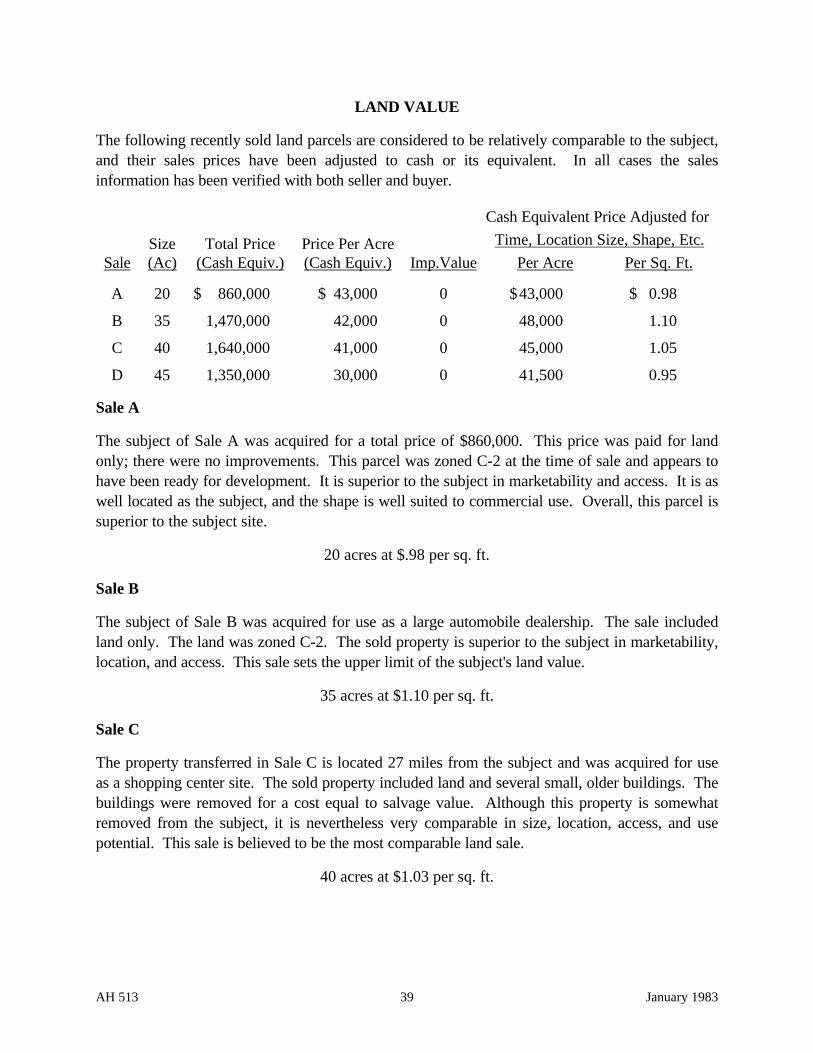
AH 513 39 January 1983
LAND VALUE
The following recently sold land parcels are considered to be relatively comparable to the subject,and their sales prices have been adjusted to cash or its equivalent. In all cases the salesinformation has been verified with both seller and buyer.
Cash Equivalent Price Adjusted for
Size Total Price Price Per Acre Time, Location Size, Shape, Etc.
Sale (Ac) (Cash Equiv.) (Cash Equiv.) Imp.Value Per Acre Per Sq. Ft.
A 20 $ 860,000 $ 43,000 0 $43,000 $ 0.98
B 35 1,470,000 42,000 0 48,000 1.10
C 40 1,640,000 41,000 0 45,000 1.05
D 45 1,350,000 30,000 0 41,500 0.95
Sale A
The subject of Sale A was acquired for a total price of $860,000. This price was paid for landonly; there were no improvements. This parcel was zoned C-2 at the time of sale and appears tohave been ready for development. It is superior to the subject in marketability and access. It is aswell located as the subject, and the shape is well suited to commercial use. Overall, this parcel issuperior to the subject site.
20 acres at $.98 per sq. ft.
Sale B
The subject of Sale B was acquired for use as a large automobile dealership. The sale includedland only. The land was zoned C-2. The sold property is superior to the subject in marketability,location, and access. This sale sets the upper limit of the subject's land value.
35 acres at $1.10 per sq. ft.
Sale C
The property transferred in Sale C is located 27 miles from the subject and was acquired for useas a shopping center site. The sold property included land and several small, older buildings. Thebuildings were removed for a cost equal to salvage value. Although this property is somewhatremoved from the subject, it is nevertheless very comparable in size, location, access, and usepotential. This sale is believed to be the most comparable land sale.
40 acres at $1.03 per sq. ft.
AH 513 40 January 1983
Sale D
The buyer in Sale D acquired the property for speculation. The property is zoned C-2, and thebuyer has no plans for immediate development. He is looking for an opportunity to sell the parcelin smaller parts or hopes to find a "build-to-suit tenant."
This property was acquired for $1,350,000 and included land only. It is similar to the subject insize but is in a less desirable location and has poorer access. This sale sets the lower limit of thesubject's land value.
45 acres at $.95 per sq. ft.
Recapitulation
The properties involved in Sales A and B are both superior to the subject in location, access, andutility. Both are recent sales and, in the opinion of the appraiser, set the upper limit of the subjectland at $1.10 per square foot. Sale C covered a property very similar to the subject even thoughit is 27 miles distant. The location is such that the property probably would be as productive asite as the subject.
Sale D involved a parcel that is definitely inferior to the subject. The subject has better access andlocation in relation to densely populated areas (purchasing power). Commercial development aswell as residential growth appears to be proceeding at a much faster rate near the subject. It is theappraiser's opinion that Sale D sets the lower limit of the subject land value.
After considering all of the above information and the comments and opinions of people qualifiedin the valuation and use of commercial property, it is the appraiser's opinion that the fair marketvalue of the subject land unimproved and ready for development to its highest and best use is$1,830,000 derived as follows:
42 Ac. x 43,560 sq. ft. = 1,829,520 sq. ft.
1,829,520 x $1.00 = $1,830,000 (Rounded14)
Land development costs must be added to this figure to obtain total land value - See back ofCommercial Property Appraisal Record, at page 34.
14 Land used for bank and service station is excluded.
AH 513 41 January 1983
THE COST APPROACH
There are three major structures owned by the developer and included in this appraisal. Eachstructure is treated separately on a separate Commercial Building Record. The separately owneddepartment store building, service station, and bank are not included.15
The cost factors employed are from Assessors' Handbook 532, Commercial Building CostManual, published by the State Board of Equalization in June 1968. The costs used arereplacement costs adjusted to current dollar values and are "unit in use" figures.16
It is the appraiser's opinion that the shopping center has a remaining economic life of 33 years andthat the improvements are 93 percent good. Miscellaneous improvements are recorded onseparate pages entitled "Miscellaneous Building Record" and "Equipment Replacement CostRecord". The land value is based on comparable land sales.
In this case study "replacement costs" have been used exclusively. We suggest that adjusted"historical costs" also be analyzed in appraising shopping centers that have been developedrecently.
15 The shopping center improvements have not been treated as a unit in the cost approach because this wouldsimply involve combining the cost of the separately owned properties and then reapportioning the resulting suminto the same amounts that were combined in the first place. The entire land area has been treated as a unit,however, by using sales of similar land of similar size and adding land development costs.16 "Unit in use" cost is the total cost of the store building in typical use condition. Figures are on a square-footbasis.
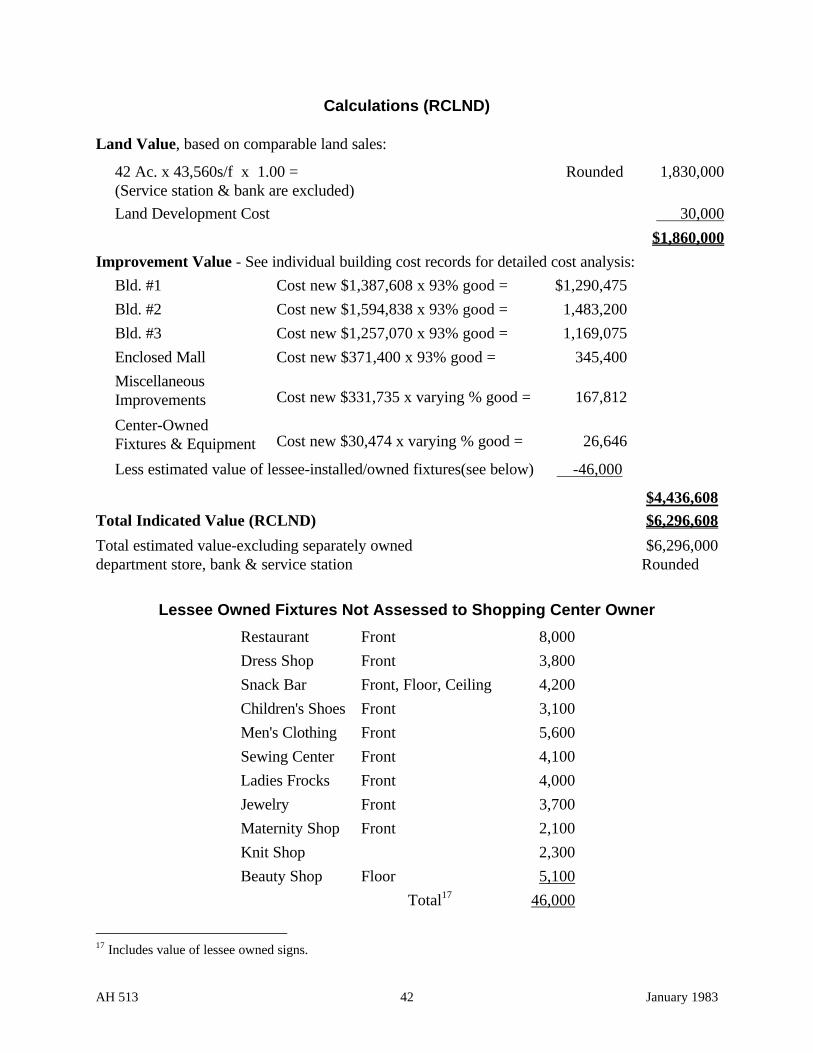
AH 513 42 January 1983
Calculations (RCLND)
Land Value, based on comparable land sales:
42 Ac. x 43,560s/f x 1.00 = Rounded 1,830,000(Service station & bank are excluded)
Land Development Cost 30,000
$1,860,000
Improvement Value - See individual building cost records for detailed cost analysis:
Bld. #1 Cost new $1,387,608 x 93% good = $1,290,475
Bld. #2 Cost new $1,594,838 x 93% good = 1,483,200
Bld. #3 Cost new $1,257,070 x 93% good = 1,169,075
Enclosed Mall Cost new $371,400 x 93% good = 345,400
MiscellaneousImprovements Cost new $331,735 x varying % good = 167,812
Center-OwnedFixtures & Equipment Cost new $30,474 x varying % good = 26,646
Less estimated value of lessee-installed/owned fixtures(see below) -46,000
$4,436,608
Total Indicated Value (RCLND) $6,296,608
Total estimated value-excluding separately owned $6,296,000department store, bank & service station Rounded
Lessee Owned Fixtures Not Assessed to Shopping Center Owner
Restaurant Front 8,000
Dress Shop Front 3,800
Snack Bar Front, Floor, Ceiling 4,200
Children's Shoes Front 3,100
Men's Clothing Front 5,600
Sewing Center Front 4,100
Ladies Frocks Front 4,000
Jewelry Front 3,700
Maternity Shop Front 2,100
Knit Shop 2,300
Beauty Shop Floor 5,100
Total17 46,000
17 Includes value of lessee owned signs.
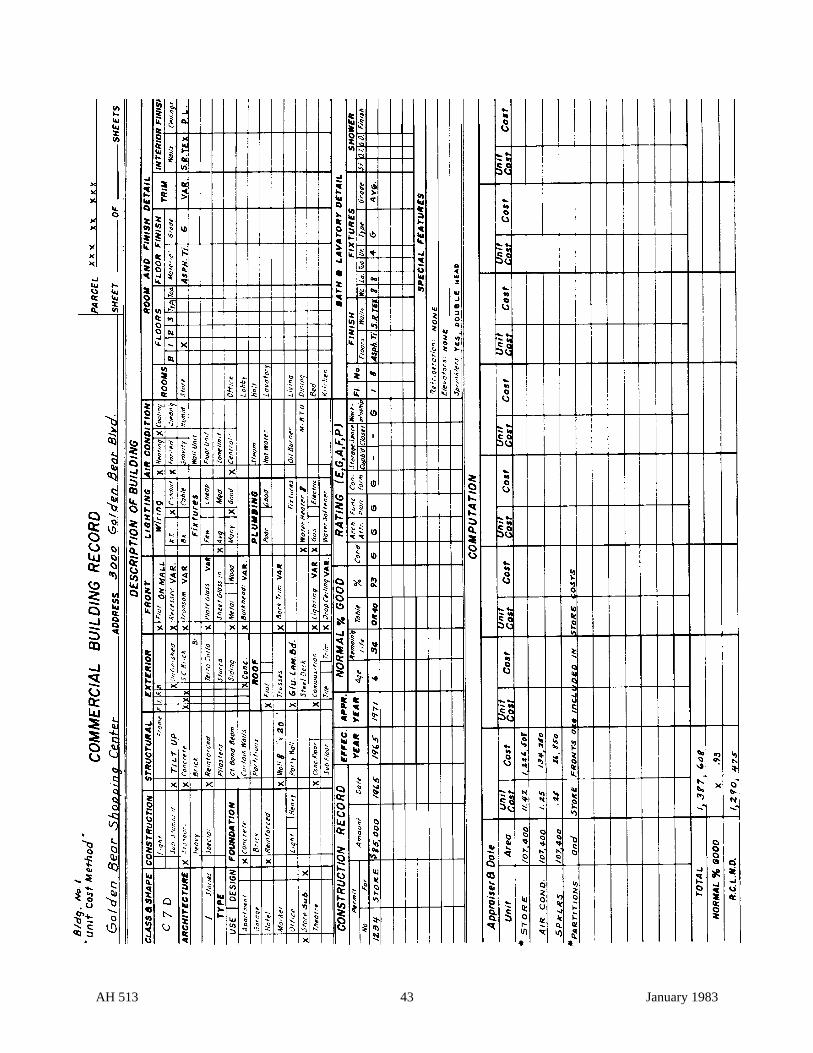
AH 513 43 January 1983
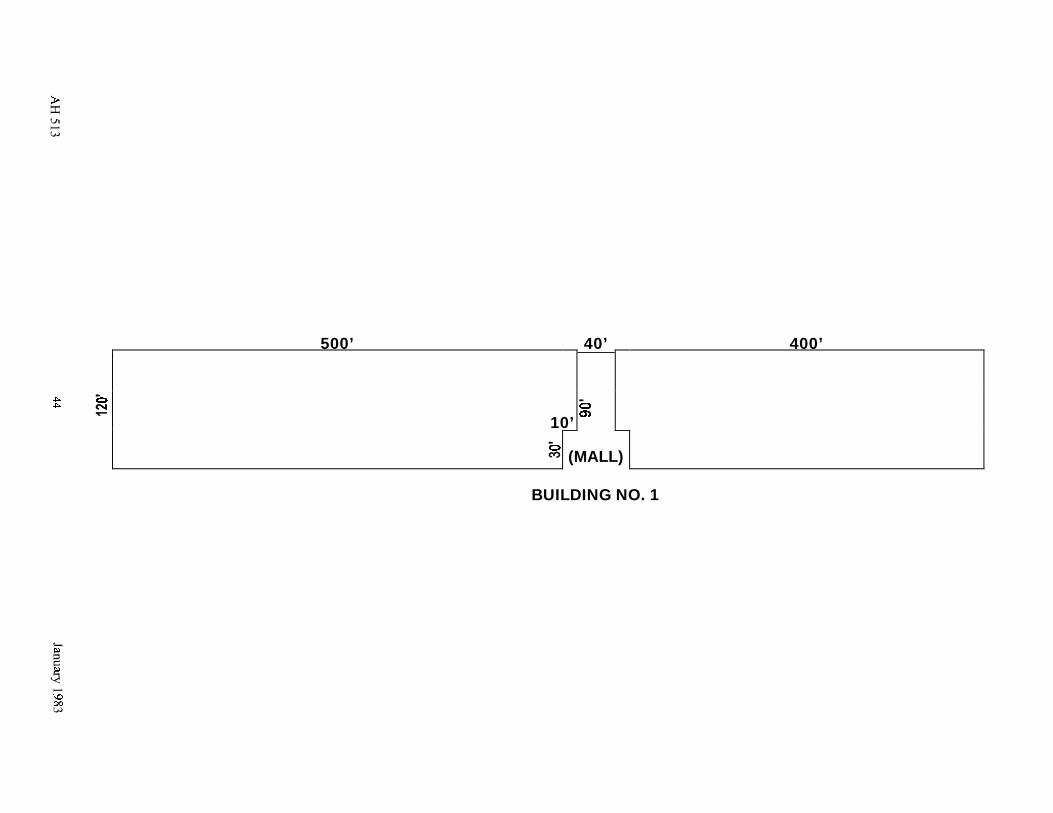
500’ 40’ 400’
10’
(MALL)
BUILDING NO. 1
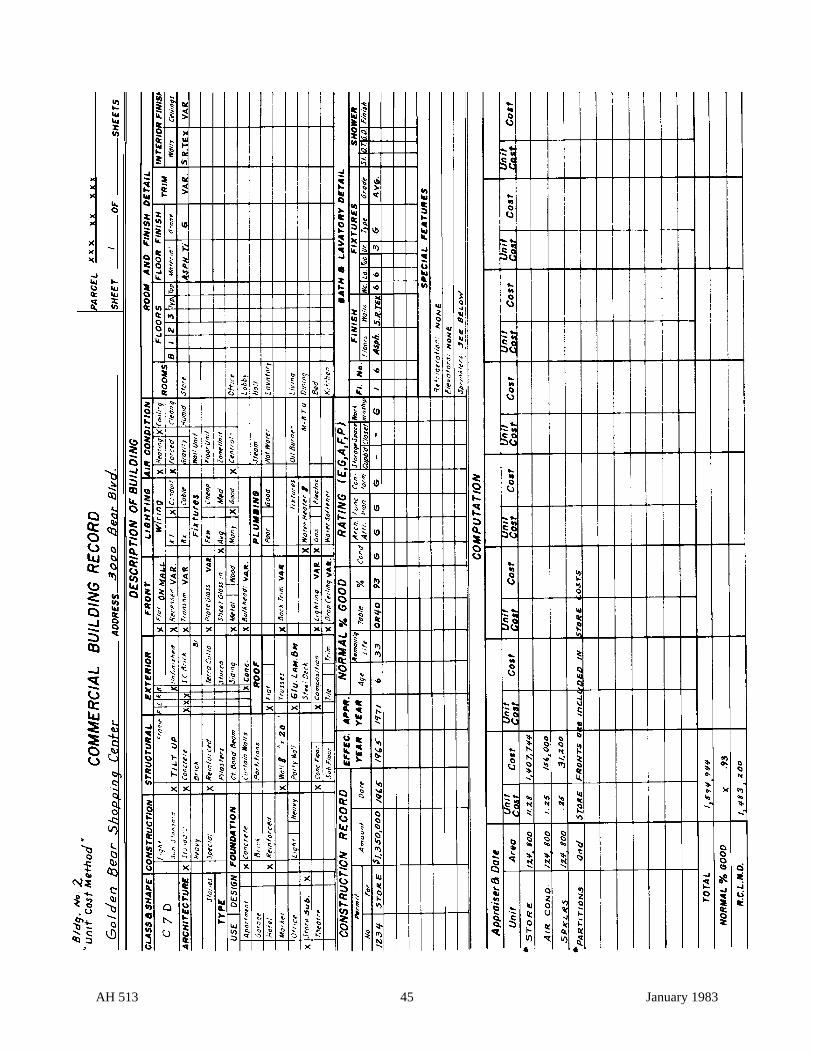
AH 513 45 January 1983
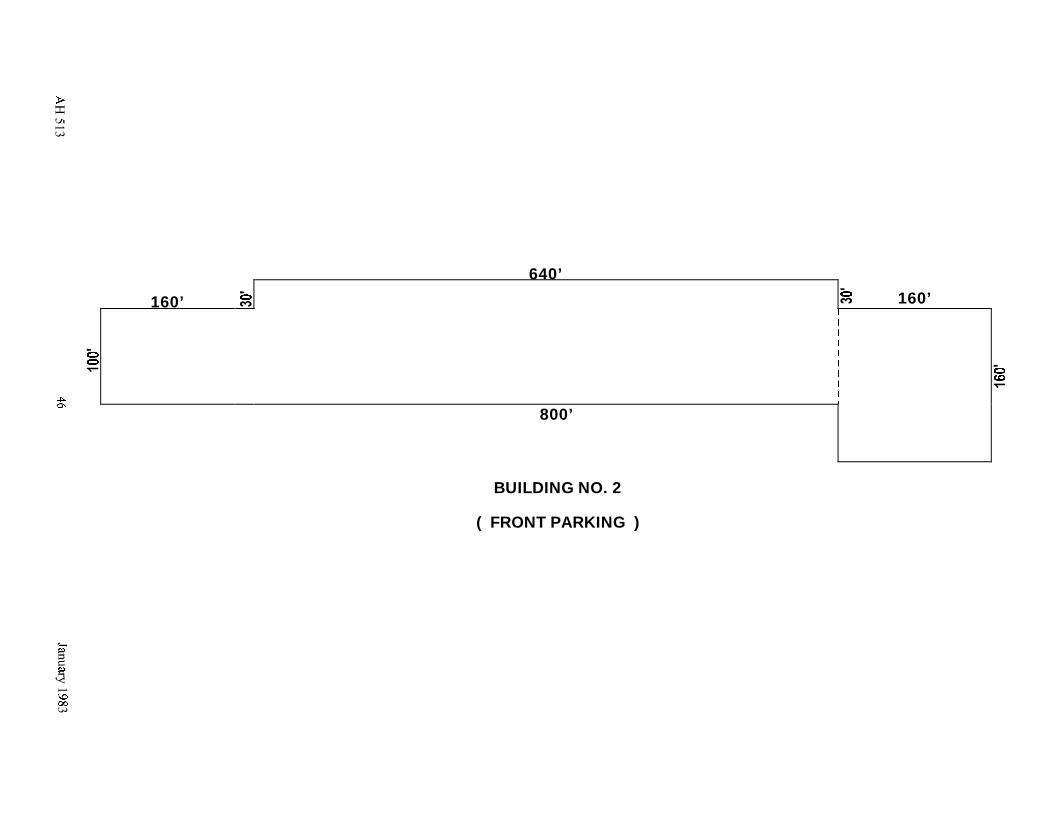
640’
160’ 160’
800’
BUILDING NO. 2
( FRONT PARKING )
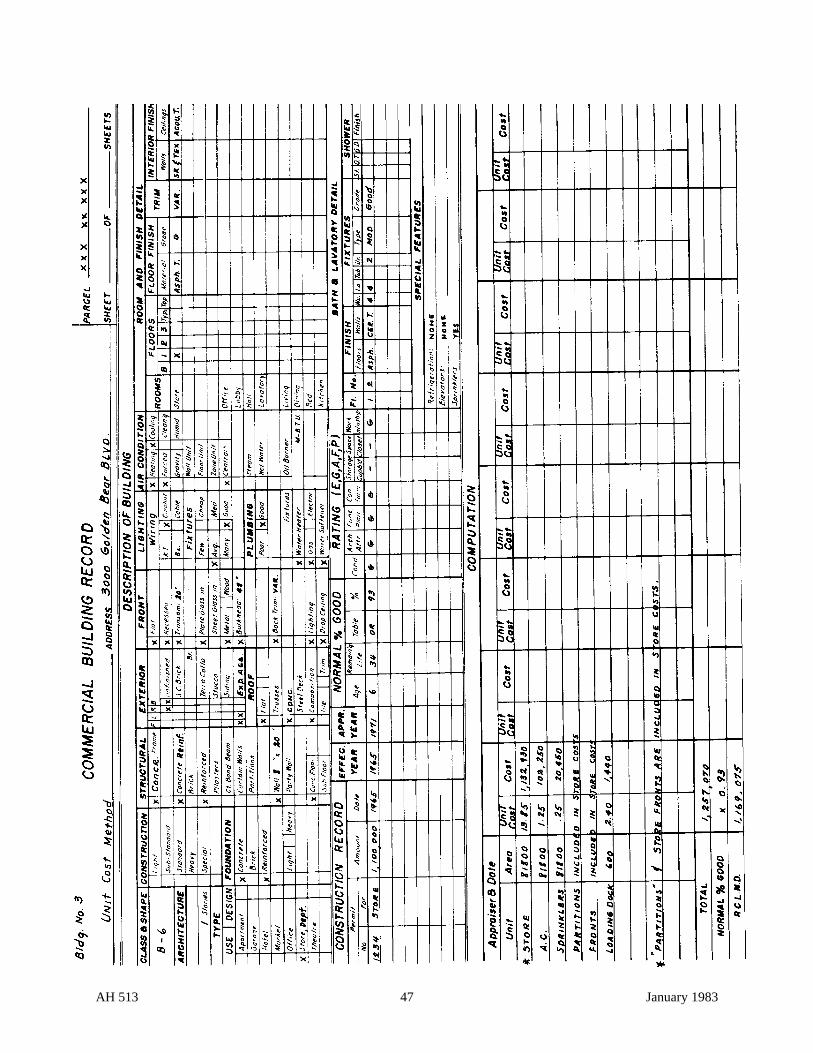
AH 513 47 January 1983
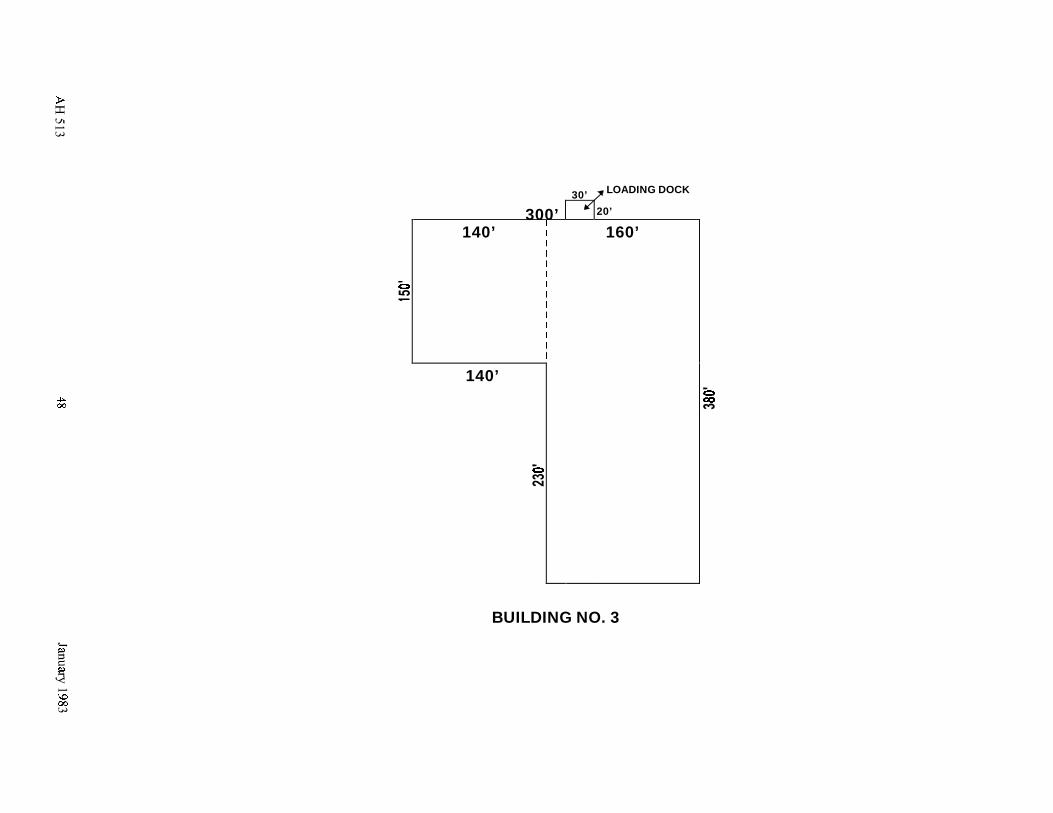
30’ LOADING DOCK
300’ 20’
140’ 160’
140’
BUILDING NO. 3
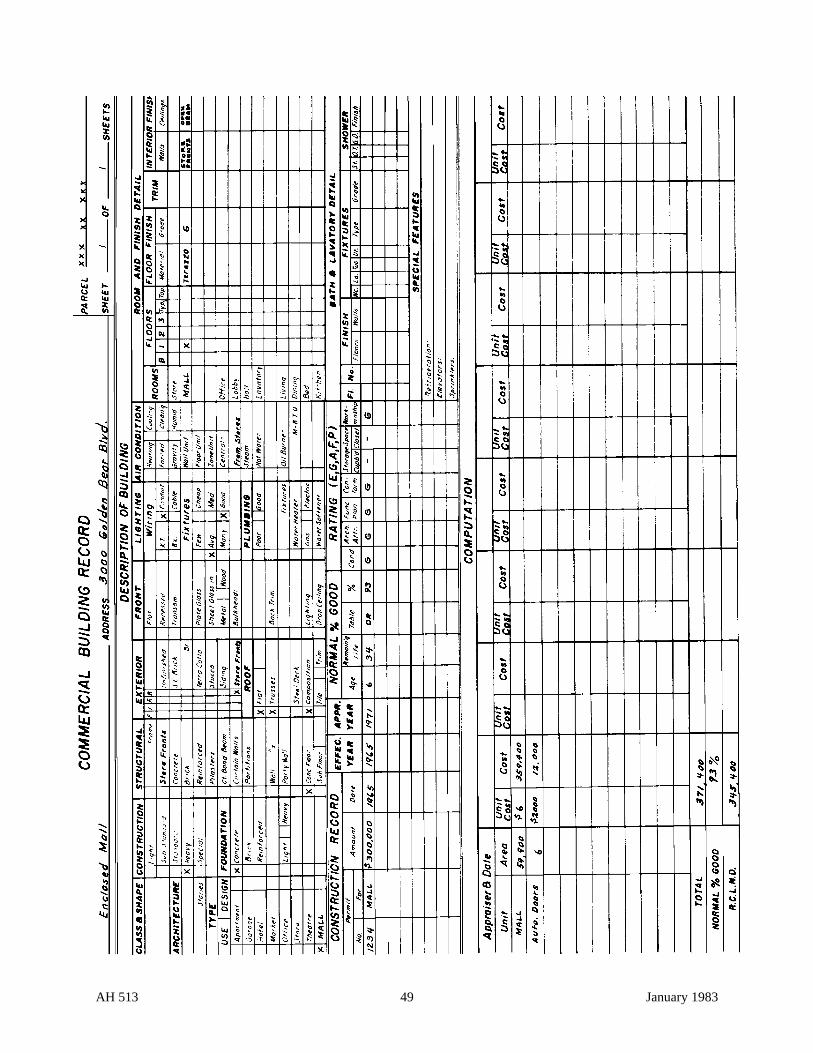
AH 513 49 January 1983
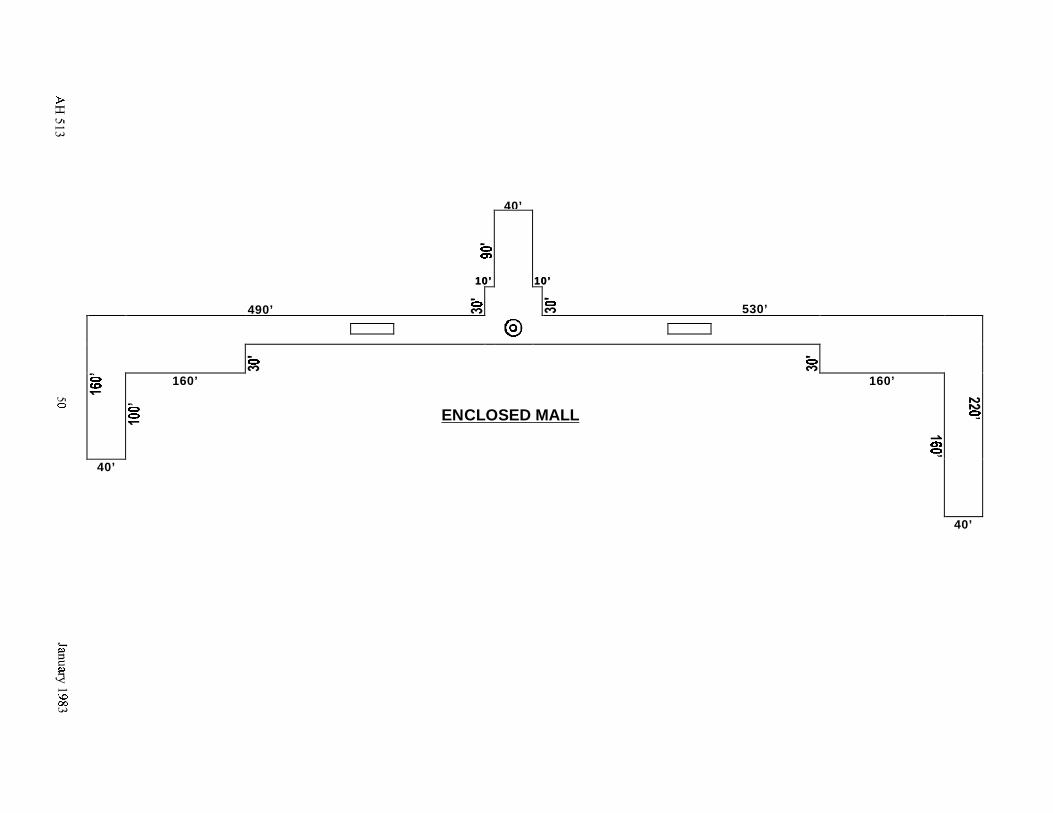
40’
10’10’ 10’10’
490’ 530’
160’
ENCLOSED MALL
160’
40’
40’
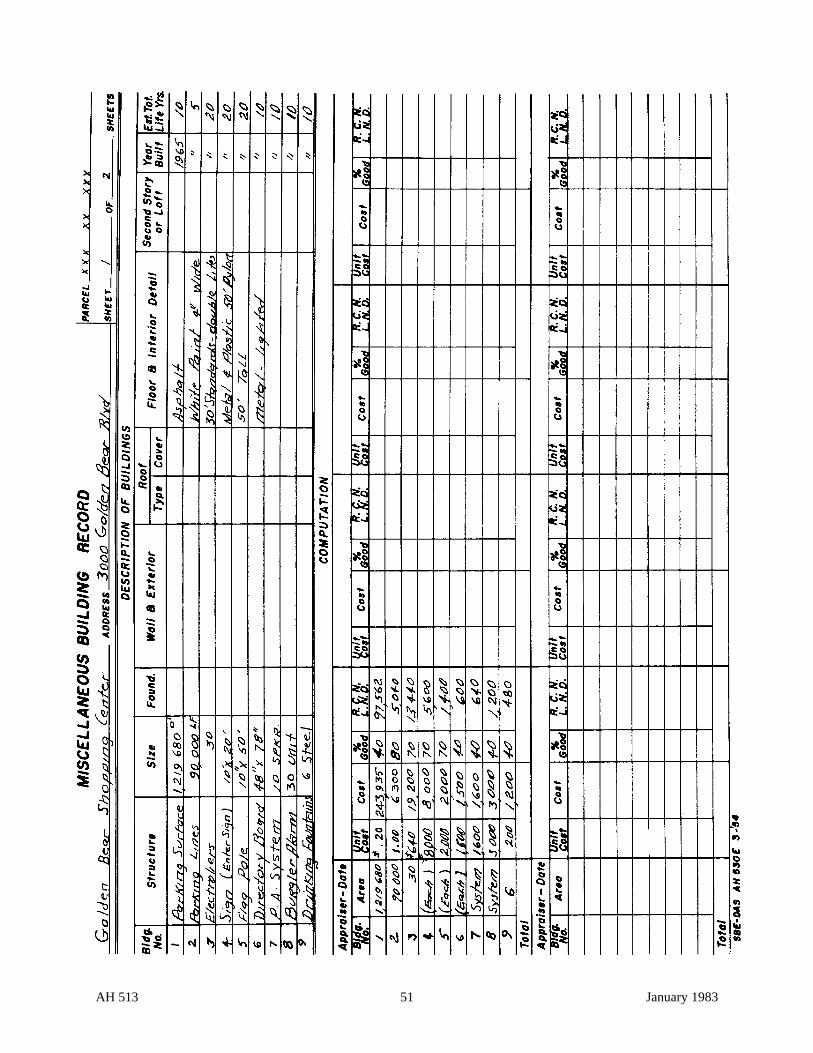
AH 513 51 January 1983
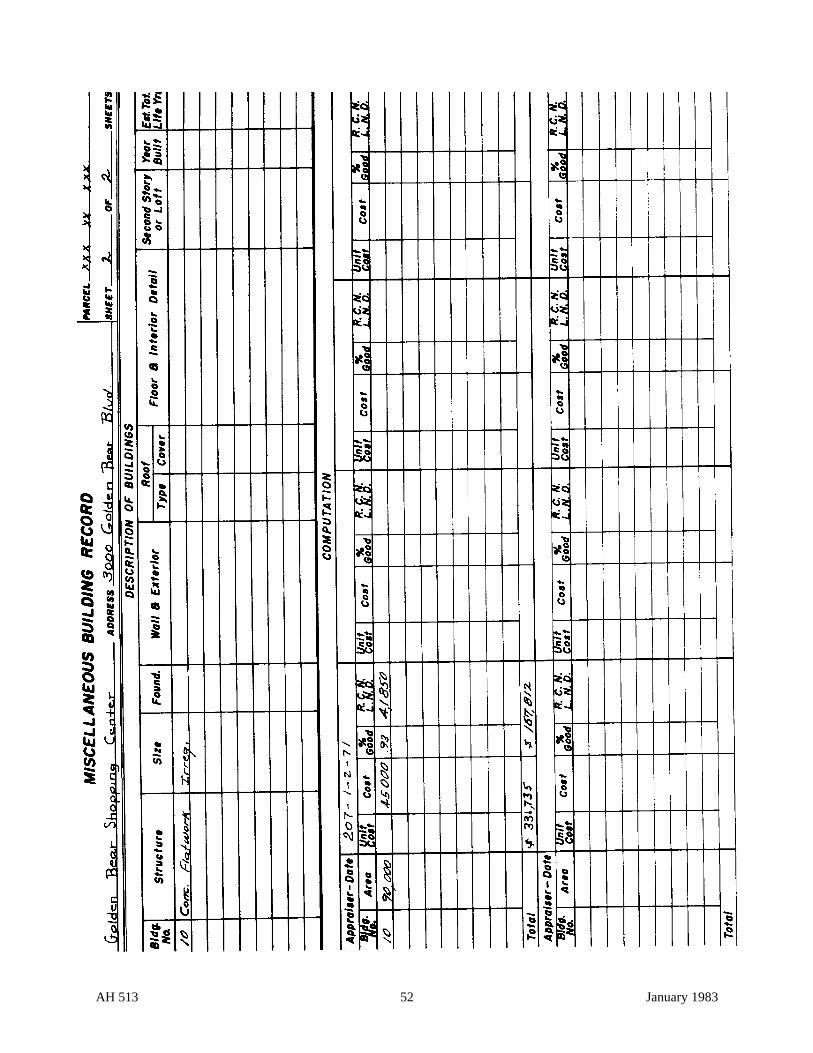
AH 513 52 January 1983
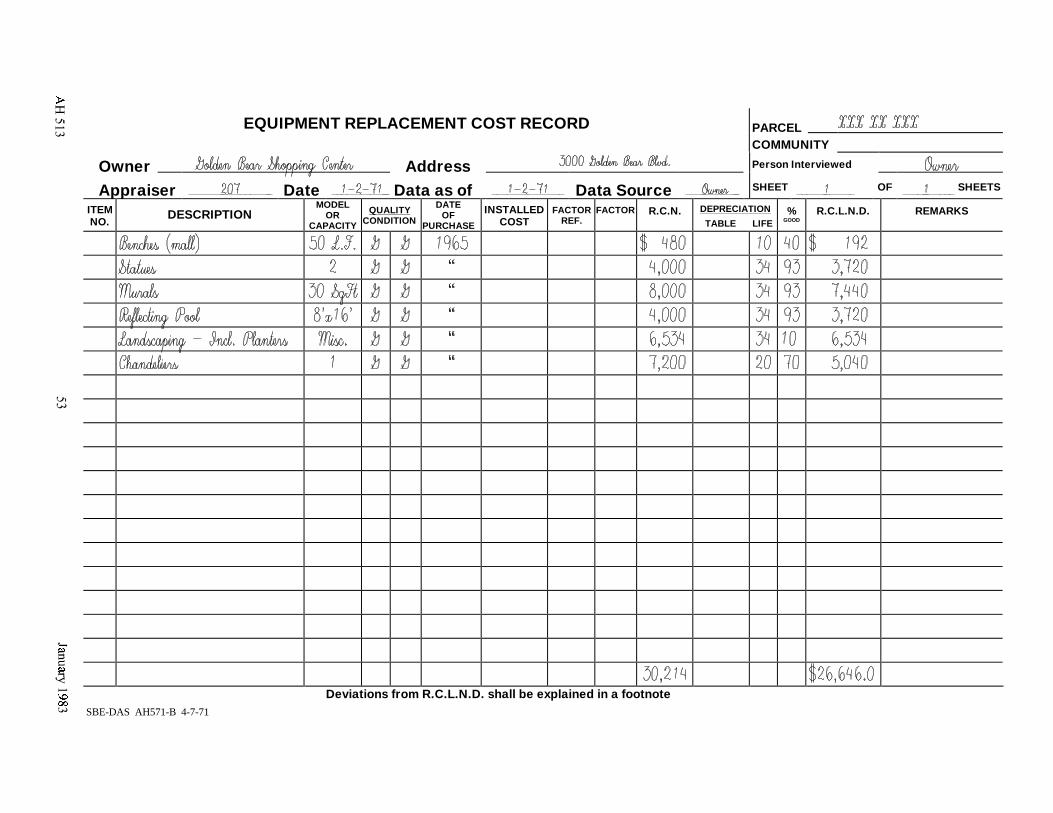
SBE-DAS AH571-B 4-7-71
EQUIPMENT REPLACEMENT COST RECORD PARCELCOMMUNITY
Owner Address Person Interviewed
Appraiser Date Data as of Data Source SHEET OF SHEETS
MODEL DATEITEM DESCRIPTION QUALITY INSTALLED FACTOR FACTOR R.C.N. DEPRECIATION % R.C.L.N.D. REMARKSOR OFNO. CONDITION COST REF.CAPACITY PURCHASE TABLE LIFE GOOD
Deviations from R.C.L.N.D. shall be explained in a footnote
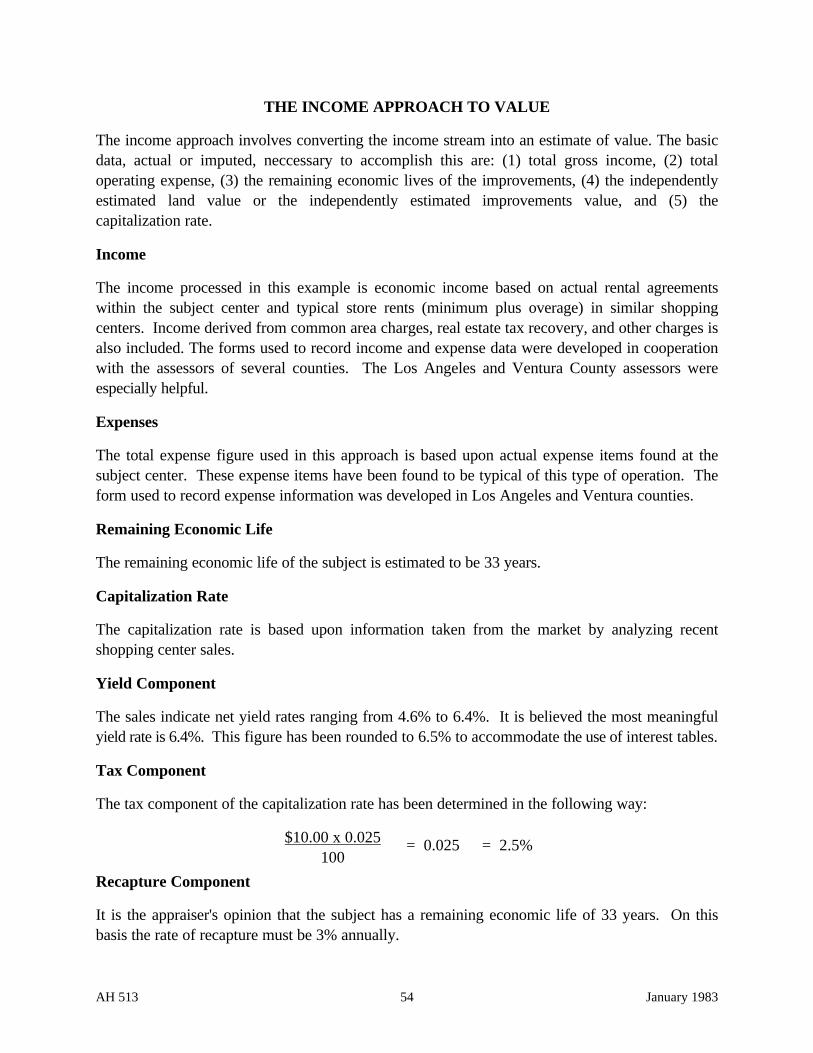
AH 513 54 January 1983
THE INCOME APPROACH TO VALUE
The income approach involves converting the income stream into an estimate of value. The basicdata, actual or imputed, neccessary to accomplish this are: (1) total gross income, (2) totaloperating expense, (3) the remaining economic lives of the improvements, (4) the independentlyestimated land value or the independently estimated improvements value, and (5) thecapitalization rate.
Income
The income processed in this example is economic income based on actual rental agreementswithin the subject center and typical store rents (minimum plus overage) in similar shoppingcenters. Income derived from common area charges, real estate tax recovery, and other charges isalso included. The forms used to record income and expense data were developed in cooperationwith the assessors of several counties. The Los Angeles and Ventura County assessors wereespecially helpful.
Expenses
The total expense figure used in this approach is based upon actual expense items found at thesubject center. These expense items have been found to be typical of this type of operation. Theform used to record expense information was developed in Los Angeles and Ventura counties.
Remaining Economic Life
The remaining economic life of the subject is estimated to be 33 years.
Capitalization Rate
The capitalization rate is based upon information taken from the market by analyzing recentshopping center sales.
Yield Component
The sales indicate net yield rates ranging from 4.6% to 6.4%. It is believed the most meaningfulyield rate is 6.4%. This figure has been rounded to 6.5% to accommodate the use of interest tables.
Tax Component
The tax component of the capitalization rate has been determined in the following way:
$10.00 x 0.025 = 0.025 = 2.5%100
Recapture Component
It is the appraiser's opinion that the subject has a remaining economic life of 33 years. On thisbasis the rate of recapture must be 3% annually.
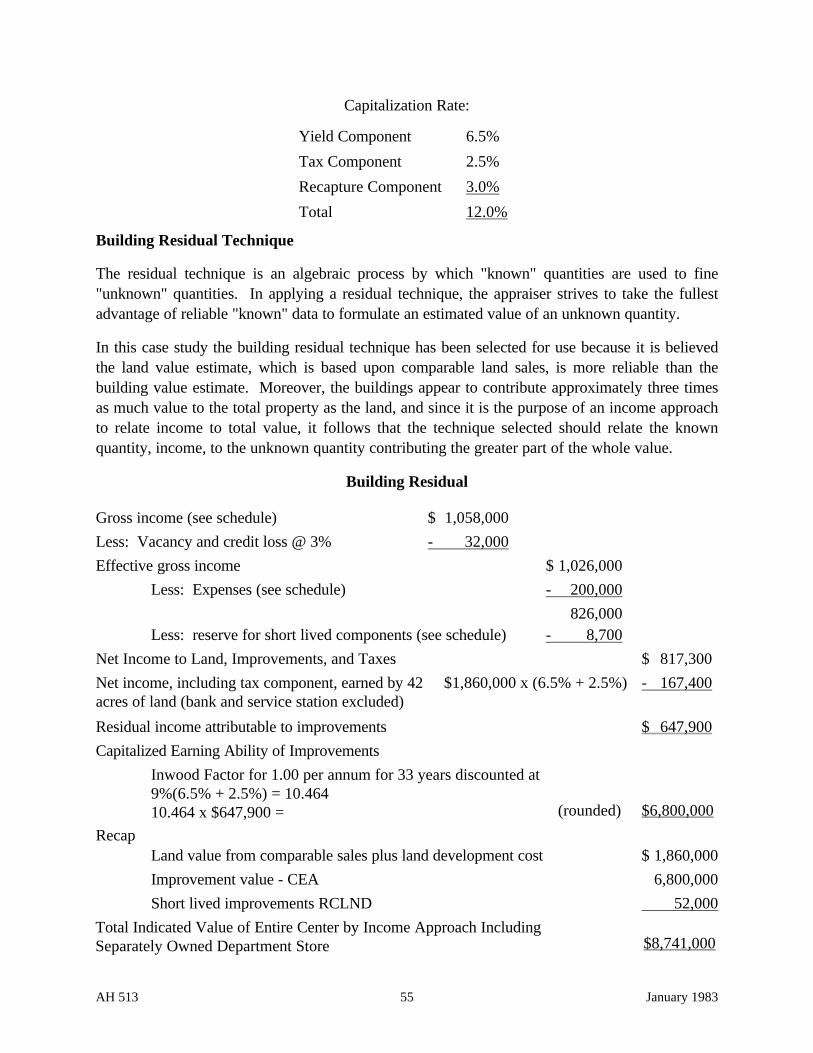
AH 513 55 January 1983
Capitalization Rate:
Yield Component 6.5%
Tax Component 2.5%
Recapture Component 3.0%
Total 12.0%
Building Residual Technique
The residual technique is an algebraic process by which "known" quantities are used to fine"unknown" quantities. In applying a residual technique, the appraiser strives to take the fullestadvantage of reliable "known" data to formulate an estimated value of an unknown quantity.
In this case study the building residual technique has been selected for use because it is believedthe land value estimate, which is based upon comparable land sales, is more reliable than thebuilding value estimate. Moreover, the buildings appear to contribute approximately three timesas much value to the total property as the land, and since it is the purpose of an income approachto relate income to total value, it follows that the technique selected should relate the knownquantity, income, to the unknown quantity contributing the greater part of the whole value.
Building Residual
Gross income (see schedule) $ 1,058,000
Less: Vacancy and credit loss @ 3% - 32,000
Effective gross income $ 1,026,000
Less: Expenses (see schedule) - 200,000
826,000Less: reserve for short lived components (see schedule) - 8,700
Net Income to Land, Improvements, and Taxes $ 817,300
Net income, including tax component, earned by 42 $1,860,000 x (6.5% + 2.5%) - 167,400acres of land (bank and service station excluded)
Residual income attributable to improvements $ 647,900
Capitalized Earning Ability of Improvements
Inwood Factor for 1.00 per annum for 33 years discounted at9%(6.5% + 2.5%) = 10.46410.464 x $647,900 = (rounded) $6,800,000
RecapLand value from comparable sales plus land development cost $ 1,860,000
Improvement value - CEA 6,800,000
Short lived improvements RCLND 52,000
Total Indicated Value of Entire Center by Income Approach IncludingSeparately Owned Department Store $8,741,000
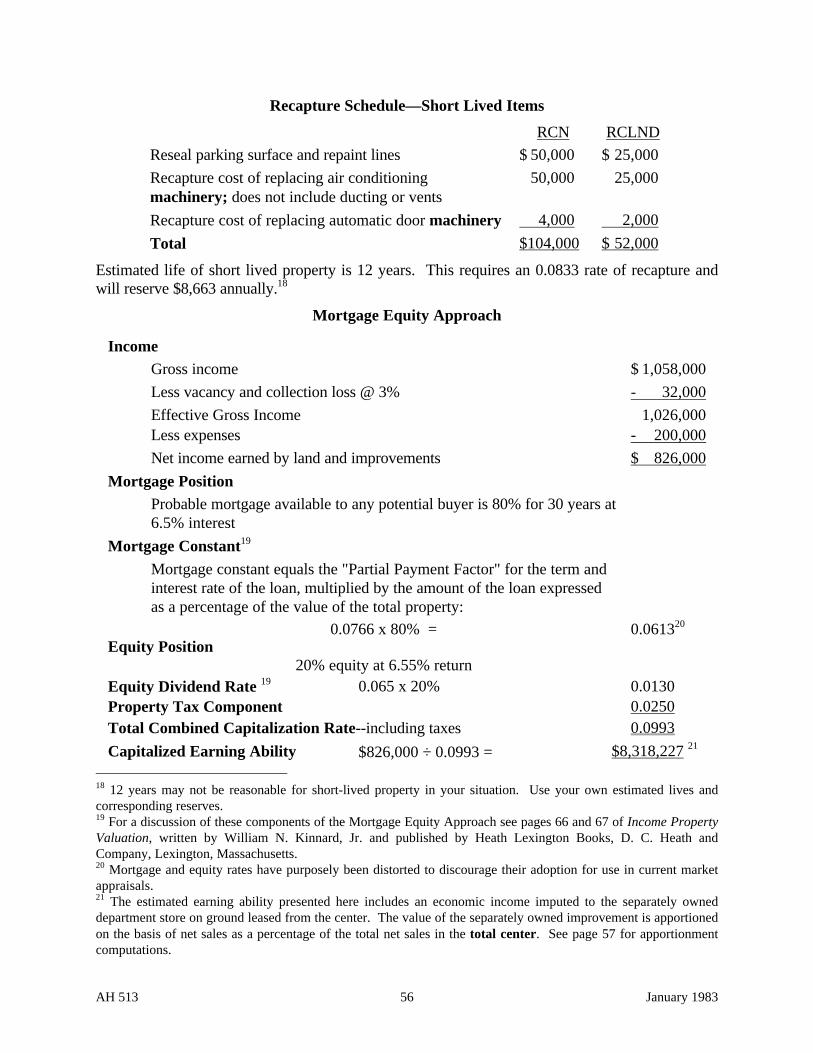
AH 513 56 January 1983
Recapture Schedule—Short Lived Items
RCN RCLND
Reseal parking surface and repaint lines $ 50,000 $ 25,000
Recapture cost of replacing air conditioning 50,000 25,000machinery; does not include ducting or vents
Recapture cost of replacing automatic door machinery 4,000 2,000
Total $104,000 $ 52,000
Estimated life of short lived property is 12 years. This requires an 0.0833 rate of recapture andwill reserve $8,663 annually.18
Mortgage Equity Approach
IncomeGross income $ 1,058,000
Less vacancy and collection loss @ 3% - 32,000
Effective Gross Income 1,026,000Less expenses - 200,000
Net income earned by land and improvements $ 826,000
Mortgage PositionProbable mortgage available to any potential buyer is 80% for 30 years at6.5% interest
Mortgage Constant19
Mortgage constant equals the "Partial Payment Factor" for the term andinterest rate of the loan, multiplied by the amount of the loan expressedas a percentage of the value of the total property:
0.0766 x 80% = 0.061320
Equity Position20% equity at 6.55% return
Equity Dividend Rate 19 0.065 x 20% 0.0130Property Tax Component 0.0250Total Combined Capitalization Rate--including taxes 0.0993
Capitalized Earning Ability $826,000 ÷ 0.0993 = $8,318,227 21
18 12 years may not be reasonable for short-lived property in your situation. Use your own estimated lives andcorresponding reserves.19 For a discussion of these components of the Mortgage Equity Approach see pages 66 and 67 of Income PropertyValuation, written by William N. Kinnard, Jr. and published by Heath Lexington Books, D. C. Heath andCompany, Lexington, Massachusetts.20 Mortgage and equity rates have purposely been distorted to discourage their adoption for use in current marketappraisals.21 The estimated earning ability presented here includes an economic income imputed to the separately owneddepartment store on ground leased from the center. The value of the separately owned improvement is apportionedon the basis of net sales as a percentage of the total net sales in the total center. See page 57 for apportionmentcomputations.
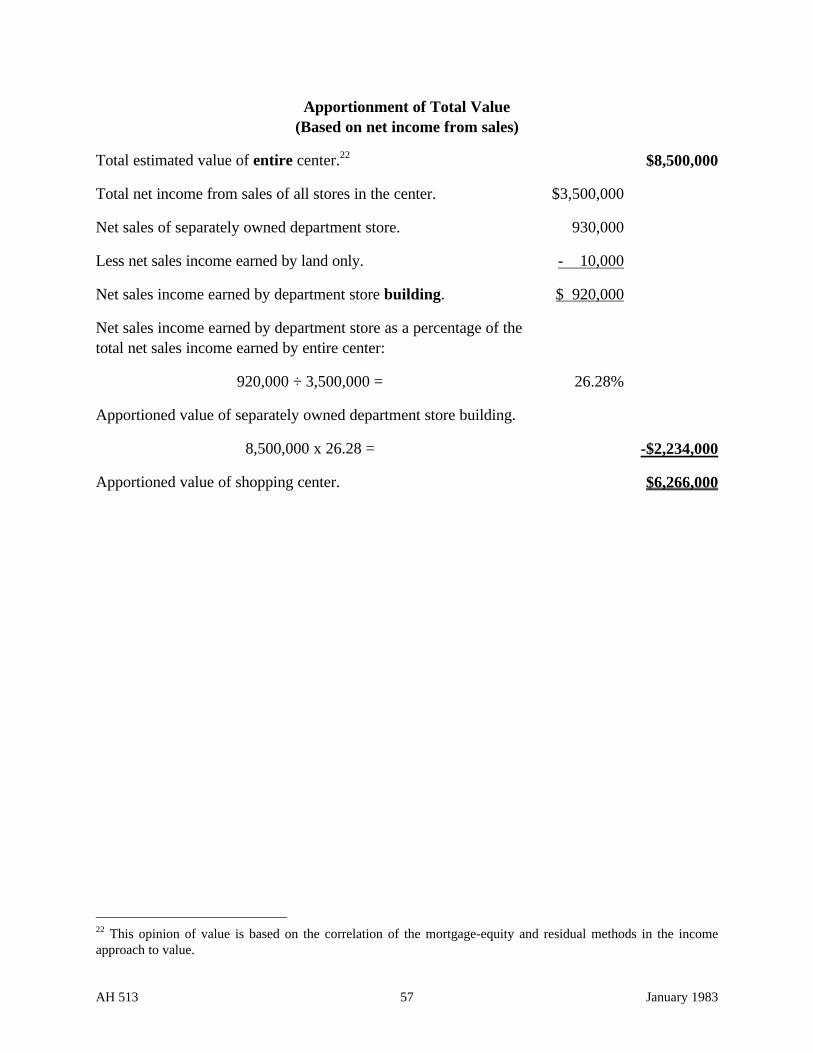
AH 513 57 January 1983
Apportionment of Total Value(Based on net income from sales)
Total estimated value of entire center.22 $8,500,000
Total net income from sales of all stores in the center. $3,500,000
Net sales of separately owned department store. 930,000
Less net sales income earned by land only. - 10,000
Net sales income earned by department store building. $ 920,000
Net sales income earned by department store as a percentage of thetotal net sales income earned by entire center:
920,000 ÷ 3,500,000 = 26.28%
Apportioned value of separately owned department store building.
8,500,000 x 26.28 = -$2,234,000
Apportioned value of shopping center. $6,266,000
22 This opinion of value is based on the correlation of the mortgage-equity and residual methods in the incomeapproach to value.
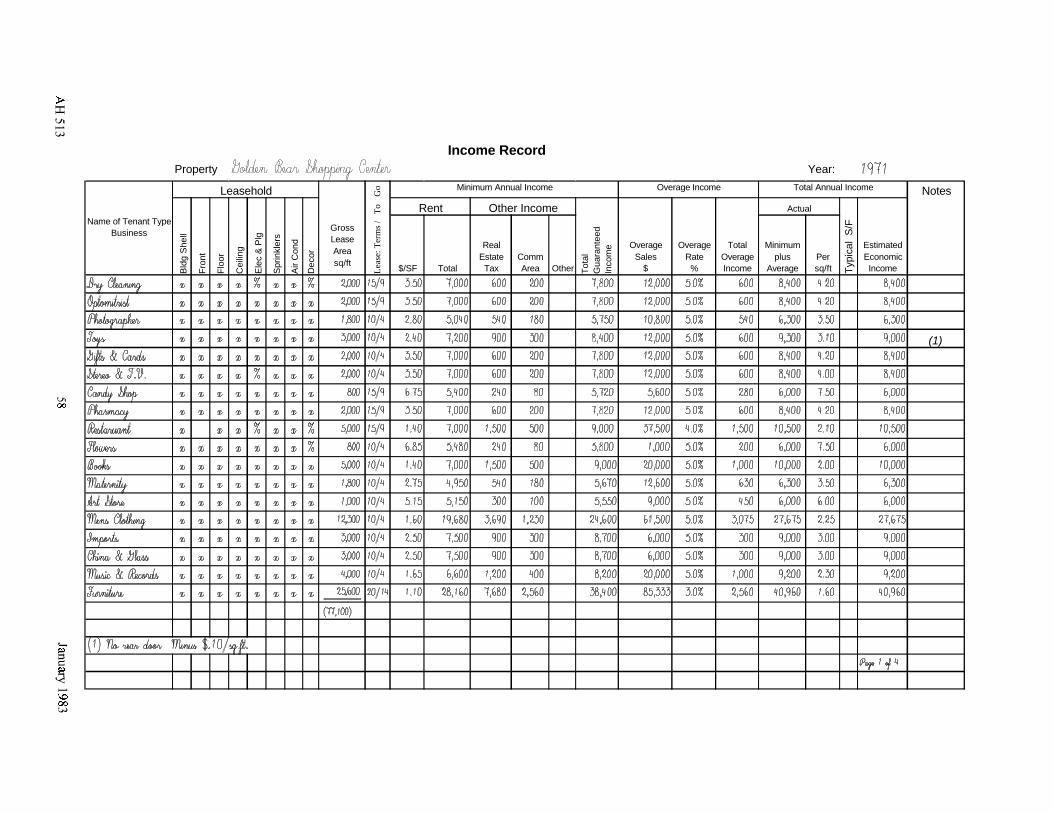
Income RecordProperty Year:
Leasehold Go Minimum Annual Income Overage Income Total Annual Income
To Rent Other Income Actual
Name of Tenant Type Business
Bld
g S
hell
Fro
nt
Flo
or
Cei
ling
Ele
c &
Plg
Spr
inkl
ers
Air
Con
d
Dec
or
Gross Lease Areasq/ft
Lea
se: T
erm
s /
$/SF Total
Real Estate
TaxComm Area Other T
otal
G
uara
ntee
d In
com
e Overage Sales
$
Overage Rate
%
Total Overage Income
Minimum plus
AveragePer sq/ft T
ypic
al S
/F
Estimated Economic Income
Notes
(1)
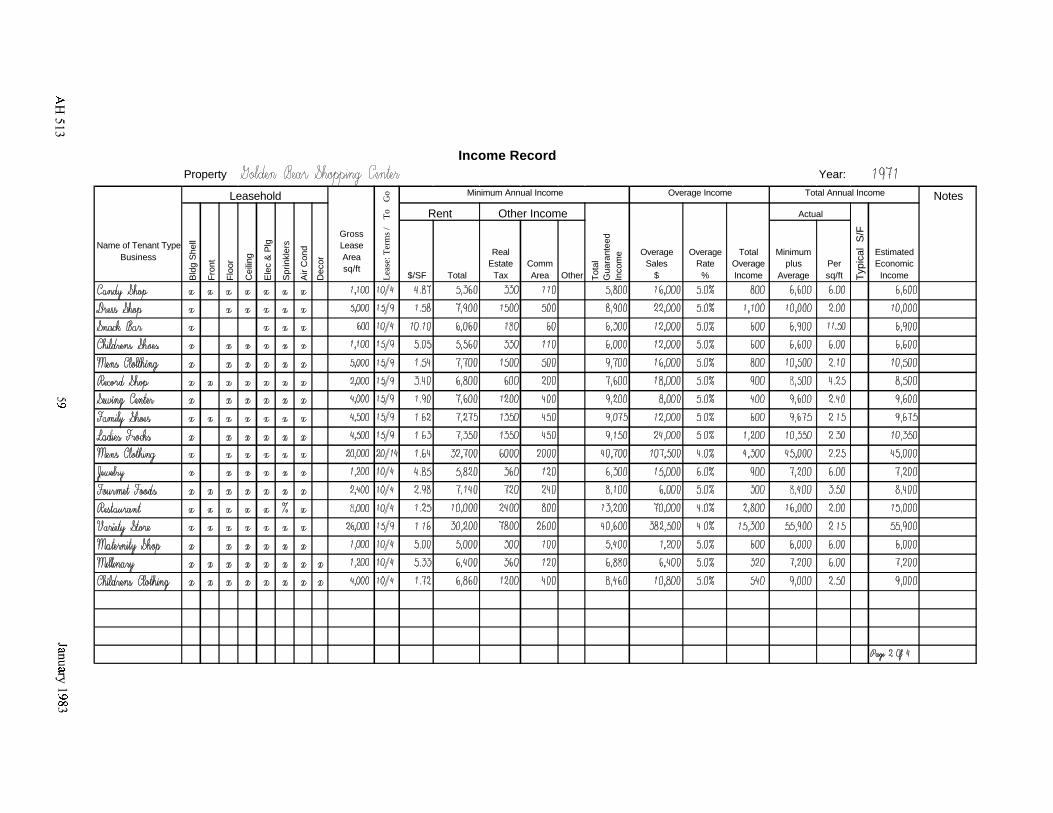
Income RecordProperty Year:
Leasehold Go Minimum Annual Income Overage Income Total Annual Income Notes
To Rent Other Income Actual
me of Tenant Type Business
Bld
g S
hell
Fro
nt
Flo
or
Cei
ling
Ele
c &
Plg
Spr
inkl
ers
Air
Con
d
Dec
or
Gross Lease Areasq/ft
Lea
se: T
erm
s /
$/SF Total
Real Estate
TaxComm Area Other T
otal
G
uara
ntee
d In
com
e Overage Sales
$
Overage Rate
%
Total Overage Income
Minimum plus
AveragePer sq/ft T
ypic
al S
/F
Estimated Economic
Income
Na
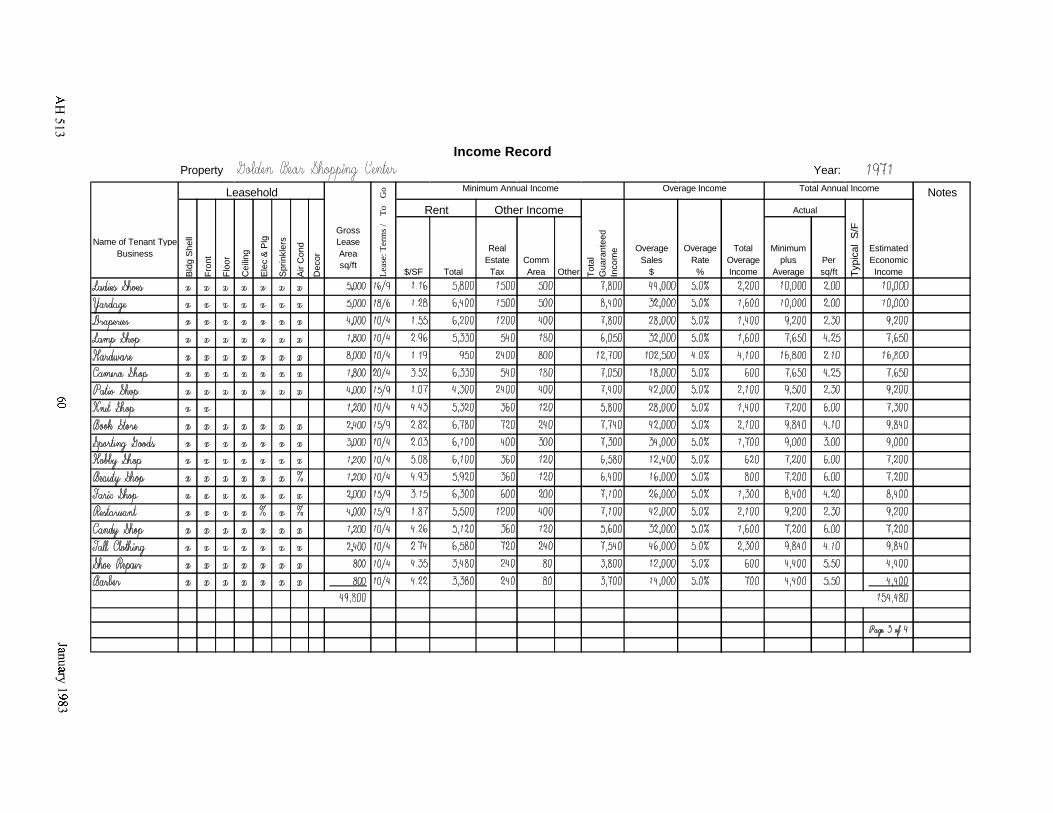
Income RecordProperty Year:
Leasehold Go Minimum Annual Income Overage Income Total Annual Income Notes
To Rent Other Income Actual
Name of Tenant Type Business
Bld
g S
hell
Fro
nt
Flo
or
Cei
ling
Ele
c &
Plg
Spr
inkl
ers
Air
Con
d
Dec
or
Gross Lease Areasq/ft
Lea
se: T
erm
s /
$/SF Total
Real Estate
TaxComm Area Other T
otal
G
uara
ntee
d In
com
e Overage Sales
$
Overage Rate
%
Total Overage Income
Minimum plus
AveragePer sq/ft T
ypic
al S
/F
Estimated Economic Income
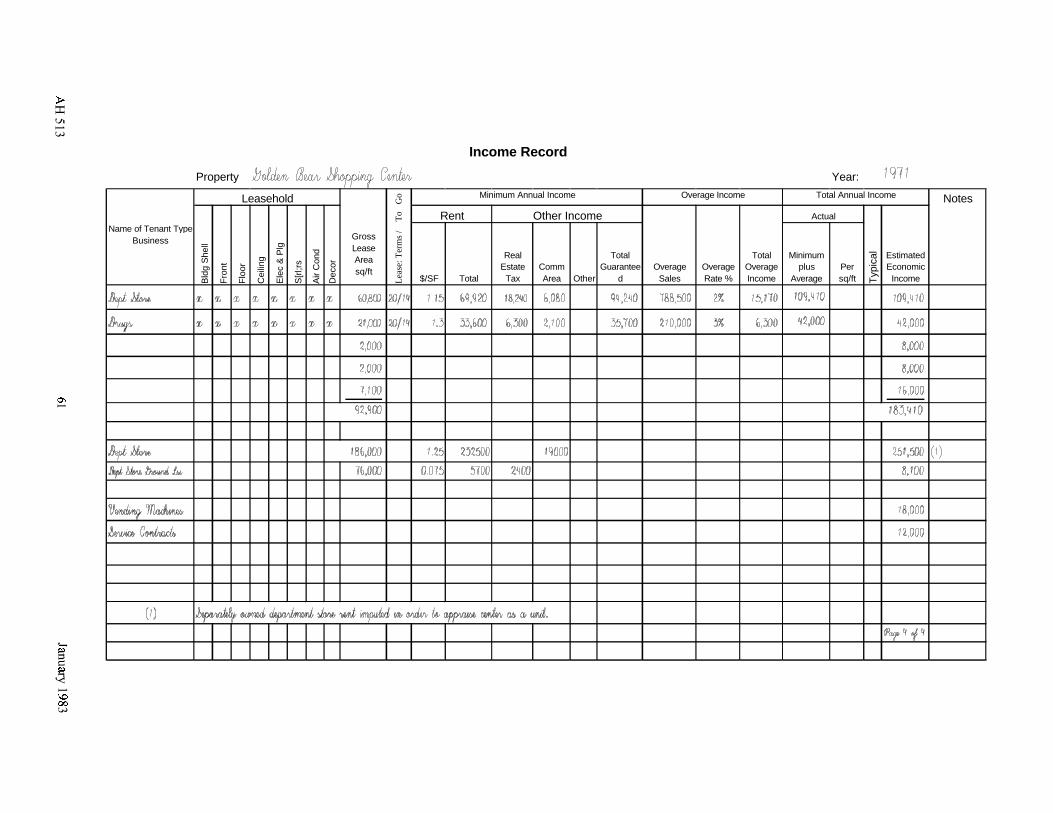
Income Record
Property Year:
Minimum Annual Income Overage Income Total Annual IncomeLeasehold NotesB
ldg
Fro
Flo
o
Cei
li sq/ftE
lec
$/SF Total Tax Area Other d Sales Rate % Income Average sq/ft IncomeS[r
l;
Air
Dec
Lea
s
Typ
She
llRent Other Income Actual
ntName of Tenant Type
Gross Businessr
Lease Real Total Total Minimum Estimated
ng AreaEstate Comm Guarantee Overage Overage Overage plus Per Economic &
Plg
rs Con
d
or e: T
erm
s /
To
Go
ical
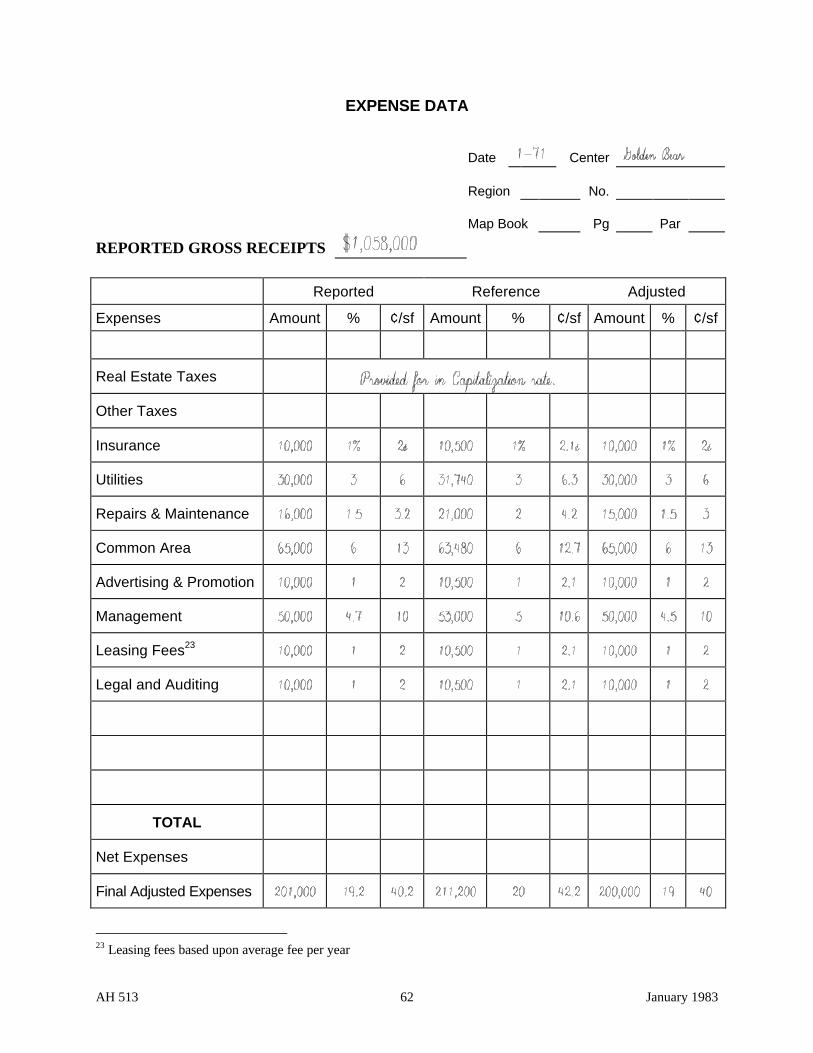
AH 513 62 January 1983
EXPENSE DATA
Date Center
Region No.
Map Book Pg Par
REPORTED GROSS RECEIPTS
Reported Reference Adjusted
Expenses Amount % ¢/sf Amount % ¢/sf Amount % ¢/sf
Real Estate Taxes
Other Taxes
Insurance
Utilities
Repairs & Maintenance
Common Area
Advertising & Promotion
Management
Leasing Fees23
Legal and Auditing
TOTAL
Net Expenses
Final Adjusted Expenses
23 Leasing fees based upon average fee per year
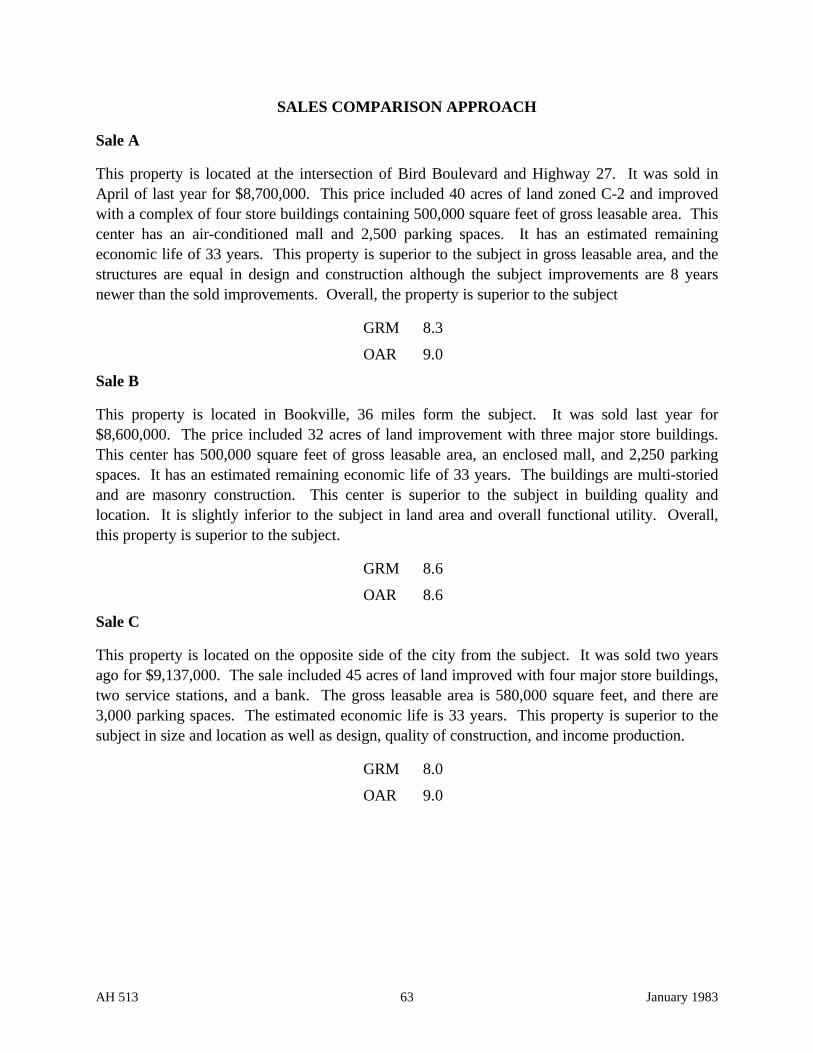
AH 513 63 January 1983
SALES COMPARISON APPROACH
Sale A
This property is located at the intersection of Bird Boulevard and Highway 27. It was sold inApril of last year for $8,700,000. This price included 40 acres of land zoned C-2 and improvedwith a complex of four store buildings containing 500,000 square feet of gross leasable area. Thiscenter has an air-conditioned mall and 2,500 parking spaces. It has an estimated remainingeconomic life of 33 years. This property is superior to the subject in gross leasable area, and thestructures are equal in design and construction although the subject improvements are 8 yearsnewer than the sold improvements. Overall, the property is superior to the subject
GRM 8.3
OAR 9.0
Sale B
This property is located in Bookville, 36 miles form the subject. It was sold last year for$8,600,000. The price included 32 acres of land improvement with three major store buildings.This center has 500,000 square feet of gross leasable area, an enclosed mall, and 2,250 parkingspaces. It has an estimated remaining economic life of 33 years. The buildings are multi-storiedand are masonry construction. This center is superior to the subject in building quality andlocation. It is slightly inferior to the subject in land area and overall functional utility. Overall,this property is superior to the subject.
GRM 8.6
OAR 8.6
Sale C
This property is located on the opposite side of the city from the subject. It was sold two yearsago for $9,137,000. The sale included 45 acres of land improved with four major store buildings,two service stations, and a bank. The gross leasable area is 580,000 square feet, and there are3,000 parking spaces. The estimated economic life is 33 years. This property is superior to thesubject in size and location as well as design, quality of construction, and income production.
GRM 8.0
OAR 9.0
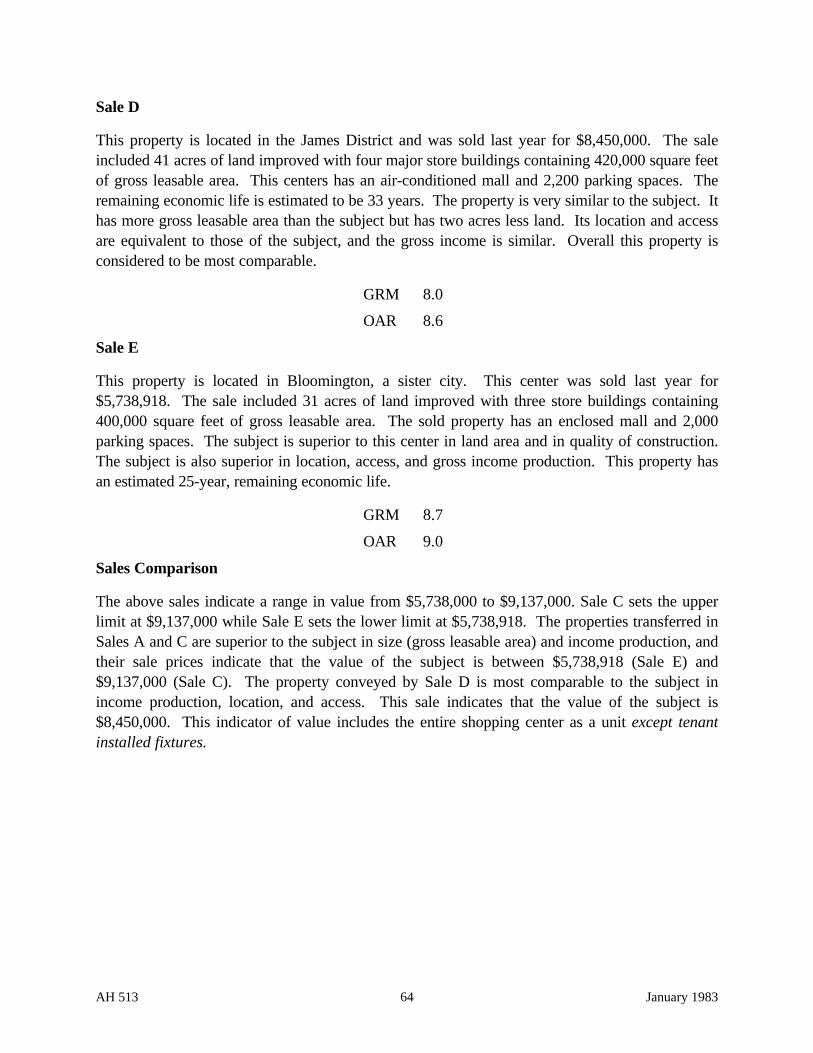
AH 513 64 January 1983
Sale D
This property is located in the James District and was sold last year for $8,450,000. The saleincluded 41 acres of land improved with four major store buildings containing 420,000 square feetof gross leasable area. This centers has an air-conditioned mall and 2,200 parking spaces. Theremaining economic life is estimated to be 33 years. The property is very similar to the subject. Ithas more gross leasable area than the subject but has two acres less land. Its location and accessare equivalent to those of the subject, and the gross income is similar. Overall this property isconsidered to be most comparable.
GRM 8.0
OAR 8.6
Sale E
This property is located in Bloomington, a sister city. This center was sold last year for$5,738,918. The sale included 31 acres of land improved with three store buildings containing400,000 square feet of gross leasable area. The sold property has an enclosed mall and 2,000parking spaces. The subject is superior to this center in land area and in quality of construction.The subject is also superior in location, access, and gross income production. This property hasan estimated 25-year, remaining economic life.
GRM 8.7
OAR 9.0
Sales Comparison
The above sales indicate a range in value from $5,738,000 to $9,137,000. Sale C sets the upperlimit at $9,137,000 while Sale E sets the lower limit at $5,738,918. The properties transferred inSales A and C are superior to the subject in size (gross leasable area) and income production, andtheir sale prices indicate that the value of the subject is between $5,738,918 (Sale E) and$9,137,000 (Sale C). The property conveyed by Sale D is most comparable to the subject inincome production, location, and access. This sale indicates that the value of the subject is$8,450,000. This indicator of value includes the entire shopping center as a unit except tenantinstalled fixtures.
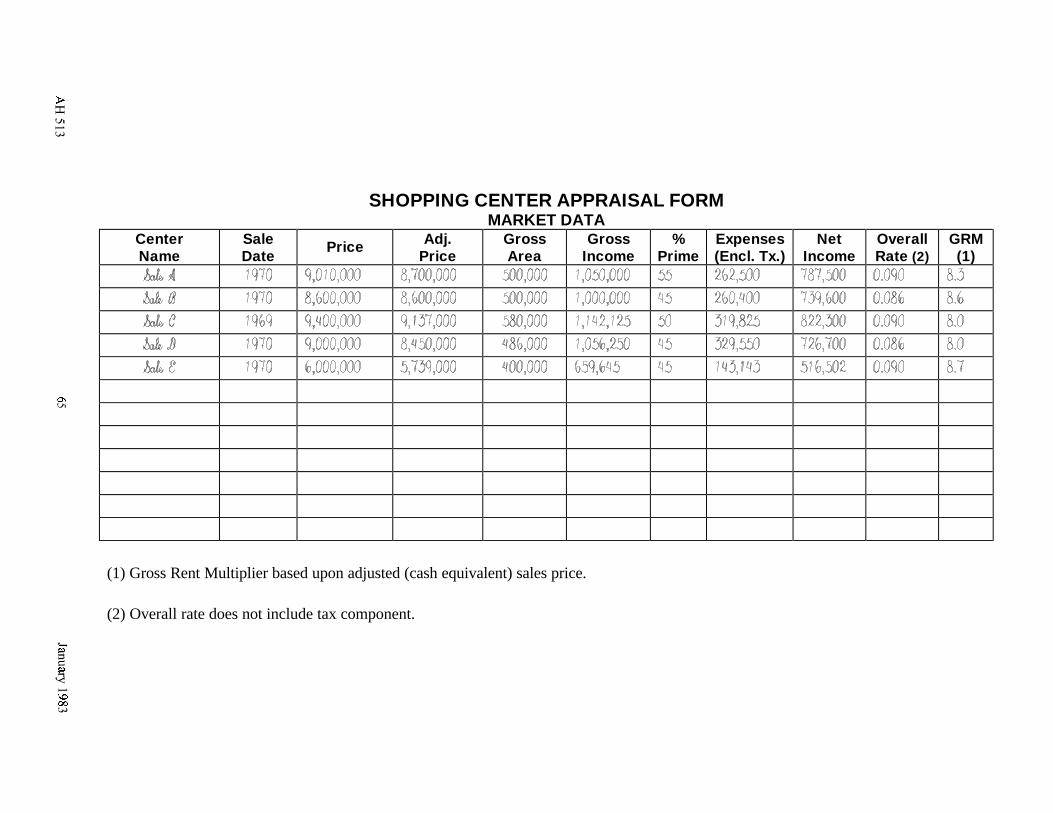
SHOPPING CENTER APPRAISAL FORMMARKET DATA
Center Sale Adj. Gross Gross % Expenses Net Overall GRMPriceName Date Price Area Income Prime (Encl. Tx.) Income Rate (2) (1)
(1) Gross Rent Multiplier based upon adjusted (cash equivalent) sales price.
(2) Overall rate does not include tax component.
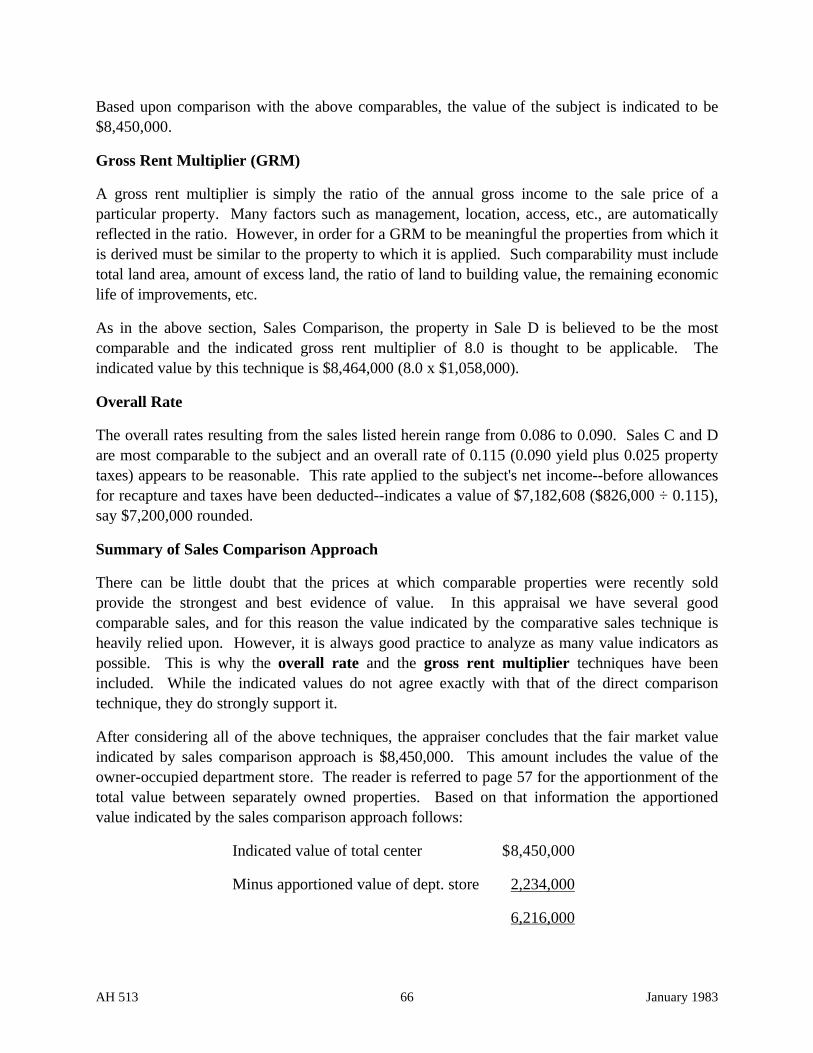
AH 513 66 January 1983
Based upon comparison with the above comparables, the value of the subject is indicated to be$8,450,000.
Gross Rent Multiplier (GRM)
A gross rent multiplier is simply the ratio of the annual gross income to the sale price of aparticular property. Many factors such as management, location, access, etc., are automaticallyreflected in the ratio. However, in order for a GRM to be meaningful the properties from which itis derived must be similar to the property to which it is applied. Such comparability must includetotal land area, amount of excess land, the ratio of land to building value, the remaining economiclife of improvements, etc.
As in the above section, Sales Comparison, the property in Sale D is believed to be the mostcomparable and the indicated gross rent multiplier of 8.0 is thought to be applicable. Theindicated value by this technique is $8,464,000 (8.0 x $1,058,000).
Overall Rate
The overall rates resulting from the sales listed herein range from 0.086 to 0.090. Sales C and Dare most comparable to the subject and an overall rate of 0.115 (0.090 yield plus 0.025 propertytaxes) appears to be reasonable. This rate applied to the subject's net income--before allowancesfor recapture and taxes have been deducted--indicates a value of $7,182,608 ($826,000 ÷ 0.115),say $7,200,000 rounded.
Summary of Sales Comparison Approach
There can be little doubt that the prices at which comparable properties were recently soldprovide the strongest and best evidence of value. In this appraisal we have several goodcomparable sales, and for this reason the value indicated by the comparative sales technique isheavily relied upon. However, it is always good practice to analyze as many value indicators aspossible. This is why the overall rate and the gross rent multiplier techniques have beenincluded. While the indicated values do not agree exactly with that of the direct comparisontechnique, they do strongly support it.
After considering all of the above techniques, the appraiser concludes that the fair market valueindicated by sales comparison approach is $8,450,000. This amount includes the value of theowner-occupied department store. The reader is referred to page 57 for the apportionment of thetotal value between separately owned properties. Based on that information the apportionedvalue indicated by the sales comparison approach follows:
Indicated value of total center $8,450,000
Minus apportioned value of dept. store 2,234,000
6,216,000
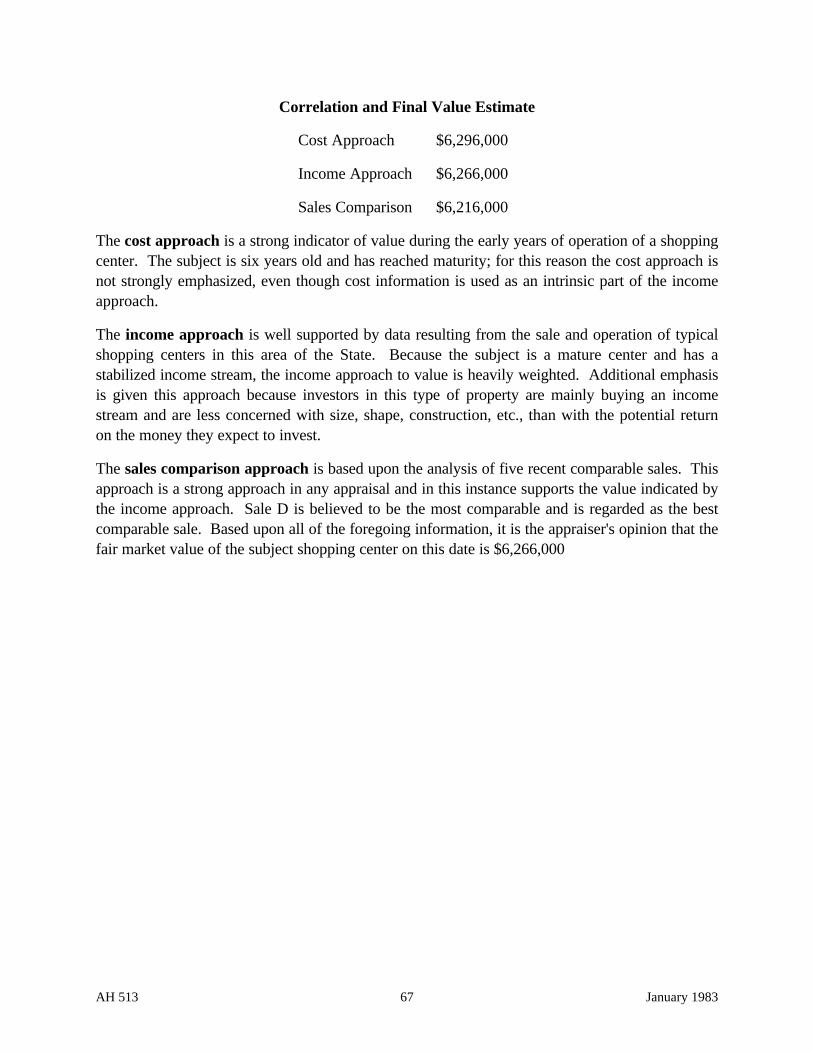
AH 513 67 January 1983
Correlation and Final Value Estimate
Cost Approach $6,296,000
Income Approach $6,266,000
Sales Comparison $6,216,000
The cost approach is a strong indicator of value during the early years of operation of a shoppingcenter. The subject is six years old and has reached maturity; for this reason the cost approach isnot strongly emphasized, even though cost information is used as an intrinsic part of the incomeapproach.
The income approach is well supported by data resulting from the sale and operation of typicalshopping centers in this area of the State. Because the subject is a mature center and has astabilized income stream, the income approach to value is heavily weighted. Additional emphasisis given this approach because investors in this type of property are mainly buying an incomestream and are less concerned with size, shape, construction, etc., than with the potential returnon the money they expect to invest.
The sales comparison approach is based upon the analysis of five recent comparable sales. Thisapproach is a strong approach in any appraisal and in this instance supports the value indicated bythe income approach. Sale D is believed to be the most comparable and is regarded as the bestcomparable sale. Based upon all of the foregoing information, it is the appraiser's opinion that thefair market value of the subject shopping center on this date is $6,266,000
AH 513 68 January 1983
CHAPTER 11: CASE STUDY
NEIGHBORHOOD SHOPPING CENTERS
This case study is fictitious.
The dollar amounts, rates, and factors
shown are utilized to demonstrate
appraisal procedures only and should
not be considered typical.
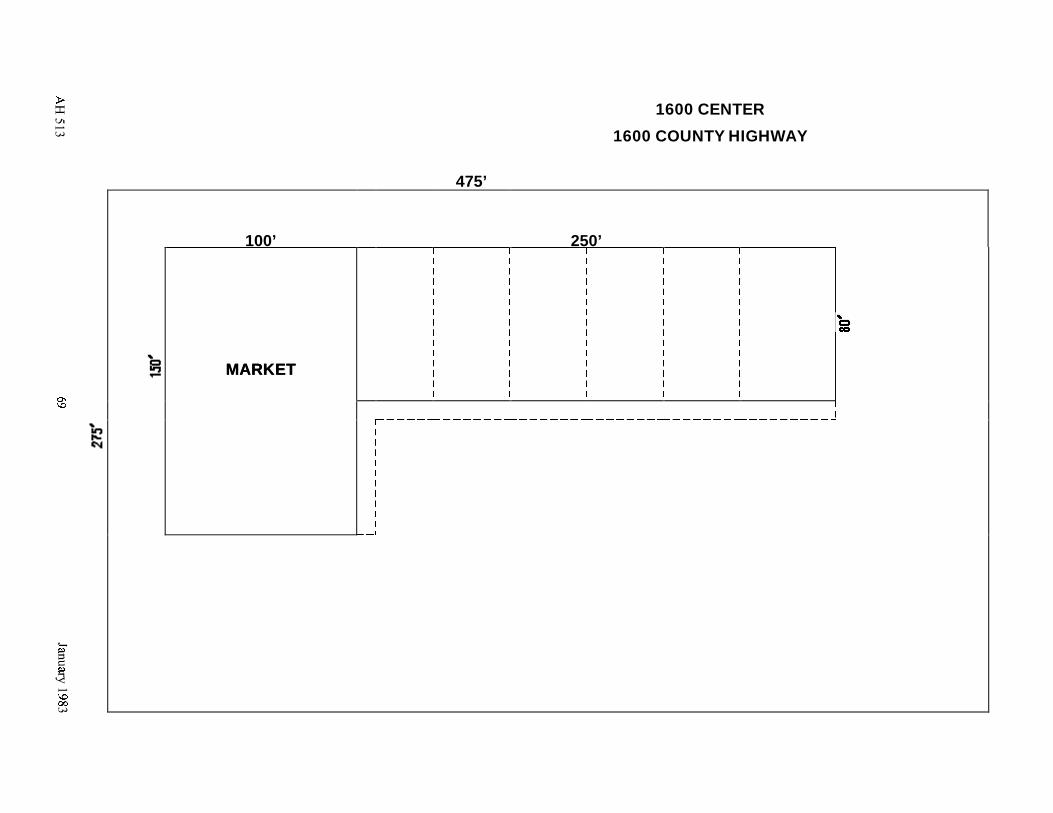
1600 CENTER
1600 COUNTY HIGHWAY
475’
100’ 250’
MARKETMARKET
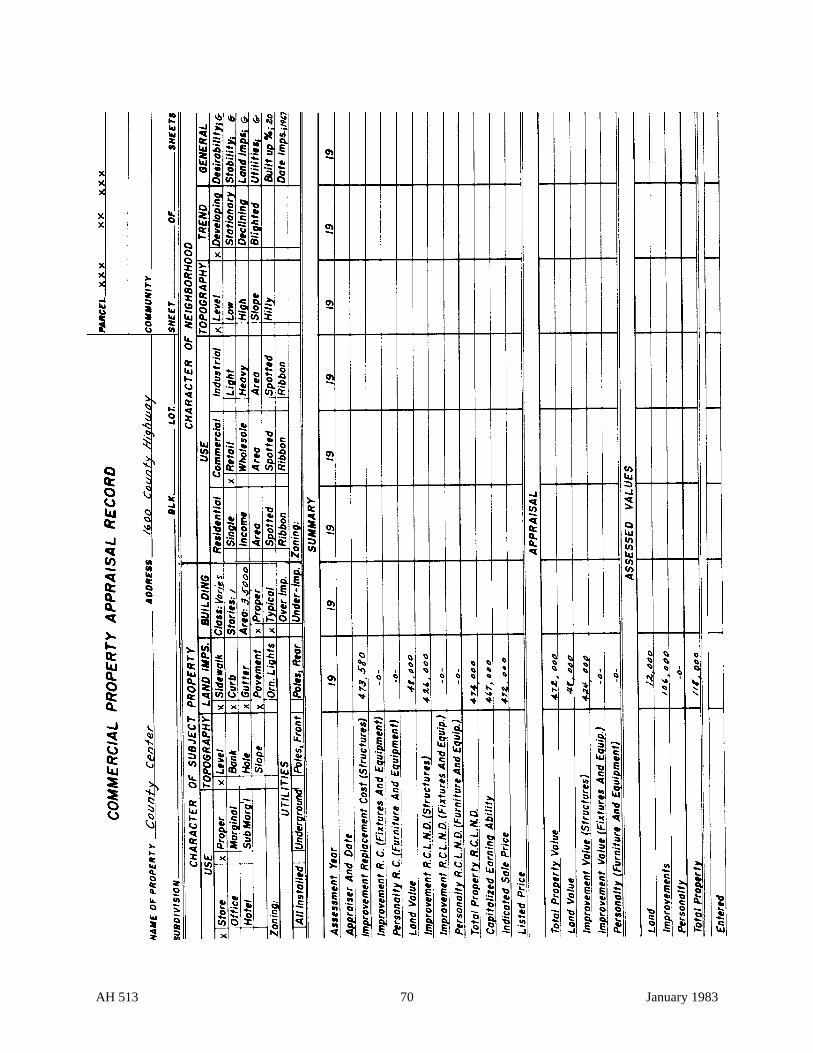
AH 513 70 January 1983
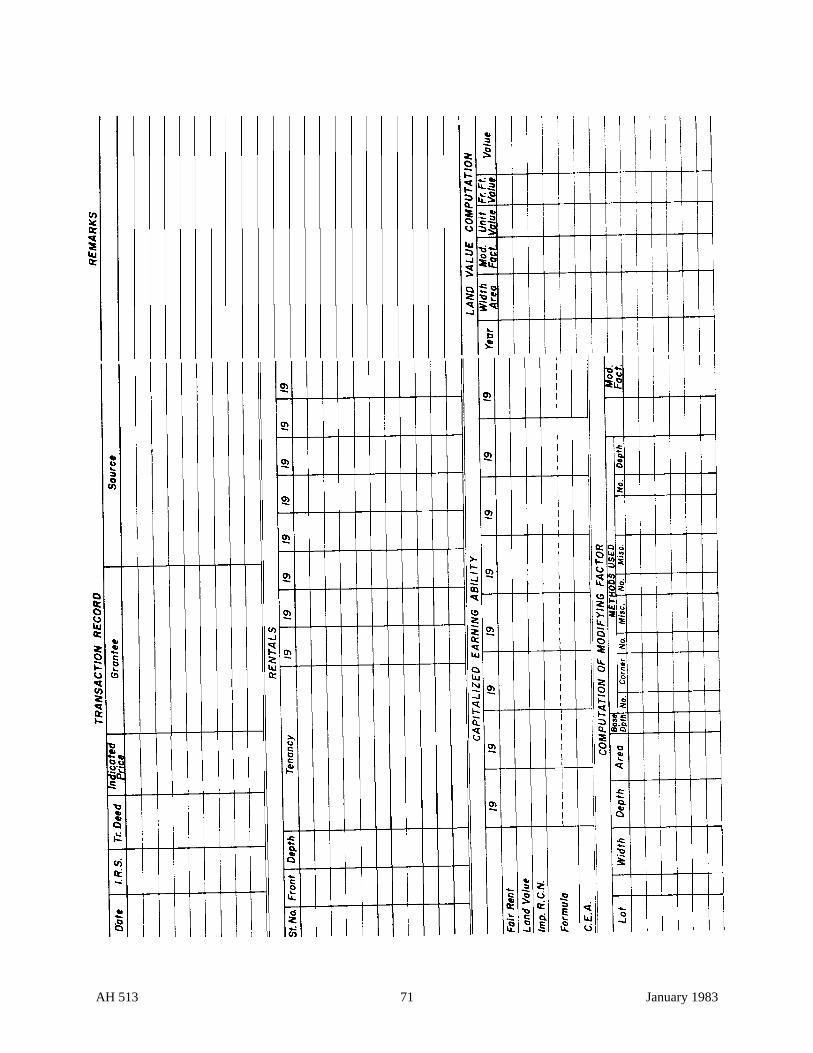
AH 513 71 January 1983
AH 513 72 January 1983
CASE STUDY
INTRODUCTION
The subject is a neighborhood shopping located in a small valley town in California. It consists ofa supermarket and a suburban store building partitioned into six separate retail stores. The centeris developed on three acres of land held in a single ownership. A 15,680 square-foot portion ofthe three-acre site is excess land and does not contribute to the income stream. The center is fiveyears old and the income stream has stabilized at about $70,000 annually. It is in directcompetition with retail stores located near the center of town. The owner and merchants of thesestores attempted to prevent development of the subject center but were unsuccessful in doing soand their sales volume has dropped considerably -- especially during the past two years.
SUBJECT PROPERTY INFORMATION
Description
Taxable real property includes:
1. 3 acres of land
2. 2 store buildings
3. Miscellaneous improvements
• Parking surface, parking lot lights, landscaping
• Sign
Identification
The subject is identified in the official county records as Assessor's Parcel xxx-xx-xxx
Owner of Record
John Q. Owner11647 Countryside Lane
Address
The subject is located at 1600 County Highway.
Utilities & Services
Natural Gas Water
Electricity Sewer
Telephone
There is no municipal transportation nor is scavenger or parking lot cleaning service available
AH 513 73 January 1983
Highest And Best Use
The highest and best use of the subject is the present use.
NEIGHBORHOOD
Commercial Development
The subject is located on the edge of town. The only development beyond the center is a feed andgrain store. Toward town are several service stations, an auto dealership, a farm and orchardsupply store, and a bulk fuel plant.
Residential Development
Most of the trade area is comprised of outlying farms. Population within the town is about 2,800and growing very slowly.
Income Level
The average annual income of the residents is about $8,000 but this includes a limited number ofsuccessful ranchers who reside in town. The majority of people are employed as skilled andunskilled agricultural workers.
Access
The subject fronts on County Highway and enjoys good identification and access from twodirections.
History
The subject site was purchased in 1965. Construction was completed and the center opened in1967. The entire development is owned by Mr. Owner. However, there is a $380,000 trust deedsecured by a promissory note made payable to the Valley Bank.
The property is managed by Mr. Owner from his home. He employs a local CPA to handle hisincome, expense and tax statements.
Evaluation
The value indicators employed in this appraisal are the cost approach, the income approach, andthe sales comparison approach. Data analyzed and employed in the appraisal come from thehistory and records of the subject property, local commercial properties, and shopping centersales from a neighboring county.
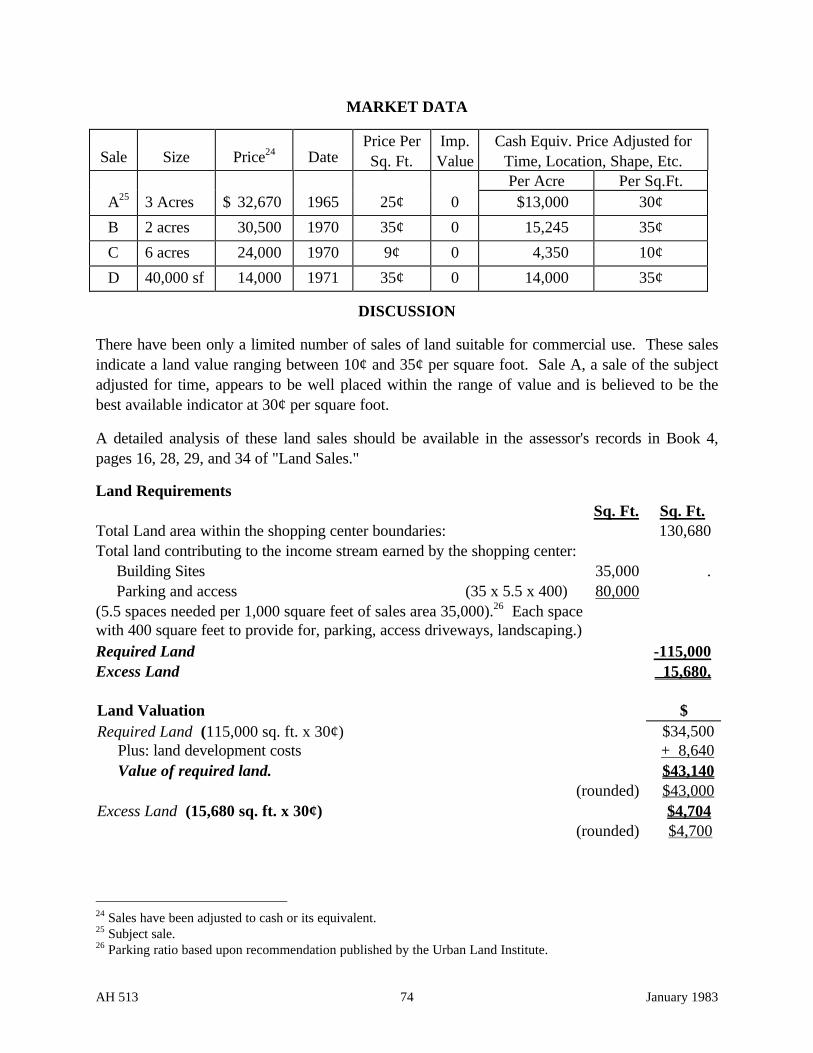
AH 513 74 January 1983
MARKET DATA
Sale Size Price24 DatePrice PerSq. Ft.
Imp.Value
Cash Equiv. Price Adjusted forTime, Location, Shape, Etc.
A25 3 Acres $ 32,670 1965 25¢ 0Per Acre Per Sq.Ft.
$13,000 30¢
B 2 acres 30,500 1970 35¢ 0 15,245 35¢
C 6 acres 24,000 1970 9¢ 0 4,350 10¢
D 40,000 sf 14,000 1971 35¢ 0 14,000 35¢
DISCUSSION
There have been only a limited number of sales of land suitable for commercial use. These salesindicate a land value ranging between 10¢ and 35¢ per square foot. Sale A, a sale of the subjectadjusted for time, appears to be well placed within the range of value and is believed to be thebest available indicator at 30¢ per square foot.
A detailed analysis of these land sales should be available in the assessor's records in Book 4,pages 16, 28, 29, and 34 of "Land Sales."
Land RequirementsSq. Ft. Sq. Ft.
Total Land area within the shopping center boundaries: 130,680Total land contributing to the income stream earned by the shopping center: Building Sites 35,000 . Parking and access (35 x 5.5 x 400) 80,000(5.5 spaces needed per 1,000 square feet of sales area 35,000).26 Each spacewith 400 square feet to provide for, parking, access driveways, landscaping.)Required Land -115,000Excess Land 15,680.
Land Valuation $Required Land (115,000 sq. ft. x 30¢) $34,500 Plus: land development costs + 8,640 Value of required land. $43,140
(rounded) $43,000Excess Land (15,680 sq. ft. x 30¢) $4,704
(rounded) $4,700
24 Sales have been adjusted to cash or its equivalent.25 Subject sale.26 Parking ratio based upon recommendation published by the Urban Land Institute.
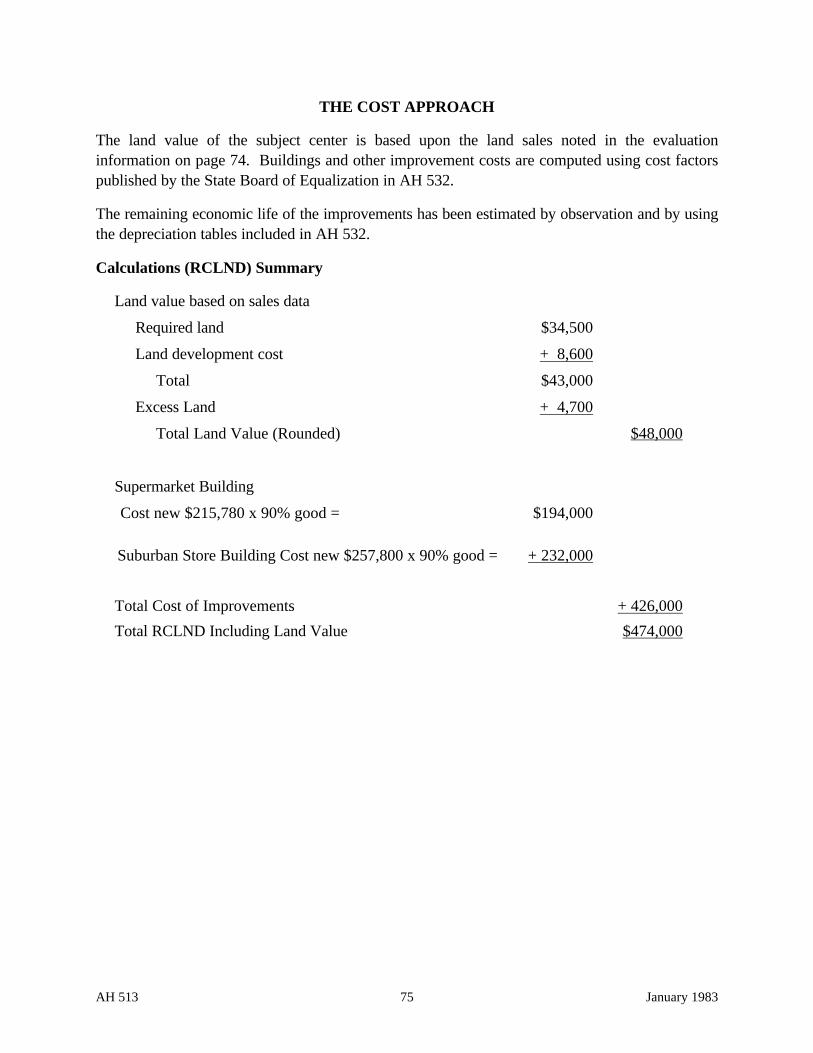
AH 513 75 January 1983
THE COST APPROACH
The land value of the subject center is based upon the land sales noted in the evaluationinformation on page 74. Buildings and other improvement costs are computed using cost factorspublished by the State Board of Equalization in AH 532.
The remaining economic life of the improvements has been estimated by observation and by usingthe depreciation tables included in AH 532.
Calculations (RCLND) Summary
Land value based on sales data
Required land $34,500
Land development cost + 8,600
Total $43,000
Excess Land + 4,700
Total Land Value (Rounded) $48,000
Supermarket Building
Cost new $215,780 x 90% good = $194,000
Suburban Store Building Cost new $257,800 x 90% good = + 232,000
Total Cost of Improvements + 426,000
Total RCLND Including Land Value $474,000
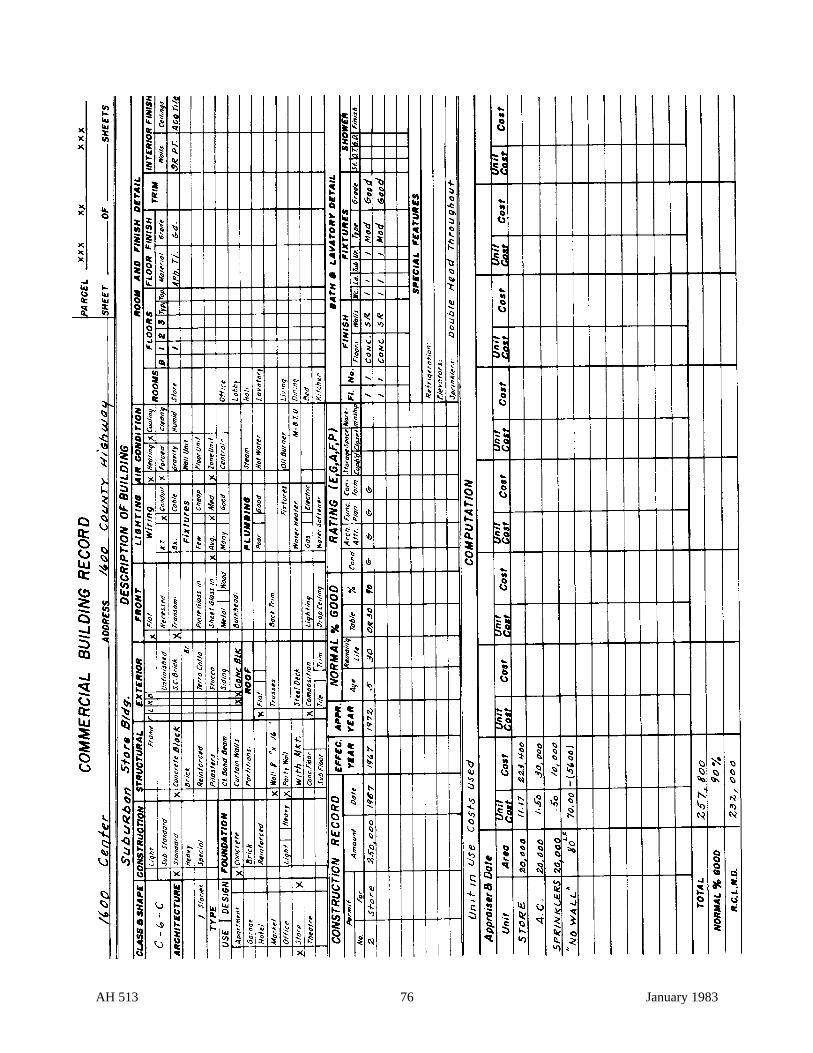
AH 513 76 January 1983
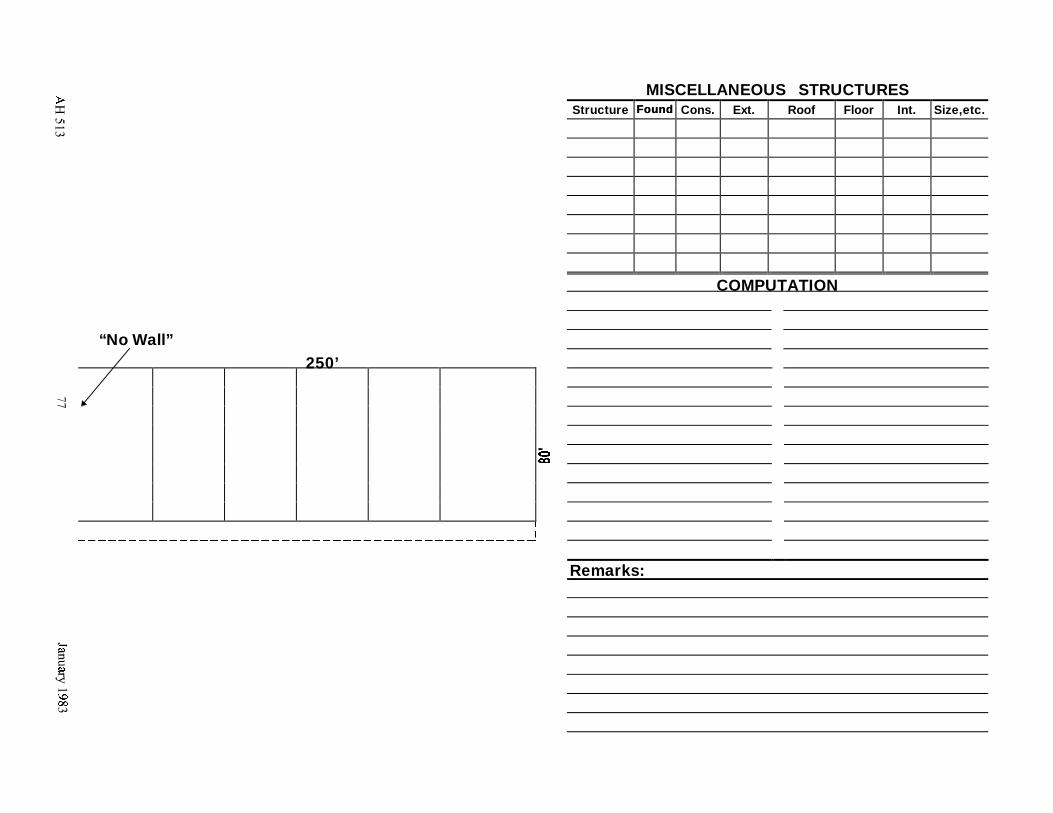
.
MISCELLANEOUS STRUCTURESStructure FoundFound Cons. Ext. Roof Floor Int. Size,etc.
COMPUTATION
Remarks:
“No Wall”
250’
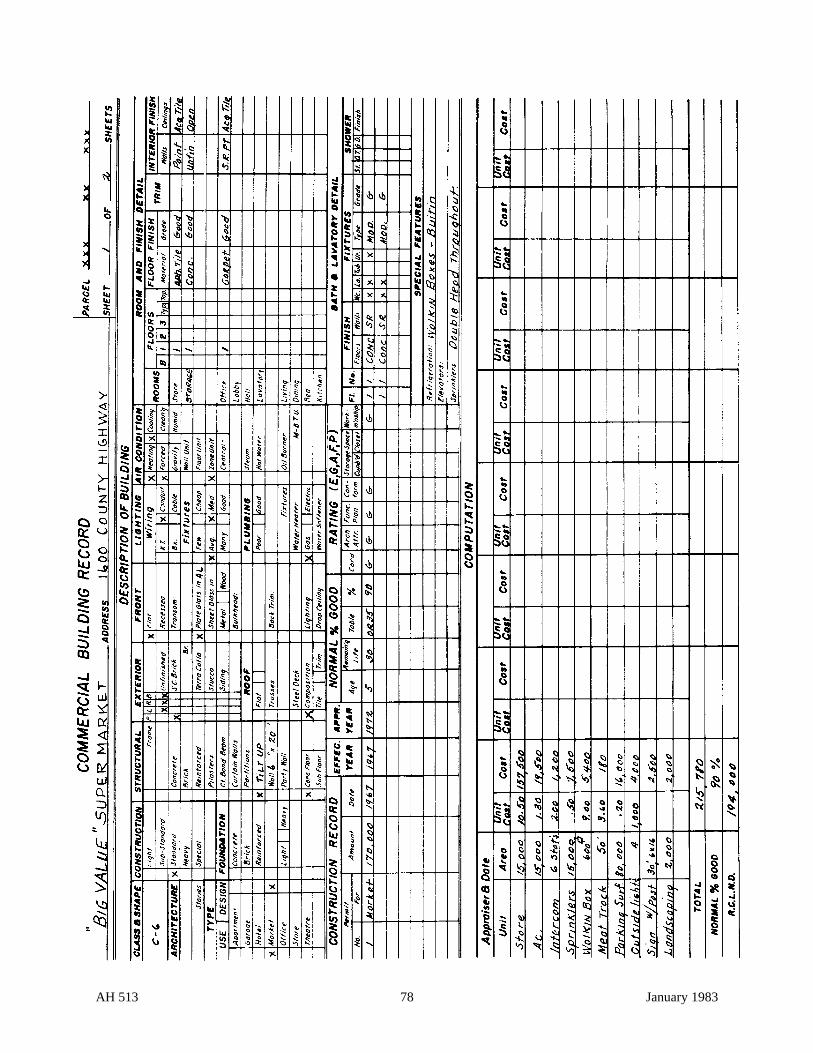
AH 513 78 January 1983
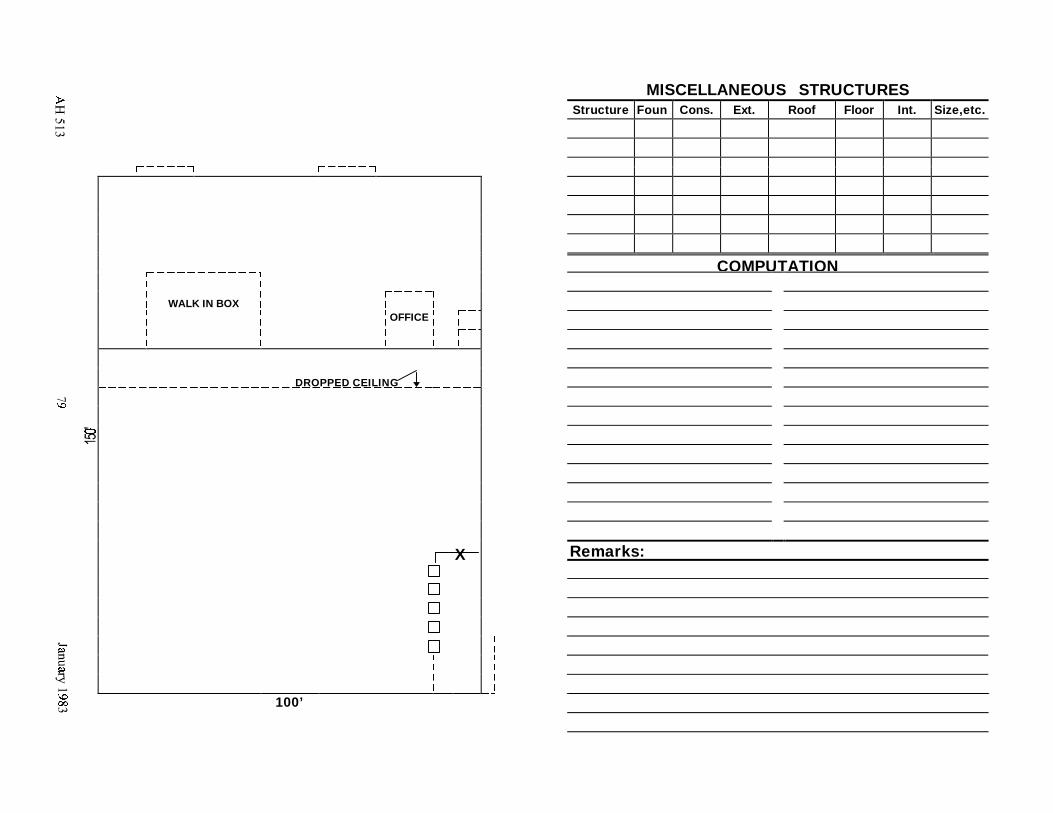
d.
MISCELLANEOUS STRUCTURESStructure Foun Cons. Ext. Roof Floor Int. Size,etc.
COMPUTATION
Remarks:
WALK IN BOXOFFICE
DROPPED CEILING
X
100’
AH 513 80 January 1983
THE INCOME APPROACH TO VALUE
The income approach involves converting the income stream into an estimate of value. The basicdata, actual or imputed, necessary to accomplish this are: (1) total gross income, (2) totaloperating expense, (3) the remaining economic lives of the improvements, (4) the independentlyestimated land value or the independently estimated improvement value, and (5) the capitalizationrate
Income
The income processed in this case study is the actual income reported by the subject center. Thisincome has been compared to the income earned by other local commercial properties and isbelieved to be the economic income
Expenses
Expense figures are those reported by the subject center. They have been compared to availableexpense information resulting from the operation of other commercial properties and have beenfound to be typical.
Remaining Economic Life
The remaining economic life of the subject is estimated to be 33 years. This estimate is basedupon observation and information published by the State Board of Equalization in Assessors'Handbook 532, Commercial Building Costs.
Capitalization Rate
The capitalization rate is based upon information taken from the market by analyzing sales ofcommercial properties.
Procedure
In this case study the building residual technique has been used because it is believed that theavailable land sales data is reasonable and reliable.
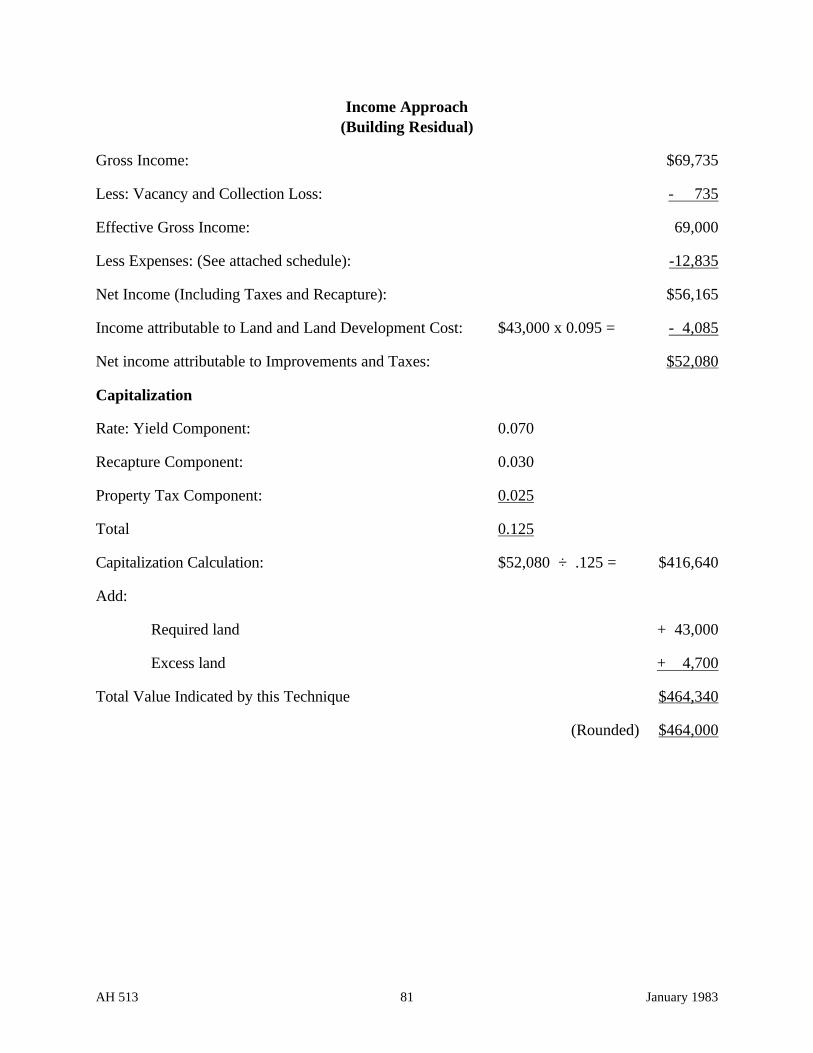
AH 513 81 January 1983
Income Approach(Building Residual)
Gross Income: $69,735
Less: Vacancy and Collection Loss: - 735
Effective Gross Income: 69,000
Less Expenses: (See attached schedule): -12,835
Net Income (Including Taxes and Recapture): $56,165
Income attributable to Land and Land Development Cost: $43,000 x 0.095 = - 4,085
Net income attributable to Improvements and Taxes: $52,080
Capitalization
Rate: Yield Component: 0.070
Recapture Component: 0.030
Property Tax Component: 0.025
Total 0.125
Capitalization Calculation: $52,080 ÷ .125 = $416,640
Add:
Required land + 43,000
Excess land + 4,700
Total Value Indicated by this Technique $464,340
(Rounded) $464,000
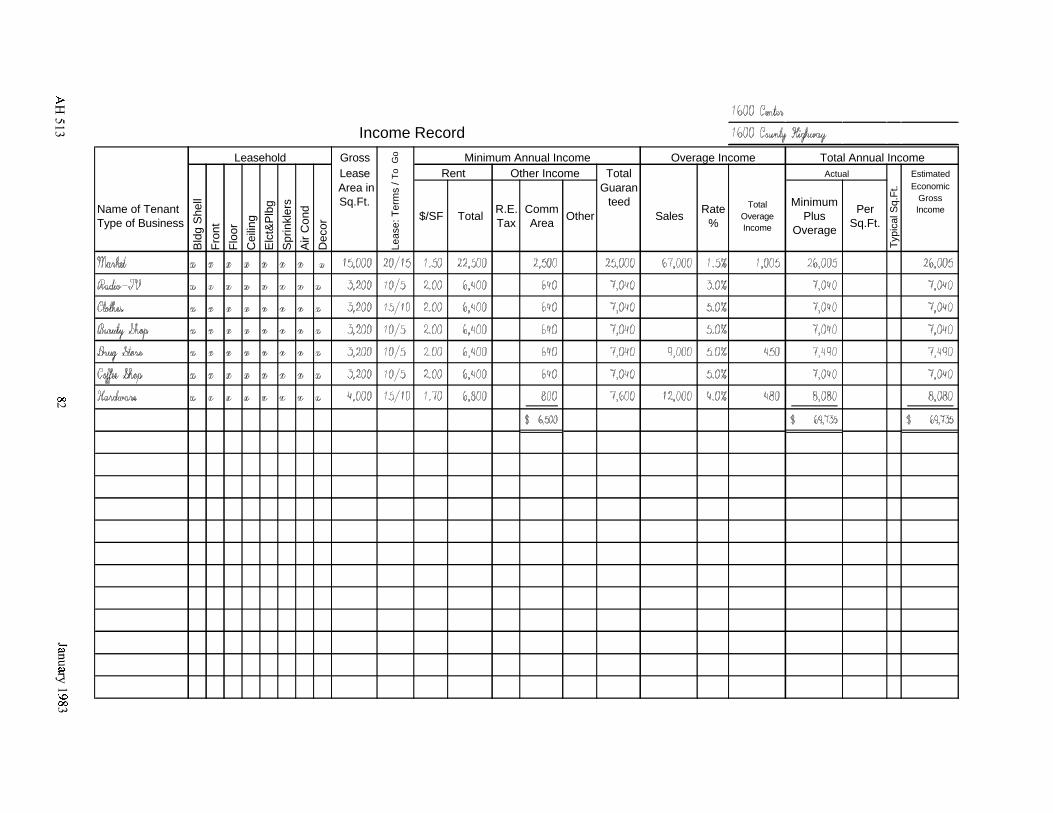
Income Record
Leasehold Gross Minimum Annual Income Overage Income Total Annual IncomeLease Rent Other Income Total Actual Estimated
Area in Guaran Economic B
l
Fr
Fl
C El
S Ai
D L T
dg S
hell Gross Sq.Ft. teed Total Minimum
Name of Tenant R.E. Comm Rate Per Incomeon
t$/SF Total Other Sales Overage Plus
Type of Business Tax Area % Sq.Ft.Incomeoo
r Overage
eilin
g
ct&
Plb
g
prin
kler
s
r C
ond
ecor
ease
: Ter
ms
/To
Go
ypic
al S
q.F
t.
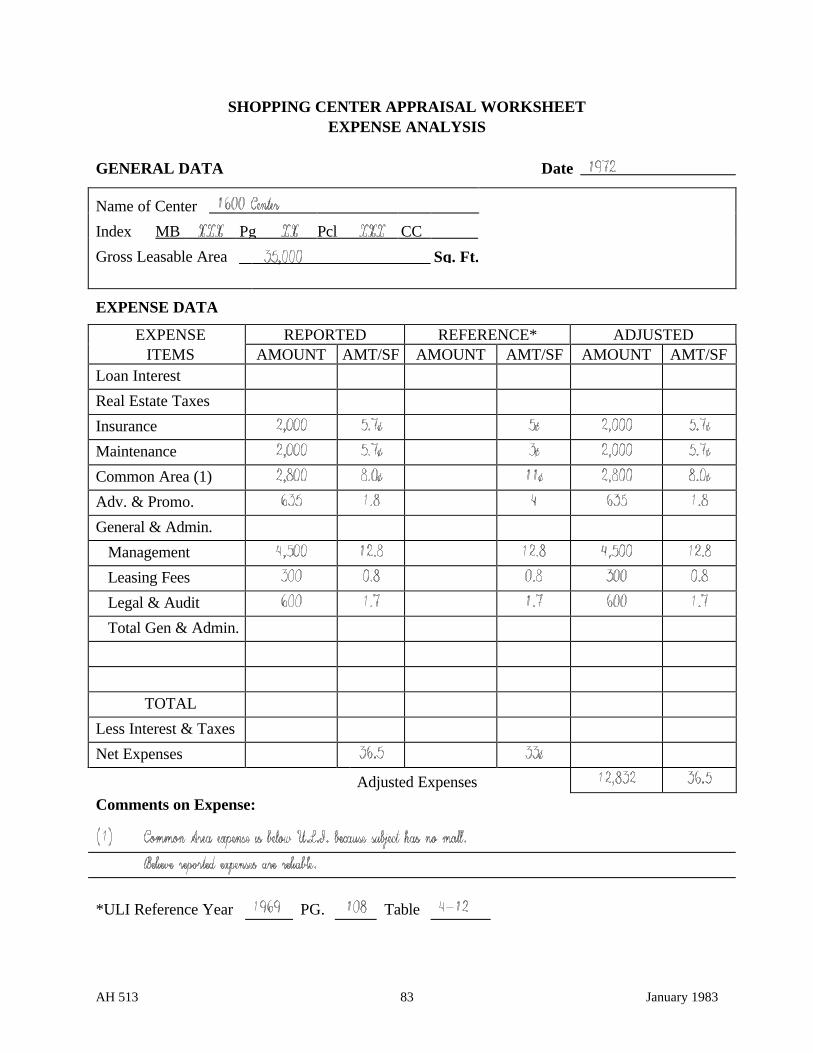
AH 513 83 January 1983
SHOPPING CENTER APPRAISAL WORKSHEETEXPENSE ANALYSIS
GENERAL DATA Date
Name of Center
Index MB Pg Pcl CC
Gross Leasable Area Sq. Ft.
EXPENSE DATA
EXPENSE REPORTED REFERENCE* ADJUSTEDITEMS AMOUNT AMT/SF AMOUNT AMT/SF AMOUNT AMT/SF
Loan Interest
Real Estate Taxes
Insurance
Maintenance
Common Area (1)
Adv. & Promo.
General & Admin.
Management
Leasing Fees
Legal & Audit
Total Gen & Admin.
TOTAL
Less Interest & Taxes
Net Expenses
Adjusted Expenses
Comments on Expense:
*ULI Reference Year PG. Table
AH 513 84 January 1983
Comparable Sales Approach
The form that follows this page presents information concerning the recent sale of four propertiessimilar to the subject. There have been no sales of small shopping centers in the county where thesubject is located; therefore, sales from a neighboring county have been utilized. In addition tothese sales, information from the sale of two commercial properties located near the subject havebeen used. It is realized that these two latter sales are not specifically similar to the subject.However, they do reflect the actions of investors in the area who are more concerned with ratesof return, risk, tax protection, etc., than with the specific type of tenant involved.
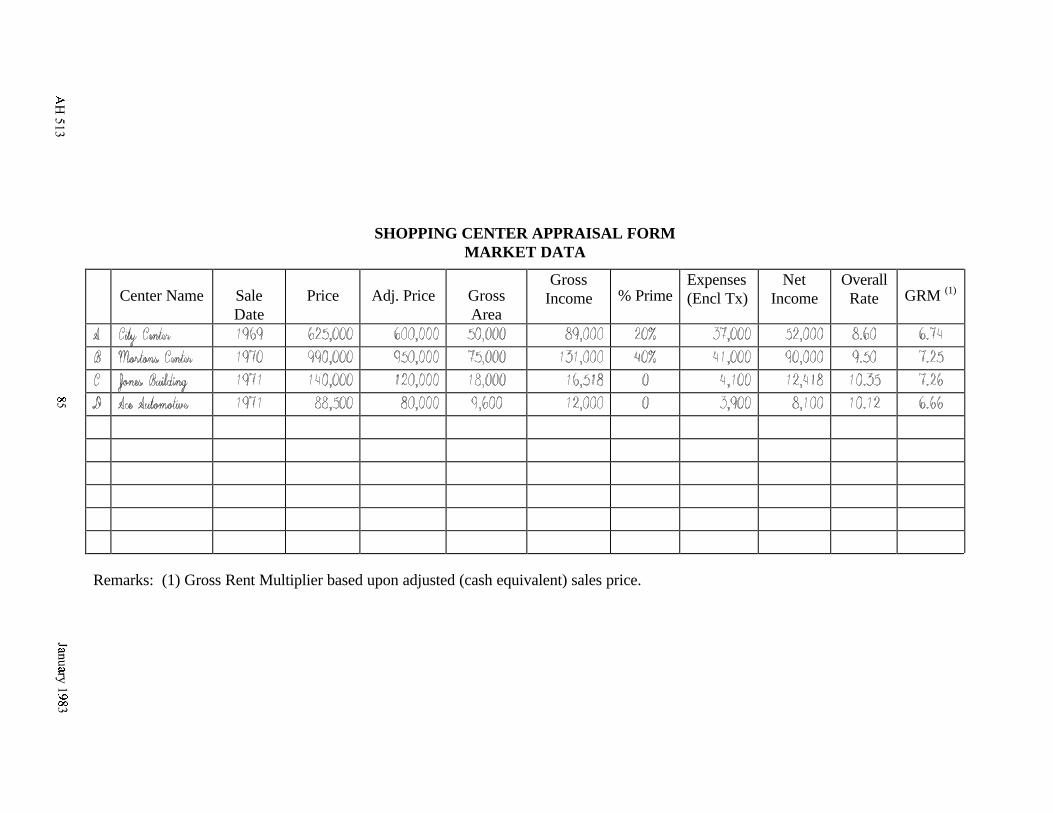
SHOPPING CENTER APPRAISAL FORMMARKET DATA
Gross Expenses Net OverallCenter Name Sale Price Adj. Price Gross Income % Prime (Encl Tx) Income Rate GRM (1)
Date Area
Remarks: (1) Gross Rent Multiplier based upon adjusted (cash equivalent) sales price.
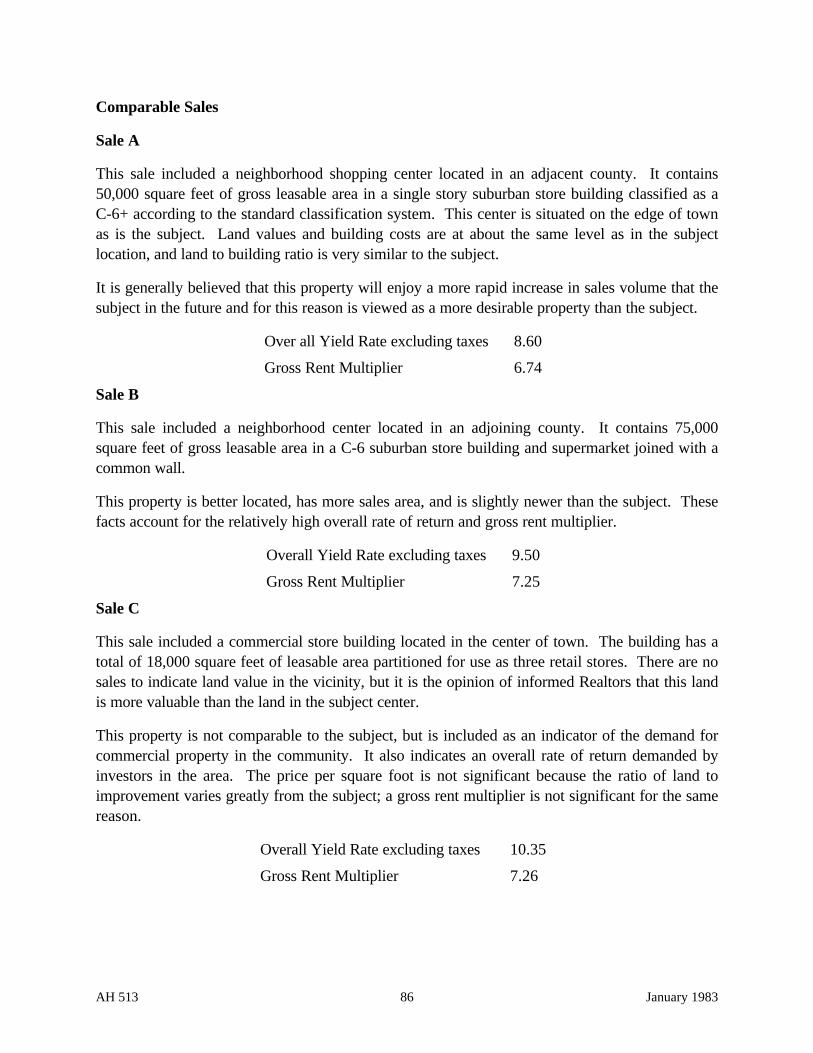
AH 513 86 January 1983
Comparable Sales
Sale A
This sale included a neighborhood shopping center located in an adjacent county. It contains50,000 square feet of gross leasable area in a single story suburban store building classified as aC-6+ according to the standard classification system. This center is situated on the edge of townas is the subject. Land values and building costs are at about the same level as in the subjectlocation, and land to building ratio is very similar to the subject.
It is generally believed that this property will enjoy a more rapid increase in sales volume that thesubject in the future and for this reason is viewed as a more desirable property than the subject.
Over all Yield Rate excluding taxes 8.60
Gross Rent Multiplier 6.74
Sale B
This sale included a neighborhood center located in an adjoining county. It contains 75,000square feet of gross leasable area in a C-6 suburban store building and supermarket joined with acommon wall.
This property is better located, has more sales area, and is slightly newer than the subject. Thesefacts account for the relatively high overall rate of return and gross rent multiplier.
Overall Yield Rate excluding taxes 9.50
Gross Rent Multiplier 7.25
Sale C
This sale included a commercial store building located in the center of town. The building has atotal of 18,000 square feet of leasable area partitioned for use as three retail stores. There are nosales to indicate land value in the vicinity, but it is the opinion of informed Realtors that this landis more valuable than the land in the subject center.
This property is not comparable to the subject, but is included as an indicator of the demand forcommercial property in the community. It also indicates an overall rate of return demanded byinvestors in the area. The price per square foot is not significant because the ratio of land toimprovement varies greatly from the subject; a gross rent multiplier is not significant for the samereason.
Overall Yield Rate excluding taxes 10.35
Gross Rent Multiplier 7.26
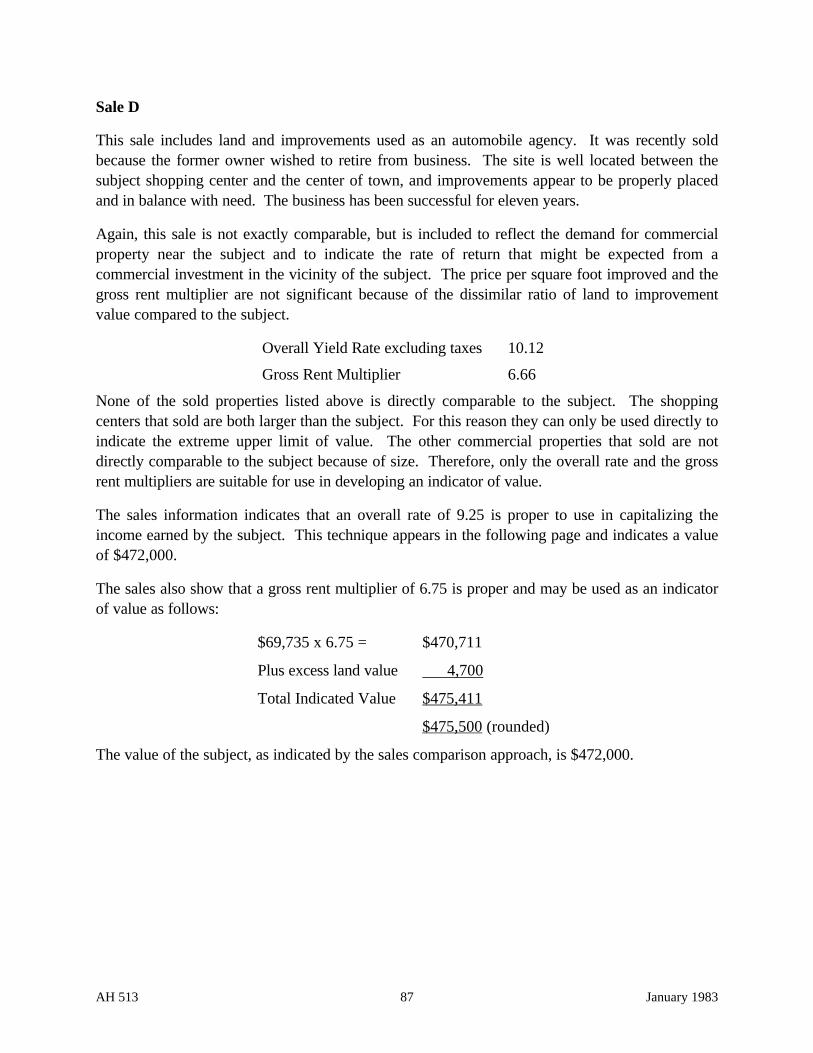
AH 513 87 January 1983
Sale D
This sale includes land and improvements used as an automobile agency. It was recently soldbecause the former owner wished to retire from business. The site is well located between thesubject shopping center and the center of town, and improvements appear to be properly placedand in balance with need. The business has been successful for eleven years.
Again, this sale is not exactly comparable, but is included to reflect the demand for commercialproperty near the subject and to indicate the rate of return that might be expected from acommercial investment in the vicinity of the subject. The price per square foot improved and thegross rent multiplier are not significant because of the dissimilar ratio of land to improvementvalue compared to the subject.
Overall Yield Rate excluding taxes 10.12
Gross Rent Multiplier 6.66
None of the sold properties listed above is directly comparable to the subject. The shoppingcenters that sold are both larger than the subject. For this reason they can only be used directly toindicate the extreme upper limit of value. The other commercial properties that sold are notdirectly comparable to the subject because of size. Therefore, only the overall rate and the grossrent multipliers are suitable for use in developing an indicator of value.
The sales information indicates that an overall rate of 9.25 is proper to use in capitalizing theincome earned by the subject. This technique appears in the following page and indicates a valueof $472,000.
The sales also show that a gross rent multiplier of 6.75 is proper and may be used as an indicatorof value as follows:
$69,735 x 6.75 = $470,711
Plus excess land value 4,700
Total Indicated Value $475,411
$475,500 (rounded)
The value of the subject, as indicated by the sales comparison approach, is $472,000.
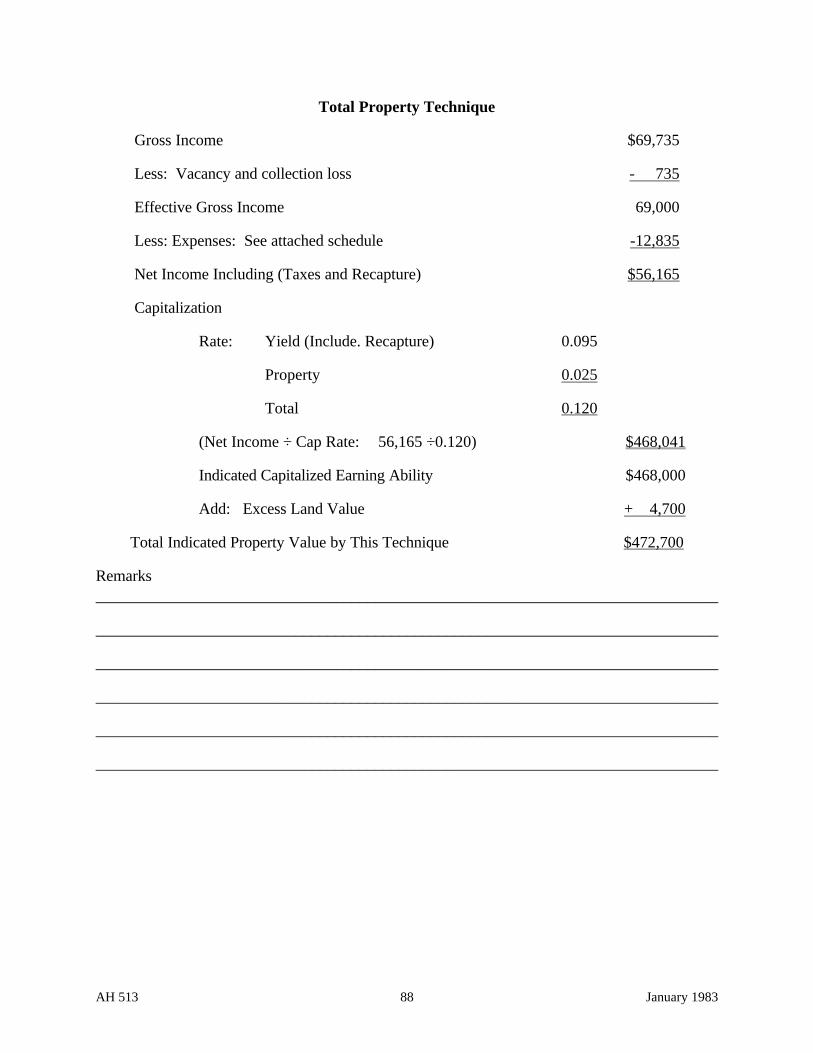
AH 513 88 January 1983
Total Property Technique
Gross Income $69,735
Less: Vacancy and collection loss - 735
Effective Gross Income 69,000
Less: Expenses: See attached schedule -12,835
Net Income Including (Taxes and Recapture) $56,165
Capitalization
Rate: Yield (Include. Recapture) 0.095
Property 0.025
Total 0.120
(Net Income ÷ Cap Rate: 56,165 ÷0.120) $468,041
Indicated Capitalized Earning Ability $468,000
Add: Excess Land Value + 4,700
Total Indicated Property Value by This Technique $472,700
Remarks______________________________________________________________________________
______________________________________________________________________________
______________________________________________________________________________
______________________________________________________________________________
______________________________________________________________________________
______________________________________________________________________________
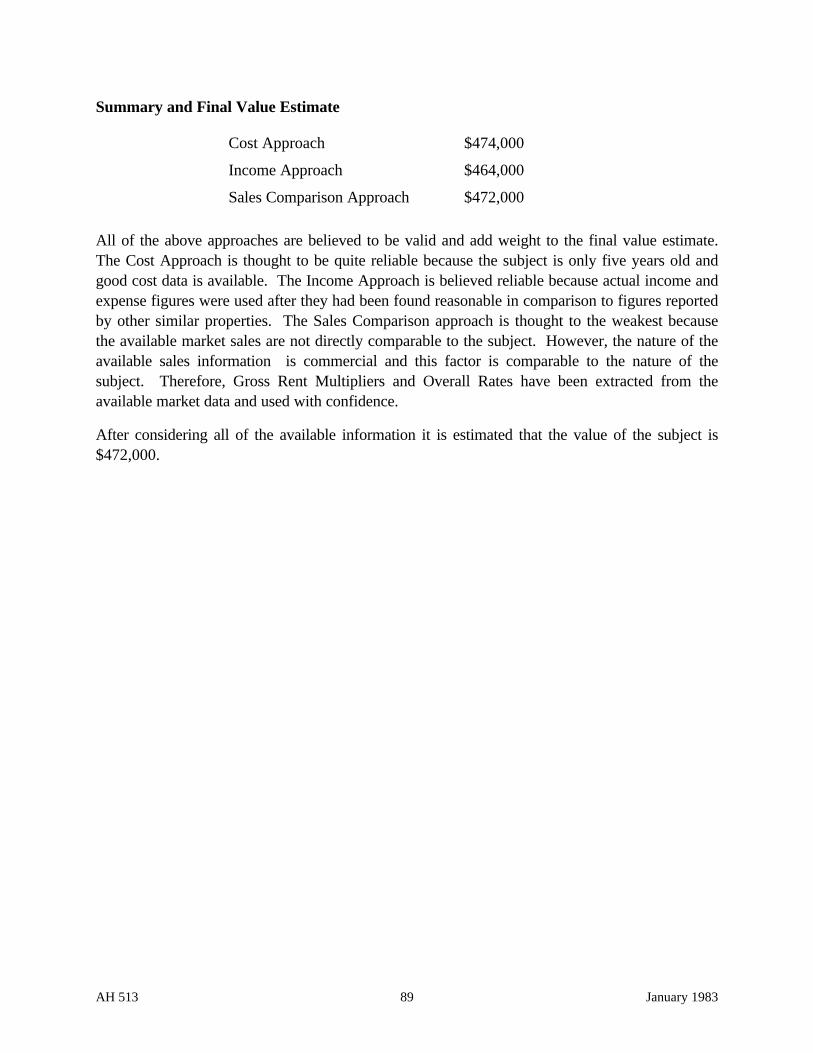
AH 513 89 January 1983
Summary and Final Value Estimate
Cost Approach $474,000
Income Approach $464,000
Sales Comparison Approach $472,000
All of the above approaches are believed to be valid and add weight to the final value estimate.The Cost Approach is thought to be quite reliable because the subject is only five years old andgood cost data is available. The Income Approach is believed reliable because actual income andexpense figures were used after they had been found reasonable in comparison to figures reportedby other similar properties. The Sales Comparison approach is thought to the weakest becausethe available market sales are not directly comparable to the subject. However, the nature of theavailable sales information is commercial and this factor is comparable to the nature of thesubject. Therefore, Gross Rent Multipliers and Overall Rates have been extracted from theavailable market data and used with confidence.
After considering all of the available information it is estimated that the value of the subject is$472,000.
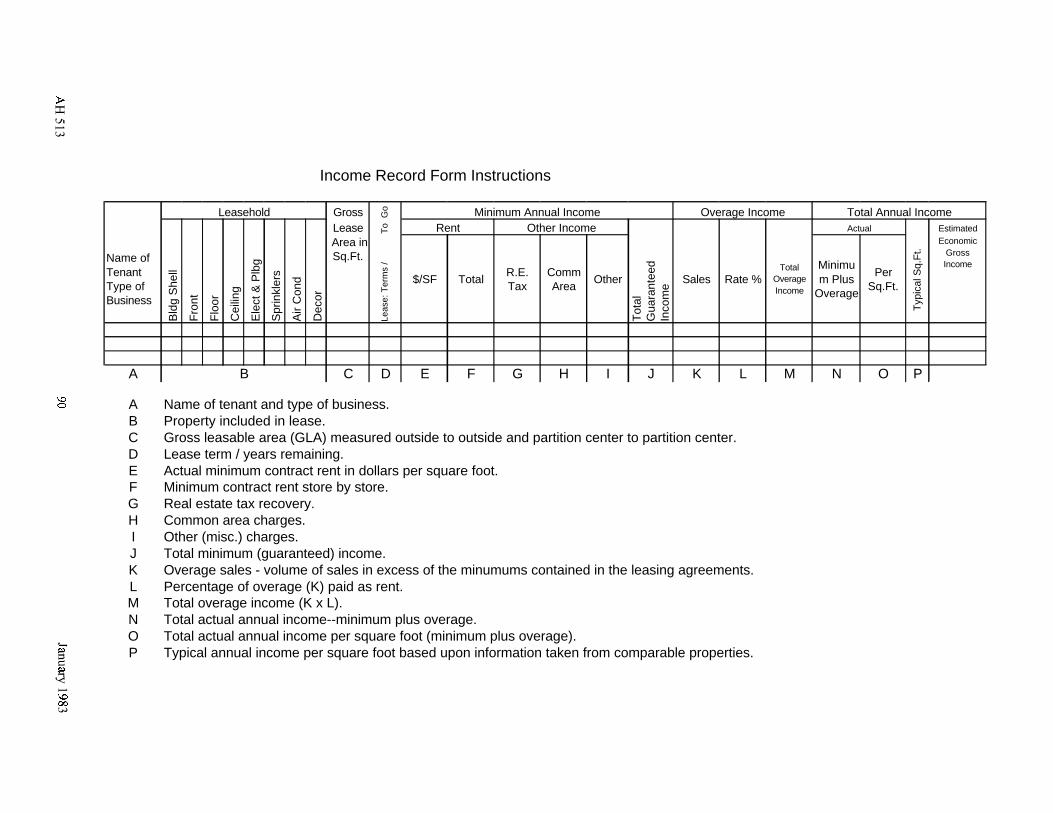
Income Record Form Instructions
Leasehold Gross Go Minimum Annual Income Overage Income Total Annual Income
Lease To Rent Other Income Actual
Typ
ical
Sq.
Ft.
EstimatedEconomic
Gross Income
Name of Tenant Type of Business
Bld
g S
hell
Fro
nt
Flo
or
Cei
ling
Ele
ct &
Plb
g
Spr
inkl
ers
Air
Con
d
Dec
or
Area in Sq.Ft.
Leas
e: T
erm
s /
$/SF TotalR.E. Tax
Comm Area
Other
Tot
al
Gua
rant
eed
Inco
me
Sales Rate %Total
Overage Income
Minimum Plus
Overage
Per Sq.Ft.
A B C D E F G H I J K L M N O P
A Name of tenant and type of business.B Property included in lease.C Gross leasable area (GLA) measured outside to outside and partition center to partition center.D Lease term / years remaining.E Actual minimum contract rent in dollars per square foot.F Minimum contract rent store by store.G Real estate tax recovery.H Common area charges.I Other (misc.) charges.J Total minimum (guaranteed) income.K Overage sales - volume of sales in excess of the minumums contained in the leasing agreements.L Percentage of overage (K) paid as rent.M Total overage income (K x L).N Total actual annual income--minimum plus overage.O Total actual annual income per square foot (minimum plus overage).P Typical annual income per square foot based upon information taken from comparable properties.
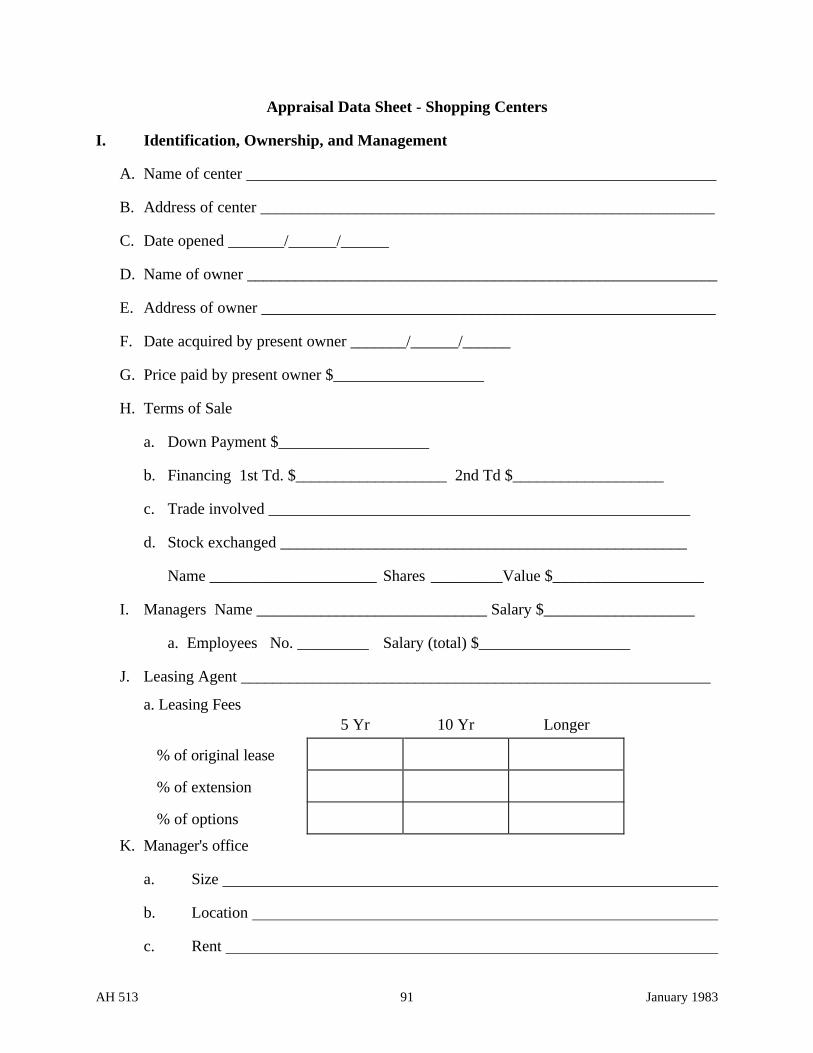
AH 513 91 January 1983
Appraisal Data Sheet - Shopping Centers
I. Identification, Ownership, and Management
A. Name of center ___________________________________________________________
B. Address of center _________________________________________________________
C. Date opened _______/______/______
D. Name of owner ___________________________________________________________
E. Address of owner _________________________________________________________
F. Date acquired by present owner _______/______/______
G. Price paid by present owner $___________________
H. Terms of Sale
a. Down Payment $___________________
b. Financing 1st Td. $___________________ 2nd Td $___________________
c. Trade involved _____________________________________________________
d. Stock exchanged ___________________________________________________
Name _____________________ Shares _________Value $___________________
I. Managers Name _____________________________ Salary $___________________
a. Employees No. _________ Salary (total) $___________________
J. Leasing Agent ___________________________________________________________
a. Leasing Fees5 Yr 10 Yr Longer
% of original lease
% of extension
% of options
K. Manager's office
a. Size
b. Location
c. Rent
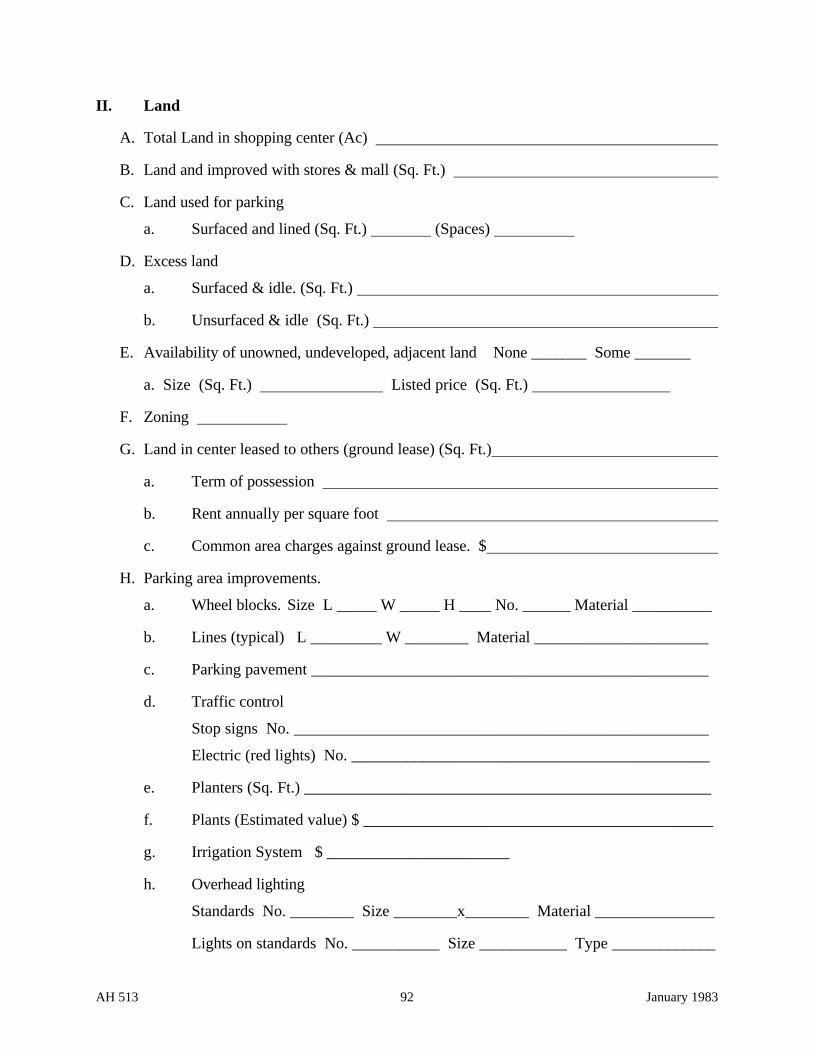
AH 513 92 January 1983
II. Land
A. Total Land in shopping center (Ac)
B. Land and improved with stores & mall (Sq. Ft.)
C. Land used for parking
a. Surfaced and lined (Sq. Ft.) (Spaces)
D. Excess land
a. Surfaced & idle. (Sq. Ft.)
b. Unsurfaced & idle (Sq. Ft.)
E. Availability of unowned, undeveloped, adjacent land None _______ Some _______
a. Size (Sq. Ft.) Listed price (Sq. Ft.)
F. Zoning
G. Land in center leased to others (ground lease) (Sq. Ft.)
a. Term of possession
b. Rent annually per square foot
c. Common area charges against ground lease. $
H. Parking area improvements.
a. Wheel blocks. Size L _____ W _____ H ____ No. ______ Material __________
b. Lines (typical) L _________ W ________ Material ______________________
c. Parking pavement __________________________________________________
d. Traffic control
Stop signs No. ____________________________________________________
Electric (red lights) No. _____________________________________________
e. Planters (Sq. Ft.) ___________________________________________________
f. Plants (Estimated value) $ ____________________________________________
g. Irrigation System $ _______________________
h. Overhead lighting
Standards No. ________ Size ________x________ Material _______________
Lights on standards No. ___________ Size ___________ Type _____________
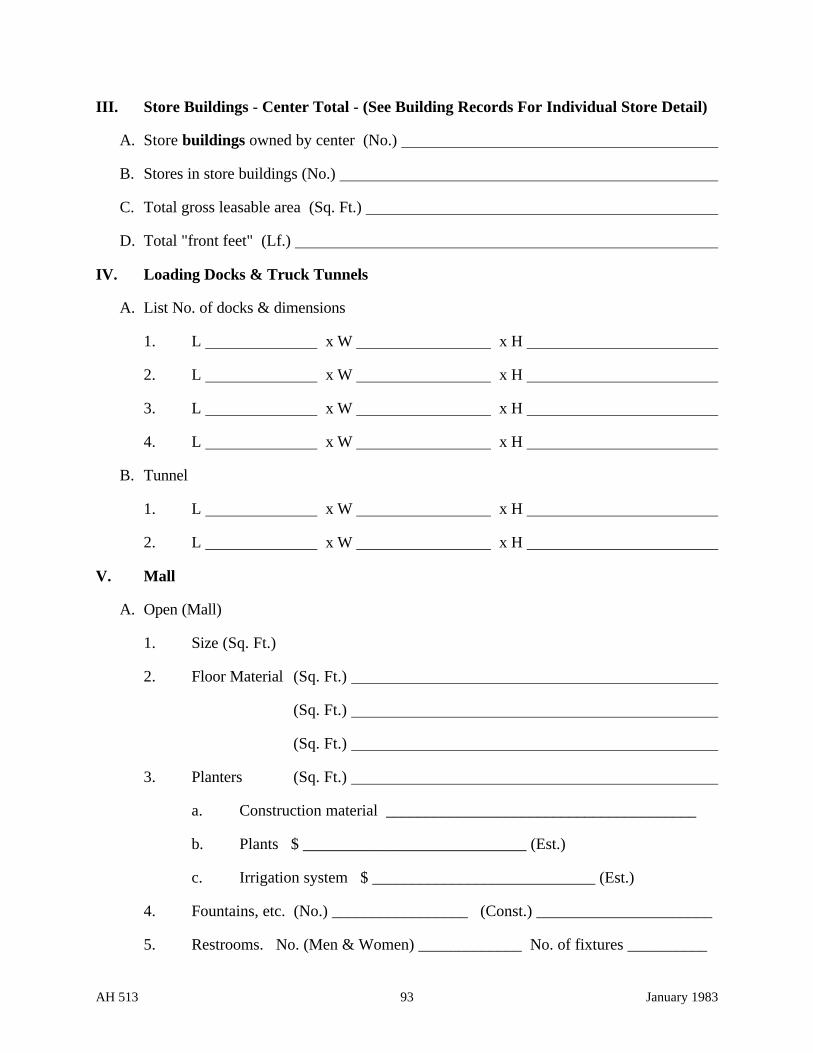
AH 513 93 January 1983
III. Store Buildings - Center Total - (See Building Records For Individual Store Detail)
A. Store buildings owned by center (No.)
B. Stores in store buildings (No.)
C. Total gross leasable area (Sq. Ft.)
D. Total "front feet" (Lf.)
IV. Loading Docks & Truck Tunnels
A. List No. of docks & dimensions
1. L x W x H
2. L x W x H
3. L x W x H
4. L x W x H
B. Tunnel
1. L x W x H
2. L x W x H
V. Mall
A. Open (Mall)
1. Size (Sq. Ft.)
2. Floor Material (Sq. Ft.)
(Sq. Ft.)
(Sq. Ft.)
3. Planters (Sq. Ft.)
a. Construction material _______________________________________
b. Plants $ ____________________________ (Est.)
c. Irrigation system $ ____________________________ (Est.)
4. Fountains, etc. (No.) _________________ (Const.) ______________________
5. Restrooms. No. (Men & Women) _____________ No. of fixtures __________
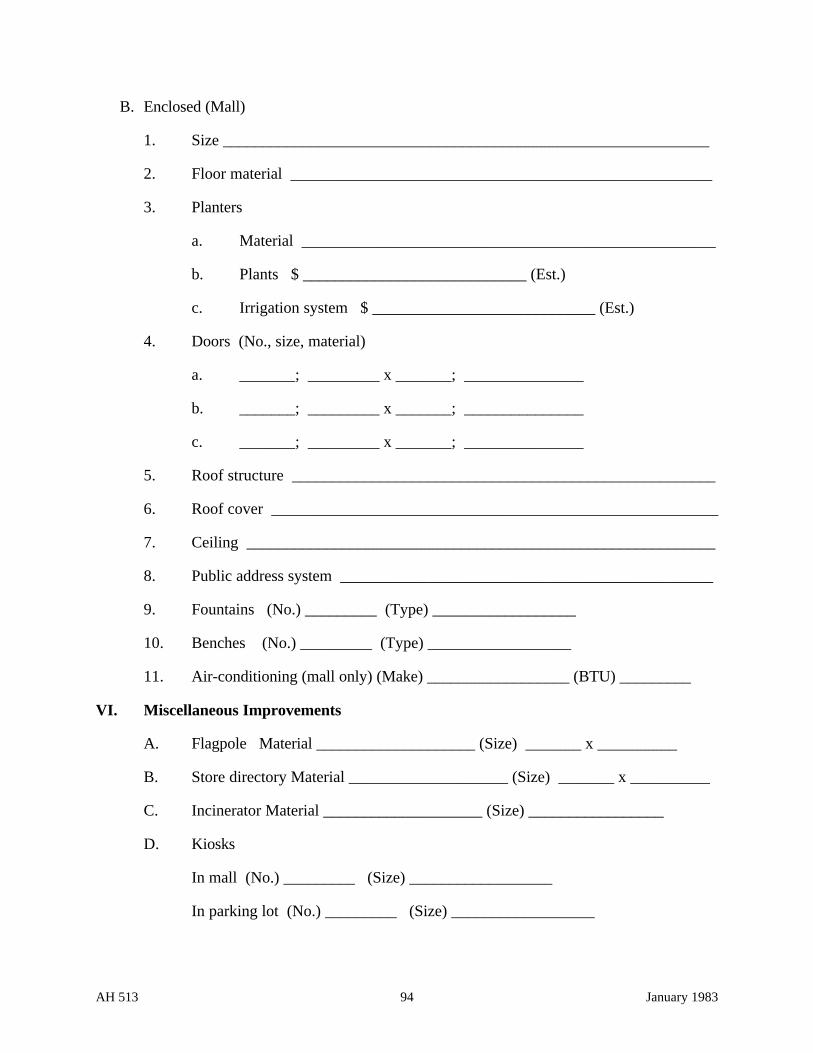
AH 513 94 January 1983
B. Enclosed (Mall)
1. Size _____________________________________________________________
2. Floor material _____________________________________________________
3. Planters
a. Material ____________________________________________________
b. Plants $ ____________________________ (Est.)
c. Irrigation system $ ____________________________ (Est.)
4. Doors (No., size, material)
a. _______; _________ x _______; _______________
b. _______; _________ x _______; _______________
c. _______; _________ x _______; _______________
5. Roof structure _____________________________________________________
6. Roof cover ________________________________________________________
7. Ceiling ___________________________________________________________
8. Public address system _______________________________________________
9. Fountains (No.) _________ (Type) __________________
10. Benches (No.) _________ (Type) __________________
11. Air-conditioning (mall only) (Make) __________________ (BTU) _________
VI. Miscellaneous Improvements
A. Flagpole Material ____________________ (Size) _______ x __________
B. Store directory Material ____________________ (Size) _______ x __________
C. Incinerator Material ____________________ (Size) _________________
D. Kiosks
In mall (No.) _________ (Size) __________________
In parking lot (No.) _________ (Size) __________________
AH 513 95 January 1983
E. Outside storage area, fence, etc.
Type ________________________________ Lineal feet __________________
F. Signs ____________________________________________________________
_________________________________________________________________
VII. Remarks
_____________________________________________________________________________
_____________________________________________________________________________
_____________________________________________________________________________
_____________________________________________________________________________
_____________________________________________________________________________
_____________________________________________________________________________
_____________________________________________________________________________
_____________________________________________________________________________
_____________________________________________________________________________
_____________________________________________________________________________
_____________________________________________________________________________
_____________________________________________________________________________
_
_
_
_
_
_
_
_
_
_
_
_
_
_